Transmural distribution of myocardial edema by NMR relaxometry following myocardial ischemia and...
10
VOlUrn. 122 Number 3, Part 1 Circadian variation of silent ischemia 34. 35. 36. 37. 38. 39. tients with coronary artery disease treated with beta-blocking drugs. Am J Cardiol 1985;55:33-6. Mitler MM, Kripke DF. Circadian variation in myocardial in- farction [Letter]. N Engl J Med 1986;314:1187-8. Figuerae J, Singh BN, Ganz W, Chamzi Y, Swan HJC. Mech- anism of rest and nocturnal angina: observations during con- tinuous hemodynamic and electrocardiographic monitoring. Circulation 1979;5:955-68. Sibley DR, Lefkowitz RJ. Molecular mechanisms of receptor desensitization using the beta-adrenergic receptor-coupled adenylate cyclase system as a model. Nature 198$317:124-g. Fox KM, Deanfield JE, Selwyn AP, Krikler S, Wright CA. Treatment of chronic stable angina pectoris with nifedipine. In: Kaltenbach M, Neufeld HN, eds. Fifth International Nife- dipine Symposium. Amsterdam: Excerpta Medica, 1982:197- 204. Yokoyama M, Kolzumi T, Fujitani K, Mizutami T, Fukuzaki H. Adverse response to nifedipine in unstable angina pectoris. Chest 1982;81:646-8. Tenis S, Bourdillon PD, Cheng DT, Pitt B. Direct cardiac and 40. 41. 42. 43. 44. peripheral vascular effects of intracoronary and intravenous nifedipine. Am J Cardiol 1986;58:25-30. Egstrup K. Asymptomatic myocardial isehemia as a predictor of cardiac events after coronary artery bypass grafting for sta- ble angina pectoris. Am J Cardiol 1988;61:248-52. Rocco M, Nabel E, Campbell S, Goldman L, Barry J, Mead K, Selwyn A. Prognostic importance of myoaardial ischemia de- tected by ambulatory monitoring in patients with stable cor- onary artery disease. Circulation 1988;78:877-84. Tzivoni D, Weisz G, Gavish A, Zin D, Ken A, Stern S. Com- parison of mortality and myocardial infarction rates in stable angina pectoris with or without ischemic episodes during daily activities. Am J Cardiol 1989;63:273-6. Mickley H, Pless P, Egstrup K, Rokkedal J, MPler M. Silent ischemia is a predictor of severe angina pectoris after first mvocardial infarction IAbstractl. Eur Heart J 1988:9:314. Gottlieb SO, Weisfeldt ML, Ouyang P, Meiiita ED,‘Gersten- blith G. Silent ischemia as a marker for early unfavourable outcomes in patients with unstable angina. N Engl J Med 1986;314:1214-9. Trammural distribution of myoca R mhxometry following myoc and reperfusion To determlne the distribution and extent of myocardial edema resulting from kchemi8 and reperfuoion, seven open-chest dogs underwent occiudon of the left circumflex coronary artery for 2 hours (group I), and 10 underwent occlusion for 2 hours and reperfuston for 2 hours (group ii). Proton, nuckar magnetic resonance spectroscopy (11 and 12 reiaxatlon ttmes) and percent water content were determined to quantitate the amount of edema. There w8s a tranrmurai increase of the 11 relaxatfon time of the central ischemic zone in groups I and ii, aithough this increase was significantfy greater in group ii In both the subendocardh#m (group I = 707.8 + 12.5 msec, group ii = 813.2 k 36.2 msec; P < 0.01) and subeptcardfum (group I = 641.7 k 20.5 msec, group ii = 760.5 +- 34.7 msec; p < 0.01). These increases were also observed in the f2 weighted relaxation time in the subendocardium (group 1 - 54.7 k 0.8 msec, group ii = 78.7 f 6.3 msec; p < 0.005) and subepicardium (group I = 54.0 + 1.4 msec, group II = 73.1 + 4.0 msoc; p < 0.001). Transmurai differences were evident between the myocardlai layers with increased 11 relaxation times (p < 0.01) in the subendocardtum in both groups. Similar fncreases were noted in the percent water content of the myocardlum. Thus Tl and T2 relaxation times lengthened with an increase in myocardiai water content foifewfng occiusfon, and these reiaxation times were augmented by reperfurion. We conclude that isohemta-fnduced edema occurs in a transmurai distribution from subendocardium to eubepicardtum foifowlng occlusion, and this edema is further enhanced by reperfusion. (Am HEART J 1991;122:055.) Beth L. Karolle, BS, Robert E. Carlson, BS, Alex M. Aisen, MD, and Andrew J. Buda, MD. Ann Arbor, Mich. From the Cardiology Division, Department of Internal Medicine and Department of Radiology, University of Michigan Medical Center. Received for publication Jan. 17, 1991; accepted March 4. 1991. This work was supported in part by a Grant-in-Aid from the American Heart Association, Inc., Dallas, Texas, and by ROI HL 34691 from the National Heart, Lung, and Blood Institute, National Institutes of Health, Bethesda, Maryland. Ms. Karolle was a recipient of a Student Research Fellowship from the American Heart Association of Michigan. Reprint requests: Andrew J. Buda, MD, Chief, Cardiology Section, Tulane University School of Medicine, 1430 Tulane Ave., New Oleans, LA 70112. 4/I/30322 655
-
Upload
independent -
Category
Documents
-
view
0 -
download
0
Transcript of Transmural distribution of myocardial edema by NMR relaxometry following myocardial ischemia and...
VOlUrn. 122
Number 3, Part 1 Circadian variation of silent ischemia
34.
35.
36.
37.
38.
39.
tients with coronary artery disease treated with beta-blocking drugs. Am J Cardiol 1985;55:33-6. Mitler MM, Kripke DF. Circadian variation in myocardial in- farction [Letter]. N Engl J Med 1986;314:1187-8. Figuerae J, Singh BN, Ganz W, Chamzi Y, Swan HJC. Mech- anism of rest and nocturnal angina: observations during con- tinuous hemodynamic and electrocardiographic monitoring. Circulation 1979;5:955-68. Sibley DR, Lefkowitz RJ. Molecular mechanisms of receptor desensitization using the beta-adrenergic receptor-coupled adenylate cyclase system as a model. Nature 198$317:124-g. Fox KM, Deanfield JE, Selwyn AP, Krikler S, Wright CA. Treatment of chronic stable angina pectoris with nifedipine. In: Kaltenbach M, Neufeld HN, eds. Fifth International Nife- dipine Symposium. Amsterdam: Excerpta Medica, 1982:197- 204. Yokoyama M, Kolzumi T, Fujitani K, Mizutami T, Fukuzaki H. Adverse response to nifedipine in unstable angina pectoris. Chest 1982;81:646-8. Tenis S, Bourdillon PD, Cheng DT, Pitt B. Direct cardiac and
40.
41.
42.
43.
44.
peripheral vascular effects of intracoronary and intravenous nifedipine. Am J Cardiol 1986;58:25-30. Egstrup K. Asymptomatic myocardial isehemia as a predictor of cardiac events after coronary artery bypass grafting for sta- ble angina pectoris. Am J Cardiol 1988;61:248-52. Rocco M, Nabel E, Campbell S, Goldman L, Barry J, Mead K, Selwyn A. Prognostic importance of myoaardial ischemia de- tected by ambulatory monitoring in patients with stable cor- onary artery disease. Circulation 1988;78:877-84. Tzivoni D, Weisz G, Gavish A, Zin D, Ken A, Stern S. Com- parison of mortality and myocardial infarction rates in stable angina pectoris with or without ischemic episodes during daily activities. Am J Cardiol 1989;63:273-6. Mickley H, Pless P, Egstrup K, Rokkedal J, MPler M. Silent ischemia is a predictor of severe angina pectoris after first mvocardial infarction IAbstractl. Eur Heart J 1988:9:314. Gottlieb SO, Weisfeldt ML, Ouyang P, Meiiita ED,‘Gersten- blith G. Silent ischemia as a marker for early unfavourable outcomes in patients with unstable angina. N Engl J Med 1986;314:1214-9.
Trammural distribution of myoca R mhxometry following myoc
and reperfusion
To determlne the distribution and extent of myocardial edema resulting from kchemi8 and reperfuoion, seven open-chest dogs underwent occiudon of the left circumflex coronary artery for 2 hours (group I), and 10 underwent occlusion for 2 hours and reperfuston for 2 hours (group ii). Proton, nuckar magnetic resonance spectroscopy (11 and 12 reiaxatlon ttmes) and percent water content were determined to quantitate the amount of edema. There w8s a tranrmurai increase of the 11 relaxatfon time of the central ischemic zone in groups I and ii, aithough this increase was significantfy greater in group ii In both the subendocardh#m (group I = 707.8 + 12.5 msec, group ii = 813.2 k 36.2 msec; P < 0.01) and subeptcardfum (group I = 641.7 k 20.5 msec, group ii = 760.5 +- 34.7 msec; p < 0.01). These increases were also observed in the f2 weighted relaxation time in the subendocardium (group 1 - 54.7 k 0.8 msec, group ii = 78.7 f 6.3 msec; p < 0.005) and subepicardium (group I = 54.0 + 1.4 msec, group II = 73.1 + 4.0 msoc; p < 0.001). Transmurai differences were evident between the myocardlai layers with increased 11 relaxation times (p < 0.01) in the subendocardtum in both groups. Similar fncreases were noted in the percent water content of the myocardlum. Thus Tl and T2 relaxation times lengthened with an increase in myocardiai water content foifewfng occiusfon, and these reiaxation times were augmented by reperfurion. We conclude that isohemta-fnduced edema occurs in a transmurai distribution from subendocardium to eubepicardtum foifowlng occlusion, and this edema is further enhanced by reperfusion. (Am HEART J 1991;122:055.)
Beth L. Karolle, BS, Robert E. Carlson, BS, Alex M. Aisen, MD, and Andrew J. Buda, MD. Ann Arbor, Mich.
From the Cardiology Division, Department of Internal Medicine and Department of Radiology, University of Michigan Medical Center.
Received for publication Jan. 17, 1991; accepted March 4. 1991.
This work was supported in part by a Grant-in-Aid from the American Heart Association, Inc., Dallas, Texas, and by ROI HL 34691 from the National Heart, Lung, and Blood Institute, National Institutes of Health, Bethesda, Maryland. Ms. Karolle was a recipient of a Student Research Fellowship from the American Heart Association of Michigan.
Reprint requests: Andrew J. Buda, MD, Chief, Cardiology Section, Tulane University School of Medicine, 1430 Tulane Ave., New Oleans, LA 70112.
4/I/30322
655

666 Karolle et al. September 1991
American Heart Journal
Cardiac nuclear magnetic resonance (NMR) imaging is potentially able to detect and quantify zones of hypoperfused and infarcted myocardium.l-l3 Be- cause the NMR signal is determined largely by the proton density contained in the edema of the zone of acute myocardial ischemia, there is a renewed inter- est in characterizing myocardial edema following coronary occlusion and reperfusion. NMR techniques quantify this myocardial edema by expressing pro- longed relaxation times and increased signal intensi- ties on NMR images. However, areas of prolonged relaxation times and increased signal intensity cor- respond better to the hypoperfused zones at risk than to the zones of actual infarction, thus overestimating infarct sizee3* I1 This suggests that edema extends beyond the necrotic zone into viable at-risk myocar- dium. Therefore a thorough understanding of the distribution of edema formation is necessary for ap- propriate interpretation of NMR cardiac images. Moreover, characterization of edema may provide additional insights into the pathophysiology of is- chemia and reperfusion.
Accordingly, we designed a study to examine the transmural distribution of myocardial edema in the setting of myocardial ischemia and coronary reper- fusion. Our hypotheses were: (1) a transmural gradi- ent of myocardial edema will occur during myocar- dial ischemia and (2) the transmural extent of edema in the ischemic and reperfused myocardium will be greater than in the ischemic myocardium without reperfusion.
METHODS
Experimental procedures complied with the guidelines of the University of Michigan Committee on the Use and Care of Animals. The University of Michigan is accredited by the American Association of Accreditation of Labora- tory Animal Care, and animal care and use conforms to the standards in “The Guide for the Care and Use of Labora- tory Animals,” Department of Health, Education, and Welfare, publication number NIH78-23, revised 1978. Seventeen male mongrel dogs (approximately 25 kg) were anesthetized intravenously with 10 ml of thiamylal sodium (5 % ) followed by 2 ml of pentobarbital sodium (30 mg/kg) and were ventilated by a Harvard respirator (Harvard Ap- paratus Inc., S. Natick, Mass.) via an endotracheal tube. Polyvinyl catheters were inserted into the left internal jug- ular vein for adminstration of fluids and into left carotid and femoral arteries for microsphere reference withdrawal. Measurement of mean arterial pressure was obtained via a catheter in the right femoral artery. A left thoracotomy was performed in the fifth intercostal space, the lungs were re- tracted, and the heart was suspended in a pericardial cra- dle. The left atria1 appendage was catheterized for injection of radiolabeled microspheres and for measurement of left atria1 pressure. The left circumflex coronary artery was
dissected away from the heart proximally, and a snare oc- eluder was placed around it (Fig. 1).
Experimental protocol (Fig. 2). The dogs were randomly assigned to two groups: 2 hours of occlusion (group I, n = 7), and 2 hours of occlusion followed by 2 hours of reperfusion (group II, n = 10). The electrocardiogram (ECG) was monitored from limb leads. Hemodynamic measurements (mean arterial pressure, left atria1 pressure, and heart rate) and two-dimensional echocardiography were performed at baseline, at 2 hours of occlusion, and at 1 and 2 hours of reperfusion. Radioactive-labeled micro- spheres (l13Sn, 141Ce, lo3Ru, 51Cr, 46Sc) for myocardial blood flow determination were injected into the left atrium at baseline, at 2 hours of occlusion, and at 2 hours of reper- fusion. Microsphere injection was performed simulta- neously with reference withdrawal from the femoral and carotid arteries at a rate of 7 ml/min via a Harvard with- drawal pump; this withdrawal was initiated a few seconds prior to and continued until 2 minutes following injection. Lidocaine was given intravenously (50 mg) 2 minutes be- fore both occlusion and reperfusion. At the time of sacri- fice, 10 ml of sodium heparin was injected, and a lethal in- travenous injection of pentobarbital sodium and saturated potassium chloride was given.
Edema determination. Following sacrifice, the hearts were excised, sliced into 5 mm transverse sections, and weighed. Immediately afterward, 1 gm subendocardial and subepicardial sections were taken from both the central is- chemic zone and the central normal zone and were sealed in a dry test tube for NMR spectroscopy. The positioning of the sample, the radiofrequency pulses, and the detector phase were optimized for each sample prior to acquisition of relaxation times. Relaxation times were obtained from an IBM PC-20 Minispec relaxometer (IBM Corp., Atlanta, Ga.) operating at 20 MHz at 40’ C. Tl values were calcu- lated from a least squares fit of 20 inversion recovery points. T2 values were calculated from a least squares fit of 150 Carr, Purcell, Meiboon-Gill (CPMG) pulse sequence points to obtain a multiple exponent, although only the dominant component was analyzed. Once the relaxometer was calibrated for a sample, the relaxation times were ac- quired three times and were then averaged to determine the final values for Tl and T2 times of each tissue section. Percent water content was determined from these same myocardial samples that were subsequently dried and re- weighed to determine the amount of water present (% Hz0 = wet wt - dry wt/wet wt).
Regional blood flow analysis. Two midpapillary slices of the hearts were cut into approximately 16 sectors. From these sections, the two most ischemic sectors were chosen for the ischemic zone, and two sections 180 degrees from the ischemic zone were chosen for the normal zone. These sectors were further sectioned into three layers defined as subendocardium, midmyocardium, and subepicardium. The samples were weighed and placed into counting vials, and radioactivity was determined by a gamma scintillation counter from oven-dried arterial withdrawal samples and from air-dried myocardial samples. The counts were cor- rected for background and overlap. Myocardial blood flow

Volum* 122
Number 3, Part 1 Distribution of myocardial edema in ischemia 657
Fig. 1. Schematic representation of the instrumentation of the heart and plane of short-axis imaging. The left circumflex coronary artery was dissected from the heart, and a snare occluder was placed around it. The left atria1 appendage was catheterized for measurement of left atrial pressure and injection of radi- olabeled microspheres for determination of regional blood flow. The short-axis imaging plane for two-di- mensional echocardiography is shown at the midpapillary muscle level. This was also the level for deter- mination of myocardial blood flow and edema measurements. The region of the central ischemic and nor- mal zones from which the samples were taken are illustrated.
was calculated as Qm = Cm x Q&r, where Qm = myo- cardial blood 5ow (in milliliters per minute), Cm = counts per minute in the tissue sample, Qr = the reference with- drawal rate (in milliliters per minute), and Cr = counts per minute in the reference arterial sample. Flow per gram of tissue was then determined by dividing sample 50~s by sample weight. The myocardium was considered severely ischemic when subendocardial myocardial blood 5ow was less than 0.2 ml/min/gm.
The same coordinate system was used for all measure- ments that divided the slice into 16 radial sectors (of 22.5 degrees each) at the midpapillary muscle level. This coor- dinate system provided a means to localize the central nor- mal and central ischemic zones as determined by his- tochemical staining, wall thickening, and edema measure- ments. The central ischemic zone was defined in the middle of the posterior papillary muscle at 135 degrees. The nor- mal zone was defined at 130 degrees from the center of the ischemic zone at 315 degrees.
Functional analysis. Short-axis two-dimensional echocardiography was performed at the level of the mid- papillary muscle; the data were subsequently analyzed on a microcomputer-based video digitizing system. End-dias- tolic and end-systolic frames were selected by using the
onset of the Q wave in lead II to define end diastole and the smallest ventricular cavity to define end systole. Endocar- dial and epicardial borders were traced directly on the video display for three successive heats during normal si- nus rhythm using a digitizing tablet. Analysis was per- formed using a radial contraction model with a fixed dias- tolic center of mass at 22.5 degree intervals over the full left ventricular circumference. The mid-point of the posterior papillary muscle was fixed at 135 degrees for correction of rotation. Wall thickening was calculated as: [(end-systolic wall thickness - end-diastolic wall thickness)/end-dias- tolic wall thickness] X 100%.
The normal range of wall thickening was determined from a functional map of the baseline images for three car- diac cycles and 95% tolerance limits were determined for each animal. These limits were used for comparison with occlusion and reperfusion functional maps and abnormal- ities were expressed as the circumferential extent and de- gree of dysfunction. I4 The extent of dysfunction was defined as the number of degrees where the occlusion or reperfusion functional map intercepted the lower control tolerance limit. The degree of dysfunction was defined as the area of the map, determined by planimetry, contained within the dysfunctional area.

658 Karolle et al. September 1091
Amerlcsn Heart Journal
occlusion
Group I
Group II
occlusion reperfusion
I
t baseline
Fig. 2. Protocol. Group I (seven dogs) underwent 2 hours of occlusion without reperfuaion; group II (10 dogs) underwent 2 hours of occlusion plus 2 hours of reperfusion. Time point measurements are represented by arrows and were obtained at baseline, at 2 hour of occlusion, and at 2 hours of reperfusion. Measure- ments included hemodynamics, blood flow studies, and two-dimensional echocardiography.
Table I. Hemodynamic data
Baseline 2 hr WC 1 hr rep 2 hr rep
HR MAP LAP
Group I Group II Group Z Group II Group I Group II (n = 7) (n = 10) (n = 7) (n = 10) (n = 7) (n = 10)
151 * 4 139 z!z 6 133 * 8 122 f 8 2 * 0.3 1 f 0.2 144 * 9 147 f I 122 + 1 112 k 8 3 zt 0.6 2 rf: 0.3*
163 f 9 107 + 9 3 f 0.5 131 * 14 111 * 9 2 f 0.4
HR. Heart rate; LAP, left atria1 pressure; MAP, mean arterial pressure; occ, occlusion; rep, reperfusion. *p < 0.05 versus baseline.
Table II. Edema data
Zschemic zone Normal zone
Subendo Subepi Subendo Su bepi
o/u Hz0 Group I (n = 7) 78.8 + 0.3* 74.8 + 1.1 77.1 + 0.2* 76.8 + 0.3 Group II (n = 10) 84.5 k 0.6* 82.8 + 0.8 79.1 f 0.7 78.8 k 0.5
Tl (msec) Group I (n = 7) 707.8 2 12.q 641.7 f 20.5 652.1 + 9.17 635.2 + 9.2 Group II (n = 10) 813.2 f 36.2t 760.5 r 34.7 679.1 f 12.5 672.8 zt 16.6
T2 (msec) Group I (n = 7) 54.7 k 0.8 54.0 * 1.4 50.7 IT 1.0 48.8 + 1.4 Group II (n = 10) 18.7 f 6.3 73.1 * 4.0 54.1 + 1.5 54.4 zk 1.7
Subendo, Subendocardium; Subepi, subepicardium. *p < 0.05 versus subepicardium; tp < 0.01 versus subepicardium.
Statistical analysls. Values are shown as the mean + SEM. Comparisons were made using a two-tailed Student’s t test with a Bonferroni correction when comparisons were made over time with respect to baseline values. Statistical signitlcance was determined at probabilities of p < 0.05.
RESULTS
creased mean arterial pressure and increased left atrial pressure during occlusion and during reperfu- sion in both groups. In addition, there was an increase in left atrial pressure in group II at 2 hours occlusion versus baseline that was not present in group I, but did not reach significance between the groups.
Hemodynamics (Table I). Hemodynamic measure- NMR spectroscopy (Table II, Fig. 3). Subendocar- ments other than left atrial pressure showed no sig- dial Tl relaxation times were prolonged in the cen- nificant changes over time within either group or be- tral ischemic zone (707.8 + 12.6 msec) with respect tween the groups. However, there was a trend of de- to the normal zone (652.1 + 9.1 msec) in group I
Volume 122
NumbW 3, Part t Distribution of myocardial edema in ischemia 659
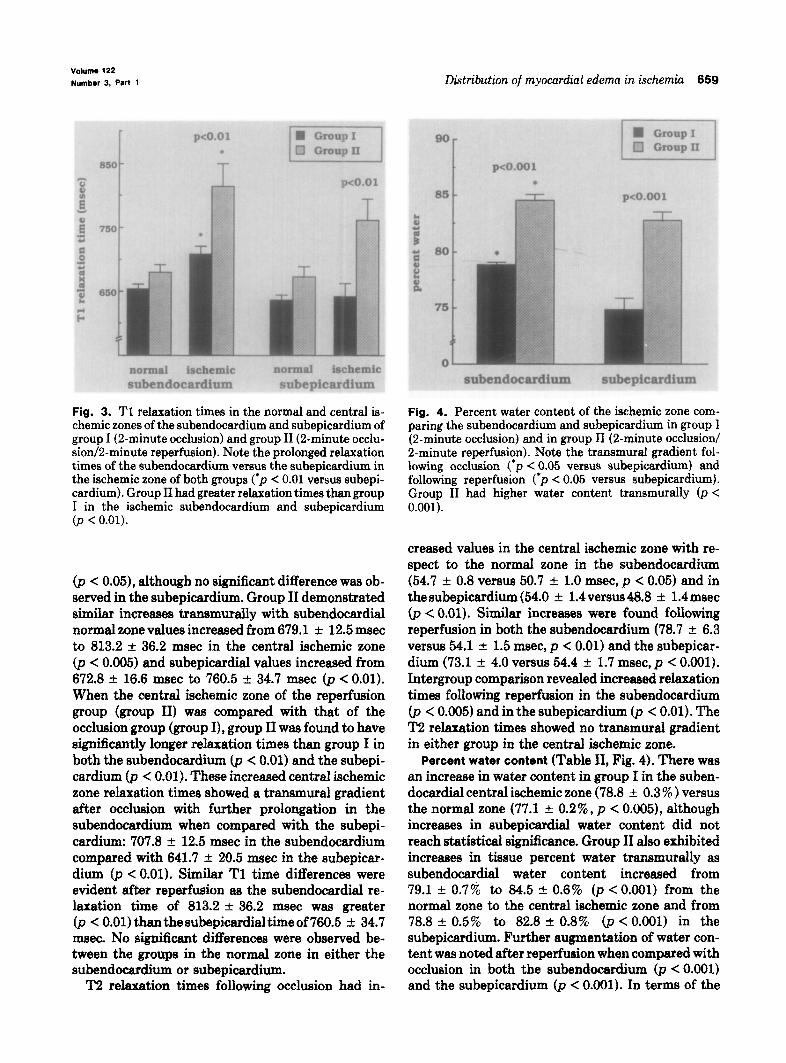
Fig. 3. Tl relaxation times in the normal and central is- chemic zones of the subendocardium and subepicardium of group I (2-minute occlusion) and group II (2-minute occlu- sion/2-minute reperfusion). Note the prolonged relaxation times of the subendocardium versus the subepicardium in the ischemic zone of both groups (‘p < 0.01 versus subepi- cardium). Group II had greater relaxation times than group I in the ischemic subendocardium and subepicardium (p < 0.01).
0, < 0.05), although no significant difference was ob- served in the subepicardium. Group II demonstrated similar increases transmuraIly with subendocardial normal zone values increased from 679.1 f 12.5 msec to 813.2 +- 36.2 msec in the central ischemic zone (p < 0.005) and subepicardial values increased from 672.8 it 16.6 msec to 760.5 k 34.7 msec (p < 0.01). When the central ischemic zone of the reperfusion group (group II) was compared with that of the occlusion group (group I), group II was found to have significantly longer reIaxation times than group I in both the subendocardium (p < 0.01) and the subepi- cardium &< 0.01). These increased central ischemic zone relaxation times showed a transmural gradient after occlusion with further prolongation in the subendocardium when compared with the subepi- cardium: 707.8 + 12.5 msec in the subendocardium compared with 641.7 t- 20.5 msec in the subepicar- dium (p < 0.01). Similar Tl time differences were evident after reperfusion as the subendocardial re- laxation time of 813.2 f 36.2 msec was greater (p < 0.01) than the e&epicardial time of 760.5 + 34.7 msec. No significant differences were observed be- tween the groups in the normal zone in either the subendocardium or subepicardium.
T2 relaxation times following occlusion had in-
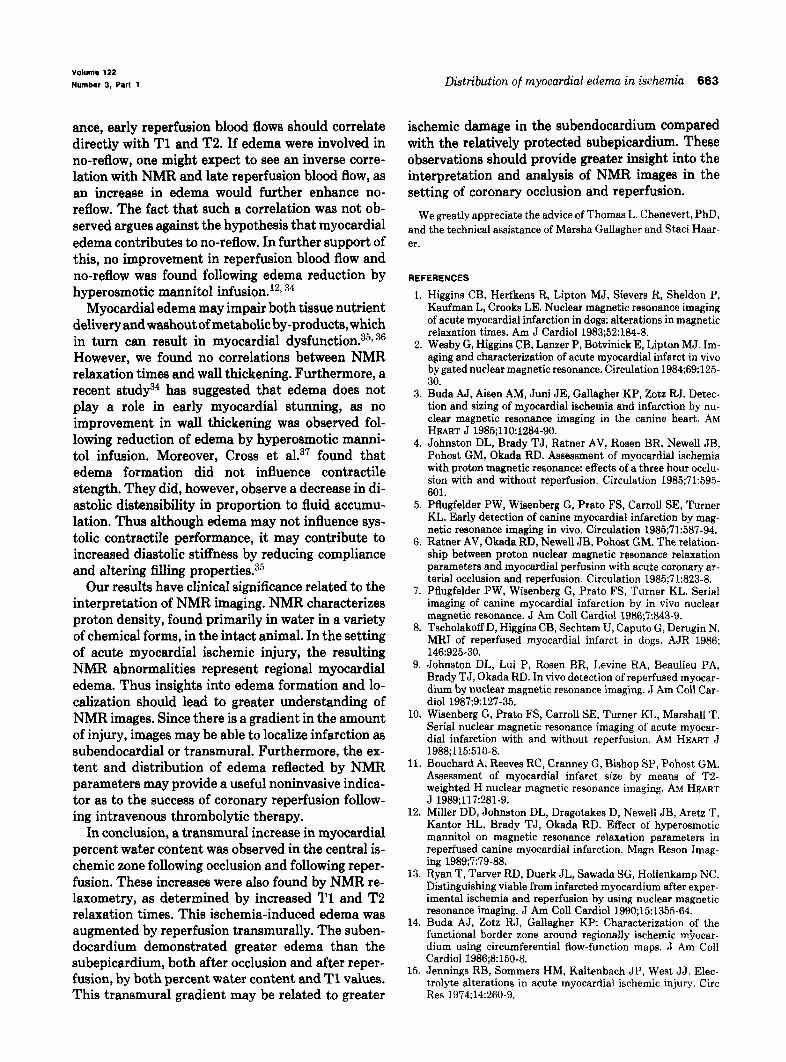
Fig. 4. Percent water content of the ischemic zone com- paring the subendocardium and subepicardium in group I (2-minute occlusion) and in group II (2-minute occlusion/ P-minute reperfusion). Note the transmural gradient fol- lowing occlusion (‘p < 0.05 versus subepicardium) and following reperfusion (*p < 0.05 versus subepicardium). Group II had higher water content transmurally (p < 0.001).
creased values in the central ischemic zone with re- spect to the normal zone in the subendocardium (54.7 + 0.8 versus 50.7 + 1.0 msec, p < 0.05) and in thesubepicardium (54.0 rt 1.4versus48.8 rt 1.4msec (p < 0.01). Similar increases were found following reperfusion in both the subendocardium (78.7 +- 6.3 versus 54.1 -+ 1.5 msec, p < 0.01) and the subepicar- dium (73.1 f 4.0 versus 54.4 + 1.7 msec, p < 0.001). Intergroup comparison revealed increased relaxation times following reperfusion in the subendocardium (p < 0.005) and in the subepicardium 03 < 0.01). The T2 relaxation times showed no transmural gradient in either group in the centraI ischemic zone.
Percent water content (Table II, Fig, 4). There was an increase in water content in group I in the suben- docardial central ischemic zone (78.8 rt 0.3 % ) versus the normal zone (77.1 + 0.2%, p < 0.005), although increases in subepicardial water content did not reach statistical significance. Group II also exhibited increases in tissue percent water transmurahy as subendocardial water content increased from 79.1 f 0.7% to 84.5 rt 0.6% o> < 0.001) from the normal zone to the central ischemic zone and from 78.8 + 0.5% to 82.8 + 0.8% (p < 0.001) in the subepicardium. Further augmentation of water con- tent was noted after reperfusion when compared with occlusion in both the subendocardium (p < 0.001) and the subepicardium (p < 0.001). In terms of the

660 Karolle et al.
3.0 r
ii 2-o. ‘;i i lm5 2: A l.O- B
4 0.5 - Q 8 a o.o-
September 1991
American Heart Journal
*
I I I I
baseline P’occ 1’ rep 2’ rep
Fig. 5. Transmural blood flow of group II at baseline, at 2 hours of occlusion (occ), and at 1 and 2 hours of reperfusion (rep). Note the lower flow in the subendocardium than subepicardium at occlusion (*p < 0.05 versus subepicardium), which is not apparent at 1 hour of reperfusion, but returns at 2 hours of reperfu- sion.
Table III. Transmural blood flow
Ischemic zone Normal zone
Group I Group II Group I Group II
Subendocardium Baseline 1.49 * 0.27 1.39 f 0.22 1.32 k 0.17 1.55 + 0.29 2 hr occ 0.03 + 0.01 0.08 k 0.04 1.17 rf: 0.24 1.80 k 0.39 1 hr rep 1.81 2 0.60 2.14 rf: 0.53 2 hr rep 1.20 + 0.31 1.94 * 0.39
Midmyocardium Baseline 1.54 k 0.28 1.33 + 0.23 1.32 +c 0.20 1.48 + 0.29 2 hr occ 0.14 i. 0.04 0.24 k 0.08 1.16 + 0.22 1.72 + 0.39 1 hr rep 1.35 k 0.24 1.95 k 0.48 2 hr rep 1.06 f 0.19 1.84 i 0.36
Subepicardium Baseline 1.33 t- 0.21 1.28 f 0.26 1.24 2 0.17 1.38 k 0.23 2 hr occ 0.40 f 0.13 0.40 * 0.14 1.17 * 0.19 1.66 f. 0.32 1 hr rep 1.92 * 0.35 1.89 + 0.43 2 hr rep 1.63 -t 0.22 1.84 k 0.40
All values are in milliliters per minute per gram. Abbreviations as in Table I.
transmural water content in the central ischemic Transmural blood flow (Table III, Fig. 5). No statis- zone, the water content was significantly higher in the tical differences were found between the protocol subendocardium than in the subepicardium follow- groups. Both groups had a severe reduction of myo- ing occlusion (p < 0.01) and following reperfusion cardial blood flow during occlusion in the central is- (p < 0.01). chemic zone. This reduction was present transmu-
Correlations between percent water content and rally, but there was a gradient with lower flow at oc- NMR relaxation times in the central ischemic zone elusion in the subendocardium of both groups when were determined. Both subendocardial and subepi- compared with the midmyocardium (p < 0.005) and cardial Tl values correlated well with percent water when compared with the subepicardium (p < 0.05). content (f = 0.70, p < 0.01; r = 0.86, p < 0.001, re- In group II, at 1 hour reperfusion flow returned to spectively). T2 relaxation times showed similar cor- near baseline levels in the subendocardium and mid- relations in the subendocardium (r = 0.80, p < 0.001) myocardium. Blood flow was augmented above base- and in the subepicardium (r = 0.72, p < 0.01). line levels in the subepicardium (p < 0.005 versus

Volume 122
Number 3, Part 1
50 r
Distribution of myocardial edema in &hernia 661
M 30- 4
0 $j 20-
z
9 lo-
os 0-
-1o- baseline 2’occ l’rep 2’rep
Fig. 6. Percent wall thickening of group II in the central ischemic zone (ischemic) to the central normal zone (normal). Note the thinning of the ischemic zone during occlusion with little improvement during reperfusion.
baseline), but this was not remarkably different from that in the normal zone. By 2 hours reperfusion, flow was attenuated in the central ischemic midmyocar- dium compared with that in the normal zone 0, < 0.005), and a similar trend was also observed in the subendocardium. Although the central ischemic subepicardial blood flow was above baseline levels, the central ischemic zone flow was still much lower than normal zone flow (p < 0.05). Correlations were also not observed between blood flow at occlusion or during reperfusion, and percent water content or Tl and T2 relaxation times.
Functional data (Fig. 6). There were no significant intergroup functional differences at baseline or at occlusion. However, in the central ischemic zone, there was marked thinning of the left ventricular wall at occlusion in both groups (p < 0.005) that persisted with little improvement during reperfusion (p < 0.005). The normal zone demonstrated aug- mented thickening at occlusion in the reperfusion group that was not present in the occlusion group, although these differences were not statistically sig- nificant between groups.
End-systolic area increased during occlusion and remained increased during reperfusion. End-dias- tolic area also increased following occlusion in the reperfusion group (p < 0.001) but not in the occlu- sion group, although no differences were seen be- tween the two groups. This increased area returned to baseline values during reperfusion. Although area ejection fraction was reduced during occlusion in both groups, area ejection fraction improved some- what following reperfusion in group II, but remained depressed. The regional indices of dysfunction, as
defined by the degree and extent of dysfunction, demonstrated no improvement with reperfusion. Correlations were not observed between percent wall thickening and NMR relaxation times or percent water content.
DISCUSSION
Our data indicate that following coronary occlu- sion, a transmural increase in myocardial water con- tent occurs in the central ischemic zone, as deter- mined by NMR-derived Tl and T2 relaxation times and percent water content. This myocardial edema is greater in the subendocardium than in the subepi- cardium, and is further augmented by reperfusion. As a result, a transmural gradient of edema is also present from the subendocardium to subepicardium following coronary reperfusion.
It is well known that impaired cell volume regula- tion, interstitial fluid accumulation, and focal struc- tural defects in the cell membrane integrity are early manifestations of ischemic injury.15-17 Willerson et aLI7 demonstrated that myocardial edema can occur as early as 40 minutes after coronary occlusion, and is associated with a significant decrease in Na/K ad- enosine triphosphatase (ATPase) activity in the ischemic region, which probably contributes to the cell swelling. During a period of ischemia, the Na/K ATPase pump is unable to actively extrude Na from the interior of cells, and this results in intracellular movement of Na, Cl, and Hz0 with subsequent cell swelling. Even relatively brief periods of ischemia (15 minutes) and reperfusion may lead to myocardial edema as a result of increased permeability because of endothelial injury. ‘s Ischemia produces functional

662 Karolle et al. September 1881
American Heart Journal
coronary microvascular injury that may further con- tribute to this tissue edema. Thus as the duration and severity of ischemia increase, microvascular perme- ability increases. ‘* Following more prolonged is- chemia and necrosis, there is a disruption of the my- ocardial cell membrane and a loss of intracellular edema. This edema correlates with the extent of eventual myocardial cell necrosis,lg* 2o but remaining viable cells may also demonstrate persistent cell swelling.16
Our results concur with those of previous studies that have observed an increase in myocardial relax- ation times in the ischemic zone after coronary occlusion and reperfusion.* For example, Johnston et al.4 found that increased NMR relaxation times were greater in the subendocardium than in the subepi- cardium following a 3-hour occlusion. Furthermore, other studies have shown that edema measured by NMR relaxation times is augmented by reperfusion compared with coronary occlusion.4l gl lo In agree- ment with our results, both Ratner et al6 and Johnston et a1.4 observed an increase in Tl and T2 relaxation times following occlusion in the suben- docardium versus the subepicardium, and following reperfusion, this transmural gradient was augmented. Thus both in the setting of ischemia and of reperfu- sion, a transmural gradient of myocardial edema from the subendocardium to the subepicardium oc- curs.
The transmural gradient of myocardial edema may be related to other transmural pathophysiologic events that are known to occur during ischemia and reperfusion. Following coronary occlusion, we ob- served a transmural blood flow gradient in the cen- tral ischemic zone, with blood flow reduced to nearly zero in the subendocardium, with relatively greater flow in the subepicardium. This is in concurrence with the findings of previous studies that have shown that the subepicardium receives preferential collat- eral flo~.~l-~~ Fukunami et al.25 found a slight trans- mural gradient at the onset of ischemia that in- creased at 30 minutes of ischemia with greater collateral flow in the subepicardium. By 24 hours of occlusion, there was an increase in midmyocardial and subepicardial blood flow with again no improve- ment in subendocardial blood flow. Thus the trans- mural gradient of myocardial edema may then be at- tributed to greater ischemic injury from lower blood flow in the subendocardium. The greater oxygen de- mand in the subendocardium, due to greater wall stress and other factors including greater extravas- cular systolic tissue pressure26p 27 and lower oxygen
‘References 1-4, 6, a-10, and 12.
tension27* 28 may exacerbate this ischemic blood flow gradient.
The vulnerability of the subendocardium to is- chemic injury is well known and occurs in a wavelike pattern of necrosis beginning in the subendocardium and progressing outward to the subepicardium with prolonged coronary occlusion.2g This gradient’, is likewise seen following coronary reperfusion, with maximum stunning and slowest recovery found in the subendocardium.30 In addition, Sheppard and Gavin31 have reported a transmural progression of no-reflow across the myocardial wall. In this regard, we found that the transmural flow gradient dimin- ished at 1 hour of reperfusion as flows in all myocar- dial layers approached values in the normal zone. However, by 2 hours of reperfusion, a transmural flow gradient was again evident, with lower flow again present in the subendocardium. This suggests an early development of the no-reflow phenomenon in the subendocardium prior to that in the subepicardi- urn, which may be indicative of greater ischemic and reperfusion injury. A similar transmural gradient in the rate at which the ischemic myocardium utilizes ATP32 and develops irreversible cell injury may fur- ther contribute to the development of the transmu- ral gradient of myocardial edema.33 The differences in ATP utilization may also be caused by the gradi- ent in the distribution of blood flow, since a linear relationship between ATP depletion and blood flow exists at occlusion.25
In view of these considerations, it was of interest that correlations were not observed in our study be- tween NMR relaxation times and myocardial blood flow at occlusion or reperfusion. Previous studies48 6 l2 have shown inverse correlations be- tween occlusion blood flow and TUT2 times follow- ing coronary occlusion. The apparent discrepancy between the results of these studies and those of our study may be attributed to the narrow range of blood flows that we used to define severe ischemia. Animals with subendocardial blood flows greater than 0.2 ml/ min/gm were considered to have significant collater- als and were excluded from analysis, whereas other investigators have accepted a much wider range of ischemic blood flows. As a result of our uniformly low blood flows, the ability to observe significant correla- tions was minimized.
Our study also found no correlation between re- laxation times and reperfusion blood flow. Previous studies have found varied results; NMR relaxation times have been found to have been directly correlated6 with reperfusion blood flow, whereas other investigators l2 found no such correlation. As reperfusion augments fluid and electrolyte imbal-
volume 122
Number 3, Part 1
ante, early reperfusion blood flows should correlate directly with Tl and T2. If edema were involved in no-reflow, one might expect to see an inverse corre- lation with NMR and late reperfusion blood flow, as an increase in edema would further enhance no- reflow. The fact that such a correlation was not ob- served argues against the hypothesis that myocardial edema contributes to no-reflow. In further support of this, no improvement in reperfusion blood flow and no-reflow was found following edema reduction by hyperosmotic mannitol infusion.i2s 34
Myocardial edema may impair both tissue nutrient delivery and washout of metabolic by-products, which in turn can result in myocardial dysfunction.35l 36 However, we found no correlations between NMR relaxation times and wall thickening. Furthermore, a recent studf4 has suggested that edema does not play a role in early myocardial stunning, as no improvement in wall thickening was observed fol- lowing reduction of edema by hyperosmotic manni- to1 infusion. Moreover, Cross et al.37 found that edema formation did not influence contractile stength. They did, however, observe a decrease in di- astolic distensibility in proportion to fluid accumu- lation. Thus although edema may not influence sys- tolic contractile performance, it may contribute to increased diastolic stiffness by reducing compliance and altering filling properties.35
Our results have clinical significance related to the interpretation of NMR imaging. NMR characterizes proton density, found primarily in water in a variety of chemical forms, in the intact animal. In the setting of acute myocardial ischemic injury, the resulting NMR abnormalities represent regional myocardial edema. Thus insights into edema formation and lo- calization should lead to greater understanding of NMR images. Since there is a gradient in the amount of injury, images may be able to localize infarction as subendocardial or transmural. Furthermore, the ex- tent and distribution of edema reflected by NMR parameters may provide a useful noninvasive indica- tor as to the success of coronary reperfusion follow- ing intravenous thrombolytic therapy.
In conclusion, a transmural increase in myocardial percent water content was observed in the central is- chemic zone following occlusion and following reper- fusion. These increases were also found by NMR re- laxometry, as determined by increased Tl and T2 relaxation times. This ischemia-induced edema was augmented by reperfusion transmurally. The suben- docardium demonstrated greater edema than the subepicardium, both after occlusion and after reper- fusion, by both percent water content and Tl values. This transmural gradient may be related to greater
Distribution of myocardial edema in &hernia 663
ischemic damage in the subendocardium compared with the relatively protected subepicardium. These observations should provide greater insight into the interpretation and analysis of NMR images in the setting of coronary occlusion and reperfusion.
We greatly appreciate the advice of Thomas L. Chenevert, PhD, and the technical assistance of Marsha Gallagher and Staci Haar- er.
REFERENCES
1.
2.
3.
4.
5.
6.
7.
8.
9.
10.
11.
12.
13.
14.
15.
Higgins CB, He&ens R, Lipton MJ, Sievers R, Sheldon P, Kaufman L, Crooks LE. Nuclear magnetic resonance imaging of acute myocardial infarction in dogs: alterations in magnetic relaxation times. Am J Cardiol 1983;52:184-8. Wesby G, Higgins CB, Lanzer P, Botvinick E, Lipton MJ. Im- aging and characterization of acute myocardial infarct in vivo by gated nuclear magnetic resonance. Circulation 1984;69:125- 30. Buda AJ, Aisen AM, Juni JE, Gallagher KP, Zotz RJ. Detec- tion and sizing of myocardial ischemia and infarction by nu- clear magnetic resonance imaging in the canine heart. AM HEART J 1985;110:1284-90. Johnston DL, Brady TJ, Ratner AV, Rosen BR, Newell JB, Pohost GM, Okada RD. Assessment of myocardial ischemia with proton magnetic resonance: effects of a three hour occlu- sion with and without reperfusion. Circulation 1985;71:595- 601. Pflugfelder PW, Wisenberg G, Prato FS, Carroll SE, Turner KL. Early detection of canine myocardial infarction by mag- netic resonance imaging in vivo. Circulation 1985;71:587-94. Ratner AV, Okada RD, Newell JB, Pohost GM. The relation- ship between proton nuclear magnetic resonance relaxation parameters and myocardial perfusion with acute coronary ar- terial occlusion and reperfusion. Circulation 1985;71:823-8. Pflugfelder PW, Wisenberg G, Prato FS, Turner KL. Serial imaging of canine myocardial infarction by in vivo nuclear magnetic resonance. J Am Co11 Cardiol 1986,‘7:843-9. Tscholakoff D, Higgins CB, Sechtem U, Caputo G, Derugin N. MRI of reperfused myocardial infarct in dogs. AJR 1986; 146:925-30. Johnston DL, Lui P, Rosen BR, Levine RA, Beaulieu PA, Brady TJ, Okada RD. In vivo detection of reperfused myocar- dium by nuclear magnetic resonance imaging. J Am Co11 Car- diol 1987;9:127-35. Wisenberg G, Prato FS, Carroll SE, Turner KL, Marshall T. Serial nuclear magnetic resonance imaging of acute myocar- dial infarction with and without reperfusion. AM HEART J 1988;115:510-8. Bouchard A, Reeves RC, Cranney G, Bishop SP, Pohost GM. Assessment of myocardial infarct size by means of TZ- weighted H nuclear magnetic resonance imaging. AM HEAFW J 198$117:281-g. Miller DD, Johnston DL, Dragotakes D, Newell JB, Aretz T, Kantor HL, Brady TJ, Okada RD. Effect of hyperosmotic mannitol on magnetic resonance relaxation parameters in reperfused canine myocardial infarction. Magn Reson Imag- ing 1989;7:79-88. Ryan T, Tarver RD, Duerk JL, Sawada SG, Hollenkamp NC. Distinguishing viable from infarcted myocardium after exper- imental ischemia and reperfusion by using nuclear magnetic resonance imaging. J Am Co11 Cardiol 1990;15:1355-64. Buda AJ, Zotz RJ, Gallagher KP: Characterization of the functional border zone around regionally ischemic mkocar- dium using circumferential flow-function maps. J Am Co11 Cardiol 1986;8:150-8. Jennings RB, Sommers HM, Kaltenbach JP, West JJ. Elec- trolyte alterations in acute myocardial ischemic injury. Circ Res 1974;14:260-9.

664 Karolle et al. September 1991
Amerkan Heart Journal
16. Powell WJ, DiBona DR, Flores J, Leaf A. The protective ef- fect of hyperosmotic mannitol in myocardial ischemia and ne- crosis. Circulation 1976;54:603-15.
17. Willerson JT, Scales F, Mukherjee A, Platt M, Templeton G, Fink B, Buja M. Abnormal myocardial fluid retention as an early manifestation of ischemic injury. Am J Path01 1977;87:159-88.
18. Dauber IM. VanBenthuvsen. McMurtrv IF. Wheeler GS.
19.
20.
21.
22.
23.
24.
25.
Lesnerfsky EJ, Horwitz LD, Weil JV. Functional coronary microvascular injury evident as increased permeability due to brief ischemia and reperfusion. Circ Res 1990;66:986-98. Carlson RE, Aisen AM, Gallagher MA, Chenevert TL, Buda AJ. Proton nuclear magnetic resonance relaxation spectros- copy reliably predicts the severity of ischemic injury [Ab- stract]. Circulation 1988;78(suppl 11):341. DiBona DR, Powell WJ. Quantitative correlation between cell swelling and necrosis in myocardial ischemia in dogs. Circ Res 1980;47:653-65. Bathe RJ, Corr FR, Greenfield JC Jr. Myocardial blood flow distribution during &hernia-induced coronary vasodilation in the unanesthetized dog. J Clin Invest 1974;54:1462-72. Juedutt BI. Hutchins GM. Bulklev BH. Becker LC. Mvocar- dia”l infarction in the conscious dog: three-dimensional” map- ping of infarct, collateral flow and region at risk. Circulation 1979;60:1141-50. Nienaber CH, Gottwik M, Winkler B, Schaper W. The relationship between the perfusion deficit, infarct size and time after experimental coronary artery occlusion. Basic Res Cardiol 1983;78:210-26. Downey JM. Why the endocardium? In: Hearse DJ, Yellon DM, eds. Therapeutic approaches to myocardial infarct size limitation. New York: Raven Press, 1984:125-38. Fukunami M, Yellon DM, Kudoh Y, Maxwell MP, Wyse RKH, Hearse DJ. Spatial and temporal characteristics of the trans- mural distribution of collateral flow and energy metabolism during regional myocardial ischemia in the dog. Can J Cardiol 1987;3:94-103.
26.
27.
28.
29.
30.
31.
32.
33.
34.
35.
36.
37.
Kirk ES, Honig AC. An experimental and theoretical analysis of myocardial tissue pressure. Am J Physiol 1964;207:361-7. Kirk ES. Honie CR. Nonuniform distribution of blood flow and gradients o? oxygen tension within the heart. Am J Phys- iol 1964;297:661-8. Weiss HR, Sinha AK. Regional oxygen saturation of small ar- terieeandveinsinthecaninemyocardium. CirRes 1978;42:119- 25. Reimer KA, Jennings RB. The “wavefront phenomenon” of myocardial ischemic cell death. Lab Invest 1979;40:633-44. Bolli R, Pate1 BS, Hartley CJ, Thomby JI, Jeraudi MO, Rob- erts R. Nonuniform transmural recovery of contractile func- tion in stunned myocardium. Am J Physiol1989;257:H375-85. Sheppard AJ, Gavin JB. The trausmural progression of the no-reflow phenomenon in globally ischemic hearts. Basic Res Cardiol 1988;83:611-7. DeBoer LWV, Ingwall JS, Kloner RA, Braunwald E. Pro- longed derangements of canine myocardial purine metabolism after a brief coronary artery occlusion not associated with an- atomic evidence of necrosis. Proc Nat1 Acad Sci USA 1980:77: 5471-5. Humphrey SM, Vanderwee MA, Gavin JB. Transmural dif- ferences in the postischemic recovery of cardiac energy me- tabolism. Am J Path01 1988;131:5-11. Carlson RE, Aisen AM, Gallagher M, Buda AJ. Does the re- duction in myocardial edema improve blood flow or functional recovery? [Abstract] Clin Res 1989;37:249A. Pogatea G, Dubecz E, Gabor G. The role of myocardial edema in the left ventricular diastolic stiffness. Basic Res Cardiol 1976;71:263-9. Laine GA. Change in dP/dtmax as an index of myocardial mi- crovascular permeability. Circ Res 1987;61:203-8. Cross CE, Rieben PA, Salisbury PF. Influence of coronary perfusion and myocardial edema on pressure-volume diagram of left ventricle. Am J Physiol 1961:201:102-8.