Genetic Association of Apolipoprotein E with Age-Related Macular Degeneration
COMPARISON BETWEEN FUNDUS FLOURESCEIN ANGIOGRAPHY AND OPTICAL COHERENCE TOMOGRAPHY IN MACULAR EDEMA IN BANGLADESHI SUBJECTS.
Extra-vascular accumulation of fluid in the macula is known asmacular oedema (Kent, 2000). It results from the breakdown of theblood-retinal barrier (BRB). ). It is the most common cause ofvisual deprivation in patients with diabetic retinopathy (Patz etal., 1973) and in other retinal vascular diseases like branch andcentral retinal vein occlusion. Blood retinal barrier (BRB)limits plasma with it’s cellular component from entering thesensory retina, which has but a small extracellular space.Disruption of the blood retinal barrier results in an increase ofthe extracellular fluid within the sensory retina (Newel, 1996)causing macular oedema
Fundus Fluorescein Angiography(FFA) is still considered as the golden standard method for the diagnosis of macular oedema. FFA outlines the retinal blood vessels, also differentiates between focal and diffuse leakage, which has important treatment implications. FFA also can be used to find evidence of foveal nonpefusion that has prognostic value in determining potential improvement in visual acuity (Croes and Kurek, 2004).
Optical Coherence Tomography (OCT) is a non-contact, noninvasiveimaging technique that provides a useful adjunct in diagnosingmacular oedema. It directs a beam of near infra-red light (830-nm) perpendicular to the surface of the retina and analyzes theproperties of the reflections. In 1.5 seconds, it produces asingle linear high resolution cross-sectional image. These imagescan display and even measure the thickened, cystic retina foundin edematous areas.
Macular oedema is a common disease entity causing visualdeprivation originating from various pathologic conditions.Presence or absence of macular oedema, its type, extent andseverity, prognostic factors all have clinical significance.

Stereoscopic fundoscopy, fundus fluorescein angiography, OCT aresome important diagnostic tools that help ophthalmologists indecision making to start treatment and also help in follow up.FFA is considered as a foremost standard for the diagnosis ofalmost all macular conditions. OCT, a newer and noninvasiveinvention unlike FFA, which help by qualitative as well asquantitative assessment. Now-a-days, digital FFA and OCT areequally available in our country and offering almost equalcompensation package.
In Bangladesh, macular oedema is not very uncommon conditioncausing visual deprivation originating from various pathologicconditions. Presence or absence of macular oedema, its type,extent and severity, prognostic factors all have clinicalsignificance. Stereoscopic fundoscopy, FFA, are some importantdiagnostic tools that help ophthalmologists in decision making tostart treatment and also help in follow up. FFA is considered asa foremost standard for the diagnosis of almost all macularconditions. Recently, OCT, a newer and noninvasive inventionunlike FFA, which help by qualitative as well as quantitativeassessment of macular oedema become an essential diagnostic tool.Now-a-days, digital FFA and OCT are equally available in ourcountry and offering almost equal compensation package.
PATIENTS AND METHODS
Type of the study: Cross sectional observational study.Place of the study: Dept. of Ophthalmology, BIRDEM, Dhaka, andHarun Eye Foundation, Dhanmondi, Dhaka.
Period of study: July 2005 to December 2006.Study population: Patients attending vitreo-retina department ofBIRDEM with suspected macular diseases.Sample criteria:Inclusion criteria: Macular oedema patients of-
20 years and above Both sexed Irrespective of origin of ME
Exclusion criteria: Patients with- Media opacity Renal failure Allergy of fluorescin dye Non cooperative patients
Sampling technique: Patients with suspected posterior segmentdiseases attending vitreo-retina department were examined withstereoscopic slit-lamp biomicroscopy and when clinically macularoedema was established were included in the study on a randombasis.
Sample size: 50 eyes of 40 patients who fulfilled the inclusionand exclusion criteria were included in the study. 30 patientshad unilateral involvement and 10 patients had bilateralinvolvement. Each eye was considered as a case.
Ethical consideration: Study patients were explained in detailsabout the disease process, prognosis, existing treatment options,technique of each diagnostic tool, benefits, potential risks andthen written consent was taken before conducting the studymaintaining the ethical aspects of Helsinki declaration.
Study protocol: A detailed study protocol explaining differenttechniques of evaluation and methods of analysis was approved bythe University
1. HISTORY:Presenting complaints:
Past history: Of ocular disease, ocular therapy or surgeryOf systemic disease like diabetes, hypertension, etc.Of previous ocular surgery
Drug history: H/o any systemic or ophthalmic drug useH/o drug allergy (fluorescein)
Family history: Of relevant ocular or systemic diseases
4. RELEVANT INVESTIGATIONS FOR THE UNDERLYING DISEASE:All patients underwent OCT 2 scanning (OCT, Zeiss HumphreySystems, Dublin, CA) at 0, 45, 90 and 135 degrees centered onfixation (linear scans). Fundus fluorescein angiograms (TopconIMAGE net® system, 1024 lines resolution) were taken on the samevisit subsequent to intravenous injection of 5 ml 20% sodiumfluorescein. Photographs were analyzed at approximately 10 minand the diagnosis was established considering incomplete 360degree, mild to severe perifoveal hyperfluorescence.
5. CLINICAL EVIDENCES OF MACULAR OEDEMA: Poor visual acuity which is further reduced with pin hole. Contact lens and stereoscopic slit-lamp fundus biomicroscopy
reveals- loss of shiny appearance of macula, irregularelevation within the macula often adjacent to intraretinallipid, microaneurysms, and / or hemorrhages in casessecondary to diabetes mellitus, vascular occlusion, orischemia.
Elevation with cystic spaces localized to the parafovealretina with or without adjacent vascular abnormalities.
elevation with subretinal hemorrhage or membrane, Serous elevation, etc.
(Kinyoun et al., 1989 and Lerche et al., 2001)Patients with clinically detected macular oedema weresubsequently advised for FFA and OCT evaluation separately.Skilled interpreter for FFA and OCT studied and interpreted eachreport. OCT interpreter was masked about the report of FFA andvice versa.

6. FFA EVIDENCES OF MACULAR OEDEMA:FFA shows hyperfluorescence in the affected site in early to midframes that increases in area and intensity in later frames.Leakage may be either of-
Focal Diffuse Cystoid (Ozdek, 2005)
7. OCT EVIDENCES OF MACULAR OEDEMA:When central macular thickness measured greater than 185 um,macular thickening was considered (Hee et al., 1995). Moreover,following OCT patterns of macular thickening were also studied-
Sponge-like retinal swelling Cystoid macular oedema Serous retinal detachment Vitreofoveal traction Thickened macula with choroidal neovascularization, etc.
(Alkuraya et al., 2005)
PARAMETERS EVALUATED:Demographic parameters-AgeSexLaterality of eye Mean required time to perform FFA and OCT
Clinical parameters-Underlying disease of macular oedemaFFA variants of macular oedemaOCT variants of macular oedemaComplication of FFA and OCT
Outcome measures- Correlation of macular thickness obtained by OCT with visual
acuity expressed in logMAR unit. Percentage of macular oedema detected by OCT and FFA and
inter-technique agreement measurement.
DATA COLLECTION AND STATISTICAL ANALYSIS:Data were collected in a pre-designed data collection sheet(Appendix-I). Correlation of macular thickness obtained by OCTwith visual acuity expressed in logMAR unit was assessed. Inter-technique agreement was assessed by Kappa agreement test(Appendix-II).
OBSERVATIONS AND RESULTS
Results have been shown in tabulated forms and figures from hereonwards:
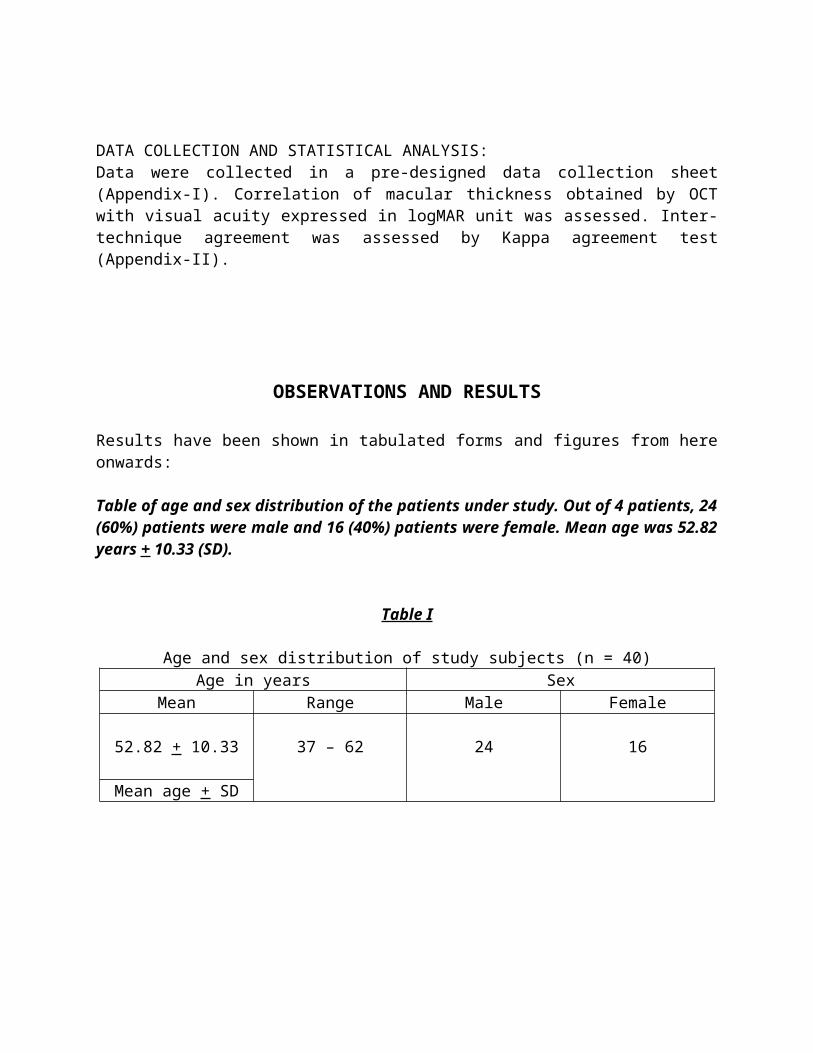
Table of age and sex distribution of the patients under study. Out of 4 patients, 24(60%) patients were male and 16 (40%) patients were female. Mean age was 52.82years + 10.33 (SD).
Table I
Age and sex distribution of study subjects (n = 40)Age in years Sex
Mean Range Male Female
52.82 + 10.33 37 – 62 24 16
Mean age + SD
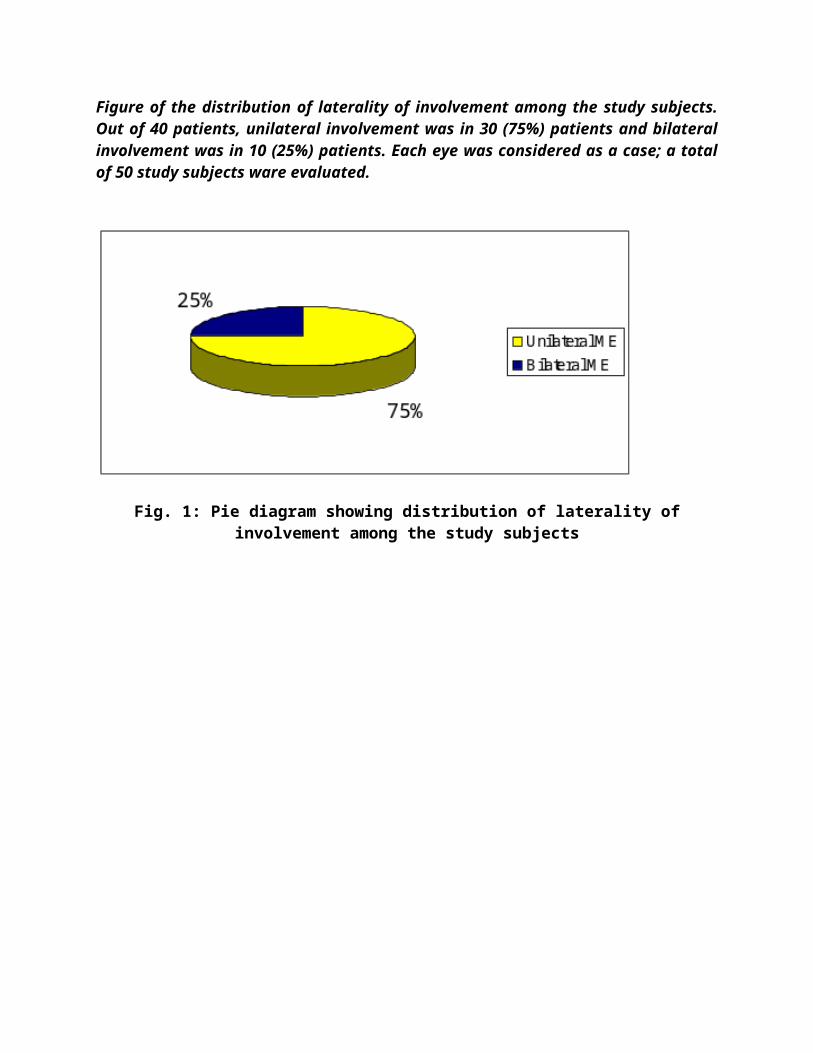
Figure of the distribution of laterality of involvement among the study subjects.Out of 40 patients, unilateral involvement was in 30 (75%) patients and bilateralinvolvement was in 10 (25%) patients. Each eye was considered as a case; a totalof 50 study subjects ware evaluated.
Fig. 1: Pie diagram showing distribution of laterality ofinvolvement among the study subjects

Figure showing the etiology of macular oedema. Among 50 study subjects, highest29 (58%) cases had diabetic macular oedema DME), 07 (14%) cases had centralserous retinopathy (CSR), 05 (10%) cases had exudative age related maculardegeneration (ARMD), 03 (06%) cases had idiopathic juxtafoveal telangiectasia(IJT) and 6 (12%) cases had other diseases (Uveitic, post-traumatic, post-surgical,etc.)
Fig. 2: Bar diagram showing distribution of underlying diseasecausing macular oedema among the study subjects (n = 50)
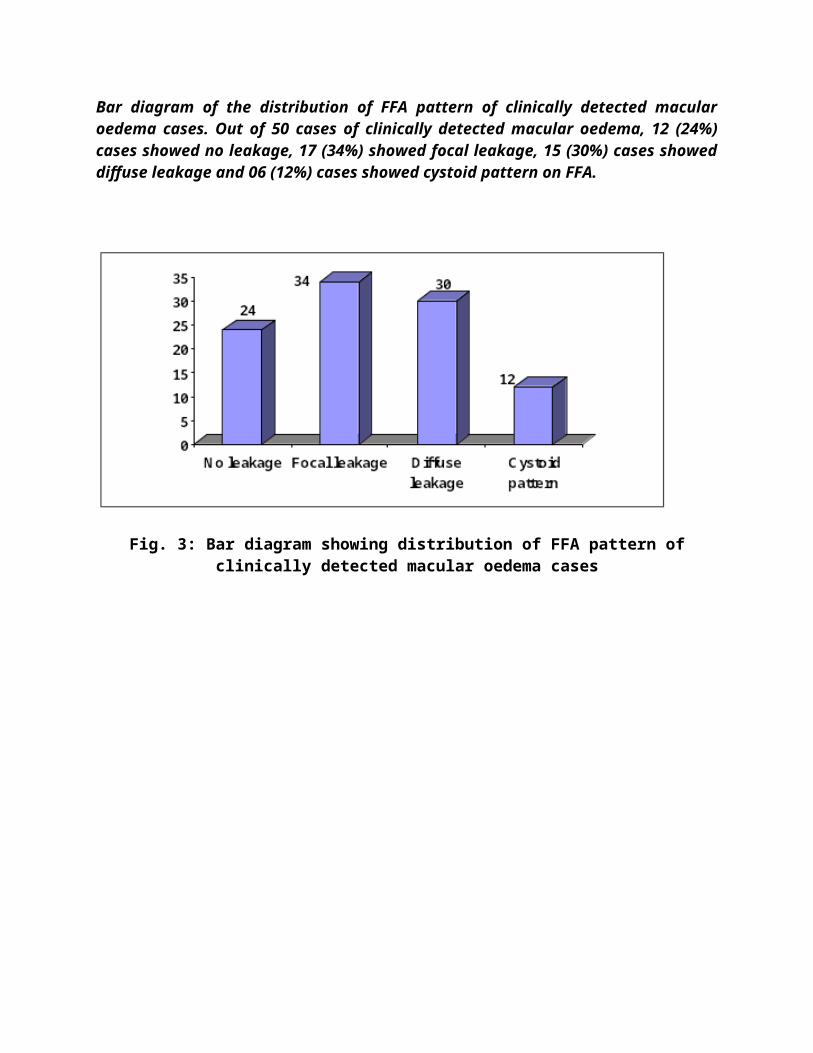
Bar diagram of the distribution of FFA pattern of clinically detected macularoedema cases. Out of 50 cases of clinically detected macular oedema, 12 (24%)cases showed no leakage, 17 (34%) showed focal leakage, 15 (30%) cases showeddiffuse leakage and 06 (12%) cases showed cystoid pattern on FFA.
Fig. 3: Bar diagram showing distribution of FFA pattern ofclinically detected macular oedema cases

Figure of bar diagram of distribution of OCT pattern of clinically detected macularoedema cases. Out of 50 cases of clinically detected macular oedema, 10 920%)cases showed no leakage, 19 (38%) showed Songe like neuroretinal thickening, 0714%) cases showed thickening with cystoid spaces, 09 (18%) cases showed serousdetachment of neuroretina and or pigment epithelial detachment PED and 05(10%) cases showed thickening with SRNV (subretinal neovascularization on OCT).
Fig. 4: Bar diagram showing distribution of OCT pattern ofclinically detected macular oedema cases (n = 50)

Correlation
Table and scatter plot of the correlation of visual acuity expressed in logMAR withcentral macular thickness in µm among the study subjects. Pearson correlation atthe confidence interval level 0.01 was 0.90 (significant positive correlation).
Table-II
Correlation of visual acuity expressed in logMAR with centralmacular thickness in µm among the study subjects.Independent Variable(Macularthickness)
DependantVariable(Visualequity)
R value P value
257.62 µm 0.60 logMARunit
0.90 < 0.05

Agreement between FFA and OCT
Table and Figure showing agreement between FFA and OC whish was assessed by‘Kappa test’. Observed agreement between FFA and OCT was 84%. Out of 50clinically detected macular oedema cases, FFA found macular oedema in 38 (76%)cases and OCT found macular oedema in 40 (80%) cases. Inter-techniqueagreement was good (Kappa = 0.77).
Table-III
Distribution of macular oedema cases as detected by FFA and OCT among 50 cases ofclinically detected macular oedema cases.
OCT TotalNo Yes
FFA No 07 (14%) 05 (10%) 12 (24%)Yes 03 (06%) 35 (70%) 38 (76%)
Total 12 (20%) 40 (80%) 50
Inter-technique agreement was assessed by ‘Kappa test’
Observed agreement = (7 + 35) / 50 = 42/50 = 0.84Chance agreement = 0.24 + 0.80 – 0.20 – 0.80 = 1.04 – 1.00 = 0.04Kappa = (0.84 – 0.04) (1 – 04)
= 0.80 x 0.96 = 0.77 (good agreement between FFA and OCT)

Fig. 6: Bar diagram showing distribution of macular oedema casesdetected clinically, by FFA and by OCT.

Tabulated form of the distribution of complication of FFA and OCT as well as timerequired to perform FFA and OCT. All the patients perceived pain duringintravenous injection of fluorescein, 03 (06%) cases experienced vomiting andanother 12 (24%) cases experienced nausea during FFA. No such complicationsdeveloped during OCT. Average time required for FFA was 12.76 minutes (frompreparation of injection upto completion of angiogram) and average time for OCTwas 6.30 minutes.
Table-IV
The distribution of complications developed during FFA and OCT and also mean timerequired for doing FFA and OCT.
Parameter FFA OCTComplication:
Nausea Vomiting Anaphylaxis
N
120300
%
240600
N
000000
%
000000
Mean time required in minutes + SE
12.76 + 0.34 6.30 + 0.15
DISCUSSION
Macular oedema is a common disease entity causing visualdeprivation originating from various pathologic conditions.Strict presence or absence of macular oedema, its type, extentand severity, prognostic factors all have clinical significance.Stereoscopic fundoscopy, fundus fluorescein angiography, OCT aresome important diagnostic tools that help ophthalmologists indecision making to start treatment and also help in follow up.
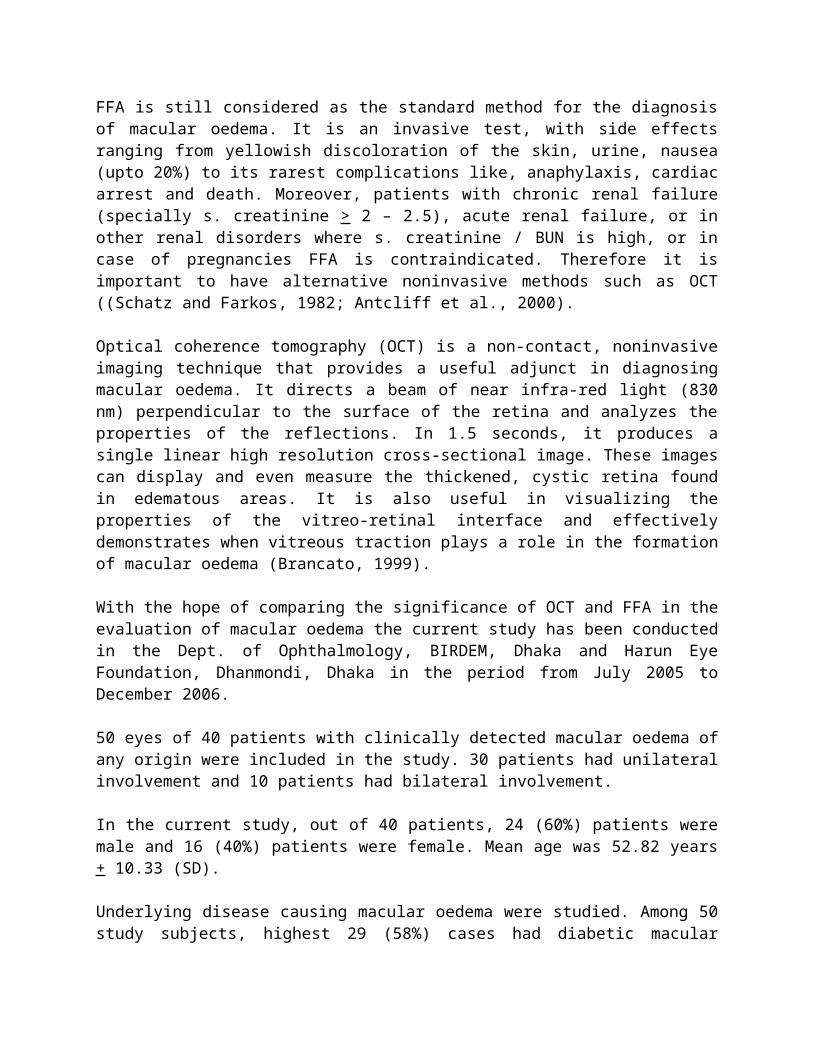
FFA is still considered as the standard method for the diagnosisof macular oedema. It is an invasive test, with side effectsranging from yellowish discoloration of the skin, urine, nausea(upto 20%) to its rarest complications like, anaphylaxis, cardiacarrest and death. Moreover, patients with chronic renal failure(specially s. creatinine > 2 – 2.5), acute renal failure, or inother renal disorders where s. creatinine / BUN is high, or incase of pregnancies FFA is contraindicated. Therefore it isimportant to have alternative noninvasive methods such as OCT((Schatz and Farkos, 1982; Antcliff et al., 2000).
Optical coherence tomography (OCT) is a non-contact, noninvasiveimaging technique that provides a useful adjunct in diagnosingmacular oedema. It directs a beam of near infra-red light (830nm) perpendicular to the surface of the retina and analyzes theproperties of the reflections. In 1.5 seconds, it produces asingle linear high resolution cross-sectional image. These imagescan display and even measure the thickened, cystic retina foundin edematous areas. It is also useful in visualizing theproperties of the vitreo-retinal interface and effectivelydemonstrates when vitreous traction plays a role in the formationof macular oedema (Brancato, 1999).
With the hope of comparing the significance of OCT and FFA in theevaluation of macular oedema the current study has been conductedin the Dept. of Ophthalmology, BIRDEM, Dhaka and Harun EyeFoundation, Dhanmondi, Dhaka in the period from July 2005 toDecember 2006.
50 eyes of 40 patients with clinically detected macular oedema ofany origin were included in the study. 30 patients had unilateralinvolvement and 10 patients had bilateral involvement.
In the current study, out of 40 patients, 24 (60%) patients weremale and 16 (40%) patients were female. Mean age was 52.82 years+ 10.33 (SD).
Underlying disease causing macular oedema were studied. Among 50study subjects, highest 29 (58%) cases had diabetic macular
oedema (DME), 07 (14%) cases had central serous retinopathy(CSR), 05 (10%) cases had exudative age related maculardegeneration (ARMD), 03 (06%) cases had idiopathic juxtafovealtelangiectasis (IJT) and 06 (12%) cases had other diseases(Uveitic, post-traumatic, post-surgical, etc.).
Distribution of FFA pattern of clinically detected macular oedemacases were also observed in the current study. Out of 50 cases ofclinically detected macular oedema, 12 (24%) cases showed noleakage, 17 (34%) showed focal leakage, 15 (30%) cases showeddiffuse leakage and 06 (12%) cases showed cystoid pattern on FFA.These patterns were consistent with OCT findings.
OCT pattern of clinically detected macular oedema cases werestudied. Out of 50 cases of clinically detected macular oedema,10 (20%) cases showed no leakage, 19 (38%) showed sponge likeneuroretinal thickening, 07 (14%) cases showed thickening withcystoid spaces, 09 (18%) cases showed serous detachment ofneuroretina and or pigment epithelial detachment (PED) and 05(10%) cases showed thickening with SRNV (subretinalneovascularization) on OCT. Alkuraya et al., (2005) also observedthe OCT features and were categorized into type 1, sponge-likeretinal swelling; type 2, systoid macular oedema; type 3, serousretinal detachment; and type 4, vitreofoveal traction. Otani etal. (1999) observed that optical coherence tomography showedthree patterns of structural changes in diabetic macular oedema:sponge-like retinal swelling (52[88%] of 59 eyes). Some eyes hadmore than one pathologic changes. Retinal swelling was morepronounced in the outer rather than the inner retinal layers.Cystoid macular oedema was located mainly in the outer retinallayers. In eyes with long-standing cystoid macular oedema,cystoid spaces had fused, resulting in a large cystoid cavityinvolving almost the entire retinal layer.
These findings were also observed in the current study. Kang etal., (2004) described OCT findings in another way; theycategorized OCT features into four types:Type 1: Thickening with homogeneous optical reflectivity;
Type 2: Thickening with markedly decreased optical reflectivityin the outer retinal layer;Type 3A: Foveolar detachment without traction; and Type 3B: Foveolar detachment with apparent vitreofoveal traction.
The type 1 and type 2 OCT are nothing but those of Alkuraya etal., (2005).
Benefits of OCT observed were quantitative evaluation of macularoedema. Central macular thickness was possible to measure inmicrometer which was found to be correlated with the visualacuity. Subtle macular oedema which was ignored by FFA producingno leakage could be detected by OCT well. Moreover, in some casesFFA showed no leakage at all; but OCT showed marked thickeningwith foveal detachment reflecting some dry elevations which werenot further leaking; such conditions may not be benefited bylaser photocoagulation.
FFA has got some benefit over OCT. FFA could explore effectivelythe retinal and to some extent the choroidal vascular patterns,site and amount of ischemic changes which were needed to gear upthe management protocol.
In the current study statistical correlation was observed betweenvisual acuity expressed in logMAR and central macular thicknessin µm among the study subjects. Pearson correlation at theconfidence interval level 0.01 was 0.90 (significant positivecorrelation). Optical coherence tomography type 1 and the focalleakage type of fluorescein angiography showed the least fovealthickness and the best visual acuity. This was also reported byKang et al., (2004). The best-corrected visual acuity wassignificantly correlated with central foveal thickness (r :0.528, p < 0.01) in the study of Ozdek et al., (2005). Yang etal., (2001) reported that the mean +/- standard deviation fovealthickness was 255.6 +/1 138.9 micron in eyes with CSME, and174.6 +/- 38.2 micron in eyes without CSME (p = 0.051). Thefoveal thickness was correlated with logMAR visual acuity (gamma= 0.68, p < 0.01). They remarked that OCT may be more sensitivethan a clinical examination in assessing diabetic macular oedema

and is a quantitative tool for documenting changes in macularthickening. Goebel and Kretzchmar-Gross (2002) observed thatretinal thickness was 153 +/- 15 micron in the fovea, 249 +/- 19micron in the temporal parafoveal region, and 268 +/- 20 micronin the nasal parafoveal region. In diabetic patients, retinalthickness was increased to 307 +/- 136 micron in the fovea, 337+/- 88 micron in the temporal retina, and 353 +/- 95 micron inthe nasal retina, respectively. In the current study, meancentral macular thickness was 257.63 + 40.86 micrometer.Lattanzio et al., (2002) showed that MT (mean thickness) was369.3 +/- 163.2 micron in diabetics and 161.9 +/- 12.9 micron incontrols (p < 0.001).
Unlike FFA, OCT presented very clear ccut features that caneasily demarcate central serous retinopathy from pigmentepithelial detachment (PED). Very early CNVM was found difficultto delineate by FFA which became relatively easier by OCT.
Keeping the FFA as the standard investigation, our studyobjective was to measure the statistical agreement of OCT withFFA in the diagnosis of macular oedema. In the current study,observed agreement between FFA and OCT was 84%. Out of 50clinically detected macular oedema cases, FFA found macularoedema in 38 (76%) cases and OCT found macular oedema in 40 (80%)cases. Inter-technique agreement was good (Kapa = 0.77). Ozdek etal., (2005) showed that there was 77% agreement between clinicalexamination and OCT result. Mitne et al., (2003) showed thatagreement between the two examinations was good (Kappa = 0.73)with diagonal agreement of 88% and no tendency to have neithermore positive nor negative findings (p = 1.0). Kang et al.,(2004) showed significant correlation between the features of OCTand fluorescein angiography in clinically significant diabeticmacular oedema.
All the patients perceived pain during intravenous injection offluorescein and 30% patients experienced nausea and vomitingwhile doing FFA but no cases of any complication was noted indoing OCT. Time required for performing OCT was also lower thanFFA.
SUMMARY AND CONCLUSION
To compare the significance of OCT and FFA in the evaluation ofmacular oedema the current study has been conducted in the Dept.of Ophthalmology, BIRDEM, Dhaka and Harun Eye Foundation,Dhanmondi, Dhaka in the period from July 2005 to December 2006.
Fifty eyes (50 eyes) of 40 patients with clinically detectedmacular oedema of any origin were included in the study. 30patients had unilateral involvement and 10 patients had bilateralinvolvement.
In the current study, out of 40 patients, 24 (60%) patients weremale and 16 (40%) patients were female. Mean age was 52.82 years+ 10.33.
Underlying diseases causing macular oedema were studied. Among 50study subjects, highest 29 (58%) cases had diabetic macularoedema (DME), 07 (14%) cases had central serous retinopathy(CSR), 05 (10%) cases had exudative age related maculardegeneration (ARMD), 03 (06%) cases had idiopathic juxtafovealtelangiectasia (IJT) and 06 (12%) cases had other diseases(uveitic, post-traumatic, post-surgical, etc.).
Out of 50 cases of clinically detected macular oedema, 12 (24%)cases showed no leakage on FFA, 17 (34%) showed focal leakage, 15(30%) cases showed diffuse leakage and 06 (12%) cases showedcystoid pattern on FFA. Whereas OCT showed 10 (20%) cases showedno thickening, 19 (38%) showed sponge like neuroretinalthickening, 07 (14%) cases showed thickening with cystoid spaces,09 (18%) cases showed serous detachment of neuroretina and or
pigment epithelial detachment (PED) and 05 (10%) cases showedthickening with SRNV (subretinal neovascularization) on OCT.
In the current study statistical correlation was observed betweenvisual acuity expressed in logMAR and central macular thicknessin µm among the study subjects. Pearson correlation at theconfidence interval level 0.01 was 0.90 (significant positivecorrelation). In the current study, mean central macularthickness was 257.63 + 40.86 micrometer.
The statistical agreement of OCT with FFA in the diagnosis ofmacular oedema was calculated. In the current study, observedagreement between FFA and OCT was 84%. Out of 50 clinicallydetected macular oedema cases, FFA found macular oedema in 38(76%) cases and OCT found macular oedema in 40 (80%) cases.Inter-technique agreement was good (Kappa = 0.77).
All the patients perceived pain during intravenous injection offluorescein and 30% patients experienced nausea and vomitingwhile doing FFA but no cases of any complication was noted indoing OCT. Time required for performing OCT was also lower thanFFA.
CONCLUSION: The analytical result of the study shows that OCTfindings in macular oedema is consistent with the clinicalfindings and fluorescein angiographic features. Moreover,quantitative assessment of macular oedema can be more effectivelydone by OCT. As OCT is a noninvasive technique and free of anysystemic complications, being patient friendly, requires minimumtime for scanning and also nevertheless cost effective,ophthalmologists can practice it adjunctively with FFA in theevaluation of macular oedema cases.
LIMITATIONS: During the study, we found fewer limitations as thisdiagnostic procedure is noninvasive in nature. Patients alwaysfeel comfortable if the nature of investigations is noninvasive.But the cost of the machine is slightly higher. The mostimportant drawback of the OCT is no detections of leaking

vessels, which is exclusively detected in FFA. Also like FFA,performance of the OCT is reduced in the cases of medialopacities.
FUTURE DIRECTION OF THE STUDY: As this study included smallsample size, further study with big sample. Multi-centre trial,and different macular disorders are to be evaluated, so bettercomparison with FFA can be assessed. Not only that, normalmacular thickness in Bangladeshi population should be assessedfor reference value.

CHAPTER EIGHT
BIBLIOGRAPHY
1. Alkuraya H, Kangave D, Abul El-Asrar AM. The correlationbetween optical coherence tomographic features and severityof retinopathy, macular thickness and visual acuity indiabetic macular edema. Int Ophthalmol. 2005 May; 26(3): 93-9. Epub 2006 Oct.
2. Antcliff RJ, Stanford M, Chauhan DS. Comparison betweenoptical coherence tomography and fundus fluoresceinangiography for the detection of cystoid macular edema inpatients with uveitis. Ophthalmology 2000; 107: 593-599.
3. Brancato R. Optical coherence tomography in macular edema.Doc Ophthalmol 1999; 97: 337-9.
4. Brown JC, Solomon SD, Bressler SB, Schachat AP, DiBernardo C,Bressler NM. Detection of diabetic foveal edema: contact lensbiomicroscopy compared with optical coherence tomography. ArcOphthalmol. 2004 Mar; 122(3): 330-5.
5. Browning DJ, Fraser CM. Optical coherence tomography todetect macular edema in the presence of asteroid hyalosis. AmJ Ophthalmol 2004; 137: 959-961.
6. Chang A, Spaide RF, Yannuzzi LA. Post-surgical cystoidmacular edema. In : Guyer DR, Yannuzzi LA, Chang S, et al.Retina, Vitreous, Macula. Saunders. Philadelphia. 1999; 1:239-255.
7. Croes K, Kurek E. OCT and FFA in Diagnosing and ManagingDiabetic Eye Disease. Retinal Physician 2004; 17: 59-61.
8. Fetkenhour CL, Choromokos E, Weinstein J. Cystoid macularoedema in retinitis pigmentosa. Trans Am Acad OphthalmolOtolaryngol. 1977; 83: 515-521.
9. Gass JDM, Norton EWD. Cystoid macular edema and papilledemafollowing cataract extraction: a fluorescein fundoscopic andangiographic study. Arch Ophthalmol 1966; 76: 646-61.

10. Glacet-Bernard A, Mahdavi KN, Coscas G. Macular gridphotocoagulation in persistent macular oedema due to centralvein occlusion. Eur J Ophthalmol. 1994 Jul-Sep; 4(3): 166-74.
11. Goebel W, Kretzchmar-Gross T. Retinal thickness in diabeticretinopathy: a study using optical coherence tomography(OCT). Retina. 2002 Dec; 22(6): 759-67.
12. Greaney MJ. Ophthalmic Clinical Examination, In: Easty DL,Sparrow JM. Eds, Oxford Textbook of Ophthalmology, OxfordUniversity Press, 1999; pp 104-105.
13. Harney B. Fluorescein angiography, In: Easty DL, Sparrow JM.Eds, Oxford Textbook of Ophthalmology, Oxford UniversityPress, 1999; pp 157-158.
14. Hee MR, Izatt JA, Swanson EA. Opthical coherence tomographyof the human retina. Arch Ophthalmol 1995; 113: 325-332.
15. Hee MR, Puliafito CA, Wong C. Quantitative assessment ofmacular edema with optical coherence tomography. ArchOphthalmol 1995; 113: 1019-1029.
16. Hee MR, Puliafito CA, Wong C, Duker JS, Reichel L. Opticalcoherence tomography of macular holes. Ophthalmology 1995;102: 748-755.
17. Hee MR, Baumal CR, Puliafito CA, Duker JS, Reichel E. Opticalcoherence tomography of age-related macular degeneration andchoroidal neovascularization. Ophthalmology 1996; 103: 1260-1270.
18. Hee MR, Puliafito CA, Duker JS. Topography of diabeticmacular edema with optical coherence tomography.Ophthalmology 1998; 105: 360-370.
19. Ip M, Szwartz J, Puliafito CA. Optical Coherence Tomography.Chapter 10 in Age-Related Macular Degeneration (ed.) BergerJW, Fine SL, Maguire MG. pp 179-205. Mosby, St. Louis MO1999.
20. Irvine SR. A newly described vitreous syndrome followingcataract surgery, interpreted according to recent concepts ofthe structure of the vitreous. Am J Ophthalmol 1952; 35: 599-619.

21. Jalkh AE, Trempe CL. Macular oedema in branch retinal veinocclusion: types and treatment. Ophthalmic surg. 1989 Jan;20(1): 26-32.
22. Kang SW, Park CY, Ham DI. The correlation between fluoresceinangiographic and optical coherence tomographic features inclinically significant diabetic macular edema. Am JOphthalmol. 2004 Feb; 137(2): 313-22.
23. Kanski JJ. Clinical Ophthalmology, 5th edition, ButterworthHeinmann, 2003; pp 352-353, 391-397, 423-425 & 455-460.
24. Kent D, Stanley A, Peter A. Macular oedema: the role ofsoluble mediators. Br J Ophthalmol 2000 May; 84: 542-546.Kinyoun J, Barton F, Fisher M, hubbard L, Aiello L.Detection of diabetic macular oedema. Ophthalmology. 1989Jun; 96(6): 746-50; Discussion 750-1.
25. Lardenoye CW, Probst K, Rothova A. Photoreceptor function ineyes with macular oedema. Invest Ophthalmol Vis Sci. 2000;41(12): 4048-4053.
26. Lattanzio R, Brancato R, Pierro L, Bandello F, Iaccher B,Fiore T, Maestranzi G. Macular thickness measured by opticalcoherence tomography OCT in diabetic patients. Eur JOphthalmol. 2002 Nov-Dec; 12(6): 482-7.
27. Lerche RC, Schaudig U, Scholz F, Walter A, Richard G.Structural changes of the retina in retinal vein occlusion-imaging and quantification with optical coherence tomography.Ophthalmic Surg Lasers. 2001 JulAug; 32(4): 272-80.
28. Markomichelakis NN, Halkiadakis I, Pantelia E. Patterns ofmacular edema in patients with uveitis: qualitative andquantitative assessment using optical coherence tomography.Ophthalmology 2994; 111: 946-53.
29. Mitne S, Junior AP, Rodrigues APS, Guia T, Bordon A, deMoraes NSB, Michel Eid Farah ME, Bonomo PP. Agreement betweenoptical coherence tomography and fundus fluoresceinangiography in post-cataract surgery cystoid macular edema.Arq. Bras. Oftalmol. Nov / Dec 2003; 66: No. 6.
30. Neubauer AS, Priglinger S, Ullrich S. Comparison of fovealthickness measured with the retinal thickness analyzer andoptical coherence tomography. Retina 2001; 21: 596-601.
31. Newell FW. Ophthalmology: Principles and Concepts, 8th
edition, Mosby, 1996; pp 25-30, 308-12.32. Nussenblatt RB, Kaufman SC, Palestine AG. Macular thickening
and visual acuity: measurement in patients with cystoidmacular edema. Ophthalmology 1987; 94: 1134-9.
33. Otani T, Kishi S, Maruyama Y. Patterns of diabetic macularedema with optical coherence tomography. Am J Ophthalmol1999; 127: 688-93.
34. Ozdek SC, Erdinc MA, Gurelik G. Optical coherence tomographicassessment of diabetic macular edema: comparison withfluorescein angiographic and clinical findings.Ophthalmologica 2005; 219: 86-92.
35. Ptz A, Schatz H, Berkow JW. Macular oedema: an overlookedcomplication of diabetic retinopathy. Trans Am AcadOphthalmol Otolaryngol. 1973; 77: 34-42.
36. Polito A, Shah SM, Haller JA. Comparison between retinalthickness analyzer and optical coherence tomography forassessment of foveal thickness in eyes with macular disease.Am J Ophthalmol 2002; 134: 240-51.
37. Puliafito CA, Hee MR, Lin CP, Reichel E, Schuman JS. Imagingof macular diseases with optical coherence tomography.Ophthalmology 1995; 102: 217-229.
38. Rothova A, Suttorp- van Schulten MSA, Treffers WF. Causes andfrequency of blindness in patients with intraocularinflammatory disease. B J Ophthalmol 1996; 80: 332-336.
39. Schatz H, Farkos WS. Nausea from fluorescein angiography. AmJ Ophthalmol 1982; 93: 370-1.
40. Sihota R, Tandon R. Parson’s Diseases of the Eye, 19th
edition, Butterworth Heinmann, 2003; pp 14-25: 93-95, 123.41. Spaide RF, Yannuzzi LA, Sisco LJ. Chronic cystoid macular
edema and predictors of visual acuity. Ophthalmic Surg 1993;24: 262-267.
42. Strom C, Sander B, Larsen N, Larsen M, Lund-Andersen H.Diabetic Macular Edema Assessed with Optical CoherenceTomography and Stereo Fundus Photography. InvestigativeOphthalmology and Visual Science. 2002; 43: 241-245.
43. Sulkes DJ, Ip M, Baumal CR. Spontaneous resolution ofvitreomacular traction documented by optical coherencetomography. Arch Ophthalmol 118: 286-287, 2000.
44. Wilkins JR, Puliafito CA, Hee MR, Duker JS, Reichel E.Characterization of epiretinal membranes using opticalcoherence tomographyl. Ophthalmology 103: 2142-2151, 1996.
45. Wilkinson CP, Ferris FL, Klein RE, Lee PP, Agardh CD.Proposed international clinical scales. Ophthalmology. 2003Sep; 110(9): 1677-82.
46. Yang CS, Cheng CY, Lee FL, Hsu WM, Liu JH. Quantitativeassessment of retinal thickness in diabetic patients wih andwithout clinically significant macular edema using opticalcoherence tomography. Acta Ophthalmol Scand. 2001 Jun; 79(3):266-70.
47. Yang Y, Vitale S, Ding Y, O’Connell SR, Alexander J, BresslerNM, Schachat AP, Zeimer R. A comparison of quantitativemapping and stereoscopic fundus photography grading ofretinal thickness in diabetic eyes with macular edema.Ophthalmic Surg Lasers Imaging. 2003 Jan-Feb; 34(1): 7-16.
48. Yannuzzi LA. A perspective on the treatment of aphakiccystoid macular edema. Surv Ophthalmol 1984; 28: 540-553.
49. Yannuzzi LA, Rohrer KT, Tindel LJ, Sobel RS, Costanza MA,Shields W. Fluorescein angiography complication survey.Ophthalmology 1986; 93: 611-7.

Copyright © 2022 FDOKUMEN