Optical Coherence Tomography Angiography of Macula and ...
13
Journal of Clinical Medicine Article Optical Coherence Tomography Angiography of Macula and Optic Nerve in Autism Spectrum Disorder: A Pilot Study Jose Javier Garcia-Medina 1,2,3,4, * , † , Elena Rubio-Velazquez 1, † , Maria Dolores Lopez-Bernal 1 , Dolores Parraga-Muñoz 1 , Alfonso Perez-Martinez 5 , Maria Dolores Pinazo-Duran 3,4,6, ‡ and Monica del-Rio-Vellosillo 7, ‡ 1 Department of Ophthalmology, General University Hospital Morales Meseguer, 30008 Murcia, Spain; [email protected] (E.R.-V.); [email protected] (M.D.L.-B.); [email protected] (D.P.-M.) 2 Department of Ophthalmology and Optometry, University of Murcia, 30120 Murcia, Spain 3 Ophthalmic Research Unit Santiago Grisolia, 46017 Valencia, Spain; [email protected] 4 Red Temática de Investigación Cooperativa en Patología Ocular (OFTARED), Instituto de Salud Carlos III, 28029 Madrid, Spain 5 Department of Clinical Analysis, General University Hospital Morales Meseguer, 30008 Murcia, Spain; [email protected] 6 Department of Ophthalmology, University of Valencia, 46010 Valencia, Spain 7 Department of Anesthesiology, University Hospital Virgen de la Arrixaca, 30120 Murcia, Spain; [email protected] * Correspondence: [email protected] or [email protected] † These authors share first place. ‡ These authors share last place. Received: 5 September 2020; Accepted: 24 September 2020; Published: 27 September 2020 Abstract: The aim of this study was to compare retinal thicknesses and vascular parameters between autism spectrum disorder (ASD) and neurotypical (NT) individuals. Recruited ASD subjects and age- and sex-matched NT controls underwent 2 optical coherence tomography scans (OCT) (macular cube and optic nerve cube) and 2 OCT angiography (OCTA) scans (macular and optic nerve head (ONH) OCTA) with the device Cirrus 5000 (Zeiss). Concerning OCT, we considered full retina thickness in 9 macular sectors of the Early Treatment Diabetic Retinopathy Study (ETDRS) pattern and peripapillary retinal nerve fiber layer (pRNFL) thickness in 4 quadrants and 12 clock-hour sectors. Vessel density and capillary perfusion density in 9 sectors were measured using 6 × 6 mm macular OCTA. Foveal avascular zone (FAZ) parameters were also considered. ONH 4.5 × 4.5 mm OCTA estimated perfusion density and flux index in 4 peripapillary quadrants. Comparisons between groups of all these parameters were performed. ASD subjects showed higher ONH perfusion density and lower ONH flux index at the peripapillary inferior quadrant when compared with NT individuals (p < 0.05). Plus, a trend towards higher macular thicknesses, higher pRNFL thickness at inferior clock-hour sectors and higher macular vessel density and perfusion was observed in ASD. No differences were found in FAZ parameters. In conclusion, retinas of ASD subjects may present some structural and vascular differences when compared with retinas of NT individuals. Keywords: autism spectrum disorder; neurotypical; optical coherence tomography angiography; macula; optic nerve; thickness; perfusion; flux; vessel density; autoregulation J. Clin. Med. 2020, 9, 3123; doi:10.3390/jcm9103123 www.mdpi.com/journal/jcm
-
Upload
khangminh22 -
Category
Documents
-
view
2 -
download
0
Transcript of Optical Coherence Tomography Angiography of Macula and ...

Journal of
Clinical Medicine
Article
Optical Coherence Tomography Angiography ofMacula and Optic Nerve in Autism SpectrumDisorder: A Pilot Study
Jose Javier Garcia-Medina 1,2,3,4,*,† , Elena Rubio-Velazquez 1,†, Maria Dolores Lopez-Bernal 1,Dolores Parraga-Muñoz 1, Alfonso Perez-Martinez 5, Maria Dolores Pinazo-Duran 3,4,6,‡
and Monica del-Rio-Vellosillo 7,‡
1 Department of Ophthalmology, General University Hospital Morales Meseguer, 30008 Murcia, Spain;[email protected] (E.R.-V.); [email protected] (M.D.L.-B.); [email protected] (D.P.-M.)
2 Department of Ophthalmology and Optometry, University of Murcia, 30120 Murcia, Spain3 Ophthalmic Research Unit Santiago Grisolia, 46017 Valencia, Spain; [email protected] Red Temática de Investigación Cooperativa en Patología Ocular (OFTARED), Instituto de Salud Carlos III,
28029 Madrid, Spain5 Department of Clinical Analysis, General University Hospital Morales Meseguer, 30008 Murcia, Spain;
[email protected] Department of Ophthalmology, University of Valencia, 46010 Valencia, Spain7 Department of Anesthesiology, University Hospital Virgen de la Arrixaca, 30120 Murcia, Spain;
[email protected]* Correspondence: [email protected] or [email protected]† These authors share first place.‡ These authors share last place.
Received: 5 September 2020; Accepted: 24 September 2020; Published: 27 September 2020 �����������������
Abstract: The aim of this study was to compare retinal thicknesses and vascular parameters betweenautism spectrum disorder (ASD) and neurotypical (NT) individuals. Recruited ASD subjects andage- and sex-matched NT controls underwent 2 optical coherence tomography scans (OCT) (macularcube and optic nerve cube) and 2 OCT angiography (OCTA) scans (macular and optic nerve head(ONH) OCTA) with the device Cirrus 5000 (Zeiss). Concerning OCT, we considered full retinathickness in 9 macular sectors of the Early Treatment Diabetic Retinopathy Study (ETDRS) patternand peripapillary retinal nerve fiber layer (pRNFL) thickness in 4 quadrants and 12 clock-hour sectors.Vessel density and capillary perfusion density in 9 sectors were measured using 6 × 6 mm macularOCTA. Foveal avascular zone (FAZ) parameters were also considered. ONH 4.5 × 4.5 mm OCTAestimated perfusion density and flux index in 4 peripapillary quadrants. Comparisons betweengroups of all these parameters were performed. ASD subjects showed higher ONH perfusiondensity and lower ONH flux index at the peripapillary inferior quadrant when compared with NTindividuals (p < 0.05). Plus, a trend towards higher macular thicknesses, higher pRNFL thickness atinferior clock-hour sectors and higher macular vessel density and perfusion was observed in ASD.No differences were found in FAZ parameters. In conclusion, retinas of ASD subjects may presentsome structural and vascular differences when compared with retinas of NT individuals.
Keywords: autism spectrum disorder; neurotypical; optical coherence tomography angiography;macula; optic nerve; thickness; perfusion; flux; vessel density; autoregulation
J. Clin. Med. 2020, 9, 3123; doi:10.3390/jcm9103123 www.mdpi.com/journal/jcm
J. Clin. Med. 2020, 9, 3123 2 of 13
1. Introduction
Autism spectrum disorder (ASD) is defined as a series of developmental disturbances in non-verbaland verbal communication, social skills and repetitive behavior [1]. Its prevalence is above 1% in all ofthe latest studies in different countries [2].
The etiology of this disorder remains elusive. Several causes and effects have been proposed [3].Vascularization and blood flow in a number of regions of interest (ROI) have been studied in ASD.In general terms, hypoperfusion have been found in temporal [4–11], parietal [5,10,11] frontal [6,7,9–13]cortices and basal ganglia [8,11,13]. In contrast, hyperperfusion in the frontal and temporal corticeshas also been described in ASD subjects in other investigations [14,15].
Developmentally and histologically, the retina constitutes an extension of the central nervoussystem (CNS) [16]. Our group has previously studied retinal thickness by means of optical coherencetomography (OCT) in ASD concluding that ASD presented some thickened locations when compared toneurotypical (NT) individuals [17]. However, to the best of our knowledge, the retinal vascularizationand perfusion have not been previously studied in the context of ASD.
In the CNS, the chance of direct observation of microvascularization is only available for the retinavessels, which derive from the internal carotid artery through the ophthalmic artery [18].
A new technology called OCT angiography (OCTA) allows us to quantify vascular parametersin vivo in human retinas non-invasively and rapidly [19]. This is useful not only in ophthalmologybut also in neuro-ophthalmology and neurology [20]. Because the retina is a part of the CNS, andconsidering the hypo and hyperperfusion found in other ROI, we hypothesized that retinal vascularparameters as measured by OCTA could be different in ASD when compared to NT individuals.
2. Materials and Methods
This prospective, cross-sectional study included participants between March and July 2019. YoungASD individuals were recruited from two specialized formation centers: Integral Formation Center“Gabriel Pérez Carcel” and ASTRADE, Murcia, Spain. NT controls were age- and sex-matched withASD subjects and were selected among patients having habitual ophthalmic visits at the department ofOphthalmology, University Hospital Morales Meseguer, Murcia, Spain. All patients signed informedconsent or, alternatively, parents/guardians’ consent was obtained. This study was approved by theEthics Committee of the University Hospital Morales Meseguer, Murcia, Spain (Protocol Code: EST10/19, 1st March 2019) and was in accordance with the declaration of Helsinki.
Inclusion criteria for ASD individuals were: (a) diagnosis of ASD following the 5th edition of theDiagnostic and Statistical Manual of Mental Disorders (DSM-5) criteria [21] assessed by at least twodifferent professionals; (b) under 25 years of age; (c) of Caucasian race; (d) having less than 6 sphericaldiopters less than 6 and cylinder diopters less than 3 in absolute values; (e) best-corrected visual acuity(BCVA) of 0.5 in decimal scale or better; (f) no signs or records of eye disorders; (g) no other diseasethat may affect OCT or OCTA measurements; (h) cooperation to obtain high-quality and reliable OCTand OCTA examinations; (i) signal strength of OCT and OCTA of 6 or better (out of 10). The sameexperienced ophthalmologist (J.J.G.-M.) checked all the scans. If segmentation errors, decentrations orother artefacts were detected, examinations were considered unreliable.
Inclusion criteria for the NT participants were also selected using the above, except for criterium(a). Additionally, NT participants could not be relatives of ASD patients.
All ophthalmological examinations were carried out at the Department of Ophthalmology,University Hospital Morales Meseguer, Murcia, Spain and consisted of: autorefractometry,best-corrected visual acuity (BCVA), neumotonometry, biomicroscopy, fundus exploration, OCTand OCTA.
OCT and OCTA examinations were performed using Cirrus 5000 device with Angioplex (softwareversion 11.0, Carl Zeiss Meditec, Dublin, CA, USA). Each participant had four scans in the left eye:Macular cube 512 × 128 OCT, optic nerve cube 200 × 200 OCT, macular OCTA 6 × 6 mm and opticnerve OCTA 4.5 × 4.5 mm.

J. Clin. Med. 2020, 9, 3123 3 of 13
In macular cube OCT scans, the thickness of the complete retina (from internal limiting membraneto retinal pigment epithelium) was estimated at the nine subfields of the Early Treatment DiabeticRetinopathy Study (ETDRS) (Figure 1).
J. Clin. Med. 2020, 9, x FOR PEER REVIEW 3 of 13
In macular cube OCT scans, the thickness of the complete retina (from internal limiting
membrane to retinal pigment epithelium) was estimated at the nine subfields of the Early Treatment
Diabetic Retinopathy Study (ETDRS) (Figure 1).
9 5 1 3 7
2
6
4
8
Figure 1. Early Treatment Diabetic Retinopathy Study (ETDRS) grid overlying the macula. Nine
subfields are represented. 1 = center, 2 = inner superior, 3 = inner right, 4 = inner inferior, 5 = inner left,
6 = outer superior, 7 = outer right, 8 = outer inferior, 9 = outer left.
In optic nerve cube OCT scans, the thickness of the peripapillary retinal nerve fiber layer was
measured in 12 clock-hour sectors and 4 quadrants (Figure 2).
Figure 2. Peripapillary retinal nerve fiber layer was measured at the indicated purple circle (left).
Clock-hour sectors (center) and quadrants (right) are represented. S = superior, N = nasal, T =
temporal, I = inferior.
The superficial capillary plexus, which extends from the internal limiting membrane to the inner
plexiform layer, was measured by OCTA in macular scans.
In macular OCTA, two vascular indices were automatically obtained using ETDRS grid (Figure
1): Vessel density (VD) and perfusion density (PD). VD is characterized as the absolute length of the
perfused vasculature per area in a considered region of estimation. Its units are mm/mm2 ranging
from 0 (no vessels) to an unbounded maximum (Figure 3). VD can be thought of as unwinding all
the vasculature in a considered area, estimating its length with a ruler, then dividing the result by the
involved area [22].
Figure 1. Early Treatment Diabetic Retinopathy Study (ETDRS) grid overlying the macula. Ninesubfields are represented. 1 = center, 2 = inner superior, 3 = inner right, 4 = inner inferior, 5 = inner left,6 = outer superior, 7 = outer right, 8 = outer inferior, 9 = outer left.
In optic nerve cube OCT scans, the thickness of the peripapillary retinal nerve fiber layer wasmeasured in 12 clock-hour sectors and 4 quadrants (Figure 2).
J. Clin. Med. 2020, 9, x FOR PEER REVIEW 3 of 13
In macular cube OCT scans, the thickness of the complete retina (from internal limiting
membrane to retinal pigment epithelium) was estimated at the nine subfields of the Early Treatment
Diabetic Retinopathy Study (ETDRS) (Figure 1).
9 5 1 3 7
2
6
4
8
Figure 1. Early Treatment Diabetic Retinopathy Study (ETDRS) grid overlying the macula. Nine
subfields are represented. 1 = center, 2 = inner superior, 3 = inner right, 4 = inner inferior, 5 = inner left,
6 = outer superior, 7 = outer right, 8 = outer inferior, 9 = outer left.
In optic nerve cube OCT scans, the thickness of the peripapillary retinal nerve fiber layer was
measured in 12 clock-hour sectors and 4 quadrants (Figure 2).
Figure 2. Peripapillary retinal nerve fiber layer was measured at the indicated purple circle (left).
Clock-hour sectors (center) and quadrants (right) are represented. S = superior, N = nasal, T =
temporal, I = inferior.
The superficial capillary plexus, which extends from the internal limiting membrane to the inner
plexiform layer, was measured by OCTA in macular scans.
In macular OCTA, two vascular indices were automatically obtained using ETDRS grid (Figure
1): Vessel density (VD) and perfusion density (PD). VD is characterized as the absolute length of the
perfused vasculature per area in a considered region of estimation. Its units are mm/mm2 ranging
from 0 (no vessels) to an unbounded maximum (Figure 3). VD can be thought of as unwinding all
the vasculature in a considered area, estimating its length with a ruler, then dividing the result by the
involved area [22].
Figure 2. Peripapillary retinal nerve fiber layer was measured at the indicated purple circle (left).Clock-hour sectors (center) and quadrants (right) are represented. S = superior, N = nasal, T = temporal,I = inferior.
The superficial capillary plexus, which extends from the internal limiting membrane to the innerplexiform layer, was measured by OCTA in macular scans.
In macular OCTA, two vascular indices were automatically obtained using ETDRS grid (Figure 1):Vessel density (VD) and perfusion density (PD). VD is characterized as the absolute length of theperfused vasculature per area in a considered region of estimation. Its units are mm/mm2 rangingfrom 0 (no vessels) to an unbounded maximum (Figure 3). VD can be thought of as unwinding allthe vasculature in a considered area, estimating its length with a ruler, then dividing the result by theinvolved area [22].

J. Clin. Med. 2020, 9, 3123 4 of 13
1
Figure 3. Vessel density map at the macula. Units are indicated in mm/mm2.
PD is characterized as the complete zone of perfused vasculature per unit of the consideredarea. This measurement is determined by summarizing the quantity of pixels which contain perfusedvasculature and dividing this by the entirety of all pixels (perfused and non-perfused pixels) in the area.The outcome is a unitless number extending from 0% (no perfusion) to 100% (completely perfused)(Figure 4).
J. Clin. Med. 2020, 9, x FOR PEER REVIEW 4 of 13
Figure 3. Vessel density map at the macula. Units are indicated in mm/mm2.
PD is characterized as the complete zone of perfused vasculature per unit of the considered area.
This measurement is determined by summarizing the quantity of pixels which contain perfused
vasculature and dividing this by the entirety of all pixels (perfused and non-perfused pixels) in the
area. The outcome is a unitless number extending from 0% (no perfusion) to 100% (completely
perfused) (Figure 4).
The primary distinction between VD and PD is that in VD all vessels are considered similarly.
In PD, bigger vessels impact the estimation more than smaller vessels. Foveal avascular zone (FAZ)
area, perimeter and circularity were also considered [22].
Figure 4. Perfusion density map at the macula. Units are unitless (%).
In peripapillary OCTA, two vascular indices were also automatically obtained considering four
quadrants (Figure 5) and measuring from internal limiting membrane to the retinal nerve fiber layer:
peripapillary perfusion density (pPD) and flux index (FI). The pPD is defined, similarly to PD in the
Figure 4. Perfusion density map at the macula. Units are unitless (%).

J. Clin. Med. 2020, 9, 3123 5 of 13
The primary distinction between VD and PD is that in VD all vessels are considered similarly.In PD, bigger vessels impact the estimation more than smaller vessels. Foveal avascular zone (FAZ)area, perimeter and circularity were also considered [22].
In peripapillary OCTA, two vascular indices were also automatically obtained considering fourquadrants (Figure 5) and measuring from internal limiting membrane to the retinal nerve fiber layer:peripapillary perfusion density (pPD) and flux index (FI). The pPD is defined, similarly to PD in themacula, as the total area of perfused vasculature per unit area in a region of interest, expressed inpercentage. FI is defined as the total area of perfused vasculature per unit area in a considered region,weighted by the brightness (intensity) of the flow signal. FI quantifies the number of blood cellspassing through a retinal vessel cross-sectional area per unit of time. It is a unitless parameter [22,23].
J. Clin. Med. 2020, 9, x FOR PEER REVIEW 5 of 13
macula, as the total area of perfused vasculature per unit area in a region of interest, expressed in
percentage. FI is defined as the total area of perfused vasculature per unit area in a considered region,
weighted by the brightness (intensity) of the flow signal. FI quantifies the number of blood cells
passing through a retinal vessel cross-sectional area per unit of time. It is a unitless parameter [22,23].
Figure 5. Peripapillary microvascularization map. Perfusion density (P) is indicated in percentage
(%). Flux index (F) is unitless. S = superior, I = inferior, N = nasal, T = temporal.
Statistical Analysis
Data were exported from the Cirrus 5000 device to an Excel file (Excel version 2016; Microsoft
Corp., Redmond, WA, USA). In order to ensure the independence of observations, only the left eye
of every patient was considered for investigation. Then, data were analyzed with SPSS software (IBM,
Chicago, IL, USA, version 24). The Fisher-exact test was used to compare the difference in group
proportions relating to sex. The Mann–Whitney U test was used to analyze the differences of
continuous parameters between groups. Correlations were calculated by the Spearman correlation
test. Data were expressed as mean ± standard deviation. Significance level was p < 0.05.
3. Results
Fourteen eyes of 14 high-functioning ASD subjects and 14 eyes of 14 age- and sex-matched NT
controls were initially examined. One ASD patient did not achieve acceptable signal strength in the
scans, so she was discarded. Finally, 13 participants (10 men and 3 women) in the ASD group and 14
(10 men and 4 women) in the NT group were considered (p = 1, Fisher-exact test). The mean ages of
the ASD and NT groups were 16.615 ± 2.987 and 16.857 ± 4.055 years (p = 0.806, Mann–Whitney U
test).
Thickness of macular (Figures 6 and 7) and peripapillary (Figures 8 and 9) subfields showed no
significant differences (p > 0.05, Mann–Whitney U test). However, a clear trend to higher thicknesses
was found in the ASD group, at all macular subfields and at inferior peripapillary sectors, with such
differences as over 10 microns at the macular central subfield (Figure 6), over 13 and 10 microns at
Figure 5. Peripapillary microvascularization map. Perfusion density (P) is indicated in percentage (%).Flux index (F) is unitless. S = superior, I = inferior, N = nasal, T = temporal.
Statistical Analysis
Data were exported from the Cirrus 5000 device to an Excel file (Excel version 2016; MicrosoftCorp., Redmond, WA, USA). In order to ensure the independence of observations, only the left eyeof every patient was considered for investigation. Then, data were analyzed with SPSS software(IBM, Chicago, IL, USA, version 24). The Fisher-exact test was used to compare the difference ingroup proportions relating to sex. The Mann–Whitney U test was used to analyze the differences ofcontinuous parameters between groups. Correlations were calculated by the Spearman correlation test.Data were expressed as mean ± standard deviation. Significance level was p < 0.05.
3. Results
Fourteen eyes of 14 high-functioning ASD subjects and 14 eyes of 14 age- and sex-matched NTcontrols were initially examined. One ASD patient did not achieve acceptable signal strength in thescans, so she was discarded. Finally, 13 participants (10 men and 3 women) in the ASD group and 14
J. Clin. Med. 2020, 9, 3123 6 of 13
(10 men and 4 women) in the NT group were considered (p = 1, Fisher-exact test). The mean ages of theASD and NT groups were 16.615 ± 2.987 and 16.857 ± 4.055 years (p = 0.806, Mann–Whitney U test).
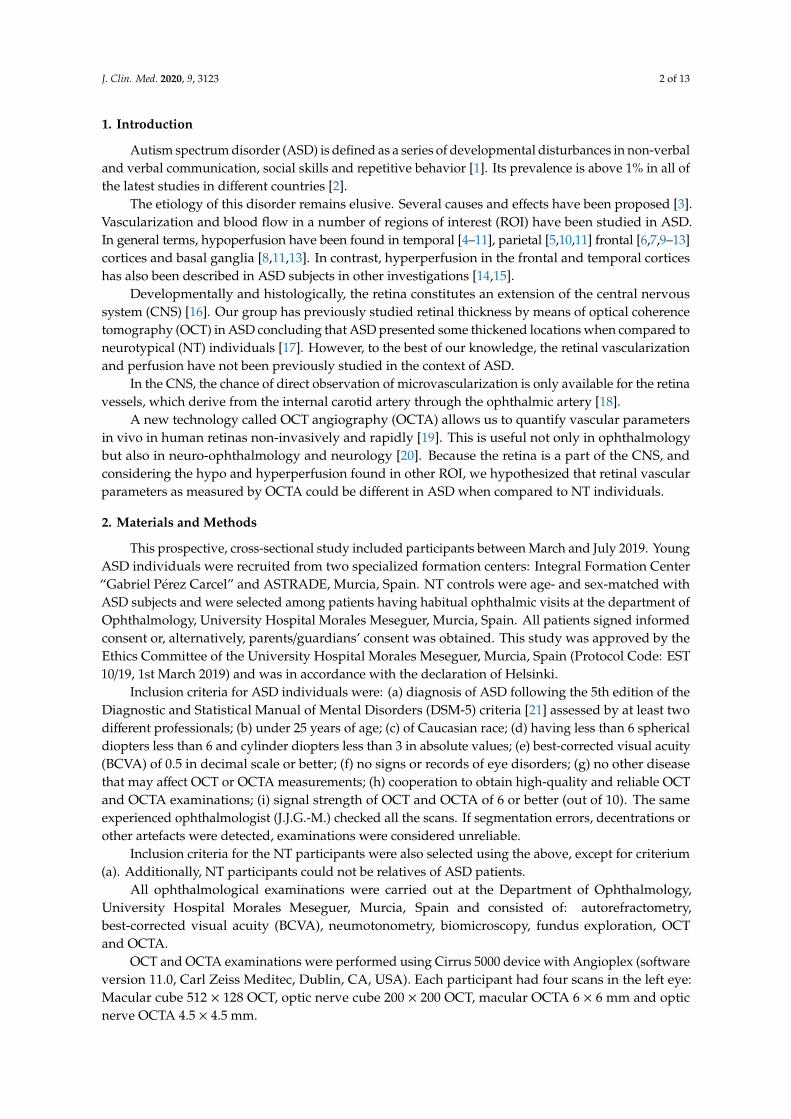
Thickness of macular (Figures 6 and 7) and peripapillary (Figures 8 and 9) subfields showed nosignificant differences (p > 0.05, Mann–Whitney U test). However, a clear trend to higher thicknesseswas found in the ASD group, at all macular subfields and at inferior peripapillary sectors, with suchdifferences as over 10 microns at the macular central subfield (Figure 6), over 13 and 10 microns atclock-hour 6 and 5 sectors, respectively (Figure 7), and over eight microns at inferior peripapillaryquadrant (Figure 8).
J. Clin. Med. 2020, 9, x FOR PEER REVIEW 6 of 13
clock-hour 6 and 5 sectors, respectively (Figure 7), and over eight microns at inferior peripapillary
quadrant (Figure 8).
Figure 6. Retinal thickness of the nine subfields of the macular ETDRS grid. ASD = autism spectrum
disorder group; NT = neurotypical group. Values represent mean thickness in microns for each group.
No significant differences were detected between groups (Mann–Whitney U test).
Figure 7. Peripapillary retinal nerve fiber layer thickness of the 12 clock-hour sectors. ASD = autism
spectrum disorder group; NT = neurotypical group. Values represent mean thickness in microns for
each group. No significant differences were detected between groups (Mann–Whitney U test).
Z_CENTER Z_INNERRIGHT Z_INNERSUPERIOR Z_INNERLEFT Z_INNERINFERIOR Z_OUTERRIGHTZ_OUTERSUPERIO
RZ_OUTERLEFT Z_OUTERINFERIOR
TEA 266.923 319.538 334.231 338.308 330.615 272.615 290.077 311.077 278.923
NT 256.5 314.071 329.5 331.286 323.214 266.357 285.357 308 275.929
250
260
270
280
290
300
310
320
330
340
350
MA
CU
LAR
TH
ICK
NES
S (m
icro
ns)
CLOCKHOUR-
1
CLOCKHOUR-
2
CLOCKHOUR-
3
CLOCKHOUR-
4
CLOCKHOUR-
5
CLOCKHOUR-
6
CLOCKHOUR-
7
CLOCKHOUR-
8
CLOCKHOUR-
9
CLOCKHOUR-10
CLOCKHOUR-11
CLOCKHOUR-12
TEA 115.15 95.154 60.385 74.538 107.31 144.69 134.31 69.769 54.231 80.154 125.31 120
NT 115.86 89 59.643 77.429 96.643 131.29 132.5 74.071 54.357 78.571 130.14 120.64
50
60
70
80
90
100
110
120
130
140
150
PER
IPA
PIL
LAR
Y T
HIC
KN
ESS
(mic
ron
s)
Figure 6. Retinal thickness of the nine subfields of the macular ETDRS grid. ASD = autism spectrumdisorder group; NT = neurotypical group. Values represent mean thickness in microns for each group.No significant differences were detected between groups (Mann–Whitney U test).
J. Clin. Med. 2020, 9, x FOR PEER REVIEW 6 of 13
clock-hour 6 and 5 sectors, respectively (Figure 7), and over eight microns at inferior peripapillary
quadrant (Figure 8).
Figure 6. Retinal thickness of the nine subfields of the macular ETDRS grid. ASD = autism spectrum
disorder group; NT = neurotypical group. Values represent mean thickness in microns for each group.
No significant differences were detected between groups (Mann–Whitney U test).
Figure 7. Peripapillary retinal nerve fiber layer thickness of the 12 clock-hour sectors. ASD = autism
spectrum disorder group; NT = neurotypical group. Values represent mean thickness in microns for
each group. No significant differences were detected between groups (Mann–Whitney U test).
Z_CENTER Z_INNERRIGHT Z_INNERSUPERIOR Z_INNERLEFT Z_INNERINFERIOR Z_OUTERRIGHTZ_OUTERSUPERIO
RZ_OUTERLEFT Z_OUTERINFERIOR
TEA 266.923 319.538 334.231 338.308 330.615 272.615 290.077 311.077 278.923
NT 256.5 314.071 329.5 331.286 323.214 266.357 285.357 308 275.929
250
260
270
280
290
300
310
320
330
340
350
MA
CU
LAR
TH
ICK
NES
S (m
icro
ns)
CLOCKHOUR-
1
CLOCKHOUR-
2
CLOCKHOUR-
3
CLOCKHOUR-
4
CLOCKHOUR-
5
CLOCKHOUR-
6
CLOCKHOUR-
7
CLOCKHOUR-
8
CLOCKHOUR-
9
CLOCKHOUR-10
CLOCKHOUR-11
CLOCKHOUR-12
TEA 115.15 95.154 60.385 74.538 107.31 144.69 134.31 69.769 54.231 80.154 125.31 120
NT 115.86 89 59.643 77.429 96.643 131.29 132.5 74.071 54.357 78.571 130.14 120.64
50
60
70
80
90
100
110
120
130
140
150
PER
IPA
PIL
LAR
Y T
HIC
KN
ESS
(mic
ron
s)
Figure 7. Peripapillary retinal nerve fiber layer thickness of the 12 clock-hour sectors. ASD = autismspectrum disorder group; NT = neurotypical group. Values represent mean thickness in microns foreach group. No significant differences were detected between groups (Mann–Whitney U test).

J. Clin. Med. 2020, 9, 3123 7 of 13
J. Clin. Med. 2020, 9, x FOR PEER REVIEW 7 of 13
Figure 8. Peripapillary retinal nerve fiber layer thickness of the 4 quadrants. ASD = autism spectrum
disorder group; NT = neurotypical group. Values represent mean thickness in microns for each group.
No significant differences were detected between groups (Mann–Whitney U test). T = temporal, S =
superior, N = nasal, I = inferior.
Vessel density (Figure 9) and perfusion density (Figure 10) in the macula of the ASD group also
showed a tendency to be higher than those of NT group. All these differences were not statistically
significant (p > 0.05).
Figure 9. Vessel density of the nine subfields of the macular ETDRS grid. ASD = autism spectrum
disorder group; NT = neurotypical group. Mean values were indicated for each group. No significant
differences were detected between groups (Mann–Whitney U test).
QUADRANT_T QUADRANT_S QUADRANT_N QUADRANT_I
TEA 67.923 120.308 76.615 128.846
NT 69.071 122.286 75.357 120.214
55
65
75
85
95
105
115
125
135
145
155P
ERIP
AP
ILLA
RY
TH
ICK
NES
S (m
icro
ns)
TEA
NT
Z_CENTER18 Z_INNERRIGHT19Z_INNERSUPERIOR
20Z_INNERLEFT21
Z_INNERINFERIOR22
Z_OUTERRIGHT23Z_OUTERSUPERIOR
24Z_OUTERLEFT25
Z_OUTERINFERIOR26
TEA 11.549 18.304 19.677 18.63 18.704 19.955 18.935 17.922 18.983
NT 10.687 18.139 18.444 18.679 18.39 19.519 18.695 17.772 18.691
101112131415161718192021
VES
SEL
DEN
SITY
(m
m/m
m2
)
Figure 8. Peripapillary retinal nerve fiber layer thickness of the 4 quadrants. ASD = autism spectrumdisorder group; NT = neurotypical group. Values represent mean thickness in microns for each group.No significant differences were detected between groups (Mann–Whitney U test). T = temporal,S = superior, N = nasal, I = inferior.
Vessel density (Figure 9) and perfusion density (Figure 10) in the macula of the ASD group alsoshowed a tendency to be higher than those of NT group. All these differences were not statisticallysignificant (p > 0.05).
J. Clin. Med. 2020, 9, x FOR PEER REVIEW 7 of 13
Figure 8. Peripapillary retinal nerve fiber layer thickness of the 4 quadrants. ASD = autism spectrum
disorder group; NT = neurotypical group. Values represent mean thickness in microns for each group.
No significant differences were detected between groups (Mann–Whitney U test). T = temporal, S =
superior, N = nasal, I = inferior.
Vessel density (Figure 9) and perfusion density (Figure 10) in the macula of the ASD group also
showed a tendency to be higher than those of NT group. All these differences were not statistically
significant (p > 0.05).
Figure 9. Vessel density of the nine subfields of the macular ETDRS grid. ASD = autism spectrum
disorder group; NT = neurotypical group. Mean values were indicated for each group. No significant
differences were detected between groups (Mann–Whitney U test).
QUADRANT_T QUADRANT_S QUADRANT_N QUADRANT_I
TEA 67.923 120.308 76.615 128.846
NT 69.071 122.286 75.357 120.214
55
65
75
85
95
105
115
125
135
145
155
PER
IPA
PIL
LAR
Y T
HIC
KN
ESS
(mic
ron
s)
TEA
NT
Z_CENTER18 Z_INNERRIGHT19Z_INNERSUPERIOR
20Z_INNERLEFT21
Z_INNERINFERIOR22
Z_OUTERRIGHT23Z_OUTERSUPERIOR
24Z_OUTERLEFT25
Z_OUTERINFERIOR26
TEA 11.549 18.304 19.677 18.63 18.704 19.955 18.935 17.922 18.983
NT 10.687 18.139 18.444 18.679 18.39 19.519 18.695 17.772 18.691
101112131415161718192021
VES
SEL
DEN
SITY
(m
m/m
m2
)
Figure 9. Vessel density of the nine subfields of the macular ETDRS grid. ASD = autism spectrumdisorder group; NT = neurotypical group. Mean values were indicated for each group. No significantdifferences were detected between groups (Mann–Whitney U test).
FAZ area (ASD = 0.195± 0.59 versus NT = 0.194± 0.59 mm2), FAZ perimetry (ASD = 1.759± 0.30 versusNT = 1.652 ± 0.61 mm) and FAZ circularity (ASD = 0.778 ± 0.52 versus NT = 0.727 ± 0.12) differenceswere not found statistically significant between the ASD and NT groups (p > 0.05, Mann–WhitneyU test).
J. Clin. Med. 2020, 9, 3123 8 of 13
J. Clin. Med. 2020, 9, x FOR PEER REVIEW 8 of 13
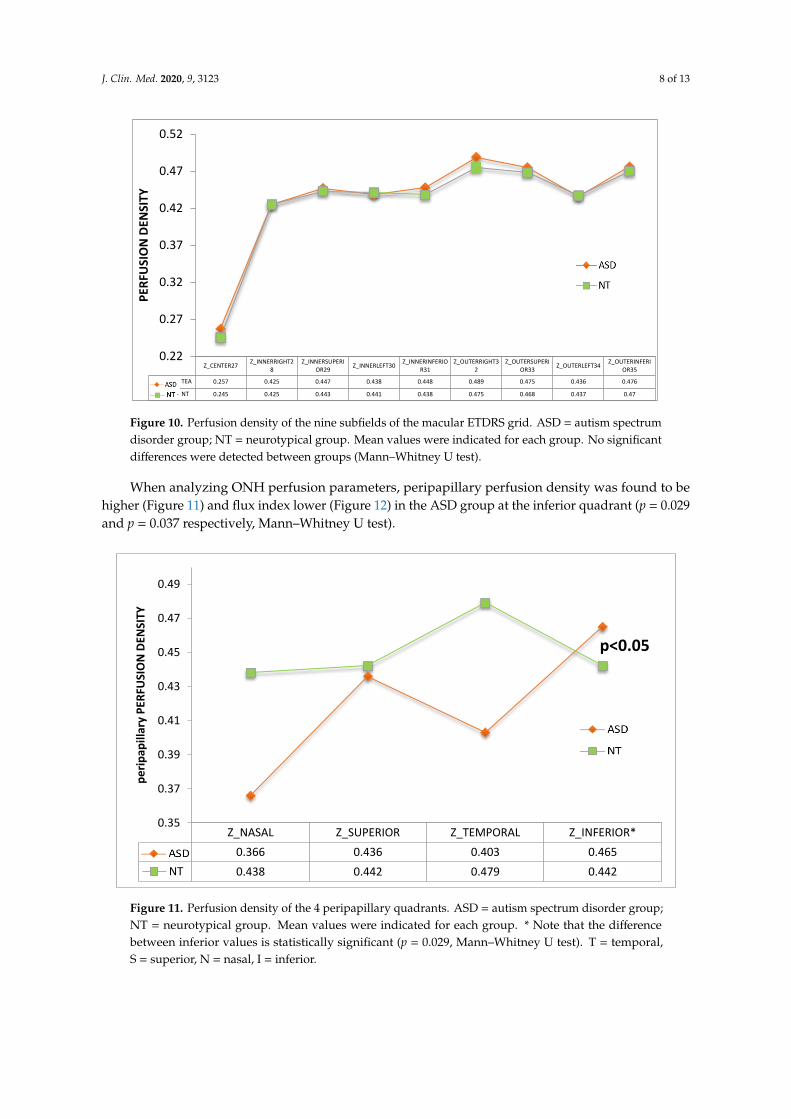
Figure 10. Perfusion density of the nine subfields of the macular ETDRS grid. ASD = autism spectrum
disorder group; NT = neurotypical group. Mean values were indicated for each group. No significant
differences were detected between groups (Mann–Whitney U test).
FAZ area (ASD = 0.195 ± 0.59 versus NT = 0.194 ± 0.59 mm2), FAZ perimetry (ASD = 1.759 ± 0.30
versus NT = 1.652 ± 0.61 mm) and FAZ circularity (ASD = 0.778 ± 0.52 versus NT = 0.727 ± 0.12)
differences were not found statistically significant between the ASD and NT groups (p > 0.05, Mann–
Whitney U test).
When analyzing ONH perfusion parameters, peripapillary perfusion density was found to be
higher (Figure 11) and flux index lower (Figure 12) in the ASD group at the inferior quadrant (p =
0.029 and p = 0.037 respectively, Mann–Whitney U test).
Figure 11. Perfusion density of the 4 peripapillary quadrants. ASD = autism spectrum disorder group;
NT = neurotypical group. Mean values were indicated for each group. * Note that the difference
between inferior values is statistically significant (p = 0.029, Mann–Whitney U test). T = temporal, S =
superior, N = nasal, I = inferior.
Z_CENTER27Z_INNERRIGHT2
8Z_INNERSUPERI
OR29Z_INNERLEFT30
Z_INNERINFERIOR31
Z_OUTERRIGHT32
Z_OUTERSUPERIOR33
Z_OUTERLEFT34Z_OUTERINFERI
OR35
TEA 0.257 0.425 0.447 0.438 0.448 0.489 0.475 0.436 0.476
NT 0.245 0.425 0.443 0.441 0.438 0.475 0.468 0.437 0.47
0.22
0.27
0.32
0.37
0.42
0.47
0.52P
ERFU
SIO
N D
ENSI
TY
Z_NASAL Z_SUPERIOR Z_TEMPORAL Z_INFERIOR*
TEA 0.366 0.436 0.403 0.465
NT 0.438 0.442 0.479 0.442
0.35
0.37
0.39
0.41
0.43
0.45
0.47
0.49
pe
rip
apill
ary
PER
FUSI
ON
DEN
SITY
p<0.05
Figure 10. Perfusion density of the nine subfields of the macular ETDRS grid. ASD = autism spectrumdisorder group; NT = neurotypical group. Mean values were indicated for each group. No significantdifferences were detected between groups (Mann–Whitney U test).
When analyzing ONH perfusion parameters, peripapillary perfusion density was found to behigher (Figure 11) and flux index lower (Figure 12) in the ASD group at the inferior quadrant (p = 0.029and p = 0.037 respectively, Mann–Whitney U test).
J. Clin. Med. 2020, 9, x FOR PEER REVIEW 8 of 13
Figure 10. Perfusion density of the nine subfields of the macular ETDRS grid. ASD = autism spectrum
disorder group; NT = neurotypical group. Mean values were indicated for each group. No significant
differences were detected between groups (Mann–Whitney U test).
FAZ area (ASD = 0.195 ± 0.59 versus NT = 0.194 ± 0.59 mm2), FAZ perimetry (ASD = 1.759 ± 0.30
versus NT = 1.652 ± 0.61 mm) and FAZ circularity (ASD = 0.778 ± 0.52 versus NT = 0.727 ± 0.12)
differences were not found statistically significant between the ASD and NT groups (p > 0.05, Mann–
Whitney U test).
When analyzing ONH perfusion parameters, peripapillary perfusion density was found to be
higher (Figure 11) and flux index lower (Figure 12) in the ASD group at the inferior quadrant (p =
0.029 and p = 0.037 respectively, Mann–Whitney U test).
Figure 11. Perfusion density of the 4 peripapillary quadrants. ASD = autism spectrum disorder group;
NT = neurotypical group. Mean values were indicated for each group. * Note that the difference
between inferior values is statistically significant (p = 0.029, Mann–Whitney U test). T = temporal, S =
superior, N = nasal, I = inferior.
Z_CENTER27Z_INNERRIGHT2
8Z_INNERSUPERI
OR29Z_INNERLEFT30
Z_INNERINFERIOR31
Z_OUTERRIGHT32
Z_OUTERSUPERIOR33
Z_OUTERLEFT34Z_OUTERINFERI
OR35
TEA 0.257 0.425 0.447 0.438 0.448 0.489 0.475 0.436 0.476
NT 0.245 0.425 0.443 0.441 0.438 0.475 0.468 0.437 0.47
0.22
0.27
0.32
0.37
0.42
0.47
0.52
PER
FUSI
ON
DEN
SITY
Z_NASAL Z_SUPERIOR Z_TEMPORAL Z_INFERIOR*
TEA 0.366 0.436 0.403 0.465
NT 0.438 0.442 0.479 0.442
0.35
0.37
0.39
0.41
0.43
0.45
0.47
0.49
pe
rip
apill
ary
PER
FUSI
ON
DEN
SITY
p<0.05
Figure 11. Perfusion density of the 4 peripapillary quadrants. ASD = autism spectrum disorder group;NT = neurotypical group. Mean values were indicated for each group. * Note that the differencebetween inferior values is statistically significant (p = 0.029, Mann–Whitney U test). T = temporal,S = superior, N = nasal, I = inferior.

J. Clin. Med. 2020, 9, 3123 9 of 13
J. Clin. Med. 2020, 9, x FOR PEER REVIEW 9 of 13
Figure 12. Flux index of the 4 peripapillary quadrants. ASD = autism spectrum disorder group; NT =
neurotypical group. Mean values were indicated for each group. * Note that the difference between
inferior values is statistically significant (p = 0.037, Mann–Whitney U test).
Figure 13 shows an example of ONH OCTA from ASD and NT participants.
Figure 13. ASD (left) and NT (right) optic nerve head OCTA of two age and sex-matched participants
in this study. Note that perfusion (P) is higher and flux index (F) is lower at the inferior quadrant in
ASD participant.
Correlations between the perfusion density or flux index and the RNFL thickness at the inferior
ONH quadrant were also calculated. Correlations between perfusion density and RNFL thickness
were not statistically significant for the ASD or NT group (r = −0.094, p = 0.761 and r = 0.103, p = 0.725,
respectively, Spearman correlation test). However, the correlation of the RNFL thickness and flux
index was significant for the NT group (r = 0.591, p = 0.029, Spearman correlation test) but not for the
ASD group (r = −0.215, p = 0.481, Spearman correlation test) (Figure 14).
Z_NASAL50 Z_SUPERIOR51 Z_TEMPORAL52 Z_INFERIOR53*
TEA 0.464 0.442 0.483 0.442
NT 0.459 0.452 0.471 0.455
0.44
0.445
0.45
0.455
0.46
0.465
0.47
0.475
0.48
0.485
0.49FL
UX
IND
EX
p<0.05
Figure 12. Flux index of the 4 peripapillary quadrants. ASD = autism spectrum disorder group;NT = neurotypical group. Mean values were indicated for each group. * Note that the differencebetween inferior values is statistically significant (p = 0.037, Mann–Whitney U test).
Figure 13 shows an example of ONH OCTA from ASD and NT participants.
J. Clin. Med. 2020, 9, x FOR PEER REVIEW 9 of 13
Figure 12. Flux index of the 4 peripapillary quadrants. ASD = autism spectrum disorder group; NT =
neurotypical group. Mean values were indicated for each group. * Note that the difference between
inferior values is statistically significant (p = 0.037, Mann–Whitney U test).
Figure 13 shows an example of ONH OCTA from ASD and NT participants.
Figure 13. ASD (left) and NT (right) optic nerve head OCTA of two age and sex-matched participants
in this study. Note that perfusion (P) is higher and flux index (F) is lower at the inferior quadrant in
ASD participant.
Correlations between the perfusion density or flux index and the RNFL thickness at the inferior
ONH quadrant were also calculated. Correlations between perfusion density and RNFL thickness
were not statistically significant for the ASD or NT group (r = −0.094, p = 0.761 and r = 0.103, p = 0.725,
respectively, Spearman correlation test). However, the correlation of the RNFL thickness and flux
index was significant for the NT group (r = 0.591, p = 0.029, Spearman correlation test) but not for the
ASD group (r = −0.215, p = 0.481, Spearman correlation test) (Figure 14).
Z_NASAL50 Z_SUPERIOR51 Z_TEMPORAL52 Z_INFERIOR53*
TEA 0.464 0.442 0.483 0.442
NT 0.459 0.452 0.471 0.455
0.44
0.445
0.45
0.455
0.46
0.465
0.47
0.475
0.48
0.485
0.49FL
UX
IND
EX
p<0.05
Figure 13. ASD (left) and NT (right) optic nerve head OCTA of two age and sex-matched participantsin this study. Note that perfusion (P) is higher and flux index (F) is lower at the inferior quadrant inASD participant.
Correlations between the perfusion density or flux index and the RNFL thickness at the inferiorONH quadrant were also calculated. Correlations between perfusion density and RNFL thicknesswere not statistically significant for the ASD or NT group (r = −0.094, p = 0.761 and r = 0.103, p = 0.725,respectively, Spearman correlation test). However, the correlation of the RNFL thickness and flux indexwas significant for the NT group (r = 0.591, p = 0.029, Spearman correlation test) but not for the ASDgroup (r = −0.215, p = 0.481, Spearman correlation test) (Figure 14).
J. Clin. Med. 2020, 9, 3123 10 of 13J. Clin. Med. 2020, 9, x FOR PEER REVIEW 10 of 13
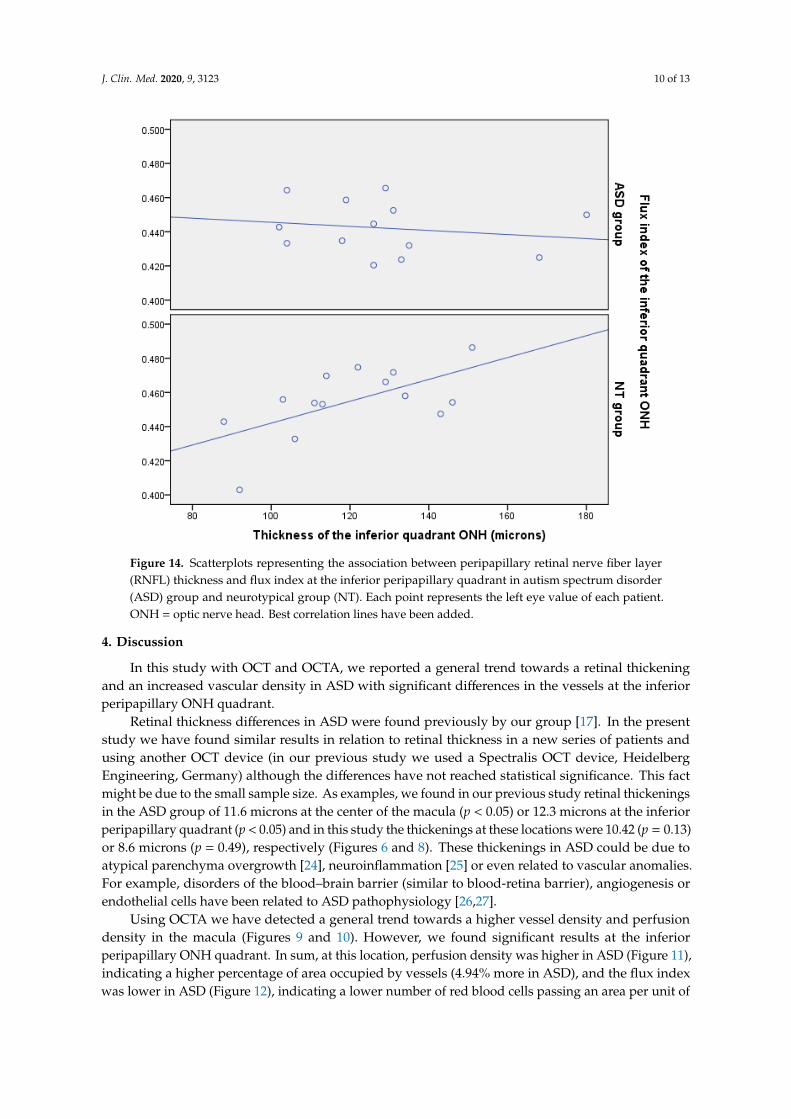
Figure 14. Scatterplots representing the association between peripapillary retinal nerve fiber layer
(RNFL) thickness and flux index at the inferior peripapillary quadrant in autism spectrum disorder
(ASD) group and neurotypical group (NT). Each point represents the left eye value of each patient.
ONH = optic nerve head. Best correlation lines have been added.
4. Discussion
In this study with OCT and OCTA, we reported a general trend towards a retinal thickening and
an increased vascular density in ASD with significant differences in the vessels at the inferior
peripapillary ONH quadrant.
Retinal thickness differences in ASD were found previously by our group [17]. In the present
study we have found similar results in relation to retinal thickness in a new series of patients and
using another OCT device (in our previous study we used a Spectralis OCT device, Heidelberg
Engineering, Germany) although the differences have not reached statistical significance. This fact
might be due to the small sample size. As examples, we found in our previous study retinal
thickenings in the ASD group of 11.6 microns at the center of the macula (p < 0.05) or 12.3 microns at
the inferior peripapillary quadrant (p < 0.05) and in this study the thickenings at these locations were
10.42 (p = 0.13) or 8.6 microns (p = 0.49), respectively (Figures 6 and 8). These thickenings in ASD
could be due to atypical parenchyma overgrowth [24], neuroinflammation [25] or even related to
vascular anomalies. For example, disorders of the blood–brain barrier (similar to blood-retina
barrier), angiogenesis or endothelial cells have been related to ASD pathophysiology [26,27].
Using OCTA we have detected a general trend towards a higher vessel density and perfusion
density in the macula (Figures 9 and 10). However, we found significant results at the inferior
peripapillary ONH quadrant. In sum, at this location, perfusion density was higher in ASD (Figure
11), indicating a higher percentage of area occupied by vessels (4.94% more in ASD), and the flux
index was lower in ASD (Figure 12), indicating a lower number of red blood cells passing an area per
unit of time (2.85% less in ASD). In other words, the vascular density was greater but the flux was
less intense in the ASD group at the inferior peripapillary ONH quadrant.
Figure 14. Scatterplots representing the association between peripapillary retinal nerve fiber layer(RNFL) thickness and flux index at the inferior peripapillary quadrant in autism spectrum disorder(ASD) group and neurotypical group (NT). Each point represents the left eye value of each patient.ONH = optic nerve head. Best correlation lines have been added.
4. Discussion
In this study with OCT and OCTA, we reported a general trend towards a retinal thickeningand an increased vascular density in ASD with significant differences in the vessels at the inferiorperipapillary ONH quadrant.
Retinal thickness differences in ASD were found previously by our group [17]. In the presentstudy we have found similar results in relation to retinal thickness in a new series of patients andusing another OCT device (in our previous study we used a Spectralis OCT device, HeidelbergEngineering, Germany) although the differences have not reached statistical significance. This factmight be due to the small sample size. As examples, we found in our previous study retinal thickeningsin the ASD group of 11.6 microns at the center of the macula (p < 0.05) or 12.3 microns at the inferiorperipapillary quadrant (p < 0.05) and in this study the thickenings at these locations were 10.42 (p = 0.13)or 8.6 microns (p = 0.49), respectively (Figures 6 and 8). These thickenings in ASD could be due toatypical parenchyma overgrowth [24], neuroinflammation [25] or even related to vascular anomalies.For example, disorders of the blood–brain barrier (similar to blood-retina barrier), angiogenesis orendothelial cells have been related to ASD pathophysiology [26,27].
Using OCTA we have detected a general trend towards a higher vessel density and perfusiondensity in the macula (Figures 9 and 10). However, we found significant results at the inferiorperipapillary ONH quadrant. In sum, at this location, perfusion density was higher in ASD (Figure 11),indicating a higher percentage of area occupied by vessels (4.94% more in ASD), and the flux indexwas lower in ASD (Figure 12), indicating a lower number of red blood cells passing an area per unit of
J. Clin. Med. 2020, 9, 3123 11 of 13
time (2.85% less in ASD). In other words, the vascular density was greater but the flux was less intensein the ASD group at the inferior peripapillary ONH quadrant.
Additionally, we detected that the flux index was positively correlated with thickness at thislocation in the NT controls but not in ASD individuals. A healthy retina is able to autoregulate theblood flux according to parenchymal metabolic needs [28]. In the NT group the thicker the retinalparenchyma was the higher than the blood flux was, but this phenomenon was not observed in theASD group (Figure 13). These results suggest that retinal blood flux autoregulation could be alteredin ASD.
One may argue that a correction for multiple comparisons should be performed in this study.This is a controversial subject because of the risk that false-negative results could increase [29] so wepreferred not to apply such adjustments.
Our work has some limitations. As mentioned above, the small sample size is one of them.However, significant results have been obtained. In addition, OCTA software of the Cirrus device usedonly provides automated results for superficial capillary plexus but not for deeper vascularizationof the retina [30]. Finally, the ASD group was made up of young, high-functioning ASD subjectsso the outcomes should not be extrapolated to other groups such as older ASD or low-functioningASD individuals.
In summary, this pilot study is the first one analyzing retinal parameters in ASD using OCT andOCTA. Retinas of ASD subjects may present some structural and vascular differences when comparedwith retinas of NT individuals. Further prospective studies are needed to confirm these findings.
Author Contributions: Conceptualization and methodology, writing – original draft preparation: J.J.G.-M., E.R.-V.,M.D.L.-B., D.P.-M., A.P.-M., M.D.P.-D., and M.d.-R.-V.; validation, formal analysis, and investigation: J.J.G.-M.,M.d.-R.-V., M.D.P.-D., E.R.-V.; data curation: D.P.-M. and E.R.-V.; critical review of the last draft of the paper:M.d.-R.-V., M.D.L.-B.; supervision: J.J.G.-M., M.d.-R.-V. and M.D.P.-D. All authors have read and agreed to thepublished version of the manuscript.
Funding: This research received no external funding.
Acknowledgments: We would like to thank Guadalupe Ruiz-Merino (Statistics Department, FFIS-IMIB, Murcia,Spain) for her statistical support in this study and Carlos del Rio (Carl Zeiss Meditec Iberia, Madrid, Spain) for histechnical support with OCT and OCTA. This work was accepted for presentation as a poster at the 2020 ARVOAnnual Meeting, Baltimore, Maryland, USA, 3 May–7 May 2020. The abstract of this poster has been published athttps://iovs.arvojournals.org/article.aspx?articleid=2768858.
Conflicts of Interest: The authors declare no conflict of interest.
References
1. Wing, L. The Autistic Spectrum. Lancet 1997, 350, 1761–1766. [CrossRef]2. Saito, M.; Hirota, T.; Sakamoto, Y.; Adachi, M.; Takahashi, M.; Osato-Kaneda, A.; Kim, Y.S.; Leventhal, B.;
Shui, A.; Kato, S.; et al. Prevalence and Cumulative Incidence of Autism Spectrum Disorders and the Patternsof Co-Occurring Neurodevelopmental Disorders in a Total Population Sample of 5-Year-Old Children.Mol. Autism 2020, 11, 35. [CrossRef]
3. Imamura, A.; Morimoto, Y.; Ono, S.; Kurotaki, N.; Kanegae, S.; Yamamoto, N.; Kinoshita, H.; Tsujita, T.;Okazaki, Y.; Ozawa, H. Genetic and Environmental Factors of Schizophrenia and Autism Spectrum Disorder:Insights from Twin Studies. J. Neural Transm. 2020, in press. [CrossRef]
4. Carina Gillberg, I.; Bjure, J.; Uvebrant, P.; Vestergren, E.; Gillberg, C. SPECT (Single Photon Emission ComputedTomography) in 31 Children and Adolescents with Autism and Autistic-like Conditions. Eur. Child Adolesc.Psychiatry 1993, 2, 50–59. [CrossRef]
5. Mountz, J.M.; Tolbert, L.C.; Lill, D.W.; Katholi, C.R.; Liu, H.G. Functional Deficits in Autistic Disorder:Characterization by Technetium-99m-HMPAO and SPECT. J. Nucl. Med. 1995, 36, 1156–1162.
6. Hashimoto, T.; Sasaki, M.; Fukumizu, M.; Hanaoka, S.; Sugai, K.; Matsuda, H. Single-Photon EmissionComputed Tomography of the Brain in Autism: Effect of the Developmental Level. Pediatr. Neurol. 2000, 23,416–420. [CrossRef]
J. Clin. Med. 2020, 9, 3123 12 of 13
7. Ohnishi, T.; Matsuda, H.; Hashimoto, T.; Kunihiro, T.; Nishikawa, M.; Uema, T.; Sasaki, M. AbnormalRegional Cerebral Blood Flow in Childhood Autism. Brain 2000, 123, 1838–1844. [CrossRef]
8. Starkstein, S.E.; Vazquez, S.; Vrancic, D.; Nanclares, V.; Manes, F.; Piven, J.; Plebst, C. SPECT Findings inMentally Retarded Autistic Individuals. J. Neuropsychiatry Clin. Neurosci. 2000, 12, 370–375. [CrossRef]
9. Kaya, M.; Karasalihoglu, S.; Ustün, F.; Gültekin, A.; Cermik, T.F.; Fazlioglu, Y.; Türe, M.; Yigitbasi, O.N.;Berkarda, S. The Relationship between 99mTc-HMPAO Brain SPECT and the Scores of Real Life Rating Scalein Autistic Children. Brain Dev. 2002, 24, 77–81. [CrossRef]
10. Burroni, L.; Orsi, A.; Monti, L.; Hayek, Y.; Rocchi, R.; Vattimo, A.G. Regional Cerebral Blood Flow inChildhood Autism: A SPET Study with SPM Evaluation. Nucl. Med. Commun. 2008, 29, 150–156. [CrossRef]
11. Degirmenci, B.; Miral, S.; Kaya, G.C.; Iyilikçi, L.; Arslan, G.; Baykara, A.; Evren, I.; Durak, H. Technetium-99mHMPAO Brain SPECT in Autistic Children and Their Families. Psychiatry Res. 2008, 162, 236–243. [CrossRef]
12. Wilcox, J.; Tsuang, M.T.; Ledger, E.; Algeo, J.; Schnurr, T. Brain Perfusion in Autism Varies with Age.Neuropsychobiology 2002, 46, 13–16. [CrossRef]
13. Gupta, S.K.; Ratnam, B.V. Cerebral Perfusion Abnormalities in Children with Autism and Mental Retardation:A Segmental Quantitative SPECT Study. Indian Pediatr. 2009, 46, 161–164.
14. Jann, K.; Hernandez, L.M.; Beck-Pancer, D.; McCarron, R.; Smith, R.X.; Dapretto, M.; Wang, D.J.J. AlteredResting Perfusion and Functional Connectivity of Default Mode Network in Youth with Autism SpectrumDisorder. Brain Behav. 2015, 5, e00358. [CrossRef]
15. Peterson, B.S.; Zargarian, A.; Peterson, J.B.; Goh, S.; Sawardekar, S.; Williams, S.C.R.; Lythgoe, D.J.; Zelaya, F.O.;Bansal, R. Hyperperfusion of Frontal White and Subcortical Gray Matter in Autism Spectrum Disorder.Biol. Psychiatry 2019, 85, 584–595. [CrossRef]
16. Yanoff, M.; Sassani, J.W. Neural (sensory) retina. In Ocular Pathology, 7th ed.; Yanoff, M., Sassani, J.W., Eds.;Saunders: London, UK, 2015; pp. 351–425.
17. García-Medina, J.J.; García-Piñero, M.; Del-Río-Vellosillo, M.; Fares-Valdivia, J.; Ragel-Hernández, A.B.;Martínez-Saura, S.; Cárcel-López, M.D.; Zanon-Moreno, V.; Pinazo-Duran, M.D.; Villegas-Pérez, M.P.Comparison of Foveal, Macular, and Peripapillary Intraretinal Thicknesses Between Autism SpectrumDisorder and Neurotypical Subjects. Invest. Ophthalmol. Vis. Sci. 2017, 58, 5819–5826. [CrossRef]
18. Riva, C.E.; Alm, A.; Pournaras, C.J. Ocular circulation In Adler’s Physiology of the Eye, 11th ed.; Levin, L.A.,Nilsson, S.F.E., Ver Hoeve, J., Wu, S.M., Eds.; Saunders/Elsevier: Philadelphia, PA, USA, 2016; pp. 243–273.
19. White, B.; Pierce, M.; Nassif, N.; Cense, B.; Park, B.; Tearney, G.; Bouma, B.; Chen, T.; de Boer, J. In VivoDynamic Human Retinal Blood Flow Imaging Using Ultra-High-Speed Spectral Domain Optical CoherenceTomography. Opt. Express 2003, 11, 3490–3497. [CrossRef]
20. Wylegała, A. Principles of OCTA and Applications in Clinical Neurology. Curr. Neurol. Neurosci. Rep. 2018,18, 96. [CrossRef]
21. American Psychiatric Association. Diagnostic and Statistical Manual of Mental Disorders: DSM-5, 5th ed.;American Psychiatric Association, Ed.; American Psychiatric Association: Washington, DC, USA, 2013.
22. CIRRUS HD-OCT. User Manual—Models 500, 5000; Carl Zeiss Meditec, Inc.: Dublin, CA, USA, 2017.Available online: https://www.zeiss.fr/content/dam/Meditec/international/ifu/documents/cirrus-hd-pct/current/2660021169012_a_cirrus_11_en_intl.pdf (accessed on 8 August 2020).
23. Richter, G.M.; Chang, R.; Situ, B.; Chu, Z.; Burkemper, B.; Reznik, A.; Bedrood, S.; Kashani, A.H.; Varma, R.;Wang, R.K. Diagnostic Performance of Macular Versus Peripapillary Vessel Parameters by Optical CoherenceTomography Angiography for Glaucoma. Transl. Vis. Sci. Technol. 2018, 7, 21. [CrossRef]
24. Varghese, M.; Keshav, N.; Jacot-Descombes, S.; Warda, T.; Wicinski, B.; Dickstein, D.L.; Harony-Nicolas, H.;De Rubeis, S.; Drapeau, E.; Buxbaum, J.D.; et al. Autism Spectrum Disorder: Neuropathology and AnimalModels. Acta Neuropathol. 2017, 134, 537–566. [CrossRef]
25. Matta, S.M.; Hill-Yardin, E.L.; Crack, P.J. The Influence of Neuroinflammation in Autism Spectrum Disorder.Brain Behav. Immun. 2019, 79, 75–90. [CrossRef]
26. Kealy, J.; Greene, C.; Campbell, M. Blood-Brain Barrier Regulation in Psychiatric Disorders. Neurosci. Lett.2020, 726, 133664. [CrossRef]
27. Baruah, J.; Vasudevan, A. The Vessels Shaping Mental Health or Illness. Open Neurol. J. 2019, 13, 1–9.[CrossRef]
28. Rassam, S.M.B.; Patel, V.; Chen, H.C.; Kohner, E.M. Regional Retinal Blood Flow and Vascular Autoregulation.Eye 1996, 10, 331–337. [CrossRef]

J. Clin. Med. 2020, 9, 3123 13 of 13
29. Rothman, K.J. No Adjustments Are Needed for Multiple Comparisons. Epidemiology 1990, 1, 43–46. [CrossRef]30. Hormel, T.T.; Jia, Y.; Jian, Y.; Hwang, T.S.; Bailey, S.T.; Pennesi, M.E.; Wilson, D.J.; Morrison, J.C.; Huang, D.
Plexus-Specific Retinal Vascular Anatomy and Pathologies as Seen by Projection-Resolved Optical CoherenceTomographic Angiography. Prog. Retin. Eye Res. 2020, in press. [CrossRef]
© 2020 by the authors. Licensee MDPI, Basel, Switzerland. This article is an open accessarticle distributed under the terms and conditions of the Creative Commons Attribution(CC BY) license (http://creativecommons.org/licenses/by/4.0/).