Assessing the accuracy of macula detection methods in retinal images
6
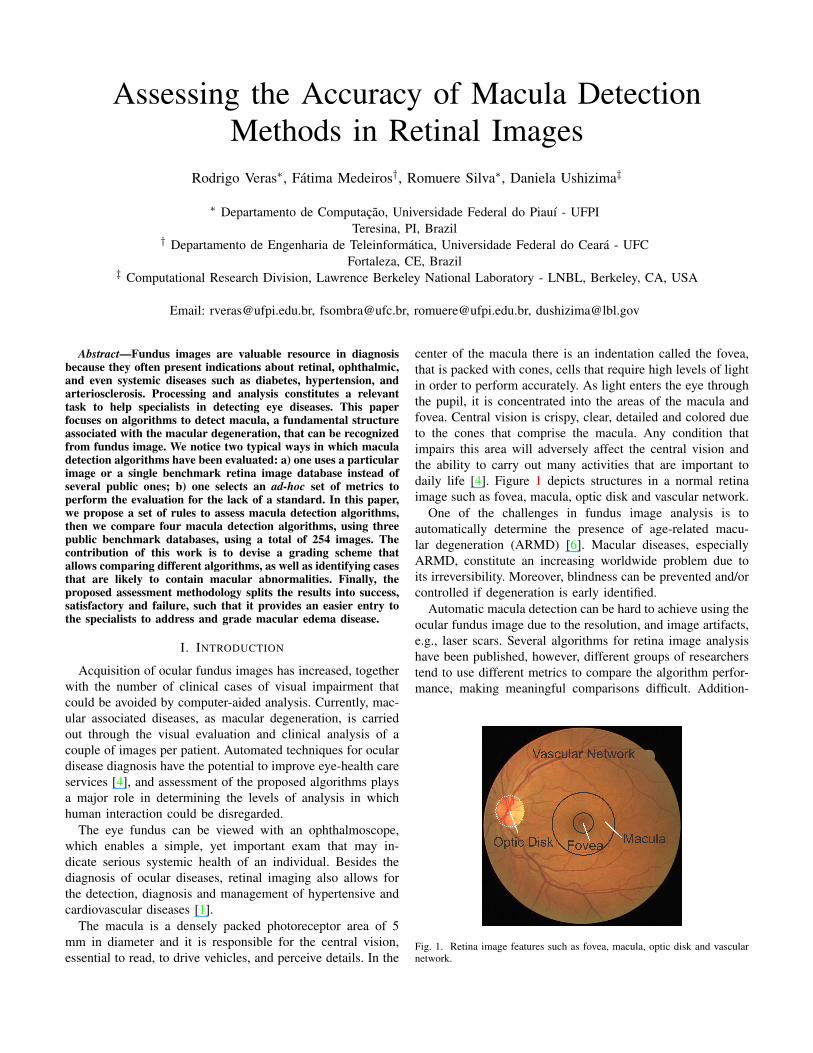
Assessing the Accuracy of Macula Detection Methods in Retinal Images Rodrigo Veras * , F´ atima Medeiros † , Romuere Silva * , Daniela Ushizima ‡ * Departamento de Computac ¸˜ ao, Universidade Federal do Piau´ ı - UFPI Teresina, PI, Brazil † Departamento de Engenharia de Teleinform´ atica, Universidade Federal do Cear´ a - UFC Fortaleza, CE, Brazil ‡ Computational Research Division, Lawrence Berkeley National Laboratory - LNBL, Berkeley, CA, USA Email: [email protected], [email protected], [email protected], [email protected] Abstract—Fundus images are valuable resource in diagnosis because they often present indications about retinal, ophthalmic, and even systemic diseases such as diabetes, hypertension, and arteriosclerosis. Processing and analysis constitutes a relevant task to help specialists in detecting eye diseases. This paper focuses on algorithms to detect macula, a fundamental structure associated with the macular degeneration, that can be recognized from fundus image. We notice two typical ways in which macula detection algorithms have been evaluated: a) one uses a particular image or a single benchmark retina image database instead of several public ones; b) one selects an ad-hoc set of metrics to perform the evaluation for the lack of a standard. In this paper, we propose a set of rules to assess macula detection algorithms, then we compare four macula detection algorithms, using three public benchmark databases, using a total of 254 images. The contribution of this work is to devise a grading scheme that allows comparing different algorithms, as well as identifying cases that are likely to contain macular abnormalities. Finally, the proposed assessment methodology splits the results into success, satisfactory and failure, such that it provides an easier entry to the specialists to address and grade macular edema disease. I. I NTRODUCTION Acquisition of ocular fundus images has increased, together with the number of clinical cases of visual impairment that could be avoided by computer-aided analysis. Currently, mac- ular associated diseases, as macular degeneration, is carried out through the visual evaluation and clinical analysis of a couple of images per patient. Automated techniques for ocular disease diagnosis have the potential to improve eye-health care services [4], and assessment of the proposed algorithms plays a major role in determining the levels of analysis in which human interaction could be disregarded. The eye fundus can be viewed with an ophthalmoscope, which enables a simple, yet important exam that may in- dicate serious systemic health of an individual. Besides the diagnosis of ocular diseases, retinal imaging also allows for the detection, diagnosis and management of hypertensive and cardiovascular diseases [1]. The macula is a densely packed photoreceptor area of 5 mm in diameter and it is responsible for the central vision, essential to read, to drive vehicles, and perceive details. In the center of the macula there is an indentation called the fovea, that is packed with cones, cells that require high levels of light in order to perform accurately. As light enters the eye through the pupil, it is concentrated into the areas of the macula and fovea. Central vision is crispy, clear, detailed and colored due to the cones that comprise the macula. Any condition that impairs this area will adversely affect the central vision and the ability to carry out many activities that are important to daily life [4]. Figure 1 depicts structures in a normal retina image such as fovea, macula, optic disk and vascular network. One of the challenges in fundus image analysis is to automatically determine the presence of age-related macu- lar degeneration (ARMD) [6]. Macular diseases, especially ARMD, constitute an increasing worldwide problem due to its irreversibility. Moreover, blindness can be prevented and/or controlled if degeneration is early identified. Automatic macula detection can be hard to achieve using the ocular fundus image due to the resolution, and image artifacts, e.g., laser scars. Several algorithms for retina image analysis have been published, however, different groups of researchers tend to use different metrics to compare the algorithm perfor- mance, making meaningful comparisons difficult. Addition- Fig. 1. Retina image features such as fovea, macula, optic disk and vascular network.
Transcript of Assessing the accuracy of macula detection methods in retinal images
Assessing the Accuracy of Macula DetectionMethods in Retinal Images
Rodrigo Veraslowast Fatima Medeirosdagger Romuere Silvalowast Daniela UshizimaDagger
lowast Departamento de Computacao Universidade Federal do Piauı - UFPITeresina PI Brazil
dagger Departamento de Engenharia de Teleinformatica Universidade Federal do Ceara - UFCFortaleza CE Brazil
Dagger Computational Research Division Lawrence Berkeley National Laboratory - LNBL Berkeley CA USA
Email rverasufpiedubr fsombraufcbr romuereufpiedubr dushizimalblgov
AbstractmdashFundus images are valuable resource in diagnosisbecause they often present indications about retinal ophthalmicand even systemic diseases such as diabetes hypertension andarteriosclerosis Processing and analysis constitutes a relevanttask to help specialists in detecting eye diseases This paperfocuses on algorithms to detect macula a fundamental structureassociated with the macular degeneration that can be recognizedfrom fundus image We notice two typical ways in which maculadetection algorithms have been evaluated a) one uses a particularimage or a single benchmark retina image database instead ofseveral public ones b) one selects an ad-hoc set of metrics toperform the evaluation for the lack of a standard In this paperwe propose a set of rules to assess macula detection algorithmsthen we compare four macula detection algorithms using threepublic benchmark databases using a total of 254 images Thecontribution of this work is to devise a grading scheme thatallows comparing different algorithms as well as identifying casesthat are likely to contain macular abnormalities Finally theproposed assessment methodology splits the results into successsatisfactory and failure such that it provides an easier entry tothe specialists to address and grade macular edema disease
I INTRODUCTION
Acquisition of ocular fundus images has increased togetherwith the number of clinical cases of visual impairment thatcould be avoided by computer-aided analysis Currently mac-ular associated diseases as macular degeneration is carriedout through the visual evaluation and clinical analysis of acouple of images per patient Automated techniques for oculardisease diagnosis have the potential to improve eye-health careservices [4] and assessment of the proposed algorithms playsa major role in determining the levels of analysis in whichhuman interaction could be disregarded
The eye fundus can be viewed with an ophthalmoscopewhich enables a simple yet important exam that may in-dicate serious systemic health of an individual Besides thediagnosis of ocular diseases retinal imaging also allows forthe detection diagnosis and management of hypertensive andcardiovascular diseases [1]
The macula is a densely packed photoreceptor area of 5mm in diameter and it is responsible for the central visionessential to read to drive vehicles and perceive details In the
center of the macula there is an indentation called the foveathat is packed with cones cells that require high levels of lightin order to perform accurately As light enters the eye throughthe pupil it is concentrated into the areas of the macula andfovea Central vision is crispy clear detailed and colored dueto the cones that comprise the macula Any condition thatimpairs this area will adversely affect the central vision andthe ability to carry out many activities that are important todaily life [4] Figure 1 depicts structures in a normal retinaimage such as fovea macula optic disk and vascular network
One of the challenges in fundus image analysis is toautomatically determine the presence of age-related macu-lar degeneration (ARMD) [6] Macular diseases especiallyARMD constitute an increasing worldwide problem due toits irreversibility Moreover blindness can be prevented andorcontrolled if degeneration is early identified
Automatic macula detection can be hard to achieve using theocular fundus image due to the resolution and image artifactseg laser scars Several algorithms for retina image analysishave been published however different groups of researcherstend to use different metrics to compare the algorithm perfor-mance making meaningful comparisons difficult Addition-
Fig 1 Retina image features such as fovea macula optic disk and vascularnetwork
Original Image
Optic Disk Detection
Determining the ROI
Determining the Macula Center
Result Evaluation
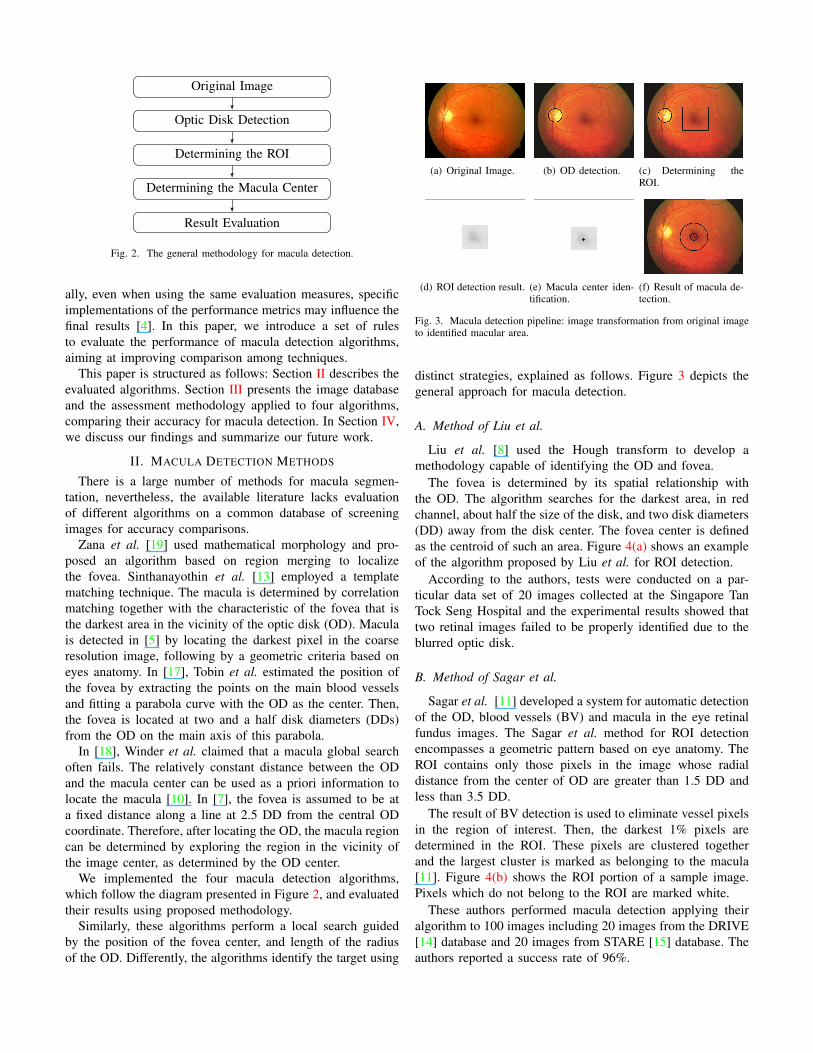
Fig 2 The general methodology for macula detection
ally even when using the same evaluation measures specificimplementations of the performance metrics may influence thefinal results [4] In this paper we introduce a set of rulesto evaluate the performance of macula detection algorithmsaiming at improving comparison among techniques
This paper is structured as follows Section II describes theevaluated algorithms Section III presents the image databaseand the assessment methodology applied to four algorithmscomparing their accuracy for macula detection In Section IVwe discuss our findings and summarize our future work
II MACULA DETECTION METHODS
There is a large number of methods for macula segmen-tation nevertheless the available literature lacks evaluationof different algorithms on a common database of screeningimages for accuracy comparisons
Zana et al [19] used mathematical morphology and pro-posed an algorithm based on region merging to localizethe fovea Sinthanayothin et al [13] employed a templatematching technique The macula is determined by correlationmatching together with the characteristic of the fovea that isthe darkest area in the vicinity of the optic disk (OD) Maculais detected in [5] by locating the darkest pixel in the coarseresolution image following by a geometric criteria based oneyes anatomy In [17] Tobin et al estimated the position ofthe fovea by extracting the points on the main blood vesselsand fitting a parabola curve with the OD as the center Thenthe fovea is located at two and a half disk diameters (DDs)from the OD on the main axis of this parabola
In [18] Winder et al claimed that a macula global searchoften fails The relatively constant distance between the ODand the macula center can be used as a priori information tolocate the macula [10] In [7] the fovea is assumed to be ata fixed distance along a line at 25 DD from the central ODcoordinate Therefore after locating the OD the macula regioncan be determined by exploring the region in the vicinity ofthe image center as determined by the OD center
We implemented the four macula detection algorithmswhich follow the diagram presented in Figure 2 and evaluatedtheir results using proposed methodology
Similarly these algorithms perform a local search guidedby the position of the fovea center and length of the radiusof the OD Differently the algorithms identify the target using
(a) Original Image (b) OD detection (c) Determining theROI
(d) ROI detection result (e) Macula center iden-tification
(f) Result of macula de-tection
Fig 3 Macula detection pipeline image transformation from original imageto identified macular area
distinct strategies explained as follows Figure 3 depicts thegeneral approach for macula detection
A Method of Liu et al
Liu et al [8] used the Hough transform to develop amethodology capable of identifying the OD and fovea
The fovea is determined by its spatial relationship withthe OD The algorithm searches for the darkest area in redchannel about half the size of the disk and two disk diameters(DD) away from the disk center The fovea center is definedas the centroid of such an area Figure 4(a) shows an exampleof the algorithm proposed by Liu et al for ROI detection
According to the authors tests were conducted on a par-ticular data set of 20 images collected at the Singapore TanTock Seng Hospital and the experimental results showed thattwo retinal images failed to be properly identified due to theblurred optic disk
B Method of Sagar et al
Sagar et al [11] developed a system for automatic detectionof the OD blood vessels (BV) and macula in the eye retinalfundus images The Sagar et al method for ROI detectionencompasses a geometric pattern based on eye anatomy TheROI contains only those pixels in the image whose radialdistance from the center of OD are greater than 15 DD andless than 35 DD
The result of BV detection is used to eliminate vessel pixelsin the region of interest Then the darkest 1 pixels aredetermined in the ROI These pixels are clustered togetherand the largest cluster is marked as belonging to the macula[11] Figure 4(b) shows the ROI portion of a sample imagePixels which do not belong to the ROI are marked white
These authors performed macula detection applying theiralgorithm to 100 images including 20 images from the DRIVE[14] database and 20 images from STARE [15] database Theauthors reported a success rate of 96
C Method of Tan et al
Tan et al introduced in [16] an automatic method for maculadetection in the retinal fundus image They adopted that theheight of the ROI is 15 DD with the center of the OD as thecenterThis strategy reduces the possibility of detecting bloodvessels which are darker than the macula in the gray imageThe length of this ROI would be 3 DD
Since the macula is approximately 25 DD away informa-tion near the OD would not be useful Thus only pixels withinthe ROI that are at a distance of more than 15 DD from theOD center are considered Figure 4(c) shows an example ofthe ROI detection algorithm proposed by Tan et al
For macula detection they find regions with lower inten-sities inside the grayscale ROI Regions of dark spots aredetected first by finding the coordinates with the lowest pixelintensity and finally by determining the average pixel neigh-borhood intensities These regions are ranked to determine theregion containing the macula
Originally Tan et al used 162 retina images that werecollected at the Singapore Eye Research Institute The testsresulted in a success rate of 988
D Method of Sekhar et al
Sekhar et al in [12] proposed an approach to automaticallylocate blood vessels OD and macula by exploiting spatialand geometric relations that rule their distribution within thefundus image
The candidate macula ROI is defined as the portion of asector subtended at the center of the optic disk by an angleof 30o above and below the line between this center and theretinal image disk center The radius of the inner arc for thisROI is 15 DD Figure 4(d) illustrates an example of a ROIportion detected by this algorithm
The macula is identified within this ROI by iterativelyapplying a threshold and then a morphological opening Oncethe macula region is identified the fovea is simply determinedas the centroid of this blob
Sekhar et al conduced tests on the DRIVE [14] STARE[15] and ARIA [2] databases The authors applied only 34 outof 40 images from DRIVE to the algorithm Regarding theSTARE database there were used 58 out of 89 images fromARIA 45 out of 116 images The reported results exhibit a100 success rate for tests with images from DRIVE andSTARE databases while ARIA accomplished 84 Whenapplying the proposed algorithm to images from ARIA theauthors stated that if the distance between the location markedas fovea in the ground-truth images and the outcomes of themethod is within 025 DD then the detection is marked as asuccessful detection [12]
III EXPERIMENTS
A Image Database
To perform the evaluation of the algorithms we haveselected three public retinal image databases DRIVE [14]ARIA [2] and MESSIDOR [9]
DD
2DD
2DD
2DDROI
(a)
15DDDD
2DD
(b)
15DD
3DD
ROI
15DD
(c)
15DD
DD
2DD
ROI
(d)
Fig 4 Example of a ROI detected by the evaluated algorithms
The DRIVE [14] database enables comparative studies onsegmentation of retinal blood vessels in retinal fundus imagesIt contains 40 fundus images from subjects with diabetesboth with and without retinopathy as well as retinal vesselsegmentations performed by two human observers The imageswere digitally captured using a Canon CR5 (nonmydriatic3CCD camera) at 45 field of view (FOV) All of them withdimensions 768times584 pixels eight bits per color channel andhave a FOV of approximately 540 pixels in diameter Thedatabase is available in the compressed JPEG format In thispaper we have excluded 5 images which do not presentvisually detectable fovea
All images from ARIA [2] database were collected by mem-bers of St Paulrsquos Eye Unit and the University of Liverpoolas part of the ARIA project including adults only All fundusimages were taken using a Zeiss FF450+ fundus camera at a 50degree field width and all images are in color and originallystored as uncompressed TIFF files In total 116 images ofARIA database were used for testing 61 images of healthypatients and 55 images of diabetic patients who have somekind of pathology in their retinas The outlined contour of theOD ground-truth images are used to obtain the OD diameterand center coordinates
MESSIDOR [9] database has a total of 1200 images Theywere acquired by 3 ophthalmologic departments using a colorvideo 3CCD camera on a Topcon TRC NW6 non-mydriaticretinograph with a 45 degree field of view The images present8 bits per color plane at 1440times960 2240times1488 or 2304times1536pixels Two medical experts provided independent diagnosesfor each image including information about retinopathy gradeand risk of macular edema We randomly selected a subsetof 103 images of MESSIDOR database Among the selectedimages 38 are healthy while 65 are pathological retinas
Although there are other public retina image databases(STARE and DIARETDB1 for example) only these afore-mentioned sets provide the ground truth images Figure 5
Fig 5 Retinal Image of ARIA Database and the correspondent ground-truthImage
shows an image of ARIA databaseAmong the several challenges in processing retina images
for computer aided diagnosis one of them regards to the abilityto perform on different image databases Thus we accomplishand assess the robustness of the proposed methodology onthree different databases Additionally our approach worksboth in the presence and absence of pathology (see Figure6) and hence it is possible to infer whether the presence ofartifacts affects or not the performance of the macula detectionalgorithm under test
Fig 6 Retina image samples (a) a healthy one and (b) another with presenceof pathological features
B Methodology for Performance Evaluation
It is necessary to establish standard metrics to evaluate theperformance of macula detection algorithms and use differentimage datasets to evaluate their performance Building uponthe work of [8] [11] [16] [12] we perform accuracyevaluation of these algorithms using the same set of rulesand we compare their performance using three databases thatprovides ground-truth
Despite the macula being a region of the retina withpeculiar features to the human eye it lacks well-defined edges(differently from OD) Hence a good metric should take intoaccount the distance between the actual macula center andthe point predicted by the algorithm In this paper we haveproposed a criterion to evaluate computational methods formacula detection combining approaches discussed in [17][12] and anatomical characteristics of human retina
Tobin et al defined in [17] a criterion for macula localiza-tion considering the distance 1DD to the estimated coordinatefrom a coordinate that was manually selected to reside at thevisual center of the macula This distance was selected basedon the fact that the macula is typically 2 to 3 times the diameterof the OD In physical terms the OD is approximately 15 mmin diameter whereas the macula extends to approximately a
3-4 mm diameter with a fovea distance of 3 mm from theOD
In [12] Sekhar et al proposed a metric to evaluate foveadetection algorithms According to this metric if the distancebetween the location marked as fovea in the ground-truthimages and the outcomes of the method is within 025 DDthen the detection is marked as a successful detection [12]
In this paper we evaluate the results using two steps deter-mining the ROI and calculating the center of the macula wedefine three statuses to the macula detection results successsatisfactory and failure
For the ROI we consider1) Success when both fovea and macula region are entirely
within the ROI2) Satisfactory when only fovea region are entirely within
the ROI3) Failure when none of the above metric is satisfiedFor the coordinates of the center of macula we consider1) Success If the distance between the location marked as
fovea in the ground-truth images and the outcomes ofthe method is within 025 DD
2) Satisfactory If the distance between the location markedas fovea in the ground-truth images and the outcomesof the method is from 025 and 10 DD
3) Failure If the distance between the location marked asfovea in the ground-truth images and the outcomes ofthe method is higher than 1 DD
Figure 7 depicts a sample image of ARIA database and theresults of all implemented methods for macula detection
x
xx xx
Fig 7 Fundus image with ground-truth fovea position (in black) and resultof macula detection by the four methods (a) Liursquos et al (satisfactory) resultin blue (b) Sagarrsquos et al (satisfactory) results in white (c) Tanrsquos et al method(success) in yellow and (d) Sekharrsquos et al method (failure) in green
The classification of macula detection results in three classesis of paramount importance for macular edema grading sys-tems In the proposed methodology algorithms with highsuccess rates ensure high accuracy in the diagnosis of macularedema separating these cases from those with satisfactorydetection which should probably undergo supervision andapproval of a medical specialist
C Experimental Results
The outlined contour of the OD ground-truth images wereused to obtain the coordinates of the center and the diameter of
the OD With these data the ROIs proposed by each evaluatedmethod were determined Since the determination of theseROIs is not affected by the presence or absence of pathologiesTable I presents the evaluation for all images
TABLE IEFFECTIVENESS OF ROI DETECTION
Success Satisfactory Failure
DRIVE
Liu et al 9143 571 286Sagar et al 6857 2571 572Tan et al 4857 4857 286
Sekhar et al 6857 2571 572
ARIA
Liu et al 8879 948 172Sagar et al 8621 1121 258Tan et al 7500 2241 259
Sekhar et al 8621 1121 259
MESSIDOR
Liu et al 8932 1068 000Sagar et al 9903 097 000Tan et al 9612 388 000
Sekhar et al 9903 097 000
According to Table I the algorithm proposed by Liu et alpresented the lowest failure rates in the three sets of tests(286 172 and 000) Particularly the method reachedthe highest success rates on the DRIVE and ARIA im-ages databases (9143 and 8879) respectively This goodperformance is mainly due to considering the largest ROIsize among other methods which increases the success rateHowever a very large ROI may include several artifacts thatinterfere in macula center detection
In DRIVE and ARIA databases the worst results wereobtained by Tan et al (4857 and 7500) while in MES-SIDOR database the worst result was obtained by Liu et al(8932) If we consider only the cases of failure as poorresults Sagar et al and Sekhar et al performed similarly inall tests
Table II shows the overall evaluation results of the maculadetection algorithms on three image databases
Regarding the DRIVE database the method proposed byLiu et al accomplished the best results with the highestsuccess (6286) and lower failure rates (2571) Tan et almethod achieved the best rates for ARIA and MESSIDORdatabases with the highest success rates around 6034 and8835 respectively The lowest failure rates were respec-tively 2155 and 097
Although images from the DRIVE database may includepathological lesions this information is not specified in thesupplied dataset On the other hand the ARIA and theMESSIDOR databases contain information about the status ofretinal images healthy or pathological In this paper we usethis information to identify methods that are most sensitive tothe presence of pathologies Therefore Table III presents theevaluation results for healthy images while Table IV showsthe results for pathological ones
TABLE IIEFFECTIVENESS OF THE ALGORITHMS IN DETECTING THE MACULA
CENTER
Success Satisfactory Failure
DRIVE
Liu et al 6286 1143 2571Sagar et al 6000 571 3429Tan et al 1714 4286 4000
Sekhar et al 3714 3143 3143
ARIA
Liu et al 4310 948 4741Sagar et al 4397 1379 4397Tan et al 6034 1810 2155
Sekhar et al 1810 4828 3362
MESSIDOR
Liu et al 6893 388 2718Sagar et al 7767 971 1262Tan et al 8835 1068 097
Sekhar et al 3981 4466 1553
TABLE IIIEFFECTIVENESS IN DETECTING THE MACULA CENTER IN HEALTHY
IMAGES
Success Satisfactory Failure
ARIA
Liu et al 4918 656 4426Sagar et al 4918 1803 3279Tan et al 7377 1475 1148
Sekhar et al 2459 5082 2459
MESSIDOR
Liu et al 8421 263 1316Sagar et al 8158 526 1316Tan et al 9211 526 263
Sekhar et al 3947 5000 1053
Tables III and IV indicate that Tan et al method achievedthe best results in both tables with the highest success (7377and 9211) and the lowest failure rates (1148 and 263) Inthe case of using the healthy ARIA image subset the methodof Sekhar et al obtained a failure rate of only 2459
The method introduced by Tan et al underperformed dueto its search strategy It searches for the darkest regions withinthe ROI while the others search for isolated dark spots Thusif there is a very dark pixel outside the macula region thesemethods may detect it as the macula center making the methodmore susceptible to errors Although performing well in thehealthy image subset the method of Sekhar et al requiresmany parameters to be accurate It applies a thresholdinga morphological opening and for each image the thresholdvalue and structuring element can be different a drawbackwhen aiming at an automated process According to [3] thelarge number of parameters to be adjusted is a weak point inalgorithms for computer aided diagnosis
In the subset of healthy images the worst results wereobtained by the Liu et al method with the highest failure rates(4426 and 1316) For pathological images Sagar et al
TABLE IVEFFECTIVENESS IN DETECTING THE MACULA CENTER IN PATHOLOGICAL
IMAGES
Success Satisfactory Failure
ARIA
Liu et al 3636 1273 5091Sagar et al 3818 909 5636Tan et al 4545 2182 3273
Sekhar et al 1091 4545 4364
MESSIDOR
Liu et al 6000 462 3538Sagar et al 7538 1231 1231Tan et al 8615 1385 000
Sekhar et al 4000 4154 1846
method presented 5636 failure rate for the ARIA databaseand Liu et al with 3538 failure rate for the MESSIDORdatabase obtained the worst result Liursquos et al method is thesimplest among all and has fewer parameters to be tunedHowever the search for the darker regions in the red channelis less efficient This occurred because many vessel pixelspresent similar color intensities to the macula pixels in thisred channel The strategy of removing the blood vessels bySagar et al is a strong advantage Nevertheless the strategy ofchoosing the darkest 1 pixels in the ROI presents drawbacksCommonly in low contrast or pathological images there aredark pixels outside the macula
IV CONCLUDING REMARKS
In this paper we have introduced a set of rules to eval-uate the performance of macula detection algorithms usingavailable public datasets that contain ground-truth informa-tion Furthermore we have conducted experiments to evaluatethe performance of four methods on three different imagedatabases simultaneously
The importance of macula detection algorithms is that theycan provide inputs for automatic screening systems for DRdiagnosis ie macula localization on fundus image Usuallyautomatic macular edema grading systems require macula cen-ter detection in both healthy and pathological retina images Inthe former the retina background is generally homogeneousin the later the presence of artifacts impairs the search for thecenter of the macula
We implemented the four different macula detection al-gorithms and addressed the difference between them whenconsidering normal and abnormal cases and introduced anovel assessment measure that classifies the results in successsatisfactory and failure rates According to this methodologywhen an algorithm has a high success rate and there are exu-dates very close to the macula center ie fovea an automaticsystem could use this information to warn the presence ofretinopathy It will also separate those cases that were onlysatisfactory which may require supervision and approval ofa specialist A great advantage of the proposed evaluationscheme is to include public datasets to compare methods
for macular edema grading systems In addition our gradingscheme may aid screening and regular monitoring and webelieve it can help ophthalmologists to identify patients withmacular diseases
Further research will include robust methods that detect themacula center in both healthy and pathological images withthe aim of devising more precise macular grading systems Wealso intend to combine information about other structures formore sophisticated diagnostic outputs
REFERENCES
[1] R Bernardes P Serranho and C Lobo Digital ocular fundus imagingA review Ophthalmologica 4(226)161ndash181 2011 1
[2] F Damian Aria online retinal image archive httpwwweyecharitycomaria online November 2006 3
[3] C Duanggatea B Uyyanonvaraa S S Makhanova S Barmanb andT Williamsonc Parameter-free optic disc detection Comp Med ImagGrap 3551ndash63 2011 5
[4] O Faust R Acharya E Y K Ng K H Ng and J Suri Algorithmsfor the automated detection of diabetic retinopathy using digital fundusimages A review J Med Syst 36145ndash157 2012 1 2
[5] L Gagnon M Lalonde M Beaulieu and M-C Boucher Procedure todetect anatomical structures in optical fundus images In Proceedingsof Conference Medical Imaging - SPIE pages 1218ndash1225 San DiegoFebruary 2001 2
[6] L Giancardo F Meriaudeau T Karnowski Y Li S Garg K Tobin andE Chaum Exudate-based diabetic macular edema detection in fundusimages using publicly available datasets Med Image Anal 16216ndash2262012 1
[7] H Li and O Chutatape Automated feature extraction in color retinalimages by a model based approach IEEE Transactions on MedicalImaging 51(2)246ndash254 February 2004 2
[8] Z Liu C Opas and S Krishnan Automatic image analysis of fundusphotograph In EMBS volume 2 pages 524ndash525 1997 2 4
[9] Messidor Methods to evaluate segmentation and indexing techniques inthe field of retinal ophthalmology httpwwwmessidorcrihanfr March2008 3
[10] K Noronha and K P Nayak Fundus image analysis for the detectionof diabetic eye diseases - a review In International Conference onBiomedical Engineering (ICoBE) pages 242ndash246 Penang February2012 2
[11] A Sagar S Balasubramanian and V Chandrasekaran Automaticdetection of anatomical structures in digital fundus retinal images InIAPR - MVA pages 483ndash486 2007 2 4
[12] S Sekhar F El-Samie P Yu W Al-Nuaimy and A Nandi Automatedlocalisation retinal features Apllied Optics 50(19)3064 ndash 3075 20113 4
[13] C Sinthanayothin J F Boyce H L Cook and T H WilliamsonAutomatic localisation of the optic disc fovea and retinal blood vesselsfrom digital colour fundus images British Journal of Ophthalmology83(8)902ndash910 1999 2
[14] J Staal M Abramoff M Niemeijer M Viergever and B GinnekenRidge-based vessel segmentation in color images of the retina IEEETrans Med Imaging 23(4)501ndash509 2004 2 3
[15] Stare Structured analysis of the retina httpwwwcesclemsonedusimahooverstare November 2000 2 3
[16] N Tan D Wong J Liu W Ng Z Zhang J Lim Z Tan Y TangH Li S Lu and T Wong Automatic detection of the macula in theretinal fundus image by detecting regions with low pixel intensity InICBPE pages 1ndash5 2009 3 4
[17] K Tobin E Chaum V P Govindasamy and T Karnowski Detection ofanatomic structures in human retinal imagery IEEE Trans Med Imaging26(12)1729ndash1739 2007 2 4
[18] R Winder P Morrow I McRitchie J Bailie and P Hart Algorithmsfor digital image processing in diabetic retinopathy Comp Med ImagGrap 33(8)608ndash622 2009 2
[19] F Zana I Meunier and J C Klein A region merging algorithmusing mathematical morphology application to macula detection InInternational Symposium on Mathematical Morphology pages 423ndash4301998 2
Original Image
Optic Disk Detection
Determining the ROI
Determining the Macula Center
Result Evaluation
Fig 2 The general methodology for macula detection
ally even when using the same evaluation measures specificimplementations of the performance metrics may influence thefinal results [4] In this paper we introduce a set of rulesto evaluate the performance of macula detection algorithmsaiming at improving comparison among techniques
This paper is structured as follows Section II describes theevaluated algorithms Section III presents the image databaseand the assessment methodology applied to four algorithmscomparing their accuracy for macula detection In Section IVwe discuss our findings and summarize our future work
II MACULA DETECTION METHODS
There is a large number of methods for macula segmen-tation nevertheless the available literature lacks evaluationof different algorithms on a common database of screeningimages for accuracy comparisons
Zana et al [19] used mathematical morphology and pro-posed an algorithm based on region merging to localizethe fovea Sinthanayothin et al [13] employed a templatematching technique The macula is determined by correlationmatching together with the characteristic of the fovea that isthe darkest area in the vicinity of the optic disk (OD) Maculais detected in [5] by locating the darkest pixel in the coarseresolution image following by a geometric criteria based oneyes anatomy In [17] Tobin et al estimated the position ofthe fovea by extracting the points on the main blood vesselsand fitting a parabola curve with the OD as the center Thenthe fovea is located at two and a half disk diameters (DDs)from the OD on the main axis of this parabola
In [18] Winder et al claimed that a macula global searchoften fails The relatively constant distance between the ODand the macula center can be used as a priori information tolocate the macula [10] In [7] the fovea is assumed to be ata fixed distance along a line at 25 DD from the central ODcoordinate Therefore after locating the OD the macula regioncan be determined by exploring the region in the vicinity ofthe image center as determined by the OD center
We implemented the four macula detection algorithmswhich follow the diagram presented in Figure 2 and evaluatedtheir results using proposed methodology
Similarly these algorithms perform a local search guidedby the position of the fovea center and length of the radiusof the OD Differently the algorithms identify the target using
(a) Original Image (b) OD detection (c) Determining theROI
(d) ROI detection result (e) Macula center iden-tification
(f) Result of macula de-tection
Fig 3 Macula detection pipeline image transformation from original imageto identified macular area
distinct strategies explained as follows Figure 3 depicts thegeneral approach for macula detection
A Method of Liu et al
Liu et al [8] used the Hough transform to develop amethodology capable of identifying the OD and fovea
The fovea is determined by its spatial relationship withthe OD The algorithm searches for the darkest area in redchannel about half the size of the disk and two disk diameters(DD) away from the disk center The fovea center is definedas the centroid of such an area Figure 4(a) shows an exampleof the algorithm proposed by Liu et al for ROI detection
According to the authors tests were conducted on a par-ticular data set of 20 images collected at the Singapore TanTock Seng Hospital and the experimental results showed thattwo retinal images failed to be properly identified due to theblurred optic disk
B Method of Sagar et al
Sagar et al [11] developed a system for automatic detectionof the OD blood vessels (BV) and macula in the eye retinalfundus images The Sagar et al method for ROI detectionencompasses a geometric pattern based on eye anatomy TheROI contains only those pixels in the image whose radialdistance from the center of OD are greater than 15 DD andless than 35 DD
The result of BV detection is used to eliminate vessel pixelsin the region of interest Then the darkest 1 pixels aredetermined in the ROI These pixels are clustered togetherand the largest cluster is marked as belonging to the macula[11] Figure 4(b) shows the ROI portion of a sample imagePixels which do not belong to the ROI are marked white
These authors performed macula detection applying theiralgorithm to 100 images including 20 images from the DRIVE[14] database and 20 images from STARE [15] database Theauthors reported a success rate of 96
C Method of Tan et al
Tan et al introduced in [16] an automatic method for maculadetection in the retinal fundus image They adopted that theheight of the ROI is 15 DD with the center of the OD as thecenterThis strategy reduces the possibility of detecting bloodvessels which are darker than the macula in the gray imageThe length of this ROI would be 3 DD
Since the macula is approximately 25 DD away informa-tion near the OD would not be useful Thus only pixels withinthe ROI that are at a distance of more than 15 DD from theOD center are considered Figure 4(c) shows an example ofthe ROI detection algorithm proposed by Tan et al
For macula detection they find regions with lower inten-sities inside the grayscale ROI Regions of dark spots aredetected first by finding the coordinates with the lowest pixelintensity and finally by determining the average pixel neigh-borhood intensities These regions are ranked to determine theregion containing the macula
Originally Tan et al used 162 retina images that werecollected at the Singapore Eye Research Institute The testsresulted in a success rate of 988
D Method of Sekhar et al
Sekhar et al in [12] proposed an approach to automaticallylocate blood vessels OD and macula by exploiting spatialand geometric relations that rule their distribution within thefundus image
The candidate macula ROI is defined as the portion of asector subtended at the center of the optic disk by an angleof 30o above and below the line between this center and theretinal image disk center The radius of the inner arc for thisROI is 15 DD Figure 4(d) illustrates an example of a ROIportion detected by this algorithm
The macula is identified within this ROI by iterativelyapplying a threshold and then a morphological opening Oncethe macula region is identified the fovea is simply determinedas the centroid of this blob
Sekhar et al conduced tests on the DRIVE [14] STARE[15] and ARIA [2] databases The authors applied only 34 outof 40 images from DRIVE to the algorithm Regarding theSTARE database there were used 58 out of 89 images fromARIA 45 out of 116 images The reported results exhibit a100 success rate for tests with images from DRIVE andSTARE databases while ARIA accomplished 84 Whenapplying the proposed algorithm to images from ARIA theauthors stated that if the distance between the location markedas fovea in the ground-truth images and the outcomes of themethod is within 025 DD then the detection is marked as asuccessful detection [12]
III EXPERIMENTS
A Image Database
To perform the evaluation of the algorithms we haveselected three public retinal image databases DRIVE [14]ARIA [2] and MESSIDOR [9]
DD
2DD
2DD
2DDROI
(a)
15DDDD
2DD
(b)
15DD
3DD
ROI
15DD
(c)
15DD
DD
2DD
ROI
(d)
Fig 4 Example of a ROI detected by the evaluated algorithms
The DRIVE [14] database enables comparative studies onsegmentation of retinal blood vessels in retinal fundus imagesIt contains 40 fundus images from subjects with diabetesboth with and without retinopathy as well as retinal vesselsegmentations performed by two human observers The imageswere digitally captured using a Canon CR5 (nonmydriatic3CCD camera) at 45 field of view (FOV) All of them withdimensions 768times584 pixels eight bits per color channel andhave a FOV of approximately 540 pixels in diameter Thedatabase is available in the compressed JPEG format In thispaper we have excluded 5 images which do not presentvisually detectable fovea
All images from ARIA [2] database were collected by mem-bers of St Paulrsquos Eye Unit and the University of Liverpoolas part of the ARIA project including adults only All fundusimages were taken using a Zeiss FF450+ fundus camera at a 50degree field width and all images are in color and originallystored as uncompressed TIFF files In total 116 images ofARIA database were used for testing 61 images of healthypatients and 55 images of diabetic patients who have somekind of pathology in their retinas The outlined contour of theOD ground-truth images are used to obtain the OD diameterand center coordinates
MESSIDOR [9] database has a total of 1200 images Theywere acquired by 3 ophthalmologic departments using a colorvideo 3CCD camera on a Topcon TRC NW6 non-mydriaticretinograph with a 45 degree field of view The images present8 bits per color plane at 1440times960 2240times1488 or 2304times1536pixels Two medical experts provided independent diagnosesfor each image including information about retinopathy gradeand risk of macular edema We randomly selected a subsetof 103 images of MESSIDOR database Among the selectedimages 38 are healthy while 65 are pathological retinas
Although there are other public retina image databases(STARE and DIARETDB1 for example) only these afore-mentioned sets provide the ground truth images Figure 5
Fig 5 Retinal Image of ARIA Database and the correspondent ground-truthImage
shows an image of ARIA databaseAmong the several challenges in processing retina images
for computer aided diagnosis one of them regards to the abilityto perform on different image databases Thus we accomplishand assess the robustness of the proposed methodology onthree different databases Additionally our approach worksboth in the presence and absence of pathology (see Figure6) and hence it is possible to infer whether the presence ofartifacts affects or not the performance of the macula detectionalgorithm under test
Fig 6 Retina image samples (a) a healthy one and (b) another with presenceof pathological features
B Methodology for Performance Evaluation
It is necessary to establish standard metrics to evaluate theperformance of macula detection algorithms and use differentimage datasets to evaluate their performance Building uponthe work of [8] [11] [16] [12] we perform accuracyevaluation of these algorithms using the same set of rulesand we compare their performance using three databases thatprovides ground-truth
Despite the macula being a region of the retina withpeculiar features to the human eye it lacks well-defined edges(differently from OD) Hence a good metric should take intoaccount the distance between the actual macula center andthe point predicted by the algorithm In this paper we haveproposed a criterion to evaluate computational methods formacula detection combining approaches discussed in [17][12] and anatomical characteristics of human retina
Tobin et al defined in [17] a criterion for macula localiza-tion considering the distance 1DD to the estimated coordinatefrom a coordinate that was manually selected to reside at thevisual center of the macula This distance was selected basedon the fact that the macula is typically 2 to 3 times the diameterof the OD In physical terms the OD is approximately 15 mmin diameter whereas the macula extends to approximately a
3-4 mm diameter with a fovea distance of 3 mm from theOD
In [12] Sekhar et al proposed a metric to evaluate foveadetection algorithms According to this metric if the distancebetween the location marked as fovea in the ground-truthimages and the outcomes of the method is within 025 DDthen the detection is marked as a successful detection [12]
In this paper we evaluate the results using two steps deter-mining the ROI and calculating the center of the macula wedefine three statuses to the macula detection results successsatisfactory and failure
For the ROI we consider1) Success when both fovea and macula region are entirely
within the ROI2) Satisfactory when only fovea region are entirely within
the ROI3) Failure when none of the above metric is satisfiedFor the coordinates of the center of macula we consider1) Success If the distance between the location marked as
fovea in the ground-truth images and the outcomes ofthe method is within 025 DD
2) Satisfactory If the distance between the location markedas fovea in the ground-truth images and the outcomesof the method is from 025 and 10 DD
3) Failure If the distance between the location marked asfovea in the ground-truth images and the outcomes ofthe method is higher than 1 DD
Figure 7 depicts a sample image of ARIA database and theresults of all implemented methods for macula detection
x
xx xx
Fig 7 Fundus image with ground-truth fovea position (in black) and resultof macula detection by the four methods (a) Liursquos et al (satisfactory) resultin blue (b) Sagarrsquos et al (satisfactory) results in white (c) Tanrsquos et al method(success) in yellow and (d) Sekharrsquos et al method (failure) in green
The classification of macula detection results in three classesis of paramount importance for macular edema grading sys-tems In the proposed methodology algorithms with highsuccess rates ensure high accuracy in the diagnosis of macularedema separating these cases from those with satisfactorydetection which should probably undergo supervision andapproval of a medical specialist
C Experimental Results
The outlined contour of the OD ground-truth images wereused to obtain the coordinates of the center and the diameter of
the OD With these data the ROIs proposed by each evaluatedmethod were determined Since the determination of theseROIs is not affected by the presence or absence of pathologiesTable I presents the evaluation for all images
TABLE IEFFECTIVENESS OF ROI DETECTION
Success Satisfactory Failure
DRIVE
Liu et al 9143 571 286Sagar et al 6857 2571 572Tan et al 4857 4857 286
Sekhar et al 6857 2571 572
ARIA
Liu et al 8879 948 172Sagar et al 8621 1121 258Tan et al 7500 2241 259
Sekhar et al 8621 1121 259
MESSIDOR
Liu et al 8932 1068 000Sagar et al 9903 097 000Tan et al 9612 388 000
Sekhar et al 9903 097 000
According to Table I the algorithm proposed by Liu et alpresented the lowest failure rates in the three sets of tests(286 172 and 000) Particularly the method reachedthe highest success rates on the DRIVE and ARIA im-ages databases (9143 and 8879) respectively This goodperformance is mainly due to considering the largest ROIsize among other methods which increases the success rateHowever a very large ROI may include several artifacts thatinterfere in macula center detection
In DRIVE and ARIA databases the worst results wereobtained by Tan et al (4857 and 7500) while in MES-SIDOR database the worst result was obtained by Liu et al(8932) If we consider only the cases of failure as poorresults Sagar et al and Sekhar et al performed similarly inall tests
Table II shows the overall evaluation results of the maculadetection algorithms on three image databases
Regarding the DRIVE database the method proposed byLiu et al accomplished the best results with the highestsuccess (6286) and lower failure rates (2571) Tan et almethod achieved the best rates for ARIA and MESSIDORdatabases with the highest success rates around 6034 and8835 respectively The lowest failure rates were respec-tively 2155 and 097
Although images from the DRIVE database may includepathological lesions this information is not specified in thesupplied dataset On the other hand the ARIA and theMESSIDOR databases contain information about the status ofretinal images healthy or pathological In this paper we usethis information to identify methods that are most sensitive tothe presence of pathologies Therefore Table III presents theevaluation results for healthy images while Table IV showsthe results for pathological ones
TABLE IIEFFECTIVENESS OF THE ALGORITHMS IN DETECTING THE MACULA
CENTER
Success Satisfactory Failure
DRIVE
Liu et al 6286 1143 2571Sagar et al 6000 571 3429Tan et al 1714 4286 4000
Sekhar et al 3714 3143 3143
ARIA
Liu et al 4310 948 4741Sagar et al 4397 1379 4397Tan et al 6034 1810 2155
Sekhar et al 1810 4828 3362
MESSIDOR
Liu et al 6893 388 2718Sagar et al 7767 971 1262Tan et al 8835 1068 097
Sekhar et al 3981 4466 1553
TABLE IIIEFFECTIVENESS IN DETECTING THE MACULA CENTER IN HEALTHY
IMAGES
Success Satisfactory Failure
ARIA
Liu et al 4918 656 4426Sagar et al 4918 1803 3279Tan et al 7377 1475 1148
Sekhar et al 2459 5082 2459
MESSIDOR
Liu et al 8421 263 1316Sagar et al 8158 526 1316Tan et al 9211 526 263
Sekhar et al 3947 5000 1053
Tables III and IV indicate that Tan et al method achievedthe best results in both tables with the highest success (7377and 9211) and the lowest failure rates (1148 and 263) Inthe case of using the healthy ARIA image subset the methodof Sekhar et al obtained a failure rate of only 2459
The method introduced by Tan et al underperformed dueto its search strategy It searches for the darkest regions withinthe ROI while the others search for isolated dark spots Thusif there is a very dark pixel outside the macula region thesemethods may detect it as the macula center making the methodmore susceptible to errors Although performing well in thehealthy image subset the method of Sekhar et al requiresmany parameters to be accurate It applies a thresholdinga morphological opening and for each image the thresholdvalue and structuring element can be different a drawbackwhen aiming at an automated process According to [3] thelarge number of parameters to be adjusted is a weak point inalgorithms for computer aided diagnosis
In the subset of healthy images the worst results wereobtained by the Liu et al method with the highest failure rates(4426 and 1316) For pathological images Sagar et al
TABLE IVEFFECTIVENESS IN DETECTING THE MACULA CENTER IN PATHOLOGICAL
IMAGES
Success Satisfactory Failure
ARIA
Liu et al 3636 1273 5091Sagar et al 3818 909 5636Tan et al 4545 2182 3273
Sekhar et al 1091 4545 4364
MESSIDOR
Liu et al 6000 462 3538Sagar et al 7538 1231 1231Tan et al 8615 1385 000
Sekhar et al 4000 4154 1846
method presented 5636 failure rate for the ARIA databaseand Liu et al with 3538 failure rate for the MESSIDORdatabase obtained the worst result Liursquos et al method is thesimplest among all and has fewer parameters to be tunedHowever the search for the darker regions in the red channelis less efficient This occurred because many vessel pixelspresent similar color intensities to the macula pixels in thisred channel The strategy of removing the blood vessels bySagar et al is a strong advantage Nevertheless the strategy ofchoosing the darkest 1 pixels in the ROI presents drawbacksCommonly in low contrast or pathological images there aredark pixels outside the macula
IV CONCLUDING REMARKS
In this paper we have introduced a set of rules to eval-uate the performance of macula detection algorithms usingavailable public datasets that contain ground-truth informa-tion Furthermore we have conducted experiments to evaluatethe performance of four methods on three different imagedatabases simultaneously
The importance of macula detection algorithms is that theycan provide inputs for automatic screening systems for DRdiagnosis ie macula localization on fundus image Usuallyautomatic macular edema grading systems require macula cen-ter detection in both healthy and pathological retina images Inthe former the retina background is generally homogeneousin the later the presence of artifacts impairs the search for thecenter of the macula
We implemented the four different macula detection al-gorithms and addressed the difference between them whenconsidering normal and abnormal cases and introduced anovel assessment measure that classifies the results in successsatisfactory and failure rates According to this methodologywhen an algorithm has a high success rate and there are exu-dates very close to the macula center ie fovea an automaticsystem could use this information to warn the presence ofretinopathy It will also separate those cases that were onlysatisfactory which may require supervision and approval ofa specialist A great advantage of the proposed evaluationscheme is to include public datasets to compare methods
for macular edema grading systems In addition our gradingscheme may aid screening and regular monitoring and webelieve it can help ophthalmologists to identify patients withmacular diseases
Further research will include robust methods that detect themacula center in both healthy and pathological images withthe aim of devising more precise macular grading systems Wealso intend to combine information about other structures formore sophisticated diagnostic outputs
REFERENCES
[1] R Bernardes P Serranho and C Lobo Digital ocular fundus imagingA review Ophthalmologica 4(226)161ndash181 2011 1
[2] F Damian Aria online retinal image archive httpwwweyecharitycomaria online November 2006 3
[3] C Duanggatea B Uyyanonvaraa S S Makhanova S Barmanb andT Williamsonc Parameter-free optic disc detection Comp Med ImagGrap 3551ndash63 2011 5
[4] O Faust R Acharya E Y K Ng K H Ng and J Suri Algorithmsfor the automated detection of diabetic retinopathy using digital fundusimages A review J Med Syst 36145ndash157 2012 1 2
[5] L Gagnon M Lalonde M Beaulieu and M-C Boucher Procedure todetect anatomical structures in optical fundus images In Proceedingsof Conference Medical Imaging - SPIE pages 1218ndash1225 San DiegoFebruary 2001 2
[6] L Giancardo F Meriaudeau T Karnowski Y Li S Garg K Tobin andE Chaum Exudate-based diabetic macular edema detection in fundusimages using publicly available datasets Med Image Anal 16216ndash2262012 1
[7] H Li and O Chutatape Automated feature extraction in color retinalimages by a model based approach IEEE Transactions on MedicalImaging 51(2)246ndash254 February 2004 2
[8] Z Liu C Opas and S Krishnan Automatic image analysis of fundusphotograph In EMBS volume 2 pages 524ndash525 1997 2 4
[9] Messidor Methods to evaluate segmentation and indexing techniques inthe field of retinal ophthalmology httpwwwmessidorcrihanfr March2008 3
[10] K Noronha and K P Nayak Fundus image analysis for the detectionof diabetic eye diseases - a review In International Conference onBiomedical Engineering (ICoBE) pages 242ndash246 Penang February2012 2
[11] A Sagar S Balasubramanian and V Chandrasekaran Automaticdetection of anatomical structures in digital fundus retinal images InIAPR - MVA pages 483ndash486 2007 2 4
[12] S Sekhar F El-Samie P Yu W Al-Nuaimy and A Nandi Automatedlocalisation retinal features Apllied Optics 50(19)3064 ndash 3075 20113 4
[13] C Sinthanayothin J F Boyce H L Cook and T H WilliamsonAutomatic localisation of the optic disc fovea and retinal blood vesselsfrom digital colour fundus images British Journal of Ophthalmology83(8)902ndash910 1999 2
[14] J Staal M Abramoff M Niemeijer M Viergever and B GinnekenRidge-based vessel segmentation in color images of the retina IEEETrans Med Imaging 23(4)501ndash509 2004 2 3
[15] Stare Structured analysis of the retina httpwwwcesclemsonedusimahooverstare November 2000 2 3
[16] N Tan D Wong J Liu W Ng Z Zhang J Lim Z Tan Y TangH Li S Lu and T Wong Automatic detection of the macula in theretinal fundus image by detecting regions with low pixel intensity InICBPE pages 1ndash5 2009 3 4
[17] K Tobin E Chaum V P Govindasamy and T Karnowski Detection ofanatomic structures in human retinal imagery IEEE Trans Med Imaging26(12)1729ndash1739 2007 2 4
[18] R Winder P Morrow I McRitchie J Bailie and P Hart Algorithmsfor digital image processing in diabetic retinopathy Comp Med ImagGrap 33(8)608ndash622 2009 2
[19] F Zana I Meunier and J C Klein A region merging algorithmusing mathematical morphology application to macula detection InInternational Symposium on Mathematical Morphology pages 423ndash4301998 2
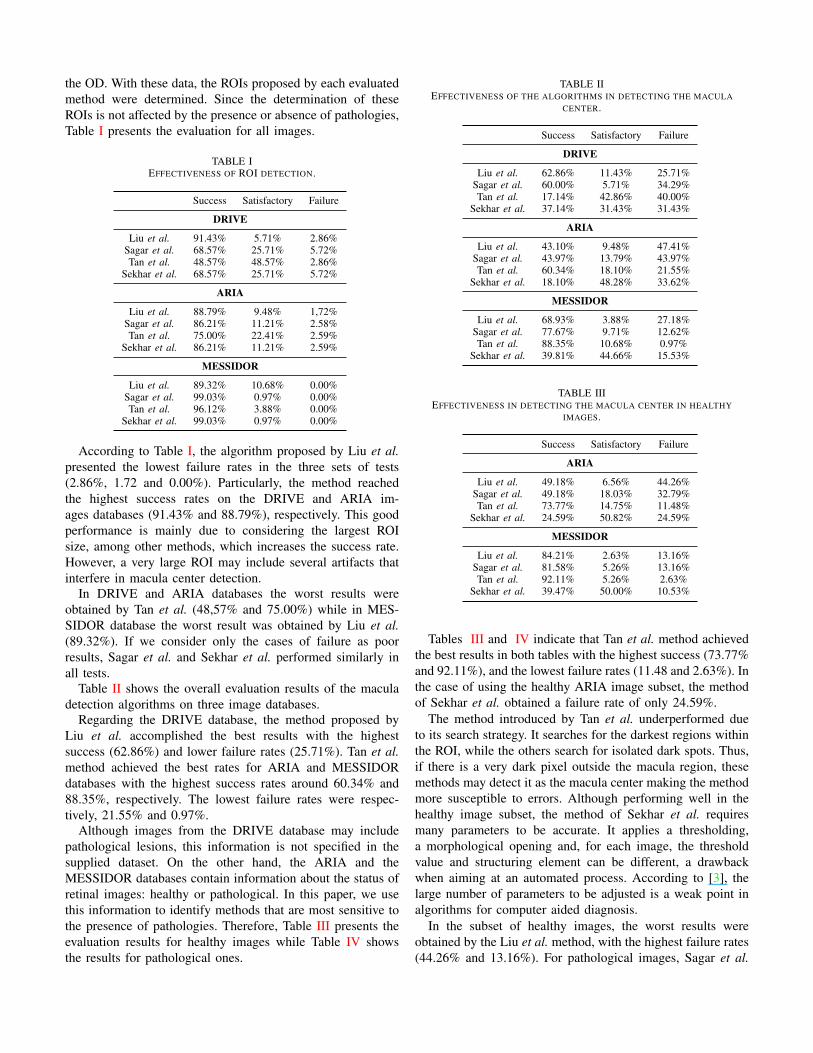
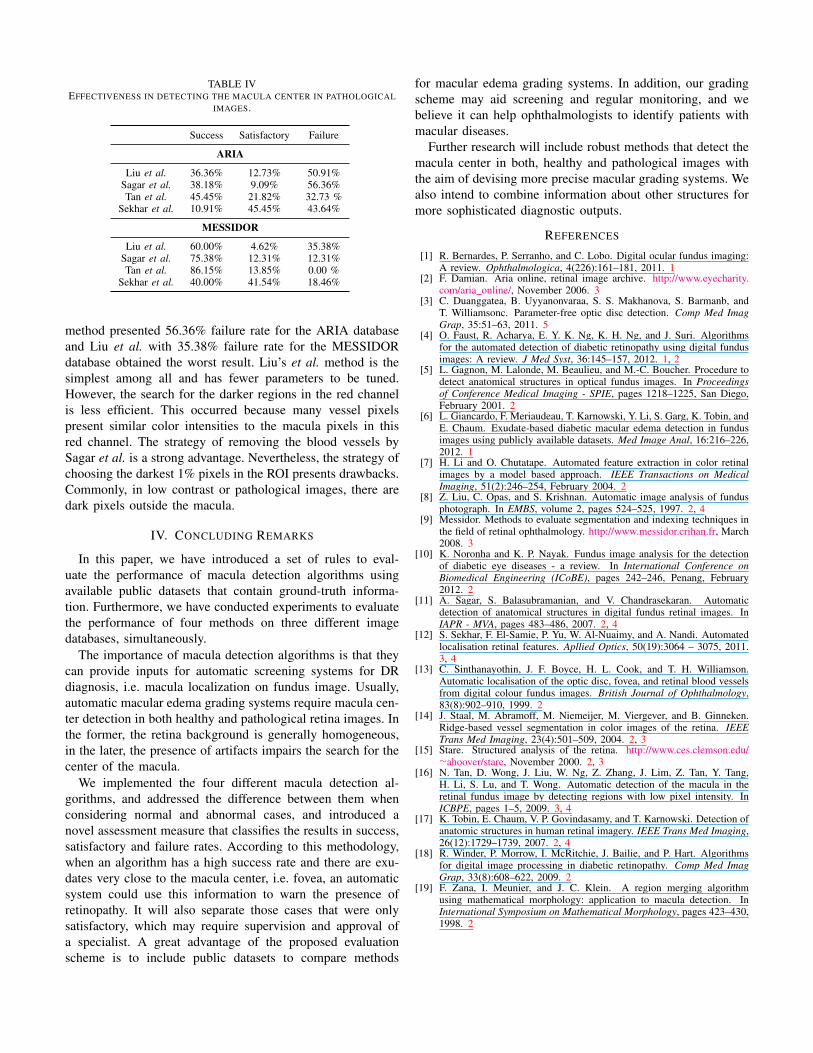