
Derivative Market in India – A Comparative Study of Stock ...
Upload
independentCategory
view
0download
0
Published: October 05, 2011
r 2011 American Chemical Society 13242 dx.doi.org/10.1021/jp204666j | J. Phys. Chem. A 2011, 115, 13242–13250
ARTICLE
pubs.acs.org/JPCA
Photophysics of the Interaction between a Fluorescein Derivativeand FicollJose M. Paredes, Luis Crovetto, Angel Orte, Sergio G. Lopez, Eva M. Talavera, and Jose M. Alvarez-Pez*
Department of Physical Chemistry, University of Granada, Cartuja Campus, 18071 Granada, Spain
bS Supporting Information
’ INTRODUCTION
The intracellular environment is highly crowded due to thepresence of large amounts of soluble and insoluble biomolecules,including proteins, nucleic acids, ribosomes, and carbohydrates,meaning that a significant fraction of the intracellular space is notavailable to other macromolecular species. This implies a non-specific influence of steric repulsions on specific reactions thatoccur in highly volume-occupied media; therefore, the structuralproperties observed in dilute buffer solutions in vitro do notrepresent the in vivo scenario.1 Experimental and theoreticalwork has demonstrated the significant effects of macromolecularcrowding on many biological processes in solution.2 Someconsequences of molecular crowding include altered chemicalreaction rates and equilibrium constants,3 enhanced proteinfolding,4 and reduced solute diffusion.5
Macromolecular crowding in solution can be mimicked ex-perimentally via the addition of high concentrations of inertsynthetic or natural macromolecules, termed crowding agents, tosystems in vitro. Ficoll has been widely used as a crowding agentbecause it is believed to be noninteracting and is composed ofmixed sizes such that smaller and larger diffusing solutes can bestudied.5b,6 Other polymeric macromolecules, such as dextransof different molecular weights, have also been used as crowdingagents.6
To study molecular diffusion, protein dynamics, chemicalreaction rates, or equilibrium constants in solutions that mimiccellular cytoplasm, fluorescence has been the most widely usedspectroscopic method. Thus, fluorescence recovery after photo-bleaching (FRAP),7 single-particle tracking (SPT),8 fluorescence
resonance energy transfer (FRET),9 fluorescence correlationspectroscopy (FCS),6 and fluorescence cross-correlation spec-troscopy (FCCS)10 have been extensively employed to investi-gate molecular mobility, transport and diffusion both in artificialsystems and directly in living cells.
In a series of previously published papers, we showed by FCS andtime-correlated single-photon counting (TCSPC) that the photo-physical characteristics of 9-[1-(2-methyl-4-methoxyphenyl)]-6-hy-droxy-3H-xanthen-3-one (TG-II), a dye corresponding to the so-called Tokyo Green family of fluorescein derivatives,11 are highlysensitive to phosphate concentrations.12 Specifically, the autocorre-lation (AC) function and the fluorescence lifetime can be consid-ered direct and sensitive means of investigating the environmentalphosphate concentration in small volumes at near-physiological pH.Moreover, we have also employed fluorescence lifetime correlationspectroscopy (FLCS) to investigate specific ion effects on TG-IIphotophysics in aqueous solutions.13 FLCS makes use of TCSPCinformation to extend the applicability of conventional FCS,14 thusallowing for the determination of autocorrelation functions fromdifferent emitters by applying temporal filters based on the fluores-cence decay.15 The FLCS methodology has been shown to be avaluable tool for studies with TG-II because its fluorescence lifetimeis 3.71 ns when the xanthene moiety is in the anion form and isreduced to 0.20 ns when the dye is protonated at acidic pHvalues.12a
Received: May 19, 2011Revised: September 27, 2011
ABSTRACT: Ficoll has been widely used as a crowding agent tomimic intracellular media because it is believed to be noninteractingand is composed of mixed sizes such that smaller and larger diffusingsolutes can be studied. Due to the interest that the fluorescent dye9-[1-(2-methyl-4-methoxyphenyl)]-6-hydroxy-3H-xanthen-3-one(TG-II) as a fluorometric probe of phosphate ions in intracellularmedia could generate, we describe the spectral characteristics of thesystem TG-II-Ficoll in aqueous solution by means of absorptionspectroscopy, steady-state fluorescence, time-resolved fluorescence,time-resolved emission spectroscopy, and fluorescence lifetime cor-relation spectroscopy. The spectral characteristics found are consis-tent with the formation of an adsorption complex on the surface of Ficoll, probably due to hydrogen bonding between TG-II andFicoll. In addition, the diffusion coefficient calculated for the association was similar to the diffusion coefficient previously recoveredfor Ficoll in the same experimental conditions. Therefore, our overall data clearly demonstrate that Ficoll is not an inert crowdingagent when in the presence of fluorescein derivative dyes.
13243 dx.doi.org/10.1021/jp204666j |J. Phys. Chem. A 2011, 115, 13242–13250
The Journal of Physical Chemistry A ARTICLE
Due to the interest that the use of TG-II as a fluorometricprobe of phosphate ions in intracellular media could generate, inthis paper, we report the behavior of the dye in aqueous solutionswith Ficoll added to mimic the crowded cell environment.Previous studies have obtained the diffusion properties of a seriesof fluorescent dyes by FCS in the presence of crowding agents.6
Moreover, fluorescein isothiocyanate (FITC) and Ficoll havebeen used to obtain measurements of the fractional clearances inisolated perfused rat kidneys.16
However, in the present paper, we show that Ficoll is not an inertcrowding agent when in the presence of xanthenic dyes such as TG-II. We report on the behavior of the TG-II�Ficoll system, describ-ing the spectral characteristics of this system in aqueous solution bymeans of absorption spectroscopy, steady-state fluorescence, time-resolved fluorescence, species-associated spectra (SAS) and FLCS.
’EXPERIMENTAL SECTION
Materials andMethods.The fluorescent dye 9-[1-(2-methyl-4-methoxyphenyl)]-6-hydroxy-3H-xanthen-3-one (TG-II, Figure 1)was prepared according to the literature.12aThe chemicals usedwereNaOH (Aldrich, spectroscopic grade, platelets), HClO4 (Aldrich,spectroscopic grade), and Ficoll 400 (Sigma, molecular biologygrade, dialyzed and lyophilized). The Ficoll concentration is ex-pressed as the Ficoll mass:water mass percentage. All chemicals wereused as received without further purification.Stock solutions of TG-II at different concentrations (2� 10�4 M
for ensemble-level measurements or 2 � 10�6 M for single-molecule experiments) and Ficoll (50% for the ensemble level or20% for the single-molecule level) were prepared using Milli-Qwater as the solvent. Appropriate concentrations of TG-II andFicoll were prepared bymixing the required amounts of the stocksolutions. To adjust the pH of the aqueous solutions, 0.01 MNaOH and 0.01 M HClO4 in Milli-Q water were used. Thesolutions were kept cool in the dark when not in use to avoidpossible deterioration through exposure to light and heat.The refractive indices of the samples were recorded using an
Abbe refractometer, model 51837 (Carl Zeiss) (Figure S-1,Supporting Information). Absorption spectra were recorded ona Perkin-Elmer Lambda 650 UV/vis spectrophotometer with a
temperature-controlled cell. Steady-state fluorescence emissionspectra were obtained using a JASCO FP-6500 spectrofluorom-eter equipped with a 450-W xenon lamp for excitation, with anETC-273T temperature controller. Fluorescence decay traces atthe ensemble level were recorded via the TCSPCmethod using aFluoTime 200 fluorometer (PicoQuant GmbH). The excitationsource consisted of either a 440 nm or 470 nm LDH pulsed laserwith a minimum pulse width of 68 or 73 ps, respectively. Thepulse repetition rate was 20 MHz. Fluorescence decay histo-grams were collected at different emission wavelengths along1320 channels (with a time increment of 36 ps per channel) using10 � 10 mm cuvettes. Histograms of the instrument responsefunctions (using LUDOX scatterer) and sample decays wererecorded until they reached 2 � 104 counts in the peak channel.For SAS, the collection time for fluorescence decay recording waslong enough to achieve more than 1 � 104 counts in the peakchannel at λem < 560 nm and at least 2 � 103 counts in the560�600 nm range.Fluorescence fluctuation traces were recorded with a Micro-
Time200 fluorescence lifetime microscope system (PicoQuantGmbH) using the time-tagged time-resolved (TTTR) metho-dology, which permits the simultaneous recovery of fluorescencedecay traces from molecules in the confocal volume.17 Theexcitation source consisted of either the 440 or 470 nm LDHpulsed laser previously described. The light beam was directedonto a dichroic mirror (510dcxr) to the oil immersion objective(1.4 NA, 100�) of an IX-71 inverted microscope system(Olympus). The collected fluorescence light was filtered by anHP500LP long-pass filter (AHF/Chroma) and focused onto aconfocal aperture. Beyond the aperture, the transmitted light wasrefocused onto two SPCM-AQR-14 single-photon avalanchediode (SPAD) detectors (Perkin-Elmer) after the signal wasseparated by a 50/50 beam splitter. Data acquisition wasperformed with a Timeharp 200 TCSPC module (PicoQuantGmbH) in TTTRmode, enabling a reconstruction of the lifetimehistogram.Data Analysis. The fluorescence decay traces at the ensemble
level were individually analyzed in terms of exponential modelsusing FluoFit software (PicoQuant GmbH). The tested decay
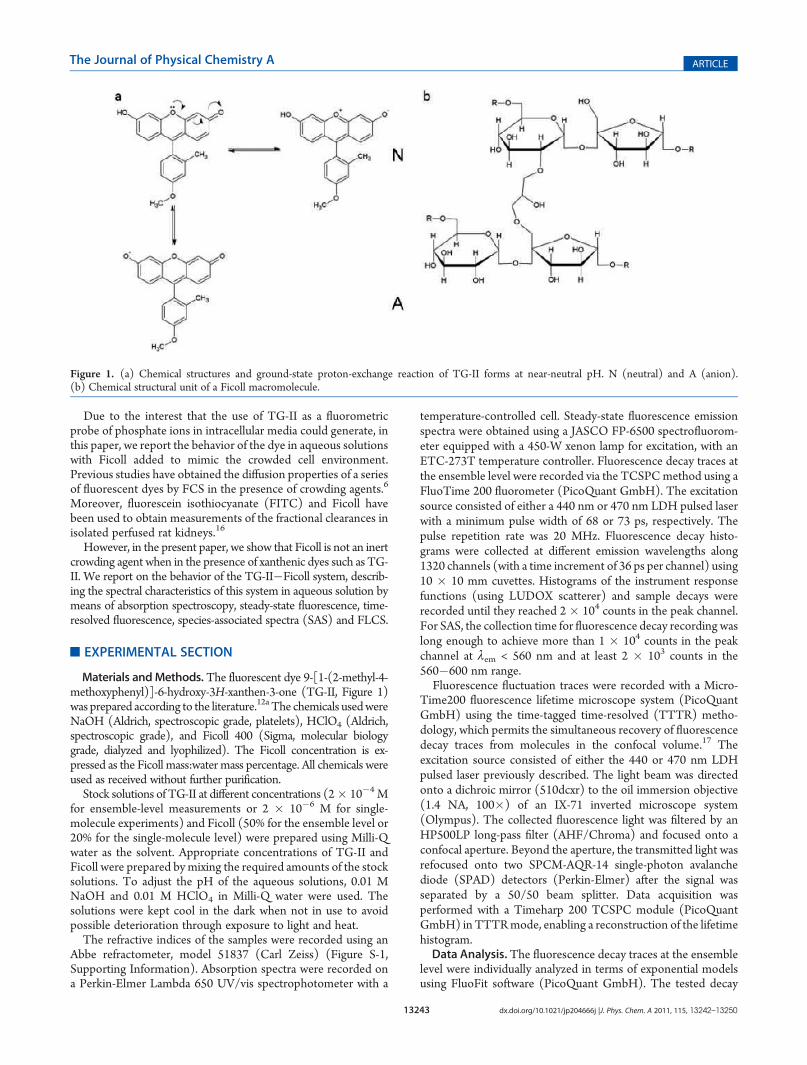
Figure 1. (a) Chemical structures and ground-state proton-exchange reaction of TG-II forms at near-neutral pH. N (neutral) and A (anion).(b) Chemical structural unit of a Ficoll macromolecule.
13244 dx.doi.org/10.1021/jp204666j |J. Phys. Chem. A 2011, 115, 13242–13250
The Journal of Physical Chemistry A ARTICLE
functions were monoexponential, biexponential, or triexponen-tial. Fluorescence decay traces of solutions at the same pH andexcitation wavelength were globally fitted with the decay timeslinked as shared parameters, whereas the pre-exponential factorswere locally adjustable parameters. Any of the fitting parameterscan be kept fixed during the fitting or can be freely adjustable todetermine the optimum values.The fluorescence decay traces at the single-molecule level were
analyzed by means of the SymPhoTime software (PicoQuantGmbH) and by applying the maximum likelihood estimator(MLE), which yields the correct parameter set for low countrates.18
Fluorescence lifetime correlation spectroscopy (FLCS) is a meth-od that uses time-correlated single-photon counting (TCSPC)information to extend the applicability of conventional fluorescencecorrelation spectroscopy, thus allowing for the determination ofautocorrelation functions from different emitters by applying tempor-al filters based on the fluorescence decay. Assuming that the identifiedsignal components are constant TCSPC patterns, FLCS makes itpossible to simultaneously monitor the diffusion speed of two dyes
with overlapping emission spectra and very similar diffusion coeffi-cients. The analysis of FLCS curves was realized by using SymPho-Time software (PicoQuant GmbH). FLCS analysis starts with apreliminary inspection of the overall TCSPC histogram. In FLCS,each photon is assigned a probability of originating from afluorescent species. From this probability, a filter function can bededuced. When the FLCS correlation curve is calculated, this filterfunction is used to weigh each individual photon on the basis of itsTCSPC channel. Next, it is possible to calculate the diffusioncoefficient of species i (Di) using eq 1:
Di ¼ ω02
4τið1Þ
where ω0 is the effective lateral focal radius at an intensity of 1/e2;
and τi is the diffusional time of species i.ω0 andDi are calculated onthe basis of a reference dye, which, in our case, was the TG-II anionform.12b Due to the low fluorescence intensity of the dye�Ficollinteraction, FLCS curves were recorded three times with ameasure-ment duration of 1 h each and then summed to obtain adequatebursts to build an acceptable AC function.
’RESULTS AND DISCUSSION
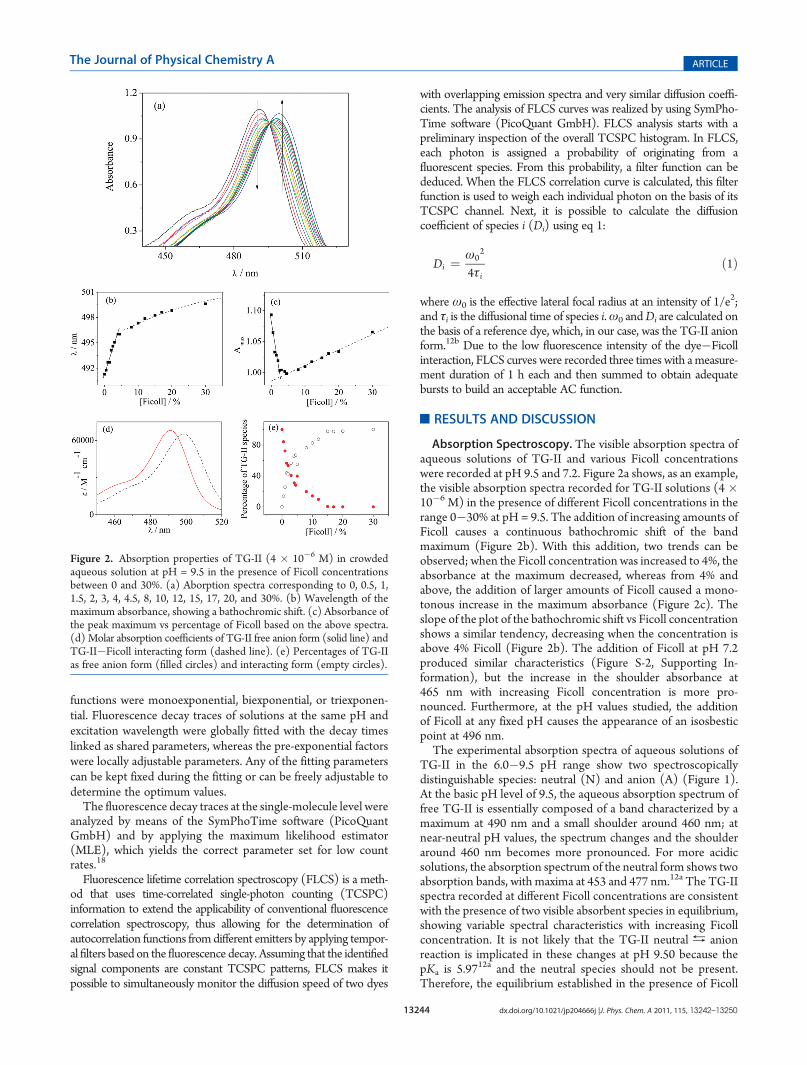
Absorption Spectroscopy. The visible absorption spectra ofaqueous solutions of TG-II and various Ficoll concentrationswere recorded at pH 9.5 and 7.2. Figure 2a shows, as an example,the visible absorption spectra recorded for TG-II solutions (4�10�6 M) in the presence of different Ficoll concentrations in therange 0�30% at pH = 9.5. The addition of increasing amounts ofFicoll causes a continuous bathochromic shift of the bandmaximum (Figure 2b). With this addition, two trends can beobserved; when the Ficoll concentration was increased to 4%, theabsorbance at the maximum decreased, whereas from 4% andabove, the addition of larger amounts of Ficoll caused a mono-tonous increase in the maximum absorbance (Figure 2c). Theslope of the plot of the bathochromic shift vs Ficoll concentrationshows a similar tendency, decreasing when the concentration isabove 4% Ficoll (Figure 2b). The addition of Ficoll at pH 7.2produced similar characteristics (Figure S-2, Supporting In-formation), but the increase in the shoulder absorbance at465 nm with increasing Ficoll concentration is more pro-nounced. Furthermore, at the pH values studied, the additionof Ficoll at any fixed pH causes the appearance of an isosbesticpoint at 496 nm.The experimental absorption spectra of aqueous solutions of
TG-II in the 6.0�9.5 pH range show two spectroscopicallydistinguishable species: neutral (N) and anion (A) (Figure 1).At the basic pH level of 9.5, the aqueous absorption spectrum offree TG-II is essentially composed of a band characterized by amaximum at 490 nm and a small shoulder around 460 nm; atnear-neutral pH values, the spectrum changes and the shoulderaround 460 nm becomes more pronounced. For more acidicsolutions, the absorption spectrum of the neutral form shows twoabsorption bands, with maxima at 453 and 477 nm.12a The TG-IIspectra recorded at different Ficoll concentrations are consistentwith the presence of two visible absorbent species in equilibrium,showing variable spectral characteristics with increasing Ficollconcentration. It is not likely that the TG-II neutral / anionreaction is implicated in these changes at pH 9.50 because thepKa is 5.97
12a and the neutral species should not be present.Therefore, the equilibrium established in the presence of Ficoll
Figure 2. Absorption properties of TG-II (4 � 10�6 M) in crowdedaqueous solution at pH = 9.5 in the presence of Ficoll concentrationsbetween 0 and 30%. (a) Aborption spectra corresponding to 0, 0.5, 1,1.5, 2, 3, 4, 4.5, 8, 10, 12, 15, 17, 20, and 30%. (b) Wavelength of themaximum absorbance, showing a bathochromic shift. (c) Absorbance ofthe peak maximum vs percentage of Ficoll based on the above spectra.(d) Molar absorption coefficients of TG-II free anion form (solid line) andTG-II�Ficoll interacting form (dashed line). (e) Percentages of TG-IIas free anion form (filled circles) and interacting form (empty circles).
13245 dx.doi.org/10.1021/jp204666j |J. Phys. Chem. A 2011, 115, 13242–13250
The Journal of Physical Chemistry A ARTICLE
between two different absorbers must involve the free anion formand a new association species produced by the dye�Ficollinteraction. To corroborate the number of absorbent speciesinvolved in this system and to quantify the assumed associationbetween the dye and Ficoll, we have analyzed the absorption databy means of principal component analysis (PCA).19�21 The useof two different absorbers explained 99.3% of the variation of theabsorption spectra. The first absorber is predominant at very lowor null Ficoll concentrations. Therefore, we assigned this spectralprofile to the TG-II free anion form. On the contrary, the secondspecies progressively appears with increasing Ficoll concentra-tions, so we assigned this absorber to the TG-II � Ficollinteracting form. Parts d and e of Figure 2 show the recoveredmolar absorption coefficients and percentages of TG-II as freeanion form, and TG-II�Ficoll interacting form. It is evident fromFigure 2e that at Ficoll concentrations above 17% nearly all TG-IImolecules interact with the polymer.
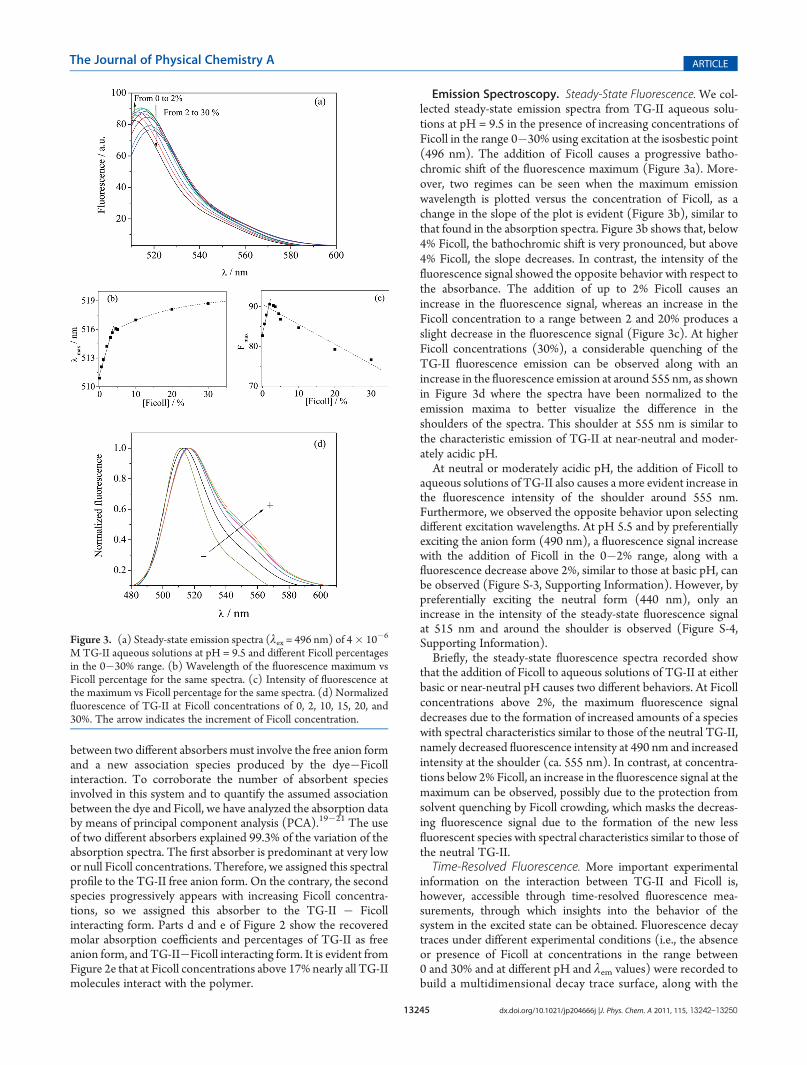
Emission Spectroscopy. Steady-State Fluorescence.We col-lected steady-state emission spectra from TG-II aqueous solu-tions at pH = 9.5 in the presence of increasing concentrations ofFicoll in the range 0�30% using excitation at the isosbestic point(496 nm). The addition of Ficoll causes a progressive batho-chromic shift of the fluorescence maximum (Figure 3a). More-over, two regimes can be seen when the maximum emissionwavelength is plotted versus the concentration of Ficoll, as achange in the slope of the plot is evident (Figure 3b), similar tothat found in the absorption spectra. Figure 3b shows that, below4% Ficoll, the bathochromic shift is very pronounced, but above4% Ficoll, the slope decreases. In contrast, the intensity of thefluorescence signal showed the opposite behavior with respect tothe absorbance. The addition of up to 2% Ficoll causes anincrease in the fluorescence signal, whereas an increase in theFicoll concentration to a range between 2 and 20% produces aslight decrease in the fluorescence signal (Figure 3c). At higherFicoll concentrations (30%), a considerable quenching of theTG-II fluorescence emission can be observed along with anincrease in the fluorescence emission at around 555 nm, as shownin Figure 3d where the spectra have been normalized to theemission maxima to better visualize the difference in theshoulders of the spectra. This shoulder at 555 nm is similar tothe characteristic emission of TG-II at near-neutral and moder-ately acidic pH.At neutral or moderately acidic pH, the addition of Ficoll to
aqueous solutions of TG-II also causes a more evident increase inthe fluorescence intensity of the shoulder around 555 nm.Furthermore, we observed the opposite behavior upon selectingdifferent excitation wavelengths. At pH 5.5 and by preferentiallyexciting the anion form (490 nm), a fluorescence signal increasewith the addition of Ficoll in the 0�2% range, along with afluorescence decrease above 2%, similar to those at basic pH, canbe observed (Figure S-3, Supporting Information). However, bypreferentially exciting the neutral form (440 nm), only anincrease in the intensity of the steady-state fluorescence signalat 515 nm and around the shoulder is observed (Figure S-4,Supporting Information).Briefly, the steady-state fluorescence spectra recorded show
that the addition of Ficoll to aqueous solutions of TG-II at eitherbasic or near-neutral pH causes two different behaviors. At Ficollconcentrations above 2%, the maximum fluorescence signaldecreases due to the formation of increased amounts of a specieswith spectral characteristics similar to those of the neutral TG-II,namely decreased fluorescence intensity at 490 nm and increasedintensity at the shoulder (ca. 555 nm). In contrast, at concentra-tions below 2% Ficoll, an increase in the fluorescence signal at themaximum can be observed, possibly due to the protection fromsolvent quenching by Ficoll crowding, which masks the decreas-ing fluorescence signal due to the formation of the new lessfluorescent species with spectral characteristics similar to those ofthe neutral TG-II.Time-Resolved Fluorescence. More important experimental
information on the interaction between TG-II and Ficoll is,however, accessible through time-resolved fluorescence mea-surements, through which insights into the behavior of thesystem in the excited state can be obtained. Fluorescence decaytraces under different experimental conditions (i.e., the absenceor presence of Ficoll at concentrations in the range between0 and 30% and at different pH and λem values) were recorded tobuild a multidimensional decay trace surface, along with the
Figure 3. (a) Steady-state emission spectra (λex = 496 nm) of 4� 10�6
M TG-II aqueous solutions at pH = 9.5 and different Ficoll percentagesin the 0�30% range. (b) Wavelength of the fluorescence maximum vsFicoll percentage for the same spectra. (c) Intensity of fluorescence atthe maximum vs Ficoll percentage for the same spectra. (d) Normalizedfluorescence of TG-II at Ficoll concentrations of 0, 2, 10, 15, 20, and30%. The arrow indicates the increment of Ficoll concentration.
13246 dx.doi.org/10.1021/jp204666j |J. Phys. Chem. A 2011, 115, 13242–13250
The Journal of Physical Chemistry A ARTICLE
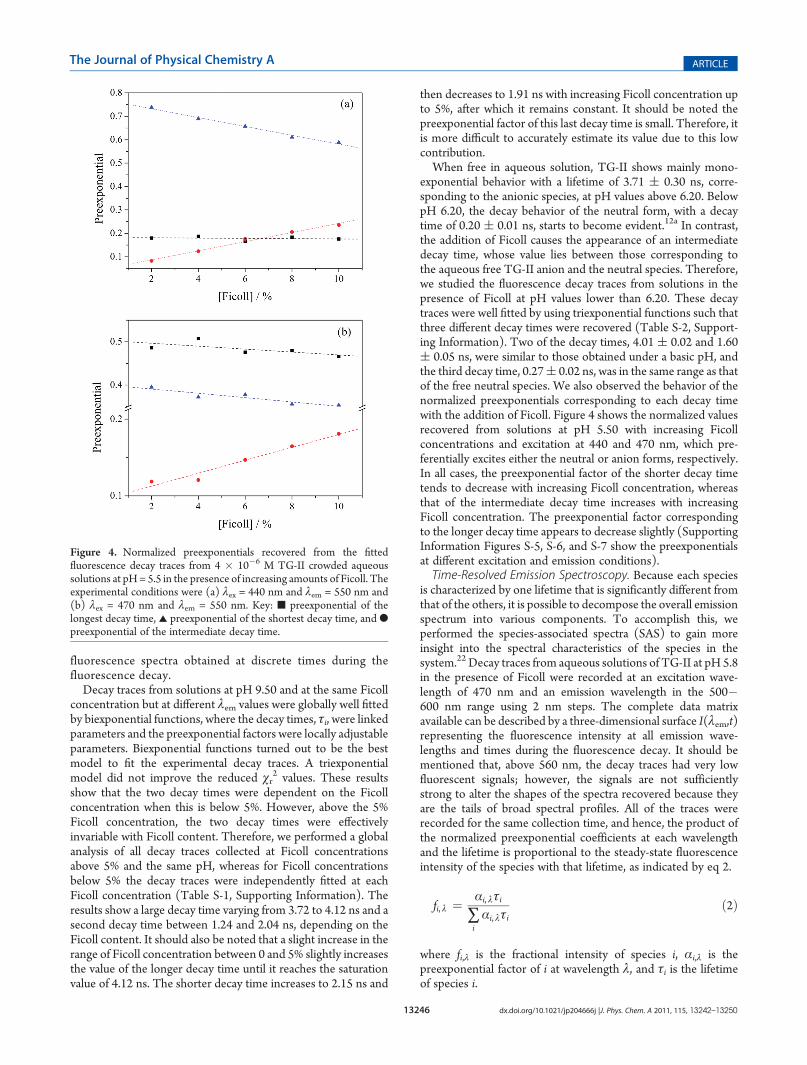
fluorescence spectra obtained at discrete times during thefluorescence decay.Decay traces from solutions at pH 9.50 and at the same Ficoll
concentration but at different λem values were globally well fittedby biexponential functions, where the decay times, τi, were linkedparameters and the preexponential factors were locally adjustableparameters. Biexponential functions turned out to be the bestmodel to fit the experimental decay traces. A triexponentialmodel did not improve the reduced χr
2 values. These resultsshow that the two decay times were dependent on the Ficollconcentration when this is below 5%. However, above the 5%Ficoll concentration, the two decay times were effectivelyinvariable with Ficoll content. Therefore, we performed a globalanalysis of all decay traces collected at Ficoll concentrationsabove 5% and the same pH, whereas for Ficoll concentrationsbelow 5% the decay traces were independently fitted at eachFicoll concentration (Table S-1, Supporting Information). Theresults show a large decay time varying from 3.72 to 4.12 ns and asecond decay time between 1.24 and 2.04 ns, depending on theFicoll content. It should also be noted that a slight increase in therange of Ficoll concentration between 0 and 5% slightly increasesthe value of the longer decay time until it reaches the saturationvalue of 4.12 ns. The shorter decay time increases to 2.15 ns and
then decreases to 1.91 ns with increasing Ficoll concentration upto 5%, after which it remains constant. It should be noted thepreexponential factor of this last decay time is small. Therefore, itis more difficult to accurately estimate its value due to this lowcontribution.When free in aqueous solution, TG-II shows mainly mono-
exponential behavior with a lifetime of 3.71 ( 0.30 ns, corre-sponding to the anionic species, at pH values above 6.20. BelowpH 6.20, the decay behavior of the neutral form, with a decaytime of 0.20 ( 0.01 ns, starts to become evident.12a In contrast,the addition of Ficoll causes the appearance of an intermediatedecay time, whose value lies between those corresponding tothe aqueous free TG-II anion and the neutral species. Therefore,we studied the fluorescence decay traces from solutions in thepresence of Ficoll at pH values lower than 6.20. These decaytraces were well fitted by using triexponential functions such thatthree different decay times were recovered (Table S-2, Support-ing Information). Two of the decay times, 4.01 ( 0.02 and 1.60( 0.05 ns, were similar to those obtained under a basic pH, andthe third decay time, 0.27( 0.02 ns, was in the same range as thatof the free neutral species. We also observed the behavior of thenormalized preexponentials corresponding to each decay timewith the addition of Ficoll. Figure 4 shows the normalized valuesrecovered from solutions at pH 5.50 with increasing Ficollconcentrations and excitation at 440 and 470 nm, which pre-ferentially excites either the neutral or anion forms, respectively.In all cases, the preexponential factor of the shorter decay timetends to decrease with increasing Ficoll concentration, whereasthat of the intermediate decay time increases with increasingFicoll concentration. The preexponential factor correspondingto the longer decay time appears to decrease slightly (SupportingInformation Figures S-5, S-6, and S-7 show the preexponentialsat different excitation and emission conditions).Time-Resolved Emission Spectroscopy. Because each species
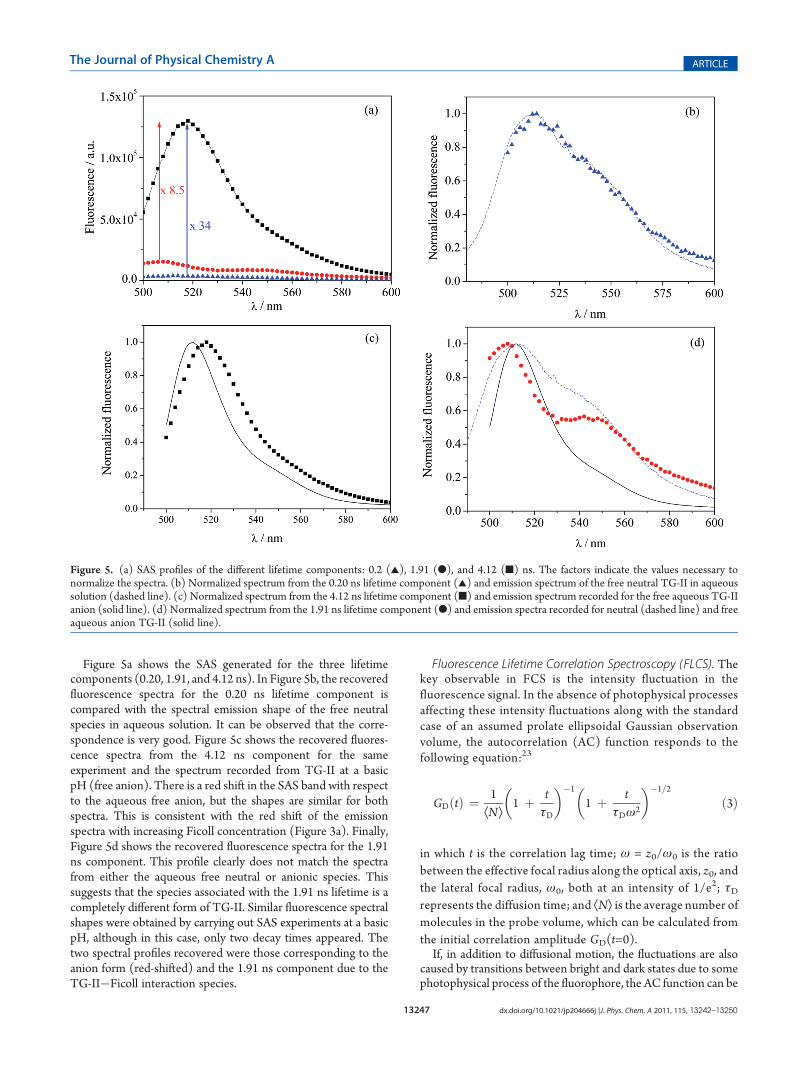
is characterized by one lifetime that is significantly different fromthat of the others, it is possible to decompose the overall emissionspectrum into various components. To accomplish this, weperformed the species-associated spectra (SAS) to gain moreinsight into the spectral characteristics of the species in thesystem.22 Decay traces from aqueous solutions of TG-II at pH 5.8in the presence of Ficoll were recorded at an excitation wave-length of 470 nm and an emission wavelength in the 500�600 nm range using 2 nm steps. The complete data matrixavailable can be described by a three-dimensional surface I(λem,t)representing the fluorescence intensity at all emission wave-lengths and times during the fluorescence decay. It should bementioned that, above 560 nm, the decay traces had very lowfluorescent signals; however, the signals are not sufficientlystrong to alter the shapes of the spectra recovered because theyare the tails of broad spectral profiles. All of the traces wererecorded for the same collection time, and hence, the product ofthe normalized preexponential coefficients at each wavelengthand the lifetime is proportional to the steady-state fluorescenceintensity of the species with that lifetime, as indicated by eq 2.
fi, λ ¼ αi, λτi
∑iαi, λτi
ð2Þ
where fi,λ is the fractional intensity of species i, αi,λ is thepreexponential factor of i at wavelength λ, and τi is the lifetimeof species i.
Figure 4. Normalized preexponentials recovered from the fittedfluorescence decay traces from 4 � 10�6 M TG-II crowded aqueoussolutions at pH= 5.5 in the presence of increasing amounts of Ficoll. Theexperimental conditions were (a) λex = 440 nm and λem = 550 nm and(b) λex = 470 nm and λem = 550 nm. Key: 9 preexponential of thelongest decay time, 2 preexponential of the shortest decay time, and bpreexponential of the intermediate decay time.
13247 dx.doi.org/10.1021/jp204666j |J. Phys. Chem. A 2011, 115, 13242–13250
The Journal of Physical Chemistry A ARTICLE
Figure 5a shows the SAS generated for the three lifetimecomponents (0.20, 1.91, and 4.12 ns). In Figure 5b, the recoveredfluorescence spectra for the 0.20 ns lifetime component iscompared with the spectral emission shape of the free neutralspecies in aqueous solution. It can be observed that the corre-spondence is very good. Figure 5c shows the recovered fluores-cence spectra from the 4.12 ns component for the sameexperiment and the spectrum recorded from TG-II at a basicpH (free anion). There is a red shift in the SAS band with respectto the aqueous free anion, but the shapes are similar for bothspectra. This is consistent with the red shift of the emissionspectra with increasing Ficoll concentration (Figure 3a). Finally,Figure 5d shows the recovered fluorescence spectra for the 1.91ns component. This profile clearly does not match the spectrafrom either the aqueous free neutral or anionic species. Thissuggests that the species associated with the 1.91 ns lifetime is acompletely different form of TG-II. Similar fluorescence spectralshapes were obtained by carrying out SAS experiments at a basicpH, although in this case, only two decay times appeared. Thetwo spectral profiles recovered were those corresponding to theanion form (red-shifted) and the 1.91 ns component due to theTG-II�Ficoll interaction species.
Fluorescence Lifetime Correlation Spectroscopy (FLCS). Thekey observable in FCS is the intensity fluctuation in thefluorescence signal. In the absence of photophysical processesaffecting these intensity fluctuations along with the standardcase of an assumed prolate ellipsoidal Gaussian observationvolume, the autocorrelation (AC) function responds to thefollowing equation:23
GDðtÞ ¼ 1ÆNæ
1 þ tτD
� ��1
1 þ tτDω2
� ��1=2
ð3Þ
in which t is the correlation lag time; ω = z0/ω0 is the ratiobetween the effective focal radius along the optical axis, z0, andthe lateral focal radius, ω0, both at an intensity of 1/e2; τDrepresents the diffusion time; and ÆNæ is the average number ofmolecules in the probe volume, which can be calculated fromthe initial correlation amplitude GD(t=0).If, in addition to diffusional motion, the fluctuations are also
caused by transitions between bright and dark states due to somephotophysical process of the fluorophore, the AC function can be
Figure 5. (a) SAS profiles of the different lifetime components: 0.2 (2), 1.91 (b), and 4.12 (9) ns. The factors indicate the values necessary tonormalize the spectra. (b) Normalized spectrum from the 0.20 ns lifetime component (2) and emission spectrum of the free neutral TG-II in aqueoussolution (dashed line). (c) Normalized spectrum from the 4.12 ns lifetime component (9) and emission spectrum recorded for the free aqueous TG-IIanion (solid line). (d) Normalized spectrum from the 1.91 ns lifetime component (b) and emission spectra recorded for neutral (dashed line) and freeaqueous anion TG-II (solid line).

13248 dx.doi.org/10.1021/jp204666j |J. Phys. Chem. A 2011, 115, 13242–13250
The Journal of Physical Chemistry A ARTICLE
described by23
GðtÞ ¼ GDðtÞ 11� f
ð1� f þ f e�t=τiÞ ð4Þ
in which the transition time to the dark state, τi, represents theinterconversion time between the bright and dark species, and f isthe fraction of molecules in the dark state.The FLCS methodology can be used to filter the different
contributions from species with different lifetimes, allowing forthe calculation of a separate AC function for each signalcomponent.14,15 From the TCSPC information, temporalweighting filters were estimated for each component, in our case,background photons and photons arising from the TG-II neutralform, the anionic form, and the new species arising from theinteraction between Ficoll and the dye. We used an excitationlaser power of <5.6 μW to avoid both photobleaching and tripletpopulation.12b The AC curve of the TG-II anion in aqueoussolution at pH 9.5 obtained by FLCS for the 3.8 ns componentshows pure diffusional behavior that could be well fitted with eq 3(Figure 6), therefore confirming the absence of a proton-transferreaction. The diffusional term was characterized by a time, τD, of0.023 ms, which corresponds to a diffusion coefficient of 330μm2/s.12b To study the effect of the addition of Ficoll to aqueoussolutions of TG-II, we recorded fluorescence fluctuation tracesfrom 1.0� 10�8 M TG-II nonbuffered solutions at pH values of9.70 and 6.10. Figure 6 shows the TG-II lifetime-filtered ACfunction for the 4.12 and 1.91 ns lifetime components for TG-IIsolutions with 2% Ficoll at pH 9.70, along with the AC functionfor the free TG-II anion in the absence of Ficoll. As shown inFigure 6, the addition of Ficoll results in a dramatic change in theTG-II anion AC function. Two transitions occur in the ACfunction of the TG-II species in the presence of Ficoll. There is anexponential decay in the microsecond time range and in thediffusional part, which lies in the millisecond range (Figure 6).Similar results were found at pH 6.10 (Figure S-8, SupportingInformation). By fitting the AC curves to eq 4, we recovered thetransition time to a dark state, τi, and the diffusion time, τD. Thevalue of τi represents the interconversion kinetics from onespecies to each other because, once the contribution of a speciesis filtered out, it acts as a dark state for the form remaining in theFLCS AC curve. We recovered the values for the transition rate
constants, ki, defined as 1/τi, for both the 4.12 and 1.91 nslifetime components. For instance, at pH 9.70 and 2% Ficoll, theki value for the 4.12 ns lifetime component was 4.3 � 104 s�1,with a dark fraction of 0.23, whereas it was 5.3 � 104 s�1 with adark fraction of 0.84 for the 1.91 ns component. Both rates are ingood agreement, suggesting that the interconversion processbetween the 4.12 ns component and the 1.91 ns component isthe same. These interconversion rates are of the same order ofmagnitude as the protonation/deprotonation rate found be-tween the TG-II anion/neutral in solution at pH 6.10, whichwas 6.3 � 104 s�1.13
We then analyzed the diffusional behavior of the TG-II speciesin the presence of Ficoll. At pH 9.70, the diffusion coefficient forthe 4.12 ns lifetime component in the presence of 2% Ficolldecreased to 173 ( 2.2 μm2/s. This is in agreement with thefinding of Dauty and Verkman, who reported that the diffusioncoefficients of small molecules in Ficoll-70 solution were reducedin an exponential manner with respect to that in water.6 More-over, we also found a slow diffusion time for the 1.91 nscomponent lifetime, a component that we assign to the complexformed between Ficoll and the dye. This diffusion time was 1.83( 0.72ms, a value over 40 times slower than that of the free anionin the presence of Ficoll and almost 2 orders of magnitude slowerthan that of the free anion in aqueous solution. The correspond-ing diffusion coefficient of this species was 20.1 ( 5.0 μm2/s athigh pH and 21.3( 3.4 μm2/s at pH 6.10. Lavrenco et al. found adiffusion coefficient of 23 μm2/s from unfractionated samples ofFicoll 400 in water.24 This similar diffusion coefficient value forthe 1.91 ns component in comparison to the diffusion coefficientof Ficoll is consistent with the formation of an adsorptioncomplex on the surface of Ficoll, probably due to hydrogenbonding between the hydroxyl group of TG-II and the numerousoxygen atoms of the hydroxyl residues of the polymer. Accordingto this proposed structure, the spectral properties of TG-II in thecomplex would be intermediate between those of the neutral andanion forms of TG-II. In fact, the shape of this steady-statefluorescence spectrum (Figure 5) is similar to that of TG-II whenthe oxygen of the hydroxyl group is either linked to anotherchemical group or simply protonated at acidic pH values.11,12
Nevertheless, the lifetime of the adsorption complex is largerthan that of the neutral species, indicating that the bonding to theFicoll surface is not covalent.System Fluorescein�Ficoll. Absorption and Steady-State
Emission Spectroscopy. We hypothesized that the interactionbetween TG-II and Ficoll is due to hydrogen bonding; therefore,it should be a general effect in other parent compounds. To testthis assertion, we investigated whether the interaction of TG-IIand Ficoll takes place with other xanthene derivatives, specificallythe broadly used fluorescein dye. We recorded both the absorp-tion and steady-state emission spectra from aqueous solutions offluorescein in the presence of Ficoll at the same concentrationrange used in the previous experiments (0�30%), and pH 9.5.The spectra are shown in Figures S-9 and S-10 of the SupportingInformation. As the concentration of Ficoll increases, both sets ofspectra show features and trends similar to those observed withTG-II. Nevertheless, the existence of two anionic species inequilibrium derived from the ionization of fluorescein in aqueoussolution, along with the close value of the lifetimes of theseanionic species,25 makes it practically unfeasible to conduct asimilar study as was carried out with the fluorescein derived TG-II. Even though, from the results obtained, we can state thatfluorescein interacts with Ficoll originating both absorption and
Figure 6. FLCS function of 2 nMTG-II at basic pH in aqueous solutionwithout Ficoll (D = 330 μm2/s) (O). 10 nM TG-II at pH = 9.70 in 2%Ficoll, selecting the 4.12 ns lifetime component (D = 174 μm2/s) (9)and selecting the 1.91 ns lifetime component (D = 20.1 μm2/s) (b).λex = 470 nm. The dashed line represents the diffusion process.
13249 dx.doi.org/10.1021/jp204666j |J. Phys. Chem. A 2011, 115, 13242–13250
The Journal of Physical Chemistry A ARTICLE
emission spectra altered in a similar way as happens with TG-II.So, one could assume that the interaction of Ficoll and xanthenesderivatives is widespread.
’CONCLUSIONS
The isosbestic point visualized in the absorption spectra, thedifferent steady-state fluorescence spectra observed when theFicoll concentration is sufficiently high, and the consistent life-time of 1.91 ns recovered from solutions in the presence of Ficollindicate the formation of a new species between TG-II and Ficollin aqueous solution. Moreover, the use of SAS permitted adetermination of the steady-state emission spectrum correspond-ing to the 1.91 ns component and, therefore, that of the newspecies. The comparison of this spectrum with those of the otherprototropic forms from TG-II makes evident the similarity withthe spectrum from TG-II when its oxygen is either linked toanother chemical group or simply protonated at acidic pH values.Finally, by using FLCS, we obtained lifetime-filtered AC func-tions for the 4.12 and 1.91 ns lifetime components from TG-IIsolutions in the presence of Ficoll. We calculated their diffusioncoefficients and compared them with that from the free anion inthe absence of Ficoll. The addition of Ficoll resulted in a dramaticdecrease in the diffusion coefficient of the TG-II anion. Impor-tantly, the diffusion coefficient of the 1.91 ns lifetime componentwas similar to the diffusion coefficient previously recovered forFicoll. These findings are consistent with the formation of anadsorption complex on the surface of Ficoll, probably due tohydrogen bonding between TG-II and Ficoll. In addition, thesystem Ficoll�fluorescein shows spectral behavior similar to thatobserved with TG-II, suggesting that the interaction betweenFicoll and xanthenes derivatives is widespread. Therefore, ouroverall data clearly demonstrate that extreme caution must beexercised in the interpretation of fluorescence data from xanthe-nic dyes in macromolecular crowding experiments, becauseFicoll is not an inert agent when in the presence of such dyes.
’ASSOCIATED CONTENT
bS Supporting Information. Study of refractive indices atdifferent Ficoll concentrations. Figure S2 shows absorptionspectra at different Ficoll concentrations. Figures S3 and S4show fluorescence spectra at different λex and different Ficollconcentrations. Figures S5, S6, and S7 show the preexponentialat different λex and λem. Figure S8 shows FLCS function at pH =6.10. Figures S9 and S10 show absorption and steady-stateemission spectra of fluorescein added to Ficoll. Tables S1 andS2 show decay times recovered by fitting of decay traces fromsolutions of TG-II with added Ficoll. This material is availablefree of charge via the Internet at http://pubs.acs.org.
’AUTHOR INFORMATION
Corresponding Author*E-mail: [email protected]. Fax: +34-958-244090. Tel: +34-958-243831.
’ACKNOWLEDGMENT
This work was supported by grants CTQ2010-20507/BQUfrom the Ministerio Espa~nol de Ciencia e Innovaci�on (cofinancedby FEDER funds) and P07-FQM-3091 from the Consejería deInnovaci�on, Ciencia y Empresa (Junta de Andalucía).
’REFERENCES
(1) Minton, A. P.; Wilf, J. Effect of macromolecular crowding uponthe structure and function of an enzyme: Glyceraldehyde-3-phosphatedehydrogenase. Biochemistry 1981, 20, 4821–4826.
(2) Cheung, M. S.; Klimov, D.; Thirumalai, D. Molecular crowdingenhances native state stability and refolding rates of globular proteins.Proc. Natl. Acad. Sci. U. S. A. 2005, 102, 4753–4758.
(3) Minton, A. P. The influence of macromolecular crowding andmacromolecular confinement on biochemical reactions in physiologicalmedia. J. Biol. Chem. 2001, 276, 10577–10580.
(4) Martin, J.; Hartl, F. U. The effect of macromolecular crowding onchaperonin-mediated protein folding. Proc. Natl. Acad. Sci. U. S. A. 1997,94, 1107–1112.
(5) (a) Seksek, O.; Biwersi, J.; Verkman, A. S. Translational diffusionof macromolecule-sized solutes in cytoplasm and nucleus. J. Cell Biol.1997, 138, 131–142. (b) Dix, J. A.; Verkman, A. S. Crowding effects ondiffusion in solutions and cells. Annu. Rev. Biophys. 2008, 37, 247–263.
(6) Dauty, E.; Verkman, A. S. Molecular crowding reduces to asimilar extent the diffusion of small solutes and macromolecules:measurement by fluorescence correlation spectroscopy. J. Mol. Recognit.2004, 17, 441–447.
(7) Verkman, A. S. Diffusion in cells measured by fluorescencerecovery after photobleaching. Methods Enzymol. 2003, 360, 635–648.
(8) Jin, S.; Verkman, A. S. Single particle tracking of complexdiffusion in membranes: simulation and detection of barrier, raft, andinteraction phenomena. J. Phys. Chem. B 2007, 111, 3625–3632.
(9) Jares-Erijman, E. A.; Jovin, T. M. FRET imaging.Nat. Biotechnol.2003, 21, 1387–1395.
(10) Bacia, K.; Kim, S. A.; Schwille, P. Fluorescence cross-correlationspectroscopy in living cells. Nat. Methods 2006, 3, 83–89.
(11) Urano, Y.; Kamiya, M.; Kanda, K.; Ueno, T.; Hirose, K.;Nagano, T. Evolution of Fluorescein as a Platform for FinelyTunable Fluorescence Probes. J. Am. Chem. Soc. 2005, 127 (13),4888–4894.
(12) (a) Paredes, J. M.; Crovetto, L.; Rios, R.; Orte, A.; Alvarez-Pez,J. M.; Talavera, E. M. Tuned lifetime, at the ensemble and singlemolecule level, of a xanthenic fluorescent dye by means of a buffer-mediated excited-state proton exchange reaction. Phys. Chem. Chem.Phys. 2009, 11 (26), 5400–5407. (b) Paredes, J. M.; Orte, A.; Crovetto,L.; Alvarez-Pez, J. M.; Rios, R.; Ruedas-Rama, M. J.; Talavera, E. M.Similarity between the kinetic parameters of the buffer-mediated protonexchange reaction of a xanthenic derivative in its ground- and excited-state. Phys. Chem. Chem. Phys. 2010, 12, 323–327.
(13) Paredes, J. M.; Crovetto, L.; Orte, A.; Alvarez-Pez, J. M.;Talavera, E. M. Influence of the solvent on the ground- and excited-state buffer-mediated proton-transfer reactions of a xanthenic dye. Phys.Chem. Chem. Phys. 2011, 13 (4), 1685–1694.
(14) B€ohmer, M.; Wahl, M.; Rahn, H. J.; Erdmann, R.; Enderlein, J.Time-resolved fluorescence correlation spectroscopy. Chem. Phys. Lett.2002, 353, 439–445.
(15) (a) Benda, A.; Fagul’ov�a, V.; Deyneka, A.; Enderlein, J.; Hof, M.Fluorescence Lifetime Correlation Spectroscopy Combined with Life-time Tuning: New Perspectives in Supported Phospholipid BilayerResearch. Langmuir 2006, 22 (23), 9580–9585. (b) Kapusta, P.; Wahl,M.; Benda, A.; Hof, M.; Enderlein, J. Fluorescence Lifetime CorrelationSpectroscopy. J. Fluoresc. 2007, 17, 43–48. (c) Gregor, I.; Enderlein, J.Time-resolved methods in biophysiscs.3. Fluorescence lifetime correla-tion spectroscopy. Photochem. Photobiol. Sci. 2007, 6, 13–18. (d) Ray, K.;Zhang, J.; Lakowicz, J. R. Fluorescence Lifetime Correlation Spectro-scopic Study of Fluorophore-Labeled Silver Nanoparticles. Anal. Chem.2008, 80 (19), 7313–7318. (e) Chen, J.; Irudayaraj, J. FluorescenceLifetime Cross Correlation Spectroscopy Resolves EGFR and Antago-nist Interaction in Live Cells. Anal. Chem. 2010, 82 (15), 6415–6421.(f) R€uttinger, S.; Kapusta, P.; Patting, M.; Wahl, M.; Macdonald, R. Onthe Resolution Capabilities and Limits of Fluorescence Lifetime Corre-lation Spectroscopy (FLCS) Measurements. J. Fluoresc. 2010, 20 (1),105–114.
13250 dx.doi.org/10.1021/jp204666j |J. Phys. Chem. A 2011, 115, 13242–13250
The Journal of Physical Chemistry A ARTICLE
(16) Ohlson, M.; S€orensson, J.; Haraldsson, B. Glomerular size andcharge selectivity in the rat as revealed by FITC-Ficoll and albumin. Am.J. Physiol. Renal Physiol. 2000, 279, F84–F91.(17) Wahl, M.; Erdmann, R.; Lauritsen, K.; Rahn, H. J. Hardware
solution for continuous time-resolved burst detection of single mol-ecules in flow. Proc. SPIE 1998, 3259, 173–178.(18) (a) Maus, M.; Cotlet, M.; Hofkens, J.; Gensch, T.; De Schryver,
F. C.; Schafer, J.; Seidel, C. A. M. An experimental comparison of themaximum likehood estimation and nonlinear least-squares fluorescencelifetime analysis of single molecules. Anal. Chem. 2001, 73, 2078–2086.(b) Edel, J. B.; Eid, J. S.; Meller, A. Accurate Single Molecule FRETEfficiency Determination for Surface Immobilized DNA Using Max-imum Likelihood Calculated Lifetimes. J. Phys. Chem. B 2007, 111 (11),2986–2990.(19) Mandal, A. K.; Pal, M. K. Principal component analysis of the
absorption spectra of the dye thiacyanine in the presence of thesurfactant AOT: Precise Identification of the Dye-Surfactant Aggregates.J. Colloid Interface Sci. 1997, 192, 83–93.(20) Al-Soufi, W.; Novo, M.; Mosquera, M. Principal component
global analysis of fluorescence and absorption spectra of 2-(20-Hydro-xyphenyl)benzimidazole. Appl. Spectrosc. 2001, 55, 630–636.(21) Ruedas-Rama, M. J.; Alvarez-Pez, J. M.; Orte, A. Formation of
stable BOBO-3 H-aggregate complexes hinders DNA hybridization.J. Phys. Chem. B 2010, 114, 9063–9071.(22) Valeur, B. Principles of steady-state and time-resolved fluorometric
techniques in Molecular fluorescence: Principles and applications. Wiley-VCH Verlag Gmbh: Weingheim (Germany), 2001, pp 155�199.(23) Haustein, E.; Schwille, P. Fluorescence Correlation Spectros-
copy: Novel Variations of an Established Technique. Annu. Rev. Biophys.Biomol. Struct. 2007, 36, 151–169.(24) Lavrenko, P. N.; Mikriukova, O. I.; Okatova, O. V. On the
separation ability of various Ficoll gradient solutions in zonal centrifuga-tion. Anal. Biochem. 1987, 166, 287–297.(25) Alvarez-Pez, J. M.; Ballesteros, L.; Talavera, E. M.; Yguerabide,
J. Fluorescein Excited State Proton Exchange Reactions: NanosecondEmission Kinetics and Correlation with Steady State FluorescenceIntensity. J. Phys. Chem. A 2001, 105, 6320–6332.
Copyright © 2022 FDOKUMEN