Strategic design for users with diabetic retinopathy
8
Strategic Design for Users with Diabetic Retinopathy: Factors Influencing Performance in a Menu-Selection Task Paula J. Edwards, Leon Barnard, V. Kathlene Emery, Ji Soo Yi, Kevin P. Moloney, Thitima Kongnakorn, Julie A. Jacko, and François Sainfort Laboratory for Human-Computer Interaction and Health Care Informatics School of Industrial and Systems Engineering Georgia Institute of Technology Atlanta, GA USA [email protected] Pamela R. Oliver, Joseph Pizzimenti, Annette Bade, Greg Fecho, and Josephine Shallo-Hoffmann Nova Southeastern University College of Optometry Ft. Lauderdale, Florida USA [email protected] ABSTRACT This paper examines factors that affect performance of a basic menu selection task by users who are visually healthy and users with Diabetic Retinopathy (DR) in order to inform better interface design. Interface characteristics such as multimodal feedback, Windows ® accessibility settings, and menu item location were investigated. Analyses of Variance (ANOVA) were employed to examine the effects of interface features on task performance. Linear regression was used to further examine and model various contextual factors that influenced task performance. Results indicated that Windows ® accessibility settings significantly improved performance of participants with more progressed DR. Additionally, other factors, including age, computer experience, visual acuity, and menu location were significant predictors of the time required for subjects to complete the task. Categories and Subject Descriptors H.5.2 [Information Interfaces and Presentation]: User Interfaces – Auditory (non-speech) feedback, Haptic I/O, User- centered Design; H.1.2 [Models and Principles]: User/Machine Systems – Human information processing General Terms Design, Human Factors. Keywords Multimodal feedback, Windows accessibility settings, visual impairment, diabetic retinopathy, auditory feedback, haptic feedback, menus Permission to make digital or hard copies of all or part of this work for personal or classroom use is granted without fee provided that copies are not made or distributed for profit or commercial advantage and that copies bear this notice and the full citation on the first page. To copy otherwise, or republish, to post on servers or to redistribute to lists, requires prior specific permission and/or a fee. ASSETS'04, October 18–20, 2004, Atlanta, Georgia, USA. Copyright 2004 ACM 1-58113-911-X/04/0010...$5.00. 1. INTRODUCTION 1.1 Diabetic Retinopathy and Computer Use The needs of computer users with limited vision have been often overshadowed by the needs of users who are blind. Despite estimates that there are three times as many individuals who are visually impaired as those who are blind [13], “paradoxically, providing access to users who do not see at all may be easier than doing so for those who see but with low vision” [3, p. 3]. People with Diabetic Retinopathy (DR) represent a large segment of the population with visual impairments. DR affects 40-45% of the approximately 18 million Americans who have diabetes [1, 12]. DR is an ocular condition that degrades performance of the retina over time through the bulging, leaking, or scarring of retinal blood vessels. A loss of fine detail in central vision is typically one of the first and most common symptoms, but the disease can eventually lead to retinal detachment, glaucoma, and blindness at its most severe. Eventually, most people with diabetes will develop some degree of DR [1]. DR is common to both type 1 diabetes (which usually occurs before age 30) and type 2 diabetes (which usually occurs after age 40), so it affects a broader range of people than many other ocular conditions. It also covers a wide spectrum of severity and may or may not progress uniformly in severity, implying that people with DR may have varying degrees of residual vision, regardless of age and other factors. Because of its prevalence among the diabetic population and its impact on a wide age range, DR is an important ocular condition to investigate in the context of studying universal access to computing technologies. As the vast majority of people with DR retain some degree of residual vision, tools developed for completely blind individuals may be unsuitable. Therefore, it is of critical importance to understand and model task performance under conditions employing accessibility enhancements especially concerning people who have visual impairments resulting from diseases with high incidence rates, such as DR. 1.2 Interactions Involving Computer Users with Visual Impairments In compliance with accessibility requirements, most computer operating systems offer preinstalled configurations that enable users with impaired vision to see the screen differently through a variety of screen enhancements. The Microsoft Windows ® XP 118
Transcript of Strategic design for users with diabetic retinopathy
Strategic Design for Users with Diabetic Retinopathy: Factors Influencing Performance in a Menu-Selection Task
Paula J. Edwards, Leon Barnard, V. Kathlene Emery, Ji Soo Yi,
Kevin P. Moloney, Thitima Kongnakorn, Julie A. Jacko, and François Sainfort
Laboratory for Human-Computer Interaction and Health Care Informatics
School of Industrial and Systems Engineering Georgia Institute of Technology
Atlanta, GA USA
Pamela R. Oliver, Joseph Pizzimenti, Annette Bade, Greg Fecho,
and Josephine Shallo-Hoffmann Nova Southeastern University
College of Optometry Ft. Lauderdale, Florida USA
ABSTRACT This paper examines factors that affect performance of a basic menu selection task by users who are visually healthy and users with Diabetic Retinopathy (DR) in order to inform better interface design. Interface characteristics such as multimodal feedback, Windows® accessibility settings, and menu item location were investigated. Analyses of Variance (ANOVA) were employed to examine the effects of interface features on task performance. Linear regression was used to further examine and model various contextual factors that influenced task performance. Results indicated that Windows® accessibility settings significantly improved performance of participants with more progressed DR. Additionally, other factors, including age, computer experience, visual acuity, and menu location were significant predictors of the time required for subjects to complete the task.
Categories and Subject Descriptors H.5.2 [Information Interfaces and Presentation]: User Interfaces – Auditory (non-speech) feedback, Haptic I/O, User-centered Design; H.1.2 [Models and Principles]: User/Machine Systems – Human information processing
General Terms Design, Human Factors.
Keywords Multimodal feedback, Windows accessibility settings, visual impairment, diabetic retinopathy, auditory feedback, haptic feedback, menus
Permission to make digital or hard copies of all or part of this work for personal or classroom use is granted without fee provided that copies are not made or distributed for profit or commercial advantage and that copies bear this notice and the full citation on the first page. To copy otherwise, or republish, to post on servers or to redistribute to lists, requires prior specific permission and/or a fee. ASSETS'04, October 18–20, 2004, Atlanta, Georgia, USA. Copyright 2004 ACM 1-58113-911-X/04/0010...$5.00.
1. INTRODUCTION 1.1 Diabetic Retinopathy and Computer Use The needs of computer users with limited vision have been often overshadowed by the needs of users who are blind. Despite estimates that there are three times as many individuals who are visually impaired as those who are blind [13], “paradoxically, providing access to users who do not see at all may be easier than doing so for those who see but with low vision” [3, p. 3]. People with Diabetic Retinopathy (DR) represent a large segment of the population with visual impairments. DR affects 40-45% of the approximately 18 million Americans who have diabetes [1, 12]. DR is an ocular condition that degrades performance of the retina over time through the bulging, leaking, or scarring of retinal blood vessels. A loss of fine detail in central vision is typically one of the first and most common symptoms, but the disease can eventually lead to retinal detachment, glaucoma, and blindness at its most severe. Eventually, most people with diabetes will develop some degree of DR [1]. DR is common to both type 1 diabetes (which usually occurs before age 30) and type 2 diabetes (which usually occurs after age 40), so it affects a broader range of people than many other ocular conditions. It also covers a wide spectrum of severity and may or may not progress uniformly in severity, implying that people with DR may have varying degrees of residual vision, regardless of age and other factors. Because of its prevalence among the diabetic population and its impact on a wide age range, DR is an important ocular condition to investigate in the context of studying universal access to computing technologies. As the vast majority of people with DR retain some degree of residual vision, tools developed for completely blind individuals may be unsuitable. Therefore, it is of critical importance to understand and model task performance under conditions employing accessibility enhancements especially concerning people who have visual impairments resulting from diseases with high incidence rates, such as DR.
1.2 Interactions Involving Computer Users with Visual Impairments In compliance with accessibility requirements, most computer operating systems offer preinstalled configurations that enable users with impaired vision to see the screen differently through a variety of screen enhancements. The Microsoft Windows® XP
118

operating system offers a magnification window, various text, icon, and menu sizes, and high contrast color schemes. Increasing the size of screen elements and enhancing the contrast between background and foreground are often recommended for computer users with visual impairments [2]. However, the Windows® accessibility settings, which follow these general principles, have largely eluded empirical validation by the academic research community. Thus the effectiveness and utility of these solutions, for a variety of users with visual impairments, is far from completely understood and have not been documented. Another strategy sometimes employed to aid computer users with visual and other types of impairments is the use of multimodal feedback. By supplying redundant information about interaction features and events in the form of non-visual feedback, computer users with impaired vision may experience more engaging interaction than if the information was conveyed solely through visual means. By using multimodal feedback, important information in the dialogue between human and computer may become more salient, and therefore more meaningful, to the user. Multimodal feedback has been investigated in a variety of applications in human-computer interaction (HCI), such as steering and targeting tasks [5, 14], drag-and-drop interactions [10], and scrolling operations[11]. Multimodal feedback takes advantage of untapped human sensory channels as input channels to provide additional and/or redundant information during interaction. The most common forms of multimodal feedback are auditory and haptic, which utilize the senses of hearing and touch, respectively. This feedback combination has great potential to improve the performance of users with visual impairments [17]. In a study by Jacko et al. [10], the addition of auditory and haptic information to visual feedback in a drag-and-drop task involving users who had Age-related Macular Degeneration yielded better performance than visual feedback alone. Multimodal feedback also has the potential to enhance interaction for users with a variety of impairments or no impairments at all [17], because the additional modalities, if used appropriately, can provide enhanced sensory input without increasing the complexity of the task or introducing new demands on the user. Because of this, multimodal feedback is often regarded as less of an assistive technology and more of a transparent and universal interface enhancement than other approaches for people with visual impairments.
1.3 Study Objectives The primary objective of the study presented in this paper was to determine what potential benefits, if any, the Windows® accessibility settings and multimodal feedback, alone and in combination, could offer users with visual impairments performing a common direct manipulation task. A secondary objective was to establish an understanding of additional factors that contribute to performance deficits for users with visual impairments, in order to generate recommendations for design. In this study, the Windows® accessibility settings and multimodal feedback were implemented in relatively standard configurations so that a high level of expertise or effort was not required from those who would be using or implementing the enhancements. The study focused on one key interaction task, menu selection, with a diverse group of people including individuals with DR and age-matched participants (controls) who possessed no ocular disease.
2. METHODOLOGY Twenty-nine volunteers from the Nova Southeastern University (NSU) College of Optometry patient pool and associates of NSU staff participated in the study and were assigned to one of three groups, depending on ocular condition. The Control Group (n=9) consisted of participants who had no limiting ocular pathology. Another group (Group 1, n=9) was formed from participants who had comparable visual acuity to the Control Group but were diabetic with evidence of retinopathy. The final group (Group 2, n=6) consisted of diabetic participants who also had evidence of retinopathy, but whose acuity was worse than the Control Group and Group 1. (See Table 1 for the visual acuities of each group). All participants were screened for adequate computer experience, as this has been shown to have a significant effect on performance, even for simple tasks [6, 7]. For the ANOVA, 5 participants were excluded from the analyses. Three were excluded because they did not meet the acuity requirements for Group 2 and a fourth did not meet the acuity requirements for the Control Group. Another participant was excluded due to inadequate computer experience. While acuity and other visual characteristics differed between the groups, the three groups were statistically equivalent with respect to age, gender, education level, mental and physical health (as assessed by the SF-12™ Health Survey [18]) and dexterity (when adjusted for differences in acuity). Group profiles are presented in Table 1.
Table 1. Group profiles.
Group Control Group 1 Group 2
DR Absent Present Present
Acuity [20/20-20/30) [20/20-20/30) [20/30-20/50) The task consisted of a series of basic menu navigation and selection actions under combinations of two interface conditions, consisting of two levels each (See Table 2). A menu interface was designed for the study to emulate selected menus from the Microsoft Word™ menu bar. The interface consisted of three menus containing five items each. One of the menus with which participants interacted is shown in Figures 1 and 2. These figures depict the relative sizes of the Normal (Figure 1) and Windows® accessibility (Figure 2) conditions. The normal menu interface (Figure 1) had smaller, black text on a light background and a blue highlight. Figure 2 shows the menu interface with the Windows® accessibility settings applied, resulting in larger, bold, white text on a black background and a purple highlight. Participants interacted with each of these menu interfaces both with and without auditory and haptic feedback, resulting in four possible interaction conditions (see Table 2).
Figure 1. The normal menu interface condition.
119

Figure 2. The Windows® accessibility interface condition.
Table 2. The four interaction conditions resulting from the two interface factors.
Factor 1: Multimodal
Visual feedback Visual, auditory, and haptic feedback
Normal Interface
Normal (N) Multimodal (M)
Fact
or 2
: W
indo
ws®
A
cces
sibi
lity
Windows® Accessibility Interface
Windows® accessibility (WA)
Multimodal & Windows® accessibility (M+WA)
The multimodal feedback was intended to reflect the level of feedback that is currently commercially available, and was therefore implemented as follows: The auditory feedback was a simple and brief abstract sound, and the haptic feedback was generated through a Saitek™ TouchForce™ [15] optical mouse, which was otherwise very similar to currently available two-button optical mice. The haptic feedback was a short mechanical vibration, generated from a motor inside the mouse. Both types of feedback occurred when the mouse crossed a boundary between menus or items. It should be noted that the forms of auditory and haptic feedback remained the same regardless of the participants’ proximity to the target menu or item. The feedback generation software was unaware of the position of the target menu and item. This lack of “intelligent” feedback is representative of the current commercially available PC peripherals integrating multimodal feedback, which this experiment endeavored to empirically evaluate. Within each scenario, the participant was instructed to locate each menu item once, thus experiencing 15 trials per condition. The goal menu item appeared centered in the bottom half of the screen in 36-pt Arial bold font. No participants reported difficulties reading the goal menu items. Three menus were permanently located in the upper-left corner of the screen in a left, middle, and right position. The placement of menus and items were consistent throughout the experiment. When a participant selected a menu item, either correctly or incorrectly, a new goal was presented in text at the bottom of the screen. Participants performed practice trials for each condition at the start of the experiment to ensure that they felt comfortable with the task prior to completion of the
trials. Once the task commenced, Total Time (TT) was recorded for each trial. Also, error measures, including Missed Opportunities (MO) were recorded. The order in which the conditions were presented and the order of the trials were randomized for each participant to control for learning and location effects.
3. RESULTS 3.1 Time A graph of the average Total Times (TT) for each trial between conditions for each group is shown in Figure 3. A repeated measures ANOVA was used to analyze TT between conditions. Since the initial analysis revealed that the data failed to meet the assumption that error terms are normally distributed, an inverse transformation (1/TT) was applied to the data, which can be interpreted as the rate of task completion.
0123456789
1011
Control Group 1 Group 2
Tota
l Tim
e (s
ec.)
N WA M M+WA
Figure 3. Average Total Time for each group.
The main effects and two-way interaction effects from the ANOVA are presented in Table 3. The results indicate significant main effects of acuity group, Windows® accessibility settings, and multimodal feedback on 1/TT.
Table 3. ANOVA results for 1/TT.
Effects df F p-value Group 2 51.55 < 0.001
Windows® accessibility 1 50.51 < 0.001
Multimodality 1 4.30 0.039
Windows® accessibility × Group 2 9.91 < 0.001
Multimodality × Group 2 0.09 0.912
Multimodality × Windows® accessibility 1 0.35 0.554
The clarity of the results is marred by the significant interaction between the acuity groups and the Windows® accessibility settings, indicating that the effect of the Windows® accessibility settings was not consistent across groups, which can be seen in Figure 3. Ninety-five percent confidence intervals were used to
120
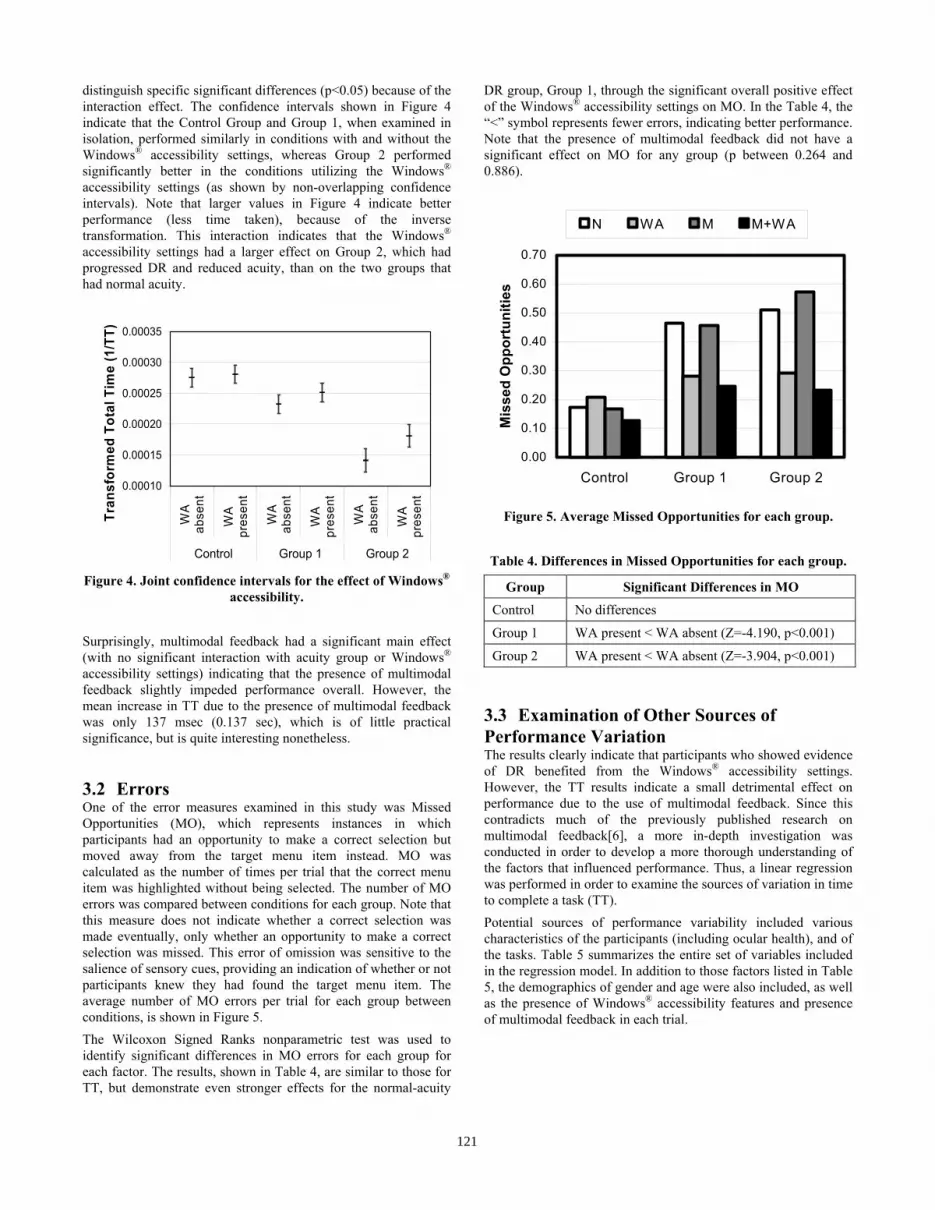
distinguish specific significant differences (p<0.05) because of the interaction effect. The confidence intervals shown in Figure 4 indicate that the Control Group and Group 1, when examined in isolation, performed similarly in conditions with and without the Windows® accessibility settings, whereas Group 2 performed significantly better in the conditions utilizing the Windows® accessibility settings (as shown by non-overlapping confidence intervals). Note that larger values in Figure 4 indicate better performance (less time taken), because of the inverse transformation. This interaction indicates that the Windows® accessibility settings had a larger effect on Group 2, which had progressed DR and reduced acuity, than on the two groups that had normal acuity.
0.00010
0.00015
0.00020
0.00025
0.00030
0.00035
WA
abse
nt
WA
pres
ent
WA
abse
nt
WA
pres
ent
WA
abse
nt
WA
pres
ent
Control Group 1 Group 2
Tran
sfor
med
Tot
al T
ime
(1/T
T)
Figure 4. Joint confidence intervals for the effect of Windows®
accessibility. Surprisingly, multimodal feedback had a significant main effect (with no significant interaction with acuity group or Windows® accessibility settings) indicating that the presence of multimodal feedback slightly impeded performance overall. However, the mean increase in TT due to the presence of multimodal feedback was only 137 msec (0.137 sec), which is of little practical significance, but is quite interesting nonetheless.
3.2 Errors One of the error measures examined in this study was Missed Opportunities (MO), which represents instances in which participants had an opportunity to make a correct selection but moved away from the target menu item instead. MO was calculated as the number of times per trial that the correct menu item was highlighted without being selected. The number of MO errors was compared between conditions for each group. Note that this measure does not indicate whether a correct selection was made eventually, only whether an opportunity to make a correct selection was missed. This error of omission was sensitive to the salience of sensory cues, providing an indication of whether or not participants knew they had found the target menu item. The average number of MO errors per trial for each group between conditions, is shown in Figure 5. The Wilcoxon Signed Ranks nonparametric test was used to identify significant differences in MO errors for each group for each factor. The results, shown in Table 4, are similar to those for TT, but demonstrate even stronger effects for the normal-acuity
DR group, Group 1, through the significant overall positive effect of the Windows® accessibility settings on MO. In the Table 4, the “<” symbol represents fewer errors, indicating better performance. Note that the presence of multimodal feedback did not have a significant effect on MO for any group (p between 0.264 and 0.886).
0.00
0.10
0.20
0.30
0.40
0.50
0.60
0.70
Control Group 1 Group 2
Mis
sed
Opp
ortu
nitie
s
N WA M M+WA
Figure 5. Average Missed Opportunities for each group. Table 4. Differences in Missed Opportunities for each group.
Group Significant Differences in MO
Control No differences
Group 1 WA present < WA absent (Z=-4.190, p<0.001)
Group 2 WA present < WA absent (Z=-3.904, p<0.001)
3.3 Examination of Other Sources of Performance Variation The results clearly indicate that participants who showed evidence of DR benefited from the Windows® accessibility settings. However, the TT results indicate a small detrimental effect on performance due to the use of multimodal feedback. Since this contradicts much of the previously published research on multimodal feedback[6], a more in-depth investigation was conducted in order to develop a more thorough understanding of the factors that influenced performance. Thus, a linear regression was performed in order to examine the sources of variation in time to complete a task (TT). Potential sources of performance variability included various characteristics of the participants (including ocular health), and of the tasks. Table 5 summarizes the entire set of variables included in the regression model. In addition to those factors listed in Table 5, the demographics of gender and age were also included, as well as the presence of Windows® accessibility features and presence of multimodal feedback in each trial.
121
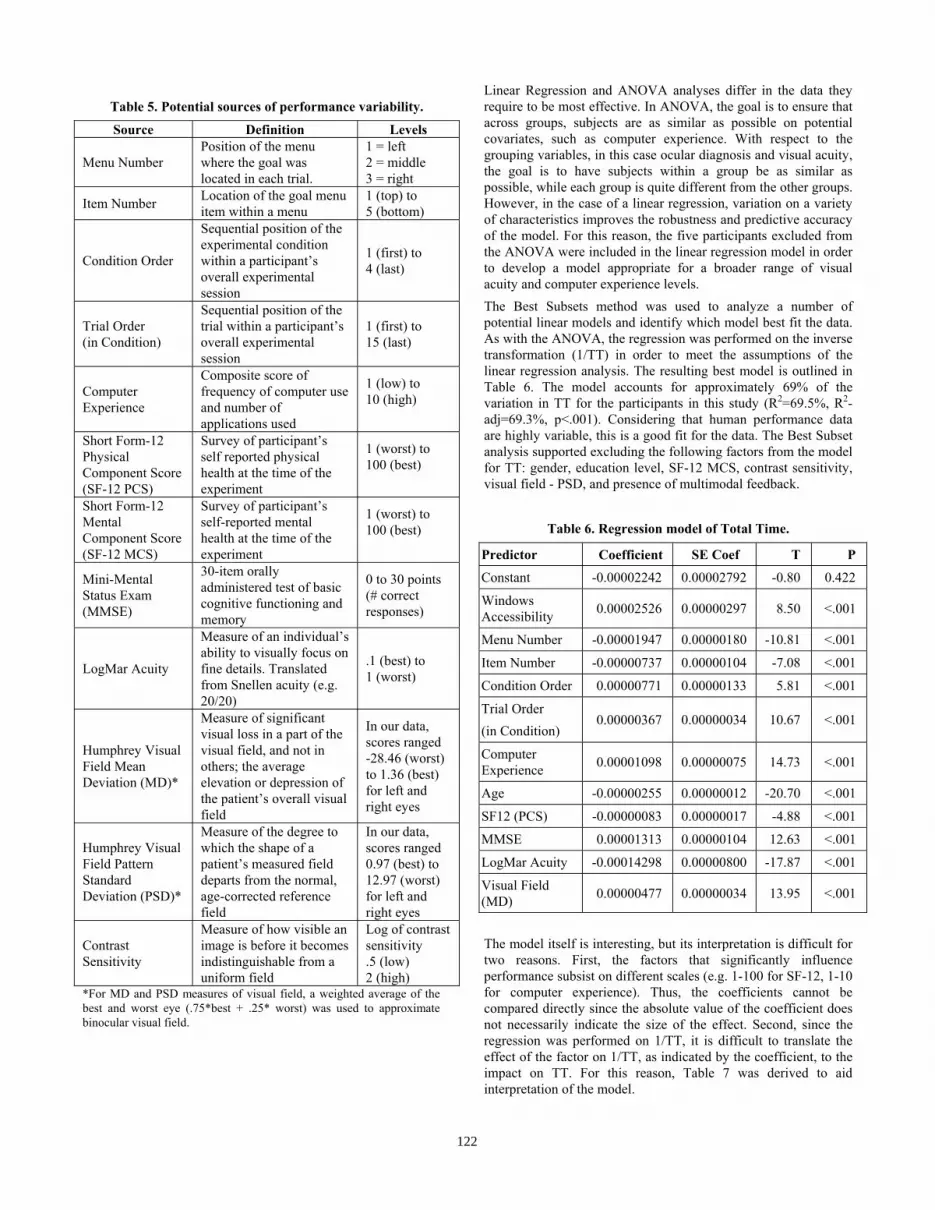
Table 5. Potential sources of performance variability.
Source Definition Levels
Menu Number Position of the menu where the goal was located in each trial.
1 = left 2 = middle 3 = right
Item Number Location of the goal menu item within a menu
1 (top) to 5 (bottom)
Condition Order
Sequential position of the experimental condition within a participant’s overall experimental session
1 (first) to 4 (last)
Trial Order (in Condition)
Sequential position of the trial within a participant’s overall experimental session
1 (first) to 15 (last)
Computer Experience
Composite score of frequency of computer use and number of applications used
1 (low) to 10 (high)
Short Form-12 Physical Component Score (SF-12 PCS)
Survey of participant’s self reported physical health at the time of the experiment
1 (worst) to 100 (best)
Short Form-12 Mental Component Score (SF-12 MCS)
Survey of participant’s self-reported mental health at the time of the experiment
1 (worst) to 100 (best)
Mini-Mental Status Exam (MMSE)
30-item orally administered test of basic cognitive functioning and memory
0 to 30 points (# correct responses)
LogMar Acuity
Measure of an individual’s ability to visually focus on fine details. Translated from Snellen acuity (e.g. 20/20)
.1 (best) to 1 (worst)
Humphrey Visual Field Mean Deviation (MD)*
Measure of significant visual loss in a part of the visual field, and not in others; the average elevation or depression of the patient’s overall visual field
In our data, scores ranged -28.46 (worst) to 1.36 (best) for left and right eyes
Humphrey Visual Field Pattern Standard Deviation (PSD)*
Measure of the degree to which the shape of a patient’s measured field departs from the normal, age-corrected reference field
In our data, scores ranged 0.97 (best) to 12.97 (worst) for left and right eyes
Contrast Sensitivity
Measure of how visible an image is before it becomes indistinguishable from a uniform field
Log of contrast sensitivity .5 (low) 2 (high)
*For MD and PSD measures of visual field, a weighted average of the best and worst eye (.75*best + .25* worst) was used to approximate binocular visual field.
Linear Regression and ANOVA analyses differ in the data they require to be most effective. In ANOVA, the goal is to ensure that across groups, subjects are as similar as possible on potential covariates, such as computer experience. With respect to the grouping variables, in this case ocular diagnosis and visual acuity, the goal is to have subjects within a group be as similar as possible, while each group is quite different from the other groups. However, in the case of a linear regression, variation on a variety of characteristics improves the robustness and predictive accuracy of the model. For this reason, the five participants excluded from the ANOVA were included in the linear regression model in order to develop a model appropriate for a broader range of visual acuity and computer experience levels. The Best Subsets method was used to analyze a number of potential linear models and identify which model best fit the data. As with the ANOVA, the regression was performed on the inverse transformation (1/TT) in order to meet the assumptions of the linear regression analysis. The resulting best model is outlined in Table 6. The model accounts for approximately 69% of the variation in TT for the participants in this study (R2=69.5%, R2-adj=69.3%, p<.001). Considering that human performance data are highly variable, this is a good fit for the data. The Best Subset analysis supported excluding the following factors from the model for TT: gender, education level, SF-12 MCS, contrast sensitivity, visual field - PSD, and presence of multimodal feedback.
Table 6. Regression model of Total Time.
Predictor Coefficient SE Coef T P
Constant -0.00002242 0.00002792 -0.80 0.422
Windows Accessibility 0.00002526 0.00000297 8.50 <.001
Menu Number -0.00001947 0.00000180 -10.81 <.001
Item Number -0.00000737 0.00000104 -7.08 <.001
Condition Order 0.00000771 0.00000133 5.81 <.001
Trial Order (in Condition)
0.00000367 0.00000034 10.67 <.001
Computer Experience 0.00001098 0.00000075 14.73 <.001
Age -0.00000255 0.00000012 -20.70 <.001
SF12 (PCS) -0.00000083 0.00000017 -4.88 <.001
MMSE 0.00001313 0.00000104 12.63 <.001
LogMar Acuity -0.00014298 0.00000800 -17.87 <.001
Visual Field (MD) 0.00000477 0.00000034 13.95 <.001
The model itself is interesting, but its interpretation is difficult for two reasons. First, the factors that significantly influence performance subsist on different scales (e.g. 1-100 for SF-12, 1-10 for computer experience). Thus, the coefficients cannot be compared directly since the absolute value of the coefficient does not necessarily indicate the size of the effect. Second, since the regression was performed on 1/TT, it is difficult to translate the effect of the factor on 1/TT, as indicated by the coefficient, to the impact on TT. For this reason, Table 7 was derived to aid interpretation of the model.
122

Table 7. Effect of change in each factor, holding other factors constant, on Total Time (TT).
Predicted Value Holding other predictors constant
Factor Coefficient Predictor Value 1/TT Predicted TT
(msec) Change (msec)
Baseline % Change
from Baseline Absent 4565 Windows®
Accessibility 0.000025 Present
0.00022 0.00024 4093 -472 -11%
1 4192
2 4565 373 9% Menu Number -0.000019
3
0.00024 0.00022 0.00020 5010 818 20%
1 4277
3 4565 288 7% Item Number -0.000007
5
0.00023 0.00022 0.00020 4894 617 14%
1 4731
2 4565 -166 -4% Condition Order 0.000008
4
0.00021 0.00022 0.00023 4265 -466 -10%
1 5075
7 4565 -510 -10% Trial Order
(in condition) 0.000004
15
0.00020 0.00022 0.00025 4025 -1050 -21%
6 5073
8 4565 -508 -10% Computer Experience 0.000011
10
0.00020 0.00022 0.00024 4149 -924 -18%
40 3886
55 4565 679 17% Age -0.000003
70
0.00026 0.00022 0.00018 5531 1645 42%
34 4398
44 4565 167 4% SF12 - PCS -0.000001
54
0.00023 0.00022 0.00021 4745 347 8%
27 5016
28.5 4565 -451 -9% MMSE 0.000013
30
0.00020 0.00022 0.00024 4188 -828 -17%
0 (20/20) 4565
0.176 (20/30) 5157 592 13% LogMar Acuity
(Acuity) -0.000143
0.398 (20/50)
0.00022 0.00019 0.00016 6167 1602 35%
1 4037 -5 4565 528 13% Visual Field (MD) -0.000005
-11
0.00025 0.00022 0.00019 5251 1214 30%
In Table 7, the predicted values for TT are listed for a range of values for each predictive factor. In calculating the Predicted TT for a given value of a factor, the value of all other factors was held constant at approximately the mean for that factor, with the exception of Acuity, which was held constant at 20/20. This enabled us to determine the change in TT (both in msec and percentage change) resulting solely from the change in value of the given factor. The levels examined for each factor represent approximately the mean for the factor and the mean plus or minus approximately one standard deviation. For example, looking at the Age factor, we see that an increase in age from 40 to 55 years of age resulted in an increase in predicted TT of 592 msec, or
13% of the TT expected at age 40. An increase in age from 40 to 70 years resulted in an increase of 1602 msec, or 35%. Additionally, we note that for these subjects, TT decreased 21% (1050 ms) from the participants’ first menu selection (1) to their last (15) within an interface condition. This model and others like it have great potential in the identification of productivity tradeoffs in the strategic design of menu systems for users with diverse needs. Using % Change from Baseline provides a guide as to how much variation in TT was accounted for by each factor. The results demonstrate that the presence of the Windows® accessibility
123

settings and the location of each menu item influenced task efficiency (TT). The subjects’ visual capabilities, as indicated by visual acuity and visual field - MD, appeared to have a very strong influence on performance, with up to 35% and 30% increases in TT, respectively. Also interesting to note is the significant effect of Trial Order, Condition Order, and Mini-Mental Status Exam (MMSE) score, which tests, among other things, a participant’s memory. Other participant characteristics that effected TT were age, computer experience, and the SF-12 PCS, an indicator of physical health. However it is interesting to note that the presence of multimodality is not significant in the regression model. This indicates that though the ANOVA identified a significant performance decrement caused by multimodal feedback, the size of this effect was not large enough to make it a significant predictor of rate of task completion.
4. DISCUSSION In examining the ANOVA results, we find that the Control Group did not perform significantly differently with respect to any of the conditions, indicating that their lack of visual impairment enabled them to perform the task very efficiently in all design conditions. This also suggests that visually healthy users were not hindered by the enhancements that were examined in this study. Group 2, on the other hand, which included participants with dramatic acuity loss and DR, showed significantly improved performance in conditions that included WA, indicating a beneficial effect of the Windows® accessibility settings for basic menu selection. Group 1, which had the same range of acuity as the Control Group, but possessed DR, performed slightly, though not significantly, faster in conditions including WA and notably, made significantly fewer errors in those conditions. These results support the use of the Windows® accessibility settings for users with visual impairments resulting from DR. The benefits of using these settings are likely due to improvements to the users’ ability to read the menus, and increasing the size of the target menu, making it easier to select. However, it is important to remember that the task was confined to one type of interaction scenario. Also, increasing the size of screen elements can create competition for screen real estate, leading to possible confusion or added mouse movement [4]. However, this tradeoff between screen crowding and improved performance may be worthwhile, especially for users with visual impairments and further, if the performance benefits of the Windows® accessibility settings observed here extend to other tasks. The multimodal feedback used in this study appears to have a small detrimental effect on TT. This is in contrast to the performance improvement observed in a drag and drop task. This indicates that multimodal feedback was not valuable for this task as it has proven to be for drag-and-drop tasks [17], for example. In menu selection, many possible targets exist making it difficult to employ a multimodal feedback paradigm that enables guiding the user to their intended choice. Additionally, the nature of the menu selection task is quite different from that of a drag and drop task, which may further reduce the effectiveness of multimodal feedback. Specifically, the drag and drop task is primarily a visual search task with all targets visible to the user at one time. In menu selection, however, the target items are hidden until the menu is selected, resulting in a visual search task with an increased load on memory (i.e., remembering which menu the target item belongs to). This working memory load becomes more
pronounced as the depth of a menu increases, and can also be dependent on the user's knowledge structure of the domain as compared to the manner in which the category descriptors used in the menu were derived and organized [8, 9]. The memory requirement of the task used in this study is embodied in the strong effect of computer experience, order, and MMSE on predicted TT. Since the menus were based on common MS Word menus, participants with computer experience had prior knowledge of which menu would contain the target item. For all users, the order effect shows that the earlier trials helped them remember or learn where the target item was located. This learning/remembering of item location is further supported by the effect of MMSE since this test of cognitive functioning tests attention and immediate and short-term recall [16]. By understanding the relatively stronger memory demand for this task, it may be possible to design more effective multimodal feedback that provides additional cues to improve the user’s recall of the location of each item. The regression model also provides further insight into designing menu interfaces, especially for users hindered by loss of acuity and visual field, as DR patients typically are. Despite the fact that the order in which target menu items occurred was randomized, the location of the menu and item were significant predictors of total time. The increase due to the item number is logical considering the greater distance the cursor must move to reach items at the bottom of the list. However, for menu items, the directionality (increasing times for menus from left to right), indicate that users’ tendency to read from left to right is driving the time difference, rather than the distance from the starting point, which is actually shorter for menus on the right since the cursor started at the center of the screen for each trial. This finding supports the conclusion that, especially for users with visual impairments, it is important to put the most frequently used items in the left-most menus, and at the top of the menu. Additionally, care should be taken to ensure that items are grouped logically in the menus and that menus are named intuitively, so that learning the menu item locations is simplified and the need for continued, extensive visual search is reduced.
5. CONCLUSIONS This study examined the factors that affect those who are visually healthy and those who experience visual impairments (resulting from DR) during performance of a menu selection task. The results show that while visual characteristics (acuity and visual field) and personal characteristics (age, computer experience, mental capabilities, physical capabilities) have strong effects on performance, detrimental effects of these characteristics can be overcome through effective interface design and training. Use of the readily-available Windows® accessibility settings is one way to improve menu selection performance, although it is possible in some scenarios that the benefits of the Windows® accessibility settings for users with visual impairments would be out-weighed by limitations introduced, such as decreased screen real estate and inappropriate resizing of screen elements. Additionally, for users with visual impairments, it is even more critical that menu design is simple and logical, to reduce memory and visual scanning requirements for the task. The strong order and computer experience effects indicate that training programs could be quite effective at helping users with
124
visual impairments become more proficient with menu-based interfaces. Further research is required to develop a more thorough understanding of the effect of these visual and personal characteristics on errors of omission and commission. Understanding which factors, in addition to the use of Windows® accessibility settings, reduce errors will enable us to design interfaces that further improve performance for users with visual impairments. Additionally, further investigation of more complex configurations of multimodal feedback is needed to determine if this feedback can be used to improve learning of menu item location and reduce the memory requirements of completing a menu selection task.
6. ACKNOWLEDGMENTS This research was made possible through funding awarded to Julie A. Jacko by the Intel Corporation and the National Science Foundation (BES-9896304). Paula Edwards’s participation was supported in part with a National Science Foundation Graduate Research Fellowship. We also acknowledge the support of Nova Southeastern University, for so generously recruiting study participants and providing the space within which this experimentation was conducted.
7. REFERENCES [1] American Diabetes Association. Basic Diabetes Information,
2003.
[2] Arditi, A. Making Text Legible: Designing for People with Partial Sight, 2003.
[3] Arditi, A. Web Accessibility and Low Vision. Aging & Vision, 14 (2). 2-3.
[4] Chadwick-Dias, A., McNulty, M. and Tullis, T., S. Web Usability and Age: How Design Changes Can Improve Performance. in Proceedings of the 2003 ACM Conference on Universal Usability (CUU 03), ACM Press, Vancouver, BC, Canada, 2003, 30-37.
[5] Dennerlein, J.T., Martin, D.B. and Hasser, C. Force-feedback improves performance for steering and combined steering-targeting tasks. in Proceedings of the SIGCHI conference on Human factors in computing systems (CHI 2000), ACM Press, The Hague, The Netherlands, 2000, 423-429.
[6] Emery, V.K., Edwards, P.J., Jacko, J.A., Moloney, K., Barnard, L., Kongnakorn, T., Sainfort, F. and Scott , I.U. Toward Achieving Universal Usability For Older Adults Through Multimodal Feedback. in Proceedings of the 2003 ACM Conference on Universal Usability (CUU 03), ACM Press, Vancouver, BC, Canada, 2003, 46-53.
[7] Jacko, J.A., Emery, V.K., Edwards, P.J., Ashok, M., Barnard, L., Kongnakorn, T., Moloney, K.P. and Sainfort, F. The effects of multimodal feedback on older adults' task performance given varying levels of computer experience. Behaviour and Information Technology, in press.
[8] Jacko, J.A. and Salvendy, G. Hierarchical menu design: breadth, depth, and task complexity. Perceptual and Motor Skills, 82. 1187-1201.
[9] Jacko, J.A., Salvendy, G. and Koubek, R.J. Modeling of menu design in computerized work. Interacting With Computers, 7 (3). 304-330.
[10] Jacko, J.A., Scott , I.U., Sainfort, F., Moloney, K., Kongnakorn, T., Zorich, B. and Emery, V.K. Effects of Multimodal Feedback on the Performance of Older Adults with Normal and Impaired Vision. Lecture Notes in Computer Science, 2615. 3-22.
[11] McGee, M.R., A haptically enhanced scrollbar: Force feedback as a means of reducing the problems associated with scrolling. in First PHANToM Users Research Symposium (PURS), (1999), 17-20.
[12] National Eye Institute. Diabetic Retinopathy, 2003.
[13] Newell, A.F. and McGregor, P. Human-computer interfaces for people with disabilities. in Helander, M.G., Landauer, T.K. and Prabhu, P.V. eds. Handbook of human-computer interaction, Elsevier, Amsterdam, The Netherlands, 1997, 813-824.
[14] Oakley, I., McGee, M.R., Brewster, S.A. and Gray, P. Putting the feel in ’look and feel‘. in Proceedings of the SIGCHI conference on Human factors in computing systems, ACM Press, The Hague, The Netherlands, 2000, 415-422.
[15] Saitek Industries. TouchForce Mouse, Saitek Industries, 2003.
[16] Tufts-New England Medical Center Dept. of Psychiatry. The Mini Mental State Examination, 2004.
[17] Vitense, H.S., Jacko, J.A. and Emery, V.K. Foundations for improved interaction by individuals with visual impairments through multimodal feedback. Universal Access in the Information Society (UAIS), 2 (1). 76-87.
[18] Ware, J.E., Kosinski, M. and Keller, S.D. How to Score the SF-12 Physical and Mental Health Summary Scales. The Health Institute, New England Medical Center, Boston, MA, USA, 1995.
125