Colander: A Probability-Based Support Vector Machine Algorithm for Automatic Screening for CID...
18
Colander: A probability-based support vector machine-learning algorithm for automatic screening for CID spectra of phosphopeptides prior to database search Bingwen Lu 1 , Cristian I. Ruse 1 , and John R. Yates III * Department of Chemical Physiology, SR-11, The Scripps Research Institute, La Jolla, California 92037, USA Abstract We developed a probability-based machine-learning program, Colander, to identify tandem mass spectra that are highly likely to represent phosphopeptides prior to database search. We identified statistically significant diagnostic features of phosphopeptide tandem mass spectra based on ion trap CID MS/MS experiments. Statistics for the features are calculated from 376 validated phosphopeptide spectra and 376 non-phosphopeptide spectra. A probability-based support vector machine (SVM) program, Colander, was then trained on five selected features. Datasets were assembled both from LC/LC-MS/MS analyses of large-scale phosphopeptide enrichments from proteolyzed cells, tissues and synthetic phosphopeptides. These datasets were used to evaluate the capability of Colander to select pS/pT-containing phosphopeptide tandem mass spectra. When applied to unknown tandem mass spectra, Colander can routinely remove 80% of tandem mass spectra while retaining 95% of phosphopeptide tandem mass spectra. The program significantly reduced computational time spent on database search by 60% to 90%. Furthermore, pre-filtering tandem mass spectra representing phosphopeptides can increase the number of phosphopeptide identifications under a pre-defined false positive rate. Introduction Protein phosphorylation is a key post-translational modification (PTMs), regulating many biological processes 1 . To enable broad and large-scale analyses of how changes in phosphorylation states regulate processes in cells, new approaches are under development and refinement. Tandem mass spectrometry is an important analysis tool for posttranslational modifications as it is capable of not only identifying the amino acid sequence of a peptide, but also pinpointing the location of a modification within the sequence. Analyses of phosphopeptides using mass spectrometers are frequently performed on peptides obtained by trypsin digestion of proteins. As the pattern of posttranslational modifications in a protein can be just as important as a specific site of modification, methods to analyze larger peptide fragments or event intact proteins are increasingly important 2 . The analysis of phosphorylation has an additional complication of stoichiometry as not all of a specific site may be occupied 3 , thus favoring the use of enrichment techniques. A variety of enrichment strategies have been developed for improving detection of phosphopeptides. Antibodies are an effective tool for enrichment of phosphotyrosine (pY)-containing peptides 4,5 prior to mass spectrometry. Phosphoserine (pS)/phosphothreonine (pT) containing peptides are usually enriched by stand alone procedures or by a combination of techniques such as: immobilized * Corresponding author. Email: [email protected]. 1 These two authors contributed equally to this work. NIH Public Access Author Manuscript J Proteome Res. Author manuscript; available in PMC 2008 November 25. Published in final edited form as: J Proteome Res. 2008 August ; 7(8): 3628–3634. doi:10.1021/pr8001194. NIH-PA Author Manuscript NIH-PA Author Manuscript NIH-PA Author Manuscript
Transcript of Colander: A Probability-Based Support Vector Machine Algorithm for Automatic Screening for CID...
Colander: A probability-based support vector machine-learningalgorithm for automatic screening for CID spectra ofphosphopeptides prior to database search
Bingwen Lu1, Cristian I. Ruse1, and John R. Yates III*Department of Chemical Physiology, SR-11, The Scripps Research Institute, La Jolla, California92037, USA
AbstractWe developed a probability-based machine-learning program, Colander, to identify tandem massspectra that are highly likely to represent phosphopeptides prior to database search. We identifiedstatistically significant diagnostic features of phosphopeptide tandem mass spectra based on ion trapCID MS/MS experiments. Statistics for the features are calculated from 376 validatedphosphopeptide spectra and 376 non-phosphopeptide spectra. A probability-based support vectormachine (SVM) program, Colander, was then trained on five selected features. Datasets wereassembled both from LC/LC-MS/MS analyses of large-scale phosphopeptide enrichments fromproteolyzed cells, tissues and synthetic phosphopeptides. These datasets were used to evaluate thecapability of Colander to select pS/pT-containing phosphopeptide tandem mass spectra. Whenapplied to unknown tandem mass spectra, Colander can routinely remove 80% of tandem massspectra while retaining 95% of phosphopeptide tandem mass spectra. The program significantlyreduced computational time spent on database search by 60% to 90%. Furthermore, pre-filteringtandem mass spectra representing phosphopeptides can increase the number of phosphopeptideidentifications under a pre-defined false positive rate.
IntroductionProtein phosphorylation is a key post-translational modification (PTMs), regulating manybiological processes1. To enable broad and large-scale analyses of how changes inphosphorylation states regulate processes in cells, new approaches are under development andrefinement. Tandem mass spectrometry is an important analysis tool for posttranslationalmodifications as it is capable of not only identifying the amino acid sequence of a peptide, butalso pinpointing the location of a modification within the sequence. Analyses ofphosphopeptides using mass spectrometers are frequently performed on peptides obtained bytrypsin digestion of proteins. As the pattern of posttranslational modifications in a protein canbe just as important as a specific site of modification, methods to analyze larger peptidefragments or event intact proteins are increasingly important2. The analysis of phosphorylationhas an additional complication of stoichiometry as not all of a specific site may beoccupied3, thus favoring the use of enrichment techniques. A variety of enrichment strategieshave been developed for improving detection of phosphopeptides. Antibodies are an effectivetool for enrichment of phosphotyrosine (pY)-containing peptides4,5 prior to massspectrometry. Phosphoserine (pS)/phosphothreonine (pT) containing peptides are usuallyenriched by stand alone procedures or by a combination of techniques such as: immobilized
* Corresponding author. Email: [email protected] two authors contributed equally to this work.
NIH Public AccessAuthor ManuscriptJ Proteome Res. Author manuscript; available in PMC 2008 November 25.
Published in final edited form as:J Proteome Res. 2008 August ; 7(8): 3628–3634. doi:10.1021/pr8001194.
NIH
-PA Author Manuscript
NIH
-PA Author Manuscript
NIH
-PA Author Manuscript
metal ion affinity chromatography (IMAC)6,7, chemical replacement of the phosphate groupwith an affinity tag8, strong cation exchange (SCX) chromatography9 or titanium oxidechromatography10.
Collision-induced dissociation (CID) is widely used to fragment both peptides andphosphopeptides to generate the information necessary to identify the amino acid sequenceand identify the site of modification. A major challenge to identifying sites of phosphorylationfrom CID tandem mass spectra is the facile loss of phosphoric acid from phosphoserine andphosphothreonine11. This neutral loss can dominate fragmentation of the peptide backboneand yield little or no sequence ions. A neutral-loss triggered MS3 step can be added to enhancefragmentation of the peptide backbone to improve identification9,12 and quantification13 ofthe phosphopeptide. New dissociation methods such as electron capture dissociation (ECD)14, 15 and ETD16 are capable of generating phosphopeptide spectra without neutral losses andthus generate potentially more informative fragmentation patterns. One study suggests that thehigher sensitivity and faster duty cycle of CID-MS/MS could be used for increasedphosphopeptide identification by ETD in a non-linear Paul trap17. Alternatively, CID-MS/MSand ECD-MS/MS could be used independently to complement each other and potentiallyreduce the false positive rates provided post-acquisition algorithms (PhosTShunter) areapplied18. Two post database-search algorithms were developed for phosphorylation sitelocalization19,20, both of which utilize the binomial probability models to calculate sitelocalization scores from site-determining ions observed in CID-tandem mass spectra. Morerecently, Schlosser et al21 proposed the use of global neutral loss features for phosphorylationsite analysis in individual proteins. Dephosphorylation was also employed for the validationof phosphorylation for QTOF or LTQ-FT data22–24. Lu et al25 also published two automaticmethods for validation of phosphorylation identification from CID-tandem mass spectra. Inthis work, we focus on pre-search filtering of pS/pT-containing phosphopeptide spectra fromCID-tandem mass spectra.
Rapid scanning mass spectrometers such as a linear ion trap can routinely acquire hundreds ofthousands of tandem mass spectra in large-scale proteomic studies. Interrogation of tandemmass spectra to identify modified peptides produces a large computational burden for databasesearch programs26. One method to simplify the search process is to establish if a tandem massspectrum contains the suspected modification before database search. If non-phosphorylatedtandem mass spectra can be filtered out before database searching then this will reduce thenumber of spectra that have to be searched for modifications.
We describe a probability-based support vector machine learning (SVM) program to identifytandem mass spectra containing pS/pT. SVM has been used to validate SEQUEST searchoutput27, to determine charge states for low resolution tandem mass spectra28, to classify massspectrometry data of diseased and normal samples29, and to validate phosphopeptide/spectrummatches25. To develop the algorithm we identified five features that are related to the labileneutral losses of phosphopeptides during mass spectrometry experiment. Two of the featuresare related to the neutral losses from the base peak ion. The other three features are related tothe neutral losses of from any ion. We found that using these features for SVM resulted in goodclassifying power for phosphopeptide spectra and non-phosphopeptide spectra. The algorithmwas evaluated on complex sets of tandem mass spectra of enriched phosphopeptide mixtures,of a non-enriched shotgun peptide mixture, and of synthetic peptides containingphosphoserines.
Lu et al. Page 2
J Proteome Res. Author manuscript; available in PMC 2008 November 25.
NIH
-PA Author Manuscript
NIH
-PA Author Manuscript
NIH
-PA Author Manuscript
Experimental MethodsPreparation of phosphopeptides from complex mixtures
Protein concentration was determined using a modified Bradford assay (Bio-Rad). We usedproteins from three different sources: nuclear extract from rat brain, whole cell lysates of PC12and HEK cells. Phosphatase Inhibitor Cocktail (Calbiochem) was used to preserve thephosphorylation of proteins. Nuclear proteins were extracted from clarified rat brain tissuehomogenate with a nuclear/cytosolic fractionation kit (BioVision, Inc.). PC12 cells weretreated with cAMP for 5 min prior to harvesting and lysis. HEK cells overexpressing beta-1adrenergic receptor were treated with isoproterenol (Sigma) prior to harvesting and lysis.
One milligram of proteins was further processed by methanol/chloroform extraction. Proteinpellet was dissolved by sonication in 50% MeOH in 100mM Tris-HCl (pH 7.6) and digestedwith trypsin (1:50) at 37°C overnight. Phosphopeptides were enriched by a strategy that willbe described elsewhere. Enriched phosphopeptides were then subjected to MudPIT analysis.
Preparation of casein proteinsCasein proteins were obtained from Sigma. Proteins were dissolved in 100mM TRIS (pH 7.6)and digested with trypsin (1:50) at 37°C overnight. Phosphopeptides were enriched by astrategy that will be described elsewhere. Enriched casein phosphopeptides were then analyzedby LC-MS/MS
Yeast whole cell lysate and digestionA protease-deficient Saccharomyces cerevisiae strain BJ546030 was purchased fromAmerican Type Culture Collection (Manassas, VA). The strain was grown to mid log phase(OD 0.6) in YPD, and cells collected by centrifugation were lysed as described previously31.The lysed cells were separated into three fractions (soluble, lightly and heavily washed), andthe soluble fraction was used in this study. The soluble fraction of cells was digested by amethod slightly modified from the one described previously31. Urea was added to the solublefraction of the cell lysate to denature the proteins. Proteins were then reduced with TCEP (5mM final concentration) for 20 minutes, alkylated using iodoacetamide (IAM, 10 mM finalconcentration) for 15 minutes in the dark, and subsequently digested with trypsin. The digestionprocess was stopped by adding formic acid to a final concentration of 1%. The protein digestwas aliquoted and stored at −80 °C prior to MudPIT analysis by an LTQ-Orbitrap massspectrometer.
MudPIT analysisSamples were pressure-loaded onto a 250-μm i.d. fused silica capillary column containing 3cm of 5-μm Aqua C18 material (Phenomenex, Ventura, CA) followed by 3 cm of 5-μmPartisphere strong cation exchanger (Whatman, Clifton, NJ) and capped with a 2 μm filteredunion. The biphasic column was washed with buffer A. The biphasic column was thenconnected to an analytical column of a 100-μm i.d. capillary with a 5-μm pulled tip and packedwith 12~13 cm of 3-μm Aqua C18 material (Phenomenex, Ventura, CA).
The column was placed inline with an Agilent 1100 quaternary HPLC and analyzed using a12-step separation. The buffer solutions are 5% acetonitrile/0.1% formic acid (buffer A), 80%acetonitrile/0.1% formic acid (buffer B), and 500 mM ammonium acetate/5% acetonitrile/0.1%formic acid (buffer C). Step 1 consisted of 15 min of 100% A followed by a gradient of 80 minfrom 0 to 55 % B, reversal to 100% A in 2 min and 3 min of re-equilibration with 100%A.Steps 2–11 have the following profile: 3 min of 100% buffer A, 2 min of X% buffer C, a 10min gradient from 0–15% buffer B, and a 97 min gradient from 15–45% buffer B. The 2 minbuffer C percentages (X) are 5, 10, 20, 30, 40, 50, 60, 70, 80, 90 % respectively for the 12-step
Lu et al. Page 3
J Proteome Res. Author manuscript; available in PMC 2008 November 25.
NIH
-PA Author Manuscript
NIH
-PA Author Manuscript
NIH
-PA Author Manuscript
analysis. The final step, the gradient contained: 3 min of 100% buffer A, 20 min of 100% bufferC, a 10 min gradient from 0–15% buffer B, and a 107 min gradient from 15–70% buffer B.
Peptides were electrosprayed directly into an LTQ mass spectrometer (nuclear extract from ratbrain, PC12 cells) or an LTQ-Orbitrap mass spectrometer (HEK cells and yeast whole celllysates) (ThermoFinnigan, Palo Alto, CA). A cycle of full scan MS (400–1,800 m/z) followedby MS/MS on the seven most abundant ions. Normalized collision energy of 35% and anisolation width of 3 m/z units were used for acquisition of tandem mass spectra.
LC-MS/MS analysisDigested casein proteins were pressure-loaded onto 100-μm I.D. fused silica capillary with a5-μm pulled tip packed with 10 cm of 3-μm Aqua C18. After loading, the column was placedinline with an Agilent 1100 quaternary HPLC and analyzed using the following gradient: 2min of 100% buffer A, a 13 min gradient from 0 to 10% buffer B, a 40 min gradient from 10to 55% buffer B, a 10 min gradient from 55% to 100% buffer B, 5 min of 100% B, reversal to100% A in 2 min and 8 min of re-equilibration.
Analysis of Tandem Mass Spectrometry dataRaw files were extracted with in-house software32 to produce distinct sets of MS2 filescontaining tandem mass spectra. When tandem mass spectra (rat brain, PC12 cells, and caseinproteins) were collected from an LTQ mass spectrometer, the data were searched usingSEQUEST33 with differential modification of + 80 Da on STY (phosphorylation), +/− 3 Dafor precursor mass tolerance, with or without enzyme restriction, as indicated in the [Resultsand Discussions] section. When tandem mass spectra (HEK cells and yeast whole cell lysates)were collected from an LTQ-Orbitrap mass spectrometer, the data were searched usingSEQUEST with differential modification of +79.966332 Da on STY, +/− 50 ppm for precursormass tolerance, with or without enzyme restriction. The rat brain and PC12 cells data weresearched against the EBI-IPI rat protein database (version 3.05, April 2005) with its reversedecoy; The HEK cells data were searched against the EBI-IPI human database (version 3.04,March 2005) with its reverse decoy; The yeast whole cell lysates data were searched againstthe Saccharomyces Genome Database (SGD) protein database (version December 2005) withits reverse decoy; The casein proteins data were searched against a database containing allcaseins (α-s1, α-s2, β and κ), the whole SGD proteins, and standard contaminant proteins withits reverse decoy.
SEQUEST results were analyzed and filtered with the following options usingDTASelect2.034: --fp 0.05, selects only peptide/spectrum matches with a false positive rate of5 % at spectrum level; -p 1, considers proteins identified by a single peptides; -m 0, display(for visualization) only the modified peptides.
Obtaining probability estimates from support vector machines (SVMs)Support vector machine (SVM) is one of the supervised statistical learning methods forclassification problems, which can also be applied to regression and ranking problems35–37.For a two-class classification problem, the SVM classifier will find a hyperplane to separatethe data into two classes by implementing the following ideas.
First, the SVM classifier searches for a hyperplane that separates the two classes with amaximum margin. Second, for data sets that could not be separated by a simple hyperplane,SVM maps the input vectors into a high dimensional feature space and constructs the OptimalSeparating Hyperplane (OSH) in the feature space, a process known as kernel mapping. Finally,for data containing noisy or mislabeled data points, SVM introduces a slack parameter thatcontrols the tradeoff between margin and misclassification error. The optimized hyperplane
Lu et al. Page 4
J Proteome Res. Author manuscript; available in PMC 2008 November 25.
NIH
-PA Author Manuscript
NIH
-PA Author Manuscript
NIH
-PA Author Manuscript
found by SVM may nearly, but not perfectly, separate the two classes, allowing a few datapoints to be misclassified.
For a given test example x, an SVM classifier outputs a predictive score that provides thedistance of x from the optimal separating hyperplane in the feature space. This sign of thispredictive score indicates to which class j example x belongs, where j ∈ {+1, −1}. However,knowing the class label (+, or −) or the predictive value a lot of times is not good enough toevaluate a classification. A better choice is to convert the predictive values to posteriorprobability estimates. We used a technique known as binning to convert predictive values toposterior probabilities38, which was implemented internally in the LIB-SVM softwarepackage39.
Results and DiscussionPhosphopeptide spectra and non-phosphopeptide spectra data sets
Known sets of 376 phosphopeptide and 376 non-phosphopeptide tandem mass spectra from aprevious study25 were used as training data sets for the probability-based SVM programColander. Known sets of 308 phosphopeptide tandem mass spectra and 1011 non-phosphopeptide tandem mass spectra25 were used as a testing set. Various tandem mass spectrawere used to evaluate the performance of the program, including: (1) 124,545 tandem massspectra from a MudPIT experiment of phosphopeptides enriched from a nuclear extract of ratbrain on a linear ion trap mass spectrometer; (2) 319,728 tandem mass spectra from a MudPITexperiment of phosphopeptides enriched from a nuclear extract of PC12 cells on a linear iontrap mass spectrometer; (3) 132,011 tandem mass spectra from a MudPIT experiment ofphosphopeptides enriched from nuclear extract of HEK cells on an LTQ-Orbitrap massspectrometer; (4) 81,112 tandem mass spectra from a MudPIT experiment of soluble fractionof whole cell lysate of Saccharomyces cerevisiae on an LTQ-Orbitrap mass spectrometer; (5)248,714 tandem mass spectra from a MudPIT experiment of phosphopeptides enriched fromcasein proteins on a linear ion trap mass spectrometer. A total of 281 tandem mass spectracollected from the direct injection of synthetic phosphopeptides into the LTQ massspectrometer as described previously25 were also used to validate the program.
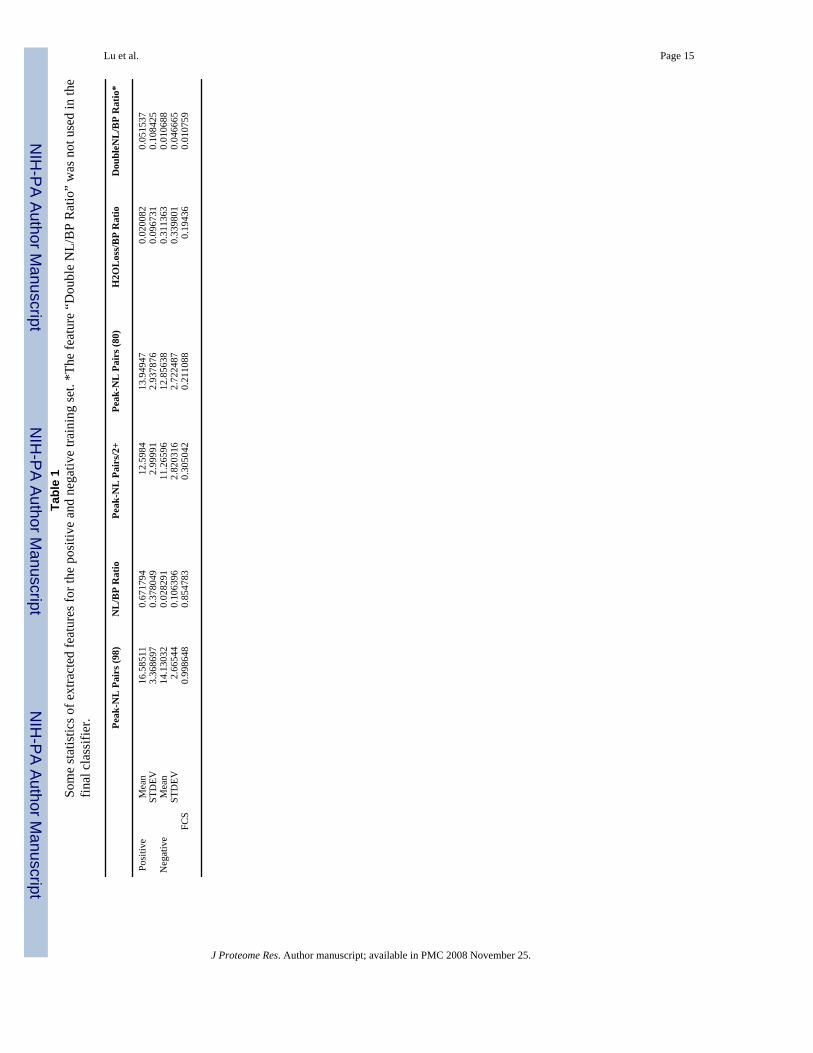
Characterizing training data setsCID MS/MS spectra are known to show neutral losses from both the precursor ions andfragment b-ions and y-ions18,25. For each spectrum/peptide match, we extracted a 6-dimensional neutral loss related feature vector x⃗ = (f1, f2, …, f6 ) in R6 where fi is the i-th featurebelow:
1. Number of peaks-“neutral loss (NL) of 98” pairs;
2. Precursor “neutral loss (NL) of 98”/“base peak (BP)” intensity ratio;
3. Number of peaks-“NL of 49” pairs (the fragment ion is of charge +2);
4. Number of peaks-“NL of 80” pairs;
5. Precursor “loss of water (18 Daltons)”/“base peak (BP)” intensity ratio;
6. Double precursor “neutral loss (NL) of 98”/“base peak (BP)” intensity ratio;
The mean and standard deviation of each feature were calculated for the positive training setand negative training set (see [Table 1] for more details). The distributions for the positive setand negative set were analyzed and the features that differ significantly between the positiveset and negative set are selected for discussion below. All these features are associated withthe neutral losses of phosphate groups or water.
Lu et al. Page 5
J Proteome Res. Author manuscript; available in PMC 2008 November 25.
NIH
-PA Author Manuscript
NIH
-PA Author Manuscript
NIH
-PA Author Manuscript
The first three features are well known features for tandem mass spectra of phosphopeptides.The first feature is the presence of large number of ions associated with a neutral loss of 98.This feature is associated with the loss of H3PO4 from both the precursor ion and fragmentions (b-ions and y-ions). The second feature is the intensity of the precursor ion neutral loss.Frequently the precursor ion neutral loss is also the base peak. The third feature is essentiallythe same as the first feature, only that the peak and the corresponding neutral loss ion are bothdoubly charge.
The fourth feature is associated with the loss of HPO3 from both precursor and fragment ions.Phosphopeptides sometimes lose the HPO3 group during mass spectrometry experiments11.The fifth feature is related to the loss of water (H2O) from the precursor ion. Our study showedthat it is less likely for phosphopeptides to lose water only, without losing the phosphate group.On average, the intensity of water loss peaks is 2% of the base peak in phosphopeptide tandemmass spectra. However, the average intensity of water loss peaks is 31% of the base peak innon-phosphopeptide tandem mass spectra. Finally, the last feature is associated with doubleneutral losses from precursor ions. Multiply phosphorylated peptides frequently lose more thanone phosphate group from a precursor ion.
To see which features might provide the most discriminatory power for our following analysisusing SVM, the Fisher criterion score (FCS) for each feature was computed. For a pair ofdistributions A and B for a specific feature, with means μA and μB and standard deviationsσA and σB, the FCS is defined as
The higher the FCS score for a feature, the greater the difference between the positive set andthe negative set will be for that feature. The FCS scores for the selected six features are givenin [Table 1]. The sixth feature, double precursor “neutral loss (NL) of 98”/“base peak (BP)”ratio, has the smallest FCS score. SVM classification without this feature showed that therewas no loss of classification accuracy. However, omission of any of the first five features ledto decreased classification accuracy by SVM. As a consequence, only the first five featureswere used for the following SVM analysis.
Classifications by SVMWe used a binary classifier support vector machine (SVM) to classify CID tandem massspectra. Each tandem mass spectrum was classified as one of the two classes: phosphopeptidespectrum (+), or non-phosphopeptide spectrum (−). The SVM classifier also assessed theprobability of being a phosphopeptide spectrum for each tandem mass spectrum. A tandemmass spectrum will be classified as phosphopeptide spectrum (+) if its probability score isgreater than 0.5. A tandem mass spectrum will be classified as non-phosphopeptide spectrum(−) if its probability score is less than 0.5. A tandem mass spectrum will remain unclassifiedif the probability score equals 0.5, which is a relatively rare situation from our observation.
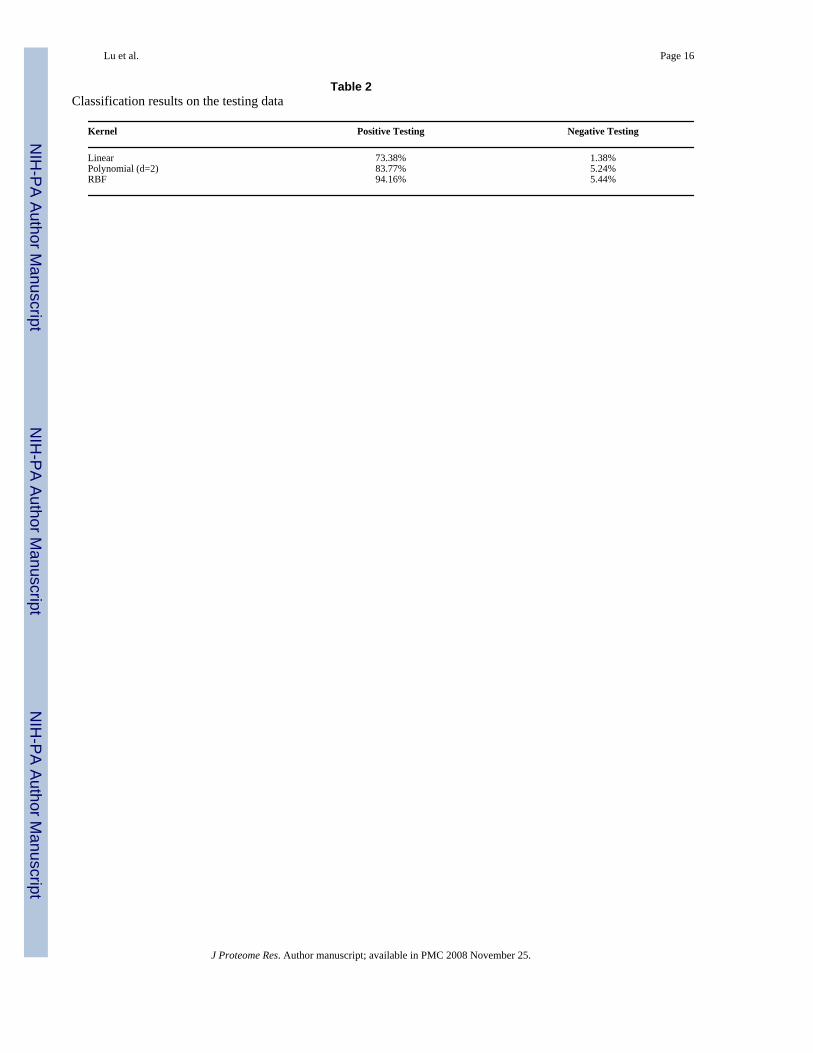
We evaluated the classification power of SVM using the five selected features described above.We used the LIB-SVM package and trained the program using 376 positive (phosphorylated)spectra and 376 negative (non-phosphorylated) spectra. The following kernel functions weretried: linear kernel function, polynomial kernel function with d = 2, and radial basis function(RBF). The prediction accuracies on the testing sets are shown in [Table 2] and the detailedperformance of the three kernel functions are shown in [Supporting Table 1]. The data showedthat the SVM classifier with the RBF kernel has the best power to retain phosphopeptide spectra(94.16%) while removing the most non-phosphopeptide spectra (94.56% = 1 – 5.44%). To
Lu et al. Page 6
J Proteome Res. Author manuscript; available in PMC 2008 November 25.
NIH
-PA Author Manuscript
NIH
-PA Author Manuscript
NIH
-PA Author Manuscript
evaluate if the differences for the different kernel methods are significant, we performed theFisher’s exact test. The p-value for the classification difference on the test data between thelinear kernel and RBF kernel is 5.4 × 10⁻⁵, and that for the classification difference betweenthe polynomial kernel (with d = 2) and RBF kernel is 0.019. Thus, the RBF kernel showedstatistically better classification power than the linear kernel and the polynomial kernel (d =2). The RBF kernel was employed in the final Colander program that was used for the followinganalysis.
Distribution of Colander probability scoresWe show in [Figure 1] the distribution of Colander probability scores for tandem mass spectramatched to phosphopeptides by SEQUST [Figure 1A] and the distribution of Colanderprobability scores not matched to phosphopeptides [Figure 1B], using our tandem massspectrometry data collected from nuclear extracts of rat brain. From this figure, we see that themajority of spectra that are matched to phosphopeptides show high Colander probability scores(close to 1). However, for the spectra that do not match to phosphopeptides, a large portion ofspectra show Colander probability scores close to 0. The distributions of other datasets fromphosphopeptide enrichment experiments showed a similar pattern. This confirms that we canuse Colander probability scores to filter tandem mass spectra for the presence ofphosphorylation.
Filtering performance of Colander on tandem mass spectra from phosphopeptideenrichment experiments
To evaluate the efficacy of using Colander to identify phosphopeptide containing tandem massspectra, we applied the program to three different MS/MS datasets generated fromphosphopeptide enrichment experiments.
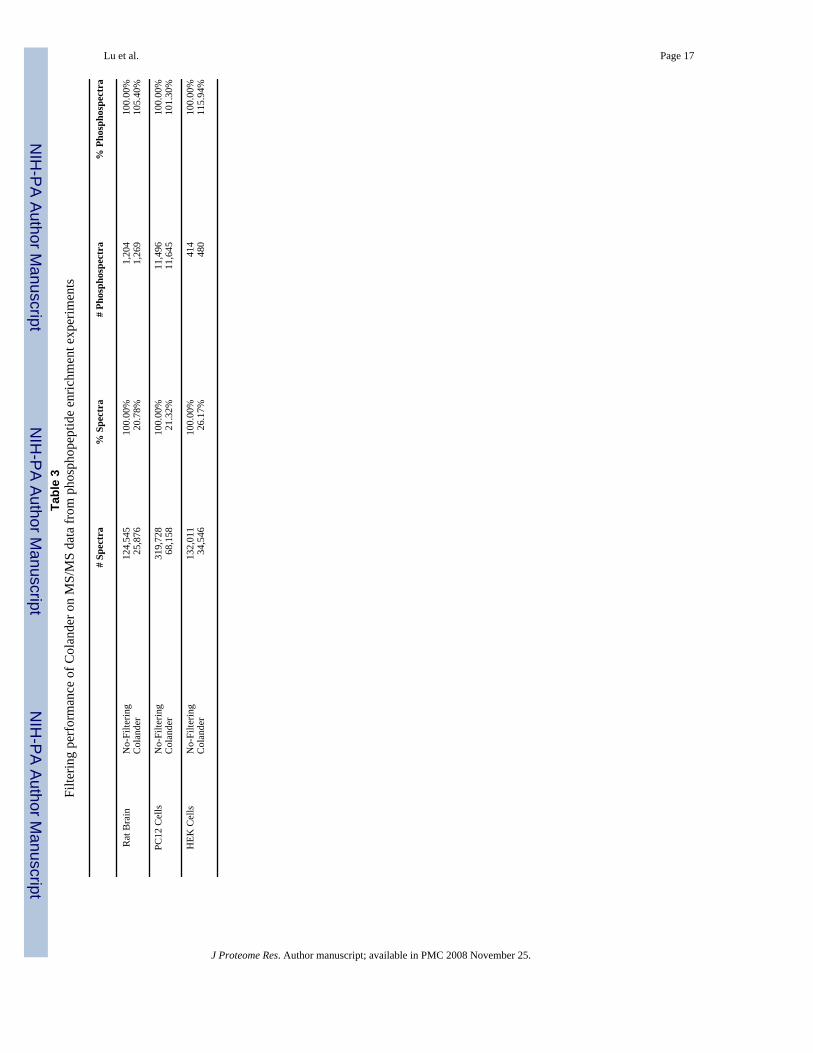
The first MS/MS dataset was collected in a MudPIT experiment of phosphopeptides enrichedfrom a nuclear extract of rat brain on a linear ion trap mass spectrometer. There are 124,545tandem mass spectra for this dataset. A SEQUEST database search with no enzyme restrictionfollowed by DTASelect filtering identified 484 phosphopeptides corresponding to 1204phosphopeptide tandem mass spectra with a 5% false positive rate at the spectrum level.Applying Colander to this data set at a 0.5 probability cutoff, we obtained 25,876 tandem massspectra (20.8% of the original spectra). SEQUEST search and DTASelect filtering with thesame parameters identified 537 phosphopeptides corresponding to 1269 phosphopeptidespectra, again with a 5% false positive rate at the spectrum level ([Table 3]). We identifiedmore peptides and spectra at a pre-defined false positive rate of 5%. The same observation wasalso made for the other datasets as shown below. A discussion will then be given on why wecan identify more peptides and spectra at a pre-defined false positive rate afterwards.
The second dataset is collected in a MudPIT experiment of phosphopeptides enriched fromnuclear extract of PC12 cells, again on a linear ion trap mass spectrometer. This dataset has319,728 tandem mass spectra. SEQUEST database search with trypsin digestion restrictionfollowed by DTASelect filtering identified 2073 phosphopeptides corresponding to 11,506phosphopeptide spectra. If we apply Colander filtering to the 319,728 tandem mass spectraand using a probability cutoff of 0.5 we obtain 68,158 tandem mass spectra expected to containphosphopeptides (21.3% of original spectra). SEQUEST search and DTASelect filtering withthe same parameters identified 2141 phosphopeptides corresponding to 11,656 phosphopeptidetandem mass spectra ([Table 3]).
The third dataset is collected in a MudPIT experiment of phosphopeptides enriched fromnuclear extract of HEK cells on an LTQ-Orbitrap mass spectrometer. This dataset has 132,011tandem mass spectra. SEQUEST database search with trypsin enzyme restriction followed by
Lu et al. Page 7
J Proteome Res. Author manuscript; available in PMC 2008 November 25.
NIH
-PA Author Manuscript
NIH
-PA Author Manuscript
NIH
-PA Author Manuscript
DTASelect filtering identified 185 phosphopeptides corresponding to 414 phosphopeptidetandem mass spectra. With Colander filtering at a probability cutoff of 0.5, we obtained 34,546tandem mass spectra (26.2% of original spectra). SEQUEST search and DTASelect filteringwith the same parameters identified 225 phosphopeptides corresponding to 480phosphopeptide spectra ([Table 3]).
We observed that frequently, under a predefined false positive rate, the number ofphosphopeptides identified from the smaller MS/MS datasets with Colander filtering is greaterthan the number of phosphopeptides identified from the bigger MS/MS datasets withoutColander filtering. We suspected that Colander might remove tandem mass spectra that can bematched to reversed phosphopeptide sequences. To further examine this issue, we plotted thedistribution of Colander scores for the PC12 spectra matched to forward phosphopeptides andreverse phosphopeptides in [Figure 2A] and [Figure 2B], respectively. The plots show thatalthough the majority of tandem mass spectra matched to forward phosphopeptides are of highColander probability scores, a large portion of tandem mass spectra matched to reversephosphopeptides are of Colander probability scores that are lower than the normal filteringprobability cutoff 0.5. Actually, the probability distribution of the tandem mass spectramatched to the reverse phosphopeptides ([Figure 2B]) is very similar to the probabilitydistribution of the tandem mass spectra not matched to phosphopeptides ([Figure 1B]). Theplots confirmed our suspicion and showed that Colander can effectively remove a large portionof tandem mass spectra that will match to reverse phosphopeptides. The removal of thesetandem mass spectra will affect the post-search filtering of DTASelect. DTASelect will lowerthe filtering threshold to achieved the same false positive rate (5% in this case), finally leadingto more spectrum and peptide identifications, as shown by the data in [Table 3]. Filtering detailsof tandem mass spectra by Colander on these three datasets using different probabilitythresholds are given in [Supporting Figure 1].
Filtering performance of Colander on tandem mass spectra from non-enrichment experimentColander shows its power in filtering out non-phosphopeptide spectra when applied to tandemmass spectra collected from peptide mixtures not enriched for phosphopeptides. When appliedto 81,112 tandem mass spectra from a MudPIT experiment of soluble fraction of a whole celllysate of Saccharomyces cerevisiae on an LTQ-Orbitrap mass spectrometer at a threshold valueof 0.5, Colander retained 94.74% (18 out of 19) of phosphopeptide tandem mass spectra whileonly retaining 7.32% of non-phosphopeptide spectra. When the filtering threshold wasincreased to 0.95, Colander kept 89.47% (17 out of 19) of phosphopeptide spectra whileremoving 99.01% of total spectra. A closer examination of the phosphopeptide tandem massspectra that did not pass the Colander threshold value of 0.5 showed that this spectrum of charge+2 was matched to a phosphopeptide with a borderline SEQUEST XCorr score of 2.0872.Filtering details of tandem mass spectra by Colander using different probability thresholds aregiven in [Supplementary Table 1]. Similar results were observed from MS/MS data from othernon-enrichment experiments.
We suggest that Colander might function as an in-silico enrichment approach for theidentification of phosphopeptides from tandem mass spectra generated from non-enrichedsamples. Specifically, parallel identification can be carried out for phosphopeptides andunmodified peptides. Database searching for non-phosphorylated peptides can be carried outon all acquired MS/MS dataset. At the same time, tandem mass spectra can be subjected toColander filtering to generate a smaller set of spectra for phosphorylation interrogation. Whileretaining the majority of phosphorylation matches, one can save more than 90% ofcomputational time.
Lu et al. Page 8
J Proteome Res. Author manuscript; available in PMC 2008 November 25.
NIH
-PA Author Manuscript
NIH
-PA Author Manuscript
NIH
-PA Author Manuscript
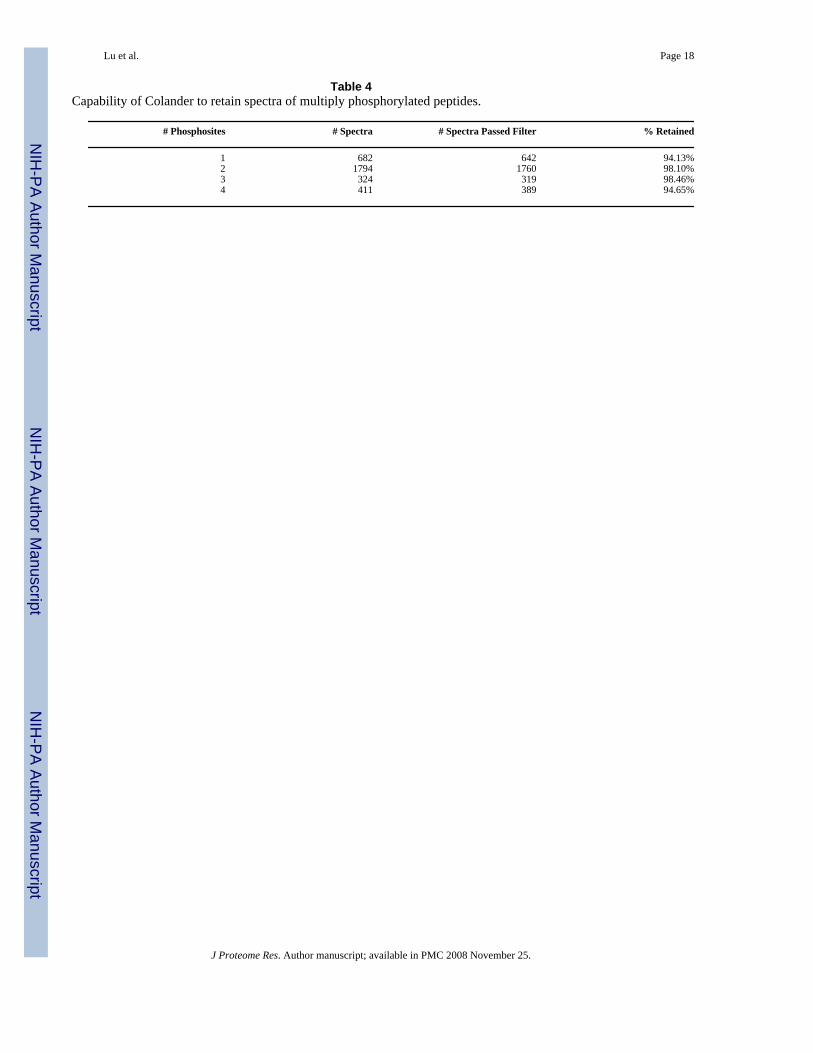
Capability of Colander to retain spectra of peptides with multiple phosphorylation sitesWe also tested the capability of Colander to retain spectra that are generated from peptidescontaining multiple phosphorylation sites. Tandem mass spectra generated from the caseinexperiment were used for this purpose. For this dataset, there are 682, 1794, 324, and 411redundant phosphopeptide spectra that are matched to casein phosphopeptides, correspondingto peptides with 1, 2, 3, and 4 phosphorylation sites, respectively ([Table 4]). At the filteringthreshold of probability 0.5, Colander is able to retain 94.13%, 98.10%, 98.46%, and 94.65%for spectra identified to peptides with 1, 2, 3, and 4 phosphorylation sites, respectively. Theresults show that Colander retains spectra of peptides with multiple phosphorylation sites.Distributions of the Colander probability scores are shown in [Supporting Figure 2].
Validation of the method with synthetic peptidesWe further validated the program using spectra generated from the synthetic phosphopeptidespSFVLNPTNIGMSKSSQGHVTK and SFVLNPTNIGMpSKSSQGHVTK25. Sites ofphosphorylation for these two synthetic peptides are indicated by the lower case “p” as in “pS”.A total of 281 redundant tandem mass spectra were acquired on a linear ion trap massspectrometer. These 281 spectra were subjected to the filtering by Colander and all of thempassed the filtering threshold of probability 0.5. Actually all of them will pass filtering even ifwe increase the threshold to 0.95. The distribution of the Colander probability scores for thesespectra is shown in [Supporting Figure 3].
Computational time and availabilityAnother consideration of the performance of Colander is computation time. For the 124,545tandem mass spectra from nuclear extract of rat brain, it took Colander 1963 seconds (or 0.5hour) to carry out the filtering step. The computational time spent on the phosphorylation searchwith no enzyme restriction on the same data set is 18,677,597 seconds (or 5188.2 hours, roughly7 months by a single-CPU computer). The time spent on filtering step is only 0.01% of thetime spent on database search. For comparison purposes, the computational time spent on thephosphorylation search with no enzyme restriction on the data after Colander filtering is6,087,498 seconds (or 1691.0 hours, roughly 70 days), 32.6% of the time spent on the wholedata set ([Supporting Table 2]).
For another dataset, the 319,728 tandem mass spectra from nuclear extract of PC12 cells, ittook Colander 1,983 seconds to filter out non-phosphopeptide spectra. The computational timespent on the phosphorylation search with trypsin restriction on the same dataset is 1,331,596(or 369.9 hours). The time spent on the filtering step is only 0.15% of the time on the databasesearch. The time spent on the phosphorylation search with trypsin restriction on the data afterColander filtering is 335,834 seconds (or 93.3 hours), 25.2% of the time spent on the wholedata set ([Supporting Table 2]). The computational time for HEK cells data, yeast lysates data,and casein proteins data can be found in [Supporting Table 2] as well.
In summary, the computational time spent on the presearch filtering of Colander is negligiblecompared to the time spent on database search. Meanwhile, filtering by Colander cansignificantly reduce computational time required for database search.
The Colander program, and the testing data set of 308 phosphopeptide MS/MS spectra and1011 non-phosphopeptide MS/MS spectra in MS2 format, are available for academic usewithout charge at: http://fields.scripps.edu/download.php.
Lu et al. Page 9
J Proteome Res. Author manuscript; available in PMC 2008 November 25.
NIH
-PA Author Manuscript
NIH
-PA Author Manuscript
NIH
-PA Author Manuscript
ConclusionsFor mass spectrometry analysis of phosphopeptides, the majority of tandem mass spectra arenot generated from phosphopeptides. As a consequence, the majority of computational time iswasted on the interrogation of non-phosphopeptide spectra for the identification ofphosphopeptides. We developed a support machine (SVM) algorithm to effectively selectphosphopeptide spectra - tandem mass spectra that are generated from phosphopeptides. Thealgorithm was trained by using known phosphopeptide spectra and non-phosphopeptidespectra. The algorithm has been implemented in the software package “Colander”. TheColander program can report a phosphopeptide spectrum probability score for each tandemmass spectrum. The probability scores are then used to filter out non-phosphopeptide spectra.
The Colander program can remove non-phosphopeptide spectra, thus maximizingcomputational resources. The output of probability scores also gives the users the flexibilityto control the filtering threshold. When applied to unknown tandem mass spectra, the algorithmcan routinely remove 80% of total tandem mass spectra while keeping more than 95% ofphosphopeptide tandem mass spectra. The program is especially useful when applied to tandemmass spectra generated from complex protein mixtures that do not have enrichment forphosphopeptides, where even a larger portion (larger than 99%) of tandem mass spectra arenon-phosphopeptide spectra. The Colander program can effectively remove tandem massspectra that could be matched to reverse phosphopeptides (false positives) and frequently leadsto more identifications under a fixed false positive rate. The computational cost by Colanderis relatively small (usually less then 0.2%) comparing to the computational time spent ondatabase search. The Colander program is also effective at retaining phosphopeptide spectragenerated from phosphopeptides containing multiple phosphorylation sites.
Supplementary MaterialRefer to Web version on PubMed Central for supplementary material.
AcknowledgementsBL is supported by a CFFT computational fellowship BALCH05X5. CIR and JRY acknowledge support from NIH5R01MH067880-02 and NIH P41 RR011823-10. The authors thank Dr. Akira Motoyama for providing the yeastwhole cell lysate data. The authors thank Drs. Lujian Liao, Aleksey Nakorchevskiy, Tao Xu for helpful review of themanuscript.
AbbreviationsNL
neutral loss
BP base peak
SVM support vector machine
MS mass spectrometry
MS/MS tandem MS
MudPIT multiple dimensional protein identification technology
Lu et al. Page 10
J Proteome Res. Author manuscript; available in PMC 2008 November 25.
NIH
-PA Author Manuscript
NIH
-PA Author Manuscript
NIH
-PA Author Manuscript
CID collision induced dissociation
PTM post-translational modification
pS phosphoserine
pT phosphothreonine
pY phosphotyrosine
References1. Johnson SA, Hunter T. Nat Methods 2005;2:17–25. [PubMed: 15789031]2. Siuti N, Kelleher NL. Nat Methods 2007;4:817–821. [PubMed: 17901871]3. Kjeldsen F, Savitski MM, Nielsen ML, Shi L, Zubarev RA. Analyst 2007;132:768–776. [PubMed:
17646876]4. Steen H, Kuster B, Fernandez M, Pandey A, Mann M. J Biol Chem 2002;277:1031–1039. [PubMed:
11687594]5. Rush J, Moritz A, Lee KA, Guo A, Goss VL, Spek EJ, Zhang H, Zha XM, Polakiewicz RD, Comb
MJ. Nat Biotechnol 2005;23:94–101. [PubMed: 15592455]6. Ficarro SB, McCleland ML, Stukenberg PT, Burke DJ, Ross MM, Shabanowitz J, Hunt DF, White
FM. Nat Biotechnol 2002;20:301–305. [PubMed: 11875433]7. Brill LM, Salomon AR, Ficarro SB, Mukherji M, Stettler-Gill M, Peters EC. Anal Chem 2004;76:2763–
2772. [PubMed: 15144186]8. Oda Y, Nagasu T, Chait BT. Nat Biotechnol 2001;19:379–382. [PubMed: 11283599]9. Beausoleil SA, Jedrychowski M, Schwartz D, Elias JE, Villen J, Li J, Cohn MA, Cantley LC, Gygi
SP. Proc Natl Acad Sci U S A 2004;101:12130–12135. [PubMed: 15302935]10. Pinkse MW, Uitto PM, Hilhorst MJ, Ooms B, Heck AJ. Anal Chem 2004;76:3935–3943. [PubMed:
15253627]11. DeGnore JP, Qin J. J Am Soc Mass Spectrom 1998;9:1175–1188. [PubMed: 9794085]12. Ulintz PJ, Bodenmiller B, Andrews PC, Aebersold R, Nesvizhskii AI. Mol Cell Proteomics
2008;7:71–87. [PubMed: 17872894]13. Wolschin F, Lehmann U, Glinski M, Weckwerth W. Rapid Commun Mass Spectrom 2005;19:3626–
3632. [PubMed: 16287031]14. Zubarev RA, Kelleher NL, McLafferty FW. J Am Chem Soc 1998;120:3265–3266.15. Cooper HJ, Hakansson K, Marshall AG. Mass Spectrom Rev 2005;24:201–222. [PubMed: 15389856]16. Syka JE, Coon JJ, Schroeder MJ, Shabanowitz J, Hunt DF. Proc Natl Acad Sci U S A 2004;101:9528–
9533. [PubMed: 15210983]17. Hartmer, R.; Lubeck, M.; Baessmann, C.; Brekenfeld, A. 54th ASMS Conference on Mass
Spectrometry; 2006.18. Kocher T, Savitski MM, Nielsen ML, Zubarev RA. J Proteome Res 2006;5:659–668. [PubMed:
16512682]19. Beausoleil SA, Villen J, Gerber SA, Rush J, Gygi SP. Nat Biotechnol 2006;24:1285–92. [PubMed:
16964243]20. Olsen JV, Blagoev B, Gnad F, Macek B, Kumar C, Mortensen P, Mann M. Cell 2006;127:635–648.
[PubMed: 17081983]21. Schlosser A, Vanselow JT, Kramer A. Anal Chem 2007;79:7439–7449. [PubMed: 17718535]22. Wu HY, Tseng VS, Liao PC. J Proteome Res 2007;6:1812–1821. [PubMed: 17402769]
Lu et al. Page 11
J Proteome Res. Author manuscript; available in PMC 2008 November 25.
NIH
-PA Author Manuscript
NIH
-PA Author Manuscript
NIH
-PA Author Manuscript
23. Imanishi SY, Kochin V, Ferraris SE, de Thonel A, Pallari HM, Corthals GL, Eriksson JE. Mol CellProteomics 2007;6:1380–1391. [PubMed: 17510049]
24. Ishihama Y, Wei FY, Aoshima K, Sato T, Kuromitsu J, Oda Y. J Proteome Res 2007;6:1139–1144.[PubMed: 17330947]
25. Lu B, Ruse C, Xu T, Park SK, Yates JR. Anal Chem 2004;79:1301–1310. [PubMed: 17297928]26. Tanner S, Shu H, Frank A, Wang LC, Zandi E, Mumby M, Pevzner PA, Bafna V. Anal Chem
2005;77:4626–4639. [PubMed: 16013882]27. Anderson DC, Li W, Payan DG, Noble WS. J Proteome Res 2003;2:137–146. [PubMed: 12716127]28. Klammer AA, Wu CC, Maccoss MJ, Noble WS. Proc IEEE Comput Syst Bioinform Conf 2005:175–
185. [PubMed: 16447975]29. Zhang X, Lu X, Shi Q, Xu XQ, Leung HC, Harris LN, Iglehart JD, Miron A, Liu JS, Wong WH.
BMC Bioinformatics 2006;7:197. [PubMed: 16606446]30. Jones EW. Methods Enzymol 1991;194:428–453. [PubMed: 2005802]31. Washburn MP, Wolters D, Yates JR III. Nat Biotechnol 2001;19:242–247. [PubMed: 11231557]32. McDonald WH, Tabb DL, Sadygov RG, MacCoss MJ, Venable J, Graumann J, Johnson JR, Cociorva
D, Yates JR 3rd. Rapid Commun Mass Spectrom 2004;18:2162–2168. [PubMed: 15317041]33. Eng J, McCormack A, Yates J III. J Am Soc Mass Spectrom 1994;5:976–989.34. Cociorva, D.; Yates, JR, III. DTASelect 2.0: Improving the Confidence of Peptide and Protein
Identifications. 54th ASMS Annual Meeting Proceedings; 2006.35. Vapnik, V. The Nature of Statistical Learning Theory. Springer Press; New York: 1995.36. Vapnik, V. Statistical Learning Theory. Wiley Press; New York: 1998.37. Cristianini, N.; Shawe-Taylor, J. An introduction to support vector machines and other kernel-based
learning methods. Cambridge University Press; 2000.38. Kwok JTY. IEEE Transactions on Neural Networks 1999;5:1018–1031. [PubMed: 18252604]39. Chang, CC.; Lin, CJ. LIBSVM: a library for support vector machines. National Taiwan University.
2001. software available at http://www.csie.ntu.edu.tw/~cjlin/libsvm
Lu et al. Page 12
J Proteome Res. Author manuscript; available in PMC 2008 November 25.
NIH
-PA Author Manuscript
NIH
-PA Author Manuscript
NIH
-PA Author Manuscript
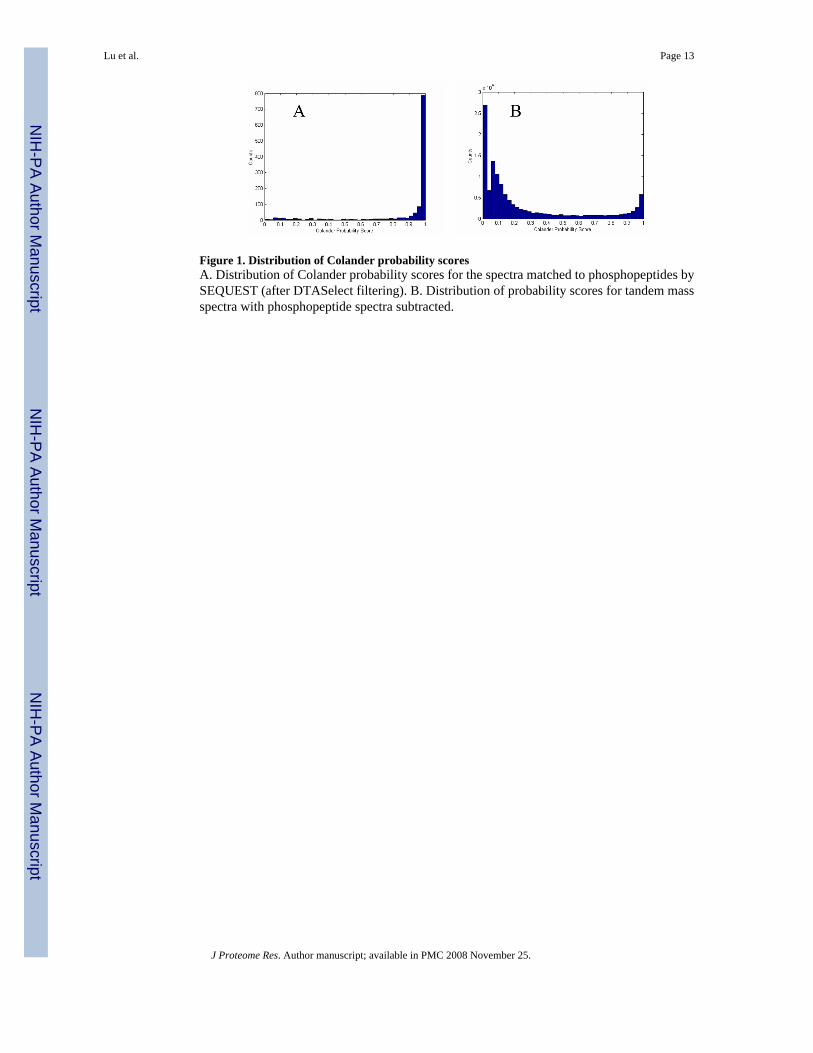
Figure 1. Distribution of Colander probability scoresA. Distribution of Colander probability scores for the spectra matched to phosphopeptides bySEQUEST (after DTASelect filtering). B. Distribution of probability scores for tandem massspectra with phosphopeptide spectra subtracted.
Lu et al. Page 13
J Proteome Res. Author manuscript; available in PMC 2008 November 25.
NIH
-PA Author Manuscript
NIH
-PA Author Manuscript
NIH
-PA Author Manuscript

Figure 2. Distributions of Colander probability scores for spectra matched to forwardphosphopeptides and reverse phosphopeptidesA. Distribution of scores for spectra matched to forward phosphopeptides; B. Distribution ofscores for spectra matched to reverse phosphopeptides.
Lu et al. Page 14
J Proteome Res. Author manuscript; available in PMC 2008 November 25.
NIH
-PA Author Manuscript
NIH
-PA Author Manuscript
NIH
-PA Author Manuscript
NIH
-PA Author Manuscript
NIH
-PA Author Manuscript
NIH
-PA Author Manuscript
Lu et al. Page 15Ta
ble
1So
me
stat
istic
s of e
xtra
cted
feat
ures
for t
he p
ositi
ve a
nd n
egat
ive
train
ing
set.
*The
feat
ure
“Dou
ble
NL/
BP
Rat
io”
was
not
use
d in
the
final
cla
ssifi
er.
Peak
-NL
Pai
rs (9
8)N
L/B
P R
atio
Peak
-NL
Pai
rs/2
+Pe
ak-N
L P
airs
(80)
H2O
Los
s/B
P R
atio
Dou
bleN
L/B
P R
atio
*
Posi
tive
Mea
n16
.585
110.
6717
9412
.598
413
.949
470.
0200
820.
0515
37ST
DEV
3.36
8697
0.37
8049
2.99
991
2.93
7876
0.09
6731
0.10
8425
Neg
ativ
eM
ean
14.1
3032
0.02
8291
11.2
6596
12.8
5638
0.31
1363
0.01
0688
STD
EV2.
6654
40.
1063
962.
8203
162.
7224
870.
3398
010.
0466
65FC
S0.
9986
480.
8547
830.
3050
420.
2110
880.
1943
60.
0107
59
J Proteome Res. Author manuscript; available in PMC 2008 November 25.
NIH
-PA Author Manuscript
NIH
-PA Author Manuscript
NIH
-PA Author Manuscript
Lu et al. Page 16
Table 2Classification results on the testing data
Kernel Positive Testing Negative Testing
Linear 73.38% 1.38%Polynomial (d=2) 83.77% 5.24%RBF 94.16% 5.44%
J Proteome Res. Author manuscript; available in PMC 2008 November 25.
NIH
-PA Author Manuscript
NIH
-PA Author Manuscript
NIH
-PA Author Manuscript
Lu et al. Page 17Ta
ble
3Fi
lterin
g pe
rfor
man
ce o
f Col
ande
r on
MS/
MS
data
from
pho
spho
pept
ide
enric
hmen
t exp
erim
ents
# Sp
ectr
a%
Spe
ctra
# Ph
osph
ospe
ctra
% P
hosp
hosp
ectr
a
Rat
Bra
inN
o-Fi
lterin
g12
4,54
510
0.00
%1,
204
100.
00%
Col
ande
r25
,876
20.7
8%1,
269
105.
40%
PC12
Cel
lsN
o-Fi
lterin
g31
9,72
810
0.00
%11
,496
100.
00%
Col
ande
r68
,158
21.3
2%11
,645
101.
30%
HEK
Cel
lsN
o-Fi
lterin
g13
2,01
110
0.00
%41
410
0.00
%C
olan
der
34,5
4626
.17%
480
115.
94%
J Proteome Res. Author manuscript; available in PMC 2008 November 25.
NIH
-PA Author Manuscript
NIH
-PA Author Manuscript
NIH
-PA Author Manuscript
Lu et al. Page 18
Table 4Capability of Colander to retain spectra of multiply phosphorylated peptides.
# Phosphosites # Spectra # Spectra Passed Filter % Retained
1 682 642 94.13%2 1794 1760 98.10%3 324 319 98.46%4 411 389 94.65%
J Proteome Res. Author manuscript; available in PMC 2008 November 25.