STRESS SCREENING OF - DTIC
224
AD-A1I8 261 RADC-TR-82-87 . -, Final Technical.Report May 1982 STRESS SCREENING OF ELECTRONIC HARDWARE Hughes Aircraft Company A.E. Saari, R.E. Schafer and S.J. VanDenBerg APPROVED FOR PUBLIC RELEASE; DISTRIBUTION UNLIBItTEDR ROME AIR DEVELOPMENT CENTER Air Force Systems Commandf Griffiss Air Force Base, NY 13441 11PINODUCEO SY NATIONAL TECHNICAL INFORMATION SERVICE U.S. DEPARTMENT Of COMMERCE SPRINGFIELD, VA. 22161
-
Upload
khangminh22 -
Category
Documents
-
view
1 -
download
0
Transcript of STRESS SCREENING OF - DTIC

AD-A1I8 261
RADC-TR-82-87 . -,
Final Technical.ReportMay 1982
STRESS SCREENING OFELECTRONIC HARDWARE
Hughes Aircraft Company
A.E. Saari, R.E. Schafer and S.J. VanDenBerg
APPROVED FOR PUBLIC RELEASE; DISTRIBUTION UNLIBItTEDR
ROME AIR DEVELOPMENT CENTERAir Force Systems Commandf
Griffiss Air Force Base, NY 13441
11PINODUCEO SYNATIONAL TECHNICAL
INFORMATION SERVICEU.S. DEPARTMENT Of COMMERCE
SPRINGFIELD, VA. 22161

U`NCLASSIFIED31ICURITY C~.ASSLPFAICNr P ai m.is PA&(c wpvo Dtem ... d)
REPORT DOCUMENTATION PACE READ INSTRUCTIONSSUCGRE C~~.7GFORMd
I IPORT NUM690 2. ., W.- 'I ZIP I C14T-' :ArAa.33 "uSea
RADC-TR-82-87 0______________
4. TITE (,E S..aeaaa8j S. TYPE OF XCOR a PIERIoO COVIINCO
STRESS SCREENING OF ELECTRONIC Final Technical Report
HARDWAREAugust 80 - September 81f4. 0CAFORMING 01G. RIEVORT14 UMOCIR
_____________________________________ FR82-16-1327. AUrNO~fe, 4. CQNrRACr OR SPNA.. 4WMSEA(S,
A.E. Saari S.J. VanDenBerg F30602-80-C-0250R.E. Schafer9 PCNPONMMNG ORGANIZATION HEAMS AMC0 ADNIES Ia. PROGRAM CLLEMamr Noojec1. rASJ(
Hughes Aircraft Company 62702 ORFJMTNU8111
Ground Systems Group, P.O. Box 3310 62330242
Fullerton CA 92634 1-3380242 _________
1 1 CONTROLLING OFFCZ %AMC AND AOONISS '2 REPRTN ZA-ra
Rome Air Development Center (RBET) IMay 1982
Griffiss AFB NY 13441 3. " UMIEN OF 0 AGES
14. MODNITORING AGENDCY 4AMC 6 AOORISSeif di~flwfl IMH C..,,@I,,,II 0111C-) !S. SCC.JRIrV Z..ASS. 'If*.,, '.419 .
UNCLASS IFI EDSame 11.. OCCLASSIFICAIION10OOWNONAOING
16. 0ISTRIGUTbON -SAI(M4(NI '-f X's Rep.n)
Approved for public release; distribution unlimited
17, DISTRIBUTION SA1'!M(N? (of (A. Abstract .At.,,din Slet* 30. it difforsit tram 900e"t)
Same
IS. SUPPLIMCNARY NOrS
RADC Project Engineer: Eugene Fiorentino
'4. KIEV V0RC1 I`Ce.,li~i. on re@iiiiss side it MOC**89a7 WOW OdenMfff bY ICk ,.Wr,6*a)
ScreeningStress ScreeningEnvironmental Strebs ScreeningStress Screening Model
20. LISYWACI 'Coiafloqeme, ois,ereo. side It .0cosaar mod ist~early by bloeS ,.-bov.)
This report presents the results of a study to develop quantitative andqualitative techniques for planning, monitoring and evaluating stress'screening programs during electronic equipment development and production. -
A screening and debugging optimization (SDO) model developed on a priorstudy, RADC-TR-78-55, was revi3ed to include current thermal cycling andvibration screening experience and an adaptive feature was added to allowstress screening program changes based on screening results. Guidelines
DD 1473 COITION OF I M4OV 415 13 0USOLCETC UNCLASSIFIEDSECURITY CLASSIFICATION OF THIS PA09 (PWh, DP#* Enteimi)
NOTICE
THIS DOCUMENT HAS BEEN REPRODUCED
FROM THE BEST COPY FURNISHED US BY
THE SPONSORING AGENCY. ALTHOUGH IT
IS RECOGNIZED THAT CERTAIN PORTIONS
ARE ILLEGIBLE, IT IS BEING RELEASED
IN THE INTEREST OF MAKING AVAILABLE
AS MUCH INFORMATION AS POSSIBLE.
This report has been reviewed by the RADC Public Affairs Office (PA) andis releasable to the National Technical Informaticn Service (NTIS). Ac NTT'it will be releasable to the general public, including foreign nations.
RADC-TR-82-87 has been reviewed and is approved for publication.
APPROVED: .
EUGENE FIORENTINOProject Engineer
APPROVED:
EDMUND J. WESTCOTT, Technical DirectorReliability & Compatibility Division
FOR THE COI'tANDER *.;;::)
Acting Chief, Plans Office
If your address has changed or if you wish to be removed from the RADCmailing list, or if the addressee is no longer employed by your organization.please notify RADC.(RBET) Griffiss AFB NY 13441. This will assist us inmaintaining a current mailing list.
Do not return copies of this report unless contractual obligations or not ct"on a specific document requires that it be returned.
ti
* ° " ' • . . . .. . " . . .I
EVALUATION
1. The objective of this study was to develop methodologies and tech-niques for planning, monitoring and evaluating stress screening programsduring electronic equipment development and production.
2. The study objectives have been successfully achieved. Both qualita-tive and quantitative guidelines have been developed for tailoring screen-ing procedures to specific hardware development and production programs.A methodology for screen selection and placement and for monitoring thescreening process through use of adaptive procedures has also been devel-oped. In addition, a previously developed stress screening model has beensimplified and updated to include more recent stress screening experience.The model establishes a quantitative basis for planning and control. Allof the major variables and inputs required for planning and evaluatingscreening programs are addressed through use of the model. Application ofthe techniques should greatly enhance the stress screening practitioner'scapability to plan and conduct screening programs in a cost-effectivemanner.
3. Use of the techniques and methodology contained in the report shouldhopefully foster the development of a broader data base for estimation ofmodel parameters and input variables. Users are encouraged to providefeedback of information on their application experience and results.
EUGEbI FIORENTINOProject Engineer
A
I -c
FOREWORD
This study was conducted to develop quantitative andqualitative techniques for planning, monitoring and evaluatingstress screening programs. The effort included investigation oftechnical and economic factors leading to the adoption of ascreeniny program and identifying factors which influence theselection of particular screens and placement of screens atvarious asser.bly levels.
A product of this study effort is a set of three coin-puter programs (comprisiny the Stress Screening Miodel) which areintended to aid the stress screening practitioner in selectingscreens, setting screening paramieters and adjusting screens onthe basis of observed results. The function of the StressScreeniny Model (SSM) is to exercise some mathematical routinesdesigned to find an optimum set of screens to achieve thedesired, (user-input) results, subject to the "ser-indicatedconstraints.
If the quantity and type of latent defects present inequipment during each level of manufacture were known and theability of the various stress screens to precipitate thosedefects into hard, detectable failures was also known, the plan-ning of stress screening programs would be greatly simplified.Actually, the nature and magnitude of defects present are unknownand changing with time; screening strengths are not well under-stood and appear to be hardware dependent. Much stress screeninghas been done in the past several years and general patterns arebeyissnin-j to eiaerge. Screening appears to be cost-effective.Te:.perdture cycling and random vibration are commonly usedscreeas dnd app~ear to be effective screens. Temperature cyclescreening effectiveness appears to increase with wider tempera-ture range and greater rates of change. Random, or broadband,vibration appears more effective than single or swept frequencyvibration. Constant teraperature burn-in, power cycling, and lowlevel single frequency vibration screens do not appear to bejenerally uffective. These patterns form an industry consensus
on stress screening effectiveness.
The llartin-Marietta termperature cycling curves (Ref. 7)and the Grurunan vibration curves (Ref. 8) are combined intoUAWIAT P-9492 and are generally representative of the industryconsensus. Screening strength equations developed previously byHughes were modified to reflect the Martin/Gruraman data and fur-ther adjusted to satisfy other stress screening results. Thescreening strength equations should not be interpreted as scien-tifically derived equations of general applicahility but ratheras useful tools to serve as a quantitative basis for planning andcontrolliny a stress screening program. Use of the stressscreening equations in conjunction with the screen selection andplacement guidelines will provide a sound planning basis.
- - ii

Careful review of stress screening results will enable the properadjustment of the screening strength equations to match the itemsbeing screened through use of the SStI adaptive feature.
The SSM is easy to use but this should not be inter-preted as meaning that planning, monitoring and evaluating astress screening program is simple. Rather, it is the intent ofthe authors to provide a model which accepts all the major vari-ables as user inputs, when available, but which can be meaning-fully used when some input data is not available. The SSM con-tains default values for all but two user inputs and while con-siderable data gathering and analysis was necessary to establishthe default values, they must be considered applicable only tothe source from which they were derived. Each user should estab-lish his own set of input variables applicable to his productionprocesses and hardware item characteristics to make best use ofthe SMRi and to have the most confidence in the results.
iii
TABLE OF CONTENTS
Paragraph Title Page
1. Introduction and Summary . . . . . . . . 11.1 Introduction . . . . . . . . . . . . . . 11.1.1 Objective and Scope of Study . . . . . .. . 21.2 Summary of Study . . . . . . . . . . . . 21.2.1 Study Approach ..... ................ 21.2.2 The SDO Model .................... 31.2.3 Screening Strength Equations . . . . . . .. 51.2.4 Adaptive Screening . . . . . . . .. .. . 51.3 Summary of Industry Surveys . . . . . . . 81.3.1 Surveys Previously Conducted and Reviewed
for this Study. . . . . . ....... .. 81.3.2 Martin-Marietta Survey (Ref. 7) . . . . . 81.3.3 McDonnell Aircraft Company Survey (Ref. 11). 91.3.4 Institute of Environmental Sciences
(IES) Survey (Ref. 12) . . . . . . . . . 111.3.5 Survey Consensus . ........... . . . 12
2. Planning a Stress Screening Program . . .. 182.1 Introduction ....... .. ... .. 182.2 Developing a Stress Screening Plan . . . .. 192.2.1 Establishing an Objective .... ........... 192.2.2 Determining if a Stress Screening Program
is Appropriate . . . ......... . . . 192.2.2.1 Field Maintenance Cost Savings
through Stress Screening . ...... 202.2.2.2 Using Stress Screening to Achieve a
Reliability Requirement . . . . . . . . . 232.2.2.3 Manufacturing Cost Savings through
Stress Screening . . . . . .......... 242.2.3 The Role of Part Level Screens . . . . . . 272.2.3.1 Part Failures in Field Use . ........ 272.2.3.2 Relationship of Part Fraction Defective
to Quality Grade............. . . . . . . 312.2.3.3 Incoming Receiving Inspection and Test . . . 342.2.4 Manufacturing Process Defects . . . . . .. 362.2.4.1 Sources of Defects .... ...... 0 . . . . 362.2.4.2 Distribution of Defects.. . ... ....... .. 372.2.5 Screen Selection and Placement ....... 392.2.5.1 General Industry Consensus on Screen
Selection and Placement ....... . 392.2.5.2 Technical and Economic Factors to Consider
in Selection and Placement of Screens . . . 402.2.5.2.1 Factors to Consider in Assembly Level
Screen Selection . . . . . . . . . . . . 402.2.5.2.2 Factors to Consider in Unit Level Screen
Selection . . . . .......... . . . 472.2.5.3 Pre- and Post-Screen Testing Considerations. 48
iv

TABLE OF CONTENTS (Continued)
Paragraph Title Page
2.2.6 Planning a Stress Screening Programfor the Development Phase . . . . . . . 49
2.2.6.1 Characteristics of a Development Phase . 492.2.6.2 Pro's and Con's of Stress Screening in a
Development Phase . . . . . . . . . . . 492.2.6.3 Relationship of Stress Screening and
Reliability Growth ...... 502.2.7 Planning a Stress Screening Program for
the Production Phase . 502.2.7.1 Using Development Phase Results to Guide
Production Phase Planning. . . . ...... . 502.2.7.2 Initial Production Phase Start-up
Problems................... . . 512.2.7.3 Planning for Subcontractor/Supplier
Stress Screening .......... .. ....... . 512.3 Contractual Considerations in Stress
Screening .................... 522.3.1 General Considerations ........ ........ 522.3.2 Contractual Flexibility to Permit Stress
Screening Program Adaptability . . . ... 522.3.3 Failure Free Cycles..... . .. . . . . ... 532.3.4 Incentives Associated with Stress Screening 53
3. Data Collection, Analysis and Reporting . 553.1 Data Collection . . . .... ... 553.1.1 Data Collection Requirements for'Stress
Screening Program.......... . . . . . . 553.1.2 The Role of Failure Analysis in Determining
Screening Effectiveness . . . . . . . . .. 573.1.3 Analysis of Stress Screening Data . . . .. 573.1.3.1 Data Analysis for Monitoring the Stress
Screening Program.... . . .. .*.. 573.1.3.2 Data Analysis for Evaluating the Stress
Screening Program......... . . . . . . . 583.1.3.3 Using the Chance Defective Exponential
(CDE) Mode] to EValuate Stress ScreeningResults ............ . .... . .. 59
3.2 Reporting of Results ................ . . 613.2.1 Purpose of Reporting Results . . . . .. . . 613.2.2 Reporting Methods .... ............. .. 613.2.3 Report Content ...... .............. .. 61
4. The Stress Screening Model (SSM) ..... 634.1 Description of the Model .. ......... .. 634.1.1 Model Options ..... .............. 644.1.2 The MTBF Option ..... ........... . . . 644.1.3 The Cost Option ....... ................ 654.1.4 The Trade-off Option ...... .... 654.1.5 Description of User Inputs to SSM and Model
Defaults . . .............. . 65
v
TABLE OF CONTENTS (Continued)
Paragraph Title Page
4.1.6 Determining the Initial FractionLatent Defectives . . . . . . . ... 71
4.2 Using the Model...... 734.2.1 General Instructions for User........ 734.2.2 IBM 310 TSO User Instructions . . . .... 754.3 Examples of SSM Use .......... . . .. 794.3.1 MTBF Option Examples . . . . . . .. 794.3.1.1 Planning a Stress Screening Program to
Achieve a Certain MTBF, without Pre-established Screens .. . . . . ... . 79
4.3.1.2 Planning a Stress Screen Program toAchieve a Certain MTBF, with Pre-established Screens . . . . % * . . . 91
4.3.1.3 Planning a Stress Screening Program toAchieve a Certain MTBF, No Solution . ... 98
4.3.2 Cost Option Example ..... ........... . . 094.3.3 Tradeoff Option Examples ... . . . . 1184.3.3.1 Evaluating an Existing Screen . . . . . 1184.3.3.2 Adapting Screens Based on Observed
Results ... 1304.3.4 Example Using the CDE Model to'Evaluate
Screening Results .............. . . . 140
REFERENCES .... . .. . . . . . . . . . . . . . . . . 151
APPENDIX A: Development of Screening Strength Equaticns 155
APPENDIX B: Statistical Aspects of Adaptive Screening . 167
APPENDIX C: The Chance Defective Exponential (CDE)Model .... ............ . . . . . . . . . 171
APPENDIX D: Approximation of Screening StrengthUsing Observed MTBF . . . ........... 175
APPENDIX E: Long Term Reliability Throueh Natural LatentDefect Reduction ........... .................. 177
APPENDIX F: Model Conputer Progran Listings ..... ........... .181
vi

LIST OF TABLES
TABLENo. Title Page
1.1 Summary of Three Previous Surveys . . . . . 14
2.1 Manufacturing Stress Screening CostAnalysis Example . . . . .......... 27
2.2 Results of Retesting Incoming ReceivingTest Microcircuit Rejects. ............ . 35
2.3 Recent Receiving Inspection Test Results . 352.4 Interconnection Defects Detected at First
Test for Early Production PWAs... ... . 382.5 Part Defects Detected at First Test for
Production PWAs. . ........... . .. 392.6 Results of First Opportunity Wire Testing
of Unit Wiring........ . . . . . . . ... 392.7 Distribution of Screening Methods for
Various Classes of Parts .. . . .. . ... 422.8 Assembly Level Defect Types Precipitated
by Thermal and Vibration Screens . . ... 43
4.1 Stress Screening Model User Input DataRequirements & Model Input Values . . ... 66
4.2 Test Parameter Cross Reference ..... .. 694.3 Iniýtial Fraction Latent Defective Parts 734.4 Parts Mix for Sample Generic Equipments . 74
vii

LIST OF FIGURES
Figure Title Page
1.1 A Typical Production Process. rindingdefects at the lowest level of manufactureis most cost effective . . . . ...... 3
1.2 Screening Strength for a Random VibrationScreen ........ 6
1.3 Screening Strength for a Swept-SineVibration Screen .. . ... 6
1.4 Screening Strength for a Single (Fixed)Frequency Vibration Screen ............. 6
1.5 Screening Strength for a TemperatureCycling Screen (R=100) ...... ........... . 7
1.6 Screening Strength for a ConstantTemperature Screen ....... .............. 7
2.1 Latent Defect Flow for Process withoutStress Screening ............. ........... 21
2.2 Field Maintenance Costs for RepairResulting from Latent Defects. ... .... .. 22
2.3 Latent Defect Flow for Process withStress Screening ....... .............. .. 21
2.4 Field MTBF Improvement through naturalLatent Defect Fallout (2,000-part system). • 25
2.5 Field MTBF Improvement through NaturalLatent Defect Fallout (10,000-part system) . 25
2.6 Field MTBF Improvement through NaturalLatent Defect Fallout (20,000-part system) . 25
2.7 Production Flow Model without StressScreening ...................... ...... .. 26
2.8 Production Flow Model with StressScreening ................................. 26
2.9 Assembly Repair Cost Analysis .. ....... .. 282.10 Unit Repair Cost Analysis ...... .... .. 292.11 Distribution of Failures by Classification
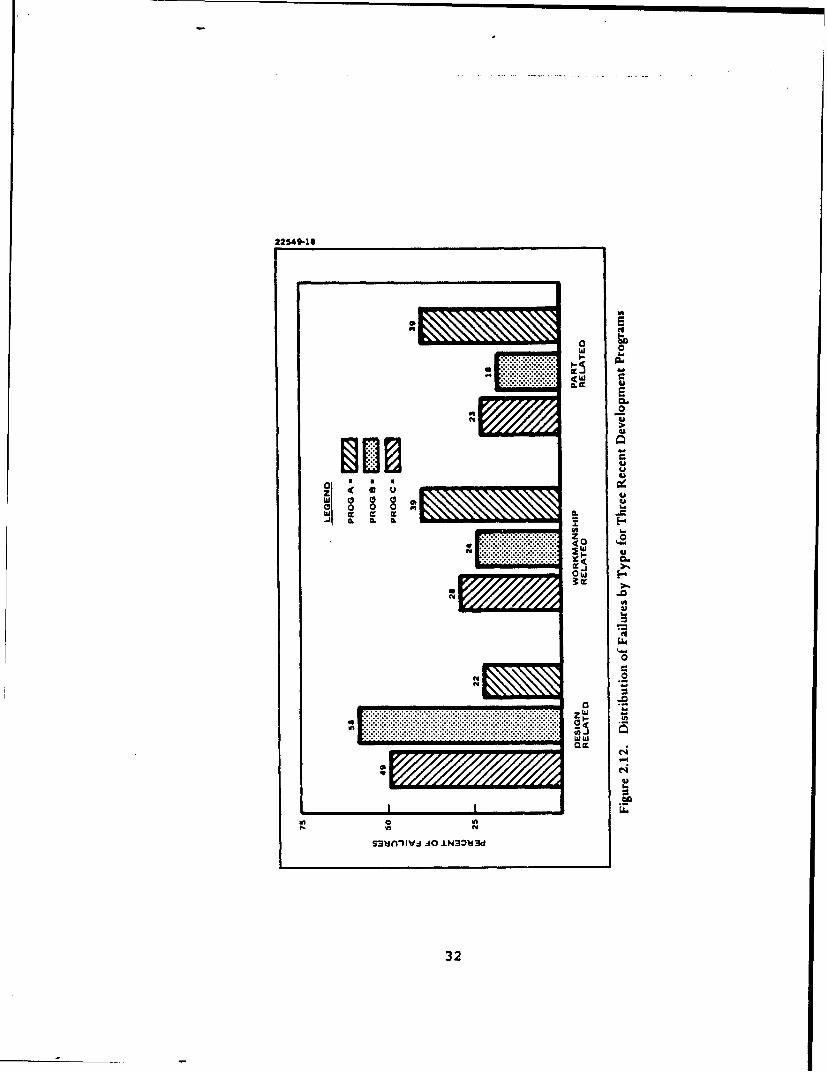
and by Time for a Radar Development Project. 302.12 Distribution of Failures by Type for Three
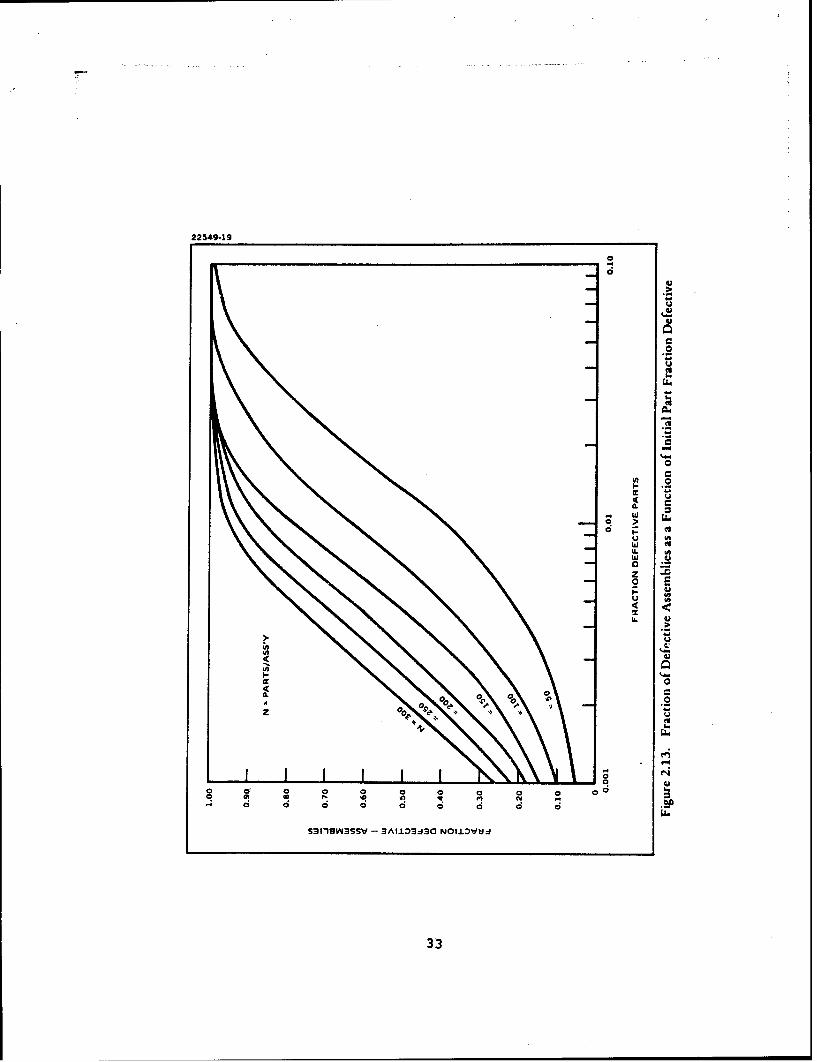
Recent Development Programs ... ....... .. 322.13 Fraction of Defective Assemblies as a
Function of Initial Part FractionDefective. . . ........... ........... .. 33
2.14 Card Thermal Survey. Part temperaturestrack the chamber temperature very closely 45
2.15 Probability of Passing a Failure FreePeriod of Duration 0.1 x Specified MTBF . 54
3.1 Temperature Cycling Data Fitted to theChance Defective Exponential Model ..... .. 60
4.1 Stress Screening Model Representationof the Production Flow Process ......... .. 63
4.2 Flow Diagram of the Stress Screening Model 75
viii
'1. IUTRODUCTIOtl AIID SUMIIIARY.
1.1 Introduction. The use of environmental stress screening ofelectronic hardware during development and production has in-creased significantly in the past few years among many militaryelectronic equipment manufacturers. The basic intent of stressscreening is to detect latent defects, by subjecting test itemsto specific conditions of environmental stress, so that suchdefects can be degraded to a detectable level. "Latent defects",as used here, represent weaknesses in parts, workmanship and tosome extent design, which result in much higher failure ratesthan what may be indicated by predicted inherent failure ratevalues. Clectronic equipment delivered to the field often con-tain latent defects traceable to the production process. Suchdefects result in abnormally high failure rates and excessiverepair costs in the field. Early stress screening of modules andassemblies, during production, is a widely accepted, effective+i-eans of alleviating the problem. Screening programs may be,however, costly to perform and may not be fully effective, per-haps even detrimental, if improperly applied and controlled. Thetechnology base, in addition, for screening test selection, ef-fectiveness measurement, and cost control, is largely underdeveloped.
Stress screening programs should be designed to precipitateand detect latent defects early in the production cycle when itis most cost-effective to do so. Early stress screening can in-crease the likelihood of the completed equipment passing finalacceptance and reliability demonstration tests and may eliminateor reduce the need for costly burn-in or reliability growthprograms at the system level. Early life stress screening ofmodules and subassemblies, therefore, can offer a cost-effectiveioeans of enhancing equipment reliability and reducing productionand field support costs.
Due to the varied nature of military electronics equipmentand their associated design, development and production programelements, it is difficult to "standardize" on a particularscreening approach. A tailoring of the screening process to theunique elements of a given program is, therefore, required.Screening tests such as temperature cycling and random vibrationap,)ear to be the most effective tests. However, exposure levels,number of cycles, and test durations differ widely among users.Other, perhaps less costly, tests such as sinusoidal vibration,power cycled burn-in at ambient and temperature soak are alsoused, but, in general, their effectiveness is believed to be lessthan the former tests. Precise information of the effectivenessof the various available screening tests is not currently known.Screening tests therefore should be selected based upon estimatesof cost and test effectiveness, early development program dataand on equipment design, manufacturing, material and processvariables, which at least, narrow consideration to the most
bReproduced frombest available coPY.
cost-effective choices. The screening process then should becontinuously monitored and test results analyzed so that changesin the process can be made, as required, to optimize the cost-effectiveness of the screening program.
A survey of the current literature has shown that althoughthe use of stress screening is on the increase, there is littlegeneral guidance as to how to best plan, monitor and control astress screening program. The Institute of EnvironmentalSciences (IES), a professional organization of engineers andscientists, currently has a national program underway to developa guideline document for Environmental Stress Screening ofElectronic YIar.ware. Results of this effort were published in aguidelines document (Ref. 12).
Hughes Aircraft Company is also preparing a StressScreening Guidelines document for internal use which is expectedto be released in 1982.1.1.1 Objective and Scope of Studs. The objective of this study
was to develop quantitative and qualitative techniques for plan-ning, monitoring and evaluating stress screening programs duringelectronic equipment development and production. The work effortinvestigated methodologies for test selection and control whichprovide assurance that reliability growth is achieved in a cost-effective manner throughout the development and productionprocess. The work performed was concerned primarily with thecost-effectiveness of stress screening at levels of assemblyubove the part level, i.e., assembly/module, unit/group andequiptaent/systeta. Part level screening considerations were in-cluded in the study only to the extent that the quality grade ofcomponents used influences the initial quantity of latent defectsdnd therefore the planning of the stress screening program.
1.2 Sunm.uarZ of Stu•_d
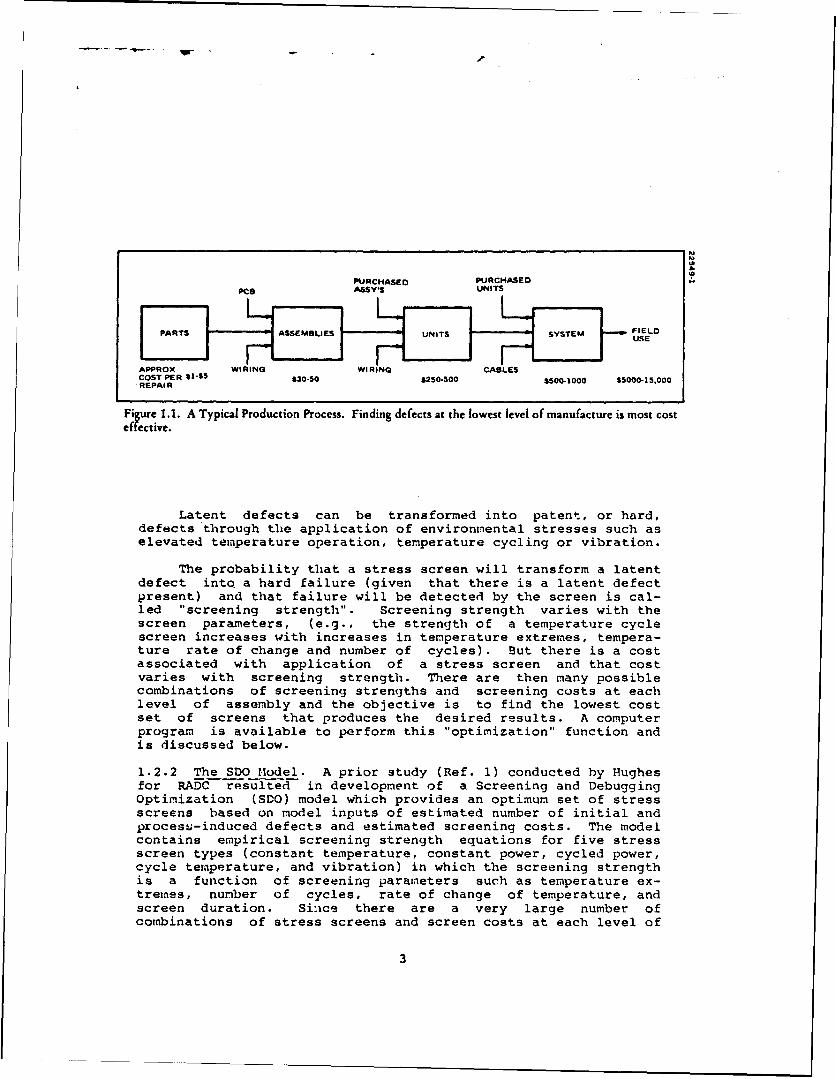
1.2.1 Stuýd_.poach. The basis of stress screening is theelimination of latent defects at a point in the productionprocess when it is least costly to do so. Figure 1.1 depicts atypical production process where parts and printed circuit boards(PCB) or wired chassis comprise assemblies; then manufactured as-semablies, purchased assemblies and associated wiring compriseunits; and finally the units, other equipment and intercablinguiake up the comipleted system. Latent defects are introduced ateach stage in the process and, if not eliminated, propagatethrough to field use. The cost of repair increases with increas-ing levels of assembly, being $1 to $5 at the part level and per-haps as high as $1)00 at the system level. Field repair cost es-timates have been quoted as high as ^15,000. For economicreasons alone, it is desireable to eliminate latent defects atthe lowest possible level of asser.bly and certainly prior tofield use.
2
FF
URCHED PURCHASEDPUC ASSYE UNITS
-1 USE
APPROX WIRING WIRING CABLESCOST PER $1-15 S30-S0 $250-500 $500SO000 $5000-15.000REPAIR
Figure 1.1. A Typical Production Process. Finding defects at the lowest level of manufacture is most costeffctive.
Latent defects can be transformed into patent, or hard,defects through the application of environmental stresses such aselevated temperature operation, temperature cycling or vibration.
The probability that a stress screen will transform a latentdefect into a hard failure (given that there is a latent defectpresent) and that failure will be detected by the screen is cal-led "screening strength". Screening strength varies with thescreen parameters, (e.g., the strength of a temperature cyclescreen increases with increases in temperature extremes, tempera-ture rate of change and number of cycles). But there is a costassociated with application of a stress screen and that costvaries with screening strength. There are then many possiblecombinations of screening strengths and screening costs at eachlevel of assembly and the objective is to find the lowest costset of screens that produces the desired results. A computerprogram is available to perform this "optimization" function andis discussed below.
1.2.2 The SDO Model. A prior study (Ref. 1) conducted by Hughesfor RADC resulted in development of a Screening and DebuggingOptimization (SDO) model which provides an optimum set of stressscreens based on model inputs of estimated number of initial andprocesL.-induced defects and estimated screening costs. The modelcontains empirical screening strength equations for five stressscreen types (constant temperature, constant power, cycled power,cycle temperature, and vibration) in which the screening strengthis a function of screening parameters such as temperature ex-treiaes, number of cycles, rate of change of temperature, andscreen duration. Since there are a very large number ofcombinations of stress screens and screen costs at each level of
3
assembly, e.g., at assembly/module, unit/group, andequipment/system levels, the SDO model utilizes a dynamicprograimning algorithm to find the optimum solution to either,
1) the set of screens which achieve a predetemnined reduc-tion of latent defects for the least cost, or
2) the set of screens which achieve the maximum reductionof latent defects for a fixed cost.
The SDO model was retained for this study because of its op-timization capability. However, many changes were made to theuiodel during the course of this study, as indicated below.
Previous SDO Model Model Changnes
1) Screening strength equations More current equations weredo not reflect recent stress substituted for existingscreening experience, equations.
2) Vibration screening strength Equations were added for randomequation is only for single vibration and swept-sine vibra-frequency vibration. tion. A new equation for single
frequency vibration wassubstituted.
3) Model is difficult to use. Use of the model was simplifiedMlany user inputs are required. by:
a. !Mlinimizing user inputrequirements.
b. Providing clear instructionsfor model use.
C. Providing examples toaid the user.
d. Making the model interactivefor use on time-share termi-nals.
e. Including user prompter andassist instructions.
f. Output formats were improvedto facilitate user under-standing.
4) The solution of the The dynamic programming algo-optimun set of screens rithn was altered to a
4

determined by the model contrained optimizationwas, occassionally, un- solution to provide anrealistic (e.g. 5 different optimum set of screens consis-screens might be required tent with current practice.sequentially at the samelevel of assembly).
5) Running of the model can be Unnecessary precision wascostly (much core is re- eliminated. Instructions werequired and CPU time can reduced.become significant forlarye systems).
6) SDO model does not have Adaptive feature was added to"adaptive screening" allow an adjustment of stresscapability, screen parameters on the basis
of results observed.
Screening strength and initialfraction defective estimatescan be derived from observedresults using the chance-defec-tive exponential (CDE) model.
1.2.3 Screeninq Strength E__quations. Screening strength equa-tions were developed for random vibration, swept-sine vibration,single frequency vibration, temperature c/cling, and constanttemperature. The first three equations (those for vibration)were developed from the results of the vibration screening ex-periments conducted by Kube and llirschberger (Ref. 8).Experiments conducted by Edgerton (Ref. 5) and Baker (Ref. 6) didnot produce sufficient vibration induced latent defect precipita-tion to enable model developmaent. No other controlled experi-i.tents with the effectiveness of vibration were identified by theliterature search. The development of the vibration screeningstrength equations is described in detail in Appendix A. Figures1.2, 1.3, and 1.4 show screening strength versus time for thethree vibration types.
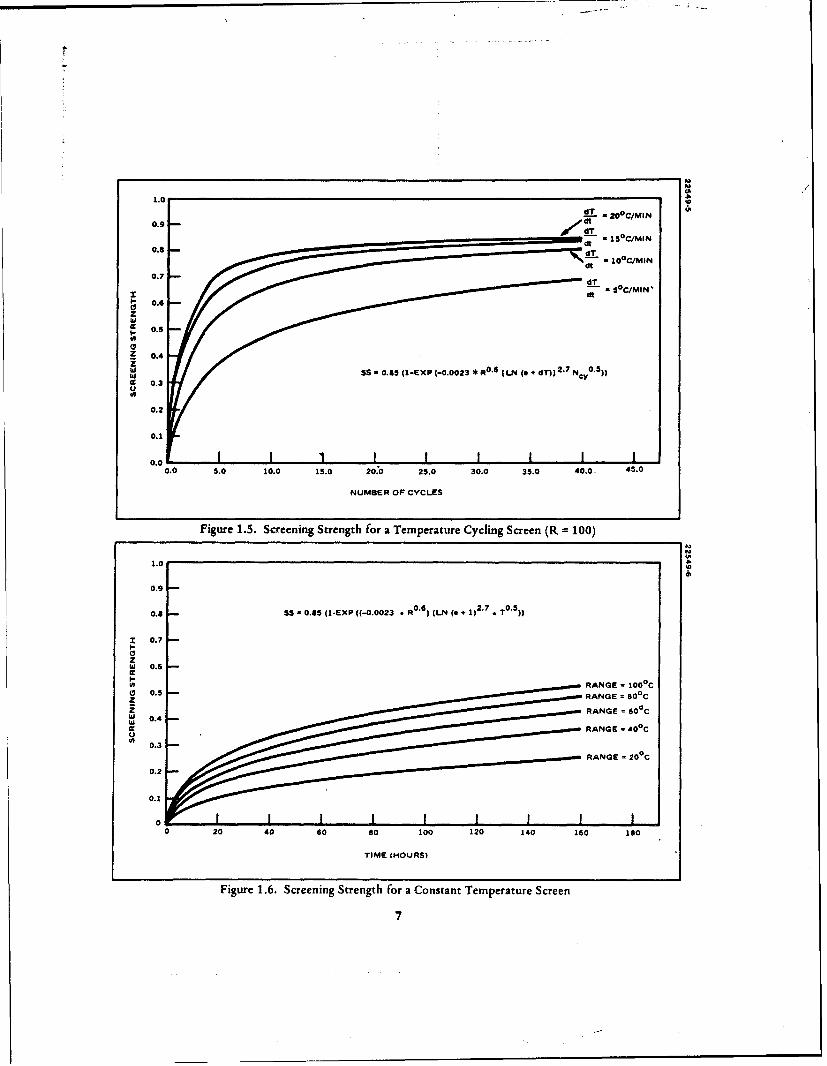
The temperature cycling screening strength equation isderived from the curves on page 6 of UAVfIAT P-9492 (Ref. 9). Itwas assumed that the curves represented results primarily fromAGREE testing of avionics equipment and represent -54 deg. C to+55 deg. C temperature extremes and a 5 deg. C/minute rate ofchange. The constant temperature screening strength equation isderived froia the temperature cycling equation. Figures 1.5 and1.6 show screening strengths for the temperature related equa-tions. The derivation is described in Appendix A.
1.2.4 Adaptive Screening. Since the stress screening equationsare empirically derived, they are only rough quantitative
5

|+S 0----T f l
0.0
0..z -- . 0 .0
so~
O.R
0. I rss
0.2
0.7
"0 0.00440 - 0.008 2oo I I I I I
@0.
£0 20 20 ,t0 00 00 70 @0o ,
VI•PATION TIMe £MOlOVTe0i
Figture 1.2. Screening Strength for a Random Vibration Screen
G •.0
0.°
0.3
0.20( 2..000
0.7
0.00.
0o 00.00•o 40 7
O0.2
IN.1i lell: 11: -..€149 to 0.4r00.O 0.040$0 0.32.
0.0
0.4
1.00.
o�IS 0 00o
S0I.0.0.
0.0 1o -0 34 40 0o .0 10 01
VIONATION, TIME (MINU.TES)
Figure 1.4. Screening Strength for a Single (Fixed) Frequency Vibration Screen
6
.09
0.97d
dt
0.7 - --.-- ----E-- (-.02 * $0 [J C/ T) N0.)
1- 0.3
0
E 0.2
IX 0.3
0.0 J0.0 5.0 10.0 15.0 20.'0 29.0 30.0 35.0 40.0. 45.0
NUMBER OF CYCLES
Figure 1.5. Screening Strength for a Temperature Cycling Screen (R 100)
1.0
0.9
0.8 SS -0.45 (1-EXP ((-0.0023 R R0.
6)(LN(0 1)
2.7
.*T0
.5)
X 0.7
zw0.6
z RANGE = 6000C
-Iw RANGE - 400
C
0.3
RANGE - 200C
0.2
0.1
0 20 40 60 s0 100 120 140 160 1S0
TIME IHOURS)
Figure 1.6. Screening Strength for a Constant Temperature Screen
7
approximations of the screens' ability to precipitate latentdefects. Screening strength is also thought to depend on otherfactors such as equipment type, construction, size, part composi-
'tion and degree of design and production maturity. Therefore,the equations -Are useful in establishing a starting point andserve as a basis for planning a screening program. As actualscreening results become available they can be compared with theexpected results as determined by the screening strength equa-tions. If the actual results fall outside the 99 percent boundson the expect.id results, the actual data can be entered into the,.todel which will automatically adjust the "equipiient-related"constants of tle stress screening equations, thereby adapting theequations to the specific hardware characteristics. The 99 per-ceat bounds are based on a statistical test of the hypothesisthat the planned values are correct (with a probability of 1 -
.99 = .01 of rejecting the hypothesis when it is true).
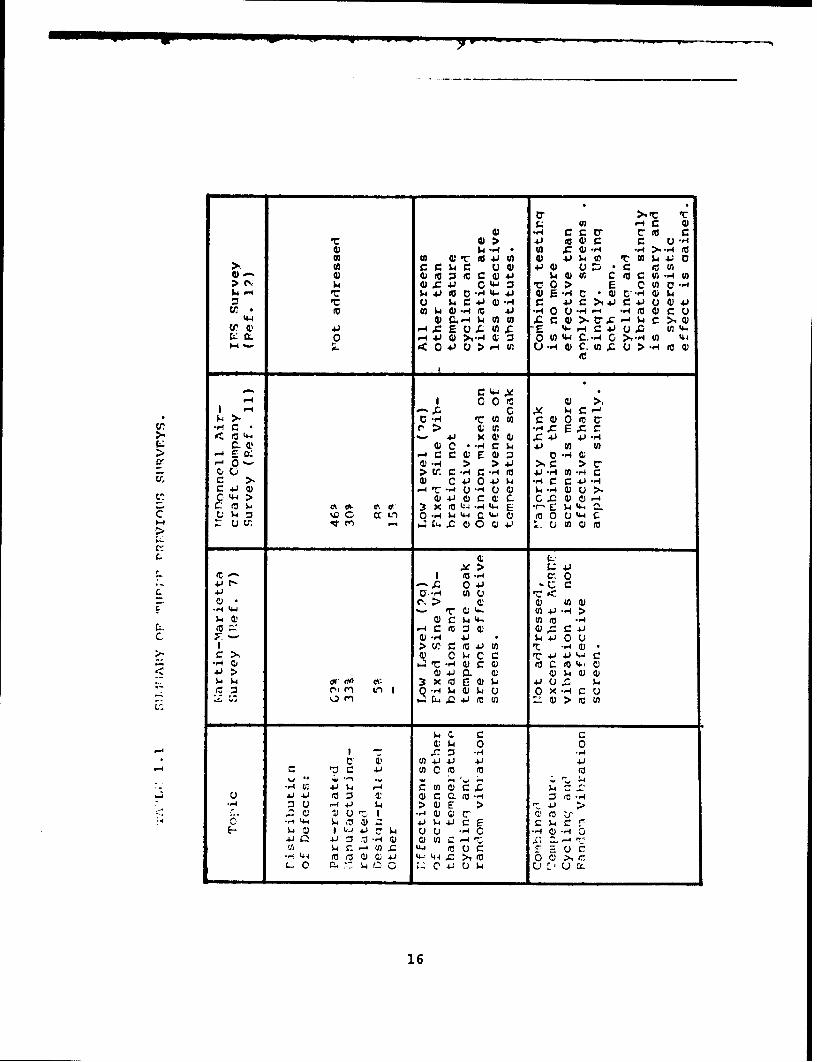
1.3 SurwmarL_,ynf _Industry_ Surveys1.3.1 Surveys Previously Conducted and Reviewed for this Study.
Three surveys previoulsly conducted on the subject of stressscreening were reviewed and the results of each are summiarized inthe following paragraphs.
The results of the three surveys show r.marked similarity be-cause there are couno,, respondents to the surveys reporting onthe same experiences. 'Much of the experience data reported showsstrikine similarity in stress screens used, screening para-meters (e.g., temperature extremes, temperature rates of change,vibration levels) and in opinions as to which screens are mosteffective. This is attributed to the fact that much of thereported screening experience is the result of contractuallyrequired MIL-STD-731B AGREE testing, primarily on avionics "blackboxes".
1.3.2 f4_artin-,'_arietta_.Survey- _(Ref.-7_). This survey of twenty-six sources p)rimfnarily reporting on AGREE testing experience indi-cate the following beliefs.
IJOTE: This survey represents experience and opinions of aboutten years ago and a large amount of stress screening ex-perience, apart from AGREE testing, has been accumulatedsince then.
a. 6-10 thermal cycles are required for the elimination of in-cipient d]efects. As more complex the screened item becomes(i.e., by part count), more cycles are required.
b. Hore than 10 cycles are required if screening is done at theassembly level, and unscreened parts are used. 16-25 cycleshave been used.
8
c. A temperature range of -54 deg. C to 55 deg. C is most com-monly used. (AGREE temperature range for avionics). Bestscreening is provided Dy using the maximum safe temperaturerange and rate of change.
d. Temperature cycling of soundly designed hardware does notdegrade the hardware.
e. Application of power during temperature cycling with con-tinuous performance monitoring is recommended. Turning offpower during' the cool-down cycle allows a more rapid tem-perature rate of change and allows parts to reach the lowtemperature extreme.
f. Failure-free cycles are sometimes used. The report recom-mends one failure-free cycle.
g. Implementing temperature cycling is most compatible withprinted circuit board (PCB) construction and least com-patible with large, complex potted cordwood modules.
h. Augmenting "black box" temperature cycling with additionalcycling at the PCB level should be considered.
i. An approximation of the types of failures detected in maturehardware by temperature cycling is:
Design-related 5%Manufacturing-related 33%Part-related 62%
j. Temperature cycling is an effective screen, with the screen-ing strength dependent on the temperature range, temperaturerate of change and number of cycles. Temperature soaks andlow-level vibration are not effective screens.
1.3.3 HcDonnell Aircraft Com.pany Surv-y (Ref. 11). This surveywas conducted during 1979-1980 of thirty-three avionic equipmentmanufacturers to determine the industry practice and opinionscurrent at that time in the conduct of environmental screening.A surmwary of the survey results follows.
a. The primary environmental stress screen used is a thermalcycle, with a high temperature limit of 55 deg. C or 71 deg.C most cormnon and a low temperature limit of -55 deg. C mostco, amon, reflecting the test limits of MIL-STD-781B.
b. Temperature cycle durations of six to eight hours are mostcommonl and probably reflect convenience in adapting to the24-hour day rather than for screening effectivenesspurposes.
9
c. Four to ten temperature cycles is most common, with the lastcycle being failure free.
d. The most common temperature rate of change is 3 to 5 deg.C/minute.
e. Vibration during temperature cycling was limited toMIL-STD-781B requirements (i.e., 2.2g, sinusoidal, 10minutes/hour). Some random vibration was used as a screen,separate from the temperature cycling, using levels of 3 to6.2g 14S for durations of 5 to 10 minutes in 2 or 3 axes.
f. There was no concensus on when random vibration should bedone when applied with temperature cycling (i.e., before,after, or in-between temperature cycling).
g. The distribution of the types of failures detected as aresult of temperature cycling is:
Design-related 8%lianufacturing-related 30%Part-related 46%Other 13%
The above percentages are mean values with large variances,reflecting varying degrees of production maturity.Soldering defects were the most common uanufacturing relateddefect.
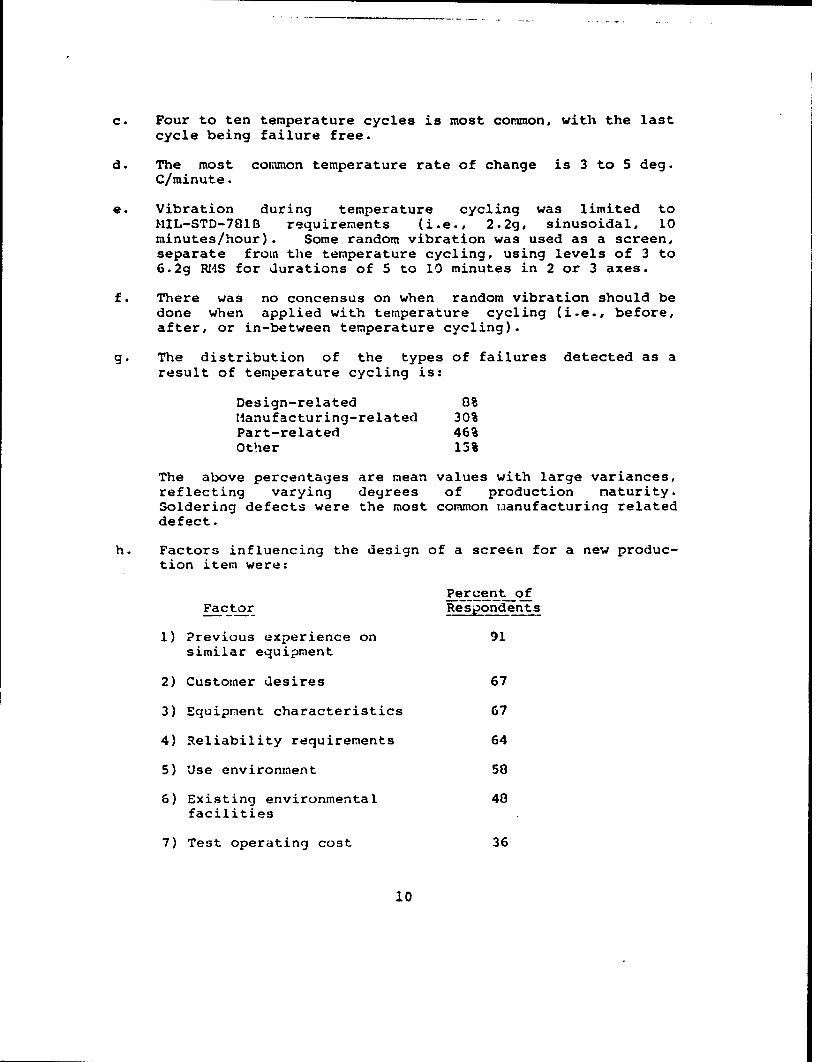
h. Factors influencing the design of a screen for a new produc-tion item were:
Percent ofFactor Respondents
1) Previous experience on 91similar equipment
2) Customer desires 67
3) Equipment characteristics 67
4) Reliability requirements 64
5) Use environment 58
6) Existing environmental 48facilities
7) Test operating cost 36
10
i. About 40% of the respondents reported that the screen hadbeen changed after the start of production and the majority(80%) of the changes were to .increase the screen (moretemperature cycles, added burn-in, added random vibration,increased vibration level) as a result of poor reliabilityresulting from the initial screen.
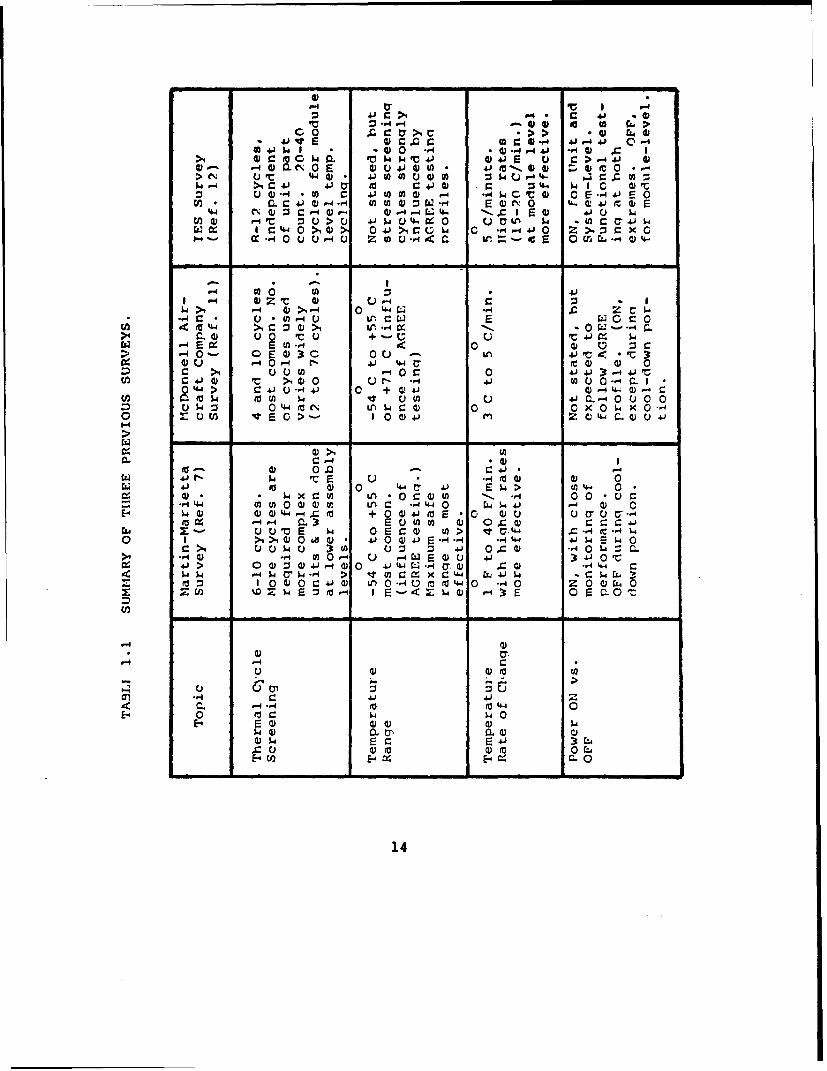
1.3.4 Institute of Environmental Sciences (IES) Survey (Ref.12). This survey was conducted during 1980-1901 by anIES-sponsored National Committee to develop an environmentalstress screening guidelines document. The survey resulted inreceipt of 85 detailed responses from 14 sources and over 50% ofthe responses were for avionics applications. Salient findingsof the survey are as follows:
a. Thermal cycling and vibration were the most common stressscreening environments used at the module, unit and systemlevels. Survey respondents also believe that thermal cy-cling and vibration are the most effective stress screens.
b. Equipment reliability can be improved by 25 to 90% by meansof environmental stress screening. The range of reliabilityimprovement varied widely depending on equipment type,screening environment and the levels of assembly at whichscreening was performed.
c. Thermal cycling was found to be a more effective screeningenvironment for electronics than vibration, by a factor of 3or 4 to 1. Random vibration is more effective than sweptsine, and swept sine is more effective than fixed sine.
d. Both thermal cycling and vibration are needed for optimumscreening effectiveness. It is inconclusive that it is moreeffective to perform thermal cycling or vibration in anyspecific sequence but there appears to be a synergistic ef-fect of using both the environments.
e. Module-level temperature cycling is generally 20 to 40 ther-mal cycles, with a temperature rate of change of 5 deg.C/minute most common, and no power applied to the module.There is no significant payoff to extend the number ofcycles beyond 40. Increasing the temperature rate of changeproduces maore effective screening. Application of power tothe module during the screen does not increase screeningeffectiveness.
f. Units and system level screening profiles used reflect thestrong influence of ?IIL-STD-7811 in temperature range andrate of change. 8 to 12 thermal cycles, with power applied,were most common.
11

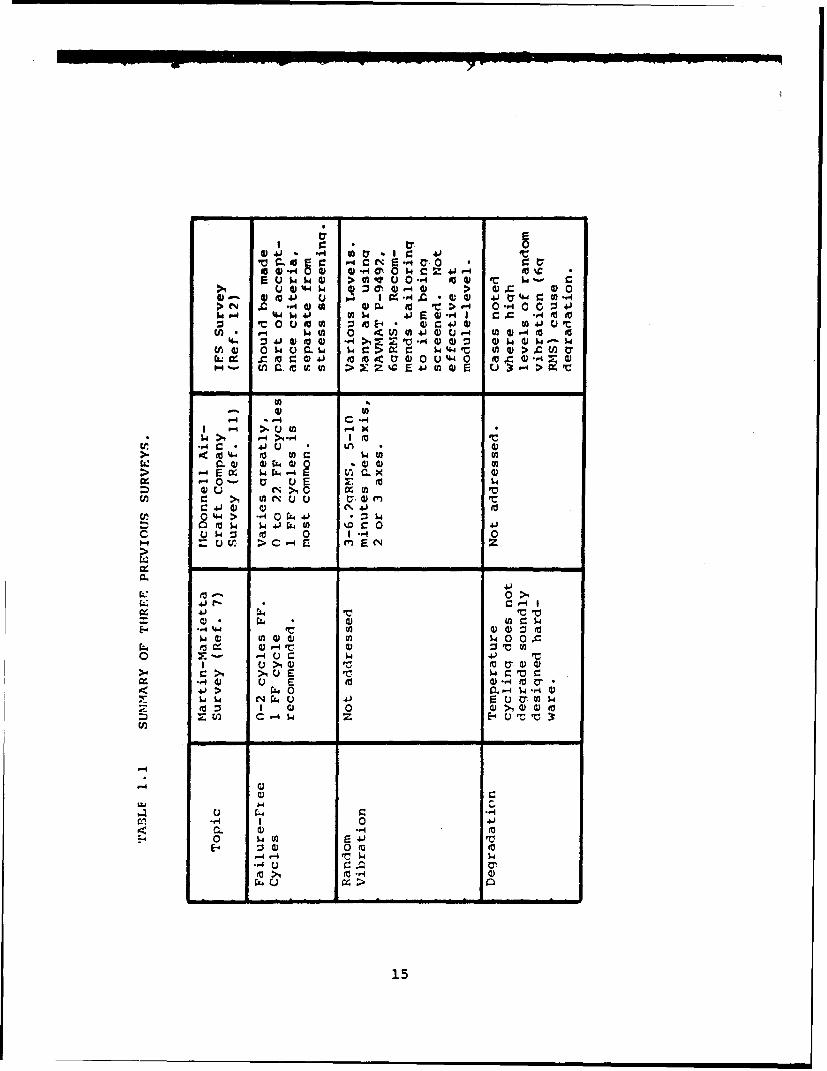
9- Some cases were noted where degradation was introduced inequipment at high levels (i.e., 6gRIS) of random vibration.There is also an indication that lower levels of randomvibration can be as effective as higher levels in someapplications.
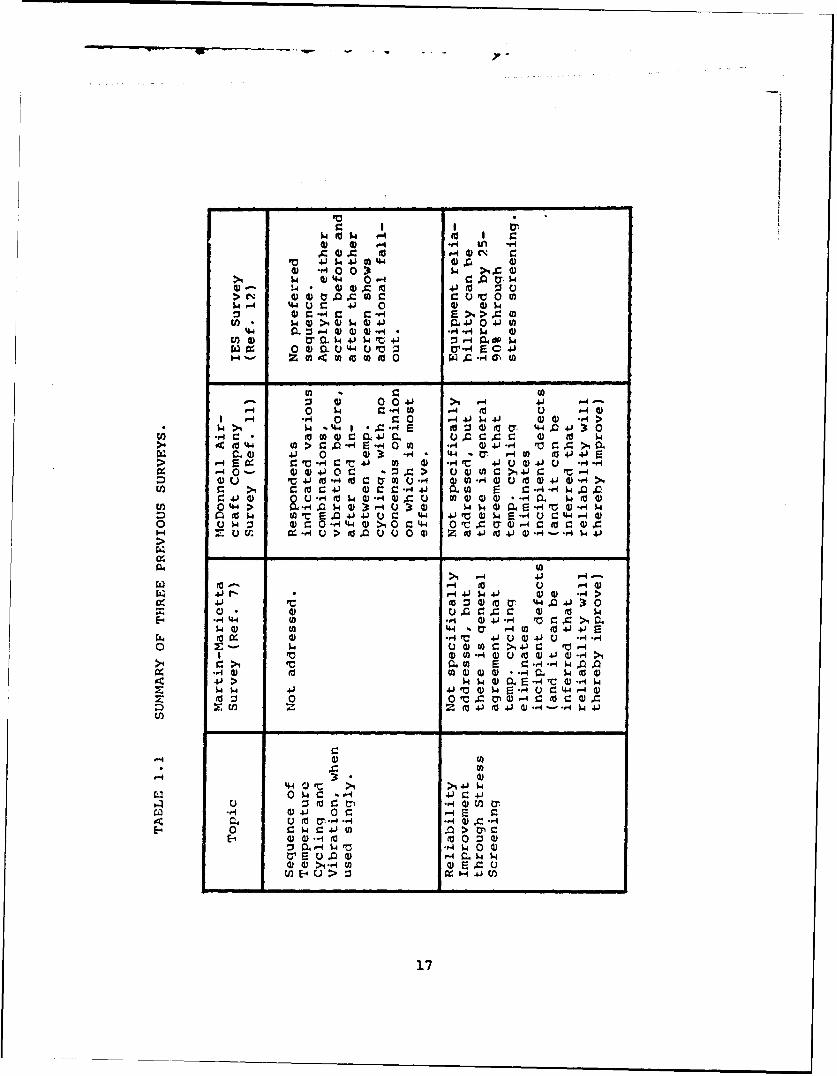
1.3.5 Survey Consensus. Thermal cycling and vibration arethought to be the effective environmental stress screens forprecipitating latent defects. A large part of the reportedstress screening experience data is a result of contractuallyrequired AGREE tests in accordance with HIL-STD-781B, test levelsE and F, for avionics equipment. The AGREE requirements have obvi-ously strongly influenced the survey respondents with regard to temperaturecycling and vibration. This, at least partly, explains the com-monality in stress screening practice. Most screening experienceis at the unit, or "black box", level and a range of 4 to 12thernal cycles is believed to be sufficient to screen out latentdefects. There is some belief that the more complex the unit(i.e., in part count), more thermal cycles are needed, althoughthis belief is not universally accepted. The most common tem-perature range over which thermal cycling is done is -54 deg. Cto +55 deg. C, again reflecting the influence of MIL-STD-731B.There is a com non belief that greater temperature ranges provilemore effective screening, provided that the temperature limitsare within the safe operating limits of the unit being screened.The most comion temperature rate of change appears to be 5 deg.C/hainute and there is general agreement that higher rates ofchange provide more effective screening. Temperature cycling atthe unit level is most often accomplished with power applied andclose Iwonitoriny of perforraance at both temperature extremes isrecommended. Power is turned off during the cool down cycle.Application of power during temperature cycling at the modulelevel does not appear to increase the effectiveness of unpoweredscreening. There does not appear to be a clear consensus on theuse of failure-free cycles. While the practice of requiring thelast cycle to be failure-free is used by some and supported byothers, there is another group who believe that a failure-freerequirement should be inclided with other acceptance criteria andkept separate from the stress screening process.
Random vibration is considered to be the most effectivevibration screening process, followed by swept frequencysinusoidal vibration (swept sine) and fixed frequency sinusoidalvibration (fixed sine).
Fixed sine vibration at low levels (e.g., 2.2g) is almostuniversally believed to ineffective as a workmanship screen.Random vibration at levels of 3-6gRMS, for 5-10 minutes (peraxis), and applying to 2 or 3 axes is currently thought to be themost effective screen. However, the application of random vibra-tion is relatively new and the survey results were mostly reportsof AGREE testing, using 2.2g fixed sine vibration. Vibration atthe module level is not currently thought to be effective.
12
Screens other than temperature cycling and vibration (e.g.,temperature soak, power OI1-OFF cycling) are not considered to beeffective screens. Combining screens, such as performing tem-perature cycling and vibration on the same unit simultaneously orsequentially is considered to be effective. Opinions are mixed,however, on whether simultaneous screening is more effective orhas the same effectiveness as sequential screening. There isalso no agreement on the most effective sequence of combinedscreens, i.e., vibrate before or after temperature cycle.
Table 1.1 summarizes the key issues of the three surveys.
13
2 V c >4 P-40 A
cO 0 *>> r" z0)U41 * -0 s 0,~4' 00 ý
>1 1 )c a 4 M PC$ w1 V ~41 04) E 0 c > 41 0)oWc r'44(N 0 E * )U 4j 4) 00 4 ( ýId~-'4) 4) 4
>N i c 44 4)' j(A0 C4)0 Z * C 4. I04 cA
V a)--q4 *02 W 40 20 ( -4 -4 W C I 0 E - 'EO0M Q. c41 0)-4 .4 0 w 4) :3 w "q E 0) v '"O 4- 41m 0) E
U) 0 P4 u zu U, 1 4 Z41 0 .. U) Ew %' 6a
I c4.40 >4 0 O4'C~ C *-4e-i40 z >1 3c x
w 0
U - P40 4) -- 0 44I'
I4 ) uZ 0 PC' + -CE0 .~ IX~ E t( -m
C0- 0 E0 V 0- U VL4nu 00 0 1- 1 4- tQ
-c '- OEO3 0 0 C: 41V w : V44c0 41O- 1) 4' > 0r 4 to u 0 0- .8 4 > C J0 -4 J 0-1 0 4'4')4 4 ') -4r
U 4 3 4'4 M iW C% ~ LA 4 4' 0200 -d x -0 X: u to E 44 0 >+0 41 -V
U 'Q..4000J~C 0 X0X .
0)xco Ln 0a4 O0 ,4 00 r-iH '44 0 0 0~ ~ 0 0 n - - W4 4 Q
(a + 0 V4 ( 4) u U' E > U24 0'-
u u 0 EO0 ' E0 0 U) ; 44 C-, t-f 4
0 1 > > 0 0 4a0 4100 4)JE -4 -4 -. 444 4-c > 00u w 0 u 4' O) c : j 0 C *-rq0 W ; C
0 .- 10-4tn 00- 0 P-4 W E a) 4' 3: A 0w'> O0 z 4.-0 41 rf 0.1 ( Q I a) -04 t4 c
-3 10 00 c41 l04 0 j 0 J~440 .,4 0 o o C' 42: ) WE v -M I E -3:E OE0-a'0
-4 r-4
Y 0) (a
cn -.. 4*4,4-
$40 0 $4 000
wC 0r 4
14
41 4j - " A* : 4
k 0> V 0.4 0 2*.*4 c0C
U0'b4.4 W 30. 0) 4 09 0 0> (is IL4 U0 ICi > P4 0 -00 4J 0 V 4
0 u0 0 ivU 0Q c 41 0 0004JUM
U). - .4 IA 0 4 ni) 4 )0Q -4 0 ) P4 it i
"w% Q. wU) > Z %C E41W0 U3 -4
U))- ~ C -4U
t; .,4 41 '4K c4 >.OU CA
cc ~ 4)0 0 4) W
> -4 E M (sz. -4E rý.) 0
U~. u 0) (nV
C410~) C 4 10, 0> -4 0 L44)0
k~ 4.) I.4.UU) cO 0 41it 0 .,1 0
.4.
Ia). 0)>.
E- 44 . * 0
0 IA 04) 4V 0 CVU0 ~ -40 - 4J
~>4 >4 E Vc*41 0 E- 4-w )> r4o u~- 4-1- 0 1
I Q) 0 1Q0m
"Ci ., 04
0 0 4
P4 ~ u >
15
.4q (A- W- , >.4
C) $4 C 04) 4J4) U *C ij 0)4)atZ V 414 14 4)U M CgoU)to-4 c
:5C W.4 0"~ 0> E cwc*.14 4J CU 0-, 4 4-A CF , J4) 4)4
ci: 4) -4~ 4C J -- 4 0 Uq-4- m 04c u'44 4)C-,UU w Cwr.4) >,a*c>c , wT~4 41 F-4 E () r- m E 4- 4qC 4,0 u r'4.
0 P44J4) >1-r-4C 0 M%64 C. -4 0>1-P4V) '44
0 00v )>
.- 4, 4)) x ll( -41 4,*-CC4)C"-c~ $4, U) U)
0) -4 > > 41 r. >t> t C~L -*4C*.'tm 4 -H M -4 C
V. C >4) c 410 4 4 -H I. 4C ,-H41 - -4Ut-0 u 44.4 U >.44 > 41 ac c) CC4Q) C)-
c %Cc CtLV) O.4$.W"44 CU., " a 1U44 c- .C C) 0 r.) 41 UWC) l
C,
0 44)
-1 4)4 4, . * ~ 4-) >44!0V) (a .14
itsC 0 4;Q) 1- 0J 0
- 44 C c 'C. 4 -
-4 0 4 ) to -
*.-4 C,1- M - CWOCx-4.Cen 4J M~. 4)n >) w)C.)
0~~~ 0~~~J -I1-C
'1.~., --C-C0C4'0 0E O
C- ~~f C 2 4-J 4J 4
16t cm fur
I4) 44 0 P4 w0 0 c *.. 41 to 3
> N4c 0 r..4) 0 c'V 4 4 C: 41JU)'4 0. $4
5.44 >4 4) 4 4 J r 4 0 4 1 0).
4-1 0 4 ) rq-P r4U4 4
U) *4 4J$ ,4 0 - P$
:3 a) 0 0 41 > .4 .41 ..40 4 ~ -H~ to 4 to u '-44
I '- 4 0 ~ 0 ,4J 4i4J 04)0 f4 >W1 *.4C 4U)4)O*C E t .4 4) 4J )1
U;al4) 4.) 0 4) 3 -M.4. 4*4 t7 ,4U 0 d4J 4J> E g . 10 -4 r.'C4J U) 4) *-r4 r 4j 0j4) 4.)U *o-.4'
U) ro c1 4)0z 101 cr.4 41E -,
r- -1 0 u04 -40( 1 )f )04-4> a-t3 4U3 * .- 4 )$.44 E 4V4) U -4>$
a to w UC) T*.*4. .) C - Q) 4 F 4J.C --4 4)00 In $4: )r 4 44 4 0 ICCU )-4W 0 10 C 0
4) r4V 4iU4)4JU *-4*to-)- 4) - J V'4
Ic M 4) 2- 0- 4)4J j-,.4>
E-4 -ri 4- U).1 4 J- 0 r 40"44) co U4)4). -4 CO 1.004J J54,fa >0 1 4144) 4) 41V 0-4 1-e
~~In
0 4)I 0) I
D14 -W4 it 4J
04 $4)- c~ -4j cC.j 000 4J r r0 .41J>
Qi -I 4 r ý40 4)a, E u.04) r4r 4$0 4) >9-1 t Q Uza
17
2. PLANNING A STRESS SCREENIrNG PROGRAM.
2.1 Introduction. The ultimate success of a stress screeningprogram is strongly dependent on the care taken in planning andunderstanding the limitations of stress screening. The planningof a stress screening program involves a number of considerationswhich are addressed below. Two important considerations shouldbe kept foremost in mind in the process of planning a stressscreening program;
"* The quantitative aspects of stress screening, i.e., theexpected number of latent defects and the ability of aspecific screen to precipitate those defects, cannot beanalytically determined, and any models purporting todo so must be recognized as approximation methods basedon past experience.
"* Past experience may provide some guidance in stressscreen selection in cases of similar equipment composi-tion and construction and degree of productionmaturity. However, there are usually other factors in-volved (e.g., reliability improvement fixes may havebeen incorporated simultaneously with the start ofstress screening) which may obscure the true source ofimprovement.
Other factors to consider are:
0 What are the objectives of a stress screening program?(e.g., achieve a quantitative reliability goal, maxi-mize reliability, reduce production costs, reduce war-ranty costs, minimize life cycle costs?)
* What are viable alternative stress screens for achiev-ing objectives (which screens applied at which levelsproduce the desired results?)
• What are the costs associated with each of the alterna-tive approaches? (consider both nonrecurring andrecurring costs)
* Hlow does one know if the screening program is going ac-cording to plan (data gathering, analysis, decisioncriteria)?
* How can a stress screening program be changed toachieve more cost effective screening?
* What are things that can go wrong, what early indica-tions are there and what should be done to correctthem?
18
0 How to and why keep management attention on benefitsbeing derived from stress screening?
2.2 Developin_ a Stress Screening Plan
2.2.1 Establishinq an Objective. The most common objective inestablishing a stress screening program is to improve fieldreliability by eliminating latent defects in the factory prior todelivery. This objective includes motivation through warrantyconsiderations as well as motivation to improve poor fieldreliability. Other objectives to consider are:
a. Meeting a contractual reliability demonstrationrequirement.
b. Achieving and maintaining a high field reliabilitylevel.
c. Assuring cost effectiveness in a Reliability
Improvement Warranty (RIW) contract.
d. Reducing production costs.
e. Reducing field costs of operations and maintenance(O&M4)
The cost of failing a reliability demonstration is highenough to negate most compromises. The amount of screening plan-ned should be consistent with the specified MTBF and test deci-sion risks. The same approach should be considered on areliability improvement warranty (RIW) contract. It should benoted that more screening is not always better and the improve-ment per unit of time decreases with time.
Achieving and maintaining a high field reliabilityrequires careful evaluation of problems which could adversely af-fect reliability levels and an understanding of how such problemscan be eliminated or controlled.
2.2.2 Determininq if a Stress Screeninq Procgram is Appropriate.The current popularity of stress screening might lead one tobelieve that it is a panacea for solving problems of low fieldreliability, high production rework costs and slipping productionschedules. Unfortunately, there are many other causes of suchproblems and no simple solution exists for correcting (orpreventing) them. The value of stress screening, i.e., theknowledge of what potential technical or economic benefits arederivable from stress screening, should be understood before adecision is made to apply it. Generally, on high volume produc-tion programs of complex hardware the cost-effectiveness ofstress screening should be considered. It is not so obvious that
19

stress screening is cost-effective, or otherwise beneficial, on asingle system, advanced development model, where the productionphase is remote and the non-recurring costs for stress screeningfacilities and test equipment are not insignificant.
The construction and complexity of the development itemare important considerations. A breadboard or brassboard modelwhich has little resemblance to a future production model shouldnot be screened for manufacturing/workmanship defects. Adevelopment model which is expected to undergo extensive produc-tization changes falls in the same category. Pre-productionmodels embodying new designs are prime candidates for stressscreening in a development phase because the types of defects tobe expected in production can be identified and a productionstress screening program can be effectively planned.
To determine if a stress screening program is appropriate,consider the following:
* Does the reduced field maintenance cost justify thescreening program cost?
o Is stress screening necessary for eliminating excessivelatent defects?
* Is stress screening necessary to achieve a technical(e.g., reliability) requirement?
o Will stress screening (in a development phase) providevaluable information for planning the production stressscreening program?
* Will stress screening save money in production (throughreduced rework costs)?
e Is the improved production schedule resulting fromstress screening worth the cost of screening?
o Does the goodwill derived from delivering latentdefect-free products balance the cost of stressscreening?
2.2.2.1 Field Maintenance Cost Savinqs through Stress Screeninq.Field maintenance costs resulting from latent defects can be cal-culated by multiplying the number of Latent defects present bythe average cost per field repair. Figure 2.1 is a simplifiedproduction flow process of an unscreened unit. Assume the unithas 11=10,000 parts, of which p=.001 fraction defective, resultingin the introduction of 10 latent defective parts. Further, as-sume 20 workmanship defects are introduced at the assembly leveland 10 more at the unit level. The normal assembly and unitoperational testing is assumed to have screening strengths of
20

0.20 at the assembly level and 0.40 at the unit level. Then, only 6 latentdefects are precipitated at the assembly level (0.20 x 30 defects) and 14at the unit level. Since a total of 40 defects were intrcduced in theprocess and 20 were precipitated, a balance of 20 remain to fail in subsequentfield use.
paINDUCED INDUCEDASSEMBLY UNITDEýFECTS DEFECTSA= 20 U. 10
INCOMINGPART UNIOUTGOINGDEFECTS ASSEMBLY 24 UNIT DEFECTS: )N SS = 0.20 SS = 0.40 / 0 =20=10 F
DEFECT DEFECTFALLOUT FALLOUTF1 6 F2= 14
Figure 2.1. Latent Defect Flow for Process Without Stress Screening
Figure 2. 2 shows the same unit with stress screening at both theassembly and unit levels and screening strengths of 0.70 are asstmed. Thesame number of latent defects are introduced (40) but because of theincreased screening strength, 34 defects are precipitated, leaving only 6defects to be found in field use. The reduction of 20-6=14 defects saves$140,000 in maintenance costs (at $10,000 per repair). If the cost of doingthe screening is less than the discounted value of $140,000, thescreening has been cost-effective.
r)
A 20 U - 10 l*0
10 ASEML 9O,-UN--,IT OUTGOINGPSS = 0.70 SS = 0.70 OF = 6
F= 21 F 2 = 13
Figure 2.2. Latent Defect Flow for Process with Stress Screening
21

Laa
1.
00
U 0
'I,.(
0. 04
0.2 0
2 44. 1 2 41
COST PIER FIELD REPAIRn (SK)
Figure 2. 3. Field Maintenance Costs for Repairs Resulting From Latent Defects
Figure 2. 3 shows that, for this example, at $10,000 per fiteld repaira total off $200,000 will be spent in maintenance as a result of the 20latent defects (p>1.001). The figure shows costs rise rapidly as the initialfraction defective increases.
22

2.2.2.2 Using- Stress Screening to Achieve a ReliabiliyXRequirement. It is generally believed that large part popula-tions are comprised of two subpopulations, viz., "good" partswith a low failure rate, Ag , and "bad" parts with a highfailure rate, Ab. It is further believed, and empirical andexperimental evidence supports, that the good subpopulationdominates. The fraction of yood parts in the population may befrom 0.9 to 0.999, depending on the part type and quality grade.There is increasing evidence (ref. 19) that failures occurringduring the life of equipment are latent defectives precipitatedto hard failures through the application of the normal fieldusage stresses over a period of time. The continuously decreas-ing subpopulation of bad (latent defective) parts results in anequipment life characteristic of a decreasing failure rate.
If the expected instantaneous failure rate of an equip-ment is the summation of the.failure rates of the good and bad(defective) parts,
X equipment = (1-D) Ag + DkXg (2-1)
where, N = total part population
D = number of defective parts
Ag = good part failure rate
k Ag = defective part failure rate
and if estimates of Xg and k can be made, then the number oflatent defects that corresponds to a desired equipment failurerate can be determined by solving (2-1) for D,
Xequipment - 11Ag (2-2)D =
Xg(k-l)
Equation 2-2 addresses only latent defective parts and therebyexcludes latent workmanship defects, which can be included by ex-panding equation 2-1,
equipment 1N-D)X D+lg + (M-C)Xc + Ck 2 c (2-3)
23

where, M = total number of electrical connections
C = number of latent defective connections
= good connection failure rate
k 2 X= defective connection failure rate 2
Equation 2-3 can be used in planning and monitoring a stressscreening program for determining the necessary reduction in theinitial number of defective parts and the number of latent defec-tive connections that yield a value of X equipment that cor-responds to the desired equipment failure rate. At the conclu-sion of stress screening, there are still some residual latentdefects. As these latent defects are precipitated by field use,the reliability will improve because the latent defects arereplaced (with high probability) with good parts. See Appendix Efor a theoretical discussion of long term field reliability im-proveinent through latent defect elimination. Figures 2.4, 2.5and 2.6 show this reliability improvement for systems of 2,000,10,000, and 20,000 parts and initial fraction defective rates of.001, .005, and .01. The figures represent systems of three dif-ferent part counts, and undergo a natural screening of latentdefects (no stress screening) in which the good part failurerate islO 7aand the bad part failure rate is 2 x 10⁻⁴. The cur-ves in Figures 2.4, 2.5, and 2.6 were derived from a simulationprogram which simulates failures of good and bad parts and keepstrack of curmulative MTBF as the number of failures due to badparts decreases with time.
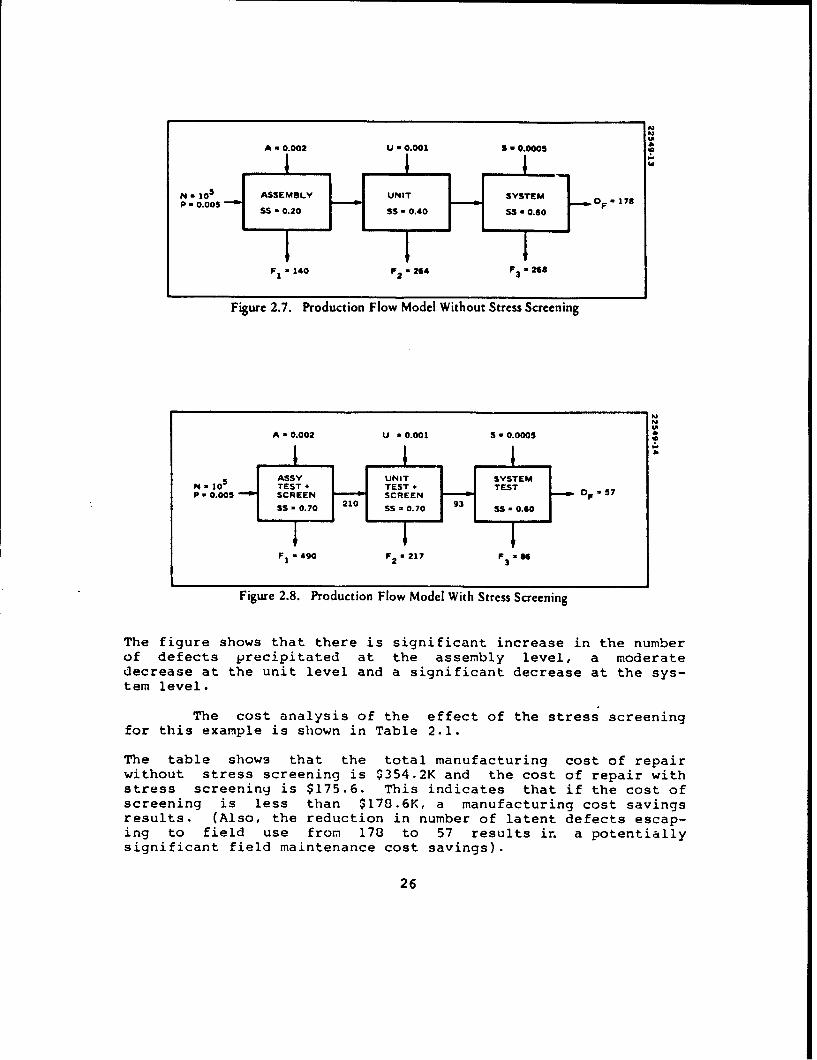
2.2.2.3 Manufacturinp Cost Savings through Stress Screening.Consider the production model shown in Figure 2.7. The figureshows a moderately large production operation involving 100,000parts. This may represent a single, large system of that manyparts or multiple systems whose total part count is 100,000.Assume that, without stress screening, the natural screeningstrengths of the assembly, unit and system levels are 0.2, 0.4and 0.6, respectively. If the incoming part defect rate is 0.5percent and induced workmanship defect rates (as a fraction ofthe number of parts) are as shown in the figure, a total of 850latent defects are introduced into the process and 672 of themare precipitated, detected and removed in the process, with thebalance of 178 remaining to be discovered in field use.
If stress screening is employed at the assembly and unitlevels, each with screening strengths of 0.70, the resultingdefect fallout at each level is as shown in Figure 2.8.
24

7
O (INITIAL FRACTIONDEFECTIVE) P =0.001
Ii.0 4
I-
0 10 20 30 40 50 0 70 809 0 1
FIELD OPERATING TIME (K-HOURS)
Figure 2.4. Field MTBF Improvement Through NaturalLatent Defect Fallout (2000 Part System)
0.9
0.8 -
0.7 - P - 0.015
20.2U
0.1
0 10 20 30 40 50 60 70 80 90 100 110
FIELD OPERATING TIME (K-HOURS)
Figure 2.5. Field MTBF Improvement Through Natural-Latent Defect Fallout (10,000 Part System)
P -0.001
0.4 -
XI P - 0.015
2 0.2
0.-
0.1
0 10 20 30 40 50 60 70 80 90 100 110FIELD OPERATING TIME (K-HOURS)
Figure 2.6. Field MTBF Improvement Through NaturalLatend Defect Fallout (20,000 Part System)
25
A - 0.002 U " 0.001 S-0.0005
N: 10 5 ASSEMBLY UNIT SYSTEM 0~ F 178P 0.005 SS-0.20 SS-0.40 SS-0.60
1 140 2 " 264 F3, 2G11
Figure 2.7. Production Flow Model Without Stress Screening
A - 0.002 U - 0.001 S-0.0005
N15 ASSY UNIT SYSTEMN - 105 TEST TEST + TESTP - 0.005 SCREEN SCREEN OF 57
SS-0.70 210 SS 0.70 SS -0.60
F1-490 F 2 - 217 F3 •86
Figure 2.8. Production Flow Model With Stress Screening
The figure shows that there is significant increase in the numberof defects precipitated at the assembly level, a moderatedecrease at the unit level and a significant decrease at the sys-tern level.
The cost analysis of the effect of the stress screeningfor this example is shown in Table 2.1.
The table shows that the total manufacturing cost of repairwithout stress screening is $354.2K and the cost of repair withstress screening is $175.6. This indicates that if the cost ofscreening is less than $178.6K, a manufacturing cost savingsresults. (Also, the reduction in number of latent defects escap-ing to field use from 178 to 57 results in a potentiallysignificant field maintenance cost savings).
26

Table 2.1 Manufacturing Stress Screening CostAnalysis Example.
Assembly Level Unit Level System LevelW/o SS W/SS W/o SS W/SS W/O SS W/SS
Number ofDefects Preci- 140 490 264 217 268 86pitated
Cost per $50 $50 $300 $300 $1,000 $1,000Repair
RepairCost ($K) 7.0 24.5 79.2 65.1 268.0 86.0
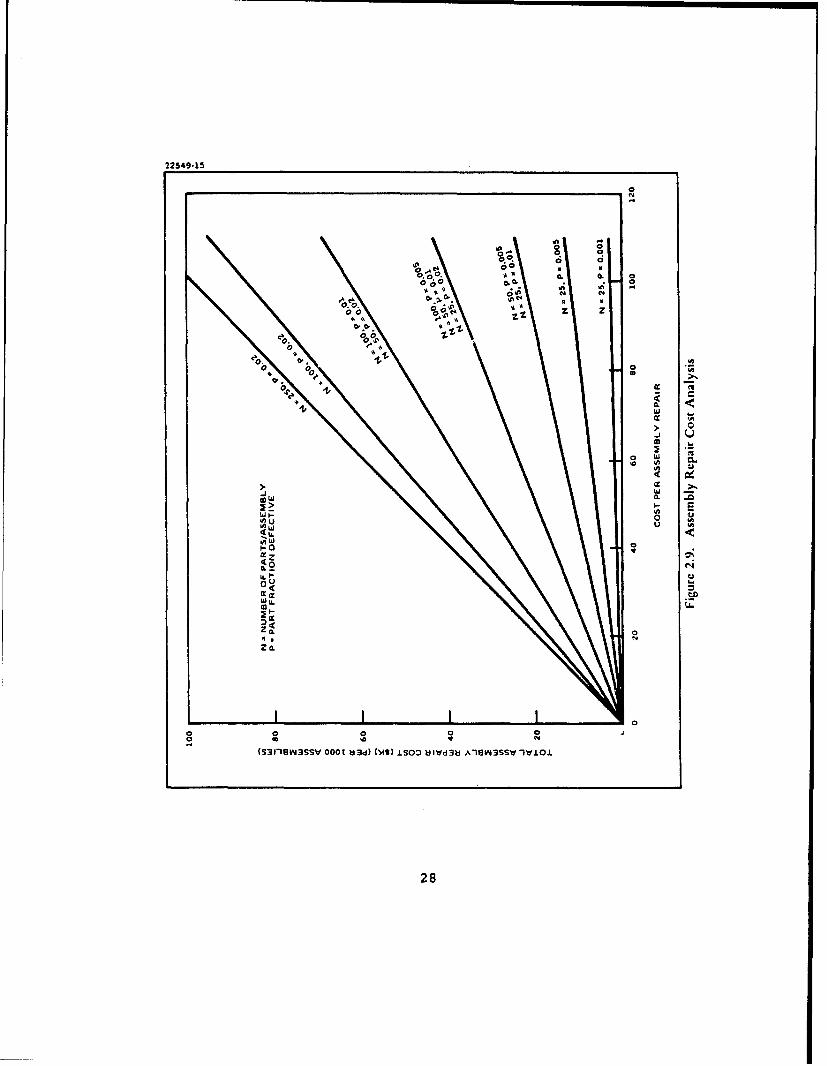
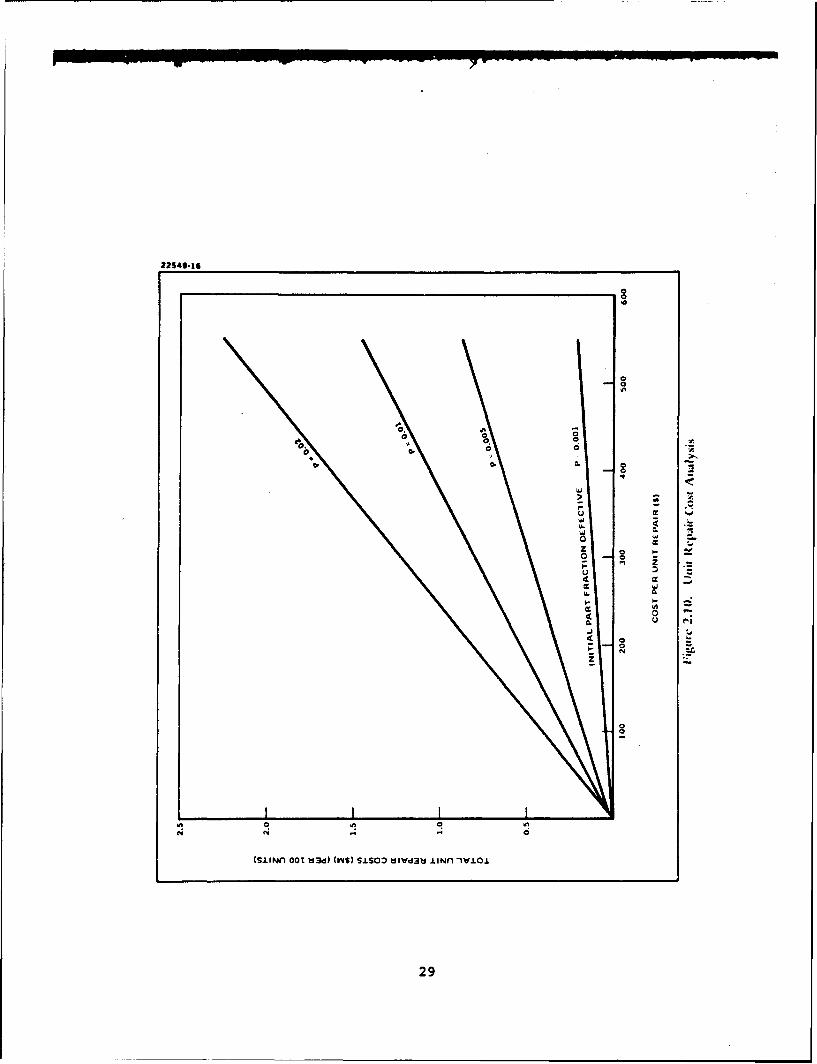
Since the cost per repair estimates are expected to varywith type and complexity of hardware, Figure 2.9 shows the totalassembly repair costs (per 1000 assemblies) as a function of costper assembly repair. Figure 2.10 shows the total unit repaircosts (per 100 units) as a function of cost per unit repair.Total cost is the product of cost per repair and expected num-ber of repairs. The expected number of repairs is determined bythe expected fraction of assemblies defective as a function ofthe initial part fraction defective, number of parts per assemblyand number of assemblies per unit, explained in paragraph 2.2.3,below. Both figures show the repair costs incurred if all latentdefects entering that level are precipitated, detected andeliminated at that level, which is unlikely since screeningstrengths are not expected to approach 100 percent. Some latentdefects will escape to subsequent stages where repair costs arehigher. Therefore, the repair costs shown represent the lowestcost to eliminate latent defects entering that level.
2.2.3 The Role of Part Level Screens
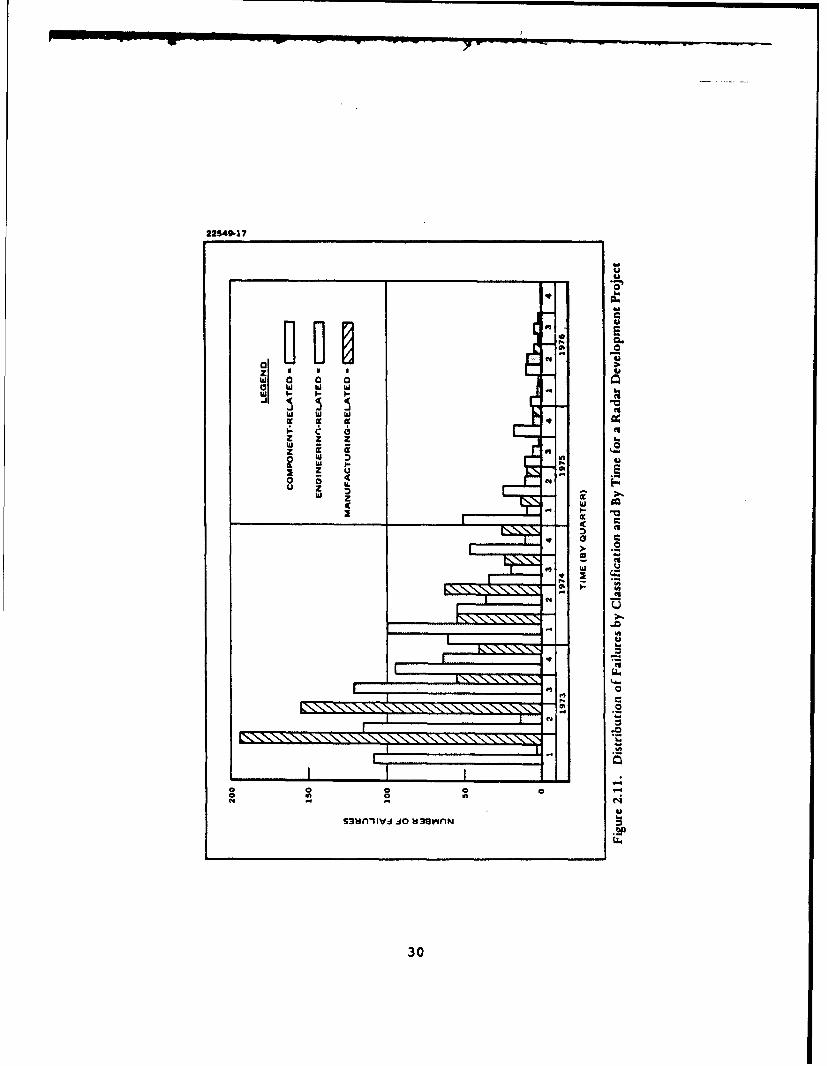
2.2.3.1 Part Failures in Field Use. The major portion offailures that occur in field use appears to be part failures ascompared to workmanship failures, although during early life thesplit between part and workmanship failures is about equal.Figure 2.11 shows the changing distribution in failure types withtime for a system development program. The early portion of thefigure represents the later development stages and the laterportion represents the final field testing stages.
27
22549-15
00
00 00
a 000. 0
o.".a a
ooo -m
, * >
JN w
0
0 . <''2
0 g -
0 Q
ww
00
C* 0(SglIBY3SSV000 Td~) IOD tl~dU A*SV4SSW VIO
11Ž 2-
22549.16
ch 0.
o 0 >u
0 ~ . 00' C. 0
(SL~n 0t bd) YYS SISO kltf~bi mnn .Lo
297
22S49-17
wU_____________ w
00 2c 03z z z
w0 00
u z
z w w
ww
01
o mv..0 0 0~n
30

Resign-related failures are a small fraction of the total numberof failures in mature production systems. During development,however, the distribution is quite different as indicated byFigure 2-12. The figure shows the distribution of defects forthree recent, large scale (25,000 to 47,000 parts/system)development programs over 2-3 years of field operation.
Part failures during production results in rework costsas described earlier. If parts are procured without screeningand subjected to sample receiving inspection, the fraction defec-tive may range from .01 to .20, depending on part type andquality grade. Even if the fraction defective is as low as .01and the parts are installed on assemblies averaging, say, 50parts, then about 40 percent of all assemblies produced will bedefective (only one defective part can make an assembly defec-tive). Figure 2.13 shows the expected fraction of assembliesdefective as a function of number of parts per assembly and partfraction defective.
2.2.3.2 Relationship of Part Fraction Defective to QualityGrade. Th"ne failure rate of different populations of microcir-cuits, operating under identical conditions, can vary over an or-der of magnitude, depending on quality grade (Class S versusC-l). Yet, the major differences between the Class S die and theclass C-1 die are the visual inspection acceptance criteria,level of process controls, and part-level screens and electricaltests to which the dice are subjected. Since screens and testsdo not make devices more reliable (they improve lot quality byeliminating some latent defective parts), a "good" class C-1 dieis as "good" as a class S die. Perhaps this can be extended to"good" class D-1 die as well. Therefore, it can be postulatedthat difference in failure rate of populations due solely toquality grade is a direct measure of the difference in fractiondefective of those populations.
For example, consider a class S, hermetic flatpack MSIdevice of, say, 40 gates operating with T;=25 deg.C in a benignground environment. A failure rate of •.0032xl0- 6 failures perhour is calculated. Let 5,000 of such devices be used in an enditem expected to operate 50,000 hours. The expected number ofdevice failures during the end item life is less than 1. Forthis application, this device can be considered "good" and if thepopulation exhibited its calculated failure rate by having 0, 1,or even 2 failures, the population might be considered to be freeof latent defectives. If a class C-1 device were used on the enditem instead of the class S device, an additional 20 failurescould be expected to occur during the same end item life, duesolely to the difference in quality grade. Perhaps the addition-al 20 failures represent latent defectives in the population. Ifthe class S parts were operated with T =100 deg. C instead of 25C deg. the increase in failure rate would result in an additionaltwo failures during the 50,000 hours. This may indicate that the
31
22549-14
00 0 W
( da
e4 --
0..
o
N U
ZU
SI I \ ,
............... 0 J :. . . . . . . . .
M/7, w
0 w0
S3nI~jJ N 0d~
32
22549-19
0
w r
U.wa
0 0
I-E
000
( 0U
4,A
or a 0-io
S3118YUSS'o -A.Ctz3)NOL~I
33U
class S lot contains latent defectives that were precipitated bythe increased operating temperature. There can be no precisedefinition for a latent defective part because the inherent flawwhich makes a part defective can range from a minor flaw (whichmay not be subjected to sufficient stress to cause degradation ofthe flaw to a hard failure) to a major flaw which requires only aslight stress. One view is that if a part fails during the lifeof the end item in which it resides it is, by definition, alatent defective part (excluding wearout failures). A devicepopulation containing a small fraction of defectives whose flawsrange uniformly from minor to major would exhibit a decreasingfailure rate until it reached a limitinq population fractiondefective,
* p
P k(l-p) + p (2-5)
k = ratio of defective part failure rate togood part failure rate
See Appendix E for a discussion of the limiting fraction defec-tive. References 19 and 21 also discuss the decreasing failurerate characteristic relationship to defectives.
2.2.3.3 Incoming Receiving Inspection and Test. Microelectronicdevices procured to the quality requirements of MIL-STD-883receive 100% final electrical testing by the part manufacturerbut, nevertheless, typically about 1 percent, and as much as 4percent of the parts will not pass a similar electrical test per-formed at receiving inspection. There are several possiblereasons for this, including:
* the seller's and buyer's tests are different
* seller testing errors
* buyer testing errors
* device damage or degradation in handling andtransportation
0 inspection and sorting errors
To determine what fraction of incoming microcircuit test rejectsare actually defective, one manufacturer performed a retest of525 rejects from a population of 75,981 devices tested. Resultsindicate that about 50% of the rejects are defective. Resultsare summarized in Table 2.2. Other studies indicate thatwithout receiving inspection test, EO% of the defectives will bedetected at the printed circuit board test, 10% will be detectedat higher levels and 30% will not be detected (deviceapplications not manifesting the defect).
34

TABLE 2.2 Results of Retesting Incoming Receiving TestMicrocircuit Rejects
# of Total Rejects Verified (See Note)Supplier Lots Qty. -Total Pass Fail g Fail
A 25 8525 100 1.17 62 32 0.38B 8 8435 22 .26 15 7 0.08C 17 21826 166 .76 120 46 0.21D 30 27295 144 .53 35 102 0.37E 22 9471 96 1.01 31 63 0.67F 2 429 6 1.40 4 2 0.47
TOTALS 104 75,981 534 0.70 267 258 0.34
NOTE: 525 of the 534 rejects were retested. Percentfailed shown in last column is the percent ofthe total quantity tested.
Table 2.3 shows recent experience with receiving inspection test-ing. The results in Table 2.3 for microcircuits show a slightincrease in percent rejects over the figures in Table 2.2 dueprimarily to increased testing at elevated temperature (0.97% vs.0.70%).
Table 2.3 Recent Receiving Inspection Test Results.
Average PercentPart Type Quantity Quality Rejects Rejected
Microcircuits 1,419,581 B-1 13,779 0.97Discrete Semiconductors 343,000 TX 2,008 0.59Passives 1,296,200 ER-M 8,539 0.66
The implication of the data in tables 2.2 and 2.3 is thatpopulations of parts, even high quality parts contain defectivesand if incoming receiving test is not performed then the estimateof the initial fraction defective (PDEF) must be appropriatelyadjusted when using the Stress Screening Model.
35

2.2.4 Manufacturing Process Defects
2.2.4.1 Sources of Defects. Both patent and latent defects areintroduced during the fabrication, assembly and test processes ofequipment in manufacture. The patent defects pass through thevarious assembly stages until detected by a test of sufficientthoroughness and all but the most subtle are detected andeliminated prior to shipment. Patent defects include thefollowing:
0 Parts
- Broken or damaged in handling
- Wrong part installed
- Correct part installed incorrectly
- Part failed due to EOS/ESD
- Missing part
* Interconnections
- Incorrect wire termination
- Open wire due to handling damage
- Wire short to ground due to misrouting or in-sulation damage
- Missing wire
- Open etch on PWB
- Open plated-through hole
- Shorted etch (solder bridge, loose wire strand)
Latent defects cannot be detected until they are transformed topatent defects through stress and time and stress screening isintended to effect this transformation. Latent defects includethe following:
* Parts
- Latent material or process defects
- Partial damage through EOS/ESD
- Partial physical damage in handling
36
- Partial damage during soldering (excessive heat)
0 Interconnections
- Cold solder
- Inadequate/excessive solder
- Broken wire strands
- Insulation damage
- Loose screw termination (lugs)
- Improper crimp
- Unseated connector contact
- Cracked etch
- Contact contamination
- Loose conductive debris
2.2.4.2 Distribution of Defects. The quantity and distributionof manufacturing process defects are dependent on three basicfactors;
* Density. Equipment with high part and/or wiringdensity is more susceptible to induced processdefects due to smaller error margins and increasedrework difficulty.
* Maturity. New production requires time to identifyand correct planning and process problems, trainpersonnel, etc. Maturity rate is dependent onvolume and time. Low volume over a long time periodhas a low maturity rate.
0 Process Control. Even with good process controls,low maturity and high density may result in suffi-cient process induced latent defects to justifystress screening. Maturity, with good process con-trol, may eliminate the need for stress screening.
Because each manufacturer's production process is unique in termsof product types, technology, skills, and management and workerattitudes towards process control, there can be no single set ofguidelines for process defect elimination with general ap-plicability. Each manufacturer must examine his own conditionsto determine the magnitude and nature of process induced defectsand decide the appropriate, perhaps cost-effective, course fortheir elimination.
37
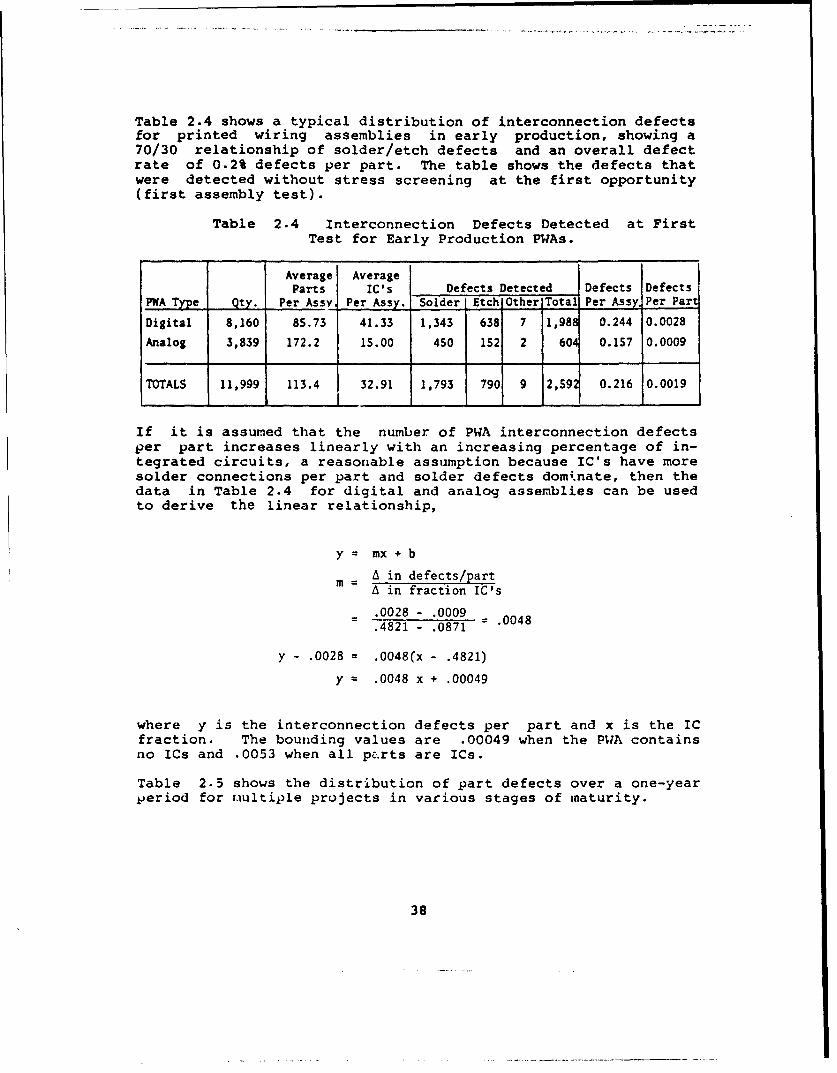
Table 2.4 shows a typical distribution of interconnection defectsfor printed wiring assemblies in early production, showing a70/30 relationship of solder/etch defects and an overall defectrate of 0.2% defects per part. The table shows the defects thatwere detected without stress screening at the first opportunity(first assembly test).
Table 2.4 Interconnection Defects Detected at FirstTest for Early Production PWAs.
Average AverageParts IC's Defects Detected Defects Defects
PWA Type Qty. Per Assy, Per Assy. Solder- Etch Other Total Per Assy Per Part
Digital 8,160 85.73 41.33 1,343 638 7 1,988 0.244 0.0028
Analog 3,839 172.2 15.00 450 152 2 601 0.157 0.0009
TOTALS 11,999 113.4 32.91 1,793 790 9 2,59 0.216 0.0019
If it is assumed that the number of PWA interconnection defectsper part increases linearly with an increasing percentage of in-tegrated circuits, a reasonable assumption because IC's have moresolder connections per part and solder defects domi.nate, then thedata in Table 2.4 for digital and analog assemblies can be usedto derive the linear relationship,
y= mx + b
M =A in defects/partA in fraction IC's
.0028 - .0009
.4821 - .0871 .0048
y - .0028 = .0048(x - .4821)
y = .0048 x + .00049
where y is the interconnection defects per part and x is the ICfraction. The bounding values are .00049 when the PWA containsno ICs and .0053 when all p,.rts are ICs.
Table 2.5 shows the distribution of part defects over a one-yearperiod for uultiple projects in various stages of maturity.
38
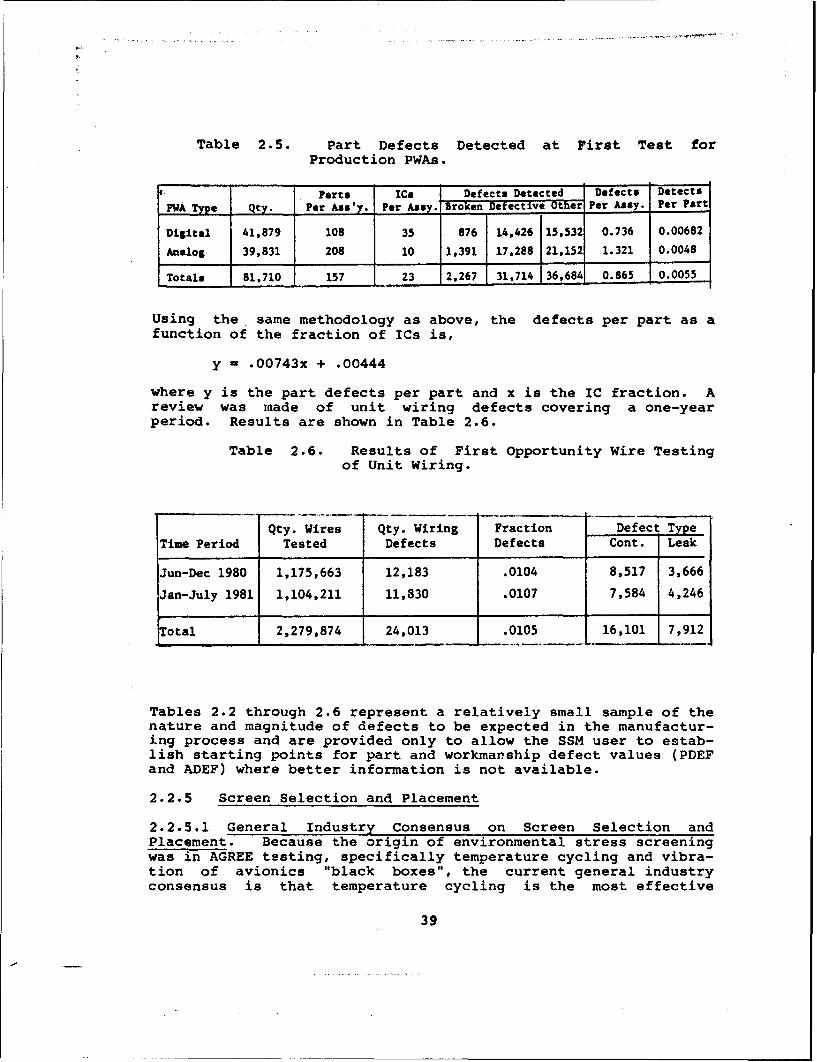
Table 2.5. Part Defects Detected at First Test forProduction PWAs.
Parts ICs Defects Detected Defects Detects
PWA Type Qty. Per Ass'y. Per Assy. Broken Defective Other Per Assy. Per Part
Digital 41,879 108 35 876 14,426 15.532 0.736 0.00682
Analog 39,831 208 10 1,391 17,288 21,152 1.321 0.0048
Totals 81.710 157 23 2,267 31,714 36,684 0.865 0.0055
Using the same methodology as above, the defects per part as a
function of the fraction of ICs is,
y = .00743x + .00444
where y is the part defects per part and x is the IC fraction. Areview was made of unit wiring defects covering a one-yearperiod. Results are shown in Table 2.6.
Table 2.6. Results of First Opportunity Wire Testingof Unit Wiring.
Qty. Wires Qty. Wiring Fraction Defect Type
Time Period Tested Defects Defects Cont. Leak
Jun-Dec 1980 1,175,663 12,183 .0104 8,517 3,666
Jan-July 1981 1,104,211 11,830 .0107 7,584 4,246
otal 2,279,874 24,013 .0105 16,101 7,912
Tables 2.2 through 2.6 represent a relatively small sample of thenature and magnitude of defects to be expected in the manufactur-ing process and are provided only to allow the SSM user to estab-lish starting points for part and workmanship defect values (PDEFand ADEF) where better information is not available.
2.2.5 Screen Selection and Placement
2.2.5.1 General Industry Consensus on Screen Selection andPlacement. Because the origin of environmental stress screeningwas in AGREE testing, specifically temperature cycling and vibra-tion of avionics "black boxes", the current general industryconsensus is that temperature cycling is the most effective
39

stress screen, followed by random vibration (Ref. 12). Thevibration used in AGREE testing done in the past was singlefrequency and relatively low level (2.2g). In search of more ef-fective screens, the Grumman experiments (Ref. 8) indicated thatrandom vibration was more effective than either swept-sine orsingle frequency sine vibration. The results of thermal cyclingin eliminating parts and workmanship defects (primarily duringAGREE testing) were collected and summarized by Martin-Marietta(Ref. 7). The results of the two studies (Ref. 7, 8) were com-bined into UAVMAT P-9492 (Ref. 9) to serve as a starting-pointguideline docunent.
At the module/assembly level, thermal cycling is believedto be an effective screen for both part and workmanship defects.The rate of change of temperature is thought to be an importantparameter, with higher rate of change being more effective.Between 20 and 40 temperature cycles are generally recommended.There are two opposing schools of thought on whether power shouldbe applied or not during the thermal cycling. There also is nogeneral agreement on the effectiveness of vibration at themodule/ assembly level. Experiments conducted at Hughes (Ref. 5,6) indicated that vibration was not effective for printed wiringassemblies (PWAs). Ref. 20 states that PWAs can be effectivelyscreened with broadband random vibration for certain defects.
At higher levels of assembly, i.e., units, groups, thermalcycling and random vibration are effective screens. Less thermalcycles are thought to be necessary at these levels, varying from4 to 12 cycles. Power on is generally accepted as more effectiveand an increasing number of practitioners are recommending a per-formance verification test (PVT) at each temperature extreme.One report states that 80% of all defects detected during stressscreening were found during PVT at the low temperature extreme.Several practitioners using randon vibration at these levels citepower on and continuous monitoring as essential to detect inter-mittents. Low level single frequency vibration is widely accep-ted as being an ineffective screen.
There is some disagreement on the effectiveness of somescreens at certain levels of assembly, the source of which maylie in differences in hardware type, construction, part contentand degree of design and production maturity. Also, the defini-tions for the various levels of assembly (subassembly, assembly,module, unit, group, etc.) are not ciear descriptions of theitems they represent.
2.2.5.2 Technical and Economic Factors to Consider in Selectionand Placement of Screens
2.2.5.2.1 Factors to Consider in Assembly Level ScreenSelection. Assembly level screens are intended to accomplish twothings,
40

1) precipitate latent defects which have escaped thepart manufacturer's screens and receiving inspec-tion tests, and
2) precipitate workmanship defects introduced in theprocess of assembly manufacture.
The types of latent part defects expected to be present dependson several factors, including,
1) types of parts comprising the assembly (i.e., mic-rocircuits, discrete semiconductors, passive parts,low population parts, microwave parts, etc.)
2) quality grade of the parts
3) extent to which the parts were previously screened(e.g., receiving inspection tests and screens)
4) testability of the parts (e.g., microprocessor andother LSI devices are difficult to test completelyand therefore precipitated defects may goundetected).
Table 2.7 is a summary of the expected types of defects for com-mon part types. The table may be used to assist in the deter-mination of the most effective screen to be selected based on thetypes of components that comprise the assembly to be screened.If, for example, the assembly consisted mostly of passive com-ponents, the table indicates that temperature cycling is the mosteffective screen, followed closely by burn-in. In this case, thechoice of temperature cycling or burn-in should probably be madeon a cost basis. Ref. 7 provides detailed breakdowns of typicalfailure modes and mechanisms for each major part type.
The types of latent workmanship defects expected to be
present also depends on several factors, including,
1) assembly type (i.e., PWA or hard wired assembly)
2) assembly complexity (e.g., number of printed wiringlayers, PTH density, metallization spacing, numberof parts, wiring density, technology type)
3) type of parts used (flat pack vs DIP, hybrids vsdiscretes)
4) wire termination type (hand solder, wave solder,wire wrap, crimp)
5) design and production maturity.
41

Table 2.7. Distribution of Screening Methods for
Various Classes of Parts. (Ref. 7)
Percent Failure Modes Screened
Passive Discrete Monolithic Hybrid All
General Screening Method Components Semiconductors ICs ICs Parts
Mechanical Shock 0 2.6 0 1.4 10.0
Particle Impact (PIND) 0 7.9 0 5.1 3.3
Random Vibration 10.4 7.9 15.6 10.9 11.0
Burn-In 63.6 36.8 35.6 43.5 51.9
Temperature Cycling 70.1 31.6 24.4 38.4 48.6
Temperature Soak 7.8 31.6 28.9 30.4 22.9
Temperature Shock 13.0 13.2 0 3.6 2.4
Power Cycling (ON/OFF) 13.0 13.2 0 3.6 7.1
High Pot. 2.6 0 0 0 1.0
Short Term Overload 39.0 0 0 0 14.3
The recommended method for estimating the expected quantity andtype of latent assembly workmanship defects is to use experiencedata on assemblies of similar characteristics produced undersimilar conditions. Table 2.8 provides a brief listing of typi-cal latent defect categories applicable to the assembly level andthe types of screens thought to be effective in precipitating thedefects. Table 2.8 may be used to assist in the selection of ascreen type based on knowledge of prior workmanship defect typespresent in similar assemblies. The table indicates that vibra-tion screens are effective for loose contacts, debris, loosehardware and mechanical flaws while thermal screens are not ef-fective. Also, thermal screens are effective for defects relat-ing to improperly installed parts, wire insulation, impropercrimp and contamination while vibration screens are not effec-tive. For other types of workmanship defects identified in thetable, both thermal and vibration screens are effective.
42
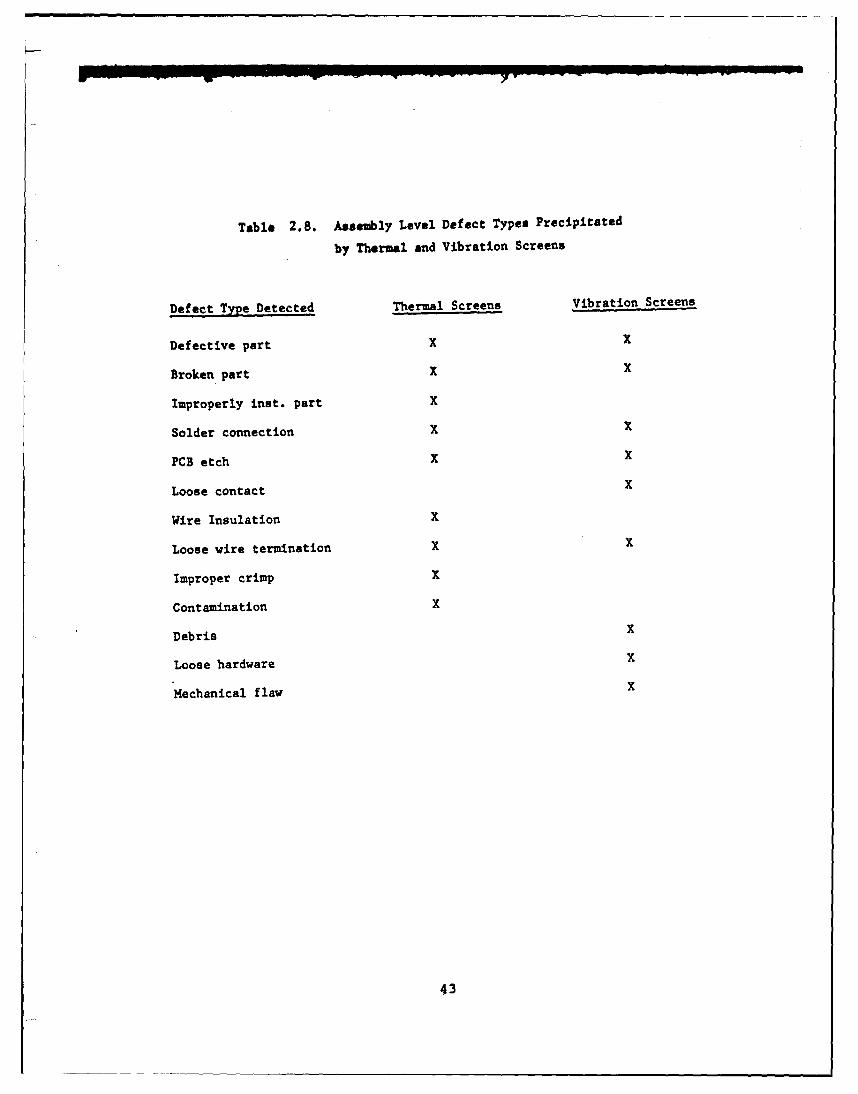
Table 2.8. Assembly Level Defect Types Precipitated
by Thermal and Vibration Screens
Defect Type Detected Thermal Screens Vibration Screens
Defective part X X
Broken part X X
Improperly inst. part X
Solder connection X X
PCB etch X X
Loose contact X
Wire Insulation X
Loose wire termination X x
Improper crimp X
Contamination X
Debris x
Loose hardware x
Mechanical flaw X
43
If a thermal screen (temperature cycling or constanttemperature burn-in) is selected for the assembly level, the fol-lowing screen parameters must be determined:
1) Maximum temperature - The maximum temperature towhich the assembly will'be exposed should not ex-ceed the lowest of the maximum ratings of all theparts and materials comprising the assembly.Nlon-operating ratings for parts are higher than theoperating ratings.
2) Minimum temperature - The minimum temperature towhich the assembly will be exposed should not ex-ceed the highest of the minimum ratings of all theparts and materials comprising the assembly.
UOTE: 1) and 2), above, must be carefully selected toassure that maximum screening effectiveness isachieved. Exceeding the maximum ratings may result indamage to non-defective parts or materials which iscontrary to the principle of stress screening. If theoperating temperature for a power-on screen cannot bereadily determined analytically, a thermal survey ofthe item to be screened should be performed to deter-mine the maximum and minimum screening temperatures.
3) Temperature rate of change - Screening effectivenessincreases with increasing temperature rate ofchange. The maximuji rate of change is dependent onthe thermal chamber characteristics and the thermalmass of the items to be screened.
4) Dwell at temperature extremes - During a temperaturecycle it is sometimes necessary to maintain thechamber temperature constant once it has reachedthe maximum (os. minimum) temperature, sometimesreferred to as dwell. Dwell may be required to al-low the item being screened to achieve the chambertemperature. The item thermal lag depends on ther-mal mass and most PWAs have a low thermal mass.Figure 2.14 shows the part case temperatures track-ing the chamber temperature very closely, thereforeeliminating the need for dwell. PWAs with moremass may require some dwell or dwell may berequired if a PVT or a vibration screen is to beimposed at a temperature extreme.
5) Number of Cycles - Ref. 12 recommends 20 to 40 ther-mal cycles for the assembly level. If the SSM isused, the number of cycles is determined by therequired screening strength. (See Section 4).
44

22549.20
g~
Z 0. 0b(7 0wZL0 LA
I - - r- E
'A,_ _ 1;
I-..
Z .4 U
ww >~ 'K.
IL W0 in
- P
L'45

The determination of whether or not to apply power to assembliesbeing screened and whether or not to perform a functional testduring the screen requires consideration of the followingfactors;
1) Predominant type of defect present - If thepredominant type of defect is expected to be a weakinterconnection which is transformed to an opencircuit by the screen, (cold solder joint, weakwire bond) then a post-screen test will detect theopen circuit and power-on is not required.
If, on the other hand, the predominant type ofdefect is expected to be of an intermittent nature,then power-on with continuous performance monitor-ing is necessary.
2) Economics - A fixture and associated test equipmentto house assemblies, apply power, provide stimuli,and monitor assembly performance can be costly.The tradeoff of fixture and test equipment cost andpotential benefits may prove difficult.
If a vibration screen is selected for the assemblylevel, the type of vibration (i.e., random, swept-sine or fixed-sine) must be selected and the fol-lowing two parameters must be determined.
1) Vibration level - Ref. 9, 12 and 20 recommendrandom vibration and suggest a level of 2.04-.045 g /Hz provided that the assembly canwithstand that level without damage. If theassembly dynamic response characteristics tothe vibration excitation are not known, a care-ful vibration survey should be conducted toproperly establish the acceleration spectrumand level. Ref. 20 provides a procedure forconducting a vibration survey. Ref 12 suggestsuse of swept-sine as a second choice if randomvibration cannot be performed. Single frequen-cy vibration at the assembly level is con-sidered as ineffective.
2) Vibration duration - Pef. 9 and 12 suggest 10minutes per each of three axes. The need formultiaxis excitation may vary from one assemblyto another and therefore it is desireable todetermine fallout per axis during initialscreens to allow screen adjustments.
46
Some other factors to consider in determining the desireability.of a PWA vibration screen are the PWA size and stiffness. LargerPWAs will flex more and precipitate, such latent defects ascracked etch, cold solder and embedded conductive debris.Smaller PWA, particularly if conformally coated, are stiff andnot amenable to vibration screening.
2.2.5.2.2 Factors to Consider in Unit Level Screen Selection.It is the intent of assembly level screens to precipitate latentpart escapes and assembly workmanship defects. Unit levelscreens are then intended to precipitate unit workmanship defectsand assembly level escapes. Unit level defect types vary withunit construction but typically include interconnection defectssuch as,
1) PWA Connector (loose, bent, cracked or contaminatedcontacts, cracked connector)
2) Backplane Wiring (loose connections; bent pins,damaged wire insulation, debris in wiring)
3) Unit Input/Output Connectors (loose or crackedpins, damaged connector, excessive, inadequate orno solder on wire terminations, inadequate wirestress relief)
4) Intra-Unit Cabling (Improperly assembled coax con-nectors; damaged insulation).
Units may also contain wired assemblies integral to the unit andnot previously screened such as Power Control and BIT Panels, andpurchased assemblies such as modular low voltage power supplies.The latent defects associated with those assemblies should beconsidered in the selection of screens.
Thermal screens are more effective than vibrationscreens in precipitating latent defective parts. Thermal cyclingand vibration screens are both effective in precipitating latentworkmanship defects although one screen may be more effectivethan the other for certain defect types. The unit compositionand knowledge of prior screening will dictate the expected typesof defects and aid in screen selection.
If a thermal screen is selected, the same process asdescribed for the assembly must be followed. Differences areoutlined below.
1) Units have greater thermal mass and therefore thehigher temperature rates of change may be more dif-ficult to achieve. A dwell at temperature extremesis probably required.
47

2) Power-on screening is usually easily accomplishedand widely recommended. A functional test (PVT) attemperature extremes has been shown in severalcases to be effective in detecting defects notdetectable at room ambient temperature. As statedpreviously, one project reported finding 80 percentof the total defects during PVT at low temperature.
3) Less temperature cycles appear to be required atthe unit level. A range of 4 to 12 cycles iscommon .
If a vibration screen is selected, it is very importantthat competent engineering personnel evaluate the unit to bevibrated to determine the appropriate vibration type, level ofexcitation and whether or not a vibration survey should be per-formed. There is some evidence that for large, massive units,low levels of vibration are effective screens.
2.2.5.3 Pre- and Post-Screen Testing Considerations. If an itemis subjected to an unpowered screen, testing subsequent to thescreen may reveal part or workmanship defects requiring correc-tion. If the item was not tested prior to entering the screen itcannot be determined, even if a detailed failure analysis wereperformed, if the defects found were precipitated by the screenor were present in the item before the screen. If all the neces-sary information relating to the effectiveness of the screen wereknown, i.e., the average number of latent defects entering thescreen and the average screening strength in precipitating thosedefects, it would not be necessary to know the condition of theitem prior to screening. However, stress screening has not yetadvanced to the point where quantity and type of latent defectscan be accurately predicted and screening strengths'calculatedand therefore some degree of experimentation is necessary toprecisely derive reasonable defect rate and screening strengthestimates. Testing before entering a screen establishes abaseline upon which post-screen testing results can be used tomeasure the screening strength. The pre-screen testing should bedone immediately before the screen to eliminate the uncertaintyof latent defect introduction during such processes as cleaning,conformal coating, handling and storage which may follow the ini-tial item testing.
Once the screening effectiveness has been establishedthe value of both pre-screen and post-screen testing hasdiminished and it may prove cost effective to perform only post-screen testing. When major perturbations take place, such asproduction line changes, fabrication/assembly process changes,personnel changes or alterations to the stress screening process,it may be advisable to reinstitute pre-screen testing until theprocess has stabilized.
48

For long term production programs, the normal learningcurves result in process improvements and the quantity and dis-tribution of latent defects is expected to change accordingly.There will be a predominance of workmanship and manufacturingprocess related defects in early production and component relateddefects dominate mature production. Stress screens have a dif-ferent degree of effectiveness for different defect types andtherefore screens that may have been effective during earlyproductions should be periodically re-evaluated to assure theircontinued effectiveness.
2.2.6 Planning a Stress Screening Program for the DevelopmentPhase
2.2.6.1 Characteristics of a Development Phase. A developmentphase may consist of a very advanced development in which a tech-nical concept is being validated and the hardware used in thevalidation bears little resemblance to the production hardware.At the other extreme, a development phase may be late engineeringdevelopment and the hardware is intended to be productionprototype. Most often, a development phase will be somewhere inbetween the above extremes. When a high volume productionprogram follows development, there may be a productization orproduction engineering phase (PEP) in which major hardware designchanges are made to enhance producibility. Also, suppliers/ven-dors used in development may change for production. In short, ifa stress screening program is considered for a development phaseprimarily for the purpose of gaining information for planning theproduction phase stress screening program, consider the amount ofhardware changes expected and the relevancy of development phasescreening results.
2.2.6.2 Pro's and Con's of Stress Screening in a DevelopmentPhase. As mentioned in the previous paragraph, one good reasonfor stress screening development hardware is to gain informationabout the nature and magnitude of latent defects in complexhardware items. This knowledge is valuable in planning how tocope with the problem in production. If a reliability demonstra-tion test is required during development when a large number oflatent defects are present in the hardware, a stress screeningprogram may be the best way to reduce the number of defects andgive a high probability of passing the test. On the other hand,the benefits to be derived from stress screening in developmentmay not be worth the cost of implementation. During developmentthere are many design related problems. About one-half of allfailures are design or engineering-related. Also, there are manymanufacturing related problems but may have no relationship toproduction problems because the development hardware may havebeen fabricated in an engineering model shop, from engineeringsketches, with soft tooling, etc. Manufacturing-related problemsare about 30% of the total. Only one of five confirmed failuresin development is component related and many of these failures
49

are a result of low quality part substitution for long-leadhi-rel parts. The hectic integration and checkout activity andthe lack of disciplined electrostatic discharge/ electrical over-stress (ESD/EOS) controls results in a predominance of electricaloverstress failures. The combination of the above (numerousdesign and fabrication problems and electrical overstressfailures) may tend to overshadow the latent defects duringdevelopment and make stress screening of questionable value.
2.2.6.3 Relationship of Stress Screening and Reliability Growth.Reliability growth is achieved through the process of eliminatingcorrectable defects. All design problems and some workmanshipand component problems are correctable. When the proper correc-tive action is taken on correctable problems, the resultanthardware failures will not recur and the hardware manifests animproved MTBF, called reliability growth. Reliability growth indevelopment can be enhanced through stress screening byprecipitation of latent defects (early in the growth process).The latent defects eliminated through stress screening will notoccur as random failures during later stages of the growthprocess.
2.2.7 Planning a Stress Screening Program for the ProductionPhase
2.2.7.1 Using Development Phase Results to Guide ProductionPhase Planning. As was pointed out in the preceding paragraph,determination of the effectiveness of stress screening in adevelopment phase is difficult because latent defect failures aremasked by a predominance of other failure types. Therefore, itis probably unrealistic to expect that accurate screening para-meters can be derived for production phase screening fromdevelopment phase screening results. However, valuable informa-tion can be gathered for the development phase which can be usedto guide the planning for production. The most valuable informa-tion is:
1) Identification of hardware items (parts, assemblies,units, equipments, ... ) which exhibited known orpotential latent defects.
2) Identification of suppliers/vendors whose* productsshow potential latent defect problems.
3) Assessment of the effectiveness of corrective actionstaken to eliminate latent defects.
4) Known defective items, eliminated from production, tiesubstitutes for which may require qualification test-ing and stress screening to assure the absence oflatent defects.
50

S5) The cost and schedule estimating factors for stresV!screening during development, and their applicabilityto production.
2.2.7.2 Initial Production Phase Start-up Problems. Typicalstart-up problems to be expected include the following:
1) Production personnel unfamiliarity with stress screen-ing requirements.
2) Facilities and test equipment unavailable for stressscreening.
3) Production planning errors result in incorrect screen-ing and stress screening omissions.
4) Required stress screening data is not recorded orrecorded incorrectly.
5) Schedule priorities preempt stress screeningpriorities.
6) Loss of failed parts preclude a sufficiently thoroughanalysis.
7) Excessive lag time from screened item failure torepair, making timely analysis of screening resultsdifficult.
8) Factory test equipment breakdowns.
It is optimistic to state that all of the above problems can beavoided through careful planning but it is nevertheless correctto state that careful planning is the only hope to minimize them.The planning requires that all organizational activities inmanufacturing involved in the stress screening be made aware oftheir roles and responsibilities at a time early enough that theyare able to plan their functions and acquire the necessaryresources to execute their responsibilities.
2.2.7.3 Planning for Subcontractor/Supplier Stress Screening.If it is determined that certain subcontractor/supplier itemswill require stress screening, the first decision to be made iswhether the items are to be screened at the subcontractor's/ sup-plier's facility or screened by the prime contractor, either atreceiving inspection/test or at a higher level of assembly.There are several benefits to screening at the subcontractor's/supplier's facility,
1) Subcontractor/supplier concern for yield at screening,translated to profits, may force process improvementsto minimize latent defects.
51
2) Screening at receiving inspection/test requires returnof defectives to the subcontractor/supplier, and mayresult in shortages and concomitant schedule slips.
3) Special stress screening facilities and test equipmentdo not have to be acquired/supported/ operated by theprime contractor.
Few benefits of stress screening of a subcontractor/supplier itemby the prime contractor can be identified.
To assure that the subcontractor/supplier is able to per-form the required stress screening, it is important that therequirements are made known at an early enough time to allow himto acquire the necessary capability, or alternatively, arrangefor an external laboratory to plan to perform to the require-ments. This early planning is required to assure that the sub-contractor/supplier is contractually required to perform thespecified stress screening and record and report the results.
2.3 Contractual Considerations in Stress Screening
2.3.1 General Considerations. There are two views on stressscreening that relate to contractual considerations. One view isthat a stress screen or stress screening program is similar to aformal qualification or acceptance test, requiring contractualterms, formal test plans, procedures and reports. Contractuallyrequired failure free periods are appended to screens in thisview and strong considerations are being given to coupling incen-tives to screening results. The second view is that stressscreening is just another step in the production process to beapplied selectively and temporarily as an effective method ofeliminating latent defects and achieving cost savings and/orschedule improvement in the process.
It is not surprising that the first view is widely heldby consumers while the second view is more common amongproducers. Consumers are primarily concerned with elimination oflatent defects prior to acceptance to avoid the high cost offield repairs and to improve operational readiness. Theproducers primary concern is to optimize the production processby eliminating latent defects at the lowest possible assemblylevel, thereby effecting cost savings and avoiding scheduledelays. If the producers process does not satisfy the consumersobjectives, contractual terms must be executed to enhance theprocess.
2.3.2 Contractual Flexibility to Permit Stress ScreeningProgram Adaptability. In early production, a number of unknownspreclude adoption of optimum stress screening. Some of the moresignificant unknowns are:
52

1) residual design deficiencies
2) manufacturing planning errors
3) worker training
4) new suppliers
5) latent defects in new part lots
6) new process capability
7) stress screening effectiveness
8) testability (for defect detection)
The stress screening program, even if carefully planned, mayproduce unexpected results which should be addressed thoughmodification of the screens. The principle of adaptive screeningis to adjust the screens on the basis of observed screeningresults so that the screens are always most cost-effective.Contract terms should be flexible enough to permit a modificationof screens or screen parameters when such modification is shownto be beneficial to the consumer.
In long term production the quantity and distributionof latent defects changes with time and therefore contract termsshould contain provisions for periodically reassessing the in-dividual screens and the overall screening program. The overrid-ing criterion for change should be the most cost-effectiveachievement of consumer objectives while remaining consistentwith the optimum production process.
2.3.3 Failure Free Cycles. While currently used in somestress screening programs and apparently gaining in popularity,all that can be meaningfully said about failure free cycles isthat some small measure of confidence is gained that the productis not totally devoid of merit. End-items being screened, sayunits, typically have inherent MTBFs of 500-5000 hours.Failure-free periods may range from 1-10 percent of the inherentMTBFs. Figure 2.15 shows the probability of passing a failurefree period in 1, 2, or 3 tries as a function of the TrueMTBF-to-Inherent M.TBF ratio. The figure clearly shows that itemswith low ratios (indicating many remaining latent defects) have agood chance of passing a failure free period. For example, anitem which has only 1/10 of its specified MTBF has a 75 percentchance of passing a failure free period in 3 or less attempts.
2.3.4 Incentives Associated with Stress Screening. Many com-mercial products exhibit extremely good "field" reliabilitywithout having been contractually required to perform stressscreening. For commercial producers, the producers objective
53

stated in 2.3.1 is modified to include in the process optimiza-tion the least repair cost during the warranty period.Significant losses that might accrue through excess field repairsresulting from latent defect escapes must be avoided. Some com-mercial manufacturers employ forms of stress screening toprecipitate latent defects while others concentrate more onprocess control and worker training and motivation.
3 TRIES
0.92 TRIES
0. oZ 0.TRY
z1 0.4
0> 0.5
S0.4
o 0.3
0A5
0.1
0.0
0.0 0.1 0.2 0.3 0.4 0.5 0.6 0.7 0.5 0.9 1.0
TRUE MTOF + SPECIFIED MTUF
Figure 2.15. Probability of Passing a Faiure Free Period of Duration 0.1 x Specified MTBF
The producers concern for potential losses (which maybe stronger than his concern for potential gains) resulting fromexcessive maintenance in early fielding may be the necessarymotivation for delivery of defect-free products, be it throughstress screening or other means. The further pursuit of warran-ties, RIW contracts, guaranteed reliability, full contractormaintenance, etc., seems strongly justified.
54
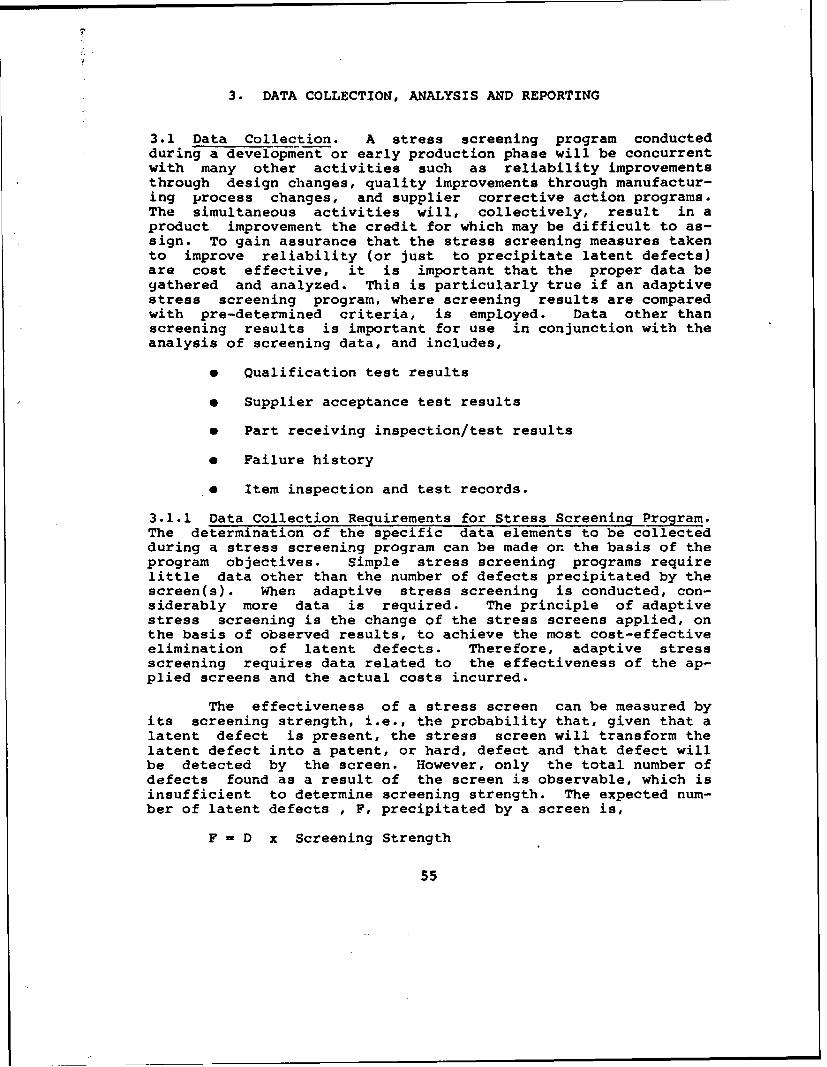
3. DATA COLLECTION, ANALYSIS AND REPORTING
3.1 Data Collection. A stress screening program conductedduring a development or early production phase will be concurrentwith many other activities such as reliability improvementsthrough design changes, quality improvements through manufactur-ing process changes, and supplier corrective action programs.The simultaneous activities will, collectively, result in aproduct improvement the credit for which may be difficult to as-sign. To gain assurance that the stress screening measures takento improve reliability (or just to precipitate latent defects)are cost effective, it is important that the proper data begathered and analyzed. This is particularly true if an adaptivestress screening program, where screening results are comparedwith pre-determined criteria, is employed. Data other thanscreening results is important for use in conjunction with theanalysis of screening data, and includes,
* Qualification test results
* Supplier acceptance test results
* Part receiving inspection/test results
* Failure history
0 Item inspection and test records.
3.1.1 Data Collection Requirements for Stress Screening Program.The determination of the specific data elements to be collectedduring a stress screening program can be made on the basis of theprogram objectives. Simple stress screening programs requirelittle data other than the number of defects precipitated by thescreen(s). When adaptive stress screening is conducted, con-siderably more data is required. The principle of adaptivestress screening is the change of the stress screens applied, onthe basis of observed results, to achieve the most cost-effectiveelimination of latent defects. Therefore, adaptive stressscreening requires data related to the effectiveness of the ap-plied screens and the actual costs incurred.
The effectiveness of a stress screen can be measured byits screening strength, i.e., the probability that, given that alatent defect is present, the stress screen will transform thelatent defect into a patent, or hard, defect and that defect willbe detected by the screen. However, only the total number ofdefects found as a result of the screen is observable, which isinsufficient to determine screening strength. The expected num-ber of latent defects , F, precipitated by a screen is,
F - D x Screening Strength
55
or the product of the screening strength and the number of latentdefects entering the screen. The true values of D and screeningstrength are unknown. Further, the observed number of defectsmay not be totally comprised of precipitated latent defects butmay include patent defects which have escaped prior screens.Another complicating, yet important, factor is that screeningstrength is a combination of the ability of the screen to raise alatent defect to a detectable level and the ability of the screento detect it. The probability that a patent defect will bedetected by the test to which the item being screened is subjec-ted is called probability of detection, Pd, or detection ef-ficiency. The value for Pd varies with the equipment complexityand the thoroughness of the test. Modern equipment comprised ofmicroprocessors, large memory devices and other LSI devices maycontain patent defects so subtle' that only the most thorough oftests will detect them. The screening strength equations in theSSM are derived from screening experience with less complexequipmeht and therefore the screening strengths can be expectedto be somewhat reduced for modern, complex equipments. Becausethere are many unknowns (e.g., initial part fraction defective,number of manufacturing defects introduced at each stage of as-sembly, the effectiveness of screens to precipitate the varioustypes of latent defects, and the ability of equipment tests todetect precipitated flaws) in the art of stress screening, it isimportant to collect as much meaningful data as possible duringthe screening process so that analyses of the data may be helpfulin developing better estimates for the unknowns. Some of the es-sential data elements are,
1) Defect data: Number of defects observed, time-to-failure or cycle-of-failure, failure classification (part,design, workmanship) and failure cause (to assist in discrimin-ating between latent and patent defects and in determiningcorrective actions).
2) Screen Parameter Data: Recording of chamber tempera-ture and the temperature of the item being screenedduring tempe..ature cycling and constant temperaturescreens are important, at least initially, to ascer-tain that the chosen screen is actually being applied.For vibration screens, the vibration input and testitem response are needed.
3) Cost data: Data related to the cost of conducting thescreens and the cost of repairs due to precipitatedlatent defects, including, chamber/facility usagehours; labor hours; labor classifications.
Ref. 17 provides an extensive discussion of data collectionduring production with emphasis on the aspects of environmentalstress screening.
56

3.1.2 The Role of Failure Analysis in Determining ScreeningEffectiveness. The effectiveness of a screen can be measured bythe number of latent defejts that are precipitated by the screen(fallout) and the number of latent defects precipitated at sub-sequent screens. The fallout at one level of screening is insuf-ficient as a measure of effectiveness because the number oflatent defects entering the screen is unknown. A comparison offallout at successive screens provides a basis for estimating theinitial quantity of latent defects and, therefore, effectiveness.
The total number of failures occurring during a screen(or detected at a post-screen test) are not all precipitatedlatent defects. Some are patent defect escapes from lower leveltesting. Examples of such patent defects would b manufacturing errorssuch as missing components, improperly installed components andwiring errors which were not detected at prior test/inspectionlevels. A failure analysis of the "fallout" data is necessaryto segregate the manufacturing errors from the true part andworkmanship defects and to further segregate the screen-induceddefects (precipitated latents) from the patent escapes. In somecases a detailed failure analysis, including part autopsy, may berequired to distinguish latents from patents and should be doneif economically justifiable. Analysis in conjunction with testthoroughness investigation will help in establishing the assemblylevel at which the defect was introduced.
3.1.3 Analysis of Stress Screening Data.
3.1.3.1 Data Analysis for Monitoring the Stress ScreeningProgram. Since a stress screening program is established for thepurpose of precipitating latent defects and thereby improvingearly field reliability and, perhaps, saving production costs inthe process, it is highly desireable, if not absolutely neces-sary, to gather and analyze stress screening data to determine iflatent defects are being precipitated at the expected rate. Anextensive review of stress screening literature conducted duringthe course of this study confirms that data collection andanalysis is the most neglected aspect of stress screening.Inasmuch as it is widely recognized that estimating the number oflatent defects present is, at best, difficult and there is con-siderable uncertainty about the ability of various stress screensto precipitate those defects, the importance of carefully examin-ing the initial screening results cannot be over-emphasized.
The SSM can be used to assist in the analysis of data.The model calculates the expected fallout F, of any screen i by,
F- (Di +ADEF i) • SSi"
where Di = number of latent defects entering the screenat the ith assembly level
57
ADEFi - number of latent workmanship defects introducedat the ith assembly levol
SSi - screening strength of the ith screen
The SSM also calculates a probability interval, i.e., upper andlower bounds on the expected fallout. A .99 probability intervalis computed by the model unless a different interval is requestedby the user. See Appendix B for a theoretical discussion of theprobability interval calculation. If the actual number ofdefects precipitated by the screen is within the desired prob-ability interval, it can be concluded that the stress screeningis proceeding as ex',icted. If, on the other hand, the actualfallout lies outside the interval, an analysis of the data is in-dicated. The fallout data may either exceed the upper bound orfall short of the lower bound. When the upper bound is exceeded,four possibilities exist:
1) the screening strength may be greater than calculatedby the model,
2) the estimate of the initial part fraction (PDEF) maybe low,
3) the estimates of induced assembly defects (ADEF) maybe low, or
4) the fallout may include patent defects that escapeddetection in prior process steps.
To be able to determine which of the four possibilities is mostlikely, a thorough analysis of the actual fallout data isrequired. If the fallout data is predominantly part defects ascompared to assembly defects, possibility 2) seems likely.Conversely, if assembly defects predominate, possibility 3) seemsmore likely. If the part and assembly defects are in the expec-ted proportion but high, possibilities 1) or 4) may be seleczed.the same type of reasoning can be applied when the actual falloutfalls shott of the lower bound.
3.1.3.2 Data Analysis for Evaluating the Stress ScreeningProgram. Stress screening programs may be costly to implement,and are justified by the resulting subsequent savings. Cautionshould be exercised to avoid commiting tc a fixed stress screen-ing regimen for a long production run on the basis of the initialcost-effectiveness analysis and early screening results. Timemay bring about changes that impact on the cost-effectiveness ofscreening, such as changes in the magnitude and distribution oflatent defects, cost of conducting screens, cost of repairs, andimproved estimates of screening strengths. The SSM, with itsoptimization feature, can be used to determine a new set of
58
screens or revised screening parameters that are more costeffective. Refer to the examples in Section 4.0 to see how theSSM can be used for this purpose.
The data analyses required for cost-effectiveness evalua-
tion are,
1) reviscd estimates of part and assembly defects
2) adjust.ed equipment-related parameters of screeningequations (using the adaptive feature),
3) revised estimates of screening cost (at this point,the fixed cost is sunk cost and may be excluded fromthe analysis),
4) revised estimates of repair costs at each level ofassembly.
Data analysis during a production screening program ser-ves another vital purpose besides determining the cost-effectiveness of the screening. Proper analysis of fallout dataaids in identification of "correctable" defects which, if correc-tive action is taken to eliminate their source/cause, will notrecur in subsequent production items. Elimination of correctabledefects results in reduced fallout and lower production costs,which may indicate a need to alter the screens. Sufficientelimination of correctable defects may result in no further needfor screening.
3.1.3.3 Using the Chance Defective Exponential (CDE) Model toEvaluate Stress Screening Results. Ref. 11 provides a method oftemperature cycle screening data analysis which gives estimatesof screening strength, initial fraction defective and constantfailure rate. Figure 3.1 is an extract from Ref. 11 showing asample histogram plot of unit average failure rate per tempera-ture cycle. The per cycle data is used to develop maximumlikelihood estimates (MLE), for parameters a 0 , a-1 and a using aconstrained optimization computer program developed by AcDonnellAircraft Company.
The parameters of the CDE model (an, a1 , and a 2 ) aredirectly related to key unknowns (initial fraction defective,screening strength, latent defective fallout rate) vital to plan-aing, monitoring and evaluating stress screening programs.Therefore, the CDE model is considered to have potential as ananalytical tool for evaluating a screening program. The para-meters are;
a0= NX g, where 17 is the total number of parts in theitem(s) subjected to stress screening
59
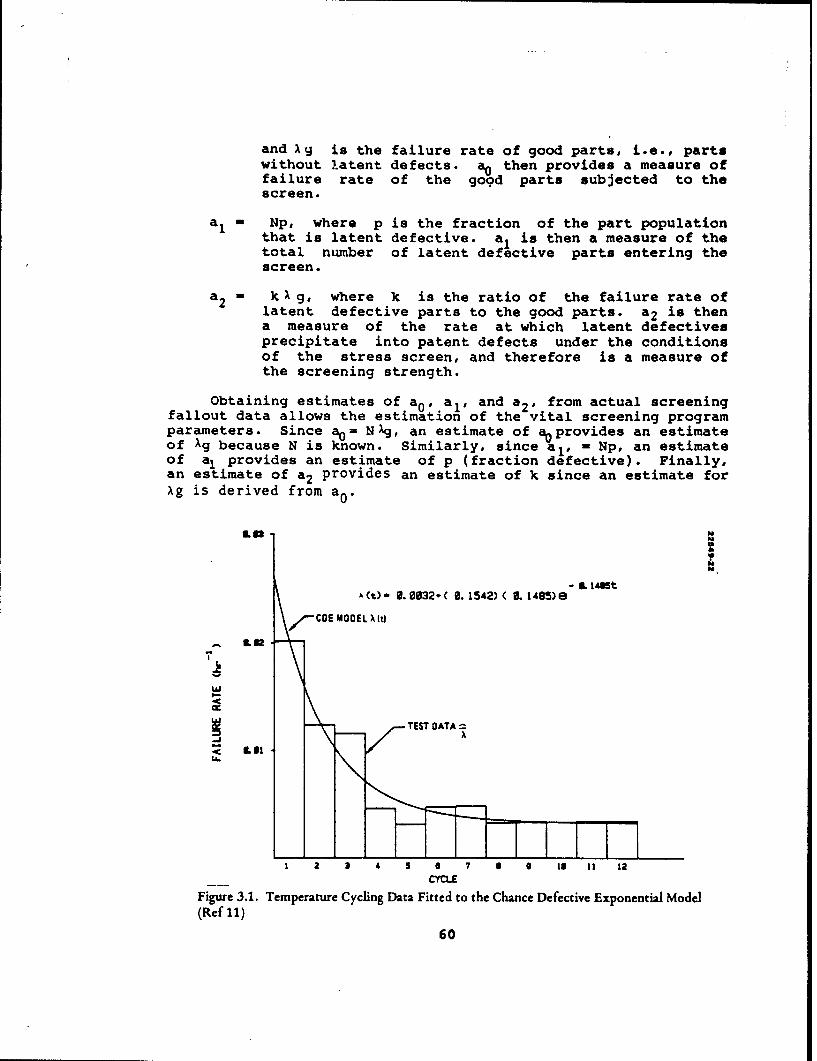
and Ag is the failure rate of good parts, i.e., partswithout latent defects. ga then provides a measure offailure rate of the good parts subjected to thescreen.
a, - Np, where p is the fraction of the part populationthat is latent defective, al is then a measure of thetotal number of latent defective parts entering thescreen.
a 2 - kX g , where k is the ratio of the failure rate oflatent defective parts to the good parts. a 2 is thena measure of the rate at which latent defectivesprecipitate into patent defects under the conditionsof the stress screen, and therefore is a measure ofthe screening strength.
Obtaining estimates of a0 , al, and a2, from actual screeningfallout data allows the estimation of the vital screening programparameters. Since ao= N.q, an estimate of a0provides an estimateof Xg because N is known. Similarly, since a,, - Np, an estimateof a, provides an estimate of p (fraction defective). Finally,an estimate of a2 provides an estimate of k since an estimate for)g is derived from aO.
- 3.141StA(t)- *. 0832.( B. 1542) ( U. 14S5)e
6.3I77
1 2 3 4 5 a 7 4 S II II 12
CYCLEFigure 3.1. Temperature Cycling Data Fitted to the Chance Defective Exponential Model(Ref 11)
60

3.2 Reporting of Results
3.2.1 Purpose of Reporting Results. Timely reporting of theresults of stress screening to cognizant management personnel isimportant to provide the necessary visibility regarding progresstoward achieving the stress screening program objectives(achievement of a reliability requirement, manufacturing costsavings, field maintenance cost savings, or combinations there-of). Timely and accurate reporting allows decisions to be maderegarding changes to the stress screening program for improvedeffectiveness or enhanced cost savings. Reporting also serves asa forcing function on the important tasks of stress screeningdata collection and analysis.
3.2.2 Reporting Methods. There are three basic methods of
reporting results to management,
1) Periodic verbal reporting with visual aids,
2) Periodic written reports, ranging from informal, in-ternal correspondence to formal, contractuallyrequired reports, and
3) Computer generated reports, either in hard copy formor image form on graphics terminals.
The verbal reporting method is most conmon and has the advantageof facilitating a question/answer exchange for report clarifica-tion. The disadvantage of this method is that it is more timeconsuming than the preparation of an informal report but this maybe justified by the more effective information transfer. Theverbal reporting is most desireable at the beginning of thestress screening program when there is the highest degree of un-certainty and highest management interest. As the stress screen-ing program initial adjustments are effected and screeningresults are consistent with expectations, reporting should trans-fer to informal internal correspondence (e.g., weekly reports)and, perhaps, a formal monthly or bi-monthly report to the cus-tomer. The third reporting method is most efficient and is ap-plicable during any phase of the stress screening program.
3.2.3 Report Content. The content of the reports should betailored to the specific objectives of the stress screeningprogram. If the primary objective is to achieve a reliabilityrequirement, a reliability projection bdsed on screening resultsis most appropriate. Cost data is always an appropriate report-ing element and may include planned versus actual screeningcosts, manufacturing costs, or field maintenance costs. Beloware some other typical reporting elements:
* Assemblies screened to date (total number of)
61

"* Assemblies passed screen without failure
"* Assembly workmanship defects expected
"* Upper and Lower Bounds
"* Assemblies with 1, 2, ... defects
o Parts on assemblies screened
o Part defects detected
o Part defects expected
o Upper and Lower Bounds
o Assembly workmanship defects detected
o (Repeat of above for units, systems)
o Assembly yield
o Assembly repair costs
o Unit repair costs
e System repair costs
"* Estimated part fraction defective
"* Correctable failures
"* Corrective action status
62

4. THE STRESS SCREENING MODEL (SSM)
4.1. Description of the Model. The SSM is a modified versionof the Screening and Debugging Optimization (SDO) Model (Ref. 1),the changes to which are described in paragraph 1.2 of thisreport. A simplified flow diagram depicting the stress screeningprocess is shown in Figure 4.1 below. The figure shows(INCOMING) the total number of parts and number of defectiveparts entering a screening process. At level 1, some workmanshipdefects (ADEF) are introduced and the screen at level 1 has somescreening strength (SS) which acts on thd incoming part andworkmanship defects to produce an expected fallout of partdefects (PRT) and workmanship defects (4KM). The total number ofdefects entering a level minus the fallout is the number ofresidual defects passed on to the next level (DEF PASSED). Afterpassing through the three screening levels, there are still somedefective parts remaining (DEF P REM) and some workmanshipdefects remaining (DEF W REM), resulting in some instantaneousoutgoing MTBF value. At each level there is an expected falloutand because of random variations in defect quantities and screen-ing strengths, a probability interval with upper and lower bounds(UPPR BND, LOWR BUD) is computed for monitoring purposes.
INCOMING LEVEL I LEVEL 2 LEVEL 3 OUTGOING
NO. PARTS, ADEF = ADEF - ADEF - DEF P REM:
NO. DEFECTS: SS - SS = SS . DEF W REM:
OEF PASSED DEF PASSED DEF PASSED MTBF=
EXPECTEO EXPECTED EXPECTEDFALLOUT: FALLOUT: FALLOUT:
PRT WKM TOT PRT WKM TOT PRT WKM TOT
UPPR BNO FOR UPPR BNO FOR UPPR SNO FOROBS FALLOUT: OBS FALLOUT: OBS FALLOUT:
LOWR BND FOR LOWR OND FOR LOWR BNO FOROBS FBS FALL CBS FALLOUT: OBS FALLOUT:
Figure 4.1. Stress Screening Model Representation of the Production Flow Process
63
4.1.1 Model Options. The SSM has three options, as follows:
1) MTBF Option (Option A). The SSM provides an optimum setof stress screens to precipitate the required number of latentdefects to achieve a desired instantaneous MTBF at the termina-tion of the screening.
2) Cost Option (Option B). The SSM provides a set of screensto precipitate the maximum number of latent defects for a fixedcost.
3) Trade-off Option (Option C). The SSM provides thecapability to evaluate existing screens and to identify equiv-alent screens for trade-off purposes.
4.1.2 The MTBF Option. In this option, the user must input thedesired MTBF of the item(s) to be screened and must also inputthe total number of parts comprising the item(s) and the expectednumber of latent defects. User input requirements and modeldefault values are described in paragraph 1.5 below. The MTBFvalue must be a series MTBF (i.e., the sum of the failure rate ofall parts subjected to the stress screen). The model may be usedfor a single system or for multiple systems. The total number ofparts and IITBF must be adjusted accordingly. The model assumesthat the MTBF is comprised of the reliability characteristics ofgood parts, with a failure rate Ag, and latent defective parts,with a failure rate k)g, good connections with a failure rate Xcand defective connections with a failure rate kX c, as follows:
MTBF [(N-D)Xg + Dk1 X (M-C)Xc + Ck2Xc]1 (4-1)
where U - Total number of parts
D - Uumber of latent defective parts
k - Defective part failure rate multiplier1
M - Total number of connections
C - Number of latent workmanship (connections) defects
k = Defective connection failure rate multiplier2
The SSM uses equation (4-1) to determine the optimum set ofscreens that result in an MTBF equal to or greater than thedesired MTBF.
64
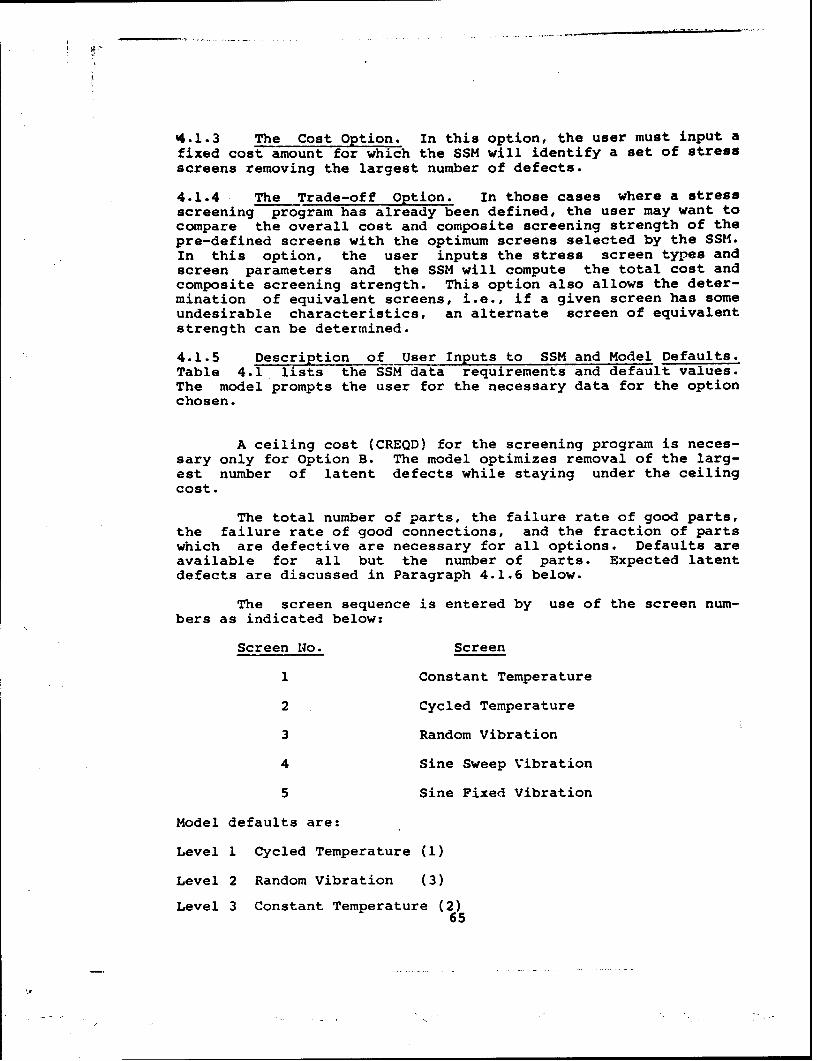
4.1.3 The Cost Option. In this option, the user must input afixed cost amount for which the SSM will identify a set of stressscreens removing the largest number of defects.
4.1.4 The Trade-off Option. In those cases where a stressscreening program has already been defined, the user may want tocompare the overall cost and composite screening strength of thepre-defined screens with the optimum screens selected by the SSM.In this option, the user inputs the stress screen types andscreen parameters and the SSM will compute the total cost andcomposite screening strength. This option also allows the deter-mination of equivalent screens, i.e., if a given screen has someundesirable characteristics, an alternate screen of equivalentstrength can be determined.
4.1.5 Description of User Inputs to SSM and Model Defaults.Table 4.1 lists the SSM data requirements and default values.The model prompts the user for the necessary data for the optionchosen.
A ceiling cost (CREQD) for the screening program is neces-sary only for Option B. The model optimizes removal of the larg-est number of latent defects while staying under the ceilingcost.
The total number of parts, the failure rate of good parts,the failure rate of good connections, and the fraction of partswhich are defective are necessary for all options. Defaults areavailable for all but the number of parts. Expected latentdefects are discussed in Paragraph 4.1.6 below.
The screen sequence is entered by use of the screen num-bers as indicated below:
Screen No. Screen
1 Constant Temperature
2 Cycled Temperature
3 Random Vibration
4 Sine Sweep Vibration
5 Sine Fixed Vibration
Model defaults are:
Level 1 Cycled Temperature (1)
Level 2 Random Vibration (3)
Level 3 Constant Temperature (2)65
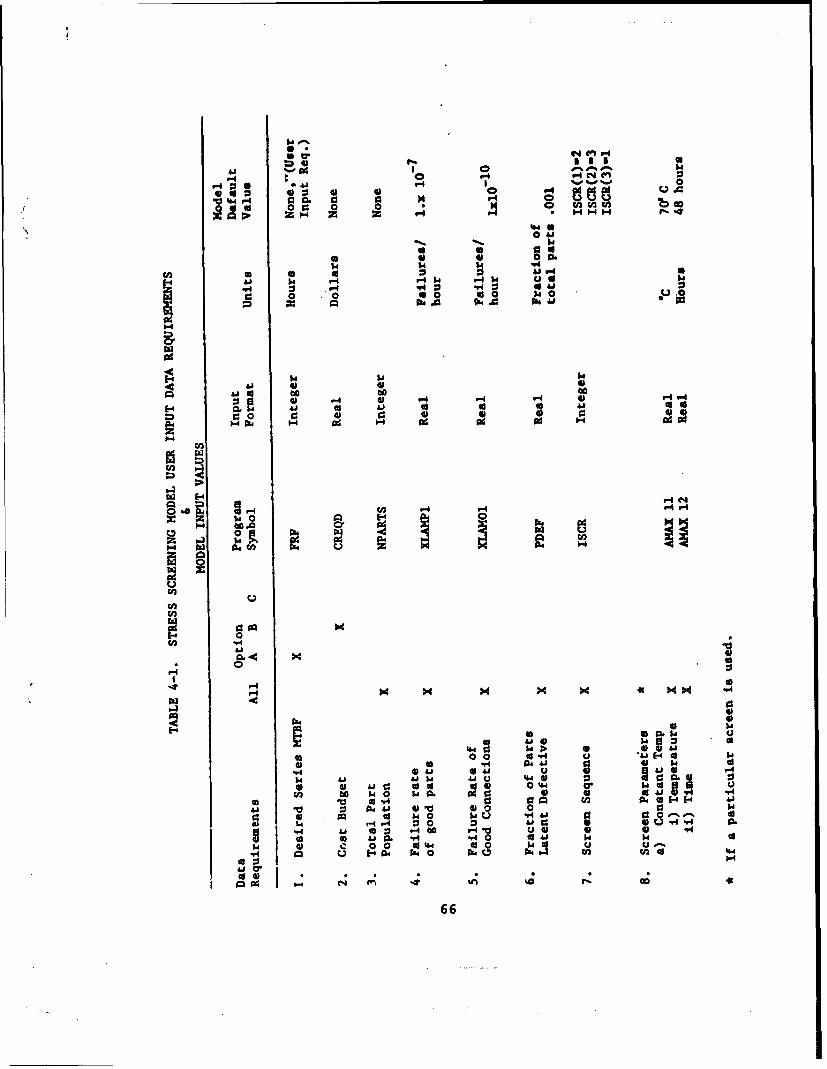
144 N 4
16I 15 ad '-A-404 .41 P4 b
*410~ ~~~ 00 4 10iI p~
0;Q 0 '. 4 0
004
r4 9-4 94~
r.A 04. 04'm.0
4- r
w00 04
1.4 W- - -
00
00
4V1
40. 9 0
to4 V4o 0'01 0
'.4 N 0 41 aN '
0. V0- 0 I
04 000 Pk Wc* 11141
i'6 I64 444

r4 V4 ý V-0%.. %~-, %0
*a~~.eO 000-1t t 04fl0(ftol 000
00 co
"4~~~A 0 "C" :4 4"0 0- A- "4 - c"
ooc. z 00 z w114 0zr
E-4~. r- 4 O"4rI - -4 O"4 rO4 4141441rýr-
C: A )0 )01 4 ) 4
ad Ad Ad 02 02 0 041a a
P-4
U3w
0 E-
w 414141
0 00
""4 cc
0~
0 4041
"4 ~41
"cc 41 j H"44
N4 "4 -4"4.E44 )4 )41 0)
0 41 >4 .0 > ~ 44
w 01 "4ý ) Xt ) U mu ) 0 14 U ." PN"r4 45 0) 41 01"L"4 4 ' .4 "41 4141 411 E-4 41 0
Qo 0'4 0 V0 41~ 00 E-4 00- E-4 0
0.H4 01 4 U3 v4 44 U) 4 41 .0 $4 4H
E- "4 44 4" >fl"4 4 fl44 V 0 m . 0 "w
414 -4 v4. m4 I .0
"4~~o .014~ -4
414:
a: "4 "4 "-4 I67
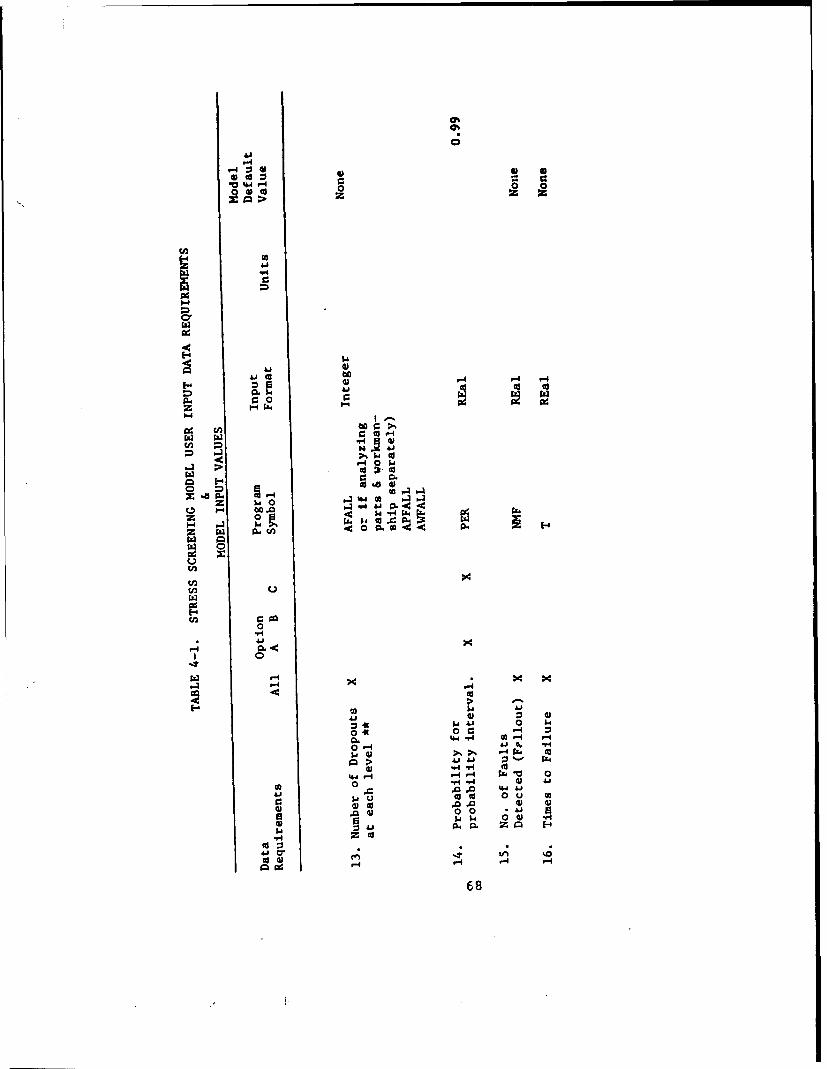
~1 0
E-4
0 W
0- ed %a
-a 0 0
0'0
0$ 4.46
z. 65 4 o
00 0
0 0 0.o 41 06 P5
9z >0 &0
0 0..0A
oj 00
Ic 0-68
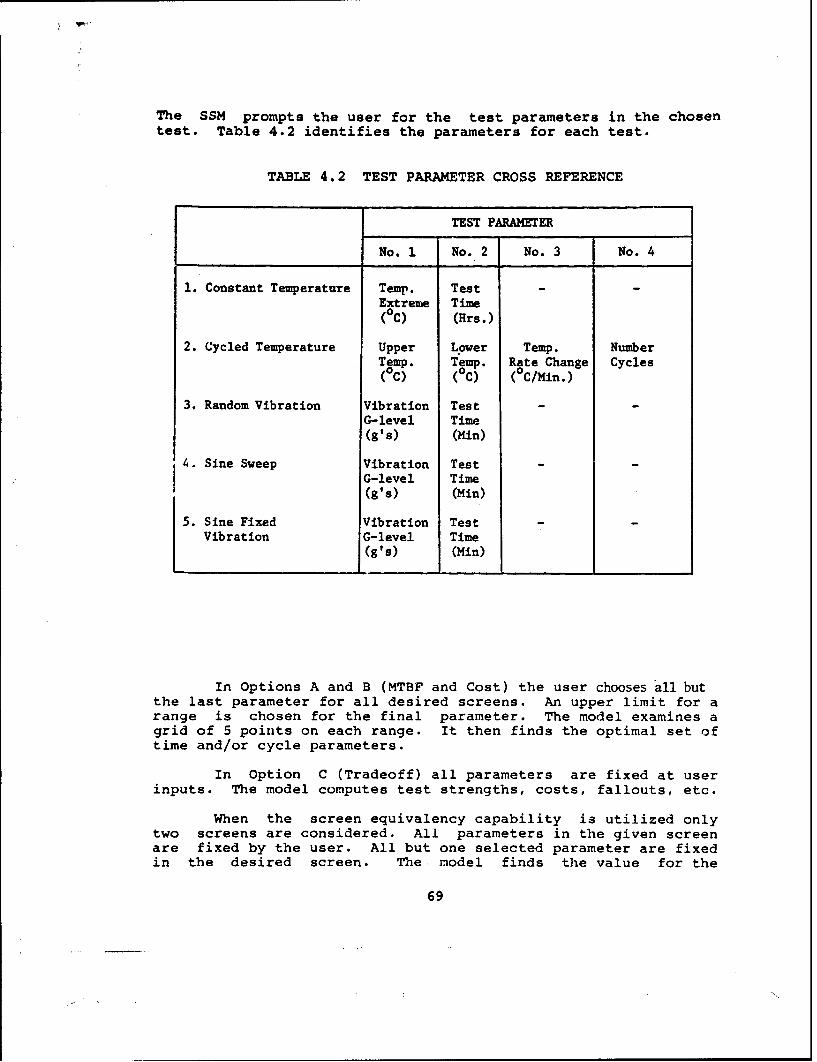
The SSM prompts the user for the test parameters in the chosen
test. Table 4.2 identifies the parameters for each test.
TABLE 4.2 TEST PARAMETER CROSS REFERENCE
TEST PARAMETER
No. 1 No. 2 No. 3 No. 4
1. Constant Temperature Temp. Test - -
Extreme Time(0C) (Hrs.)
2. Cycled Temperature Upper Lower Temp. NumberTemp. Temp. Rate Change Cycles(06 (06 (0C/Min.)
3. Random Vibration Vibration Test -
G-level Time(g's) (Min)
4. Sine Sweep Vibration Test -
G-level Time(g's) (Min)
5. Sine Fixed Vibration Test -
Vibration G-level Time(g's) (Min)
In Options A and B (MTBF and Cost) the user chooses all butthe last parameter for all desired screens. An upper limit for arange is chosen for the final parameter. The model examines agrid of 5 points on each range. It then finds the optimal set oftime and/or cycle parameters.
In Option C (Tradeoff) all parameters are fixed at userinputs. The model computes test strengths, costs, fallouts, etc.
When the screen equivalency capability is utilized onlytwo screens are considered. All parameters in the given screenare fixed by the user. All but one selected parameter are fixedin the desired screen. The model finds the value for the
69
variable parameter. This value yields a strength for the desiredtest equal to the strength for the given test. If this valuecannot be achieved, a message is written and the user may enternew parameters.
The basic cost equation for each test is of a linear na-ture where:
test cost - fixed cost + (variable cost x test duration).
The default used for fixed cost in the SSM is zero due tothe assumption that test equipment, etc. are already available tothe user. For assembly and unit levels the actual time on testis multiplied by 15% since it was found in a previous study(RADC-TR-78-55) that this yields an approximation of actual laborhours. If the user wishes to alter the 15% constant its locationis given in Appendix F.
Test duration is a test parameter in all but temperaturecycling screens. The time required to reach the temperature ex-tremes is computed by using the temperature rate of change param-eter. It was found that the function
td *4/dT (4-2)
where td - dwell timedT - temperature rate of change (in oC/minute)
with units adjusted to yield hours, gave a good approximation ofdwell time. Thus, test duration for temperature cycling isexpressed.
d -2Ncyc tt + t d) (4-3)
where d - test duration
NcyC number of cycles
tt temperature transition time (minimum
temperature to maximum temperature)
td = dwell time
In all cases test duration is computed in hours and the input ordefault variable cost is in dollars per hour. If the user doesnot input a variable test cost the default of $30/hour per houris used.
70
The average cost to repair a defect found at each levelmay be input. The default repair costs are $45 at level 1, $300at level 2, and $990 at level 3.
Total costs at- each level are given by the linearequation;
C i CTi + F iCR (4-4)
where C - Total cost at level i
C T- Test cost at level i
F, - Number of latent defects precipitated (fallout) atlevel i
CR - Cost to repair at level i (one repair per defect)
Workmanship defects introduced at each assembly level(ADEF (i), i=1, 2, 3)) are entered as a fraction of the number ofparts.
If the SSM is being used to analyze fallout data this datacan be entered for each screening level. The model examines thenumber of defects detected at each level to determine if it isconsistent with the expected number. Parts and workmanship fall-out can be analyzed separately at each level or a total can beused.
A probability value (PER) can be entered to change the0.99 probability interval about expected fallout automaticallyassumed by the model. A smaller probability yields a narrowerinterval. That is, if the expected mean is the true mean, theband which contains 80% of the actual fallout is narrower thanthe band which contains 99%. It is suggested that the probabil-ity interval not be made too narrow (PER not less than .80). Anoverly narrow interval may frequently result in instructions tochange the screen when a change is not required. If the plannedmean is the true mnean, then (1-PER) is the fraction of the timeactual fallout will still be outside the interval. That is,(1-PER) of the time instructions will be given to change thescreen even though no change is needed.
4.1.6 Determining the Initial Fraction Latent Defectives. Anincoming lot of parts contains three subpopulations, viz.,
o parts that are "good", i.e., free of defects and areexpected to survive the useful life of the end item of
71

/
which they are a part, given that they are notsubjected to stress beyond their ratings,
"* parts that are "bad", i.e., containing a patent defectwhich precludes them from achieving their specifiedperformance, and,
"* parts that are "marginal", i.e., containing a latentdefect which when initially tested appear to be "good"parts but when subjected to normal operating stressesand time will transform to "bad" parts.
If an electrical test is performed on a received lot ofparts, the fallout from the test is expected to be all or most ofthe "bad" parts. The "marginal" parts are not expected to failunless the operating stresses applied during the test and thetest duration are sufficient to transform the "marginal" part toa "bad" part.
There is expected to be a good correlation between thequality grade of parts used and the initial quantity of "bad" and"marginal" parts. That is, higher quality grade parts are expec-ted to have fewer "bad" and "marginal" parts. This is par-ticularly true for microcircuits because the processing and finaltest and inspection requirements on the part supplier increase inseverity for increasing quality grades, which serves to reducethe quantity of marginal parts and preclude delivery of badparts.
Table 4.3, Initial Fraction Latent Defective Parts, is in-tended to provide the user with default values in those caseswhere better information is not available. The table containsvalues for type of equipment and quality level. The type ofequipment is characterized by percentage of microcircuits,
number of microcircuits x 100total number of parts
Quality levels range from 1 to 8 and indicate the general qualitygrade of the equipment in terms of the various microcircuit, dis-crete semiconductor and passive part quality grades. The tablevalues are derived through direct application of the valuesof MIL-HDBK-217C, Notice 1, for a typical part mix.
Table 4.4 provides a sampling of generic equipment typesof recent vintage to aid the user in estimating the percentage ofmicrocircuits that an equipment or system might contain if it canbe related to one of the generic equipments.
72
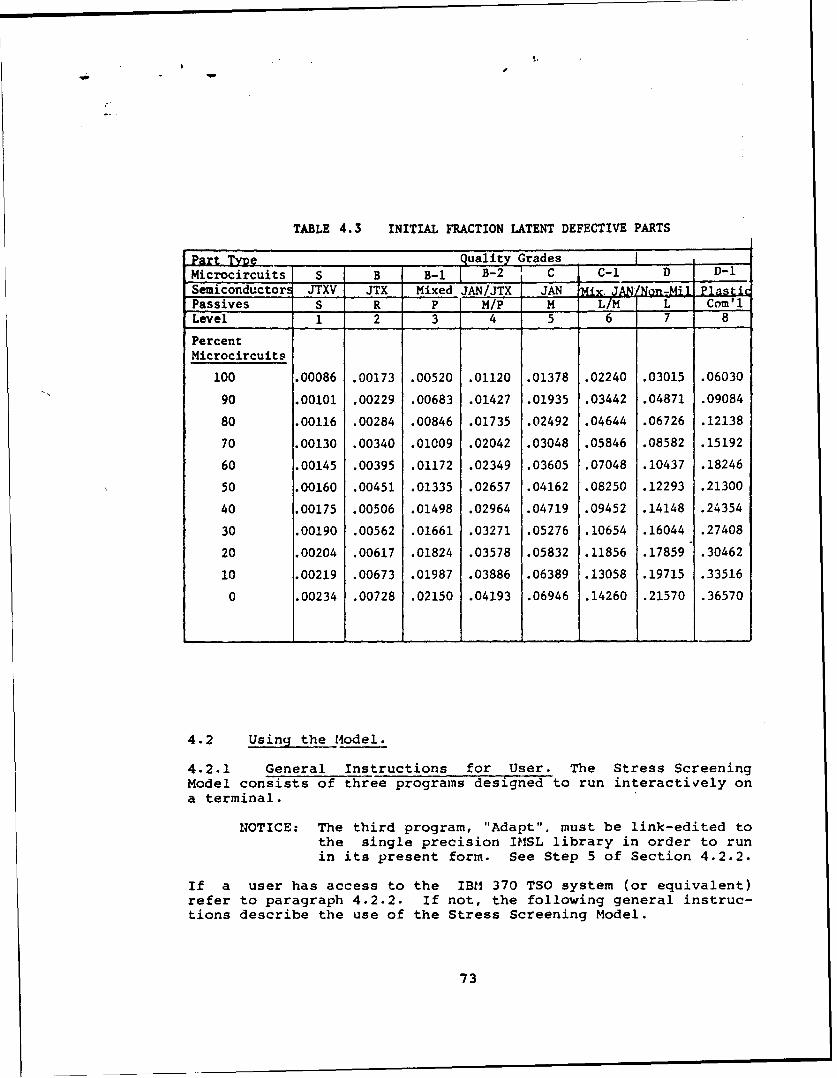
TABLE 4.3 INITIAL FRACTION LATENT DEFECTIVE PARTS
Part T)Xe Quality Grades IMicrocircuits S B B-1 B-2 1 C C-I D D-1Semiconductors JTXV JTX Mixed JAN/JTX JAN Ix, JAN/ I PastiPassives S R P M/P M L/M L Com'lLevel 1 2 3 4 5 6 7 8
PercentMicrocircuits
100 .00086 .00173 .00520 .01120 .01378 .02240 .03015 .06030
90 .00101 .00229 .00683 .01427 .01935 .03442 .04871 .09084
80 .00116 .00284 .00846 .01735 .02492 .04644 .06726 .12138
70 .00130 .00340 .01009 .02042 .03048 .05846 .08582 .15192
60 .00145 .00395 .01172 .02349 .03605 .07048 .10437 .18246
50 .00160 .00451 .01335 .02657 .04162 .08250 .12293 .21300
40 .00175 .00506 .01498 .02964 .04719 .09452 .14148 .24354
30 .00190 .00562 .01661 .03271 .05276 .10654 .16044 .27408
20 .00204 .00617 .01824 .03578 .05832 .11856 .17859 .30462
10 .00219 .00673 .01987 .03886 .06389 .13058 .19715 .33516
0 .00234 .00728 .02150 .04193 .06946 .14260 .21570 .36570
4.2 Using the Model.
4.2.1 General Instructions for User. The Stress ScreeningModel consists of three programs designed to run interactively ona terminal.
NOTICE: The third program, "Adapt", must be link-edited tothe single precision IMSL library in order to runin its present form. See Step 5 of Section 4.2.2.
If a user has access to the IBM 370 TSO system (or equivalent)refer to paragraph 4.2.2. If not, the following general instruc-tions describe the use of the Stress Screening Model.
73

0~ 0 Vb, 1- ' a .wI
40 ~ ~ S 40 Sn IA f. wl r 440 p-
@5 Sn 0 0 0 :0 : wlUS V t C4*~ . 5* .0 S
a6a
06 W- a wt vt m -% 44 at 0k at ' A f 5 0 t
"1 S 40 0r o n pn on Sn onn ft r4 C4f
zz
0A.
- USzu
Sn 0 05 !t US at ft 1% 9 t f 9f
C, z
Z -jcc t- u
I- w~ catC6 CL 0. a
z ce. -1uj0
ft z ) g t C V) u W
'U 'U 74
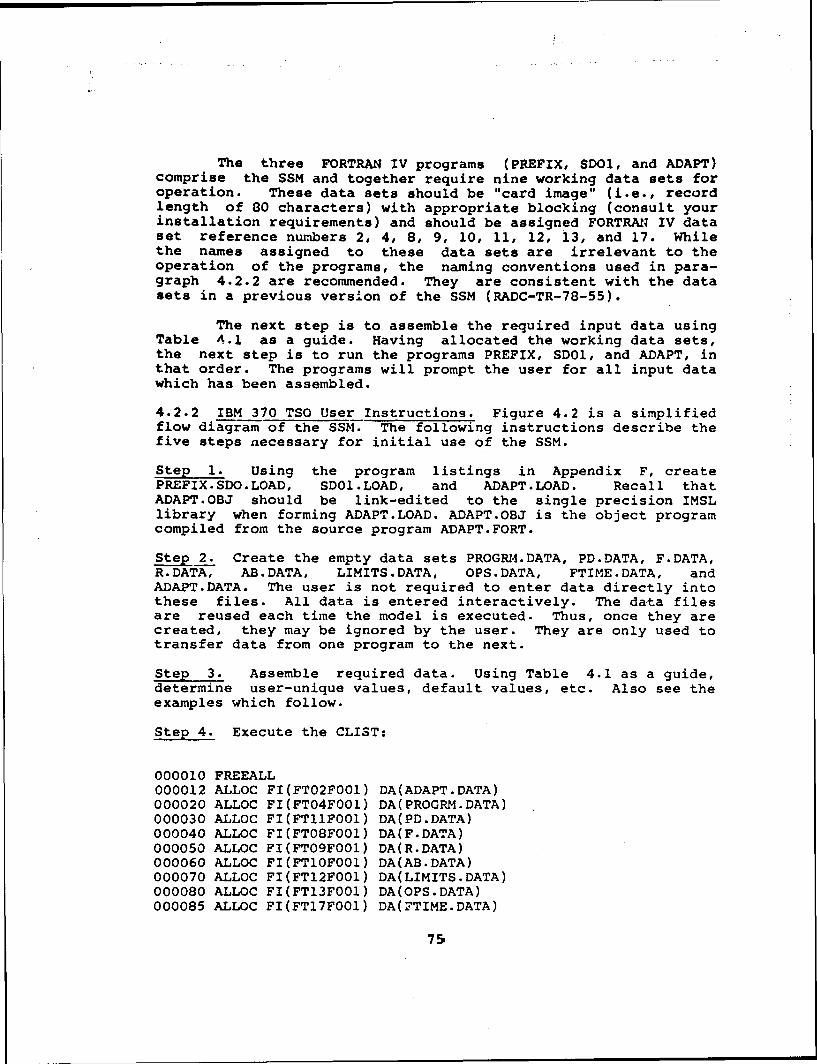
The three FORTRAN IV programs (PREFIX, SDO1, and ADAPT)comprise the SSM and together require nine working data sets foroperation. These data sets should be "card image" (i.e., recordlength of 80 characters) with appropriate blocking (consult yourinstallation requirements) and should be assigned FORTRAN IV dataset reference numbers 2, 4, 8, 9, 10, 11, 12, 13, and 17. Whilethe names assigned to these data sets are irrelevant to theoperation of the programs, the naming conventions used in para-graph 4.2.2 are recommended. They are consistent with the datasets in a previous version of the SSM (RADC-TR-78-55).
The next step is to assemble the required input data usingTable 4.1 as a guide. Having allocated the working data sets,the next step is to run the programs PREFIX, SDO1, and ADAPT, inthat order. The programs will prompt the user for all input datawhich has been assembled.
4.2.2 IBM 370 TSO User Instructions. Figure 4.2 is a simplifiedflow diagram of the SSM. The following instructions describe thefive steps necessary for initial use of the SSM.
Step 1. Using the program listings in Appendix F, createPREFIX.SDO.LOAD, SDO1.LOAD, and ADAPT.LOAD. Recall thatADAPT.OBJ should be link-edited to the single precision IMSLlibrary when forming ADAPT.LOAD. ADAPT.OBJ is the object programcompiled from the source program ADAPT.FORT.
Step 2. Create the empty data sets PROGRM.DATA, PD.DATA, F.DATA,R.DATA, AB.DATA, LIMITS.DATA, OPS.DATA, FTIME.DATA, andADAPT.DATA. The user is not required to enter data directly intothese files. All data is entered interactively. The data filesare reused each time the model is executed. Thus, once they arecreated, they may be ignored by the user. They are only used totransfer data from one program to the next.
Step 3. Assemble required data. Using Table 4.1 as a guide,determine user-unique values, default values, etc. Also see theexamples which follow.
Step 4. Execute the CLIST:
000010 FREEALL000012 ALLOC FI(FT02F0O0) DA(ADAPT.DATA)000020 ALLOC FI(FT04F0O01) DA(PROGRM.DATA)000030 ALLOC FI(FTIIFO01) DA(PD.DATA)000040 ALLOC FI(FT08F001) DA(F.DATA)000050 ALLOC FI(FT09FO01) DA(R.DATA)000060 ALLOC FI(FTlOFO01) DA(AB.DATA)000070 ALLOC FI(FTl2FO01) DA(LIMITS.DATA)000080 ALLOC FI(FTl3F001) DA(OPS.DATA)000085 ALLOC FI(FTI7F001) DA(FTIME.DATA)
75

INTERACTIVEDATA INPUTAL
TESTS POOCOMPLETE
CALL SO0I EQUIVALENT NO
CALL OATA SCREENS?REAO FILES YES
CREATEDINTERACTIVELY CALL SEARCH YES
CALL SSPROIS SEUNE:TT FOINOIPAAEEIREQUIREMENT T IL
COMPUTE SCREEN IEQUAL SCREENINGSTRENGTHS 0O STRENGTH$EACH TESTPARAMETERA VALVE
CLSCENREQUIREMENT NO SLCAL SREE o MEus TLEVEL III NO0
COMPUTE TEST PSIFAILURESTRENGTH AND TIMES?
TOTAL COST POPYEEACH TESTPARAMETER VALUE VE
DIECODE TO TEST POINT ESTIMATIESV ~ ~ ~ ~ O ALISADoINCOýMINGPOINT UTPUTDEFECTS ANO
TIESTRPOT SCREENINMGCOMPETEST RENGTH
YIES
FIRpST NO
TEST
COMPUTECOMPOSITE TESTSTRENGTH ANDYET OTAL COST I
CALLOU AN0
RORER TESTCC MEINAT IONSYEBY COST
REMOVE TS
COMUINATIE.NSTHAT ARE VIHI.002 OFD EACH
OTHER PRIT REVISED
PARMTR
Figure 4.2. Flow Diagram of Ehe Stress Screening Model
7 6
S.' I -
000090 CALL PREFIX. SDO -LOAD (TEMPNA4E)000100 CALL SDO1.LOAD(TEMPNAME)000105 CALL ADAPT.LOAD(TEMPNAME)000110 END
Step 5. Enter data as prompted. Once data is input, the op-timization and flow chart output will be printed without furtheraction from the user. If there is actual fallout data to beanalyzed, the user will be prompted. If equivalent screens areto be found, the parameters will be called for.
For subsequent use, only steps 3, 4, and 5 will be neces-sary for use of the model since the load modules and data setsare on file. The examples which follow illustrate some of thepossible options.
Two proprietary routines are used in the model. If IMSLis not already available the user may wish to contact
International Mathematical and StatisticalLibraries, Inc.
Sixth Floor - NBC Building7500 Bellaire BoulevardHouston, Texas 77036
Telephone (713) 772-1927Telex 79-1923 IMSL INC HOU.
The IMSL routine MDCH is used in the computation of thebounds for actual fallout in this program. As stated previousl,ADAPT.OBJ needs to be link-edited to the single precision IMSLlibrary in order to run in its present form.
The use of MDCH is as follows:
CALL MDCH(CS, DF, P, IER)
where
CS = input value for which the probability is computed.CS must be greater than or equal to zero.
DF = input value containing number of degrees of freedomof the chi-squared distribution. DF must be greaterthan or equal to .5 and less than or equal to200,000.
P = output value containing probability.
IER = error parameter. Terminal error = 128 + N. N-lindicates that CS or DF was specified incorrectly.
77
Warning error - 32 + 11. N-2 indicates that thenormal PDF would have produce4 an underflow.
MDCH computes the probability P that a random variable Xwhich follows the chi-squared distribution with continuous param-eter DF, is less than or equal to CS.
Any chi-squared routine with similar input and outputparameters could be substituted if access to the IMSL library isnot available.
The two lines -
CALL MDCH (Xl,B(I),PIER) BOUNI 300
CALL MDCH (Xl,Bl,PI,IER) BOUN 360
found in ADAPT.FORT would be the only program lines chang-ed if a different library routine is used.
A Newton-Raphson root-finding technique is used to obtainthe degrees of freedom since no available routine could do thatdirectly.
The IMSL Routine ZXSSQ is used for the least squares fitof failure times to the CDE model. Parameters a, and a2 of theCDE model are estimated. Fairly extensive rewriting will benecessary if a different curve-fitting routine is to be used.However, if times to failure for level III are not to beanalyzed, ZXSSQ is not needed. The line calling ZXSSQ (OPT 200in ADAPT) may be removed in this case.
78

4.3 Examples of SSM Use
4.3.1 .rBF Option Examples
4.3.1.1 Planning a Stress Screening Program to Achieve a Certain
MTBF , without Pre-established Screens. The user in this
example specifies an MTBF of 1200 hours and selects the
model default screens at the assembly, unit and system
levels. The least cost Thermal cycling screen at the
assembly level and random vibration screen at the unit
level to achieve the desired MTBF is determined by the
SSM. A screen at the system level is determined not
necessary to achieve the 1200 hour MTBF value.
**•*s*s* SELECTION OF PROGRAN INPUTS AND OPTIONS ****e*
IF THE MODEL DEFAULT IS DESIRED, ENTER ZERO:
OPTION A FINDS OPTIMAL TEST SEQUENCE TO ACHEIVE A GIVEN PRODUCTRELIABILITY REQUIREMENT
OPTION B OPTINIZES PRODUCT RELIABILITY GIVEN A FIXED COST
OPTION C COMPUTES TEST STRENGTHS OF EXISTING SCREENS
DESIRED SERIES NTIF OF REV SYSTEM (OPTION A ONLYFOR OPTIONS B OR CENTER ZERO)
1200
TOTAL PART POPULATION(NO DEFAULT AVAILABLE)
5000
FAILURE RATES OF GOOD PARTS; 600D CONRECTIONS=?
00PART QUALITY DEFECTS AS A FRACTION OF TOTAL PARTS=
0
79
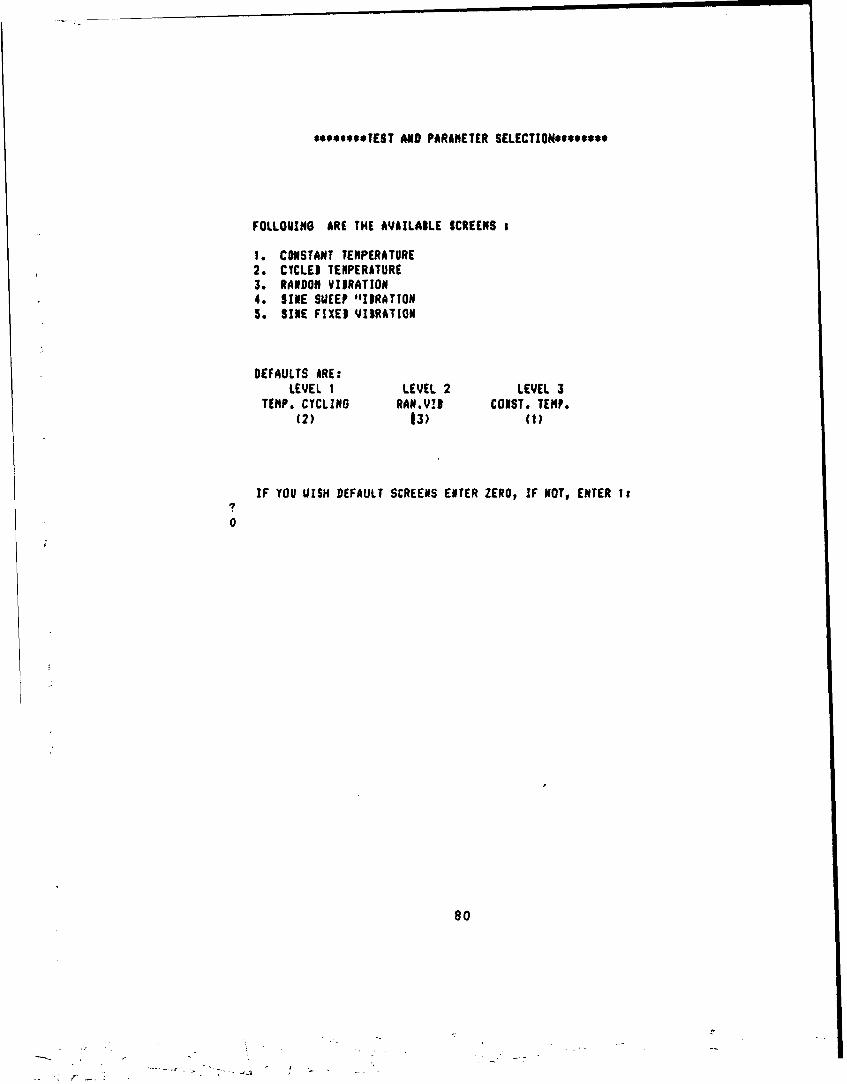
W*ee*eWe*EST AND PARAMETER SELECTION*$******
FOLLOMINt ARE THE AVAILABLE SCREENS a
1. CONSTANT TEMPERATURE2. CYCLED TEMPERATURE3. RANDOM VIBRATION4. SINE SUEEP 'IIIRATION5. SINE FIXED VIIRATION
DEFAULTS ARE:LEVEL 1 LEVEL 2 LEVEL 3
TEMP. CYCLING RAR.V!B COIST. TEMP.(2) 13) (1)
IF YOU UISH DEFAULT SCREENS ENTER ZERO, IF NOT, ENTER Is
0
80
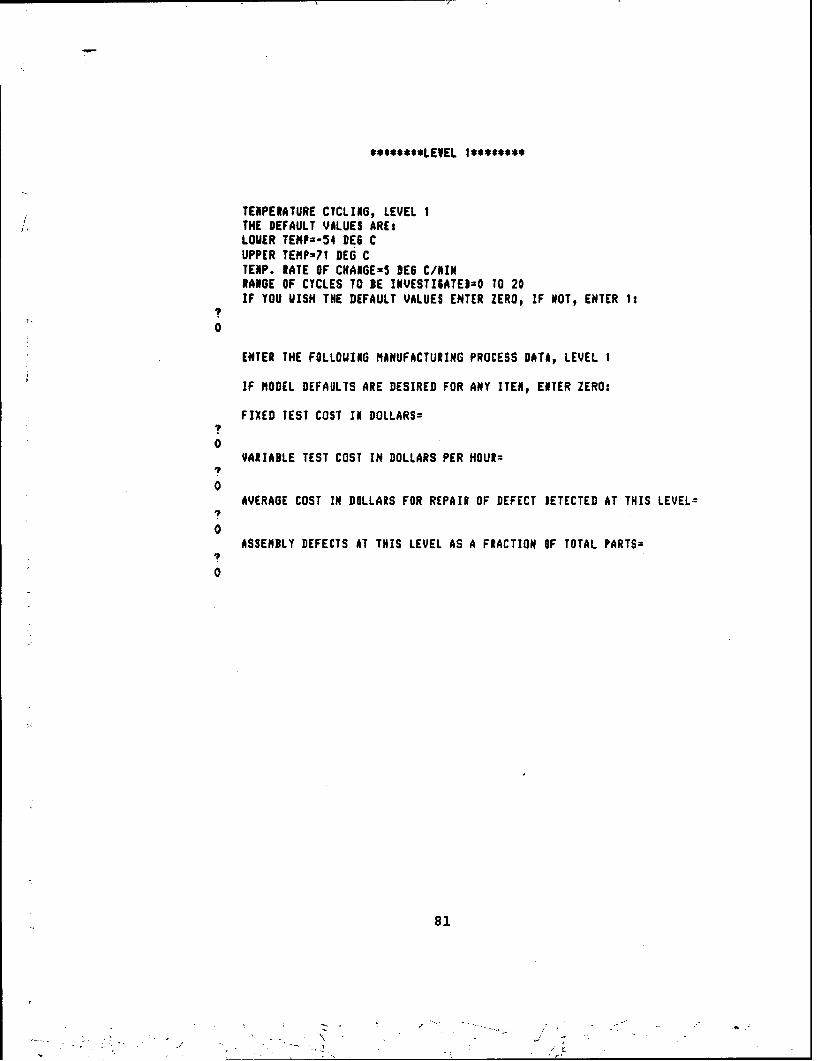
**#*****LEYEL t*******
TENPERATURE CYCLING, LEVEL 1THE DEFAULT VALUES AREsLOUER TEMP=-54 DES CUPPER TEMP=71 DEG CTENP. RATE OF CHAISE=5 DES C/NINRANGE OF CYCLES TO BE INVESTISATE1=O TO 20IF YOU UISH THE DEFAULT VALUES ENTER ZERO, IF NOT, ENTER It
0
ENTER THE FOLLOUXNG MANUFACTURING PROCESS DATA, LEVEL I
IF MODEL DEFAULTS ARE DESIRED FOR ANY ITEM, ENTER ZERO:
FIXED TEST COST IN DOLLARS=
0VARIABLE TEST COST IN DOLLARS PER HOUR=
I?
0AVERAGE COST IN DOLLARS FOR REPAIR OF DEFECT DETECTED AT THIS LEVEL=
0ASSEMBLY DEFECTS AT THIS LEVEL AS A FRACTION OF TOTAL PARTS=
0
81
• ,. -r.
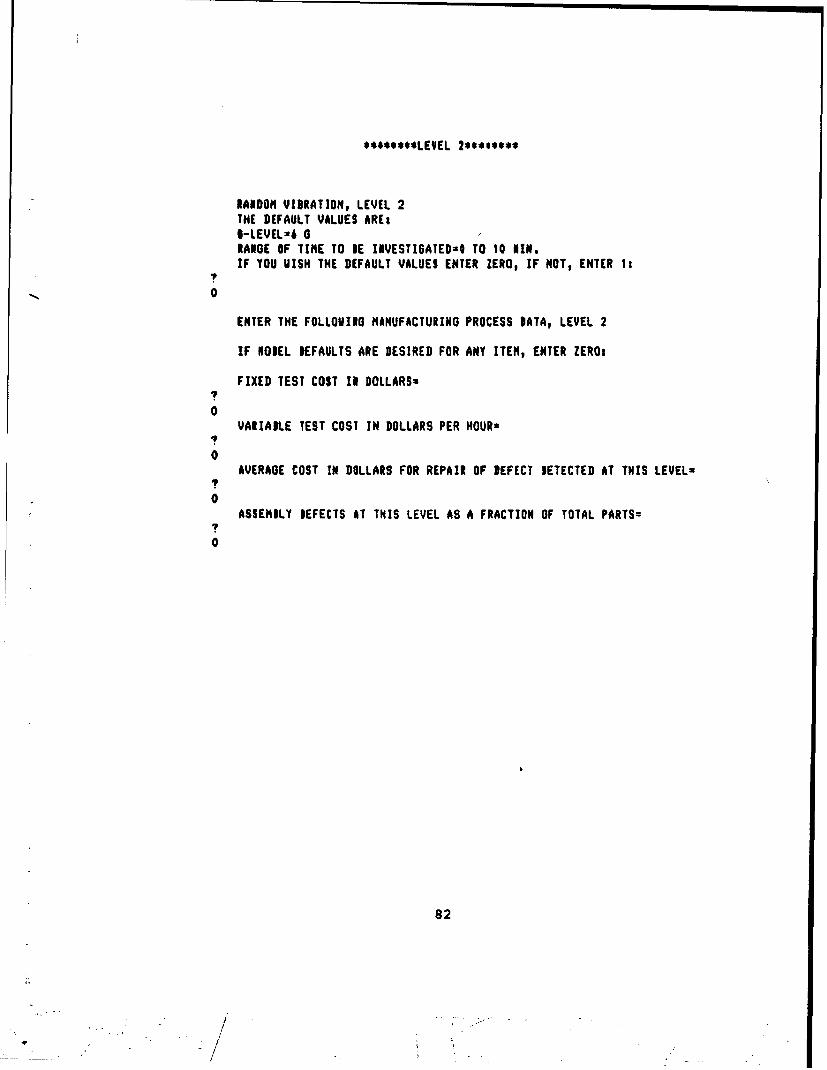
*******$LEVEL 2***.**s*
RANDOM VIBRATION, LEVEL 2THE DEFAULT VALUES AREsI-LEVEL26 0RANGE OF TIME TO DE INVESTIGATEDaO TO 10 SIN.IF YOU VISH THE DEFAULT VALUES ENTER ZEROj IF NOT, ENTER Is
S.,, 0
ENTER THE FOLLOVINO MANUFACTURING PROCESS DATA, LEVEL 2
IF NODEL DEFAULTS ARE DESIRED FOR ANY ITEM, ENTER ZEROs
FIXED TEST COST Ii DOLLARSm?
0VAtIAIDLE TEST COST IN DOLLARS PER HOURs
I
0AVERAGE COST IN DOLLARS FOR REPAIR OF DEFECT DETECTED AT THIS LEVELs
?I
0ASSEMDLY DEFECTS AT THIS LEVEL AS A FRACTION OF TOTAL PARTS=
?
0
82
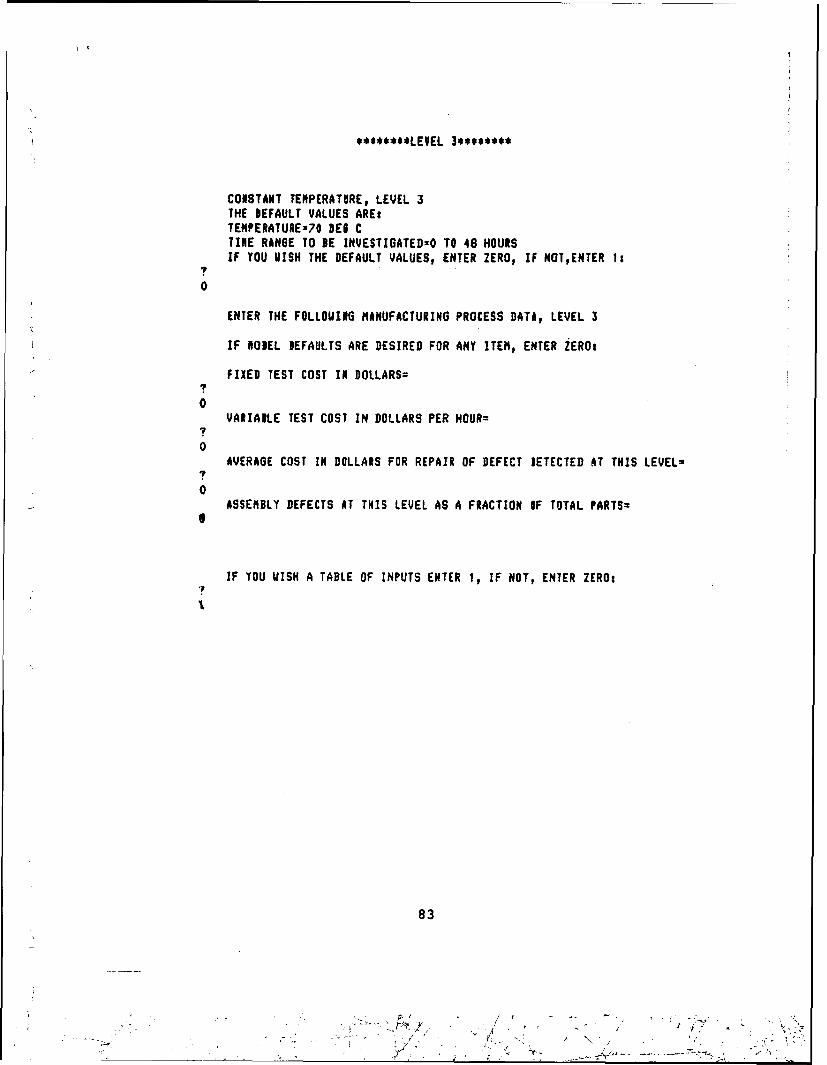
i ~**e***e•LEVEL 3.**s*****
CONSTANT TEMPERATURE, LEVEL 3THE DEFAULT VALUES ARE:TENPERATURE=7O DEB CTINE RANGE TO BE INVESTIGATEDzO TO 48 HOURSIF YOU UISH THE DEFAULT VALUES, ENTER ZERO, IF NOT,ENTER 18
7
0
ENTER THE FOLLOUING MANUFACTURING PROCESS DATA, LEVEL 3
IF NOBEL DEFAULTS ARE DESIRED FOR ANY ITEM, ENTER ZERO:
FIXED TEST COST I DOLLARS=7
0VARIABLE TEST COST IN DOLLARS PER HOUR=
0AVERAGE COST IN DOLLARS FOR REPAIR OF DEFECT IETECTED AT THIS LEVEL=
0ASSEMBLY DEFECTS AT THIS LEVEL AS A FRACTION IF TOTAL PARTS=
6
IF YOU UISH A TABLE OF INPUTS ENTER 1, IF NOT, ENTER ZERO:'1
83
; /,- -/ J 4 " • kS-- • r' • ' -• : .- • :• -•- - , f" '-. -, • ,
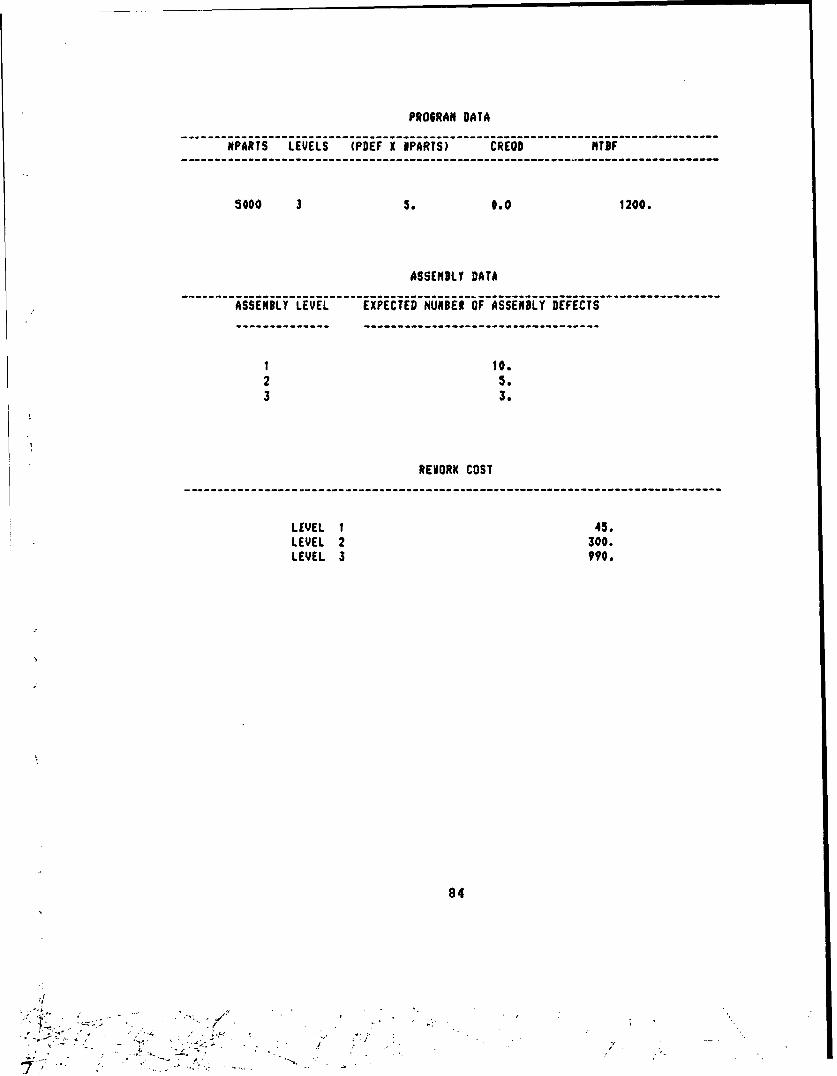
PR06RAN DATA
MPARTS LEVELS (PDEF X IPARTS) CREOD MTBF
5000 3 5. 0.0 1200.
ASSEMBLY DATA
1 10.2 5.3 3.
REVORK COST
LEVEL 1 45.LEVEL 2 300.LEVEL 3 990.
84

TEST DESCR IPT1ONPARANETER VALUE
TEST SEQUENCE TYPE NO. I NO. 2 NO. 3 NO. 4 TOTAL COST($)
-- --------------------------------------------------------- t--------
LEVEL NO. 1 450.TEST NO. 2 CYT 71.00 -54.00 5.00 5.00 450.
LEVEL NO. 2 1955.TEST NO. 3 RYE) 6.00 7.50 0.0 0.0 1955.
LEVEL NO. 3 0.TEST NO. 1 CT 0.0 0.0 0.0 0.0 0.
------------------------------------------------------------------
TOTAL COST S 2404.
INSTANTANEOUS ATIF FOR REMAININGFLAMS AT END OF SCREENING
UORKNANSHIPPARTS A5. . 7. 8. 9. 10. 11.
0. :-1956. 1955. 1955. 1 -55. 1954. 1954. 1954.0. 1956. 1955. 1955. 1955. 1954. 1954. 1954.
1. 1586. 1586. 1586. 1586. 1585. 1585. 1515.2. 1204. 1204. 1204. 1204. 1204. 1204. 1204.3. 971. 971. 971. 970. 970. 970. 970.4. 813. 813. 813. 813. 813. 813. 813.5. 699. 69?. 699. 699. 699. 699. 699.
IF YOU UISH A .99 PRODABILITY INTERVAL, ENTER ZEROIF YOU UISH TO ENTER A SMALLER PROBABILITY (FOR A NARROUER INTERVAL)ENTER ONE:
1
ENTER PROBADILITY DESIRED:
.8
85
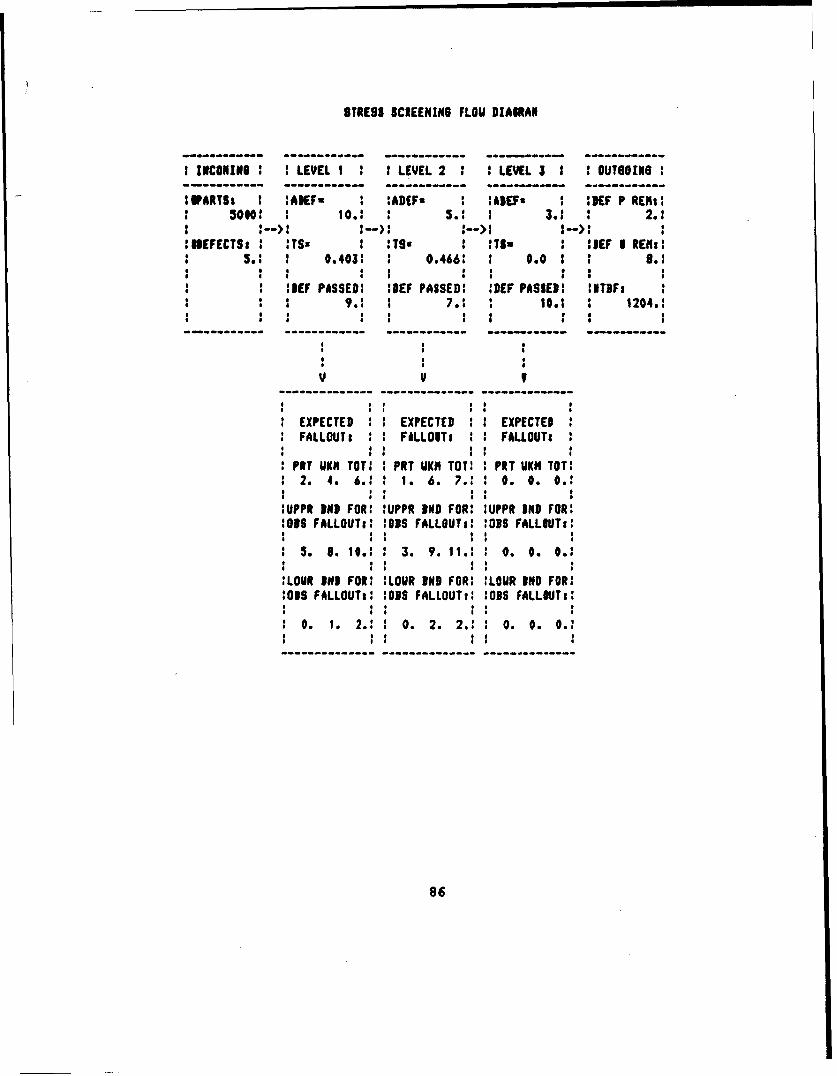
STRESS ICREENING FLOU DIAIRAN
I IlCONINI 1 LEVEL I 1 1 LEVEL 2 1 LEVEL 3 1 1 OUTSOZIN
IPARTSI :AEFz : lAD(F* 1 :ADEF* M IEF P RE~il5001 1 10.: : 5.: 1 3.: 2.:
:IIEFECTIS TSx M MTSa 1 - 1 :IEF I REWas. I 0.403: 1 0.466: 2 0.0 8.1
* I 5 5 5 5 S
fIEF PASSED: IDEF PASSEDI fiEF PASIEDI :lruFs9.1 7.s : 10. : 1204.1
I SII I
* I I* I 1
V V U
EXPECTED : : EXPECTED : 1 EXPECTEDFALLOUT: : : FALLOIT: FALLOUTs:
PRT UKN TOT! PRT UKN TOT: PRT UKN TOT:2. 4. 6.1 1. 6. 7.: 0. 0. O.
:UPPR IND FOR: 1UPPR IND FOR: 1UPPR IND FOR::018 FALLOUTt: 0OBS FALLOUTs: OBS FALLIUTs* I I I
1 5. 8. 15.2 : 3. 9. 11.: 0. 0. 0.:
LOUR INl FOR :LOUR IND FOR: LOUR IND FOR::OS FALLOUT:: :oiS F4LLOUTt: 103S FALLMTM:
0 0. 1. 2. I 0. 2. 2.: 0. 0. 0.4I I S I 8
86
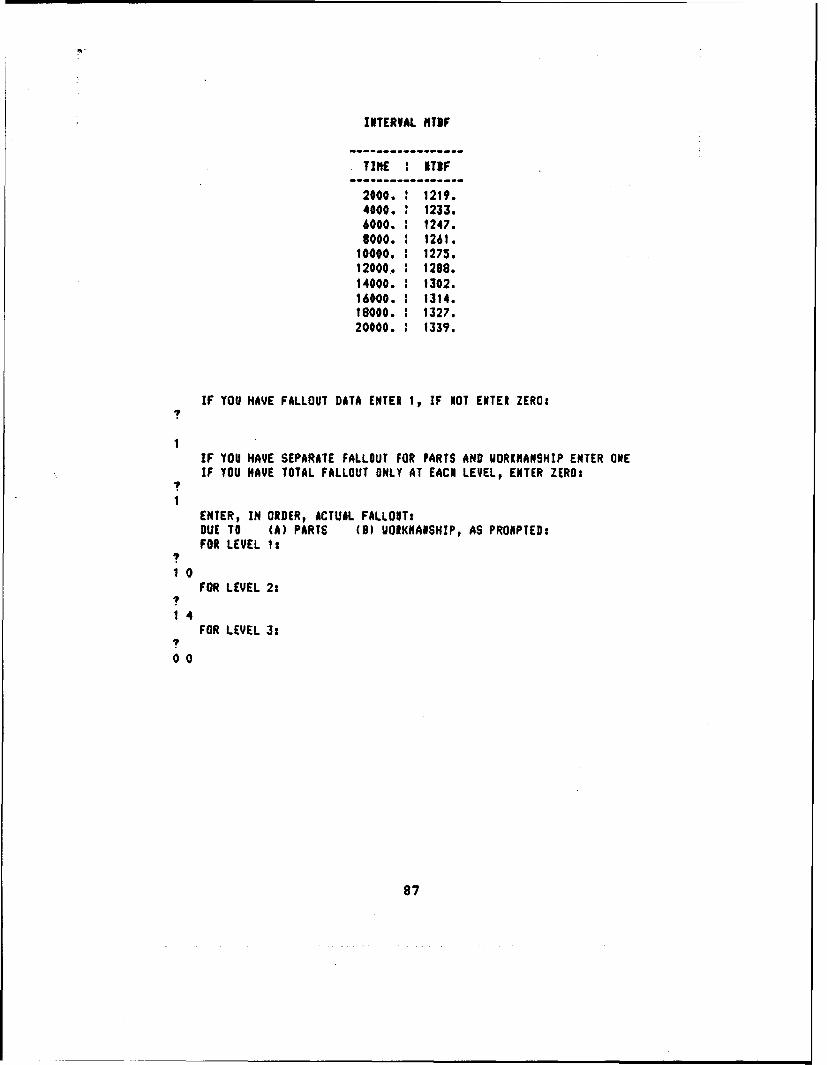
INTERVAL HTIF
TINE : ITIF
2000. 1219.4000. 1233.6000. : 1247.8000. 1261.
10000. 1275.12000, 1288.14000. 1302.16000. 1 1314.18000. 1327.20000. 1339.
IF YOU HAVE FALLOUT DATA ENTER 1, IF NOT ENTER ZEROsI
1
IF YOU HAYE SEPARATE FALLOUT FOR PARTS AND UORKNANSHIP ENTER ONEIF YOU HAVE TOTAL FALLOUT ONLY AT EACN LEVEL, ENTER ZERO:
I
ENTER, IN ORDER, ACTUAL FALLOUT:DUE TO (A) PARTS (B) UORKNAISHIP, AS PRONPTED:FOR LEVEL 1:
10FOR LEVEL 2:
14FOR LEVEL 3:
00
87
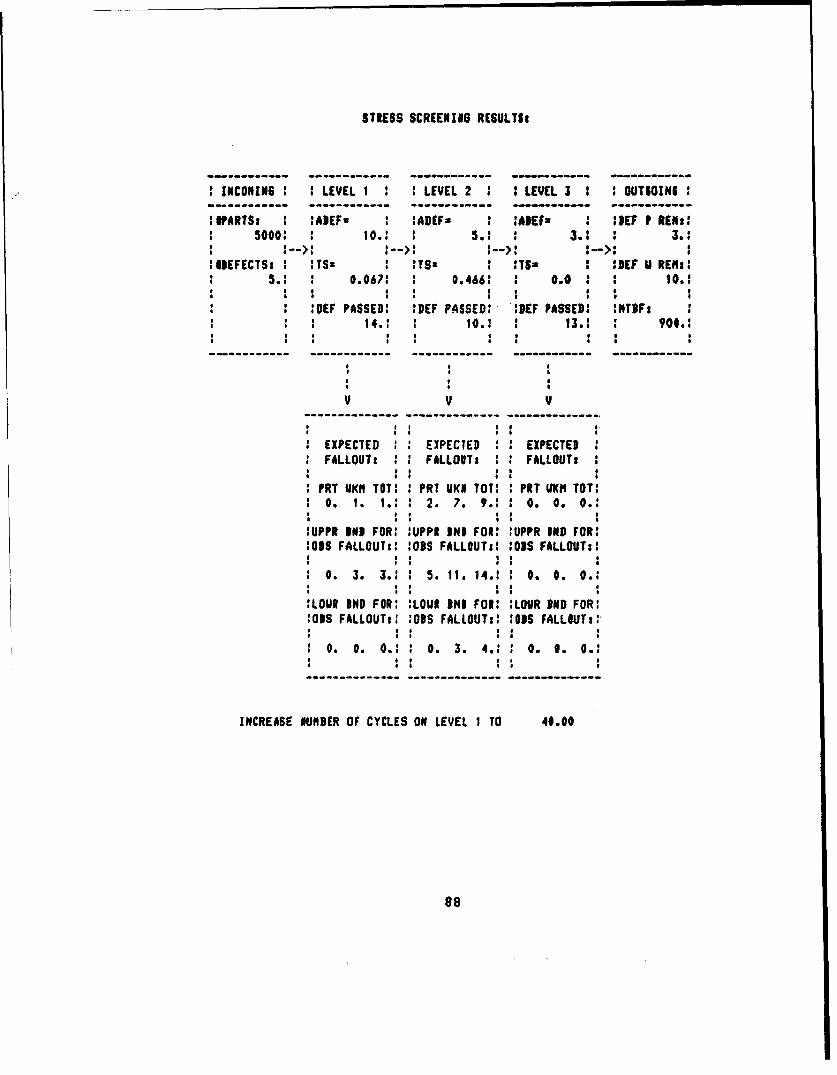
STRESS SCREENIN8 RESULTSt
INCONIN6 : LEVEL I : : LEVEL 2 : : LEVEL 3 : OUTIOINI
WVARTS :ADEFs :AD[Fs IADEF* : 5EF ? REo5000: I0.: I 5.1 : 3.: 3.:
:10EFECTS: : ITS- I TS= M :DEF U REM:35.1 0.067: 0.466' 1 @.0 I 10.:
:DEF PASSED: :DEF PASSED: DEF PASSED: INTIF:S14. : I. : 13.: : 90O.
V V V
EXPECTED EXPECTED EXPECTEDFALLOUT: 1 FALLOUT: FALLOUT:
PRT UKM TOT: PRT UKI TOT: PRT UKM TOT:O. 1. i.: 2. 7. 9.: 0. 0. 0.:
:UPPR IND FOR: IUPPE IND FOR: :UPPR IND FOR:1035 FALLOUT:: :O1$ FALLOUTs: :OS FALLOUT:
0. 3. 3.:1 5. 11. 14.1: 0. 0. 0.:
LOUR DND FOR: :LOUR MI FOR: :LOUR DND FOR:M03S FALLOUTt: :O3S FALLOUT:: :02S FALLOUTs:,
0. O. 0.: 0 0. 3. 4.1 : O. O. 0.:
INCREASE ONUBER OF CYCLES ON LEVEL I TO 40.00
8e
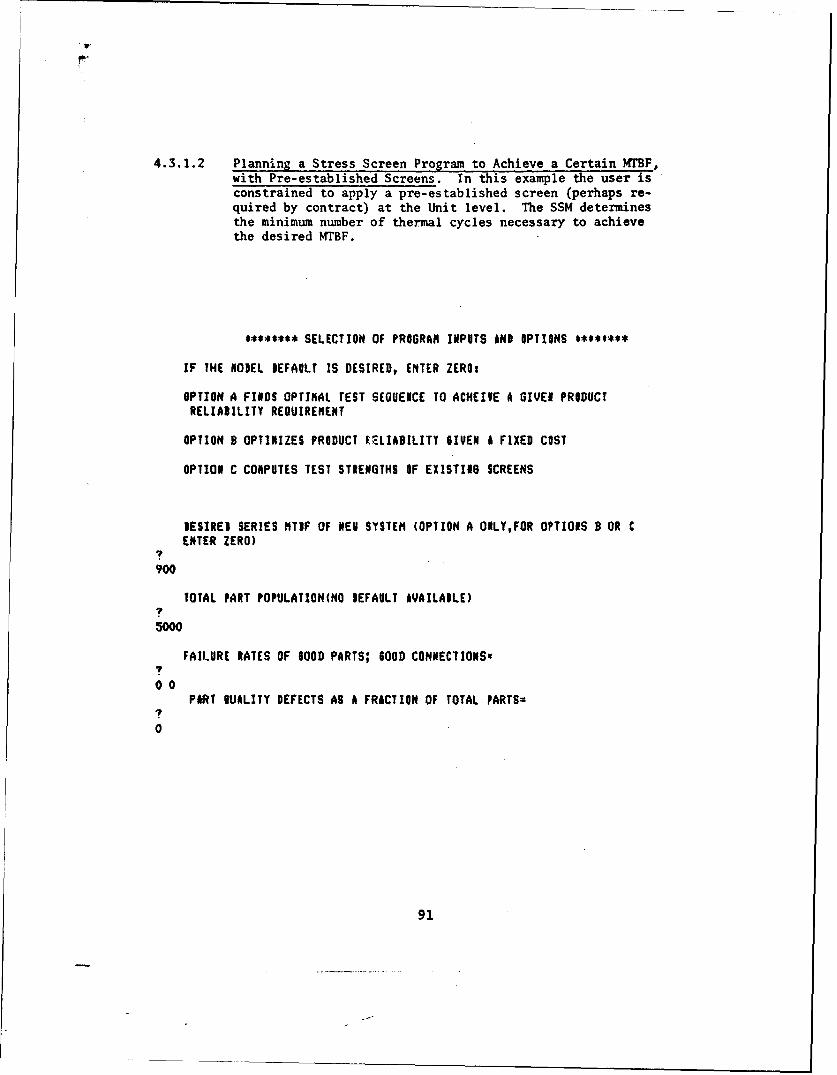
4.3.1.2 Planning a Stress Screen Program to Achieve a Certain MTBF,with Pre-established Screens. In this example the user isconstrained to apply a pre-established screen (perhaps re-quired by contract) at the Unit level. The SSM determinesthe minimum number of thermal cycles necessary to achievethe desired MTBF.
SELECTION OF PROGRAM INPUTS WND OPTIONS ****@***
IF THE NOBEL DEFAULT IS DESIRED, ENTER ZERO:
OPTION A FINDS OPTIMAL TEST SEQUENCE TO ACHEIOE A GIVEN PRODUCTRELIADILITY REQUIREMENT
OPTION B OPTIMIZES PRODUCT RELIABILITY 6IVEN A FIXED COST
OPTION C COMPUTES TEST STRENGTHS OF EXISTING SCREENS
DESIRED SERIES NTIF OF NEV SYSTEM (OPTION A ONLY,FOR OPTIONS D OR CENTER ZERO)
7
900
TOTAL PART POPULATION(NO DEFAULT AVAILADLE)7
5000
FAILURE RATES OF SOOD PARTS; 600D CONNECTIONS%7
00PART DUALITY DEFECTS AS A FRiCTION OF TOTAL PARTS=
I
0
91

IF YOU NISH ANOTHER EDUIVALENCY ENTER ONEp IF NOT, ENTER ZERO.
1
FOLLOVINS ARE THE SCREEN EQUATIONS AVAILABLE:1. COISTANT TEMPERATURE2. TEIPERATURE CICLING3. RANiON VIBRATION4. SINE SlEEP VIBRATION5. SINE FIXED VIBRATION
ENTER #UMIER FROM ABOVE LIST CORRESPONDINI TO 61VEN SCREEN.
3ENTER NUMIER FROM ABOVE LIST CORRESPONDING TO DESIRED SCREENt?
4
ENTER PARANETERS FOR lIVEN SCREEN.
ENTER 6 LEVEL AND TIME IN MINUTES?
6 7.5
ENTER PARANETERS FOR DESIRED SCREEN;
ENTER ZERO FOR PARAMETER TO BE FOUND:
ENTER 6 LEVEL AND TIME IN MINUTES
060
TEST STREN6TH FOR GIVEN SCREEN= 0.4651
PARAMETER FOR DESIRED VIBRATION SCREEN= 5.8
IF YOU UISH ANOTHER ElUIVALENCY ENTER ONE, IF NOT, ENTER ZERO:
0
IF YOU HAVE TIMES TO FAILURE FOR LEVEL III ENTER 1,IF NOT, ENTER ZERO:
0READY
90

$*$***$**LEVEL 2***#*s*s
TEIPERATURE CYCLINGO LEVEL 2THE DEFAULT VALUES AREsLOVER TENP=-54 DEG CUPPER TENP=71 DEG CTEMP. RATE OF CHAIGE=5 DES C!KINRAIGE OF CYCLES TO BE INVESTIIATED=O TO 20IF YOU UISH THE DEFAULT VALUES ENTER ZERO, IF NOT, ENTER 1:
I
ENTER, IN ORDER, SEPARATED BY COMNAS OR SPACES:UPPER TEMP.,LOUER TEMP.,TEMP. RATE OF CHANGE, NO. OF CYCLES:(TEMPERATURE RANGE OUST BE WITHIN -55 TO +75 DEG CAND RATE OF CHANGE BETUEEN 1 AID 20 DES C/IIN)
7
7, -40 5 24
ENTER THE FOLLOWING MANUFACTURING PROCESS DATA, LEVEL 2
IF MODEL DEFAULTS ARE DESIRED FOR ANY ITEM, EITER ZEROt
FIXED TEST COST IN DOLLARS=
10000VARIABLE TEST COST IN DOLLARS PER HOUR=
7
0AVERAGE COST IN DOLLARS FOR REPAIR OF DEFECT DETECTED AT THIS LEVEL=
70
ASSEMBLY DEFECTS AT TNIS LEVEL AS A FRACTION OF TOTAL PARTS=
.002
93

********TEST AND PARANETER SELECTION$*e*****
FOLLOVINe ARE THE AVAILAILE SCREENS a
I. CINSTANT TEMPERATURE2. CYCLER TEMPERATURE3. RANDON VIDRATION4. SINE SUEEP VI3RATION5. SINE FIXED VIDRATION
DEFAULTS ARE:LEVEL I LEVEL 2 LEVEL 3
TEMP. CYCLINi RAN.VIB CONST. TEMP.(2) (3) (1)
IF YOU UISH DEFAULT SCREENS ENTER ZERO, IF NOT, ENTER 1:
I1
ENTER YOUR SCREEN SEQUENCE AS PROMPTED USIN6 NUMIERS FRO# ABOVE LISTINIsIF YOU DO NOT VISH TO SCREEN AT A PARTICULAR LEVEL, ENTER ZERO:
FOR LEVEL I THE SCREEN NURDER DESIRED ISs
0
FOR LEVEL 2 THE SCREEN NUMBER DESIRED IS:7
2FO LEVEL 3 THE SCREEN NUMBER DESIRED IS:7
0
92
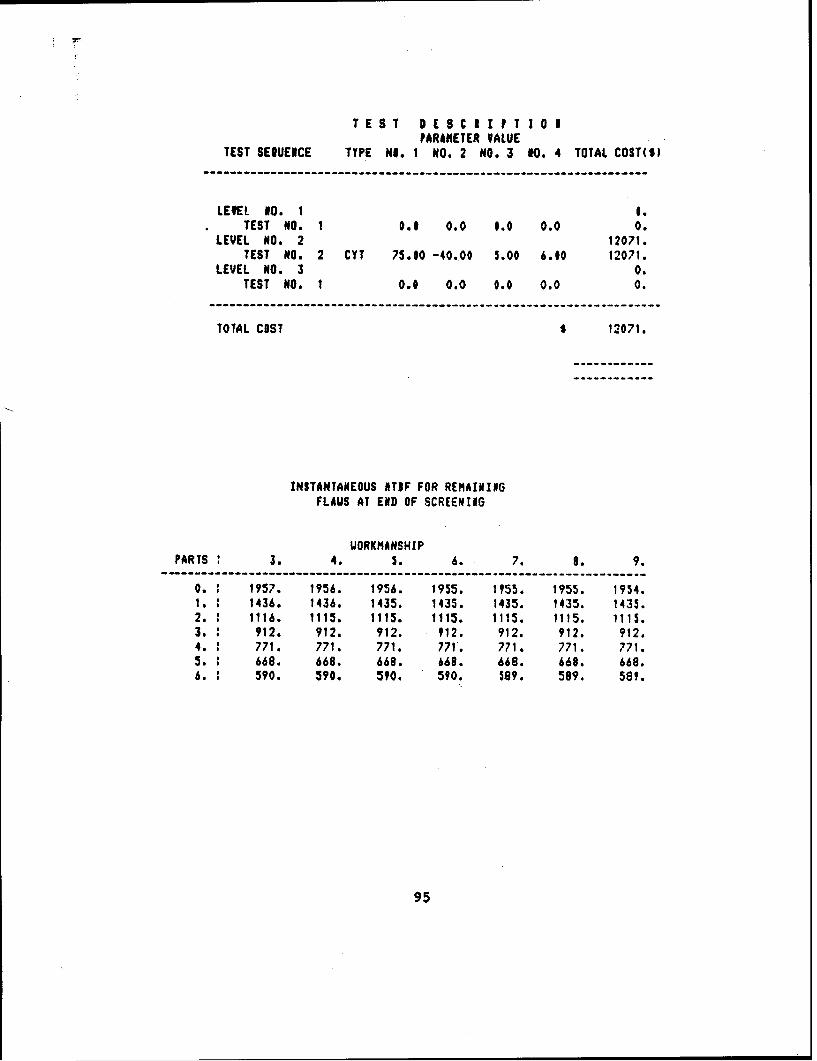
TEST DESCE I PT 1O 0PARAMETER VALUE
TEST SEOUENCE TYPE NI. 1 NO. 2 NO. 3 90. 4 TOTAL COST($)
LEVEL 10. 1 1.TEST NO. 1 0.0 0.0 0.0 0.0 0.
LEVEL NO. 2 12071.TEST NO. 2 CYT 75.00 -40.00 5.00 6.00 12071.
LEVEL NO. 3 0.TEST NO. 1 0.0 0.0 0.0 0.0 0.
TOTAL COST s 12071.
INSTANTANEOUS ITIF FOR REMAININGFLAUS AT END OF SCREENING
UORKMANSHIPPARTS 3. 4. 5. 6. 7. 8. 9.
0. 1957. 1956. 1956. 1955. 1955. 1955. 1954.1. 1436. 1436. 1435. 1435. 1435. 1435. 1435.2. 1116. 1115. 1115. 1115. 1115. 1115. 1115.3. 912. 912. 912. 912. 912. 912. 912.4. 771. 771. 771. 771. 771. 771. 771.5. 668. 668. 668. 668. 668. 668. 668.6. 590. 590. 590. 590. 589. 589. 589.
95

IF 1O0 UISH A TABLE OF INPUTS ENTER 1, IF lOT, ENTER ZEROs
1
PROIRAM DATA
IPARTS LEVELS (PDEF X NPARTS) CREOD ITIF
5000 3 3. 0.0 900.
ASSEMBLY DATA
ASSENULT LEVEL EXPECTED NUNDER OF ASSENILT DEFECTS
1 0.2 10.3 0.
REIORK COST
LEVEL 1 45.LEVEL 2 300.LEVEL 3 990.
94

INTERVAL ITIF
-----------------TINE 1 HIP
-.-.ft ------------
2000. ! 944.4000. : 176.60#0. : 1#07.1000. i 1037.
10000. i 1066.12000. 1494.14000. 1122.16000. 1148.18000. to 1174.20000. : 1199.
IF YOU RAVE FALLOVT DATA ENTER 1, IF NOT ENTER ZERls
0IF YOU WISN TO ANALYZE EQUIVALENT SCREENS ENTER ONEIF NOT ENTER ZERO:
0REIDY
97
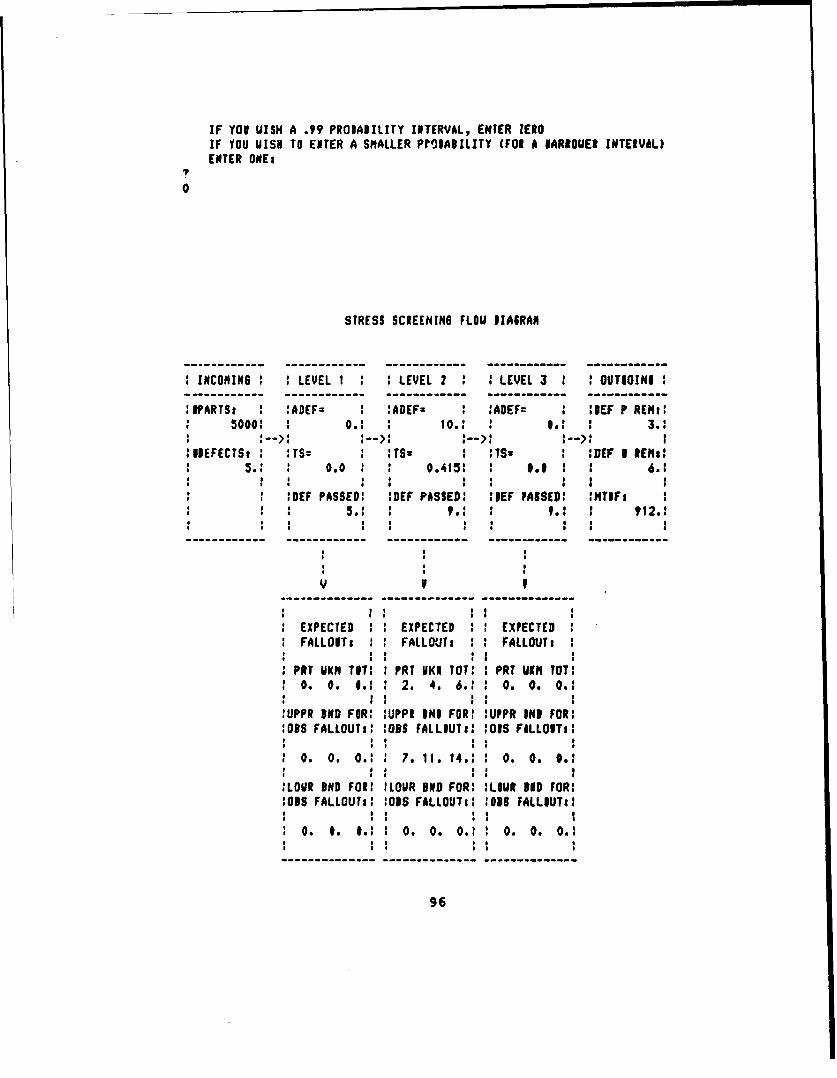
IF YOU UISH A .99 PROBABILITY INTERVAL, ENTER ZEROIF YOU UISN TO ENTER A SMALLER POIABILITY (FOR A NARIOUER INTERVAL)ENTER ONE:
0
STRESS SCREENING FLOU IIAiRAN
INCOMIN6 : LEVEL I : LEVEL 2 : 1 LEVEL 3 : OUTIO!NI :
PARTSt :ADEF ADEF :ADEFz IIEF P REM.:5000: : 0.: :o.: : 3.:
IDEFECTSt : TS: l TS :Ism : :DEFt REIMES.: 0.0 0.4•5: 0.0 6.:
1 1DEF PASSED: 1DEF PASSED: IEF PASSED: !NTIF: i
0.0 #. 2. 4. 6.. 0. 0. 0.
SS . S . . !S1 .
V I 1
:09 F Us: 10S FALUi :OSFLIo
EXPECTED : ! EXPECTED FO: EXPECTEDFALLOUT: : I FALLOUT: :0I0FALLOUT:
PRT UKN TInT: PRT UKI TOT:: PRT UKM TOT:
o. O. 1.:oI 2. 4. 6.: I 0. O. O.:
:UPPR IND FOR: IUPPR IMS FORI IUPPR DM3 FOR::035 FALLOUT:: :OBS FALLIUTI: IODS FALLOUTe:
1 1 : :
a . a. 0.: : 7. i1. 14.:I O. a. O.:
:LOVR 3BD FOR: ILOUR 3BD FOR: :LOUR DUD FOR:lOBS FALLOUT.: 03I FALLOUT.: :035 FALLIUT:I
O. O. S.: 1a. a. 0.: 1 09. 0. 0.
96
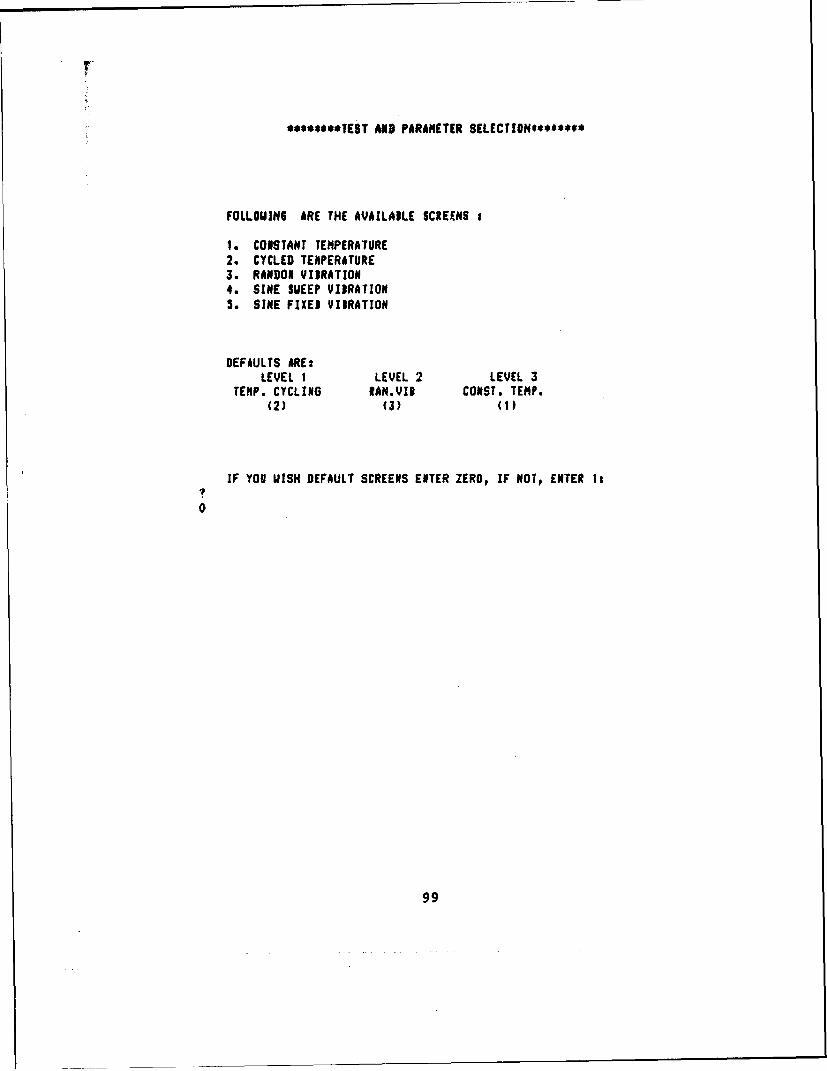
********EST AND PARAMETER SELECTION*******
FOLLOUIN6 ARE THE AVAILABLE SCREENS
I. CONSTANT TEMPERATURE2. CYCLED TENPERATURE3. RANDON VYIRATION4. SINE SUEEP VIBRATIONS. SINE FIXEI VIBRATION
DEFAULTS ARE:LEVEL I LEVEL 2 LEVEL 3
TEMP. CYCLING RAN.VIB CONST. TEMP.(2) (3) (1)
IF YOU UISH DEFAULT SCREENS ENTER ZERO, IF NOT, ENTER Is
0
99
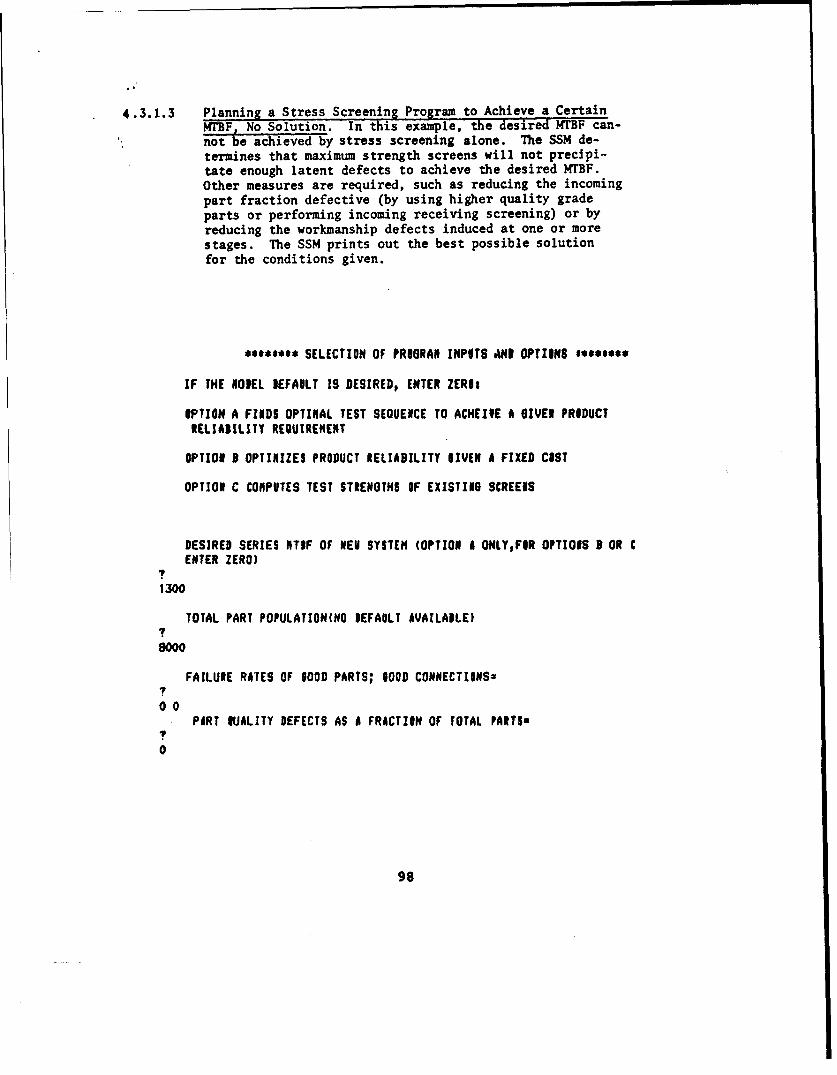
4.3.1.3 Planning a Stress Screening Program to Achieve a Certain?rBF, No Solution. In this example, the desired MTBF can-not be achieved by stress screening alone. The SSM de-termines that maximum strength screens will not precipi-tate enough latent defects to achieve the desired KrBF.Other measures are required, such as reducing the incomingpart fraction defective (by using higher quality gradeparts or performing incoming receiving screening) or byreducing the workmanship defects induced at one or morestages. The SSM prints out the best possible solutionfor the conditions given.
*.s*e**, SELECTION OF PROGRAN INPOTS AND OPTIINS **e**e
IF THE NOOEL DEFAULT IS DESIREDr ENTER ZERI:
OPTION A FINDS OPTINAL TEST SEQUENCE TO ACHEIVE A GIVEN PRODUCTRELIASILITY REQUIREMENT
OPTION B OPTINIZES PRODUCT RELIABILITY DIVEN A FIXED COST
OPTION C COMPUTES TEST STRENGTHS OF EXISTING SCREENS
DESIRED SERIES NTIF OF NEU SYSTEM (OPTION I ONLYTFOR OPTIONS 3 OR CENTER ZERO)
I
1300
TOTAL PART POPULATION(NO DEFAULT AVAILAILE)7
8W00
FAILURE RATES OF O00D PARTS; 1OOD CONNECTIONS-
00PART DUALITY DEFECTS AS A FRACTION OF TOTAL PARTS=
0
98
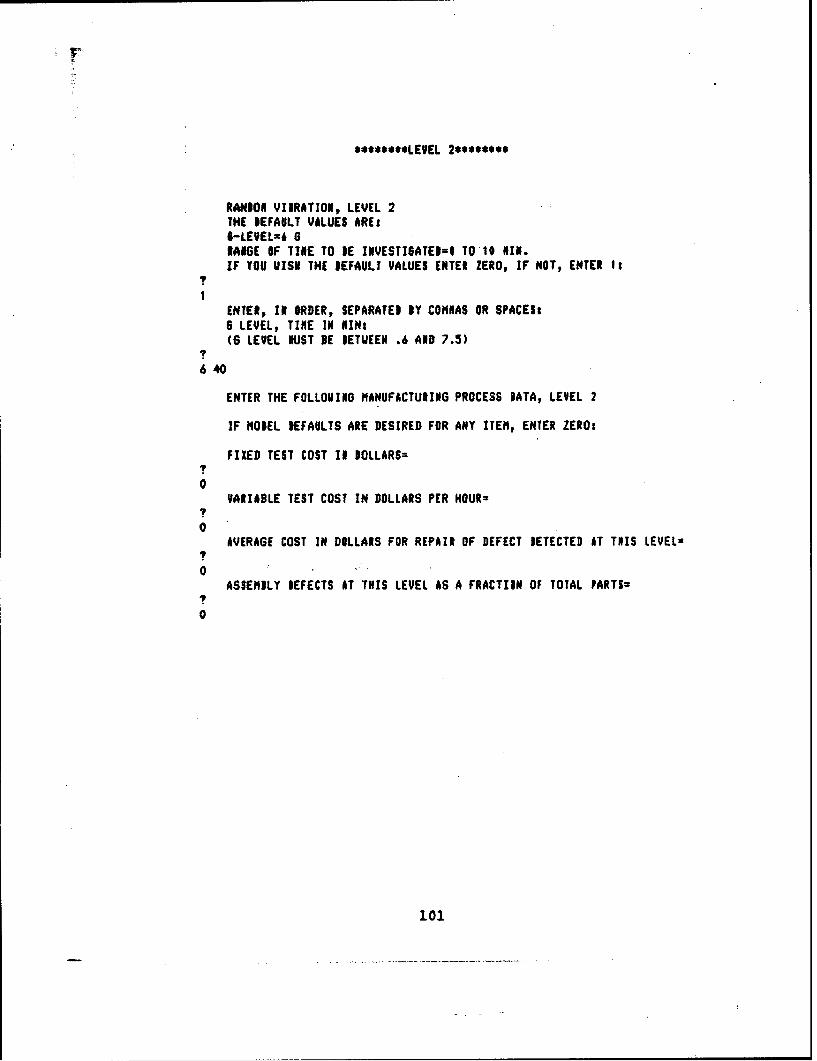
********LEVEL 2*******
RANDON VIDRATION, LEVEL 2THE DEFAULT VALUES AREsI-LEVEL6i 6RAIGE OF TINE TO DE INVESTIGATES=O TO 10 NII.IF YOU VISi THE DEFAULT VALUES ENTER ZERO, IF NOT, ENTER 1:
1
ENTER, II ORDER, SEPARATED DY COMNAS OR SPACES:6 LEVEL, TINE IN HIMN(6 LEVEL DUST DE DETUEEN .6 AiD 7.5)
640
ENTER THE FOLLOUING MANUFACTURING PROCESS DATA, LEVEL 2
IF MODEL DEFAULTS ARE DESIRED FOR ANY ITEM, ENTER ZERO:
FIXED TEST COST 11 DOLLARS=7
0VARIABLE TEST COST IN DOLLARS PER HOUR=
?
0AVERAGE COST IN DOLLARS FOR REPAIR OF DEFECT DETECTED AT THIS LEVEL=
70
ASSENMLY BEFECTS AT THIS LEVEL AS A FRACTION OF TOTAL PARTS=?
0
101
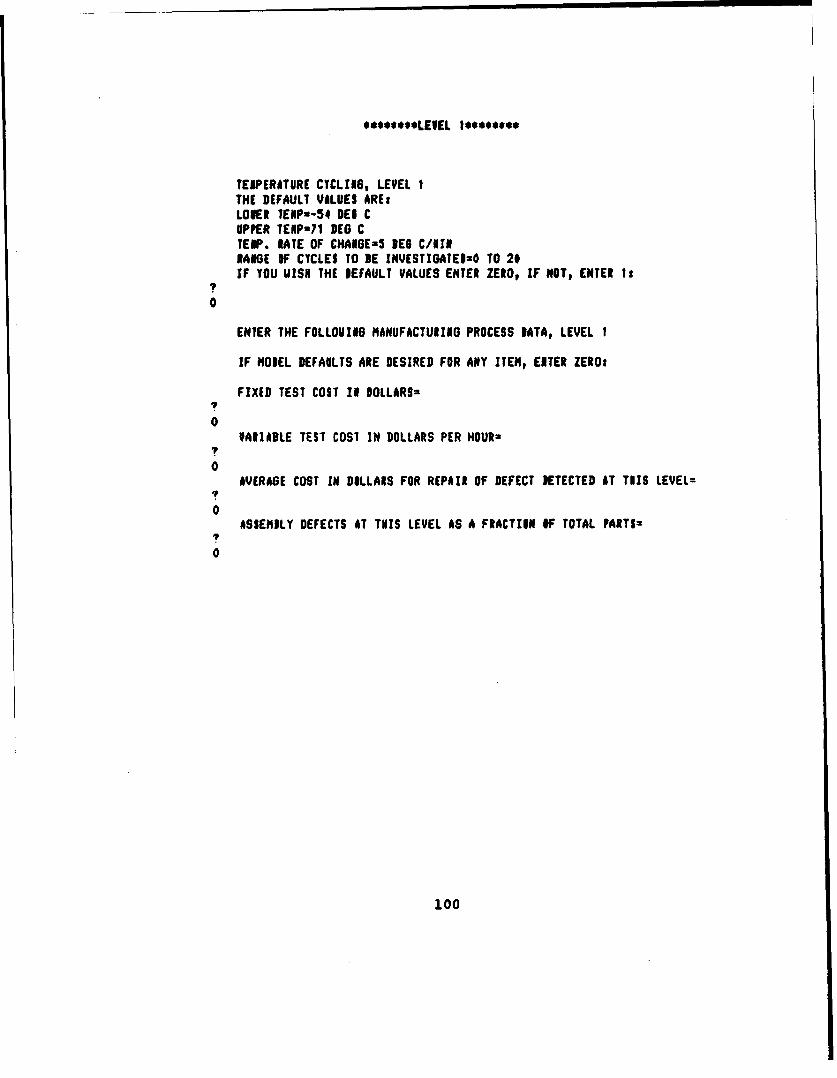
**W***LEVEL 1********
TEAPERATURE CYCLING, LEVEL ITHE DEFAULT VALUES ARESLOKER IENPm-54 DES CUPPER TENP=7I DEG CTEMP. RATE OF CHANGE=5 DES C/1I1RANGE OF CYCLES TO DE INVESTIGATED=O TO 21IF YOU UISN THE DEFAULT VALUES ENTER ZERO, IF NOT, ENTER Is
?
0
ENTER THE FOLLOVING NANUFACTURING PROCESS DATA, LEVEL I
IF NODEL DEFAULTS ARE DESIRED FOR ANY ITEM, ENTER ZERO:
FIXED TEST COST IN IOLLARS=
0VARIABLE TEST COST IN DOLLARS PER HOURS
0AVERAGE COST IN DOLLARS FOR REPAIR OF DEFECT DETECTED AT TlIS LEVEL=
0ASSEMILY DEFECTS AT TlIS LEVEL AS A FRACTION OF TOTAL PARTS=
I0
100
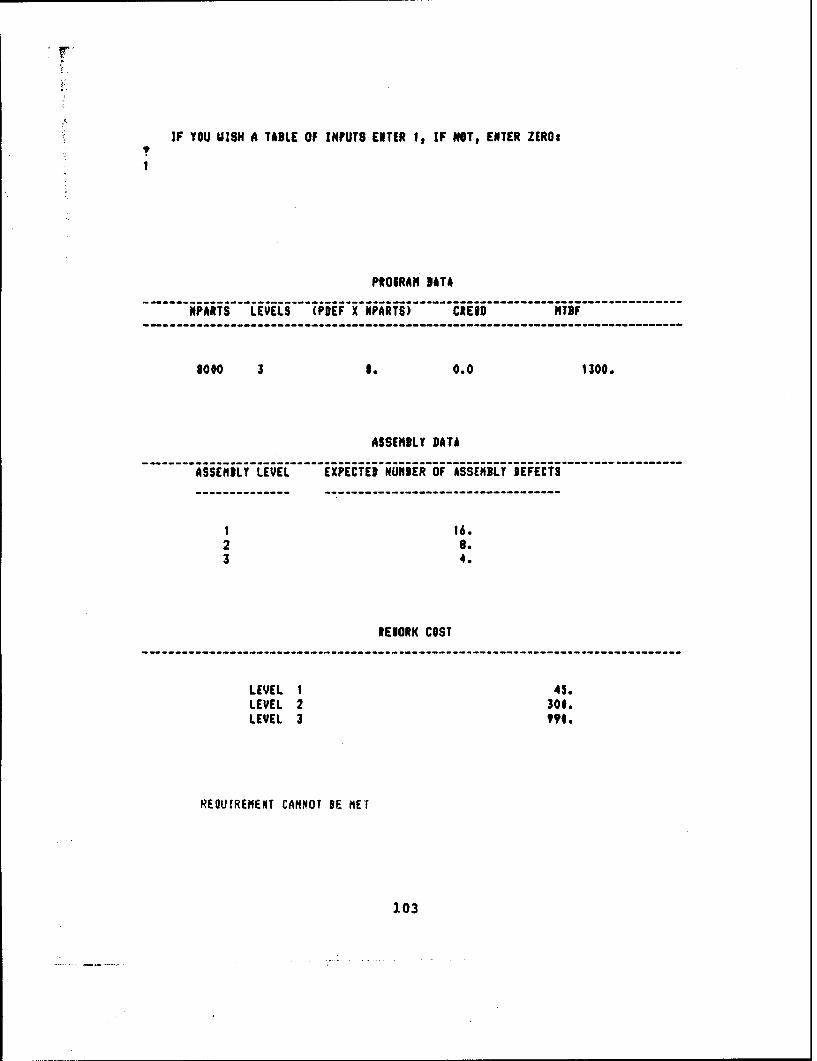
IF YOU UISH A TABLE OF INPUTS ENTER It IF NOT, ENTER ZEROs
1
PIOIRAN DATA
NPARTS LEVELS (PDEF X NPARTS) CREID NTDF
80*0 3 3. 0.0 1300.
ASSEMBLY DATA
ASSEMBLY LEVEL EXPECTED NUNBER OF ASSEMBLY DEFECTS
1 16.2 8.3 4.
REIORK COST
LEVEL I 45.LEVEL 2 300.LEVEL 3 991.
REQUIREMENT CANHOT BE MET
103

t*e*.***LEVEL 3*.*.*****
COISTANT TENPERATIRE, LEVEL 3THE DEFAULT VALUES ARE:TENPERATUlEu7T DES-CTINE RANSE TO DE INVESTIGATEDsO TI 48 HOURSIF YOU VISH THE DEFAULT VALUES, ENTER ZEROt IF NOT,ENTER It
?1
ENTER, 11 ORDER, SEPARATED DY COMiAS OR SPACES$TEMP IN DES Cp TINE IN HRSo(TEIP MUST DE LESS THAN +75 DEG C)
70 96
ENTER THE FOLLOVING MANUFACTURINO PROCESS DATA, LEVEL J
IF MODEL DEFAULTS ARE DESIRED FOR ANY ITEM, ENTER ZERO:
FIXED TEST COST 1I DOLLARS=
0VARIABLE TEST COST IN DOLLARS PER HOUR*
0AVERASE COST IN DILLARS FOR REPAIR OF DEFECT DETECTED iT TEIS LEVELz
?
0ASSENDLY DEFECTS AT T711 LEVEL AS A FRACTION OF TOTAL PARTS-
0
102

STRESS SC9EENIN6 FLOU IIAIRAN
I INCOMING 1 LEVEL I : 1 LEVEL 2 1 1 LEVEL 3 1 1 OUTIOINI
I PARTS# : ADEFu 1 :ADEFz 1 *DEFs 1 :DEF P RENW80009 16..: 1.: 1.:
:IDEFECTS: 2 TSu 1 1TSm 1 !TSm 1 :DEF U REWi* 8.1 i 0.615: 0.683! 0.314: 6.
:DEF PASSED: :DEF PASSED: :DEF PASSED: 2NTIFsS : 9.: 1 5.: : 6.: I 1051.:
I, !: : 11 :
EXPECTED : EXPECTED ;:EXPECTED1FALLOOTi : FALLOUT:s FALLOUT:
PRT UKi TOT: PRT UKMl TOT: PRT IKH TOT:4. 11. 15.,' 2. 10. 12.1 O . 3. 3.:
1UPPR IND FOR: :IPPR BID FOR: !UPPR IND FOR!lOBS FALLOUTS: :ODS F *LLOUTt :QJS FALLOSTS
111. 21. 26..' o 7. 20. 22.1 11 0. 9. 9.:
:LOUR ROD FOR: :LOVR BID FOR: :LOUR IND FOR!:OBS FALLOUTil WOS FALLOUTis :019 FALLOUT::
: I
0. 2. 5.1 1 0. 2. 3.1 : 0. 0. 0.:
X : EPCD XE
F--L--O---- -------- --FALOUT:-----ALOU -
I S S I105
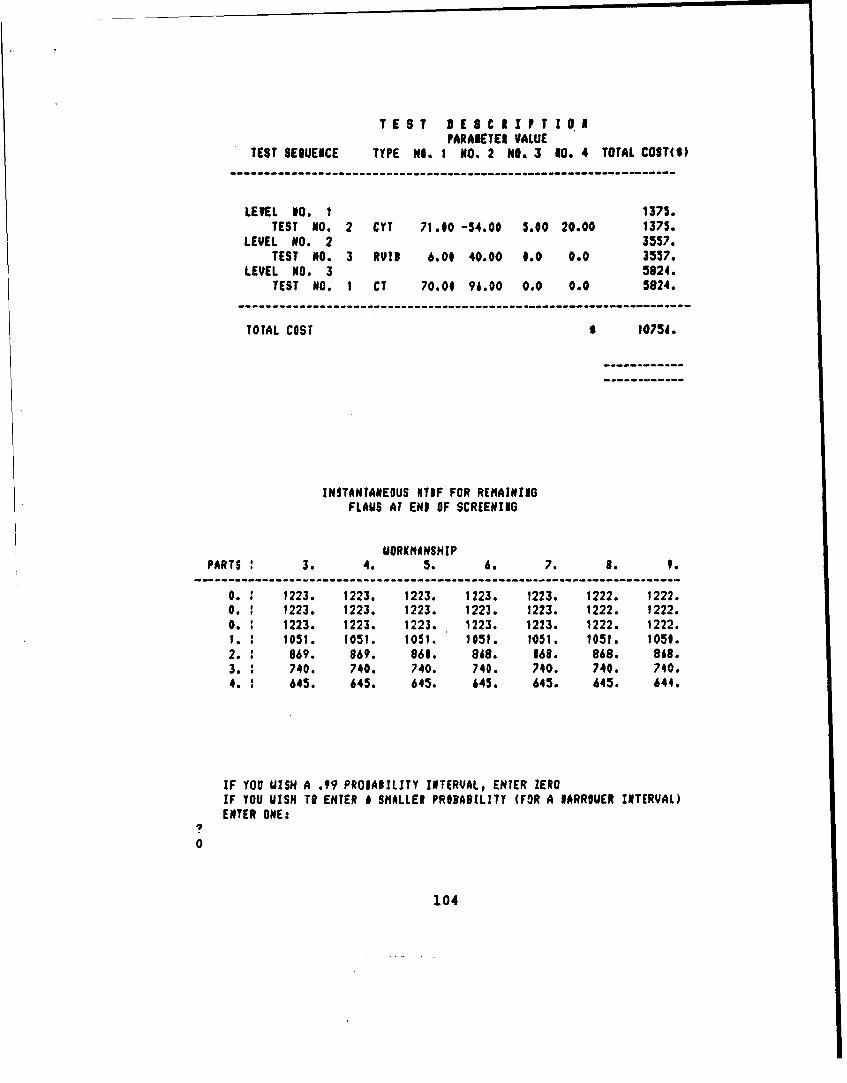
TEST DESE CII T IOUPARAIETEI VALUE
TEST SESUENCE TYPE NI. 1 NO. 2 NO. 3 10. 4 TOTAL COST(S)
LEVEL M0. 1 1375.TEST NO. 2 CYT 71.00 -54.00 5.00 20.00 1375.
LEVEL NO. 2 3557.TEST NO. 3 RVID 6.00 40.00 0.0 0.0 3557.
LEVEL NO. 3 5824.TEST NO. I CT 70.00 96.00 0.0 0.0 5824.
TOTAL COST $ 10756.
INSTANTANEOUS NTIF FOR REMAININGFLAUS AT END OF SCREENING
UORKMANSHIPPARTS 3. 4. 5. 6. 7. 8. 9.
0. -- 1223. 1223. 1223. 1223. 1223. 1222. 1222.0. 1223. 1223. 1223. 1223. 1223. 1222. 1222.0. 1223. 1223. 1223. 1223. 1223. 1222. 1222.1. 1051. 1251. 1051. 1051. 1051. 1051. 1250.2. 0869. 869. 061. 868. 168. 868. 868.3. 740. 740. 740. 740. 740. 740. 740.
4. 645. 645. 645. 645. 645. 645. 644.
IF YOU UISH A .99 PRO1A4ILITY INTERVAL, ENTER ZEROIF YOU lUSH TO ENTER A SMALLER PROBABZLITY (FOR A VARROUER INTERVAL)ENTER ONE:
0
104

IF YOU HAVE FALLOUT DATA ENTER It, IF NOT ENTEI ZEROs
0XF YOU UVSI TO ANALYZE EOUIVALENT SCREENS ENTER ONE
IF NOT ENTER ZERO:
1
FOLLOUING ARE TNE SCREEN EQUATIONS AVAILABLE:1. CONSTANT TEMPERATURE2. TEMPERATURE CYCLING"3. RANDOM VIBRATfON4. SINE SUEEP VIBRATION5. SINE FIXED VIDRATION
ENTER RUMBER FROM ABOVE LIST CORRESPONDING TO SlYEI SCREEN:
1
ENTER NIUMER FROM ABOVE LIST CORRESPONDING TO DESIRED SCREEN:
2
ENTER PARAMETERS FOR 6IVEN SCREEN:
ENTER ABSOLUTE VALUE OF DIFFERENCE BETUEEN TENP IN DEG C AID 25 DEl CAND TIME IN HOURS
?
45 96
ENTER PAROMETERS FOR DESIRED SCREEN;ESTER ZERO FOR PARAMETER TO NE FOUND:
ENTER RANGE IN DES CTIMP RATE OF CHANGE IN DES C/MINAID NUMNER OF CYCLES
100 3 0
TEST STRENGTH FOR GIVEN SCREEN= 0.3143
PAIAMETER IN DESIRED TEMP CYCLING SCREEN= 8.0
107
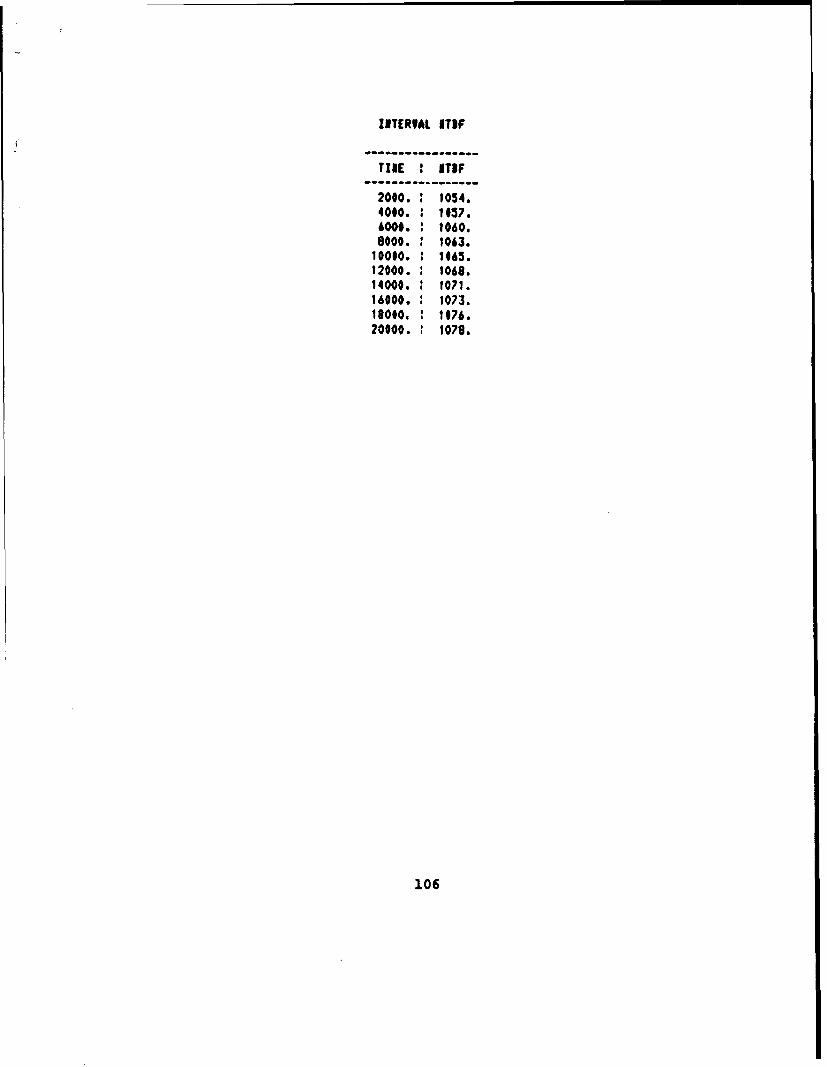
ZITERVAL ITIF
TINE ITTF
2000. : 1054.4000. ; 1057.6000. : 1060.8000. : 1063.
10000. 1065.12000. : 1068.14000. : 1071.16000. : 1073.18010. ! 1076.20000. : 1078.
106
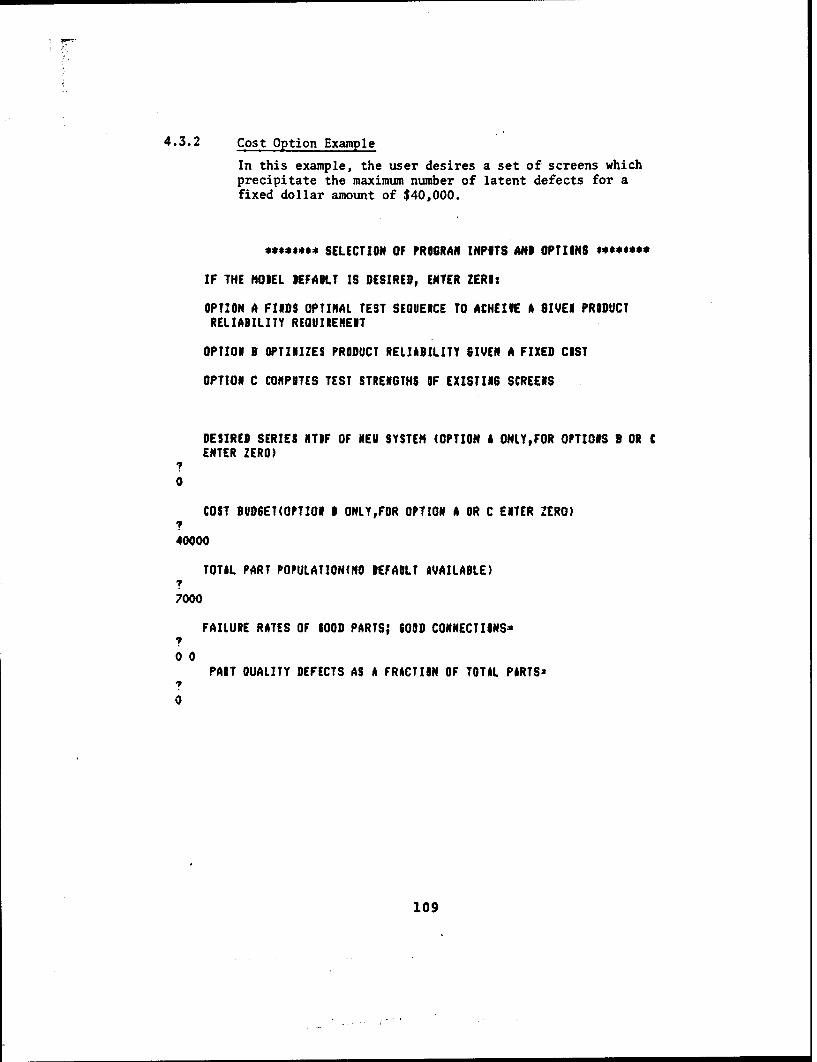
4.3.2 Cost Option Example
In this example, the user desires a set of screens whichprecipitate the maximum number of latent defects for afixed dollar amount of $40,000.
**0*•*** SELECTION OF PROGRAN INPITS AND OPTIONS e***'***
IF THE MOIEL DEFAULT IS DESIRED, ENTER ZERO:
OPTION A FINDS OPTIMAL TEST SEQUENCE TO ACHEIVE A GIVEN PRODUCTRELIABILITY REQUIREMENT
OPTION 3 OPTIMIZES PRODUCT RELIABILITY GIVEN A FIXED COST
OPTION C COMPUTES TEST STRENGTHS OF EXISTING SCREENS
DESIRED SERIES NTIF OF NEU SYSTEM (OPTION A ONLYFOR OPTIONS 9 OR CENTER ZERO)
0
COST BUDSET(OPTION I ONLY,FOR OPTION A OR C ENTER ZERO)
40000
TOTAL PART POPULATION(NO DEFAULT AVAILABLE)?
7000
FAILURE RATES OF 600D PARTS; 6OOD CONNECTIONS=I
00PART QUALITY DEFECTS AS A FRACTION OF TOTAL PiRTS2
0
109

IF YOU UISi ANOTHER EGUIVALENCI ENTER ONE, IF NOT, ENTER ZERO$?I
FOLLOUZIG ARE THE SCREEN EQUATIONS AVAILAILEs1. CONSTANT TEMPERATUIE2. TEMPEIATURE CYCLING3. RANDOM VIBRATION4. SINE SUEEP VIBRATION5. SINE FIXED VIBRATION
ENTER NHMIER FROM ABOVE LIST CORRESPONDING TO GIVEN SCREEN:
2ENTER NHMIER FROM ABOVE LIST CORRESPOIDING TO IESIREI SCREEN:T2
ENTER PARAMETERS FOR IIVEi SCREENs
ENTER RANGE IN DES CTEMP RATE OF CHANGE IN DEG C/MINAID NOMIER OF CYCLES
1223 5 20
ENIER PARAMETERS FOR DESIRED SCREEN;EITER ZERO FOR PARAMETER TO BE FOUND:
ENTER RANGE IN IEI CTEIP RATE OF CHANGE IN DEG C/MENAID NOMIER OF CYCLES
100 3 0
TE1T STRENGTH FOR GIVEN SCREEN= 0.6145
PARAMETER IN IESIRED TEMP CYCLING SCREENs 61.4
108

**$*****LEVEL 1*******
TEIPERATURE CYCLING, LEVEL 1THE DEFAULT VALUES AREsLOVER TENP-54 DE$ CUPPER TENP71 DES CTEIP. RATE OF CHAIGE=5 DEG C/KINRANGE OF CYCLES TO DE INVESTISATED=O TO 20IF YOU iISH THE DEFAULT VALUES ENTER ZERO, IF NOT, ENTER 1:
T0
ENTER THE FOLLOVIUG MANUFACTURING PROCESS DATA, LEVEL 1
IF MODEL DEFAULTS ARE DESIRED FOR ANY ITEM, ENTER ZEROt
FIXED TEST COST IN DOLLARS=710000
VARIABLE TEST COST IN DOLLARS PER HOUR=7
40AVERASE COST IN DOLLARS FOR REPAIR OF DEFECT DETECTED AT THIS LEVEL=
7
0ASSENDLY DEFECTS AT THIS LEVEL AS A FRACTION IF TOTAL PARTS=
00
111
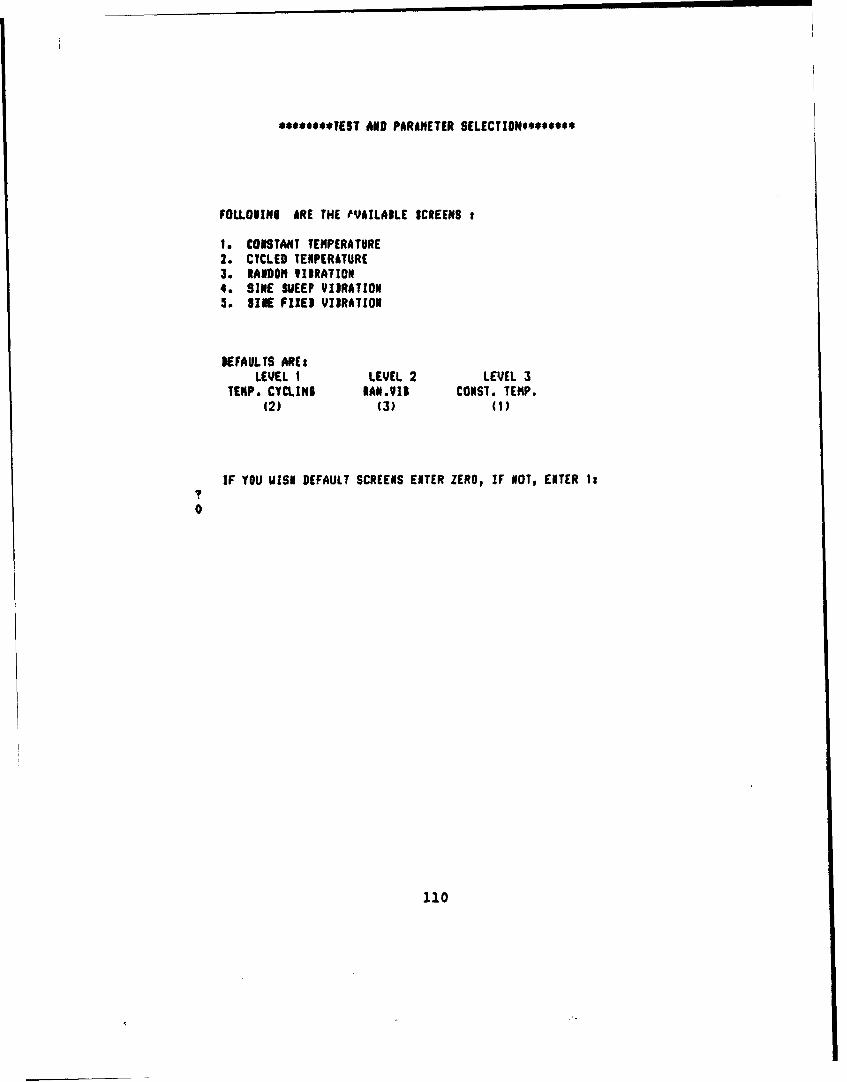
****$$**TEST AND PARAMETER SELECTIONWW*****
FOLLODINS IRE THE tVAILADLE SCREENS :
1. CONSTANT TEMPERATURE2. CYCLED TENPERATURE3. RANDOM VIDRATION4. SINE SUEEP VIDRATION5. SINE FIXES VIDRATION
DEFAULTS ARE:LEVEL I LEVEL 2 LEVEL 3
TEMP. CYCLIN IAAN.VII CONST. TEMP.(2) (3) (1)
IF YOU UISN DEFAULT SCREENS ENTER ZERO, IF NOTO ENTER II
0
110

**e*****LEUEL 3.*.*.***
CONSTANT TEMPERATURE, LEVEL 3THE DEFAULT VALUES ARE:TEIPERATURE27# DES CTIE RANGE TO BE INVESTIGATEDsO TO 48 HOURSIF YOU UISN THE DEFAULT VALVES, ENTER ZERO, IF NOTENTER I:
0
ENTER THE FOLLOUING MANUFACTURING PROCESS DATA, LEVEL 3
IF MODEL DEFAULTS ARE DESIRED FOR ANY ITEM, ENTER ZEROt
FIXED TEST COST II DOLLARSs
10000VARIABLE TEST COST IN DOLLARS PER HOUR=
50AVERAGE COST IN DOLLARS FOR REPAIR OF DEFECT DETECTED AT TVIS LEVEL=
1000ASSEMILY IEFECTS AT THIS LEVEL AS A FRACTION OF TOTAL PARTS=
70
113
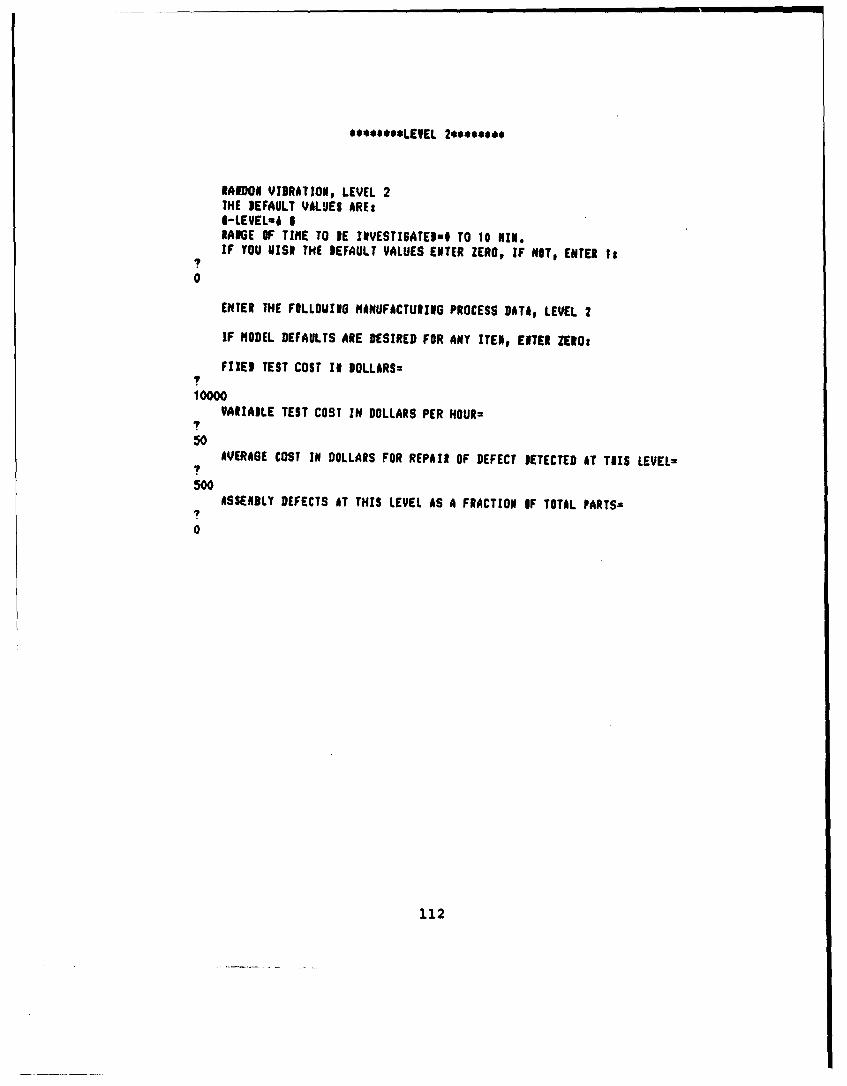
e***eee**LE5EL 2.*..e**e
RAIDON VIDRATION, LEVEL 2THE DEFAULT VALUES ARE:$-LEVEL=& IRANGE WF TIME TO RE IfVESTIGATEl-# TO 10 NIN.IF YOU VISI THE DEFAULT VALUES ENTER ZERO, IF WoT, ENTER Is
0
ENTER THE FOLLOUIEG MANUFACTURING PROCESS DATA, LEVEL 2
IF MODEL DEFAULTS ARE DESIRED FOR ANY ITElp ENTER ZEROt
FIXED TEST COST 1I DOLLARS:
10000VARIASLE TEST COST IN DOLLARS PER HOUR:
?
50AVERAGE COST IN DOLLARS FOR REPAIR OF DEFECT DETECTED AT TUIS LEVEL=
I
500ASSENDLY DEFECTS AT THIS LEVEL AS A FRACTION IF TOTAL PARTS=
70
112
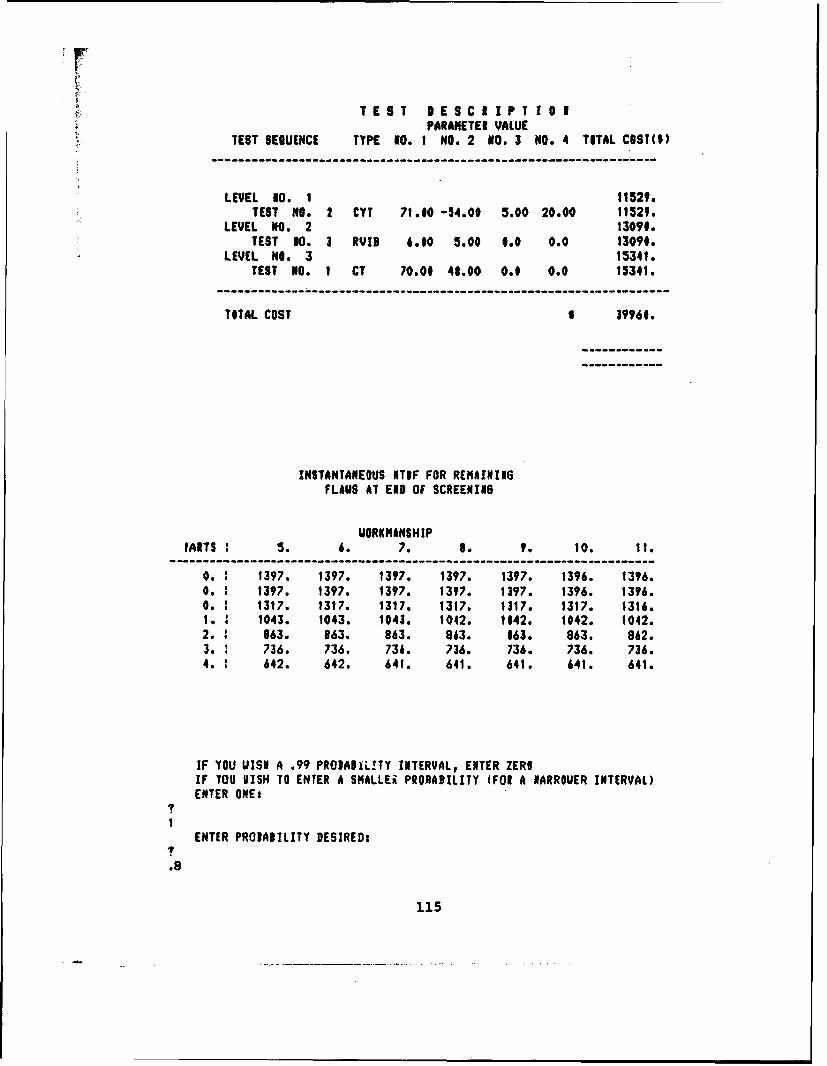
I
7 TEST DESC IP T 1 0 IPARAMETER VALUE
TEST SEGUENCE TYPE 10. 1 NO. 2 NO. 3 NO. 4 TOTAL COST(S)
LEVEL 10. 1 11529.TEST NO. 2 CTY 71.00 -54.00 5.00 20.00 11529.
LEVEL NO. 2 1309#.TEST 10. 3 RYID 6.00 5.00 #.0 0.0 13090.
LEVEL NO. 3 15341.TEST NO. 1 CT 70.00 41.00 0.# 0.0 15341.
TOTAL COST S 3996h
INSTANTANEOUS ITIF FOR REMAININGFLAUS AT END OF SCREENINS
VORKMANSHIPFARTS 5. 6. 7. S. 9. 10. 11.
0. : -1397. 1397. 1397. 1397. 1397. 1396. 1396.0. 1397. 1397. 1397. 1397. 1397. 1396. 1396.0. 1317. 1317. 1317. 1317. 1317. 1317. 1316.
1. 1043. 1043. 1043. 1042. 1042. 1042. 1042.2. 863. 963. 863. 863. 163. 863. 862.3. 736. 736. 736. 736. 736. 736. 736.4. 642. 642. 641. 641. 641. 641. 641.
IF YOU UISH A .99 PRODABiL!TY INTERVAL, ENTER ZEROIF YOU VISH TO ENTER A SNALLEi PRORABILITY (FOR A NARROUER INTERVAL)ENTER ONEs
I
*1
ENTER PRODABILITY DESIRED:1
.8
115
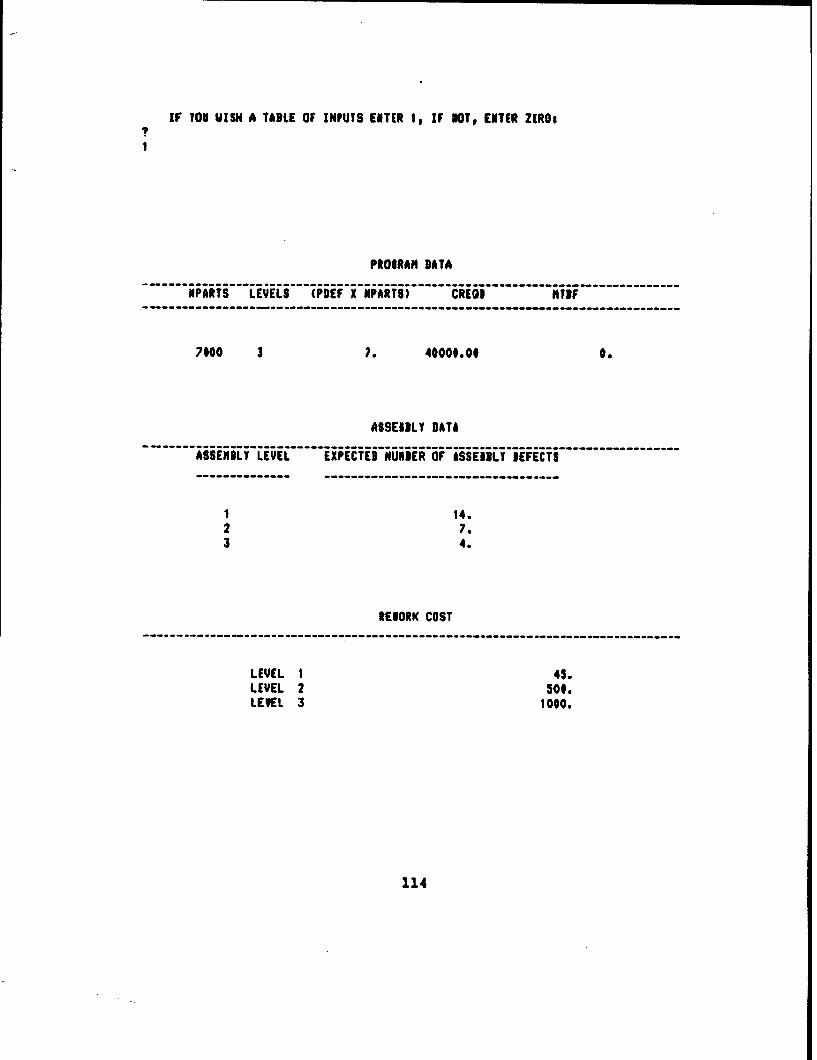
IF VON UISH A TABLE OF INPUTS ENTER 1, IF NOT, ENTER ZEROs
1
PROIRAN DATA
NPARTS LEVELS (POEF X NPARTS) CREOP NTIF
7000 3 7. 40000.00 0.
ASSEINLY DATU----------------------------------- ft---------- ------------
ASSEMILY LEVEL EXPECTED NUNDER OF ISSEIRLY DEFECTS
1 14.2 7.3 4.
REIORK COST
------------------ ------------------------------------------
LEVEL I 45.LEVEL 2 500.LEVEL 3 1000.
114

INTERVAL ITIF
TIRE NYIF
2000. : 1049.4000. ! 1056.6000. 1 1062.8000. : 1069.
10000. 1 1075.12000. 1 1081.14000. 1 1087.16000. 1093.18000. i 1098.20000. ! 1104.
IF YOU HAVE FALLOUT DATA ENTER 1, IF NOT ENTER ZERO:?
0IF YOU VISH TI ANALYZE EQUIVALENT SCREENS ENTER OlEIf NOT ENTER ZEROo
I
0
IF YOU HAVE TINES TO FAILURE FOR LEVEL III ENTER 1,IF NOT, ENTER ZEROs
0READY
117

STRESS SCREENING FLOg IIAGIAN
INCONING : LEVEL I 1 LEVEL 2 : LEVEL 3 : 1 OUTSOING I
WmPARTS: :ADEF- :ADEFs IADEF. IDEF P REMII700014I! 4. 7. 4.1 1.:
--- >! -- >! -I
IIUEFECTStI TS* :TS= I :TS= I fEF I RENM:7.: 0.615: 1 0.4091 0.237: 1 8.1: : : : :
IDEF PASSED: IDEF PASSED: :DEF PASSED: !MTDF:a.: : 9.: : o.: : 1042.1
II S I I I I I S
* S I
* I SI 0 5
V V I
EXPECTED I -EXPECTED : EXPECTEDFALLOUT# 1 FALLOUTs 1 FALLOUT:I
PRT UKi TOT: PRT IKN TOT: PIT UKN TOT:4. 9. 13.: 1. 5. 6.: 0. 3. 3.1
:UPPR DID FOR: IUPPR BDD FOR! IUPPR IND FOR:DOBS FALLOUT:: :OIS FALLOUT: :COBS FALLOUT::* I1 55
1. 14. is.11 3. 9. 10.: 0. 6. 6.1
:LOUR DID FOIl ILOUR BDD FOR: LOUR IND FOR::OBI FALLOUT:: 0IS FALLOUT:: 0IS FiLLOUT:
1. 4. 7.: 0 0. 1. 2.: 0. 0. 0.:- - - I- - I -
116
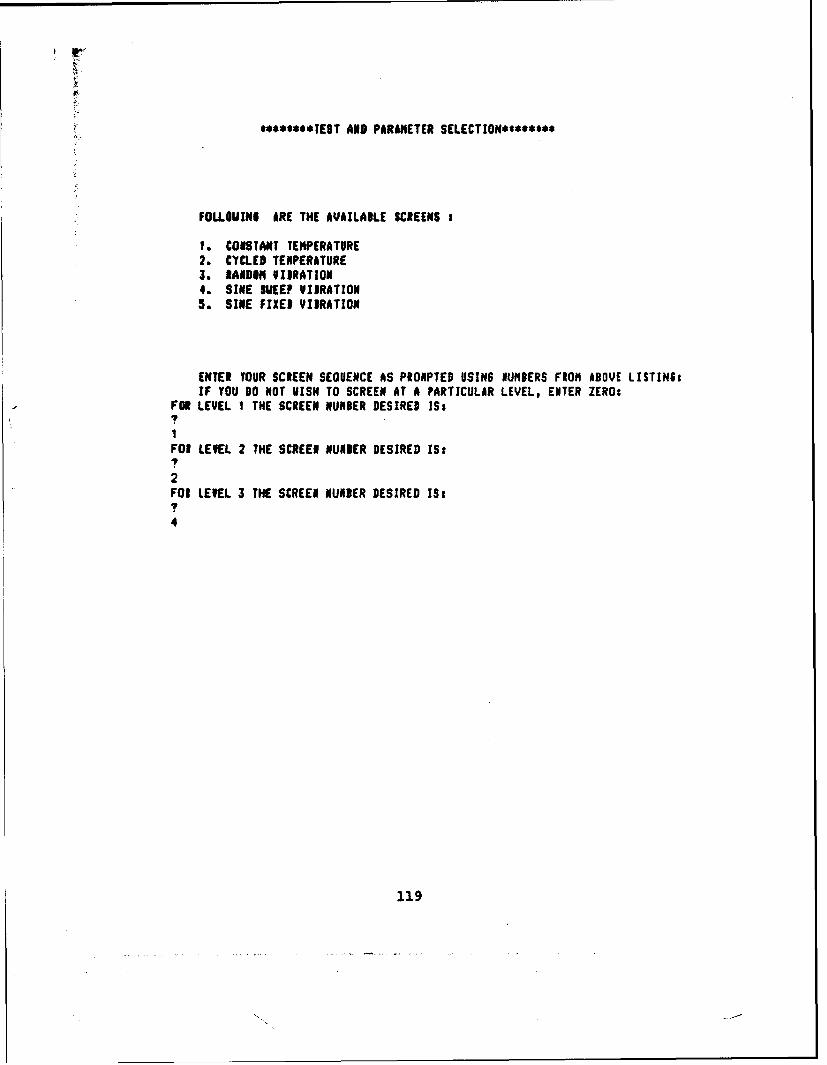
$*******TEST AND PARANETER SELECTION*$s**$*$
FOLLOMINO ARE THE AVAILABLE SCREENS i
1. COISTANT TENPERATURE2. CYrCLED TENPERATURE3. RANDON VIBRATION4. SINE SVEEP VIBRATION5. SINE FIXED VIBRATION
ENTER TOUR SCREEN SEQUENCE AS PROIPTED USING #UMBERS FROM ABOVE LISTINS:IF YOU DO NOT VISH TO SCREEN AT A PARTICULAR LEVEL, ENTER ZERO:
FOlR LEVEL I THE SCREEN PUNIER DESIRED IS:
1FOE LEVEL 2 THE SCREEN NUNUER DESIRED IS:
2FOR LEVEL 3 THE SCREEN NUNBER DESIRED IS:?4
119
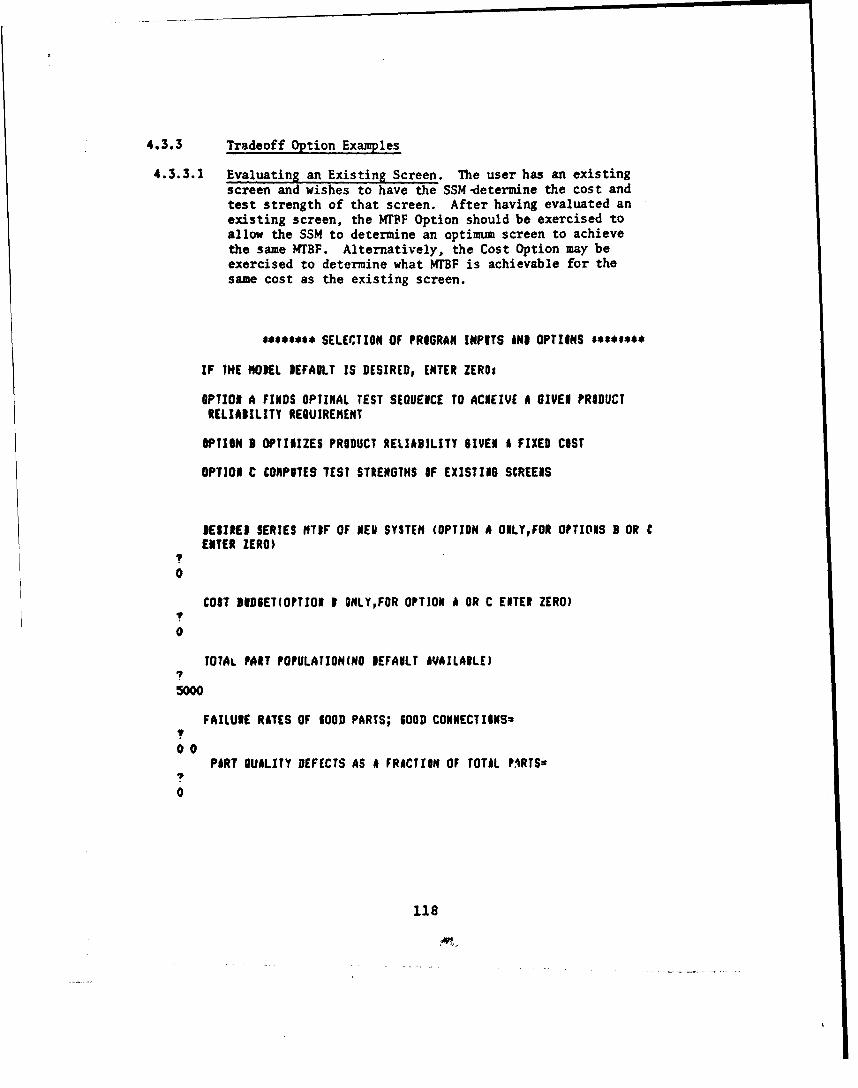
4.3.3 Tradeoff Option Examples
4.3.3.1 Evaluating an Existing Screen. The user has an existingscreen and wishes to have the SSM -determine the cost andtest strength of that screen. After having evaluated anexisting screen, the MTBF Option should be exercised toallow the SSM to determine an optimum screen to achievethe same WTBF. Alternatively, the Cost Option may beexercised to determine what HTBF is achievable for thesame cost as the existing screen.
SELECTION OF PROGRAN INPUTS IND OPTIONS ,,See*
IF THE NOVEL DEFAULT IS DESIRED, ENTER ZEROs
OPTION A FINDS OPTINAL TEST SEQUENCE TO ACNEIVE A GIVEN PRODUCTRELIAIILITY REQUIREMENT
OPTION I OPTINIZES PRODUCT RELIABILITY SIVEN A FIXED COST
OPTION C CONP7TES TEST STRENGTHS OF EXISTIN6 SCREENS
DIINEI SERIES HTIF OF NEU SYSTEN (OPTION A OILY,FOR OPTIONS 9 OR C
ENTER ZERO)
0
COST DUDIET(OPTIO1 I ONLY,FOR OPTION A OR C ENTER ZERO)I
0
TOTAL PART POPULATION(NO OEFAULT AVAILAILE)
5000
FAILURE RATES OF 6000 PARTS; 600D CONNECTIONS=
00PART QUALITY DEFECTS AS A FRACTION OF TOTAL PFiRTS=
0
118
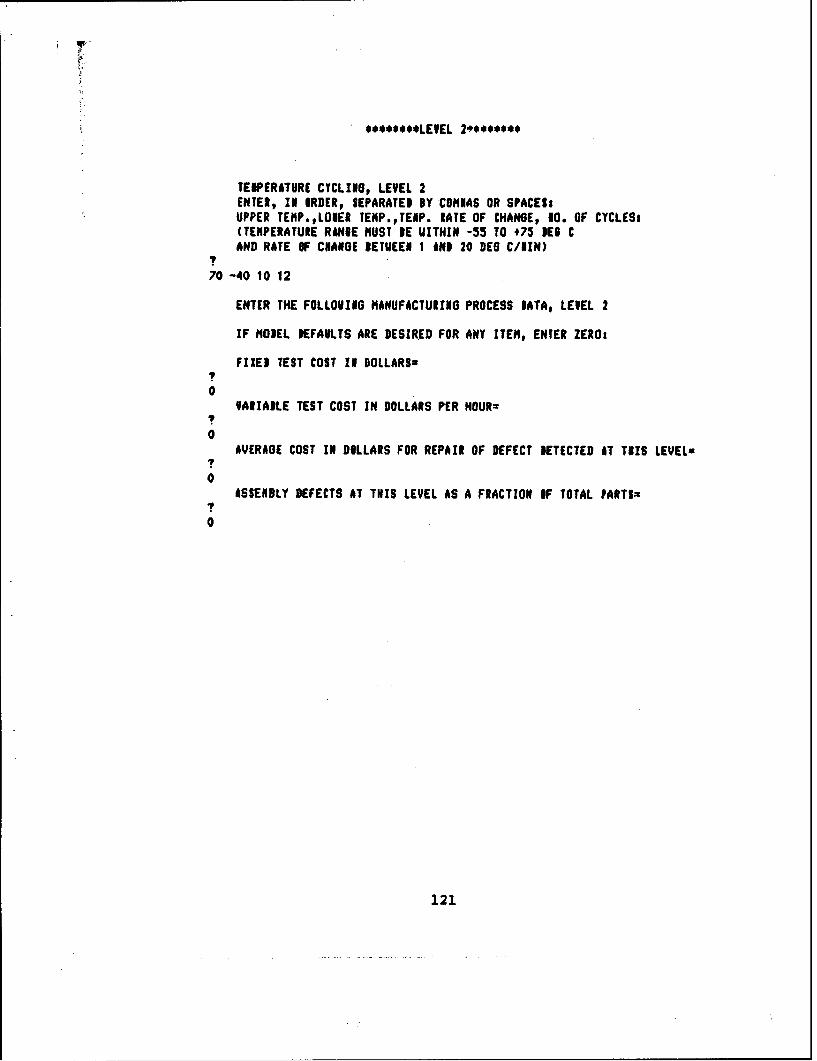
*e***$**LEVEL 2***s****
TEMPERATURE CTCLIMOG LEVEL 2ENTER, IN ORDER, SEPARATED BY COMNAS OR SPACESsUPPER TEMP.qLOlER TENP.,TEIP. RATE OF CHANGE, 10. OF CYCLES:(TEMPERATURE RANSE MUST BE UITHIN -55 TO +75 DES CAND RATE OF CUANGE DETUEEN I AND 20 DEG C/lIN)
?
70 -40 10 12
ENTER THE FOLLOVIOG MANUFACTURING PROCESS IATA, LEVEL 2
IF MODEL DEFAULTS ARE DESIRED FOR ANY ITEM, ENTER ZERO:
FIXED TEST COST 11 DOLLARSw?
0VARIAILE TEST COST IN DOLLARS PER HOUR-
I
0AVERAGE COST IN DOLLARS FOR REPAIR OF DEFECT DETECTED AT TIIS LEVELs
T0
ASSEMBLY DEFECTS AT THIS LEVEL AS A FRACTION OF TOTAL PARTS=7
0
121

I!
[ **e**e**LEVEL I**e*.***
CONSTANT TEIPERATURE, LEVEL 1ENTER, IN ORDER, SEPARATED DY COMMAS OR SPACES:TEAP 1I DEI C, TINE IN HRSt(TEMP MUST BE LESS THAN +75 DEG C)
70 96
ENTER THE FOLLOUING MANUFACTURING PROCESS DATA, LEVEL I
IF IODEL DEFAULTS ARE DESIRED FOR ANY ITEM9 ENTER ZEROt
FIXED TEST COST 1I DOLLARS=
0VARIABLE TEST COST IN DOLLARS PER HOUR2
I?0
AVERASE COST IN DOLLARS FOR REPAIR OF DEFECT DETECTED AT THIS LEVELsI
0ASSEMBLY DEFECTS AT THIS LEVEL AS A FRACTION OF TOTAL PARTSwI
0
120
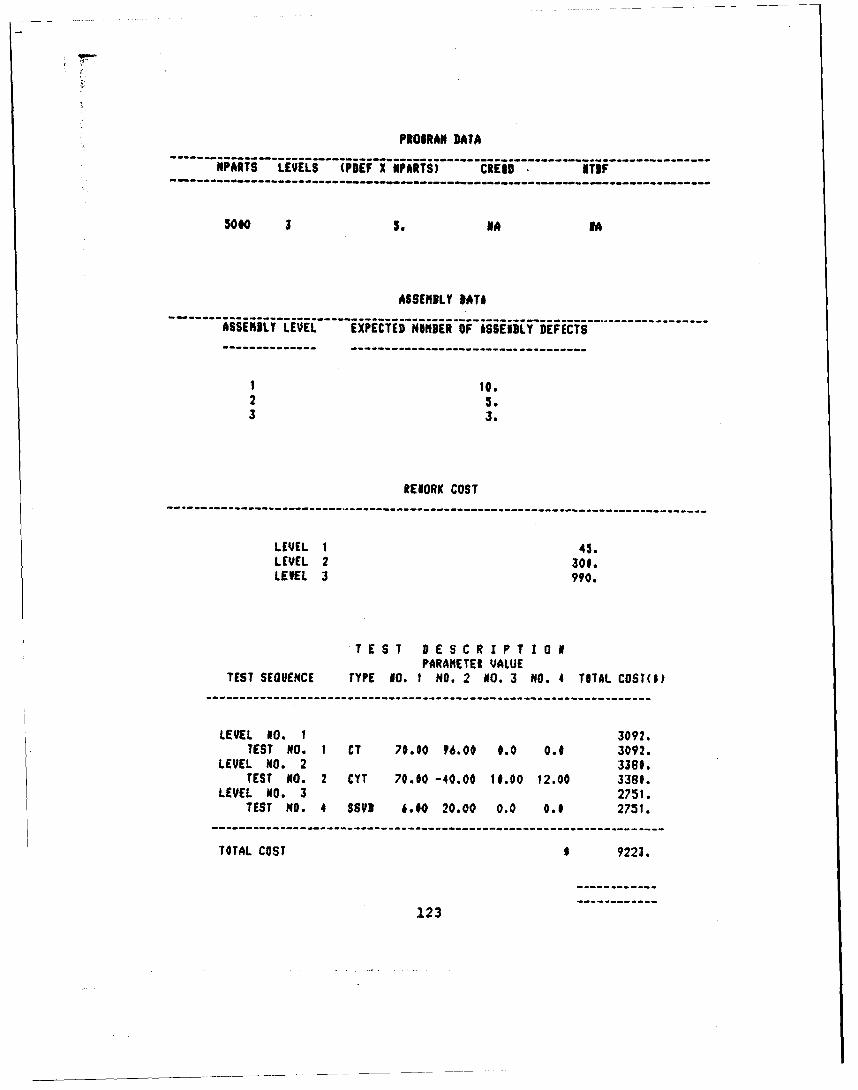
PROIRAM DATA
UPARTS LEVELS (PDEF X MPARTS) CRESS ITDF
5000 3 5. MA #A
ASSEMBLY DATA
ASSENDLY LEVEL EXPECTED NUMBER OF ASSENDLY DEFECTS
-------- ----------------------------------
1 10.2 5.3 3.
REHORK COST
-----------------------------------------------------------------
LEVEL 1 45.LEVEL 2 300.LEVEL 3 990.
TEST DESCR IPT I O0PARAMETER VALUE
TEST SEQUENCE TYPE M0. 1 NO. 2 NO. 3 NO. 4 TOTAL COST($)
LEVEL NO. 1 3092.TEST NO. I CT 70.00 ?6.00 0.0 0.0 3092.
LEVEL NO. 2 3380.TEST NO. 2 CYT 70.00 -40.00 10.00 12.00 3380.
LEVEL NO. 3 2751.TEST 00. 4 SSVY 6.00 20.00 0.0 0.0 2751.
TOTAL COST 6 9223.
123

**e*****LEVEL ]*****s*s
SIDE SEEP VIDRATION, LEVEL 3ENTER IN ORDER, SEPARATED BY COMMAS OR SPACESi9-LEVEL, TIME IN MIDs(0 LEVEL BETUEEN I AND 10)
620
ENTER THE FOLLOUING MANUFACTURING PROCESS DATA, LEVEL 3
IF MODEL DEFAULTS ARE DESIRFE' FOR ANY ITEM, EITER ZERO.
FIRED TEST COST I0 DOLLARS=
0VARIABLE TEST COST IN DOLLARS PER HOUR=
7
0AVERAGE COST IN DOLLARS FOR REPAIR OF DEFECT DETECTED AT TNIS LEVEL=
?0
ASSEMBLY DEFECTS AT THIS LEVEL AS A FRACTION OF TOTAL PARTS=?
0
IF YOU UISH A TABLE OF INPUTS ENTER 1, IF NOT, ENTER ZEROtI1
122

STRESS SCREENIN6 FLOU DIA6RAH
INCONING 1 : LEVEL I : LEVEL 2 : LEVEL 3 : : OUTGOING O----- w- -------- ------------ ------------ ------------:IPARTSi :ADEF= :ADEFa :ADEFx I :DEF P REM:!
5000! 10.1 5.: 1.:
:IBEFECTS: I TSx :TS= ITS= 1 :IEF U RE~sl5.; 0.314: 0.1891: 0.311: 4
1 DEF PASSED: IDEF PASSED: :DEF PASSED: NTBFsi 10.1: 5. 3 4.1 1555.1
V V y* I II I 4
EXPECTED 1 EXPECTED 1 : EXPECTEDFALLOUT: I FALLOUTt 1 FALLOUT# 1
PRY UKN TOY! I PRT UKH TOT: I PRT OKN TOTI1. 4. 5.1 2. 9. 11.1 1 0. 3. 3.1
1UPPR IND FOIR IIPPR DUD FOR! :UPPR IND FOR:lOBS FALLOUTtl :0S FALLIUTi: :OIS FALLOUT::
4 I 4
5. 10. 12.1: 7. 18. 21.1 1 0. 9. 9.1
:LOUR DID FOR: :LOUR IND FOR: :LOUR BND FOR::10S FALLOUT:: lODS FALLOUT:! 1OS FiLLOUTs:
0 0. 0. 0.1 0. 1. 2.1 0 . 0. 0.1
INTERVAL ITIF
TIME 1 ITIF
2000. 1 1564.4000. 1 1573.6000. : 1582.8000. 1 1591.
10000. 1 1599.12000. 1 1607.14000. 1 1615.16000. 1623.18000. 1i1630.20000. 1;1637.
125
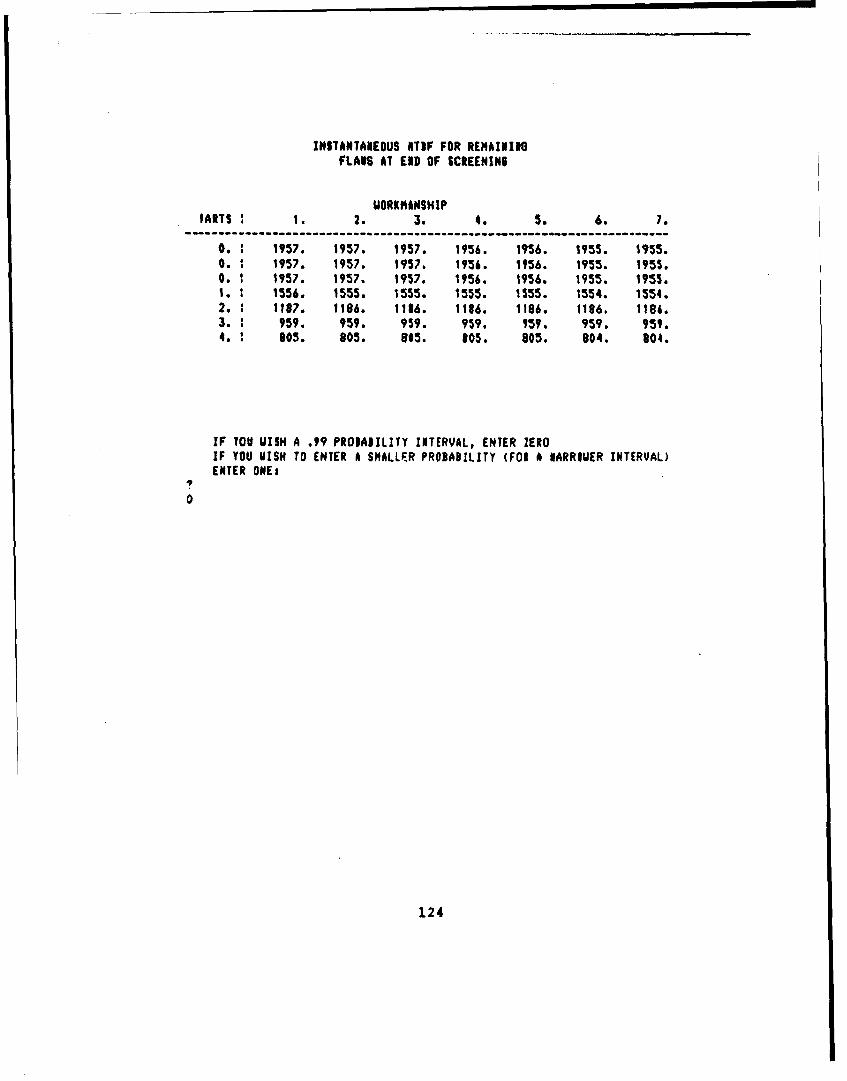
!NITANTANEOUS N7IF FOR REMAININGFLASS AT EID OF SCREENIN6
UORKMNASHIPtARTS 1. 2. 3. 4. 5. 6. 7.
0. 1957. 1957. 1957. 1956. 1956. 1955. 1955.0. 1957. 1957. 1957. 1956. 1956. 1955. 1955.0. 1957. 1957. 1957. 1956. 1956. 1955. 1955.1. 1556. 1555. 1555. 1555. 1555. 1554. 1554.2. 1187. 1186. 1116. 1186. 1186. 1186. 1186.3. 959. 959. 959. 959. 159. 959. 959.4. 805. 805. 805. 005. 805. 804. 804.
IF YOU UISH A .V9 PRODADILITY INTERVAL, ENTER ZEROIF YOU UISH TO ENTER A SNALLER PROBABILITY (FOE A PARRIUER INTERVAL)ENTER ONEs
0
124
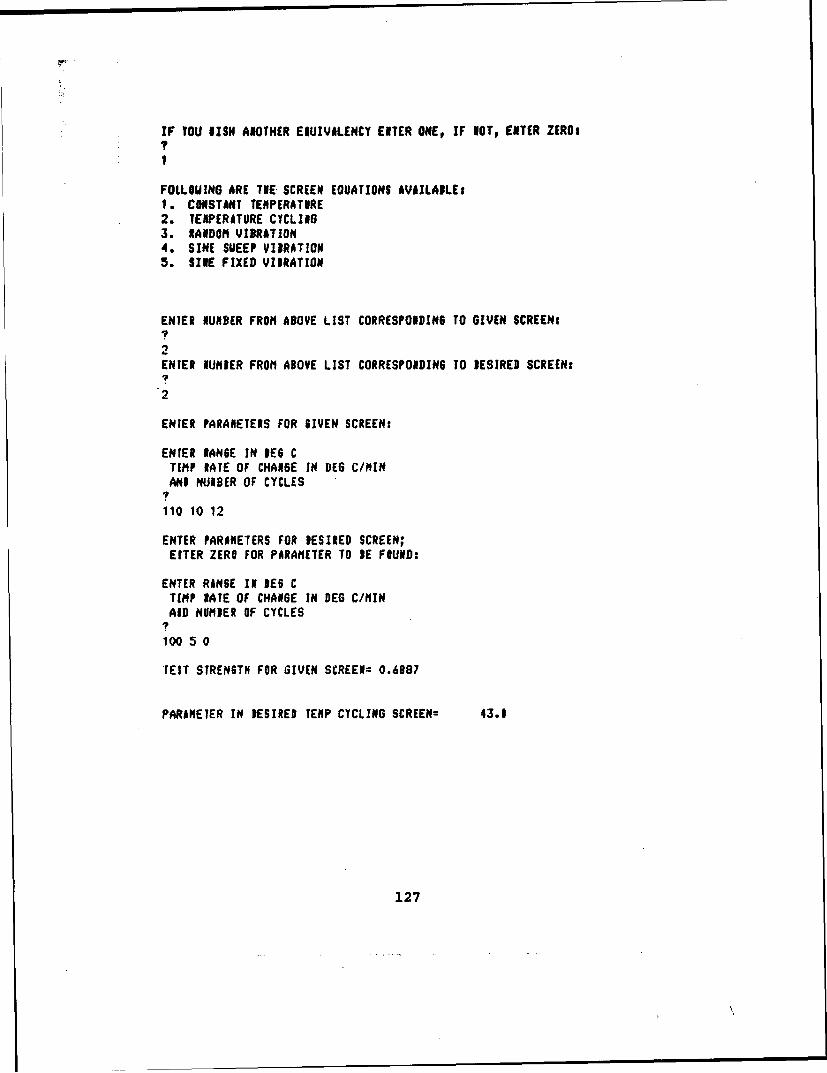
IF IOU DISH ANOTHER EIUIVALENCY ENTER ONEt IF NOT, ENTER ZEROSI1
FOLLOMING ARE TIE SCREEN EOUATIONS AVAILAILEs1. CONSTANT TEMPERATURE2. TENPERATURE CYCLING3. RANDOM VIBRATION4. SINE SUEEP VIBRATION5. SINE FIXED VIDRATION
ENTER NUMBER FROM ABOVE LIST CORRESPONDING TO GIVEN SCREEN:I
ENTER NUMIER FROM ABOVE LIST CORRESPONDING TO DESIRED SCREENS
2
ENTER PARAMETERS FOR IVEN SCREEN:
ENTER RANGE IN DES CTIMP RATE OF CHANGE 1N DEG C/MINAND NUINBER OF CYCLES
110 10 12
ENTER PARAMETERS FOR DESIRED SCREEN;EITER ZERO FOR PARAMETER TO BE FOUND:
ENTER RINSE IN BEG CTEMP RATE OF CHANGE IN DEG C/fINAID NUMBER OF CYCLES
100 5 0
TEST STRENGTH FOR GIVEN SCREEN= 0.6887
PARAMETER IN DESIRED TEMP CYCLING SCREEN= 43.1
127

IF YON HAVE FALLOIT DATA ENTER I1 IF NOT EITER ZERO%T
0IF YOU U1SH TO ANALYZE EQUIVALENT SCREENS ENTER ONE
IF NOT ENTER ZEROs
1
FOLLOUXIG ARE THE SCREEN EQUATIONS AVAILAILE,1. CONSTANT TEMPERATUNE2. TEWPERATURE CYCLING3. RAIDON VIBRATION4. SIDE SHEEP VIBRATION5. SINE FIXED VIBRATION
ENTER NUMBER FROM ABOVE LIST CORRESPOIDIN6 TO GIVEN SCREENI
1
ENTER NUMBER FROM ABOVE LIST CORRESPOIDING TO DESIRED SCREENs?
2
ENTER PARANETERS FOR lIVEN SCREENs
ENTER ABSOLUTE VALUE IF DIFFERENCE BETUEEN TEMP IN DEG C AID 25 PEI CAND TIME IN HOURS
45 96
ENTER PARAMETERS FOR DESIRED SCREEN;ENTER ZERO FOR PARAMETER TO DE FOIND:
ENTER RANKE IN BE$ CTIM? RATE OF CHANGE IN DEG C/NIHAND NUINER OF CYCLES
100 5 0
TEST STRENGTH FOR GIVEN SCREEN= 0.3143
PARAMETER IN DESIRED TEMP CYCLING SCREENs 3.4
126
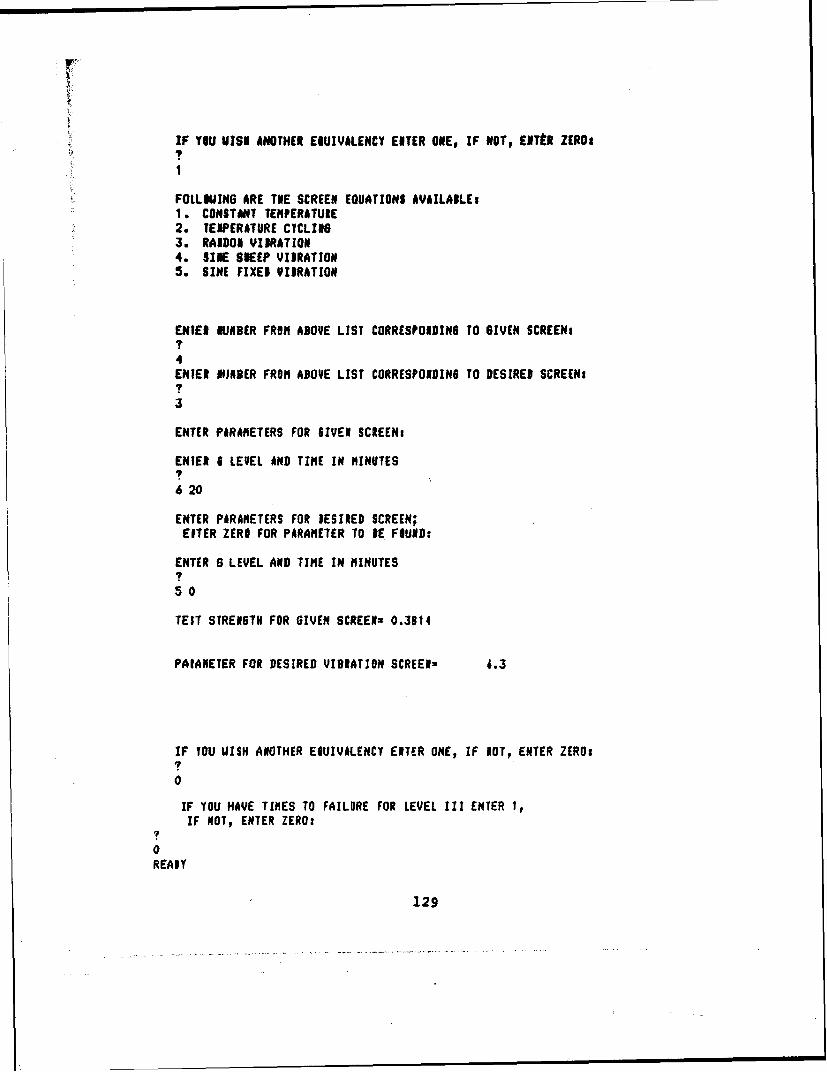
IF YOU VUSI ANOTHER £LU!VALENCY ENTER ONE, IF NOT, EITtR ZEROs
! 1
FOLLOWING ARE TIE SCREEN EQUATIONS AVAILAILEs1. CONSTANT TEMPERATURE2. TEIPERATURE CYCLING3. RAIDOS VYIRATION4. SINE SEEP VIBRATION5. SINE FIXED VIBRATION
ENIER NUNBER FROM ABOVE LIST CORRESPOIDINS TO GIVEN SCREENs?
4ENIER IIJNBER FROM ABOVE LIST CORRESPOIDIN6 TO DESIRED SCREEN:
3
ENTER PARAMETERS FOR lIVEN SCREEN:
ENTER 6 LEVEL AND TIME IN MINUTES7
620ENTER PARAMETERS FOR DESIRED SCREEN;
EITER ZERO FOR PARAMETER TO 1E FOUND:
ENTER 6 LEVEL AND TIME IN MINUTES
50
TEIT STRENGTH FOR GIVEN SCREENz 0.3014
PAIANETER FOR DESIRED VIBRATION SCREEN= 6.3
IF YOU UISH ANOTHER ElUIVALENCY ENTER ONE, IF NOT, ENTER ZEROs
0
IF YOU HAVE TIMES TO FAILURE FOR LEVEL III ENTER 1,IF NOT, ENTER ZERO:
0READY
129

IF IOU OISN ANOTHER EIUIVALENCY ENTER ONE, IF lOT, ENTER ZERO:?
FOLLOWING ARE THE SCREEN EQUATIONS AVAILAILEs1. CONSTANT TEMPERATURE2. TEMPERATURE CYCLING3. RANDOM VIBRATION4. SINE SVEEP VIIRATION5. SINE FIXED VISRATION
ENTER IUNBER FROM ABOVE LIST CORRESPONDING TO GIVEN SCREEN$
4ENTER NUMIER FROM ABOVIE LIST CORRESPONDING TO DESIRED SCREEN:
3
ENTER PARANETERS FOR 6IEN SCREENs
ENTER I LEVEL AND TIME IN MINUTES
6 20
ENTER PARANETERS FOR DESIRED SCREEN;EITER ZERO FOR PARAMETER TO DE FOUND:
ENTER 6 LEVEL AND TIME IN MINUTES
0 15
TEST STIEN6TH FOR GIVEN SCREEN= 0.3814SOlUTION CANNOT PE FOUND BY INTERNAL NETHOD.
TRY A GRID OF POSSIBLE SOLUTIONS.
128
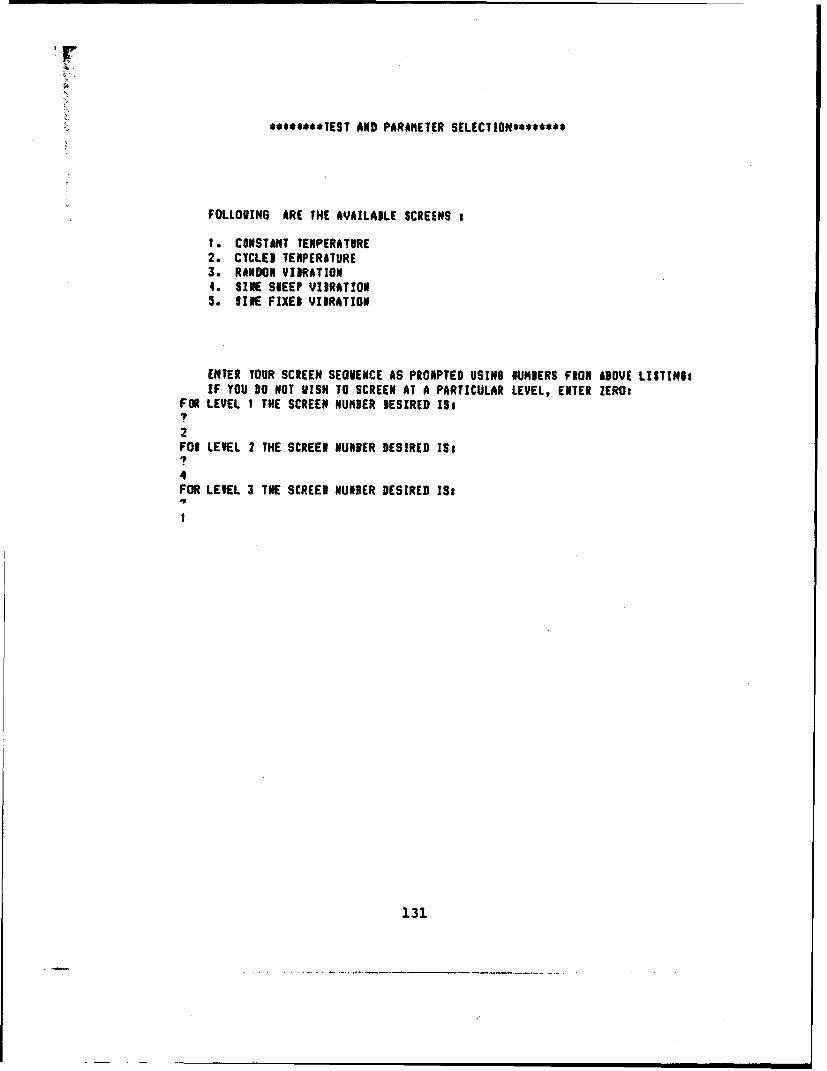
**$****s*TEST AND PARAMETER SELECTION$e******
FOLLOVING ARE THE AVAILABLE SCREENS
1. CONSTANT TENPERATURE2. CYCLED TEMPERATURE3. RANDOM VIBRATION4. SINE SVEEP VIBRATION3. SINE FIXED VIBRATION
ENTER YOUR SCREEN SEOUENCE AS PRONPTED USING NUNDERS FRON iBOVE LISTINg!IF YOU DO NOT VISH TO SCREEN AT A PARTICULAR LEVEL, ENTER ZEROt
FOR LEVEL I THE SCREEN NUMBER DESIRED JStI
2FOI LEVEL 2 THE SCREEN NUNBER DESIRED ISt74FOR LEVEL 3 TNE SCREEN NUMBER DESIRED 1S3
1
131
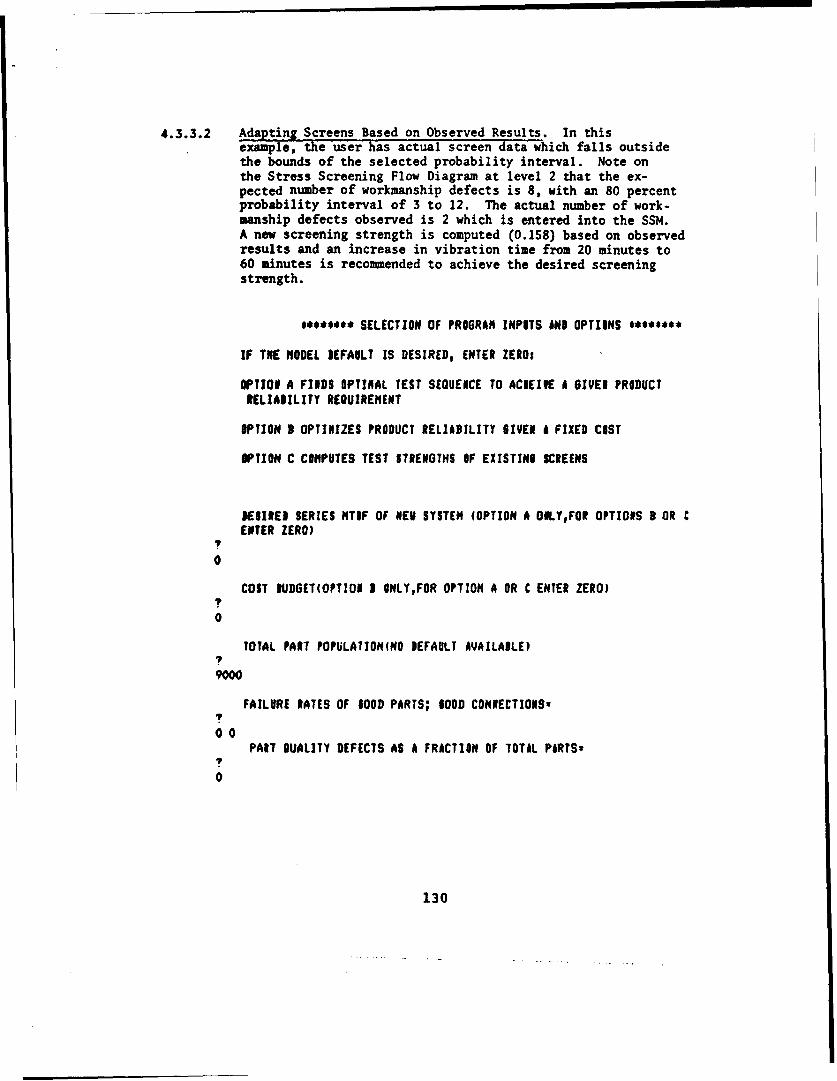
4.3.3.2 Adapting Screens Based on Observed Results. In thisexample, the user has actual screen data which falls outsidethe bounds of the selected probability interval. Note onthe Stress Screening Flow Diagram at level 2 that the ex-pected number of workmanship defects is 8, with an 80 percentprobability interval of 3 to 12. The actual number of work-manship defects observed is 2 which is entered into the SSM.A new screening strength is computed (O.158) based on observedresults and an increase in vibration time from 20 minutes to60 minutes is recommended to achieve the desired screeningstrength.
$****'** SELECTION OF PROGRAM INPITS $0B OPTIONS **.***
IF TNE MODEL DEFAULT IS DESIRED, ENTER ZERO:
OPTION A FINDS OPTIMAL TEST SEOUEICE TO ACIEISE A GIVEI PRODUCTRELIABILITY REQUIREMENT
OPTION 3 OPTINIZES PRODUCT RELIABILITY 6IVEN A FIXED COST
OPTION C COMPUTES TEST STRENGTHS OF EXISTINg SCREENS
DESIREI SERIES MTIF OF NEU SYSTEM (OPTION A OILYrFOR OPTIONS B OR CENTER ZERO)
0
COST IUDGET(OPTION I ONLY,FOR OPTION A OR C ENTER ZERO)?
0
TOTAL PART POPULATION(NO DEFAULT AVAILABLE)
9000
FAILURE RATES OF 1OOD PARTS; IOOD CONIECTIONS-?
00PART DUALITY DEFECTS AS A FRACTION OF TOTAL PiRTSa
0
130
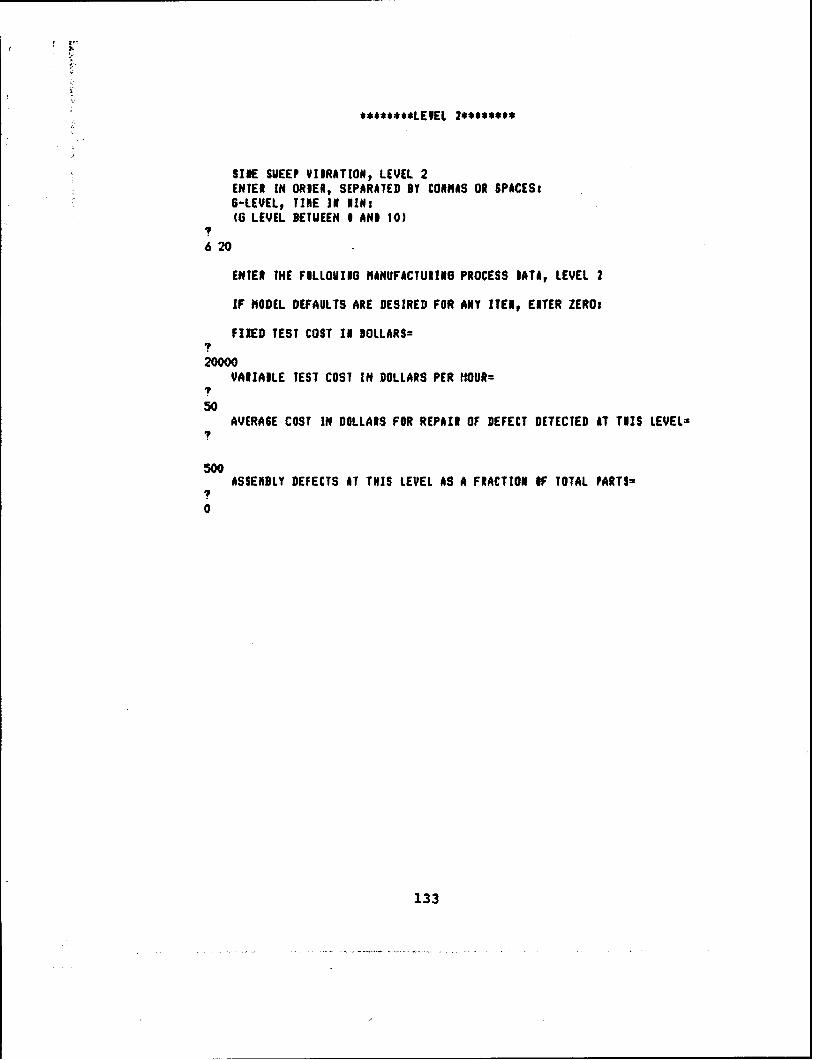
******$*LEVEL 2********
SIDE SEEP VIDRATION, LEVEL 2ENTER IN ORDER, SEPARATED BY COMMAS OR SPACES:6-LEVEL, TINE IN KIN:(6 LEVEL BETUEEN I AND 10)
620
ENTER THE FILLOVING MANUFACTURING PROCESS DATA, LEVEL 2
IF MODEL DEFAULTS ARE DESIRED FOR ANY ITEm, ENTER ZERO:
FIXED TEST COST 11 DOLLARS=
20000VAIIADLE TEST COST IN DOLLARS PER HOUR=
?
50AVERASE COST IN DOLLARS FOR REPAIR OF DEFECT DETECTED AT THIS LEVEL=
500ASSENDLY DEFECTS AT TNIS LEVEL AS A FRACTION IF TOTAL PARTS=
?
0
133
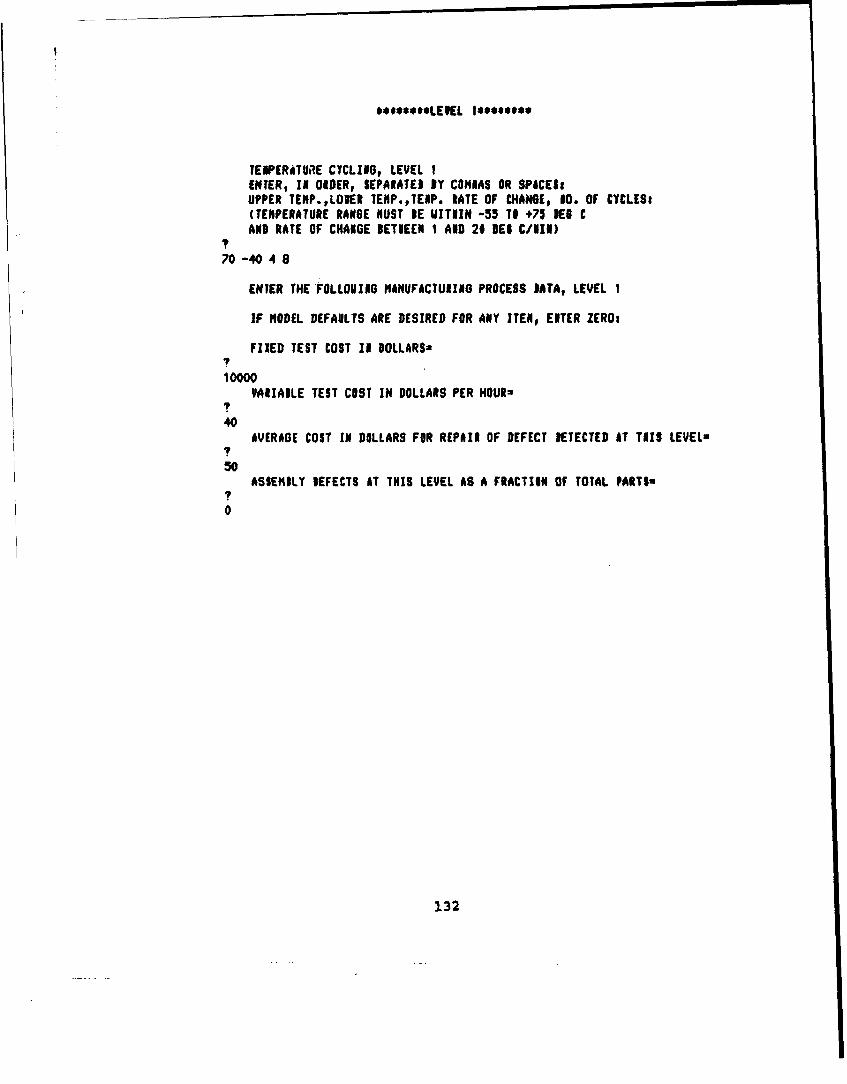
*.e..ILEEL I***$****
TEIPERATUiE CYCLIEG, LEVEL 1ENTER, IN ORDER, SEPARATED BY CONIAS OR SPiCESIUPPER TENP.,LOIER IEMP.,TENP. RATE OF CHANGE, IO. OF CYCLES#(TENPERATURE RANGE MUST DE UITIIN -55 TI +73 DES CAND RATE OF CHANGE DETNEEN I AID 2f BE$ C/ll)
70 -40 4 8
ENTER THE FOLLOUING NANUFACTUIRINO PROCESS DATA, LEVEL I
IF NODEL DEFAULTS ARE DESIRED FOR ANY ITENg ENTER ZERO:
FIIED TEST COST It DOLLARS-
10000VARIAILE TEST COST IN DOLLARS PER HOUR.
40AVERAGE COST IN DOLLARS FOR REPAIR OF DEFECT DETECTED AT TtIS LEVELm
7
50ASSEMILY DEFECTS AT THIS LEVEL AS A FRACTIIN OF TOTAL PARTS=
I
0
132
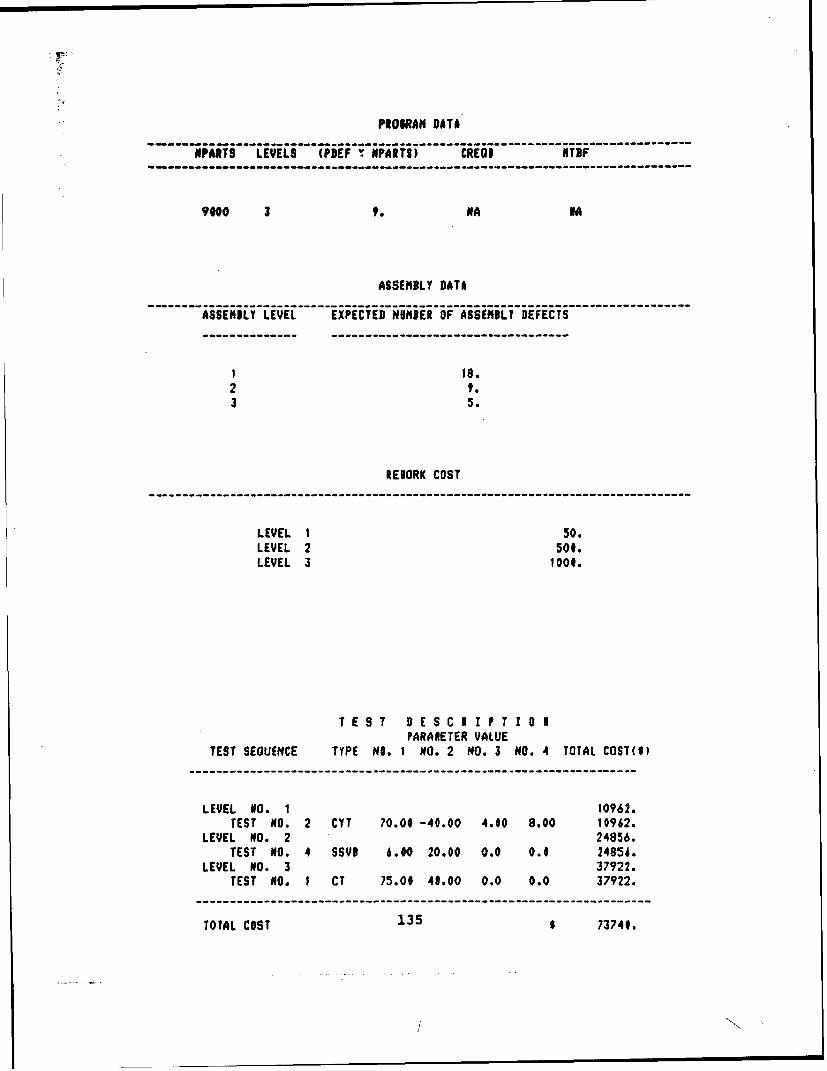
PROIRAM DATA
NIPARTS LEVELS (PDEF I NPARTS) CREQI ATIF
900 3 9. NA 1A
ASSEMBLY DATA
ASSEMBLY LEVEL EXPECTED NUMBER OF ASSEMIOLY DEFECTS
1 18.
2 1.3 5,
REDORK COST
LEVEL 1 50.LEVEL 2 500.LEVEL 3 1000.
TEST DESCI I PT 1 IPARANETER VALUE
TEST SEOUENCE TYPE NO. I NO. 2 NO. 3 NO. 4 TOTAL COST(S)
LEVEL NO. 1 10962.TEST NO. 2 CYT 70.00 -40.00 4.00 8.00 10962.
LEVEL NO. 2 24856.TEST NO. 4 SSVD 6.00 20.00 0.0 0.0 24854.
LEVEL NO. 3 37922.TEST NO. I CT 75.00 41.00 0.0 0.0 37922.
TOTAL COST 135 S 7374#.
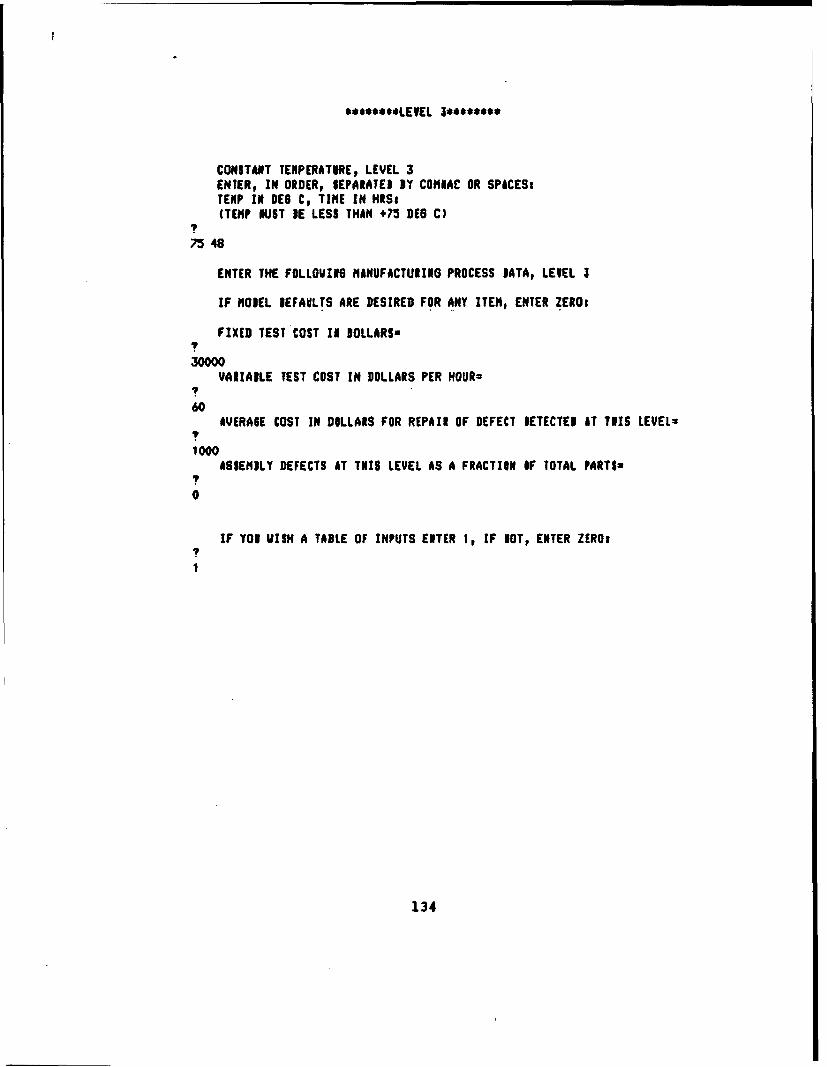
**e***$*LEVEL 3********
CONSTANT TEAPERATIREp LEVEL 3ENTER, IN ORDER, SEPARATES BY CONIAC OR SPACES.TEMP IN DES C, TIME IN HRS#(TEIP OUST DE LESS THAN +75 DEG C)
73 48
ENTER THE FOLLOVYIM NANUFACTURINO PROCESS IATA, LEVEL 3
IF NOBEL DEFAULTS ARE DESIRED FOR ANY ITENt ENTER ZEROt
FIXED TEST COST IN DOLLARS=
30000VARIABLE TEST COST IN DOLLARS PER HOURU
60AVERA6E COST IN DOLLARS FOR REPAIR OF DEFECT IETECTED AT TEIS LEVEL=
1000ASSEMBLY DEFECTS AT TNIS LEVEL AS A FRACTION OF TOTAL PARTS*
0
IF YOU VISH A TABLE OF INPUTS ENTER Ip IF lOT, ENTER ZEROi
1
134
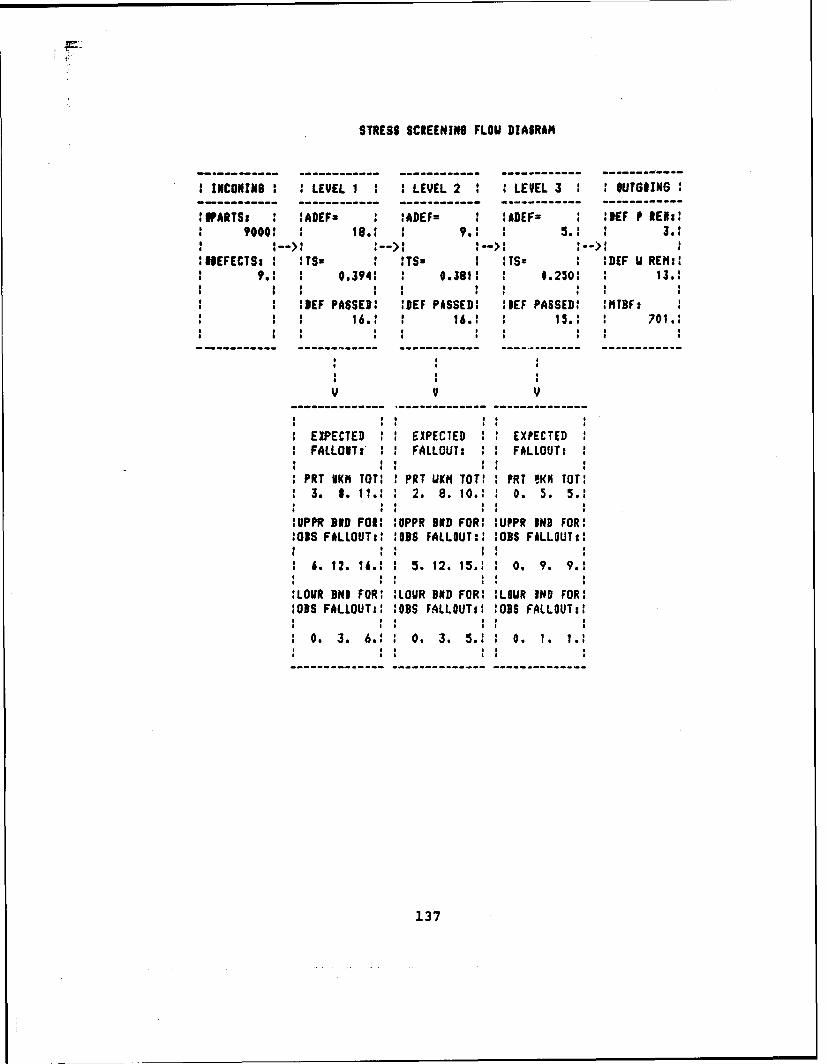
STRESS SCREENING FLOU DIAGRAM
--- ---------- ---------------------
INCONINS 1 LEVEL I : 1 LEVEL 2 : LEVEL 3 : OUTGOING------ ------ --------------------------------------
IIPARTSt 1ADEF- I IADEF= I IADEF= :IEF P REWI9000: 18.1 9.: 5. I 3.:
IIEFECTSi I ITSz :TS= 1 :Tsz :DEF U REMil9.1 I 0.3941 : 0.3811 1.250 1 13.:
1 a a, *1 1 1 01
:DEF PASSED: !DEF PASSED: IEF PASSED: :MTBF:S*6.! * 16.1 1 15. : 701.:
* a I
V V V
EXPECTED I EXPECTED EXPECTEDFALLOUT: I FALLOUT: FALLOUT:
PRT VKM TOT: PRT UKN TOT! 1 PRT IKH TOT:3. 1. 11.: 2. 8. 10.:' 0. 5. 5.1
1UPPR DID FOR: UPPR BID FOR! :UPPR IND FOR::MIS FALLOUTi: :8DS FALLOUT:: :OBS FILLOUT:
A 6. 12. 16.: I 5. 12. 15.11 0. 9. 9.!
:LOUR BNO FOR: :LOUR BID FOR: !LOUR IND FOR::OBS FALLOUT:: :OBS FALLOUTi :OBS FALLOUT::
0 0. 3. 6.: 0 0. 3. 5.1: 0. 1. 1.:
137
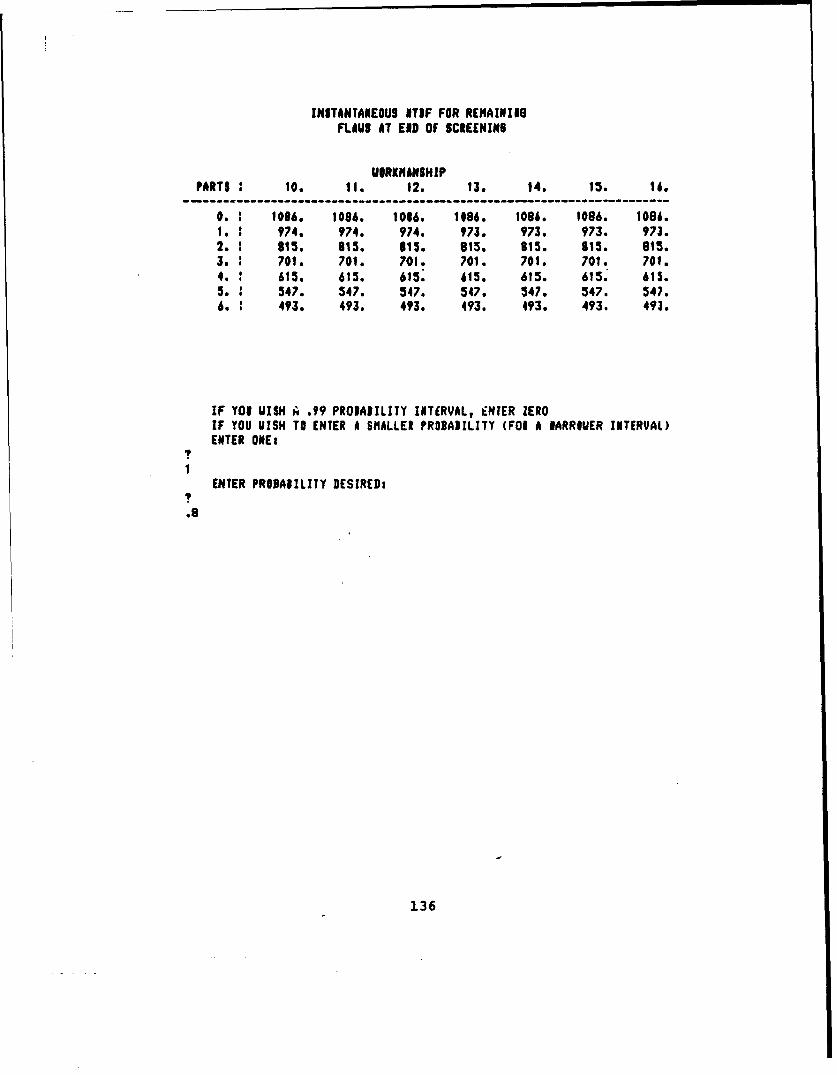
INSTANTANEOUS ITIF FOR RENAININGFLAUiS AT EID OF SCREENINS
UORKMANSHIPPARTS 10. it. 12. 13. 14. 15. 1i.
0. : 1086. 1086. 1086. 1#86. 1086. 1086. 1086.1. : 974. 974. 974. 973. 973. 973. 973.2. 115. 815. 815. 815. 815. 815. 815.3. 701. 701. 701. 701. 701. 701. 701.4. 615. 615. 615. 615. 615. 615. 615.5. 547. 547. 547. 547. 547. 547. 547.6. 493. 493. 493. 493. 493. 493. 493.
IF YOU UISH A .99 PROIADILITY INTERVAL, ENTER ZEROIF YOU VISH TO ENTER A SMALLER PROBAPILITY (FOR A IARROUER INTERVAL)ENTER ONEi
1
ENTER PR@BAIILITY DESIRED:
.8
136
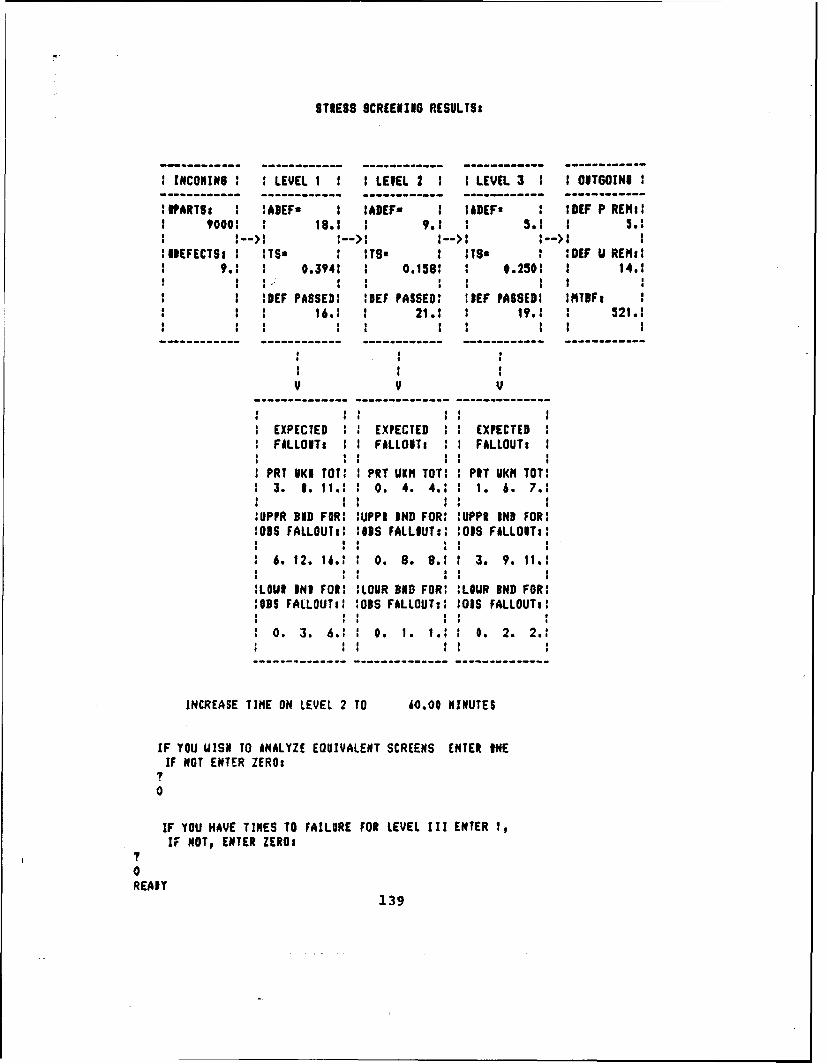
STRESS SCREENING RESULTS:
----------- ------------ ------------ ------------INCONINS : LEVEL 11 1 LEVEL 2 1 1 LEVEL 3 : I OITGOINU 1
:WARTSs !ADEF- S IADEF- 1 IADEFs : D[F P REM:?i 90001 18.1 1 5.9
,->,I'-.* I--)I a--)l
IIEFECTSt I MTS lTSz ITS. IDIF U REM:l9.1 0.3941 0.158; 1.250 14.1
1 IDEF PASSED: 1DEF PASSED: 3IEF PASSED: ISMTDF16. i 21.1 19.1 521.1
EXPECTED 1 EXPECTE EXPECTED 1
FALLONTo FALLOVTi FALLOUTi
1PRI VKi TOT:S PRT UKMl TOT! PIT UKM TOT!3. 1. 11.1 O . 4. 4.: 1 . 6. 7.'1
;UPPR BOB FOR: IUPPI IND FOR: UPPR IND FOR!:OBS FALLOUTI !IDS FALLOUTt: OIS F&LLOITo:
S 6. 12. 16.: 0 . 8. S.: 3. 9. 11..1 : 4
1LOUI IMP FOR: :LOUR 8ND FOR: :LOUR IND FOR!:IBS FALLOUTi: lOS FALLOUT:! 101S FALLOUTol
I I a
0. 3. 6.1 a . 1. a. 0. 2. 2.a'SF : 1 L
INCREASE TIME ON LEVEL 2 TO U0.00 INUTES
IF YOU UISN TO ANALYZE EQUIVALENT SCREENS ENTER ONEIF NOT ENTER ZERO:
0
IF YOU HAE TIMES TOI FOR: OR LEVEL I UI ENTER OR
IF MOTv ENTER ZEROs?0REAIY
139

INTERVAL ITIF
---------------TINE I ITIF
------- ft-------f2000. I 709.4000. : 717.6000. ! 725.8000. ! 733.
10000. 1 740.12CO0. 1 748.14000. 1 755.16000. 1 762.18000. ! 769.200100. 776.
IF YOU HAVE FALLOUT DATA ENTER 1, IF NOT ELTER ZERO:I1
IF YOU HAVE SEPARATE FALLOUT FOR PARTS AND VORINANIHIP ENTER ONEIF YOU HAVE TOTAL FALLOUT ONLY AT EACH LEVEL, ENTER ZERO:
1
ENTER, 1N ORDER, ACTUAL FALLOUTtSUE TI (A) PARTS (3) UOIKNAISHIP, AS PROIPTEDoFOR LEVEL It
T
37FOR LEVEL 23
22FOR LEVEL 3.
T
06
138
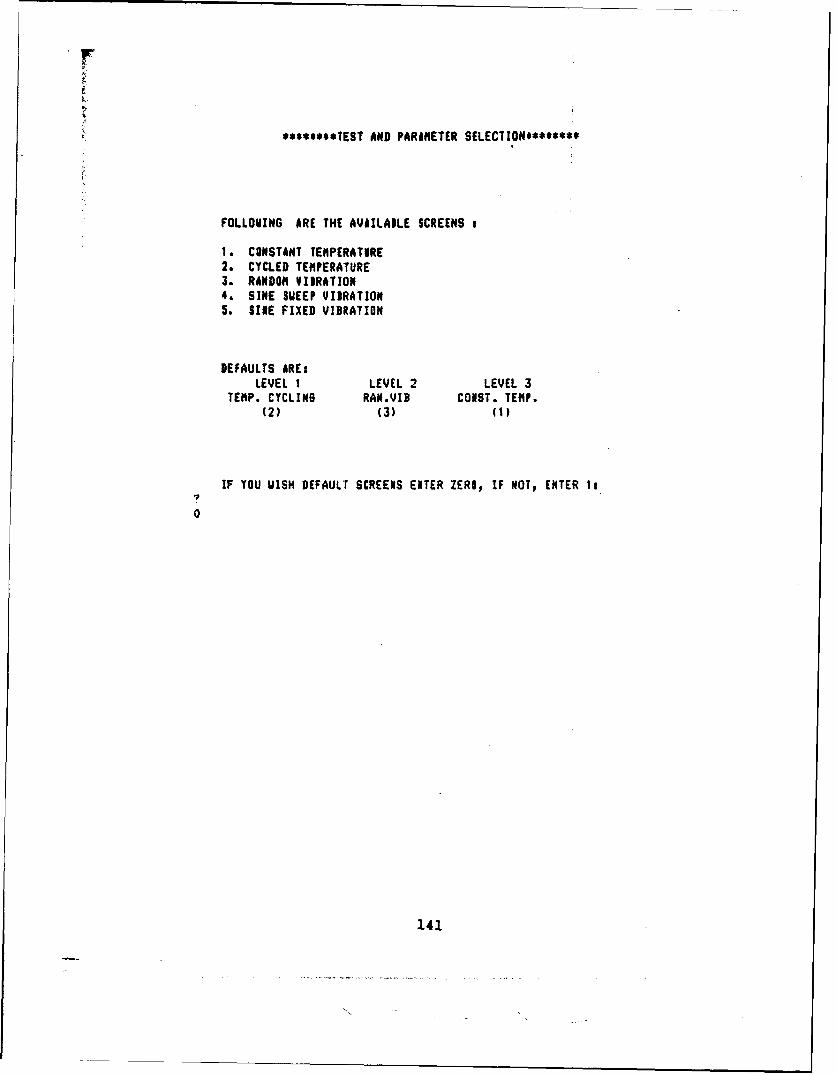
r
****$***TEST AND PARIMETER SELECTION********
FOLLOVING ARE THE AVAILABLE SCREENS I
1. CONSTANT TENPERATURE2. CYCLED TEMPERATURE3. RANDOM VIBRATION4. SINE SUEEP VIBRATION5. SINE FIXED VIBRATION
DEFAULTS ARE:LEVEL I LEVEL 2 LEVEL 3
TENP. CYCLING RAN.VID COIST. TEMP.(2) (3) (1)
IF YOU UISH DEFAULT SCREENS ENTER ZERO, IF NOT, ENTER 1:
0
141
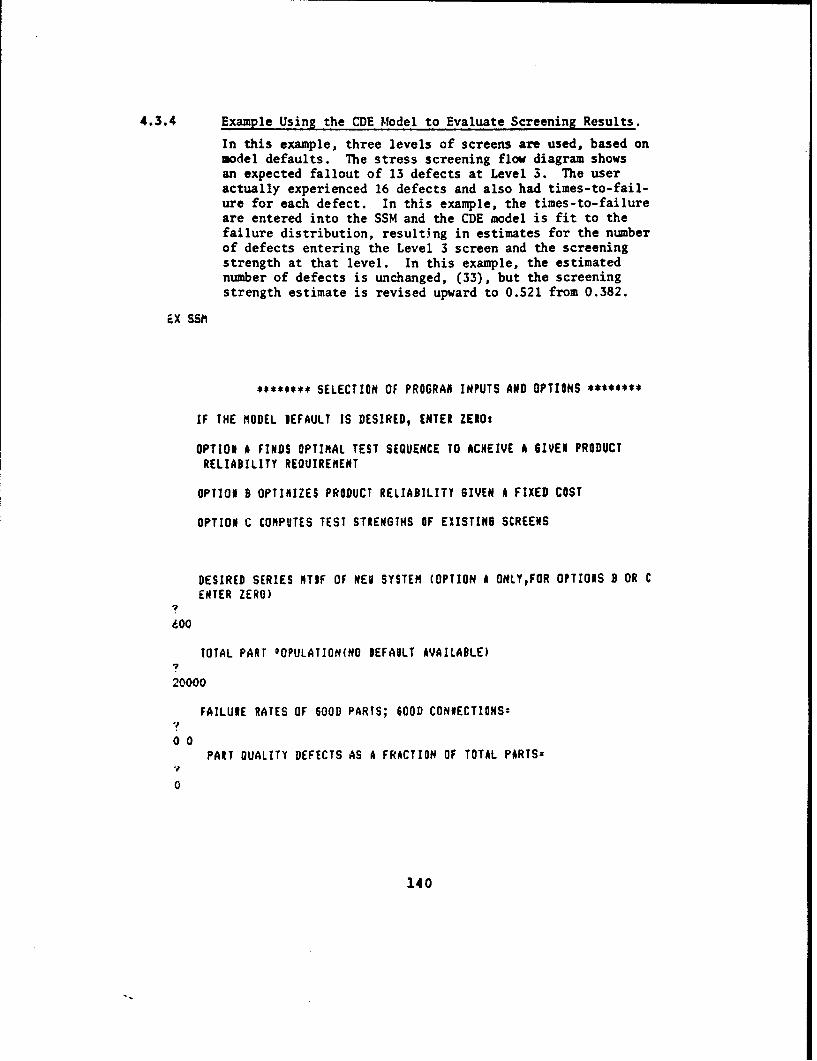
4.3.4 Example Using the CDE Model to Evaluate Screening Results.
In this example, three levels of screens are used, based onmodel defaults. The stress screening flow diagram showsan expected fallout of 13 defects at Level 3. The useractually experienced 16 defects and also had times-to-fail-ure for each defect. In this example, the times-to-failureare entered into the SSM and the CDE model is fit to thefailure distribution, resulting in estimates for the numberof defects entering the Level 3 screen and the screeningstrength at that level. In this example, the estimatednumber of defects is unchanged, (33), but the screeningstrength estimate is revised upward to 0.521 from 0.382.
EX SSA
s***.*** SELECTION OF PROGRAN INPUTS AND OPTIONS ***'***
IF THE MODEL DEFAULT IS DESIRED, ENTER ZEROs
OPTION A FINDS OPTIMAL TEST SEQUENCE TO ACHEIVE A GIVEN PRODUCTRELIABILITY REQUIREMENT
OPTION B OPTIRIZES PRODUCT RELIABILITY GIVEN A FIXED COST
OPTION C COMPUTES TEST STRENGTHS OF EXISTING SCREENS
DESIRED SERIES NTIF OF NEV SYSTEM (OPTION A ONLYFOR OPTIONS B OR CENTER ZERO)
600
TOTAL PART OOPULATION(NO DEFAULT AVAILABLE)
20000
FAILURE RATES OF 600D PARTS; 600D CONNECTIONSs
PART QUALITY DEFECTS AS A FRACTION OF TOTAL PARTS=
0
140

**$***$*LEVEL 2***s***s
RAIDON VIIRATION, LEVEL 2THE DEFAULT VALUES ARE:S-LEVEL=6 6RAISE OF TINE TO IE IMVESTISAIED=O TO 10 NIN.IF YOU VISH THE DEFAULT VALUE EWTER ZERO, IF NOT, ENTER 1:
0
ENTER THE FOLLOVINO MANUFACTURING PROCESS DATA, LEVEL 2
IF MODEL DEFAULTS ARE DESIRED FOR ANY ITEM, ENTER ZEROs
FIXED TEST COST II DOLLARS:
30000VARIAILE TEST COST IN DOLLARS PER HOUR=
0AVERAGE COST IN DOLLARS FOR REPAIR OF DEFECT DETECTED AT THIS LEVEL=
0ASSENILY DEFECTS AT THIS LEVEL AS A FRACTION OF TOTAL PARTS=
?
0
143

******$*LEVEL I**...**
TEIPEIATURE CICLIIG, LEVEL ITHE DEFAULT VALUES ARE:LOVER TENP=-54 DES CUPPER TEMP=7? DEG CTENP. RATE OF CHAIGEz5 DES C/lINRANGE IF CYCLES TO DE INVESTIGATEDxO TO 20IF YOU VISH THE DEFAULT VALUES ENTER ZERO, IF NOTj ENTER I:
T
0
ENTER THE FOLLOUJIG NANUFACTURING PROCESS DATA, LEVEL I
IF MODEL DEFAULTS ARE DESIRED FOR ANY ITEM, ENTER ZERO:
FIXED TEST COST 1i DOLLARS=I
20000VARIABLE TEST COST IN DOLLARS PER HOUR=
0AVERA6E COST IN DOLLARS FOR REPAIR OF DEFECT DETECTED AT TNIb LEVEL2
70
ASSEMILY DEFECTS AT THIS LEVEL Aj A FRACTION OF TOTAL PARTS=
"0
142
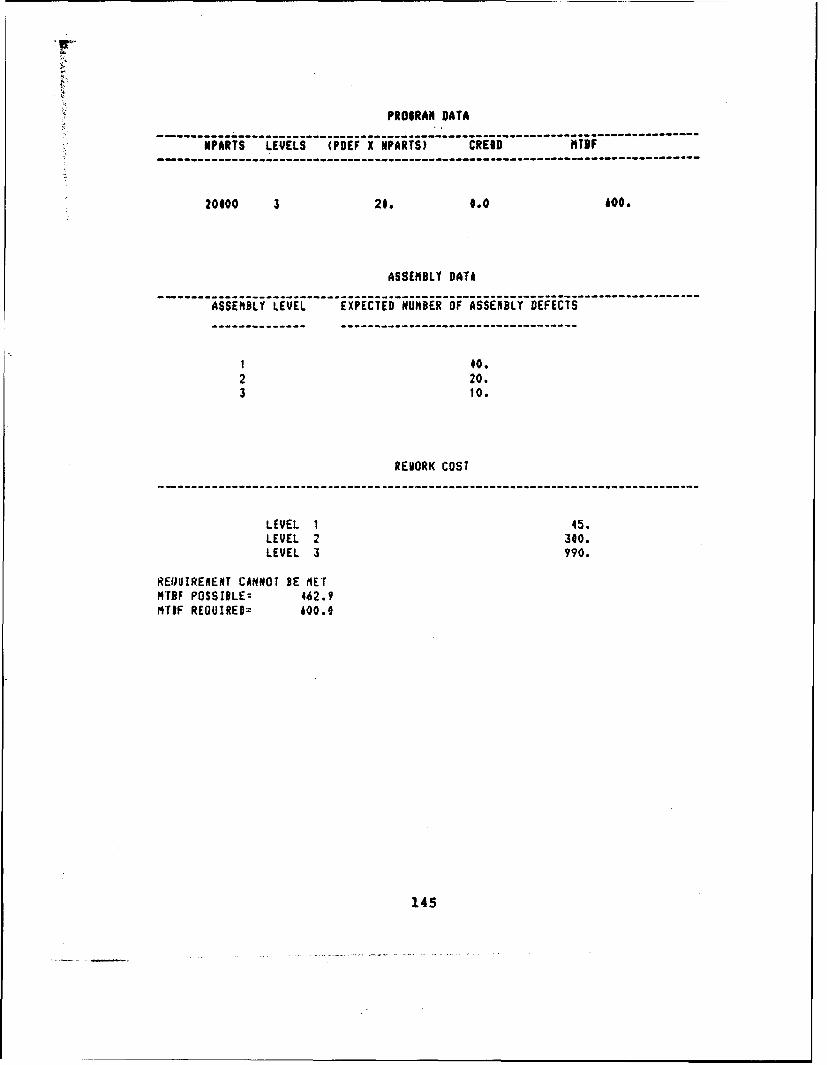
PROIRAN DATA
---PARTS LEVELS (P-EF X NPARTS) CRE-D i --F
-----------------------------------------------------------------
20000 3 20. 0.0 600.
ASSEMBLY DATA
ASSEMBLY LEVEL EXPECTED NUMBER OF ASSEIBLY DEFECTSIlii--il-lilil--------------------l
1 40.2 20.3 10.
REHORK COST- - -- --- ---- --- ---- -- - -- - -- - -- - ------i- -----------------------lli ~ ll I~l il---
LEVEL 1 45.LEVEL 2 300.LEVEL 3 990.
REUVIRERENT CANNOT BE METMTBF POSSIBLE: 462.9MTIF REOUIRED= 600.0
145
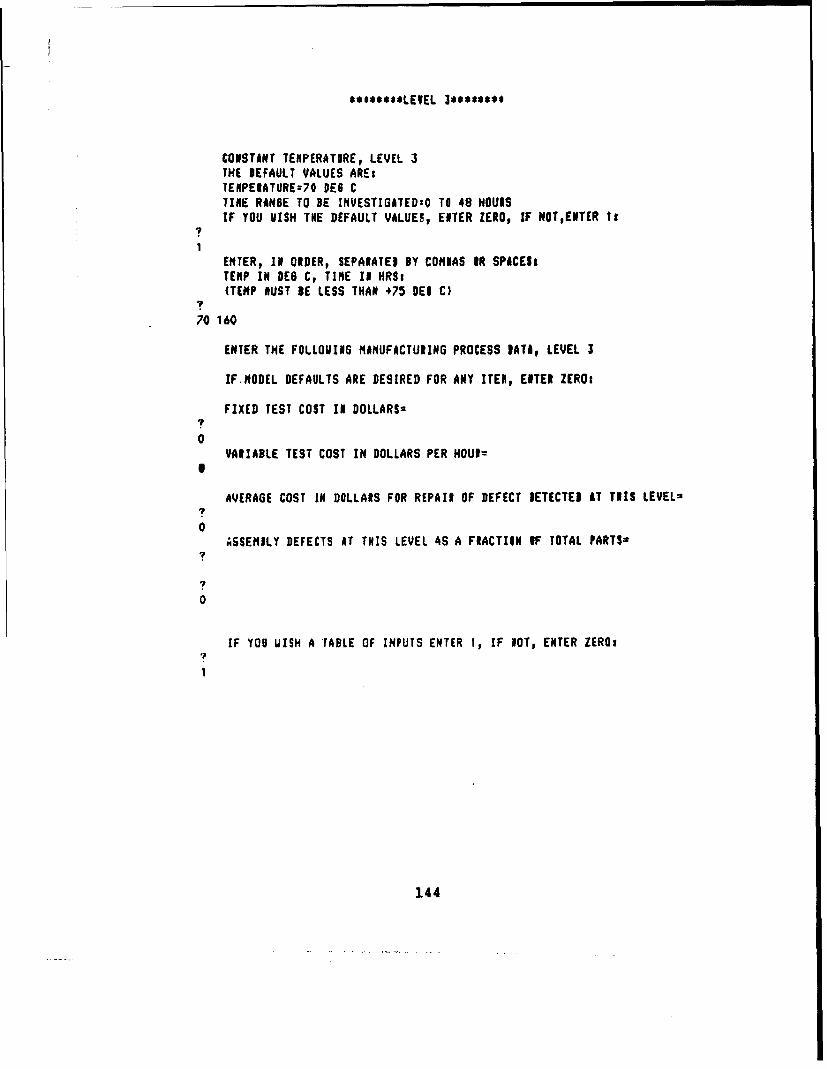
**$***$*LEVEL 3*******,
CONSTINT TENPERATURE, LEVEL 3THE DEFAULT VALUES ARE:TENPEIATUREz70 DES CTINE RAN6E TO BE IMVESTIGATED:0 TO 48 HOUlSIF YOU VISH THE DEFAULT VALUES, ENTER ZERO, IF NOTgENTER Is
I
1
ENTER, IN ORDER, SEPARATED BY CONIAS OR SPICES.TEMP IN DE6 C, TIME IN HRSi(TENP BUST DE LESS THAN +75 DES C)
70 160
ENTER THE FOLLOVING MANUFACTURING PROCESS IATA, LEVEL I
IF.NODEL DEFAULTS ARE DESIRED FOR ANY ITEM, ENTER ZERO.
FIXED TEST COST 11 DOLLARS=I
0VARIABLE TEST COST IN DOLLARS PER HOUR=
S
AVERAGE COST IN DOLLARS FOR REPAIR OF DEFECT IETECTED AT TUIS LEVEL=
0ASSENILY DEFECTS AT THIS LEVEL 4S A FRACTION OF TOTAL PARTS=
7
0
IF YOU UISH A TABLE OF INPUTS ENTER I, IF NOT, ENTER ZERO,1
1
144
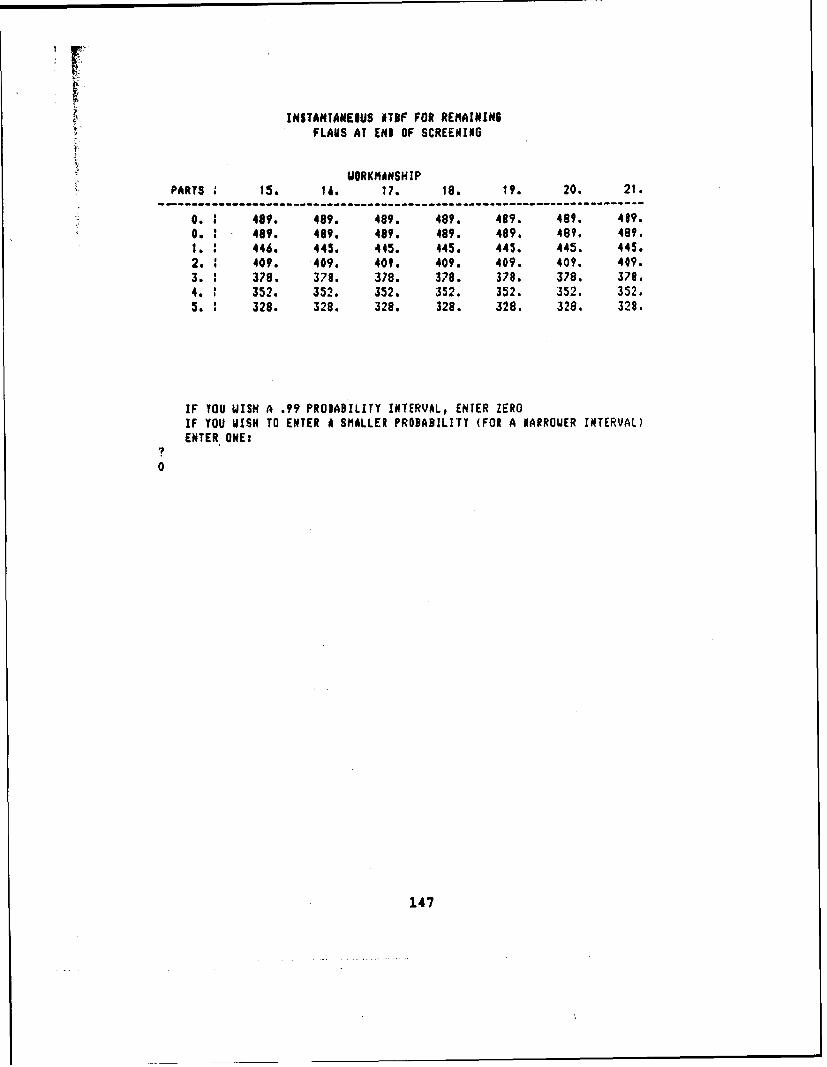
INSTANTANEOUS ITIF FOR REMAININIFLAUS AT END OF SCREENING
UORKMANSHIPPARTS 15. 14. 17. 18. 19. 20. 21.
-----------------------------------------------------------------------
0. : 489. 489. 489. 489. 489. 489. 489.0. 489. 489. 489. 489. 489. 489. 489.1. : 446. 445. 445. 445. 445. 445. 445.2. 409. 409. 40f. 409. 409. 409. 409.3. 378. 378. 378. 378. 378. 378. 378.4. 352. 352. 352. 352. 352. 352. 3524.5. 328. 328. 328. 328. 328. 328. 328.
IF YOU UISH A .99 PRODABILITY INTERVAL, ENTER ZEROIF YOU UISH TO ENTER A SMALLER PROBABILITY (FOR A NARROUER INTERVAL)ENTER ONE:
0
147

w
T TEST DESCRIPT IOPARANETEE VALUE
TEST SEQUENCE TYPE NO. 1 10. 2 NO. 3 00. 4 TOTAL COST($)
LEVEL NO. 1 22371.TEST NO. 2 CYT 71.00 -54.00 5.00 20.00 22371.
LEVEL NO. 2 36011.TEST NO. 3 RYIS 6.00 7.50 0.0 0.6 36031.
LEVEL NO. 3 17283.TEST NO. I CT 70.60 160.00 9.0 0.0 17283.
TOTAL COST 1 75614.
146

uITER1AL ITOF
TIME ITPF
2000. 393.4000. 395.6000. 397.8000. 399.
10000. 401.12000. 403.14000. 404.16000. 406.18000. 407.20000. 409.
149

STRESS SCREENING FLOU IIAIRAN
INCOMIN6 : : LEVEL 1 : : LEVEL 2 : ; LEVEL 3 : : OUTIOINI
:IPARTSi : :ADEF= :ADEF= :iDEFz :DEF P REM:20000: : 40.: 20.: : i.: * 3.:
:#DEFECTS: :TS= :TS: : :TS= fIEF V REM::20.: 0.615: 0.466: 2 0.312: : Is.:
:DEF PASSED: :DEF PASSED: :DEF PASSED: :MTDF:23.: 23.: : 20.: : 392.:
* IS I
* S I
V V V
EXPECTED : EXPECTED : EXPECTEDFALLOUT: : FALLOUT: : FALLOUT:
PRT UKM Tor: PRI UKN TOT: PRT UKM TOT:12. 25. 37.: 3. 17. 20.: 1. 12. 13.:
: ! I s
:UPPR DND FOR: :UPPR DMI FOR: :UPPR IND FOR::OBS FALLOUT:: :O2S FALLOUT:: :DS FALLOUT::
23. 40. 55.: 9. 30. 33.: 5. 22. 24.:I, : 01
:LOUR ODN FOR: :LOUI BDI FO: :LOUR IND FOR::095 FALLOUTt: :CBS FALLOUT:: :0BS FALLOUT::
3. 12. 21.: 0. 6. 9.: 0. 3. 4.:
148

REFERENCES
1. R. E. Schafer, L. E. James, et al. "ElectronicEquipment Screening and Debugging Techniques", HughesAiLcraft Company, Ground Systems Group, Fullerton, CA.,RADC-TR-78-55, March 1978. AD# A053 561.
2. C. M. Ryerson, "Summnary of Math Models for ReliabilityScreening and Related Product Assurance", HughesAircraft Company, Culver City, CA., Report No.FR-80-04-636, February 1980.
3. C. M. Ryerson, "Principles of Screening and CostEffective Product Assurance", Hughes Aircraft Company,El Segundo, CA., Report No. FR-79-04-1191, November1979.
4. C. M. Ryerson, "Reliability CREDIT", Hughes AircraftCompany, Culver City, CA., Report No. TIC 20-42-732, May1973.
5. D. Edgerton Jr., "Stress Screening Studies", HughesAircraft Company, Canoga Park, CA., Report No. TIC5150.76/501, June 1976.
6. R. L. Baker, T. Drnas, "Stress Screening Experiment,Phase One", Hughes Aircraft Company, Culver City, CA.,Report No. P76-385, October 1976.
7. R. W. Burrows, "Long Life Assurance Study for MannedSoacecraft Long Life Hardware", Vols. 1-5, MartinM :ietta Corporation, Denver, Colorado, December 1972.
8. 7. Kube, G. Hirschberger, "An Investigation to DetermineEffective Equipment Environmental Acceptance TestMethods", Grumman Aerospace Corporation, Report No., ADR14-04-73.2, April 1973.
9. "Navy Manufacturing Screening Program", NAVMAT P-9492,May 1979.
151
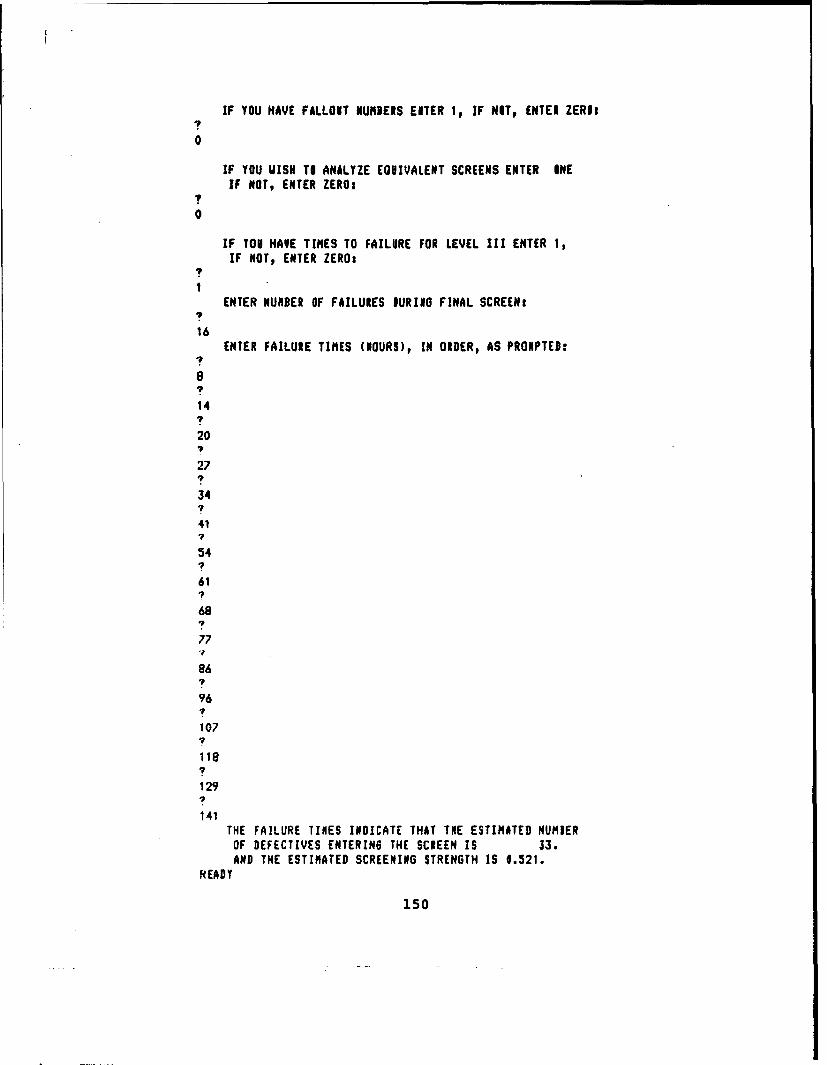
IF YOU HAVE FALLOUT #UMBERS ENTER 1, IF NIT? ENTER ZERO:
0
IF YOU VISN TI ANALYZE EQUIVALENT SCREENS ENTER ONEIF NOT, ENTER ZERO:
0
IF YOU HAVE TIMES TO FAILURE FOR LEVEL III ENTER ItIF NOT, ENTER ZERO:
ENE UBRO FIUE UIG IA CEF
16ENTER NNE OFFAILURE S TIE DNURING FINR tAL SCREEN TED
16
14
61
28
277
8p
412
141
615
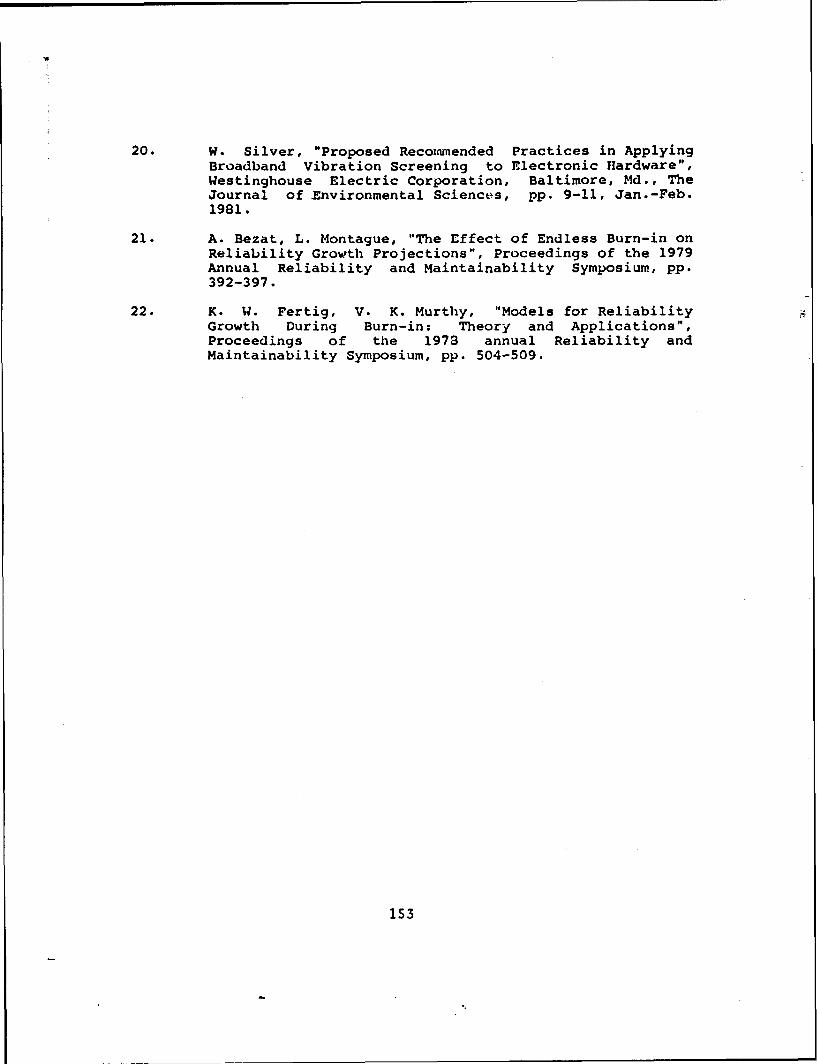
20. W. Silver, "Proposed Recommended Practices in ApplyingBroadband Vibration Screening to Electronic Hardware",Westinghouse Electric Corporation, Baltimore, Md., TheJournal of Environmental Sciences, pp. 9-11, Jan.-Feb.1981.
21. A. Bezat, L. Montague, "The Effect of Endless Burn-in onReliability Growth Projections", Proceedings of the 1979Annual Reliability and Maintainability Symposium, pp.392-397.
22. K. W. Fertig, V. K. Murthy, "Models for ReliabilityGrowth During Burn-in: Theory and Applications",Proceedings of the 1973 annual Reliability andMaintainability Symposium, pp. 504-509.
1S3
10. C. M. Ryerson, "Relating Factory Test Failure Results toField Reliability, Required Field Maintenance, and toTotal Life Cycle Costs", Hughes Aircraft Company, CulverCity, CA., Report No. TIC 72-05, June 1972.
11. J. R. Anderson, "Environmental Burn-in Effectiveness",McDonnell Aircraft Company, St. Louis, Mo., Report No.AFWAL TR-80-3086, August 1980.
12. "Environmental Stress Screening Guidelines", TheInstitute of Environmental Sciences, Library ofCongress", Catalog Card No. 62-38584, 1981.
13. L. E. James et al, "Microcircuit Cost Factors", HughesAircraft Company, Fullerton, CA., Report No. FR81-16-326, February 1981.
14. "Optimum Burn-in Determination", Tracor Sciences andSystems, Arlington, VA., Document No. 9229, November1979.
15. P. L. Shove, "The Effect of Screening and Burn-in onElectronic Reliability", Admiralty Surface WeaponsEstablishment (UK), Report No. TR-72-46, (AD915959),November 1972.
16. C. S. Murphy, "A Guide-line Document for Early LifeFailure Screening Procedures on G1 Equipment", SperryGyroscope (UK), Report 1o. TR 591, September 1977.
17. C. M. Ryerson, "Principles of Manufacturing DataManagement", Hughes Aircraft Company, Report No. FR81-01-812, May 1981.
18. C. M. Ryerson, "Card Level Acceptance Testing", HughesAircraft Co., Paper presented at 6th Aerospace TestingSeminar, Los Angeles, March 1981.
19. K. L. Wong, "Unified Field (Failure) Theory-Demise ofthe Bathtub Curve", Hughes Aircraft Company, Proceedingsof the 1981 Annual Reliability and MaintainabilitySymposium, pp. 402-406.
152
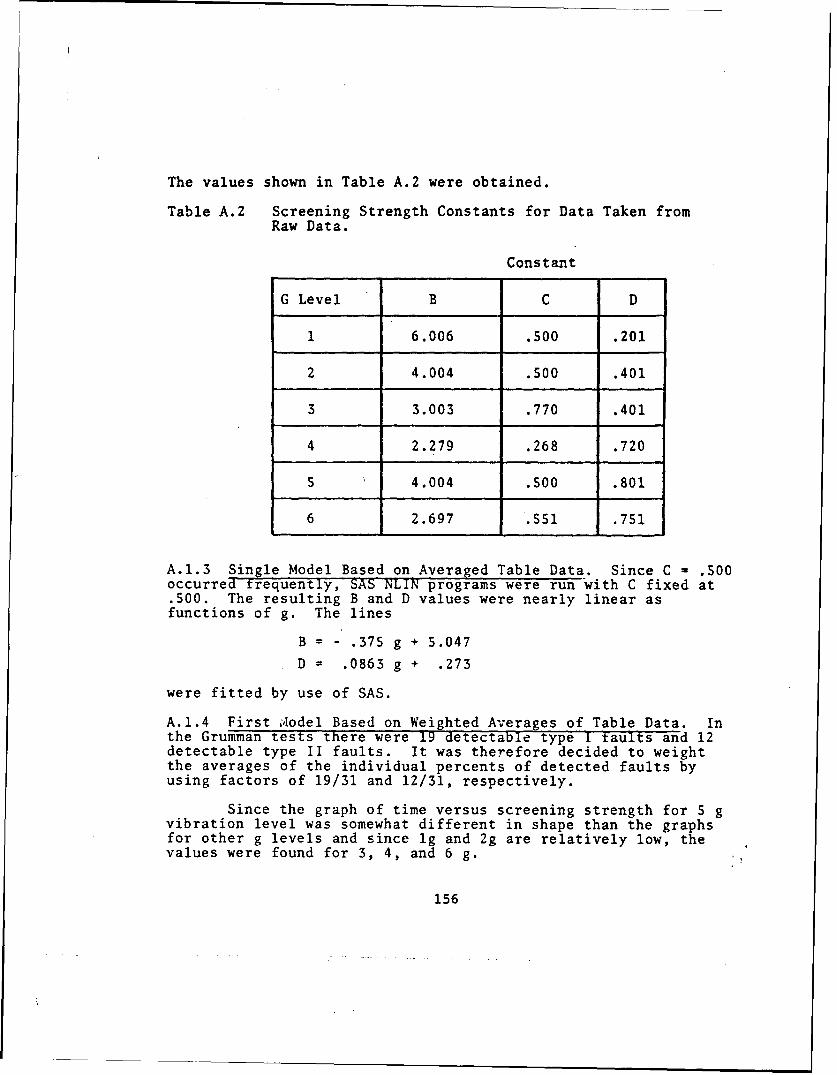
The values shown in Table A.2 were obtained.
Table A.2 Screening Strength Constants for Data Taken fromRaw Data.
Constant
G Level B C D
1 6.006 .500 .201
2 4.004 .500 .401
3 3.003 .770 .401
4 2.279 .268 .720
S 4.004 .500 .801
6 2.697 .551 .751
A.1.3 Single Model Based on Averaged Table Data. Since C .500occurred trequently, SAS NLIN programs were run with C fixed at.500. The resulting B and D values were nearly linear asfunctions of g. The lines
B = - .375 g + 5.047
D = .0863 g + .273
were fitted by use of SAS.
A.1.4 First Model Based on Weighted Averages of Table Data. Inthe Grumman tests there were 19 detectable type I taults and 12detectable type II faults. It was therefore decided to weightthe averages of the individual percents of detected faults byusing factors of 19/31 and 12/31, respectively.
Since the graph of time versus screening strength for 5 gvibration level was somewhat different in shape than the graphsfor other g levels and since lg and 2g are relatively low, thevalues were found for 3, 4, and 6 g.
156
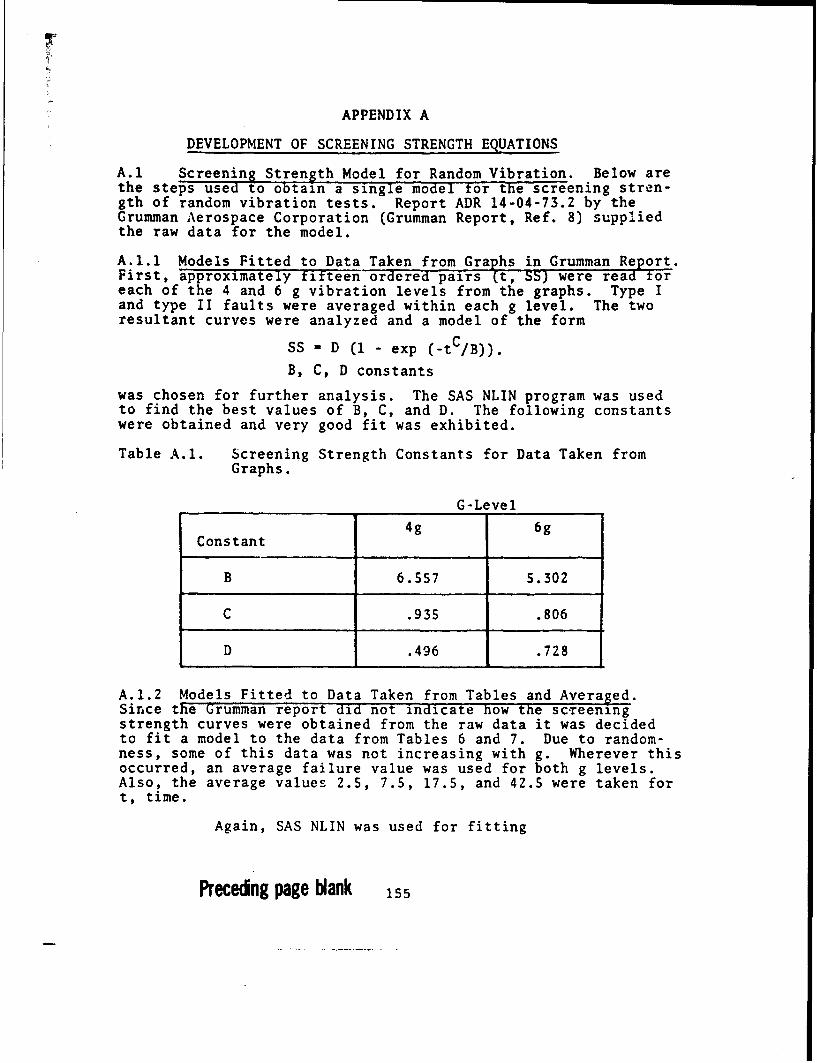
APPENDIX A
DEVELOPMENT OF SCREENING STRENGTH EQUATIONS
A.1 Screening Strength Model for Random Vibration. Below arethe steps used to obtain a single model for the screening stren-gth of random vibration tests. Report ADR 14-04-73.2 by theGrumman Aerospace Corporation (Grumman Report, Ref. 8) suppliedthe raw data for the model.
A.1.1 Models Fitted to Data Taken from Graphs in Grumman Report.First, approximately fitteen ordered pairs (t, SS) were read toreach of the 4 and 6 g vibration levels from the graphs. Type Iand type II faults were averaged within each g level. The tworesultant curves were analyzed and a model of the form
SS - D (1 - exp (-tC/B)).
B, C, D constants
was chosen for further analysis. The SAS NLIN program was usedto find the best values of B, C, and D. The following constantswere obtained and very good fit was exhibited.
Table A.l. Screening Strength Constants for Data Taken fromGraphs.
G-Level
4g 6gConstant
B 6.557 5.302
C .935 .806
D .496 .728
A.1.2 Models Fitted to Data Taken from Tables and Averaged.Since the Grumman report did not indicate how the scTeeningstrength curves were obtained from the raw data it was decidedto fit a model to the data from Tables 6 and 7. Due to random-ness, some of this data was not increasing with g. Wherever thisoccurred, an average failure value was used for both g levels.Also, the average values 2.5, 7.5, 17.5, and 42.5 were taken fort, time.
Again, SAS NLIN was used for fitting
Precedng page blank 155
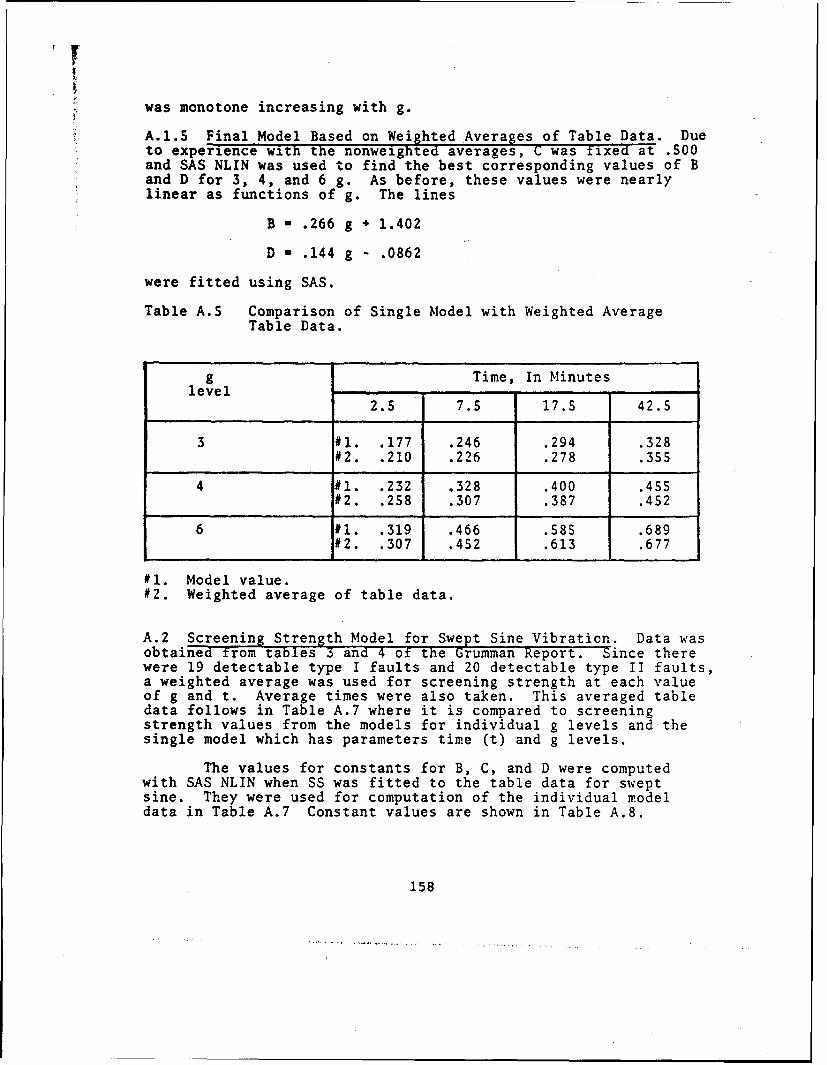
was monotone increasing with g.
A.l.S Final Model Based on Weighted Averages of Table Data. Dueto experience with the nonweighted averages, C was fixed at .500and SAS NLIN was used to find the best corresponding values of Band D for 3, 4, and 6 g. As before, these values were nearlylinear as functions of g. The lines
B - .266 g + 1.402
D - .144 g - .0862
were fitted using SAS.
Table A.5 Comparison of Single Model with Weighted AverageTable Data.
g Time, In Minuteslevel
2.5 7.5 17.5 42.5
3 #1. .177 .246 .294 .328#2. .210 .226 .278 .355
4 f1. .232 .328 .400 .455#2. .258 .307 .387 .452
6 #1. .319 .466 .585 .689#2. .307 .4S2 .613 .677
#1. Model value.#2. Weighted average of table data.
A.2 Screening Strength Model for Swept Sine Vibration. Data wasobtained from tables 3 and 4 of the Grumman Report. Since therewere 19 detectable type I faults and 20 detectable type II faults,a weighted average was used for screening strength at each valueof g and t. Average times were also taken. This averaged tabledata follows in Table A.7 where it is compared to screeningstrength values from the models for individual g levels and thesingle model which has parameters time (t) and g levels.
The values for constants for B, C, and D were computedwith SAS NLIN when SS was fitted to the table data for sweptsine. They were used for computation of the individual modeldata in Table A.7 Constant values are shown in Table A.8.
158
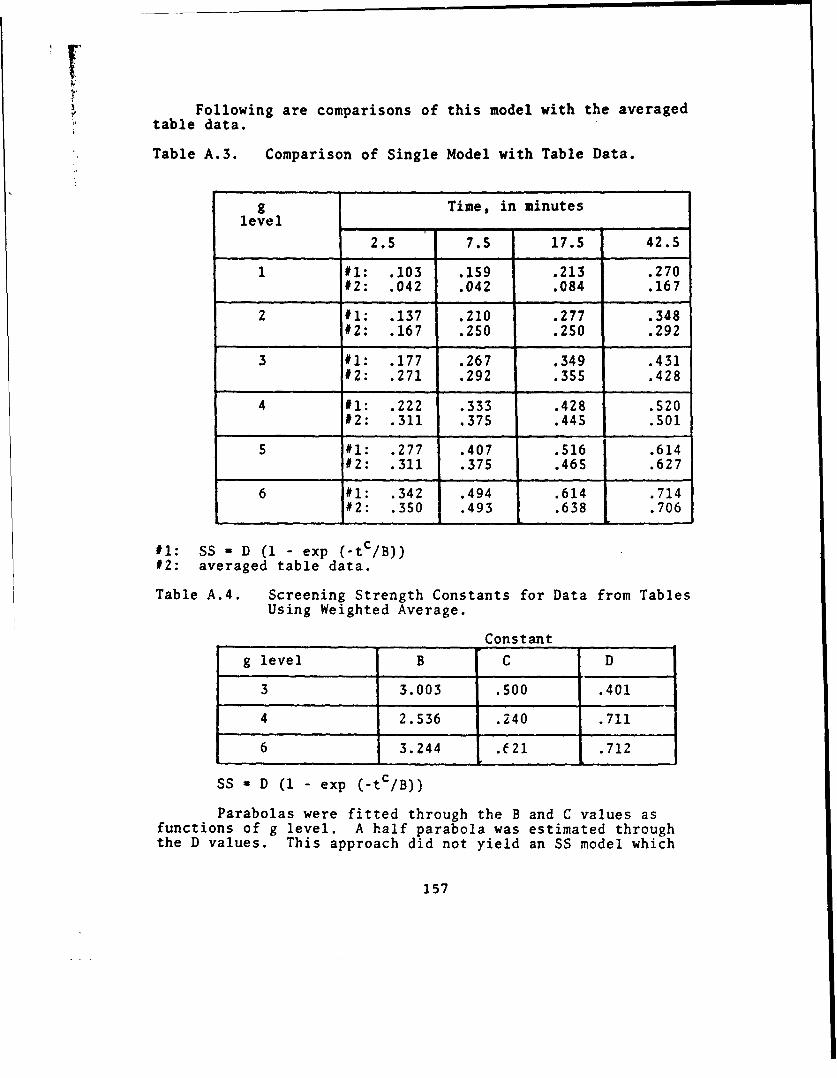
Following are comparisons of this model with the averagedtable data.
Table A.3. Comparison of Single Model with Table Data.
g Time, in minuteslevel
2.5 7.5 17.5 42.5
1 #1: .103 .159 .213 .270#2: .042 .042 .084 .167
2 #1: .137 .210 .277 .348#2: .167 .250 .250 .292
3 #1: .177 .267 .349 .431#2: .271 .292 .355 .428
4 #1: .222 .333 .428 .S20#2: .311 .375 .445 .501
5 #1: .277 .407 .516 .614#2: .311 .375 .465 .627
6 #1: .342 .494 .614 .714#2: .350 .493 .638 .706
#1: SS - D (1 - exp (-tC/B))#2: averaged table data.
Table A.4. Screening Strength Constants for Data from TablesUsing Weighted Average.
Constant
glevel B C D
3 3.003 .500 .401
4 2.536 .240 .711
6 3.244 .f21 .712
SS - D (1 - exp (-tC/B))
Parabolas were fitted through the B and C values asfunctions of g level. A half parabola was estimated throughthe D values. This approach did not yield an SS model which
157
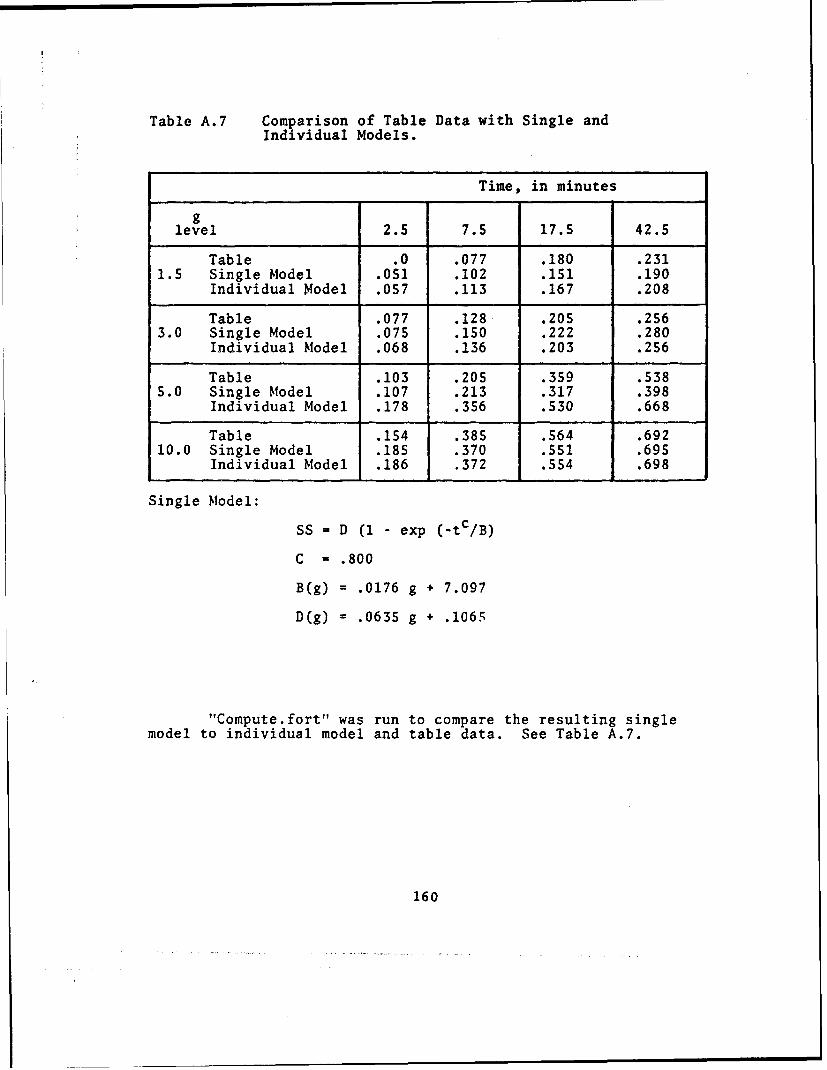
Table A.7 Comparison of Table Data with Single andIndividual Models.
Time, in minutes
glevel 2.5 7.5 17.5 42.5
Table .0 .077 .180 .2311.5 Single Model .051 .102 .151 .190
Individual Model .057 .113 .167 .208
Table .077 .128 .205 .2563.0 Single Model .075 .150 .222 .280
Individual Model .068 .136 .203 .256
Table .103 .205 .359 .5385.0 Single Model .107 .213 .317 .398
Individual Model .178 .356 .530 .668
Table .154 .385 .564 .69210.0 Single Model .185 .370 .551 .695
Individual Model .186 .372 .554 .698
Single Model:
SS = D (1 - exp (-tC/B)
C - .800
B(g) = .0176 g + 7.097
D(g) = .0635 g + .106S
"Compute.fort" was run to compare the resulting singlemodel to individual model and table data. See Table A.7.
160

Table A.6 Comparisons of Single Model with Models Fitted forIndividual g Levels.
g Time, In Minutes
level 10 15 20 30 40 50
#1:
.261 .291 .311 .336 .352 .363#2:
.264 .286 .301 .317 .322 .332
#1:
.353 .-17 .395 .420 .438 .4524 02:
.354 .3-8 .410 .437 .445 .462
#1:.516 .576 .614 .656 .678 .691
6 #2:.507 .564 .603 .652 .670 .704
#1: Models fitted for each g level.#2: Single model:
Note that the values on the charts correspond closely andthat the single model exhibits other desired properties. SS ismonotone increasing in t and 0<D<l, t>o, C>0, B>0.
But 0<D<1 for .6<g<7.5. (.5986..< g<7.543...) andB>0 for g>0.
The final screening strength model is,
SS - D (1 - exp (t5 /B)), t>0
B - .266 g + 1.402, 0.6<g<7.5
D - .144 g - .0862
Due to experience with other SS functions, C was fixed at.8 and SAS NLIN was run again. See Table A.9
It appeared that the 5 g constants were aberrant so lineswere fitted to the remaining values of B and D as functions of g.These were
B(g) w .0176 g + 7.097
D(g) - .0635 g + .1065
159

A.3 Screening Strength Model for Sine Fixed FrequencyVibration. Raw data was obtained from Table 5 and Figure 9of the Grumman Report. In the case where table data exhibitednon-monotonicity (reversals) in g, the average was taken andused for both values. There were 19 detectable type I faultsand 20 detectable type II faults so a weighted average was used.Average times were also taken. This averaged table data followsin Table A.10 where it is compared to screening strength valuesfrom the single model for various g levels and the models forindividual g levels.
Table A.10 Comparison of Table Data, Single Model, andIndividual Models for Sine Fixed Frequency.
Time, Minutes
glevel 2.5 7.5 17.5 42.5
1.5 Table .0 .0 .0 .0Single Model .054 .066 .077 .090
Table .0 .051 .103 .1033.0 Single Model .068 .084 .097 .113
Individual Model .051 .063 .073 .086
Table .128 .154 .154 .1545.0 Single Model .091 .111 .129 .150
Individual Model .109 .133 .154 .179
Table .154 .205 .231 .2315.6 Single Model .112 .136 .157 .183
Individual Model .156 .187 .215 .247
Table .154 .179 .256 .28210.0 Single Model .180 .217 .250 .288
Individual Model .171 .207 .240 .276
Table .230 .230 .286 .33612.0 Single Model .240 .288 .329 .376
Individual Model .208 .250 .287 .329
Single Model:
SS = D (I - exp (-t C/B)
B = - .4187g + 8.620
D = .04354g + .3235 C = .200
162
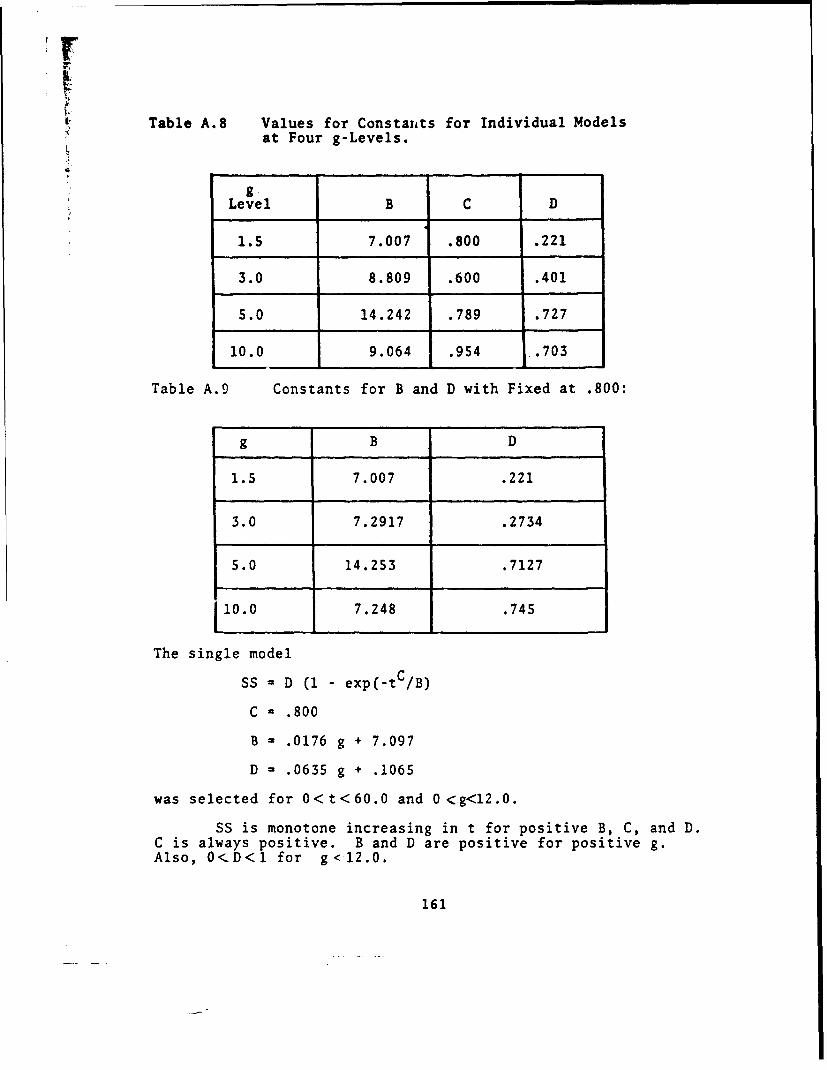
Table A.8 Values for Constants for Individual Modelsat Four g-Levels.
gLevel B C D
1.5 7.007 .800 .221
3.0 8.809 .600 .401
5.0 14.242 .789 .727
10.0 9.064 .954 .703
Table A.9 Constants for B and D with Fixed at .800:
g B D
1.5 7.007 .221
3.0 7.2917 .2734
5.0 14.253 .7127
10.0 7.248 .745
The single model
SS = D (1 - exp(-tC /B)
C = .800
B = .0176 g + 7.097
D - .0635 g + .1065
was selected for 0<t<60.0 and 0<g<12.0.
SS is monotone increasing in t for positive B, C, and D.C is always positive. B and D are positive for positive g.Also, O<D<1 for g <12.0.
161
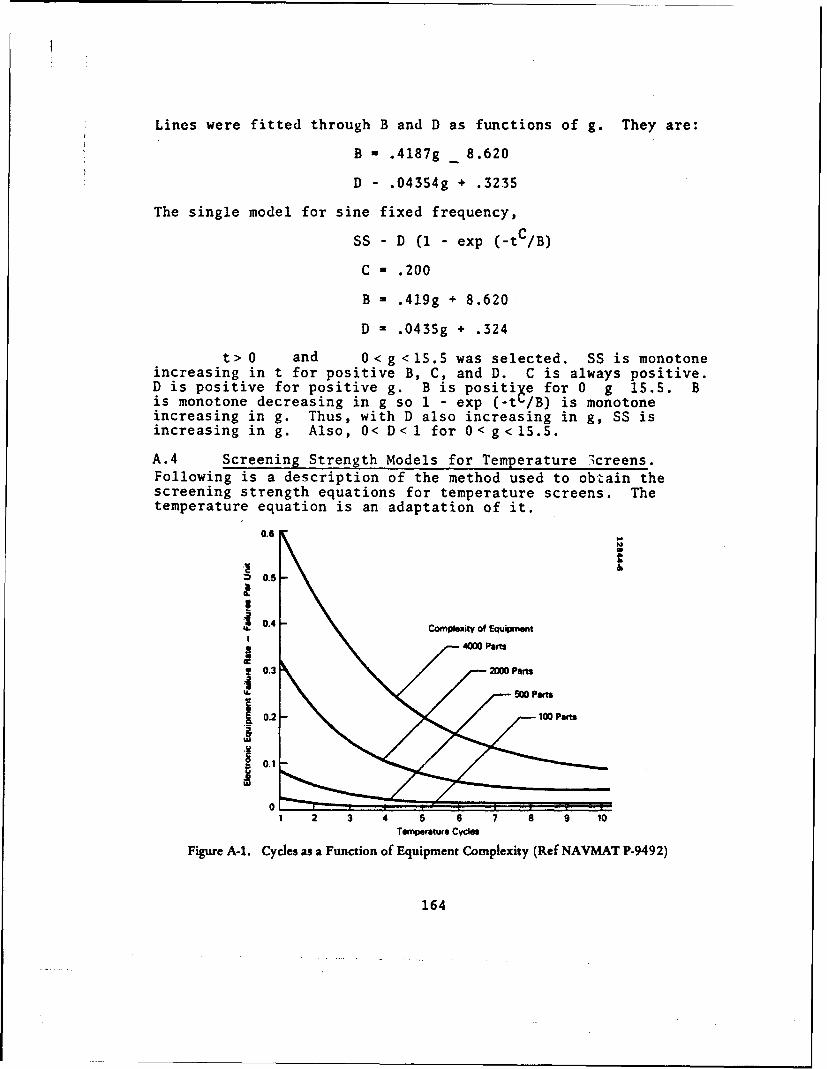
Lines were fitted through B and D as functions of g. They are:
B - .4187g _ 8.620
D .04354g + .3235
The single model for sine fixed frequency,
SS - D (1 - exp (-tC /B)
C - .200
B .419g + 8.620
D - .043Sg + .324
t> 0 and 0< g <15.S was selected. SS is monotoneincreasing in t for positive B, C, and D. C is always positive.D is positive for positive g. B is positiye for 0 g 15.5. Bis monotone decreasing in g so 1 - exp (-tl/B) is monotoneincreasing in g. Thus, with D also increasing in g, SS isincreasing in g. Also, 0< D< 1 for 0<g<15.5.
A.4 Screening Strength Models for Temperature 3creens.Following is a description of the method used to obtain thescreening strength equations for temperature screens. Thetemperature equation is an adaptation of it.
0.6
0.6 -
0.4 -
|a
.Compxit of E0.imt
Ur0.3
01
1 2 3 4 5 6 7 a 9 10
Temperature Cycles
Figure A-1. Cycles as a Function of Equipment Complexity (Ref NAVMAT P-9492)
164

II
The values for constants for B, C, and D were computedby SAS NLIN when SS was fitted to the table data. The valuesare shown in Table A.11. They were used for the computationof the individual model data on Table A.10.
Table A.11. Values for Constants for Individual Models atFive g-Levels.
g
level B C D
3.0 7.007 .440 .201
5.0 6.006 .200 .601
6.5 4.004 .200 .601
10.0 5.005 .200 .801
12.0 4.004 .200 .801
Since C - .200 occurred frequently, C was fixed at .200and the program run again on the 3g data. Fixing C at .200yielded the constants
B - 8.800 and D - .401
for the 3g individual model. Thus for C = .200 the constantsare:
Table A.12. Values for B and D with C Fixed at 0.200.
g B D
3.0 8.800 .401
5.0 6.006 .601
6.5 4.004 .601
10.0 5.005 .801
12.0 4.004 .801
163
IC/minute. or less and temperature extremes within -55 deg. C to+ 7S deg. C.
Only slight modifications are necessary to adapt the SSequation for temperature cycling to constant temperature. Forconstant temperature DT becomes 1.0 and Ncy = 0.0. ReplacingNcy is T - (time in hours) also to the 0.5 power. The rangeis computed from 25 deg. C.
The revised model gives reasonable solutions for itswide range of valid input parameters, exhibits consistencyfor constant temperature and temperature cycling, and is ofthe same general form as previously accepted test strengthequations without exhibiting their inconsistencies. Figures 1.5and 1.6 show the screening strengths for the temperatureequations.
166
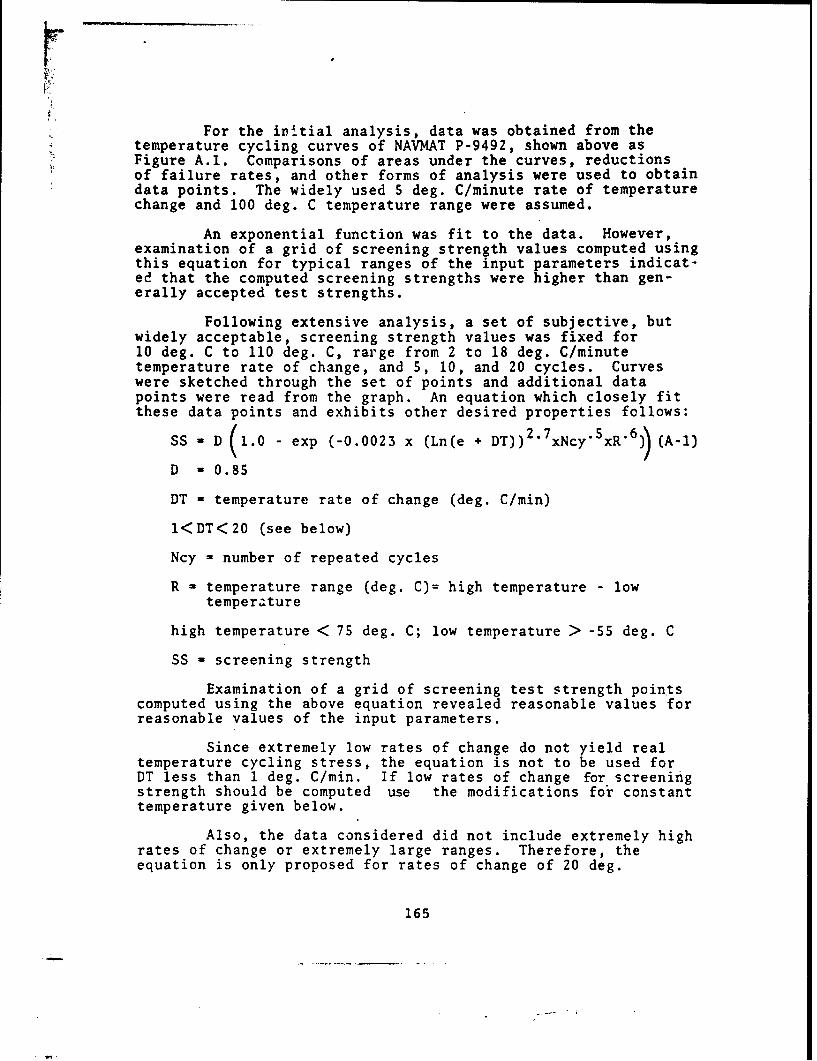
For the initial analysis, data was obtained from thetemperature cycling curves of NAVMAT P-9492, shown above asFigure A.l. Comparisons of areas under the curves, reductionsof failure rates, and other forms of analysis were used to obtaindata points. The widely used 5 deg. C/minute rate of temperaturechange and 100 deg. C temperature range were assumed.
An exponential function was fit to the data. However,examination of a grid of screening strength values computed usingthis equation for typical ranges of the input parameters indicat-ed that the computed screening strengths were higher than gen-erally accepted test strengths.
Following extensive analysis, a set of subjective, butwidely acceptable, screening strength values was fixed for10 deg. C to 110 deg. C, rarge from 2 to 18 deg. C/minutetemperature rate of change, and 5, 10, and 20 cycles. Curveswere sketched through the set of points and additional datapoints were read from the graph. An equation which closely fitthese data points and exhibits other desired properties fellows:
SS D D (1.0 - exp (-0.0023 x (Ln(e + DT)) 27xNcy'SxR6)) (A-1)
D - 0.85
DT - temperature rate of change (deg. C/min)
l<DT<20 (see below)
Ncy = number of repeated cycles
R a temperature range (deg. C)= high temperature - lowtemperature
high temperature < 75 deg. C; low temperature > -55 deg. C
SS - screening strength
Examination of a grid of screening test strength pointscomputed using the above equation revealed reasonable values forreasonable values of the input parameters.
Since extremely low rates of change do not yield realtemperature cycling stress, the equation is not to be used forDT less than 1 deg. C/min. If low rates of change for screeningstrength should be computed use the modifications for constanttemperature given below.
Also, the data considered did not include extremely highrates of change or extremely large ranges. Therefore, theequation is only proposed for rates of change of 20 deg.
165
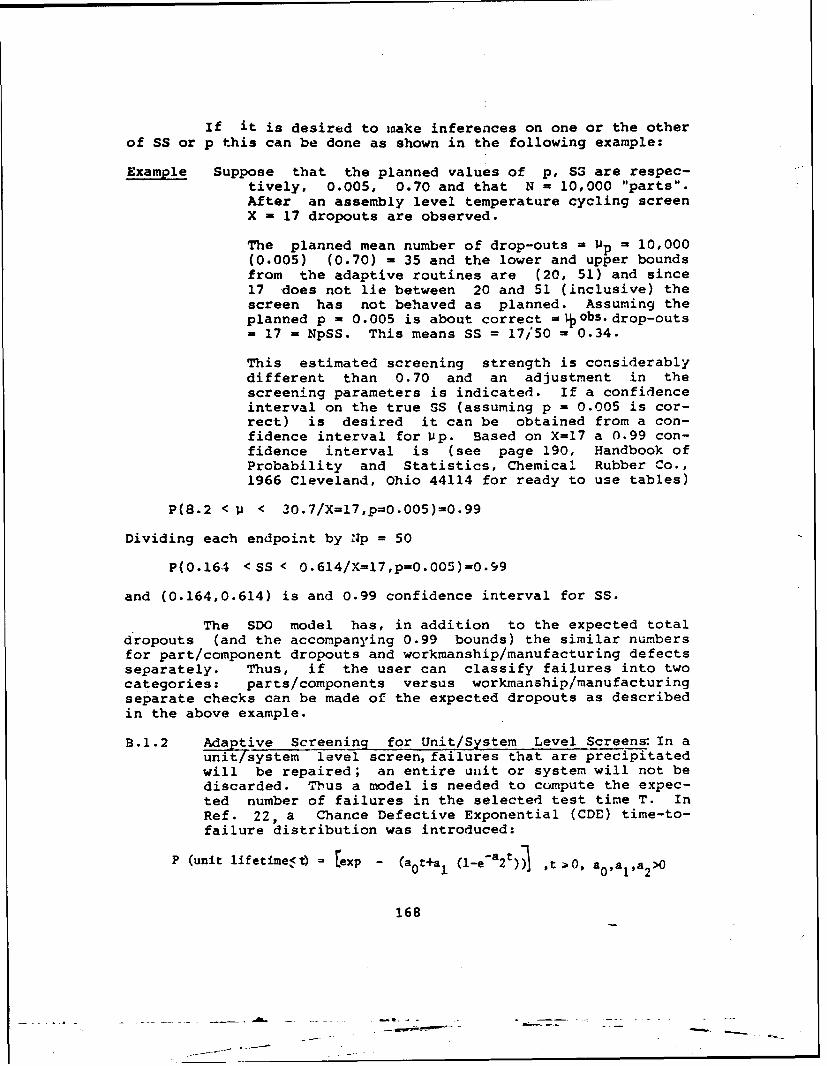
If it is desired to make inferences on one or the otherof SS or p this can be done as shown in the following example:
Example Suppose that the planned values of p, SS are respec-tively, 0.005, 0.70 and that N = 10,000 "parts".After an assembly level temperature cycling screenX - 17 dropouts are observed.
The planned mean number of drop-outs = Up = 10,000(0.005) (0.70) - 35 and the lower and upper boundsfrom the adaptive routines are (20, 51) and since17 does not lie between 20 and 51 (inclusive) thescreen has not behaved as planned. Assuming theplanned p = 0.005 is about correct = •obS. drop-outs- 17 - NpSS. This means SS = 17/50 = 0.34.
This estimated screening strength is considerablydifferent than 0.70 and an adjustment in thescreening parameters is indicated. If a confidenceinterval on the true SS (assuming p = 0.005 is cor-rect) is desired it can be obtained from a con-fidence interval for Up. Based on X=17 a 0.99 con-fidence interval is (see page 190, Handbook ofProbability and Statistics, Chemical Rubber Co.,1966 Cleveland, Ohio 44114 for ready to use tables)
P(8.2 <IJ < 30.7/X=17,p=0.005)s0.99
Dividing each endpoint by Np = 50
P(0.164 <SS < 0.614/X=17,p=0.005)=0.99
and (0.164,0.614) is and 0.99 confidence interval for SS.
The SDO model has, in addition to the expected totaldropouts (and the accompanying 0.99 bounds) the similar numbersfor part/component dropouts and wcrkmanship/manufacturing defectsseparately. Thus, if the user can classify failures into twocategories: paris/components versus workmanship/manufacturingseparate checks can be made of the expected dropouts as describedin the above example.
B.1.2 Adaptive Screeninq for Unit/System Level Screens: In aunit/system level screen, failures that are precipitatedwill be repaired; an entire unit or system will not bediscarded. Th9bus a model is needed to compute the expec-ted number of failures in the selected test time T. InRef. 22, a Chance Defective Exponential (CDE) time-to-failure distribution was introduced:
P (unit lifetimet) = [exp - (a 0 t+a1 ( 1-e- 2t)ý ,t O, a0 ,aa 2>0
168
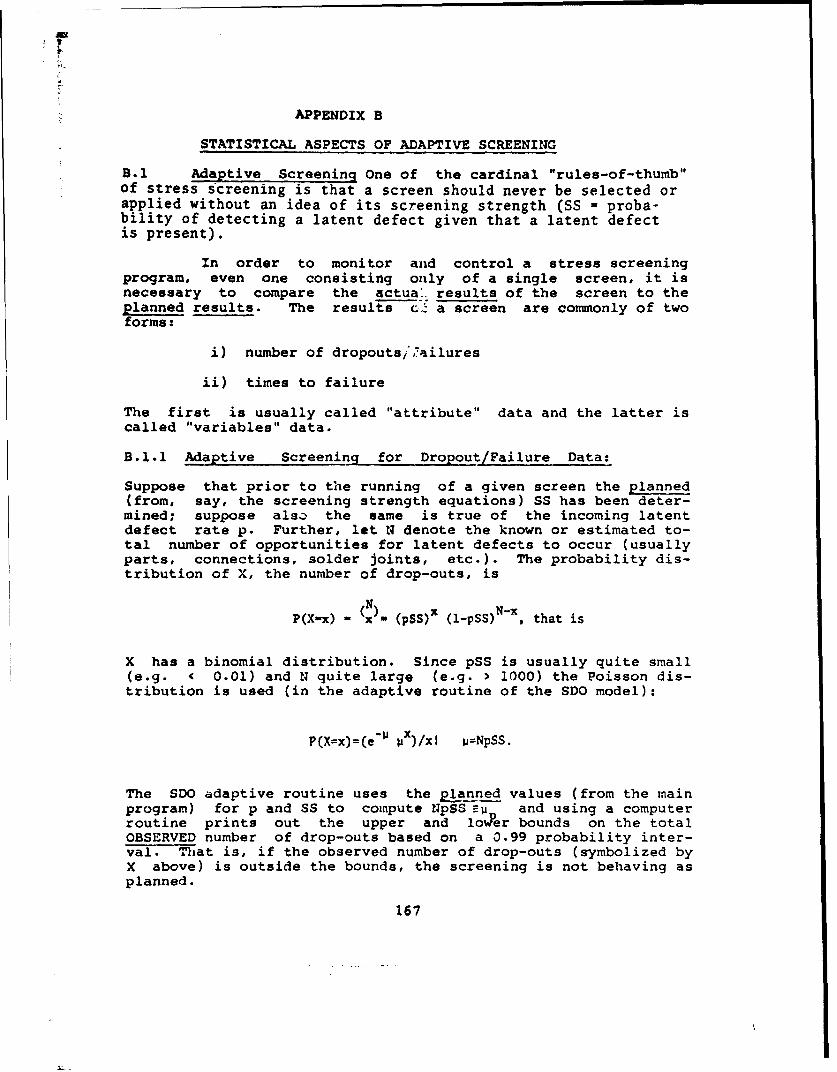
4WKI
"APPENDIX B
STATISTICAL ASPECTS OF ADAPTIVE SCREENING
B.1 Adaptive Screening One of the cardinal "rules-of-thumb"of stress screening is that a screen should never be selected orapplied without an idea of its screening strength (SS - proba-bility of detecting a latent defect given that a latent defectis present).
In order to monitor and control a stress screeningprogram, even one consisting only of a single screen, it isnecessary to compare the actua. results of the screen to theplanned results. The results c-' a screen are commonly of twoforms:
i) number of dropoutsi,`ailures
ii) times to failure
The first is usually called "attribute" data and the latter iscalled "variables" data.
B.1.1 Adaptive Screening for Dropout/Failure Data:
Suppose that prior to the running of a given screen the planned(from, say, the screening strength equations) SS has been deter-mined; suppose also the same is true of the incoming latentdefect rate p. Further, let N denote the known or estimated to-tal number of opportunities for latent defects to occur (usuallyparts, connections, solder joints, etc.). The probability dis-tribution of X, the number of drop-outs, is
N N-xP(X-x) - (X)- (pSS)x (l-pSS), that is
X has a binomial distribution. Since pSS is usually quite small(e.g. < 0.01) and N quite large (e.g. > 1000) the Poisson dis-tribution is used (in the adaptive routine of the SDO model):
P(X=x)=(e- x )/xl p=NpSS.
The SDO adaptive routine uses the planned values (from the mainprogram) for p and SS to compute UpSS -I and using a computerroutine prints out the upper and loer bounds on the totalOBSERVED number of drop-outs based on a 0.99 probability inter-val. Th"iat is, if the observed number of drop-outs (symbolized byX above) is outside the bounds, the screening is not behaving asplanned.
167

APPENDIX C
THE CHANCE DEFECTIVE EXPONENTIAL (CDE) MODEL
The CDE Model:
P (t)-P(pznit life >t)-exp [ (a0 t+a 1 (1-a-42 '))] (C-I)
is extremely attractive. It arises from reasonable physical con-siderations and it can furnish a direct (unconfounded with p) es-timate of screening strength (SS).
Actually the CDE of C-I involves two assumptions thatneed not *be made and that do not seem to improve it's trac-tability. The assumption that the probability distribution of n(the random number of latent defects) is Poisson (with mean-tp) may be replaced by the exact binomial distribution:
P(n) - (N) pn(l-p) N-n (p - the probility of a latent defect)
Also it was assumed that the total failure for all of the goodparts (of which there are actually N-n) is a constant a0 . Ifwe write a' for the failure rate of a single good part andremove both 8f these assumptions.
T j7Ct) .-a6t + -,a t]N
The form (C-1) of the CPE has three unknown parameters a a (aa awhile the "exact" CDE above has four parameterr - of'dZ4saIt?The parameter N is known so that the only unknown para-meters are a6 a , p.
A quantity of interest is the probability that a defec-tive unit (symbolized by D) will live through the test i.e. (iftsunit life) P(t > T/D), it can and has been shown that:
"-["a 0 T + a, (1-_ -a 2 T)J -e [a1 + aOT] (C-2)
P(t>TID) -
(1-. -a 1 )
The screening strength (SS) per latent defect is
Preceding page blank 171

it will be assumed, as in Ref. 22, that the unit/system failureprocess is a Nonhomogeneous Poisson Process (NHPP) with the meanvalue function (say M(t)) of the CDEs
M(t)-Expected i of occurrences in (O,t)-aOt+al(1-e'a2t)
The CDE arises naturally: assuming that a group of N parts con-tains n4<9 latent defect parts with constant failure rate a2: alarge number (u-n) of good parts with constant failure rate(for the totality of good parts) a0: and expected number oflatent defect parts a1 tp (p -the incoming latent defect rate)then the probability o0 survival of a system comprised a total ofN parts (given n latent defective parts) is P (system live > t/nbad parts) - ( 0-a0 t) [e .a2nt]
Multiplying bY probability of n latent defective parts, namely
and summing out n, the unconditional survival distribution is
P(un-t life time >c), I*(t)Fexp 4[ a0t+"& l-*-a2tI
Since a, - Up, p - N Ag - failure rate of a good part, aZ - )ag(latent defect £ailure rate),
PLAINED values of£ -a 0,( a a 2, say a* - (a*8,at a*1- "2 1'l 2"
can be obtained. The planned expected number of occurrences in ascreen of length T is
M(T)- * T +a *l(1 -a_2T)
and this is the value computed by the adaptive routine at theunit/system level screens.
When the actual failure times (during the unit/systemlevel screen) are available, which is usually very costly, theparameter vector a might be estimated and more extensive dataanalysis performed. This topic is discussed in the Appendix C.At this point such data analysis is too costly and intractablefor the adaptive routine.
169
2A
maximizing vector a are said to be the maximum likelihoodestimates (MLE's). On the other hand one might differentiate
* (C-4) or its logarithim with respect a0 ,.a , a ,.and iter-atively solve three equations in three unko0wn'.
There are non-trivial problems with either approach,starting points are required and these are not easy to come by.Also the orders of magnitude of an,,aI, a2, are quite differentwhich causes other problems. Usu lly good starting points areobtained by using another method of estimation. For example themoment estimates of a say i (1n, T, -a,) could be used as start-ing points or in the-worstcasQ thiy c uld be used as estimatesdirectly. Unfortunately the moments of the CDE, even the first(the mean) are intractable. All this discussion leaves asidethe important question: over the space of all possible observeddata {t. } for which sets of t will the maximum of (C-4) existand/or 6U unique?
However, assuming a user can obtain estimates of awhich to him are satisfactory the direct estimate of SS can beobtained, namely, 1 -e-a 2 T
In fact, there is another approach to estimatinga. It is the non-linear squares approach using theobserved cumulative failures as the dependent variable andfitting the observed cumulative failures to the mean valuefunction,
-2tMWt - a Ot +aI1 (1-e )a~
From a purely statistical standpoint this method is not assatisfying as the maximum likelihood method. Indeed themethod considered here would better be called "pseudo" leastsquares. The UCLA BIOMED CAL non-linear least squares
.- rogram (BMDO7R) seems to have problems of convergence andstarting points as well.
173
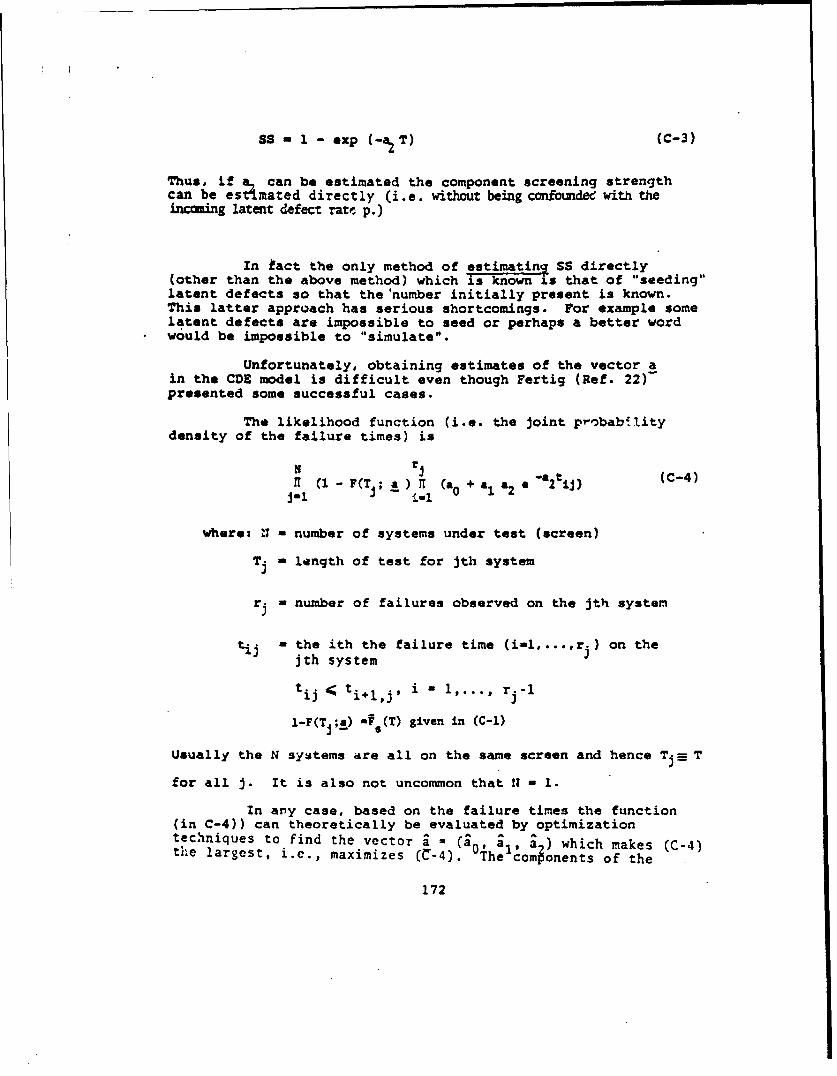
SS = 1 - exp (-aýT) (C-3)
Thus, if a can be estimated the component screening strengthcan be estimated directly (i.e. without being confounded with theincouing latent defect rate p.)
In fact the only method of estimating SS directly(other than the above method) which is known is that of "seeding"latent defects so that the 'number initially present is known.This latter approach has serious shortcomings. For example somelatent defects are impossible to seed or perhaps a better wordwould be impossible to "simulate".
Unfortunately, obtaining estimates of the vector ain the CDE model is difficult even though Fertig (Ref. 22)presented some successful cases.
The likelihood function (i.e. the joint probabilitydensity of the failure times) is
N r(R(-F(T;a) o (0 2 ( -(2ifj) (C-4)J-1 i-1l0
where: U - number of systems under test (screen)
Tj - length of test for Jth system
ri - number of failures observed on the jth system
tij j- the ith the failure time (i-l,...,r.) on thejth system
tij 4 ti+,,j, i r 1, . , r -1
1-F(T ;a) " s(T) given in (C-i)
Usually the N systems dre all on the same screen and hence Tj- T
for all j. It is also not uncommon that 11 - I.
In any case, based on the failure times the function(in C-4)) can theoretically be evaluated by optimizationtechniques to find the vector a = (3o a~l ) which makes (C-4)the largest, i.e., maximizes (C-4). The comionents of the
172
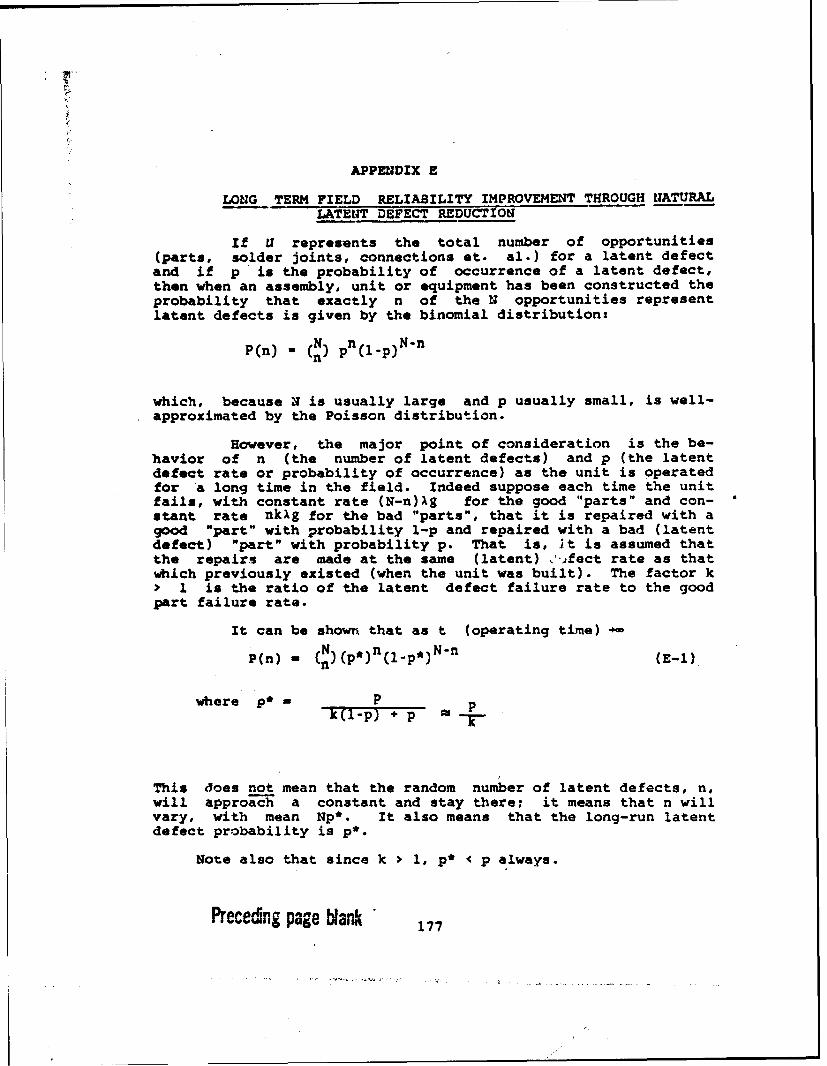
"APPEUDIX E
LONG TERM FIELD RELIABILITY IMPROVEMENT THROUGH IIATURALLATENT DEFECT REDUCTION
If U represents the total number of opportunities(parts, solder joints, connections et. al.) for a latent defectand if p is the probability of occurrence of a latent defect,then when an assembly, unit or equipment has been constructed theprobability that exactly n of the N opportunities representlatent defects is given by the binomial distribution:
P(n) N() pn(l-p)N-n
which, because N is usually large and p usually small, is well-approximated by the Poisson distribution.
However, the major point of consideration is the be-havior of n (the number of latent defects) and p (the latentdefect rate or probability of occurrence) as the unit is operatedfor a long time in the field. Indeed suppose each time the unitfails, with constant rate (N-n)Xg for the good "parts" and con-stant rate nkAg for the bad "parts", that it is repaired with agood "part" with probability 1-p and repaired with a bad (latentdefect) "part" with probability p. That is, it is assumed thatthe repairs are made at the same (latent) ",fect rate as thatwhich previously existed (when the unit was built). The factor k> 1 is the ratio of the latent defect failure rate to the goodpart failure rate.
It can be shown that as t (operating time)P(n) N- ( P*)( n(1-p,)N'n ( -)
where p*- Pk(1-p) + p P •
This does not mean that the random number of latent defects, n,will approach a constant and stay there; it means that n willvary, with mean Np*. It also means that the long-run latentdefect probability is p*.
Note also that since k 1 1, p* < p always.
Precedng page blank 177

APPENDIX D
APPROXIMATIOU OF SCREENING STRENGTH USIUG OBSERVED MTBF
Here it is assumed that, at the equipment or systemlevel, estimates of the HTBF with and without a particular"screening sequence" (perhaps consisting of only one screen)are available.
Lot U be the number of opportunities (parts connections)for the occurrence of a latent defect in an equipment or system.Then, in terms of expected values, the system failure rate attime t - 0 and prior to a screen is
AU.S. a N (l-p)Xg * NpkXg (D-1)
wheres k ' 1 is the factor which when multiplied by thenon-defective part failure rate yields thelatent defect part failure rate; p is thelatent defect occurrence probability (rate) andu.s. represents unscreened.
After the screen, in terms of expected values the equipment/sys-tam failure rate is
A . N [C1p)(1'SS)] Xg NpkXg (lSS) (D-2)
where: SS is the screening strength of the screen. Using (D-l)and (D-2)
SS - (XU.s . A)/(u. . -NX) X > NA
The largest SS can be is when N-AA ; then SS is one. Thesmallest SS can be is when NA-0 an& then it is 1 - (A s/XU.S.)
MTBF
MTBFs
Example: Suppose that two pieces of electrical equipment haveMTBF's (field observed) of 100 and 250, respectively,and that the first (100 hr. MTBF) has been unscreenedwhile the latter (250 hr. MTBF) was subjected to a 15min. 6g (RMS) random vibration screen. Then thestrength of that screen, namely SS, is at least1-100/250 - 0.6.
Preceding page blank 175
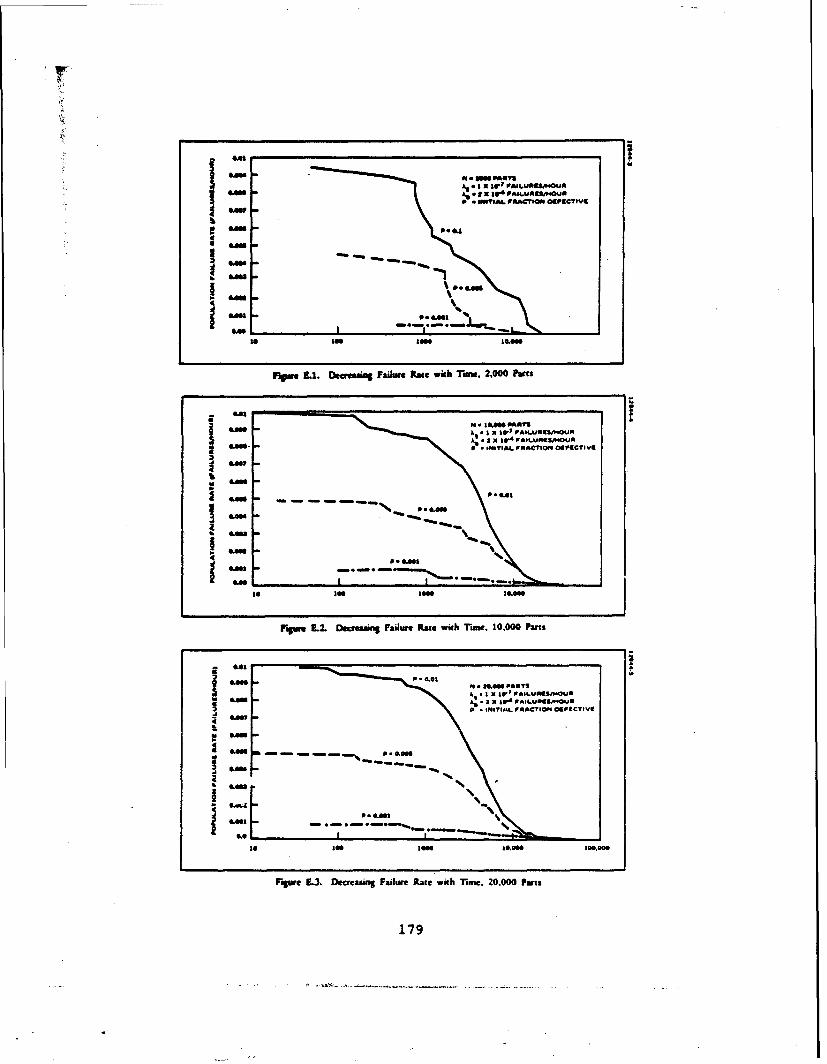
P * 1?I*& FRACTION OGFUCTIVC
.. 0.861
10 106 08e le&
grem 3.1. Dgeaeaing lFailure Rate with Taiste, 2,000 Parts
N Ism PANTS801
I XIV ALM*A~QAN earn.RATOM010ETI
Loss
Is s"1004
rigw L2. Decreasing Failure Rate wich Tuone. 10.000 Parts
4,4060 P 20 f A T
N. 41.0001061
P*w 0, IM 'jotLUUs-W
le -0 0.0..090ima
Uow 3 ~esn alueRt ihrn.2,0 at
~Lw -- -- 179

-7 3Examples Suppose U - 2000, p - 0.005,lg - 10 and k - 2xlO
Then
0.005 " 2.5 x 1061990 + .005
An important question is: how long does it take to ap-proach (E-I). The mathematical result requires t 0 • Theaccompanying three. figures give an idea of the rate of decreasefor nine typical cases3 p - .001, .005 and .01,
p - 0.001, 0.005, and 0.01
8 - 2000, 10,000, and 20,000
X - 10g
k~g - 2 x 10.4
The data in the three figures were derived from a simulationprogram which simulated failures of both good and bad parts andreplacement of the failed part from populati..:s containing pfraction defective.
178
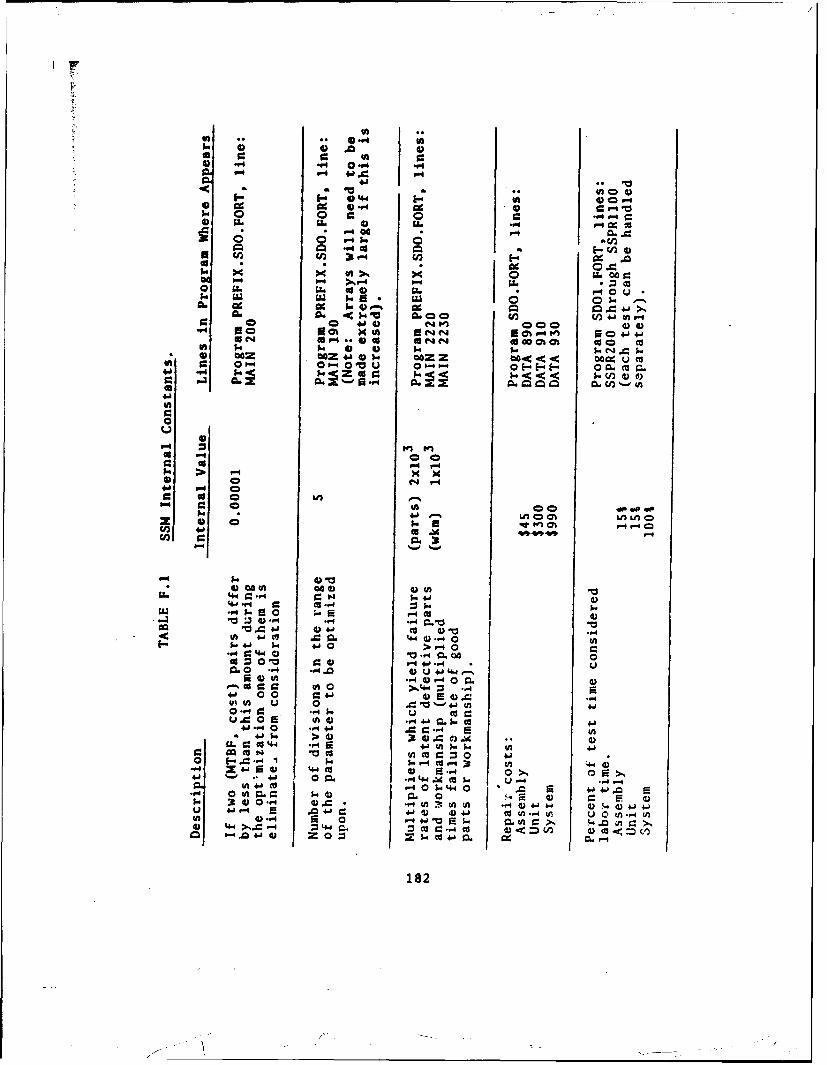
a 400~- .. ** .4
4)~u 4) a0x 0 0 "* -V4 .94 09
-&L. L. f0 =04m
oC 0C6~. 0U0 0 .10 a -- cn)4"*" )~ 4 ca 9z E. A
0U k~ 10 1
o SZ.In. 04) Q- J.uDOa. C1 C4 C44) Go 0% (A C
00 0 P"4 " e-0 0 .044*w "4 SoSo r. E.1r4 *o,-tO *0
41. 0u-..o CD~ Ooob 0
0 C
0 - 4 000444 0 -4 r-N4
U2.~ ' -4 $-E;.r 4c
*.a 61 0 " A $.4- )-$.44 4 + 0 0 r4 0..
-. C 40 0 00t 0cc2 1 4) F- 5. M U0.0 -4 ,4 0 U~ 4- 4-I
a) a ? 4- cc 0 uu 0M
-1 0. 4 0 r- 4
ut U4-5 0- .- 0 V 4 n0 p r~4. ~ .F4 k U ca =0. a-0 s ' . ~ 4jG4 ccI- 5-4. 0. 4j1 = -40sI
410 $. >4) 0 =U).C c0 4-1 P-4 a l 4 Ul JI 4.
02 ) ccM s l o =00 410 ~ = 04 k k4.'CS- ;: V
41 In F4 t-w ccQ -a AO I04lv- 0$ 44 A50 4-'j 00 ul Q. .944. 0 U+j V4.1. 9:) 4 4)c 44r, U 0 t mcul ~ 04 a94 o.O55 +jUrz 1A 04, -. 0'AC
. 44 >.= 54) Z44 a -4c 4) <.- Ln~ a0ccr !.0 4 a~ 0. *.Co410.9 .F-4
1fl4.O ~" 4.~0-182

APPENDIX F
MODEL COMPUTER PROGRAM LISTINGS
The three computer programs comprising the SSM are,
1) PREFIX
2) SDO1
3) ADAPT
Listings of those programs are contained in this appendix. Belowis a table of internal constants, identifying the values assignedto the constants and the line number in the program where thatconstant can be found. This enables the user to modify theprogram by altering the constants to more closely fit the usersown hardware characteristics, production processes and screeningconditions.
Prececing page b~asnf

PROGRAM LISTING FOR PREFIX. SDO. FORT
184

L. Ca C60
ou 4 9 -cc9
1.. 94'9 04) C P"
a on " Sn0 cr 4 j C30C
S 0 E-0 . 4ý 00 06- 04W4 -4 N~ -<$ 000 $'- 5.*5 $0 a.
o -4
*0 0-
0 0-4 09C.4 4) 4.4 x
V-4~~L) 00 1 W 3 a 0cc -W 0W %CCL
4.cc 0 04)p~
.040
U~ ~ 0coo.) UJ
-U u5 000 WI -1
a C) 0 9
00. 0 00 -r af 0*
0 -P r 0
- P r.4. F- V 4 ) . -%41 - 4 r I 4 (- FI 0
06 -V .90 COO 0 U, a - m,4 41 ' Ca0 04) o j k ,
w l ccUb o.. w-4$ - ->.:4) U U0
*944J..4 4 51 3
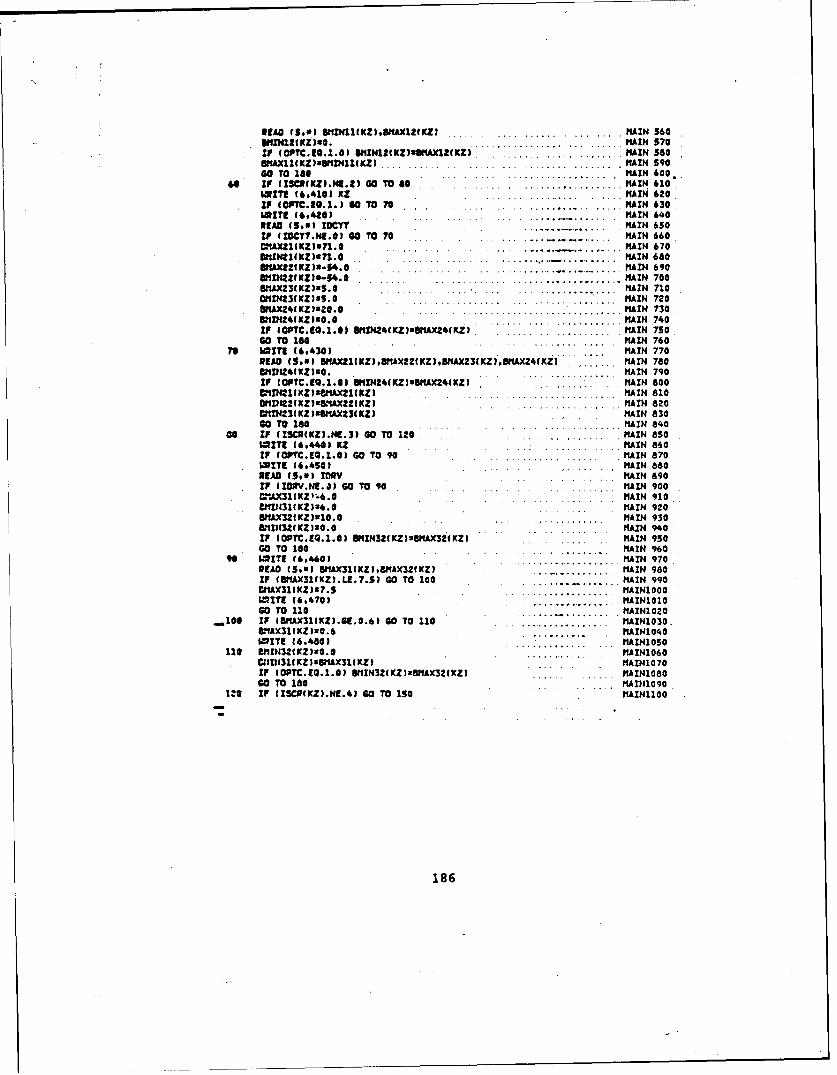
*SAD (5901 1111N11(3CZIUMAMZ(XZ3 ... ..... . . MAIN 560lAUNZIKZ)vQ@ .... . MAIN 570IF IOPTC.10.1.01 UMINItfXZ)zUMAXI1UKZ) MAIN 580OMA11( KZ la&MIlIg KZ I.. .... .. ... MAIN 59060 TO IS1...0 MAIN 400.
46 If (ISCI(KZ.14.23 60 TO 80 . ... ........ MAIN 410WRITE (4,410) XZ .MAIN 620IF (OPTC.I0.1.) S0 TO 70 . .MAIN 430WRITE (64,410 .... MAIN 440PEAS (5,11 IOCYT ~ . MAIN 650IF (IOCTT.NI.03 go To 70 *.. .MAIN 660cMoAxi1(Kz337.s MAIN 670WiiNZ(Kiuman. r ..... ..... MAIN 66010=221(K218-54.0 . 1. ............. MAIN 6908t11N22(XZV-54.0 . . . . . . ...... MAIN 700MAXZ31KZ)z$.$ .......... ..... MAIN 7100t11N3f1(ZIS.0 MAIN 720BWA241KZ3EztO. . . . . . . . MAIN 7308HW24(KZ~aO.O ... ...... MAIN.740IF IOPTC.EQ.2.01 WIINZ44KZIZSSAX24fKZ) ............ MAIN 750Go TO 1SO MAIN 760
70 WRTE (64301MAIN 770RIAD (5,*3 SMAX*1(KZ),8MAX2Z(KZ3,UMAX3EKZ),8flAX24(KZ) ... ........ MAIN 7808111N24( KZ8o ..... MAIN 790IF (OPTC.1Q.1.01 B"UIN4tKZ)*&NAX24(KZ) H.. . . .AIN 800121VrZ1(KZICXIWI(XZ3 MAIN 8108MINII(KZ):SMAX22(XZ) MAIN 820SMIN23( KZ 3USft4(3( KZl MAIN 8306o To 180 MAIN 840
00 IF (ISCR(KZ).NE.3) 60 TO 120 MAIN 8503.5T16P(44401 KZ MAIN 880If (OPTC.IQ.1.01 GO TO 90 MAIN 870WRITE! (4,#450 MAIN 8580READ (SO*) ImV MAIN 890IF I IoV.1E.J3) 60 TO IS MAIN 900C1*AX3I(KZ'-4.O ................ MAIN 910&KIN31(KZ)z6.0 MAIN 920SMAX32(KZ)V1O.O . . . . . . . MAIN 9308211N3*(KZJUO.@ ..... . MAIN 940If (OPTC.EQ.1.0) UHIN32(KZ38SMAX32W(KZ) MAIN 950Go TO 180 MAIN 960WRIT 1S? 4,"03 .. . . . MAIN 970AEAO (5,01 SMA32(KZI#SMAX32(KZI .. . MAIN 980IF (8MlAX31(KZ).LI.7.S1 GO TO 100 MI 9ZMAX3I(XZ)s7.5 . . . . . .AINGOOo
.......................... MIll60 TO 110 ......... MAINIO20
-.100 IF IBMAX321IKZ.61..6) 60 TO 110............................MAIN1O3O.8flAX31(3CZ)90.6 .. . . . MAIN104OUPITE (6.4800....... MAINlOSO
110 eMIN32(KZ~sO.O MAINIO60V1I13I3( KZ 3aS*1X3I( KZ) MAIN1O70IF (OPTC.10.1.01 OMIN32(KZJ:SMAX32(3CZ) .. MAIN1080GO TO 180 MAVN1O90
142 IF goC(Z.N.36 ToIO15 MAIN11OG
186
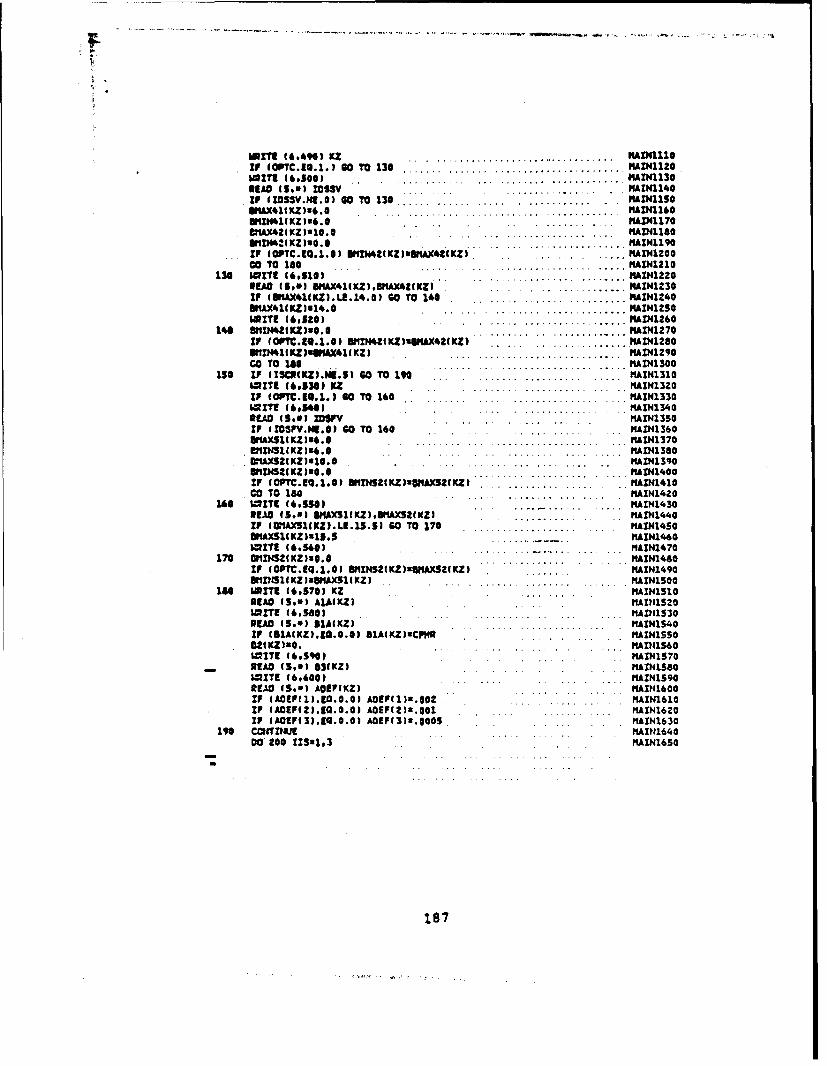
WRITE (64"190 KZ ..... .... ... ..... 10aif IOPTC.EO.1.1 so TO 130 ................. MIN112@WRITE (6,5003 .... #.... ...... AINI130HEAD (5.01 IDISSY... -. 1 KAIN1144If fIDSSV.Nl.0) 60 TO 130 .... ................ PAIN1150
tAX41(XZ)84.0 ....... HAVNI16*nvoI(KZ184.0 ... I. I.. ....... ANA11170
eHAX421KZ)[email protected] ....... . NAINII40
IF (OPTC.CQ.1.01 &lV442(KZjvGWA4C(KZl KAINlIGOGo TO 100 H AINl2lO
130 WRITE (4.50s1l..... .... IANAI1220IDSO (So*) INA41IKZ),BtAX42fKZI ..... MAIN1230IF (UA4(Z)L.* 0)O TO 140 .............. AIN1240&WA41(KZ)814.0 ........ .. .... IVAIN1230WRITE (6t5203 ........... AIN1260
146 SHIMDA KZ)m4.0 .... ........ flAIN1270IF (OPTC.I6.1.01 UIIIN42KZ)DNAX*2(KZ) .... MAIN1280u'11N611Kz)qSwAVUK) ..... .......... AINIZ90Go To 1I" M.IAIN1300
is* If IISXh(KZ).N.5) 0 TO11 MAIN1310MITI (69531 KZ MAIN13ZOIF (OPTC.EO.1.I 60 TO 140 .. .. ....... AIN1330MITI! (605401 MAIN13'40RUAD (5161 lowF . .. . AIN1350IF (IOSFV.m!.03 GO To 140 KAIN1360&UXS1I(KU3.4.......... KAIN1370lmtflflI zl863.o PtAIN1360GMAU2XV814K . . . ... .... .... .... .. MAIN1390BMDMSIKZJo.@. MAIN1400IF (OPTC.1Q.1.0) SKM2S(KZ)zoNlAXSI(XZ)..................... KAIN1410co TO 180 MA11N1420
1I0 WRITE (615501 .-.. 3AIN1430READ 15.01 JMAXS1(KZ).IDIAXS32IMZ) ........ AIN1440IF (OMAX51(KDA.LE.5.53 GO TO 170 ......... . NAIN1450UIIAXSl(KZ 3315.5 - - AIN1460WRITE (4.540) MArN1470
170 OflI)SIZtx)[email protected] IAIN1480IF (oFTC.9q.1.a3 8HIN52Z(URSqIAXZ(KZ) . AIN14908HI?31IKZICUHD.XS(KZ) . ........... APMlSO
186 WRITE 14,570) KZ PAINi5lOREAD (3,01 AlA(KZ) nAzNIS20WRITE (4,5801 . .... IAXPI1530RUAD (5.0) DIA(KZ) KAIN1540IF (B1AIUZ).EO.0.0) BZAIKZ)NCPWI MAINISSO
WRITE (695"93 ~NAINS7O- 3A.O (5.*) b3(KZ) MAINISSO
WRITE (4,4001 .. ... AIN1S90ELWO IS..) AOEF(KZ) . .. . .MI10IF (A09Ff13.tQ.0.0) ADEF(1)2.0@2 M AIN1610IF (ADEPIZI.EQ.0.01 ADEF(2Ix. 001 MAI162If (AO!F(33.9O.0.01 ADEF(3)X,0005, M AIN1630
1I" Cc~lax TIV1aJ00*200 II321,3 MAIN1650
187

I" IF (ISCR(Z!5).LE.S) 130(113121 K.N~WRITE (2.0) ISCR MA!H1670WRITE (6.03 P. .. .. . . .. .. . . .. .. . . . . PIADN166000 220 !)DEX21.M MAI6N169000 220 !)M!X22103...... ......... KAI)1700OL3S121000. KA!n1710CtflS21000. MAI)1720tF (!SCR(INDEX).10.!3!EX21 00 TO 210 KItAN173@WRITE (10,0) 0"1~.0".2 MA!NM740go TO 220 MA!)N1750
210 62!T! (10.') AlA(DM9X).S1A(D!IX) .............. A!N17603210 CONTINUE MAD(1770
WRIT1! (11,6103 P NA!N1760WRITE 19.620) 31.R2 flAfl4179000 2330 1:13 KA1N10OO
MITI! (12.0) MAX121(),SfINlI(!) MAIN~I82OMI!?!~~~~~~ (1.0 MXZ!.ff4 )..............................AIlO
MIZTI (12,03 SflAX21l(),8*1!N21(l) .. ........ HA!N1830.WRITE (12.5) 511AX2Z(!),8*1fl42(Z) MA!N164061T!? t12.0) 9flX23(!).8*1fl23(!) MAIN1850M!T! (1200) SIIAXZ4(!),Bfl!NZ4(!) MA!N1860MIITE (12.03 BRAX31(!),811!N31(!) . .. MAINIS70MITE! (12.0) SMAX32(l),8Z1!N32(!) .. .... ..... PA418806117! (12.0) SNA414 I I, SHIN41 (I) MA!N1890MITE! (12,m) aflAX42(l I.MlIN42(!) PtA!N1900MITE! (12.*) NltX51(!),SMl!3S1(X) MAD111910MITE! (12.0) S*IAXS2( !).91!NS2(!) MAZN)1920
230 CTl?1)OJ 11AI341930MITE! (4.0) NCYC.M.HPAITS.C3!O0.E.nV.PO1hPCM4R, .... ... A1940MITE! 44,630) MAIN31950
WRITE (4,0) 30fF 3(613419000 240 !Xsl.1M MAIN31973
e40 MITI! (4,03 AOEF(IX) 1(613419MITI! (496301 1(6131990
00 260 !XS1,31 PlA!N200000 250 !Uul.S MAIN)2010
250 MI!?! (4,01 st(!X),83t!Xl 1161342020260 C=fl1INi . ... .. AI2030
GO TO 300 ... .191~!040
27O 62Z?! (6,640) HAI1)4205MITE (6.650) MAIN32060READ (5,0) XO¶TF 116142070IF f XITBF.to. 0. ) GO TO 280 MAIN32080,!Oo:0* MAIN32090
go TO 290 11A1342002"8 MITI! (6,660) 116134211
READ (5,0) CREGO mikim4212- If (CI!OD.N!.0.0) GO TO 2"0 MAD32130
C3EC~:1.t10 K16)W140OPTCzI. 0 MAIN321S0
2"0 MITE! (6o670) 116AI42260READ (5.09 HPARTS 1161342170621?! (6.680) 11AIN2180PLIO (5,*) XLAIWI,XLAMCI 1(61342190If (XLAMI¶9.IQ.0.0) XLAIIP12I.1-7 MAIN32200
188

IF tXUDMCI.EQ..0.@ XLAMC121.1-10............. ...... . HI I
XUNPC21 .23aXLA11R1 MAM230Z
HOP'21. *"WARTS MAIN2240WIETE 113..) NOP.XLAMPIXLiMP2.XLAflCI.XLAMC2, MAD422SOMOME (6.4") PAD12260READ 45.0) POIF ... .NAZN270
C RIAD(SONICPHR ftAZ229OCPRXu30. HAD12300GO TO 10 KAD41310
300 STOP AIMAN320C nA111233D310 FORMIAT (ZXV////1*X.8( I# 'TEST AND PARAMETER SILECTION' PS(-w-///?nAZN23'.0320 FORMIAT UIX//SXo*FOLLOWIHS 't ARE THE AVAILABLE SCREIENS :'//5X.'1.fA!Nf2350
I CONSANT',' TEMiPEAATUWE/5X9'2. CYCLED TUIMPRATWIV/SX03. RAHMA1142360am0 VIURATIOR'/SX0 4. SIHE SUEEP't' VIIRATZI'/SX. 3. 5DMl FIXIOMAZN23703 VIBRATION'//) NAZ112390
330 FORMIAT IWSX*'X.EFAULTS ARE:*/lOX.'LEVEL 1%pl0X*t.EVfL 2'pl0X.'LlVlAfl?2390111 3'/4X9'T~flP. CYCLIUG',7X.RPAH.VIU'.7Xo'CONST. TEMP.'/l1X.(Z'QJI¶&ZN2400
3"0 FORMIAT (SX. 'IF YOU WISH DEFAULT SCREENS ENTE ZERO. IF NO?,'.' INTMAII12420
3M FORMIAT (lX//5X.'ENTER YOM SCREEN SEQUENCE AS PROMPTED USING * .'UMIAN24011=11S FROM ABOVE LISTIG:'/SX,'IF YOU CO NOT WISH TO SCREEN ',-'AT 11Alf12A502A PARTICULAR LEVEL# ENTER ZER:* '3MA1N42*6O
360 FORMIAT (lX.'FOR LEVIL'o.12.' THE SCREEN NMBSER D0SIRE0 IS:'-I MIAN2470310 FCMMIAT (I//*.1'')LEA'I.1"3U M1?42460380 FORMIAT (SX. 'COSTA.JT TfMWERATUWE. LEVEL',212 MlA11124903"0 FORMIAT MSX'THE DEFAULT VALUES ARE! '/SX,'TEMHREATUPfU70 CEO C%'SX9HAN2S00
1'TINE RAIJGE TO BE INVESTIGATfOall TO *8 HOURS'/SX.'ZF YOU WISH THE IIAUIKSICOEFAIJLT VALUES, ENTER ZIERO. IF NOCT.'.'ENTER 1:-1 M11Af2520
406 FORMIAT (SX. 'ENER, INl CROER, SEPARATED BY COPRUS ON SPACES: 4/X. ' TMAD125301119 IN 0ES C. *.'MIE IN HRS:'/SXo'ITVIP MUST BE LESS THAN4 #75 OgGflAZN25402 CIO) AIIAZNESD
*10 FORMAT (SX0 TEMPERATURE CYCLinG. LEVEL' .13) 1iflplZ56*10 WORIIAT ISX,'THE DEFAULT 1.'VALUES ARE:'/SXP*LIER TEIIPS-5* DES C'/nArtts270
lSX.lUPPER TEiIPa71 DEC C'/SX.ITEIIP. RATE Of CHAPIG985 0ES C/tIHN/SX..1ArN2380I'RANSA OF CYCLES TO SE'.' ZNVESTXGATEDSO TO 29'/SX.*ZF YOU WISH THU¶AZ?I259O31 DEFAULT VALUES 'r'EPITEE ZERO, If NOT. EN4TER 1:') MAIAN2600
*30 FORMIAT (SX.'ENTER, ZN O2OER, SEPARATED BY COMMIAS 00 SPACES: '/5X. &'WAZ?426 10IPPER TEflP.iLloWER TEIIP.sTEllP. RATE OF CHANCE. NO.'.' OF CYCLES-- /5)Qu1AZ1?202.'ITEMPERATWRE RANGE KJST 8E WITHIN -55 TO .71'.' DES CI/SX..*b@ OINAIP2630SATE OF CHANCE BETWEEN 1 AND 20 DEG C/MIH 3') flAZ1426aO
*40 FCP1¶AY (SXv'0AH0O?1 V~l!RATIONv LEVZL'olZ3 MAIN26SO450 FORMIAT 15X.'THE DEFAULT VALUES',' ARE:'/5X.'l-LEVEL26 G*/SX.'RAHGMADI?1660
1 OF TIMlE TO BE INVESTIGATE0=0 TO 10 MIII. '/SX. 'IF YOU WISN THE DEFAAIAN2670- ULT VALUES ENTER ZERO. IF NOT. ENTER 1:'l tAIlN2680
*40 FORMIAT (SX.'ENTER, IM ORDER. SEPARATED SY COIWAS OR SPACES:'/SX.'SIIAI?1269D1 LEVEL.', TIMlE ZN flIN-/SX*'f6 LEVEL MAiT BE BETWEEN .6 AND 7.5I'MAIAN27002) MAP1N2710
470 FCRtIAT (!SX.6-LfVEL OUT Of ALLOWABLE RAIIUI.PARAIIETIR SET AT 7.S'.11AIN27201' 6.') tlAItUE730
484 FO0tIAT (SXv'S-LEVEL OUT Of ALLOWABLE RANSE.-PARADIETER '.'SET AT 0.tlAIN274O16 6.') ?IAIHZ79O
189

4"0 FORMIAT lSX,'SINE SWIEEP VISRATION9 LEVEL'#12) M124500 FORMAT (5X9'THE DEFAULT VALUES ARE:'/5X,'G-LEVELx6 $'/SXRANGE ',MA1N2770
I-OF TIME TO 0E INVESTTOATEDX0 TO 10 MIIN.*/SXP'IF YOU',' WISHI THE OMIAIN2780ZEFAULT VALUES. ENTER ZERO, IF NOTP ENTER 1:'I MAIN2790
510 FORMAT (SX. 'ENTER IN ORDER. SEPARATED BY COMSAS OR SPACES: '/SX. 'G-tIA12800ILEVEL. TIME IN l1IN:'/SXP'I6 LEVEL BETWEEN 0 AND 103'1 MA1N2810
520 FORMAT (SX. '6-LEVEL OUT OF ALLOWABLE RANGE--' ,'PARAMETER SET AT 14KAIN26201.0 a'l KAIN2630
534 FORMAT ISX9'SIfl-FIXED FREQ. VIBRATION. LEVEL' 123 flA1N28'.0540 FORMAT ISX.'THE DEFAULT VALUES ARE:'/SX.'G-LEVELs6 G'/5X.'RANGE CFMAIN28S0
l'o' TIME TO NE IHVESTIGATEDxG TO 10 flIN'/SFXo'IF YOU WISH THE 't'DE?1A1N28602FAULT VALUES ENTER ZERO. IF NOT, ENTER 1:') MAIN287u
SSG FORMAT (SX**ENTER. !N ORDER, SEPARATED BY COMMAS OR SPACES:*/SX@'GMAIN28B0I-LEVEL. TINE IN HIN:'/SX,'(Gm-LEVEL BETWEEN 1 AND lO0)1 MAIN2690
540 FORMAT (SX, 6-LEVEL OUT OF ALLOWABLE RANGE--'P,'PARAMIETER SET AT 13MA1N29001.5 8') MAIN2910
570 FORMAT I lX/SX, 'ENTER THE FOLLOWING MANUFACTURING PROCESS DATA' P, MAIN2920ZLEVIL%*I2//SX.'IF MOIEL DEFAULTS ARE DES1RED FOR ANY ITEM* ENTER ZMAIN29302ERO: '//SX,'FIXED TEST COST IN OOLLARSX') MAIN2940
S44 FORMAT (SXt'VARIABLE TEST COST IN DCLLARS PER 3103*') 31AIN295059" FORMAT ISX.'AVERAGE COST IN DOLLARS FOR REPAIR OF DEFECT'p' DETECTMAIN2960
1ED AT THIS LEVE!Lz') KAIN2970400 FORMAT (SXASSEMBLY DEFECTS AT THIS LEVEL AS A FRACTION ','OF TOTMAIN2980
ZAL PARTSxS) MAIN2990410 FORMAT fIXoF4.1) MAIN30004*0 FORMAT 123 1XF11O.6)) MAIN3010630 FORMAT fIiX) MArN302O440 FORMAT (WX////14X.8f1 w'), * SELECTION OF PROGRAM INPUTS AND ''oPTINAIN3O 30
1OS .('')/XI THE MODEL DEFAULT IS DESIRED. ENTER ZERO:'//5MA1N3040ZX. 'OPTION A FINDS OPTIMAL TEST SEQUENCE TO ACHEIVIE A'.#' GIVEN PROOlIAIN30503UCT'/SX9' RELIABILITY REOUIREMIENT'//SX9OPTION 5 ','OPTIMIZES PROOMAIN3060*..10?C RELIABILITY GIVEN A FIXED C03T'//SXo 'OPTION C COMPUTES TEST STKAIP43070SRINGTHS OF EXISTING SCREENS'//I MAIN3080
"45 FORMAT (1X/SX,'DESIRED SERIES IITBF OF NEWd SYSTEM (OPTION A ','OHLYMAIN30901.FOR OPTIOUS 9 OR C '/SX.'ENTER ZERO)') MAIN3100
"40 FORMAT (lX/3X, 'COST OLOGETE OPTION B ONLY.9',FOR OPTION A OR C ENTEMAIN311OIN ZERO)') MAIN3120
470 FORMAT (1X/SX. .'TOTAL PART POPULATIONI ND DEFAULT AVAILABLE)') lAt!N3130480 FORMAT (1X/SX, FAILURE RATES Of GOOD PARTS; GOOD CONM4CTIONSa') MAIN31404"0 FORMAT I1XoSX,'PART QUALITY DEFECTS AS A FRACTION OF TOTAL',' PARTMAIN31SO
132') MAIN3160END IIAIN3170
190
PROGRAM LISTING FOR SDO1. FORT
191

ZIE~tSR 1 MAIN 10
01MENSIO4 NIS), ADEMI), F(I1.4sS), A1(11,4tS), UZtl1,495)# "AIN 30OCTI 5,5), MAIN 351CR1ES63I, CPZ(39519 TS(20,lS0019 TCEZO,1300), N1(Mv) NF(20)o ISCUWAIN 40
M(). 1(11,4,S)o 1511 17000), TC1117000), SCO$T(5,3), IAUWAYI201, MAIN 50OTIMM(3,), MAIN 553 155(20,1300), PARRAY(11*495)9 ANtAX11(3)9 *111NI1(31* A*IAX12(319. MAIN 604 AMIN1IV319 ANAXZI(S)9 AMINZIXI), A*IAXZ2(3), A111N22(3), AMAX231 "AIN 7053), ANIN23(3), AMAXZ*(3), AHIIN4(3), AflAX31(3)p AIIIN31(3) AI'AX3Z(MAIN 80631o AIIIN3Z(3 AMAX41(3), AM1IN41(3)9 AIIAX421319 ANIN4Z(3), ANAXS1(MAIN "073)o AiiINSIt3) ANAXS2t3). ANINS213), X(l1,*,5)vT3511170003 .. AIN 100DATA N4P.TSTC.TS3,TSS1,T31,TC1/20*0,14100000./ MAIN 110DATA PAPPAY/220*1 .0/ "AIN 120DATA PvFvl1,12/SG00'.0/ M.... AIN 130DATA NsSeS/ MAIN 1*0COI9ION ISC* MAIN 150CALL DATA (NCYC.M.PDIEP,CS!O0,E.ITVNAOE!PCPNW,PFp~,R1i2,Ckl#CR2XMAIN 1601HThPLEVELIT'VPAIAX11,AMIMIiNAJAX12,AtMIN12.AMAXZ1,AHIN21,ANAXZ22AtIAIN 1702"M1N2AlIAX23,A"IN23,A*¶AX24sAIIIN2*,tAIAX31,AIIIN31,AMAX32,AI¶IN3Z.AaIAXMAIN 180341 .AMIN*1 ,AIAX4tAMI¶N42 PADAXSX ,IINS1 ,ANAX52 ,AMINS2 ,NPARTS) MAIN 1900READ (2,*) 15CR . . .MAIN 200WRITE It#*) M,NPARTS#POEFPAOEP MAIN 210READ 413,0) XNOPXLA*IPIXLANP2,ZXLAMqC1,XLUtIC2 MAIN 220LLv0 MAIN 230AOINuO.G MAI" 24000 10 Z12.M MAIN 250
le AOIH'OIkON*ADEF(I) MAIN 260OINvAOIN.POEF MAIN 270IF (XrVT5F.EQ.0.0) GO TO 20 MAIN 280PRFEl./XrTff MAIN 2900F"~0.0 MAIN 300011544.0 MAIN 310OPT32uO * MAIN 320
~32,8Z0. 0 MAIN 3303RGOuXMTSF "AIN 340
:0 00 100 ZI'1.M MAIN 3300,1l21011) MAIN 36000 170 1221,NI1 MAIN 370LLuLtl. MAIN 360H*30 MAIN 3900READ 410,*099M30) AX,81 MAIN 40060 TO 40 MAIN 410
30 A120.0 MAIN 420SI'S *0 MAIN 430
40 00 90 KK4u1,ITV MAIN 44000 "0 KX3s1.XTV MAIN 450DO 70 KK2'1,ITV MAIN 46000*60 )KX~x1,ITV MAIN 470muIVUMV MAIN 48000 S0 Iu1,NCTC MAIN *90
s0 PAMVA'V(II,I,1)sPfI,Il,1Z) MAIN 500CALL SSPROS tKX1,EK2,XK3.KK4,I1,I2,PARRAYNYCc,C1,A1,e1,TVIygqOWsMAIN 510
IC~tW*,TIMV.A??AX11I I1),AMtiIXl(I1),AIAX12II1),A"IHIIfl21),AMAX21(I1)sAMAIN 520211121111i) sAMAXZ2( I11 sAM1N224 Il) ,AfAX23(11) ,A11IWZ3( Il 1,ADAX244 11) 9AlAIN 130
1.92
MUM 11) @3ANAX32t141) AMZN311 21) tAMW321 11) PAD43g~),AftAX*413,f 1) AKA W40RN1Nf4Il1sAMAX42t 13,1)AIN421 .III AAXSl( I3,AKVG1111),MIAXS2(I 13,MAIN 550
IMIMM(1111MAIN 560CALL SCU N1CNNpUpONAVpAtp1U.Tu.R,5.IA1 570.?orC0S7,Z1.U.5CO5T,TcflIN,O.O,T~nW1 NPANS,Xd0P,XLAtIP.XLAflPZ,XLA)1CMAIN 340
ttlXI.ANCl X) "AIN 5907551LLoMV)WSS MAIN 600751 LL.IW3'SMj MAN 11 10TCtLLPIO3TCOST MAIN *10
60 wffI)GJ MAIN *3070 CO4TIMA MAIN *40
IF 111VZ-)l14.I-3 $00100.60 MAIN 650so CGWI1J!F MAIN *40.0 CONTI""E "AIN 470
Ice C014TIN4i1 MAIN *00D0 110 ll1,NCYC "AIN 490
110 PARRAYIII1.Iljul.0 MAIN 700NIl L)UII MArm 710IF (LL-9) 1700,Uo,13@ MAIN 720
120 K1UN1(LL-I) "AIN 730so "O 140 MAIN 740
130 KINK MAIN 730140 KZ31I(LL) MAIN '760
NS!u~lE AIN 77000 1)4 J1'1.x1 MAIN 76000 150 JZVlgEZ MAIN 7901187551LL.J1)fl1.0-T3S1LL-1.J1 ).TSS(LL-1,J1J MAIN I"5UU751LL-) ,.1 34 1.-75S4 LL-IJI P T33751LLJ2)'TUILLJ13 MAINI S00V3TCILL-1,J1)*(.1.T5S(LL-1,J1,p.TSS(LLJi,.TC(LLJg, MAIN 010PWILL~eutVLL)*1 MAIN 600JJUWIPLL) MAIN 03051014 jJ)UJ MAIN 800TIV(JJIlmi MAtN 0507S11jilaU MAIN 800TCI~if a "JPuAIN 070?533(JJ)tI MAIM 0"5
'50 CONTIHUI MAIN 880CALL RAWO ITS1.TCI#TSS1,N5EQvStQ1,TVI) MAIN 09"
Q~mQ4MAIN "[email protected] MAIN 910Kno MAIN 920DO 140 IEI.NSIO MIAIN 930IF soS()E..S.WI~().ooop0 To 1*0 MAIN 940If 11S43-S/StI.Tg TO 160 MAIN 950IF (ITCIZ()-WC3/TC1113.LT.1) GO T0 160 MAIN 9*0QCsTC1IlI MAIN 970
@537511)"AIN 900XKOK. MAIN 190
TCILL.X)*7CI13 HAHINIOOO754 LLE 3u751I3I AMAIGl"755 LL.K )1TS51( 1I MAINIOIS5104 LLAE PSE~IGIM MAINZOZOIVI LL@K PETYIl ) MAIN1030TI~rlE io. MAINIC0075111)a0. .... AINICSO
193
TSS1(l'0. ArNlO*D251011 )SO MAINIO60TVIIMuO i'AIN1070
160 CCHTDWJE MAIN1080170 COHT~flJ 11AINIC90166 CONTINUE fAIN1100
CALL 3EARMH (LL.K.CC!Q0,51!QO,SE0,TtTCTSS,TS,!ARRAYTCIIINTSfAX,IIAIN11101IN.HX) flAXN1120CALL REPORT (NNeCCN,ZSCRgp!POIHlAo0!P,CpNR,P,F,R1,R2,CTCR1,CR2MAIN11301.ZAP*ATA1,81.ITVTC11!N,TSlAX,NPARTS,.XNOP,XLAflPIXLAMP2,XLMIC1I,XLAIIAIN114OIIICZXAMIAXIIPMIN11,AfAX12 ,AMINI2 ,A1AXZ1 ,APIIN21,AfAX22 ,AMh22 ,AIIAXAIN115O323,A111N23,ANAX4,AH!H24,AflAX31,AIIIN32.AflAX32,A*11N32,AtIAX41,AflIN41,flArIN160*A11AX42,AMIIIH,AMAXS1,AIIINS1.A11AXSZ,AIIINS2) MAIN11700231.1 SUSC)4 1AIN117SEMG MAINilSOSJ09OUTZN! SCREEN tNCYC,11.NPO!POINAO!*PFpF,,RZ,CTCP1.CR2.SSSCR! 10111,TCOSTI1,12,SCOSTTCfl!NPLAGTXII!,NPARTS,XNOPXLAIPIPXLAIIP2,XLASCRE 20VICIPXLAMC2.X) SCR! 300ZN!NSION X(11,49319 P(1194,S), F(11.,4#5. R111.#4*53 Q(20), 5CR! 40113CR(31, TZI!E(3*51, TCOSTL(3S), COSTLIS), N(S), CT(S9SI, CR1(SS)SCRE 50to AOEF(SI, CRVtS,S19 SCOST(5S,),Rt(11,4*5I SCRE 80COIWION ITCR 8CR! 70PLIFT211DEP 5CR! 80IF (FLAGA.61.. WRITE (13,*) TrM(1,ISCR(1I)),TIM¶( 2.I5CR(2)),TIM!SCRE 90l3oISCR(3)l 5CR! 100IF (PLAG.6T.@.) WRITE (2#10) Pil1,1,SCR(1)),P(1,2,ISCR(2))tP(193,IS5CRE 110
'"(3))5CRE 120NCYC~aNCYC*1 5CR! 13000 10 Iu1,NCYCl 8CR! 14000 10 JAI,"1 5CR! 150NJUN(J) 5CR! 16000 10 lKu1,NJ 5CR! 170
10 X(IJ.K)=@.@ 5CR! 180XI1,1.1)XAOCF(1)+POEP 5CR! 19000 So0J10,1 5CR! 200"NJUN(j) 5CR! 21000 52 Kal1,NJ 5CR! 220IF IW.1) 2@,20,40 5CR! 230
10 IF Q-1; 10.50.30 5CR! 24030 CALL fl!A4 (XNOPXU11C1,X(1,J-1,N(J-1)),TIME(J-1,NEJ-1)),P(IJ-1,H(5CR! 250
IJ-1))#FALL) 5CR! 260PLfPTSPLE!~PT' 1,J-1 ,NfJ.-1)) 5CR! 270Xl 1 JK )'X( 1 J-1 ,NJI -) I-PALL.AOEF(J .1 CR! 280so TO 50 5CR! 290
9, ~l,,K)P(1JK1)*(1,,X-l CR! 300PLlFT*PL!FTPTDI .JIC-1? ICR! 31060 10 S0 5CR! 320
*@ CALL MEAN (CF0IPXLAi1C1,X(1.J,K-1),TIIh!(JK-1),P(1,JK-1),FALLI 8CR! 330PLEFT2PLEFT*P( .JK-1) 5CR! 340XflpJvK)8Xf1,J.I(-l)-fALL 5CR! 350
so CCMTIIEJE 5CR! 360IF IFLAG.ST.D.) WXrTE 12,101 X(1~,1,1,X(1,2t1),XI,3,1) 8CR! 370
C.. If IFU.GAT.@.) )RITE(6,4000)t(X(1,JIU,J21,M),Kz1,3) 5CR! 380IF (FLAG.GT.C.) WRITE (2,') X(1,1,5),X(1,2,5),X(1,3,3),PLEFT 5CR! 390CLfFT2X( 1p3,3 -PLEFT 5CR! 400
194
~au,.scuc 610DO 100 IuIPCY m CR! 420
5CR! 43000 60 Jat SCRE *50
00 6c KGINJ 5CR! *404. XI.11,1uX1.,1.),(-FIIJd~3.PIJKI.4-R1IJK))e(Z,,KPCR!470
@090 juion scRm 4e@"UN~u(J) 5CR! 490Do 9 u.J scme 500IF (XtI.J#X).LT.1.0) 60 TO sen 5 sic51IF (J.mE.I.ANO.X.EQ.I) 60 TO 90 Scat 52oIF (J.GT.I.ANO.X.EQ.1) 60 TO 70 5so! 530IF (J.O!.l.AN.K.GT.2) 60 TO 80 5$"! 540so To 90 5CR! 550
70 XtZ~.1.J,)mPqtIpJ-1,4-)bx11J1N - I1PIJ1)'-(SR 540I9Jq))*f-*2Ipjqj)*1Ifjl)5CR! 570
soTOW "scum seaGO X(I1,1J,EIuPqI.1,JK-1I.X(#IJK-11.(1-P(IJK3IU(1-FIIJK))w(1-SCRE 590
1RIptIvjqKJ)'EImJpx) sot! 40090 CONTflJ! 5CR! 410100 coNTP4I! SCR! 420c If IFLA6.6T.G.) WUITIr*4,40I)((X(ZJE),JaIN3.Ks1S) 5CR! 430
3"GU.0 5CR! 64000 110 IU1.NC'rC 5CR! 450PIIWN) 5CR! 440mWu5U9.tAx I ol,90) -5C"! 470
110 COPYTUIM 5CR! 440OCUTuUMM SCRE 4905M1.f I IXNP-CLE"T3)CLME1.4 PfLOATI WRARTS J-Pt!PT )OKUNPI.CLWT'*XL**SCRE 700
LC2*PLEPTXLAM"P) *. scum 7103Sal.*0-OOUTiOIN 5CR! 720OtLTAuOV#-OOuT Ecam3oACOSTv0.0 .. . . . SCR! 740TC03T90.0 SCRE 75000 120 JN1.M 9CR! 76000 120 Kul's 5CR! 770
1l0 5COSTtJK)SO.0 5CR! 780IFPL~AO.N!.0.0) 60 TO 140 SCR! 790
00 130 zuI.*.CrC 5CR! 800
COSTOCTI 11.12)*"CR'(Tol I,)-XI Itt1.SP .) SCRE 820130 ACOST*ACOST.CCST SCum 840
60 TO 170 5CR! 850144 cc 140 Jet," 5CR! 840
00 140 Eul.S S CR! 870"[email protected] 5CR! 880
* SPDWTSI.@. S CR! 89000 150 1I.,cTc SCRE 9005(9t51u5(RFT51.(1.-P(I.JE))UX(Z.JxI . CPE 910srSzxYSZUS"Ts2#xfIjE) 5CR! 920
150 CONTIP1M 9CR! 930if (ISCpfJl.me.K) go To 140 5vcR "9*0IF (Pf1,JvISCR(J)P.GT.*.mpf 60 TO 140 5CR! 9505COST(JKu5UNTs1'C"ZwJpKJ*CTJoK) SCRE 4
195

140., ?COSfTuCOST.SCOT( J.K) 901E 970IJITCuTCOST .... .... SUE 9"0so T0 1I0 SCRE 9"0
170 IF (MIN-0OUT.GE.1.0doI To ISO ......0.. SCRE100008LTAm1.0 SURIlOlO
IO TCOSTRACOSTiOELTA SUE 10201I" RITU*H SCRE1O30
OEMU StCHK SCRE1039
SWUO*IITN RAWK tTSI#TC1.T3SS1,NSQS!Q1,TVI) RAWK 10D47!6ERuE TVl(I7Q0001,SlE1(I7000) RAWK 20DIPIESIGH T01(170003, TCI(I70001,TSSX(I70001 RAWK 30"emUSEQ RAWK 40"fIuNE RANK 5O
1s "1IHtT(N1/2. I RAWK 40IF 0.1.)60 TO So RAWK 70
M14-NlRAWK 80jai RAWK 90
to Inj RAWK 10030 Uuz*nI RAWK 110
IF ITCltI3.LE.rCXI U)) 60 TO 40 RAWK 120AU=TC1IZ) RAWK 130*ISTSIl( RAWK 140C1UTSS1(I3 RAWK 145A2*SEQ1II) RAWK 1S0sturV1(l) RAWI 160?ClU) .:It LI) RANK 1707511! uTSM.f ) RAWK 1800TSS1(XI)uTSSI(LU) RAWK 185S39Q1!)aSEQ1( Li) RAWK 190TVitI XJuTV1I LU) RAWK 200TCI( Li )2AI RAWK 2107511 U 3ul ..... RAWK 220TSSI(LV:* C1 RAWK 22SSEZItLi )sAg RAWK 230TViIL1RUS2 RANK 240131-NI RANK 250IF (1631 TO 7 30 RANK 260
40 JUJ~i RAWK 270If (J.LE.Hi) 60 TO 20 RAWK 280607TO10 RAWK Z90
so RETtlRN RAWK 300£16 RANK 310SUSRUJTIhE SEARCH (LLNOCIEQOSRE43OSEOTYTCPTSSTSIARRA~tTCHIIISE 10
SEAR 20INTEGER 79,5.1932 SEAR 30INTEGER'? TV(20.3003,SEQ(20,3001 SEAR 40
- OXHENSION TCI20,i5001# TS(20,1500), IARRAY(20), X4li,4,S) . SEAR S0#*TSSE 20*1SOO) . . SEAR S5
PLACE'SRfOO .. SEAR 4000 10 lXI.NO . SEAR 70TCTOTzTCI LL.1)*OINwTSSE LL.I) SEAR 72TCI LL.I 337CT0 SEAR 74
10 CON71)RE SEAR 90OTCMM!NTC( LL#NO) SEAR 100
196

to IF (CR4003 30,40940 .. .......... SEAM 12030 IF (3hE00) 140,1*0,640. SEAR 13040 KENO ........... SEAM 140s0 IF fT (LL.1(3-CRP.OO3 00,0960t".... . SEAR 15060 1(31 SEAM 16070 If (?S(LLE-SMEGO) 100,AM,44 SEAM 170
60 S12SEO(LLoK3 39AM 180TOTYI LLKl ..... SEM 190!AMMAY( L WaT....... ........ 3EAR 200TMIINUTC(LLK) SEAM 210TSII*XuTS( LL,1(I SEAM 220K931 SEAM 23060 TO 110 SE. . . .. 3AM 240
90 a(K-I SEAM 250IF fit) 1409140950 ....... SEAR 260
Ice zK* ... .. SEAR 270IF 1K-NO) 709709140 ........ SEAM 280
110 IzLL-I SEAM 290120 IF (1-1) 15001509130.... ...... SEAR 300130 sustaflei.51 SEAM 310
TsTV(Z,1.31 SE .. ..... 3AR 32052IM SEAM 330Sias ................................. SEAM 340ZAMMAVI I liT SEAM 350IMI-1 SEAM 36060 TO 1t20. SEAM 370
144 WRITE (4,1803 SEAM 38059100.151LL.NOI SEam "00GO TO 20 SEAM 1410
150 IAMMAY(1)3s SEAR 42060 TO 1I SEAM 430
1*0 WRITE 14692001 SEam 440STOP 39SAM 451)
015.5 %0CN1 sEAM 455170 CONTINUEI SIAM 460
2SM~ORPLACE SEAM 470RCTURN SEAM 4650
C 3EAM 4"9180 FOIMAT (/IXMEOUIMEPIENT CANNOT BE IWET/1X3 SEAM 300200 FORKAT 1/iX. REOUIREMENT CAN4 BE MWIT WITHOUffTEST5 SCREENS' 3 SEAM 520
DoC SEAM 530SUBPOUTDIE SSPROS 1K1,K2,1(3,1(4,I112,PNCYCCTA1,b1,I1VHOWSPWMSSPW 10
IP1.TtWeANAX11,ANINI1,AJIAX1ZAMINIIN1A1AX21,AMIN2LM¶AX22,A111N22,AIIAXSSPM 20223 ,M1I4t3 ,ANAX24 ,Al1I?l24,Ai1AX31 ,AIIZH31 ,AIIAX32 ,A111N32 ,MIAX4I ,AMIN41 pSSPW 303ANAX42 ,A~r*11N2AfAXS1 .ANINS1 ,AIAX52 ,A111N52 SSPM 40011*SION P111,4t53, CTI5.53, TIfl!3*53 SSPR s060 TO (1097091400,2,203,ol 22 SSPR 40
10 CCNTIWE!, SSPR 70C TEST ONE: CONSTANT TEIPERATRE( CT) SSPI 80
RWv4 (AMAXII-AMINIHI 3K1*AtitiN1IOTV-ANAX1I /( IN-I.31 . SSP 9R~zSS4P~2. 3SSPR 100
TT3( (APMAX12-AHZN123N(2.ANZN1Z'ITV-AJIAX123/( ITV-I. I SSPM 110MOI~sr3 SPO 120
0TUALOG(EXPfI1 31.3 SSPR 130
197

P~y@ '.Of l.-EXP -00- 093"000.$Orr**e. SaEC.Oyg. 7,1 3 SD0 1M
15.1-W23110 170TIf (8Z) 198034 1PSI
60 TO 380 ... 5..0210i*0 CMI.M849t .15 )oommsuCe4 559 220PRt
60 TO 350 . .5... 903N 30H CTMIZ3, ff2 )HWUPH* 1590240
60 TO 350 .... 5.9.....2.50N S00 C?( 4,5 )It 1 SUCPWI 5.5..90P 200
00 TO 350 5590 27070 COWIITPOI SUSP too
C TEST 1M02 CYCLED TZYPEATWE CYT) ... s~p 2"0WOA6S( MIAXtl-~IA2t) 5590 300
071311 I A1AX23-AM1th23 )aI3.A*11H331TY-fltAX23 3/f ITV-I.J I SPN 3100T8AL0O(6XPI I. J.T1 )*t.7 5590 320*Cyst I A~X4-ANIN2I4 IaI4.0111H24O1TV-AftAX24 /f Ml-1.I 33 USD 330?Tot. SDSv 3*0DFOT8.6531 1.-EXPI-.0023'*M.6WTT0ICYT.S3OT)I SSpp 3505531 * -PDFT s3PR 3600IF ft *IIAXZ3-2flIH23 P.E3.4fl1423I17V-AftAX23) "9090,80 SSDS 370
00 HOISmff4CYTO4. /VT,(2. ORR /f OTOOO.3 USD5 380TIME f 11. 12 1 MoI.s SSPI 39060 TO Zo0 SDSP 400HO W":-S SUSP 410TIPW(1vItU I2 iuwaw USD0 *20
I"0 IF t91) 110.1109340 SUSP 430110 60 TO (t12,130,14091501, 11 5590*440120 CT( 1.12 ) af0. IS).IOWSSCD9I 555 450
400.0 350 SSDS 600139 C~T 2. 12 1 v10.1S)eIRMSoCDII0 5550 *70
go TO 350 5350 *80I"0 CTI 3.12 )vtNotWSCSII 53PW 4"
so TO 350 3SD0 500I" C714.12 lOI sm SoCilm 3590 310
go TO 350 USD0 520140 CONTINUE 33PR 530C TEST mTWE: 11PM10 V1B9ATZON( OV) S3PO 540
"66311ANAX31-AUII31 3@4( ANtIH31RZTV-ANAX31 3/C flY-I ) 33PO 53077.6 I h11X32-AMI132 )t(2.A"INiZ'ITV-*flAX3Z3/I ITY-1 *) 5590 300NOLP*STT/60. 33PSD 570M6u.204*W6.4.*0 5390 38000n.*1*4466-. t 3SP 08290o oWYU*Oo*E 1 -IXPI -77O./053 31 5550 6000
- 55*1.0-Wrv 5550 410T71111111 * 1 '0tVS 5550 020IF (all 170,170,340 5590 030
171 00 TO (18019,2100,2103,o 11 SSPR 60*1I" CTtS.1218MI.S3IIOWNS 33PR 603
00 TO 350 5350 6001I" CTI92.123f0XsWIoWo~s 550 070
60 TO 350 33PR 080
198

....35 ............ .......... 700 . ...
so TO350 55W 720Ile Cmvva91O sm noc TimT Fowl SZHE-hhwhp VIWA72ON(SSVU 55 740
77*g (A A#-ii DIN4) E.*MIZHOEUIIV-MIAX1)/(ITV-1. 1 55WQ 710NW*U"TT/40. 55WR 760
~~.O.I . -(PI-T~e.8S R 15 810055~*-~Uss" doo
C CWPOAlOOULI LEVLS 55W 030IF felt ?30.1309340 5510 040
134 0 TO 1 55W 030M4 CT1I 21,ZR(S.LSI.1OIORS"CllNWp"
so0TO350 55W 070as0 CYI [email protected]"I .SP 55Ws
........ ... ..W. .
C CMUPH04T/SVSTUNLELS 55WR 900
6060 M 3914OOO1CH .... .310 55 150
273 CR4.11R).WOOWSCRO 55W 930
S"4 COETDEJ! 55R 5050C TEST PRY! S SIN-F IXt VIaRATW4ISFT ( I 5Wa 540
TTS( (AMAXSI-AN11451)0K2.*flZHIlZTV-*IIAXSEIt !IV-1.) 55WN 970U*EE4AnAX31-M1GI)513W1,4ZN51@ZTV-APtAX51/.t TV-1. I 55R "50
NGISU?#'0. 55R 550
Wa.043'6..35 SSWO1OURW5O00f1. -VW( -1e. 2/90) 11 SPR020
Uo5a1 * [email protected] . . .. . .WOW 3ss"10
C CWARO/MWLE LEVLS SSW1IOSOIF (Si) 990,2900340 33110106
I'm 60 To 43000310OUS0,3301, 11 SSPP1070394 CT(%.I~l)U(.1S)OlXWS.CPRI ... ...U 3SPOI080
so0TO350 SSPRIO90313 CTI l.UJut0.15)uI4KMS*CP 3SSW1100
60 To 350 S3PW11IOC EWJZPMWN/SVSTVI LEVLS SSWI11Zo320 CVI 3.22 )uHCOL CPRI SSPOI13O
60 To30 330 R5W140330 CT(4912 )9OMDSCPM .. 33SW113
so To7 310 SSPPI11034 CT(Z1.X23a32.WOMS*A1 . SSPOI170
00 340 tu.NCYC 33PR1980PII.Z1,Z2)83SSSPI0
340 IF (NS*S.EQ.0.01 P(It,11.1231.4 33PRI2S10lMUM~P 55W1220
199
SLIOAIT)E REPORT "vlCVC,H9 ISCR vPOPGU.INA0U.CPW Py FPRIPRE eCTvCpt. 10.1R1,CA2,IAWWAY.AlStlTVTCfllNTS"tAXNpARTS,#Q4OPXLA,1,1,XLAM~P2X~LAEPG 202C1.XLAIIC2,X.AIAX11.A"NZN11.M'AX12.AMIN12.AflAX21,AI'INZ1.M1AX22.NIIN2IEPO 3032 ,AIIAXt3 ,AIN23,AMAX2',,M11H24,ANAX31 ,AtIII31 .M1AX32 ,A*1N32 ."A*X*1 AAUGEP 404MIIN* .MAX*2. ANZNI*2 *AMXS1, AINSI#1 AMAXS2 .AlINS2) REPO so
REAL LCOST( 5) REPG 60OMElNSIOPI AflAXI f3). APITHI1(31# ANAXIZ31# AWIINI() AffAX21f3)v ANUGO 70
111IN2113)o A*¶AXZZ(31, Aflfl(22(3. AMAX23019) AI1flI23M3) AflA24(3) AREPO 402flV12*(3), AIIAX3143,9 A?(1N31131, APIAX3213)9 AMI!32(31# AtIAX41(31. ARIP0 "03MIH*1131. N9AX42131P AflI424319 AMAXSIM3) AflINSI3). APIUIMXP() AREPO 100*lMIN52 3 RepG 110oIIIINSION "PtS5,5,5) M 5). P411649S)4 M11.9.S4 ISCRMP) REUG It0
1R1II1,495), R2(111.4,5) CR115.5)t CR215PSIP CT15.5), SCOMST(SIP REPO 130lITSTIS), IN4S). ZAMRAY(2019 ANP45,SS), A09FISJ. TIME(3p§)* REPO 140OWUP149Si REPO 145REWNDP 10 REPG 150DATA NP/12501/ REPO 16DATA LCOST/S*0./ REPO 170DATA TEST/CT .9CYT .. .....%SFU' REPO 1o0DATA AMP/1ZS'0./ Repo 190INS REPG t00OG 1,30 IIS1,N REPG 22000 130 122.1. Repo 230READ (I0,3) A1,81 Repo 240131.1 RUGO UsIR(1)uIARRAYMI RUGO 240GO TO l10980.'0,10,10 It REPO 270NPfII1,2,I)*IARWAYMI . ..... U.... EO 260GO TO 120 REPG 290
10 00 46 Kut.3 Repo 30013f1vWQUOfI K-I )PITV4P*(3-K)) REPO 310IF (INIK-1)) 30,30s20 RPO 320
to MP0121.1.4-K ISINTI PLOAT(I 3K-1) 3/I LOATI VIv) '*3- )*..99999) RUGO 33060 TO *0 RPO 340
30 MPfI1,I2P4-K)11ITV RUGiP 35046 CONTIPJ REPO 340
60 TO 120 REPO 37088 00 70 Kz2,4 AREO 360
IRM ut0(lR(K-1),ITV'*14-K1) RepG 390IF (13-1K)) 40,40.50 REPO 400
so NP111.12.5-K)INmTIFLOAT(IRIK-1)1/IFLOAT1IrV))'*14-K)..99,9"09 REPG 41000 TO 70 REPO 420
G0 HP1II1,12,S-K)xITV AUGO 43070 CONTIwmJ REPO *40
so TO 120 REPO *5060 00 110 K*295 REPO *40
131K ):t0fl0~ 1K-iI ,ITVW**fS-K)) REPG 470- If (IMI-1)) 100,100,90 RUGO 40090 NR1111.6-K)SINT(FLOAT(IR(K-1))/(FLOATII7V)).g-K)..9090939 REPO 490
60 TO 110 REPO 500100 PoW 11112 .4-K)SITV . .... ....... RUGO 510110 CONT11PAJE REPG 520
60 TO 120 REPO 530120 CALL SROPP (NRf12 v12 a1),NPIf11,I2,2 3,NPf I1,12.3),NPI 1,912,4 )eIZREPG 540
1,PNCYC.CT#A,81.1,TV,g$OtpSCP9IR.TIMEAjAX11II1),AhIH11gI1),MeI1*REPO 550
200

811) 9AMNIVitIi) AMAXt4I(ID pAITMzu 12) sAMAXz1132 ,AMI~Uf IIIMtfAX234 NIPO 50311) tA11N23f III ,MPIAX244I) oAflIH24i 11) PAMtAX31E 113 ,AM3I#43 I .APIAX3I (REPO 570411) .AII1N3VI I1 PA*IAX41I2l 3,M1IN41I Ii) PAMAX*I% I1 ,AMII3*2 I PAM¶AX1(PO 300
$1)A5113,WN1IU,A'wXWE(I),AM~zftszh11 REP 590
CALL SCcUED 4NCYCo,,MPO5IP .IHAUE'P .PF,P Ri ,i#Ct~CRI#CiiZSSNPCOEPO 6101TZ1,1l.5COSTsTCMIN1ol.TPTh1,NPNp~TsXNoPXXLAa1xxAMPZ#X,.AaMC1XLAMuEPO 6202CZox RE PO 63000 1*0 1231,1 REPO *4000 140 12TulS 4211 650
144 LCOST4Il3ULCOST4I13.sc0iSI(fl.123 REPO *601Q30 . . ... RERO 670MMT 1691601.. REPRO "o000150 I1180" REPRO 6"0
M4R4~~~~~~~~~~~~ In4. 33 MA4(I -DI*411 af 1413414 iv 3TVAHAREPO 700IX411 11) 1/( ITd-I. I REPRO 710
1X1I13(i3I ITV-1. 3REPO 730AMkfR4t1312u41A l41-iH2I3.pfl,,*zih1.yMqIo 740
114I13IDWITV-1. 3 *REO 750AW I 15,1 334AtIX54nI(I -ANVI(SI 1 I IP( 11,5,1 3.AtUIII6 II)O*T'V-AIWEPO 760
1X514133/4TV-1. ) REPRO 770ANRE 12.5,2334 4*IAX3VIVI -AMD6XI'I IilO 33UNR4Ai 11,513UINZ Ii *IV-A ft WPO 700
UGX3 D 1/1331TV-1. I REPO 790ANP4II192 sI183u4EAhX21t 11-AMMUM h0NPw411..1 IAm31114n3.zyv..AKARnPo 800
IXiii1M33/4TV-1.) 3REPO s10AMP( It *2 #2)4 (AHAX22(1' . # -AMIMZ41)391R11 #&v23.A1142III)*131VM4AWEP0 820
ZX22I1133/4 I'-i.) 3REPO 830ANN 11 P2 e3334 (A1AX23f ID -AH134234 133NR12 9 P 1.33AaqlH(11 M-MA"RPOI 8401)(23I1133/41T'-1.1 R EPO 805AN4R4 11.143341 AMAXZ*4 Ii AM142*( 113 3W4R4 1 .143*iAi"l4 11 301T-AIANRIO 860
1X2*4t113 /4ITd-1.) RE3!PO a70MNIIRE113,1 334 A1AX31( I1)-A111131( Ii)13W4R4113,13.d111132(113.ITV-MIAERO 800
3x3141133/f7V-1.) REPRO 09"ANIIRE 113.#2318f AIIAX321 1 Ii -AM9424Ii 11))*W 1132, j.M41 I#Ajk9Ij 301V-AMAN!PO 900
1X321XI/13IT'd-1. 3 REPO 910AMPf 11.94vt JM(4APIAX4( 11 -AMIIV4 113 WfR 11.4,s2 3.A111T424 1)*ITV-AMAREPO 920
1X42412)3WMV-1. ..... REPRO 930KTTat REPO 9*0IF (I5CII(13J0.23 KT3734 REPO 950W1TI 413,03 ANP4II1,ISCN4II,KTT) REPO 9*000 250 1211.3 REPO 97060 TO 4150.1*0,10.180,19I. It REPO 94o
150 IF IANtR4I1,1,2.EQ.03 60 TO 200 REPO 9"060 TO 220 SEP01000
160 If 4A11PI11,1.33.fQ.03 60 TO 200 NREOI0Os0 TO 120 EURalaoO
.170 If A14,32..0 60 TO 200 3RE01030so TO 120 0111I024
100 IF 4APIP(9491.*13.U.01 60 TO t00 NUolOGO TO 120 REUROI60
1I" If 4A11R411,5,3.9Q.03 GO TO 200 PEPO1O70G0 TO 220 REUROI80
200 00 210 3431,4 REUOI1119210 ANRI1,12Z.Kjz0. 3RE01100
201

220 IF (11-1Q) 24092449230 ..... EPOI21230 MITI! (6,870) fl.LCOSTf1) ... ..... RP012201*0 IF (ZSCR(IM3NI.Z2) 00 TO0250 REPOI130
WRITE (6,460) IZ2.TST(12),(ANP(Z1,UXK),Ks1,43,SCOT(Il,22) REP01140250 IS"1 . ... NEPOI150
WRITE (6,2")3 PC0T.... REPO1280omm U11MCHK REPOI170RETURN REP01180
c RPOI0190260 FORMAT C1X//////////29X.,T 1 S T 0 1 S C R I P T 10 M'/39XP'PAAQUPO1200
IAMETEU VALUEVIOXTIST SZQUtHCE'PSX,'TYP9'p2XpNO. VP2Xs'NO. 2',1EP01210t2X*'NO. 3**ZXP*NO. 4',2XvTOTAL C0ST'P($)'/7X,66( *')//) REPOI220
ITO FORMIAT V *,6X'LEIVL'.ZX#t40. ,Il2939XF12.O3 REP01230a"0 FORMAT (' #P12X,'TEST NO. '*IZ,3X,AA,1Xs4F7.2,F12.0) REP01240Z"0 FORMIAT V* %7,p14/,Xp'TOTAL'p COSTA41X#OS,P2.0//' *,RP01250
END REP01270SUBROUTINE DATA (NCYC,fl,PDIPCR!qDpl,ITVN.AOIFCPWRPFPR,Rl,2CR1DATA 10I.CR2,XT8PL!VtLITYPAnAX~lAnzN11,AnAX12.AnrN12,Ah1AX2xAMzNZ1,AP,DATA 202AX22.A.'¶1N22,AMAXZ3,ANhIN23,A*1AX24,AI¶1N24,AMAX31,A111N31,AJIAX32,AMIN30ATA 3031,AHX41,ASmIN41,AIW*(4Z,AI1IN42,A(fAXSI.AMINSIAHAXS2,AMINS2,HPARTS) DATA 40DZIMENSION N(S), ACEF(S), P(11,4,5), Ft11,*4,5)v R1(11,4,33, DATA SOI CRI(3513 C12(S,53, AI¶AX11(3), A11IN11(3), ANAX12(3), AIIIN12(3)v ADATA 80219AX2101v) AtIINZ113), AMAX22(33, A111N22(33, AflAX23(3), Afl!N23(3)9 ADATA 703MAX2413), A11Th24(33, AIIAX31(33, AtIIN31(3), AI1AX32(319 AflIh32(31, AOATA 80*tI*X41(33. AM"N1(33, AIIAX42(3), AflZH42(3), AVMIA1(3)t AMINS1(3) AOATA 90511AX52133, DHN23..(14. ATA 100READ (4*,* NCYCNNPRT3,CRE00,EoITVXMTUPCPI(R DATA 110READ (4,3,1)03103 POlP . DATA 120IF IPOIP) 10#10.20 DATA 130
10 PDEuOG. OO1*PAR1' DATA 140G0 TO 30 .DATA 150
to POEsPOEPOIWIARTS DATA 16030 00860 let," DATA 170
READ (1*,SH09~4@3 AOEI!~) DATA 180IF (AOIP(I)) 40#40,50 . DATA 190
40 ADIFVINI). 00SU#NPAR DATA 200So T080 . DATA 210
so AOfP(I)*ADEF(I)mNPARTS DATA 22080 CONTItUe. DATA 230
WRITE (6,470) DATA 240READ IS.*) ITASLE DATA 250IF (ITASLE.LT.2) G0 TO 90 DATA 28014MITI (8,5001 DATA 270IF ICREGO.GE.9.19) GO TO 70 DATA 280WRITE (8,320) NPARTS,MIPPDEF.CREGD,XMTaF DATA 29060 TO 80 DATA 300
-70 WRIT! (6,480) HPARTS3flPOEP DATA 31080 WRITE! (8,5101
DATA 320WRITE (6,530) (IAOEF(Z)p,1i,) DATA 33090 D0 140 1221.fl DATA 340
00 140 12231, DATA 350READ (11,0,91021001 P(li1,12) DATA 360IF (P11,2l100,100,120 DATA 370
100 00 110 Z31,NCYC DATA 380
202

116 P'I,10,212u1.0 DATA 39060 TO 140 DATA *00
Ito00D 130 101,NCTC.........................DATA 410130 PII.111.22)aPll.I1Z2)......................DATA *20140 COMM"A.............................DATA 430
00 190 11*1,N................................... DATA *4000 190 321............................DATA *50woAn 489*01maso50 M01,1,1)..................DATA *40If (P11.I,2IM 1509150,170...................DATA 470
150 00 160 IulNCTC...................................... DATA [email protected] 490f([email protected] 500
FIX091210.0DATA 5101*6 F(I,9,42)20.0..........................DATA 320
600 TO 1I" DATA 530170 DO 180 1u1,NCYC.... ... .................... ........ ........DATA 540160 PII.utl1,2...................DATA 5501I" CONTDOJU DATA S60
0O 290 1lul011 DATA 57DDO 290 IZvlss DATA 560111A (990*EM*2001 *111,2,21I.2...........DATA S90IF (OU1012,12)) 20002000220...................DATA 600
'00 DO 210 IWI.Hcyc . . . . .DATA 610:10 *141.1,12)SI0.5.............................DATA 620
60 TO M*............................DATA 630DO 0 230 Ix1,NCYC ..... ...... ... DATA 640
23306l(.1Ivll1.2 DATA 4502*0 IF (M~1IN1,2911 350,250,270 DATA 66025 0.0D 260 IaI,.Crc ..... . DATA 670260 12(II1K23Iuo.S .... DATA 680
60 TO IVO DATA 690270 DO 260 laNt...........................DATA 700Zoo 12(2#Z101I)S2(1I1.1*1......................DATA 710
290. 3 COI*MI................... ......................... DATA 720DO *30 111:1..................... ..................... DATA 740RM 1evOX0)9 @3.. .. .. DATA 7*0
300 N1 0) 300,300,35 DATA 7603660 TO (310,320,330,3*0), 11 .... ... ... DATA 770
320 .CR11,#1124u.0 DATA 78060 TO 360 .DATA 7"0
329 C1112#Z21840. .. . . . . DATA 800so TO 340 DATA 810
330 CR113,12 )nO.8 DATA 82060 To 340 .. . ............ ..... DATA 830
M* CN1(OfZ2)'.@ DATA 84060 TO 360 DATA 850
.35* CR1(I1.123u82 DATA 860360 IF (53) 370*370.*20 DATA 870379060 TO (3809390940094101s 11 DATA 860380 CXV191123*5. DATA 890
So To *30 DATA 9003"6 CR2fC,12)'3*O DATA 910
go TO *30 DATA 920*00 C*1113,12)m990. DATA 930
203
60 TO 430 DATA 940410 CR2(*,12)8O.0 DATA 9S0
so TO 430 DATA %a0*10 CR2(I1.12)u03 DATA 970*30 CONTINUE DATA 9400
IF (ITAGLE.LT.1) 60 TO *40 DATA 990WPMt (6#3401 DATAlOODWRITE (~4,49) (JmCRf(Jv1)vJu1.fl) DATAZOZO
*40 D0 *50 I16,(OYC OATAlOED00*450 Jul."l DATA103@"NJUN(J) OATA104000 450 K01,34J .. .D.ATA10SOF(IpJq,8)F(1,JoK) DATA1060RZ(IojqK)w~l(1,Jqx) OATAX070
*30 R2(I.JKl2R2f1.JvKa CATA108000*460 IZ21,fl OATA1090
C TEST ONE: CONSTANT TEMIPERATURE OATAliDOREAD (12.0) AMAX11(IZ),AMIN11(IZ) CATA1110READ (12901 AflAX12fIZ),AflIN12(IZ) OATA1120
C TEST TWO: CYCLED TEMPERATURE CATA1130READ 412.10) AMAX2ltIZ).AM!N2l(IZ) OATA1140READ (12.03 AflAXZZ(IZ),AMF4122(IZ) DATA12SOREAD (12.03 AMAX23(IZ),AMZN23(IZ) C ATA116DREAD (12.03 AflAX2*(IZ),AMIN2*( 12) OAYA117O
C TEST THREE: RANDOM VIBRATICH OATAliSOREAD 112o0) AflAX3l(IZ)tAflV5~1(IZ) DATA1190READ 412,0) AMAX32(IZ),A!-'132(IZ' DATA1200
C TEST FOUW: 31NE-SI4EEP VIBRATION DATA1210READ (12.0) AMAX*1(IZ),AIIIN41(IZ) CATA1220READ (12.03 AMAX42(IZ),AflIN42(IZ) DATA1230
C TEST FIVE: SINE-FIXED VIBRATION 0ATA1240READ (12.0) AMAX511!ZI.AM!NS1(IZ) OATA1230READ (12.0) AflAXS2fIZ),AMIfl52(IZ) OATA1260
*40 CONTINUE OATA1270RErt(DN CATA1280
C OATA1290470 FORMAT (SX//SX9,IF YOUJ WISH A TABLE OF INPJTS ENTER Is IF HOT,'.' DATA1300
lEPITER ZERO * I3 OATAX310480 FORMAT f' ,SX.I7,SX,11,4X.F13.0,12X,'N4A.13X.NA)I DATA1320490 FM~MAT (17Xv'LEVfL-f,1330XFl0.Q) DATA1330500 FORMAT (1X///////34X,' PROGRAM DATA'/' ,0( t/7XvNPARTS3*s3ATA1340
1X@'LEVLSp3XP'fPDEF X NFA.RT3)%46X.CREOO,1DOXMTSBF*/ 'p60f-')/DATA133O2/) DATA1360
510 FORMAT f1X////33X,* ASSEMBLY DATA*/* ,BD ) ,XsA5EMSLY LOATA1370lffVfL.2X,' *92X,'EXPECTEO HUJMER Of ASSEMBLY DEFECTS*/' ',X,14('_OATA138O
Z3,SX33V *//)OATA1390320 FORMAT V 'SXI7,SX,rl.4X,F13.@,2XF13.2,SX,2XF13.0) OATA1400-530 PORTMA? V ,11X.IZ27X.F9.0) OATA1410544 FORMAT (1X////35Xo' REWORK ,v'COST O ,0 2)/ ATA1420
END OATA1430SUBROUTINE MEAN (XNXUAMSXNPPTOMSSFALL) MEAN 10IF (OMSS.GT.0. "l) GO TO 10 MEAN4 20IF (T.LE.1.1-9) GO TO 10 MEAN4 3DAOzXN0XLAMI MEAN 40A1sXNP MEAN 3D
204
//
W S-AL.OSIO I/IS X..I..T. . . .
pALL2A rvwTAlO( 1.-o P -At-T l ..... ............ - IMAN
60 O tO .N "
is [email protected] .. . .... ............ MAN 10
t o T U. . . . ... . . . . . . . . . . .. . . . . .24. . .. .. .................. M m u s
2015

PROGRAM LISTING FOR ADAPT. FORT
Precedng page blank 207

"'.bLALUf 3, APALL(31, APPALLM3) AUPALL(S), P43), MARX(3)9 IMA)PMAIN 202123). EL(S). POL13) WSLM. 8453) PSW(3) WU(3). TSIM3. AT(S)MAIM 303 A.!T0F17.7), F2EMM1( w7),WEfl() MAIN 40FLASS0.0 MAIN 50flE?9 Q.4) ISCV.91.NPAQTS.,U!,,AO[F MAIN 603E.'&O (13.51 OJOP,XUpR.XLAP2,XLACI,XLAnZ MAIN 70"10 413.0) Tl?!:..¶r MAIN 60
.!0(2.*1 TSdlbrs(2),rS(S)l MAIN "000 10 4 . MAIN 100754IX)21.-TS(z) .MAIN 110?5111)XsEI MAIN 120
10 CO'TIhUZ MAIN 130*2.O (2,01 C0?¶!(),CM':Eg:),C0nE(3) MAIN 140I!AO 12.') 0?)41.W412)ON(35,PUzT MAIN 130211TE (6,26*1 MAIN 160C!'!(C'!( 31 -PLSFT) I AIN 17000 .40 K)xs1,7 MAIN 180P;E!*(,K)xgAnAXIg0.,PLgpT..4.,pWAT(g(K))i MAIN 190C0 21 rLxl.7 MAIN 200
'r!(RL)SAfltAX1( 0. .0?3-*. .FLOAT(KL)I MArN 210hI1T3F( K( ,KL B)s(QpI.,fj( 1(1.-I) )OXLAIC1.( PL0AT(NPAKTS)-PRD¶~ (1(3)'XLASITPIAI 220
11. '!C.'¶ (KL) %XLAMIC2,PqEll( KK )XLAMP MAIN 230A:ITCFCKK.XL )Wl./A.ITDF(KK.KL) KMAI 240
t0 CMITI'VEMAN 3!--!ITE (6,270) =qE" MAIN 26000 30 K(31.7 MAIN 270
30 (.2'!? (6.280) M.MClKX).AM1ThP(XX.XL)*ELxl.71 MAIN 2600137 (6.2"01 MAIN 290QUID (510) ItIEA MAIN 300IF (r!tER.GT.0) CC TO 40 ... MAIN 310GOU.9 TosoAIN 320
00 7 50MAIN 33040 L13171 (6,.300) MAIN 340
)!!AD (S.') PER MAIN 330so 131?TE (6.3101 HAIM 360
C-0 60 9(31.3 MAIN 370F(X)CM:ZK)-O:tK)MAIN 380
40 CC!:7'2J2 MAIN4 39070 PAf1zFX(07C0!(,0(),C(1 MAIN 400
!?ALI )~C~! 1 -0~( I)-PALL 1)MAIN 410PPALL(2)uI'Ixf (PDEF-P:FALL(1,)s*(C0I'.!2)-0:2) )./CA-l(21 MAIN 420
1~A.4 )s~::( -~ 2 -PFLL(2)MAIN 430PPALL4 3)zIPIXf (POEF-;iPALL( 1)-PFALL(2) )0(CC."( 31-eu31),Cm1!3)I MAIN 440I-ALL( 3)wCOM!4 3)-Cm (3)-PFALL(3) MAIN *50
P 4FLAG.GT. 0.0) PLEFT:POEFPFpALL( 1 -PPALL( 2)-PPALL( 3) MAIN 460* ULE1TzVJM3-PLEFT MAIN 470
I. rT 46.320) MAIN *8013T7!(6.3301 MAIN 49"
1'!!(4.320) MAIN 50016T!(.333) MAIN 310
M2IT! (4,360) IIPARTS,AC!P41),A0!P(2),AOEFES),PLEpT MAIN 520VIM? 16.370) KMAI 53013!?!E 16.380) "AIN 540; !~ )TF f X(?0P- WLE FT) OX L AlC F LOA T NPA QIS -PL E T) *XLAMP14ULEFTVX LAWM MIN 530
208
ltiPLRFTVXLAMP2 . ....................... MAIN 564RMFhPl aRMim MAIN 5701-21IT (4,390) POlF,TS(l),TS(t),TI(3),&(LEPT ............ MAIN 380MIflt (4.344) MAIN 590M~ITE .16,4001 MAIN 600WIMM (4,410) OHWZ),04(t3,ON(3)pRNT5h............... MAIN 410L."IITt (6,340) MAIN 620.UITi (4,320) MAIN 630MLITE (4,420) MAIN 640MI~TE (4,4201 MAIN 450WIIT! (4,430) MAIN "60M MI~ (64,440) .. MAIN 6709=1E (6p460) MAIN 680MMIT (4,450)..........................MAIN 4906.1ITE (4,470)..........................MAIN 700WI~fT (4,460) MAIN 710MLIME (4,430) MAIN 720OC 80 1.1:1.3 MtAIN 730CALL W=0O (Ftzj)..!t:Ij),8' (zj),PrI) ttAIN 740CALL UCVO (IPFALL(IJ)vP3L(IJ),P3U(IJ),PER) M.. ........ AIN 750CALL L'.NO :7ALLwIJ),htL(I.1),Wa(IJ),P!R*) MAIN 760
s0 cOmS?17UE MIAIN 770'"IM! (6,490) PFALL(I1).UFALL(1I ,f(1 I PVALL( 23.WFALL( 2) .P(2 PPFALL( MAIN 780
13).44PALL(31,F(3) MAIN 790'"IM! (6,460) MAIN 8001.191T (4,S20) MAIN 810L1!7"I (4.510) MAIN 820WITE (6,4601 MAIN 830Zb.-Tl (6.490) P3u(1),Im8(1).aU(1),PIU(2JMWt(2),8W(2),PSU(3),N8U('3f1AIN 840
1),3'J(3' MAIN 850IWITl f(4640) WAN 860S."I7! (4,500) MAIN 870LWITZ (4,S103..... ......................... .......... MAIN 880b-7rT (6,490) MI8900I -A I3 ML . . . . . .. . . . . AIN 910ILMITZ (4,460) ........ MAIN 92014VIT! (6,440) ....... MAIN 930IF (FIJG.GT.O.0) 60 TO 180 MAIN 940Co 10 90 MAIN 950
90 "ALL INT (XNOPHPARTSPLEFT.ON(3),XLmu1,1xLAMWxLMC1,xLAmC) M1AXII 960Lw?M1 (4,530) MAIN 970READ (S,01 ZACAPT MAIt( 980:F EI-AOAPT.LT.21 60 TO 220 ...... MAIN 990LMITt (6,5*0) MlAIN1000IIAD (5,:) IFALL .... .... ..... MAX141010If (IFALL.GT.0) 60 TO 120 nAIN102OMITIT (6,550o) MAIN1O30READ (S.*) AFALL(1),AFALL(i),AFALL(3) MIN~l1040ICU!' 20 MAINIM5CC 0 110 1:1,3 .... MAINIC6O
IF (AFALL(I).LT.BL(I)) 1A1I~1lAIN103O110 CDTI7pi"J MAIN1090
?*RKITz.,R.( 1 ).iARK( 2 )+.ARK( 3) MAIN1lOC
209
U(tl0*UKT.9Q.0).AWC.(ICtff.6T.S)l 60 TO 1.40 ........... AIDliXIF (HARKT.Lt. 0) 6O TO 240 H~ AMMI.CALL IJFL0 ("ARK .C"CNIE,04TSAFALL.F .XXAWPVNPTS I . .... AD41130FULA3~.o .........0 . MAIM1X44W1TIE (6.368) ... .I..N.. ... AXII1150Go TO 70 .. .. ..... A3.NIZ60
no3 $amT (6.570) KA.IM3170IF.110 AD16410
00 1303 I193 ..... AZN1XOO0m~ (6.530 1 ..... MAINiZOCREAD (So*) APPALL(Z)AhUALL11) . ..... N....... AM220lAPALLlI 3IAFPFALL(I .).ALWALL(I).... .3 ... HAZ12Z0
3.30 CONTIR .... .. NAXN230ICUEai KAMMl'.soTOId .0 3.00. . ... MAX250
144 00 170 121.3 . . .. .... IIIF (APPALL(Z).6.PBUL(3 60 TO 150 ..... ..... AI17PfALLI!)APPALLtZ) ... .. ...... NAZn1Z8*WPALL( .)'MWFALLI I) .......... MAD43290IMNARt JI~ )a HA)41300
150 IF (AMWALL(Z3.6laL()3 60 TO 160 ........ AD4131061ALLMN~ASWALLI 1) .... MAIN1320PFALLE I IAPPALL() ..... flAfl1330WK.NDaP1)l MAD11340
160 AFALL(I)WPALLtX).4FALLIZ) MAIN13SOM.7 COITZjIA. ... MIqAN1360
1FP~l4M1KqPu(3.)0*MMPW(2)*'MA9PW( 33 *.AIN1.370
iftrM1'.Eq.4) GO TO 240 MAIN1360CALL )CJFLC:4 (MARPAC.JCW9 POHNTS. AFALL o.PTIM PXUhi-.&,MPART* s 1AIN1390
FLA421.0 AIN1400W*3TI (695601 MAM2341060 TO 70 MAMl1420
180 IF IP!J.MlT) 60 TO 200 PIAI1143000 M9 J21.3 NAIH1440
M9 IIADK(JI*ARKP¶JIJ) KI15200 C0NP)1DE lrNAIN60
C021.0 Jal.3 "ArM1470If IUK(J).LT.3.) G0 TO 210 ... tI1aCALL SOLVE (J*XSCRPTS,TS1.AT) IIAflN1490
210 CCI.TZ3~JE MINIMC2.0 10MT (6.590) MAMINIlO
READ 15,01 lEQ MAIH1SZO0IF 119E3.LT.3.) GO TO 230 MAXNI530CALL 1CUXV 11EG) MA!N1540
'30 L11TE f6,232) MAXN'S50R!40 (5.1`1 ICI..?I KMAI160If (IM1~.LT.1) GO TO 2400 flAIN1570
- ,*P2QMI2 ).LOF( 3) M*IN1580CALL P7Th! (NP.WTS.XL/.?IP,XNP,TS(3),TPf!(3l) PIATNIS90
2*0 STOP flAIN1600c flAflM6lOC MAIN11620230 FOPYMT (lX/SX. 'IF YC*J "AVE TIMES! TO FAILURE FOR LEVEL III',' NEWM¶AIN1630
1 -I.'.F -01. ENTEP ZEqO:~ * MAIN16'.0260 FaNAT (lX///,//h'20X. 'INSTANTAHEOUS MTeF FC9 PEMAZNINS/23X. * FLAh.2Afl1650
210

)S AT tHO OF SCUEEW4*S'//flX, * WORKMtANSHIP' I MA.u4166270 FORMAT t1x,. PARTS I'p7t4X,F5.O)/lXp7Ze-P) . MAINI670te0. FORMtAT (1X.pF.O,1X.''i*7(4X,FS.03) MAZIN16602"0 FORMAT IK/ISX'FYOU WISH A .99 PRC13ASILMT DiTEROVAL.' ENTER'tIAD11690
to' ZERO'/SX.'ZP YOU WISH TO ENTER A SMIALLER FPO9A8ZLITY (FOR's' A flAflh700214ARROINER INTERVAL),*/SX.lENTER 04E:1) flA1111710
380 FCPMAT (SX. ENTE PPCaASXITY OESIREDI') IIAZN1720310 FORMIAT t ////////Z5Xt'STRESS SCREENIIM FLOW OZAGRAMt'//l IIA N1730320 FORMIAT (ZX,5(12(*-'),3Xl) MIAIN174.0330 FC:?IAT E1Xs't D.*CO'¶IH I*,3X,'t LEVEL 1 I'3X*.I LEVEL 2 I'M3X,?AIN17S0
Ii ILEVEL 3 1I',3x 0 1I OUflD I* .. . . .. . ?A1N176030 FORtIAT (1X.Sl'I'.1OX#,I.3X)) HAZN1770
330. FORMIAT (1X,'IVPARTS: I,3X.3VIlAOEPW #,4X.'t'.3X).IlOF P REMll't1Afl4178O1) flAfl1790
370 FC12"AT t1X.AV1'IlOX~li--)o),I'l,l0X.'l') HAIN1810380 FOaMtQT (1X,'ISOEFECTS: I',3X. 1 TS: . Iv3X3.I.pOfF W4 REN: IfAflh1820
11) HAZN2.830390 FORM~AT M1,I,1.,IX3''Fo3''3)i,1.,I3 1AIN1840*02 FC!11AT (1X.i'P1OX,'I,3X.3('lOEF PASSSOI',3X),*lMTBF: 1.) HAI'llaso410 FORI-At T ZX.*I%10X,'I',3X,4('t*,F10.0,'I'.3X)) . tA11860430 FC?.AT (21Xo3t'V'.1*X~l MAINIL3O430 FC.'1?AT (ZlXo3(i'V'#IXll . .. AIN193440 FOU1AT (ISX.,3(14( *-* IX)) 11A1N189
455 F=0tT (1SXo3(il EXPECTED I,Wi) . fAD11900*60 FC'tIAT (1SXm3E'I'.12Xqi,vXX)) . .. N .. FAIN191O470 PFWMAT (ISX93(V1 FALLOUT: 1'.1X)l MAIN1920*30 FCnIAT (ISX*3t't POT bIQI TOTI'.1X)) MA1111930
490 C2M.T (SX*(.l~3(F.41*Ptl~l AIN1940*90 FO~N1l.T (1SXo3(*IL'.3(F4.0),'I*.lX)) P.A1 .19.
510 FCm.AT (ISX*3(*I03S FALLOUT:1¾1IX)) . tAZN196O520 FORMAT (1SX*3L'IUPPR 540 FCRI'.1X)) flAfl1970530 ft.. OIAT CIX////SX. 'IF YOU HAVE FALLOUT NWIIERS ENTXR 1. IF NOT',', r.Afl1980
IENT19 ZERO") MA'19540 FC~?tAT (SX0 'I YOU HAVE SEPARATE FALLOUT FCrA PARIS AND ' t'WCRI(IANSMiAIN2000
iNIP ENTER ONE*/SX,'IF YOU HAVE TOTAL FALLO'JT OHLY AT',' EACH LEVELMiAD120102.I EWTER Zeno:,) MD2
550 FWMAT (SX o' ENTER THE THREE AC TUAL .FALLOUT HURIERS, IN ORDER. ','tAZN2O3CXBY LEVEL:') - HADW2O'.
560 F=MAT (1X/////Z4X,'STRfS3 SCREEIIIN- 01SULTSV///) MAIN2030570 FOn!!AT (5X,'ENTER, IN O.ROER, ACTUAL FALLCUJT:'/SX,'t)UtTO* (A)','?Afl4Z60
1 PvflTS (8) 141IANSHIP, AS PPOIPTEO ) * I #A1412070S-C0 F~r.AT (SX.'FCR LEVEL' ,I2.':*) IIAD4203051; FC7:1-T (1X/5Xt'!F YOU WISH) TO ANALYZE EQUIVALENTr SCREENS 't'ENTER KII-12090
1 0!!'/6X 'IF NOTv ENTER ZERO:' I¶AIN2100
SM'!CUT!NE a= fX.8L,SUPfR) B oL'N 10
Ofl"ENSICH 5(2)9 PR(2) a"~t 20COWN 40
PP( 1 )PERPRt 2) aOUN soXI:2*X E.OUN 60
C. SCUMN 70CO040 rz1,2 BOLIN 80S(I):tt(EFLOAT(I-2)e2.58:SQT(Z.)),SQRT(2.02.58w.2,4*X1))/2)-2 BOU4 90
211
16 IF Elf ?.LT.O.3) GO 10 20 9M lagCALL MiCM 1X1.511),10.ZEI awl.3 l10P29-97!! 1) GOI 12081,28! 110. U0s 1"I 130CALL M1CH (X1.81.101,1ER3 9O 140PISPI-171l a" l ISO15WstIef !)-00'0.0051/1 P1-P) aw 160IF (AS04-(I.E..05 GO S0O4BOI 170lE~of iia l ISO18GO To 10 am$I"~19
~0 S!Z:@.0 lINzo0Co TO 40 8"I 210
30 OIafl SOLDE8 2*0*4 CCe.TP~JE 6"I 230
*L3PLOAT(IIfX((AMAXZ51132.a-2.J/t.31 SOWN 240ir 10113.LE.2.41 BLSO! a"I 250L*JXPLOATf!FZX(5!21/:P. .. 93' 6"I 2*0IF IWJ.LE.0.'140 fiOUN a 270GO TO .10 lO 280
S0 BL2G .. .l... .. . .N. 290Viso. lO" 300
60 RE~TLP lOWN 31"IWO a"4 320
SLCROVIJTN MEAN (N*XLA*¶LXNP.T,CMSSFALL) MEAN 10IF (0:111.U7.0.9991 GO TO 10 MIEAN *0A02#I0XLM ME1AN 30Als"(P MEAN 40R13-*L&5CM IS 3?'IXLAIIST) ..... MEA 50A32x3rwXL'tt! MEAN 60FALLsAOWT*A1UE 1.-eXCPf-A*'T3l ....... e 70CO TO 20 MEAN so
10 *.Li zO. 0 ..... .. .. MEAN 9020 UeTUN WMEA 100
Don MEAN 110IL1.VO~iTZE NUFLOIJ (MAq~K ,Ct"1ff.ON9T3,AFALLPF ,TIhE ,XLAMI oHPARTS I I*JFL 10oaIi:sw.~ II*9K133, CC310)3, ON(3lv 15(33, AFALL(33, P1), TIh!13) tIJL 2000 10 121.1 ......... UL 30IF fP1VKlZ.LT.13 GO TO 10 :AOFL 40TSIX)sAFALUDI/COIMt(13... NtfL 50
10 Cc~I7I?¶e NUFL 60IF !l'0E(113.L1.03 GO TO020 I6.FL 70PLACZZCO-If1t*f131. -T3(1)3 1 JFL 80CCM'!(2)zCO?1(Z3.PLAC1-ON(1I) ... NFL 90OCff 1)SPL.ACE t4JFL 100F(1j'cc!1f(13-mlf13 NUFL 110
t0 IF ( "' K(2).LT.1) GO TO 30 NUFL 12073: 2 3AFALLI 2 3/CWE!!23 NUFL 130
*3 =~SS:1..T3(2) NUFL 140C-.LiLi MEAf tI tPAWI'S.XLAJZICCOM(21,TZ h!(2),eiisSPq2)3 IJFL 150PLACEtC0't( 2 3-F! 23 NJFL 160COrit 33:C~f( 33.4 PLACI-0611 233 NUL 17001f 2 3uPUCE MJPL 180If (MAOX(33.L.11 GO TO040 NIWL 19075(3 3UAFALLI 3 /CC!f 33 NtJFL 200
40 C~SSzl.-TS(3) N6JFL 210
212
CALL IVAN (NwAuYS.XLAtS1.CWWE33,TTMI3J.lSS,F(3II.............MFL 2200ff3)ECOMIMI3-M1) * UFL 330
plyul"NUFL 350
SI.IOTINE4 SOLV9 IJ.XSCR#T.TST@AT) SOLY 100IIIVSION ISOM(33 TSMP 33. 1(3), AT , ARAM1395,*3 ....... OLY t0pfuIm it SOLY 30O010 to Z'13 *UOLV 4400 10 Kul5 ......... SOLV so00 to Nu1.4 SOWY 60IF I.N.3M.N6. 60 TO 10 . ...... p ...... .. 70i IREZAO (12.01 PD.RAM(I"#KeN)PPARA~tI?9,K9ll ............. SOLY SO
to Caffl" WLV 9000 20 N8l93 SOLY 100mot...............................SOLV 110
IF (ZSCD(NI.9Q.21 MMI4 SOLV 120PARA.9(JeISCU(N),ItMl3ATtN)....................SOLV 130
20 CONTINUE.............................SOLY 140I~v0....... SOLY 150
CALL F I J.CX.IT~P*RAMwTSTS1I#SCN1TNEN..............SOLY 16011.1 . . . . . . . . SOLY 170TIXAT(J I SOLY 180CALL F (JC1.ITPANAflTS.TS1,ISCU,Tl.ThE1I ....................... SOLV 19010ZI3CO(j) .. . ........ ....... SOLY 20090 TO 130940.50.S.501P TO .................. SOLY 210
30 If (TNE'A.GT.2*0.) TNEWS240 . . . ..... SOLV 120'WRITE (6,701 JOTHEM.......................SOLV 230Go TO 60 OL 240
40 If (ThVJ.GT.4O.) THrnENZ*0. SOLV 250bel?! 16,803 .JThl........ ....................... SOLY 26090 TO 6o........ ............................. SOLV 270
54 IF (ThEU.GT.60.1 ThEU240.......... ............. ........ OLY 80017M (6,0") JTNU....... .................... ................ SOLV 2"0
60 catrieJ..................... ............... ........... SOLV 300.. . .. .. .. .. . SOLV 310
.C. . . . . . . . . . SOLV 320c SOLV 33070 FORMIAT (1X//5Xv'INCIEASt TIME! ON LEVEL'oI!.' TO ,#F1O.2. HOUiF.'-)SOLV 340So FCRT1AT (DW/SX.I)CREASE WMaSER OF CYCLES ON LMVLPIZo* TO *,F10.SOLV 350
12//) SOLV 36090.FC2MfAT I 1IX//5X' NCV9ASE TIMl ON LEYEL'o12. O 'F1 PIMJTESSOLV 370
1//) .SOLv 380Etc SOLV 390
SV23S.0UTIN! F (J.C1.IT,PAAMAolTS.TS1.ISCl,T1 ,TNEUd3 F. 100=03104I~2 PARAII(MvS43, ISCR(3), TS3131 T!1(31 . F . 20IGSISCIIIjl . . . . . . F 300O TO (10.S0.80.80.803. is F 40
.10 IF (IT.GT.0) 60 TO 20 . . . . . .F .so
T.fllE.'ARAII(J,1,2) 1 F 60ST:TS( J I F 70G0 TO 30 F 80
20 T2 C4#k,11Cpf J) OFAMDUJ*ISWI J '),)3*?10.5,C1)U F 90GC TO -40 it. 100
30 RuA8S12S.-PAPAM0.2,111.3.... F 1l0OT:~c~EX~t13,l . .F 120
213

C '( * L O 1 . S T ~ . M 2 ' h u e .4 o m~ . .w ~ I .. 3. . . . . . . . . . . . . . . . . . . . . . 1 3050 IF (IT.GT.01 40 TO 60 is*
NCYNOSAMI J.2.'.). 160
03 TO 70 is*8
70 EUPASIAN(J,2.1 -PAMAH(J,2.Z!toOTNALC-.1 VM(1. b.PANA-1,,I 2,3), .. . 210
86 Txf*AJI.(j,I3cR1JIql) p .. 240
STS!5S(J) . P 930
W0 To 190*90,90,100,11010 to 270W 02.1~4.PAOArnJ.3.1)-.0962 96. P 20
. .. ... .. p 900GO To 120 PF 300
100 O'.043556P*PAMN9J4,11..106S F 320607012 .......... .P 330
110 D8u.033PAPAM(JPS#1)*.32'. 340996.2 P 360
121 IF (17.07.0) 60 TO 130 P 370
R1ALI 1 74WHn 380
13 MI F 400t00~~ . 1
P-*--T!O4 C04 (!.PARAM) .CO...N 120COMN2 .0*23 . . .. CON 20Go To 140 .'0.10.20.10)0 I CON 30
16 CONE .264vP1qA*It1.4O2)..4-z, cm 3 0 '0Go To040Co-0
to 002*'(.0176*PAR.'.n7.O9,)..(..1) CON soGo T 40CON 60GO O .0CC" 70
43 !T).FM CmN 90LIZ Cm 100"0 ~.CUMT[t Iow ( "~to I IOU! 10
DIMNSMS12 M453.10), ISCot!) C! 010 L.:TI (6.1301 foul 30
VTM (6.140) ECU! 60REA!) 15,03 I5com1 EOU! 70~'In. 1601301 C!8READ (5,*1 !SC.~1(2) ECU! 90
00 70 181.2 .. ECU! 110GO TO (20,30)9 I ECu! 12a
20 CUTE7 (6,140) I CUi1 320HuZ!CRfI 3 CU!J 13.0CC TO 1'40,54,60.60,60), Mt ECU! 150
214

. . .. . . . . . ........ ... . - • •........ • • - ,- ' ' •• •• "! " • • ' ' + 5+ +• •"
r.... .. . ................. . . .... IOU 170 .P~mZ5 1(I ) ... .. ..... ..... ..... .. ... ................... q Z 1 0
. 0 TO (4093,0,60 ,60)o 1 ........................................ E UIJ 18040 kR!T (491901 Ioul 190
/ 00 TO 1 . . .... . .. .... ......... .................... ......... Q I +1READ (5 10) p(1.1.!3,p(I.2.!3.................................... EU! z00
READ (3,*3 P(2,1.!3.P(,2.2.),P(2.3.! .............. EIJU! 230GO TO 70 . ........... ........................................... EU Z40
60 MIlTI (6.200) .. U. 25070 READ (5,,) P(!scI . 1.) ,P(IScR z),z .................. EUI 26070 , .= r'f'NUI ........ . .... .... .... .... ............................. foul 27o
C .... ................................. ..... EIU! 280Krl EIU! 290CALL SSF (!SCR(1).YXFLJ6,6TS. ......................... CUI 300MITIE f6,2101 OTS . ................ EI 310K .... ...................... EUI 320X1S1. IO•U 330jUG IOU! 340CALL iSU (.SCR •-KKP"X•FLAG,6T3 ............... EUIO 3SOIF (FUG.GT.g.) 60 T 110 EQIU 360
..SCR(M) EQJI 37060 TO (60,90,100,100,'100), M.. EQU! 330
860 RIkTE (6,220) X ECU! 390CO TO 120 EQUI 400
90 W.ITE (6,2301 X ... . 410GO TO 120 EIJU! 420
100 01#TE (6,24:0) X !... ....... EQU 430110 A.. t.Q0. EIO! 440120 rl1E (6.25o) IOU !.. ..QU. 450
... •EP, IS~i ).. ... . .... . . . . .... .... ..... . . . . . . .. E U 6:IAD IS,*) L IOU! 460If (L.BrO@ GO TO 10 I.. .......... . ...... ECU* 470
. ............ ERI U! 480. EIU! 500
130 FOARRT (IX,'.OLLO•r• AE THE SCREEN EQUATIONS AVA!LAMMLE: '/X.'EOU! SO11. CCMSTA•I TEPIPERATURIE*/1X,2. TEMPERATURE CYCLING'/ZXt'3. RANIEUI 5202OOtt V!EVAT!ON'/1X 4'. SIhE .S•IEP VM.RATO'/1X, *'S.',' SIdE FIXEOECU" 5303 V!C!ATXON'///) IOU! 540
140 FVM.)T (IX. -INTER MISER FROi AsOVE LIST CORR•S•-6oN• TO GIVEN * .EzO" S50.1 1SCREEN: * ) ECU! 560
150 FO,,AT (IIX. ENTER NUMIBR FP0m ABOVE +L!ST CORRESPOMONS TO '.,'OES1REQU 570IPo SC.REEN: I) EIU! 580
160. FOfMMAT (IX/iX. ENTER PARA[ETERS FP9 GIVEN SCREN:') ' . . CUI 590170 FC!•'•AT (IX/IX. 'ENTER PAR.AETERS FOR DEZ3•ED SCREL;"/t.X, ENTLN ZEREOUX 600
10 FCP PA•.AMETER TO OE Fp•.,:' ) EOU! 610180 FPM..AT (1X/1X.'INrER ABSOLUTE VALUE Of DPFFERE?'CE BETWEEN,' TEIMP EJU 620
1!N C1E C AND 25 BEG .'/2X,'A.Z TIME ZN HOURS' ) ECI 630190 FPC.AT (1X/1X.'EPITER RAPME IN DEG C*/gX,*TErfP RATE OF CHM,"SE ZN DEEIQU 640
16 C/?1ZN'/2X.'AM) MMUER Of CYCLES') EQU! 650220 P.tF*AT IIX/1X,'INTER G LEVEL AHr TIME ZN MINUTES') E•IO 660210 FPO..1T (iX/IX,'TEST STRENITH FOR GIVEN SCREE.•x',F7.4) ECU! 670220 FM!t!.,T (iX/IX,' PARAMt•TER !N DESZRED CCNSTAtNT TEM'P SC;EE4z' ,Fp10.1 3)E10 6802Z0 FC`.CAT (1X//1X,'PAINIETER IN 0ESIRE0 TEMP CYCLING ','SCREEN:*,F10.EQU! 640
11.) .. .. EIJ 700
215
.*$g*>.
240 FOR?%T (ZX,/IX.'PARAMM~ FOR DESIRED VIMATION '0WE5s EDu.Pio.1)goz nog250 PORnAT (lx/////1x,*tF YOU wIdsH ANOTHER EOUIAilvucy ENTER cue,%,, muCz n20IF NOT. OfTES ZO#O:) ' IvUz 730Do2JD' S 1CEKPXFG~ EQUI 74.00Z?1S5boS P453,32) sr tGo TO I1,09lo,) CuE 5SF 3010 IF (K-910.11 GO TO 30 5SF 4.0
XUX**'3./3.) 5SF 706371) O0 5SF so
Xs~C.g35SF I00RE UPl,,K 5SF 110
5SF 130T~P(.2,cj SF 130
40 RETURNt 5SF 1SOso IF iK.90.1) 6O TO 80SO 16If WP2.,1K).TO7.o0o GO TO 60 5SF 170SSF 170
XIOV( 2P3# )-. 104 S/35sFr 190pIrml? S3F t9o60 If (P(2.2.KI.GT.0.01 go To 70 SSF Zia
!SF 220XXuEXr(Xl-EXP(.1.j MS 220
E!73: 25. 230
5SF 270so N'P12.1,K) 3SF 270R'XYMP(263,9) 5SF 280
CS~SS'1.-X~fO02wqw6ugw~t~..yw~,, SF 3003SF 310
9 if IX.IQ.1) go To 100 5SF 320if (P(ICUf,2.x).Gy.O.O) GO TO 190 5SF 34010a T3P(ICUE.,K)3 3SF 31.0SO TO (110.110*210.12*v130o) ICUE SSF 310110 8s.266vPfICtJ9P1.X)#.4QZ
0 5SF 370O'.1.I44P(ICU!.1.K)3..C62 SFr 380C2.5S
SSF 3900go TO 140 r40
55F 1.10C-$3 .45F130GO TO 14.0
SSF 440130 52-.1.19opt ICihE.1.gi.6...ZF45
Ox. 437*41V 1. 19)*.3245SF 460Cs.2 5SF 1.7014.0 CO TO rado.K 53F 483150 If lGT3.GT D) C0 TO 160 S 49
Go TO 170 5SF s10
216

140 WRZ~t (4.2301 5 520FLAGal . .5S.. . . . . . . . . . .. . . . . . . . . . . .3 F 330
170 RETU2H 5SF 540.ICO GTSvO1(I.-lXPf-T**C/8)) 5SF 550
RETURN 55? 540190 x121. 55? 570
Js0 55? 380t00 Xe:znl([email protected])-GTS)Sp1l(XCU!.2,PoXl) 5SF 590
J2J41 5SF 400If (J.GT.50) GO TO 220 .. S3F 410If LACS004-XI). LE.G. 005) r.0 TO 210 5SF 420.xI3X4 .s . 5630IF (X1.LE.G.) )amJ 55? 640
GO TO to0 5SF 450216 Xs)w' SSF 440
RET'.mU SSF 670220 6"TITZ (49248) . 5F 480
RETURN SSF 700C. DE.IX INIT ..... siv noC 5SF 720C 5SF 730230 FORNAT ( IX. -SOLUTION 'NOY POSSIBLE FOR dSilRED 6S LEVI L. .... 5SF 740240 FOMU¶T fiIX, *SOLUTION CANNOT BE FOUND0 BY INTERINAL ?MThOO. /2k. 'TRY 3SF 730
IA G010 OF POSSIBLE SOLUTIONS. ') 5SF 740Do SSF 770
FVXTION SS?1 (Z0SvLvPX1)....................SSFI 10MOCOION P15.3*23 SSFI 20
GO TO (10.20.30.30301910 lO....................IS 30
.0 RTURN SSF1 s020 RInmZXI......... ............................. .................. 5571 50
R t~ T : X . . . . . . . . . . .. . . . . . . . . . . . . . . . . . . . . . . . . . . . . . . . . . . ......1.430. TapCIDS,202)..........................SSF1 80
4. 22607 *0,*,;5.402 . 10. .-........................ .................100Ms ..... .... .. . . .......... S 11001.1*44X1-.0862.........................SSP1 120
.. 0D3.144 ........ .... .................. .......................... SSF 130Cz.S..............................SSF1 140GoTO707..................................SS?11ISO
so. e.oi7k~X17.47 . ......................................... SSF1 140952.0176.............................5FI 1700u.0633'X1..1045........................SSF1 18000:.0635..................................SSF1 190C3.8...............................SF1 20000 TO 70 .. . . . .. . . . SSP 210
_60 Bx-.419vn1,a.62c ... ...... I................... 5SF1 2200032-.419 . . ............. SSF1 23008.04330Et1..32*...............................I........ ...... SF 240
a.2 .003 TO8..... ... ....................... ................ 26:7i IF (LL.2 0 O88
1F 270
S~fz0-O*9~f-T*CD -0*( IT*uC/3*2 *68uES~XP( -T*'C/B) I . SSF1 280RETURN .. . . . . . . . . . . . . . . .SSFI 290
217

.. . .. . . .........-.....T........ ssn 300*II..TM . . . . . . . .. . . . . . SF1 316
vs swi 320SU3RCUTD4E INT I X1OP.HPAMTSPLEPTTLEP?.XUAMI. XLMI ,XLA~iIC.AAMXHT. 10
. .. . . . . .. . . INT 30MmT (6.201 III? 40AUSI X1:CP-TLEPT4PLEPT )OXLAMCIC1( LOATI NPARTS 3-PLErT )*XLAPIP DOT soAISTLIFT lINT 60AZUI PLEFPTXLA11P.fTLEFT-PUPT3UXUIICI /TLE . .. .... lifT 70
00 10 121.10 nit f1xAOUT#A1U(1.-CXP( -A:*Ti) ... Df? 100X11T3F~r/L! lifT I1062ITE f8.303 TOMBFh Dc? 120Tzr*,2oa. DI? 130
10 COUTZ?'! . . .... ?r 140RETUR14N W 1501
C ZN? 180C ZN? 170
20 ORMYA (1XV//////29X.INDEVMAL MrhP'//27XI7f'-')/29X,'TM 1t I ZNIT 180I tlThP'/27Xt17('-J) ZN? 190
30 PC2MAT 128X.P8.00, IP7.0) Di? 20011:0 nfl 210
SI=2RJDl MMEi (NPAPTS.XLAM9,XNP~sSirThIM P111 10C S*.r2CZ7A11 TO f1T FAILU21 DATA TO .... ... " 20c ti(1'3uAo'T.AII1-.*XP(-A2W1')) P1311 30c i.rz~ is .MS OUTINE zC5SQ.............. ........... P111 4c
EXTERNAL AMFANY P1111 80REALY4 PhAllI 43 XI23 .PI2003 ,XJACI 200,1) XJTJ( 3),UOPKI13) P1111 70REALNu* T(200) P111 80C419=4 ZSQAO P1M190
C .P"Vi 100)CUNPLOATI lPARTS) "1" 110RICU-AL0*(I.*-SS 3/(I TD1XLAS) 3TZ Ito11W RITE 18.10) P1111 130READ 15,.) H1 P11 140K32'11.13 P1111 150CALL OPT (A11fANY,X04,XLAM.2O4P,NK,PAE11,XP,XJACX4TJ.UMO,T,11,K.T11UTih 180
11) P1111 170RETURN P111 180
C P1M1 19010- PC11AT I SX. 'ENTER W,20E3 OF FAILURES MA~INS FINAL SCREEN: F3 11) 200
0:0 "in1 210St=CUTZ~fl OPT (AIAtiAfV.e@4,XLAN.)@W.RK ,PAm1XP,XJAC.XJTJ oIIORKT,nOpT 10
1.IC.lflf OPT 20CIM1ISION P1*111*3 X(23, PFll). XJACIII.21i XJrJI3). WOMOI ), TMll OPT 30
C~CUZSO.A* OPT 401IZMTE 16,210 OPT 5000 t0 IJNI.fl OPT 80READ I59*1 TfIJl OPT 70I.ZITZ #17,0) T(IJ) OPT so
10 C21T??.Jg *OPT 90M32OPT 100
218.
IXJACSa. . . . .. . . . . .. . . . .. . .P... . . . . .. 116#IS*OPT 120
9psuO.S ... *.... OPT. 130O9LTAz@.@ ....-......... . OPT. 140"IAXFNUSOO .... I.... .. IOPT. IS0!OPTZ: . . . . . . . . . . .. . . . . . . . . . . . . . OPT 140AOUXN'XLAU .. ... ... .. . . ... . . . . .. OPT. 170X(1 12)4 . . ... .. . .. . OPT 180Xf2)ENX*XLAt!3*1.E3 OPT I90CALL ZXSSO (AJIEM4Vf,N,NSiloEPS'OELTA.flA?,IOPT,PARHlX.SSQF.XJACOPTr 200
1.ZXJAC.XJTJ.&tCQK9IHF!RPIER) . ............ ..... OPT 210X(2)zX12)ml.1-3 OPT .220
CSSz( I.-EXPI-XI 2 WMET... ........ OPT 23012UTE (6930) X1)*CSS.... ..... OPT 240RETlUftI OPT 250
C OPT 26020 FORMAT ISX, 'ENTER FAILURE TIMES (MOWjS I IN 'MOEN, AS P . OPIPTEO.: . OPT 27030 MM~AT (SX9 ThE FAILUZ7E TIMES INDICATE THAT TH! ESTIMATED NUL1SER'/OPT 280
15X,' Of DEFECTIVES ENTERIfl3 THE SCREEN 1S ',F10.C/5X*' AND THE ESCPT 290C.TflflTED SCREE?*IN STRUE:'TH 1S * .S.3,.) OPT 300
OPT 310S UTf!ASIEA)4 IX.11,NP) A1IEA 10
P!AL*6 XX(21vFF(200),TT(2OO1 AII!A C0#LIL04 XIN).FIM)vT1200) . .AIIIA 30CCO¶.:^- ZSOAO AMIA 40REUIND 17 MA 0WX110.11) .. Afl!A .60XX 2 )2Xf 2 30.1-3 A*IEA 7000 30 1:1.1 AIIA .80RCAO 417t'I T(I) ...... .... . A1.A 90TTII)STII) AuIEA 100
IF rrIJ*X12)6T.70.0) TO10..................... ....DIA 110IT 00XX123.T.0.00) URITE (6,40) AJI!A 120
Go TO 20 AMEA 14010 FF(I)xz'0hrTII),XX(I)-OFLOAT(Ii ....... ..... . AMEA 1S020 F(IISFF(I) .. . . . . . . .AJIEA 16030 CCHTINJI A2IEA 170
RETLWI A*IEA 180C AHEA 19044 FCWhAT fIX.-NEGATIVE At ATTEMPTE -- HN! VXPECTIO VALUES MAY#,$ BE NA?¶EA 200
lECOED.) .'3 . ... . AREIA 210EN.... ...................... AIIA 220
219
% 35
MISSIONOf
Rowe Air Development CenterRWIC p1ana and execute4 %ie~scaAch, deveeopene~t, teA t andaetec-ted acqui~Le..on p~ogltam8 in Auppo*.tt o6 Command. CecfoCowmwtcuuztion and 1'Lte~ttigence (C31) activitie6. Tv'ch;Ucak.and enginee/winq 6uppo'tt within aueas oj tech nicat c '"petopicei4 p'otovided ~to ESV7 Ptoa'm 066ice6 (PO-s) and othei [SPietemeanta. The pniina.pa~e technicate mins~sion atcaa n~e~onu'unicationd, etectAomagnetic guiAdantce and coI'WLC., 5wr
vei.Lance oj qtound and aeio~iace objects, inteeip,-w. fiCottection and hantdtizg, b n~o.nia tioi sil~stem techav?'Ž'ni.i1ono4phmicc piopaqation, -4c'd 4state sccnce6, M~CtlounC'
phqc~sandetec4tAoptic 'tet~iabditir, maintetairb4itty i~ndcompa~tibiLtit.