Prediction of perceived astringency induced by phenolic compounds
Upload
independentCategory
view
1download
0
Mc
Ha
b
I
a
ARR1AA
KPAWOM
1
sSatraTfcl
otmlmti
0d
Talanta 77 (2009) 1466–1472
Contents lists available at ScienceDirect
Talanta
journa l homepage: www.e lsev ier .com/ locate / ta lanta
ultisyringe flow injection system for solid-phase extraction coupled to liquidhromatography using monolithic column for screening of phenolic pollutants
ugo M. Oliveiraa, Marcela A. Segundoa,∗, José L.F.C. Limaa, Victor Cerdàb
REQUIMTE, Servico de Química-Física, Faculdade de Farmácia, Universidade do Porto, Rua Aníbal Cunha, 164, 4099-030 Porto, PortugalDepartment of Chemistry, Faculty of Sciences, University of the Balearic Islands, Carretera de Valldemossa km 7.5, E-07122 Palma de Mallorca,
lles Balears, Spain
r t i c l e i n f o
rticle history:eceived 26 May 2008eceived in revised form8 September 2008ccepted 21 September 2008
a b s t r a c t
In this work a fast, automatic solid-phase extraction procedure hyphenated to HPLC-UV is proposed forscreening of priority phenolic pollutants in waters at ng mL−1 levels. A flow through column, containingpolystyrene-divinylbenzene sorbent, was incorporated to a multisyringe flow injection system (MSFIA),where the sample loading and analyte elution were carried out after computer control. The MSFIA systemalso directed the eluent to fill the injection loop of the chromatograph, coupling the sample preparation
vailable online 30 September 2008eywords:henolic pollutantsutomatic solid-phase extractionater analysis
n-line preconcentration
to its determination. High enrichment factors were attained for phenol and ten of its derivatives (meanvalue 176 for 50 mL of sample), with LOD values lower than 1 ng mL−1 for the maximum volume of sampleused (100 mL). For all analytes, mean recoveries between 89 and 103% were obtained for different watermatrices. Certified reference material and a contaminated soil (RTC-CRM 112) were also tested success-fully. The determination frequency was 4–10 h−1, providing an automatic, fast and reliable tool for waterquality and environmental monitoring.
dim
pcrtrtcwfn
tt
ultisyringe flow injection analysis
. Introduction
Phenolic compounds are widespread aquatic pollutants. Con-idering their toxicological and organoleptic effects, the Unitedtates Environmental Protection Agency (EPA) has listed phenolnd several derivatives as priority pollutants [1]. Their input intohe ecosystems results directly from the human activity or indi-ectly from the transformation of natural or synthetic chemicalsnd they are often found in waters from different sources [2–5].he screening of phenol and its derivatives in risk areas is essentialor public health protection in order to spot timely illegal dis-harges from industry or contamination by pesticides, even at lowevels.
Different strategies have been described for the quantificationf phenolic compounds in water samples, including separationechniques such as liquid chromatography (LC) [6–8] or gas chro-
atography (GC) [9–11] coupled to different detectors. Due to the
ow volatility character of phenolic compounds, LC is employedore often than GC because analyte derivatization is avoided. Fur-hermore, with the advent of monolithic columns, fast analysiss possible [12], allowing the determination of several phenolic
∗ Corresponding author. Tel.: +351 222078994; fax: +351 222078961.E-mail address: [email protected] (M.A. Segundo).
icoppcll
039-9140/$ – see front matter © 2008 Elsevier B.V. All rights reserved.oi:10.1016/j.talanta.2008.09.036
© 2008 Elsevier B.V. All rights reserved.
erivatives in about 3 min [13,14]. However, sample preparations frequently required in order to attain analyte enrichment and
atrix removal.Despite the available fast chromatographic methods, the sample
reconcentration/clean up step restricts the sample throughput,onditioning the number of samples that can be processed in envi-onmental surveillance schemes. In this context, automation ofhe sample preparation step is relevant. In fact, some alternativesesorting to robotic systems have been described [15,16]. However,he hyphenation to the chromatograph is not easy, requiring dedi-ated, expensive equipment. Other alternatives using flow-systemsith on-line column switching schemes have also been described
or simpler hyphenation between sample treatment and determi-ation [17,18].
Flow injection systems have been clearly underexploited forhis task [19], especially the more recent, computer controlledechniques. Multisyringe flow injection analysis (MSFIA) [20]s one of them and its features (flow network design, multi-hannel operation and total compatibility of the manifold withrganic solvents) allow the assembling and operation of solid-
hase extraction (SPE) devices [21]. Therefore, the objective of theresent work is the development of a fast MSFIA-SPE procedureoupled to LC-UV determination for screening of priority pheno-ic pollutants in waters and environmental samples at ng mL−1evels.

H.M. Oliveira et al. / Talanta 77 (2009) 1466–1472 1467
Table 1Detection wavelength, log Kow, pKa and structures of EPA phenolic priority pollutants.
.
Phenolic compound �/nm log Kowa pKa
a Structure
C2 C3 C4 C5 C6
2,4-Dinitrophenol (24DNP) 360 1.53 4.09 NO2 NO2
2-Methyl-4,6-dinitrophenol (46DNOC) 375 2.12 4.34 CH3 NO2 NO2
Phenol (P) 215 1.50 9.994-Nitrophenol (4NP) 315 1.90 7.16 NO2
2-Chlorophenol (2CP) 195 2.15 8.55 Cl2-Nitrophenol (2NP) 210 1.78 7.21 NO2
2,4-Dimethylphenol (24DMP) 195 2.42 10.6 CH3 CH3
4-Chloro-3-methylphenol (4C3MP) 195 3.10 9.55 CH3 Cl2,4-Dicholorophenol (24DCP) 200 2.08 7.85 Cl ClPentachlorophenol (PCP) 220 5.01 4.93 Cl Cl Cl Cl Cl2
Hetheo Lee, Hi
2
2
(cwmso
S(((((eaato(t
uSmftfwbtpw[(f
c
Lsawu
2
MeapssbPuM
aaempwtce
QmdTw(
,4,6-Trichlorophenol (246TCP) 200 3.69
a From references (1) Dean, J.R.; Tomlinson, W.R.; Makovskaya, V.; Cumming, R.;ctanol–water partition coefficient. Anal. Chem. 1996, 68, (1), 130–133; (2) Li, N. Q.;on-exchange solid-phase extraction. Anal. Chem. 1997, 69, (24), 5193–5199.
. Material and methods
.1. Reagents and solutions
All solutions were prepared with water from MilliQ systemMillipore, Bedford, MA, USA) (resistivity > 1.8 × 10⁵ � cm) andhemicals of analytical-reagent grade quality. Methanolic solutionsere prepared with methanol HPLC grade (Merck, Darmstadt, Ger-any). This organic solvent was also used as SPE eluent. The SPE
orbent Lichrolut EN (cross linked styrene-divinylbenzene) wasbtained from Merck.
The phenolic compounds (Table 1) used were purchased fromigma–Aldrich (St. Louis, MO, USA) and were the following: phenolP), 2-nitrophenol (2NP), 4-nitrophenol (4NP), 2,4-dinitrophenol24DNP), 2-methyl-4,6-dinitrophenol (46DNOC), 2-chlorophenol2CP), 2,4-dicholorophenol (24DCP), 2,4,6-trichlorophenol246TCP), pentachlorophenol (PCP), 4-chloro-3-methylphenol4C3MP), and 2,4-dimethylphenol (24DMP). The stock solution ofach phenolic compound was prepared by accurately weighing theppropriate mass and by dissolving it in methanol in order to obtainfinal concentration of 1000 mg L−1. The working standard solu-
ions (containing either mixtures or individual compounds) werebtained by rigorous dilution of the stock solutions in methanolfor direct injection into HPLC system) or in 0.010 mol L−1 HCl (forhe preconcentration step).
For accuracy assessment, recovery assays were performedsing analytical grade standards of each compound obtained fromupelco (Bellefonte, PA, USA). All standards were purchased in 1 mLethanol solution with the concentration of 5000 mg L−1, except
or 4C3MP, whose concentration was 500 mg L−1. For the prepara-ion of working standard solutions the same procedure describedor the standard solutions was adopted, except for the solvent,hich was replaced by water from different sources. In this case,
efore spiking the water samples with the mixture of analytes,hey were filtered through a 0.45 �m membrane filter and theH was adjusted to 2 with concentrated HCl (12 mol L−1). The seaater matrix was prepared after the APHA/AWWA/WEF procedure
22]. Furthermore, certified reference material from LGC-StandardsMiddlesex, UK), ref. U-QCI-760 and RTC-QCI-032, was also appliedor accuracy assessment.
For the HPLC methodology, HPLC grade acetonitrile was pur-hased from Merck. Sodium dihydrogen phosphate (Sigma, St.
2
s0
7.42 Cl Cl Cl
ridge, M.; Comber, M., Solid-phase microextraction as a method for estimating the. K., Trace enrichment of phenolic compounds from aqueous samples by dynamic
ouis, MO, USA) solution was prepared by dissolving 6.8 g of thealt in 1000 mL of water, and the pH of this solution was adjusted tofinal value of 5.25 using a NaOH solution (6 mol L−1). All solutionsere filtered through a 0.45 �m membrane filter and degassedsing ultrasound before use.
.2. Apparatus
Chromatographic determinations were conducted on aerck/Hitachi-LaChrom 7000 series (Hitachi Ltd., Tokio, Japan)
quipped with a diode array detector (L-7455), a pump (L-7100)nd a Chromolith RP-18e (100 mm × 4.6 mm i.d.) column withre-column (5 mm × 4.6 mm i.d.) (Merck). The chromatographicystem was controlled by an interface (D-7000) and the D-7000oftware. The eluate of the preconcentrated sample was injectedy using a Rheodyne 7725i manual injector (Rheodyne, Rohnertark, CA, USA) equipped with 20 �L loop. This device was alsosed as interface between the chromatographic and the automaticSFIA-SPE system.Solutions were propelled in the preconcentration system by
multisyringe burette (Crison Instruments, Allela, Spain) andMinipuls 3 peristaltic pump (Gilson Villiers-le-Bel, France)
quipped with polyvinylchloride pumping tubes. In this work, theultisyringe module was equipped with a syringe of 10 mL in
osition 2 and a syringe of 5 mL in position 3. Besides the three-ay commutation valve (NResearch, Caldwell, NJ, USA) connected
o the head of each syringe, four extra commutation valves wereonnected and controlled through the burette. For all valves, thexchange options were classified in on/off lines.
A personal computer, running lab-made software written inuickBasic 4.5 (Microsoft, Redmond, WA, USA), controlled theultisyringe operation (number of steps and direction of piston
isplacement, position of all commutation valves) by a serial port.he peristaltic pump control (flow direction and rotation speed)as performed by the same software using a PCL-711 interface card
Advantech, Taipei, Taiwan).
.3. Manifold and MSFIA procedure
The different components of the flow-system were disposed ashown schematically in Fig. 1. All connections were made with.8 mm i.d. polytetrafluorethylene (PTFE) tubing (Omnifit, Cam-

1468 H.M. Oliveira et al. / Talanta
Fig. 1. (A) MSFIA-SPE manifold for the automatic preconcentration of phenoliccompounds coupled to LC equipment. (B) Detailed representation of the connec-tion between MSFIA-SPE manifold and the chromatographic system through theinjection valve on “load” and “inject” positions. MS, multisyringe; Si, syringe; Vi,commutation valves; EC, SPE column; IV, injection valve; PP, peristaltic pump; W,waste; L1, connection tubing (30 cm); S2, syringe 10 mL; S3, syringe 5 mL; C, car-rier (HCl 0.010 mol L−1); EL, eluent (methanol); S, sample or standard solution;HP, high-pressure pump; MCC, monolithic chromatographic column; MSFIA-SPE,prNd
bcw8fit
eTot(0(s1oSHattiti
2
aoto
3
3
fof a monolithic column (100 mm × 4.6 mm i.d.) allowed the sep-
TP
D
S
1
2
3
4
5
6
7
reconcentration flow-system; CP, closed port. In the valves, the position “on” isepresented by a solid line while the position “off” is represented by a dotted line.eedle port and connection to waste in the injection valve are also represented byotted lines.
ridge, UK). A lab-made polyetheretherketone (PEEK) extractionolumn was used. This column presented a tubular configuration
ith 24 mm of length and 3 mm of internal diameter, containing7 mg of sorbent. The resin was trapped inside the column by usinglter disks from MoBiTec (Goettingen, Germany) with pore diame-er of 10 �m (ref. #2210).
aatp
able 2rotocol sequence for the automatic solid-phase extraction of phenolic compounds from
escription Position
tep MS operation Chromatograph 1 2
Sorbent bed is washed withmethanol
Chromatographic run (sampleX-1); injection loop is washedwith methanol
- F
HCl solution is sent through thecolumn for sorbent conditioning
Chromatographic run (sampleX-1)
- N
Syringes are refilled and sample Xis loaded to the preconcentrationcolumnc where analytes retentiontake place
Chromatographic run (sampleX-1) finishes
- F
HCl solution is sent through thecolumn for matrix removal
– – N
Methanol is sent through thesorbent, eluting the retainedanalytes
The loop of the injection valveis filled by eluent
– F
– The segment of eluate trappedin the loop is injected and thechromatographic run starts
– –
Syringes are refilled Chromatographic run (sampleX); the injection valve isreturned to “load” position
– F
a N and F represent position “on” and “off”, respectively.b The indicated values for volume refer to syringe 2 (10 mL).c The peristaltic pump is activated (8 mL min−1) during the time necessary for propellin
77 (2009) 1466–1472
The protocol sequence adopted for the automatic solid-phasextraction of EPA phenolic compounds is described in Table 2.he complete sequence included six steps. A volume of 3500 �Lf methanol was propelled through the extraction column andhe chromatographic injection loop in order to clean the systemstep 1). After commutation of the appropriate valves, 2500 �L of.010 mol L−1 HCl solution were used for conditioning the sorbentstep 2). Afterwards, with all valves in “Off” position, the peri-taltic pump was activated and a variable sample volume up to00 mL was direct towards to the extraction column at flow ratef 8.0 mL min−1. Simultaneously, the syringes were filled (step 3).ubsequently, the extraction column was washed with 2500 �L ofCl solution in order to remove the sample matrix (step 4). Thenalytes retained were eluted with 610 �L of methanol and directo the chromatograph, filling the IV loop (step 5). Next, 20 �L ofhe eluate were injected into the chromatographic system by rotat-ng the injection valve to the “inject” position (step 6), beginninghe chromatographic run. Finally, the syringes were refilled and thenjection valve was returned to the “load” position (step 7).
.4. Soil sample
A certified soil sample (ref. RTC-CRM 112, LGC Standards) wasnalyzed. Five grams of soil were weighted and added to 100 mLf water. After 19 h of storage in the dark, the mixture was passedhough a 0.22 �m filter. The filtrate was acidified to pH 2 by additionf concentrated HCl and then processed by the MSFIA system.
. Results and discussion
.1. Chromatographic analysis
The chromatographic method used in this work was adaptedrom that proposed by Cledera-Castro et al. [13]. The utilization
ration and quantification of eleven EPA priority pollutants inpproximately 5 min with an analytical performance comparableo that obtained by using conventional microparticulate reversed-hase columns. All the chromatographic conditions (mobile phase
water.
of the commutation valvesa MS operation
3 4 5 6 7 8 Volume/�Lb Time/s
N - N F N F 7000 70
F - F N F F 2500 30
F - F F F F 3720 14.8–750
F – F N F F 2500 30
N – N F N F 1220 24.4
– – – – – – – –
F – F F F F 9500 38
g the defined sample volume (up to 100 mL).
lanta 77 (2009) 1466–1472 1469
cw2ev
3
csPisonesdt
aalSata(aptiocfTcaIbafvtmattts
cpttedfupaacf
Fu1
efuhddfTbwteae
dtddtctrbhcavofr
3
ue
H.M. Oliveira et al. / Ta
omposition, flow rate and sample volume) were maintainedith exception of temperature. Room temperature (approximately
3 ◦C) was applied instead of 36 ◦C because no significant differ-nces were observed in the performance of the method using eitheralue.
.2. Development of the automatic MSFIA-SPE system
The use of a MSFIA flow based manifold allowed the preciseontrol of the flow rate and volume of the solutions used for theorbent conditioning and respective elution. The glass syringes andTFE valves that constitute the multisyringe burette and all remain-ng components of the manifold were also compatible with organicolvents. A peristaltic pump was assembled to the flow manifold inrder to load sample volumes up to 100 mL. By using this device theecessity of filling a holding coil before sending the sample to thextraction column with the correspondent time-consuming repo-itioning movements of the piston bar [23] was avoided, allowing arastic reduction in the time necessary to perform this step duringhe protocol sequence.
Some operational parameters as the carrier solution, volumesnd flow rates used were fixed according to reported data [24]nd our previous experience [25]. The retention of the target ana-ytes was performed at pH 2.0, using HCl 0.010 mol L−1 as carrier.amples and standards were also acidified to this pH. Taking intoccount the reversed-phase interactions between the sorbent andhe analytes, this pH was necessary to prevent the ionization ofll priority phenolic pollutants, which pKa is in the range 4–11Table 1). A volume of 3.5 mL of methanol was used for removing thenalytes not injected into the HPLC system in the beginning of eachrotocol sequence. This procedure allowed a complete cleaning ofhe extraction column and the HPLC connection tubing, eliminat-ng carryover between consecutive samples. Two portions of 2.5 mLf carrier solution (HCl 0.010 mol L−1) were fed into the extractionolumn immediately before and after the sample loading step, per-orming the sorbent conditioning and the sample matrix cleanup.his volume was fixed considering the volumes of the sorbent bed,onnection tubing and commutation valves, guaranteeing an oper-tion without contamination by consecutive injections of samples.n order to prevent the formation of a liquid gap before the sorbented top with a consequent pressure build-up, the sample loadingnd the elution steps were performed in opposite ways. There-ore, the extraction column was placed between two commutationalves (Fig. 1, V5-V7). The length of the connection tubing betweenhe exit of the extraction column and injection valve (Fig. 1, L1) was
ade as short as possible to prevent dispersion of the extractednalytes. The introduction of the commutation valve V8 (Fig. 1) inhe flow path between the sample commutation valve (V6) andhe extraction column (V7-V5) was necessary to avoid the con-amination of the extraction column when the sample or standardolutions were changed.
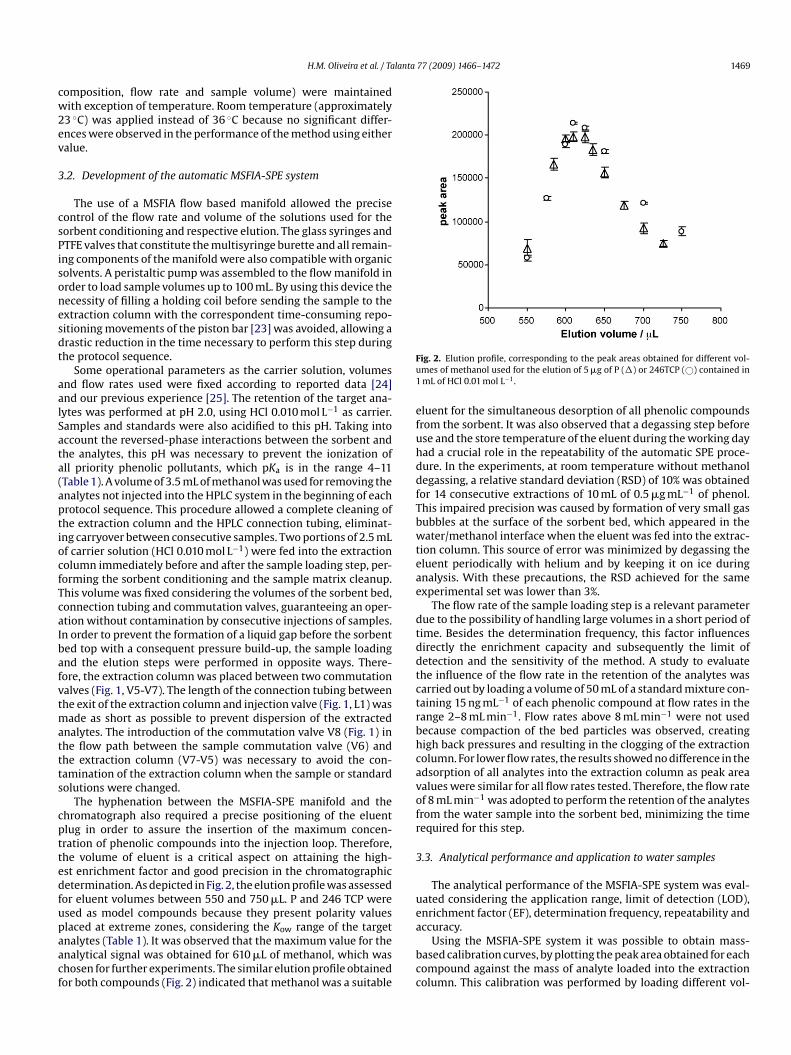
The hyphenation between the MSFIA-SPE manifold and thehromatograph also required a precise positioning of the eluentlug in order to assure the insertion of the maximum concen-ration of phenolic compounds into the injection loop. Therefore,he volume of eluent is a critical aspect on attaining the high-st enrichment factor and good precision in the chromatographicetermination. As depicted in Fig. 2, the elution profile was assessedor eluent volumes between 550 and 750 �L. P and 246 TCP weresed as model compounds because they present polarity values
laced at extreme zones, considering the Kow range of the targetnalytes (Table 1). It was observed that the maximum value for thenalytical signal was obtained for 610 �L of methanol, which washosen for further experiments. The similar elution profile obtainedor both compounds (Fig. 2) indicated that methanol was a suitablea
bcc
ig. 2. Elution profile, corresponding to the peak areas obtained for different vol-mes of methanol used for the elution of 5 �g of P (�) or 246TCP (©) contained inmL of HCl 0.01 mol L−1.
luent for the simultaneous desorption of all phenolic compoundsrom the sorbent. It was also observed that a degassing step beforese and the store temperature of the eluent during the working dayad a crucial role in the repeatability of the automatic SPE proce-ure. In the experiments, at room temperature without methanolegassing, a relative standard deviation (RSD) of 10% was obtainedor 14 consecutive extractions of 10 mL of 0.5 �g mL−1 of phenol.his impaired precision was caused by formation of very small gasubbles at the surface of the sorbent bed, which appeared in theater/methanol interface when the eluent was fed into the extrac-
ion column. This source of error was minimized by degassing theluent periodically with helium and by keeping it on ice duringnalysis. With these precautions, the RSD achieved for the samexperimental set was lower than 3%.
The flow rate of the sample loading step is a relevant parameterue to the possibility of handling large volumes in a short period ofime. Besides the determination frequency, this factor influencesirectly the enrichment capacity and subsequently the limit ofetection and the sensitivity of the method. A study to evaluatehe influence of the flow rate in the retention of the analytes wasarried out by loading a volume of 50 mL of a standard mixture con-aining 15 ng mL−1 of each phenolic compound at flow rates in theange 2–8 mL min−1. Flow rates above 8 mL min−1 were not usedecause compaction of the bed particles was observed, creatingigh back pressures and resulting in the clogging of the extractionolumn. For lower flow rates, the results showed no difference in thedsorption of all analytes into the extraction column as peak areaalues were similar for all flow rates tested. Therefore, the flow ratef 8 mL min−1 was adopted to perform the retention of the analytesrom the water sample into the sorbent bed, minimizing the timeequired for this step.
.3. Analytical performance and application to water samples
The analytical performance of the MSFIA-SPE system was eval-ated considering the application range, limit of detection (LOD),nrichment factor (EF), determination frequency, repeatability and
ccuracy.Using the MSFIA-SPE system it was possible to obtain mass-ased calibration curves, by plotting the peak area obtained for eachompound against the mass of analyte loaded into the extractionolumn. This calibration was performed by loading different vol-

1470 H.M. Oliveira et al. / Talanta 77 (2009) 1466–1472
Table 3Linear dynamic range, calibration curve parameters, values for limit of detection (LOD) and enrichment factors (EF) obtained for the proposed method.
Calibration curvea
Compound Linear range/ng Slope/area units ng−1 Interception r2 LOD/ng LODb/ng mL−1 EFc
24DNP 350–3500 32.9 ± 0.6 1813 ± 818 0.995 207 2 n. a.46DNOC 350–3500 31.9 ± 0.5 -830 ± 674 0.998 103 1 148 ± 5P 300–3000 38.7 ± 0.8 424 ± 924 0.996 157 2 198 ± 54NP 225–2250 52 ± 1 −116 ± 949 0.997 110 1 187 ± 62CP 200–2000 214 ± 5 1243 ± 888 0.999 31 0.3 195 ± 42NP 200–2000 57 ± 1 −431 ± 891 0.994 87 0.9 189 ± 624DMP 200–2000 236 ± 5 1106 ± 982 0.999 30 0.3 193 ± 44C3MP 200–2000 147 ± 3 835 ± 286 0.996 18 0.2 215 ± 624DCP 150–1500 164 ± 3 644 ± 947 0.998 39 0.4 177 ± 4PCP 200–2000 57 ± 1 −979 ± 780 0.996 66 0.7 110 ± 3246TCP 150–1500 96 ± 2 −421 ± 1070 0.995 55 0.6 151 ± 3
uBit
2e(
tviLa
raoc2uu
tclto
staT(4
sncrw
aawtwro1oTb
TVc
C
24P422242P2M
n
a For 25 mL of standard mixtures.b For sample preconcentration volume of 100 mL.c For sample preconcentration volume of 50 mL. n. a., not available.
mes of standard, resulting in a dynamic calibration range [25,26].esides using a single or a small number of standard mixtures to cal-
brate the system, it was also possible to adjust the loaded volumeo the concentration of the target analytes for each sample.
Calibration curves (Table 3) were established by extracting5 mL of a set of standard mixtures containing a defined amount ofach compound. The linear dynamic range varied from 150–1500 ng24DCP and 246TCP) to 350–3500 ng (24DNP and 46DNOC).
The LOD was calculated as the mass of compound correspondingo the interception plus three times Sy/x [27]. The values obtainedaried between 18 ng for 4C3MP and 207 ng for 24DNP. Consider-ng the maximum volume of sample used in this work (100 mL)OD values ≤1 ng mL−1 was attained for nine of the eleven targetnalytes (Table 3).
The enrichment factor for each analyte was calculated by theatio between the slope of the calibration curves obtained after SPEnd the slope of the calibration curve obtained after direct injectionf the analytes into the chromatographic system [28]. For the pre-oncentrated volume of 50 mL the average EF was 176 and only for4DNP and PCP the value was lower than 150 (Table 3). Higher val-es of EF would be easily attained by increasing the sample volumesed in the extraction step.
The time required for a complete analytical cycle included theime necessary for performing the SPE protocol followed by the
hromatographic run. As these two steps were performed in paral-el, the total analysis time was defined by the SPE procedure whenhe sample volume was higher than 19.2 mL (144 s in step 3, Table 2)r by the chromatographic run (that takes about 5 min) for lowerssvR
able 4alues of percentage of recovery obtained for the preconcentration of 50 and 100 mL of sporrespond to a mean of five determinations ± standard deviation.
ompound Milli Q water Mineral water
50 mL 100 mL 50 mL 10
4DNP 90 ± 4 87 ± 5 83 ± 7 866DNOC 119 ± 9 117 ± 5 93 ± 10 94
96 ± 4 82 ± 3 96 ± 10 96NP 98 ± 3 90 ± 5 88 ± 10 93CP 91 ± 3 84 ± 3 90 ± 8 95NP 112 ± 8 106 ± 5 90 ± 9 954DMP 100 ± 5 93 ± 5 91 ± 10 94C3MP 118 ± 8 106 ± 6 102 ± 11 1144DCP 112 ± 7 103 ± 4 90 ± 8 99CP 86 ± 6 93 ± 2 n. a. n.46TCP 110 ± 9 126 ± 9 86 ± 10 10ean recovery 103 99 91 98
. a., not available.
ample volumes. For screening purposes at low �g L−1 concen-ration levels, sample volumes between 25 and 100 mL must bepplied, thus sample throughput was limited by the SPE protocol.his procedure took between 6 (for 25 mL of sample) and 15 minfor 100 mL of sample), hence the determination frequency was–10 h−1.
Regardless of the sample volume processed, it should be empha-ized that a reduced amount of reagents and solvents wereecessary to perform the sample preparation. For each SPE pro-edure only 4.1 mL of methanol and 5 mL of HCl 0.010 mol L−1 wereequired. Furthermore, the sorbent was reutilized up to 100 times,ithout loss of performance.
The accuracy and repeatability of the MSFIA-SPE method weressessed by analysing spiked water samples from different sourcesnd certified reference material. The samples (MilliQ water, mineralater, tap water and sea water) were spiked with a mixture of cer-
ified standard solutions. An amount of 500 ng of each compoundas added to 50 mL (10 ng mL−1) and to 100 mL (5 ng mL−1). The
esults provided by the MSFIA-SPE method expressed as percentagef recovery are listed in Table 4. Mean recoveries between 89 and03% were obtained for the different samples and more than 90%f the determinations presented a recovery between 85 and 110%.he results demonstrated that the performance was not affectedy the saline content or the ionic strength of the sample due to the
imilar results for the different matrices analyzed. Moreover, theimilarity founded in the results obtained using different sampleolumes indicated that no breakthrough occurred up to 100 mL.epeatability was estimated by calculating RSD of 5 consecutiveiked water sample containing 500 ng of each phenolic compound. The listed values
Tap water Sea water
0 mL 50 mL 100 mL 50 mL 100 mL
± 6 n. a. n. a. 107 ± 4 98 ± 3± 6 99 ± 5 108 ± 3 124 ± 5 118 ± 5± 9 88 ± 2 84 ± 5 95 ± 3 87 ± 3± 7 85 ± 6 88 ± 4 100 ± 3 92 ± 3± 7 86 ± 4 90 ± 5 93 ± 4 89 ± 4± 7 88 ± 3 93 ± 1 97 ± 3 91 ± 5± 6 n. a. n. a. 107 ± 4 99 ± 4± 9 89 ± 6 95 ± 4 109 ± 4 105 ± 5
± 6 89 ± 5 97 ± 4 96 ± 4 93 ± 5a. n. a. n. a. 94 ± 8 94 ± 58 ± 10 88 ± 4 103 ± 9 116 ± 10 122 ± 3
89 95 103 99
H.M. Oliveira et al. / Talanta
FS4
da
u2uw3123((stpcVceo
3
tstcd
TRi
C
24P42242P
n
lbpmabtpttHwtdMloeMtdtp
4
ofimp“bddos(rs
A
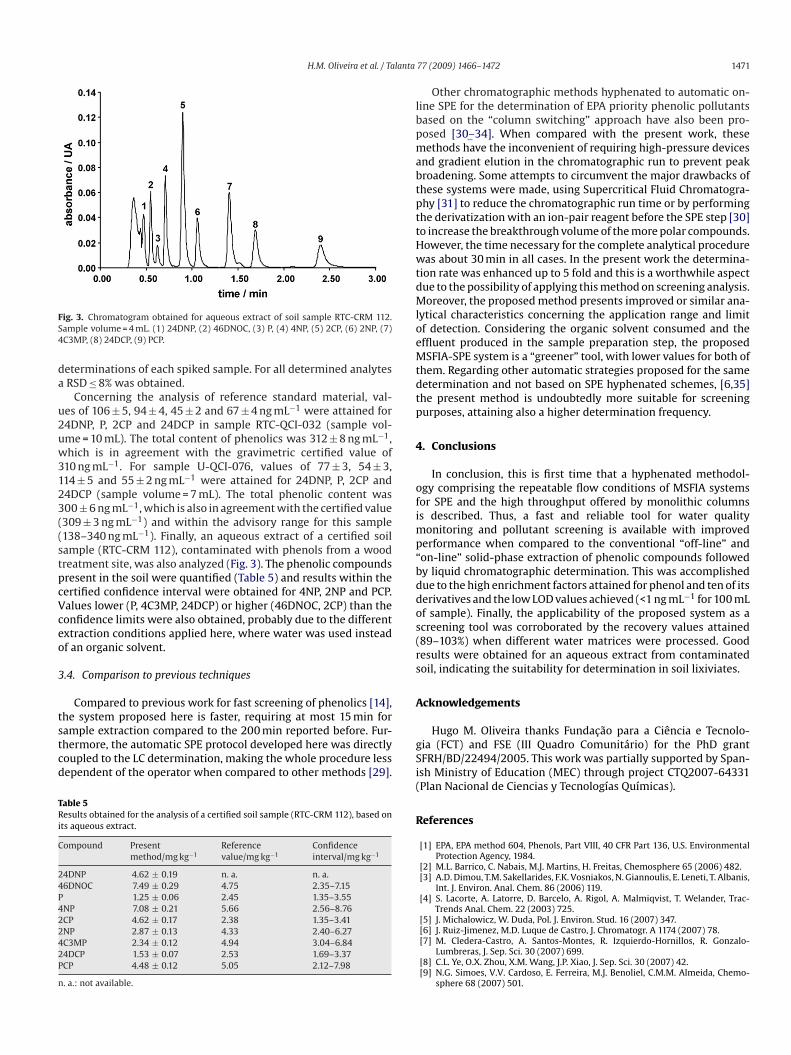
ig. 3. Chromatogram obtained for aqueous extract of soil sample RTC-CRM 112.ample volume = 4 mL. (1) 24DNP, (2) 46DNOC, (3) P, (4) 4NP, (5) 2CP, (6) 2NP, (7)C3MP, (8) 24DCP, (9) PCP.
eterminations of each spiked sample. For all determined analytesRSD ≤ 8% was obtained.
Concerning the analysis of reference standard material, val-es of 106 ± 5, 94 ± 4, 45 ± 2 and 67 ± 4 ng mL−1 were attained for4DNP, P, 2CP and 24DCP in sample RTC-QCI-032 (sample vol-me = 10 mL). The total content of phenolics was 312 ± 8 ng mL−1,hich is in agreement with the gravimetric certified value of
10 ng mL−1. For sample U-QCI-076, values of 77 ± 3, 54 ± 3,14 ± 5 and 55 ± 2 ng mL−1 were attained for 24DNP, P, 2CP and4DCP (sample volume = 7 mL). The total phenolic content was00 ± 6 ng mL−1, which is also in agreement with the certified value309 ± 3 ng mL−1) and within the advisory range for this sample138–340 ng mL−1). Finally, an aqueous extract of a certified soilample (RTC-CRM 112), contaminated with phenols from a woodreatment site, was also analyzed (Fig. 3). The phenolic compoundsresent in the soil were quantified (Table 5) and results within theertified confidence interval were obtained for 4NP, 2NP and PCP.alues lower (P, 4C3MP, 24DCP) or higher (46DNOC, 2CP) than theonfidence limits were also obtained, probably due to the differentxtraction conditions applied here, where water was used insteadf an organic solvent.
.4. Comparison to previous techniques
Compared to previous work for fast screening of phenolics [14],
he system proposed here is faster, requiring at most 15 min forample extraction compared to the 200 min reported before. Fur-hermore, the automatic SPE protocol developed here was directlyoupled to the LC determination, making the whole procedure lessependent of the operator when compared to other methods [29].able 5esults obtained for the analysis of a certified soil sample (RTC-CRM 112), based on
ts aqueous extract.
ompound Presentmethod/mg kg−1
Referencevalue/mg kg−1
Confidenceinterval/mg kg−1
4DNP 4.62 ± 0.19 n. a. n. a.6DNOC 7.49 ± 0.29 4.75 2.35–7.15
1.25 ± 0.06 2.45 1.35–3.55NP 7.08 ± 0.21 5.66 2.56–8.76CP 4.62 ± 0.17 2.38 1.35–3.41NP 2.87 ± 0.13 4.33 2.40–6.27C3MP 2.34 ± 0.12 4.94 3.04–6.844DCP 1.53 ± 0.07 2.53 1.69–3.37CP 4.48 ± 0.12 5.05 2.12–7.98
. a.: not available.
gSi(
R
77 (2009) 1466–1472 1471
Other chromatographic methods hyphenated to automatic on-ine SPE for the determination of EPA priority phenolic pollutantsased on the “column switching” approach have also been pro-osed [30–34]. When compared with the present work, theseethods have the inconvenient of requiring high-pressure devices
nd gradient elution in the chromatographic run to prevent peakroadening. Some attempts to circumvent the major drawbacks ofhese systems were made, using Supercritical Fluid Chromatogra-hy [31] to reduce the chromatographic run time or by performinghe derivatization with an ion-pair reagent before the SPE step [30]o increase the breakthrough volume of the more polar compounds.owever, the time necessary for the complete analytical procedureas about 30 min in all cases. In the present work the determina-
ion rate was enhanced up to 5 fold and this is a worthwhile aspectue to the possibility of applying this method on screening analysis.oreover, the proposed method presents improved or similar ana-
ytical characteristics concerning the application range and limitf detection. Considering the organic solvent consumed and theffluent produced in the sample preparation step, the proposedSFIA-SPE system is a “greener” tool, with lower values for both of
hem. Regarding other automatic strategies proposed for the sameetermination and not based on SPE hyphenated schemes, [6,35]he present method is undoubtedly more suitable for screeningurposes, attaining also a higher determination frequency.
. Conclusions
In conclusion, this is first time that a hyphenated methodol-gy comprising the repeatable flow conditions of MSFIA systemsor SPE and the high throughput offered by monolithic columnss described. Thus, a fast and reliable tool for water quality
onitoring and pollutant screening is available with improvederformance when compared to the conventional “off-line” andon-line” solid-phase extraction of phenolic compounds followedy liquid chromatographic determination. This was accomplishedue to the high enrichment factors attained for phenol and ten of itserivatives and the low LOD values achieved (<1 ng mL−1 for 100 mLf sample). Finally, the applicability of the proposed system as acreening tool was corroborated by the recovery values attained89–103%) when different water matrices were processed. Goodesults were obtained for an aqueous extract from contaminatedoil, indicating the suitability for determination in soil lixiviates.
cknowledgements
Hugo M. Oliveira thanks Fundacão para a Ciência e Tecnolo-ia (FCT) and FSE (III Quadro Comunitário) for the PhD grantFRH/BD/22494/2005. This work was partially supported by Span-sh Ministry of Education (MEC) through project CTQ2007-64331Plan Nacional de Ciencias y Tecnologías Químicas).
eferences
[1] EPA, EPA method 604, Phenols, Part VIII, 40 CFR Part 136, U.S. EnvironmentalProtection Agency, 1984.
[2] M.L. Barrico, C. Nabais, M.J. Martins, H. Freitas, Chemosphere 65 (2006) 482.[3] A.D. Dimou, T.M. Sakellarides, F.K. Vosniakos, N. Giannoulis, E. Leneti, T. Albanis,
Int. J. Environ. Anal. Chem. 86 (2006) 119.[4] S. Lacorte, A. Latorre, D. Barcelo, A. Rigol, A. Malmiqvist, T. Welander, Trac-
Trends Anal. Chem. 22 (2003) 725.[5] J. Michalowicz, W. Duda, Pol. J. Environ. Stud. 16 (2007) 347.
[6] J. Ruiz-Jimenez, M.D. Luque de Castro, J. Chromatogr. A 1174 (2007) 78.[7] M. Cledera-Castro, A. Santos-Montes, R. Izquierdo-Hornillos, R. Gonzalo-Lumbreras, J. Sep. Sci. 30 (2007) 699.[8] C.L. Ye, O.X. Zhou, X.M. Wang, J.P. Xiao, J. Sep. Sci. 30 (2007) 42.[9] N.G. Simoes, V.V. Cardoso, E. Ferreira, M.J. Benoliel, C.M.M. Almeida, Chemo-
sphere 68 (2007) 501.

1 lanta
[
[[[
[[[
[[[
[
[[
[
[
[
[
[
[[
[
[Chromatographia 46 (1997) 295.
472 H.M. Oliveira et al. / Ta
10] M. Kladi, M. Dassenakis, M. Scoullos, N. Psaroudakis, Fresenius Environ. Bull. 15(2006) 1003.
11] M. Schellin, P. Popp, J. Chromatogr. A 1072 (2005) 37.12] S. El Deeb, L. Preu, H. Watzig, J. Sep. Sci. 30 (2007) 1993.13] M. Cledera-Castro, A. Santos-Montes, R. Izquierdo-Hornillos, J. Chromatogr. A
1087 (2005) 57.14] M. Ali, H.Y. Aboul-Enein, Anal. Lett. 37 (2004) 2351.15] D.T. Rossi, N. Zhang, J. Chromatogr. A 885 (2000) 97.16] J. O’Reilly, O. Wang, L. Setkova, J.P. Hutchinson, Y. Chen, H.L. Lord, C.M. Linton,
J. Pawliszyn, J. Sep. Sci. 28 (2005) 2010.17] P. Sadilek, D. Satinsky, P. Solich, Trac-Trends Anal. Chem. 26 (2007) 375.18] M.C. Hennion, J. Chromatogr. A 856 (1999) 3.19] G.A. Theodoridis, C.K. Zacharis, A.N. Voulgaropoulos, J. Biochem. Biophys. Meth-
ods 70 (2007) 243.20] V. Cerdà, J.M. Estela, R. Forteza, A. Cladera, E. Becerra, P. Altimira, P. Sitjar, Talanta
50 (1999) 695.21] M.A. Segundo, L.M. Magalhães, Anal. Sci. 22 (2006) 3.22] L.S. Clesceri, A.E. Greenberg, A.D. Eaton, Standard Methods for the Examination
of Water and Wastewater, 20th ed., APHA, AWWA, WEF, Washington, 1998.23] M.A. Segundo, H.M. Oliveira, J.L.F.C. Lima, M.I.G.S. Almeida, A.O.S.S. Rangel, Anal.
Chim. Acta 537 (2005) 207.
[[[[
77 (2009) 1466–1472
24] L.A. Oliferova, M.A. Statkus, G.I. Tsisin, J. Wang, Y.A. Zolotov, J. Anal. Chem. 61(2006) 416.
25] H.M. Oliveira, M.A. Segundo, S. Reis, J.L.F.C. Lima, Microchim. Acta 150 (2005)187.
26] G. de Armas, M. Miró, J.M. Estela, V. Cerdà, Anal. Chim. Acta 467 (2002)13.
27] J.N. Miller, J.C. Miller, Statistics Chemometrics for Analytical Chemistry, 5th ed.,Pearson Education Ltd., Harlow, 2000.
28] Z. Fang, Flow Injection Separation and Preconcentration, VCH, Weinheim, 1993.29] M.A. Crespin, S. Cardenas, M. Gallego, M. Valcarcel, Rapid Commun. Mass Spec-
trom. 12 (1998) 198.30] E. Pocurull, G. Sanchez, F. Borrull, R.M. Marce, J. Chromatogr. A 696 (1995)
31.31] J.L. Bernal, M.J. Nozal, L. Toribio, M.L. Serna, F. Borrull, R.M. Marce, E. Pocurull,
32] D. Puig, D. Barceló, J. Chromatogr. A 733 (1996) 371.33] N. Masque, E. Pocurull, R.M. Marce, F. Borrull, Chromatographia 47 (1998) 176.34] N. Masque, M. Galia, R.M. Marce, F. Borrull, Analyst 122 (1997) 425.35] R.M. Alberici, R. Sparrapan, W.F. Jardim, M.N. Eberlin, Environ. Sci. Technol. 35
(2001) 2084.
Copyright © 2022 FDOKUMEN