Multiple Independent Genetic Variants in the 8q24 Region Are Associated with Prostate Cancer Risk
12
2008;17:1203-1213. Published online May 15, 2008. Cancer Epidemiol Biomarkers Prev Claudia A. Salinas, Erika Kwon, Christopher S. Carlson, et al. Are Associated with Prostate Cancer Risk Multiple Independent Genetic Variants in the 8q24 Region Updated Version 10.1158/1055-9965.EPI-07-2811 doi: Access the most recent version of this article at: Cited Articles http://cebp.aacrjournals.org/content/17/5/1203.full.html#ref-list-1 This article cites 33 articles, 14 of which you can access for free at: Citing Articles http://cebp.aacrjournals.org/content/17/5/1203.full.html#related-urls This article has been cited by 10 HighWire-hosted articles. Access the articles at: E-mail alerts related to this article or journal. Sign up to receive free email-alerts Subscriptions Reprints and . [email protected] Publications Department at To order reprints of this article or to subscribe to the journal, contact the AACR Permissions . [email protected] Department at To request permission to re-use all or part of this article, contact the AACR Publications American Association for Cancer Research Copyright © 2008 on May 14, 2011 cebp.aacrjournals.org Downloaded from DOI:10.1158/1055-9965.EPI-07-2811
-
Upload
independent -
Category
Documents
-
view
1 -
download
0
Transcript of Multiple Independent Genetic Variants in the 8q24 Region Are Associated with Prostate Cancer Risk

2008;17:1203-1213. Published online May 15, 2008.Cancer Epidemiol Biomarkers Prev Claudia A. Salinas, Erika Kwon, Christopher S. Carlson, et al. Are Associated with Prostate Cancer RiskMultiple Independent Genetic Variants in the 8q24 Region
Updated Version 10.1158/1055-9965.EPI-07-2811doi:
Access the most recent version of this article at:
Cited Articles http://cebp.aacrjournals.org/content/17/5/1203.full.html#ref-list-1
This article cites 33 articles, 14 of which you can access for free at:
Citing Articles http://cebp.aacrjournals.org/content/17/5/1203.full.html#related-urls
This article has been cited by 10 HighWire-hosted articles. Access the articles at:
E-mail alerts related to this article or journal.Sign up to receive free email-alerts
SubscriptionsReprints and
[email protected] Department atTo order reprints of this article or to subscribe to the journal, contact the AACR
To request permission to re-use all or part of this article, contact the AACR Publications
American Association for Cancer Research Copyright © 2008 on May 14, 2011cebp.aacrjournals.orgDownloaded from
DOI:10.1158/1055-9965.EPI-07-2811

Multiple Independent Genetic Variants in the 8q24 RegionAre Associated with Prostate Cancer Risk
Claudia A. Salinas,1,2 Erika Kwon,4 Christopher S. Carlson,1 Joseph S. Koopmeiners,1,3
Ziding Feng,1 Danielle M. Karyadi,4 Elaine A. Ostrander,4 and Janet L. Stanford1,2
1Division of Public Health Sciences, Fred Hutchinson Cancer Research Center; Departments of 2Epidemiology and 3Biostatistics,School of Public Health and Community Medicine, University of Washington, Seattle, Washington and 4Cancer GeneticsBranch, National Human Genome Research Institute, NIH, Bethesda, Maryland
Abstract
Recently, the 8q24 region has been identified as aprostate cancer susceptibility locus in a genome-widescan of prostate cancer families in Iceland and anadmixture scan of African Americans. Further inves-tigations of variants at 8q24 have shown the existenceof additional single nucleotide polymorphisms (SNPs)that enhance prostate cancer risk, suggesting thepossibility of multiple regions harboring variants forthe disease. In the present population-based study ofCaucasians (1,308 cases and 1,266 controls) and AfricanAmericans (149 cases and 85 controls), we tested theassociation between prostate cancer and 23 SNPs in the8q24 region. Fourteen SNPs in Caucasians and 5 SNPsin African Americans were significantly associatedwith risk of prostate cancer after adjusting for multiple
comparisons; of these, 5 SNPs in Caucasians and 3 inAfrican Americans were independently associated withrisk. The strongest associationwas for rs6983561 (carriersof any C allele) with an odds ratio of 1.6 (95% confidenceinterval, 1.1-2.1) in Caucasians; variants in rs979200,rs1016343, rs7837328, and rs10090154 were also indepen-dently associated with risk. In African Americans, thestrongest association was for rs7000448 (carriers of any Tallele) with an odds ratio of 3.4 (95% confidence interval,1.3-8.7). In addition, two SNPs that extend the bound-aries of the 8q24 regionwere significantly associatedwithrisk: rs979200 at the centromeric boundary and rs3891248,located in the first intron of the c-MYC gene (IVS1-355),which identifies a new telomeric boundary. (CancerEpidemiol Biomarkers Prev 2008;17(5):1203–13)
Introduction
Prostate cancer is a common disease with an underlyinggenetic component (1-3). Genetic linkage studies haveidentified numerous putative loci that could harborprostate cancer susceptibility genes (4, 5) and variantalleles in several candidate genes have been reported tobe associated with prostate cancer risk (6), but resultshave proven difficult to replicate (7). Recently, agenome-wide linkage scan of prostate cancer familiesin Iceland identified the 8q24 region as a prostate cancersusceptibility locus (8). Multiple alleles in the region,especially the -8 allele of microsatellite marker DG8S737and the A allele of the single nucleotide polymorphism(SNP) rs1447295, were associated with increased pros-tate cancer risk in three Caucasian case-control studypopulations from Iceland, Sweden, and Chicago [overallodds ratio (OR), 1.62, P = 2.7 � 10-11 for DG8S7373 -8 allele; OR, 1.51, P = 1.7 � 10-11 for rs1447295 A allele].The DG8S737 marker was also associated with anincreased relative risk in a sample of African Americansfrom Michigan (OR, 1.60, P = 2.2 � 10-3). Subsequently,
an admixture scan of African Americans confirmedthe importance of the 8q24 region in modulatingprostate cancer risk (9). The latter study also replicatedresults for the rs1447295 A allele, but suggested thatthe association of DG8S737 with risk of prostatecancer might simply reflect the overall difference inallele frequencies between African Americans andCaucasians (10).
The identification of the 8q24 region is notable forsuccessful replication of several markers in studies usingdistinct populations (11-19). Of note, the original linkageresult arose from the exploration of a suggestive linkagesignal (maximum lod score of 2.11 at D8S529; ref. 8). Thetwo original markers, DG8S737 and rs1447295, have beenstudied most widely (20), but several other SNPs in the8q24 region have also recently been associated withprostate cancer risk. Fine mapping of the 8q24 regionwith SNPs from genome-wide association studies (12)and follow-up of the admixture study by Haiman et al.(13) have suggested that there are multiple regionswithin 8q24 that harbor variants altering prostate cancerrisk (21). In the present population-based case-controlstudy of Caucasian and African American men, we testthe association between prostate cancer and multipleSNPs in three previously described regions of 8q24 andseveral new SNPs that extend the boundaries of theregion. We also evaluate whether the association of SNPsin the 8q24 region varies among men with comparativelyless or more aggressive disease or by age at diagnosis,first-degree family history of prostate cancer, or bodymass index (BMI).
Cancer Epidemiol Biomarkers Prev 2008;17(5). May 2008
Received 11/16/07; revised 1/31/08; accepted 3/5/08.
Grant support: National Cancer Institute, NIH grants CA56678, CA92579, andCA97186 and contract NO1-PC-35142 and Department of Defense training grantPC061445 (C.A. Salinas); Fred Hutchinson Cancer Research Center and IntramuralProgram of the National Human Genome Research Institute.
Requests for reprints: Janet L. Stanford, Division of Public Health Sciences, FredHutchinson Cancer Research Center, M4-B874, P.O. Box 19024, Seattle, WA98109-1024. Phone: 206-667-2715; Fax: 206-667-4787. E-mail: [email protected]
Copyright D 2008 American Association for Cancer Research.
doi:10.1158/1055-9965.EPI-07-2811
1203
American Association for Cancer Research Copyright © 2008 on May 14, 2011cebp.aacrjournals.orgDownloaded from
DOI:10.1158/1055-9965.EPI-07-2811
Materials and Methods
Study Population. The study population consists ofparticipants from two population-based case-controlstudies in Caucasian and African American residents ofKing County, Washington (studies I and II), which havebeen described previously (20, 22). Incident cases withhistologically confirmed prostate cancer (InternationalClassification of Diseases for Oncology code C61.9) wereascertained from the Seattle-Puget Sound Surveillance,Epidemiology, and End Results cancer registry. In studyI, cases were diagnosed between January 1, 1993 andDecember 31, 1996 and were ages 40 to 64 years atdiagnosis. In study II, cases were diagnosed betweenJanuary 1, 2002 and December 31, 2005 and were ages 35to 74 years at diagnosis. Overall, 2,244 eligible prostatecancer patients were identified and 1,754 (78.2%) wereinterviewed. The main reasons for nonresponse werepatient refusal (13.9%), physician refusal to allow patientcontact (2.1%), patients were too ill to participate (0.9%),or died before interview (1.4%). Blood samples yieldingsufficient DNA for genotyping were drawn from 1,457(83%) cases who completed the study interview.
A comparison group of controls without a self-reported history of prostate cancer, residing in KingCounty, Washington, was identified using random-digittelephone dialing (23). Controls were frequency matchedto cases by 5-year age groups and recruited evenlythroughout each ascertainment period for cases. Duringthe first step of random-digit dialing, complete house-hold census information was obtained for 94% and 81%of the residential telephone numbers contacted forstudies I and II, respectively. A total of 2,448 men wereidentified who met the eligibility criteria and 1,754(71.7%) completed a study interview. The main reasonsfor nonparticipation included refusal (29.1%) or too ill to
participate (1.4%). Blood samples were drawn and DNAwas prepared from 1,358 (77.4%) interviewed controlsusing standard protocols (24).
Subjects in both studies completed in-person inter-views conducted by trained male interviewers usingstandardized questionnaires. The questions pertained tothe period up to the date of prostate cancer diagnosisfor cases and a similar, randomly preassigned referencedate for controls, which approximated the distribution ofcases’ diagnosis dates. Information was collected onfamily structure and cancer history, medical history, andsocial and demographic factors. All study procedureswere approved by the Fred Hutchinson Cancer ResearchCenter Institutional Review Board and written informedconsent was obtained from all study participants beforeparticipation. Clinical information on cases, includingGleason score, tumor stage, and serum prostate-specificantigen (PSA) level at diagnosis, was obtained from thecancer registry.
Genotyping and SNP Selection. Twenty-six SNPswere selected for genotyping in previously definedregions 1, 2, and 3 and the c-MYC gene. The majorityof SNPs were selected based on published reports on8q24 variants associated with cancer or were highlycorrelated (r2 > 0.8) with SNPs that have been reportedpreviously (http://cgems.cancer.gov/), aiming to mini-mize linkage disequilibrium (LD) between SNPs andfocus on those with a minor allele frequency of at least5%. SNPs in c-MYC were selected using the SeattleSNPsgenome variation server (http://gvs.gs.washington.edu/GVS/index.jsp). The Applied Biosystems SNPlexGenotyping System was used to genotype SNPs inindividual DNA samples and proprietary GeneMappersoftware was used for allele assignment (http://www.appliedbiosystems.com). Discrimination of the specific
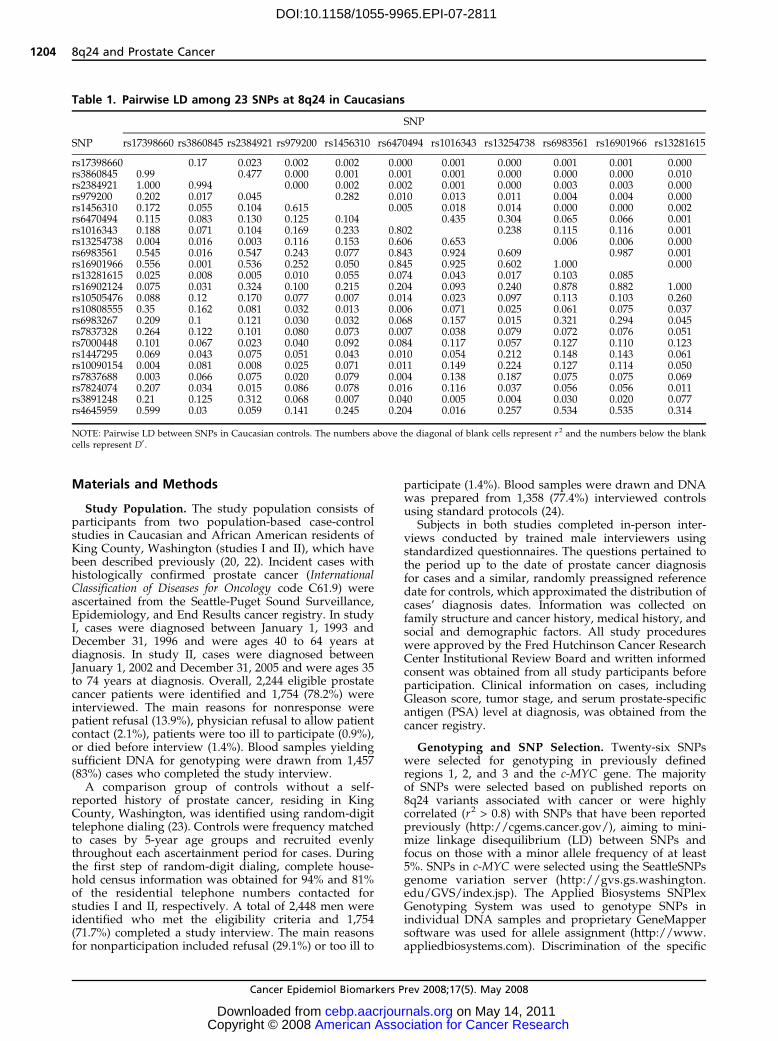
Table 1. Pairwise LD among 23 SNPs at 8q24 in Caucasians
SNP
SNP rs17398660 rs3860845 rs2384921 rs979200 rs1456310 rs6470494 rs1016343 rs13254738 rs6983561 rs16901966 rs13281615
rs17398660 0.17 0.023 0.002 0.002 0.000 0.001 0.000 0.001 0.001 0.000rs3860845 0.99 0.477 0.000 0.001 0.001 0.001 0.000 0.000 0.000 0.010rs2384921 1.000 0.994 0.000 0.002 0.002 0.001 0.000 0.003 0.003 0.000rs979200 0.202 0.017 0.045 0.282 0.010 0.013 0.011 0.004 0.004 0.000rs1456310 0.172 0.055 0.104 0.615 0.005 0.018 0.014 0.000 0.000 0.002rs6470494 0.115 0.083 0.130 0.125 0.104 0.435 0.304 0.065 0.066 0.001rs1016343 0.188 0.071 0.104 0.169 0.233 0.802 0.238 0.115 0.116 0.001rs13254738 0.004 0.016 0.003 0.116 0.153 0.606 0.653 0.006 0.006 0.000rs6983561 0.545 0.016 0.547 0.243 0.077 0.843 0.924 0.609 0.987 0.001rs16901966 0.556 0.001 0.536 0.252 0.050 0.845 0.925 0.602 1.000 0.000rs13281615 0.025 0.008 0.005 0.010 0.055 0.074 0.043 0.017 0.103 0.085rs16902124 0.075 0.031 0.324 0.100 0.215 0.204 0.093 0.240 0.878 0.882 1.000rs10505476 0.088 0.12 0.170 0.077 0.007 0.014 0.023 0.097 0.113 0.103 0.260rs10808555 0.35 0.162 0.081 0.032 0.013 0.006 0.071 0.025 0.061 0.075 0.037rs6983267 0.209 0.1 0.121 0.030 0.032 0.068 0.157 0.015 0.321 0.294 0.045rs7837328 0.264 0.122 0.101 0.080 0.073 0.007 0.038 0.079 0.072 0.076 0.051rs7000448 0.101 0.067 0.023 0.040 0.092 0.084 0.117 0.057 0.127 0.110 0.123rs1447295 0.069 0.043 0.075 0.051 0.043 0.010 0.054 0.212 0.148 0.143 0.061rs10090154 0.004 0.081 0.008 0.025 0.071 0.011 0.149 0.224 0.127 0.114 0.050rs7837688 0.003 0.066 0.075 0.020 0.079 0.004 0.138 0.187 0.075 0.075 0.069rs7824074 0.207 0.034 0.015 0.086 0.078 0.016 0.116 0.037 0.056 0.056 0.011rs3891248 0.21 0.125 0.312 0.068 0.007 0.040 0.005 0.004 0.030 0.020 0.077rs4645959 0.599 0.03 0.059 0.141 0.245 0.204 0.016 0.257 0.534 0.535 0.314
NOTE: Pairwise LD between SNPs in Caucasian controls. The numbers above the diagonal of blank cells represent r2 and the numbers below the blankcells represent D¶ .
8q24 and Prostate Cancer
Cancer Epidemiol Biomarkers Prev 2008;17(5). May 2008
1204
American Association for Cancer Research Copyright © 2008 on May 14, 2011cebp.aacrjournals.orgDownloaded from
DOI:10.1158/1055-9965.EPI-07-2811

SNP allele was carried out with the Applied Biosystems3730xl DNA Analyzer and is based on the presence of aunique sequence assigned to the original allele-specificoligonucleotide. Quality control included genotyping of140 blind duplicate samples distributed across allgenotyping batches. One SNP was monomorphic(rs1326634), one SNP was genotyped in only study IIsamples (rs2384921; agreement was 99% based on 82blind duplicates), and two SNPs failed on the genotypingplatform (rs2290840 and rs7818201). For the remaining22 SNPs, there was 100% agreement between blindedsamples. Each batch of DNA aliquots genotyped incor-porated similar numbers of case and control samples,and laboratory personnel were blinded to the case-control status of samples.
Statistical Analyses. Departure from Hardy-Weinbergequilibrium was assessed for each SNP separately, byrace, in controls using the m2 test. Pairwise LD wasestimated between SNPs, also by race, based on D¶ and r2
statistics calculated in controls (Table 1), using Haplo-view software version 4.0 (ref. 25; available from theBroad Institute at http://www.broad.mit.edu/mpg/haploview/). Individual region boundaries within 8q24are those defined by Haiman et al. (13) as follows: region1 from 128.54 to 128.62 Mb, region 2 from 128.14 to 128.28Mb, and region 3 from 128.47 to 129.54 Mb.
Unconditional logistic regression models were used toestimate ORs and 95% confidence intervals (95% CI) tomeasure the association between individual SNP geno-types and prostate cancer risk (26), as implemented inSAS version 9.1.3. Polytomous regression models wereused to generate ORs and 95% CIs for the associationbetween SNP genotypes and cases stratified by diseaseaggressiveness (less versus more based on a compositevariable including Gleason score, stage, and PSA)compared with controls. More aggressive cases werethose with a Gleason score of z7 (4 + 3) or regional or
distant stage or a PSA level z20 ng/mL at diagnosis.Both codominant (additive) and dominant geneticmodels were considered for each variant allele depend-ing on the distribution of genotypes. Likelihood ratio–based test statistics were used to identify statisticallysignificant associations between individual SNP geno-types and prostate cancer risk, by comparing the fullmodel containing the SNP genotypes with the reducedmodel without the SNP, with a two-sided P value of0.05, unadjusted for multiple comparisons, consideredsignificant.
A permutation procedure was used to account for theeffect of multiple testing. Pairs of case-control labels andages were permuted to approximate the distribution ofthe age-adjusted P values under the null hypothesis.Ages and case-control labels were permuted together topreserve any relationship that may exist between age andcase-control status and allow age-adjusted P values to becalculated for each permutation that are consistent withthe original analysis. For each permutation, codominantand dominant models were fit for all SNPs and theminimum of the P values kept for each SNP. TheP values were ordered to approximate the null distribu-tion of the order statistics for the P values, that is,minimum P value, second smallest P value, etc. Theoriginal P values were also ordered and permutationP values were calculated by comparing the orderedP values to the null distribution for the appropriate orderstatistic. Permutation P values can be interpreted as theprobability of observing a P value less than or equal towhat was observed for the given order statistic underthe null hypothesis of no association with disease for anyof 23 SNPs. For example, the minimum P value wascompared with the null distribution for the minimumP value and the corresponding permuted P value canbe interpreted as the probability of the minimum P valuebeing less than or equal to the observed minimum
Table 1. Pairwise LD among 23 SNPs at 8q24 in Caucasians (Cont’d)
SNP
rs16902124 rs10505476 rs10808555 rs6983267 rs7837328 rs7000448 rs1447295 rs10090154 rs7837688 rs7824074 rs3891248 rs4645959
0.000 0.000 0.006 0.004 0.004 0.001 0.000 0.000 0.000 0.002 0.001 0.0010.000 0.003 0.007 0.005 0.005 0.001 0.000 0.001 0.001 0.000 0.002 0.0000.001 0.002 0.001 0.004 0.002 0.000 0.000 0.000 0.000 0.000 0.005 0.0000.001 0.001 0.000 0.001 0.002 0.002 0.001 0.000 0.000 0.002 0.002 0.0000.003 0.010 0.000 0.001 0.003 0.006 0.000 0.000 0.001 0.002 0.000 0.0020.005 0.000 0.010 0.002 0.010 0.005 0.000 0.000 0.000 0.000 0.001 0.0010.002 0.000 0.003 0.006 0.001 0.006 0.000 0.001 0.001 0.001 0.000 0.0000.006 0.001 0.000 0.000 0.002 0.003 0.002 0.003 0.002 0.000 0.000 0.0010.001 0.001 0.000 0.004 0.000 0.001 0.006 0.005 0.002 0.000 0.000 0.0000.001 0.001 0.000 0.003 0.000 0.001 0.006 0.004 0.002 0.000 0.000 0.0000.062 0.016 0.000 0.001 0.001 0.006 0.001 0.000 0.001 0.000 0.002 0.002
0.074 0.311 0.478 0.520 0.000 0.000 0.000 0.000 0.001 0.006 0.0000.384 0.074 0.311 0.478 0.198 0.000 0.000 0.000 0.000 0.001 0.0000.426 0.329 0.339 0.502 0.010 0.000 0.000 0.000 0.003 0.001 0.0010.143 0.978 0.841 0.649 0.151 0.000 0.000 0.000 0.000 0.001 0.0000.534 0.981 0.829 0.995 0.038 0.000 0.000 0.001 0.002 0.006 0.0000.417 0.583 0.109 0.517 0.210 0.006 0.005 0.005 0.002 0.000 0.0020.100 0.050 0.011 0.010 0.043 0.313 0.907 0.815 0.009 0.010 0.0020.080 0.049 0.008 0.018 0.022 0.265 0.967 0.895 0.007 0.010 0.0020.151 0.017 0.008 0.008 0.058 0.279 0.913 0.946 0.006 0.000 0.0020.082 0.010 0.057 0.015 0.064 0.099 0.173 0.150 0.144 0.001 0.0080.155 0.151 0.115 0.088 0.210 0.027 0.007 0.008 0.007 0.117 0.0060.198 0.110 0.132 0.107 0.005 0.173 0.768 0.679 0.771 0.792 1.000
Cancer Epidemiology, Biomarkers & Prevention
Cancer Epidemiol Biomarkers Prev 2008;17(5). May 2008
1205
American Association for Cancer Research Copyright © 2008 on May 14, 2011cebp.aacrjournals.orgDownloaded from
DOI:10.1158/1055-9965.EPI-07-2811

P value under the null hypothesis. The same is true forthe second smallest P value, the third smallest P value,etc. The permutation approach to approximating the nulldistribution of the order statistics will be valid regardlessof any correlation between the SNPs. A SNP wasconsidered to be significantly associated with prostatecancer risk if the nominal P value and the permutedP value were both <0.05. In Results, we reportunadjusted P values.
After consideration of SNP genotypes individually,all SNPs remaining significant after adjustment bypermutation were included in a stepwise selection modelusing Akaike’s Information Criterion to select the mostparsimonious model (27). SNPs that were significant(nominal P < 0.05) after adjustment for each other wereincluded in the final model (28). Variant alleles weretested under a dominant genetic model and both forwardand backward selection models were compared, withequivalent results. A similar approach was used to testfor SNP-SNP interactions, where all possible pairwiseinteractions of independently significant SNPs from thefirst stepwise procedure were included in a secondstepwise selection. Haplotype frequencies and measuresof association were estimated separately for AfricanAmericans and Caucasians using Hplus version 2.5(ref. 29; available from http://qge.fhcrc.org/hplus/).All models were adjusted for age at reference date.
Other potential confounding factors, including first-degree family history of prostate cancer, prostate cancerscreening history (digital rectal examination and PSA),and BMI (<25, 25-29.9, z30), were examined to see if suchfactors changed the risk estimates by z10%. To testwhether such factors modified estimates of risk associ-ated with SNP genotypes, ORs and 95% CIs werecalculated for stratified models. If risk estimates differedacross levels of these secondary factors, the interactionwas then tested formally by including an interaction termin the model with the SNP genotype. The reduced model,with main effects only, was compared with the fullmodel containing the interaction term using a likelihoodstatistic-based test.
Results
The study population was predominantly Caucasian(Table 2). In comparison with controls, a higherproportion of cases were African American, had a first-degree family history of prostate cancer, and reportedhaving a PSA screening test within the 5-year periodbefore reference date. No significant differences weredetected between cases and controls for education orBMI. The majority of cases had diagnostic PSA values of4 to 9.9 ng/mL, localized stage disease, and Gleasonscores of 5 or 6.
All 23 SNPs analyzed were in Hardy-Weinbergequilibrium in Caucasian controls. However, amongAfrican American controls, the distribution of genotypesfor rs2384921 and rs6983561 was significantly differentfrom that expected (P = 0.0002 and 0.02, respectively).For both SNPs, this may be related to the small numberof samples from African Americans or due to chance. Inaddition, genotyping data were only available for menfrom one of the two studies for SNP rs2384921.Genotyping error is another reason for Hardy-Weinberg
equilibrium violation but seems unlikely given the highlevel of agreement observed in blind duplicate samples.
Among the individual SNPs, 14 were significantlyassociated with risk of prostate cancer in Caucasiansbased on a codominant model, with nominal P values <0.05 (Table 3). In African Americans, 5 SNPs weresignificantly associated with prostate cancer risk withnominal P values < 0.05. After adjusting for multiplecomparisons, all nominally significant SNPs in Cauca-sians and African Americans remained significant atpermuted P values < 0.05. Proceeding along thechromosome from the most centromeric to the mosttelomeric 8q24 region, 5 SNPs in region 2 (13) weresignificantly associated with prostate cancer risk inCaucasians. The most statistically significant finding inthis region was for rs1016343 (Table 3), with an OR of 1.9(95% CI, 1.3-2.7) for men with the rare homozygotegenotype (P < 0.00005). Two other SNPs in region 2
Table 2. Characteristics of prostate cancer cases andcontrols
Characteristic Cases,n (%)
Controls,n (%)
Age40-49 118 (8.1) 126 (9.3)50-54 214 (14.7) 209 (15.5)55-59 357 (24.5) 358 (26.5)60-64 433 (29.7) 348 (25.7)65-69 177 (12.1) 164 (12.1)70-74 158 (10.7) 146 (10.8)
RaceCaucasian 1,308 (89.8) 1,266 (93.7)African American 149 (10.2) 85 (6.3)
First-degree family history of prostate cancerNo 1,144 (79.5) 1,200 (88.8)Yes 313 (21.5) 151 (11.2)
EducationHigh school or less 287 (19.7) 261 (19.3)Some college or vocational technology 373 (25.6) 323 (23.9)B.S./B.A. degree 390 (26.8) 375 (27.8)Graduate school 407 (27.9) 392 (29.0)
BMINormal (<25) 467 (32.1) 410 (30.3)Overweight (25-29.9) 706 (48.5) 651 (48.2)Obese (>30) 284 (19.5) 290 (21.5)
Prostate cancer screening history*None 157 (10.8) 183 (13.6)Digital rectal examination only 257 (17.6) 518 (38.3)PSA 1,043 (71.6) 650 (48.1)
PSA value at diagnosis (ng/mL)0-3.9 189 (13.0) —4.0-9.9 813 (55.8) —10.0-19.9 209 (14.3) —z20.0 138 (9.5) —Missing 108 (7.4) —
Gleason score2-4 71 (4.9) —5-6 742 (51.1) —7 = 3 + 4 408 (28.1) —7 = 4 + 3 90 (6.2) —8-10 140 (9.7) —
Stage of diseaseLocal 1,132 (77.7) —Regional 278 (19.1) —Distant 37 (2.5) —Missing 10 (0.7) —
*Screening history within the 5 years before diagnosis (cases) or reference(controls) date.
8q24 and Prostate Cancer
Cancer Epidemiol Biomarkers Prev 2008;17(5). May 2008
1206
American Association for Cancer Research Copyright © 2008 on May 14, 2011cebp.aacrjournals.orgDownloaded from
DOI:10.1158/1055-9965.EPI-07-2811

Table 3. Prostate cancer risk associated with individual SNPs in the 8q24 region, by race
Caucasians
SNP Cases,* n = 1,308 (%) Controls,* n = 1,266 (%) ORc(95% CI) P
b
rs17398660, chr8:126113619GG 1,038 (82.8) 1,036 (84.0) 1.00 (Reference)AG 205 (16.4) 185 (15.0) 1.11 (0.89-1.38)AA 10 (0.8) 12 (9.7) 0.83 (0.36-1.93) 0.58
rs3860845, chr8:126152376TT 529 (42.0) 530 (42.8) 1.00 (Reference)CT 579 (46.0) 556 (44.9) 1.04 (0.88-1.24)CC 152 (12.1) 153 (12.4) 1.00 (0.77-1.28) 0.88
rs2384921,x chr8:126156760CC 458 (64.2) 452 (63.9) 1.00 (Reference)CT 227 (32.1) 227 (32.1) 1.00 (0.8-1.26)TT 28 (4.0) 28 (4.0) 0.88 (0.51-1.54) 0.90
P trend = 0.80rs979200, chr8:127992902GG 576 (45.6) 493 (39.7) 1.00 (Reference)AG 534 (42.3) 599 (48.3) 0.76 (0.64-0.90)AA 153 (12.1) 149 (12.0) 0.88 (0.68-1.14) 0.0062
rs1456310, chr8:128121615CC 464 (37.0) 401 (32.5) 1.00 (Reference)CT 598 (47.7) 605 (49.1) 0.85 (0.72-1.02)TT 192 (15.3) 227 (18.4) 0.73 (0.58-0.92) 0.024
P trend = 0.006rs6470494, chr8:128157086 (Region 2)CC 605 (47.9) 659 (53.2) 1.00 (Reference)CT 515 (40.8) 494 (39.9) 1.14 (0.96-1.34)TT 143 (11.3) 85 (6.9) 1.83 (1.37-2.45) 0.0002
P trend = 0.0002rs1016343, chr8:128162479 (Region 2)CC 711 (56.7) 796 (64.6) 1.00 (Reference)CT 454 (36.2) 385 (31.2) 1.32 (1.12-1.57)TT 88 (7.0) 52 (4.2) 1.91 (1.33-2.73) <0.00005
P trend < 0.00005rs13254738, chr8:128173525 (Region 2)AA 571 (45.5) 581 (47.1) 1.00 (Reference)AC 535 (42.6) 543 (44.0) 1.00 (0.85-1.18)CC 150 (11.9) 110 (8.9) 1.37 (1.05-1.82) 0.046
P trend = 0.08rs6983561, chr8:128176062 (Region 2)AA 1,124 (88.9) 1,156 (93.5) 1.00 (Reference)AC 135 (10.7) 78 (6.3) 1.78 (1.33-2.39)CC 5 (0.4) 2 (0.2) 2.50 (0.48-12.93) 0.0002
P trend < 0.00005rs16901966, chr8: 128179434 (Region 2)AA 1,161 (89.2) 1,179 (93.6) 1.00 (Reference)AG 136 (10.4) 79 (6.3) 1.75 (1.31-2.34)GG 5 (0.4) 2 (0.2) 2.47 (0.48-12.75) 0.0003
P trend = 0.0001rs13281615, chr8:128424800AA 426 (34.0) 436 (35.3) 1.00 (Reference)AG 633 (50.5) 568 (46.0) 1.14 (0.96-1.36)GG 195 (15.6) 230 (18.6) 0.87 (0.69-1.09) 0.038
rs16902124, chr8:128426400GG 1,132 (90.2) 1,132 (91.8) 1.00 (Reference)AG 120 (9.6) 97 (7.9) 1.24 (0.94-1.65)AA 3 (0.2) 4 (0.3) 0.73 (0.16-3.29) 0.28
rs10505476, chr8:128477298 (Region 3)GG 662 (52.7) 705 (57.2) 1.00 (Reference)AG 513 (40.8) 438 (35.5) 1.25 (1.06-1.48)AA 81 (6.5) 90 (7.3) 0.96 (0.70-1.32) 0.022
rs10808555, chr8:128478693 (Region 3)AA 531 (42.3) 559 (45.4) 1.00 (Reference)AG 569 (45.4) 540 (43.9) 1.11 (0.94-1.31)GG 154 (12.3) 132 (10.7) 1.23 (0.95-1.60) 0.22
P trend = 0.08rs6983267, chr8:128482487 (Region 3)GG 364 (28.9) 313 (25.3) 1.00 (Reference)
(Continued on the following page)
Cancer Epidemiology, Biomarkers & Prevention
Cancer Epidemiol Biomarkers Prev 2008;17(5). May 2008
1207
American Association for Cancer Research Copyright © 2008 on May 14, 2011cebp.aacrjournals.orgDownloaded from
DOI:10.1158/1055-9965.EPI-07-2811

Table 3. Prostate cancer risk associated with individual SNPs in the 8q24 region, by race (Cont’d)
Caucasians
SNP Cases,* n = 1,308 (%) Controls,* n = 1,266 (%) ORc(95% CI) P
b
GT 652 (51.8) 617 (49.8) 0.91 (0.75-1.10)TT 242 (19.2) 308 (24.9) 0.67 (0.54-0.85) 0.0017
P trend = 0.0008rs7837328, chr8:128492309 (Region 3)GG 387 (30.8) 451 (36.4) 1.00 (Reference)AG 639 (50.8) 590 (47.6) 1.26 (1.06-1.50)AA 232 (18.4) 198 (16.0) 1.37 (1.08-1.73) 0.0088
P trend = 0.003rs7000448, chr8:128510352 (Region 3)CC 494 (39.1) 505 (40.8) 1.00 (Reference)CT 614 (48.7) 568 (45.8) 1.11 (0.94-1.31)TT 154 (12.2) 166 (13.4) 0.95 (0.74-1.22) 0.33
rs1447295, chr8:128554220 (Region 1)CC 937 (74.8) 994 (80.6) 1.00 (Reference)AC 288 (23.0) 225 (18.3) 1.36 (1.12-1.65)AA 27 (2.2) 14 (1.1) 2.08 (1.07-3.95) 0.0012
P trend = 0.0002rs10090154, chr8:128601319 (Region 1)CC 968 (75.2) 1,007 (80.6) 1.00 (Reference)CT 294 (22.8) 230 (18.4) 1.33 (1.09-1.61)TT 26 (2.0) 13 (1.0) 2.09 (1.07-4.10) 0.0019
P trend = 0.0005rs7837688, chr8:128608542 (Region 1)GG 945 (75.0) 1,005 (81.0) 1.00 (Reference)GT 287 (22.8) 222 (17.9) 1.37 (1.13-1.67)TT 28 (2.2) 14 (1.1) 2.14 (1.12-4.10) 0.0006
P trend = 0.0001rs7824074, chr8:128658004GG 620 (49.1) 646 (52.1) 1.00 (Reference)GT 544 (43.1) 496 (40.0) 1.14 (0.97-1.35)TT 99 (7.8) 99 (8.0) 1.04 (0.77-1.40) 0.28
rs3891248, chr8:128819321 (MYC)TT 921 (74.3) 871 (70.6) 1.00 (Reference)AT 299 (24.1) 330 (26.8) 0.86 (0.72-1.03)AA 19 (1.5) 32 (2.6) 0.55 (0.31-0.98) 0.041
P trend = 0.02rs4645959, chr8:128819722 (MYC)AA 1,178 (93.4) 1,158 (93.5) 1.00 (Reference)AG 81 (6.4) 80 (6.5) 1.00 (0.73-1.38)GG 2 (0.2) 0 — 1.00
African Americans
SNP Cases,* n = 149 (%) Controls,* n = 85 (%) ORc(95% CI) P
b
rs17398660, chr8:126113619GG 138 (96.5) 74 (93.7) 1.00 (Reference)AG + AA 5 (3.5) 5 (6.3) 0.57 (0.15-2.23) 0.42
rs3860845, chr8:126152376TT 5 (3.4) 3 (3.8) 1.00 (Reference)CT + CC 140 (96.6) 76 (96.2) 1.75 (0.36-8.50) 0.49
rs2384921,x chr8:126156760CC 73 (70.2) 46 (75.4) 1.00 (Reference)CT + TT 31 (29.8) 15 (24.6) 1.50 (0.69-3.28) 0.3
rs979200, chr8:127992902GG 16 (11.1) 7 (8.9) 1.00 (Reference)AG + AA 128 (88.9) 72 (91.1) 0.94 (0.35-2.56) 0.91
rs1456310, chr8:128121615CC 21 (14.6) 19 (24.1) 1.00 (Reference)CT + TT 123 (85.4) 60 (75.9) 2.36 (1.11-5.02) 0.025
rs6470494, chr8:128157086 (Region 2)CC 90 (62.1) 44 (56.4) 1.00 (Reference)CT + TT 55 (37.9) 34 (43.6) 0.85 (0.47-1.54) 0.59
rs1016343, chr8:128162479 (Region 2)CC 90 (62.9) 45 (57.0) 1.00 (Reference)
(Continued on the following page)
8q24 and Prostate Cancer
Cancer Epidemiol Biomarkers Prev 2008;17(5). May 2008
1208
American Association for Cancer Research Copyright © 2008 on May 14, 2011cebp.aacrjournals.orgDownloaded from
DOI:10.1158/1055-9965.EPI-07-2811
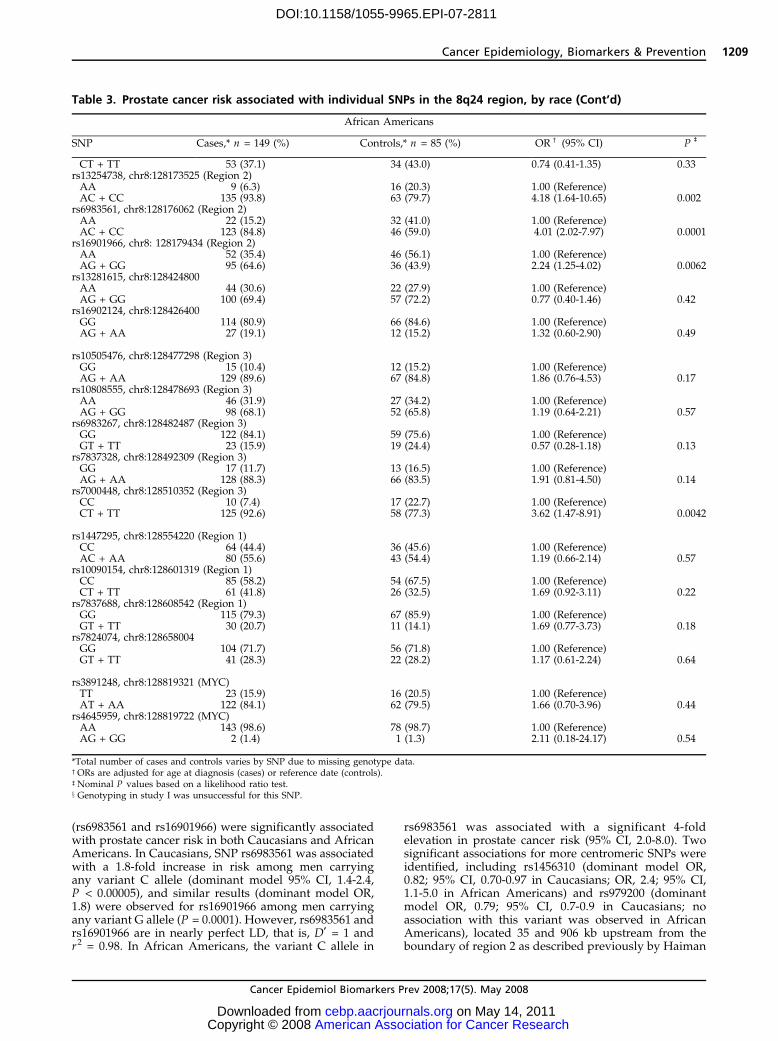
(rs6983561 and rs16901966) were significantly associatedwith prostate cancer risk in both Caucasians and AfricanAmericans. In Caucasians, SNP rs6983561 was associatedwith a 1.8-fold increase in risk among men carryingany variant C allele (dominant model 95% CI, 1.4-2.4,P < 0.00005), and similar results (dominant model OR,1.8) were observed for rs16901966 among men carryingany variant G allele (P = 0.0001). However, rs6983561 andrs16901966 are in nearly perfect LD, that is, D¶ = 1 andr2 = 0.98. In African Americans, the variant C allele in
rs6983561 was associated with a significant 4-foldelevation in prostate cancer risk (95% CI, 2.0-8.0). Twosignificant associations for more centromeric SNPs wereidentified, including rs1456310 (dominant model OR,0.82; 95% CI, 0.70-0.97 in Caucasians; OR, 2.4; 95% CI,1.1-5.0 in African Americans) and rs979200 (dominantmodel OR, 0.79; 95% CI, 0.7-0.9 in Caucasians; noassociation with this variant was observed in AfricanAmericans), located 35 and 906 kb upstream from theboundary of region 2 as described previously by Haiman
Table 3. Prostate cancer risk associated with individual SNPs in the 8q24 region, by race (Cont’d)
African Americans
SNP Cases,* n = 149 (%) Controls,* n = 85 (%) ORc (95% CI) Pb
CT + TT 53 (37.1) 34 (43.0) 0.74 (0.41-1.35) 0.33rs13254738, chr8:128173525 (Region 2)AA 9 (6.3) 16 (20.3) 1.00 (Reference)AC + CC 135 (93.8) 63 (79.7) 4.18 (1.64-10.65) 0.002
rs6983561, chr8:128176062 (Region 2)AA 22 (15.2) 32 (41.0) 1.00 (Reference)AC + CC 123 (84.8) 46 (59.0) 4.01 (2.02-7.97) 0.0001
rs16901966, chr8: 128179434 (Region 2)AA 52 (35.4) 46 (56.1) 1.00 (Reference)AG + GG 95 (64.6) 36 (43.9) 2.24 (1.25-4.02) 0.0062
rs13281615, chr8:128424800AA 44 (30.6) 22 (27.9) 1.00 (Reference)AG + GG 100 (69.4) 57 (72.2) 0.77 (0.40-1.46) 0.42
rs16902124, chr8:128426400GG 114 (80.9) 66 (84.6) 1.00 (Reference)AG + AA 27 (19.1) 12 (15.2) 1.32 (0.60-2.90) 0.49
rs10505476, chr8:128477298 (Region 3)GG 15 (10.4) 12 (15.2) 1.00 (Reference)AG + AA 129 (89.6) 67 (84.8) 1.86 (0.76-4.53) 0.17
rs10808555, chr8:128478693 (Region 3)AA 46 (31.9) 27 (34.2) 1.00 (Reference)AG + GG 98 (68.1) 52 (65.8) 1.19 (0.64-2.21) 0.57
rs6983267, chr8:128482487 (Region 3)GG 122 (84.1) 59 (75.6) 1.00 (Reference)GT + TT 23 (15.9) 19 (24.4) 0.57 (0.28-1.18) 0.13
rs7837328, chr8:128492309 (Region 3)GG 17 (11.7) 13 (16.5) 1.00 (Reference)AG + AA 128 (88.3) 66 (83.5) 1.91 (0.81-4.50) 0.14
rs7000448, chr8:128510352 (Region 3)CC 10 (7.4) 17 (22.7) 1.00 (Reference)CT + TT 125 (92.6) 58 (77.3) 3.62 (1.47-8.91) 0.0042
rs1447295, chr8:128554220 (Region 1)CC 64 (44.4) 36 (45.6) 1.00 (Reference)AC + AA 80 (55.6) 43 (54.4) 1.19 (0.66-2.14) 0.57
rs10090154, chr8:128601319 (Region 1)CC 85 (58.2) 54 (67.5) 1.00 (Reference)CT + TT 61 (41.8) 26 (32.5) 1.69 (0.92-3.11) 0.22
rs7837688, chr8:128608542 (Region 1)GG 115 (79.3) 67 (85.9) 1.00 (Reference)GT + TT 30 (20.7) 11 (14.1) 1.69 (0.77-3.73) 0.18
rs7824074, chr8:128658004GG 104 (71.7) 56 (71.8) 1.00 (Reference)GT + TT 41 (28.3) 22 (28.2) 1.17 (0.61-2.24) 0.64
rs3891248, chr8:128819321 (MYC)TT 23 (15.9) 16 (20.5) 1.00 (Reference)AT + AA 122 (84.1) 62 (79.5) 1.66 (0.70-3.96) 0.44
rs4645959, chr8:128819722 (MYC)AA 143 (98.6) 78 (98.7) 1.00 (Reference)AG + GG 2 (1.4) 1 (1.3) 2.11 (0.18-24.17) 0.54
*Total number of cases and controls varies by SNP due to missing genotype data.cORs are adjusted for age at diagnosis (cases) or reference date (controls).bNominal P values based on a likelihood ratio test.x Genotyping in study I was unsuccessful for this SNP.
Cancer Epidemiology, Biomarkers & Prevention
Cancer Epidemiol Biomarkers Prev 2008;17(5). May 2008
1209
American Association for Cancer Research Copyright © 2008 on May 14, 2011cebp.aacrjournals.orgDownloaded from
DOI:10.1158/1055-9965.EPI-07-2811
et al. (13). Interestingly, the rare T allele of rs1456310was associated with a lower risk of prostate cancer inCaucasians (OR, 0.7) but a higher risk of disease inAfrican Americans (OR, 2.4).
Continuing along 8q24 regions from the centromeretoward the telomere, in 8q24 region 3, three SNPs weresignificantly associated with risk in Caucasians. The mostsignificant SNP in this region, rs6983267 (P = 0.002),conferred a 30% decrease in risk of disease for carriers ofthe rare homozygote genotype (95% CI, 0.5-0.9). InAfrican Americans, rs7000448 was the only significantSNP in region 3 and was associated with a significantelevation in risk of prostate cancer (OR, 3.6; 95% CI,1.5-8.9 for men with the T allele).
Next, in 8q24 region 1, three SNPs were significantlyassociated with prostate cancer risk in Caucasians,including the polymorphism identified as the markermost strongly associated with prostate cancer in theinitial studies by Amundadottir et al. (8) and Freedmanet al. (9). This SNP, rs1447295, was associated with a2.1-fold increase in risk of prostate cancer in Caucasianmen homozygous for the rare A allele relative to menhomozygous for the more common C allele (95% CI,1.1-4.0). Two SNPs in strong LD with rs1447295,rs10090154 and rs7837688, produced similar positiveassociations in Caucasians. The rs1447295 SNP was notsignificantly associated with prostate cancer risk amongAfrican Americans.
Telomeric to region 1, we genotyped three SNPs,including two in c-MYC . SNP rs4645959 encodes amissense change in MYC protein (Asn26Ser) and was
not significantly associated with prostate cancer risk ineither Caucasians or African Americans. However,rs3891248, located in the first intron, was significantlyassociated with a reduced risk of prostate cancer inCaucasians (OR, 0.55; 95% CI, 0.31-0.98 in men with thevariant AA genotype relative to the common TT genotype;P = 0.04). No associationwith this latter SNPwas observedin African Americans. Interestingly, the allele distributionfor rs3891248 was substantially different in AfricanAmericans from that observed in Caucasians.
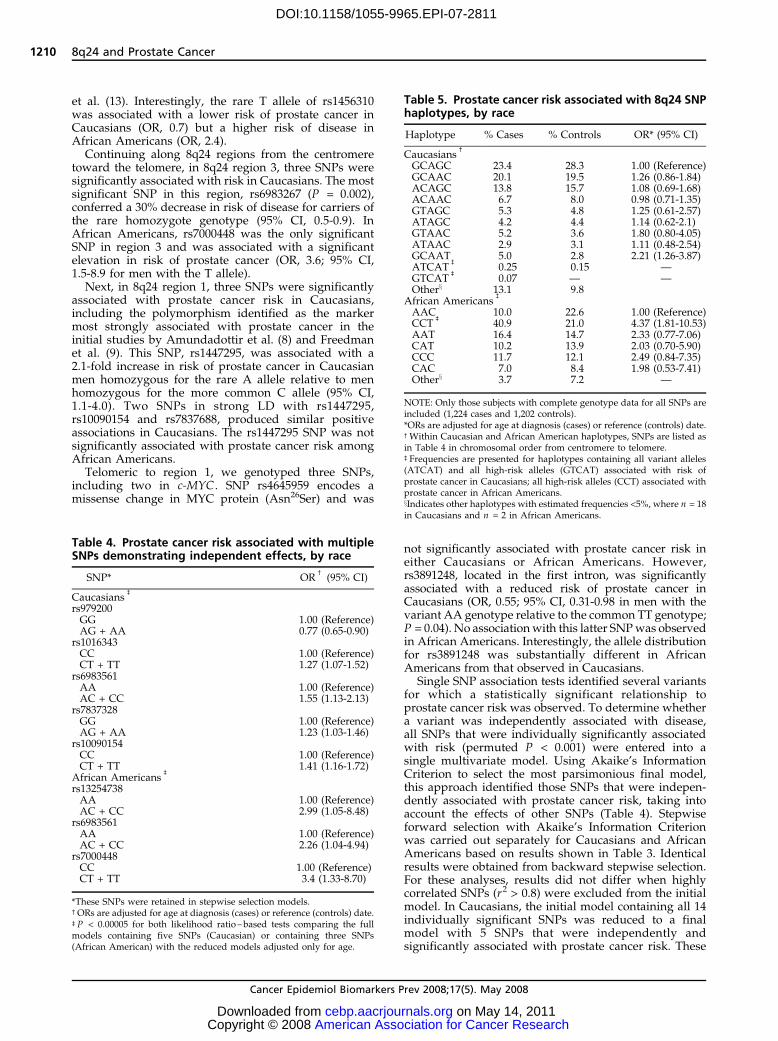
Single SNP association tests identified several variantsfor which a statistically significant relationship toprostate cancer risk was observed. To determine whethera variant was independently associated with disease,all SNPs that were individually significantly associatedwith risk (permuted P < 0.001) were entered into asingle multivariate model. Using Akaike’s InformationCriterion to select the most parsimonious final model,this approach identified those SNPs that were indepen-dently associated with prostate cancer risk, taking intoaccount the effects of other SNPs (Table 4). Stepwiseforward selection with Akaike’s Information Criterionwas carried out separately for Caucasians and AfricanAmericans based on results shown in Table 3. Identicalresults were obtained from backward stepwise selection.For these analyses, results did not differ when highlycorrelated SNPs (r2 > 0.8) were excluded from the initialmodel. In Caucasians, the initial model containing all 14individually significant SNPs was reduced to a finalmodel with 5 SNPs that were independently andsignificantly associated with prostate cancer risk. These
Table 4. Prostate cancer risk associated with multipleSNPs demonstrating independent effects, by race
SNP* ORc(95% CI)
Caucasiansb
rs979200GG 1.00 (Reference)AG + AA 0.77 (0.65-0.90)
rs1016343CC 1.00 (Reference)CT + TT 1.27 (1.07-1.52)
rs6983561AA 1.00 (Reference)AC + CC 1.55 (1.13-2.13)
rs7837328GG 1.00 (Reference)AG + AA 1.23 (1.03-1.46)
rs10090154CC 1.00 (Reference)CT + TT 1.41 (1.16-1.72)
African Americansb
rs13254738AA 1.00 (Reference)AC + CC 2.99 (1.05-8.48)
rs6983561AA 1.00 (Reference)AC + CC 2.26 (1.04-4.94)
rs7000448CC 1.00 (Reference)CT + TT 3.4 (1.33-8.70)
*These SNPs were retained in stepwise selection models.cORs are adjusted for age at diagnosis (cases) or reference (controls) date.bP < 0.00005 for both likelihood ratio –based tests comparing the fullmodels containing five SNPs (Caucasian) or containing three SNPs(African American) with the reduced models adjusted only for age.
Table 5. Prostate cancer risk associated with 8q24 SNPhaplotypes, by race
Haplotype % Cases % Controls OR* (95% CI)
Caucasiansc
GCAGC 23.4 28.3 1.00 (Reference)GCAAC 20.1 19.5 1.26 (0.86-1.84)ACAGC 13.8 15.7 1.08 (0.69-1.68)ACAAC 6.7 8.0 0.98 (0.71-1.35)GTAGC 5.3 4.8 1.25 (0.61-2.57)ATAGC 4.2 4.4 1.14 (0.62-2.1)GTAAC 5.2 3.6 1.80 (0.80-4.05)ATAAC 2.9 3.1 1.11 (0.48-2.54)GCAAT 5.0 2.8 2.21 (1.26-3.87)ATCAT
b0.25 0.15 —
GTCATb
0.07 — —Otherx 13.1 9.8
African Americansb
AAC 10.0 22.6 1.00 (Reference)CCT
b40.9 21.0 4.37 (1.81-10.53)
AAT 16.4 14.7 2.33 (0.77-7.06)CAT 10.2 13.9 2.03 (0.70-5.90)CCC 11.7 12.1 2.49 (0.84-7.35)CAC 7.0 8.4 1.98 (0.53-7.41)Otherx 3.7 7.2 —
NOTE: Only those subjects with complete genotype data for all SNPs areincluded (1,224 cases and 1,202 controls).*ORs are adjusted for age at diagnosis (cases) or reference (controls) date.cWithin Caucasian and African American haplotypes, SNPs are listed asin Table 4 in chromosomal order from centromere to telomere.bFrequencies are presented for haplotypes containing all variant alleles(ATCAT) and all high-risk alleles (GTCAT) associated with risk ofprostate cancer in Caucasians; all high-risk alleles (CCT) associated withprostate cancer in African Americans.xIndicates other haplotypes with estimated frequencies <5%, where n = 18in Caucasians and n = 2 in African Americans.
8q24 and Prostate Cancer
Cancer Epidemiol Biomarkers Prev 2008;17(5). May 2008
1210
American Association for Cancer Research Copyright © 2008 on May 14, 2011cebp.aacrjournals.orgDownloaded from
DOI:10.1158/1055-9965.EPI-07-2811
SNPs include variants in each of the 8q24 subregions(rs10090154, rs1016343, rs6983561, and rs7837328 locatedin regions 1, 2, 2, and 3, respectively), plus rs979200,which is centromeric to region 2. In African Americans,of the 5 SNPs individually associated with prostatecancer risk in single SNP tests (Table 3), 3 remainedsignificant in the final stepwise regression model,suggesting independent associations for each of theseSNPs. SNP rs6983561 was independently associated withprostate cancer risk, as it was in Caucasians, and so weretwo additional SNPs (rs13254738 and rs7000448 inregions 2 and 1, respectively).
SNPs that were found to be independently associatedwith prostate cancer risk were included in haplotypes toexamine the joint effect of variant alleles on risk in ourpopulation (Table 5). Interestingly, the haplotypeexpected to be associated with the highest relative riskof prostate cancer among Caucasians, that is, rs979200 G,rs1016343 T, rs6983561 C, rs7837328 A, and rs10090154T alleles, is not estimated to occur in Caucasian controls,although the frequency in Caucasian cases is expected tobe 0.07%. In Caucasians, haplotype GCAAT is signifi-cantly associated with disease risk with an OR of 2.2(95% CI, 1.3-3.9) and carries two alleles associated withincreased risk, the G allele of rs979200 and the A allele ofrs7837328. These two alleles identify the three haplotypesin Caucasians with the largest point estimates of diseaserisk. Among African Americans, the AAC haplotypewith all low-risk alleles is the most common (10% casesand 22.6% controls). When men with the high-risk CCThaplotype (40.9% cases and 21.0% controls) are comparedwith men with the AAC haplotype, there was astatistically significant 4.4-fold increase in prostate cancerrisk (95% CI, 1.8-10.5).
Evaluation of the five independently significant 8q24SNPs in Caucasians and three in African Americanswith prostate cancer risk within categories defined byfirst-degree family history of prostate cancer, prostatecancer aggressiveness, Gleason score, stage of disease,or BMI in polytomous models did not reveal anyappreciable heterogeneity of risk estimates (data notshown). Among Caucasian cases, only rs16902124was significantly associated with age at diagnosis.Patients having any A allele were diagnosed, on average,1.7 years younger than GG homozygous cases (58.4versus 60.1 years, respectively; P = 0.02). Among AfricanAmericans, the largest difference in age at diagnosis wasobserved for rs7837328, where, on average, cases withany A allele were diagnosed at age 58.8 years versusGG homozygous cases who were diagnosed at age64.0 years (P = 0.005). The age of diagnosis for AfricanAmericans also differed significantly across genotypesof SNPs rs1456310, rs10505476, and rs1447295, withcarriers of variant alleles being diagnosed at earlier ages(data not shown).
Discussion
Multiple polymorphisms across the 8q24 region havebeen significantly associated with prostate cancer risk inboth case-control association and genetic linkage studies.This study confirms the previous findings for several8q24 SNPs reported in populations of western Europeandescent and extends the centromeric boundary of the
8q24 region by identifying variant alleles in two SNPsalmost 1 Mb centromeric of region 2 (rs979200 andrs1456310) that are significantly associated with risk ofprostate cancer. Consistent with previously publishedstudies (8, 13, 14, 16, 18), our results confirm an increasein prostate cancer risk for the rs1447295 SNP (OR, 2.1)and two SNPs in strong LD with that SNP (rs10090154and rs7837688). We also previously reported strong LDbetween rs1447295 and the microsatellite DG8S7373 inthe 8q24 region (15). In the current analyses, the largestsignificant effect we observed in Caucasians was forrs7837688, with a >2-fold increase in the relative risk ofprostate cancer (OR, 2.2; 95% CI, 1.1-4.1) when compar-ing variant TT homozygotes to common GG homozy-gotes. Significant findings in Caucasians for rs6983267(13, 18) and rs6983561 (13) were also replicated, but notthose for rs13257438 or rs7000448. The allele frequenciesfor rs13254738 and rs7000448 in our data were notsignificantly different from those reported previously(ref. 13; 0.33 cases and 0.31 controls and 0.36 cases and0.36 controls for rs13254738 and rs7000448, respectively).We found no evidence to support the notion that the 8q24SNPs are preferentially associated with more aggressiveprostate cancer as defined by Gleason score, stage, andPSA at diagnosis. Neither was there a difference in theassociations detected across strata of family history ofprostate cancer, BMI, or smoking history.
From a stepwise multivariate model, five SNPs wereretained with each being independently associated withprostate cancer risk in Caucasians (Table 4). These SNPsare associated with as much as a 1.6-fold increase in therelative risk of disease (95% CI, 1.1-2.1 for rs6983561).Our results are consistent with the inclusion of rs6983561and rs10090154 in the multivariate model of Haimanet al. (13), but not their inclusion of rs7000448 orrs13254738. Interestingly, these two latter SNPs areindependently associated with risk in our multivariateSNP model for African Americans (Table 4).
Several studies, including recently available data fromthe Cancer Genetic Markers of Susceptibility Study, havereported the strength of the associations for rs1447295and rs6983267 with risk of disease (14, 17, 18). In ourdata, both of these SNPs were significantly associatedwith risk of prostate cancer in single SNP tests, butneither was included in our multivariate models as otherSNPs in strong LD with these two were more significantin our data set. However, the earlier data are consistentwith results presented here, as rs10090154 and rs7837328were both independently associated with risk in Cau-casians, rs10090154 is in strong LD with rs1447295, andrs7837328 is in strong LD with rs6983267 (Table 1). Thus,they serve as proxies or ‘‘tags’’ for one another. Indeed,when rs1447295 and rs6983267 are substituted in themultivariate SNP model of Table 4, results are similar.When haplotypes are constructed from the SNPs foundto be independently associated with risk, prostate cancerrisk increases as the number of alleles associated withhigher risk increases, e.g., compare GTAAC and GCAAT,each with 3 risk alleles, with ACAGC, GCAGC, andACAAC, each with V1 risk allele. Combinations ofindependent SNPs more than double the relative riskestimates of disease (95% CI, 1.26-3.87) in men carryingthe GCAAT haplotype compared with the most commonhaplotype (Table 5).
Cancer Epidemiology, Biomarkers & Prevention
Cancer Epidemiol Biomarkers Prev 2008;17(5). May 2008
1211
American Association for Cancer Research Copyright © 2008 on May 14, 2011cebp.aacrjournals.orgDownloaded from
DOI:10.1158/1055-9965.EPI-07-2811

The relative risk estimates in African Americans wereof greater magnitude than those observed in Caucasians,with several significant ORs above 3.5 (rs13254738,rs6983561, and rs7000448), although the limited samplesize implies the need for caution in interpreting thesedata. Five SNPs were significantly associated withprostate cancer risk in models with single SNPs, withrs6983561 and rs16901966 potentially reflecting the sameassociation signal, as they are in modest LD (r2 = 0.51).This is similar to the results of Haiman et al. (13),who reported significant associations for rs13254738,rs6983561, and rs7000448 for African Americans fromMichigan. In contrast, no significant associations wereidentified for rs10090154 in these data, but allelefrequencies differed between study populations (23.3%cases and 16.7% controls in our study compared with12.3% and 8.9% for cases and controls in Haiman et al.).No significant association was detected for rs1447295,which is consistent with several earlier studies (8, 9, 12,19). At an a level of 0.05 and the number of independenttests conducted in Caucasians, at least one false-positiveresult would be expected. The probability of finding asmany independent significant results as were observedin Caucasians is <1 � 10-13, that is, 11 SNPs with r2 < 0.8had significant nominal P values < 0.05. Among AfricanAmericans, the probability of observing as manyindependent significant results as were observed, thatis, four SNPs with r2 < 0.8, is 1 � 10-4. These probabilitiesare calculated based on the assumption that the nullhypothesis is true. As the 8q24 region has been identifiedpreviously as a region of interest with multiple variantsassociated with risk in other studies, this assumptionmay not be valid for all SNPs tested here. As anadditional measure to correct for multiple comparisons,P values were obtained from permutation testing. All ofthe SNPs initially identified as significant at the nominalP < 0.05 level in both Caucasians and African Americansremained significant based on the permuted P valuesthat account for multiple comparisons.
Findings from this study extend the boundaries of the8q24 region where significant associations with prostatecancer risk have been found. SNPs rs979200 andrs1456310, both significantly associated with disease,are located 88 and 40 kb centromeric to rs10086908, asreported in Zheng et al. (18). These three SNPs arelocated over 120 kb distant from 8q24 region 2 (128.14-128.28 Mb), the most centromeric of the three 8q24regions identified so far, and are not in LD with knownSNPs in other regions. These SNPs may identify whatZheng et al. suggest may be a fourth 8q24 region inCaucasians. At the other margin of 8q24, rs3891248(Table 3) identifies a potentially new telomeric boundary,which is also notable for being located in the first intronof c-MYC (IVS1-355). Although several recent studieshave examined SNPs in or near c-MYC (12, 13, 17, 18),none has reported significant associations. However,these studies did not report investigating rs3891248 andthis SNP does not appear to be in significant LD with anyknown SNP. This result is interesting as the c-MYConcogene has been hypothesized as playing a role inprostate cancer based on its amplification in prostatetumors (30) and its location in the 8q region mostfrequently gained in the genome of prostate tumors (31).
Our study has several strengths and limitations. Thepopulation-based study design, the sample size, the
availability of information on potential confounders andeffect modifiers, and the clinical information on prostatecancer cases are strengths. Limitations include themodest number of African Americans, which reflectsdemographics of the Seattle-Puget Sound area. Becausethe genotypes of SNPs in the 8q24 region seem unlikelyto be related to study participation, the potential forselection bias is reduced. In addition, although not allinterviewed cases and controls provided blood samplesfor genotyping, no significant differences in demograph-ic (cases and controls) or clinical features of disease(cases) were observed between men who provided bloodsamples and those who did not.
In summary, results reported here and elsewhereconfirm that multiple genetic polymorphisms in the 8q24region are associated with prostate cancer susceptibility.Multiple independent subregions have been discernedand multiple genetic markers in these regions apparentlycontribute independently to disease risk. This is not agene-rich region of the genome, although severalpotential transcripts and genes of unknown functionare present. Current interest in the 8q24 region maymotivate further characterization of loci, such as PVT1,which is telomeric to c-MYC and which has been recentlyimplicated in breast cancer progression (32). In themeantime, the underlying biological mechanism(s) driv-ing the positive associations for SNPs in this region willbe challenging to uncover. Others have speculated thatthese multiple independent variants are likely to under-lie a common biological mechanism and may influencethe regulation of a local gene (13, 18). The presence ofc-MYC in the distant genomic landscape presents atempting yet challenging candidate gene. Aside from thesignificant association of rs3891248 with prostate cancerrisk, the distance between the most telomeric SNPreported previously as significantly associated withprostate cancer risk and c-MYC is >200 kb. It is notbeyond reason to speculate that polymorphisms thisfar upstream may influence expression of c-MYC . First,the largest segments of DNA that have been engineeredupstream of a c-MYC reporter transgene fail to recapit-ulate the full profile of c-MYC expression in vivo (33).Secondly, genes with long-range enhancers located asfar upstream as 8q24 is from c-MYC have been reportedpreviously (34-36). Our finding of a significant associa-tion between an intronic SNP in c-MYC and prostatecancer is intriguing and suggests that the boundariesof the region may extend farther than thought pre-viously. The combined efforts of the prostate cancerresearch community will be required to fully understandthe role of the 8q24 region to development of this diseaseand the identification of the biological mechanism(s)involved.
Disclosure of Potential Conflicts of Interest
No potential conflicts of interest were disclosed.
AcknowledgmentsThe costs of publication of this article were defrayed in part bythe payment of page charges. This article must therefore behereby marked advertisement in accordance with 18 U.S.C.Section 1734 solely to indicate this fact.
8q24 and Prostate Cancer
Cancer Epidemiol Biomarkers Prev 2008;17(5). May 2008
1212
American Association for Cancer Research Copyright © 2008 on May 14, 2011cebp.aacrjournals.orgDownloaded from
DOI:10.1158/1055-9965.EPI-07-2811

We thank the men who participated in these studies andwhose help made this work possible, Dr. Robert Eisenman forhelpful discussions about c-MYC , Dr. Meredith Yeager for helpwith SNP selection in 8q24, and Drs. Bo Johanneson andBrandon Pierce for helpful discussions.
References1. Lichtenstein P, Holm NV, Verkasalo PK, et al. Environmental and
heritable factors in the causation of cancer—analyses of cohorts oftwins from Sweden, Denmark, and Finland. N Engl J Med 2000;343:78– 85.
2. Bruner DW, Moore D, Parlanti A, Dorgan J, Engstrom P. Relative riskof prostate cancer for men with affected relatives: systematic reviewand meta-analysis. Int J Cancer 2003;107:797 –803.
3. Zeegers MP, Jellema A, Ostrer H. Empiric risk of prostate carcinomafor relatives of patients with prostate carcinoma: a meta-analysis.Cancer 2003;97:1894–903.
4. Xu J, Dimitrov L, Chang BL, et al. A combined genomewide linkagescan of 1,233 families for prostate cancer-susceptibility genesconducted by the international consortium for prostate cancergenetics. Am J Hum Genet 2005;77:219– 29.
5. Langeberg WJ, Isaacs WB, Stanford JL. Genetic etiology of hereditaryprostate cancer. Front Biosci 2007;12:4101 –10.
6. Platz EA, Giovannucci E. Prostate cancer. In: Schottenfeld D,Fraumeni JF, editors. Cancer epidemiology and prevention. Oxford(NY): Oxford University Press; 2006. p. 1128–50.
7. Schaid DJ. The complex genetic epidemiology of prostate cancer.Hum Mol Genet 2004;13 Spec No 1:R103–21.
8. Amundadottir LT, Sulem P, Gudmundsson J, et al. A commonvariant associated with prostate cancer in European and Africanpopulations. Nat Genet 2006;38:652–8.
9. Freedman ML, Haiman CA, Patterson N, et al. Admixture mappingidentifies 8q24 as a prostate cancer risk locus in African-Americanmen. Proc Natl Acad Sci U S A 2006;103:14068–73.
10. Powell IJ. Epidemiology and pathophysiology of prostate cancer inAfrican-American men. J Urol 2007;177:444 –9.
11. Camp NJ, Farnham JM, Allen-Brady K, Cannon-Albright LA.Statistical recombinant mapping in extended high-risk Utah pedi-grees narrows the 8q24 prostate cancer locus to 2.0 Mb. Prostate 2007;67:1456–64.
12. Gudmundsson J, Sulem P, Manolescu A, et al. Genome-wideassociation study identifies a second prostate cancer susceptibilityvariant at 8q24. Nat Genet 2007;39:631–7.
13. Haiman CA, Patterson N, Freedman ML, et al. Multiple regionswithin 8q24 independently affect risk for prostate cancer. Nat Genet2007;39:638–44.
14. Schumacher FR, Feigelson HS, Cox DG, et al. A common 8q24 variantin prostate and breast cancer from a large nested case-control study.Cancer Res 2007;67:2951–6.
15. Suuriniemi M, Agalliu I, Schaid DJ, et al. Confirmation of a positiveassociation between prostate cancer risk and a locus at chromosome8q24. Cancer Epidemiol Biomarkers Prev 2007;16:809–14.
16. Wang L, McDonnell SK, Slusser JP, et al. Two common chromosome8q24 variants are associated with increased risk for prostate cancer.Cancer Res 2007;67:2944–50.
17. Yeager M, Orr N, Hayes RB, et al. Genome-wide association study of
prostate cancer identifies a second risk locus at 8q24. Nat Genet 2007;39:645–9.
18. Zheng SL, Sun J, Cheng Y, et al. Association between two unlinkedloci at 8q24 and prostate cancer risk among European Americans. JNatl Cancer Inst 2007;99:1525 –33.
19. Robbins C, Torres JB, Hooker S, et al. Confirmation study of prostatecancer risk variants at 8q24 in African Americans identifies a novelrisk locus. Genome Res 2007;17:1717– 22.
20. Agalliu I, Salinas CA, Stanford JL. Use of statins and risk of prostatecancer. 2008 Am J Epidemiol. In Press.
21. Witte JS. Multiple prostate cancer risk variants on 8q24. Nat Genet2007;39:579 –80.
22. Stanford JL, Wicklund KG, McKnight B, Daling JR, Brawer MK.Vasectomy and risk of prostate cancer. Cancer Epidemiol BiomarkersPrev 1999;8:881– 6.
23. Harlow BL, Davis S. Two one-step methods for household screeningand interviewing using random digit dialing. Am J Epidemiol 1988;127:857 –63.
24. Sambrook J, Russell DW. Molecular cloning: a laboratory manual.Cold Spring Harbor (NY): Cold Spring Harbor Laboratory Press;2001.
25. Barrett JC, Fry B, Maller J, Daly MJ. Haploview: analysis andvisualization of LD and haplotype maps. Bioinformatics 2005;21:263–5.
26. Breslow NE, Day NE. Statistical methods in cancer research. Theanalysis of case-control studies. IARC Sci Publ 1980;1:5 –338.
27. Li W, Nyholt DR. Marker selection by Akaike information criterionand Bayesian information criterion. Genet Epidemiol 2001;21 Suppl1:S272–7.
28. Cordell HJ, Clayton DG. A unified stepwise regression procedure forevaluating the relative effects of polymorphisms within a gene usingcase/control or family data: application to HLA in type 1 diabetes.Am J Hum Genet 2002;70:124– 41.
29. Zhao LP, Li SS, Khalid N. A method for the assessment of diseaseassociations with single-nucleotide polymorphism haplotypes andenvironmental variables in case-control studies. Am J Hum Genet2003;72:1231 –50.
30. Jenkins RB, Qian J, Lieber MM, Bostwick DG. Detection of c-myconcogene amplification and chromosomal anomalies in metastaticprostatic carcinoma by fluorescence in situ hybridization. Cancer Res1997;57:524 –31.
31. Sun J, Liu W, Adams TS, et al. DNA copy number alterations inprostate cancers: a combined analysis of published CGH studies.Prostate 2007;67:692–700.
32. Guan Y, Kuo WL, Stilwell JL, et al. Amplification of PVT1 contributesto the pathophysiology of ovarian and breast cancer. Clin Cancer Res2007;13:5745 –55.
33. Lavenu A, Pournin S, Babinet C, Morello D. The cis -acting elementsknown to regulate c-myc expression ex vivo are not sufficient forcorrect transcription in vivo . Oncogene 1994;9:527– 36.
34. Nobrega MA, Ovcharenko I, Afzal V, Rubin EM. Scanning humangene deserts for long-range enhancers. Science 2003;302:413.
35. Lettice LA, Heaney SJH, Purdie LA, et al. A long-range Shh enhancerregulates expression in the developing limb and fin and is associatedwith preaxial polydactyl. Hum Mol Genet 2003;12:1725 –35.
36. Vavouri T, McEwen GK, Woolfe A, Gilks WR, Elgar G. Defining agenomic radius for long-range enhancer action: duplicated conservednon-coding elements hold the key. Trends Genet 2006;22:5 –10.
Cancer Epidemiology, Biomarkers & Prevention
Cancer Epidemiol Biomarkers Prev 2008;17(5). May 2008
1213
American Association for Cancer Research Copyright © 2008 on May 14, 2011cebp.aacrjournals.orgDownloaded from
DOI:10.1158/1055-9965.EPI-07-2811