Genetic variants of flavin-containing monooxygenases
303
Genetic Variants of Flavin-containing Monooxygenases: Consequences for Drug Metabolism Asvi Francois Department of Structural and Molecular Biology University College London A thesis submitted for the degree of Doctor of Philosophy September 2009 1
-
Upload
khangminh22 -
Category
Documents
-
view
1 -
download
0
Transcript of Genetic variants of flavin-containing monooxygenases

Genetic Variants of Flavin-containing Monooxygenases: Consequences for Drug Metabolism
Asvi Francois
Department of Structural and Molecular Biology
University College London
A thesis submitted for the degree of Doctor of Philosophy
September 2009
1

Statement
I, Asvi Francois confirm that the work presented in this thesis is my own. Where information
has been derived from other sources, I confirm that this has been indicated in the thesis.
2

Abstract
The metabolism of the anti-tubercular drug, thiacetazone (TAZ) by human FMOs in vitro and
the disposition of TAZ in vivo in mice were studied. Reverse phase chromatography
confirmed TAZ to be a substrate for human FMO1, FMO2.1 and FMO3 with the formation
of TAZ-sulphinic acid and TAZ-carbodiimide via a TAZ- sulphenic acid intermediate. The
products are the same as those formed by the Mycobacterium tuberculosis enzyme EtaA, the
enzyme responsible for TAZ activation. Kinetic studies found FMO2.1 to be significantly
more efficient at TAZ oxygenation than EtaA, FMO1 and FMO3. Asians and Europeans do
not express functional FMO2 in their lungs as a result of a premature stop codon. However
about 28% of African individuals lack this mutation. The products of FMO2 are expected to
be toxic to mammalian cells; therefore individuals expressing FMO2 in their lungs may be at
higher risk of FMO-dependent TAZ bioactivation.
Protein variants of FMO3 were analysed for their ability to catalyse TAZ
oxygenation. Kinetic studies showed that the L360P variant displayed a significantly higher
catalytic activity towards TAZ than the wild type protein. The K158/G308 protein was
inactive towards TAZ, whereas K158 or G308 variants oxygenated TAZ. These findings
may reflect the underlying mechanism of TAZ-dependent liver toxicity reported in patients
taking TAZ as part of treatment for TB.
Mouse liver and lung microsome experiments indicated that both FMOs and
cytochromes P450 (CYPs) metabolise TAZ in vitro. FMO contribution was higher in the lung
than the liver. Kinetic studies using microsomes from Fmo1 knockout mice show FMO1 to
be the predominant contributor to TAZ oxygenation in vitro.
Metabolism of TAZ in liver and lungs of mice in vivo was not observed, however
TAZ, TAZ-sulphenic acid, TAZ-sulphinic acid and TAZ-carbodiimide were identified in
kidney.
3

For my Mother and Lord Vishnu...
First and foremost, I’d like to thank my supervisor, Professor Elizabeth Shephard for giving
me the opportunity to explore such an exciting project. You have always supported and
encouraged me throughout the Ph.D and I greatly appreciate this. I could not have hoped for
a more supportive supervisor.
I would like to thank Dr. Azara Janmohamed for teaching me all the lab basics and for
her constant encouragement throughout the 4 years of my research. I wish to thank members,
past and present of Lab 402, a.k.a ‘Shephard’s Crew’ for their friendship, lab support and
general messing about.
I thank Prof. Jeremy Brockes and Dr. Neil Bradman for acting as my mentors during
my Ph.D.
My sincere thank you to Professor Paul Ortiz de Montellano at the University of
California, San Francisco who hosted my Bogue Fellowship and Dr. Clinton Nishida for his
supervision and ensuring that I didn’t break their fancy HPLC equipment.
I would like to thank the Bogue Fellowship, UCL, for funding my trip to San
Francisco and also funding excursions like helicopter tours, a visit to Alcatraz, Fisherman’s
Wharf and shopping sprees in Macy’s, an experience I will never forget.
I wish to thank Professor Ian R. Phillips at Queen Mary University, London for many
helpful discussions, particularly on FMO2 genetics. I am grateful to Professor Keith
Brockelhurst and Dr. Saeed Hussain for their guidance on enzyme kinetics.
I would like to thank Mr. Marco Calzavara and the rest of the Bioline team for the
invaluable industrial experience I gained.
I offer my extreme thanks to the Biotechnology and Biological Sciences Research
Council for funding my research and to the UCL Graduate School who partly funded my trip
to Singapore.
I would like to thank my grand Uncle, Mr. Kirpal Singh for the financial support he
provided over the years of my student life and for reminding me about what is really
important in life.
Finally, I would like to thank my mum – who else would have put up with me
moaning over ‘‘dead’’ enzymes, Western’s not working and cells not growing. You have
been my inspiration and I couldn’t have done this Ph.D without you. I hope this thesis does
you justice.
4

Table of Contents
Title Page 1
Statement 2
Abstract 3
Acknowledgements 4
Contents List 5
List of Figures 7
List of Tables 10
List of Abbreviations 12
1.0 Chapter 1: Introduction .................................................................................................16
1.1 Xenobiotic Metabolism 16
1.2 FMOs 17
1.2.4 Reactions Catalysed by FMOs: Detoxification vs Bioactivation 21
1.3 Human FMOs 26
1.3.1 FMO1 28
1.3.3 FMO3 45
1.3.4 FMO4 54
1.3.5 FMO5 54
1.4 Tuberculosis 57
1.4.1 Transmission and Pathogenesis 57
1.4.2 TB Incidence, Prevalence and Mortality 57
1.4.3 Genus Mycobacterium and Disease 58
1.4.4 Anti-tuberculosis chemotherapy 59
1.4.5 Mechanisms of Drug Action 61
1.4.6 Ethionamide 64
1.4.7 Thiacetazone 67
1.4.8 Ethionamide-Activating Enzyme (EtaA): A bacterial FMO 74
1.5 Pharmacogenetics 77
1.6 AIMS 80
5

2.0 Chapter 2: Materials and Methods
2.1 Chemicals 81
2.2 Cell Culture Conditions 82
2.2.1 Spodoptera frugiperda, (Sf9) Cells 82
2.2.2 Cell Counting and Seeding 84
2.2.3 Culture of Bacteria 85
2.3 Bac-to-Bac® Baculovirus Expression system (Invitrogen) 86
2.3.1 Generation of Recombinant Bacmid DNA 87
2.4 Generation of Recombinant Baculovirus 96
2.4.1 Amplification of Baculovirus 97
2.5 Expression & Analysis of Recombinant Protein in Sf9 Cells 98
2.5.1 Baculovirus Infection of Sf9 cells 98
2.5.2 Insect cell Microsome Preparation 98
2.5.3 Determination of Total Protein Concentration 99
2.5.4 Sodium Dodecyl Sulphate Polyacrylamide Gel Electrophoresis (SDS-PAGE)
Analysis 100
2.5.5 Western Blot Analysis 102
2.6 Quantification of Recombinant FMO in Insect Cell Microsomes 105
2.6.1 Quantitative Western Blotting 105
2.7 HPLC and LC-MS Analysis of FMO Catalysed Reactions 106
2.7.2 Reverse Phase HPLC analysis 107
2.7.3 Liquid Chromatography-Mass Spectroscopy (LC-MS) Analyses 108
2.8 FMO Assays 108
2.8.1 Methimazole Assay of FMO activity (Dixit et al. 1984) 108
2.8.2 TAZ Oxygenation by Human FMOs and EtaA 111
2.8.3 Kinetic Studies of TAZ oxygenation using a UV-spectroscopic Assay 115
2.8.4 Kinetic Studies of TAZ oxygenation using HPLC analysis 116
2.9 Generation of human FMO3 Amino Acid Variant cDNAs 116
2.9.1 BamHI and HindIII Restriction Digest of human FMO3-pET21b and pFastBac1™ 117
2.9.2 Gel Extraction of DNA 118
2.9.3 DNA Ligation 119
2.9.4 Tranformation of E.coli OneShot™ TOP10 competent cells with Ligation Products
120
6

2.9.5 Analysis to Confirm Successful ligation of human FMO3 cDNA and pFastBac1™ 121
2.9.6 DNA Sequencing 121
2.9.7 Assays of Variant human FMO3 Activity 122
2.10 Isolation and Preparation of Mouse Tissue Microsomes 123
2.10.1 Dissection 124
2.10.2 Isolation of Mouse Tissue Microsomes 125
2.10.4 Control Experiments used to Assess Activity of Mouse Tissue Microsomes 127
3.0 Chapter 3: Results and Discussion……………………………….…………………. 134
3.1 Analysis of the Reaction between Human FMO2.1 and the Anti-Tubercular Drugs
Thiacetazone and Ethionamide. 133
3.2 Kinetic Parameters of FMO3 Amino Acid Variants 172
3.3 Metabolism of Thiacetazone by Mouse Tissue Microsomes 204
Chapter 4: Summary ……………………………………………………………………..253
Chapter 5: References ……………………………………………………………………271
Appendix 1 ………………………………………………………………………………...274
Publications ..........................................................................................................................272
7

List of Figures
Chapter 1: Introduction
Figure 1.1: Major Steps in the Catalytic Cycle of FMO..........................................................20
Figure 1.2: Oxidation of Thiourea by FMO.............................................................................23
Figure 1.3: Interaction of Glutathione (GSH) with FMO-generated metabolites of
Thiocarbamide S-oxygenation. ................................................................................................24
Figure 1.5: Selected substrates of human FMO1.....................................................................31
Figure 1.6: The Nonsense Mutation in Human FMO2 is absent in Other Mammalian Species
..................................................................................................................................................36
Figure 1.7: The Frequency and Distribution of the Human FMO2*1 allele in Africa ............38
Figure 1.8: Human FMO2.1 substrate specificity towards phenothiazines .............................40
Figure 1.8A: Chemical Structures of Second-line Antibiotics: (A) Thiacetazone and (B)
Ethionamide. ............................................................................................................................44
Figure 1.9: Chemical Structures of Isoniazid (INH) and Ethionamide (ETA) ........................65
Figure 1.10: EtaA Catalyses the Two-Step Oxidation of TAZ................................................72
Figure 1.11: A primary sequence alignment of EtaA and human FMOs involved in drug
metabolism ...............................................................................................................................75
Chapter 2: Materials and Methods Figure 2.1: Generation of recombinant baculovirus using the Bac-to-Bac expression system.
Taken from Bac-to-Bac® Baculovirus Expression System User’s Manual ...........................88
Figure 2.2: (A) General PCR programme for BIO-X-ACT™. (B) Formulae for determining
the Tm and annealing temperatures. ........................................................................................95
Figure 2.3: ‘Sandwich’ arrangement of the gel during transfer.............................................104
Chapter 3: Results and Discussion Section 3.1 Figure 3.1.1: SDS-PAGE gel illustrating the expression of human FMO1, FMO2.1 and
FMO3 expressed in Sf9 insect cell microsomes. ...................................................................134
Figure 3.1.2: Quantification of FMO1 amounts in insect cell microsomes...........................136
Figure 3.1.3. Metabolites of TAZ generated by human FMO2.1 catalysed oxidation. .........137
Figure 3.1.4: UV-Absorption spectra of TAZ metabolites generated by human FMO2.1
catalysed oxidation.................................................................................................................138
8

Figure 3.1.5. Mass spectra of TAZ metabolites generated from human FMO2.1 catalysed
oxidation ................................................................................................................................139
Figure 3.1.6. UV-HPLC Chromatograms of TAZ metabolite standards. ..............................141
Figure 3.1.7: UV-spectra of TAZ metabolite standards. .......................................................142
Figure 3.1.8: Metabolites of TAZ generated by human FMO1, FMO3 and EtaA catalysed
oxidation ................................................................................................................................143
Figure 3.1.9: Time Course Experiment of TAZ oxidation by human FMO2.1.....................144
Figure 3.1.10. LC-MS analysis of ETA metabolites generated by human FMO2.1 catalysed
oxidation ................................................................................................................................146
Figure 3.1.11: UV-spectra of TAZ ........................................................................................148
Figure 3.1.12: Linear absorbance of TAZ .............................................................................149
Figure 3.1.13A: Human FMO2.1- and NADPH-dependent decrease in TAZ absorbance at
328 nm is linear......................................................................................................................150
Figure 3.1.13B: Human FMO2.1- and NADPH-dependent decrease in TAZ absorbance at
328 nm over time. ..................................................................................................................151
Figure 3.1.14: UV-spectra at 328 nm in the presence of non-infected insect cell microsomes
and NADPH ...........................................................................................................................152
Figure 3.1.15: Human FMO2.1-dependent decrease in TAZ absorbance in the absence of
NADPH at 328 nm.................................................................................................................153
Figure 3.1.16. Effect of pH on the rate of TAZ oxygenation by purified EtaA or Sf9 insect
cell microsomes containing heterologously expressed human FMO1, FMO2.1 or FMO3...156
Figure 3.1.17A: Non-linear regression and linear transformation of the Michaelis-Menten
equation for human FMO1 catalysed TAZ oxidation...........................................................158
Figure 3.1.17B: Non-linear regression and linear transformation of the Michaelis-Menten
equation for human FMO2.1 catalysed TAZ oxidation........................................................159
Figure 3.1.17C: Non-linear regression and linear transformation of the Michaelis-Menten
equation for human FMO3 catalysed TAZ oxidation...........................................................160
Figure 3.1.18: Standard curve representing the ratio of integrated peak area of TAZ and ETA
plotted against TAZ concentration.........................................................................................162
Figure 3.1.19: Diagram depicting TAZ metabolites generated by the oxidation of FMO and
the interaction with glutathione (GSH)..................................................................................168
Section 3.2
Figure 3.2.1: Polymorphic Variants of Human FMO3 investigated in this Chapter .............175
9
Figure 3.2.2A: Non-linear regression and linear transformation of the Michaelis-Menten
equation for FMO3 wild type (M486) catalysed TAZ oxidation ..........................................183
Figure 3.2.2C: Non-linear regression and linear transformation of the Michaelis-Menten
equation for FMO3 P360 catalysed TAZ oxidation ..............................................................185
Figure 3.2.3A: Non-linear regression and linear transformation of the Michaelis-Menten
equation for FMO3 wild type (I486) catalysed TAZ oxidation.............................................187
Figure 3.2.3B: Non-linear regression and linear transformation of the Michaelis-Menten
equation for FMO3 K158 catalysed TAZ oxidation..............................................................188
Section 3.3 Figure 3.3.1: νo versus [TAZ] plot for TAZ metabolism catalysed by wild type female mouse
liver microsomes. ...................................................................................................................206
Figure 3.3.2: νo versus [TAZ] plot catalysed by wild type and Fmo1 (-/-), 2 (-/-), 4 (-/-)
female mouse liver microsomes.............................................................................................207
Figure 3.3.3: νo versus [TAZ] plot catalysed by wild type, Fmo1 (-/-), 2 (-/-), 4(-/-) and Fmo5
(-/-) female mouse liver microsomes .....................................................................................208
Figure 3.3.4: Rate of TAZ metabolism observed for female mouse liver microsomes.........210
Figure 3.3.5: Rate of TAZ metabolism observed for female and male mouse liver microsomes
................................................................................................................................................211
Figure 3.3.6: The effect of pre-treatment of female mouse liver microsomes with
methimazole on the rate of TAZ metabolism ........................................................................213
Figure 3.3.7: The effect of pre-treatment of male mouse liver microsomes with methimazole
on the rate of TAZ metabolism ..............................................................................................214
Figure 3.3.8: The effect of pre-heat treatment of female liver microsomes on TAZ
metabolism .............................................................................................................................216
Figure 3.3.9: The effect of pre-heat treatment of male liver microsomes on TAZ metabolism
................................................................................................................................................217
Figure 3.3.10: The effect of Anti-NADPH-dependent Cytochrome P450 reductase serum on
TAZ metabolism by female liver microsomes.......................................................................219
Figure 3.3.11: The effect of Anti-NADPH-dependent Cytochrome P450 reductase serum on
TAZ metabolism by male liver microsomes..........................................................................221
Figure 3.3.12: Comparison of the effects of pre-heat treatment and Anti-NADPH-dependent
Cytochrome P450 reductase serum incubation on the rate of TAZ metabolism by male and
female liver microsomes ........................................................................................................222
10

Figure 3.3.13: νo versus [TAZ] plot for TAZ metabolism catalysed by female mouse lung
microsomes ............................................................................................................................224
Figure 3.3.14: The reduction of cytochrome c catalysed by wild type and Fmo1.................226
(-/-), 2 (-/-), 4 (-/-) lung microsomes......................................................................................226
Figure 3.3.15: Rate of TAZ metabolism observed for female and male mouse lung
microsomes ............................................................................................................................227
Figure 3.3.17: The effect of pre-treatment with methimazole on the rate of TAZ metabolism
by male mouse lung microsomes ...........................................................................................230
Figure 3.3.18: The effect of pre-heat treatment on TAZ metabolism observed by lung
microsomes ............................................................................................................................231
Figure 3.3.19: The effect of pre-heat treatment on TAZ metabolism by male lung microsomes
................................................................................................................................................233
Figure 3.3.20: The effect of Anti-NADPH-dependent Cytcrome P450 reductase serum on
TAZ metabolism observed for female lung microsomes.......................................................235
Figure 3.3.21: The effect of Anti-NADPH-dependent Cytochrome P450 reductase serum on
TAZ metabolism by male lung microsomes ..........................................................................236
Figure 3.3.22: Comparison of the effects of pre-heat treatment and Anti-NADPH Cytochrome
P450 reductase antibody incubation on the rate of TAZ metabolism observed for male and
female lung microsomes ........................................................................................................237
Figure 3.3.23: Comparison of the rate of TAZ metabolism by lung and liver microsomes
prepared from male and female wild type mice.....................................................................239
List of Tables Chapter 1: Introduction
Table 1.1 Nitrogen-containing drugs oxygenated by Human FMO1 ......................................32
Table 1.2: Suphur-containing drugs oxygenated by Human FMO1........................................33
Table 1.3: Nitrogen-containing drugs oxygenated by Human FMO3 .....................................47
Table 1.3: Nitrogen-containing drugs oxygenated by Human FMO3 (continued)..................48
Table 1.4: Suphur-containing drugs oxygenated by Human FMO3........................................49
Table 1.5: Polymorphic Variants of FMO3 not causative for TMAU.....................................52
Table 1.6: Summary of Tissue-specific FMO expression in Man ...........................................56
11

Chapter 3: Results and Discussion Section 3.1 Table 3.1.1: Kinetic Parameters of enzyme catalysed oxidation of Methimazole.................157
Table 3.1.2: Kinetic Parameters of enzyme catalysed oxidation of Thiacetazone ................161
Table 3.1.3: Comparison of kinetic parameters of human FMO2.1 catalysed TAZ oxidation
determined by HPLC and UV-spectroscopy..........................................................................163
Section 3.2
Table 3.2.1: Genetic polymorphisms of Human FMO3 investigated in this report ..............173
Table 3.2.2: Methimazole S-oxygenation by human FMO3 (M486) and FMO3 amino acid
variants ...................................................................................................................................178
Table 3.2.3: Methimazole S-oxygenation by human FMO3 (I486) and FMO3 amino acid
variants ...................................................................................................................................179
Table 3.2.4: S-oxygenation of TAZ by Human FMO3 (M486) and FMO3 amino acid variants
................................................................................................................................................181
Table 3.2.5: S- oxygenation of TAZ by Human FMO3 (I486) and FMO3 amino acid variants
................................................................................................................................................182
Table 3.2.6: S-oxygenation of methimazole by Human FMO3 (M486) and FMO3 (I486) ..191
Table 3.2.7: S- oxygenation of TAZ by Human FMO3 (M486) and FMO3 (I486) ..............192
Table 3.2.8: Data extracted from HapMap for FMO3 g.21599T>C (FMO3 360Pro/Leu) and
FMO2 g.23238C/T (FMO2-472Gln/STOP). .........................................................................193
Appendix 1
Table 1: Primer sequences used in standard PCR..................................................................270
Table 2: Gene Specific Primers used in qRT-PCR ................................................................271
12
[E] Enzyme Concentration A Absorbance Abs Absorbance AG Arabinogalactan ANTU Alpha-Naphthylthiourea ASW African Ancestry in Southwest USA BLAST Basic Local Alignment Search Bp Base Pairs BSA Bovine Serum Albumin BZD Benzydamine C57BL/6 C57 Black 6 Mouse Strain cDNA Complimentary DNA CMAS Cyclopropane Mycolic Acid Synthase CRP NADPH-Dependent Cytochrome P450 Reductase CYP Cytochrome P450 D Aspartic Acid DNA Deoxyribonucleic Acid D-PBS Dulbelcos's Phosphate Buffered Saline DTNB 5,5-Dithio-bis(2-nitrobenzoic acid) DTT Dithiotreitol E Glutamic Acid ε Molar Extinction Co-effiecient E.coli Escherichia coli EDTA Ethylenediaminetetraacetic Acid EMB Ethambutol ETA Ethionamide EtaA Ethionamide-Activating Enzyme ETA-AMIDE 2-Ethyl-4-amidopyridine ETA-NITRILE 2-Ethyl-4-cyanopyridine ETA-SO Ethionamide S-oxide FAD Flavin Adenine Dinucleotide FAD-OOH Hydroperoxyflavin Fig. Figure FMN Flavin Adenine Mononucleotide FMO Flavin Containing Monooxygenase G Glycine g. Gene Cooridinate GAPDH Glyceraldehyde-3-Phosphate Dehydrogenase Gln Glutamine GSH Glutathione H Histidine HEPES 4-(2-hydroxyethyl)-1-piperazineethanesulfonic Acid HIV Human Immunodefiency Virus
13

HNF1 Hepatocyte Nuclear Factor 1 HPLC High Performace Liquid Chromatography Hr Hour(s) I Isoleucine INH Isoniazid K Lysine Kcat Turnover Number KM Michaelis Constant KO Knockout L Leucine LAM Lipoarabinomannan LC-MS Liquid Chromatography-Mass Spectroscopy Leu Leucine LKW Luhya in Webuye, Kenya M Methionie M. bovis Mycobacterium bovis M. smegmatis Mycobacterium smegmatis M.tuberculosis Mycobacterium tuberculosis m/z Mass-to-charge ratio MA Mycolic Acid MAME Mycolic Acid Methyl Esters MDR-TB Multi-drug resistant TB Min Minute(s) MKK Maasai in Kinyawa, Kenya MMLV Moloney Murine Leukemia Virus mRNA Messenger RNA MS Mass Spectroscopy N.D Not Detected n.d Not determined NADPH β-Nicotinamide Adenine Dinucleotide Phosphate (Reduced) P Probability P Proline PAGE Polyacrylamide Gel Electrophoresis PCR Polymerase Chain Reaction PG Peptidoglycan Pro Proline PTU Phenylthiourea PZA Pyrazinamide Q Glutamine
qRT-PCR Quantitative Real-Time Reverse-Transcription Polymerase Chain Reaction
RIF Rifampicin RNA Ribonucleic acid rRNA Ribosomal RNA
14
S.D. Standard Deviation S.E Standard Error SAM S-adenosyl methionine SDS Sodium Dodecyl Sulphate SDS-PAGE Sodium Dodecyl Sulphate Polyacrylamide Gel Electrophoresis Sec Second(s) Sf9 Spodoptera frugiperda SM Streptomycin SNP Single Nucleotide Polymorphism TAZ Thiacetazone TB Tuberculosis TBE Tris/Borate/EDTA Solution TBS Tris Buffered Saline TEMED N,N,N',N'-Tetramethylethylenediamine TMA Trimethylamine TMAU Trimethylaminuria TNB 2-nitro-5-thiobenzoate Tricine N-(Tri(hydroxymethyl)methyl)glycine Tris Tris[hydroxymethyl]aminomethane UK United Kingdom of Great Britain and Northern Island USA United States of America UV Ultraviolet Vmax Maximal Velocity WHO World Health Organisation X-MDR TB Extensively Drug Resistant TB YRI Yoruba in Ibadan, Nigeria
A word about human and mouse gene nomenclature. A human gene is written in italics and capital letters e.g. FMO, whereas the human protein is
written in capitals e.g. FMO. In mice the protein is also written in capitals e.g. FMO, but the
gene is written in italics with the first letter uppercase and the following letters in lowercase
e.g. Fmo.
15

Chapter 1: Introduction
16

1.1 Xenobiotic Metabolism Xenobiotic metabolism refers to the biochemical pathways involved in the processing of an
exogenous substance. The principle site of xenobiotic metabolism is the liver, but
biochemical transformations, to a greater or lesser extent occur throughout the body and
depend on the site of xenobiotic exposure. Xenobiotic metabolism can be considered in two
phases. Phase I metabolism is the stage at which polar groups are either introduced or
exposed in the xenobiotic. This step is achieved by oxidation catalysed by Cytochrome P450
Monooxygenases (CYPs), Flavin Containing Monooxygenases (FMOs), Alcohol and
Aldehyde Dehydrogenases, Monamine Oxidase or Peroxidases or hydrolysis by Esterases,
Amidases or Epoxide Hydrolase. Phase II metabolism refers to the detoxification of
modified products of Phase I metabolism by conjugation to water-soluble, non reactive
chemical moieties to facilitate their excretion from the body. This step is catalysed mainly by
Transferases e.g. Glutathione S-Transferase, Sulfotransferases or UDP Glucuronyl
Transferase.
After the CYPs, the FMOs are the largest group of enzymes involved in the Phase I
metabolism of drugs and other xenobiotics and provide the focus for this investigation.
1.2 FMOs
FMOs (EC 1.14.12.8) are β-Nicotinamide adenine dinucleotide phosphate (reduced)
(NADPH)-dependant enzymes that catalyse the N- and S-oxidation of a wide range of
compounds. They contain flavin dinucleotide (FAD) as a prosthetic group and are dependant
on molecular oxygen for enzyme catalysis.
17

1.2.1 Discovery of FMOs
In 1960, a study described how rat liver microsomes contained enzymes that catalysed the
oxygen- and NADPH-dependent oxidation of a number of azo dyes (Miller et al. 1960). The
localisation (membrane bound), co-factor requirement (FAD), and activity of this enzyme
(oxidation) towards xenobiotics was similar to that observed for CYPs which had recently
been discovered at the time. Studies with purified pig liver microsomes provided evidence
that this enzyme was not a CYP. It was immunologically distinct from the microsomal
NADPH-dependent NADPH cytochrome P450 reductase and unlike this enzyme, which
contains FAD and flavin mononucleotide (FMN), FAD was the only prosthetic group found
in the pig liver oxidase (Masters et al. 1971). Further studies with purified pig liver
microsomes, confirmed the dependence of this oxidase enzyme on FAD but not FMN (Pettit
et al. 1964). At the time, most of the characterisation of the pig liver enzyme had been done
using N, N- dimethylaniline as a model substrate and so ‘amine oxidase’ and ‘dimethylaniline
monooxygenase’ were apt names for this enzyme. The enzyme was initially classified as a
mixed function-amine N-oxidase because it consumes two atoms of oxygen per substrate
where one atom is transferred to the nitrogen of the amine moiety and the other is reduced to
form one molecule of water. Further studies with a panel of xenobiotics revealed that the
enzyme was capable of reacting with a remarkably broad and rather promiscuous range of
compounds with no common chemical feature (described in section 1.2.3). The name mixed
function amine oxidase was now too restrictive in describing the reactions catalysed by this
enzyme. The enzyme was given the trivial name flavin containing monooxygenase which is
usually abbreviated to ‘FMO’.
18

1.2.2 FMO Enzyme Mechanism
The mechanism of FMO enzyme catalysis was determined by extensive kinetic and spectral
studies by Poulsen and Zeigler in the 1970’s (Poulsen et al. 1979).
A sequential cycle is observed in FMO enzyme catalysis with the first step being the
reduction of the prosthetic FAD by NADPH (Fig 1.1). The reduced form (FADH2) can
rapidly react with molecular oxygen to generate a hydroperoxyflavin (FAD-OOH) radical. In
a mechanism that distinguishes FMOs from all other monooxygenases, the formation of this
radical does not require binding of the oxygenatable substrate to the active site of the enzyme,
in fact the hydroperoxyflavin formation occurs before the interaction of substrate and FMO
(Poulsen et al. 1979). The enzyme-bound C4a-hydroperoxyflavin is stable from minutes to
hours at 4˚C and the radical is presumed to be in this state in a cell. Thus, FMOs have been
described to be in a ‘cocked gun’ state, ready to attack any substrate bearing a soft
nucleophile moiety, which has gained access to the active site bearing the hydroperoxyflavin
radical. In the presence of a suitable substrate (see next section) FMO transfers one atom of
molecular oxygen (from the FAD-OOH) to oxygenate the substrate, while the other is
reduced to form water. The oxygenated substrate is released immediately and the next and
rate-limiting step is the release of water. The last step in the cycle is the release of NADP+
and then the regeneration of FAD-OOH starts again. It is important to note that substrate
binding has no effect on the velocity of product formation; that is decided by the rate-limiting
step (the release of water), despite this, the enzyme displays Michaelis-Menten kinetics
(Poulsen et al. 1979).
19

Figure 1.1: Major Steps in the Catalytic Cycle of FMO.
Substrate binding is not required for the cycle to begin. In the first step, the xenobiotic
substrate S is oxidised to SO by the enzyme-bound 4a-hydroperoxyflavin (FAD-OOH). SO is
released immediately and the release of water in step 2 is rate-limiting. The subsequent steps
3-5 simply regenerate the FAD-OOH form of the enzyme. Adapted from Ziegler 2002.
20

1.2.3 Substrate Specificity
In general, any compound bearing a soft nucleophile that can gain access to the enzyme-
bound C4a-hydroperoxyflavin site is a potential substrate for an FMO. The unique
mechanism of FMOs is theorised to be the basis of the broad range of compounds that are
substrates for this enzyme. Substrates include hydrazines (Prough et al. 1981), phosphines
(Smyser et al. 1985), iodine boron containing compounds (Jones et al. 1986), sulphides
(Hamman et al. 2000), selenium bearing compounds (Ziegler et al. 1992) and an array of
amines (Ziegler 2002). There is evidence of a number of endogenous compounds being
FMO substrates including methionine (Duescher et al. 1994), cysteamine, cysteine- and
homocysteine-S-conjugates (Ziegler 1993).
Structure-activity studies with purified and microsomal pig liver FMO indicate that
the overall size and shape of a nucleophilic substrate are major factors limiting access to the
FMO-bound hydroperoxyflavin radical.
1.2.4 Reactions Catalysed by FMOs: Detoxification vs Bioactivation
Detoxification refers to the removal of toxic metabolites by the process of oxidation or
conjugation, i.e. it is a form of xenobiotic metabolism. Conversely bioactivation is the
process of metabolism in which a generated metabolite is more toxic or reactive than the
parent compound. FMOs generally catalyse the former reaction that results in the formation
of metabolites with reduced pharmacological and toxicological properties. For instance, the
neurotoxicant, 1-methyl-4-phenyl-1, 2, 3, 6-tetrahydropyridine (MPTP) is readily N-
oxygenated by FMO to the N-oxide, a non-toxic and easily excretable metabolite (Weisman
et al. 1985; Cashman et al. 1986). As with every rule however, there are exceptions. In the
case of certain sulphur-containing compounds such as thiocarbamides, FMOs efficiently
catalyse their bioactivation.
21

Thiourea and N,N-mono or disubstituted thioureas are amongst the best substrates for
FMOs (Poulsen et al. 1979; Henderson et al. 2004a; Onderwater et al. 2004; Onderwater et
al. 2006). Initial work by Poulsen and Zeigler using phenylthiourea (Poulsen et al. 1979),
demonstrated that FMOs catalyse a two-step, sequential oxidation of thiocarbamides to
generate the sulphinic acid via a sulphenic acid intermediate (Fig 1.2). The sulphenic acids
of thiocarbamide compounds are strong electrophiles that are highly susceptible to reduction
by thiol-containing molecules, such as glutathione (GSH). The net effect of the non-
enzymatic reduction of sulphenic acid by GSH results in the formation of oxidised GSH
(GSH disulphide, GSSG) and regeneration of the parent thiocarbamide (Fig. 1.3A). In the
presence of glutathione reductase, a futile cycle is established whereby the formation of
sulphenic acid by the action of FMO is concomitantly linked to the reaction of glutathione
reductase to regenerate GSH in its reduced form (Fig. 1.3A and B). Both enzymatic
pathways are powered by the oxidation of NADPH to NADP+.
The glutathione status within a cell (i.e. the disulfide:thiol ratio), if disturbed, can
affect the activity of numerous enzymes and thus can alter normal cellular function (reviewed
elsewhere by Kosower et al. 1978). An increased ratio of GSSG:GSH is an indication of
oxidative stress and triggers cellular pathways to correct it (reviewed by Kosower et al.
1978). Studies with rat hepatocytes have determined two mechanisms by which the liver may
attempt to correct this redox imbalance. When the amount of GSSG exceeds that of GSH in a
cell, reductases catalyse the reduction of the oxidised form at the expense of NADPH
oxidation, but when the rate of GSH oxidation exceeds that of GSSG reduction, excess GSSG
is excreted in bile. Livers of rats perfused with thiourea or phenylthiourea led to the efflux
of GSSG (but not GSH) in the bile of such animals confirming this hypothesis (Krieter et al.
1984). N-benzylimidazole a potent CYP inhibitor, had no effect on the
22
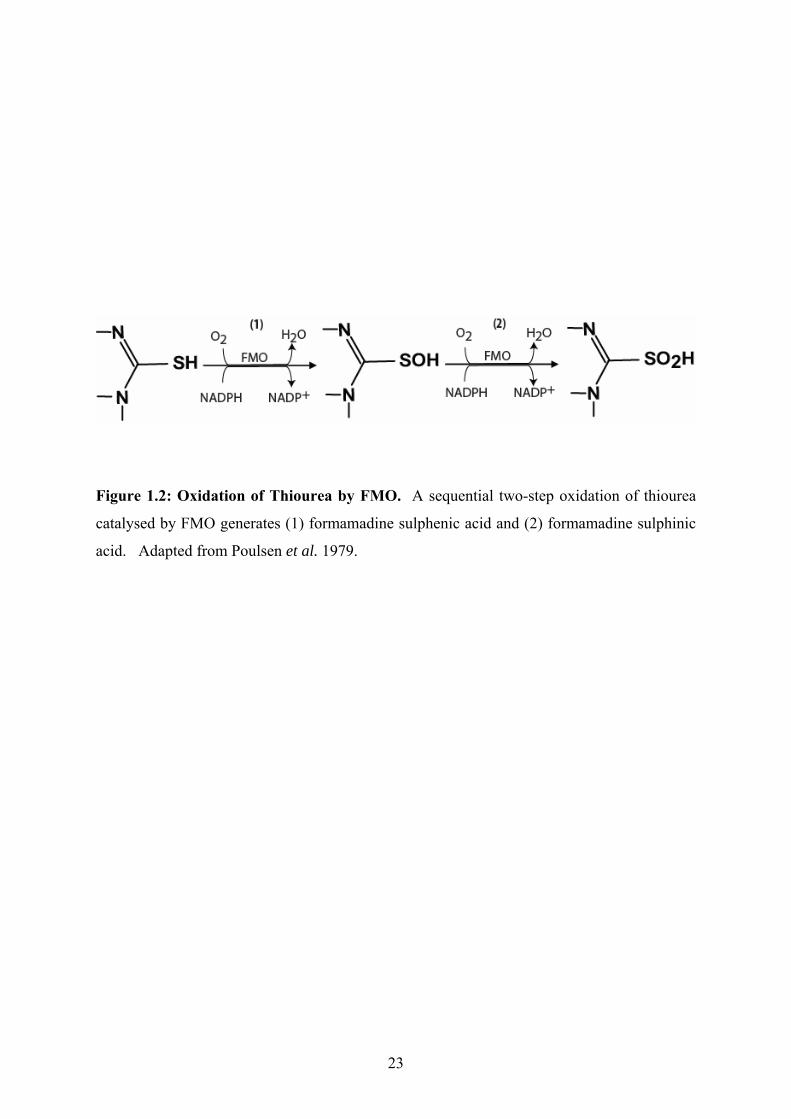
Figure 1.2: Oxidation of Thiourea by FMO. A sequential two-step oxidation of thiourea
catalysed by FMO generates (1) formamadine sulphenic acid and (2) formamadine sulphinic
acid. Adapted from Poulsen et al. 1979.
23

Figure 1.3: Interaction of Glutathione (GSH) with FMO-generated metabolites of
Thiocarbamide S-oxygenation.
(A) Non-enzymatic reduction of formamidine sulphenic acid to the parent thiocarbamide by
GSH and the formation of GSH disulfide. (B) Enzymatic regeneration of GSH by the
oxidation of NADPH. (C) Non-enzymatic reaction of formamadine sulphenic acid and GSH.
24
amount of GSSG excreted in bile and thus indicated that this monooxygenase was not
involved in the bioactivation reaction. The contribution of hydroperoxidase and glutathione
peroxidase in the bioactivation process was not determined to be significant as selenium-
deficient mice excreted similar amounts of GSSG in bile when compared to mice
supplemented with selenium (Krieter et al. 1984). Lack of GSSG efflux in bile after
administration of mice with the corresponding nitrogen analogue of thiourea and
phenylthiourea (i.e. urea and phenylurea) was consistent with a model in which a reactive
sulphur-containing derivative of the thiocarbamide was responsible for the toxicity. Given
the substrate specificity of FMO and the formation of sulphenic acid species by this enzyme
led to a FMO-dependent pathway being implicated in the bioactivation of thiourea and
phenylthiourea in the liver of rats (Krieter et al. 1984).
In addition to the exhaustion of GSH in the redox cycling of sulphenic acids,
depletion of NADPH as a result of the uncontrolled oxidation reactions may lead to the
depletion of glycogen. NADPH is largely maintained from the dehydrogenation of glucose-
6-phosphate, a process that occurs as part of the pentose phosphate pathway. Since glucose-
6-phosphate is derived from glycogenolysis, the need to regenerate NADPH from NADP+
results in the depletion of glycogen (Krieter et al. 1984). In the liver, thiocarbamide
bioactivation and GSH:GSSG imbalance may directly contribute to glycogen depletion as
glycogenolysis is also stimulated by elevated GSSG levels (Sies et al. 1978). This has been
defined as the basis of glycogen depletion observed in liver of rats perfused with
thiocarbamides (Krieter et al. 1984).
The reactive SO- moiety of sulphenic acids can attack the thiol group of GSH directly,
generating a glutathione-sulphenate adduct and thus further depleting the concentration of
GSH in a cell (Giri et al. 1970; Krieter et al. 1984) (Fig. 1.3C).
25
Other than the thiol-group in glutathione, sulphenic acid metabolites can react with
thiol-containing molecules such as cysteine residues in proteins thus perturbing protein
function (Decker et al. 1992).
The sulphenic acid metabolite of thiourea is implicated in forming DNA adducts
(Ziegler-Skylakakis et al. 1998). Furthermore the sulphinic acid of thiourea has been
demonstrated to initiate DNA repair synthesis, form DNA adducts and cause the formation of
micronuclei in cultured rat hepatocytes (Ziegler-Skylakakis et al. 1998). A micronuclei test
is used to assess DNA damage induced by a compound. Micronuclei form when a
chromosome or fragment of a chromosome fails to incorporate into daughter nuclei at the
time of cell division.
1.3 Human FMOs
In humans, five FMO genes are known to encode protein (FMO1-5) (Phillips et al. 1995).
FMOs 1, 2 3 and 4 are found in a cluster with FMO6, a putative pseudogene, at 1q23-4
(Shephard et al. 1993; Hernandez et al. 2004). FMO5 is located further away from this
cluster at 1q21 (McCombie et al. 1996). A second cluster on chromosome 1 contains five
FMO pseudogenes, FMO7P-FMO11P, which are located within a cluster ~4Mb to the
centromeric side of the functional FMO gene cluster (Hernandez et al. 2004).
FMOs 1-5 exhibit 50-59% amino acid identity across mammalian species including
humans (Lawton et al. 1994). A primary sequence alignment of the five functionally active
human FMOs is given in Figure 1.4 and illustrates the highly conserved motifs identified in
all mammalian FMOs. Two GXGXXG motifs, known to be important in the binding of the
26
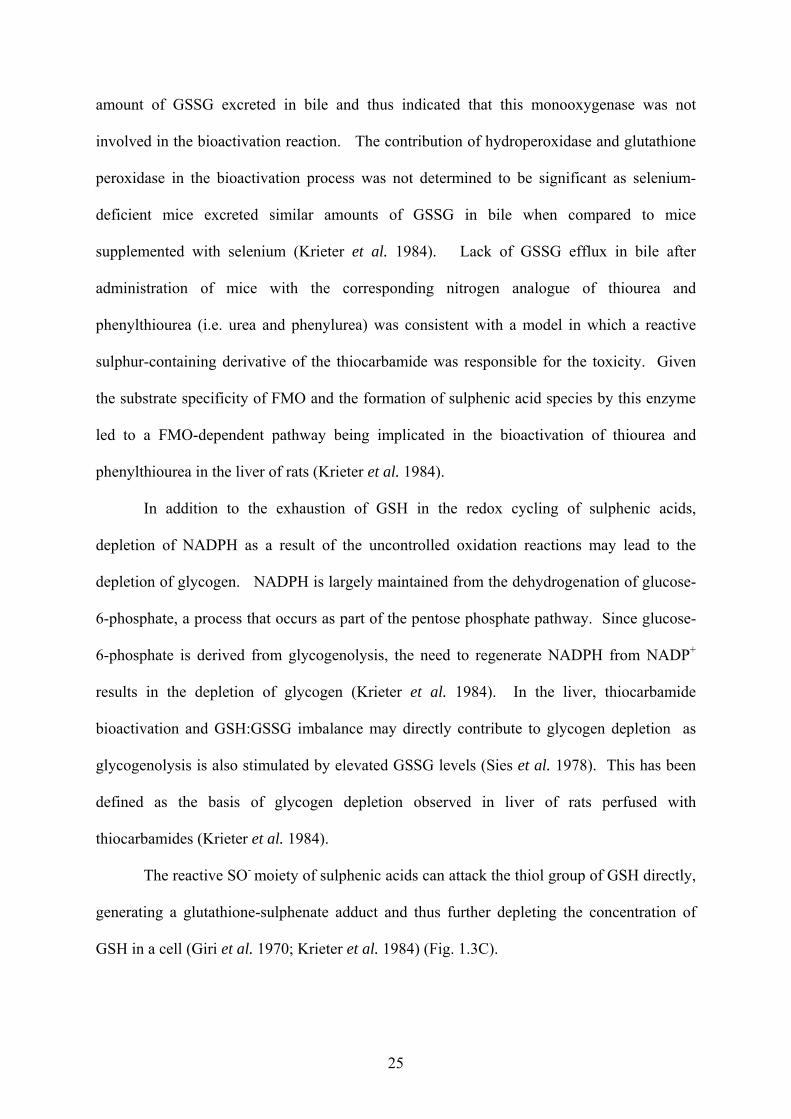
Figure 1.4: A primary sequence alignment of the five functional FMOs in humans. The
primary sequence of FMOs 1-5 are aligned. An asterix denotes conserved identical residues,
a colon indicates conserved similar residues, and a dot indicates highly similar residues. The
‘GXGXXG’ FAD and NADPH binding moieties are boxed in red along with the FMO
characteristic ‘FATGY’ motif boxed in blue. Primary sequences were aligned using the
ClustalW2 tool available at http://www.ebi.ac.uk/Tools/clustalw2/index.html.
27

Adenine dinuceotide phosphate (ADP) moiety in FAD and NADPH are present at positions
(residues 9-14 and 191-196, respectively) within human FMOs (Fig. 1.4) and other examined
mammalian FMOs. The FAD-binding site is contained within a highly conserved motif that
predicts a βαβ secondary structure, a Rossman fold, known to be important in binding
dinucleotides (Wierenga et al. 1986). In addition to this motif, an FMO characteristic motif
‘FATGY’ has been identified and is present at identical positions within the human FMOs
(Fig.1.4) and is thought to play a role in N-oxidation.
1.3.1 FMO1
FMO1, purified from porcine liver microsomes, was the first FMO to be isolated from
porcine liver microsomes and was named as a mixed function amine oxidase (Ziegler et al.
1971) (see section 1.2.1). A cDNA corresponding to the human FMO1 protein was
identified in 1991 (Dolphin et al. 1991) and was formally named as FMO1 in 1994 (Lawton
et al. 1994). The human gene encodes a polypeptide of 532 amino acid residues that has a
molecular weight of 60,603 Daltons.
FMO1 is highly expressed in the liver of most adult mammals such as pig, rabbit, rat,
dog and mouse (Gasser et al. 1990; Lawton et al. 1990; Cherrington et al. 1998; Lattard et al.
2002; Stevens et al. 2003) but the gene is not expressed in the liver of adult human. Neither
the mRNA (Phillips et al. 1995; Dolphin et al. 1996) nor protein (Yeung et al. 2000;
Koukouritaki et al. 2002) of FMO1 is detected in the adult liver. The lack of FMO1
expression in the adult human liver is thought to be due to the insertion of several long
interspersed nuclear elements (LINEs), just upstream of the proximal promoter P0 (Shephard
et al. 2007), which influence the expression in the adult, but not in the foetal liver. FMO1 is
expressed in foetal liver of humans (Dolphin et al. 1991; Phillips et al. 1995; Dolphin et al.
28
1996; Yeung et al. 2000; Koukouritaki et al. 2002), but its expression is switched off in a
mechanism linked tightly to birth but not gestational age (Koukouritaki et al. 2002). The
repression is likely to be due to increased methylation, around the time of birth, of the
proximal promoter P0 due to the close presence of LINE elements (Shephard et al. 2007)
FMO1 expression is abundant in the adult human kidney, and the gene is also, to a
lesser extent, expressed in the small intestine (Yeung et al. 2000), stomach and endocrine
organs such as the thymus, testis, pancreas, adrenal cortex and thyroid (Hernandez et al.
2004). FMO1 is also detected in the foetal kidney, but unlike in the liver, expression in this
tissue increases after birth (Dolphin et al. 1991; Phillips et al. 1995; Dolphin et al. 1996;
Yeung et al. 2000; Krause et al. 2003). The continued expression of the gene in adult tissues
such as the kidney is due to the use of tissue-specific, alternative, downstream promoters
(Shephard et al. 2007).
Levels of expression of FMO1 in the kidney (47 ± 9 pmol/mg microsomal protein)
(Yeung et al. 2000) are not much lower than that observed in the liver for the major hepatic
CYP isoform, CYP3A4 (96 ± 51 pmol/mg microsomal protein) (Shimada et al. 1994). In
kidney, the amount of FMO1 is greater than that of total CYP expression and thus is likely to
be an important contributor to renal xenobiotic metabolism.
FMO1, among all the FMO isoforms has the broadest substrate specificity. This is an
attribute of the size and dimension of the access channel through which a substrate gains
entry to the active site. The access channel in human FMO1 is estimated to be 5 Å in
diameter and the active site containing FAD-OOH is at least 5 Å below the surface of the
channel (Kim et al. 2000). This is the theorised basis by which FMO1 can oxygenate
substrates as small as thiourea with the same efficiency as it metabolises large and bulky
compounds such as tricyclic tertiary amines (Fig. 1.5). A wide range of xenobiotics and
foreign compounds are among its substrates including therapeutic drugs, pesticides and
29

endogenous compounds. A list of all known substrates of human FMO1 that are of
therapeutic importance has been listed in Tables 1.1 and 1.2.
1.3.1.1 Inter-Individual Differences in Expression of Human FMO1: Consequences for
Drug Metabolism
Human FMO1 is the most conserved gene amongst the FMOs within the gene cluster located
on 1q23-4. In a recent study, four non-synonymous single nucleotide polymorphisms (SNPs)
were identified in the protein coding region of FMO1 in African-American subjects (Furnes
et al. 2003). The genetic substitutions (and subsequent amino acid substitution) were
observed to be g.9614C>G (H97Q), g.23970A>G (I303V), g.23971T>C (I303T) and
g.27362C>T (R502X) and were estimated to occur at a relatively low frequency of 1-2% in
this population (Furnes et al. 2003). Functional studies with heterologously expressed
protein variants indicated a moderate but distinct substrate-specific difference towards typical
FMO1 substrates including the hyperthyroidism drug, methimazole, the anti-depressant drug
imipramine and the pesticide agent fenthion. An interesting finding was that the truncated
variant, R502X was capable of oxidising imipramine and fenthion but was inactive towards
methimazole.
Recently, studies have reported inter-individual differences in levels of protein
expression of human FMO1 in the kidney (Yeung et al. 2000; Koukouritaki et al. 2002;
Krause et al. 2003). As FMOs are generally not inducible by environmental factors, it is
plausible to assign such inter-individual differences to genetic variability within promoter and
regulatory sequences within the gene that ultimately lead to different amount of protein being
produced. A single nucleotide substitution, g.-9,536C>A (FMO1*6) was identified in the
upstream region of exon 0 that happens to be within a Yin Yang 1 (YY1) binding site
sequence (Hines et al. 2003). The YY1 site also overlaps binding sequences of other
30
Thiourea Phenylthiourea
Alpha-naphthylthiourea
Chlorpromazine Imipramine Orphenadrine
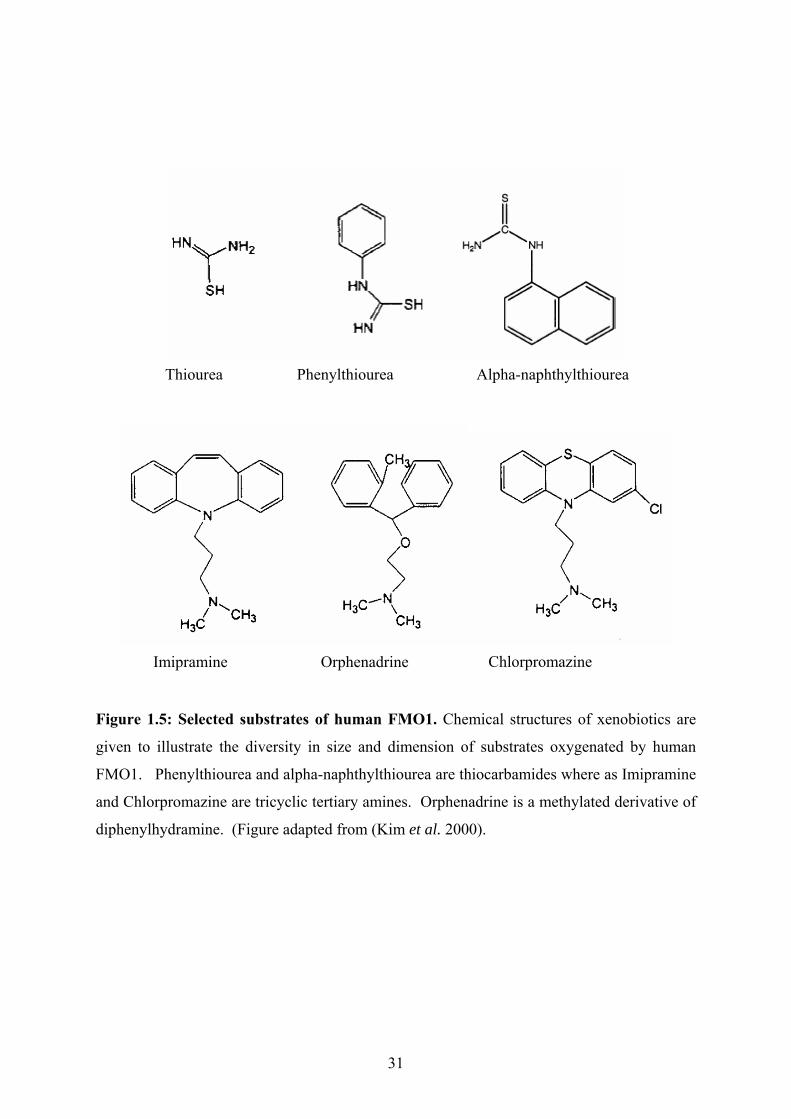
Figure 1.5: Selected substrates of human FMO1. Chemical structures of xenobiotics are
given to illustrate the diversity in size and dimension of substrates oxygenated by human
FMO1. Phenylthiourea and alpha-naphthylthiourea are thiocarbamides where as Imipramine
and Chlorpromazine are tricyclic tertiary amines. Orphenadrine is a methylated derivative of
diphenylhydramine. (Figure adapted from (Kim et al. 2000).
31
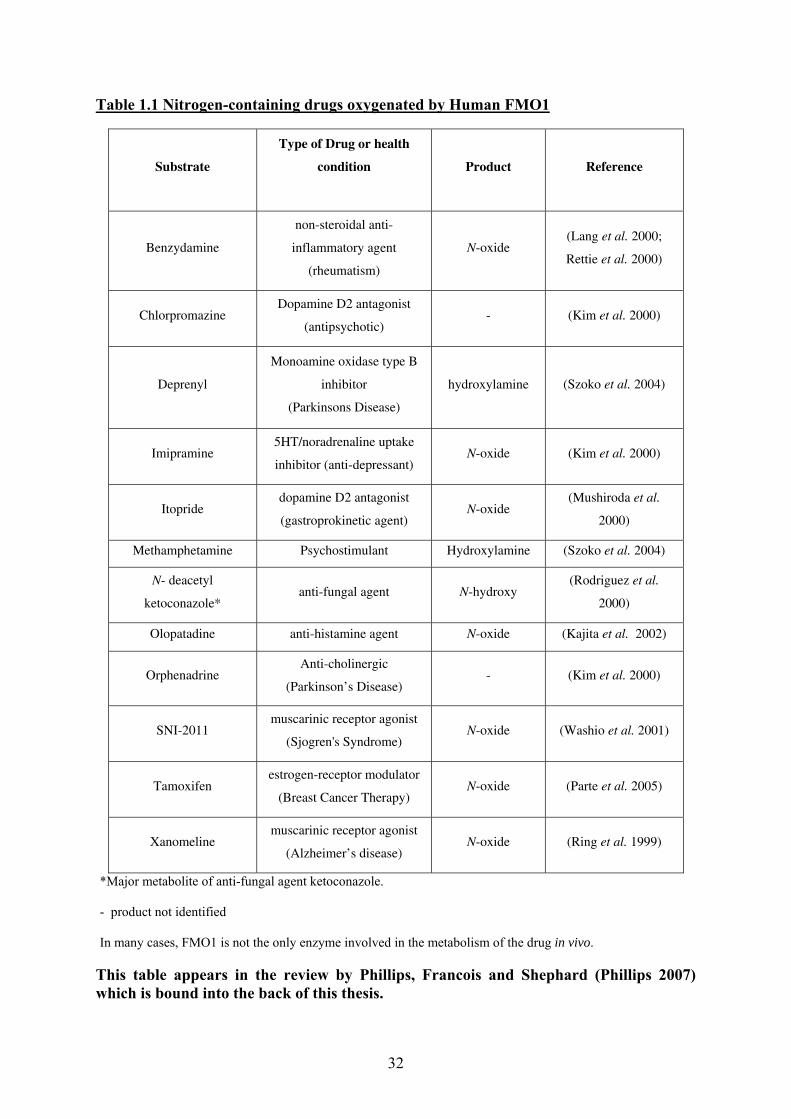
Table 1.1 Nitrogen-containing drugs oxygenated by Human FMO1
Substrate
Type of Drug or health
condition
Product Reference
Benzydamine
non-steroidal anti-
inflammatory agent
(rheumatism)
N-oxide (Lang et al. 2000;
Rettie et al. 2000)
Chlorpromazine Dopamine D2 antagonist
(antipsychotic) - (Kim et al. 2000)
Deprenyl
Monoamine oxidase type B
inhibitor
(Parkinsons Disease)
hydroxylamine (Szoko et al. 2004)
Imipramine 5HT/noradrenaline uptake
inhibitor (anti-depressant) N-oxide (Kim et al. 2000)
Itopride dopamine D2 antagonist
(gastroprokinetic agent) N-oxide
(Mushiroda et al.
2000)
Methamphetamine Psychostimulant Hydroxylamine (Szoko et al. 2004)
N- deacetyl
ketoconazole* anti-fungal agent N-hydroxy
(Rodriguez et al.
2000)
Olopatadine anti-histamine agent N-oxide (Kajita et al. 2002)
Orphenadrine Anti-cholinergic
(Parkinson’s Disease) - (Kim et al. 2000)
SNI-2011 muscarinic receptor agonist
(Sjogren's Syndrome) N-oxide (Washio et al. 2001)
Tamoxifen estrogen-receptor modulator
(Breast Cancer Therapy) N-oxide (Parte et al. 2005)
Xanomeline muscarinic receptor agonist
(Alzheimer’s disease) N-oxide (Ring et al. 1999)
*Major metabolite of anti-fungal agent ketoconazole.
- product not identified
In many cases, FMO1 is not the only enzyme involved in the metabolism of the drug in vivo.
This table appears in the review by Phillips, Francois and Shephard (Phillips 2007) which is bound into the back of this thesis.
32

Table 1.2: Suphur-containing drugs oxygenated by Human FMO1
Substrate Type of Drug or health condition
Product Reference
Ethionamide
Antibiotic (tuberculosis)
S-oxide/sulphinic acid
(Henderson et al. 2008)
Methimazole Thyroperoxidase inhibitor
(hyperthyroidism)
S-oxide (Furnes et al. 2004)
S – methyl esonarimod*
cytokine production inhibitor
(rheumatism)
S-oxide (Ohmi et al. 2003)
Tazorotenic acid**
Retinoic acid receptor modulator
(acne/psoriasis)
S-oxide (Attar et al. 2003)
Thiacetazone
Antibiotic (tuberculosis)
Sulphinic acid/carbodiimide
(Qian et al. 2006)
*active metabolite of parent compound esonarimod.
** active metabolite of parent compound tazarotene.
In some cases FMO1 is not the only enzyme involved in the metabolism of the drug in vivo.
This table appears in the review by Phillips, Francois and Shephard (Phillips 2007)
which is bound into the back of this thesis.
33

transcription factors, mainly Oct1 and HNF1 (Hines et al. 2003). YY1 is a transcription
factor which is known to negatively regulate FMO1 expression in rabbit (Luo et al. 2001).
Transcriptional reporter assays with human FMO1 gene constructs however suggest YY1 to
be a positive regulator of FMO1 expression, but only in the presence of other yet to be
identified upstream regulators. In humans therefore, it is suggested that the disruption of the
consensus YY1 binding site as a result of the g.-9,536C>A mutation results in the
downregulation of transcription of FMO1. This finding has been postulated as the basis of
inter-individual difference in FMO1 expression levels observed in adult kidney (Hines et al.
2003). Analysis of the frequency of the variant allele, FMO1*6 was not found to be
statistically different among African Americans or Northern European-Americans but was
found to be prevalent in Hispanic Americans at a significantly higher frequency of 26.9%
(Hines et al. 2003). A significantly higher amount of FMO1 in kidney obtained from African
individuals than Caucasians has been reported. However, it is noteworthy that the
comparison made in this study may not be appropriate as kidney biopsies were used for
African sample analysis while samples from cadavers were analysed for all Caucasians
(Krause et al. 2003).
The genetic variations observed in FMO1 may have consequences for the ability of
individuals to metabolise therapeutic drugs and other xenobiotics that are substrates for this
enzyme. For example, Fmo1 (-/-) mice administered with the anti-depressant drug
imipramine, display exaggerated pharmacological behavioural responses including tremors
and body spasms and increased amounts of parent drug in the plasma and kidney (Hernandez
et al. 2009). Conversely, higher levels of FMO1 in the kidney may be associated with
increased renal toxicity as a result of bioactivation of xenobiotics containing sulphur
moieties.
34
1.3.2 FMO2
In 1984, direct evidence of the existence of multiple forms of FMO was obtained when an
enzyme from rabbit lung was purified. The ‘lung’ FMO was distinctly different from the
‘liver’ FMO (now known as FMO1) in that it had restricted substrate specificity related to
steric properties, greater thermal stability and displayed a higher pH optimum for enzyme
activity (Williams et al. 1984; Williams et al. 1985; Nagata et al. 1990; Williams et al. 1990;
Venkatesh et al. 1992). This enzyme is now know as FMO2.
FMO2 is highly expressed in the lung of mammals including rabbits (Williams et al.
1984; Tynes et al. 1985; Williams et al. 1985; Lawton et al. 1990; Williams et al. 1990),
guinea pig (Nikbakht et al. 1992), mouse (Karoly et al. 2001), and rhesus macaque (Yueh et
al. 1997). FMO2 expression in rabbit has been estimated to represent 10% of total lung
protein (Williams et al. 1984; Tynes et al. 1985). The mRNA of FMO2 is the most
abundant amongst the isoforms in human lung (Zhang et al. 2006) but efforts to isolate and
purify the protein from this tissue proved unsuccessful (Whetstine et al. 2000).
Genotypic analysis revealed that the FMO2 gene, in humans has ethnic-specific
variation in its base sequence (Dolphin et al. 1998; Whetstine et al. 2000). All Europeans
and Asians genotyped to date possess the FMO2*2 allele in which a C>T substitution at
position 1414 bp (in the cDNA) replaces a glutamine amino acid residue at position 472 with
a premature stop codon in the polypeptide (Q472X) (Fig. 1.6) (Dolphin et al. 1998). This
position corresponds to g.23238C>T (Q472X) of the gene. A proportion of individuals of
African descent however, possess an FMO2 gene that encodes a full-length protein (Dolphin
et al. 1998). This allele is called FMO2*1. The truncated protein, FMO2.2, when compared
with FMO2 from rabbit, guinea pig and rhesus macaque lacks 64 amino residues from its
carboxy terminus. Analysis of the product of heterologously expressed FMO2.2 cDNA
revealed that the truncated protein is catalytically inactive (Dolphin et al. 1998). In the
35

Figure 1.6: The Nonsense Mutation in Human FMO2 is absent in Other Mammalian
Species: (A) The codon at position 1414 bp (relative to the A of the ATG translation
initiation codon) in the ancestral gene of human FMO2*1 and mouse and rhesus macaque
FMO2 is given in blue. The corresponding codon in human FMO2*2 is boxed in red and the
position of the nucleotide base substitution is marked with an arrow. (B) Horizontal bars
represent the polypeptide chains encoded by genes given in part (A). N and C denote the
amino- and carboxy- termini respectively. Alternative grey and white boxes indicate regions
encoded by exons 1-9.
36

human lung, the truncated protein is thought to be rapidly degraded because of incorrect
folding (Dolphin 1998) and this probably explains why attempts to purify FMO2 from human
lung had been unsuccessful (Whetstine et al. 2000). In contrast, when the full-length
FMO2.1 protein is expressed in a heterologous system it is catalytically active (Dolphin et al.
1998).
A recent study in which 1800 people, of recent African descent from sub-Saharan
Africa were genotyped, up to 50% of individuals were found to possess at least one copy of
the ancestral allele FMO2*1 (Veeramah et al. 2008). Individuals with one or two FMO2*1
alleles are thus expected to express the full-length and catalytically functional protein
(FMO2.1) in the lung (Dolphin et al. 1998; Krueger et al. 2002; Veeramah et al. 2008) (Fig.
1.6). The ancestral allele occurs at relatively low frequency in North Africa and its
distribution in sub-Saharan Africa differs significantly within this region (Fig. 1.7). The
FMO2*1 allele has also been observed in 5-7 % of Hispanics of African decent (Whetstine et
al. 2000).
The nonsense mutation g.23238C>T (Q472X) is not present in non-human
primates such as the chimpanzee (Pan troglodytes) and the gorilla (Gorilla gorilla) and must
have therefore arisen in the human lineage some time after the divergence of the Homo and
Pan clades took place some 6 million years ago (Brunet et al. 2002).
The full length human FMO2 protein contains 535 amino acid residues and has a
molecular weight of 60, 920 Daltons. Analysis of microsomes prepared from a lung sample
obtained from a single individual heterozygous for the FMO2*1 allele detected the
expression of FMO2.1 protein in this tissue. The microsomal sample was capable of S-
oxygenating methimazole with a similar catalytic efficiency as that observed for
heterologously expressed human FMO2.1 (Dolphin et al. 1998; Krueger et al. 2002).
37
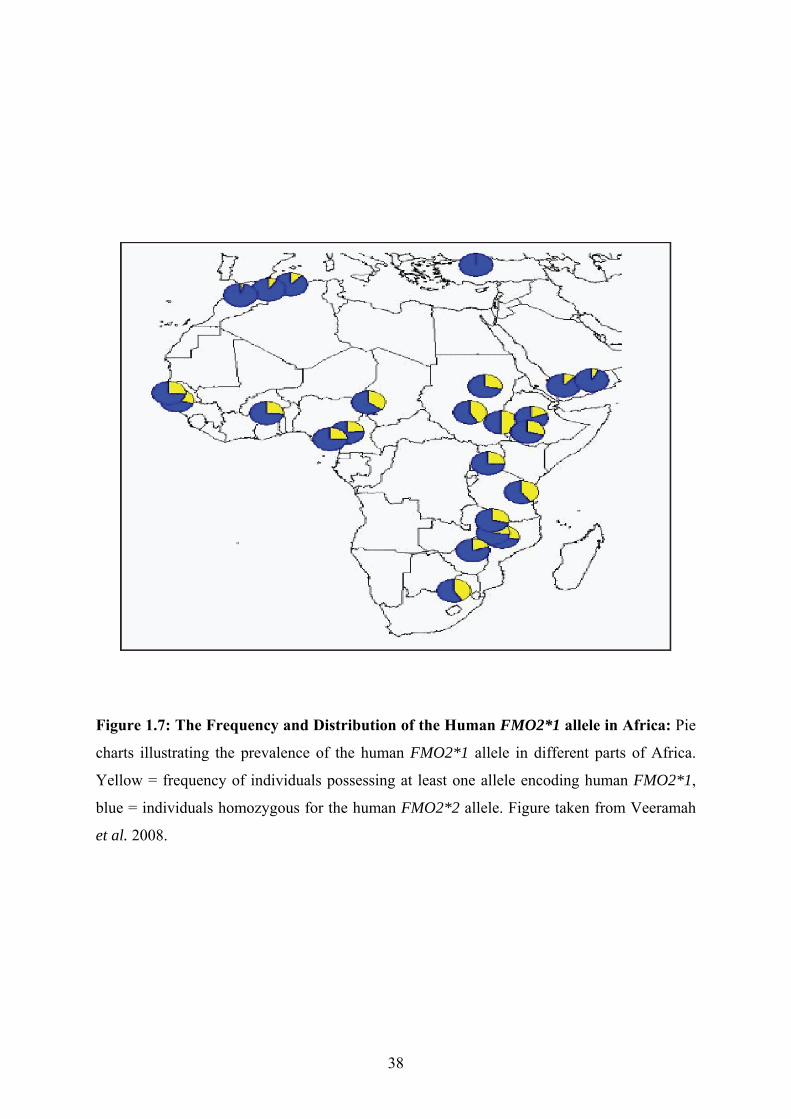
Figure 1.7: The Frequency and Distribution of the Human FMO2*1 allele in Africa: Pie
charts illustrating the prevalence of the human FMO2*1 allele in different parts of Africa.
Yellow = frequency of individuals possessing at least one allele encoding human FMO2*1,
blue = individuals homozygous for the human FMO2*2 allele. Figure taken from Veeramah
et al. 2008.
38
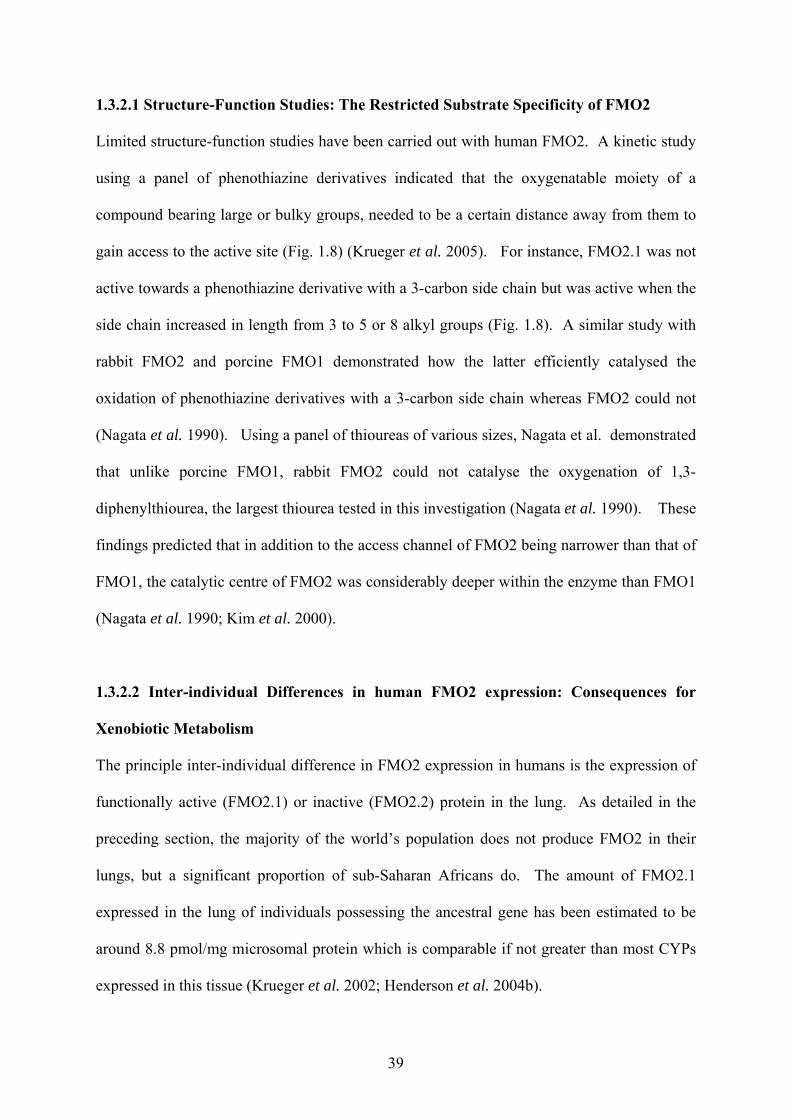
1.3.2.1 Structure-Function Studies: The Restricted Substrate Specificity of FMO2
Limited structure-function studies have been carried out with human FMO2. A kinetic study
using a panel of phenothiazine derivatives indicated that the oxygenatable moiety of a
compound bearing large or bulky groups, needed to be a certain distance away from them to
gain access to the active site (Fig. 1.8) (Krueger et al. 2005). For instance, FMO2.1 was not
active towards a phenothiazine derivative with a 3-carbon side chain but was active when the
side chain increased in length from 3 to 5 or 8 alkyl groups (Fig. 1.8). A similar study with
rabbit FMO2 and porcine FMO1 demonstrated how the latter efficiently catalysed the
oxidation of phenothiazine derivatives with a 3-carbon side chain whereas FMO2 could not
(Nagata et al. 1990). Using a panel of thioureas of various sizes, Nagata et al. demonstrated
that unlike porcine FMO1, rabbit FMO2 could not catalyse the oxygenation of 1,3-
diphenylthiourea, the largest thiourea tested in this investigation (Nagata et al. 1990). These
findings predicted that in addition to the access channel of FMO2 being narrower than that of
FMO1, the catalytic centre of FMO2 was considerably deeper within the enzyme than FMO1
(Nagata et al. 1990; Kim et al. 2000).
1.3.2.2 Inter-individual Differences in human FMO2 expression: Consequences for
Xenobiotic Metabolism
The principle inter-individual difference in FMO2 expression in humans is the expression of
functionally active (FMO2.1) or inactive (FMO2.2) protein in the lung. As detailed in the
preceding section, the majority of the world’s population does not produce FMO2 in their
lungs, but a significant proportion of sub-Saharan Africans do. The amount of FMO2.1
expressed in the lung of individuals possessing the ancestral gene has been estimated to be
around 8.8 pmol/mg microsomal protein which is comparable if not greater than most CYPs
expressed in this tissue (Krueger et al. 2002; Henderson et al. 2004b).
39
Figure 1.8: Human FMO2.1 substrate specificity towards phenothiazines. Activity of
FMO2.1 towards phenothiazine with tertiary amine substituents of differing lengths. 3PTZ,
5PTZ and 8PTZ represent phenothiazine derivaties with 3, 5 or 8 carbon alkyl side chains
respectively. Adapted and revised from Krueger et al. 2005.
40

It is therefore plausible to assume that individuals expressing FMO2.1 will have altered
metabolism of drugs and xenobiotics in the lungs. This raises an important question of
whether such individuals are more or less predisposed to FMO-dependent toxicity of
xenobiotics, whether the activity of this enzyme will affect the efficacy of a drug or whether
these individuals may be at a genetic advantage with regard to protection from exogenous
toxicants.
To date, limited studies have investigated the contribution of FMO2.1 in drug
metabolism, probably because of the apparent lack of this isoform in human lung. The recent
discovery that a significant proportion of individuals carry the FMO2*1 allele has however
generated interest in the toxicological consequences of xenobiotic metabolism by this
enzyme.
Heterologously expressed human FMO2.1 is capable of catalysing the S-oxygenation
of a wide range of thiourea-containing compounds including phenylthiourea, alpha-
naphthylthiourea and ethylenethiourea (Henderson et al. 2004a). Thiourea containing
compounds are used extensively in industry and to a certain extent are used in household
products. Thiourea is an industrial chemical with a number of uses, it is used extensively in
the manufacture of flame retardant resins and is the main component of liquids used to clean
items made of silver. Recently, the interest in thiourea-containing drugs has risen since the
development of Trovirdine, an N-substituted thiocarbamide as a potent HIV-1 non-
nucleoside, reverse transcriptase inhibitor (Cantrell et al. 1996; Onderwater et al. 2004).
Alpha-naphthylthiourea (ANTU) is used extensively as a rodenticide. The product of the
FMO-mediated oxygenation of thioureas, the sulphinic acid metabolite, is generated via a
sulphenic acid intermediate that is more toxic than the parent compound. As detailed in
section 1.2.4, the intermediate metabolite is capable of redox cycling in the presence of
glutathione and glutathione reductase which is hypothesised to result in oxidative stress.
41
Other than reacting with glutathione, the sulphenic acid metabolite can react with sulphhydrl
groups including cysteine residues of other proteins. This is the mechanism by which the
FMO-dependent S-oxygenation of phenylthiourea (PTU) was shown to inhibit the activity of
CYP1A1 (Onderwater et al. 1999) in rat hepatocytes. In rats, ANTU is toxic to the lungs
causing severe pulmonary edema and vascular injury which has been demonstrated to be
FMO-dependent (Boyd et al. 1976; Lee et al. 1980; Scott 1990). Since ANTU is sold in a
powdered form, inhalation of ANTU particles is likely to be toxic to individuals expressing
FMO2.1 in the lungs.
Recent studies have demonstrated the activity of human FMO2.1 towards pesticides
such as phorate and disulfoton (Henderson et al. 2004b). Phorate and disulfoton are
thioether-containing organophosphate insecticides used extensively in agriculture. They are
broad-spectrum insecticides used to protect crops such as corn, potatoes, cotton and grain,
including wheat. Exposure to these compounds occurs both in occupational settings and to
the public in general. In the occupational setting, the primary route of exposure is inhalation
and dermal, whereas in the general population it is inhalation, diet and dermal (Brokopp et al.
1981). As inhalation is a major route of exposure, extensive pulmonary metabolism of such
compounds is expected. The role of CYPs in organophosphate metabolism is well
documented. As with other organophosphates, CYPs can catalyse the desulphuration to yield
the corresponding oxon, a toxic metabolite and potent inhibitor of acetylcholinesterase
(Kulkarni 1984). CYPs can also catalyse the formation of the S-oxide and further oxidise this
metabolite to generate a sulphone (Kulkarni et al. 1984). In addition to the toxic oxon, the
sulphone metabolite of organophosphate pesticides is also a acetylcholinesterase inhibitor
(Levi et al. 1988). Human FMO2.1-dependent sulphoxidation of phorate and disulfuton
generates the S-oxide, a typical detoxification product and does not catalyse the second
oxidation reaction to the sulphone (Henderson et al. 2004b). With the higher FMO:P450
42

ratio in the lungs and the high catalytic activity displayed by FMO2.1 towards these
compounds, plus the lack of production of toxic oxons and sulphone metabolites (generated
by CYP oxidation), suggests that individuals expressing FMO2.1 in the lung are protected
from bioactivated species of such exogenous compounds. Conversely one may argue that the
extensive formation of the S-oxide by FMO2.1 in the lungs may provide a source for the
CYPs to catalyse the secondary oxidation reaction of this metabolite to give more of the toxic
sulphone species.
With respect to altered drug metabolism in the lung, anti-tubercular drugs are of
particular concern. Thiacetazone and Ethionamide are prodrugs that require metabolic
activation by Mycobacterium tuberculosis to exert an anti-microbial effect (Baulard et al.
2000; DeBarber et al. 2000; Vannelli et al. 2002; Qian et al. 2006; Dover et al. 2007). A
detailed description of these drugs and their activation will be given in section 1.4.2.
Thiacetazone and Ethionamide are thiocarbamide-containing compounds and thus are
expected to be FMO substrates. Human FMO1 and FMO3 are capable of catalysing the S-
oxygenation of thiacetazone to form the sulphinic acid and carbodiimide derivatives of this
drug (Qian et al. 2006). Although an intermediate was not identified, a sulphenic acid
metabolite is postulated to be the precursor of the observed products. In vitro studies have
demonstrated that the metabolites of this reaction lead to the depletion of glutathione and thus
it represents a bioactivation. Whether or not FMO2.1 can catalyse this reaction is still to be
determined and provides the focus of experiments described in this thesis. Given that
tuberculosis is a major problem in a world region where the frequency of the FMO2*1 allele
is considerably high, raises the question of whether individuals given this drug as part of
chemotherapy will be at a greater risk of drug toxicity. It also poses the question of whether
the ‘use’ of thiacetazone by FMO2.1 in the lung may affect drug efficacy. It is tempting to
assume that thiacetazone will be a substrate for FMO2.1 as FMO1 and FMO3 are capable of
43
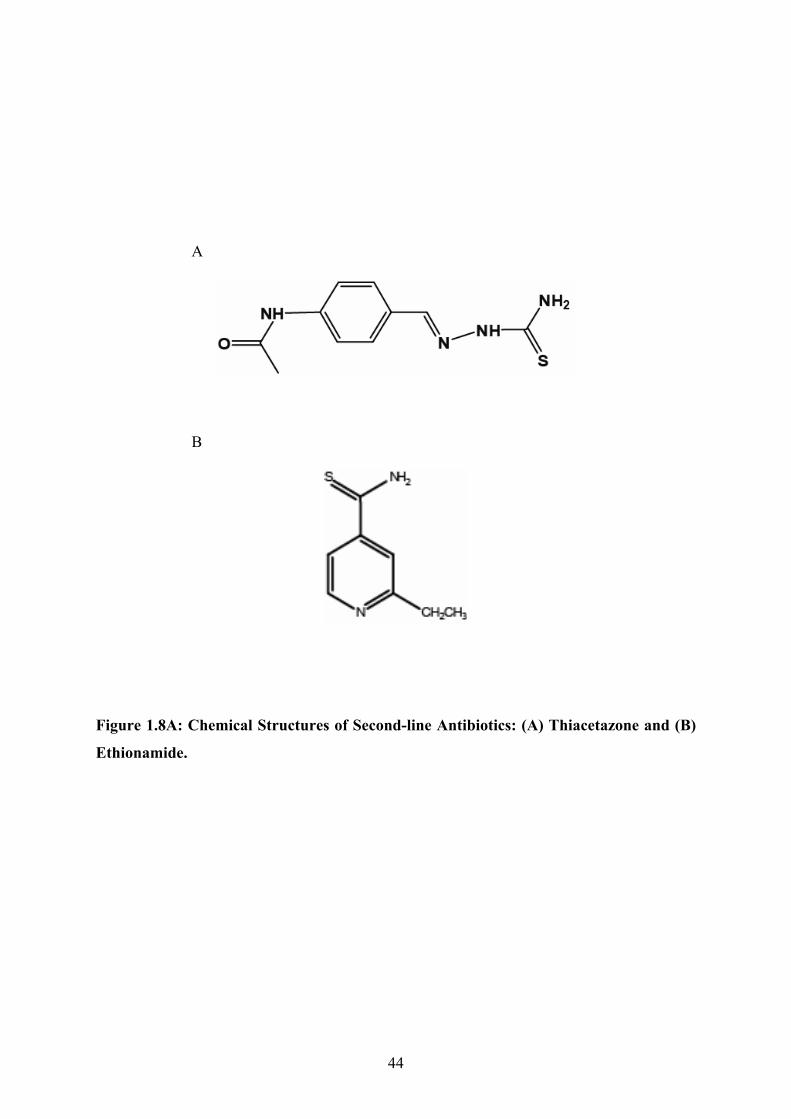
A
B
Figure 1.8A: Chemical Structures of Second-line Antibiotics: (A) Thiacetazone and (B)
Ethionamide.
44

its S-oxygenation, but caution must be exercised when extrapolating substrate specificities
among FMO isoforms. As detailed in the preceding section, FMO2 has the most restricted
substrate specificity when compared to both FMO1 and FMO3. Marked differences in
substrate oxygenation between isoforms is a result of the dimension of the channel that gives
access to the active site of the enzyme and has been described in section 1.3.2.1.
1.3.3 FMO3
A cDNA for human FMO3 was identified in 1992 (Lomri et al. 1992) and it encoded a
polypeptide of 532 amino acid residues with a molecular weight of 60, 047 Daltons.
FMO3 is the major FMO isoform present in the adult human liver (Phillips et al.
1995; Dolphin et al. 1996). FMO3 mRNA has also been detected in the lung, kidney, adrenal
medulla and cortex, pancreas, thyroid, gut and brain (Hernandez et al. 2004). Low levels of
FMO3 are detected in embryonic liver cells but not in the foetus. Currently, the mechanisms
and factors required for the expression of FMO3 in the embryo, silencing through foetal
development and reactivation after birth are not known. After birth the onset of FMO3
expression in the liver occurs in three distinct phases between 3 weeks and 10 months of age,
10 months and 11 years and between 11 and 18 years of age (Koukouritaki et al. 2002).
Unlike the regulation of human FMO1 in the foetal liver which is tightly linked to birth but
irrespective of gestational age, the onset of FMO3 gene expression after birth is less defined.
Birth is necessary but not sufficient for expression of FMO3 in the adult liver and some
individuals show no expression of this protein up until 10 months of age (Koukouritaki et al.
2002).
In terms of substrate specificity, FMO3 is an intermediate between FMO1 and FMO2.
It can metabolise substrates which are excluded from the active site of FMO2 (such as
secondary amines, (Cashman et al. 1999)) but cannot catalyse the oxidation of bulkier
45
compounds such as imipramine which are good substrates for FMO1 (Kim et al. 2000).
Given the relatively broad substrate specificity of this enzyme and its expression in the liver,
FMO3 is considered the most important FMO isoform in hepatic drug metabolism in humans.
Compounds of therapeutic importance metabolised by FMO3 are given in Tables 1.3 and 1.4.
Unlike other FMO isoforms, an endogenous role for FMO3 in humans is established.
The bacterial break-down product of dietary choline in the gut is trimethylamine (TMA), a
compound with an extremely strong, fish-like odour. In the liver, FMO3 catalyses the N-
oxygenation of TMA to its N-oxide, a metabolite with no detectable offensive odour. TMA
N-oxide is excreted from the body via the urine and sweat. Impairment of this detoxification
reaction results in the rare but serious condition of Trimethylaminuria, which will be
described below.
1.3.3.1 Genetic Variants of human FMO3
Human FMO3 is the most polymorphic among the FMO genes with more than 40 SNPs
identified across the entire length of this gene (reviewed elsewhere by Phillips 2007 and
Phillips et al. 2008). These variations, many in the form of single nucleotide substitutions,
may have consequences for the ability of individuals to metabolise therapeutic drugs and
other xenobiotics that are substrates for this enzyme.
1.3.3.2 FMO3 Variants and Trimethylaminurea
Some of the documented SNPs identified in FMO3 are rare (occurring at a frequency of <1%
in a population) and result in the total loss of FMO3 catalytic activity. A list of these
mutations has been given elsewhere (for a review see Phillips 2007). Such polymorphisms
46
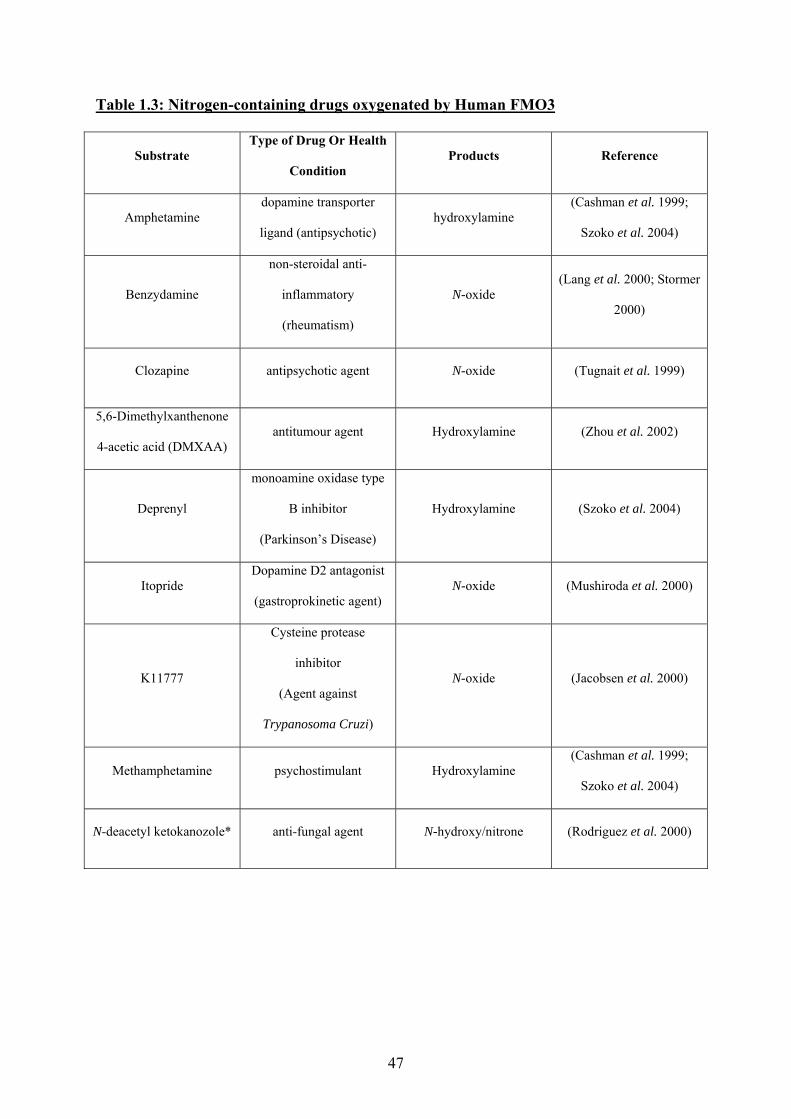
Table 1.3: Nitrogen-containing drugs oxygenated by Human FMO3
Substrate Type of Drug Or Health
Condition Products Reference
Amphetamine dopamine transporter
ligand (antipsychotic) hydroxylamine
(Cashman et al. 1999;
Szoko et al. 2004)
Benzydamine
non-steroidal anti-
inflammatory
(rheumatism)
N-oxide (Lang et al. 2000; Stormer
2000)
Clozapine antipsychotic agent N-oxide (Tugnait et al. 1999)
5,6-Dimethylxanthenone
4-acetic acid (DMXAA) antitumour agent Hydroxylamine (Zhou et al. 2002)
Deprenyl
monoamine oxidase type
B inhibitor
(Parkinson’s Disease)
Hydroxylamine (Szoko et al. 2004)
Itopride Dopamine D2 antagonist
(gastroprokinetic agent) N-oxide (Mushiroda et al. 2000)
K11777
Cysteine protease
inhibitor
(Agent against
Trypanosoma Cruzi)
N-oxide (Jacobsen et al. 2000)
Methamphetamine psychostimulant Hydroxylamine (Cashman et al. 1999;
Szoko et al. 2004)
N-deacetyl ketokanozole* anti-fungal agent N-hydroxy/nitrone (Rodriguez et al. 2000)
47
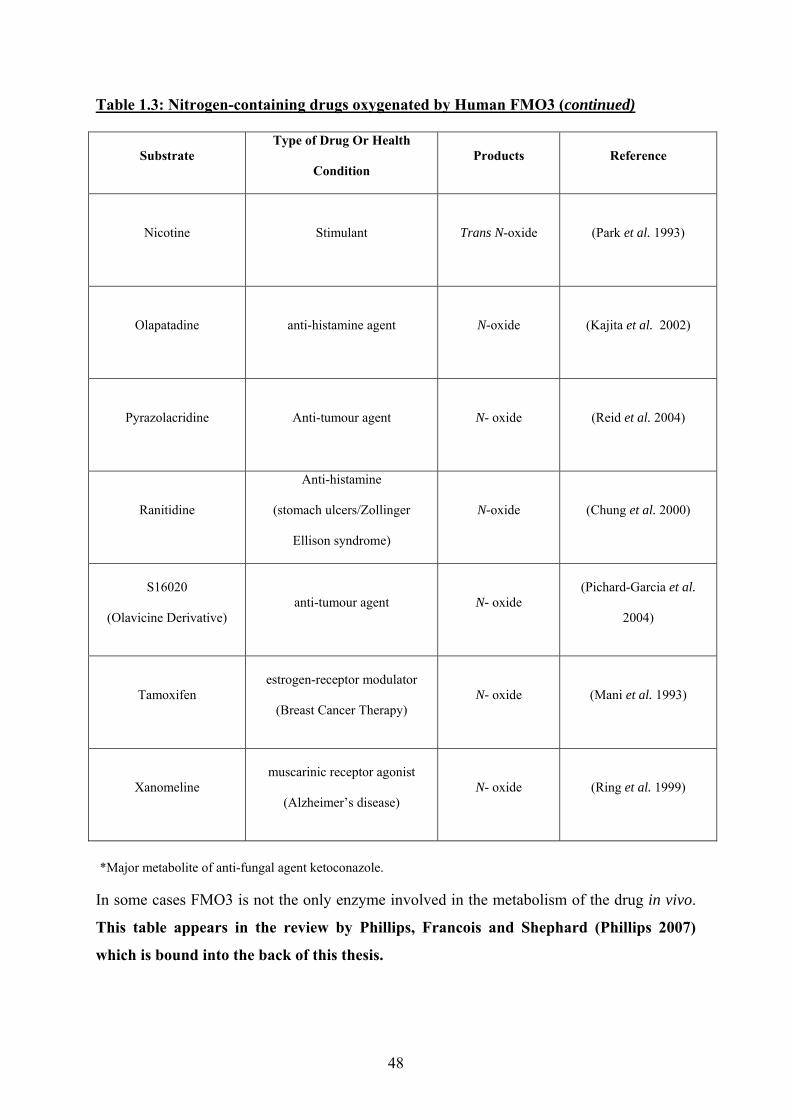
Table 1.3: Nitrogen-containing drugs oxygenated by Human FMO3 (continued)
Substrate Type of Drug Or Health
Condition Products Reference
Nicotine Stimulant Trans N-oxide (Park et al. 1993)
Olapatadine anti-histamine agent N-oxide (Kajita et al. 2002)
Pyrazolacridine Anti-tumour agent N- oxide (Reid et al. 2004)
Ranitidine
Anti-histamine
(stomach ulcers/Zollinger
Ellison syndrome)
N-oxide (Chung et al. 2000)
S16020
(Olavicine Derivative) anti-tumour agent N- oxide
(Pichard-Garcia et al.
2004)
Tamoxifen estrogen-receptor modulator
(Breast Cancer Therapy) N- oxide (Mani et al. 1993)
Xanomeline muscarinic receptor agonist
(Alzheimer’s disease) N- oxide (Ring et al. 1999)
*Major metabolite of anti-fungal agent ketoconazole.
In some cases FMO3 is not the only enzyme involved in the metabolism of the drug in vivo.
This table appears in the review by Phillips, Francois and Shephard (Phillips 2007)
which is bound into the back of this thesis.
48

Table 1.4: Suphur-containing drugs oxygenated by Human FMO3
Substrate Type of Drug Or Health
Condition Products Reference
Ethionamide antibiotic (tuberculosis) S-oxide/sulphinic acid (Henderson et al.
2008)
MK-0767 methyl sulfide
peroxisome proliferator
receptor activator
(diabetic)
S-oxide (Karanam et al. 2004)
Ranitidine
Anti-histamine
(stomach ulcers/Zollinger
Ellison syndrome)
S-oxide (Chung et al. 2000)
S - methyl esonarimod *
cytokine production
inhibitor
(rheumatism)
S-oxide (Ohmi et al. 2003)
Sulindac Sulphide**
Non-steroidal anti-
inflammatory agent
(Colorectal Cancer)
S-oxide (Hamman et al. 2000)
Tazarotenic Acid***
Retinoic acid receptor
modulator
(acne/psoriasis)
S-oxide (Attar et al. 2003)
Thiacetazone antibiotic (tuberculosis) sulphinic acid /carbodiimide (Qian et al. 2006)
*active metabolite of parent compound esonarimod.
** active metabolite of parent compound sulindac.
*** active metabolite of parent compound tazarotene.
In some cases FMO3 is not the only enzyme involved in the metabolism of the drug in vivo.
This table appears in the review by Phillips, Francois and Shephard (Phillips 2007)
which is bound into the back of this thesis.
49
are causative of Trimethylaminuria (TMAU) or ‘Fish-odour syndrome’, a condition in which
individuals have a body odour similar to that of rotten fish. In the absence of functional
FMO3 in the liver, trimethylamine derived from the diet or from the reduction of dietary
precursors such as choline, accumulates within the body and is then excreted in its raw,
odorous form in the bodily fluids. The smell of rotten fish thus emanates from a patient’s
urine, sweat and breath. Affected individuals have >40% unmetabolised TMA in their urine
compared to 0-9% in unaffected individuals (Cashman et al. 2003). More than the
physiological effects, the psychological and social consequences of this condition are
important. Patients affected by this condition generally have trouble integrating into society
because they are often perceived by others as being unhygienic. In some cases individuals
are known to have taken their own lives as a means of escape from their condition (Todd
1979).
The first described clinical report of TMAU was in 1970 (Humbert et al. 1970) but it
is not the first TMAU-like reference on record. Shakespeare’s The Tempest describes a
character, Caliban of which was written:‘‘What have we here? A man or a fish? Dead or
alive? A fish: he smells like a fish; a very ancient and fish-like smell’’ (Man Burrows 1975).
The earliest reference is thought to be in a Hindu folklore, contained in the Indian epic,
Mahabharata dating back to nearly 1400 BC, Satyavata, a young women condemned to
solitary life as a ferry women was cast from society because she smelt of ‘‘rotten fish’’ (New
York Times 2005).
TMAU patients display altered metabolism of therapeutic drugs that are substrates for
FMO3. For instance, the non-steroidal anti-inflammatory drug Benzydamine (BZD) is
metabolised to its N-oxide by FMO3 in the liver and a measure of the BZD N-oxide: BZD
ratio in the serum and urine is considered as an index for FMO3 activity in vivo (Stormer
2000). In a recent study, TMAU patients were administered BZD and monitored for the
50

amount of metabolised and unmetabolised drug in their urine and serum (Mayatepek et al.
2004). The ratio of BZD N-oxide: BZD displayed by TMAU patients was considerably
lower from that observed for control subjects. This study was the first to demonstrate the
effect of FMO3-defiency on drug metabolism. The study did not however, determine the
clinical implications of the altered metabolism of BDZ.
1.3.3.3 Inter-individual Differences and the Impact on Drug Metabolism
During the course of study on the genetic causes of TMAU, numerous SNPs were identified
in FMO3 which affected the catalytic activity of the enzyme but were not causative of
TMAU (Table 1.5). The polymorphisms are relatively common (ranging from 2-50%
depending on the population sampled) and thus are of particular interest as they may alter the
metabolism of therapeutic drugs in the general population. For instance, an individual with a
polymorphism in FMO3 that causes a reduction in oxidation activity (e.g. D132H or E158K)
may be considered a poor or ‘‘slow’’ metaboliser of FMO3 substrates and therefore may have
heightened risk of overdose. Conversely an individual possessing a variant FMO3 with
increased catalytic activity (e.g. L360P) may be considered as a ‘‘rapid’’ metaboliser of a
drug. This may lead to lower efficacy of a drug metabolised by FMO3 and ineffective dose
prescription due to more rapid drug clearance.
The E158K amino acid variant of FMO3 is the product of a G>A substitution at
position g.15167 in exon 4. g.15167 (E158K) is by far the most common polymorphism
occurring at a frequency of 45-50% in African Americans, 42% in Caucasian Americans and
in 19% of Asians (Dolphin et al. 1997; Park et al. 2002; Koukouritaki et al. 2005; Hao et al.
2006; Hao et al. 2007; Koukouritaki et al. 2007). Individuals homozygous for this
polymorphism display similar TMA: TMA N-oxide ratio to individuals with the reference
51

Table 1.5: Polymorphic Variants of FMO3 not causative for TMAU
Variant exon Amino Acid
Change Functional Consequence Reference
g.72G>T 2 E24D Limited (Koukouritaki et al.
2005)
g.11177C>A 3 V58I Reduced (Kubota et al. 2002)
g.15089G>C 4 N61K* reduced or abolished (Koukouritaki et al.
2005)
g.15167G>A 4 N61S S-oxygenation only (Dolphin et al. 2000)
g.15475G>T 5 D132H substrate-dependant decrease (Furnes et al. 2003;
Lattard et al. 2003)
g.15550C>T 5 E158K moderate, substrate-dependent
decrease (Brunelle et al. 1997)
g.18281G>A 6 G180V no effect (Dolphin et al. 1997)
g.18290A>G 6 R205C moderate decrease (Fujieda et al. 2003)
g.21350T>C 7 V257M no effect or limited substrate-
dependent decrease (Treacy et al. 1998)
g.21443A>G 7 M260 n.d. (Shimizu et al. 2007)
g.21599T>C 7 V277A n.d. (Cashman 2002)
g.21604G>C 7 E308G moderate substrate-dependent
decrease
(Treacy et al. 1998;
Lattard et al. 2003)
g.23613G>T 8 L360P increased activity (Furnes et al. 2003;
Lattard et al. 2003)
g.24642G>A 9 E362Q n.d. (Cashman 2002)
g.24691G>C 9 K416N Limited (Koukouritaki et al.
2005)
g.24642G>A 9 I486M n.d. (Cashman 2002)
g.24691G>C 9 G503R n.d. (Furnes et al. 2003)
*Likely to be causative for TMAU. n.d. – Not determined. Coordinates are based on assigning the ‘A’ of the ATG translation initiation codon as +1 This table appears in the review by Phillips, Francois and Shephard (Phillips 2007) which is bound into the back of this thesis.
52
genotype (Zschocke et al. 1999). The finding is indicative of this amino acid variant having a
similar catalytic efficiency to the wild type protein.
g.21443A>G (E308G) is a relatively common polymorphism occurring at a frequency
of 18% in Asians, 20% in Caucasian-Americans and in 5% of African-Americans (Treacy et
al. 1998; Park et al. 2002; Koukouritaki et al. 2005; Hao et al. 2006; Hao et al. 2007;
Koukouritaki et al. 2007). Linkage analysis confirmed g.15167 (E158K) and g.21443A>G
(E308G) polymorphisms to be linked in 4% of individuals from a German population
(Zschocke et al. 2000). In this study, individuals homozygous for both variants in cis (on the
same allele) were reported to display a mild TMAU phenotype, as confirmed from TMA:
TMA N-oxide ratios. Interestingly, individuals who had one E158K or E308G variant allele
and one E158K variant allele showed little difference between urinary metabolic ratio of
TMA: TMA N -oxide (0.0084) and individuals with the reference genotype (0.0056). This
data suggested, for the first time, that the occurrence of E158K and E308G in cis has more
effect on catalytic function than a genotype of E158K or E308G and E158K alone (Zschocke
et al. 2000). Studies with African-American subjects suggested that a haplotype containing
E158K and E308G in cis occurred at a frequency of around 5% (Koukouritaki et al. 2007).
The in vivo consequence of the polymorphism g.21599T>C (L360P) is still to be
determined, but it is the only polymorphic variant to result in an enzyme with higher catalytic
activity (Furnes et al. 2003; Lattard et al. 2003). The polymorphism has been estimated to
occur at a frequency of around 2% in African-Americans and genotypic analysis to date
infers the variant to be specific to this ethnic population.
Inter-individual differences of 10- to 20-fold in the amount of hepatic FMO3 protein
have been reported (Overby et al. 1997; Koukouritaki et al. 2002). FMOs are generally
considered not to be inducible by environmental factors and therefore such variation must be
due to genetic factors. SNPs discovered in the 5’-flanking region of the FMO3 gene are
53

implicated in the observed inter-individual differences in levels of FMO3 protein expression
in the liver. In vitro analysis of such SNPs illustrates their effect on FMO3 transcription, in
some cases effectively silencing it, and in others increasing it as much as 8-fold
(Koukouritaki et al. 2002).
1.3.4 FMO4
FMO4 is 558 amino acid residues long. Other members of the FMO family, with the
exception of FMO2.2, contain between 532 and 535 residues (Phillips et al. 1995).
Sequence comparisons reveal that the additional residues in FMO4 are contained in a single
block located at the C-terminus of the polypeptide (Dolphin et al. 1992). It has been
suggested that the additional amino acid residues may have arisen as a result of a single point
mutation in the termination codon of the ancestral FMO4 gene.
The mRNA of FMO4 is expressed constitutively at low levels in the liver, kidney and
lung of the adult human (Dolphin et al. 1992; Dolphin et al. 2000; Hernandez et al. 2004;
Zhang et al. 2006). The protein encoded by this gene is still to be detected in human tissue.
Evidence of FMO4 contribution to xenobiotic metabolism is limited. In fact, very
little is known of this FMO in general. The probable reason is the difficulty encountered in
expressing this FMO isoform in a heterologous system (Itagaki et al. 1996).
1.3.5 FMO5
A cDNA encoding human FMO5 was isolated in 1995 (Overby et al. 1995; Phillips et al.
1995) and consists of a polypeptide of 533 amino acid residues and of molecular weight 60,
255 Dalton. FMO5 is expressed in many foetal and adult tissues, but in humans its main site
of expression is adult liver although it is not expressed in the same amounts as FMO3
(Janmohamed et al. 2001; Hernandez et al. 2004; Zhang et al. 2006).
54

FMO5 is regarded as the ‘‘black sheep’’ of the FMO family with respect to gene
expression, gene regulation and substrate specificity. Despite this, it is classified as an FMO
because of its sequence similarity to other members of this family.
The FMO5 gene is not part of the FMO gene cluster on human chromosome 1q24.3
but is located ~26Mb closer to the centromere at 1q21.1 (Hernandez et al. 2004). FMO5 is
thought to be the ancestral FMO gene (Hernandez et al. 2004). Currently, FMO5 is the
only human FMO demonstrated to be under hormonal regulation (Miller et al. 1997).
FMO5 shows little or no activity towards classic FMO substrates such as methimazole
(FMO1, FMO2 and FMO3), imipramine (FMO1) and thioureas (FMO1, FMO2 and FMO3)
(Overby et al. 1995; Henderson et al. 2004a; Onderwater et al. 2004; Hernandez et al. 2009)
but efficiently catalyses the N-oxygenation of short chain aliphatic primary amines like n-
octylamine, that are not utilized by other human FMOs. FMO5 is capable of oxidising
thioethers with proximal carboxy groups, like the drug Esonarimod, a reaction not catalysed
by FMO1 or FMO3 (Ohmi et al. 2003).
Sequencing studies performed on human FMO5 from individuals of African-
American descent suggest it is the most conserved isoform of the FMO family (Furnes et al.
2003).
Despite its expression in the adult human liver, FMO5 is not thought to play a
significant role in drug metabolism as a result of its limited substrate specificity. FMO5
may, however be important in an endogenous metabolic pathway, yet to be identified.
55

Table 1.6: Summary of Tissue-specific FMO expression in Man
Human FMO Major site of expression Reference
FMO1 Kidney Koukouritaki et al. 2002
FMO2 Lung* Krueger et al. 2002
FMO3 Liver Phillips et al. 1995, Koukouritaki et al. 2002
FMO4 Not determined -
FMO5 Liver Janmohammed et al. 2001
*Absent in the majority of the human population, see section 1.3.2 for details.
56

1.4 Tuberculosis
Tuberculosis (TB) is an infectious disease caused by the opportunistic bacterium,
Mycobacterium tuberculosis. TB is a severe infection of the lung that can disseminate to
other parts of the body such as the lymph nodes, the spine and the central nervous system.
The symptoms of pulmonary TB include persistent coughing with blood appearing in sputum,
chest pains, weight loss, intermittent fever and night sweats.
1.4.1 Transmission and Pathogenesis
Transmission of the disease occurs when an infected individual expels Mycobacteria in the
form of aerosols in the air when they cough, sneeze, spit or laugh. The bacteria once inhaled
in the lungs of an uninfected person lodge in the distal airways of the alveoli and are engulfed
by alveolar macrophages. At this stage the pathogen has one of several fates. In the
majority (>90%) of cases, Mycobacterium ‘hides’ within macrophages and evades the
primary innate immune response by interfering with intracellular signalling pathways in the
macrophage by mechanisms that are currently poorly understood. The pathogen in this state,
is non-replicating and initiates a latent infection. This sub-clinical, asymptomatic infection
can last for years and in the majority of cases never re-activates. Re-activation or ‘post-
primary’ infection occurs in 5-10 % of individuals and its onset is accelerated in an
immunocompromised host. In the remainder of l0% of cases, Mycobacterium starts to
replicate and the onset of a primary infection develops.
1.4.2 TB Incidence, Prevalence and Mortality
One third of the world’s population is infected with TB. The World Health Organisation
(WHO) Report 2009 estimated 9.2 million new cases of TB worldwide in 2007, of which
31% were in Africa (WHO 2009). Among the 9.2 million cases, 0.5 million were caused by
57
multi-drug resistant strains of Mycobacterium tuberculosis (MDR-TB) and 5 % of the
incident cases were estimated to be HIV-positive. There was an estimated 13.7 million
prevalent cases worldwide in 2007 and this estimate is slightly higher than that reported for
the previous year (13.4 million in 2006). The number of deaths caused by TB in HIV-
negative patients was estimated to be 1.32 million in 2007 and there was an additional 0.48
million TB deaths in HIV-positive cases. In absolute terms, the total number of TB cases is
on the rise and the WHO statistics highlight that TB is still a major global health problem. If
controls are not imposed, an estimated 1 billion people will be infected by 2020, over 125
million will get sick and more than 30 million will die from this disease (Ghiladi et al. 2005).
1.4.3 Genus Mycobacterium and Disease
Mycobacterium is a genus of Actinobacteria given its own family name, Mycobacteriacea.
Several species belonging to this genus are pathogenic and known to cause serious disease in
mammals. Mycobacterium tuberculosis is the primary causative agent of TB in humans.
Other pathogenic species of Mycobacteria have been isolated in man; albeit rare they include
Mycobacterium Microti, Mycobacterium africanum and Mycobacterium canettii (Miltgen et
al. 2002; Cadmus et al. 2009; Frank et al. 2009).
1.4.3.1 Mycobacterium tuberculosis (M.tuberculosis)
M. tuberculosis is an aerobic, non-motile, polytrophic organism that grows in straight or
curved rod-like structures (bacillus). The bacterium has a remarkably slow rate of growth
with a doubling time of around 20-30 hours (cf. E.coli which can divide every 20 mins under
optimum conditions). M. tuberculosis is classified as Gram-positive bacteria as it has one
phospholipid outer membrane. Despite this feature, the bacteria stains weakly upon Gram-
staining and in some cases will not stain at all. The inability to retain Gram stain is because
58
of the presence of a thick, lipid-rich waxy layer that surrounds the cell wall thus preventing
the stain to encounter this barrier. Instead, an acid-fast or Ziehl-Neelsen stain can be
employed to identify M. tuberculosis in bacterial cultures.
The cell wall of M. tuberculosis and species belonging to the Mycobacterium genus in
general have a unique and complex cell wall structure that is considered one of the attributes
of making this organism one of the most successful pathogens of mankind. The cell wall
consists of an inner and outer layer that surrounds the plasma membrane of the organism.
The outer layer compartment consists of lipids and proteins. Linked to the lipid moiety are
polysaccharides including lipoarabinomannan (LAMs), lipomannan and sulpholipids. This
layer is the soluble component of the cell wall and contains receptors that interact with the
host immune system. The inner layer consists of peptidoglycans (PG), arabinogalactan (AG)
and mycolic acids (MA) covalently linked to form a complex known as the MA-AG-PG
complex that extends from the plasma membrane towards the outer layer, starting with PG
and ending with MA. This complex is insoluble and impermeable and is referred to as the
essential core of the cell wall. This component is the target of several antibiotics and will be
described later.
1.4.4 Anti-tuberculosis chemotherapy
There are five main aims of chemotherapy
a. Cure of the patient
b. Prevention of death from active disease or its late effects
c. Avoidance of relapse or re-current disease
d. Prevention of spread of drug-resistant organisms
e. Protection of the community from infection
59

A group of antibiotics have been dubbed the essential drugs for TB chemotherapy. The drugs
are generally prescribed in combination as monotherapy can lead to drug resistance. A two-
tier system is established in TB chemotherapy and consists of first-line and second-line
antibiotics. First-line antibiotics; isoniazid (INH), rifampicin (RIF), pyrazinamide (PZA),
and streptomycin (SM) are predominantly bactericidal in action. Thiacetazone (TAZ),
ethionamide (ETA) and ethambutol (EMB) are second-line antibiotics and are predominantly
bacteriostatic. First-line antibiotics are generally more expensive and display higher drug
efficacy, second-line drugs on the other hand are cheaper but have higher levels of toxicity
and are less effective at treating TB. Among all the current TB drugs, TAZ is the cheapest
antibiotic available. The WHO recommends Directly Observed Therapy (DOTs) that
consists of the following drug regimen for treatment of active TB infection: 6 months therapy
consisting of initial 2 month phase of treatment with four drugs; INH, RIF, PZA and EMB
followed by a continuation phase with INH and RIF for another 4 months (WHO 2009 ). All
of these drugs are expensive and are ineffective in treating TB in areas of high incidence of
multi-drug resistant TB (MDR-TB). In developing countries, the cost of these drugs is too
much to afford and more second-line drugs are substituted for first-line antibiotics. For
instance drug regimens in Sudan, Nigeria, Ghana, Senegal and some parts of South America
administer the following course of treatment: 4 months intensive chemotherapy with INH,
RIF, PZA, EMB followed by 3 months of TAZ and INH (Lawn et al. 1999; Mame Thierno et
al. 2001; Dosumu 2002; Keus et al. 2003). Poverty-stricken areas of Africa and certain parts
of India however can ill afford this relatively cheap combination and thus resort to a
preparation of INH and TAZ (Thiazina) course of treatment which lasts for 18 months,
despite it being less effective and causing potentially life-threatening side effects (Nunn et al.
1992). The side effects of this drug have been presumed to be from the TAZ component of
this preparation (Anonymous 1963; Aquinas 1968; Volek et al. 1970; Hussain et al. 1973;
60

Coetzee 1980; Naraqi et al. 1980; Short 1980; Jaliluddin et al. 1981; Eriki et al. 1991; Fegan
et al. 1991; Kole 1991; Nunn et al. 1991; Ipuge et al. 1995).
INH is the most potent bactericidal antibiotic amongst the essential drugs and is most
effective towards metabolically active and continuously growing bacteria. RIF is a good
bactericidal agent towards growing bacteria but is also effective at targeting semi-dormant
bacteria. Thus RIF is a good sterilising agent that will kill Mycobacteria capable of surviving
the action of INH. PZA, like RIF is a good sterilising agent of Mycobacteria, especially
those that grow in an acidic environment. SM has less bactericidal action but nevertheless is
effective.
It is envisaged that tubercle bacilli in lesions within an infected host consist of sub-
populations that display differences in metabolic status. These are ‘‘(a) those that are
metabolically active, continuously growing bacteria that are killed by the action of INH (but
in the case of INH resistance are killed by RIF and SM), (b) semi-dormant bacteria that
undergo spurts of metabolism which are killed by RIF, (c) those that are of low metabolic
activity and reside in acid pH environment which are killed by PZA and (d) those that are
‘dormant’ which are not killed by any current TB drug’’ (Zhang 2005).
1.4.5 Mechanisms of Drug Action
The action of drugs can be categorised in the following groups, inhibitors of cell wall
synthesis (INH, TAZ, ETA, EMB), inhibitors of nucleic acid synthesis (RIF), inhibitors of
protein synthesis (SM) and drugs that inhibit or deplete membrane energy (PZA). It is
beyond the scope of this report to detail the mechanism of each drug, for a detailed insight
into the mode of drug action/activation see review by (Zhang 2005). A brief description will
be provided here.
61

Inhibitors of Cell Wall Synthesis
Inhibitors of cell wall synthesis target components within the lipid rich inner and outer layer
that surrounds the cell wall, thereby weakening the cell scaffold that is crucial to bacterium
survival. INH is a pro-drug that is activated by M. tuberculosis catalase-peroxidase enzyme,
KatG ((Zhang et al. 1992), Johnson and Schultz 1994) to generate a range of toxic oxygen
species. The active species of this activation, the isonicotinic acyl radical, reacts with NAD
to form an INH-NAD adduct that inhibits the enzyme InhA (Rozwarski et al. 1999). The
enoyl-acyl carrier protein reductase, InhA is part of the Fatty Acid Synthase type II (FAS II)
complex that is responsible for the synthesis and elongation of mycolic acids. The primary
target of INH is thus mycolic acid biosynthesis (Winder et al. 1970). Mutations in KatG and
in InhA confer resistance to INH treatment (Banerjee et al. 1994).
EMB interferes with the production of arabinogalactan, an important polysaccharide
component of the essential core of the cell wall. EMB inhibits the polymerisation of the
arabinin moiety of arabinogalactan and LAMs thus weakening the scaffold of the
mycobacterial cell wall (Zhang 2005). The exact details of EMB action or activation are still
poorly understood but aribinosyl transferase, an enzyme involved in arabinogalactan
synthesis has been postulated as the target of this drug.
ETA and TAZ also target cell wall biosynthesis and this will be described in detail in
section 1.4.6 and 1.4.7 respectively.
Inhibitors of nucleic acid synthesis
RIF is a broad spectrum, rifamycin B derivative that inhibits RNA synthesis in bacteria. RIF
inhibits the synthesis of RNA by binding to the β-subunit of bacterial DNA-dependent RNA
polymerase (DDRP) thus inhibiting the transcription of RNA and subsequent translation to
protein (Zhang 2005). The beta subunit of DDRP is the translational product of the rpoB
62

gene and mutations in a defined 81-bp region of this gene confer RIF resistance (Zhang
2005).
Inhibitors of Protein Synthesis
SM is an aminoglycoside that inhibits translation of bacterial mRNA. It does so by binding to
specific components associated with the bacterial ribosome that is composed of a large (50S)
and a small (30S) subunit. Studies have identified that SM binds to the 16S rRNA
component of 30S and also to the S12 protein that is associated with this complex (Spotts et
al. 1961). 16S rRNA and S12 are encoded by the rrs and rpsl genes respectively and
mutations in these genes are known to cause resistance to SM action (Garvin et al. 1974).
Inhibition and Depletion of Membrane Energy
PZA, a structural analogue of nicotinamide, is a prodrug that requires conversion to its active
form pyrazinoic acid (POA) by the pZase/nicotinamidase enzyme (Scorpio et al. 1996). The
drug has no activity against Mycobacteria growing at normal culture conditions near neutral
pH, but is effective in killing bacilli at lower pH (Tarshis et al. 1953). Acid pH facilitates the
formation of uncharged protonated POA that permeates through the membrane easily, this
results in the accumulation of POA and the decrease in membrane potential in M.
tuberculosis (Zhang et al. 1999; Zhang et al. 2003). Protons flow into the cell and this
subsequently causes the collapse of the proton-motive force and affects membrane transport
(Zhang et al. 2003).
The pZase/nicotinamidase enzyme is encoded by the pncA gene in M. tuberculosis.
Mutations in pncA are considered the major mechanism of resistance to this drug (Scorpio et
al. 1996; Scorpio et al. 1997).
63
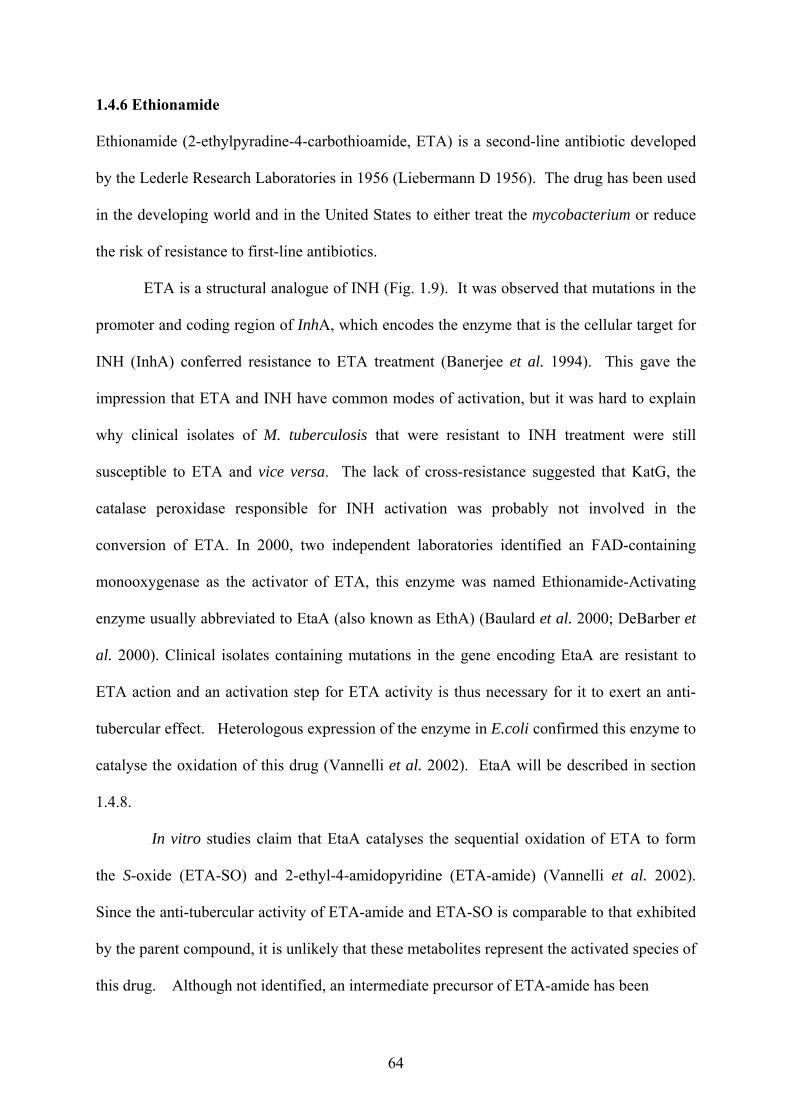
1.4.6 Ethionamide
Ethionamide (2-ethylpyradine-4-carbothioamide, ETA) is a second-line antibiotic developed
by the Lederle Research Laboratories in 1956 (Liebermann D 1956). The drug has been used
in the developing world and in the United States to either treat the mycobacterium or reduce
the risk of resistance to first-line antibiotics.
ETA is a structural analogue of INH (Fig. 1.9). It was observed that mutations in the
promoter and coding region of InhA, which encodes the enzyme that is the cellular target for
INH (InhA) conferred resistance to ETA treatment (Banerjee et al. 1994). This gave the
impression that ETA and INH have common modes of activation, but it was hard to explain
why clinical isolates of M. tuberculosis that were resistant to INH treatment were still
susceptible to ETA and vice versa. The lack of cross-resistance suggested that KatG, the
catalase peroxidase responsible for INH activation was probably not involved in the
conversion of ETA. In 2000, two independent laboratories identified an FAD-containing
monooxygenase as the activator of ETA, this enzyme was named Ethionamide-Activating
enzyme usually abbreviated to EtaA (also known as EthA) (Baulard et al. 2000; DeBarber et
al. 2000). Clinical isolates containing mutations in the gene encoding EtaA are resistant to
ETA action and an activation step for ETA activity is thus necessary for it to exert an anti-
tubercular effect. Heterologous expression of the enzyme in E.coli confirmed this enzyme to
catalyse the oxidation of this drug (Vannelli et al. 2002). EtaA will be described in section
1.4.8.
In vitro studies claim that EtaA catalyses the sequential oxidation of ETA to form
the S-oxide (ETA-SO) and 2-ethyl-4-amidopyridine (ETA-amide) (Vannelli et al. 2002).
Since the anti-tubercular activity of ETA-amide and ETA-SO is comparable to that exhibited
by the parent compound, it is unlikely that these metabolites represent the activated species of
this drug. Although not identified, an intermediate precursor of ETA-amide has been
64

INH ETA Figure 1.9: Chemical Structures of Isoniazid (INH) and Ethionamide (ETA)
65

postulated to be the reactive species of ETA oxidation and is predicted to be a sulphinic acid
metabolite (Vannelli et al. 2002). In an independent study, the in vivo metabolism of ETA in
M.tuberculosis was investigated and in addition to ETA-SO and ETA-amide, the
corresponding nitrile, acid and alcohol derivatives of ETA were observed (DeBarber et al.
2000). Both studies employed extraction methods prior to MS analyses and some argue that
these products may result from spontaneous chemical modification/oxidation rather than an
enzymatic reaction as none of these compounds display anti-microbial activity (Hanoulle et
al. 2006). To establish the product(s) of EtaA catalysed oxidation, one study employed high
resolution magic angle spinning-NMR to determine the metabolism and identify the active
species of this drug in living M.smegmatis (Hanoulle et al. 2006). The study investigated the
metabolism of ETA in the growth medium and within the cells in real time. The study
demonstrated that the concentration of ETA in the growth medium decreased over time and
was coupled to the formation of two metabolites. NMR analysis confirmed these as ETA-SO
and ETA-alcohol. Analysis of the intracellular distribution of this drug however did not
identify ETA, ETA-alcohol or ETA-amide. This suggests that upon activation of ETA, the
products are rapidly expelled from the cell. Furthermore, the accumulation of an aromatic
ETA derivative was observed within the cell and its formation correlated to the loss of ETA
in the growth medium. This metabolite, ETA* is considered to be the active product of EtaA
catalysed oxidation, the nature of this species however, is still to be determined but is
postulated as the sulphinic acid of ETA (Hanoulle et al. 2006). Given that ETA, ETA-SO,
and ETA-alcohol were only observed in the growth medium and that ETA* accumulated over
time within the cell indicates that ETA activation is coupled to a complex molecular sorting
of metabolites and to a selective accumulation of a specific species. (Vannelli et al. 2002;
Hanoulle et al. 2006).
66

Although the active species of ETA is not identified the mode of action of this drug is
established. The cellular target of ETA is the enoyl acyl carrier protein reductase, InhA
(Larsen et al. 2002). This enzyme is involved in the final step of the Fatty Acid Synthase
complex reactions. The actual mechanism by which ETA or its active metabolite inhibit this
enzyme is still to be established.
Given that InhA is the cellular target of ETA, it is reasonable to assume that the drug
will affect lipid metabolism in Mycobacteria. ETA causes the cessation of alpha-, keto and
methoxy-mycolate methyl ester synthesis; these lipids are sub-types of mycolic acids that are
essential components of the Mycobacterium cell wall. Thus impairment in their biogenesis
is likely to weaken the cell scaffold and make Mycobacteria more susceptible to host immune
attacks (Dover et al. 2007). More details regarding the role of mycolic acids will be provided
in the next section.
1.4.7 Thiacetazone
Thiacetazone (p-acetylaminobenzaldehyde thiosemicarbazone, TAZ) is a member of the
thiosemicarbazone family of drugs that were developed in the late 1940s by Farbenfabriken
Bayer in Germany (Behnisch et al. 1950). The therapeutic importance of TAZ was
investigated by Domagk (Domagk 1950) when the drug was used to treat some 10, 000
patients in Germany as a single agent in treatment for TB (Mertens et al. 1950). As was the
norm of the time, these trials were uncontrolled and details referring to drug efficacy,
tolerance and safety were not documented but two American observers concluded that TAZ
appeared to have ‘‘anti-tuberculous activity of the same order of magnitude as p-
aminosalicyclic acid; and a potential toxicity somewhat like the arsenics used to treat
syphilis’’ (Hinshaw et al. 1950; Nunn et al. 1993). The drug has not been used in the United
States or in Europe (outside Germany) because of the discovery of INH and SM, drugs that
67

are far more efficient at treating TB (Nunn et al. 1993). However the combination of high
costs of obtaining first-line antibiotics and the long duration of drug regimens means that
poorer countries can ill afford them. This has led to the use of TAZ as either monotherapy or
in conjunction with other drugs in areas of Africa, India and South America (Narang ;
Anonymous 1963; Fox et al. 1974; Neill et al. 1990; Nunn et al. 1992; Nunn et al. 1993;
Lawn et al. 1999; Mame Thierno et al. 2001).
The main role of TAZ in current drug regimens is to prevent the emergence of
Mycobacteria that are resistant to first line drugs such as INH and RIF. Despite TAZ being a
bacteriostatic drug with poor sterilising activity (Heifets et al. 1990), recent interest in this
drug has arisen since it has not been used in the developed world. This means that M.
tuberculosis strains resistant to drugs prescribed in industrialised countries are likely to be
susceptible to TAZ treatment. For example, a recent report described the treatment of an
individual suffering from chronic TB infection in Japan whose sputum smeared positive for
TB during and after extensive chemotherapy with INH, RIF and PZA (Wada et al. 2007).
Drug susceptibility tests confirmed the individual to suffer from a multi-drug resistant strain
of M. tuberculosis. TAZ was included in the regimen as a ‘last resort’ and after four months
of therapy, the individual’s sputum smeared negative for the first time since the onset of
infection. 3 years after the termination of TAZ therapy in a follow-up, the patient displayed
negative sputum smears and no signs of relapse were observed (Wada et al. 2007). This
finding is valuable as the level of multi-drug resistant M. tuberculosis, i.e. strains resistant to
INH and RIF are on the rise and pose a major obstacle in the successful treatment of this
disease. Furthermore, statistics regarding X-MDR TB, (that is individuals infected with
bacterial strains resistant to INH and RIF and at least three of the six second line drugs)
confirm its rise in industrialised parts of the world (WHO 2009 ). A major problem regarding
68

the progression of TAZ as a mainstay in the developed world however is the level of toxicity
observed in regimens containing this drug.
The first controlled clinical trial of TAZ chemotherapy was conducted in East Africa
in which 51 patients with active TB infections were administered 150 mg of TAZ daily
(Anonymous 1960). During this study, severe skin rashes were observed in about 20% of
patients and a single case of Steven’s Johnson syndrome was reported. Stevens-Johnson
syndrome is a life threatening disease in which cell death causes the epidermis to separate
from the dermis and is usually described as ‘skin falling off’. Since this study, numerous
reports of dermatological reactions including Stevens-Johnson syndrome and Lyell disease,
inflicted by TAZ usage have been documented (Harland 1962; Ferguson et al. 1971; Hussain
et al. 1973; Bedi et al. 1974; Sahi et al. 1974; Purohit et al. 1976; Strobel et al. 1979; Naraqi
et al. 1980; Strobel et al. 1980; Anonymous 1981; Gupta et al. 1983; Mullick et al. 1986;
Fegan et al. 1991; Fegan et al. 1991; Nunn et al. 1991; Chintu et al. 1993; Kelly et al. 1994;
Ipuge et al. 1995; GOTHI 1998 ; Lawn et al. 1999; Dieng et al. 2001; Mame Thierno et al.
2001). Stevens-Johnson syndrome is more common in HIV-positive patients than HIV-
negative patients that take TAZ as part of TB treatment (Colebunders 1989; Colebunders et
al. 1989; Elliott et al. 1990; Elliott et al. 1996) and work in Uganda specifically implicated
TAZ as the responsible drug (Eriki et al. 1991). Therefore TAZ is strongly contraindicated in
patients that are HIV-positive. Reports of adverse skin reactions have been made in smaller
district programmes in India, Kenya, Tanzania and Senegal whereby cutaneous rashes are
reported as common (Shane et al. 1951; Ipuge et al. 1995; GOTHI 1998 ; Mame Thierno et
al. 2001). A common complaint of patients given this drug is of gastrointestinal disturbances
such as nausea and vomiting (Shane et al. 1951; Teklu 1976; GOTHI 1998 ; Mame Thierno
et al. 2001) this is a potential problem with regard to drug compliance as chemotherapy may
last for up to 24 months with this drug. Liver function tests performed, such as thymol
69
turbidity and bromsulphthalein staining on patients prescribed with TAZ, indicate higher
incidence of liver toxicity (Hinshaw et al. 1950; Shane et al. 1951; Anonymous 1963).
Jaundice has also been reported in around 4% of individuals in India given TAZ as
chemotherapy (Narang ; Sharda et al. 1976; Gupta et al. 1977). Jaundice was frequently
reported in patients on TAZ containing regimens in controlled studies conducted in Africa,
Singapore and Hong Kong (Anonymous 1963; Aquinas 1968; Anonymous 1971). These
findings are hard to interpret for two reasons; TAZ is usually administered as a preparation
with INH (Thiazina) or as multi-drug therapy with other first- and second-line antibiotics and
thus it cannot be assumed that TAZ is responsible for inducing hepatotoxicity, secondly
disseminated TB infections of the liver may also lead to hepatic dysfunction. To complicate
the interpretation further, contradictory findings have been reported about the role of INH in
potentiating TAZ-induced toxicity in individuals being given Thiazina or regimens in which
the drugs are prescribed together. One case study of 13 British TB patients reported liver
toxicity and liver damage in individuals prescribed INH and TAZ but not in those prescribed
TAZ as monotherapy (Pines 1964). This would indicate a role of INH in liver toxicity rather
than TAZ. Though uncommon, INH-induced hepatotoxicity has been reported and in part
has been associated to one’s acetylator status (Rubin 1952, Reynolds 1962, Bahrs 1963,
Pande 1996, Huang 2002, Possuelo 2008, Bozok Centintas 2008). A study in Zimbabwe
however, observed hepatotoxicity in patients given TAZ, INH, PZA and SM but not in drug
regimens in which TAZ was omitted, the study also noted that adverse-drug reactions showed
no correlation to INH acetylator status (Neill et al. 1990). Although a role of INH cannot be
ruled out entirely, it is generally accepted that TAZ is the main contributor of liver toxicity
and liver damage (Anonymous 1963; Aquinas 1968; Axton 1971; Sharda et al. 1976; Gupta
et al. 1977; Coetzee 1980).
70

Details regarding the metabolism and potential mechanism of toxicity of TAZ are
poorly documented, probably because the development of this drug before the advent of
clinical trials and drug licensing and also owing to the lack of TAZ used in the United States.
The drug is administered orally in a tablet form and is likely to be well absorbed; hepatic
metabolism is thus expected to be important, though bioavailability data is not available. UV-
spectral and HPLC analysis of human urine and faecal samples suggest that 15-20% of the
drug is excreted unchanged (Ellard et al. 1974; Jenner 1983; Jenner et al. 1984). Spectral
analysis observed p-aminobenzaldehyde thiosemicarbazone and p-acetylaminobenzoic acid
in urine (Ellard et al. 1974) but these metabolites were not identified in later work using
HPLC (Jenner 1983; Jenner et al. 1984). The latter method detected two unidentified
metabolites, although in small quantities in urine (Jenner 1983; Jenner et al. 1984).
The mode of action of TAZ in killing M. tuberculosis has recently been investigated.
TAZ, like other TB drugs is a pro-drug that requires metabolic activation by an enzyme
specific to Mycobacteria. The enzyme necessary (but not sufficient) to activate TAZ is the
bacterial FMO, EtaA (Baulard et al. 2000; DeBarber et al. 2000; Qian et al. 2006; Dover et
al. 2007; Alahari et al. 2009). In the presence of NADPH and molecular oxygen, EtaA
catalyses the oxidation of TAZ to generate two major metabolites; TAZ-sulphinic acid and
TAZ-carbodiimide (Qian et al. 2006). Experiments with chemical oxidants such as H2O2
and the desulphuration agent cuprous chloride (CuCl), demonstrate that TAZ-sulphinic acid
and TAZ-carbodiimide are not products of sequential oxidation, i.e. the carbodiimide is not
formed by desulphuration of the sulphinic acid, but instead both products are formed by
independent enzymatic reactions of TAZ probably through an unidentified intermediate.
Given that sulphinic acids can be generated by the oxidation of sulphenic acids and the fact
that EtaA is a monooxygenase, the authors of this study postulated a TAZ-sulphenic acid
metabolite as the intermediate precursor for both products (Fig. 1.10) (Qian et al. 2006).
71

Figure 1.10: EtaA Catalyses the Two-Step Oxidation of TAZ. Chemical structures of
oxidative products generated by the oxygen- and NADPH-dependant oxidation of TAZ by
EtaA. The structure of the postulated sulphenic acid intermediate is given in brackets (Qian
et al. 2006).
72

Recent work has identified stains of M. bovis that are resistant to TAZ but carry a functional
EtaA (Alahari et al. 2009). This implies that in addition to EtaA, other activators of TAZ are
present. The Mycobacterial methyltransferase Mma4 is necessary in the activation of TAZ,
though currently it is unclear how this enzyme interacts with EtaA and whether the enzymes
share a common target (Alahari et al. 2009). Although the mode of TAZ action has recently
been established, the drug metabolite responsible for inhibiting the growth of M. tuberculosis
is still unknown.
TAZ is an inhibitor of cell wall mycolic acid biogenesis (Alahari et al. 2007; Dover et
al. 2007; Alahari et al. 2009). Mycolic acids are mixtures of alpha, methoxy- and keto-
mycolic acid methyl esters that are branched, long chain fatty acids representing the key
components of the hydrophobic cell wall. These lipids provide several protective features
including resistance to oxidative injury, low permeability to antibiotics and the ability to
persist within the host (Daffe et al. 1998; Dubnau et al. 2000; Glickman et al. 2000).
Synthesis of alpha- and keto-mycolic acid methyl esters occurs through a coordinated
pathway involving oxidation, methylation and cis or trans-cyclopropanation that is catalysed
by cyclopropane mycolic acid synthases (CMASs). In a recent study, the effect of TAZ on
wild type and TAZ-hypersensitive strains of M. bovis were studied to elucidate the
mechanism by which this drug impairs cell wall biogenesis (Dover et al. 2007). TAZ inhibits
the formation of all sub-types of mycolates and results in the accumulation of alpha- and
keto-mycolate precursors. These lipids, when analysed by NMR and MS, lack the
cyclopropane ring moiety and imply that the cellular target of TAZ may be enzymes that
catalyse this step (Alahari et al. 2007). The cellular target of TAZ has thus been identified as
the S-adenosyl methionine (SAM)-dependant methyltransferases, Mma2, Mma4 and PcaA
(Alahari et al. 2007). The actual mechanism by which TAZ or its reactive metabolite inhibits
the function of such enzymes is still unclear. It is noteworthy that although the action of ETA
73

on M. bovis does affect mycolic acid synthesis, it does not lead to the accumulation of
unsaturated mycolates, this implies ETA and TAZ inhibit mycolic acid biogenesis by
different mechanisms. Furthermore, TAZ does not inhibit the function of enzymes involved
in the FAS II synthase pathway i.e. InhA, KasA, KasB, MabA or mtFabH and further
suggests that TAZ and ETA although activated by the same enzyme have different cellular
targets (Dover et al. 2007).
1.4.8 Ethionamide-Activating Enzyme (EtaA): A bacterial FMO
In 2000, two independent studies identified a gene Rv3854c (EtaA) in the M. tuberculosis
genome that encoded a protein responsible for ETA activation (Baulard et al. 2000; DeBarber
et al. 2000). The protein was accordingly named Ethionamide-Activating enzyme and is
usually abbreviated to EtaA or EthA.
Characterisation of EtaA revealed that it was 488 amino acid residues in length and
was membrane associated (Vannelli et al. 2002). UV-spectral analysis of EtaA yielded a
spectrum displaying absorbance maxima at 365 nm and 440 nm suggesting the presence of a
flavin containing prosthetic group (Vannelli et al. 2002). Extraction of the flavin species
identified FAD and not FMN as the prosthetic group in this enzyme. The enzyme
demonstrated dependence on molecular oxygen and NADPH. EtaA is inactive under
anaerobic conditions and NADH can not be substituted for NADPH. The size, prosthetic
group, dependence on oxygen and NADPH and enzyme localisation of EtaA are consistent
with it being a flavin-containing monooxygenase (Vannelli et al. 2002). A primary sequence
alignment of EtaA and human FMO1, 2.1 and 3 is given in Figure 1.11 and demonstrates that
the bacterial enzyme contains the characteristic ‘GXGXXG/A’ consensus sequence that is
important in binding dinucleotides in eukaryotic FMOs. As described in the preceding
section, EtaA catalyses the S-oxidation of TAZ
74

Figure 1.11: A primary sequence alignment of EtaA and human FMOs involved in drug
metabolism. The primary sequence of EtaA and FMO1, 2.1 and 3 are aligned. An asterix
denotes conserved identical residues, a colon indicates conserved similar residues, and a dot
indicates highly similar residues. The ‘GXGXXG/A’ FAD and NADPH binding moieties are
boxed in red. Primary sequences were aligned using the ClustalW2 tool available at
http://www.ebi.ac.uk/Tools/clustalw2/index.html.
75

(Qian et al. 2006). Human FMO1 and FMO3 are also capable of catalysing the two step
oxidation of TAZ to TAZ-sulphinic acid and carbodiimide the same products identified for
EtaA (Qian et al. 2006). This finding suggests that upon administration of TAZ to humans,
oxidation of TAZ by eukaryotic monooxygenases may result in the production of potentially
toxic metabolites and/or the inactivation of the drug leading to reduced drug efficacy. It is
therefore crucial to determine the role of mammalian monooxygenases in the activation of
TAZ and other thiocarbamide drugs and this provides the focus of this investigation.
EtaA is under the transcriptional control of a regulatory protein that is encoded by the
gene, Rv3855. In vitro studies demonstrate that over-expression of Rv3855 generates ETA
resistance. The protein encoded by this gene displays homology to members of the TetR
family of transcriptional repressors and thus is thought to be a negative repressor of EtaA
expression and has been designated as EtaR. Supporting this finding is the observation that
chromosomal inactivation of Rv3855 in M. bovis results in the hyper-sensitivity of
Mycobacteria to ETA and TAZ (Baulard et al. 2000; Dover et al. 2007). Not only do these
findings confirm the regulation of EtaA by EtaR but also confirm EtaA as the enzyme
responsible for activating ETA and TAZ. Clinical isolates resistant to TAZ and ETA are
also resistant to thiocarlide (a second-line antibiotic) treatment. It thus appears that EtaA
may be a common activator for thiocarbamide containing drugs (Dover et al. 2007).
76

1.5 Pharmacogenetics
Pharmacogenetics is the discipline that studies the influence of genetic variation on drug
response. The field has generated recent interest owing to the fact that around 100,000 deaths
occur in the United States every year because of adverse-drug reactions exhibited by patients
on medication (Lazarou 1998; Abbott 2003).
The first observation of genetic variation on drug response was in the 1950s for
suxamethonium chloride, a muscle relaxant administered during general anaesthesia (Kalow
1952; Evans et al. 1953; Kalow 1961 reviewed by Gardiner et al. 2006). Doctors observed
that upon drug administration, some patients remained paralysed for longer than others and
some suffered from life-threatening respiratory arrest (Abbott 2003; Kalow 2004). It was
later established that homozygousity for mutations on the butyrlcholinesterase gene led to
this phenomena (Kalow 1957; Jensen et al. 1995). Cholinesterase is the enzyme that
hydrolyses the drug to an inactive metabolite and in the event when this process is impaired,
the resultant accumulation of succinylcholine results in the prolonged paralysis of muscles
including those that are involved in breathing (Jensen et al. 1995; Yen et al. 2003 and
reviewed by Lee 2009).
Of particular interest to pharmacogenetic studies are families of drug metabolising
enzymes, in particular the cytochrome P450s (CYPs). It is estimated that more than 80% of
serious adverse drug reactions are the consequence of polymorphic variants of CYPs (Abbott
2003). Though it is beyond the scope of this section to describe in detail the polymorphic
nature of CYPs, a few examples of altered drug metabolism by CYP variation will briefly be
described here. For an extensive review see Gardiner et al. 2006.
Codeine, a pain killer commonly given to post-operative patients to manage pain is
ineffective in about 10% of individuals. The drug is oxidised to morphine by CYP2D6, but
in people possessing polymorphic variants of this enzyme, the drug is ineffective and patients
77
do not get any pain relief (reviewed by Lotsch et al. 2009 and Thorn et al. 2009). CYP2D6 is
in fact the most polymorphic of CYP genes and genetic variations result in individuals being
rapid, normal or slow metabolisers of drugs that are substrates for this enzyme (reviewed in
(Gardiner et al. 2006)). Therapeutics metabolised by CYP2D6 for which a pharmacogenetic
link has been established include the anti-hypertensive agent debrisoquine (Tucker et al.
1977; Wolf et al. 1992), the anti-depressant nortriptyline (Dalen et al. 1998; Dalen et al.
2003) and the anti-angina drug perhexilline (reviewed by Ashrafian et al. 2007).
The anti-coagulant Warfarin is metabolised by CYP2C9. Variant alleles that reduce
the enzymes capacity to clear this drug, such as CYP2C9*2 and CYP2C9*2 cause Warfarin
hypersensitivity that can lead to life-threatening bleeding and a higher risk of stroke (Rettie et
al. 1994; Haining et al. 1996). Allelic variants of CYP2C8 have been implicated in altered
oxidation of the mitotic inhibitor paclitaxel (Dai et al. 2001; Bahadur et al. 2002).
The ultimate goal of pharmacogenetic research is a healthcare service that would
consider the genetic profile of a patient so that therapeutics can be tailored to maximise drug
efficacy and minimise adverse drug reactions. No matter how beneficial the concept of
‘personalised medicine’ may sound it is unlikely to happen in the foreseeable future given the
complex nature of drug metabolism that usually involves the inter-play of several enzymes
and not to mention the cost and time involved in mass biochemical and genetic testing. Even
if it is viable in affluent parts of the industrialised world, it may be unethical to broaden the
gap between the rich and poor in terms of healthcare. At this moment, it is feasible to
consider using genomic data to avoid prescribing certain drugs to people that may be
predisposed to an adverse drug reaction. Whether pharmacogenetic information will be used
in such a way is still to be seen. Experiments described in this thesis attempt to elucidate the
basic biochemistry behind the metabolism of anti-tubercular drugs by polymorphic variants
78

of human FMOs, by doing so we try to explain the underlying cause of toxicity that is
exhibited by these drugs in so many TB patients.
79
1.6 AIMS
The aims of this investigation were as follows.
• To establish whether TAZ and ETA were substrates for human FMO2.1 and to
identify the products of this reaction. To compare the products of TAZ oxidation by
human FMO2.1 to those generated by EtaA-, FMO1- and FMO3- catalysed reactions.
To determine the kinetic parameters of the reaction of human FMO2.1 and TAZ
through the development of a spectroscopic assay. To compare the kinetic constants
obtained for FMO2.1 to those of human FMO1, FMO3 and EtaA.
• To determine the catalytic consequences of human FMO3 variation, particularly
focussing on polymorphisms that increase or abolish catalytic activity and those that
are prevalent in Africa. Kinetic performance of FMO3 variants was assessed using
an established enzyme assay for a typical FMO substrate and the novel spectroscopic
assay for TAZ.
• To attempt to understand the relative contribution of FMOs and CYPs to TAZ
metabolism in vitro by using microsomal samples isolated from mouse lung and liver.
Microsomes isolated from wild type and FMO knockout mouse lines were employed
to determine the role of individual FMO isoforms to TAZ metabolism.
• To attempt to gain an understanding of the in vivo metabolism and disposition of TAZ
by FMOs using a mouse model.
80

Chapter 2: Materials and Methods
2.1 Chemicals
81

All chemicals, except tissue culture material, where purchased from Sigma-Aldrich (St.
and, CA, USA) and were of cell culture grade. Plastic ware for cell culture
PLC
C
.2.1 Spodoptera frugiperda, (Sf9) Cells
• SF-900 Serum-Free Media (Media/SFM) (Invitrogen): Stored at 4˚C in the dark.
tored at 4˚C.
l Bovine Serum (FBS), (Invitrogen): Stored at -20˚C and thawed on ice before
ese stocks contained 10% Fetal Bovine Serum (FBS) (Invitrogen). Maintaining
ells in serum has been reported to make cell cultures prone to contamination and also results
Louis, MO, USA) unless stated otherwise. Tissue culture materials were purchased from
vitrogen (CarlsbIn
was purchased from VWR International (West Chester, PA, USA). Materials used for H
and LC-MS were purchased from Fisher Scientific (Hampton, NH, USA) and were of HPL
grade.
2.2 Cell Culture Conditions
2
Solutions:
• Gentamicin, tissue culture grade: S
• Feta
use.
Frozen stocks of Sf9 cells were previously prepared in the laboratory and stored in liquid
nitrogen. Th
c
in higher costs. The cells were therefore adapted to grow in serum-free conditions. Cells
were also adapted to grow in suspension cultures as higher levels of protein expression can be
achieved in this way. A frozen Sf9 cell aliquot was removed from liquid nitrogen and rapidly
thawed by rubbing the tube repeatedly between two hands. As soon as the cells started to
thaw the contents of the tube were poured into a T25 attachment flask (Nunc™ VWR, UK)
containing 5mL of pre-warmed SF-900 serum-free media and 10 µg/mL gentamicin. The
82

cells were allowed to attach to the surface of the flask in a nonhumified incubator (Innova™
4230, New Brunswick Scientific, USA) at 27˚C and were inspected after 1 hour. After 1
hour the cells had attached to the surface, this was observed by viewing the flask under a light
microscope and gently moving the flask from side to side. Cells which have attached remain
stationary whereas unattached cells ‘float’ in the medium. The cells were incubated at 27˚C
until they reached confluence. This took approximately 48 hours. At this point the cells were
seeded. To seed the cells, medium from the flask was removed and replaced with 5mL of
fresh media containing gentamicin. The flask was then firmly hit against the palm of the
hand three times to dislodge cells from the surface. 2.5 mL of culture was transferred into a
new T25 flask containing 2.5 mL of media, gentamicin and 10% FBS. This culture was
maintained in serum and was used as a ‘stock’ while cells where adapted to suspension
cultures. The remainder 2.5 mL of the original culture was transferred into a 125 mL shaking
flask (sterile, disposable Erlenmeyer flask (VWR Intl.), containing 23 mL of SF-900 serum-
free media and 10 µg/mL gentamicin. To start off, cells were shaken at 110 rpm. Cells were
counted every 24 hours to assess cell viability at the rotational speed. If cell death was
apparent then the speed of shaking was reduced by 5 rpm until cells reached a mid-log phase
(2x10⁶ cells/mL). It was found that at this initial stage, slower rates of shaking (<110 rpm)
led to cell death, as did a rate over 115 rpm. If these cell batches reached cell densities of
2x10⁶ cell/mL, they were re-seeded to a density of 8x10⁵cell/mL and shaken at 115 rpm. Cell
batches were monitored in this way until they had adapted to grow at 125 rpm. This speed is
the optimum speed given in the supplier’s instructions (Invitrogen). The cells took a total of
5 weeks to adapt to the new conditions.
Sf9 cells adapted to serum-free and suspension cultures were maintained in SF-900 serum-
free media containing 10 µg/mL gentamicin in suspension cultures. Cells were seeded at a
83

density of 2x10⁶ to 5x10⁵ cell/mL every 2-3 days in 25 mL or 50 mL suspension cultures in
• Dulbecco’s Phosphate - Buffered Saline (D-PBS)
ain
L of D-PBS, 100 µL of Trypan blue
a 1.5mL microfuge tube. 100µL of this sample was
en mounted onto a hemocytometer (VWR, Intl.) and viewed under a light microscope.
) = (Final cell density / No. of viable cells x106) X Final Volume
a batch has <98% viability it is not used for transfection or infection with baculovirus.
were counted every 2-3 days.
sterile 125 mL or 250 mL Erlenmeyer flasks respectively. Cultures were grown in a
nonhumified incubator at 27ºC and at 125 rpm shaking.
2.2.2 Cell Counting and Seeding
Solutions:
• 0.4% (w/v) Trypan Blue St
To count the cells, a 1 in 10 dilution was prepared. 900 µ
stain and 100 µL of cells were mixed in
th
Cells within the grid of the cytometer were counted. In the presence of the stain, viable cells
appear round and have a bright silver–white outline. Dead cells appear blue and usually have
lost their characteristic round shape. Only viable cells (i.e. white and round) are counted. In
this way, the stain allows one to assess the viability of cell cultures. Using equation 1, the
volume of cells required for seeding is calculated and cultures made up to the final volume
(25 mL or 50 mL) with SFM containing gentamicin. Media was incubated at 27˚C for 30
minutes before use.
Equation 1:
Volume of cells (mL
If
Cell batches
84

2.2.3 Culture of Bacteria
Solutions
• Luria-Bertani Agar medium (LB – Agar) (Q-Biogene Inc., USA). Formulation/L: 10g
t Extract B, 10g NaCl, 15g Agar-B. Tablets were dissolved in
ed water and autoclaved.
lution was prepared by weighing out the appropriate
ghing out the appropriate
te
. The solution was allowed to cool until it could be held by the hand comfortably
ut not long enough for the agar to set. At this point the appropriate antibiotics were added
Tryptone – B, 5g Yeas
deionis
• Luria-Bertani Medium (formulation/L: 10g bactotryptone, 5g yeast extract, 5 g NaCl).
Forty tablets were dissolved in 1 L of deionised water and autoclaved.
• Ampicillin: A 50 mg/mL stock so
amount of solid ampicillin and dissolving it in deionised water.
• Tetracycline: A 50 mg/mL stock solution was prepared by weighing out the appropriate
amount of solid tetracycline and dissolving it in ethanol. Aliquots were stored at -20˚C.
• Gentamicin: A 10 mg/mL stock solution was prepared by wei
amount of solid gentamicin and dissolving it in water. Aliquots were stored at -20˚C.
• Kanamycin: A 50 mg/mL stock solution was prepared by weighing out the appropria
amount of solid kanamycin and dissolving it in water. Solution aliquots were stored at -
20˚C.
Forty tablets of LB-Agar were dissolved in 1 litre of deionised water and autoclaved on the
day of use
b
and the solution gently swirled by the wrist. Approximately 30 mL of medium was poured
into 82 mm Petri dishes or till they were half full.
The agar was allowed to set at room temperature. The plates were briefly kept at 37˚C and
then stored at 4˚C.
85

Bacteria was streaked on to plates and incubated at 37˚C overnight. The following
day, a singly colony was picked and inoculated into 5mL of LB-medium containing the
approp
irus Expression system (Invitrogen)
expression of a
ene in insect cells by producing recombinant baculovirus. The system provides a faster
riate antibiotics. Cultures were grown for 6-8 hours or overnight with shaking at a
rotational speed of 250 rpm.
2.3 Bac-to-Bac® Baculov
The Bac-to-Bac® Baculovirus Expression system (Invitrogen) allows high
g
route to recombinant protein expression compared to traditional baculovirus methods as a
homologous recombination event takes place in E.coli rather than in insect cell. The system
uses a pFastBac™ plasmid which encodes an insect cell- specific promoter (i.e. a polyhedrin
promoter) for high expression in insect cells. The main features of the plasmid include
multiple cloning sites to facilitate cloning and an SV40 poly-A sequence to promote
transcription termination and polyadenalation of the mRNA transcript in insect cells. The
plasmid also contains sites to which the bacterial Tn7 transposon (provided by a helper
plasmid) can attach and allow transposition in bacmid DNA (a baculovirus vector). The
presence of a gentamicin resistance gene in pFastBac™ allows for the selection of
recombinant E.coli DH10Bac™ cells (these cells provide the bacmid DNA). Upon
transformation of competent E.coli DH10Bac™ cells with pFastBac™, a homologous
recombination event takes place between the mini-T7 element from the pFastBac™ plasmid
and the mini–attTn7 site in the bacmid. Successful transposition results in the disruption of
the lacZα gene in the bacmid, so E.coli colonies containing recombinant bacmid appear
white and non-recombinants appear blue when grown in the presence of a gratuitous inducer
(Isopropyl-β-D-thiogalactopyranoside) and a chromogenic substrate (i.e. X-Gal).
86

Recombinant bacmid is used to transfect insect cells which will produce budding virus
(baculovirus) harbouring the gene of interest. This virus is used to infect insect cells which
will express the recombinant protein. A schematic diagram outlining the main steps is shown
in Figure 2.1.
2.3.1 Generation of Recombinant Bacmid DNA
uman FMO1 cDNA was previously cloned into pFastBac™ 1 and maintained in E.coli
containing human FMO1 cDNA was
mid DNA
olutions:
iniprep Kit (Qiagen, Hilden,
seA
tralisation Buffer
H
DH5α™ glycerol stocks. Recombinant bacmid
prepared from this stage as follows.
2.3.1.1 Small Scale Isolation of plas
S
The following solutions were obtained from the QIAprep m
Germany):
• P1 – Re-suspension Buffer : 50mM Tris-Cl (pH 8), 10mM EDTA, 100 µg/mL
RNa
• P2 – Lysis Buffer: 200 mM NaOH, 1% (w/v) SDS
• N3 – Neu
• PE - Wash Buffer
87
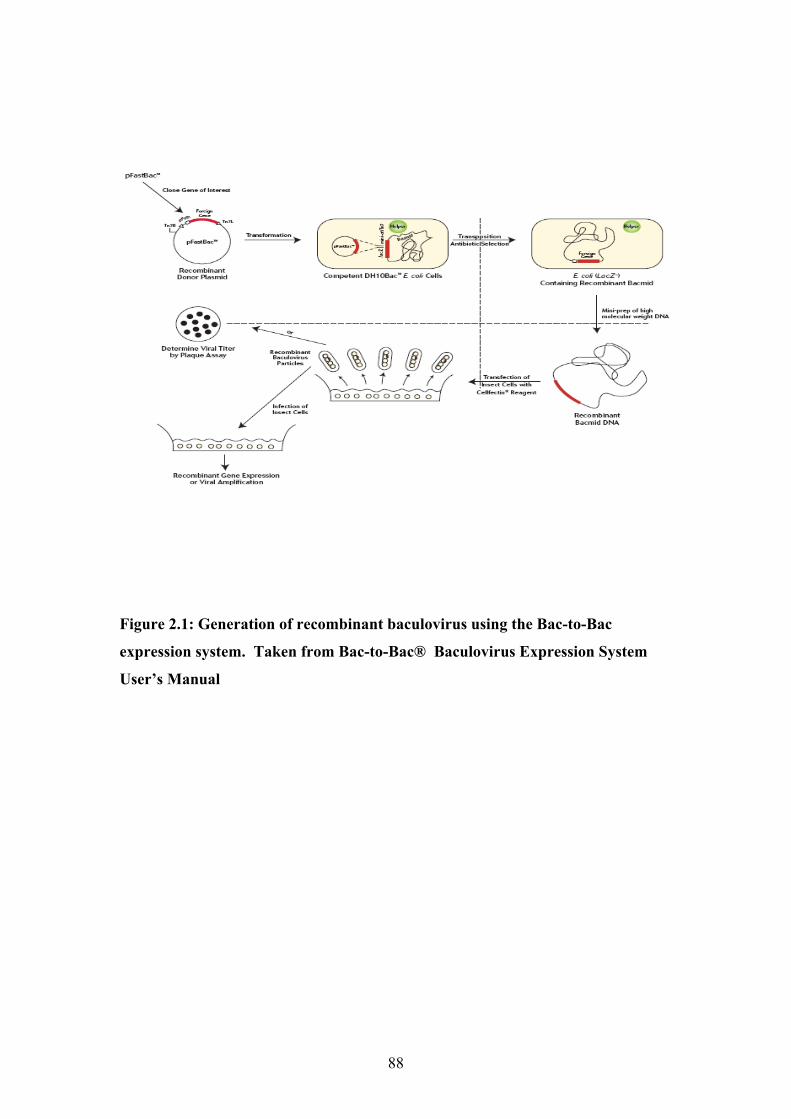
Figure 2.1: Generation of recombinant baculovirus using the Bac-to-Bac
expression system. Taken from Bac-to-Bac® Baculovirus Expression System
User’s Manual
88

LB-agar plates were prepared containing ampicillin at a final concentration of 50
µg/mL as described in section 2.2.3. Glycerol stocks previously prepared in the
laboratory had been stored at -80˚C and it is important that during their use the
glycerol sample does not thaw as the bacteria will die as a result of the rapid
temperature change. An agar plate was streaked with bacteria from the glycerol
stock and incubated at 37˚C overnight. The glycerol stock sample was returned to -
80˚C before it had thawed. The following day, a single colony was picked and used
to inoculate 5 mL of LB-medium containing ampicillin at a final concentration of 50
µg/mL. The culture was grown for 6-8 hours as described in section 2.2.3.
Plasmid DNA was isolated from the bacterial culture using the QIAprep
Miniprep Kit (QIAGEN) and was performed as described in the QIAprep Miniprep
Kit handbook. Briefly, 1.5 mL of bacterial culture in mid-log phase was transferred
into a 1.5 mL microfuge tube and centrifuged for 5 minutes at 13, 000g at 4˚C using a
bench top microcentrifuge (Eppendorf). The following steps were carried out at room
temperature. The bacterial pellet was re-suspended in 250 µL Buffer P1 by pipetting
up and down until no clumps were visible. 250 µL of Buffer P2 was added to the
tube. The solution was mixed by inverting the tube several times and until the
solution had turned a homogenous blue. 350 µL Buffer N3 was added drop wise and
mixed thoroughly by inverting the tube several times to avoid localised precipitation.
This was done until the solution had turned white. The sample was centrifuged at
13,000g for 10 min. The supernatant from this stage was applied to the QIAprep spin
column using a pipette (and avoiding the pellet) and centrifuged (30 s). The flow
through was discarded. The column was washed again using 0.75 mL of Buffer PE
by centrifuging for 30 s and discarding the flow through. The column was
centrifuged again for 1 min at high speed to remove any residue of Buffer PE. The
89
QIAprep column was placed in a fresh 1.5 mL microfuge tube and 50µL of sterile
deionised water added to the centre of the column. The column was allowed to stand
for 1 min and plasmid eluted by centrifugation for 1 min at high speed. Isolated
plasmid DNA was stored at 4˚C until further use.
2.3.1.2 Quantification of Isolated plasmid DNA
Plasmid DNA was quantified using a Nanodrop Spectrophotometer 1000 (Nanodrop).
1µL of deionised water was applied to the platform to calibrate the machine and to
make a ‘blank’ measurement. The platform was wiped clean and 1µL of isolated
plasmid DNA sample was applied to the platform. The absorbance of the samples
was measured at 260 nm.
Presence of the plasmid was confirmed by running the DNA sample on a 1%
(w/v) agarose gel.
2.3.1.3 Agarose Gel Electrophoresis of DNA
Solutions
• 10X Tris-Borate-EDTA Buffer (TBE): 0.89 M Tris-base, 0.09 M Boric acid,
20 mM EDTA (pH 8)
• 6X loading buffer: 0.25% bromophenol blue, 0.25% xylene cyanol, 30% (v/v)
glycerol.
• Ethidium Bromide (EtBr): 10 mg/mL stock solution (Fisher Scientific, UK)
For a 1% (w/v) agarose gel, 1g of agarose was dissolved in 100 mL of 1X TBE by
heating the solution in a microwave oven for 2 min or until the solution was clear.
2µL of Ethidium bromide was added to the solution once it had cooled but before the
90

agarose had started to set. The agarose was poured into a gel mould and an
appropriate comb was positioned into place. The gel was allowed to set for at least 1
hour. Once the gel had set, the gel mould was positioned into an electrophoresis tank
and submerged in 1xTBE. The comb was removed and 10µL of HyperLadder 1
(Bioline Ltd, UK) was loaded into a well as a molecular weight marker. Sample DNA
was mixed with 1X loading dye and loaded into the wells. The gel was run at 100
volts to separate the DNA. After electrophoresis the gel was viewed and
photographed using a UV transilluminator (Syngene, GeneSnap).
2.3.1.4 Transformation of Competent E.coli DH10Bac™ and the Blue-White
Assay
Solutions
• 1M Isopropyl-β-D-thiogalactopyranoside (IPTG) (Invitrogen): prepared fresh on
the day in water and filter-sterilised.
• 2% (w/v) 5-bromo-4-chloro-3-indolyl-beta-D-galactopyranoside (X-Gal) prepared
fresh on the day in dimethyl sulfoxide (DMSO) and stored in the dark.
• SOC Medium provided with MAX Efficiency® DH10Bac™ competent cells
(Invitrogen)
A 50 µL aliquot of competent MAX Efficiency® DH10Bac™ cells (Invitrogen) was
removed from -80ºC and thawed on ice. The cells were transformed with 100 ng of
plasmid by heat shock treatment for 45 s using a water bath set at 42˚C. 900µL of
SOC medium was added to the transformed cells and incubated at 37˚C for four hours
in a shaking water bath. During this time, agar plates containing gentamicin,
tetracycline and kanamicin at a final concentration of 7 µg/mL, 10 µg/mL and 50
91

µg/mL respectively were prepared as described in section 2.2.3. 50 µL X-Gal
(0.02µg) and 10µL IPTG (10µmol) were spread on to these plates and allowed to dry.
Serial dilutions of the transformed cell culture were prepared (10-1, 10-2, 10-3 10-4) and
spread onto the agar plates and incubated for 24 hours at 37˚C. The following day the
plates where transferred to 4˚C for a further 24 hours to enhance the colour of the blue
colonies. Three white colonies and one blue colony were picked and inoculated into 5
mL of LB medium containing 7 µg/mL gentamicin, 10 µg/mL tetracycline and 50
µg/mL kanamycin as described in section 2.2.3. Bacmid DNA was isolated from
these cultures.
2.3.1.5 Isolation of recombinant Bacmid DNA
Solutions:
• Propan-2-ol
• Ethanol (70%, (v/v))
The following solutions were provided with the QIAprep miniprep Kit (Qiagen):
• P1 – Re-suspension Buffer : 50 mM Tris–Cl (pH 8) , 10 mM EDTA, 100
µg/mL RNase A.
• P2 – Lysis Buffer: 200 mM NaOH, (1%) SDS.
• P3 – Neutralisation Buffer: 3M potassium acetate (pH 8).
Human FMO2.1 and FMO3
E.coli DH10Bac™ cells containing recombinant bacmid were previously prepared in
the laboratory and maintained in glycerol stocks. E.coli DH10Bac™ cells containing
either human FMO2.1 or FMO3 cDNA were streaked on to agar plates containing 7
µg/mL gentamicin, 10 µg/mL tetracycline and 50 µg/mL kanamicin and incubated at
92

37ºC overnight as described in section 2.2.3. A single colony was used to inoculate 5
mL of LB medium containing 7 µg/mL gentamicin, 10 µg/mL tetracycline and 50
µg/mL kanamycin overnight at 37ºC with shaking. The following day, recombinant
bacmid was isolated.
Human FMO1, FMO2.1 and FMO3
Bacmid DNA was isolated using the method of alkaline lysis as described by
(Janmohamed et al. 2006). Briefly, 1.5 mL of bacterial culture growing in mid-log
phase in the presence of antibiotics was transferred into a 1.5 mL microfuge tube and
centrifuged at 14,000g for 10 min at 4ºC in a bench top microcentrifuge (Eppendorf,
Germany). The pellet was re-suspended in 300µL Buffer P1 by pipetting up and
down. 300µL of Buffer P2 was added to the tube and mixed by inverting the tube.
The mixture was allowed to stand at room temperature for 5 minutes. Buffer P3 was
slowly added to the tube, mixed gently and centrifuged at 14, 000g for 10 min at room
temperature. The supernatant was transferred into a 2mL microfuge tube and 800µL
of propan-2-ol was added. The tube was inverted several times and placed on ice for
10 min, then centrifuged at 14, 000g at room temperature. The supernatant was
removed and 500µL of 70% (v/v) ethanol was added to the pellet. The tube was
inverted several times to wash the pellet and centrifuged at 14, 000g for 15 min at
room temperature. The supernatant was removed, initially by decanting the liquid and
then using a glass Pasteur pipette to remove all the ethanol, which can reduce
transfection efficiency. The pellet was air dried for 10 min. The DNA was dissolved
in 50µL of sterile deionised water. The tube was gently tapped to dissolve the DNA -
vortexing at this stage would cause the DNA to shear. Bacmid DNA was stored at -
20ºC.
93
2.3.1.6 Polymerase Chain Reaction (PCR) (Standard)
All standard PCR reactions were carried out using a Genius PCR machine (Techne
Ltd., UK).
Solutions
• BIO-X-ACT™ Short DNA Polymerase (4U/ μL) (Bioline Ltd, UK)
• OptiBuffer™ (10x Reaction buffer): 10 mM Tris-Cl (pH8.3), 15 mM MgCl2 ,
500 mM KCl (Bioline Ltd, UK)
• dNTP mix (10 mM) (Bioline Ltd, UK)
• 50 mM Magnesium Chloride (Bioline Ltd, UK)
• Forward and Reverse Primers
PCR consisted of; 10 ng template DNA, 0.2 mM dNTP mix, 1.5 mM MgCl2 and 0.5
μM reverse and forward primers. The reaction volume was made up to 50 µL with
sterile water. Four units of BIO-X-ACT™ Short DNA Polymerase were added to the
reaction. Amplification parameters are shown in Figure 2A for BIO-X-ACT™
polymerase catalysed PCR. The annealing temperature depends on the melting
temperature (Tm) of the primers which are to be used. The Tm and annealing
temperature were calculated using formulae given in Figure 2B. Primer sequences
have been given in Table 1 of Appendix 1. PCR products were electrophoresed on a
1% (w/v) agarose gel and viewed as described in section 2.3.1.3.
94

(A)
PCR Conditions
Initial Denaturation 95 ˚C 2 min 1 Cycle
Denaturation 95 ˚C 30 sec
Annealing 55 ˚C 30 sec 40 Cycles
Extension 72 ˚C 30 sec
Final Extension 72 ˚C 5 min 1 Cycle
(B) Tm = 69.3 + (0.41 x (%G+C)) – 650/length (nt)
Tm1 + Tm2 2
-6 Annealing temperature =
Figure 2.2: (A) General PCR programme for BIO-X-ACT™. (B) Formulae for
determining the Tm and annealing temperatures.
95
Human FMO1
A PCR was carried out to confirm the presence of human FMO1 cDNA insert in the
recombinant bacmid DNA using M13 forward and reverse primers as described
above. M13 sequences are present in the regions flanking the site of pFastBac™ 1
transposition (i.e. the cDNA insert site) in the bacmid.
2.3.1.7 Preparation of Glycerol Stocks
Solution:
• Glycerol.
For long term storage of E.coli transformed with recombinant bacmid DNA, glycerol
stocks were prepared. 1mL of bacterial culture (grown overnight at 37˚C with
shaking) was mixed with 100 µL of glycerol in a 1.5 mL microfuge tube. The
contents were inverted several times to mix the solutions thoroughly and immediately
stored at -80˚C.
2.4 Generation of Recombinant Baculovirus
Solutions:
• SF-900 Serum-Free Media (SFM / media)
• Tissue culture grade gentamicin
• CELLFECTIN® Reagent
Transfection was carried out essentially as described by (Janmohamed et al. 2006).
Briefly, Sf9 cells in mid-log phase (2x10⁶ cell/mL) were seeded at a density of 9x10⁵
cell/mL in 2 mL of media containing gentamicin into a 35-mm dish. It is important
96

that cell cultures with a viability of >98% are used for this stage; otherwise
transfection efficiency is reduced. The cells were allowed to attach to the dish by
incubating the dish at 27ºC for 1 hour. During this time the transfection mixture was
prepared which consists of solution A and B. Solution A: 5µL of miniprep bacmid
DNA and 100 µL SFM without gentamicin. Solution B: 6µL CELLFECTIN®
Reagent (Invitrogen) and 100 µL SFM without gentamicin. The CELLFECTIN®
reagent tube was inverted several times before use as lipids can settle to the bottom of
the tube. Solutions A and B were combined and incubated for 30 min at room
temperature. Media was removed from the attached cells by gently tilting the dish to
one side and pipetting the media away from the dish without touching the surface.
The cells were washed once in the same way with media without gentamicin. Media
(788 µL) without gentamicin was added to the mix of solution A and B to give a final
volume of 1mL. This transfection mixture was gently pipetted over the attached cells.
The dish was placed on a bed of tissues dampened with sterile water in an airtight
container. This humidified container was incubated at 27ºC for 5 h. The transfection
mixture was then removed and replaced with 2 mL of media containing gentamicin.
The cells were incubated for a further 72 h at 27ºC in a fresh humidified box. The
virus (in the supernatant) was harvested by transferring the medium in the dish into a
tube (Falcon) and centrifuged at 100g for 10 min at 4ºC. The virus is present in the
supernatant and was filter-sterilised using a 0.22 micron filter into a fresh tube. The
virus was stored at 4ºC in the dark.
2.4.1 Amplification of Baculovirus
Virus harvested from the transfection stage is of low titre and needs to be amplified.
Virus was amplified as described by (Janmohamed et al. 2006). 50µL of the
97

transfection stage virus was used to infect a 25mL batch of cells which were at a cell
density of 2x10⁶ cell/mL. Cells were infected for 72 hours at 27ºC in shaking. The
cell culture was then transferred into a sterile tube (Falcon) and centrifuged for 10 min
at 4000 rpm at 4ºC. The supernatant represents the amplified high titre virus. The
supernatant was filter-sterilised into a fresh tube and stored at 4˚C in the dark. Insect
cell microsomes were prepared from the cell pellet and analysed for FMO expression.
2.5 Expression & Analysis of Recombinant Protein in Sf9 Cells
2.5.1 Baculovirus Infection of Sf9 cells
The amount of virus required for optimum FMO expression was investigated using a
range of volumes of amplified virus. To begin with, 100, 250 and 500µL of virus
were used to infect 50 mL of insect cell cultures which were at a cell density of 2x10⁶
cell/mL for 72 or 96 hours. Expression and catalytic activity was then analysed from
microsomes prepared from these cells using western blotting and the methimazole
assay.
2.5.2 Insect cell Microsome Preparation
Solution:
• HEPES Buffer: 10 mM HEPES (Sodium salt) (pH 7.4), 0.154 M KCl, 0.1 mM
EDTA (pH 8), 20% (v/v) glycerol.
Microsomes were prepared as described by (Janmohamed et al. 2006) with slight
modification. Sf9 cells were transferred into a tube (50 mL Falcon) and centrifuged at
4000 rpm for 10 min at 4ºC (Eppendorf, Rotor 5810 R). The cell pellet was re-
98

suspended in chilled HEPES buffer (which was three times the volume of the pellet)
by pipetting up and down. The cells were lysed by sonification; three 12 s bursts with
5 s pauses in between each burst were found to cause sufficient cell lysis and
minimum protein degradation. Cells were placed on ice during the sonification
process. The homogenate was centrifuged at 1000g for 10 min at 4ºC. The
supernatant obtained from the previous step was transferred into pre-chilled
ultracentrifuge tubes and centrifuged at 50,000 rpm for 1 h at 4ºC in a Beckman
Coulter Optima Max Ultracentrifuge (Fullerton, CA, USA) (rotor TLA-110K). The
pellet was re-suspended in chilled HEPES buffer using a glass hand held homogeniser
on ice to give a total protein concentration of around 5 µg/µL and the total protein
concentration was determined by the assay of Lowry (see next section). The
microsomes were aliquoted into 500µL samples in 1.5mL microfuge tubes to avoid
freeze-thawing large volumes as this leads to loss of activity. Samples were
immediately stored at -80ºC.
2.5.3 Determination of Total Protein Concentration
Protein concentration was determined by the assay of Lowry (Lowry et al. 1951)
using the Bio-Rad DC Protein Assay Kit (Bio-Rad Laboratories, Inc., Hercules, CA,
USA).
Solutions:
• Bovine Serum Albumin (BSA) (Bio-Rad) : Pre-weighed BSA was dissolved
in 20 mL of sterile deionised water and gave a total concentration of 1.47
mg/mL
The following solutions were obtained from Bio-Rad DC Protein Assay Kit
• Reagent A
99
• Reagent B
The assay was carried out as described in the Bio-Rad Protein Assay Kit hand book
with slight modification. Briefly, 6 BSA standard concentrations ranging from 0 –
147 mg/mL were prepared in HEPES buffer. 2µL and 5µL of experimental protein
sample were dissolved in HEPES buffer to give a final volume of 100µL. Each assay
was carried out in duplicate. 0.5 mL of Solution A was added to each standard and
sample tube. These were mixed by vortexing and 4 mL of solution B was then added
to each tube and the samples mixed immediately (by vortexing). The tubes were
allowed to stand for 20 min. 1 mL of each standard and sample were transferred into
plastic cuvettes and their absorbance was measured at 595 nm using a GeneQuant
spectrophotometer. The spectrophotometer deduced the protein concentration of
standards and sample and this was recorded.
2.5.4 Sodium Dodecyl Sulphate Polyacrylamide Gel Electrophoresis (SDS-
PAGE) Analysis
Solutions:
• Protogel Solution: 30% (w/v) acrylamide, 0.8% (w/v) bisacrylamide (National
Diagnostics).
• 10% (w/v) Ammonium persulfate (APS): The appropriate amount of solid
APS was weighed out and dissolved in deionised water on the day of use.
• Resolving buffer: 1.5 M Tris-HCl (pH 8.4), 0.4% (w/v) SDS. pH adjusted
with HCl.
• Stacking buffer: 0.5 M Tris-HCl (pH 6.8), 0.4% (w/v) SDS. pH adjusted with
HCl.
• TEMED (Bio-Rad).
100

• NuPAGE LDS Loading Dye (Invitrogen).
• SDS Running Buffer: 0.025 M Tris-base, 0.192 M Glycine, 01% (w/v) SDS
prepared on the day of use.
• β-Mercaptoethanol.
• Coomassie Blue Stain: 0.1% (w/v) Coomassie Brilliant Blue Dye, 40% (v/v)
methanol, 10% Acetic acid. The solution was filtered through 3MM
Whatmann paper before use and stored at room temperature.
• Destain: 30% (v/v) methanol, 10% (v/v) acetic acid, 60% (v/v) deionised
water.
25 mL of a 10% resolving gel was prepared with the following materials; 8.33 mL
Protogel, 6.25 mL resolving buffer, 0.25 mL APS and 10.14 mL deionised water.
This solution was mixed thoroughly and the gel running mould was set up and
tested for leaks using water. Only then was 25 µL of TEMED added to the
solution, which was mixed and immediately pipetted into the gel mould. The
solution was overlaid with propan-2-ol to ensure a flat surface. The resolving gel
was allowed to set for at least 2 hours. 10 mL of a 3% stacking gel was prepared
with the following materials; 1 mL Protogel, 2.5 mL stacking buffer, 100 µL APS
and 6.40 mL of deionised water. Once the resolving gel had set, the propan-2-ol
was washed away by tilting the gel mould slightly to one side. Water was used to
wash out any residual propan-2-ol. 10 µL of TEMED was then added to the
stacking gel mixture and immediately pipetted into the gel mould over the
resolving gel. A comb of an appropriate size was positioned to place immediately
and the gel was allowed to set for at least one hour. Protein samples were mixed
with up to 4µL of NuPAGE loading dye and were boiled for 5 min at 95˚C.
101
β-Mercaptoethanol was added to the sample to give a final concentration of 20%
(v/v) and samples were centrifuged for 1 min . The gel mould was placed into the
electrophoresis tank and SDS-running buffer was poured over this so that the
electrodes were submersed in buffer. The comb was then removed. 20µL of
molecular weight marker (See-Blue 2, Invitrogen) was loaded into the well and so
were the samples. The gel was electrophoresed with SDS-Running buffer at 25
mA until proteins had stacked upon the resolving gel and then run at 35 mA till
the samples had resolved – i.e. till the bands had travelled to the bottom of the
resolving gel. The gel was immersed in Coomassie staining solution for at least
24 hours. The stain was removed by replacing the staining solution with destain.
Fresh destain solution was applied until protein bands were clearly visible. Using
the geneSNAP tool, the gel was photographed (Syngene).
2.5.5 Western Blot Analysis
Solutions:
• Transfer/Blotting Buffer: 192 mM Glycine, 25 mM Tris, 20% (v/v) methanol.
The transfer/blotting buffer was prepared fresh.
• 5X TBS: 100 mM Tris-Cl (pH 7.5), 2.5 M NaCl. The pH was adjusted with
HCl.
• 1X TTBS: 1X TBS, 0.1% (v/v) Tween 20. A 100 µL of Tween 20 was used
for every 100mL of 1x TBS.
• I-Block Solution: 0.2% (w/v) I-Block (TROPIX Inc., USA) in 100mL 1X
TBS. The solution was heated in a microwave oven to melt the solid. The
solution was cooled to room temperature before 100µL of Tween 20 was
added.
102
• Primary Antibody Solution: Primary antibodies were used as a 1 in 3000
dilution made up in I-Block solution and were stored at -20˚C. Primary
antibody solution used to detect human FMO1, FMO2.1 and FMO3 were goat
anti-(rabbit FMO1), goat anti-(rabbit FMO2) or goat anti-(rabbit FMO3)
serum respectively. Primary antibodies were a kind gift from Dr. R. Philpot.
• Secondary Antibody Solution: anti-goat IgG (whole molecule) antibody-
Alkaline Phosphatase conjugate (Sigma-Aldrich) was used as a 1 in 30, 000
dilution and dissolved in I-Block solution. This was prepared on the day of
use.
The following solutions were obtained with the AP Conjugate Kit (Bio-Rad)
• 25X Alkaline Phosphatase (AP) Colour Development Solution. This
solution is stored at 4˚C.
• Reagent A: stored at -20˚C.
• Reagent B: stored at -20˚C.
2.5.6.1 Protein Transfer
Proteins from SDS-PAGE gels were transferred onto a supported nitrocellulose
0.45µM membrane (BDH) using a TRANS-BLOT Cell (Bio-Rad). Once protein
samples had been electrophoresed, the gel mould was dissembled and the approximate
size (length and width) of the gel was estimated. 4 sheets of 3MM Whatman filter
paper and 1 sheet of blotting membrane were cut to size. Filter papers and blotting
pads were soaked in transfer buffer before use. The gel was ‘sandwiched’ between
filter paper and blotting membrane as shown in Figure 3. It is important not to move
the gel once it has come in contact with the membrane, as transfer of protein may
103

have occurred. Any bubbles between the gel and the membrane were removed by
running a pipette gently over the gel. The ‘sandwich’ was placed within a blotting
cassette and loaded into the transfer cell. The cell was filled with transfer buffer and
run overnight at 100 mA. The next day the voltage was turned up to 200 mA for 2
hours.
Blotting Membrane
Blotting Pad
Gel
Filter Paper
Filter Paper Blotting Pad
Figure 2.3: ‘Sandwich’ arrangement of the gel during transfer
2.5.6.2 Antigen Detection
Antigen detection was carried out by a series of incubations and washes as described
below. All incubations were carried out at room temperature and on shaking. Blotting
membrane was washed in I-Block Solution for 1 h and the solution was discarded
after use. Primary antibody solution was poured over the membrane and incubated
for 1 h, this solution can be re-used. The membrane was washed for 5 min with 1X
TTBS, three times. The solution was discarded. A 1 h incubation with secondary
antibody solution was carried out and the solution was discarded. The membrane was
washed three times in 1X TTBS for 5 min and once in 1x TBS. The solution was
discarded.
2.5.6.3 Development of Western Blot
An Alkaline Phosphatase Conjugate Kit (Bio-Rad) detection method was used to
detect the presence of antigen. 1X AP Colour Development solution was prepared
104

just before use, to which Reagents A and B were added. 1mL of Reagents A and B
were used for every 100 mL of 1X AP solution. This mixture was poured over the
membrane and observed for the appearance bands. As soon as bands started to
develop the reaction was quenched by replacing the colour detection mixture with
deionised water – this will prohibit the blotting membrane to overdevelop. The blot
was scanned (Epson Scanner, Epson, Naguna, Japan).
2.6 Quantification of Recombinant FMO in Insect Cell Microsomes
2.6.1 Quantitative Western Blotting
Various amounts of authentic rabbit FMO1, FMO2 or human FMO3 of known
amounts were loaded along side Sf 9 insect cell membranes containing heterologously
expressed FMO of unknown concentrations as described in section 2.5.6. SDS-PAGE
was performed as described in section 2.5.4 and a Western blot was performed on
these gels as described in section 2.5.5. The developed Western blot was scanned at a
resolution of 1200 dpi and the image was saved in TIFF format. The amount of FMO
in the recombinant insect membranes was quantified by scanning densitometry using
Image Gauge software, version 4.2.1 (Science Lab, FujiFilm, Tokyo, Japan) and by
comparison with a standard curve of standard FMO vs band intensity. Values
determined for FMO quantity were obtained from samples tested in quadruplicate
from two independent Western blots. As authentic standards of FMO1 and FMO2
were from rabbit and authentic FMO3 was from human, relative abundance of FMOs
was analysed by SDS-PAGE analysis to ensure that there was no difference in
antigenicity. The amount of FMO in insect cell microsomes was measured by
comparison of intensity of Coomassie blue stained protein bands of authentic FMO.
105

2.7 HPLC and LC-MS Analysis of FMO Catalysed Reactions
2.7.1.1 Incubations with Thiacetazone (TAZ)
Solutions:
• 100 mM TAZ: TAZ was dissolved in dimethyl sulphoxide (DMSO)
• Assay buffer: 100 mM potassium phosphate buffer, pH 7.5 contained:
• 100 U/ mL Catalase: prepared by weighing the appropriate amount of solid
Catalase powder in the appropriate amount of sterile filtered water to give a
working stock concentration of 40 U/mL. The solution was stored at -20˚C
and re-used.
• 100 U/mL Superoxide dismutase (SOD): prepared by weighing the appropriate
amount of solid SOD in the appropriate amount of sterile filtered water to give
a working stock concentration of 40 U/mL. The solution was stored at -20˚C
and re-used.
• 0.1 mg/mL Bovine serum albumin (BSA): prepared by weighing the
appropriate amount of solid SOD in the appropriate amount of sterile filtered
water. The solution was stored at -20˚C and re-used.
• NADPH regenerating system consisting of: 2 U/mL of glucose-6-phosphate
dehydrogenase, 1 mM NADP+ and 2.5 mM glucose-6-phosphate. Working
solutions were prepared for each component in sterile filtered water and stored
at -20˚C.
Incubations of TAZ and FMO were performed as described by (Qian et al. 2006) but
with modifications. The assay buffer was prepared to give a reaction volume of 1 mL.
Assay buffer was incubated at 37 ˚C for 10 min to allow the formation of NADPH
106
from the regenerating system to occur. TAZ was added at a final concentration of 100
µM to the assay buffer and mixed. Reactions were initiated by adding Sf9 insect cell
microsomes containing heterologously expressed human FMO1, FMO2.1 or FMO3
(at a final concentration of 500 nM) or purified EtaA (1 µM final concentration).
Reactions were incubated at 37 ˚C for 90 min and quenched by addition of an equal
volume of ice-cold acetonitrile (CH3CN). Mixtures were centrifuged at 10,000g for 5
min at 4 ˚C and analysed by reverse phase HPLC as described below.
2.7.1.2 Incubations with Ethionamide (ETA)
Sf9 insect cell microsomes containing heterologously expressed human FMO2.1 were
incubated with ETA (final concentration 100 µM) for 60 min in assay buffer as
described for TAZ. Reactions were analysed by Liquid Chromatography- Mass
Spectroscopy (LC MS) as described below.
2.7.2 Reverse Phase HPLC analysis
HPLC analysis was done as described previously (Qian et al. 2006). The supernatants
were diluted to a final concentration of 5% CH3CN and then analysed by HPLC on a
Hewlett Packard II instrument (Hewlett-Packard Company, CA, USA) equipped with
a photodiode array detector and a reverse-phase C18 column (Waters, 3.5 µm particle
size, 4.6 mm i.d x 150mm, Symmetry) employing two buffers: A, H2O and 0.1%
formic acid (FA); and B, CH3CN and 0.1% FA. The solvent flow rate was 0.2
mL/min and the eluent was spectrophotometrically monitored using two bandwidths
[330 +/- 60 nm and 260 +/- 4 nm]. The column was eluted from 0 to 25 min with a
linear gradient from 5 to 20% buffer B. For spectral analysis of metabolites eluent
peaks were ‘monitored’ between 200 and 500 nm. 20 µL of sample was injected.
107

2.7.3 Liquid Chromatography-Mass Spectroscopy (LC-MS) Analyses
Samples for LC-MS analysis were prepared as described for HPLC. LC-MS was
carried out as described previously (Qian et al. 2006). Briefly, LC-MS analysis of
TAZ metabolites was performed on a Waters Micromass ZQ coupled to a Waters
Alliance HPLC system (Waters Corporation, MA, USA). The system was equipped
with a 2695 separations module, a Waters 2487 Dual λ Absorbance detector and a
reverse phase C18 column (Waters, 3.5 µm particle size, 4.6 mm i.d x 150mm,
Symmetry). The reverse-phase column was eluted with a flow rate of 0.2 mL/min
(buffer A, H2O and 0.1% FA; and buffer B, CH3CN and 0.1% FA) with the following
protocol: 0 - 16 min, 5-30% buffer B (linear gradient). The eluent was monitored at
310 nm. The eluent was monitored at 280 and 320 nm. The mass spectrometer
settings were as described previously (Qian et al. 2006). The mass spectrometer
settings were as follows: mode, ES+, capillary voltage, 3.5 kv, cone voltage, 25 v,
desolvation temperature, 250 ˚C.
LC-MS analysis of ETA metabolites produced by FMO2.1 was
performed as described above, with the following modifications. The column was
eluted at a flow rate of 0.2 mL/min (buffer A, H2O and 0.1% FA ; and B, CH3CN and
0.1% FA with the following protocol: 0-15 min with 1% buffer B (isocratic). The
eluent was monitored at 350 nm.
2.8 FMO Assays
2.8.1 Methimazole Assay of FMO activity (Dixit et al. 1984)
Methimazole oxidation by human FMOs was monitored spectrophotometrically using
a dual beam spectrophotometer (Varian Cary 100, Varian Inc., CA, USA). The assay
108

consists of a coupled reaction in which Dithiothreitol (DTT) and 5-Dithio-bis (2-
nitrobenzoic acid) (DTNB) initially react to form nitro-5-thiobenzoate (TNB), a
yellow compound which absorbs light in the visible range. In the presence of
NADPH and molecular oxygen, FMOs catalyse the oxidation of methimazole to
methimazole S-oxide, this will oxidise TNB to a colourless compound (Dixit et al.
1984). The rate of colour change from yellow to colourless is monitored
spectrophotometrically at 412 nm and is proportional to the rate of methimazole
oxidation by FMO.
Solutions:
Assay Buffers
• Human FMO1 and 3: 0.1 M Tris-Cl (pH 8.4), 1 mM EDTA
Buffer was prepared on the day of use. The pH was adjusted to 8.4 using
concentrated HCl. Prior to use, the buffer was aerated for 30 min by placing
the bottle in a shaking water bath set to 37 ˚C .
• Human FMO2.1: 0.1 M Tricine (pH 9.5), 1 mM EDTA.
Buffer was prepared on the day of use. The pH was adjusted to 9.5 using 5 M
NaOH. Prior to use, the buffer was aerated for 30 min by placing the bottle in
a shaking water bath set to 37 ˚C .
Methimazole
• 200 mM Methimazole: Stock solution was prepared fresh by adding the
appropriate amount of solid methimazole to the assay buffer.
109
• 10 mM Methimazole: Stock solution was prepared fresh by adding the
appropriate amount of solid methimazole to the assay buffer
NADPH
• 20 mM NADPH reduced (sodium salt): Stock solution was prepared fresh by
adding the appropriate amount of solid NADPH to chilled assay buffer and
stored on ice.
• NADPH regenerating system:
• 2 U/mL Glucose-6-Phosphate Dehydrogenase
• 3.0 mM Glucose-6-Phosphate
• 0.375 mM NADP+
All components where prepared on the day in the appropriate assay buffer which
was chilled before use.
• 4 mM Dithiothreitol (DTT): DTT solution was prepared fresh by adding the
appropriate amount of solid DTT to assay buffer.
• 12 mM 5, 5-Dithio-bis (2-nitrobenzoic acid) (DTNB): Prepared fresh by
adding the appropriate amount of solid DTNB to 100% ethanol.
Assay
Reactions were carried out in a final volume of 1 mL and at 37ºC. The final
concentrations of DTNB and DTT were 0.06 µM and 0.02 mM respectively. Two
identical ‘blank’ cuvettes were prepared with the following components, 5 µL
NADPH or 25µL of glucose-6-phosphate, 25µL of NADP+, 7.5µL of glucose-6-
110

phosphate dehydrogenase when a regenerating system was used, 5µL of DTT, 5µL of
DTNB and 15-70 µL of human FMO expressing microsomes (no more than 1 mg/mL
total protein) in assay buffer to give a total volume of 1 mL. The contents were mixed
by inverting the cuvettes. Cuvettes were placed in cell 1 or cell 7 of a Varian Cary
100 dual beam spectrophotometer and a blank measurement was taken. Using the
Kinetics application, the spectrophotometer was set to blank correction mode.
Methimazole was added at the appropriate concentration to the sample cuvette and the
equivalent volume of assay buffer was added to the reference cuvette. The rate of
decrease in optical density at 412 nm was monitored after one minute for 4 minutes.
Kinetic studies were performed on triplicate preparations of enzymes at
concentrations of methimazole ranging from 10-2000 µM for human FMO1 and
FMO3 and 200-6000 µM for human FMO2.1. Steady-state parameters, Vmax, KM
and kcat were determined as described in section 2.8.3.1.
2.8.2 TAZ Oxygenation by Human FMOs and EtaA
2.8.2.1 Development of a UV-Spectroscopic Assay to monitor the rate of TAZ
oxygenation
Solutions:
• Assay Buffer: 0.1 M Tris-Cl (pH 8.4). Buffer was prepared on the day of use.
The pH was adjusted to 8.4 using concentrated HCl. Prior to use, the buffer
was aerated for 30 min by placing the bottle in a water bath set to 37 ˚C with
shaking.
111

• 20 mM TAZ: A stock solution was prepared fresh in dimethyl sulphoxide
(DMSO). Serial dilutions of TAZ were prepared from the 20 mM stock and in
DMSO.
Two quartz cuvettes containing 999 µL of assay buffer were placed in cell 1 and cell 7
of a Varian Cary 100 dual-beam spectrophotometer (Varian Inc., USA). Using the
Varian Scan application, the spectrophotometer was set to blank correction mode. 1
µL of TAZ (in DMSO) was added to the cuvette in cell 7 (sample cuvette) and 1 µL
of DMSO to the cuvette in cell 1 (reference). The final organic solvent concentration
in each cuvette was held at 0.1% (v/v). Using the Varian Scan application, samples
were scanned from 200 to 500 nm over a range of TAZ concentrations between 1 and
20 µM. These measurements were done in triplicate using three independently
prepared stock solutions of TAZ (20 mM) that were diluted accordingly in DMSO.
The absorbance of TAZ, measured at its λmax (328 nm) was plotted against
concentration. The molar extinction coefficient of TAZ in 0.1% DMSO was
determined from the gradient of this graph and the Beer-Lambert equation (equation
2).
Molar Extinction Co-efficient (ε) = A
ℓ.C Equation 2
Where,
A = Absorbance of a given solution at a particular wavelength
C = concentration of the solution
ℓ = the distance light has to travel through a solution
112

2.8.2.2 UV-Spectrophotometric Assay to Monitor FMO-dependent TAZ
oxidation
Solutions:
Assay Buffers:
• Human FMO1 and 3: 0.1 M Tris-Cl (pH 8.4), 1 mM EDTA. Buffer was
prepared on the day of use. The pH was adjusted to 8.4 using concentrated
HCl. The buffer was placed in a water bath set to 37 ˚C. Prior to use, the
buffer was aerated for 30 min by placing the bottle in a shaking water bath set
to 37 ˚C.
• Human FMO2 and EtaA: 0.1 M tricine (pH 9.5), 1 mM EDTA. Buffer was
prepared on the day of use. The pH was adjusted to 9.5 using 5M NaOH. The
buffer was placed in a water bath set to 37 ˚C. Prior to use, the buffer was
aerated for 30 min by placing the bottle in a shaking water bath set to 37 ˚C.
• 20 mM NADPH: prepared fresh by adding the appropriate amount of solid
NADPH to assay buffer. The solution was stored on ice.
• 20 mM TAZ: solution was prepared fresh by adding the appropriate amount of
solid TAZ to in dimethyl sulphoxide (DMSO). Serial dilutions ogf TAZ were
prepared from the 20 mM stock solution in DMSO. TAZ solutions were kept
at room temperature.
Assay
TAZ oxidation by human FMO or EtaA was measured by monitoring the rate of
decrease in TAZ absorbance at 328 nm using a dual beam spectrophotometer (Varian
Cary 100). The spectrophotometer was set to blank correction mode and the Peltier
113

module to 37˚C. Two identical ‘blank’ quartz cuvettes were prepared with the
following components; 100 µM NADPH, insect cell microsomes containing
heterologously expressed human FMO1 (320 nM), FMO2.1 (5 nM), FMO3 (230 nM),
purified ETA (1 µM) or the equivalent amount of uninfected Sf9 cell microsomes in
the appropriate assay buffer (see next section) to give a final reaction volume of 1 mL.
The contents of the cuvettes were mixed thoroughly and placed in cell 1 (reference) or
cell 7 (sample) of the spectrophotometer and a ‘blank’ measurement was made. The
samples were allowed to equilibriate at 37˚C for 1 min. 1 µL of TAZ from an
appropriate stock solution was added to the sample cuvette and 1 µL of DMSO was
added to the blank cuvette. The contents were mixed by inverting the cuvette and the
cuvettes were immediately replaced to their respective cells. The rate of decrease in
optical density at 328 nm was monitored after one minute for 4 minutes.
2.8.2.2.1 Determining pH dependence of FMO and EtaA activity
The pH optimum for human FMOs and ETA was determined using the following
reaction buffers:
• 0.1 mM potassium phosphate (pH 7.5), 1 mM EDTA
• 0.1 M Tris-HCl (pH 8.5), 1mM EDTA
• 0.1 M Tricine-OH (pH 9.5), 1 mM EDTA.
Buffers were prepared fresh on the day and were aerated for 30 min at 37 ˚C in a
shaking water bath before use. Optimum pH for enzymes was determined using
the UV-spectroscopic assay detailed in the preceding section using TAZ at a final
concentration of 10 µM.
114

2.8.3 Kinetic Studies of TAZ oxygenation using a UV-spectroscopic Assay
Kinetic studies were performed on triplicate preparations of enzymes at
concentrations of TAZ ranging from 1 to 20 µM. The final organic solvent
concentration was held at 0.1% (v/v). Assays were carried out in triplicate on each
enzyme preparation as described in section 2.7.2 in the optimum pH buffer for each
enzyme: pH 8.5 for FMO1 and FMO3 and 9.5 for FMO2.1 and EtaA.
2.8.3.1 Determination of Steady-State Kinetic Parameters
Enzyme velocity was converted from absorbance min-1 to µmol L-1 min-1 using the
Molar extinction co-efficient of TAZ (determined to be 38,300 ± 2,320 M-1 cm-1) or
TNB (13,600 M-1 cm-1). Steady-state kinetic parameters, Vmax and KM were
estimated by non-linear regression using the Enzyme Kinetics module (v.1.3) of the
SigmaPlot (v 10.0) program (Systat Software Inc., CA, USA). Non-linear regression
has been chosen to determine kinetic parameters as it is superior to methods which
transform Michaelis-Menten equation in a linear fashion. Linearity of data was
confirmed by Hanes-Woolf (Hanes 1932) linear transformations of the Michaelis-
Menten equation using the Enzyme Kinetics module. Turnover number (kcat) was
determined using the following equation.
kcat = Vmax / [E]
Equation 3
Where Vmax is the maximal enzyme velocity of enzyme catalysis and [E] is the final
enzyme concentration in the reaction.
115

2.8.4 Kinetic Studies of TAZ oxygenation using HPLC analysis
Sf9 cell microsomes containing heterologously expressed human FMO2.1 were
incubated in 0.1 M Tricine-OH (pH 9.5), 1 mM EDTA, 0.1 mM NADPH and TAZ
(concentrations ranged from 1 - 50µM in DMSO). A duplicate set of samples was
prepared but without the addition of enzyme. The final organic solvent concentration
was held at 0.1% (v/v). Mixtures were incubated at 37 ˚C for 5 min and reactions
were quenched with an equal volume of ice-cold CH3CN. ETA was added as an
internal standard at a final concentration of 100 µM (in DMSO) and mixtures were
prepared for HPLC analysis as described above. A standard curve was generated by
plotting the ratio of the integrated HPLC peak areas of TAZ and ETA (from the
sample set without added enzyme), against the range of TAZ concentrations used. The
ratio of the integrated HPLC peak areas of TAZ and ETA, in the sample set with
added enzyme, was calculated and the amount of unmetabolised TAZ determined
from the standard curve. This value was subtracted from the input concentration of
TAZ to calculate the amount of TAZ metabolized by the enzyme. Vmax, KM and kcat
were determined as described in section 2.8.3.1.
2.9 Generation of human FMO3 Amino Acid Variant cDNAs
Human FMO3 cDNAs containing the desired mutations were previously prepared in
the laboratory as described elsewhere (Allerston et al. 2009). Each human FMO3
cDNA variant was cloned in pET21b and transformed into E.coli DH5α™ and
maintained as glycerol stocks. This section describes the sub-cloning of FMO3
cDNA from pET21b into pFastBac1™ for subsequent expression in Sf9 cells. For
116

simplicity human FMO3 cDNA for wild type and FMO3 polymorphic variants will be
referred to as ‘human FMO3’.
E.coli DH5α™ cells containing FMO3-pET21b plasmid DNA were streaked
on to agar plates containing 50 µg/mL ampicillin and incubated at 37ºC overnight as
described in section 2.2.3. A single colony was used to inoculate 5 mL of LB-
medium containing 50 µg/mL ampicillin. The culture was incubated overnight at 37ºC
with shaking. The following day, plasmid was isolated from 3 mL of bacterial culture
using the QIAprep Miniprep Kit (QIAGEN) as described in section 2.3.1.1. Plasmid
DNA was quantified as described in section 2.3.1.2.
pFastBac1™ was purchased from Invitrogen and was at a concentration of 1.3
µg/µL.
2.9.1 BamHI and HindIII Restriction Digest of human FMO3-pET21b and
pFastBac1™
Solutions:
• 10X NEBUFFER 2 (New England Biolabs, MA, USA)
• 100X Bovine Serum Albumin (BSA) (New England Biolabs, MA,USA)
• Sterile water
BamHI and HindIII were used to excise FMO3 cDNA from pET21b. 1 µg of plasmid
DNA was digested at 37ºC overnight with 5 U of BamHI and 5 U of HindIII, in a
solution containing 1X NEBuffer 2, 1X BSA and sterile water according to NEB
instructions. pFastBac1™ was also digested with BamHI and HindIII to produce
complementary DNA sequences or ‘sticky ends’ to the DNA sequence of digested
FMO3 cDNA.
117

2.9.2 Gel Extraction of DNA
Solutions:
• SYBR® Green 100,000X Concentrate (Invitrogen)
• Propan-2- ol
• Sterile Water
The following solutions were obtained from the QIAquick Gel Extraction Kit
(Qiagen)
• Buffer QG
• Buffer PE
After digestion of pET21b, human FMO3 cDNA was isolated using the QIAquick gel
Extraction kit (QIAGEN). Samples prepared as described in section 2.9.1 were
separated on a 1% agarose gel as described in section 2.3.1.3 with the exception that 1
µL of SYBR® Green was added to molten agarose instead of ethidium bromide. This
allowed DNA to be visualised using a light box with an orange filter rather than
exposing it to UV. Using the molecular weight marker as a guide, FMO3 cDNA was
excised from the gel using a scalpel. The piece of agarose was weighed and placed in
a 1.5 mL microfuge tube. Three volumes of Buffer QG was added to one volume of
agarose (1 volume =100 µL of agarose or 100 mg) and incubated at 50˚C for 10 min
or until the agarose had completely dissolved. The following steps were carried out at
room temperature. One ‘gel’ volume of propan -2-ol was added and the tube was
inverted. A QIAquick spin column was placed in a 2 mL collection tube and 800 µL
of sample was applied to the column. Samples were centrifuged at 13,000g for 1 min
118

in a microcentrifuge, the flow through was discarded and the column was placed in
the same collection tube. 0.5 mL of Buffer QG was added to the column to remove
traces of agarose. The column was centrifuged for 1 min at 13,000g and the flow
through was discarded. The column was washed by adding 0.75 mL of Buffer PE, the
sample was centrifuged for 1 min and the flow through was discarded. The column
was centrifuged for an additional 1 min to ensure all residual ethanol from Buffer PE
was removed. For the elution step, the column was placed into a fresh 1.5 mL
microfuge tube and 30 µL of sterile water was applied to the column. The column
was allowed to stand for 1 min and then centrifuged for 1 min at 13,000g. For short
term storage, human FMO3 cDNA was kept at 4˚C.
2.9.3 DNA Ligation
Solutions:
The following solutions were provided with the Quick Stick Ligase Kit (Bioline Ltd,
UK).
• 4X QS Buffer
• Sterile water
DNA Ligation was carried out using the Quick Stick Ligase Kit (Bioline Ltd, UK)
Human FMO3 cDNA isolated in the previous section was ligated to pFastBac1™.
Prior to this step, pFastBac1™was digested with BamHI and HindIII as described in
section 2.9.1 and a 1 in 100 dilution was prepared. For each ligation reaction, two
tubes were set up: Vector Only (digested pFastBac1™) and Vector plus Insert
(digested pFastBac1™and digested FMO3 cDNA). Vector only tubes contained: 1
µL of digested pFastBac1™, 1 µL of Quick Stick Ligase enzyme, 5 µL of 4X QS
119
buffer (which was vortexed before use) and 13 µL of sterile water. Vector plus Insert
tubes contained: 1 µL of digested pFastbac1, 1 µL of Quick Stick Ligase enzyme, 5
µL of 4X QS buffer (which was vortexed before use) and 13 µL of digested human
FMO3 cDNA. The tubes were incubated overnight at 16˚C.
2.9.4 Tranformation of E.coli OneShot™ TOP10 competent cells with Ligation
Products
In order to confirm that the ligation reaction between human FMO3 cDNA and
pFastBac1™ was successful, E.coli OneShot™ TOP10 chemically competent cells
Invitrogen) were transformed with the ligation reaction mixtures. A 50 µL vial of
OneShot™ cells was used per ligation. OneShot™ cells were thawed by gently
rubbing the vial in the hands and as soon as thawing was observed, the samples were
placed on ice and 1 µL of ligation reaction mixture was added. The contents were
mixed by gently tapping and inverting the vial as pipetting can reduce transformation
efficiency. The vials were incubated on ice for 30 min. Vials were incubated for
exactly 30 sec at 42˚C using a heat block. The vials were then placed on ice. 250 µL
of pre-warmed SOC solution was added to each vial. Samples were incubated with
shaking in a heat block for exactly 1 hr at 37˚C. During this time, agar plates
containing ampicilin (prepared as described in section 2.2.3) were placed in a 37˚C
incubator to warm up. 50 µL of transformed cells from each vial were spread on an
agar plate, the plates were inverted and incubated at 37˚C overnight. Colonies were
counted the following day and the ratio of colonies formed from ‘Vector only’ and
‘Vector plus Insert’ vials was noted. 5 colonies were picked from each Vector plus
Insert plate and 1 colony from Vector only plates. Each colony was inoculated into
5mL of LB-medium containing 50 µg/ mL of ampicillin. Cultures were grown for 6-8
120

hours or overnight with shaking at a rotational speed of 250 rpm at 37˚C. Plasmid
DNA was isolated using the QIAprep Miniprep kit (QIAGEN) as described in section
2.3.1.1.
2.9.5 Analysis to Confirm Successful ligation of human FMO3 cDNA and
pFastBac1™
10 µL of plasmid DNA was digested with BamHI and HindIII as described in section
2.9.1. Digested products were run on a 1% agarose gel as described in section 2.3.1.3.
If ligation was successful, two DNA bands were expected to be observed,
representing pFastBac1™ (4.8kb) and human FMO3 cDNA (~2kb). In order to
confirm that the vector was indeed pFastBac1™ (and not the original vector,
pET21b), a restriction enzyme was chosen which could differentiate between the two
plasmids. Bgl II was used as it has two restriction sites in pFastBac1™ but only one
in pET21b. Reactions contained 5 µL of plasmid DNA, 1 µL of Bgl II (NEB,
England), NEBuffer 3 (NEB, England) and 3 µL of water. Samples were incubated
for 2 hours at 37˚C. Digested products were visualised by agarose gel electrophoresis
as described in section 2.3.1.3.
2.9.6 DNA Sequencing
DNA sequencing was performed by Eurofins-MWG Biotech (Germany) using the
‘value read’ service. The service required 1 µg of plasmid DNA per sequencing
reaction. Sequences were analysed by comparison to the wild type human FMO3.
DNA was sequenced in both forward and reverse orientations using primers annealing
to sequences in the pFastBac1™ vector, these primers were available at MWG-
121

Biotech. Primer sequences used for sequencing wild type and variant human FMO3
DNA are given in appendix 1.
The remainder of the method is the same as that described for human FMO1, FMO2.1
and FMO3. E.coli DH10Bac™ cells were transformed with human FMO3 cDNA as
described in section 2.3.1.4 and the resulting bacmid DNA was isolated as described
in section 2.3.1.5. Generation of baculovirus containing human FMO3 DNA was
done as described in section 2.4. Expression of recombinant human wild-type FMO3
protein and FMO3 amino acid variants was carried out as described in section 2.5.
Quantitation of FMO3 in insect cell microsomal membranes was done as described in
section 2.6 using human FMO3 containing insect cell microsomes of known FMO3
amounts as a standard.
2.9.7 Assays of Variant human FMO3 Activity
Activity of FMO3 amino acid variants was determined towards methimazole and
TAZ.
2.9.7.1 Methimazole Assay of FMO3 Amino Acid Variant activity
Kinetic studies on human FMO3 amino acid variants and methimazole were
performed at pH 8.4 and essentially as described in section 2.8.1. NADPH was
supplied to the reaction using a 20 mM NADPH solution prepared in assay buffer.
200-500 pmol of FMO3 protein was used in the assay depending on the variant.
Methimazole was tested at concentrations ranging from 10-1000 µM on batches of
microsomes isolated from three independent infections of Sf9 cells. Steady-state
kinetic parameters were determined from assays performed in triplicate for each
122

FMO3 protein (as described in section in 2.8.3.1) and were compared to those
obtained for wild type FMO3. Statistical significance was assessed using an unpaired,
two-tailed t-test performed using the Microsoft Excel application of Microsoft Office
2003.
2.9.7.2 TAZ Assay of FMO3 amino Acid Variant activity
Kinetic studies on human FMO3 amino acid variants and TAZ were performed at pH
8.4 and essentially as described in section 2.8.2.2. 200-500 pmol of FMO3 protein
was used in the assay depending on the variant. NADPH was supplied to the reaction
using a 20 mM NADPH solution prepared in assay buffer. TAZ was tested at
concentrations ranging from 1-20 µM on batches of microsomes isolated from three
independent infections of Sf9 cells. Steady-state kinetic parameters were determined
from assays performed in triplicate for each FMO3 protein (as described in section in
2.8.3.1) and were compared to those obtained for wild type FMO3. Statistical
significance was assessed using an unpaired, two-tailed t-test performed using the
Microsoft Excel application of Microsoft Office 2003.
2.10 Isolation and Preparation of Mouse Tissue Microsomes
Age-matched male and female wild-type C57BL/6 and knockout mice back-crossed
for eight generations onto the C57BL/6 line were used in this investigation. The
construction of the Fmo1 (-/-), Fmo2 (-/-) Fmo4 (-/-) knockout mouse has been
described (Hernandez et al 2009). The production of the Fmo5 (-/-) knockout line has
not yet been published but preliminary data on its construction can be found in the Ph
D thesis of A. Melloni and in (Hernandez et al. 2006).
123

2.10.1 Dissection
Liver and lungs were obtained from 8-10-week old C57BL/6 mice, Fmo1 (-/-), Fmo2
(-/-) Fmo4 (-/-) mice and Fmo5 (-/-) mice as described in this section. Mice had access
to food and water ad libitum and were housed with appropriate animal husbandry
facilities.
Solutions:
• 70% Ethanol
• Buffer A: 0.1 M Tris-Acetate (pH 7.4), 0.1 M KCl, 1 mM EDTA. Buffer was
prepared the day before dissection was to take place and stored at 4˚C.
On the morning of the procedure, dissection equipment was ensured to be clean and
was wiped with 70% ethanol. Mice were sacrificed in the morning between 9 and 11
am by carbon dioxide asphyxiation. For this, the asphyxiation chamber was first
placed on its side to allow any residual CO2 to be removed and then returned to its
upright position. Mice (no more than 4 at a time) were placed in the box and the CO2
concentration was slowly increased to avoid stress to the animals. After 10 min, mice
were taken out of the box and their feet were pinched to observe pedal reflex. If no
response was observed, the abdomen was swabbed with 70% ethanol and opened
through a U-shaped incision. The intestines were moved to one side of the torso and
the liver was excised. The liver was weighed and submerged in three times the
volume of chilled Buffer A that was placed on ice. The abdomen was inspected to
ensure that all three lobes of the liver were excised. To excise the lungs, the
124

diaphragm was cut and so was the rib cage. Again inspections were made to ensure
that the entire lung was obtained. Lungs were weighed and submerged in three times
the volume of chilled Buffer A. The tissues were minced in this buffer using scissors.
The steps described in the next section were performed immediately.
2.10.2 Isolation of Mouse Tissue Microsomes
Solution:
• Storage Buffer: 10 mM potassium phosphate (pH7.5), 1 mM EDTA, 20%
Glycerol. Buffer was prepared a day before dissection and stored at 4˚C.
Minced tissues from the preceding section were homogenised using a motor powered
hand held homogeniser (Citenco, Park Products Ltd, England). The mortar was
chilled before transferring minced tissue samples to it and it was kept on ice during
the procedure at all times. Tissues were homogenised at speed 7 until the tissue was
completely resuspended. The homogenate was then transferred to a chilled centrifuge
tube and centrifuged at 10,000g for 10 min at 4˚C. The supernatant from this step
was centrifuged at 105,000g for 90 min at 4˚C to give a pale yellow pellet. The pellet
obtained from this step is a crude preparation of smooth and rough endoplasmic
reticulum membranes. The pellet was immediately placed on ice and resuspended in
Storage buffer using a glass-glass hand held homogeniser. The desired final
concentration of the suspended microsomes was about 10-25 µg/µL. Microsomes
were frozen at -80˚C in 500 µL aliquots to avoid freeze-thawing of large volumes as
this leads to reduced activity. Microsomal protein concentration was determined by
the method of Lowry as described in section 2.5.3.
125

2.10.3 Kinetic Studies of TAZ Metabolism by Mouse Tissue Microsomes
2.10.3.1 TAZ metabolism by Mouse Lung and Liver Microsomes
Solution
• Assay Buffer: 100 mM potassium phosphate (pH 7.5), 1 mM EDTA. Buffer
was made on the day from a pre-made 1M potassium phosphate solution
(pH7.5) that was stored at 4˚C. The buffer was aerated for 30 min in a 37˚C
water bath with shaking.
• NADPH regenerating system:
• 2 U/mL Glucose-6-Phosphate Dehydrogenase (7.5 µL was used in
a 1 mL reaction)
• 3.0 mM Glucose-6-Phosphate (25 µL was used in a 1 mL reaction)
• 0.375 mM NADP+ (25 µL was used in a 1 mL reaction)
All components where prepared on the day in the appropriate assay buffer which
was chilled before use.
The rate of TAZ metabolism by mouse liver and lung microsomes was determined
essentially as described in section 2.8.2.2 but using TAZ at a final concentration of 10
µM and using an NADPH regenerating system. The relative contribution of FMOs
and CYPs was to be determined by this method and so reactions were performed at
pH 7.5 because a) this resembles physiological pH and b) because CYP function is
inhibited in alkaline conditions. NADPH was supplied through an NADPH
regenerating system for which the components are described above. 500 µg of
microsomal protein was used in the reaction and enzyme velocity was converted from
126

absorbance min-1 to µmol L-1 min-1 using the Molar extinction co-efficient of TAZ
(determined to be 38,300 ± 2,320 M-1 cm-1). Michaelis-Menten plots (initial enzyme
velocity vs concentration of substrate) were plotted for microsomal samples isolated
from liver and lung from female mice.
The rate of TAZ metabolism obtained for liver and lung microsomal samples
was compared between mouse lines and to results obtained for enzyme inhibition
studies (see following section). Statistical significance was assessed using an unpaired
two-tailed t-test when results were compared between samples (same test condition,
different samples), when results were compared within a sample (i.e. different test
conditions, one sample) a paired two-tailed t-test was employed.
2.10.4 Control Experiments used to Assess Activity of Mouse Tissue Microsomes
It was necessary to check that the microsomes displayed activity towards control
substrates of the FMOs and CYPs to ensure that they had not become inactivated
during the isolation procedure. FMO activity was assessed using the assay of
methimazole and CYP activity was assessed by monitoring the rate of cytochrome c
reduction by NADPH-dependent cytochrome P450 reductase.
2.10.4.1 Methimazole Oxidation by Mouse Tissue microsomes
To ensure that FMOs were not inactivated during the isolation procedure their
capacity to oxidise methimazole was assessed.
The rate of methimazole oxidation by mouse liver and lung microsomes was
determined essentially as described in section 2.8.1. Reactions were performed in pH
8.4 and NADPH was supplied through a NADPH regenerating system. 50-200µg of
microsomal protein was used in the reaction depending on the tissue from which the
127

microsomes were isolated from. Enzyme velocity was converted from absorbance
min-1 to µmol L-1 min-1 using the Molar extinction co-efficient of TNB (13,600 M-1
cm-1). Though kinetic parameters were not calculated for microsomes because of the
shortage of sample, the relative rate of TNB oxidation was used as a measure of FMO
activity.
2.10.4.2 Activity of NADPH Cytochrome P450 Reductase in Mouse Liver
Microsomes
Although CYPs are relatively robust enzymes that are stable at room temperature and
can withstand incubations of up to several minutes at 45-50˚C, it was necessary to
ensure that they were active during the experiment. NADPH cytochrome P450
reductase is an enzyme that is necessary for the activity of CYPs and the activity of
this enzyme was used as an assessment of CYP activity. Details regarding its function
will be given in section 3.3. It is appreciated that factors other than CRP activity may
affect CYP activity; however these are uncommon under the conditions used in this
experiment.
Solutions:
• Assay Buffer: 100 mM potassium phosphate buffer (pH 7.5) prepared on the
day from a pre-made 1M potassium solution that was stored on ice.
• 0.2 mM Cytochrome c: Stock solution was prepared by weighing the
appropriate amount of solid Cytochrome c from Saccharomyces cerevisiae and
adding it to assay buffer.
128

• 20 mM NADPH reduced (sodium salt): Stock solution was prepared fresh by
adding the appropriate amount of solid NADPH to chilled assay buffer and
was stored on ice.
The rate of cytcochrome c reduction by CRP was measured spectrophotometrically at
25˚C as described by Omura and Takesue (Omura et al. 1970). Two identical ‘blank’
cuvettes were prepared with the following components; 200 µg of microsomes
isolated from mouse lung or liver and cytochrome c at a final concentration of 0.2
µM. The cuvettes were capped and inverted to mix the contents before placing them
in cell 1 (reference) or cell 7 (sample) of a Varian Cary 100 dual beam
spectrophotometer. The Peltier module was set to 25˚C. Using the Kinetics
application, the spectrophotometer was set to blank correction mode and a blank
measurement was taken. Reactions were initiated by the addition of 100 µM
NADPH. The increase in optical density at 550 nm was measured for 10 min.
2.10.5 Inhibition Studies on Mouse Tissue Microsomes.
In this section the rate of TAZ metabolism was determined for microsomes that have
been treated to inhibit FMO activity or CYP activity. Sections 2.10.5.1 through
2.10.5.3 describe how FMOs and CYPs were inactivated. Samples were then
assessed for their ability to metabolise 10 µM TAZ as described in section 2.10.3.1
2.10.5.1 Competitive Inhibition of FMO activity
Solutions:
• Assay Buffer: 100 mM potassium phosphate (pH 7.5), 1 mM EDTA. Buffer
was made on the day from a pre-made 1M potassium phosphate solution (pH
129
7.5) that was stored at 4C. The buffer was aerated for 30 min in a 37˚C water
bath with shaking
• 200 mM Methimazole: Stock solution was prepared fresh by adding the
appropriate amount of solid methimazole to assay buffer.
FMO activity was inhibited by pre-incubating mouse tissue microsomes with
methimazole, a probe substrate of the FMOs that acts as a competitive inhibitor. The
concentration of methimazole chosen in this experiment was determined by reviewing
literature of the saturating concentration of methimazole.
Tubes (prepared in duplicate) containing 500 µg microsomal protein, 1 mM
methimazole and NADPH regenerating components were incubated at 37˚C for 2
min. The contents of the tubes were transferred to two quartz cuvettes where one
would be treated with TAZ and the other would serve as a blank in the assay. The
rate of TAZ metabolism after FMO inhibition was measured as described in section
2.8.2.2. Assays were carried out in triplicate on two batches of mouse tissue
microsomal samples and statistical significance was assessed as described in section
2.10.4.
2.10.5.2 Heat Inactivation of FMO Activity
FMOs are heat labile and can be inactivated by short durations of heat treatment at 45-
50˚C in the absence of NADPH (Rawden et al. 2000; Stormer 2000; Virkel et al.
2006; Siddens et al. 2008).
Tubes (prepared in duplicate) containing 500 µg microsomal protein in assay
buffer (to give a final volume of 942 µL) were incubated at 45˚C for 5 min. After
heat treatment, tubes were returned to ice for one min and components of the NADPH
regenerating system were added. Tubes were inverted to ensure adequate mixing. The
130
contents of the tubes were transferred to two quartz cuvettes where one would be
treated with TAZ and the other would serve as a blank in the assay. The rate of TAZ
metabolism after FMO inhibition was measured as described in section 2.8.2.2.
Assays were carried out in triplicate on two batches of mouse tissue microsomal
samples and statistical significance was assessed as described in section 2.10.4.
2.10.5.3 Inhibition of CYP Inactivity
NADPH-dependent Cytochrome P450 Reductase (CRP) anti-serum was employed to
abolish the activity of CYPs in the microsomal samples.
The amount of CRP-anti-serum was optimised as follows: tubes (prepared in
duplicate) containing 500 µg microsomal protein in assay buffer and increasing
volumes of CRP-anti-serum or control non-immune serum (0-50 µL) were incubated
on ice for 15 min. The components of the NADPH regenerating system were applied
to these tubes and these were inverted to mix the contents. The contents of the tubes
were transferred to two quartz cuvettes where one would be treated with TAZ and the
other would serve as a blank in the assay. The rate of TAZ metabolism after CYP
inhibition was measured as described in section 2.8.2.2. Assays were carried out in
triplicate on two batches of mouse tissue microsomal samples and statistical
significance was assessed as described in section 2.10.4.
131

132
chapter 3: Results and Discussion

3.1 Analysis of the Reaction between Human FMO2.1 and the Anti-
Tubercular Drugs Thiacetazone and Ethionamide.
The work described in this section has been published.
Francois, A.A., Nishida, C.R., Ortiz de Montellano, P.R., Phillips, I.R., Shephard,
E.A. (2009) Human Flavin-Containing Monooxygenase 2.1 Catalyzes Oxygenation of
the Antitubercular Drugs Thiacetazone and Ethionamide. Drug Metabolism and
Disposition. 37(1):178-186.
Introduction
This section describes the reaction between human FMO2.1 and the anti-tubercular
drugs Thiacetazone (TAZ) and Ethionamide (ETA). Metabolites generated for TAZ
by FMO2.1 were compared to those formed by the action of human FMO1, FMO3
and the Mycobacterial FMO, EtaA. Kinetic parameters describing the reaction
between FMO2.1 and TAZ were determined using a novel UV-spectroscopy assay.
Kinetic parameters for human FMO1, FMO3 and EtaA were also determined for
comparison.
Results
Protein Expression
Human FMO1, FMO2.1 and FMO3 were heterologously expressed in Sf9 insect cell
membranes as described in sections 2.3-2.5. Insect cell microsomes, which represent
membranes of the endoplasmic reticulum in suspension, were prepared as described in
section 2.5.2.
Figure 3.1.1 shows photographs of polyacrylamide gels obtained from SDS-
PAGE analysis of Sf9 insect cell microsomes containing heterologously expressed
133

1 2 C1 2 B1 2 A
118 kDa
90 kDa
48 kDa
36 kDa
27 kDa
Figure 3.1.1: SDS-PAGE gel illustrating the expression of human FMO1,
FMO2.1 and FMO3 expressed in Sf9 insect cell microsomes. Lane 1: Molecular
weight marker, lane 2 microsomes prepared from non-infected Sf9 insect cells
(negative control) and Sf9 insect cell microsomes containing heterologously expressed
human FMO1 (A), FMO2.1 (B) and FMO3 (C).
134

human FMO1, FMO2.1 or FMO3. The amount of FMO expressed in microsomes
was determined by generating a standard curve from authentic FMO standards as
described in section 2.6.1. Figure 3.1.2 illustrates an example of a quantitative
Western blot and a calibration curve generated to quantify human FMO1 in insect cell
microsomes.
Catalytic Oxidation of TAZ by human FMO2.1
Reactions analysed by reverse phase HPLC and liquid chromatography-mass
spectroscopy (LC-MS) were prepared as described in section 2.7.
Incubation of TAZ with Sf9 insect cell microsomes containing heterologously
expressed human FMO2.1, in the presence of NADPH, resulted in the formation of
three major metabolites with reverse-phase retention times of 7.5 min (M1), 11.4 min
(M2) and 14.6 min (M3) (Fig. 3.1.3). No products were observed when TAZ was
incubated with microsomes isolated from non-infected Sf9 cells or when NADPH was
omitted (results not shown). UV spectral analysis of the metabolites (Fig. 3.1.4)
showed that M1 had a maximal absorption peak at 325 nm and a smaller peak at
approximately 230 nm. M2 had a similar spectrum, with peaks at 320 and 220 nm.
The absorption spectrum of M3 exhibited a main peak at 295 nm and a secondary
peak at 220 nm.
To identify the three metabolites, M1, M2, and M3, formed from TAZ by the
action of human FMO2.1, were analysed by LC-MS. The mass spectrum of M1 had a
molecular ion [M + H]+ at m/z 269.07, with fragment ions at m/z 205.14 and 163.12
(Fig. 3.1.5A). The mass of the molecular ion of M1 is 32 atomic mass units more than
that of the molecular ion of TAZ (237), suggesting a structure in which TAZ has
incorporated two oxygen atoms (Fig. 3.1.5A) and hence supports identification of the
135
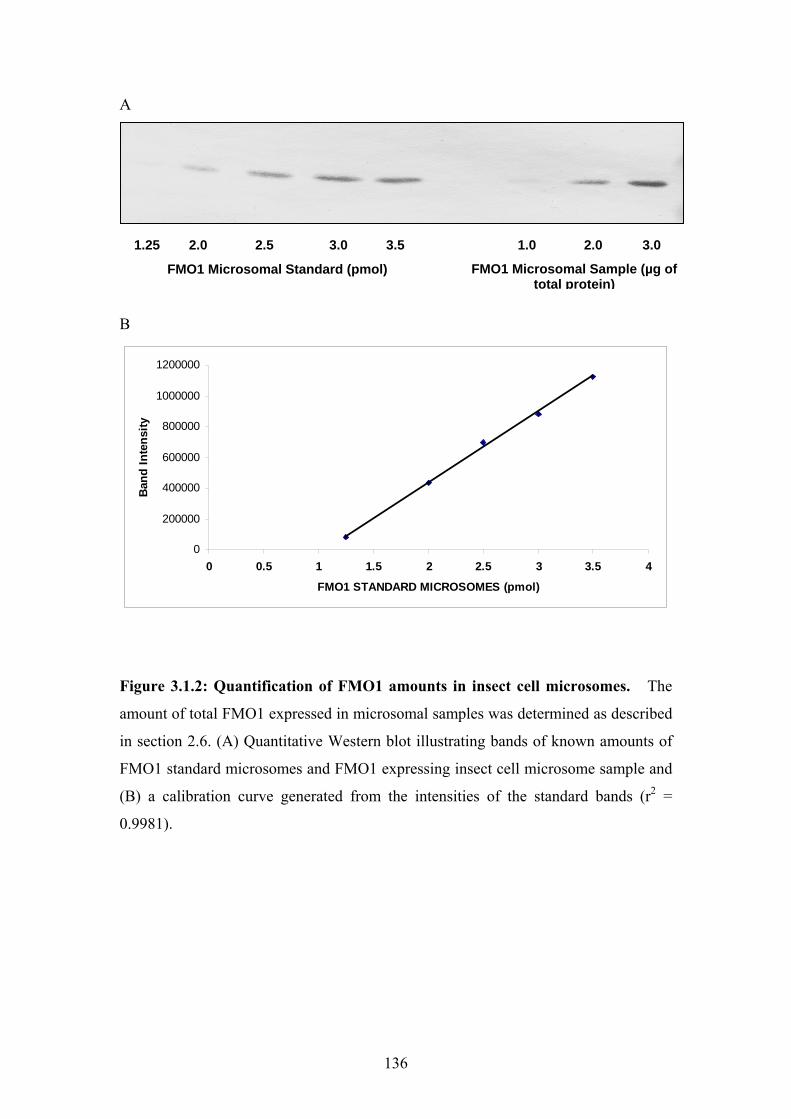
A
1.25 2.0 2.5 3.0 3.5 1.0 2.0 3.0
FMO1 Microsomal Sample (µg of total protein)
FMO1 Microsomal Standard (pmol)
B
0
200000
400000
600000
800000
1000000
1200000
0 0.5 1 1.5 2 2.5 3 3.5 4
FMO1 STANDARD MICROSOMES (pmol)
Ban
d In
tens
ity
Figure 3.1.2: Quantification of FMO1 amounts in insect cell microsomes. The
amount of total FMO1 expressed in microsomal samples was determined as described
in section 2.6. (A) Quantitative Western blot illustrating bands of known amounts of
FMO1 standard microsomes and FMO1 expressing insect cell microsome sample and
(B) a calibration curve generated from the intensities of the standard bands (r2 =
0.9981).
136

Figure 3.1.3. Metabolites of TAZ generated by human FMO2.1 catalysed
oxidation. UV-HPLC chromatogram of M1 (7.6 min), M2 (11.4 min) and M3 (14.5
min) generated from incubations of TAZ with Sf9 insect cell microsomes containing
heterologously expressed human FMO2.1 and NADPH. Reactions were carried out at
pH9.5 for 90 min at 37 °C
137

Figure 3.1.4: UV-Absorption spectra of TAZ metabolites generated by human
FMO2.1 catalysed oxidation. UV-absorption spectra of the products produced by
FMO2.1 metabolism of TAZ. Dotted line, M1; solid line M2; and dashed line, M3.
138

Figure 3.1.5. Mass spectra of TAZ metabolites generated from human FMO2.1
catalysed oxidation. Mass spectra and structures of the products from incubations of
TAZ with Sf9 insect cell microsomes containing heterologously expressed human
FMO2.1 and NADPH at pH 9.5 for 90 min at 37 °C. (A) M1, identified as the
sulphinic acid, has a molecular ion [M + H]+ m/z 269.07, with fragment ions at m/z
205.14 and 163.12. (B) M2, identified as the sulphenic acid, has a molecular ion [M +
H] + at m/z 253, with fragment ion peaks at m/z 235 and 193 and (C) M3, identified as
the carbodiimide, has a molecular ion [M + H]+ ) m/z 203.13 with a fragment ion at
m/z 161.11.
139

metabolite as the sulphinic acid derivative. The mass spectrum of M2 had a
molecular ion [M + H] + at m/z 253, with fragment ions at m/z 235 and 193 (Fig.
3.1.5A). The mass of the molecular ion of M2 is in accord with a structure in which
TAZ has incorporated a single oxygen atom, and thus supports identification of M2 as
the monooxygenated, sulphenic acid derivative. The metabolite M3 has a molecular
ion [M + H]+ at m/z 203.13, which suggests that it is the carbodiimide generated by
elimination from M2 of the oxidized sulfur atom (Fig. 3.1.5C). Previously synthesized
authentic standards of TAZ-sulphinic acid and TAZ-carbodiimide (Qian et al. 2006)
were used to confirm the identity of M1 and M3. UV-HPLC chromatograms and UV
spectra generated from authentic standards of TAZ-sulphinic acid and TAZ-
carbodiimide are given in Figure 3.1.6. Comparison of their HPLC elution times (Fig.
3.1.6), UV spectra (Fig. 3.1.7) and MS spectra (Qian et al. 2006) with those of the
synthetic standards unambiguously identified the metabolites M1 and M3 as the
sulphinic acid and carbodiimide derivatives of TAZ, respectively.
The same three metabolites (the sulphinic acid, sulphenic acid and
carbodiimide derivatives) were also produced when TAZ was incubated with purified
EtaA or with Sf9 cell microsomes containing heterologously expressed human FMO1
or FMO3 (Fig 3.1.8). Previous work identified M1 and M3 as products formed by the
action of these enzymes on TAZ(Qian et al. 2006). Although the sulphenic acid
derivative (M2) was not detected, it was postulated as an intermediate in the enzyme-
catalyzed metabolism of TAZ (Qian et al. 2006). To confirm this, incubations of TAZ
with heterologously expressed human FMO2.1 were quenched at different time points
(Fig. 3.1.9). It is clear from the results that formation and accumulation of M2
precedes that of M1 and M3, indicating that M2 is an intermediate in the formation of
the latter two metabolites.
140

A TAZ-SULPHINIC ACID
B
TAZ-CARBODIIMIDE
Figure 3.1.6. UV-HPLC Chromatograms of TAZ metabolite standards. Reverse
phase chromatograms obtained for (A) TAZ-sulphinic acid (7.6 min) and (B) TAZ-
carbodiimide standard (14.5 min).
141

Figure 3.1.7: UV-spectra of TAZ metabolite standards. TAZ-sulphinic acid
standard (top) gives a major peak at 325 nm and a smaller peak at approximately 220
nm. (Bottom) TAZ-carbodiimide standard gives a major peak at 295 and 220 nm.
142

A TAZ
TAZ-SULPHENIC ACID
TAZ-SULPHINIC ACID
TAZ-CARBODIIMIDE
B
C
Figure 3.1.8: Metabolites of TAZ generated by human FMO1, FMO3 and EtaA
catalysed oxidation. UV-HPLC chromatogram of TAZ-sulphinic acid (7.6 min),
TAZ-sulphenic acid (11.4 min) and TAZ-carbodiimide (14.5 min) generated from
incubations of TAZ with Sf9 insect cell microsomes containing heterologously
expressed (A) human FMO1 (B) human FMO3 and (C) EtaA and NADPH in pH 8.4
(for FMO1 and FMO3) or 7.5 (EtaA) for 90 min at 37 °C.
143

Figure 3.1.9: Time Course Experiment of TAZ oxidation by human FMO2.1.
UV-HPLC chromatograms of the products from incubations of TAZ with Sf9 insect
cell microsomes containing heterologously expressed human FMO2.1 and NADPH at
pH 9.5 and 37 °C for 0 min (A) 10 min (B) or 20 min (C).
144

Catalytic oxidation of ETA by human FMO2.1.
ETA and FMO2.1 reactions were analysed by liquid chromatography-mass
spectroscopy (LC-MS) as described in section 2.7.
Incubation of ETA with Sf9 microsomes containing heterologously expressed
human FMO2.1, in the presence of NADPH, resulted in the formation of a major
product, P1, with LC retention time of 6.2 min (Fig. 3.1.10A). The mass spectrum of
P1 had a molecular ion [M + H]+ at m/z 183, with fragment ions at m/z 151 and 133
(Fig. 3.1.10B). The mass of the molecular ion of P1 is 16 atomic mass units more than
that of the molecular ion of ETA (166), suggesting a structure in which ETA has
incorporated one oxygen atom (Fig. 3.1.10B). This supports identification of P1 as
the S-oxide of ETA. The mass spectrum of P1 is identical to that of authentic ETA S-
oxide (Vannelli et al. 2002), therefore unambiguously identifying this metabolite as
the S-oxide of ETA. A mass spectrum of the broad peak with a LC retention time of
approx. 3 min (Fig. 3.1.10A) could not be obtained.
Development of a spectrophotometric assay of TAZ oxidation.
Although, reverse phase HPLC was used to identify metabolites generated by FMOs,
access to this method was not always available. For this reason a UV-spectroscopy
based enzyme assay was developed to determine the kinetic parameters of TAZ and
FMOs.
An assay was developed to monitor the rate of decrease in TAZ
spectrophotometrically as a measure of its oxygenation by FMOs (described in section
2.8.2.1). First, the UV properties of TAZ were investigated. A UV absorption
145
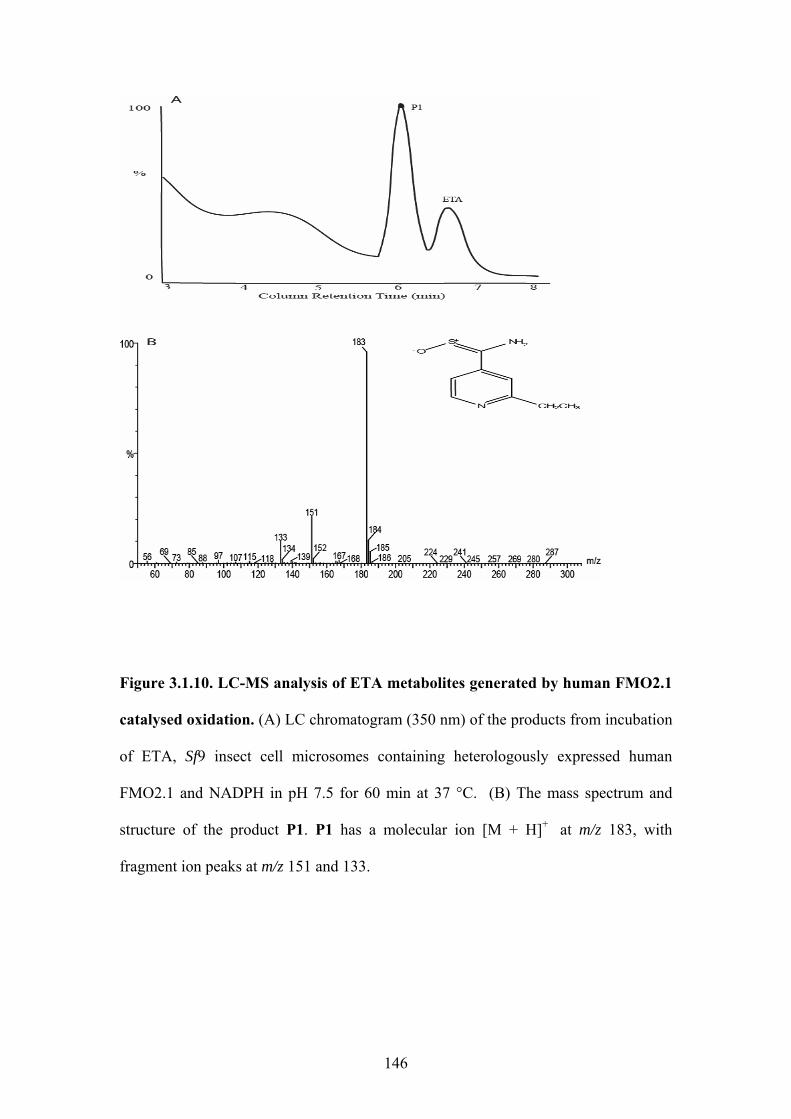
Figure 3.1.10. LC-MS analysis of ETA metabolites generated by human FMO2.1
catalysed oxidation. (A) LC chromatogram (350 nm) of the products from incubation
of ETA, Sf9 insect cell microsomes containing heterologously expressed human
FMO2.1 and NADPH in pH 7.5 for 60 min at 37 °C. (B) The mass spectrum and
structure of the product P1. P1 has a molecular ion [M + H]+ at m/z 183, with
fragment ion peaks at m/z 151 and 133.
146

spectrum of TAZ revealed an absorption maximum at 328 nm and a smaller peak at
approximately 220 nm (Fig. 3.1.11). The absorbance of TAZ at 328 nm was linear
between 1 and 20 μM (Fig. 3.1.12) and at this wavelength the molar extinction
coefficient of TAZ in 0.1% DMSO was determined as 38,300 ± 2,320 M-1cm-1.
Incubation of TAZ, in the presence of NADPH, with Sf9 cell microsomes
containing heterologously expressed human FMO1, FMO2.1 or FMO3, or with
purified EtaA, resulted in a decrease in TAZ absorbance at 328 nm that was linear
over time (Fig. 3.1.13A and B) and with respect to enzyme concentration (data not
shown). No decrease in TAZ absorbance was observed in the absence of EtaA or
human FMOs, or when microsomes prepared from non-infected Sf9 cells were used
(Fig. 3.1.14). Omission of NADPH from reaction mixes containing heterologously
expressed human FMOs resulted in a very small (<1% of that observed in the
presence of NADPH) and short-lived (<2 min.) decrease in TAZ absorbance (Fig.
3.1.15). This is due to the presence of endogenous NADPH in the insect cell
microsomes. This spectrophotometric assay was used to determine the pH optima and
kinetic parameters of enzyme-catalyzed oxidation of TAZ.
Effect of pH on TAZ oxidation catalyzed by human FMOs and EtaA.
FMO1, FMO2.1 and FMO3 display different pH optima for enzymatic activity
(Krueger et al. 2002; Qian et al. 2006; Siddens et al. 2008). The dependence of FMO
activity on pH with respect to TAZ oxidation was measured spectrophotometrically as
described in section 2.7.2.1.1.
The activity of EtaA and heterologously expressed human FMO1, FMO2.1
and FMO3 towards TAZ was assessed in buffers of pH 7.5, 8.5 or 9.5. All enzymes
displayed activity towards TAZ throughout the tested range. Each FMO however,
147

Figure 3.1.11: UV-spectra of TAZ. TAZ in DMSO gives a major peak at 328 nm
and a smaller peak at approximately 220 nm as measured using a UV-
spectrophotometer.
148

Figure 3.1.12: Linear absorbance of TAZ . The absorbance of TAZ at 328 nm was
determined over a range of concentrations. The molar extinction coefficient for TAZ
was calculated using the gradient of the straight line (r2 = 0.996).
149

Figure 3.1.13A: Human FMO2.1- and NADPH-dependent decrease in TAZ
absorbance at 328 nm is linear. TAZ (20 µM) was incubated with insect cell
microsomes containing heterologously expressed human FMO2.1, NADPH at pH 9.5
and 37 °C. Rate of TAZ oxidation was determined from 1-5 minutes.
150

328 nm
Figure 3.1.13B: Human FMO2.1- and NADPH-dependent decrease in TAZ
absorbance at 328 nm over time.
t = 0 t = 1 min t = 3 min t = 5 min
151

Figure 3.1.14: UV-spectra at 328 nm in the presence of non-infected insect cell
microsomes and NADPH. No decrease in TAZ absorbance was observed in the
presence of non-infected insect cell microsomes and NADPH at pH 9.5 at 37 °C. The
change in absorbance during the first minute represents scattering.
152

Figure 3.1.15: Human FMO2.1-dependent decrease in TAZ absorbance in the
absence of NADPH at 328 nm. TAZ (20 µM) was incubated with insect cell
microsomes containing heterologously expressed human FMO2.1 in the absence of
NADPH at pH 9.5 and 37 °C.
153

had a particular pattern of pH-dependent activity. The pH optimum for the oxidation
of TAZ was 8.5 for human FMO1 and FMO3, and 9.5 for human FMO2.1 and EtaA
(Fig. 3.1.16).
Assessing FMO catalytic capacity using methimazole as a control substrate.
Human FMOs were first tested for catalytic activity towards methimazole to ensure
that the Sf9 insect cell microsomes were of good quality. Kinetic parameters were
determined for FMO1-, FMO2.1- and FMO3-catalyzed oxygenation of methimazole,
a probe substrate of the FMOs. The rate of methimazole S-oxygenation was
monitored spectrophotometrically by monitoring the rate of decrease of 5-thio-2-
nitrobenzoic acid (TNB) at 412 nm. Steady state kinetic parameters were determined
for human FMOs using the non-linear regression application of the Kinetics module
(v.3.1) of SigmaPlot (v.10)
KM values obtained for FMO1, FMO2.1 and FMO3 were in good agreement
with previously published data (Dolphin et al. 1998; Krueger et al. 2002; Furnes et al.
2004) (Table 3.1.1). This confirms microsomes containing heterologously expressed
FMO1, FMO2.1 or FMO3 were suitable for determining the kinetic parameters for
TAZ.
Kinetics of TAZ oxidation by human FMOs and EtaA.
The kinetics of TAZ oxidation catalyzed by EtaA or by heterologously expressed
human FMO1, FMO2.1 or FMO3 were evaluated by determining the initial rates of
TAZ oxidation, measured spectrophotometrically, over a range of TAZ concentrations
(Fig. 3.1.17 and data not shown) as described in section 2.8.2.2. Assays were
performed at the optimum pH for each enzyme (see above). Steady state kinetic
154

parameters were determined for human FMOs and EtaA using the non linear
regression application of the Kinetics module (v.3.1) of Sigmaplot (v.10).
Human FMOs and EtaA displayed hyperbolic Michaelis-Menten relationship
between enzyme activity and TAZ concentration. Michaelis-Menten and Hanes-
Woolf plots obtained for human FMO catalysed TAZ oxygenation is given in Figure
3.1.17.
TAZ was an excellent substrate for the human FMOs and EtaA (Table 3.1.2).
The KM values for TAZ oxidation catalyzed by human FMO1, FMO2.1, FMO3 and
EtaA are in the low micromolar range and very similar to each other (Table 3.1.2).
The kcat of the FMO2.1-catalyzed reaction is much higher than that of reactions
catalyzed by human FMO1, FMO3 or EtaA (Table 3.1.2). Consequently, kcat/KM (the
specificity constant) for TAZ is much higher for human FMO2.1 than for the other
three enzymes (Table 3.1.2).
Kinetic analysis of the reaction between human FMO2.1 and TAZ was
evaluated by reverse phase HPLC in order to validate the UV-spectroscopy assay.
ETA was used as an internal standard. The kinetic analysis methodology using HPLC
is detailed in section 2.8.4. A standard curve corresponding to the ratio of the
integrated HPLC peak of TAZ and ETA plotted against TAZ concentration was used
to determine the amount of unmetabolised TAZ in the reaction (Fig. 3.1.18). Table
3.1.3 summarises the kinetic parameters for human FMO2.1 and TAZ determined by
the HPLC and UV methods. There was no statistical difference observed in KM or
kcat values determined from the use of an HPLC- or the UV-based assay, thus
validating the UV spectrophotometric method (p>0.05).
155

Figure 3.1.16. Effect of pH on the rate of TAZ oxygenation by purified EtaA or
Sf9 insect cell microsomes containing heterologously expressed human FMO1,
FMO2.1 or FMO3. The decrease in TAZ over time was measured at 328 nm in the
presence of NADPH in buffers at pH 7.5, 8.5 or 9.5.
156

Table 3.1.1: Kinetic Parameters of enzyme catalysed oxidation of Methimazole.
Enzyme KM
(µM)
kcat
(min-1)
kcat/ KM
(min-1M-1) (x104)
FMO1 8.08 ± 2.35 2.27 ± 0.30 28.1 ± 7.95
FMO2.1 575 ± 60.02 31.5 ± 2.11 5.48 ± 0.68
FMO3 29 ± 4.06 2.60 ± 0.38 8.97 ± 1.81
The S-oxygenation of methimazole by human FMOs was determined as described in
section 2.8.1. KM (µM), kcat (min-1), kcat / KM (min-1 / M-1) are reported as mean ±
standard error obtained from enzyme assays performed in triplicate on microsomes
isolated from a single infection of Sf9 cells.
157

Figure 3.1.17A: Non-linear regression and linear transformation of the
Michaelis-Menten equation for human FMO1 catalysed TAZ oxidation (A)
Michaelis-Menten curve of TAZ oxygenation catalysed by Sf9 insect cell microsomes
containing heterologously expressed human FMO1 in the presence of NADPH and a
buffer at pH 8.5. (B) Linear transformation of Michaelis-Menten data using Hanes-
Woolf regression.
158
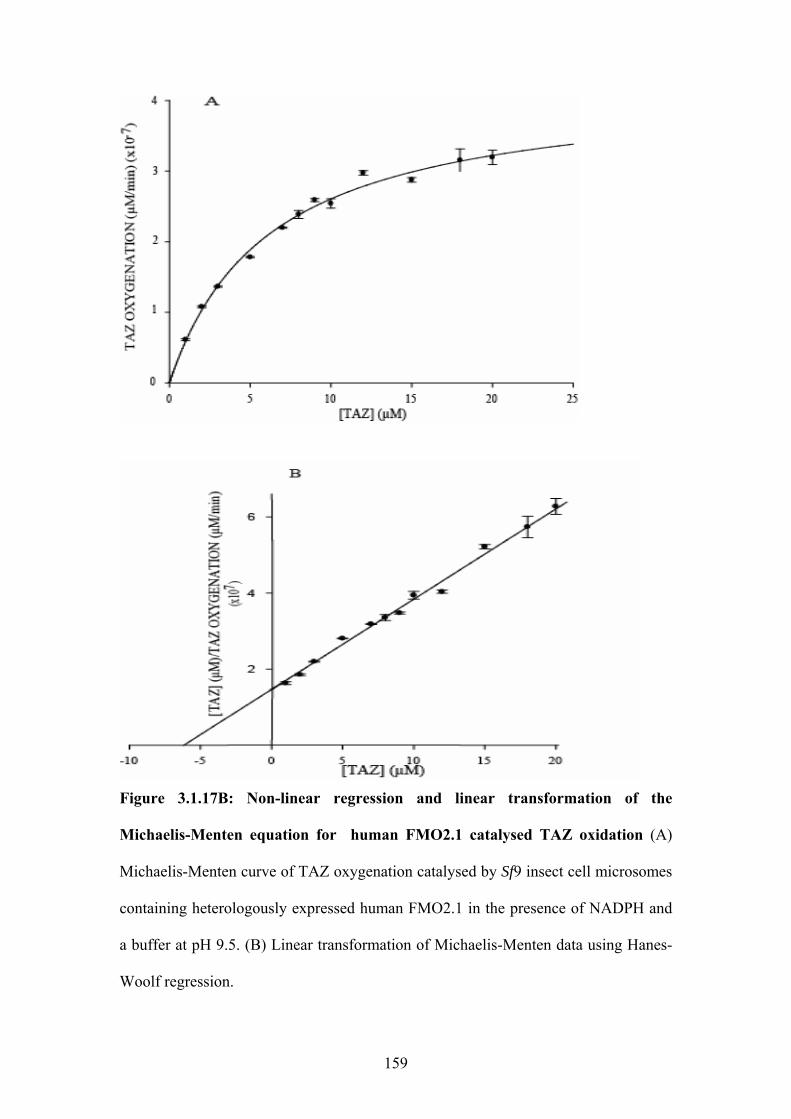
Figure 3.1.17B: Non-linear regression and linear transformation of the
Michaelis-Menten equation for human FMO2.1 catalysed TAZ oxidation (A)
Michaelis-Menten curve of TAZ oxygenation catalysed by Sf9 insect cell microsomes
containing heterologously expressed human FMO2.1 in the presence of NADPH and
a buffer at pH 9.5. (B) Linear transformation of Michaelis-Menten data using Hanes-
Woolf regression.
159

Figure 3.1.17C: Non-linear regression and linear transformation of the
Michaelis-Menten equation for human FMO3 catalysed TAZ oxidation (A)
Michaelis-Menten curve of TAZ oxygenation catalysed by Sf9 insect cell microsomes
containing heterologously expressed human FMO3 in the presence of NADPH and a
buffer at pH 8.5. (B) Linear transformation of Michaelis-Menten data using Hanes-
Woolf regression.
160
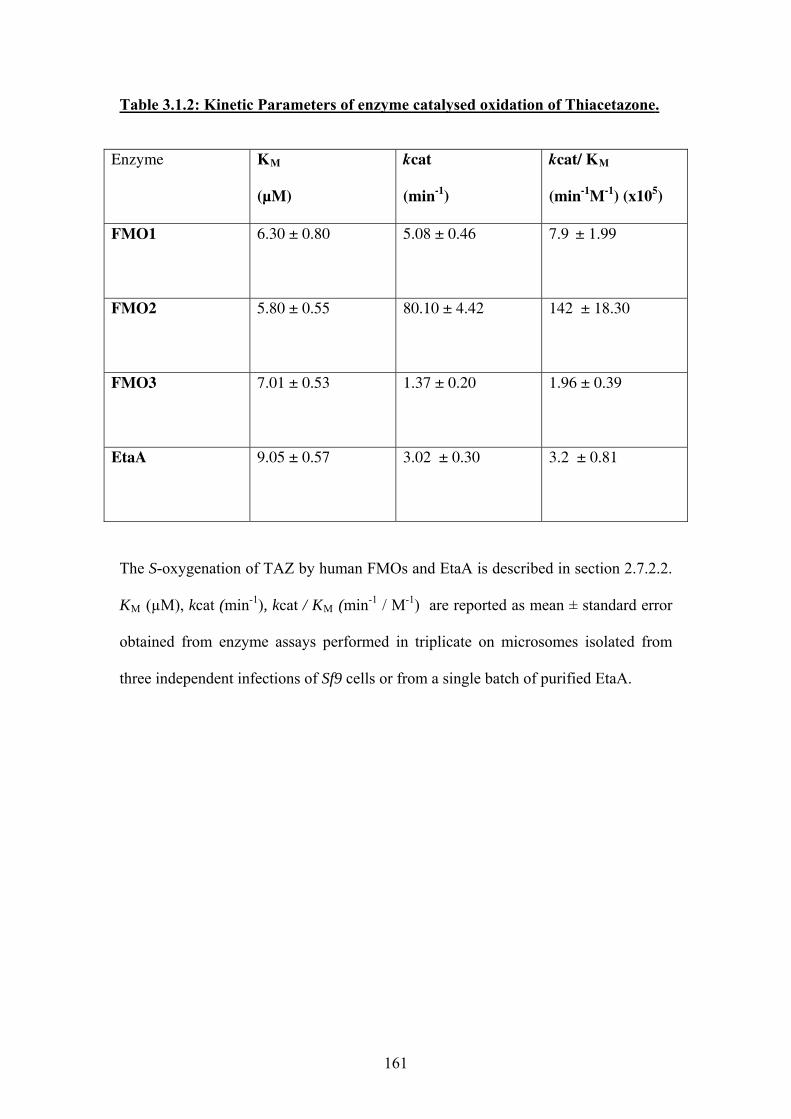
Table 3.1.2: Kinetic Parameters of enzyme catalysed oxidation of Thiacetazone.
Enzyme
KM
(µM)
kcat
(min-1)
kcat/ KM
(min-1M-1) (x105)
FMO1 6.30 ± 0.80 5.08 ± 0.46 7.9 ± 1.99
FMO2 5.80 ± 0.55 80.10 ± 4.42 142 ± 18.30
FMO3 7.01 ± 0.53 1.37 ± 0.20 1.96 ± 0.39
EtaA 9.05 ± 0.57 3.02 ± 0.30 3.2 ± 0.81
The S-oxygenation of TAZ by human FMOs and EtaA is described in section 2.7.2.2.
KM (µM), kcat (min-1), kcat / KM (min-1 / M-1) are reported as mean ± standard error
obtained from enzyme assays performed in triplicate on microsomes isolated from
three independent infections of Sf9 cells or from a single batch of purified EtaA.
161
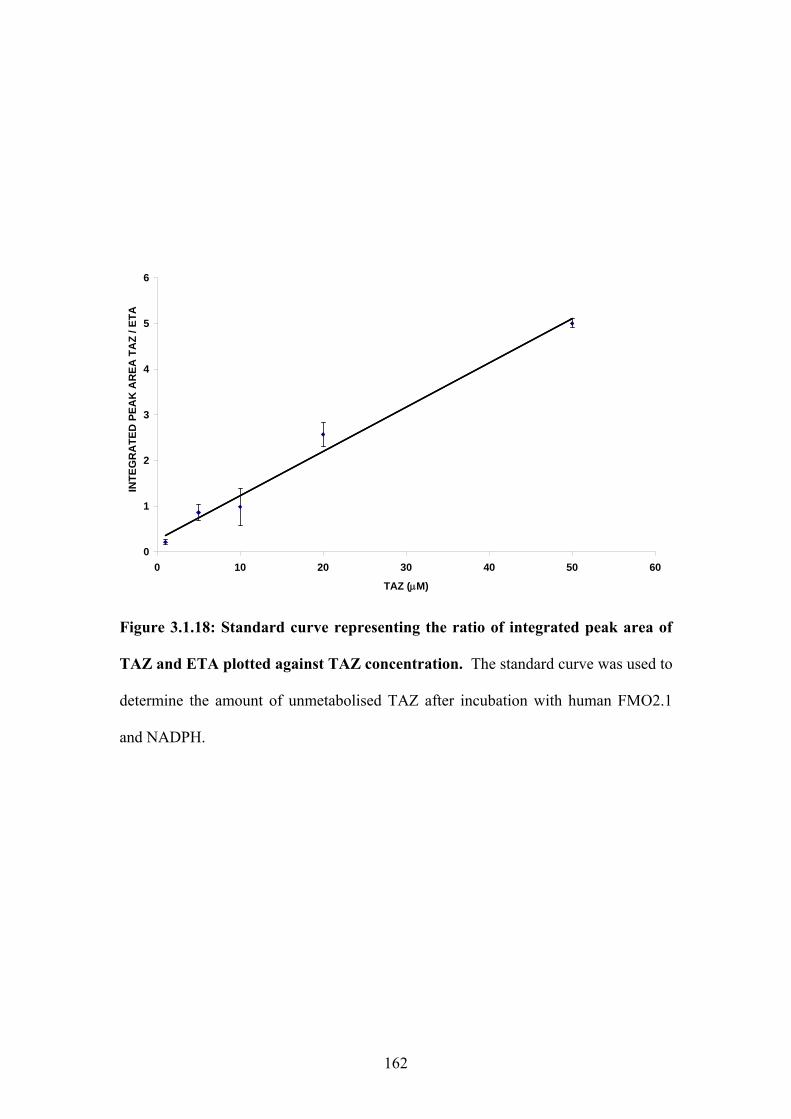
0
1
2
3
4
5
6
0 10 20 30 40 50
TAZ (μM)
INTE
GR
ATE
D P
EAK
AR
EA T
AZ
/ ETA
60
Figure 3.1.18: Standard curve representing the ratio of integrated peak area of
TAZ and ETA plotted against TAZ concentration. The standard curve was used to
determine the amount of unmetabolised TAZ after incubation with human FMO2.1
and NADPH.
162

Table 3.1.3: Comparison of kinetic parameters of human FMO2.1 catalysed TAZ
oxidation determined by HPLC and UV-spectroscopy.
Method KM
(µM)
kcat
(min-1)
UV-Spectroscopic Assay 5.80 ± 0.55 80.10 ± 4.42
HPLC Assay 5.90 ± 0.52 71.47 ± 6.80
The S-oxygenation of TAZ by human FMO2.1 is described in section 2.8.3 and 2.8.4.
Kinetic parameters determined by a UV-spectroscopy based assay and by reverse
phase HPLC (KM (µM) and kcat (min-1) are reported as mean ± standard error
obtained from enzyme assays performed in triplicate on microsomes isolated from a
single infection of Sf9 cells.
163

In summary, this section has established TAZ to be an excellent substrate for human
FMO2.1 and identifies the products of this reaction to be TAZ-sulphinic acid, TAZ-
carbodiimide formed from a common intermediate precursor, a sulphenic acid of
TAZ. Kinetic studies confirm this enzyme to be catalytically more efficient at this
reaction than is the bacterial FMO, EtaA or human FMO1 or 3.
164
Discussion-Analysis of the reaction between human FMO2.1 and the Anti-
tubercular drugs Thiacetazone and Ethionamide.
Thiacetazone (TAZ) and Ethionamide (ETA) are second-line antibiotics prescribed in
the treatment of pulmonary tuberculosis. TAZ and ETA are pro-drugs which require
metabolic activation by the mycobacterial enzyme EtaA, to exert a cytotoxic effect.
The aim of this section was to establish whether anti-tubercular drugs,
thiacetazone (TAZ) and ethionamide (ETA) are substrates for human FMO2.1 and
whether this enzyme catalysed the same reaction as the Mycobacterial FMO, EtaA.
Experiments carried out in this investigation have shown human FMO2.1 to be
capable of catalysing the S-oxygenation of TAZ. The metabolites generated, the
sulphinic acid, sulphenic acid and carbodiimide of TAZ are the same as those
identified for EtaA, FMO1 and FMO3 in this investigation. Although, a previous
study had identified the sulphinic acid and carbodiimide as the products of EtaA,
FMO1 and FMO3 catalysed oxidation, a sulphenic acid intermediate was postulated
to be the precursor of these metabolites (Qian et al. 2006). Experiments carried out as
part of this investigation have for the first time, identified the intermediate as the
sulphenic acid of TAZ.
Human FMO2.1 catalysed the oxidation of ETA to generate the corresponding
S-oxide. Though the S-oxide has been identified as the product of EtaA oxidation
(DeBarber et al. 2000; Vannelli et al. 2002; Hanoulle et al. 2006), these studies also
identify the corresponding amide and nitrile of ETA. According to our results, human
FMO2.1 does not generate these products and this finding is supported by others
(Henderson et al. 2008). Given that S-oxides are generally pharmacologically less
toxic than the parent compound, it can be presumed that individuals prescribed ETA
and who express FMO2.1 in the lung will not be at a higher risk of drug toxicity.
165
Conversely, given that FMO2.1 can oxidise ETA, the inactivation of the drug before it
reaches Mycobacteria may result in reduced drug efficacy. This suggests that
individuals expressing this enzyme are at a genetic disadvantage with regard to ETA
metabolism.
Analyses of kinetic parameters indicate FMO2.1 to be more efficient at TAZ
oxygenation than EtaA, human FMO1 and FMO3 as a measure of the specificity
constant (kcat/KM). KM determined for the enzymes was similar indicative of them
having similar affinities for this substrate. The high value of the specificity constant
of FMO2.1 was therefore a result of a higher kcat rather than a lower KM. Although
kinetic parameters were determined at optimum pH for each enzyme, human FMO2.1
was still the most effective at TAZ oxygenation at a more physiological pH, pH 7.5
(Fig 3.1.16) .
The catalytic cycle of FMOs described in section 1.2.2 illustrates how the rate-
limiting step in an FMO-catalysed reaction is not the binding of a substrate. In a
mechanism unique to FMOs, the enzyme is ‘ready’ to oxygenate a substrate before it
(the substrate) has bound. Tight binding between enzyme and substrate is therefore
not required but a single point of contact with the active site (the 4a-peroxyflavin
intermediate) is sufficient for the substrate to be oxidised. The rate-limiting step is
therefore the release of one molecule of water and the subsequent recycling of FAD to
peroxyflavin after the oxygenation of the substrate. This implies that a given FMO
would have similar kcat values for all of its oxidisable substrates. Comparison of kcat
values obtained for TAZ and methimazole for FMO1, FMO2.1 or FMO3 respectively
are in the same order of magnitude and conform to this expectation (Table 3.1.1 and
3.1.2). Comparison of kcat values determined for human FMO2.1 towards thiourea
and ethylene-thiourea (Henderson et al. 2004) are similar to that obtained for TAZ in
166

this investigation. Similarly the relatively low kcat values determined for human
FMO1 and FMO3 are comparable to those obtained for the oxygenation of a panel of
thioureas by these enzymes (Onderwater et al. 2006). The high kcat value obtained
for human FMO2.1 in this section implies that the enzyme is more efficient at
catalysing the rate-limiting step than is FMO1 or FMO3. The high KM and high kcat
determined for the reaction between methimazole and human FMO2.1 (Table 3.1.1) is
comparable to that observed for purified and heterologously expressed rabbit FMO2
and this substrate (Lawton et al. 1991).
FMOs generally catalyse the detoxification of xenobiotics. The prototypic
product of FMO reactions is the non-toxic and non-reactive N- and S-oxide. But
thiourea compounds undergo FMO-dependent bioactivation in which the metabolites
generated are more toxic than the parent compound (Smith et al. 2002; Henderson et
al. 2004; Onderwater et al. 2004; Onderwater et al. 2006) . Sulphenic acids of
thioureas (generated by FMO oxygenation) are electrophiles that can react reversibly
with glutathione (GSH) an important anti-oxidant in a mammalian cell (Ziegler-
Skylakakis et al. 1998; Henderson et al. 2004). The sulphenic acid of TAZ can react
with GSH to give rise to TAZ and to oxidised GSH (GSSG) (Qian et al. 2006). In
the presence of GSH reductase, a concurrent cycle may establish with the net effect
being the depletion of GSH in a cell, and regeneration of the parent compound
subsequently leading to oxidative stress and cell toxicity (Fig. 3.1.19) (Krieter et al.
1984; Henderson et al. 2004; Onderwater et al. 2004). Sulphenic acid metabolites can
react covalently with other thiol-containing molecules like cysteine residues in
proteins (Decker et al. 1992). This can perturb the function of proteins and enzymes
directly and is likely to be detrimental for cellular functions. TAZ-carbodiimide can
167

Figure 3.1.19: Diagram depicting TAZ metabolites generated by the oxidation of FMO and the interaction with glutathione (GSH).
Adapted and revised from Qian et al. 2006.
168
GSH Reductase

169
form covalent bonds with GSH thus reducing the amount of an anti-oxidant in a cell
(Qian et al. 2006). Human FMO1, FMO2.1 and FMO3 are therefore able to catalyse
the oxygenation of TAZ to give rise to metabolites which are known to be toxic to a
mammalian cell.
Given that human FMO1, FMO2.1 and FMO3 catalyse the bioactivation of
TAZ may explain the basis of the adverse drug reactions observed in patients
prescribed with this drug (Harland 1962; Aquinas 1968; Axton 1971; Hussain et al.
1973; Bedi et al. 1974; Anonymous 1981; Gupta et al. 1983; Fegan et al. 1991;
Brown 1992; Ipuge et al. 1995; Lawn et al. 1999; Dieng et al. 2001). The role of
FMOs in the in vivo bioactivation of TAZ is supported by the fact that TAZ-related
adverse reactions are observed in tissues in which FMOs are expressed:
hepatotoxicity, FMO3 in the liver (Dolphin et al. 1996; Hernandez et al. 2004);
gastrointestinal problems, FMO1 in the small intestine (Yeung et al. 2000); and skin
rashes, FMO1 and FMO3 in skin (Janmohamed et al. 2001). TAZ is not prescribed to
patients who suffer from human immunodeficiency virus (HIV) as adverse clinical
effects are exasperated. The underlying mechanism of this cytotoxicity is not known
but the severity of TAZ-induced toxicity correlates to the level of immunosupression
(Nunn et al. 1992). It is noteworthy that immunocompromised individuals display
impairment in glutathione homeostasis and deficiency of glutathione is established in
patients with HIV (Eck et al. 1989; Staal et al. 1992a; Staal et al. 1992b; Staal et al.
1992c). Given that glutathione mediates a detoxification process by reducing
sulphenic acids of thiourea-containing compounds, it is speculated that the
pronounced adverse affects in HIV patients may be due to the accelerated cellular
toxicity induced by the accumulation of TAZ-sulphenic acid in the absence of
glutathione.

In humans, FMO1 and FMO3 are expressed in the kidney and liver
respectively and may contribute to TAZ activation in extra-pulmonary tissues. Inter-
individual and inter-racial differences are reported for expression in FMOs. The
expression of FMO1 is significantly higher in the kidney of African-Americans than
in Caucasians (Krause et al. 2003). Significant variations in the amount of FMO1
expressed in the kidney is reported within individuals and is suggested to be a result
of upstream promoter variants identified in the FMO1 gene (Hines et al. 2003).
Genetic polymorphisms in the human FMO3 gene result in protein variants with
altered catalytic activity (reviewed by Phillips et al. 2007 and Phillips et al. 2008)
one of which, L360P has increased activity (Lattard et al. 2003). Amino acid variants
of human FMO3 are implicated in the altered metabolism and therapeutic outcome of
certain drugs (Stormer 2000; Hisamuddin et al. 2004; Mayatepek et al. 2004;
Hisamuddin et al. 2005). Genetic polymorphisms in upstream promoter regions that
affect transcription of FMO3 have been identified (Koukouritaki et al. 2005;
Koukouritaki et al. 2007). This suggests that some people may metabolise TAZ more
in the liver and kidney than in others. The result of this inter-individual difference
may affect the amount of unmetabolised TAZ reaching the lung and thus
Mycobacteria.
In humans, the expression of FMO2 is ethnic-dependent (Dolphin et al. 1998;
Whetstine et al. 2000). All Europeans and Asians genotyped to date possess the
FMO2*2 allele in which a C>T substitution at position 1414bp replaces a glutamine
amino acid residue with a premature stop codon (Dolphin et al. 1998). The resulting
protein, FMO2.2, is catalytically inactive and is not detected in human lung (Dolphin
et al. 1998). In sub-Saharan Africa, up to 50% of individuals possess at least one
copy of the ancestral allele (FMO2*1) and are expected to express catalytically
170

functional protein (FMO2.1) in the lung (Dolphin et al. 1998; Krueger et al. 2002;
Veeramah et al. 2008). The in vitro bioactivation of TAZ catalysed by FMO2.1
observed in this investigation suggests that individuals expressing this enzyme in the
lung are likely to be predisposed to TAZ-related toxicity in this tissue. The reaction
between TAZ and FMO2.1 in the lung represents a non-specific activation of this
drug and will consequently lead to less TAZ being activated by EtaA in
Mycobacteria. The net effect of the reaction is the production of reactive metabolites
in lung and the decrease in TAZ efficacy.
Given the high frequency of the ancestral form of FMO2 (FMO2.1) in a region
where TB is a major problem, may have implications on the toxicity and efficacy of
TAZ and ETA.
171

3.2 Kinetic Parameters of FMO3 Amino Acid Variants
Introduction
This section describes kinetic studies undertaken on amino acid variants of human
FMO3. Variant FMO3 proteins were assayed for TAZ oxygenation activity to assess
whether individuals possessing these variants may have altered metabolism of TAZ in
the liver and the skin.
Work in this chapter has focused on SNPs which are highly prevalent or
unique to the African population. This is because TAZ is only administered in certain
parts of Africa due to lack of resources. SNPs which are likely to have a significant
impact on the proteins ability to oxygenate TAZ are also investigated, even though
they may not be highly prevalent in the African population. The African population
has also been chosen as an average of 28% of Sub-Saharan Africans are found to
express a functionally active form of FMO2 (FMO2.1) (Dolphin et al. 1998; Krueger
et al. 2002; Veeramah et al. 2008). The remainder of the world’s population have
acquired a polymorphism, which introduces a premature stop codon and thus do not
produce functional FMO2 (Dolphin et al. 1998; Whetstine et al. 2000; Veeramah et
al. 2008), this aspect will be discussed later.
The four FMO3 SNPs to be investigated in this chapter are shown in Table
3.2.1.
Results – Kinetic Parameters of FMO3 Amino Acid Variants
FMO3 cDNA constructs containing the desired genetic substitutions were previously
prepared in the laborotary for bacterial expression (Allerston et al. 2009). Sub
cloning of these constructs to produce baculovirus for expression in insect cells is
described in chapter 2.9. Both strands of each cDNA were sequenced in order to
172

Table 3.2.1: Genetic polymorphisms of Human FMO3 investigated in this report.
GENETIC
SUBSTITUTION
AMINO ACID
SUBSTITUTION
AND POSITION
SOURCE SNP ID
g.15167G>A E158K
(Brunelle et al. 1997;
Dolphin et al. 1997;
Treacy et al. 1998;
Zschocke et al. 1999;
Furnes et al. 2003)
rs2266782
g.21443A>G
E308G
(Treacy et al. 1998;
Zschocke et al. 1999)
rs2266780
g.15167G>A,
g.21443A>G E158K/E308G
(Furnes et al. 2003;
Allerston et al. 2007)
rs2266782
rs2266780
g.21599T>C L360P (Furnes et al. 2003;
Lattard et al. 2003) rs28363581
Genetic and amino acid substitutions are given for FMO3 polymorphic variants
studied in this section. Publications which identified the polymorphism or
characterised the functional effect have been given. SNP id references are provided.
173
confirm the presence of the SNP and to ensure that other mutations were not
introduced during the cloning procedure. The original cDNA for FMO3 which has
been used in this section and in section 3.1 encodes methionine at position 486
(Dolphin et al. 1997). Subsequent studies have found isoleucine to be more common
at this position and thus the methionine residue has been reported as a polymorphism
(Cashman 2002). Prior to this knowledge, constructs had been prepared on the
methionine and isoleucine background. No population frequency data is available on
these SNPs and there are no reports of catalytic differences between the I486 and
M486 proteins. In this chapter the catalytic activities of heterologously expressed
FMO3 I486 and M486 have also been compared. Henceforth, FMO3 M486 will be
referred to as wild type (M486) and FMO3 I486 as wild type (I486). Figure 3.2.1
illustrates whether a SNP has been constructed on the I486 background or on the
M486 background. Amino acid variants G308 and P360 will be compared to wild
type (M486) whereas K158 and K158 / G308 will be compared to wild type (I486).
The FMO3 variants, K158, G308, K158/G308, P360 and wild type (I486) and
(M486) have been investigated by expressing each variant FMO3 protein using the
baculovirus/insect cell system. Insect cell microsomal membranes were isolated and
characterised for their ability to oxygenate TAZ. This was done using the UV
spectroscopic assay described in section 3.1. Previous reports have characterised the
effects of these SNPs towards methimazole, a probe substrate of the FMOs and
therefore, the activity of the variant FMO3 proteins towards methimazole was also
tested.
174

Positions of genetic and amino acid substitutions are shown above. Exons are numbered. G308 (B) and P360 (C) polymorphic variants were
constructed on the M486 background (A), whereas K158 (E) and K158/G308 (F) were on the I486 background (D).
Figure 3.2.1: Polymorphic Variants of Human FMO3 investigated in this Chapter
175

176
Methimazole S-Oxygenation by human FMO3 Amino Acid Variants
All protein variants were first tested for catalytic activity towards methimazole to
ensure that the insect cell microsomes were of good quality. The rate of methimazole
S-oxygenation was monitored spectrophotometrically by monitoring the rate of
decrease of 5-thio-2-nitrobenzoic acid (TNB) at 412 nm. Methimazole assays were
performed in triplicate on batches of microsomes isolated from three independent
infections of Sf9 cells. Steady state kinetic parameters, KM and Vmax were
determined for wild type and variant FMO3 proteins using the non-linear regression
application of the Kinetics module (v.3.1) of SigmaPlot (v.10). Turnover number
was calculated using Vmax values and enzyme concentration as described in chapter
2.9.8.2. The findings are summarised in Table 3.2.2 and 3.2.3.
All variant proteins catalysed methimazole S-oxygenation and a hyperbolic
Michaelis-Menten relationship was observed between methimazole concentration and
the initial rate of TNB disappearance.
Wild type (M486) (Fig. 3.2.1A) S-oxygenated methimazole with a turnover
number (kcat) and Michaelis constant (KM) of 2.95 ± 0.25 min-1 and 31.45 ± 2.05 µM
respectively. These finding are in agreement with previously published data (Dolphin
et al. 1997) (Table 3.2.2). Table 3.2.2 summarises kinetic data for FMO3 G308 (Fig.
3.2.1B) and FMO3 P360 (Fig. 3.2.1C) in comparison to wild type (M486) (Fig
3.2.1A). FMO3 G308 catalysed methimazole oxygenation with a kcat of 2.03 ± 0.83
min-1 and a KM of 49.50 ± 5.45 µM. This represents a 30% decrease in the turnover
number of FMO3 G308 when compared to that of wild type (M486) (p<0.05). The
KM of FMO3 G308 is observed to be higher than that of wild type (M486) but this
difference was not statistically significant (p>0.05). Although direct comparison to
published data is not possible (as published work refers to this SNP expressed on the

I486 background), the general effect of this SNP is in agreement with published data.
Lattard and co-workers report a ~25% decrease in catalytic activity and a 2.4-fold
increase in KM, similar to findings in this study (Lattard et al. 2003). Kinetic analysis
of FMO3 P360 showed this protein to be significantly more efficient at methimazole
oxygenation than wild type (M486) (p<0.05) with a kcat of 35.45 ± 3.50 min-1. The
turnover number for this variant is 4 -fold greater than that found for wild type
(M486). There was no significant difference however, in the KM values determined
for the two proteins (p>0.05). This trend is in good agreement with work in previous
publications in which a 4-fold increase in Vmax was observed (Lattard et al. 2003).
Table 3 summarises kinetic data for FMO3 K158 (Fig 3.2.1E) and FMO3
K158/G308 (Fig 3.2.1F) in comparison to wild-type (I486) (Fig 3.2.1C). Wild type
(I486) catalysed methimazole oxygenation and displayed a kcat of 6.26 ± 1.55 min-1
and a KM of 24.50 ± 1.70 µM. These kinetic parameters are within a similar range to
those already published (Lattard et al. 2003; Koukouritaki et al. 2007). kcat and KM
values for FMO3 K158 catalysed methimazole oxygenation was found to be 7.25 ±
2.91 min-1 and 39.40 ± 2.41 µM respectively. No significant difference was observed
in the turnover number between FMO3 K158 and wild type (I486) (p>0.05). This
data supports previous findings (Lattard et al. 2003). The double mutant, K158 /
G308 had significantly reduced activity compared to that of wild type (I486). The
double mutant catalysed methimazole S-oxygenation with a kcat of 0.60 ± 0.09 min -1
and a KM of 570 ± 26 µM. These kinetic parameters are significantly different from
those determined for wild type I486. The trend is in agreement with previously
published data, whereby the double mutant has diminished activity compared to that
of wild type FMO3, and the single variants K158 and G308. The KM of methimazole
177

Table 3.2.2: Methimazole S-oxygenation by human FMO3 (M486) and FMO3 amino acid variants
FMO3 Variant KM
(µM) kcat
(min-1) kcat / KM
(min-1 M-1) (x104) Relative Activity
(%)
Wild type (M486)
31.45 ± 2.05
2.95 ± 0.25
9.2 ± 2.10
100%
FMO3 G308
49.50 ± 5.45
2.03 ± 0.83
4.10 ± 0.67
45%*
FMO3 P360
35.45 ± 3.50
12.20 ± 3.45
34.5 ± 0.21
375%*
The S-oxygenation of methimazole by human FMO3 variants was determined as
described in section 2.9.8.1. KM (µM), kcat (min-1), kcat / KM (min-1 / M-1) are
reported as mean ± standard error obtained from enzyme assays performed in
triplicate on microsomes isolated from three independent infections of Sf9 cells.
Relative catalytic activity compared to that of wild type FMO3 is displayed (%).
*p<0.05 compared to the result of obtained for wild type (M486)
178
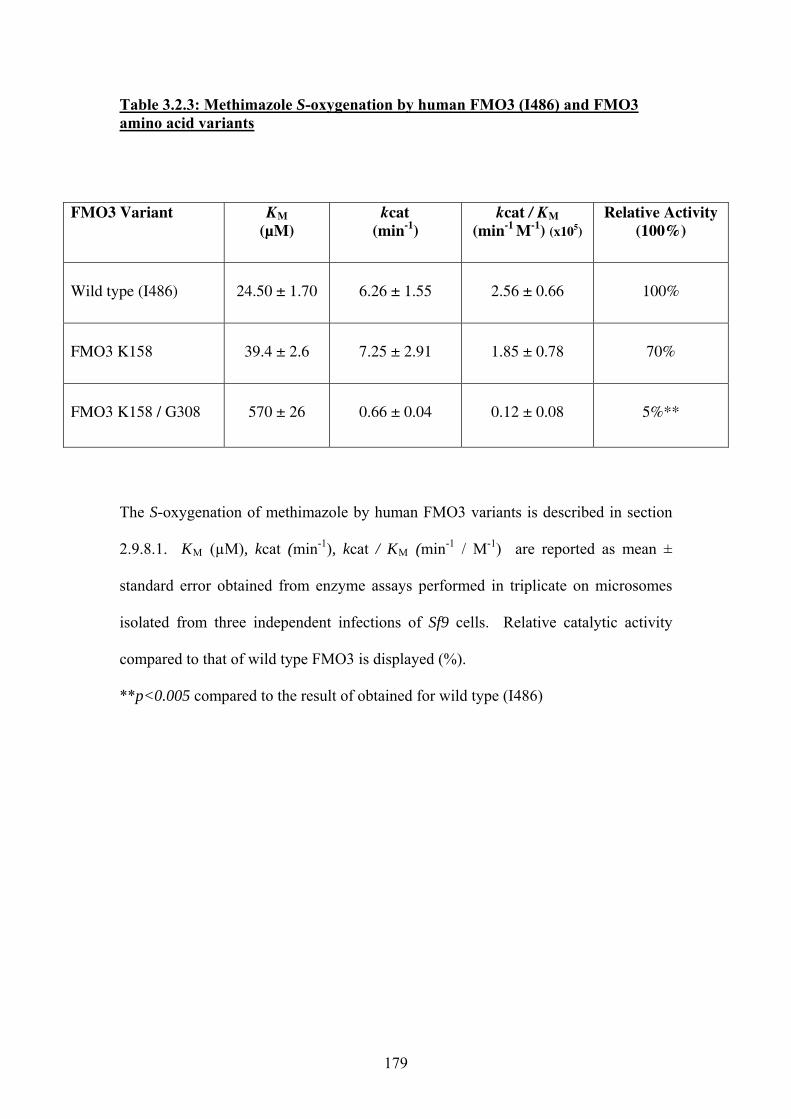
Table 3.2.3: Methimazole S-oxygenation by human FMO3 (I486) and FMO3 amino acid variants
FMO3 Variant KM
(µM) kcat
(min-1) kcat / KM
(min-1 M-1) (x105) Relative Activity
(100%)
Wild type (I486)
24.50 ± 1.70
6.26 ± 1.55
2.56 ± 0.66
100%
FMO3 K158
39.4 ± 2.6
7.25 ± 2.91
1.85 ± 0.78
70%
FMO3 K158 / G308
570 ± 26
0.66 ± 0.04
0.12 ± 0.08
5%**
The S-oxygenation of methimazole by human FMO3 variants is described in section
2.9.8.1. KM (µM), kcat (min-1), kcat / KM (min-1 / M-1) are reported as mean ±
standard error obtained from enzyme assays performed in triplicate on microsomes
isolated from three independent infections of Sf9 cells. Relative catalytic activity
compared to that of wild type FMO3 is displayed (%).
**p<0.005 compared to the result of obtained for wild type (I486)
179
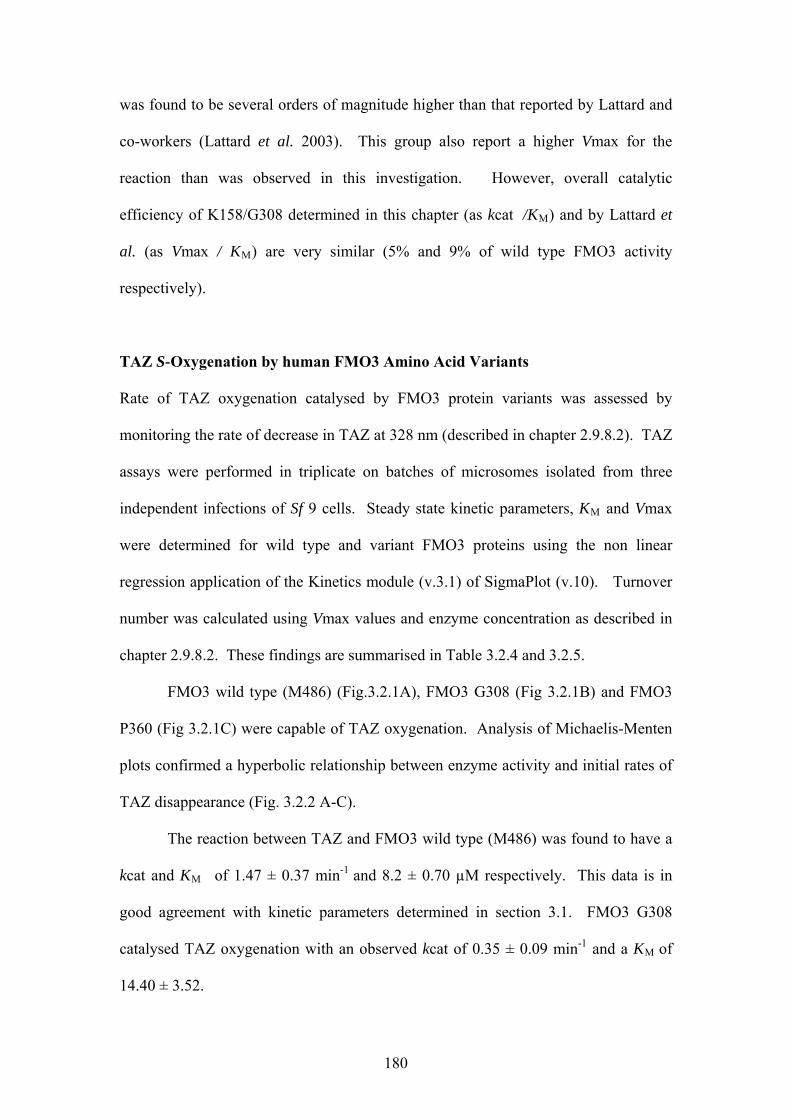
was found to be several orders of magnitude higher than that reported by Lattard and
co-workers (Lattard et al. 2003). This group also report a higher Vmax for the
reaction than was observed in this investigation. However, overall catalytic
efficiency of K158/G308 determined in this chapter (as kcat /KM) and by Lattard et
al. (as Vmax / KM) are very similar (5% and 9% of wild type FMO3 activity
respectively).
TAZ S-Oxygenation by human FMO3 Amino Acid Variants
Rate of TAZ oxygenation catalysed by FMO3 protein variants was assessed by
monitoring the rate of decrease in TAZ at 328 nm (described in chapter 2.9.8.2). TAZ
assays were performed in triplicate on batches of microsomes isolated from three
independent infections of Sf 9 cells. Steady state kinetic parameters, KM and Vmax
were determined for wild type and variant FMO3 proteins using the non linear
regression application of the Kinetics module (v.3.1) of SigmaPlot (v.10). Turnover
number was calculated using Vmax values and enzyme concentration as described in
chapter 2.9.8.2. These findings are summarised in Table 3.2.4 and 3.2.5.
FMO3 wild type (M486) (Fig.3.2.1A), FMO3 G308 (Fig 3.2.1B) and FMO3
P360 (Fig 3.2.1C) were capable of TAZ oxygenation. Analysis of Michaelis-Menten
plots confirmed a hyperbolic relationship between enzyme activity and initial rates of
TAZ disappearance (Fig. 3.2.2 A-C).
The reaction between TAZ and FMO3 wild type (M486) was found to have a
kcat and KM of 1.47 ± 0.37 min-1 and 8.2 ± 0.70 µM respectively. This data is in
good agreement with kinetic parameters determined in section 3.1. FMO3 G308
catalysed TAZ oxygenation with an observed kcat of 0.35 ± 0.09 min-1 and a KM of
14.40 ± 3.52.
180

Table 3.2.4: S-oxygenation of TAZ by Human FMO3 (M486) and FMO3 amino acid variants
FMO3 Variant KM
(µM) kcat
(min-1) kcat / KM
(min-1 M-1) (x105) Relative Activity
(%)
Wild type (M486)
8.2 ± 0.70
1.47 ± 0.37
1.80 ± 0.34
100%
FMO3 G308
14.40 ± 3.52
0.35 ± 0.09
0.24 ± 0.13
14%**
FMO3 P360
8.53 ± 0.83
4.05 ± 0.57
4.75 ± 0.81
263%*
The S-oxygenation of TAZ by human FMO3 variants is described in section 2.9.8.2.
KM (µM), kcat (min-1), kcat / KM (min-1 / M-1) are reported as mean ± standard error
obtained from enzyme assays performed in triplicate on microsomes isolated from
three independent infections of Sf9 cells. Relative catalytic activity compared to that
of wild type FMO3 is displayed (%).
*p<0.05 compared to the result of obtained for wild type (M486)
**p<0.005 compared to the result of obtained for wild type (M486)
181

Table 3.2.5: S- oxygenation of TAZ by Human FMO3 (I486) and FMO3 amino acid variants
FMO3 Variant KM
(µM) kcat
(min-1) kcat / KM
(min-1 M-1)(x105) Relative Activity
(%)
Wild type (I486)
10.80 ± 1.33
1.70 ± 0.25
1.57 ± 0.30
100%
FMO3 K158
8.80 ± 0.57
1.87 ± 0.19
2.12 ± 0.26
135%
FMO3 KI58 / G308
N.D
N.D
N.D
N.D
The S-oxygenation of TAZ by human FMO3 variants is described in section 2.9.8.2.
KM (µM), kcat (min-1), kcat / KM (min-1 / M-1) are reported as mean ± standard error
obtained from enzyme assays performed in triplicate on microsomes isolated from
three independent infections of Sf9 cells. Relative catalytic activity compared to that
of wild type FMO3 is displayed (%).
N.D: Enzyme activity was not detected.
182

Figure 3.2.2A: Non-linear regression and linear transformation of the Michaelis-
Menten equation for FMO3 wild type (M486) catalysed TAZ oxidation (A)
Michaelis-Menten curve of TAZ oxygenation catalysed by Sf9 insect cell microsomes
containing heterologously expressed FMO3 wild type (M486) in the presence of
NADPH and a buffer at pH 8.4. (B) Linear transformation of Michaelis-Menten data
using Hanes-Woolf regression.
183
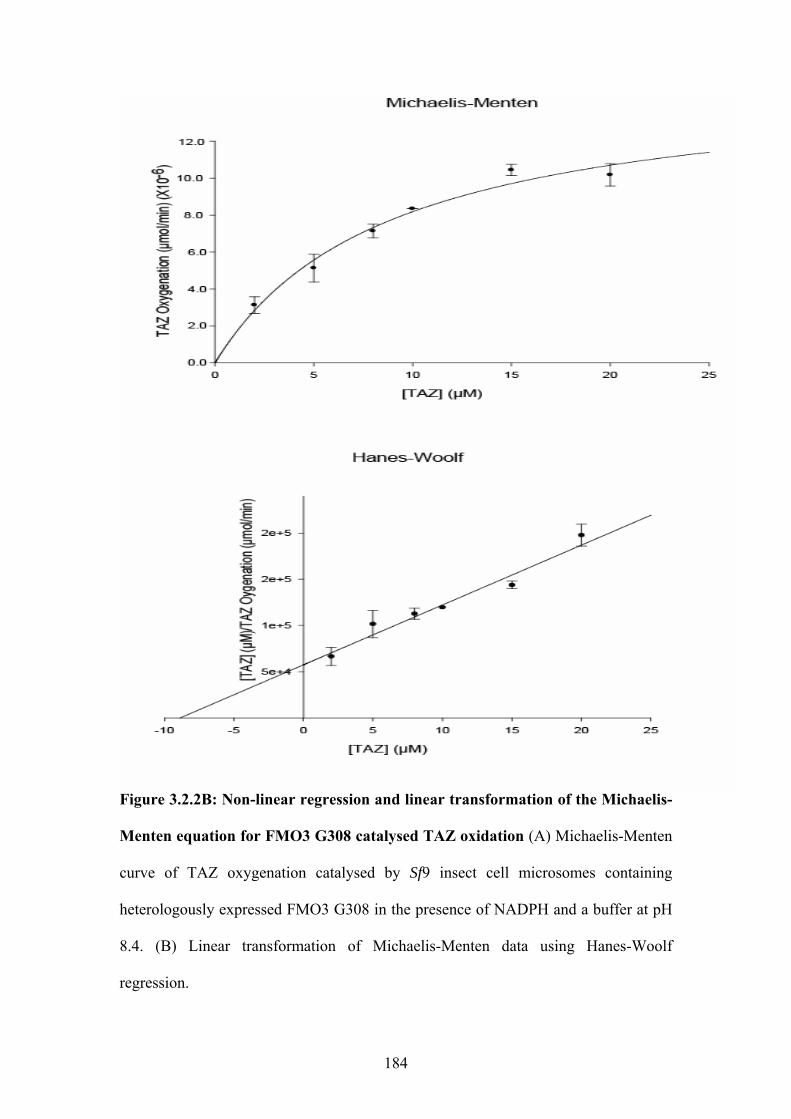
Figure 3.2.2B: Non-linear regression and linear transformation of the Michaelis-
Menten equation for FMO3 G308 catalysed TAZ oxidation (A) Michaelis-Menten
curve of TAZ oxygenation catalysed by Sf9 insect cell microsomes containing
heterologously expressed FMO3 G308 in the presence of NADPH and a buffer at pH
8.4. (B) Linear transformation of Michaelis-Menten data using Hanes-Woolf
regression.
184

Figure 3.2.2C: Non-linear regression and linear transformation of the Michaelis-
Menten equation for FMO3 P360 catalysed TAZ oxidation (A) Michaelis-Menten
curve of TAZ oxygenation catalysed by Sf9 insect cell microsomes containing
heterologously expressed FMO3 P360 in the presence of NADPH and a buffer at pH
8.4. (B) Linear transformation of Michaelis-Menten data using Hanes-Woolf
regression.
185

Compared to wild type (M486), this variant shows a significant decrease in TAZ
oxygenation activity. The kcat / KM of this reaction is approximately 85% lower than
that of wild type (M486) (p<0.005). A small increase in the KM of the reaction
between FMO3 G308 and TAZ was observed when compared to that of wild type
(M486) and TAZ, however this is not of statistical significance (p>0.05). These
findings suggest that individuals expressing FMO3 G308 in the liver may metabolise
TAZ at a much lower rate than those who possess the wild type form. Analysis of
FMO3 P360 found this enzyme to be significantly more efficient at TAZ oxygenation
than wild type (M486) (p< 0.05). The kcat of the FMO3 P360 catalysed reaction was
found to be 4.05 ± 0.57 min-1, 2.7-fold greater than that observed for wild type
(M486). No significant difference was observed in the KM of TAZ and FMO3 P360
(8.53 ± 0.83 µM) compared to that of wild type (M486) and TAZ (p>0.05). These
findings suggest that individuals possessing this variant in the liver are likely to
metabolise TAZ much faster than those who possess the wild type form.
FMO3 wild type (I486) (Fig.3.2.1D) and FMO3 K158 (Fig 3.2.1E) were
capable of TAZ oxygenation. Analysis of Michaelis-Menten plots confirmed a
hyperbolic relationship between enzyme activity and initial rates of TAZ
disappearance (Fig. 3.2.3A and B). No TAZ oxygenation activity was observed for
the K158/G308 variant of FMO3.
kcat values for wild type (I486) and FMO3 K158 catalysed TAZ oxygenation
were determined as 1.70 ± 0.25 and 1.87 ± 0.19 min-1 respectively (see Fig. 3.2.1 D
and E). KM values for wild type (I486) and FMO3 K158 towards TAZ were found to
be 10.80 ± 1.33 and 8.80 ± 0.57 µM respectively (Table 3.2.5). kcat and KM values
for FMO3 K158 were not statistically different to those determined for wild type
(I486) (Table 3.2.5). This suggests that individuals expressing this variant in the liver
186

Figure 3.2.3A: Non-linear regression and linear transformation of the Michaelis-
Menten equation for FMO3 wild type (I486) catalysed TAZ oxidation (A)
Michaelis-Menten curve of TAZ oxygenation catalysed by Sf9 insect cell microsomes
containing heterologously expressed FMO3 wild type (I486) in the presence of pH
NADPH and a buffer at pH 8.4. (B) Linear transformation of Michaelis-Menten data
using Hanes-Woolf regression.
187
Figure 3.2.3B: Non-linear regression and linear transformation of the Michaelis-
Menten equation for FMO3 K158 catalysed TAZ oxidation (A) Michaelis-Menten
curve of TAZ oxygenation catalysed by Sf9 insect cell microsomes containing
heterologously expressed FMO3 K158 in the presence of NADPH and a buffer at 8.4.
(B) Linear transformation of Michaelis-Menten data using Hanes-Woolf regression.
188
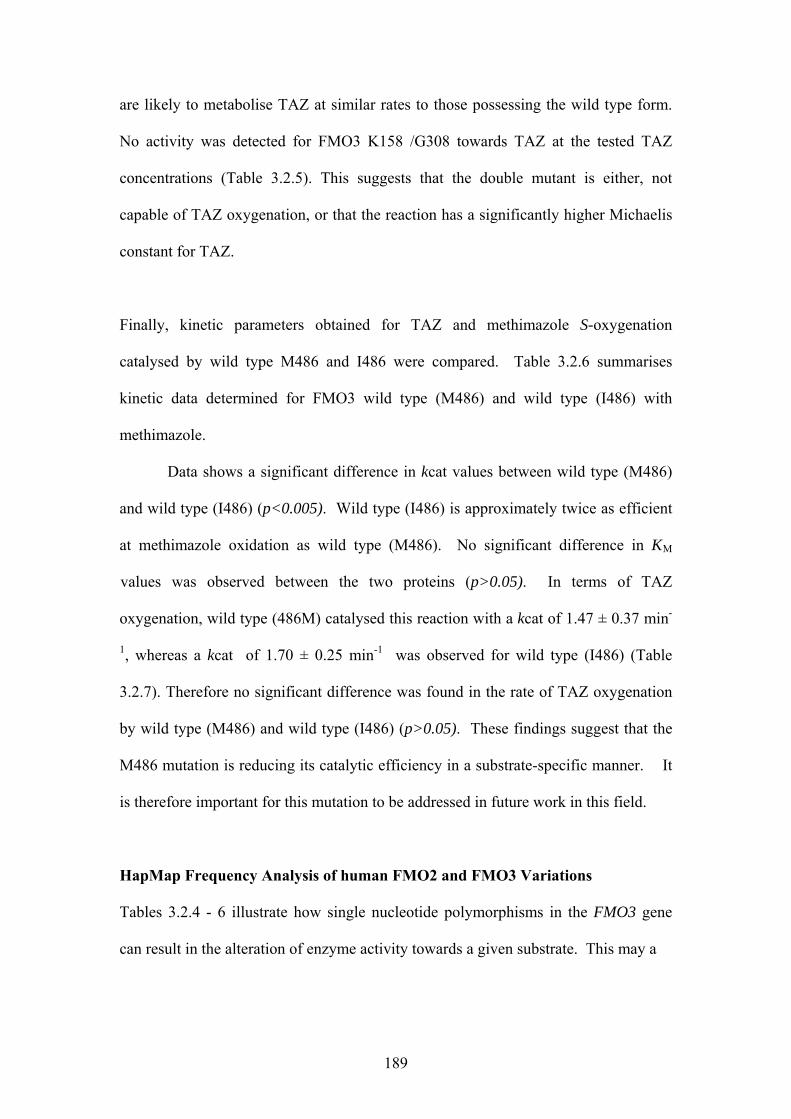
are likely to metabolise TAZ at similar rates to those possessing the wild type form.
No activity was detected for FMO3 K158 /G308 towards TAZ at the tested TAZ
concentrations (Table 3.2.5). This suggests that the double mutant is either, not
capable of TAZ oxygenation, or that the reaction has a significantly higher Michaelis
constant for TAZ.
Finally, kinetic parameters obtained for TAZ and methimazole S-oxygenation
catalysed by wild type M486 and I486 were compared. Table 3.2.6 summarises
kinetic data determined for FMO3 wild type (M486) and wild type (I486) with
methimazole.
Data shows a significant difference in kcat values between wild type (M486)
and wild type (I486) (p<0.005). Wild type (I486) is approximately twice as efficient
at methimazole oxidation as wild type (M486). No significant difference in KM
values was observed between the two proteins (p>0.05). In terms of TAZ
oxygenation, wild type (486M) catalysed this reaction with a kcat of 1.47 ± 0.37 min-
1, whereas a kcat of 1.70 ± 0.25 min-1 was observed for wild type (I486) (Table
3.2.7). Therefore no significant difference was found in the rate of TAZ oxygenation
by wild type (M486) and wild type (I486) (p>0.05). These findings suggest that the
M486 mutation is reducing its catalytic efficiency in a substrate-specific manner. It
is therefore important for this mutation to be addressed in future work in this field.
HapMap Frequency Analysis of human FMO2 and FMO3 Variations
Tables 3.2.4 - 6 illustrate how single nucleotide polymorphisms in the FMO3 gene
can result in the alteration of enzyme activity towards a given substrate. This may a
189

affect the metabolism of a therapeutic drug and furthermore have an impact on the
outcome of such a compound in vivo. In the second part of this section, analysis of
HapMap was undertaken to establish whether individuals possessing the ‘rapid’
variant of FMO3 might also possess the ancestral allele encoding the functional
FMO2.1 protein. The reason why this is deemed important is because functional
FMO2.1 is expressed only in a proportion of sub-Saharan African and Hispanic
individuals and the enzyme, as demonstrated in section 3.1, is capable of oxidising
TAZ to metabolites that are expected to be detrimental to a cell. Therefore
individuals expressing this protein in the lung and FMO3 P360 in the liver may be at
higher risk of adverse drug reactions.
HapMap is an international collaboration that catalogues genetic differences
and similarities in humans of different ethnic populations. This allows one to
investigate variations in several genes in a given individual. Table 3.2.8 depicts
information derived from HapMap on individuals from three African populations who
possess at least one copy of g.21599T>C (L360P) SNP in FMO3. Table 3.2.8 also
identifies which variant of FMO2 these individuals possess.
190

Table 3.2.6: S-oxygenation of methimazole by Human FMO3 (M486) and FMO3 (I486)
FMO3 Variant KM
(µM) kcat
(min-1) kcat / KM
(min-1 M-1) (x105)
Wild type (M486)
31.45 ± 2.05
2.95 ± 0.25
9.2 ± 2.10
Wild type (I486)
24.50 ± 1.70
6.26 ± 1.55**
2.56 ± 0.66
The S-oxygenation of methimazole by human FMO3 (M486) and (I486) is described
in section 2.9.8.1. KM (µM), kcat (min-1), kcat / KM (min-1 / M-1) are reported as
mean ± standard error obtained from enzyme assays performed in triplicate on
microsomes isolated from three independent infections of Sf9 cells.
**p<0.005 compared to the result obtained for wild type (M486)
191

Table 3.2.7: S- oxygenation of TAZ by Human FMO3 (M486) and FMO3 (I486)
The S-oxygenation of TAZ by human FMO3 variants is described in section 2.9.8.2.
KM (µM), kcat (min-1), kcat / KM (min-1 / M-1) are reported as mean ± standard error
obtained from enzyme assays performed in triplicate on microsomes isolated from
three independent infections of Sf9 cells.
FMO3 Variant KM
(µM) kcat
(min-1) kcat / KM
(min-1 M-1) (x105)
Wild type (M486)
8.2 ± 0.70
1.47 ± 0.37
1.80 ± 0.34
Wild type (I486)
10.80 ± 1.33
1.70 ± 0.25
1.57 ± 0.30
192

Table 3.2.8: Data extracted from HapMap for FMO3 g.21599T>C (FMO3 360Pro/Leu) and FMO2 g.23238C/T (FMO2-472Gln/STOP).
HapMap Chromosome
Identifier No.
FMO3 g.21599T>C
(FMO3 360Pro/Leu)
FMO2 g.23238C>T
FMO2 – 472Gln/STOP
Population
NA20340_c1 NA20340_c2
C (360Leu) T (360Pro)
T 472 STOP C 472 Gln
ASW
NA19438_c1 NA19438_c2
T (360Pro) C (360Leu)
T 472 STOP T 472 STOP
LKW
NA19182_c1 NA19182_c2
T (360Pro) C (360Leu)
T 472 STOP T 472 STOP
YRI
NA18855_c1 NA18855_c2
T (360Pro) C (360Leu)
T 472 STOP T 472 STOP
YRI
NA19093_NA19092_c1 NA19093_NA19092_c2
C (360Leu) T (360Pro)
T 472 STOP NO DATA
AVAILABLE
YRI
(HapMap Genome Browser (Phase 3 - genotypes, frequencies & LD,
www.hapmap.org). ASW = African ancestry in Southwest USA (population sampled:
82 individuals). YRI = Yoruba in Ibadan, Nigeria (population sampled: 256
individuals). LKW = Luhya in Webuye, Kenya (population sampled: 268
individuals).
193
Given that the g.21599T>C (L360P) polymorphisms encodes a protein with
higher catalytic activity, it is of particular interest to assess the frequency at which it
occurs in cis with FMO2 g.23238C (Q472, FMO2.1). Such individuals will express
functional FMO2 in their lungs and a rapid metaboliser of TAZ in the liver. Analysis
of the African data set on HapMap identifies one individual (out of a sample of 82), of
African-American descent to be heterozygous for g.21599T>C (L360P) and FMO2
g.23238C (Q472). Given the small sample size (82 individuals) and the fact that
L360P is a rare polymorphism it is of no surprise that only one individual was
identified. Nevertheless, this finding is of importance as it confirms that the two
polymorphisms can and do occur together. Allelic frequencies cannot be calculated
from data obtained from one individual and so we have considered frequency data of
g.21599T>C (L360P) and FMO2 g.23238C (Q472) that have been published by
studies employing larger samples. The number of individuals estimated to possess at
least one copy of the ancestral allele of FMO2.1 is 28% in African-Americans
(Dolphin 1998, Whetstine 2000). The frequency of individuals heterozygous for the
g.21599T>C (L360P) polymorphism has been determined as 2% in an African-
American population (Furnes and Schlenk 2003). Thus assuming that the variations
assort independently, the frequency at which they occur in cis can be estimated by
multiplying the individual frequencies. By doing so, it is estimated that 0.56% of
African-American individuals will encode FMO3 P360 and FMO2.1 in their liver and
lungs respectively. Given that the population of African-Americans is approximately
36 million, the number of individuals possessing at least one copy of these
polymosphisms in cis is estimated to be around 20,000. Though not a considerably
high number, it must be noted that this figure may be in the order of several million in
194

sub-Saharan Africa (where these individuals have originally come from) since the
population of this area is in excess of 800 million.
195

Discussion – Kinetic Parameters of FMO3 Amino Acid Variants The impact of pharmacogenetics on anti-tubercular drug metabolism has been
established. Isoniazid (INH), an anti-tubercular prescribed since the 1950’s is a pro-
drug that requires metabolic activation by the Mycobacterial catalase-peroxidase
KatG to generate an irreversible inhibitor of the FAS II enzyme, InhA(Zhang et al.
1992; Banerjee et al. 1994). Variant alleles of human arylamine N-acetyltransferase
2 are implicated in the altered metabolism of Isoniazid. The drug undergoes
acetylation in the liver by arylamine N-acetyltransferase 2 (NAT2) and this process
represents the inactivation of the drug (reviewed in (Preziosi 2007)). The human
population can be divided into ‘rapid’, ‘moderate’ and ‘slow’ acetylators depending
on which variant allele of NAT2 they possess(Parkin et al. 1997; Singh et al. 2009).
‘Slow’ acetylators have slower rates of INH acetylation in the liver and are more
likely to develop neuropathy and hepatotoxicity as a result of the accumulation of
toxic intermediates of INH than those who are ‘rapid’ acetylators (Ellard et al. 1976;
Timbrell et al. 1977; Ellard et al. 1981; Possuelo et al. 2008).
Thiacetazone (TAZ) was once a widely prescribed drug against tuberculosis in
Africa, Asia, South America and Germany (Anonymous 1963; Anonymous 1968;
Heffernan 1968; Anonymous 1971; Mame Thierno, On et al. 2001). But numerous
reports of TAZ-induced dermatological reactions and hepatotoxicity led to this drug
being discontinued in the industrialised world (Narang ; Harland 1962; Aquinas 1968;
Axton 1971; Hussain et al. 1973; Bedi et al. 1974; Gupta et al. 1977; Fegan et al.
1991; Fegan et al. 1991; Chintu et al. 1993; Ipuge et al. 1995; GOTHI 1998 ; Dieng et
al. 2001; Mame Thierno et al. 2001). Severe cutaneous rashes including Stevens-
Johnson syndrome have frequently been reported for patients taking TAZ and early
studies on this drug have shown ethnic-dependent side effects (Miller et al. 1966).
196

Despite the availability of more effective and ‘safer’ antibiotics, certain parts of
Africa still receive TAZ as part of treatment for TB because of the lack of resources
(Lawn et al. 1999; (Keus et al. 2003). To date the underlying cause of the observed
adverse reactions has not been explained. It has been suggested that the toxicity may
be driven by the parent compound, by a reactive metabolite, impairment in
detoxification processes or by any combination of these factors (Park et al. 1990).
In humans the major FMO involved in hepatic drug metabolism is FMO3.
Expression of FMO3 while largely restricted to the liver in humans is expressed in the
skin in amounts comparable to other Phase I metabolising enzymes such as CYPs
2A6, 2B6 and 3A4 (Janmohamed et al. 2001). FMO3 is encoded from a highly
polymorphic gene and several polymorphisms give rise to amino acid variants with
altered catalytic capacity (reviewed in (Phillips et al. 2008)). This section of the
thesis describes five amino acid variants of human FMO3 and their capacity to
catalyse TAZ oxygenation. It is important to assess the catalytic activity of
commonly occurring amino acid variants of FMO3 towards TAZ oxygenation given
that the in vitro reaction between FMO3 and TAZ represents one of bioactivation as it
generates metabolites that represent chemically reactive species (discussed in section
3.1). It is expected that the catalytic efficiency of an FMO3 variant will dictate the
amount of reactive products produced (discussed in section 3.1).
The most common polymorphism g.15167G>A (E158K) has an allelic
frequency ranging from 19-50% depending on the population sampled (Dolphin,
Riley et al. 1997; Park, Chung et al. 1999; Zschocke, Kohlmueller et al. 1999;
Cashman and Zhang 2002; Park, Kang et al. 2002; Lattard, Zhang et al. 2003;
Koukouritaki, Poch et al. 2005; Hao, Sun et al. 2007). In African-Americans, the
frequency ranges from 45-50% and is the most common FMO3 polymorphism found
197

in this ethnic group (Dolphin et al. 1997; Lattard et al. 2003; Hao et al. 2007).
Heterozygotes for this polymorphism showed no significant decrease in TMA N-
oxidation as judged by the excretion of free TMA in urine (Zschocke et al. 1999). In
vitro studies by other groups have also shown the lack of significant effect of E158K
amino acid substitution on FMO3 catalysis towards several substrates (Lattard et al.
2003; Zhang et al. 2003; Koukouritaki et al. 2005; Shimizu et al. 2007). This finding
is confirmed in this investigation where no significant difference was observed in the
E158K protein ability to catalyse S-oxygenation of TAZ and methimazole. This
suggests that individuals possessing only this polymorphism of FMO3 are not likely
to metabolise TAZ less efficiently than those possessing the wild type enzyme.
A relatively common polymorphism g.21443A>G (E308G) has an allelic
frequency of 5-26% depending on the population sampled (Akerman et al. 1999; Park
et al. 1999; Cashman et al. 2001; Dolan et al. 2005; Koukouritaki et al. 2005; Hao et
al. 2007). The E308G mutation, unlike E158K, is less prevalent in African-
Americans, occurring in approximately 5% of individuals (Koukouritaki et al. 2007).
In vivo studies have shown the variant to have little consequence catalytically to
FMO3 efficiency (Sachse et al. 1999; Lambert et al. 2001). Kinetic data determined
for heterologously expressed G308 have shown moderate but substrate specific effects
of this mutation on enzyme catalysis (Stormer 2000; Lattard et al. 2003). In this
investigation we observe a significant decrease in enzyme efficiency. In the case of
methimazole S-oxygenation, a decrease of 55% was observed (Table 3.2.2) (P<0.05).
In the case of TAZ oxygenation, the E308G variant retained just 20% of the wild type
FMO3 capacity (p<0.005) as a measure of kcat /KM. This finding supports previous
reports that G308 displays substrate-specific catalytic efficiency. In terms of TAZ
metabolism, individuals expressing the G308 variant are likely to metabolise TAZ at a
198

slower rate in the tissues that normally express FMO3, the liver and skin, compared to
those who possess wild type FMO3. This may be beneficial for individuals receiving
TAZ as chemotherapy. The advantages of possessing a ‘slower’ enzyme are
discussed below.
The two polymorphisms g.15167G>A (E158K) and g.21443A>G (E308G)
occur in cis at an allelic frequency ranging from 1-16% depending on the population
sampled (Cashman et al. 2001; Hao et al. 2007; Koukouritaki et al. 2007). In
African- Americans, a small proportion (~1 %) of individuals possess a haplotype in
which g.15167G>A (E158K) and g.21443A>G (E308G) exist in cis (Allerston et al.
2007; Koukouritaki et al. 2007). The K158/G308 double variant when found in cis
has previously been shown to reduce FMO3 activity by around 50% in vivo (as
measured by the amount of free TMA excreted in urine samples compared to control
subjects) (Akerman et al. 1999; Akerman et al. 1999; Zschocke et al. 1999; Zschocke
et al. 2000). Another in vivo study investigating the metabolism of the H2-receptor
antagonist ranitidine, showed less ranitidine N-oxide, compared to control subjects, in
the urine of individuals possessing the K158/G308 variant (Park et al. 2002). The
activity of in vitro expressed K158/G308 shows a dramatic reduction in catalytic
activity when compared to either the K158 or G308 single variants (Park et al. 2002;
Lattard et al. 2003). The kinetic data presented in this investigation supports these
findings. The double variant displayed a significant reduction in enzyme efficiency,
retaining just 5% of FMO3 activity towards the S-oxygenation of methimazole (as a
measure of kcat/KM) (p<0.005). TAZ oxygenation catalysed by this variant was not
observed at the tested TAZ concentrations. This may indicate that the enzyme has
lost the ability to oxygenate TAZ as an effect of the amino acid substitutions, or that
the variant has a considerably higher Michaelis constant for this substrate. The
199

finding that the double variant has reduced activity towards TAZ and methimazole is
of concern to FMO3-substrate metabolism with particular reference to substrates of
therapeutic importance. FMO3-substrate metabolism shown to be affected by the
reduction of in catalytic efficiency of the K158/G308 variant occurring in cis includes
the H2-receptor antagonist ranitidine (Park et al. 2002) and the non-narcotic, non-
steroidal anti-inflammatory drug, sulindac (Hamman et al. 2000; Hisamuddin et al.
2004; Hisamuddin et al. 2005). In the latter case, a less active FMO3 enzyme has
been shown to be beneficial. The K158/G308 double variant is implicated in having a
protective effect on the development of polyps in familial adenomatous polyposis
patients who received sulindac as part of primary chemoprevention. The prodrug
sulindac, is converted by gut bacteria to the active metabolite sulindac sulphide.
FMO3 inactivates the drug by converting it to sulindac sulphoxide. The beneficial
outcome for a patient with an FMO3 protein with reduced enzyme activity is
presumed to be the result of the reduced ability of this enzyme to inactivate the drug
and thus leading to prolonged exposure to the active form of sulindac, sulindac
sulphide (Hisamuddin et al. 2004; Hisamuddin et al. 2005). The K158/G308 variant
protein therefore has the potential to affect the efficacy of a given therapeutic agent.
In the case of TAZ, the double variant K158/G308 and the single variant FMO3 G308
(described above) may both be advantageous to those receiving TAZ as part of TB
treatment. Mycobacterial infections are treated when TAZ is activated by the bacterial
FMO, EtaA (Qian et al. 2006; Alahari et al. 2007). This results in cell death. The
reaction of FMO3 and TAZ in vivo would therefore represent a ‘non-specific’ TAZ-
activation event that would not just give rise to chemically reactive species in a
mammalian cell (which we wish not to harm) but would also reduce the amount of
pro-drug reaching the Mycobacteria at the site of infection. This scenario is likely to
200

not only reduce the efficacy of the drug but also to produce harmful side effects in the
patient. So an individual who possesses an FMO3 variant which is catalytically
inefficient may be at a lower risk of TAZ bioactivation in the liver and skin and is
likely also to have increased drug delivery to the site of infection and thus increase
and prolong the exposure of the Mycobacteria to TAZ.
A rare polymorphism, g.21599T>C (L360P), is observed at an allelic
frequency of about 2% in African-American populations (Furnes et al. 2003; Lattard
et al. 2003). The polymorphism is thought to be unique to this ethnic group as it has
not been identified in Caucasians and Asians (Furnes et al. 2003; Lattard et al. 2003).
In vitro studies of heterologously expressed protein have shown that FMO3 P360 is
the only known variant of FMO3 to display an increased catalytic efficiency to
substrates. The substrates investigated were methimazole, TMA and 10-(N, N-
dimethylaminopentyl)-2-(trifluoromethyl) phenothiazine (5-DPT) (Lattard et al.
2003). This variant has therefore both increased N- and S-oxygenation activity. In the
studies we undertook, the P360 variant showed significantly higher catalytic
efficiencies towards both TAZ and methimazole when compared to wild type FMO3
(p<0.05). No data has been published on the in vivo consequence of this
polymorphism for drug metabolism. With respect to TAZ metabolism, we speculate
that individuals expressing the P360 variant may be at higher risk of mediating TAZ
activation in the liver and skin for reasons described above. The formation of
chemically reactive and oxidising metabolites (described in section 3.1) and depletion
of TAZ may be detrimental to individuals possessing this variant.
The functional effects of the g.24642G>A (M486) polymorphism have been
investigated. The allelic frequency of this polymorphism is yet to be determined.
Kinetic data obtained as part of this investigation has shown this variant to have
201

significantly reduced catalytic efficiency towards methimazole (but not to TAZ) when
compared to wild type FMO3 (I486), as a measure of the turnover number (p<0.05).
This finding supports previously described data regarding the substrate-specific
effects of certain amino acid substitutions on FMO3 activity.
In this section, the effect of five polymorphic variants on FMO3 enzyme
catalysis has been discussed, with particular reference to methimazole and TAZ.
Work in this section has focussed on functional effects of genetic polymorphisms
identified in the coding region of the human FMO3 gene and discussed how they
might influence the metabolism of an anti-tubercular in vivo. However, it must be
noted that genetic variations in upstream sequences (promoter and enhancer) of the
gene have not been analysed. It is possible than an individual expressing a ‘slow’
variant of FMO3 like G308 or K158/G308 may have additional polymorphisms in the
promoter region of this gene, whereby the expression of the protein is upregulated.
The production of more ‘slow enzyme’ would therefore be expected to have a
compensatory effect. Promoter variations have been identified by Koukouritaki and
co-workers and are shown to vary within ethnic groups(Koukouritaki et al. 2005;
Koukouritaki et al. 2007). Interestingly the group reported an inferred frequency of
5.6% of African-American individuals to possess a haplotype which encodes a high
activity promoter and at least one of the g.15167G>A (E158K) and/or g.21443A>G
(E308G) polymorphisms. Haplotype analysis has not been reported for the
g.21599T>C (L360P) polymorphism, it is yet to be seen whether an upstream
polymorphism will mask or exacerbate the functional effects of this variant.
In the second part of this section, an attempt was made to estimate the
frequency of individuals that possess the g.21599T>C (L360P) and the g.23238C
(Q472) alleles in cis. Though just a rough estimate, it was determined that more than
202

20,000 Africans in America and in excess of 4 million people in sub-Saharan Africa
may express FMO2.1 and FMO3 P360 in their lungs (FMO2.1), liver and skin
(FMO3). This may have implications regarding the metabolism of TAZ and other
xenobiotic compounds that are substrates for these enzymes.
Although, to elucidate the cause(s) or mechanism of TAZ-induced toxicity are
beyond the scope of this investigation, this section has described significant catalytic
differences in commonly found variants of human FMO3 which may be involved in
the inter-individual difference observed for the response towards TAZ treatment.
203

3.3 Metabolism of Thiacetazone by Mouse Tissue Microsomes
Introduction
Sections 3.1 and 3.2 described the in vitro metabolism of TAZ by heterologously
expressed human FMOs in microsomes prepared from insect cells. In this section,
microsomes prepared from mouse tissue have been used to investigate the relative
contribution of the flavin containing monooxygenases (FMOs) and cytochrome P450s
(CYPs) to TAZ metabolism.
Microsomes prepared from tissue are fragments of membranes of the
endoplasmic reticulum in suspension, they reflect (among other things) the tissue-
specific expression of Phase I drug metabolising enzymes. This makes them an
invaluable tool to investigate the contribution of such enzymes in the metabolism of a
given substrate in vitro. A UV spectroscopy assay (described in section 3.1 and
2.8.2.2) was used to analyse the rate of TAZ metabolism catalysed by microsomes
isolated from mouse liver and lung. Mouse liver was investigated for its capacity to
metabolise TAZ as the first site of metabolism of an orally administered drug is
thought to be the liver. The lung was analysed as this is thought to be the site of
activation of TAZ (by Mycobacterium tuberculosis) in the case of pulmonary
tuberculosis.
The expression of FMOs is known to be sex- and tissue-specific, the key sex-
difference in mice is the absence of FMO3 expression in the liver of adult males (Falls
et al. 1995; Falls et al. 1997). FMO3 continues to be expressed in adult, male lung
(Janmohamed et al. 2004). Lung and liver microsomes from male and female mice
were therefore analysed. Microsomes from liver and lung were prepared from three
mouse lines; wild type (C57BL/6 mice), Fmo1 (-/-), 2 (-/-), 4(-/-) line and an Fmo 5(-
204

/-) line. Each of the Fmo knockout lines was produced by back-cross breeding onto
the C57BL/6 line for 8 generations. Preparation of microsomes from the three mouse
lines allowed the investigation of the relative contribution of different members of the
FMO family of enzymes to TAZ metabolism to be analysed.
Results
Metabolism of TAZ by Liver Microsomes
Liver microsomes were prepared from wild type C57BL/6 mice, Fmo1 (-/-), 2 (-/-), 4
(-/-) and Fmo 5 (-/-) mouse line as described in section 2.10.1. The rate of TAZ
metabolism catalysed by mouse liver microsomes was monitored
spectrophotometrically and is described in section 2.10.2. Data represent mean ±
standard deviation obtained from two independent isolations of microsomes. All
assays were carried out in triplicate on each batch of microsomes.
Figures 3.3.1-3 represent Michaelis-Menten plots (Vo versus [TAZ]) obtained
for female liver microsomes prepared from the three mouse lines. Liver microsomes
from all three mouse lines catalysed TAZ metabolism and showed a hyperbolic
Michaelis-Menten relationship between initial rate of enzyme activity and substrate
concentration.
There are five FMO proteins to consider in the mouse. Studies on FMO
expression in mouse tissues have reported FMO1, FMO3 and FMO5 to be highly
expressed in female liver whereas FMO2 and FMO4 are not expressed (Falls et al.
1995; Janmohamed et al. 2004). Therefore in the case of wild type liver microsomes,
TAZ metabolism could be due to FMO1, FMO3 or FMO5 (Fig. 3.3.1). Experiments
shown in Fig. 3.3.2 implicate FMO1 in TAZ metabolism as there is a marked decrease
205

0
0.2
0.4
0.6
0.8
1
1.2
0 2 4 6 8 10TAZ (μΜ)
TAZ
OXY
GEN
ATI
ON
(nm
ol L
-1/m
in/ μ
g pr
otei
n)
12
Figure 3.3.1: νo versus [TAZ] plot for TAZ metabolism catalysed by wild type
female mouse liver microsomes. The rate of TAZ metabolism by wild type female
mouse liver microsomes was determined as described in section 2.10.2. Data are
mean ± standard deviation obtained from assays carried out in triplicate.
206

0
0.2
0.4
0.6
0.8
1
1.2
0 2 4 6 8 10TAZ (μΜ)
TAZ
OXY
GEN
ATI
ON
(nm
ol L
-1/m
in/ μ
g pr
otei
n)
12
Wild Type
Fmo1 (-/-),2 (-/-),4 (-/-)
Figure 3.3.2: νo versus [TAZ] plot catalysed by wild type and Fmo1 (-/-), 2 (-/-), 4
(-/-) female mouse liver microsomes. The rate of TAZ metabolism by wild type and
Fmo1 (-/-), 2 (-/-), 4(-/-) female mouse liver microsomes was determined as described
in section 2.10.2. Data are mean ± standard deviation obtained from assays carried
out in triplicate.
207
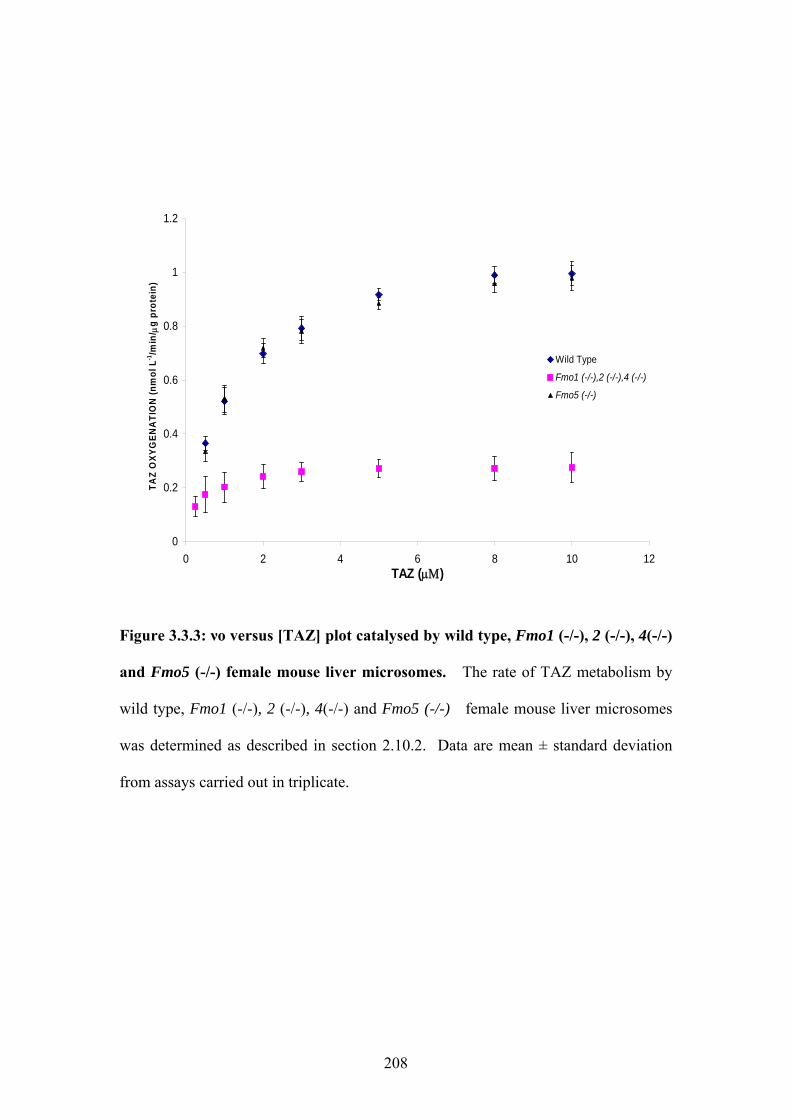
0
0.2
0.4
0.6
0.8
1
1.2
0 2 4 6 8 10TAZ (μΜ)
TAZ
OXY
GEN
ATI
ON
(nm
ol L
-1/m
in/ μ
g pr
otei
n)
12
Wild Type
Fmo1 (-/-),2 (-/-),4 (-/-)
Fmo5 (-/-)
Figure 3.3.3: νo versus [TAZ] plot catalysed by wild type, Fmo1 (-/-), 2 (-/-), 4(-/-)
and Fmo5 (-/-) female mouse liver microsomes. The rate of TAZ metabolism by
wild type, Fmo1 (-/-), 2 (-/-), 4(-/-) and Fmo5 (-/-) female mouse liver microsomes
was determined as described in section 2.10.2. Data are mean ± standard deviation
from assays carried out in triplicate.
208

in TAZ metabolism by microsomes isolated from the mouse line that has the Fmo1
gene deleted. In contrast, microsomes isolated from the Fmo 5 (-/-) line showed
similar metabolism to that of wild type microsomes (Fig 3.3.3). FMO5 therefore does
not contribute to hepatic TAZ metabolism. To establish whether these differences
were significant, rates of TAZ metabolism were analysed at saturating TAZ
concentrations. Figure 3.3.4 illustrates a significant decrease in TAZ metabolism by
microsomes isolated from liver of the Fmo1 (-/-), Fmo2 (-/-), Fmo 4 (-/-) line
compared to wild type liver microsomes(P<0.005). There is no significant
difference, however between wild type and Fmo 5 (-/-) liver microsomes (P>0.05).
FMO3 is expressed in liver microsomes from all three mouse line and its contribution
needs to be addressed. In the liver of a mouse, FMO3 is expressed in a sex-specific
manner whereby its expression is ‘turned off’ in males as a result of high testosterone
levels (Falls et al. 1995; Falls et al. 1997). In order to distinguish between the
contribution of FMO1 and FMO3 to the rate of TAZ metabolism, microsomes from
male liver were prepared. As shown in Figure 3.3.5 there is no significant difference
between male and female liver microsomes isolated from wild-type mice, indicative
that FMO3 is unlikely to contribute to the activity shown by female liver microsomes
(Fig. 3.3.1-4). Comparison between male, wild-type and Fmo5 (-/-) liver microsomes,
shows no significant difference in TAZ metabolism (Fig. 3.3.5) indicating that FMO5
is unlikely to contribute to this reaction. A small decrease in TAZ metabolism is
observed in male Fmo 1 (-/-), 2 (-/-), 4 (-/-) liver microsomes when compared to male
wild-type liver, however this difference is not statistically significant (p>0.05) (Fig.
3.3.5). Compared to female Fmo 1 (-/-), 2 (-/-), 4 (-/-) liver microsomes, male
microsomes from the same mouse line showed a significant increase in TAZ
209

0
0.2
0.4
0.6
0.8
1
1.2
1.4
Wild Type Fmo1 (-/-),2 (-/-),4 (-/-) Fmo5 (-/-)
TAZ
Met
abol
ism
(nm
ol L
-1 p
er m
in p
er μ
g pr
otei
n)
**
Figure 3.3.4: Rate of TAZ metabolism observed for female mouse liver
microsomes. The rate of TAZ metabolism catalysed by liver microsomes prepared
from female wild type, Fmo1 (-/-), 2 (-/-), 4 (-/-) and Fmo5 (-/-) mice was determined
as described in section 2.10.2. Data are mean ± standard deviation obtained from two
independent experiments. Enzyme assays were carried out in triplicate.
**p<0.005 compared to the result obtained from wild type female liver microsomes.
210
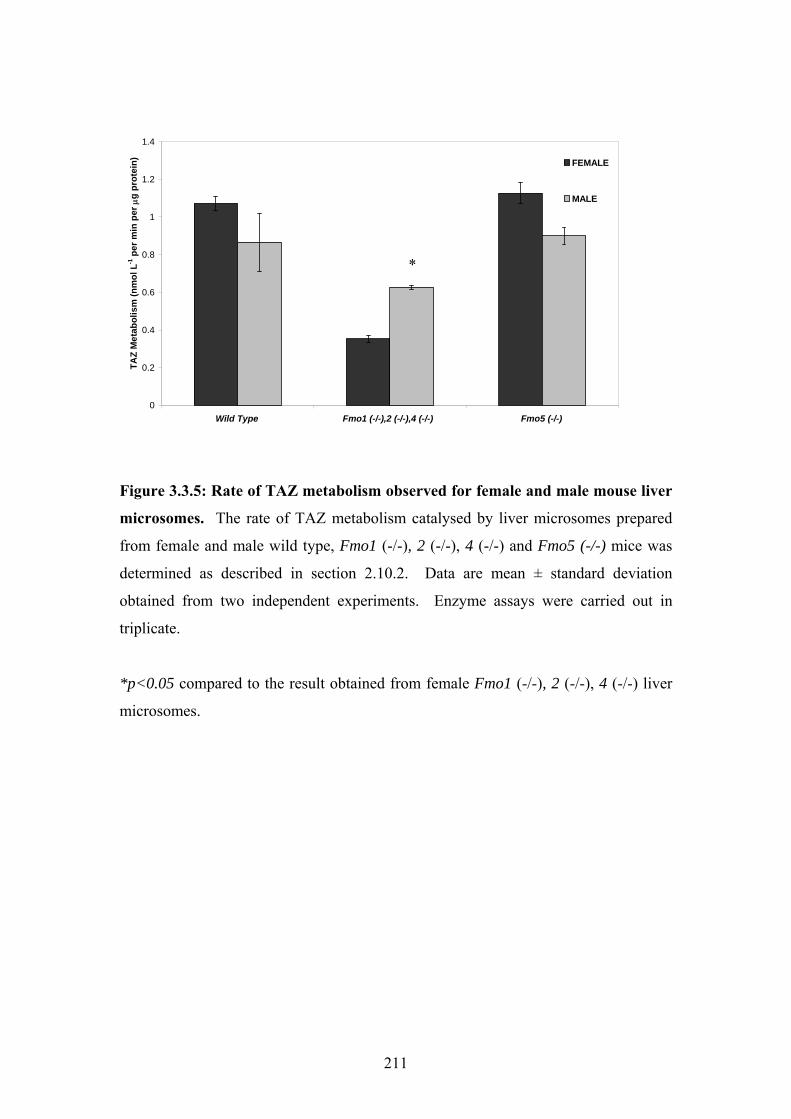
0
0.2
0.4
0.6
0.8
1
1.2
1.4
Wild Type Fmo1 (-/-),2 (-/-),4 (-/-) Fmo5 (-/-)
TAZ
Met
abol
ism
(nm
ol L
-1 p
er m
in p
er μ
g pr
otei
n) FEMALE
MALE
*
Figure 3.3.5: Rate of TAZ metabolism observed for female and male mouse liver
microsomes. The rate of TAZ metabolism catalysed by liver microsomes prepared
from female and male wild type, Fmo1 (-/-), 2 (-/-), 4 (-/-) and Fmo5 (-/-) mice was
determined as described in section 2.10.2. Data are mean ± standard deviation
obtained from two independent experiments. Enzyme assays were carried out in
triplicate.
*p<0.05 compared to the result obtained from female Fmo1 (-/-), 2 (-/-), 4 (-/-) liver
microsomes.
211
metabolism (p<0.005). These findings suggest the contribution of FMOs to TAZ
metabolism in male mice may be less than in female mice.
Although FMO contribution to TAZ metabolism has been confirmed, it was
important to assess whether FMOs are responsible for all of the TAZ metabolism
observed in the liver. The relative amount of FMO contribution to TAZ metabolism
was tested by using methods to distinguish between FMO and CYP activity.
Assessing FMO Contribution to TAZ Metabolism in Mouse Liver
Methimazole is used as a probe substrate and as a competitive inhibitor for FMO
activity (Dixit et al. 1984; Chung et al. 1997; Rawden et al. 2000; Stormer 2000;
Virkel et al. 2006). By acting as a competitive inhibitor, methimazole can be used to
inhibit FMO-dependent TAZ metabolism. Figure 3.3.6 shows the effect of pre-
incubation of female mouse liver microsomes with methimazole before the addition of
TAZ. In the presence of methimazole, a significant decrease in TAZ metabolism is
observed in the wild type (p<0.005) and Fmo5 (-/-) (p<0.05) female liver
microsomes, with a reduction of 48% and 35% in enzyme activity respectively. This
confirms that FMOs contribute to TAZ metabolism. In the Fmo 1 (-/-), 2 (-/-), 4 (-/-)
female liver microsomes, however, there is no significant difference between
methimazole treated and untreated samples (p>0.05). Given that there was no
significant decrease in TAZ metabolism in microsomes in which the Fmo1 gene had
been deleted further supports the role of FMO1 in the metabolism of this drug. In
male, microsomal liver samples, a decrease in TAZ metabolism activity was observed
for wild type, Fmo1 (-/-), Fmo2 (-/-), Fmo4 (-/-), and Fmo5 (-/-) knockout lines in the
presence of methimazole (Fig. 3.3.7), however this was only significant for wild-type
212

0
0.2
0.4
0.6
0.8
1
1.2
1.4
Wild Type Fmo1 (-/-),2 (-/-),4 (-/-) Fmo5 (-/-)
TAZ
Met
abol
ism
(nm
ol L
-1 p
er m
in p
er μ
g pr
otei
n)TAZ
TAZ+METHIMAZOLE
*
**
Figure 3.3.6: The effect of pre-treatment of female mouse liver microsomes with
methimazole on the rate of TAZ metabolism. Pre-treatment of liver microsomes
with methimazole is described in section 2.10.3.1. The rate of TAZ metabolism
catalysed by liver microsomes prepared from female and male wild type, Fmo1 (-/-), 2
(-/-), 4 (-/-) and Fmo5 (-/-) mice was determined as described in section 2.10.2. Data
are mean ± standard deviation obtained from two independent experiments. Enzyme
assays were carried out in triplicate.
*p<0.05 compared to the result obtained from untreated Fmo5 (-/-) female liver
microsomes.
*p<0.005 compared to the result obtained from untreated female wild type liver microsomes.
213

0
0.2
0.4
0.6
0.8
1
1.2
Wild Type Fmo1 (-/-),2 (-/-),4 (-/-) Fmo5 (-/-)
TAZ
Met
abol
ism
(nm
ol L
-1 p
er m
in p
er μ
g pr
otei
n)TAZ
TAZ +METHIMAZOLE
*
Figure 3.3.7: The effect of pre-treatment of male mouse liver microsomes with
methimazole on the rate of TAZ metabolism. Pre-treatment of liver microsomes
with methimazole is described in section 2.10.3.1. The rate of TAZ metabolism
catalysed by liver microsomes prepared from male wild type, Fmo1 (-/-), 2 (-/-), 4 (-/-
) and Fmo5 (-/-) mice was determined as described in section 2.10.2. Data are mean
± standard deviation obtained from two independent experiments. Enzyme assays
were carried out in triplicate.
*p<0.05 compared to the result obtained from untreated wild type male liver
microsomes.
214

microsomes (p<0.05) and not for the Fmo knockout lines. This may indicate a lesser
contribution of FMOs to TAZ metabolism in male mice.
Although the use of methimazole as a measure of FMO contribution is
accepted, methimazole is not a substrate for FMO5 and therefore will not affect its
activity towards TAZ (Cherrington et al. 1998). Some reports also claim that
methimazole may inhibit the activity of certain CYP isoenzymes (Guo et al. 1991).
To gain more of an understanding of FMO contribution to TAZ metabolism, liver
microsomes were pre-heated to inactivate FMOs. Unlike CYPs, FMOs are relatively
heat labile and this property has been exploited to distinguish between FMO and CYP
activity in vitro (Rawden et al. 2000; Stormer 2000; Virkel et al. 2006). Figure
3.3.8 illustrates the effects of heat inactivation on TAZ metabolism activity for female
liver microsomes. There is a significant reduction in activity for wild type (p<0.005)
and Fmo5 (-/-) (p<0.05) female liver microsomes, but not for microsomes isolated
from livers of Fmo1 (-/-), 2 (-/-), 4(-/-) mice (p>0.05). A 42% and 36% decrease in
activity is seen for wild type and Fmo5 (-/-) female liver microsomal samples
respectively. For male liver microsomes, there was no significant difference in TAZ
metabolism by liver microsomes isolated from wild type, Fmo1 (-/-), 2 (-/-), 4(-/-) or
Fmo5 (-/-) mouse lines after heat treatment (p>0.05) (Fig. 3.3.9). The reduction in
activity in wild type male liver microsomes observed after methimazole treatment
(Fig. 3.3.7) may therefore indicate the inhibition of a CYP rather than an FMO.
These findings suggest a sex-specific difference in TAZ metabolism in liver of a
mouse. To ensure that FMO activity had fully diminished after heat inactivation,
samples were tested for activity towards methimazole (see section 2.10.3.1) before
and after heating. No TNB oxidation was observed after heat treatment (data not
shown) indicating that FMOs were no longer active.
215

0
0.2
0.4
0.6
0.8
1
1.2
1.4
Wild Type Fmo1 (-/-),2 (-/-),4 (-/-) Fmo5 (-/-)
TAZ
Met
abol
ism
(nm
ol L
-1 p
er m
in p
er μ
g pr
otei
n)
TAZ
HEATINACTIVATION
***
Figure 3.3.8: The effect of pre-heat treatment of female liver microsomes on TAZ
metabolism. Heat inactivation of FMOs in liver microsomes is described in section
2.10.3.2. The rate of TAZ metabolism catalysed by liver microsomes prepared from
female wild type, Fmo1 (-/-), 2 (-/-), 4 (-/-) and Fmo5 (-/-) mice was determined as
described in section 2.10.2. Data are mean ± standard deviation obtained from two
independent experiments. Enzyme assays were carried out in triplicate.
*p<0.05 compared to the result obtained from untreated Fmo5 (-/-) female liver
microsomes.
**p<0.005 compared to the result obtained from untreated wild type female liver
microsomes.
216

0
0.2
0.4
0.6
0.8
1
1.2
Wild Type Fmo1 (-/-),2 (-/-),4 (-/-) Fmo5 (-/-)
TAZ
Met
abol
ism
(nm
ol L
-1 p
er m
in p
er μ
g pr
otei
n)TAZ
HEATINACTIVATION
Figure 3.3.9: The effect of pre-heat treatment of male liver microsomes on TAZ
metabolism. Heat inactivation of FMOs in liver microsomes is described in section
2.10.3.2. The rate of TAZ metabolism catalysed by liver microsomes prepared from
male wild type, Fmo1 (-/-), 2 (-/-), 4 (-/-) and Fmo5 (-/-) mice was determined as
described in section 2.10.2. Data are mean ± standard deviation obtained from two
independent experiments. Enzyme assays were carried out in triplicate.
217

As TAZ metabolism was not completely abolished by methimazole treatment
or heat inactivation, it indicates that another enzyme or group of enzymes are
involved in the metabolism of TAZ.
Assessing CYP Contribution in Liver Microsomes to TAZ Metabolism
The relative contribution of CYPs was investigated using an antibody specific to
NADPH-dependent Cytochrome P450 reductase. This antibody will inactivate all
liver microsomal CYP activity regardless of the CYP form. NADPH-dependent
Cytochrome P450 reductase (CRP) are FAD and FMN containing enzymes which
transfer electrons to CYPs. By inhibiting CRP, CYPs can no longer function as there
is no electron donor from which they can accept an electron (as a result of the absence
of reduced cytochrome P450 reductase). Therefore the use of an antibody against
CRP is a useful tool to investigate the relative contribution of CYP to a given
substrate in vitro. The amount of NADPH-dependent Cytochrome P450 Reductase
antiserum was optimised by testing increasing volumes of antiserum on rates of TAZ
metabolism catalysed by microsomal samples until no further change in the rate of
TAZ metabolism was observed (see section 2.10.3.4). Non-immune sera was used
to approximate the amount of non-specific inhibition. Non-specific inhibition of
TAZ metabolism was found to be ~20%. The actual amount of inhibition by
NADPH-dependent Cytochrome P450 Reductase antiserum was corrected for the
non-specific inhibition (see section 2.10.3.4). Figure 3.3.10 shows the effect of CYP
inactivation on the rate of TAZ metabolism in isolated female liver microsomes. CYP
inactivation caused a significant decrease in TAZ metabolism by the wild type and
two Fmo knockout mouse lines. A 44%, 63% and 52% decrease in
218

0
0.2
0.4
0.6
0.8
1
1.2
1.4
Wild Type Fmo1 (-/-),2 (-/-),4 (-/-) Fmo5 (-/-)
TAZ
Met
abol
ism
(nm
ol L
-1 p
er m
in p
er μ
g pr
otei
n)TAZ
TAZ + Anti-NADPH P450ReductaseAntibody
** **
*
Figure 3.3.10: The effect of Anti-NADPH-dependent Cytochrome P450 reductase
serum on TAZ metabolism by female liver microsomes. Inactivation of P450s in
liver microsomes is described in section 2.10.3.4. The rate of TAZ metabolism
catalysed by liver microsomes prepared from female wild type, Fmo1 (-/-), 2 (-/-), 4 (-
/-) and Fmo5 (-/-) mice was determined as described in section 2.10.2. Data are mean
± standard deviation obtained from two independent experiments. Enzyme assays
were carried out in triplicate.
* p<0.05 compared to the result obtained from untreated female Fmo1 (-/-),2 (-/-),4 (-
/-) liver microsomes.
** p<0.005 compared to the result obtained from untreated female wild type or Fmo5
(-/-) female liver microsomes respectively.
219

TAZ metabolism was observed for microsomes from wild type (p<0.005), Fmo1 (-/-),
2(-/-), 4(-/-), (p<0.05) and Fmo5 (-/-) mice (p<0.005) respectively. In males,
inactivation of CYPs caused a significant decrease in TAZ metabolism by liver
microsomes isolated from all three mouse lines. Wild type, Fmo1 (-/-), 2 (-/-), 4(-/-)
and Fmo5 (-/-) microsomes had a reduction of 61%, 64% and 75% respectively (Fig.
3.3.11). This confirms that CYPs, as well as FMOs contribute towards the metabolism
of TAZ by mouse liver microsomes.
Figure 3.3.12 summarises the results obtained after heat inactivation (FMO
inactivation) or after anti-CRP incubation (CYP inactivation) in male and female wild
type liver microsomes. The reduction in TAZ metabolism after FMO or CYP
inactivation in female samples was 42% and 44% respectively whereas in male liver
microsomes CYP inactivation led to a 61% decrease in enzyme activity but no
significant difference was observed after FMO inactivation. When FMO and CYPs
were both inactivated (heat inactivation and anti-CRP incubation) the effect was
additive. In the case of female liver microsomes inactivation of FMO and CYPs
resulted in an insignificant amount of enzyme activity being observed but in the male
microsomal samples, approximately 23% of TAZ metabolism was still present (data
not shown).
Data reported here suggests that FMO and CYPs are involved to similar degrees in the
metabolism of TAZ in liver microsomes of female wild type mice, but not in liver
microsomes of male mice. In male liver microsomal samples (of wild type mice),
data suggests a CYP-mediated enzymatic reaction as the major pathway and the
possibility of a third, unidentified enzyme or group of enzymes to contribute as well.
Analysis of data from the two knockout lines implicates FMO1 as the major FMO
220

0
0.2
0.4
0.6
0.8
1
1.2
Wild Type Fmo1 (-/-),2 (-/-),4 (-/-) Fmo5 (-/-)
TAZ
Met
abol
ism
(nm
ol L
-1 p
er m
in p
er μ
g pr
otei
n)
TAZ
TAZ + Anti- NADPHP450 ReductaseAntibody
*
** **
Figure 3.3.11: The effect of Anti-NADPH-dependent Cytochrome P450 reductase
serum on TAZ metabolism by male liver microsomes. Inactivation of P450s in
liver microsomes is described in section 2.10.3.4. The rate of TAZ metabolism
catalysed by liver microsomes prepared from male wild type, Fmo1 (-/-), 2 (-/-), 4
(-/-) and Fmo5 (-/-) mice was determined as described in section 2.10.2. Data are
mean ± standard deviation obtained from two independent experiments. Enzyme
assays were carried out in triplicate.
* p<0.05 compared to the result obtained from untreated male wild type liver
microsomes.
** p<0.005 compared to the result obtained from untreated male Fmo1 (-/-), 2 (-/-), 4
(-/-) or Fmo5 (-/-) female liver microsomes respectively.
221

0
0.2
0.4
0.6
0.8
1
1.2
TAZ HEAT INACTIVATION NADPH CYTOCHROME P450-REDUCTASE ANTIBODY
TAZ
Met
abol
sim
(nm
ol L
-1 p
er m
in p
er μ
g pr
otei
n)FEMALE
MALE
** **
*
Figure 3.3.12: Comparison of the effects of pre-heat treatment and Anti-
NADPH-dependent Cytochrome P450 reductase serum incubation on the rate of
TAZ metabolism by male and female liver microsomes. Pre-heat treatment and
incubation with NADPH-dependent cytochrome P450-Reducatse antibody of liver
microsomes is described in section 2.10.3. The rate of TAZ metabolism catalysed by
liver microsomes prepared from male and female wild type, Fmo1 (-/-), 2 (-/-), 4 (-/-)
and Fmo5 (-/-) mice was determined as described in section 2.10.2. Data are mean ±
standard deviation obtained from two independent experiments. Enzyme assays were
carried out in triplicate.
*p<0.05 compared to the result obtained from untreated male liver microsomes.
**p<0.005 compared to the result obtained from untreated female liver microsomes.
222

isoform to be involved in TAZ metabolism by female liver microsomes but not by
male liver microsomes.
TAZ Metabolism by Lung Microsomes
Lung microsomes were prepared from wild type (C57BL/6 mice), Fmo1 (-/-), 2 (-/-),
4 (-/-) and an Fmo 5 (-/-) mouse line as described in section 2.10.1. The rate of TAZ
metabolism catalysed by mouse liver microsomes was monitored
spectrophotometrically and is described in section 2.10.2.2. Data represent mean ±
standard deviation obtained from two independent microsomal isolations. All assays
were carried out in triplicate on each batch of microsomes.
Figure 3.3.13 represents Michaelis-Menten plots (νo versus [TAZ]) obtained
for female lung microsomes prepared from the three mouse lines. Lung microsomes
prepared from wild type and Fmo5 (-/-) mice catalysed TAZ metabolism and showed
a hyperbolic Michaelis-Menten relationship between initial rate of enzyme activity
and substrate concentration. Microsomes prepared from Fmo1 (-/-), 2 (-/-), 4 (-/-)
mouse lung however were not found to metabolise TAZ, suggesting that one or all of
the three genes deleted (Fmo1, 2 or 4) are important in TAZ metabolism in the lung.
To test whether the lack of activity towards TAZ is because of the absence of FMO
protein or because the lung microsomal samples were inactivated during isolation, a
control experiment was carried out. In the control experiment the activity of
NADPH-dependent Cytochrome P450 reductase was measured using the substrate
cytochrome c. The methimazole assay was not used because mouse lung have low
amounts of FMO3, therefore in the absence of FMO1, FMO2 and FMO4, little or no
activity towards this substrate would be expected. The activity of NADPH-dependent
223

0
0.5
1
1.5
2
2.5
3
0 2 4 6 8 10 12TAZ (μΜ)
TAZ
OXY
GEN
ATI
ON
(nm
ol L
-1/ m
in/ μ
g pr
otei
n)
Wild TypeFmo1 (-/-), Fmo2 (-/-), Fmo4 (-/-)Fmo5 (-/-)
Figure 3.3.13: νo versus [TAZ] plot for TAZ metabolism catalysed by female
mouse lung microsomes. The rate of TAZ metabolism catalysed by wild type
female mouse lung microsomes was determined as described in section 2.10.2. Data
are mean ± standard deviation from assays carried out in triplicate.
224

NADPH-dependent Cytochrome P450 reductase was assayed by measuring the initial
rate of cytochrome c reduction [Omura et al. 1970]. Figure 3.3.14 shows the activity
of lung microsomes isolated from female Fmo1 (-/-), 2(-/-), 4(-/-) and female wild
type mice. The rate of cytochrome c reduction by Fmo1 (-/-), 2(-/-), 4(-/-) lung
microsomes is similar to that catalysed by wild type microsomes and therefore shows
that the microsomes from the knockout line are active.
Wild type and Fmo5 (-/-) lung microsomes showed Michaelis-Menten
behaviour over the tested TAZ concentrations (Fig. 3.3.13). At saturating TAZ
concentrations, lung microsomes from female and male wild type and Fmo5 (-/-) mice
showed a significant difference in TAZ metabolism (p<0.05) (Fig. 3.3.15). Female
lung microsomal samples from both mouse lines were more efficient at TAZ
metabolism than were microsomes from male lung samples (Fig. 3.3.15). There was
no significant difference in TAZ metabolism between female wild type and female
Fmo5 (-/-) lung microsomes (Fig. 3.3.15) indicating that FMO5 is unlikely to be
contributing to TAZ metabolism in female lung microsomes. In males however, lung
microsomal samples from Fmo5 (-/-) mice showed a significant decrease in TAZ
metabolism compared to the wild type microsomes (p<0.005) (Fig. 3.3.15). The
results indicate a sex-dependent difference in mouse lung towards TAZ and also
indicate a role for FMO5 in male lung microsomes. A possible explanation for the
observed activity in the Fmo5 (-/-) microsomal samples may be that the lack of FMO5
in lung leads to an up-regulation of another FMO or CYP to compensate for the role
FMO5 would normally play in the lung.
225

A B
Figure 3.3.14: The reduction of cytochrome c catalysed by wild type and Fmo1
(-/-), 2 (-/-), 4 (-/-) lung microsomes. The rate of cytochrome c reduction was
monitored as described in section 2.10.4. The change in absorbance signal at 550 nm
representing the reduction of cytochrome c by lung microsomes prepared from wild
type female (A) and Fmo 1 (-/-), Fmo2 (-/-), Fmo4 (-/-) female mice (B) are shown.
226

0
0.5
1
1.5
2
2.5
3
3.5
4
Wild Type Fmo5 (-/-)
TAZ
Met
abol
ism
(nm
ol L
-1 p
er m
in p
er μ
g pr
otei
n)
FEMALE
MALE
Figure 3.3.15: Rate of TAZ metabolism observed for female and male mouse
lung microsomes. The rate of TAZ metabolism catalysed by lung microsomes
prepared from female and male wild type and Fmo5 (-/-) mice was determined as
described in section 2.10.2. Data are mean ± standard deviation obtained from two
independent experiments. Enzyme assays were carried out in triplicate.
**p<0.05 compared to the result obtained from female wild type or Fmo5 (-/-) lung
microsomes respectively.
227
Assessing FMO Contribution to TAZ Metabolism in Mouse Lung Microsomes
Methimazole was used as a competitive inhibitor to determine the contribution of
FMOs to TAZ metabolism as described above. Female lung microsomes showed a
significant difference in TAZ metabolism after treatment with methimazole; a 63 and
65% decrease in activity was observed for wild type and Fmo5 (-/-) microsomes
respectively (Fig. 3.3.16). For male lung microsomes treated with methimazole; a
32% and 47% decrease in activity in TAZ metabolism was observed for wild type
(p<0.005) and Fmo5 (-/-) (p<0.05) lung microsomes respectively (Fig. 3.3.17).
These findings suggest that although FMOs are contributing to TAZ metabolism in
the lung, FMO contribution is higher in the female microsomes than the male
microsomes of this organ. This is supported by experiments shown in Figure 3.3.15
where female lung microsomal samples are observed to be more efficient at TAZ
metabolism than male lung microsomes. The role of FMO5 is not confirmed by these
findings (shown in Fig. 3.3.17). FMO5, unlike other members of the FMO family,
does not metabolise methimazole, therefore, if one assumes the difference in TAZ
metabolism between male wild type and male FMO5 (-/-) microsomes (shown in Fig.
3.3.16) is because of the absence of FMO5, then methimazole treatment should have
no effect on the rate of TAZ metabolism catalysed by Fmo5 (-/-) lung microsomes.
Figure 3.3.17 shows, however a significant decrease in TAZ metabolism in male
FMO5 (-/-) lung microsomes compared to TAZ ‘only’ treated Fmo5 (-/-) microsomes
(p<0.05). This suggests that FMO5 is unlikely to influence TAZ metabolism in the
male lung microsomes. Following heat inactivation of the FMOs, a significant
difference in TAZ metabolism was observed for female lung microsomes (Fig.
3.3.18). Compared to unheated lung microsomes; heating caused a reduction in TAZ
metabolism of 61% and 68% by wild type and Fmo5 (-/-) female lung microsomes
228

0
0.5
1
1.5
2
2.5
3
3.5
4
Wild Type Fmo5 (-/-)
TAZ
Met
abol
ism
(nm
ol L
-1 p
er m
in p
er μ
g pr
otei
n)TAZ
TAZ + METHIMAZOLE
Figure 3.3.16: The effect of pre-treatment with methimazole on the rate of TAZ
metabolism by female mouse lung microsomes. Pre-treatment of lung microsomes
with methimazole is described in section 2.10.3.1. The rate of TAZ metabolism
catalysed by lung microsomes prepared from female wild type and Fmo5 (-/-) mice
was determined as described in section 2.10.2. Data are mean ± standard deviation
obtained from two independent experiments. Enzyme assays were carried out in
triplicate.
* *
*p<0.05 compared to the result obtained from untreated female wild type or Fmo5
(-/-) lung microsomes respectively.
229

0
0.1
0.2
0.3
0.4
0.5
0.6
0.7
0.8
0.9
1
Wild Type Fmo5 (-/-)
TAZ
Met
abol
ism
(nm
ol L
-1 p
er m
in p
er μ
g pr
otei
n)TAZ
TAZ + METHIMAZOLE
*
*
Figure 3.3.17: The effect of pre-treatment with methimazole on the rate of TAZ
metabolism by male mouse lung microsomes. Pre-treatment of lung microsomes
with methimazole is described in section 2.10.3.1. The rate of TAZ metabolism
catalysed by lung microsomes prepared from male wild type and Fmo5 (-/-) mice was
determined as described in section 2.10.2. Data are mean ± standard deviation
obtained from two independent experiments. Enzyme assays were carried out in
triplicate.
*p<0.05 compared to the result obtained from untreated male wild type or Fmo5 (-/-)
lung microsomes respectively.
230
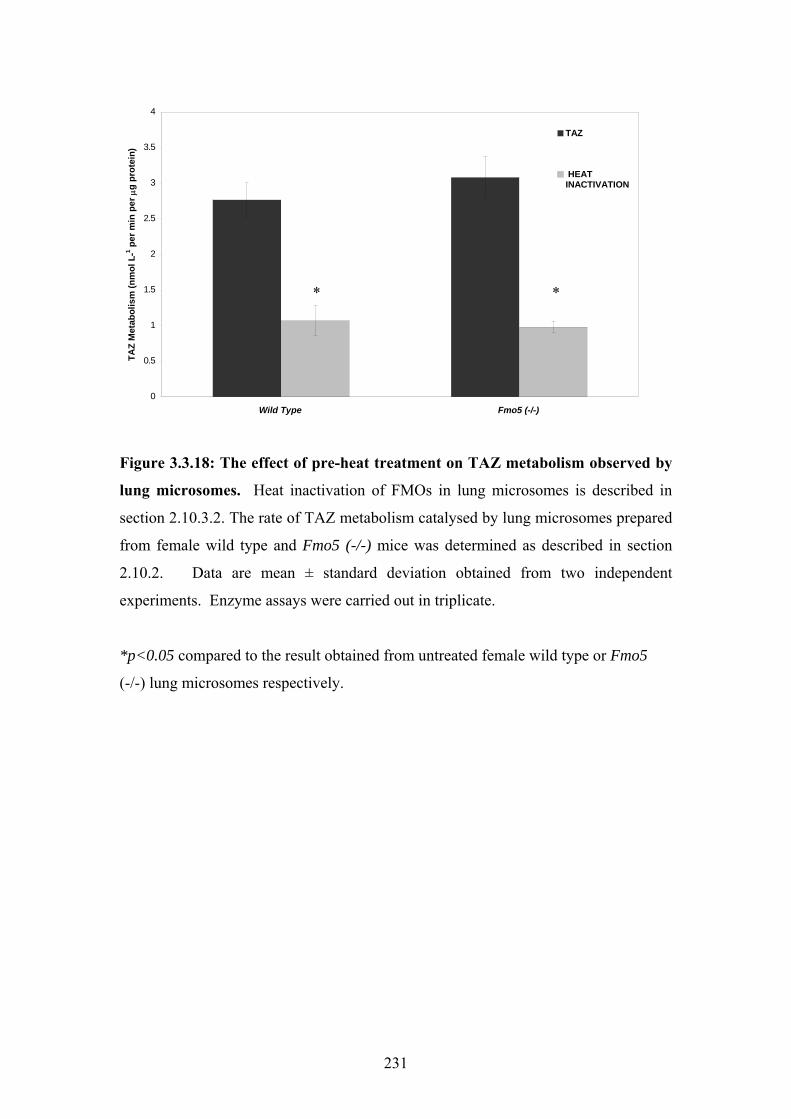
0
0.5
1
1.5
2
2.5
3
3.5
4
Wild Type Fmo5 (-/-)
TAZ
Met
abol
ism
(nm
ol L
-1 per
min
per
μg
prot
ein)
TAZ
HEATINACTIVATION
* *
Figure 3.3.18: The effect of pre-heat treatment on TAZ metabolism observed by
lung microsomes. Heat inactivation of FMOs in lung microsomes is described in
section 2.10.3.2. The rate of TAZ metabolism catalysed by lung microsomes prepared
from female wild type and Fmo5 (-/-) mice was determined as described in section
2.10.2. Data are mean ± standard deviation obtained from two independent
experiments. Enzyme assays were carried out in triplicate.
*p<0.05 compared to the result obtained from untreated female wild type or Fmo5
(-/-) lung microsomes respectively.
231

This data is in agreement with findings from methimazole treated microsomes. Heat
inactivation of FMOs in male lung microsomes caused a significant decrease in TAZ
metabolism by wild type lung microsomes (p<0.05) but not however, for Fmo5 (-/-)
lung microsomes (Fig. 3.3.19). This indicates that FMO contribution is less in the
lung microsomes of the male Fmo5 (-/-) mouse line.
Assessing CYP Contribution to TAZ Metabolism in Mouse Lung Microsomes
As described earlier, anti-sera to NADPH-dependent Cytochrome P450 Reductase is a
tool which can be used to inactivate CYP activity. Here it has been used to deduce
the relative contribution of CYPs to TAZ metabolism in mouse lung microsomes.
Non- specific inhibition of TAZ metabolism by serum addition was found to be
~20%.
The effects of pre-incubating microsomes with NADPH-dependent
Cytochrome P450 Reductase antibody shows that in both male and female lung
samples a significant decrease in TAZ metabolism had occurred (p<0.05) (Fig. 3.3.20
and 3.3.21). For female lung microsomes there was a 31 and 57% reduction in
activity for wild type and Fmo5 (-/-) mouse lines respectively and in males a 34 and
31% decrease in activity of wild type and Fmo5 (-/-) lungs respectively. These
findings confirm that CYPs contribute to the metabolism of TAZ in mouse lung
microsomes.
Figure 3.3.22 summarises the results obtained after heat inactivation (FMO
inactivation) or after anti-CRP incubation (CYP inactivation) in male and female wild
type lung microsomes. The reduction in TAZ metabolism after FMO or CYP
inactivation in female samples was 63% and 31% respectively whereas in male liver
232

0
0.1
0.2
0.3
0.4
0.5
0.6
0.7
0.8
0.9
1
Wild Type Fmo5 (-/-)
TAZ
Met
abol
ism
(nm
ol L
-1 p
er m
in p
er μ
g pr
otei
n)TAZ
HEATINACTIVATION
Figure 3.3.19: The effect of pre-heat treatment on TAZ metabolism by male lung
microsomes. Heat inactivation of FMOs in lung microsomes is described in section
2.10.3.2. The rate of TAZ metabolism catalysed by lung microsomes prepared from
male wild type and Fmo5 (-/-) mice was determined as described in section 2.10.2.
Data are mean ± standard deviation obtained from two independent experiments.
Enzyme assays were carried out in triplicate.
*p<0.05 compared to the result obtained from untreated male wild type lung
microsomes.
233
microsomes FMO and CYP inactivation led to a 32% and 34% decrease in enzyme
activity respectively. When FMO and CYPs were both inactivated (heat inactivation
and anti-CRP incubation) the effect was additive. In the case of female liver
microsomes inactivation of FMO and CYPs resulted in an insignificant amount of
enzyme activity being observed but in the male microsomal samples, approximately
25% of TAZ metabolism was still present (data not shown). Data reported here
suggests that FMO is the major enzymatic pathway involved in the metabolism of
TAZ in the lung microsomes of female wild type mice, but not in lung microsomes of
male mice. In male lung microsomal samples (of wild type mice) the contribution of
FMOs and CYPs is similar, the sum of FMO and CYP contribution however does not
equal the total amount of TAZ metabolism observed in this tissue. This may indicate
a role of another enzyme in the metabolism of TAZ in male lung microsomes of mice.
The relative contribution of FMO1 and FMO2 to TAZ metabolism could not be
deduced, mainly because methimazole is a substrate for both isoforms. A probe
substrate for FMO1 could have been imipramine (Kim et al. 2000; Hernandez et al.
2004), however this compound is also a substrate for some CYPs. Further studies are
required to elucidate the relative contribution of FMO1 and FMO2 to TAZ
metabolism in vitro
Comparison between Liver and Lung Microsomes With Respect to TAZ
Metabolism
Figure 3.3.23 shows the rate of TAZ metabolism for female liver and lung
microsomes. There is a significant difference between activities of lung and liver
microsomes isolated from female wild type mice (p<0.005). Lung microsomes are
more efficient at TAZ metabolism than liver microsomes from female wild type mice.
234

0
0.5
1
1.5
2
2.5
3
3.5
4
Wild Type Fmo5 (-/-)
TAZ
Met
abol
sim
(nm
ol L
-1 p
er m
in p
er μ
g pr
otei
n)TAZ
TAZ + Anti - NADPH P450Reductase Antibody
*
*
Figure 3.3.20: The effect of Anti-NADPH-dependent Cytcrome P450 reductase
serum on TAZ metabolism observed for female lung microsomes. Inactivation of
NADPH-dependent Cytochrome P450 reductase in lung microsomes is described in
section 2.10.3.3. The rate of TAZ metabolism catalysed by lung microsomes prepared
from female wild type and Fmo5 (-/-) mice was determined as described in section
2.10.2. Data are mean ± standard deviation obtained from two independent
experiments. Enzyme assays were carried out in triplicate.
* p<0.05 compared to the result obtained from untreated female wild type or
Fmo5 (-/-) lung microsomes respectively.
235

0
0.1
0.2
0.3
0.4
0.5
0.6
0.7
0.8
0.9
1
Wild Type Fmo5 (-/-)
TAZ
Met
abol
ism
(nm
ol p
er L
-1 p
er m
in p
er μ
g pr
otet
in)
TAZ
TAZ + Anti-NADPH P450ReductaseAntibody
*
*
Figure 3.3.21: The effect of Anti-NADPH-dependent Cytochrome P450 reductase
serum on TAZ metabolism by male lung microsomes. Inactivation of P450s in
lung microsomes is described in section 2.10.3.3. The rate of TAZ metabolism
catalysed by lung microsomes prepared from male wild type and Fmo5 (-/-) mice was
determined as described in section 2.10.2. Data are mean ± standard deviation
obtained from two independent experiments. Enzyme assays were carried out in
triplicate.
* p<0.05 compared to the result obtained from untreated male wild type or Fmo5 (-/-)
lung microsomes respectively.
236

0
0.5
1
1.5
2
2.5
3
3.5
TAZ HEAT INACTIVATION NADPH CYTOCHROME P450-REDUCTASE ANTIBODY
TAZ
Met
abol
ism
(nm
ol L
-1 p
er m
in p
er μ
g pr
otei
n)FEMALE
MALE
Figure 3.3.22: Comparison of the effects of pre-heat treatment and Anti-NADPH
Cytochrome P450 reductase antibody incubation on the rate of TAZ metabolism
observed for male and female lung microsomes. Pre-heat treatment and incubation
with anti-NADPH-dependent Cytochrome P450-Reductse antibody of liver
microsomes is described in section 2.10.3.2 and 2.10.3.3. The rate of TAZ metabolism
catalysed by lung microsomes prepared from male and female wild type and Fmo5
(-/-) mice was determined as described in section 2.10.2. Data are mean ± standard
deviation obtained from two independent experiments. Enzyme assays were carried
out in triplicate.
237

However, there is no significant difference in TAZ metabolism by male lung and liver
microsomes isolated from wild type mice. This indicates a sex-dependant difference
within the capacity to metabolise TAZ in mouse lung and liver.
In summary, experiments carried out in this section describe the relative
contribution of FMOs and CYPs to the metabolism of TAZ in microsomes prepared
from lung and liver of mouse. The data confirms a role for both FMOs and CYPs in
the in vitro metabolism of TAZ. Sex- and tissue-specific differences in TAZ
metabolism have been identified.
238

0
0.5
1
1.5
2
2.5
3
3.5
FEMALE MALE
TAZ
Met
abol
ism
(nm
ols
L-1 p
er m
in p
er μ
g pr
otei
n)LUNG
LIVER
**
Figure 3.3.23: Comparison of the rate of TAZ metabolism by lung and liver
microsomes prepared from male and female wild type mice. The rate of TAZ
metabolism catalysed by lung and liver microsomes prepared from male and female
wild type mice was determined as described in section 2.10.2. Data are mean ±
standard deviation obtained from two independent experiments. Enzyme assays were
carried out in triplicate.
**p<0.005
239
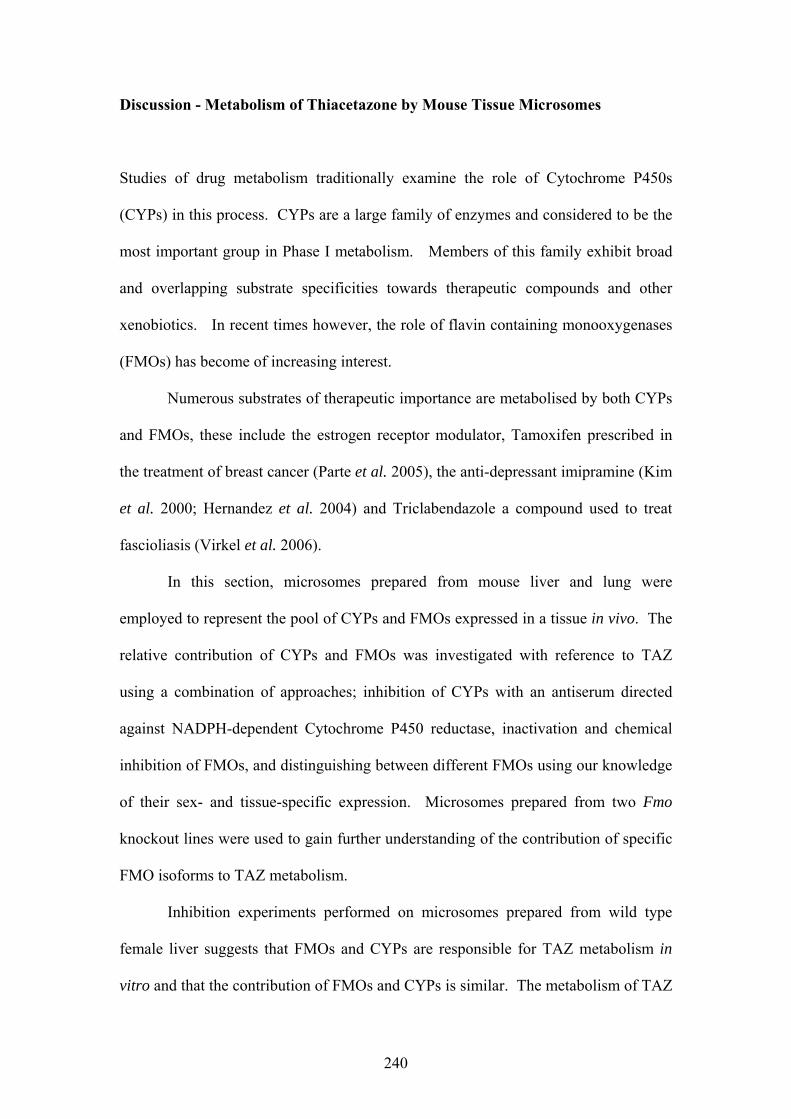
Discussion - Metabolism of Thiacetazone by Mouse Tissue Microsomes
Studies of drug metabolism traditionally examine the role of Cytochrome P450s
(CYPs) in this process. CYPs are a large family of enzymes and considered to be the
most important group in Phase I metabolism. Members of this family exhibit broad
and overlapping substrate specificities towards therapeutic compounds and other
xenobiotics. In recent times however, the role of flavin containing monooxygenases
(FMOs) has become of increasing interest.
Numerous substrates of therapeutic importance are metabolised by both CYPs
and FMOs, these include the estrogen receptor modulator, Tamoxifen prescribed in
the treatment of breast cancer (Parte et al. 2005), the anti-depressant imipramine (Kim
et al. 2000; Hernandez et al. 2004) and Triclabendazole a compound used to treat
fascioliasis (Virkel et al. 2006).
In this section, microsomes prepared from mouse liver and lung were
employed to represent the pool of CYPs and FMOs expressed in a tissue in vivo. The
relative contribution of CYPs and FMOs was investigated with reference to TAZ
using a combination of approaches; inhibition of CYPs with an antiserum directed
against NADPH-dependent Cytochrome P450 reductase, inactivation and chemical
inhibition of FMOs, and distinguishing between different FMOs using our knowledge
of their sex- and tissue-specific expression. Microsomes prepared from two Fmo
knockout lines were used to gain further understanding of the contribution of specific
FMO isoforms to TAZ metabolism.
Inhibition experiments performed on microsomes prepared from wild type
female liver suggests that FMOs and CYPs are responsible for TAZ metabolism in
vitro and that the contribution of FMOs and CYPs is similar. The metabolism of TAZ
240

by male liver microsomes prepared from wild type mice catalysed the reaction to a
similar extent to female wild type microsomal samples. Inhibition studies however
unmasked significant differences between the contribution of FMOs and CYPs to this
reaction by the two sexes. In males, CYP contribution was determined to be greater
than that of FMOs with the latter enzymatic contribution being insignificant. Analysis
of data obtained from both sexes and the two knockout mouse lines and between both
sexes implicated FMO1 to be important in the metabolism of TAZ in females but not
in males. A survey of literature describing the sexual dimorphic expression of FMOs
and CYPs was undertaken to try to explain this finding. Examples of sex-specific
expression of CYPs and FMOs in the liver are documented. In the mouse, CYP2D9 is
highly expressed in the liver of males but is repressed in the female (Sakuma et al.
2004), whereas hepatic expression of CYP2A4 and CYP2B9 is predominant in the
liver of females (reviewed by Waxman et al. 2009). Studies of FMO mRNA
expression have reported FMO1 transcript levels to be significantly higher in the liver
of female mouse (Janmohamed et al. 2004) whereas FMO3 is not expressed in the
liver of adult males (Cherrington et al. 1998). Given that liver microsomes obtained
from male Fmo1(-/-), 2 (-/-), 4 (-/-) mice showed significantly higher levels of TAZ
metabolism than female liver microsomes and the insignificant effect of heat
inactivation on these samples, suggests that FMOs (and FMO1 in particular) are not
responsible for the metabolism of TAZ observed in male microsomal samples.
Therefore it is likely that the sex-specific expression of a CYP isoform was
responsible for the difference in TAZ metabolism observed in between male and
female liver microsomes. It was beyond the scope of this investigation to determine
the exact CYP isoform responsible for the sex-specific difference.
241
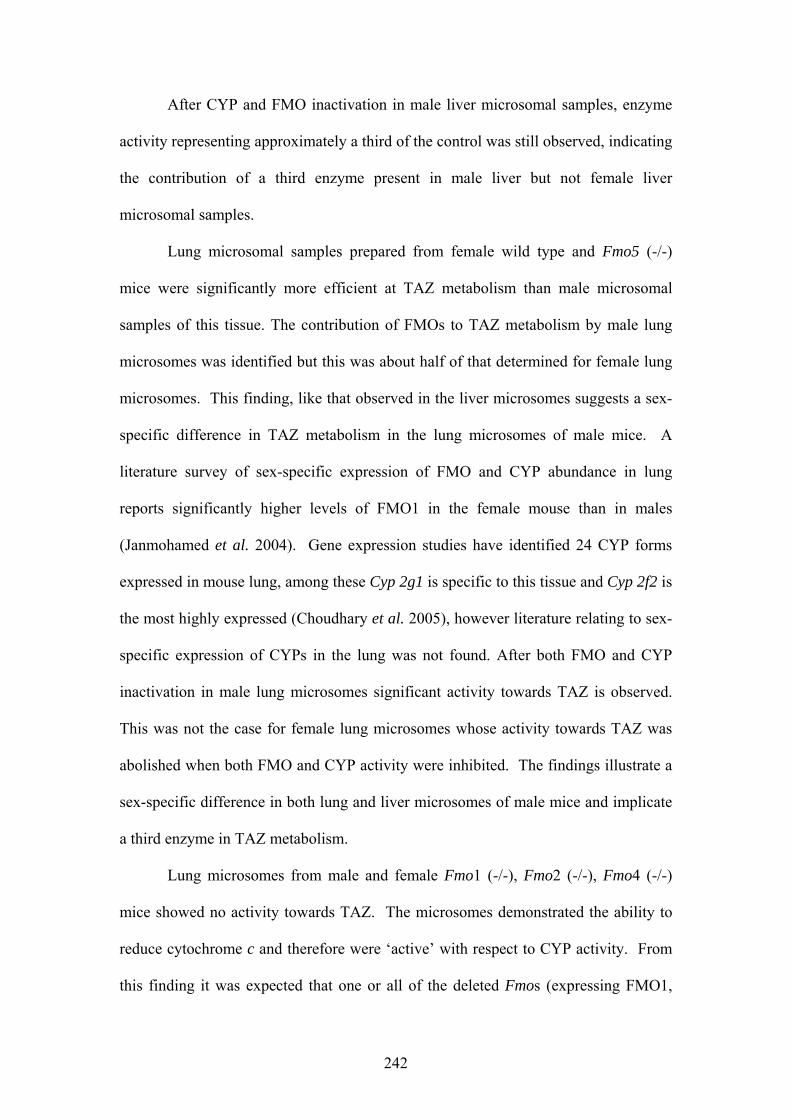
After CYP and FMO inactivation in male liver microsomal samples, enzyme
activity representing approximately a third of the control was still observed, indicating
the contribution of a third enzyme present in male liver but not female liver
microsomal samples.
Lung microsomal samples prepared from female wild type and Fmo5 (-/-)
mice were significantly more efficient at TAZ metabolism than male microsomal
samples of this tissue. The contribution of FMOs to TAZ metabolism by male lung
microsomes was identified but this was about half of that determined for female lung
microsomes. This finding, like that observed in the liver microsomes suggests a sex-
specific difference in TAZ metabolism in the lung microsomes of male mice. A
literature survey of sex-specific expression of FMO and CYP abundance in lung
reports significantly higher levels of FMO1 in the female mouse than in males
(Janmohamed et al. 2004). Gene expression studies have identified 24 CYP forms
expressed in mouse lung, among these Cyp 2g1 is specific to this tissue and Cyp 2f2 is
the most highly expressed (Choudhary et al. 2005), however literature relating to sex-
specific expression of CYPs in the lung was not found. After both FMO and CYP
inactivation in male lung microsomes significant activity towards TAZ is observed.
This was not the case for female lung microsomes whose activity towards TAZ was
abolished when both FMO and CYP activity were inhibited. The findings illustrate a
sex-specific difference in both lung and liver microsomes of male mice and implicate
a third enzyme in TAZ metabolism.
Lung microsomes from male and female Fmo1 (-/-), Fmo2 (-/-), Fmo4 (-/-)
mice showed no activity towards TAZ. The microsomes demonstrated the ability to
reduce cytochrome c and therefore were ‘active’ with respect to CYP activity. From
this finding it was expected that one or all of the deleted Fmos (expressing FMO1,
242
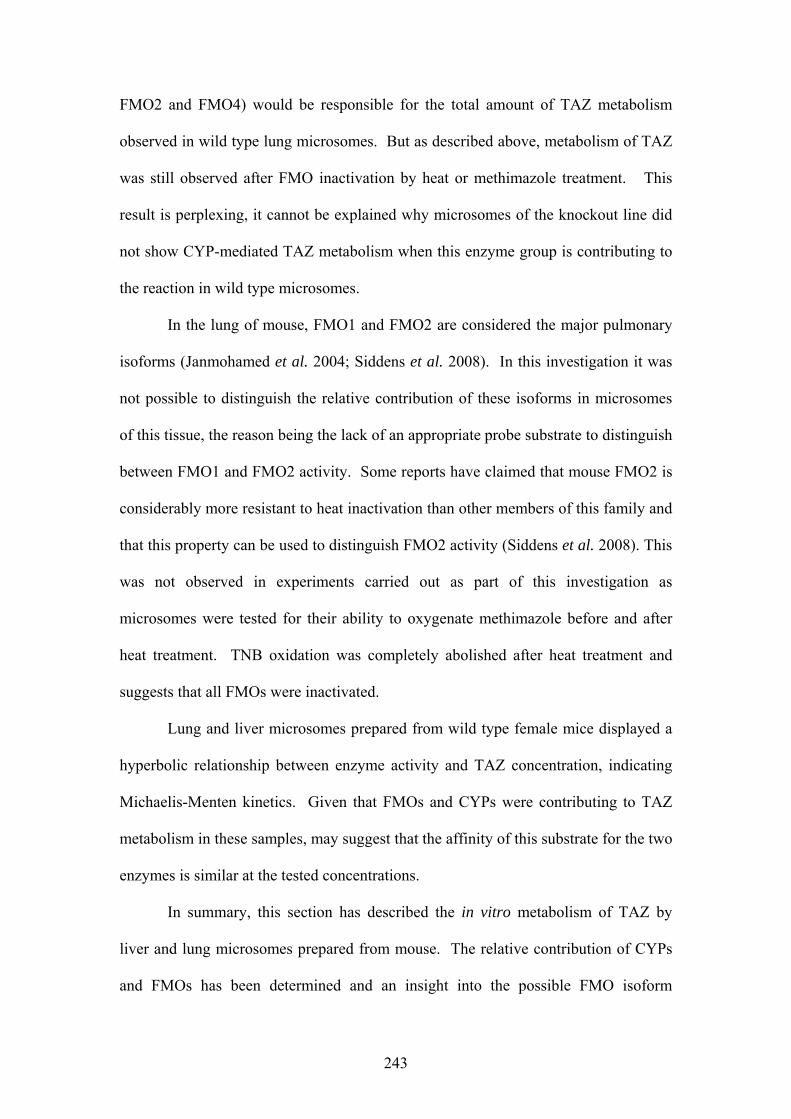
FMO2 and FMO4) would be responsible for the total amount of TAZ metabolism
observed in wild type lung microsomes. But as described above, metabolism of TAZ
was still observed after FMO inactivation by heat or methimazole treatment. This
result is perplexing, it cannot be explained why microsomes of the knockout line did
not show CYP-mediated TAZ metabolism when this enzyme group is contributing to
the reaction in wild type microsomes.
In the lung of mouse, FMO1 and FMO2 are considered the major pulmonary
isoforms (Janmohamed et al. 2004; Siddens et al. 2008). In this investigation it was
not possible to distinguish the relative contribution of these isoforms in microsomes
of this tissue, the reason being the lack of an appropriate probe substrate to distinguish
between FMO1 and FMO2 activity. Some reports have claimed that mouse FMO2 is
considerably more resistant to heat inactivation than other members of this family and
that this property can be used to distinguish FMO2 activity (Siddens et al. 2008). This
was not observed in experiments carried out as part of this investigation as
microsomes were tested for their ability to oxygenate methimazole before and after
heat treatment. TNB oxidation was completely abolished after heat treatment and
suggests that all FMOs were inactivated.
Lung and liver microsomes prepared from wild type female mice displayed a
hyperbolic relationship between enzyme activity and TAZ concentration, indicating
Michaelis-Menten kinetics. Given that FMOs and CYPs were contributing to TAZ
metabolism in these samples, may suggest that the affinity of this substrate for the two
enzymes is similar at the tested concentrations.
In summary, this section has described the in vitro metabolism of TAZ by
liver and lung microsomes prepared from mouse. The relative contribution of CYPs
and FMOs has been determined and an insight into the possible FMO isoform
243

involved in this reaction has been gained. Further studies are required to identify
CYP isoforms involved in this reaction and also to identify other enzymes which are
likely to be involved in TAZ metabolism. Additional studies are required to identify
the products generated by CYP-mediated metabolism of TAZ.
244

Chapter 4: Summary
245

4.1 Summary
TAZ and ETA are anti-tubercular drugs prescribed to treat TB in the poorest parts of
the world and in industrialised countries respectively. With TB announced as a
pandemic by the WHO and the dramatic increase in MDR- and X-MDR- TB cases,
development of new and effective drugs is a race against time. Some researchers and
medical professionals alike have resorted to the re-introduction of TAZ to
chemotherapy regimens in an attempt to use whatever is at hand. There are two main
obstacles in the way of ‘reinstating’ this cheap and effective drug, first the toxicity
that TAZ exerts in a significant proportion of individuals and secondly the scarce
amount of information regarding its metabolism in man and bacteria. The metabolism
of TAZ in the latter has provided the focus of recent literature that has subsequently
determined the nature of TAZ as a prodrug (Alahari et al. 2007), the enzyme
responsible for its activation (Baulard et al. 2000; DeBarber et al. 2000; Qian et al.
2006; Dover et al. 2007; Alahari et al. 2009), the bacterial target of TAZ action
(Alahari et al. 2007) and the mechanism by which it debilitates Mycobacteria (Alahari
et al. 2007; Dover et al. 2007). Though essential pieces of information, they do not
explain why or how TAZ induces derma- and hepatic toxicity. This will become clear
once the in vivo metabolism of TAZ in man is determined and understood.
A pharmacogenetic investigation was undertaken to assess the effect of a
recently identified genetic variation in FMOs in individuals of African-decent. A
SNP in the human FMO2 gene that occurs at a frequency of 100% of Asians and
Europeans results in the production of a non-functional enzyme (Dolphin et al. 1998).
Interestingly, a significant proportion of Africans and Hispanics of African-decent
encode the ancestral form of the gene and consequently express functionally active
FMO2 in the lungs (Dolphin et al. 1998; Krueger et al. 2002; Krueger et al. 2005;
246
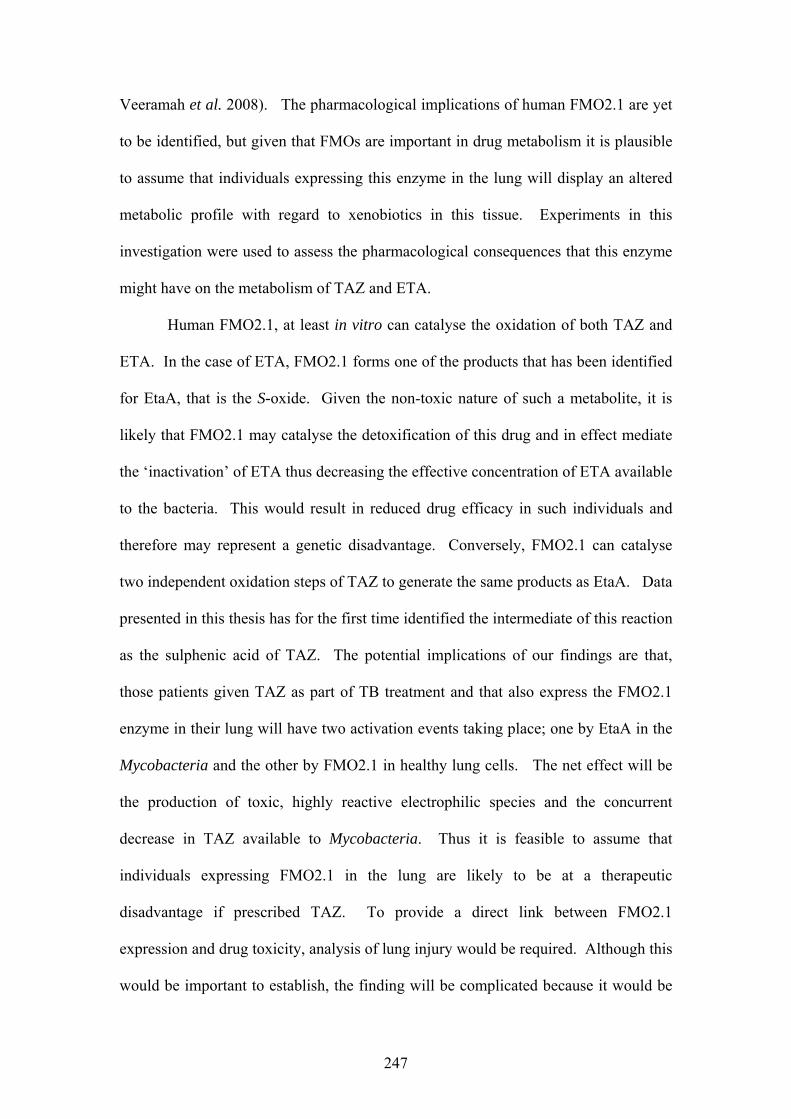
Veeramah et al. 2008). The pharmacological implications of human FMO2.1 are yet
to be identified, but given that FMOs are important in drug metabolism it is plausible
to assume that individuals expressing this enzyme in the lung will display an altered
metabolic profile with regard to xenobiotics in this tissue. Experiments in this
investigation were used to assess the pharmacological consequences that this enzyme
might have on the metabolism of TAZ and ETA.
Human FMO2.1, at least in vitro can catalyse the oxidation of both TAZ and
ETA. In the case of ETA, FMO2.1 forms one of the products that has been identified
for EtaA, that is the S-oxide. Given the non-toxic nature of such a metabolite, it is
likely that FMO2.1 may catalyse the detoxification of this drug and in effect mediate
the ‘inactivation’ of ETA thus decreasing the effective concentration of ETA available
to the bacteria. This would result in reduced drug efficacy in such individuals and
therefore may represent a genetic disadvantage. Conversely, FMO2.1 can catalyse
two independent oxidation steps of TAZ to generate the same products as EtaA. Data
presented in this thesis has for the first time identified the intermediate of this reaction
as the sulphenic acid of TAZ. The potential implications of our findings are that,
those patients given TAZ as part of TB treatment and that also express the FMO2.1
enzyme in their lung will have two activation events taking place; one by EtaA in the
Mycobacteria and the other by FMO2.1 in healthy lung cells. The net effect will be
the production of toxic, highly reactive electrophilic species and the concurrent
decrease in TAZ available to Mycobacteria. Thus it is feasible to assume that
individuals expressing FMO2.1 in the lung are likely to be at a therapeutic
disadvantage if prescribed TAZ. To provide a direct link between FMO2.1
expression and drug toxicity, analysis of lung injury would be required. Although this
would be important to establish, the finding will be complicated because it would be
247

difficult to distinguish between lung injury caused by Mycobacterial infection and
that caused by drug toxicity as a result of TAZ-activation by FMO2.1.
Mycobacterial infections cause lesions in the lung and further injury is caused by the
oxidative activation of macrophages.
This study also assayed variant forms of the major human hepatic FMO,
FMO3 for their capacity to catalyse TAZ oxygenation. The results demonstrate that
some polymorphic variants of FMO3 displayed reduced catalytic activity whereas
others displayed an increase in catalytic efficiency. The importance of this finding to
human health is two-fold. First, in the case of the double variant K158/G308,
individuals may be protected from TAZ toxicity as the enzyme has significantly
reduced capacity at oxidising this compound and so more TAZ reaches the site of
infection. In the second scenario those expressing the ‘hyper-active’ variant P360
might be predisposed to hepato- and dermatological toxicity and may require higher
doses of TAZ to treat the infection. The effect of polymorphic FMO3 variants on
sulindac and benzydamine metabolism has been discussed in section 3.2 and
demonstrates how the outcome of a therapeutic regime may be affected by the
catalytic efficiency of an FMO3 variant. Data provided in this thesis supports and
strengthens this knowledge.
Although products of the reaction were not analysed, both CYPs and FMOs
were found to contribute to TAZ metabolism by microsomes isolated from mouse
lung and liver. There is no evidence to date that demonstrates a role for CYPs in the
meabolism of TAZ in humans. Inferences from microsomes prepared from male and
female mice of FMO knockout lines suggested that in the mouse, FMO1 is the major
FMO involved in TAZ metabolism. However, it should be noted that species
differences exist with respect to the tissue distribution of FMOs in humans and
248

mouse. The most notable difference being that the FMO1 gene is switched off in
human liver at birth. Thus in humans, FMO3 is the enzyme expected to produce
hepatic toxicity as a result of TAZ metabolism.
Though not detailed in this thesis, preliminary in vivo studies of TAZ
metabolism in mouse identified, for the first time, TAZ-sulphinic acid, TAZ-
carbodiimide and TAZ-sulphenic acid in the kidney. This indicated a role for FMOs
in the extra-hepatic metabolism of this drug. Though unexpected, this finding
supports the role of FMO1 as the predominant TAZ metaboliser in mouse.
Extrapolation of mouse data to humans should always be done with caution especially
in the case of FMOs because of the difference in the tissue-specific expression of
these enzymes stated above. In mouse and all other mammals, FMO1 is the major
hepatic FMO isoform whereas humans express FMO3 in the liver and FMO1
expression is largely restricted to the kidney and skin.
It is increasingly being acknowledged that FMOs, though a small family of
enzymes are still important players in the metabolism of xenobiotics and endogenous
compounds when compared to the vast family of CYPs. The high expression in
tissues that are vital for drug metabolism and the unique mechanism by which FMOs
catalyse the oxidation of a plethora of foreign compounds provides a remarkably wide
substrate palette for these enzymes. Experiments undertaken as part of this
investigation have attempted to broaden the understanding of FMO catalysed
reactions and to delineate the contribution of individual FMO enzymes.
Clearly the data presented in this thesis can be considered as the tip of the
iceberg; nevertheless it is envisaged that the basic biochemical details regarding the
metabolism of TAZ and ETA given here will provide a foundation for future work in
this field. The knowledge gained of the contribution and inter-play of different FMO
249

genetic variants to the metabolism of a therapeutic drug may help to rationalise drug
treatment regimes and we hope contribute to better health care especially in the poorer
areas of the world.
250

Chapter 5: References
251

Abbott, A. (2003). "With your genes? Take one of these, three times a day." Nature 424: 760-762. Akerman, B. R., S. Forrest, L. Chow, R. Youil, M. Knight and E. P. Treacy (1999)a.
"Two novel mutations of the FMO3 gene in a proband with trimethylaminuria." Hum Mutat 13(5): 376-379.
Akerman, B. R., H. Lemass, L. M. Chow, D. M. Lambert, C. Greenberg, C. Bibeau, O. A. Mamer and E. P. Treacy (1999)b. "Trimethylaminuria is caused by mutations of the FMO3 gene in a North American cohort." Mol Genet Metab 68(1): 24-31.
Alahari, A., L. Alibaud, X. Trivelli, R. Gupta, G. Lamichhane, R. C. Reynolds, W. R. Bishai, Y. Guerardel and L. Kremer (2009). "Mycolic acid methyltransferase, MmaA4, is necessary for thiacetazone susceptibility in Mycobacterium tuberculosis." Mol Microbiol 71(5): 1263-1277.
Alahari, A., X. Trivelli, Y. Guerardel, L. G. Dover, G. S. Besra, J. C. Sacchettini, R. C. Reynolds, G. D. Coxon and L. Kremer (2007). "Thiacetazone, an antitubercular drug that inhibits cyclopropanation of cell wall mycolic acids in mycobacteria." PLoS One 2(12): e1343.
Allerston, C. K., M. Shimizu, M. Fujieda, E. A. Shephard, H. Yamazaki and I. R. Phillips (2007). "Molecular evolution and balancing selection in the flavin-containing monooxygenase 3 gene (FMO3)." Pharmacogenet Genomics 17(10): 827-839.
Allerston, C. K., H. H. Vetti, G. Houge, I. R. Phillips and E. A. Shephard (2009). "A novel mutation in the flavin-containing monooxygenase 3 gene (FMO3) of a Norwegian family causes trimethylaminuria." Mol Genet Metab 98(1-2): 198-202.
Anonymous (1960). "East African/British Medical Research Council (1960). Comparative trial of isoniazid in combination with thiacetazone or a substituted diphenylthiourea (SU1906) or PAS in the treatment of acute pulmonary tuberculosis in East Africans." Tubercle 41: 399-423.
Anonymous (1963). "East African/British Medical Research Council Second Thiacetazone Investigation. Isoniazid with Thiacetazone in the treatment of Tuberculosis. Tuberculosis in East Africa~-SECOND INVESTIGATION." 1963 44: 301-333.
Anonymous (1981). "Severe cutaneous eruptions caused by thiacetazone used to treat tuberculosis in Rio Grande do Sul, Brazil. Public Health Dermatology Team, Tuberculosis Team, and Epidemiologic Control Unit, Rio Grande do Sul State Department of Health." Bull Pan Am Health Organ 15(2): 113-120.
Aquinas, M. (1968). "Side effects and toxicity to thiacetazone and isoniazid: findings in a Hong Kong Tuberculosis Treatment Service-British Medical Research Council investigation." Tubercle 49: Suppl:56-58.
Ashrafian, H., J. D. Horowitz and M. P. Frenneaux (2007). "Perhexiline." Cardiovasc Drug Rev 25(1): 76-97.
Attar, M., D. Dong, K. H. Ling and D. D. Tang-Liu (2003). "Cytochrome P450 2C8 and flavin-containing monooxygenases are involved in the metabolism of tazarotenic acid in humans." Drug Metab Dispos 31(4): 476-481.
Axton, J. H. (1971). "Thiacetazone as a cause of fatty liver." Cent Afr J Med 17(12): 245-246.
Bahadur, N., J. B. Leathart, E. Mutch, D. Steimel-Crespi, S. A. Dunn, R. Gilissen, J. V. Houdt, J. Hendrickx, G. Mannens, H. Bohets, F. M. Williams, M. Armstrong, C. L. Crespi and A. K. Daly (2002). "CYP2C8 polymorphisms in
252
Caucasians and their relationship with paclitaxel 6alpha-hydroxylase activity in human liver microsomes." Biochem Pharmacol 64(11): 1579-1589.
Banerjee, A., E. Dubnau, A. Quemard, V. Balasubramanian, K. S. Um, T. Wilson, D. Collins, G. de Lisle and W. R. Jacobs, Jr. (1994). "inhA, a gene encoding a target for isoniazid and ethionamide in Mycobacterium tuberculosis." Science 263(5144): 227-230.
Barnett, M., S. R. Bushby, J. M. Dickinson and D. A. Mitchison (1963). "The Response to Treatment with Thiacetazone of Guinea-Pigs and Mice Infected with Tubercle Bacilli Obtained from Untreated African Patients." Tubercle 44: 417-430.
Baulard, A. R., J. C. Betts, J. Engohang-Ndong, S. Quan, R. A. McAdam, P. J. Brennan, C. Locht and G. S. Besra (2000). "Activation of the pro-drug ethionamide is regulated in mycobacteria." J Biol Chem 275(36): 28326-28331.
Bedi, T. R., O. P. Singh and L. K. Bhutani (1974). "Acute epidermal necrolysis (Lyell syndrome) induced by thiacetazone." Indian J Chest Dis 16(1): 55-57.
Behnisch, R., F. Mietzsch and H. Schmidt (1950). "Chemical studies on thiosemicarbazones with particular reference to antituberculous activity." Am Rev Tuberc 61(1): 1-7.
Bermudez, L. E., R. Reynolds, P. Kolonoski, P. Aralar, C. B. Inderlied and L. S. Young (2003). "Thiosemicarbazole (thiacetazone-like) compound with activity against Mycobacterium avium in mice." Antimicrob Agents Chemother 47(8): 2685-2687.
Boyd, M. R. and R. A. Neal (1976). "Studies on the mechanism of toxicity and of development of tolerance to the pulmonary toxin, alpha-naphthylthiourea (ANTU)." Drug Metab Dispos 4(4): 314-322.
Brokopp, C. D., J. L. Wyatt and J. Gabica (1981). "Dialkyl phosphates in urine samples from pesticide formulators exposed to disulfoton and phorate." Bull Environ Contam Toxicol 26(4): 524-529.
Brown, P. (1992). "Cheap TB drug 'too dangerous' for Africa." New Sci 135(1836): 5. Brunelle, A., Y. A. Bi, J. Lin, B. Russell, L. Luy, C. Berkman and J. Cashman (1997).
"Characterization of two human flavin-containing monooxygenase (form 3) enzymes expressed in Escherichia coli as maltose binding protein fusions." Drug Metab Dispos 25(8): 1001-1007.
Brunet, M., F. Guy, D. Pilbeam, H. T. Mackaye, A. Likius, D. Ahounta, A. Beauvilain, C. Blondel, H. Bocherens, J. R. Boisserie, L. De Bonis, Y. Coppens, J. Dejax, C. Denys, P. Duringer, V. Eisenmann, G. Fanone, P. Fronty, D. Geraads, T. Lehmann, F. Lihoreau, A. Louchart, A. Mahamat, G. Merceron, G. Mouchelin, O. Otero, P. Pelaez Campomanes, M. Ponce De Leon, J. C. Rage, M. Sapanet, M. Schuster, J. Sudre, P. Tassy, X. Valentin, P. Vignaud, L. Viriot, A. Zazzo and C. Zollikofer (2002). "A new hominid from the Upper Miocene of Chad, Central Africa." Nature 418(6894): 145-151.
Cantrell, A. S., P. Engelhardt, M. Hogberg, S. R. Jaskunas, N. G. Johansson, C. L. Jordan, J. Kangasmetsa, M. D. Kinnick, P. Lind, J. M. Morin, Jr., M. A. Muesing, R. Noreen, B. Oberg, P. Pranc, C. Sahlberg, R. J. Ternansky, R. T. Vasileff, L. Vrang, S. J. West and H. Zhang (1996). "Phenethylthiazolylthiourea (PETT) compounds as a new class of HIV-1 reverse transcriptase inhibitors. 2. Synthesis and further structure-activity relationship studies of PETT analogs." J Med Chem 39(21): 4261-4274.
253
Cashman, J. R. (2002). "Human flavin-containing monooxygenase (form 3): polymorphisms and variations in chemical metabolism." Pharmacogenomics 3(3): 325-339.
Cashman, J. R., K. Camp, S. S. Fakharzadeh, P. V. Fennessey, R. N. Hines, O. A. Mamer, S. C. Mitchell, G. P. Nguyen, D. Schlenk, R. L. Smith, S. S. Tjoa, D. E. Williams and S. Yannicelli (2003). "Biochemical and clinical aspects of the human flavin-containing monooxygenase form 3 (FMO3) related to trimethylaminuria." Curr Drug Metab 4(2): 151-170.
Cashman, J. R., Y. N. Xiong, L. Xu and A. Janowsky (1999). "N-oxygenation of amphetamine and methamphetamine by the human flavin-containing monooxygenase (form 3): role in bioactivation and detoxication." J Pharmacol Exp Ther 288(3): 1251-1260.
Cashman, J. R., J. Zhang, J. Leushner and A. Braun (2001). "Population distribution of human flavin-containing monooxygenase form 3: gene polymorphisms." Drug Metab Dispos 29(12): 1629-1637.
Cashman, J. R. and D. M. Ziegler (1986). "Contribution of N-oxygenation to the metabolism of MPTP (1-methyl-4-phenyl-1,2,3,6-tetrahydropyridine) by various liver preparations." Mol Pharmacol 29(2): 163-167.
Chasseaud, L. F. and B. Catanese (1985). "Pharmacokinetics of benzydamine." Int J Tissue React 7(3): 195-204.
Cherrington, N. J., J. G. Falls, R. L. Rose, K. M. Clements, R. M. Philpot, P. E. Levi and E. Hodgson (1998). "Molecular cloning, sequence, and expression of mouse flavin-containing monooxygenases 1 and 5 (FMO1 and FMO5)." J Biochem Mol Toxicol 12(4): 205-212.
Chintu, C., C. Luo, G. Bhat, M. Raviglione, H. DuPont and A. Zumla (1993). "Cutaneous hypersensitivity reactions due to thiacetazone in the treatment of tuberculosis in Zambian children infected with HIV-I." Arch Dis Child 68(5): 665-668.
Choudhary, D., I. Jansson, I. Stoilov, M. Sarfarazi and J. B. Schenkman (2005). "Expression patterns of mouse and human CYP orthologs (families 1-4) during development and in different adult tissues." Arch Biochem Biophys 436(1): 50-61.
Chung, W. G. and Y. N. Cha (1997). "Oxidation of caffeine to theobromine and theophylline is catalyzed primarily by flavin-containing monooxygenase in liver microsomes." Biochem Biophys Res Commun 235(3): 685-688.
Chung, W. G., C. S. Park, H. K. Roh, W. K. Lee and Y. N. Cha (2000). "Oxidation of ranitidine by isozymes of flavin-containing monooxygenase and cytochrome P450." Jpn J Pharmacol 84(2): 213-220.
Dai, D., D. C. Zeldin, J. A. Blaisdell, B. Chanas, S. J. Coulter, B. I. Ghanayem and J. A. Goldstein (2001). "Polymorphisms in human CYP2C8 decrease metabolism of the anticancer drug paclitaxel and arachidonic acid." Pharmacogenetics 11(7): 597-607.
Dalen, P., M. L. Dahl, M. L. Bernal Ruiz, J. Nordin and L. Bertilsson (1998). "10-Hydroxylation of nortriptyline in white persons with 0, 1, 2, 3, and 13 functional CYP2D6 genes." Clin Pharmacol Ther 63(4): 444-452.
Dalen, P., M. L. Dahl, H. K. Roh, G. Tybring, M. Eichelbaum, G. R. Wilkinson and L. Bertilsson (2003). "Disposition of debrisoquine and nortriptyline in Korean subjects in relation to CYP2D6 genotypes, and comparison with Caucasians." Br J Clin Pharmacol 55(6): 630-634.
254

DeBarber, A. E., K. Mdluli, M. Bosman, L. G. Bekker and C. E. Barry, 3rd (2000). "Ethionamide activation and sensitivity in multidrug-resistant Mycobacterium tuberculosis." Proc Natl Acad Sci U S A 97(17): 9677-9682.
Decker, C. J., D. R. Doerge and J. R. Cashman (1992). "Metabolism of benzimidazoline-2-thiones by rat hepatic microsomes and hog liver flavin-containing monooxygenase." Chem Res Toxicol 5(5): 726-733.
Dieng, M. T., B. Ndiaye and C. Camara (2001). "[Skin toxicity of thiacetazone (TB1) at a hospital service in Dakar]." Dakar Med 46(1): 1-3.
Dixit, A. and T. E. Roche (1984). "Spectrophotometric assay of the flavin-containing monooxygenase and changes in its activity in female mouse liver with nutritional and diurnal conditions." Arch Biochem Biophys 233(1): 50-63.
Dolan, C., D. C. Shields, A. Stanton, E. O'Brien, D. M. Lambert, J. K. O'Brien and E. P. Treacy (2005). "Polymorphisms of the Flavin containing monooxygenase 3 (FMO3) gene do not predispose to essential hypertension in Caucasians." BMC Med Genet 6: 41.
Dolphin, C., E. A. Shephard, S. Povey, C. N. Palmer, D. M. Ziegler, R. Ayesh, R. L. Smith and I. R. Phillips (1991). "Cloning, primary sequence, and chromosomal mapping of a human flavin-containing monooxygenase (FMO1)." J Biol Chem 266(19): 12379-12385.
Dolphin, C. T., D. J. Beckett, A. Janmohamed, T. E. Cullingford, R. L. Smith, E. A. Shephard and I. R. Phillips (1998). "The flavin-containing monooxygenase 2 gene (FMO2) of humans, but not of other primates, encodes a truncated, nonfunctional protein." J Biol Chem 273(46): 30599-30607.
Dolphin, C. T., T. E. Cullingford, E. A. Shephard, R. L. Smith and I. R. Phillips (1996). "Differential developmental and tissue-specific regulation of expression of the genes encoding three members of the flavin-containing monooxygenase family of man, FMO1, FMO3 and FM04." Eur J Biochem 235(3): 683-689.
Dolphin, C. T., A. Janmohamed, R. L. Smith, E. A. Shephard and I. R. Phillips (2000). "Compound heterozygosity for missense mutations in the flavin-containing monooxygenase 3 (FM03) gene in patients with fish-odour syndrome." Pharmacogenetics 10(9): 799-807.
Dolphin, C. T., J. H. Riley, R. L. Smith, E. A. Shephard and I. R. Phillips (1997). "Structural organization of the human flavin-containing monooxygenase 3 gene (FMO3), the favored candidate for fish-odor syndrome, determined directly from genomic DNA." Genomics 46(2): 260-267.
Dolphin, C. T., E. A. Shephard, S. Povey, R. L. Smith and I. R. Phillips (1992). "Cloning, primary sequence and chromosomal localization of human FMO2, a new member of the flavin-containing mono-oxygenase family." Biochem J 287 ( Pt 1): 261-267.
Domagk, G. (1950). "Investigations on the antituberculous activity of the thiosemicarbazones in vitro and in vivo." Am Rev Tuberc 61(1): 8-19.
Dover, L. G., A. Alahari, P. Gratraud, J. M. Gomes, V. Bhowruth, R. C. Reynolds, G. S. Besra and L. Kremer (2007). "EthA, a common activator of thiocarbamide-containing drugs acting on different mycobacterial targets." Antimicrob Agents Chemother 51(3): 1055-1063.
Duescher, R. J., M. P. Lawton, R. M. Philpot and A. A. Elfarra (1994). "Flavin-containing monooxygenase (FMO)-dependent metabolism of methionine and evidence for FMO3 being the major FMO involved in methionine
255

sulfoxidation in rabbit liver and kidney microsomes." J Biol Chem 269(26): 17525-17530.
Eck, H. P., H. Frey and W. Droge (1989). "Elevated plasma glutamate concentrations in HIV-1-infected patients may contribute to loss of macrophage and lymphocyte functions." Int Immunol 1(4): 367-372.
Ellard, G. A., J. M. Dickinson, P. T. Gammon and D. A. Mitchison (1974). "Serum concentrations and antituberculosis activity of thiacetazone." Tubercle 55(1): 41-54.
Ellard, G. A. and P. T. Gammon (1976). "Pharmacokinetics of isoniazid metabolism in man." J Pharmacokinet Biopharm 4(2): 83-113.
Ellard, G. A., D. J. Girling and A. J. Nunn (1981). "The hepatotoxicity of isoniazid among the three acetylator phenotypes." Am Rev Respir Dis 123(5): 568-570.
Eriki, P. P., A. Okwera, T. Aisu, A. B. Morrissey, J. J. Ellner and T. M. Daniel (1991). "The influence of human immunodeficiency virus infection on tuberculosis in Kampala, Uganda." Am Rev Respir Dis 143(1): 185-187.
Falls, J. G., B. L. Blake, Y. Cao, P. E. Levi and E. Hodgson (1995). "Gender differences in hepatic expression of flavin-containing monooxygenase isoforms (FMO1, FMO3, and FMO5) in mice." J Biochem Toxicol 10(3): 171-177.
Falls, J. G., N. J. Cherrington, K. M. Clements, R. M. Philpot, P. E. Levi, R. L. Rose and E. Hodgson (1997). "Molecular cloning, sequencing, and expression in Escherichia coli of mouse flavin-containing monooxygenase 3 (FMO3): comparison with the human isoform." Arch Biochem Biophys 347(1): 9-18.
Fattorini, L., D. Tan, E. Iona, M. Mattei, F. Giannoni, L. Brunori, S. Recchia and G. Orefici (2003). "Activities of moxifloxacin alone and in combination with other antimicrobial agents against multidrug-resistant Mycobacterium tuberculosis infection in BALB/c mice." Antimicrob Agents Chemother 47(1): 360-362.
Fegan, D. and J. Glennon (1991). "Cutaneous sensitivity to thiacetazone." Lancet 337(8748): 1036.
Fegan, D. and J. Glennon (1991). "Severe skin reactions to thiacetazone in east Nepal." Tubercle 72(4): 305-306.
Fujieda, M., H. Yamazaki, M. Togashi, T. Saito and T. Kamataki (2003). "Two novel single nucleotide polymorphisms (SNPs) of the FMO3 gene in Japanese." Drug Metab Pharmacokinet 18(5): 333-335.
Furnes, B., J. Feng, S. S. Sommer and D. Schlenk (2003). "Identification of novel variants of the flavin-containing monooxygenase gene family in African Americans." Drug Metab Dispos 31(2): 187-193.
Furnes, B. and D. Schlenk (2004). "Evaluation of xenobiotic N- and S-oxidation by variant flavin-containing monooxygenase 1 (FMO1) enzymes." Toxicol Sci 78(2): 196-203.
Gardiner, S. J. and E. J. Begg (2006). "Pharmacogenetics, drug-metabolizing enzymes, and clinical practice." Pharmacol Rev 58(3): 521-590.
Garvin, R. T., D. K. Biswas and L. Gorini (1974). "The effects of streptomycin or dihydrostreptomycin binding to 16S RNA or to 30S ribosomal subunits." Proc Natl Acad Sci U S A 71(10): 3814-3818.
Gasser, R., R. E. Tynes, M. P. Lawton, K. K. Korsmeyer, D. M. Ziegler and R. M. Philpot (1990). "The flavin-containing monooxygenase expressed in pig liver: primary sequence, distribution, and evidence for a single gene." Biochemistry 29(1): 119-124.
256

Ghiladi, R. A., K. F. Medzihradszky, F. M. Rusnak and P. R. Ortiz de Montellano (2005). "Correlation between isoniazid resistance and superoxide reactivity in mycobacterium tuberculosis KatG." J Am Chem Soc 127(38): 13428-13442.
Giri, S. N. and A. B. Combs (1970). "Sulfur-containing compounds and tolerance in the prevention of certain metabolic effects of phenylthiourea." Toxicol Appl Pharmacol 16(3): 709-717.
Gothi, G. D., O’Rourke J. O., Baily, G. V. J. (1998 ). "Some Observations on the drug combination of INH + Thiacetazone Under the Conditions of District Tuberculosis Programmes." Ind. J. Tub. XIV(I): 41-48.
Guo, W. X. and D. M. Ziegler (1991). "Estimation of flavin-containing monooxygenase activities in crude tissue preparations by thiourea-dependent oxidation of thiocholine." Anal Biochem 198(1): 143-148.
Gupta, D. K., R. Kumar, V. Kumar and A. K. Aggarwal (1983). "Diffuse toxic alopecia due to thiacetazone." Indian J Chest Dis Allied Sci 25: 74-75.
Gupta, H. L., I. S. Gulati, H. Singh, P. S. Dhatt and H. C. Mehta (1977). "Thiacetazone therapy in childhood tuberculosis with special reference to hepatotoxicity." Indian J Med Res 65(3): 327-333.
Haining, R. L., A. P. Hunter, M. E. Veronese, W. F. Trager and A. E. Rettie (1996). "Allelic variants of human cytochrome P450 2C9: baculovirus-mediated expression, purification, structural characterization, substrate stereoselectivity, and prochiral selectivity of the wild-type and I359L mutant forms." Arch Biochem Biophys 333(2): 447-458.
Hamman, M. A., B. D. Haehner-Daniels, S. A. Wrighton, A. E. Rettie and S. D. Hall (2000). "Stereoselective sulfoxidation of sulindac sulfide by flavin-containing monooxygenases. Comparison of human liver and kidney microsomes and mammalian enzymes." Biochem Pharmacol 60(1): 7-17.
Hanes, C. S. (1932). "Studies on plant amylases: The effect of starch concentration upon the velocity of hydrolysis by the amylase of germinated barley." Biochem J 26(5): 1406-1421.
Hanoulle, X., J. M. Wieruszeski, P. Rousselot-Pailley, I. Landrieu, C. Locht, G. Lippens and A. R. Baulard (2006). "Selective intracellular accumulation of the major metabolite issued from the activation of the prodrug ethionamide in mycobacteria." J Antimicrob Chemother 58(4): 768-772.
Hao, D., J. Sun, B. Furnes, D. Schlenk, M. Li, S. Yang and L. Yang (2007). "Allele and genotype frequencies of polymorphic FMO3 gene in two genetically distinct populations." Cell Biochem Funct 25(4): 443-453.
Hao, D. C., J. Sun, B. Furnes, D. Schlenk, Z. F. Hou, Y. P. Zhang, S. L. Yang and L. Yang (2006). "Haplotype frequency distribution and linkage disequilibrium analysis of single nucleotide polymorphisms at the human FMO3 gene locus." Biochem Genet 44(7-8): 391-407.
Harland, R. D. (1962). "Stevens-Johnson syndrome with unusual skin features occurring in two patients undergoing treatment for pulmonary tuberculosis with thiacetazone." Tubercle 43: 189-191.
Heifets, L. B., P. J. Lindholm-Levy and M. Flory (1990). "Thiacetazone: in vitro activity against Mycobacterium avium and M. tuberculosis." Tubercle 71(4): 287-291.
Henderson, M. C., S. K. Krueger, L. K. Siddens, J. F. Stevens and D. E. Williams (2004)a. "S-oxygenation of the thioether organophosphate insecticides phorate and disulfoton by human lung flavin-containing monooxygenase 2." Biochem Pharmacol 68(5): 959-967.
257

Henderson, M. C., S. K. Krueger, J. F. Stevens and D. E. Williams (2004)b. "Human flavin-containing monooxygenase form 2 S-oxygenation: sulfenic acid formation from thioureas and oxidation of glutathione." Chem Res Toxicol 17(5): 633-640.
Henderson, M. C., L. K. Siddens, J. T. Morre, S. K. Krueger and D. E. Williams (2008). "Metabolism of the anti-tuberculosis drug ethionamide by mouse and human FMO1, FMO2 and FMO3 and mouse and human lung microsomes." Toxicol Appl Pharmacol 233(3): 420-427.
Hernandez, D., P. Chandan, A. Janmohamed, R. Phillips and E. A. Shephard (2006). "Deletion of genes from the mouse genome using Cre/loxP technology." Methods Mol Biol 320: 307-319.
Hernandez, D., A. Janmohamed, P. Chandan, B. A. Omar, I. R. Phillips and E. A. Shephard (2009). "Deletion of the mouse Fmo1 gene results in enhanced pharmacological behavioural responses to imipramine." Pharmacogenet Genomics 19(4): 289-299.
Hernandez, D., A. Janmohamed, P. Chandan, I. R. Phillips and E. A. Shephard (2004). "Organization and evolution of the flavin-containing monooxygenase genes of human and mouse: identification of novel gene and pseudogene clusters." Pharmacogenetics 14(2): 117-130.
Hines, R. N., Z. Luo, K. A. Hopp, E. T. Cabacungan, S. B. Koukouritaki and D. G. McCarver (2003). "Genetic variability at the human FMO1 locus: significance of a basal promoter yin yang 1 element polymorphism (FMO1*6)." J Pharmacol Exp Ther 306(3): 1210-1218.
Hisamuddin, I. M., M. A. Wehbi, A. Chao, H. W. Wyre, L. M. Hylind, F. M. Giardiello and V. W. Yang (2004). "Genetic polymorphisms of human flavin monooxygenase 3 in sulindac-mediated primary chemoprevention of familial adenomatous polyposis." Clin Cancer Res 10(24): 8357-8362.
Hisamuddin, I. M., M. A. Wehbi, B. Schmotzer, K. A. Easley, L. M. Hylind, F. M. Giardiello and V. W. Yang (2005). "Genetic polymorphisms of flavin monooxygenase 3 in sulindac-induced regression of colorectal adenomas in familial adenomatous polyposis." Cancer Epidemiol Biomarkers Prev 14(10): 2366-2369.
Humbert, J. A., K. B. Hammond and W. E. Hathaway (1970). "Trimethylaminuria: the fish-odour syndrome." Lancet 2(7676): 770-771.
Hussain, S. A., H. C. Saksena and R. P. Kothari (1973). "Stevens-Johnson syndrome due to thiacetazone." J Indian Med Assoc 60(2): 57-59.
Ipuge, Y. A., H. L. Rieder and D. A. Enarson (1995). "Adverse cutaneous reactions to thiacetazone for tuberculosis treatment in Tanzania." Lancet 346(8976): 657-660.
Itagaki, K., G. T. Carver and R. M. Philpot (1996). "Expression and characterization of a modified flavin-containing monooxygenase 4 from humans." J Biol Chem 271(33): 20102-20107.
Jacobsen, W., U. Christians and L. Z. Benet (2000). "In vitro evaluation of the disposition of A novel cysteine protease inhibitor." Drug Metab Dispos 28(11): 1343-1351.
Janmohamed, A., C. T. Dolphin, I. R. Phillips and E. A. Shephard (2001). "Quantification and cellular localization of expression in human skin of genes encoding flavin-containing monooxygenases and cytochromes P450." Biochem Pharmacol 62(6): 777-786.
258

Janmohamed, A., D. Hernandez, I. R. Phillips and E. A. Shephard (2004). "Cell-, tissue-, sex- and developmental stage-specific expression of mouse flavin-containing monooxygenases (Fmos)." Biochem Pharmacol 68(1): 73-83.
Janmohamed, A., P. Thaunsukon, E. A. Shephard and R. Phillips (2006). "Expression of recombinant flavin-containing monooxygenases in a baculovirus/insect cell system." Methods Mol Biol 320: 39-59.
Jensen, F. S., L. T. Skovgaard and J. Viby-Mogensen (1995). "Identification of human plasma cholinesterase variants in 6,688 individuals using biochemical analysis." Acta Anaesthesiol Scand 39(2): 157-162.
Jensen, F. S. and J. Viby-Mogensen (1995). "Plasma cholinesterase and abnormal reaction to succinylcholine: twenty years' experience with the Danish Cholinesterase Research Unit." Acta Anaesthesiol Scand 39(2): 150-156.
Jones, K. C. and D. P. Ballou (1986). "Reactions of the 4a-hydroperoxide of liver microsomal flavin-containing monooxygenase with nucleophilic and electrophilic substrates." J Biol Chem 261(6): 2553-2559.
Kalow, W. (2004). "Atypical plasma cholinesterase. A personal discovery story: a tale of three cities." Can J Anaesth 51(3): 206-211.
Karanam, B. V., C. E. Hop, D. Q. Liu, M. Wallace, D. Dean, H. Satoh, M. Komuro, K. Awano and S. H. Vincent (2004). "In vitro metabolism of MK-0767 [(+/-)-5-[(2,4-dioxothiazolidin-5-yl)methyl]-2-methoxy-N-[[(4-trifluoromet hyl) phenyl]methyl]benzamide], a peroxisome proliferator-activated receptor alpha/gamma agonist. I. Role of cytochrome P450, methyltransferases, flavin monooxygenases, and esterases." Drug Metab Dispos 32(9): 1015-1022.
Karoly, E. D. and R. L. Rose (2001). "Sequencing, expression, and characterization of cDNA expressed flavin-containing monooxygenase 2 from mouse." J Biochem Mol Toxicol 15(6): 300-308.
Keus, K., S. Houston, Y. Melaku and S. Burling (2003). "Field research in humanitarian medical programmes. Treatment of a cohort of tuberculosis patients using the Manyatta regimen in a conflict zone in South Sudan." Trans R Soc Trop Med Hyg 97(6): 614-618.
Khanna, P., S. Kaur, G. G. Sanwal and B. Ali (1992). "Characteristics of a cytosolic arylacylamidase metabolizing thiacetazone." J Pharmacol Exp Ther 262(3): 1225-1231.
Kim, Y. M. and D. M. Ziegler (2000). "Size limits of thiocarbamides accepted as substrates by human flavin-containing monooxygenase 1." Drug Metab Dispos 28(8): 1003-1006.
Kosower, N. S. and E. M. Kosower (1978). "The glutathione status of cells." Int Rev Cytol 54: 109-160.
Koukouritaki, S. B., M. T. Poch, E. T. Cabacungan, D. G. McCarver and R. N. Hines (2005). "Discovery of novel flavin-containing monooxygenase 3 (FMO3) single nucleotide polymorphisms and functional analysis of upstream haplotype variants." Mol Pharmacol 68(2): 383-392.
Koukouritaki, S. B., M. T. Poch, M. C. Henderson, L. K. Siddens, S. K. Krueger, J. E. VanDyke, D. E. Williams, N. M. Pajewski, T. Wang and R. N. Hines (2007). "Identification and functional analysis of common human flavin-containing monooxygenase 3 genetic variants." J Pharmacol Exp Ther 320(1): 266-273.
Koukouritaki, S. B., P. Simpson, C. K. Yeung, A. E. Rettie and R. N. Hines (2002). "Human hepatic flavin-containing monooxygenases 1 (FMO1) and 3 (FMO3) developmental expression." Pediatr Res 51(2): 236-243.
259

Krause, R. J., L. H. Lash and A. A. Elfarra (2003). "Human kidney flavin-containing monooxygenases and their potential roles in cysteine s-conjugate metabolism and nephrotoxicity." J Pharmacol Exp Ther 304(1): 185-191.
Krieter, P. A., D. M. Ziegler, K. E. Hill and R. F. Burk (1984). "Increased biliary GSSG efflux from rat livers perfused with thiocarbamide substrates for the flavin-containing monooxygenase." Mol Pharmacol 26(1): 122-127.
Krueger, S. K., S. R. Martin, M. F. Yueh, C. B. Pereira and D. E. Williams (2002). "Identification of active flavin-containing monooxygenase isoform 2 in human lung and characterization of expressed protein." Drug Metab Dispos 30(1): 34-41.
Krueger, S. K., L. K. Siddens, M. C. Henderson, E. A. Andreasen, R. L. Tanguay, C. B. Pereira, E. T. Cabacungan, R. N. Hines, K. G. Ardlie and D. E. Williams (2005). "Haplotype and functional analysis of four flavin-containing monooxygenase isoform 2 (FMO2) polymorphisms in Hispanics." Pharmacogenet Genomics 15(4): 245-256.
Krueger, S. K. and D. E. Williams (2005). "Mammalian flavin-containing monooxygenases: structure/function, genetic polymorphisms and role in drug metabolism." Pharmacol Ther 106(3): 357-387.
Kubota, M., Y. Nakamoto, K. Nakayama, P. Ujjin, S. Satarug, T. Mushiroda, T. Yokoi, M. Funayama and T. Kamataki (2002). "A mutation in the flavin-containing monooxygenase 3 gene and its effects on catalytic activity for N-oxidation of trimethylamine in vitro." Drug Metab Pharmacokinet 17(3): 207-213.
Kulkarni, A. P. and E. Hodgson (1984). "The metabolism of insecticides: the role of monooxygenase enzymes." Annu Rev Pharmacol Toxicol 24: 19-42.
Lambert, D. M., O. A. Mamer, B. R. Akerman, L. Choiniere, D. Gaudet, P. Hamet and E. P. Treacy (2001). "In vivo variability of TMA oxidation is partially mediated by polymorphisms of the FMO3 gene." Mol Genet Metab 73(3): 224-229.
Lang, D. H. and A. E. Rettie (2000). "In vitro evaluation of potential in vivo probes for human flavin-containing monooxygenase (FMO): metabolism of benzydamine and caffeine by FMO and P450 isoforms." Br J Clin Pharmacol 50(4): 311-314.
Lattard, V., C. Longin-Sauvageon, J. Lachuer, P. Delatour and E. Benoit (2002). "Cloning, sequencing, and tissue-dependent expression of flavin-containing monooxygenase (FMO) 1 and FMO3 in the dog." Drug Metab Dispos 30(2): 119-128.
Lattard, V., J. Zhang, Q. Tran, B. Furnes, D. Schlenk and J. R. Cashman (2003). "Two new polymorphisms of the FMO3 gene in Caucasian and African-American populations: comparative genetic and functional studies." Drug Metab Dispos 31(7): 854-860.
Lawn, S. D., E. H. Frimpong and J. W. Acheampong (1999). "Life-threatening cutaneous reactions to thiacetazone-containing antituberculosis treatment in Kumasi, Ghana." West Afr J Med 18(4): 249-253.
Lawton, M. P., J. R. Cashman, T. Cresteil, C. T. Dolphin, A. A. Elfarra, R. N. Hines, E. Hodgson, T. Kimura, J. Ozols, I. R. Phillips and et al. (1994). "A nomenclature for the mammalian flavin-containing monooxygenase gene family based on amino acid sequence identities." Arch Biochem Biophys 308(1): 254-257.
260

Lawton, M. P., R. Gasser, R. E. Tynes, E. Hodgson and R. M. Philpot (1990). "The flavin-containing monooxygenase enzymes expressed in rabbit liver and lung are products of related but distinctly different genes." J Biol Chem 265(10): 5855-5861.
Lawton, M. P., T. Kronbach, E. F. Johnson and R. M. Philpot (1991). "Properties of expressed and native flavin-containing monooxygenases: evidence of multiple forms in rabbit liver and lung." Mol Pharmacol 40(5): 692-698.
Lazarou, J., Pomeranz BH, Corey PN, Incidence of Adverse Drug Reactions in Hospitalized Patients: A meta-analysis of prospective studies. (1998). " Incidence of Adverse Drug Reactions in Hospitalized Patients: A meta-analysis of prospective studies." JAMA 279: 1200-1205.
Lee, C. (2009). "Goodbye suxamethonium!" Anaesthesia 64 Suppl 1: 73-81. Lee, P. W., T. Arnau and R. A. Neal (1980). "Metabolism of alpha-naphthylthiourea
by rat liver and rat lung microsomes." Toxicol Appl Pharmacol 53(1): 164-173.
Levi, P. E. and E. Hodgson (1988). "Stereospecificity in the oxidation of phorate and phorate sulphoxide by purified FAD-containing mono-oxygenase and cytochrome P-450 isozymes." Xenobiotica 18(1): 29-39.
Liebermann D, M. M., Rist N, Grumbach F. (1956). "Sur la preparation de nouveaux thioamides pyridiniques acitifs dans la tuberculose experimentale." C. R. Acad. Sci. 242: 2409-2412.
Liu, W. and D. A. Saint (2002). "A new quantitative method of real time reverse transcription polymerase chain reaction assay based on simulation of polymerase chain reaction kinetics." Anal Biochem 302(1): 52-59.
Lomri, N., Q. Gu and J. R. Cashman (1992). "Molecular cloning of the flavin-containing monooxygenase (form II) cDNA from adult human liver." Proc Natl Acad Sci U S A 89(5): 1685-1689.
Lotsch, J., G. Geisslinger and I. Tegeder (2009). "Genetic modulation of the pharmacological treatment of pain." Pharmacol Ther.
Lowry, O. H., N. J. Rosebrough, A. L. Farr and R. J. Randall (1951). "Protein measurement with the Folin phenol reagent." J Biol Chem 193(1): 265-275.
Luo, Z. and R. N. Hines (2001). "Regulation of flavin-containing monooxygenase 1 expression by ying yang 1 and hepatic nuclear factors 1 and 4." Mol Pharmacol 60(6): 1421-1430.
Mame Thierno, D., S. On, S. Thierno Ndiaye and B. Ndiaye (2001). "[Lyell syndrome in Senegal: responsibility of thiacetazone]." Ann Dermatol Venereol 128(12): 1305-1307.
Man Burrows, C. (1975 ). Commentaries on insanity. London, Rutlidge and Keegan Paul.
Mani, C., E. Hodgson and D. Kupfer (1993). "Metabolism of the antimammary cancer antiestrogenic agent tamoxifen. II. Flavin-containing monooxygenase-mediated N-oxidation." Drug Metab Dispos 21(4): 657-661.
Masters, B. S. and D. M. Ziegler (1971). "The distinct nature and function of NADPH-cytochrome c reductase and the NADPH-dependent mixed-function amine oxidase of porcine liver microsomes." Arch Biochem Biophys 145(1): 358-364.
Mayatepek, E., B. Flock and J. Zschocke (2004). "Benzydamine metabolism in vivo is impaired in patients with deficiency of flavin-containing monooxygenase 3." Pharmacogenetics 14(11): 775-777.
261

McCombie, R. R., C. T. Dolphin, S. Povey, I. R. Phillips and E. A. Shephard (1996). "Localization of human flavin-containing monooxygenase genes FMO2 and FMO5 to chromosome 1q." Genomics 34(3): 426-429.
Mertens, A. and R. Bunge (1950). "The present status of the chemotherapy of tuberculosis with conteben a substance of the thiosemicarbazone series; a review." Am Rev Tuberc 61(1): 20-38.
Miller, A. B., W. Fox and R. Tall (1966). "An international co-operative investigation into thiacetazone (thioacetazone) side-effects." Tubercle 47(1): 33-74.
Miller, J. A., J. W. Cramer and E. C. Miller (1960). "The N- and ringhydroxylation of 2-acetylaminofluorene during carcinogenesis in the rat." Cancer Res 20: 950-962.
Miller, M. M., R. A. James, J. K. Richer, D. F. Gordon, W. M. Wood and K. B. Horwitz (1997). "Progesterone regulated expression of flavin-containing monooxygenase 5 by the B-isoform of progesterone receptors: implications for tamoxifen carcinogenicity." J Clin Endocrinol Metab 82(9): 2956-2961.
Mushiroda, T., R. Douya, E. Takahara and O. Nagata (2000). "The involvement of flavin-containing monooxygenase but not CYP3A4 in metabolism of itopride hydrochloride, a gastroprokinetic agent: comparison with cisapride and mosapride citrate." Drug Metab Dispos 28(10): 1231-1237.
Nagata, T., D. E. Williams and D. M. Ziegler (1990). "Substrate specificities of rabbit lung and porcine liver flavin-containing monooxygenases: differences due to substrate size." Chem Res Toxicol 3(4): 372-376.
Narang, P. S., J.N "Thiacetazone Jaundice." Indian Journal of Tuberculosis XIII(No.2): 77-79.
Neill, P., D. Pringle, M. Mhonda, T. Kusema and C. F. Nhachi (1990). "Effects of two pulmonary tuberculosis drug treatments and acetylator status on liver function in a Zimbabwean population." Cent Afr J Med 36(4): 104-107.
Nikbakht, K. N., M. P. Lawton and R. M. Philpot (1992). "Guinea pig or rabbit lung flavin-containing monooxygenases with distinct mobilities in SDS-PAGE are allelic variants that differ at only two positions." Pharmacogenetics 2(5): 207-216.
Nunn, P., C. Gicheha, R. Hayes, S. Gathua, R. Brindle, D. Kibuga, T. Mutie, R. Kamunyi, M. Omwega, J. Were and et al. (1992). "Cross-sectional survey of HIV infection among patients with tuberculosis in Nairobi, Kenya." Tuber Lung Dis 73(1): 45-51.
Nunn, P., J. Porter and P. Winstanley (1993). "Thiacetazone--avoid like poison or use with care?" Trans R Soc Trop Med Hyg 87(5): 578-582.
Ohmi, N., H. Yoshida, H. Endo, M. Hasegawa, M. Akimoto and S. Higuchi (2003). "S-oxidation of S-methyl-esonarimod by flavin-containing monooxygenases in human liver microsomes." Xenobiotica 33(12): 1221-1231.
Omura, T. and S. Takesue (1970). "A new method for simultaneous purification of cytochrome b5 and NADPH-cytochrome c reductase from rat liver microsomes." J Biochem 67(2): 249-257.
Onderwater, R. C., J. N. Commandeur, W. M. Menge and N. P. Vermeulen (1999). "Activation of microsomal glutathione S-transferase and inhibition of cytochrome P450 1A1 activity as a model system for detecting protein alkylation by thiourea-containing compounds in rat liver microsomes." Chem Res Toxicol 12(5): 396-402.
262

Onderwater, R. C., J. N. Commandeur and N. P. Vermeulen (2004). "Comparative cytotoxicity of N-substituted N'-(4-imidazole-ethyl)thiourea in precision-cut rat liver slices." Toxicology 197(2): 81-91.
Onderwater, R. C., A. E. Rettie, J. N. Commandeur and N. P. Vermeulen (2006). "Bioactivation of N-substituted N'-(4-imidazole-ethyl)thioureas by human FMO1 and FMO3." Xenobiotica 36(7): 645-657.
Overby, L. H., A. R. Buckpitt, M. P. Lawton, E. Atta-Asafo-Adjei, J. Schulze and R. M. Philpot (1995). "Characterization of flavin-containing monooxygenase 5 (FMO5) cloned from human and guinea pig: evidence that the unique catalytic properties of FMO5 are not confined to the rabbit ortholog." Arch Biochem Biophys 317(1): 275-284.
Overby, L. H., G. C. Carver and R. M. Philpot (1997). "Quantitation and kinetic properties of hepatic microsomal and recombinant flavin-containing monooxygenases 3 and 5 from humans." Chem Biol Interact 106(1): 29-45.
Park, B. K. and N. R. Kitteringham (1990). "Assessment of enzyme induction and enzyme inhibition in humans: toxicological implications." Xenobiotica 20(11): 1171-1185.
Park, C. S., W. G. Chung, J. H. Kang, H. K. Roh, K. H. Lee and Y. N. Cha (1999). "Phenotyping of flavin-containing monooxygenase using caffeine metabolism and genotyping of FMO3 gene in a Korean population." Pharmacogenetics 9(2): 155-164.
Park, C. S., J. H. Kang, W. G. Chung, H. G. Yi, J. E. Pie, D. K. Park, R. N. Hines, D. G. McCarver and Y. N. Cha (2002). "Ethnic differences in allelic frequency of two flavin-containing monooxygenase 3 (FMO3) polymorphisms: linkage and effects on in vivo and in vitro FMO activities." Pharmacogenetics 12(1): 77-80.
Park, S. B., P. Jacob, 3rd, N. L. Benowitz and J. R. Cashman (1993). "Stereoselective metabolism of (S)-(-)-nicotine in humans: formation of trans-(S)-(-)-nicotine N-1'-oxide." Chem Res Toxicol 6(6): 880-888.
Parkin, D. P., S. Vandenplas, F. J. Botha, M. L. Vandenplas, H. I. Seifart, P. D. van Helden, B. J. van der Walt, P. R. Donald and P. P. van Jaarsveld (1997). "Trimodality of isoniazid elimination: phenotype and genotype in patients with tuberculosis." Am J Respir Crit Care Med 155(5): 1717-1722.
Parte, P. and D. Kupfer (2005). "Oxidation of tamoxifen by human flavin-containing monooxygenase (FMO) 1 and FMO3 to tamoxifen-N-oxide and its novel reduction back to tamoxifen by human cytochromes P450 and hemoglobin." Drug Metab Dispos 33(10): 1446-1452.
Pettit, F. H., W. Orme-Johnson and D. M. Ziegler (1964). "The requirement for flavin adenine dinucleotide by a liver microsmal oxygenase catalyzing the oxidation of alkylaryl amines." Biochem Biophys Res Commun 16(5): 444-448.
Phillips, I. R., C. T. Dolphin, P. Clair, M. R. Hadley, A. J. Hutt, R. R. McCombie, R. L. Smith and E. A. Shephard (1995). "The molecular biology of the flavin-containing monooxygenases of man." Chem Biol Interact 96(1): 17-32.
Phillips, I. R., Francois, A.A, Shephard, E.A (2007 ). "The Flavin-Containing Monoooxygenases (FMOs): Genetic Variation and its Consequences for the Metabolism of Therapeutic Drugs." Current Pharmacogenomics 5(5): 292-313.
Phillips, I. R. and E. A. Shephard (2008). "Flavin-containing monooxygenases: mutations, disease and drug response." Trends Pharmacol Sci 29(6): 294-301.
263
Pichard-Garcia, L., R. J. Weaver, N. Eckett, G. Scarfe, J. M. Fabre, C. Lucas and P. Maurel (2004). "The olivacine derivative s 16020 (9-hydroxy-5,6-dimethyl-N-[2-(dimethylamino)ethyl)-6H-pyrido(4,3-B)-carbaz ole-1-carboxamide) induces CYP1A and its own metabolism in human hepatocytes in primary culture." Drug Metab Dispos 32(1): 80-88.
Pines, A. (1964). "Thiacetazone Toxicity in British Patients." Tubercle 45: 188-191. Possuelo, L. G., J. A. Castelan, T. C. de Brito, A. W. Ribeiro, P. I. Cafrune, P. D.
Picon, A. R. Santos, R. L. Teixeira, T. S. Gregianini, M. H. Hutz, M. L. Rossetti and A. Zaha (2008). "Association of slow N-acetyltransferase 2 profile and anti-TB drug-induced hepatotoxicity in patients from Southern Brazil." Eur J Clin Pharmacol 64(7): 673-681.
Poulsen, L. L., R. M. Hyslop and D. M. Ziegler (1979). "S-Oxygenation of N-substituted thioureas catalyzed by the pig liver microsomal FAD-containing monooxygenase." Arch Biochem Biophys 198(1): 78-88.
Poulsen, L. L. and D. M. Ziegler (1979). "The liver microsomal FAD-containing monooxygenase. Spectral characterization and kinetic studies." J Biol Chem 254(14): 6449-6455.
Preziosi, P. (2007). "Isoniazid: metabolic aspects and toxicological correlates." Curr Drug Metab 8(8): 839-851.
Prough, R. A., P. C. Freeman and R. N. Hines (1981). "The oxidation of hydrazine derivatives catalyzed by the purified liver microsomal FAD-containing monooxygenase." J Biol Chem 256(9): 4178-4184.
Qian, L. and P. R. Ortiz de Montellano (2006). "Oxidative activation of thiacetazone by the Mycobacterium tuberculosis flavin monooxygenase EtaA and human FMO1 and FMO3." Chem Res Toxicol 19(3): 443-449.
Rawden, H. C., G. O. Kokwaro, S. A. Ward and G. Edwards (2000). "Relative contribution of cytochromes P-450 and flavin-containing monoxygenases to the metabolism of albendazole by human liver microsomes." Br J Clin Pharmacol 49(4): 313-322.
Reid, J. M., D. L. Walker, J. K. Miller, L. M. Benson, A. J. Tomlinson, S. Naylor, A. L. Blajeski, P. M. LoRusso and M. M. Ames (2004). "The metabolism of pyrazoloacridine (NSC 366140) by cytochromes p450 and flavin monooxygenase in human liver microsomes." Clin Cancer Res 10(4): 1471-1480.
Rettie, A. E., L. C. Wienkers, F. J. Gonzalez, W. F. Trager and K. R. Korzekwa (1994). "Impaired (S)-warfarin metabolism catalysed by the R144C allelic variant of CYP2C9." Pharmacogenetics 4(1): 39-42.
Rettie, A. E. and D. H. Lang (2000). "Can caffeine metabolism be used as an in-vivo probe for human flavin-containing monooxygenase activity?" Pharmacogenetics 10(3): 275-277.
Ring, B. J., S. A. Wrighton, S. L. Aldridge, K. Hansen, B. Haehner and L. A. Shipley (1999). "Flavin-containing monooxygenase-mediated N-oxidation of the M(1)-muscarinic agonist xanomeline." Drug Metab Dispos 27(10): 1099-1103.
Rodriguez, R. J. and C. L. Miranda (2000). "Isoform specificity of N-deacetyl ketoconazole by human and rabbit flavin-containing monooxygenases." Drug Metab Dispos 28(9): 1083-1086.
Rozwarski, D. A., C. Vilcheze, M. Sugantino, R. Bittman and J. C. Sacchettini (1999). "Crystal structure of the Mycobacterium tuberculosis enoyl-ACP
264

reductase, InhA, in complex with NAD+ and a C16 fatty acyl substrate." J Biol Chem 274(22): 15582-15589.
Ruse, M. J. and R. H. Waring (1991). "The effect of methimazole on thioamide bioactivation and toxicity." Toxicol Lett 58(1): 37-41.
Sachse, C., S. Ruschen, M. Dettling, J. Schley, S. Bauer, B. Muller-Oerlinghausen, I. Roots and J. Brockmoller (1999). "Flavin monooxygenase 3 (FMO3) polymorphism in a white population: allele frequencies, mutation linkage, and functional effects on clozapine and caffeine metabolism." Clin Pharmacol Ther 66(4): 431-438.
Sakuma, T., K. Kitajima, M. Nishiyama, M. Mashino, T. Hashita and N. Nemoto (2004). "Suppression of female-specific murine Cyp2b9 gene expression by growth or glucocorticoid hormones." Biochem Biophys Res Commun 323(3): 776-781.
Scorpio, A. and Y. Zhang (1996). "Mutations in pncA, a gene encoding pyrazinamidase/nicotinamidase, cause resistance to the antituberculous drug pyrazinamide in tubercle bacillus." Nat Med 2(6): 662-667.
Scorpio, A., P. Lindholm-Levy, L. Heifets, R. Gilman, S. Siddiqi, M. Cynamon and Y. Zhang (1997). "Characterization of pncA mutations in pyrazinamide-resistant Mycobacterium tuberculosis." Antimicrob Agents Chemother 41(3): 540-543.
Scott, A. M., Powell, G. M., Upshall, D. G., and Curtis, C. G. (1990). "Pulmonary toxicity of thioureas in the rat." Environ. Health Perspect. 85: 43-50.
Sharda, B. and B. Bhandari (1976). "Hepatotoxicity of thiacetazone." Indian Pediatr 13(4): 315-316.
Shephard, E. A., P. Chandan, M. Stevanovic-Walker, M. Edwards and I. R. Phillips (2007). "Alternative promoters and repetitive DNA elements define the species-dependent tissue-specific expression of the FMO1 genes of human and mouse." Biochem J 406(3): 491-499.
Shephard, E. A., C. T. Dolphin, M. F. Fox, S. Povey, R. Smith and I. R. Phillips (1993). "Localization of genes encoding three distinct flavin-containing monooxygenases to human chromosome 1q." Genomics 16(1): 85-89.
Shimada, T., H. Yamazaki, M. Mimura, Y. Inui and F. P. Guengerich (1994). "Interindividual variations in human liver cytochrome P-450 enzymes involved in the oxidation of drugs, carcinogens and toxic chemicals: studies with liver microsomes of 30 Japanese and 30 Caucasians." J Pharmacol Exp Ther 270(1): 414-423.
Shimizu, M., H. Yano, S. Nagashima, N. Murayama, J. Zhang, J. R. Cashman and H. Yamazaki (2007). "Effect of genetic variants of the human flavin-containing monooxygenase 3 on N- and S-oxygenation activities." Drug Metab Dispos 35(3): 328-330.
Siddens, L. K., M. C. Henderson, J. E. Vandyke, D. E. Williams and S. K. Krueger (2008). "Characterization of mouse flavin-containing monooxygenase transcript levels in lung and liver, and activity of expressed isoforms." Biochem Pharmacol 75(2): 570-579.
Sies, H., G. M. Bartoli, R. F. Burk and C. Waydhas (1978). "Glutathione efflux from perfused rat liver after phenobarbital treatment, during drug oxidations, and in selenium deficiency." Eur J Biochem 89(1): 113-118.
Singh, N., S. Dubey, S. Chinnaraj, A. Golani and A. Maitra (2009). "Study of NAT2 gene polymorphisms in an Indian population: association with plasma
265

isoniazid concentration in a cohort of tuberculosis patients." Mol Diagn Ther 13(1): 49-58.
Smith, P. B. and C. Crespi (2002). "Thiourea toxicity in mouse C3H/10T1/2 cells expressing human flavin-dependent monooxygenase 3." Biochem Pharmacol 63(11): 1941-1948.
Smyser, B. P. and E. Hodgson (1985). "Metabolism of phosphorus-containing compounds by pig liver microsomal FAD-containing monooxygenase." Biochem Pharmacol 34(8): 1145-1150.
Spotts, C. R. and R. Y. Stanier (1961). "Mechanism of streptomycin action on bacteria: a unitary hypothesis." Nature 192: 633-637.
Staal, F. J., S. W. Ela, M. Roederer, M. T. Anderson and L. A. Herzenberg (1992)a. "Glutathione deficiency and human immunodeficiency virus infection." Lancet 339(8798): 909-912.
Staal, F. J., M. Roederer and L. A. Herzenberg (1992)b. "Glutathione and immunophenotypes of T and B lymphocytes in HIV-infected individuals." Ann N Y Acad Sci 651: 453-463.
Staal, F. J., M. Roederer, D. M. Israelski, J. Bubp, L. A. Mole, D. McShane, S. C. Deresinski, W. Ross, H. Sussman, P. A. Raju and et al. (1992)c. "Intracellular glutathione levels in T cell subsets decrease in HIV-infected individuals." AIDS Res Hum Retroviruses 8(2): 305-311.
Stevens, J. C., R. J. Melton, M. J. Zaya and L. C. Engel (2003). "Expression and characterization of functional dog flavin-containing monooxygenase 1." Mol Pharmacol 63(2): 271-275.
Stormer, E. R., I. Brockmoller, J. (2000). "Benzydamine N-oxidation as an index reaction reflecting FMO activity in human liver microsomes and impact of FMO3 polymorphisms on enzyme activity." Br J Clin Pharmacol 50(6): 553-561.
Szoko, E., T. Tabi, T. Borbas, B. Dalmadi, K. Tihanyi and K. Magyar (2004). "Assessment of the N-oxidation of deprenyl, methamphetamine, and amphetamine enantiomers by chiral capillary electrophoresis: an in vitro metabolism study." Electrophoresis 25(16): 2866-2875.
Tarshis, M. S. and W. A. Weed, Jr. (1953). "Lack of significant in vitro sensitivity of Mycobacterium tuberculosis to pyrazinamide on three different solid media." Am Rev Tuberc 67(3): 391-395.
Thorn, C. F., T. E. Klein and R. B. Altman (2009). "Codeine and morphine pathway." Pharmacogenet Genomics 19(7): 556-558.
Timbrell, J. A., J. M. Wright and T. A. Baillie (1977). "Monoacetylhydrazine as a metabolite of isoniazid in man." Clin Pharmacol Ther 22(5 Pt 1): 602-608.
Todd, W. A. (1979). "Psychosocial problems as the major complication of an adolescent with trimethylaminuria." J Pediatr 94(6): 936-937.
Treacy, E. P., B. R. Akerman, L. M. Chow, R. Youil, C. Bibeau, J. Lin, A. G. Bruce, M. Knight, D. M. Danks, J. R. Cashman and S. M. Forrest (1998). "Mutations of the flavin-containing monooxygenase gene (FMO3) cause trimethylaminuria, a defect in detoxication." Hum Mol Genet 7(5): 839-845.
Tucker, G. T., J. H. Silas, A. O. Iyun, M. S. Lennard and A. J. Smith (1977). "Polymorphic hydroxylation of debrisoquine." Lancet 2(8040): 718.
Tugnait, M., E. M. Hawes, G. McKay, M. Eichelbaum and K. K. Midha (1999). "Characterization of the human hepatic cytochromes P450 involved in the in vitro oxidation of clozapine." Chem Biol Interact 118(2): 171-189.
266
Tynes, R. E. and E. Hodgson (1985). "Catalytic activity and substrate specificity of the flavin-containing monooxygenase in microsomal systems: characterization of the hepatic, pulmonary and renal enzymes of the mouse, rabbit, and rat." Arch Biochem Biophys 240(1): 77-93.
Vannelli, T. A., A. Dykman and P. R. Ortiz de Montellano (2002). "The antituberculosis drug ethionamide is activated by a flavoprotein monooxygenase." J Biol Chem 277(15): 12824-12829.
Veeramah, K. R., M. G. Thomas, M. E. Weale, D. Zeitlyn, A. Tarekegn, E. Bekele, N. R. Mendell, E. A. Shephard, N. Bradman and I. R. Phillips (2008). "The potentially deleterious functional variant flavin-containing monooxygenase 2*1 is at high frequency throughout sub-Saharan Africa." Pharmacogenet Genomics 18(10): 877-886.
Venkatesh, K., B. Blake, P. E. Levi and E. Hodgson (1992). "The flavin-containing monooxygenase in mouse lung: evidence for expression of multiple forms." J Biochem Toxicol 7(3): 163-169.
Virkel, G., A. Lifschitz, J. Sallovitz, A. Pis and C. Lanusse (2006). "Assessment of the main metabolism pathways for the flukicidal compound triclabendazole in sheep." J Vet Pharmacol Ther 29(3): 213-223.
Wada, M., S. Mizutani, Y. Nakajima, K. Ito, S. Mitarai, H. Hoshino, M. Okumura, T. Yoshiyama and H. Ogata (2007). "[A case of multidrug-resistant pulmonary tuberculosis cured by the regimen including thiacetazone]." Kekkaku 82(1): 33-37.
Washio, T., H. Arisawa, K. Kohsaka and H. Yasuda (2001). "Identification of human drug-metabolizing enzymes involved in the metabolism of SNI-2011." Biol Pharm Bull 24(11): 1263-1266.
Waxman, D. J. and M. G. Holloway (2009). "Sex differences in the expression of hepatic drug metabolizing enzymes." Mol Pharmacol 76(2): 215-228.
Weisman, S. J., R. L. Berkow, R. M. Weetman and R. L. Baehner (1985). "5-Azacytidine: acute central nervous system toxicity." Am J Pediatr Hematol Oncol 7(1): 86-88.
Whetstine, J. R., M. F. Yueh, D. G. McCarver, D. E. Williams, C. S. Park, J. H. Kang, Y. N. Cha, C. T. Dolphin, E. A. Shephard, I. R. Phillips and R. N. Hines (2000). "Ethnic differences in human flavin-containing monooxygenase 2 (FMO2) polymorphisms: detection of expressed protein in African-Americans." Toxicol Appl Pharmacol 168(3): 216-224.
WHO (2009). Epidemiology: Global Tuberculosis Control Report 2009 Wierenga, R. K., P. Terpstra and W. G. Hol (1986). "Prediction of the occurrence of
the ADP-binding beta alpha beta-fold in proteins, using an amino acid sequence fingerprint." J Mol Biol 187(1): 101-107.
Williams, D. E., S. E. Hale, A. S. Muerhoff and B. S. Masters (1985). "Rabbit lung flavin-containing monooxygenase. Purification, characterization, and induction during pregnancy." Mol Pharmacol 28(4): 381-390.
Williams, D. E., M. K. Shigenaga and N. Castagnoli, Jr. (1990). "The role of cytochromes P-450 and flavin-containing monooxygenase in the metabolism of (S)-nicotine by rabbit lung." Drug Metab Dispos 18(4): 418-428.
Williams, D. E., D. M. Ziegler, D. J. Nordin, S. E. Hale and B. S. Masters (1984). "Rabbit lung flavin-containing monooxygenase is immunochemically and catalytically distinct from the liver enzyme." Biochem Biophys Res Commun 125(1): 116-122.
267

Wolf, C. R. and N. K. Spurr (1992). "Identification of genetic differences in debrisoquine hydroxylase activity." Hepatology 15(2): 360.
Yeung, C. K., D. H. Lang, K. E. Thummel and A. E. Rettie (2000). "Immunoquantitation of FMO1 in human liver, kidney, and intestine." Drug Metab Dispos 28(9): 1107-1111.
Yueh, M. F., S. K. Krueger and D. E. Williams (1997). "Pulmonary flavin-containing monooxygenase (FMO) in rhesus macaque: expression of FMO2 protein, mRNA and analysis of the cDNA." Biochim Biophys Acta 1350(3): 267-271.
Zhang, J. and J. R. Cashman (2006). "Quantitative analysis of FMO gene mRNA levels in human tissues." Drug Metab Dispos 34(1): 19-26.
Zhang, J., Q. Tran, V. Lattard and J. R. Cashman (2003). "Deleterious mutations in the flavin-containing monooxygenase 3 (FMO3) gene causing trimethylaminuria." Pharmacogenetics 13(8): 495-500.
Zhang, Y. (2005). "The magic bullets and tuberculosis drug targets." Annu Rev Pharmacol Toxicol 45: 529-564.
Zhang, Y., B. Heym, B. Allen, D. Young and S. Cole (1992). "The catalase-peroxidase gene and isoniazid resistance of Mycobacterium tuberculosis." Nature 358(6387): 591-593.
Zhang, Y., M. M. Wade, A. Scorpio, H. Zhang and Z. Sun (2003). "Mode of action of pyrazinamide: disruption of Mycobacterium tuberculosis membrane transport and energetics by pyrazinoic acid." J Antimicrob Chemother 52(5): 790-795.
Zhou, S., P. Kestell and J. W. Paxton (2002). "6-methylhydroxylation of the anti-cancer agent 5,6-dimethylxanthenone-4-acetic acid (DMXAA) by flavin-containing monooxygenase 3." Eur J Drug Metab Pharmacokinet 27(3): 179-183.
Ziegler-Skylakakis, K., S. Nill, J. F. Pan and U. Andrae (1998). "S-oxygenation of thiourea results in the formation of genotoxic products." Environ Mol Mutagen 31(4): 362-373.
Ziegler, D. M. (1993). "Recent studies on the structure and function of multisubstrate flavin-containing monooxygenases." Annu Rev Pharmacol Toxicol 33: 179-199.
Ziegler, D. M. (2002). "An overview of the mechanism, substrate specificities, and structure of FMOs." Drug Metab Rev 34(3): 503-511.
Ziegler, D. M. and M. S. Gold (1971). "Oxidative metabolism of tertiary amine drugs by human liver tissue." Xenobiotica 1(4): 325-326.
Ziegler, D. M., P. Graf, L. L. Poulsen, W. Stahl and H. Sies (1992). "NADPH-dependent oxidation of reduced ebselen, 2-selenylbenzanilide, and of 2-(methylseleno)benzanilide catalyzed by pig liver flavin-containing monooxygenase." Chem Res Toxicol 5(2): 163-166.
Zschocke, J., D. Kohlmueller, E. Quak, T. Meissner, G. F. Hoffmann and E. Mayatepek (1999). "Mild trimethylaminuria caused by common variants in FMO3 gene." Lancet 354(9181): 834-835.
Zschocke, J. and E. Mayatepek (2000). "Biochemical and molecular studies in mild flavin monooxygenase 3 deficiency." J Inherit Metab Dis 23(4): 378-382.
268

Appendix 1
269

Table 1: Primer sequences used in standard PCR.
Name of primer Orientation Sequence (5’ – 3’) Source of sequence
M13F Forward TCCCAGTCACGACGTCGT
pUC
M13R Reverse GGAAACAGCTATGACCATG pUC
270

Gene Orientation Primer Sequence (5’-3’)
Amplicon size (bp)
Source
Fmo1 Forward Reverse
TGTCTCTGGACAGTGGGAAGT CATTCCAACTACAAGGACTCG
166 (Janmohamed et al. 2001)
Fmo2 Forward Reverse
AGGCTCCATCTTCCCAACCGTA CCGGGTCTTTAAGGGTTTCAGG
382 (Siddens et al. 2008)
Fmo3 Forward Reverse
ACAACTTACCCACCGCCATCTC GGCATAACCATAGCCTGTGGCAAA
269 (Hernandez et al. 2009)
GAPDH Forward Reverse
TTCACCACCATGGAGAAGGC GGCATGGACTGTGGTCATGA
237 Bioline Reference Gene Panel
18S rRNA Forward Reverse
TTGACGGAAGGGCACCACCAG GCACCACCACCCACGGAATCG
130 Bioline Reference Gene Panel
G-Actin Forward Reverse
AGGAGATCACAGCCCTAGCA ACATCTGCTGGAAGGTGGAC
189 Bioline Reference Gene Panel
271
Table 2: Gene Specific Primers used in qRT-PCR

272
Publications

Human Flavin-Containing Monooxygenase 2.1 CatalyzesOxygenation of the Antitubercular Drugs Thiacetazone
and Ethionamide
Asvi A. Francois, Clinton R. Nishida, Paul R. Ortiz de Montellano, Ian R. Phillips,and Elizabeth A. Shephard
Institute of Structural and Molecular Biology (A.A.F., E.A.S.) and UCL Genetics Institute (E.A.S.), University College London,London, United Kingdom; Department of Pharmaceutical Chemistry, University of California, San Francisco, California
(C.R.N., P.R.O.d.M.); and School of Biological and Chemical Sciences, Queen Mary, University of London,London, United Kingdom (I.R.P.)
Received August 25, 2008; accepted October 20, 2008
ABSTRACT:
The second-line antitubercular drugs thiacetazone (TAZ) and ethi-onamide (ETA) are bioactivated by the mycobacterial enzyme EtaA.We report here that human flavin-containing monooxygenase 2.1(FMO2.1), which is expressed predominantly in the lung, catalyzesoxygenation of TAZ. The metabolites generated, the sulfenic acid,sulfinic acid, and carbodiimide derivatives, are the same as thoseproduced by EtaA and human FMO1 and FMO3. Two of the me-tabolites, the sulfenic acid and carbodiimide, are known to beharmful to mammalian cells. FMO2.1 also catalyzes oxygenation ofETA, producing the S-oxide. We have developed a novel spectro-photometric assay for TAZ oxygenation. The assay was used todetermine kinetic parameters for TAZ oxygenation catalyzed byhuman FMO1, FMO2.1, and FMO3 and by EtaA. Although the KM
values for the four enzyme-catalyzed reactions are similar, kcat
and, consequently, kcat/KM (the specificity constant) for FMO2.1-catalyzed TAZ oxygenation are much higher than those of FMO1,FMO3, or EtaA. This indicates that FMO2.1 is more effective incatalyzing TAZ oxygenation than are the other three enzymes andthus is likely to contribute substantially to the metabolism of TAZ,decreasing the availability of the prodrug to mycobacteria andproducing toxic metabolites. Because of a genetic polymorphism,Europeans and Asians lack FMO2.1. However, in sub-SaharanAfrica, a region in which tuberculosis is a major health problem, asubstantial proportion of individuals express FMO2.1. Thus, ourresults may explain some of the observed interindividual differ-ences in response to TAZ and ETA and have implications for thetreatment of tuberculosis in sub-Saharan Africa.
Pulmonary tuberculosis (TB) is a serious respiratory disease causedby the opportunistic bacterium Mycobacterium tuberculosis. TheWorld Health Organization estimated 9.2 million new cases of TBinfection worldwide in 2006, of which 31% were in Africa. Theappearance of strains of M. tuberculosis that are resistant to more thanone first-line antitubercular drug has required the use of second-linedrugs (Peloquin, 1993), such as the thiourea thiacetazone (TAZ;4�-formylacetanilide thiosemicarbazone) and the thioamide ethionamide(ETA; 2-ethylpyridine-4-carbothioamide). TAZ has been widely usedin the developing world (Brown, 1992). Although an effective treat-ment for multidrug-resistant TB, it can produce adverse effects suchas liver toxicity, gastrointestinal disturbances, and life-threateningskin reactions, particularly in human immunodeficiency virus patients(Teklu, 1976; Brown, 1992; Peloquin, 1993; Ipuge et al., 1995), and,
consequently, its use has been discontinued in several countries(Brown, 1992). ETA continues to be prescribed in both developed anddeveloping countries.
Both TAZ and ETA are prodrugs that are converted to their activeforms by the mycobacterial enzyme EtaA (Baulard et al., 2000;DeBarber et al., 2000; Qian and Ortiz de Montellano, 2006), aflavin-containing monooxygenase (FMO) (Vannelli et al., 2002).EtaA activates TAZ by two sequential oxidation steps to form asulfinic acid and a carbodiimide via a postulated sulfenic acid inter-mediate (Qian and Ortiz de Montellano, 2006). TAZ treatment affectsmycolic acid biogenesis in mycobacteria (Alahari et al., 2007; Doveret al., 2007), and this may be the mechanism by which the drug exertsits antimicrobial effect.
The FMOs (EC 1.14.13.8) of mammals catalyze the oxidativemetabolism of numerous xenobiotics, including pesticides, fertilizers,and therapeutic drugs (Krueger and Williams, 2005; Cashman andZhang, 2006; Phillips et al., 2007; Phillips and Shephard, 2008).Humans express five functional FMOs, FMOs 1 through 5 (Phillips etal., 1995; Hernandez et al., 2004). FMO1, FMO2, and FMO3 can
The work in San Francisco was supported by National Institutes of Health[Grant AI074824].
Article, publication date, and citation information can be found athttp://dmd.aspetjournals.org.
doi:10.1124/dmd.108.024158.
ABBREVIATIONS: TB, tuberculosis; TAZ, thiacetazone; ETA, ethionamide; FMO, flavin-containing monooxygenase; HPLC, high-performanceliquid chromatography; Sf, Spodoptera frugiperda; LC/MS, liquid chromatography/mass spectrometry; FA, formic acid; DMSO, dimethyl sulfoxide;GSH, glutathione.
0090-9556/09/3701-178–186$20.00DRUG METABOLISM AND DISPOSITION Vol. 37, No. 1Copyright © 2009 by The American Society for Pharmacology and Experimental Therapeutics 24158/3422738DMD 37:178–186, 2009 Printed in U.S.A.
178
at Univ O
f Calif S
an Francisco on D
ecember 28, 2008
dmd.aspetjournals.org
Dow
nloaded from

bioactivate thiourea-based drugs (Smith and Crespi, 2002; Hendersonet al., 2004; Onderwater et al., 2006), and FMO1 and FMO3 havebeen shown to catalyze oxygenation of TAZ in vitro, forming thesame products as EtaA (Qian and Ortiz de Montellano, 2006).
A genetic polymorphism of the FMO2 gene, g.23238C�T(Q472X), gives rise to an allele, FMO2*2, which encodes a truncated,nonfunctional protein (FMO2.2) (Dolphin et al., 1998). Essentially allEuropeans and Asians are homozygous for FMO2*2 and thus do notexpress functional FMO2 (Dolphin et al., 1998; Whetstine et al.,2000). However, in sub-Saharan Africa, and in populations recentlydescended from this region, a substantial proportion of individualspossess at least one copy of the ancestral FMO2*1 allele, whichencodes a full-length functional protein (FMO2.1) (Dolphin et al.,1998; Whetstine et al., 2000; Veeramah et al., 2008). In contrast toFMO1 and FMO3, which in the adult human are expressed primarilyin kidney and liver, respectively (Dolphin et al., 1996; Yeung et al.,2000; Hernandez et al., 2004; Cashman and Zhang, 2006), the mainsite of expression of FMO2 is the lung (Dolphin et al., 1998; Kruegeret al., 2002; Hernandez et al., 2004; Cashman and Zhang, 2006).Expression of functional FMO2.1 has been confirmed in lung micro-somes from an individual heterozygous for the FMO2*1 allele(Krueger et al., 2002).
Because TAZ and ETA act against mycobacteria in the lung, weinvestigated the ability of human FMO2.1 to catalyze the oxygenationof these antitubercular drugs. In this article, we show that the proteinencoded by the FMO2*1 allele, FMO2.1, catalyzes oxygenation ofboth TAZ and ETA, forming the same metabolites as those producedby human FMO1 and FMO3 and by the mycobacterial enzyme EtaA.Furthermore, we show that the specificity constant of FMO2.1 forTAZ is higher than that of any of the other three enzymes. Our resultsprovide a potential explanation for some of the observed interindi-vidual differences in the efficacy of and response to TAZ and ETAand have implications for the treatment of TB in sub-Saharan Africaand in individuals of recent African descent.
Materials and Methods
Materials. Chemical reagents, enzymes, and antibiotics were obtained fromSigma-Aldrich (St. Louis, MO) unless stated otherwise. Plasticware for insectcell culture was obtained from VWR (West Chester, PA). Reagents forhigh-performance liquid chromatography (HPLC) were obtained from FisherScientific (Waltham, MA) and were of HPLC grade.
Protein Expression. Recombinant bacmids encoding full-length humanFMO2 (FMO2Q472; FMO2.1) and FMO3 were as described previously (Dol-phin et al., 1997, 1998). A recombinant bacmid encoding human FMO1 wasprepared from an FMO1 cDNA (Dolphin et al., 1991) (accession numberQ01740) via site-specific transposition in Escherichia coli, through the use ofthe Bac-to-Bac system (Invitrogen, Carlsbad, CA) as described previously(Janmohamed et al., 2006). Bacmid DNAs were isolated using a modifiedalkaline lysis method. Production of baculovirus and expression of FMOs inSpodoptera frugiperda (Sf ) 9 cells were as described previously (Janmohamedet al., 2006), except that after infection with recombinant baculovirus, cellswere cultured for 96 h before harvesting. EtaA was expressed and purified asdescribed previously (Vannelli et al., 2002).
Isolation of Microsomal Membranes. Sf9 cells were harvested and resus-pended in HEPES buffer [0.154 M KCl, 10 mM HEPES, pH 7.4, 1 mM EDTA,20% (v/v) glycerol]. Cells were lysed by three 12-s bursts of sonication on ice.Cell lysates were centrifuged at 1000g for 10 min at 4°C. The resultingsupernatant was centrifuged at 100,000g for 1 h at 4°C. The pellet wasresuspended in HEPES buffer by hand, using a glass-glass homogenizer placedon ice, and stored in aliquots at �80°C. Protein concentration was determinedusing the method of Lowry (DC Protein Assay kit; Bio-Rad, Hercules, CA) andbovine serum albumin (Bio-Rad) as a standard.
Quantification of FMOs. Antibodies to FMO1, FMO2, and FMO3 were agift from Dr. R. Philpot. Heterologously expressed FMOs were quantified by
Western blotting essentially as described previously (Dolphin et al., 1997,1998). Blots were incubated with goat anti-(rabbit FMO1), goat anti-(rabbitFMO2), or goat anti-(rabbit FMO3) serum (1 in 3000 dilution), then with arabbit anti-(goat IgG)-alkaline phosphatase conjugate (1 in 30,000 dilution).Antigen was visualized through the use of a color development kit (APConjugate Substrate Kit; Bio-Rad). The concentration of each expressed FMOwas determined by scanning densitometry and Image Gauge software, version4.2.1 (Science Lab, FujiFilm, Tokyo, Japan) using a standard curve of authen-tic rabbit FMO1 and FMO2 or human FMO3 (which were gifts from Dr.R. Philpot). As a comparison, the relative abundance of heterologously ex-pressed FMOs was estimated from scans of Coomassie Blue-stained SDS-polyacrylamide gels of a range of amounts of microsomal protein isolated fromSf9 cells infected with recombinant baculoviruses (data not shown). The resultscorresponded well with those obtained by Western blotting, indicating thatthere was no appreciable difference in cross-reactivity among the antibodies.
Enzyme Incubations with TAZ or ETA. Sf9 insect cell microsomescontaining heterologously expressed human FMO1, FMO2.1, or FMO3 (at afinal concentration of 500 nM) or purified EtaA (1 �M final concentration)were incubated with TAZ (100 �M final concentration) at 37°C for 90 min inthe buffer described previously (Qian and Ortiz de Montellano, 2006). Reac-tions were initiated by the addition of enzyme. Reactions were stopped byaddition of an equal volume of ice-cold CH3CN. Mixtures were centrifuged at10,000g for 5 min at 4°C and analyzed by HPLC as described below.
Sf9 insect cell microsomes containing heterologously expressed humanFMO2.1 were incubated with ETA (final concentration 100 �M) for 60 min asdescribed previously (Qian and Ortiz de Montellano, 2006). Reactions wereanalyzed by liquid chromatography/mass spectroscopy (LC/MS) as describedbelow.
HPLC. The supernatants were diluted to a final concentration of 5%CH3CN and then analyzed by HPLC on a reverse-phase C18 column (3.5-�mparticle size, 4.6 mm i.d. � 150 mm, Symmetry; Waters, Milford, MA) usingtwo buffers: A, H2O and 0.1% formic acid (FA) and B, CH3CN and 0.1% FA.The solvent flow rate was 0.2 ml/min, and the eluent was spectrophotometri-cally monitored using two bandwidths (330 � 60 and 260 � 4 nm). Thecolumn was eluted from 0 to 25 min with a linear gradient from 5 to 20%buffer B. For spectral analysis of metabolites, eluent peaks were monitoredbetween 200 and 500 nm.
LC/MS Analyses. For analysis of TAZ metabolites, LC/MS was performedas described previously (Qian and Ortiz de Montellano, 2006), with theexception of the following modifications. The reverse-phase column waseluted with a flow rate of 0.2 ml/min (buffer A, H2O and 0.1% FA; buffer B,CH3CN and 0.1% FA) with the following protocol: 0 to 16 min, 5 to 30%buffer B (linear gradient). The eluent was monitored at 310 nm. The massspectrometer settings were as described previously (Qian and Ortiz de Mon-tellano, 2006).
LC/MS analysis of ETA metabolites produced by FMO2.1 was performedas described above, with the following modifications. The column was elutedat a flow rate of 0.2 ml/min (buffer A, H2O and 0.1% FA; buffer B, CH3CNand 0.1% FA) with the following protocol: 0 to 15 min with 1% buffer B(isocratic). The eluent was monitored at 350 nm.
Determination of Kinetic Parameters by Spectrophotometric Analysis.The molar extinction coefficient of TAZ was determined as follows. Twocuvettes containing 1 ml of Tris-HCl, pH 8.5, 1 mM EDTA were placed in aVarian Cary 100 dual-beam spectrophotometer (Varian, Inc., Palo Alto, CA).The spectrophotometer was set to blank correction mode. TAZ [in dimethylsulfoxide (DMSO)] was added to the sample cuvette, and DMSO was added tothe reference cuvette. The final organic solvent concentration in each cuvettewas held at 0.1% (v/v). Using the Varian Scan application, samples werescanned from 200 to 500 nm over a range of TAZ concentrations between 1and 20 �M. These measurements were carried out in triplicate using threeindependently prepared stock solutions of TAZ (20 �M) that were dilutedaccordingly in DMSO. The absorbance of TAZ, measured at its �max (328 nm),was plotted against concentration. The molar extinction coefficient of TAZ inDMSO was determined from the gradient of this graph and the Beer-Lambertequation.
Enzyme-catalyzed oxidation of TAZ was monitored by measuring the rateof decrease in the absorbance of TAZ at 328 nm using a dual-beam spectro-
179THIACETAZONE AND ETHIONAMIDE METABOLISM BY FMO2.1
at Univ O
f Calif S
an Francisco on D
ecember 28, 2008
dmd.aspetjournals.org
Dow
nloaded from

photometer (Varian Cary 100, kinetics module). The pH optima for humanFMOs and EtaA were determined using the following reaction buffers: 0.1 mMpotassium phosphate, pH 7.5, 1 mM EDTA; 0.1 M Tris-HCl, pH 8.5, 1 mMEDTA; and 0.1 M Tricine-OH, pH 9.5, 1 mM EDTA. Immediately before usebuffers were aerated at 37°C for 30 min in a shaking water bath. Assays wereperformed in a volume of 1 ml in reaction buffer containing 0.1 mM NADPHand either Sf9 cell microsomes containing human FMO1 (320 nM), FMO2.1(5 nM), or FMO3 (230 nM) or purified EtaA (1 �M). Reaction mixtures wereallowed to equilibrate for 1 min at 37°C. Reactions were initiated by theaddition of TAZ in DMSO (to a final TAZ concentration of 10 �M) to thesample cuvette and DMSO to the reference cuvette. Initial rates were recordedbetween 1 and 5 min.
For determination of kinetic parameters, assays were performed on triplicatepreparations of enzymes at concentrations of TAZ ranging from 1 to 20 �M.The final organic solvent concentration was held at 0.1% (v/v). Assays werecarried out in triplicate as described above in the optimum pH buffer for eachenzyme: pH 8.5 for FMO1 and FMO3 and pH 9.5 for FMO2.1 and EtaA.
KM and Vmax values were determined from vi versus [S]o data usingnonlinear regression and the kinetics module 3.1 of Sigma Plot version 10(SPSS Inc., Chicago, IL). For calculation of kcat values, enzyme concentrationwas determined as described above.
Determination of Kinetic Parameters by HPLC Analysis. Sf9 cell mi-crosomes containing heterologously expressed human FMO2.1 were incubatedin 0.1 M Tricine-OH, pH 9.5, 1 mM EDTA, 0.1 mM NADPH, and TAZ(concentrations ranged from 1–50 �M in DMSO). A duplicate set of sampleswas prepared but without the addition of enzyme. The final organic solventconcentration was held at 0.1% (v/v). Mixtures were incubated at 37°C for 5min, and reactions were quenched with an equal volume of ice-cold CH3CN.ETA was added as an internal standard at a final concentration of 100 �M (inDMSO), and mixtures were prepared for HPLC analysis as described above. Astandard curve was generated by plotting the ratio of the integrated HPLC peakareas of TAZ and ETA (from the sample set without added enzyme) against therange of TAZ concentrations used. The ratio of the integrated HPLC peak areasof TAZ and ETA, in the sample set with added enzyme, was calculated, and
the amount of unmetabolized TAZ was determined from the standard curve.This value was subtracted from the input concentration of TAZ to calculate theamount of TAZ metabolized by the enzyme. Vmax, KM, and kcat were deter-mined as above.
Enzyme Incubations with Methimazole. Sf9 insect cell microsomes con-taining heterologously expressed human FMO1, FMO2.1, or FMO3 wereassayed for activity toward methimazole by the method of Dixit and Roche(1984) as described previously (Dolphin et al., 1998). Assays for FMO1 andFMO3 activity were carried out at pH 8.5, and those for FMO2.1 were done atpH 9.5.
Results
Catalytic Oxidation of TAZ by Human FMO2.1. Incubation ofTAZ with Sf9 insect cell microsomes containing heterologously ex-pressed human FMO2.1, in the presence of NADPH, resulted in theformation of three major metabolites with reverse-phase retentiontimes of 7.5 min (M1), 11.4 min (M2), and 14.6 min (M3) (Fig. 1).No products were observed when TAZ was incubated with micro-somes isolated from noninfected Sf9 cells or when NADPH wasomitted (results not shown). UV spectral analysis of the metabolites(Fig. 2) showed that M1 had a maximal absorption peak at 325 nmand a smaller peak at approximately 230 nm. M2 had a similarspectrum, with peaks at 320 and 220 nm. The absorption spectrum ofM3 exhibited a main peak at 295 nm and a secondary peak at 220 nm.
To identify the three metabolites, M1, M2, and M3, formed from TAZby the action of human FMO2.1, they were analyzed by LC/MS. Themass spectrum of M1 had a molecular ion [M � H]� at m/z 269.07, withfragment ions at m/z 205.14 and 163.12 (Fig. 3A). The mass of themolecular ion of M1 is 32 atomic mass units more than that of themolecular ion of TAZ (237), suggesting a structure in which TAZ hasincorporated two oxygen atoms (Fig. 3A) and hence supports identifica-tion of the metabolite as the sulfinic acid derivative. The mass spectrum
FIG. 1. UV-HPLC chromatogram of the products from incubations of TAZ withSf 9 insect cell microsomes containing heterologously expressed human FMO2.1in the presence of NADPH. Reactions were carried out at pH 9.5 for 90 min at 37°C.
FIG. 2. UV-absorption spectra of the three metabolites produced from the incuba-tion of TAZ with heterologously expressed human FMO2.1 and NADPH. Dottedline, M1; solid line, M2; and dashed line, M3.
180 FRANCOIS ET AL.
at Univ O
f Calif S
an Francisco on D
ecember 28, 2008
dmd.aspetjournals.org
Dow
nloaded from
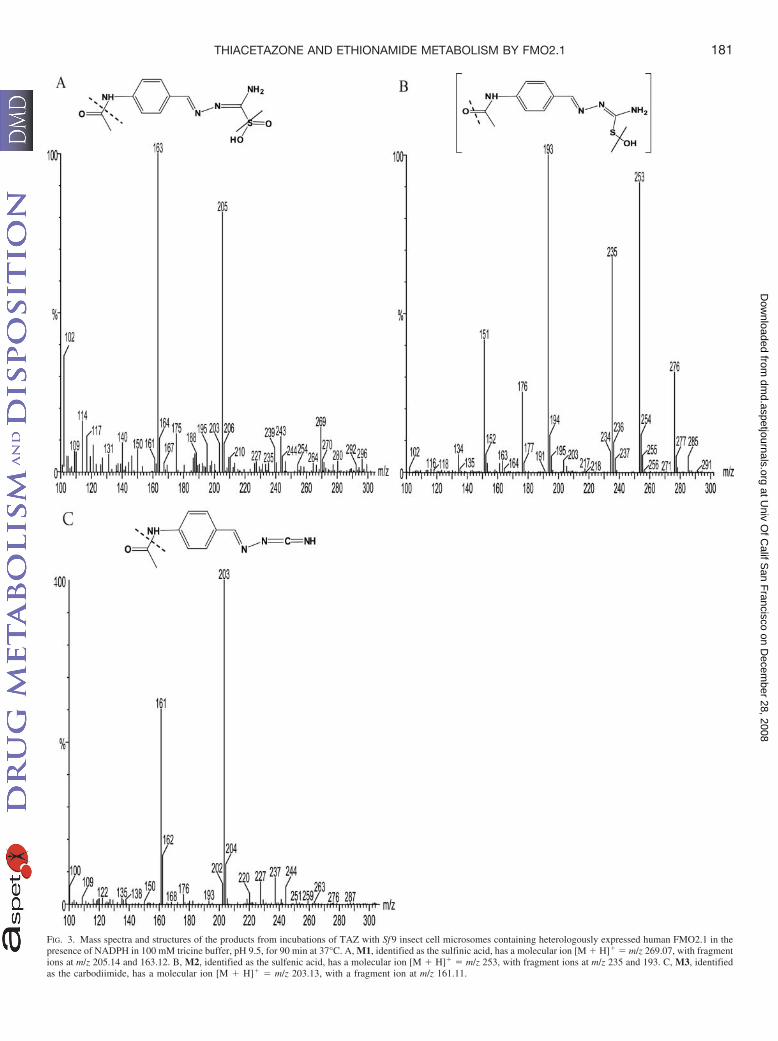
FIG. 3. Mass spectra and structures of the products from incubations of TAZ with Sf 9 insect cell microsomes containing heterologously expressed human FMO2.1 in thepresence of NADPH in 100 mM tricine buffer, pH 9.5, for 90 min at 37°C. A, M1, identified as the sulfinic acid, has a molecular ion [M � H]� � m/z 269.07, with fragmentions at m/z 205.14 and 163.12. B, M2, identified as the sulfenic acid, has a molecular ion [M � H]� � m/z 253, with fragment ions at m/z 235 and 193. C, M3, identifiedas the carbodiimide, has a molecular ion [M � H]� � m/z 203.13, with a fragment ion at m/z 161.11.
181THIACETAZONE AND ETHIONAMIDE METABOLISM BY FMO2.1
at Univ O
f Calif S
an Francisco on D
ecember 28, 2008
dmd.aspetjournals.org
Dow
nloaded from

of M2 had a molecular ion [M � H]� at m/z 253, with fragment ions atm/z 235 and 193 (Fig. 3B). The mass of the molecular ion of M2 is inaccord with a structure in which TAZ has incorporated a single oxygenatom, and thus supports identification of M2 as the monooxygenated,sulfenic acid derivative. The metabolite M3 has a molecular ion [M �H]� at m/z 203.13, which suggests that it is the carbodiimide generatedby elimination from M2 of the oxidized sulfur atom (Fig. 3C). Previouslysynthesized authentic standards of TAZ-sulfinic acid and TAZ-carbodiimide (Qian and Ortiz de Montellano, 2006) were used to confirmthe identity of M1 and M3. Comparison of their HPLC elution times, UVspectra, and MS spectra with those of the synthetic standards unambig-uously identified the metabolites M1 and M3 as the sulfinic acid andcarbodiimide derivatives of TAZ, respectively.
The same three metabolites (the sulfinic acid, sulfenic acid, andcarbodiimide derivatives) were also produced when TAZ was incu-bated with purified EtaA or Sf9 cell microsomes containing heterolo-gously expressed human FMO1 or FMO3 (data not shown). Previouswork identified M1 and M3 as products formed by the action of theseenzymes on TAZ (Qian and Ortiz de Montellano, 2006). Although thesulfenic acid derivative (M2) was not detected, it was postulated as anintermediate in the enzyme-catalyzed metabolism of TAZ (Qian andOrtiz de Montellano, 2006). To confirm this, incubations of TAZ withheterologously expressed human FMO2.1 were quenched at differenttime points (Fig. 4). It is clear from the results that formation andaccumulation of M2 precede that of M1 and M3, indicating that M2is an intermediate in the formation of the latter two metabolites.
Catalytic Oxidation of ETA by Human FMO2.1. Incubation ofETA with Sf9 microsomes containing heterologously expressed hu-man FMO2.1, in the presence of NADPH, resulted in the formation ofa major product, P1, with LC retention time of 6.2 min (Fig. 5A). Themass spectrum of P1 had a molecular ion [M � H]� at m/z 183, withfragment ions at m/z 151 and 133 (Fig. 5B). The mass of the molecularion of P1 is 16 atomic mass units more than that of the molecular ionof ETA (166), suggesting a structure in which ETA has incorporatedone oxygen atom (Fig. 5B). This supports identification of P1 as theS-oxide of ETA. The retention time and mass spectrum of P1 areidentical to those of authentic ETA S-oxide (Vannelli et al., 2002),therefore unambiguously identifying this metabolite as the S-oxide ofETA. A mass spectrum of the broad peak with an LC retention timeof approximately 4 min (Fig. 5A) could not be obtained.
Development of a Spectrophotometric Assay of TAZ Oxidation.A UV absorption spectrum of TAZ revealed an absorption maximumat 328 nm and a smaller peak at approximately 220 nm (data notshown). The absorbance of TAZ at 328 nm was linear between 1 and20 �M (data not shown), and at this wavelength the molar extinctioncoefficient of TAZ in DMSO was determined as 38,300 � 2320M�1cm�1. Incubation of TAZ, in the presence of NADPH, with Sf9cell microsomes containing heterologously expressed human FMO1,FMO2.1, or FMO3, or with purified EtaA resulted in a decrease inTAZ absorbance at 328 nm that was linear over time (Fig. 6 and datanot shown) and with respect to enzyme concentration. No decrease inTAZ absorbance was observed in the absence of EtaA or humanFMOs or when microsomes prepared from noninfected Sf9 cellswere used. Omission of NADPH from reaction mixtures containingheterologously expressed human FMOs resulted in a very small (�1%of that observed in the presence of NADPH) and short-lived (�2 min)decrease in TAZ absorbance. This is because of the presence ofendogenous NADPH in the insect cell microsomes. This spectropho-tometric assay was used to determine the pH optima and kineticparameters of enzyme-catalyzed oxidation of TAZ.
Effect of pH on TAZ Oxidation Catalyzed by Human FMOs andEtaA. TAZ was incubated with purified EtaA or with heterologouslyexpressed human FMO1, FMO2.1, or FMO3 in buffers of pH 7.5, 8.5, or9.5. Oxidation of TAZ was measured spectrophotometrically. The pH op-timum for the oxidation of TAZ at a concentration of 10 �M was 8.5 forhuman FMO1 and FMO3 and 9.5 for human FMO2.1 and EtaA (Fig. 7).
Kinetics of TAZ Oxidation by Human FMOs and EtaA. Thekinetics of TAZ oxidation catalyzed by EtaA or heterologously ex-pressed human FMO1, FMO2.1, or FMO3 was evaluated by deter-mining the initial rates of TAZ oxidation, measured spectrophoto-metrically, over a range of TAZ concentrations (Fig. 8 and data notshown). Assays were performed at the optimum pH determined foreach enzyme as described above. Steady-state kinetic parameters weredetermined from vi versus [S] data by nonlinear regression.
The KM values for TAZ oxidation catalyzed by human FMO1,FMO2.1, and FMO3 are very similar to each other and slightly lowerthan that of the EtaA-catalyzed reaction (Table 1). The kcat of theFMO2.1-catalyzed reaction is much higher than that of reactionscatalyzed by human FMO1, FMO3, or EtaA (Table 1). Consequently,kcat/KM (the specificity constant) for TAZ is much higher for humanFMO2.1 than for the other three enzymes (Table 1). Very similarkinetic parameters for FMO2.1-catalyzed TAZ oxygenation wereobtained through the use of an HPLC-based assay, thus validating thespectrophotometric assay (data not shown).
As a comparison, we determined kinetic parameters for FMO1-,FMO2.1-, and FMO3-catalyzed oxygenation of methimazole, a pro-totypic substrate for FMOs (Table 1). The kcat of each enzyme wassimilar for TAZ and methimazole. However, for FMO2.1 the KM for
FIG. 4. UV-HPLC chromatograms of the products from incubations of TAZ withSf 9 insect cell microsomes containing heterologously expressed human FMO2.1in the presence of NADPH. Reactions were carried out at pH 9.5 and 37°C for 0 min(A), 10 min (B), or 20 min (C).
182 FRANCOIS ET AL.
at Univ O
f Calif S
an Francisco on D
ecember 28, 2008
dmd.aspetjournals.org
Dow
nloaded from

methimazole was 100-fold greater than that for TAZ. Consequently,for methimazole oxygenation, the kcat/KM of FMO2.1 is considerablyless than that of FMO1 and slightly less than that of FMO3.
Discussion
Our results show that full-length, functional FMO2 of human(FMO2.1) catalyzes oxygenation of the second-line thiourea antitu-bercular drug TAZ in vitro. The metabolites generated, the sulfenicacid, sulfinic acid, and carbodiimide derivatives, are the same as those
produced by the action of human FMO1, human FMO3, or themycobacterial enzyme EtaA. The sulfinic acid and carbodiimide de-rivatives have been identified previously as products of TAZ oxygen-ation catalyzed by FMO1, FMO3, or EtaA (Qian and Ortiz de Mon-tellano, 2006). Although these authors did not detect the sulfenic acidderivative, it was postulated to be an intermediate. Our results confirmthat in reactions catalyzed by all three human FMOs and by EtaA,TAZ sulfenic acid is indeed an intermediate in the formation of thesulfinic acid and carbodiimide metabolites.
FIG. 5. Analysis of the products from incubation of ETA with Sf 9 insect cell microsomes containing heterologously expressed human FMO2.1 and NADPH in 100 mMpotassium phosphate buffer, pH 7.5, for 60 min at 37°C. A, LC chromatogram (350 nm). B, the mass spectrum and structure of the product P1. P1 has a molecular ion[M � H]� at m/z 183, with fragment ions at m/z 151 and 133.
183THIACETAZONE AND ETHIONAMIDE METABOLISM BY FMO2.1
at Univ O
f Calif S
an Francisco on D
ecember 28, 2008
dmd.aspetjournals.org
Dow
nloaded from
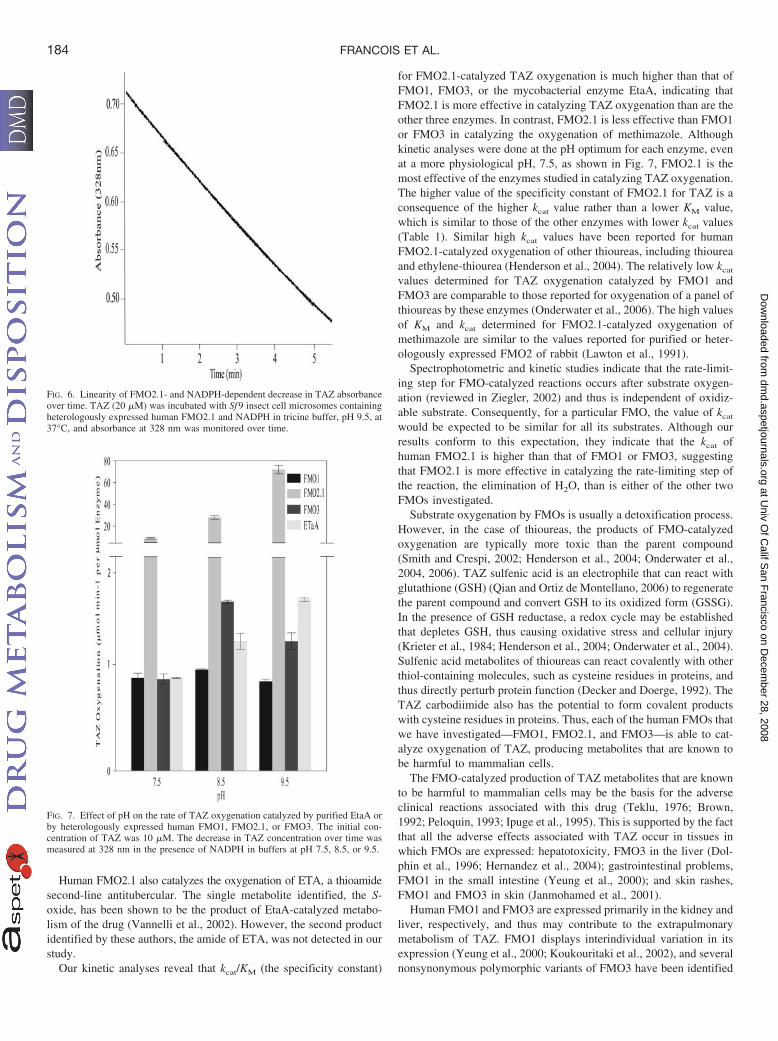
Human FMO2.1 also catalyzes the oxygenation of ETA, a thioamidesecond-line antitubercular. The single metabolite identified, the S-oxide, has been shown to be the product of EtaA-catalyzed metabo-lism of the drug (Vannelli et al., 2002). However, the second productidentified by these authors, the amide of ETA, was not detected in ourstudy.
Our kinetic analyses reveal that kcat/KM (the specificity constant)
for FMO2.1-catalyzed TAZ oxygenation is much higher than that ofFMO1, FMO3, or the mycobacterial enzyme EtaA, indicating thatFMO2.1 is more effective in catalyzing TAZ oxygenation than are theother three enzymes. In contrast, FMO2.1 is less effective than FMO1or FMO3 in catalyzing the oxygenation of methimazole. Althoughkinetic analyses were done at the pH optimum for each enzyme, evenat a more physiological pH, 7.5, as shown in Fig. 7, FMO2.1 is themost effective of the enzymes studied in catalyzing TAZ oxygenation.The higher value of the specificity constant of FMO2.1 for TAZ is aconsequence of the higher kcat value rather than a lower KM value,which is similar to those of the other enzymes with lower kcat values(Table 1). Similar high kcat values have been reported for humanFMO2.1-catalyzed oxygenation of other thioureas, including thioureaand ethylene-thiourea (Henderson et al., 2004). The relatively low kcat
values determined for TAZ oxygenation catalyzed by FMO1 andFMO3 are comparable to those reported for oxygenation of a panel ofthioureas by these enzymes (Onderwater et al., 2006). The high valuesof KM and kcat determined for FMO2.1-catalyzed oxygenation ofmethimazole are similar to the values reported for purified or heter-ologously expressed FMO2 of rabbit (Lawton et al., 1991).
Spectrophotometric and kinetic studies indicate that the rate-limit-ing step for FMO-catalyzed reactions occurs after substrate oxygen-ation (reviewed in Ziegler, 2002) and thus is independent of oxidiz-able substrate. Consequently, for a particular FMO, the value of kcat
would be expected to be similar for all its substrates. Although ourresults conform to this expectation, they indicate that the kcat ofhuman FMO2.1 is higher than that of FMO1 or FMO3, suggestingthat FMO2.1 is more effective in catalyzing the rate-limiting step ofthe reaction, the elimination of H2O, than is either of the other twoFMOs investigated.
Substrate oxygenation by FMOs is usually a detoxification process.However, in the case of thioureas, the products of FMO-catalyzedoxygenation are typically more toxic than the parent compound(Smith and Crespi, 2002; Henderson et al., 2004; Onderwater et al.,2004, 2006). TAZ sulfenic acid is an electrophile that can react withglutathione (GSH) (Qian and Ortiz de Montellano, 2006) to regeneratethe parent compound and convert GSH to its oxidized form (GSSG).In the presence of GSH reductase, a redox cycle may be establishedthat depletes GSH, thus causing oxidative stress and cellular injury(Krieter et al., 1984; Henderson et al., 2004; Onderwater et al., 2004).Sulfenic acid metabolites of thioureas can react covalently with otherthiol-containing molecules, such as cysteine residues in proteins, andthus directly perturb protein function (Decker and Doerge, 1992). TheTAZ carbodiimide also has the potential to form covalent productswith cysteine residues in proteins. Thus, each of the human FMOs thatwe have investigated—FMO1, FMO2.1, and FMO3—is able to cat-alyze oxygenation of TAZ, producing metabolites that are known tobe harmful to mammalian cells.
The FMO-catalyzed production of TAZ metabolites that are knownto be harmful to mammalian cells may be the basis for the adverseclinical reactions associated with this drug (Teklu, 1976; Brown,1992; Peloquin, 1993; Ipuge et al., 1995). This is supported by the factthat all the adverse effects associated with TAZ occur in tissues inwhich FMOs are expressed: hepatotoxicity, FMO3 in the liver (Dol-phin et al., 1996; Hernandez et al., 2004); gastrointestinal problems,FMO1 in the small intestine (Yeung et al., 2000); and skin rashes,FMO1 and FMO3 in skin (Janmohamed et al., 2001).
Human FMO1 and FMO3 are expressed primarily in the kidney andliver, respectively, and thus may contribute to the extrapulmonarymetabolism of TAZ. FMO1 displays interindividual variation in itsexpression (Yeung et al., 2000; Koukouritaki et al., 2002), and severalnonsynonymous polymorphic variants of FMO3 have been identified
FIG. 6. Linearity of FMO2.1- and NADPH-dependent decrease in TAZ absorbanceover time. TAZ (20 �M) was incubated with Sf 9 insect cell microsomes containingheterologously expressed human FMO2.1 and NADPH in tricine buffer, pH 9.5, at37°C, and absorbance at 328 nm was monitored over time.
FIG. 7. Effect of pH on the rate of TAZ oxygenation catalyzed by purified EtaA orby heterologously expressed human FMO1, FMO2.1, or FMO3. The initial con-centration of TAZ was 10 �M. The decrease in TAZ concentration over time wasmeasured at 328 nm in the presence of NADPH in buffers at pH 7.5, 8.5, or 9.5.
184 FRANCOIS ET AL.
at Univ O
f Calif S
an Francisco on D
ecember 28, 2008
dmd.aspetjournals.org
Dow
nloaded from

(reviewed in Phillips et al., 2007; Phillips and Shephard, 2008), one ofwhich, L360P, increases enzyme activity (Lattard et al., 2003),whereas others, such as E158K and E308G, when present together incis, decrease enzyme activity (reviewed in Phillips et al., 2007;
Phillips and Shephard, 2008). Promoter variants that affect transcrip-tion have also been identified (Koukouritaki et al., 2005). Therefore,individuals who have lower expression or activity of FMO1 or FMO3would be less able to metabolize TAZ in extrapulmonary tissues,
FIG. 8. A, Michaelis-Menten plot of TAZoxygenation catalyzed by heterologouslyexpressed human FMO2.1 in the presenceof NADPH at pH 9.5. B, linear transform ofMichaelis-Menten data using Hanes-Woolfregression (r2 � 0.961).
TABLE 1
Kinetic parameters of enzyme-catalyzed oxygenation of TAZ and methimazole
TAZ assays were performed in triplicate on batches of microsomes isolated from three independent infections of Sf 9 cells (i.e., nine measurements per FMO). Methimazole assays wereperformed in triplicate on a single batch of microsomes for each heterologously expressed human FMO. EtaA assays were performed in triplicate on purified protein. Kinetic parameters arereported as mean � S.E.
EnzymeThiacetazone Methimazole
KM kcat kcat/KM KM kcat kcat/KM
�M min�1 min�1M�1 (�105) �M min�1 min�1M�1 (�104)
FMO1 6.30 � 0.80 5.08 � 0.46 7.94 � 1.99 8.08 � 2.35 2.27 � 0.30 28.11 � 7.95FMO2.1 5.80 � 0.55 80.10 � 4.42 142.56 � 18.30 575.75 � 60.02 31.50 � 2.11 5.48 � 0.68FMO3 7.01 � 0.53 1.37 � 0.20 1.96 � 0.39 29.30 � 4.06 2.60 � 0.38 8.97 � 1.81EtaA 9.05 � 0.57 3.02 � 0.30 3.29 � 0.81 N.D. N.D. N.D.
N.D., not determined.
185THIACETAZONE AND ETHIONAMIDE METABOLISM BY FMO2.1
at Univ O
f Calif S
an Francisco on D
ecember 28, 2008
dmd.aspetjournals.org
Dow
nloaded from

whereas those with higher expression or activity would metabolizeTAZ more effectively, thus reducing the amount of prodrug reachingthe lung and increasing the amounts of metabolites toxic to the host.Polymorphic variants in FMO3 have been shown to influence themetabolism and therapeutic outcomes of drugs such as benzydamineand sulindac (Stormer et al., 2000; Hisamuddin et al., 2005).
TAZ and ETA are prodrugs that are converted to their active formsin mycobacteria. Therefore, for treatment to be effective, a sufficientamount of unmetabolized drug must reach mycobacteria in the lung.Although Europeans and Asians lack functional FMO2, a substantialproportion of sub-Saharan Africans and individuals of recent Africandescent possess an ancestral FMO2*1 allele (Whetstine et al., 2000;Veeramah et al., 2008) and thus would be expected to express func-tional FMO2 in the lung (Krueger et al., 2002). The relatively highspecificity constant for FMO2.1-catalyzed TAZ oxygenation suggeststhat, when present in lung, FMO2.1 is likely to contribute substan-tially to the metabolism of TAZ in this tissue, thus decreasing theavailability of the prodrug to mycobacteria and producing metabolitestoxic to the host. Therefore, patients with multidrug-resistant TB whoexpress FMO2.1 may respond less well to treatment with second-lineantitubercular drugs such as TAZ and ETA and may be more prone toadverse clinical reactions to these drugs. The relatively high frequencyof the FMO2*1 allele in sub-Saharan Africa, a region in which TB isa major health problem, has implications for the efficacy of andresponse to antitubercular drugs, such as TAZ and ETA, that aresubstrates for FMO2.1.
Acknowledgments. We thank Dr. R. Philpot for antibodies toFMOs and FMO protein standards and Prof. Keith Brocklehurst forhelpful comments on the manuscript.
References
Alahari A, Trivelli X, Guerardel Y, Dover LG, Besra GS, Sacchettini JC, Reynolds RC, CoxonGD, and Kremer L (2007) Thiacetazone, an antitubercular drug that inhibits cyclopropanationof cell wall mycolic acids in mycobacteria. PLoS ONE 2:e1343.
Baulard AR, Betts JC, Engohang-Ndong J, Quan S, McAdam RA, Brennan PJ, Locht C, andBesra GS (2000) Activation of the pro-drug ethionamide is regulated in mycobacteria. J BiolChem 275:28326–28331.
Brown P (1992) Cheap TB drug ‘too dangerous’ for Africa. New Sci 135:5.Cashman JR and Zhang J (2006) Human flavin-containing monooxygenases. Annu Rev Phar-
macol Toxicol 46:65–100.DeBarber AE, Mdluli K, Bosman M, Bekker LG, and Barry CE 3rd (2000) Ethionamide
activation and sensitivity in multidrug-resistant Mycobacterium tuberculosis. Proc Natl AcadSci U S A 97:9677–9682.
Decker CJ and Doerge DR (1992) Covalent binding of 14C- and 35S-labeled thiocarbamides inrat hepatic microsomes. Biochem Pharmacol 43:881–888.
Dixit A and Roche TE (1984) Spectrophotometric assay of the flavin-containing monooxygenaseand changes in its activity in female mouse liver with nutritional and diurnal conditions. ArchBiochem Biophys 233:50–63.
Dolphin C, Shephard EA, Povey S, Palmer CN, Ziegler DM, Ayesh R, Smith RL, and PhillipsIR (1991) Cloning, primary sequence, and chromosomal mapping of a human flavin-containing monooxygenase (FMO1). J Biol Chem 266:12379–12385.
Dolphin CT, Beckett DJ, Janmohamed A, Cullingford TE, Smith RL, Shephard EA, and PhillipsIR (1998) The flavin-containing monooxygenase 2 gene (FMO2) of humans, but not of otherprimates, encodes a truncated, nonfunctional protein. J Biol Chem 273:30599–30607.
Dolphin CT, Cullingford TE, Shephard EA, Smith RL, and Phillips IR (1996) Differentialdevelopmental and tissue-specific regulation of expression of the genes encoding threemembers of the flavin-containing monooxygenase family of man, FMO1, FMO3 and FM04.Eur J Biochem 235:683–689.
Dolphin CT, Janmohamed A, Smith RL, Shephard EA, and Phillips IR (1997) Missense mutationin flavin-containing mono-oxygenase 3 gene, FMO3, underlies fish-odour syndrome. NatGenet 17:491–494.
Dover LG, Alahari A, Gratraud P, Gomes JM, Bhowruth V, Reynolds RC, Besra GS, and KremerL (2007) EthA, a common activator of thiocarbamide-containing drugs acting on differentmycobacterial targets. Antimicrob Agents Chemother 51:1055–1063.
Henderson MC, Krueger SK, Stevens JF, and Williams DE (2004) Human flavin-containingmonooxygenase form 2 S-oxygenation: sulfenic acid formation from thioureas and oxidationof glutathione. Chem Res Toxicol 17:633–640.
Hernandez D, Janmohamed A, Chandan P, Phillips IR, and Shephard EA (2004) Organizationand evolution of the flavin-containing monooxygenase genes of human and mouse: identifi-cation of novel gene and pseudogene clusters. Pharmacogenetics 14:117–130.
Hisamuddin IM, Wehbi MA, Schmotzer B, Easley KA, Hylind LM, Giardiello FM, and YangVW (2005) Genetic polymorphisms of flavin monooxygenase 3 in sulindac-induced regressionof colorectal adenomas in familial adenomatous polyposis. Cancer Epidemiol BiomarkersPrev 14:2366–2369.
Ipuge YA, Rieder HL, and Enarson DA (1995) Adverse cutaneous reactions to thiacetazone fortuberculosis treatment in Tanzania. Lancet 346:657–660.
Janmohamed A, Dolphin CT, Phillips IR, and Shephard EA (2001) Quantification and cellularlocalization of expression in human skin of genes encoding flavin-containing monooxygenasesand cytochromes P450. Biochem Pharmacol 62:777–786.
Janmohamed A, Thaunsukon P, Shephard EA, and Phillips R (2006) Expression of recombinantflavin-containing monooxygenases in a baculovirus/insect cell system, in Cytochrome P450Protocols (Phillips IR and Shephard EA eds) ed 2, pp 307–319, Humana Press Totowa, NJ.
Koukouritaki SB, Poch MT, Cabacungan ET, McCarver DG, and Hines RN (2005) Discovery ofnovel flavin-containing monooxygenase 3 (FMO3) single nucleotide polymorphisms andfunctional analysis of upstream haplotype variants. Mol Pharmacol 68:383–392.
Koukouritaki SB, Simpson P, Yeung CK, Rettie AE, and Hines RN (2002) Human hepaticflavin-containing monooxygenases 1 (FMO1) and 3 (FMO3) developmental expression.Pediatr Res 51:236–243.
Krieter PA, Ziegler DM, Hill KE, and Burk RF (1984) Increased biliary GSSG efflux from ratlivers perfused with thiocarbamide substrates for the flavin-containing monooxygenases. MolPharmacol 26:122–127.
Krueger SK, Martin SR, Yueh MF, Pereira CB, and Williams DE (2002) Identification of activeflavin-containing monooxygenase isoform 2 in human lung and characterization of expressedprotein. Drug Metab Dispos 30:34–41.
Krueger SK and Williams DE (2005) Mammalian flavin-containing monooxygenases: structure/function, genetic polymorphisms and role in drug metabolism. Pharmacol Ther 106:357–387.
Lattard V, Zhang J, Tran Q, Furnes B, Schlenk D, and Cashman JR (2003) Two new polymor-phisms of the FMO3 gene in Caucasian and African-American populations: comparativegenetic and functional studies. Drug Metab Dispos 31:854–860.
Lawton MP, Kronbach T, Johnson EF, and Philpot RM (1991) Properties of expressed and nativeflavin-containing monooxygenases: evidence of multiple forms in rabbit liver and lung. MolPharmacol 40:692–698.
Onderwater RC, Commandeur JN, and Vermeulen NP (2004) Comparative cytotoxicity ofN-substituted N�-(4-imidazole-ethyl)thiourea in precision-cut rat liver slices. Toxicology 197:81–91.
Onderwater RC, Rettie AE, Commandeur JN, and Vermeulen NP (2006) Bioactivation ofN-substituted N�-(4-imidazole-ethyl)thioureas by human FMO1 and FMO3. Xenobiotica 36:645–657.
Peloquin CA (1993) Pharmacology of the antimycobacterial drugs. Med Clin North Am 77:1253–1262.
Phillips IR, Dolphin CT, Clair P, Hadley MR, Hutt AJ, McCombie RR, Smith RL, and ShephardEA (1995) The molecular biology of the flavin-containing monooxygenases of man. ChemBiol Interact 96:17–32.
Phillips IR, Francois AA, and Shephard EA (2007) The flavin-containing monooxygenases(FMOs): Genetic variation and its consequences for the metabolism of therapeutic drugs.Current Pharmacogenomics 5:292–313.
Phillips IR and Shephard EA (2008) Flavin-containing monooxygenases: mutations, disease anddrug response. Trends Pharmacol Sci 29:294–301.
Qian L and Ortiz de Montellano PR (2006) Oxidative activation of thiacetazone by theMycobacterium tuberculosis flavin monooxygenase EtaA and human FMO1 and FMO3. ChemRes Toxicol 19:443–449.
Smith PB and Crespi C (2002) Thiourea toxicity in mouse C3H/10T1/2 cells expressing humanflavin-dependent monooxygenase 3. Biochem Pharmacol 63:1941–1948.
StormerE, Roots I, and Brockmoller J (2000) Benzydamine N-oxidation as an index reactionreflecting FMO activity in human liver microsomes and impact of FMO3 polymorphisms onenzyme activity. Br J Clin Pharmacol 50:553–561.
Teklu B (1976) Gastrointestinal toxicity of thiacetazone. Ethiop Med J 14:17–22.Vannelli TA, Dykman A, and Ortiz de Montellano PR (2002) The antituberculosis drug
ethionamide is activated by a flavoprotein monooxygenase. J Biol Chem 277:12824–12829.Veeramah KR, Thomas MG, Weale ME, Zeitlyn D, Tarekegn A, Bekele E, Mendell NR,
Shephard EA, Bradman N, and Phillips IR (2008) The potentially deleterious functionalvariant flavin-containing monooxygenase 2*1 is at high frequency throughout Sub-SaharanAfrica. Pharmacogenet Genomics 18:877–886.
Whetstine JR, Yueh MF, McCarver DG, Williams DE, Park CS, Kang JH, Cha YN, Dolphin CT,Shephard EA, Phillips IR, et al. (2000) Ethnic differences in human flavin-containing mono-oxygenase 2 (FMO2) polymorphisms: detection of expressed protein in African-Americans.Toxicol Appl Pharmacol 168:216–224.
Yeung CK, Lang DH, Thummel KE, and Rettie AE (2000) Immunoquantitation of FMO1 inhuman liver, kidney, and intestine. Drug Metab Dispos 28:1107–1111.
Ziegler DM (2002) An overview of the mechanism, substrate specificities, and structure ofFMOs. Drug Metab Rev 34:503–511.
Address correspondence to: Elizabeth A. Shephard, Department of Struc-tural and Molecular Biology, University College London, Gower Street, LondonWC1E 6BT, UK. E-mail: [email protected]
186 FRANCOIS ET AL.
at Univ O
f Calif S
an Francisco on D
ecember 28, 2008
dmd.aspetjournals.org
Dow
nloaded from
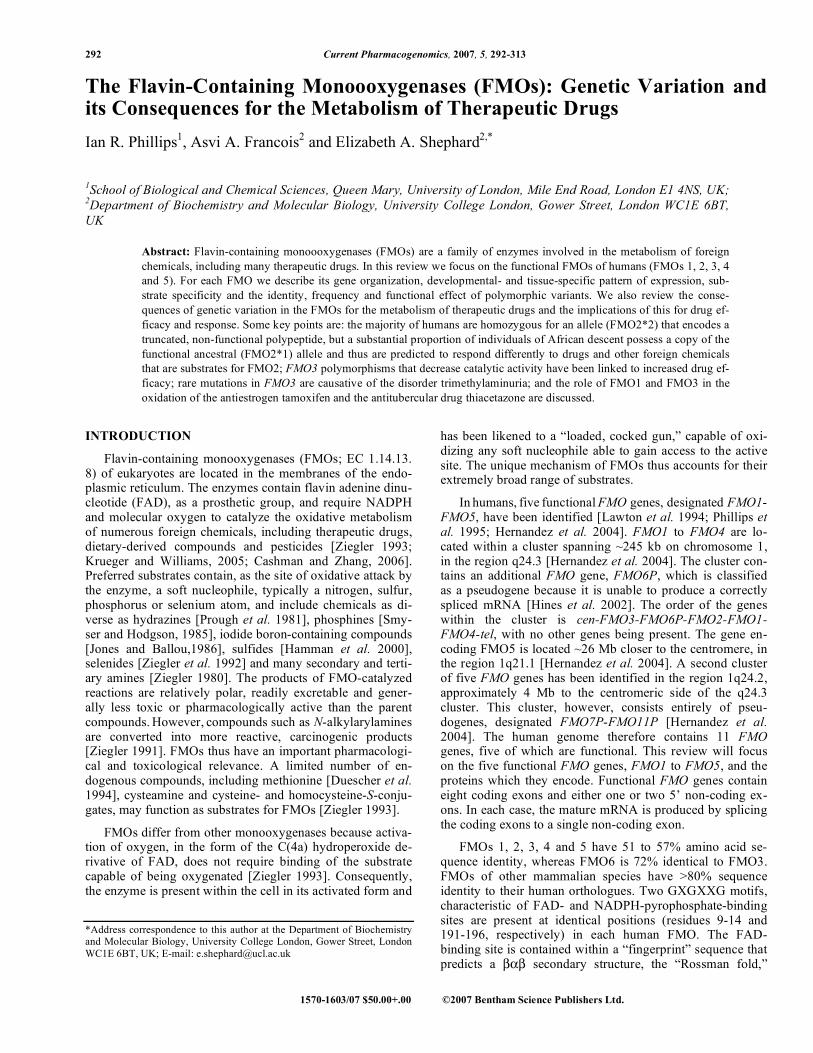
292 Current Pharmacogenomics, 2007, 5, 292-313
1570-1603/07 $50.00+.00 ©2007 Bentham Science Publishers Ltd.
The Flavin-Containing Monoooxygenases (FMOs): Genetic Variation and its Consequences for the Metabolism of Therapeutic Drugs
Ian R. Phillips1, Asvi A. Francois
2 and Elizabeth A. Shephard
2,*
1School of Biological and Chemical Sciences, Queen Mary, University of London, Mile End Road, London E1 4NS, UK;
2Department of Biochemistry and Molecular Biology, University College London, Gower Street, London WC1E 6BT,
UK
Abstract: Flavin-containing monoooxygenases (FMOs) are a family of enzymes involved in the metabolism of foreign
chemicals, including many therapeutic drugs. In this review we focus on the functional FMOs of humans (FMOs 1, 2, 3, 4
and 5). For each FMO we describe its gene organization, developmental- and tissue-specific pattern of expression, sub-
strate specificity and the identity, frequency and functional effect of polymorphic variants. We also review the conse-
quences of genetic variation in the FMOs for the metabolism of therapeutic drugs and the implications of this for drug ef-
ficacy and response. Some key points are: the majority of humans are homozygous for an allele (FMO2*2) that encodes a
truncated, non-functional polypeptide, but a substantial proportion of individuals of African descent possess a copy of the
functional ancestral (FMO2*1) allele and thus are predicted to respond differently to drugs and other foreign chemicals
that are substrates for FMO2; FMO3 polymorphisms that decrease catalytic activity have been linked to increased drug ef-
ficacy; rare mutations in FMO3 are causative of the disorder trimethylaminuria; and the role of FMO1 and FMO3 in the
oxidation of the antiestrogen tamoxifen and the antitubercular drug thiacetazone are discussed.
INTRODUCTION
Flavin-containing monooxygenases (FMOs; EC 1.14.13. 8) of eukaryotes are located in the membranes of the endo-plasmic reticulum. The enzymes contain flavin adenine dinu-cleotide (FAD), as a prosthetic group, and require NADPH and molecular oxygen to catalyze the oxidative metabolism of numerous foreign chemicals, including therapeutic drugs, dietary-derived compounds and pesticides [Ziegler 1993; Krueger and Williams, 2005; Cashman and Zhang, 2006]. Preferred substrates contain, as the site of oxidative attack by the enzyme, a soft nucleophile, typically a nitrogen, sulfur, phosphorus or selenium atom, and include chemicals as di-verse as hydrazines [Prough et al. 1981], phosphines [Smy-ser and Hodgson, 1985], iodide boron-containing compounds [Jones and Ballou,1986], sulfides [Hamman et al. 2000], selenides [Ziegler et al. 1992] and many secondary and terti-ary amines [Ziegler 1980]. The products of FMO-catalyzed reactions are relatively polar, readily excretable and gener-ally less toxic or pharmacologically active than the parent compounds. However, compounds such as N-alkylarylamines are converted into more reactive, carcinogenic products [Ziegler 1991]. FMOs thus have an important pharmacologi-cal and toxicological relevance. A limited number of en-dogenous compounds, including methionine [Duescher et al. 1994], cysteamine and cysteine- and homocysteine-S-conju-gates, may function as substrates for FMOs [Ziegler 1993].
FMOs differ from other monooxygenases because activa-tion of oxygen, in the form of the C(4a) hydroperoxide de-rivative of FAD, does not require binding of the substrate capable of being oxygenated [Ziegler 1993]. Consequently, the enzyme is present within the cell in its activated form and
*Address correspondence to this author at the Department of Biochemistry and Molecular Biology, University College London, Gower Street, London
WC1E 6BT, UK; E-mail: [email protected]
has been likened to a “loaded, cocked gun,” capable of oxi-dizing any soft nucleophile able to gain access to the active site. The unique mechanism of FMOs thus accounts for their extremely broad range of substrates.
In humans, five functional FMO genes, designated FMO1-FMO5, have been identified [Lawton et al. 1994; Phillips et al. 1995; Hernandez et al. 2004]. FMO1 to FMO4 are lo-cated within a cluster spanning ~245 kb on chromosome 1, in the region q24.3 [Hernandez et al. 2004]. The cluster con-tains an additional FMO gene, FMO6P, which is classified as a pseudogene because it is unable to produce a correctly spliced mRNA [Hines et al. 2002]. The order of the genes within the cluster is cen-FMO3-FMO6P-FMO2-FMO1-FMO4-tel, with no other genes being present. The gene en-coding FMO5 is located ~26 Mb closer to the centromere, in the region 1q21.1 [Hernandez et al. 2004]. A second cluster of five FMO genes has been identified in the region 1q24.2, approximately 4 Mb to the centromeric side of the q24.3 cluster. This cluster, however, consists entirely of pseu-dogenes, designated FMO7P-FMO11P [Hernandez et al. 2004]. The human genome therefore contains 11 FMO genes, five of which are functional. This review will focus on the five functional FMO genes, FMO1 to FMO5, and the proteins which they encode. Functional FMO genes contain eight coding exons and either one or two 5’ non-coding ex-ons. In each case, the mature mRNA is produced by splicing the coding exons to a single non-coding exon.
FMOs 1, 2, 3, 4 and 5 have 51 to 57% amino acid se-quence identity, whereas FMO6 is 72% identical to FMO3. FMOs of other mammalian species have >80% sequence identity to their human orthologues. Two GXGXXG motifs, characteristic of FAD- and NADPH-pyrophosphate-binding sites are present at identical positions (residues 9-14 and 191-196, respectively) in each human FMO. The FAD-binding site is contained within a “fingerprint” sequence that predicts a secondary structure, the “Rossman fold,”
tariq
Final

The Flavin-Containing Monoooxygenases (FMOs) Current Pharmacogenomics, 2007, Vol. 5, No. 4 293
known to be involved in binding dinucleotides [Wierenga et al. 1985]. A hydrophobic motif, F(A/T)TGY, characteristic of FMOs, is present at about residue 330. For more informa-tion on the structural features of FMOs, see the review by Krueger and Williams [2005]. Recently, a three-dimensional structure of a FMO from Schizosaccharomyces pombe has been determined [Eswaramoorthy et al. 2006]. In contrast to mammalian FMOs, the yeast enzyme is cytosolic and about 85 residues shorter.
Phylogenetic analysis suggests that the five functional FMO genes arose from a common ancestral gene via a series of gene duplications, estimated to have occurred between 210 and 275 million years ago [Hernandez et al. 2004]. This is much earlier than the divergence of mammals, some 85 million years ago, and therefore it is predicted that all mam-mals possess the functional FMO genes FMO1 to FMO5.
Each member of the FMO gene family exhibits a differ-ent developmental stage- and tissue-specific pattern of ex-pression, which accounts for the marked qualitative and quantitative differences in FMO activities in tissues such as liver, lung and kidney. In addition, there are species differ-ences in FMO gene expression (see below), which have im-plications for the extrapolation of drug metabolism data from experimental animals to humans.
In this review we focus on the functional FMOs of hu-mans. For each FMO we describe gene organization, devel-opmental- and tissue-specific pattern of expression (and how this may differ from that in other mammals) and substrate specificity. We also describe genetic variants that have been identified, focusing on validated coding-region variants, but including promoter variants that have been shown to have an effect on gene expression, the frequency with which the variants occur in the world’s major population groups and their effect on enzyme function. We then discuss conse-quences of genetic variation in the FMOs for the metabolism of therapeutic drugs and the implications of this for drug efficacy and response.
FMO1
In 1971 Ziegler identified a mixed-function amine oxi-dase in porcine liver microsomes whose substrates included nitrogen- and sulphur-containing compounds [Ziegler et al. 1971]. A cDNA for the corresponding protein of humans was isolated in 1991 [Dolphin et al. 1991], and the enzyme is now known as FMO1 [Lawton et al. 1994]. The FMO1 gene, which was mapped to the long arm of chromosome 1 [Shephard et al. 1993], encodes a polypeptide of 532 amino-acid residues of molecular mass 60,306.
Tissue Distribution
There is a distinct species difference in the hepatic ex-pression of FMO1. In humans, neither FMO1 mRNA [Dol-phin et al. 1991; Phillips et al. 1995; Dolphin et al. 1996] nor protein [Yeung et al. 2000; Koukouritaki et al. 2002] is present in adult liver. This is in marked contrast to all other mammals investigated, in which FMO1 constitutes a major form of the enzyme in adult liver [Lawton et al. 1990; Gas-ser et al. 1990; Cherrington et al. 1998a; Lattard et al. 2002a; Stevens et al. 2003]. However, the FMO1 gene is
expressed in fetal human liver [Dolphin et al. 1991, 1996; Phillips et al. 1995; Yeung et al. 2000; Koukouritaki et al. 2002]. Expression is highest in the first trimester (7.8 ± 5.3 pmol/mg microsomal protein), then declines during fetal development and by 3 days after birth is completely extin-guished [Koukouritaki et al. 2002]. FMO1 is also expressed in fetal human kidney, but in this tissue expression is in-creased after birth, not switched off as in the liver [Dolphin et al. 1991, 1996; Phillips et al. 1995; Yeung et al. 2000; Krause et al. 2003].
In adult human the main site of expression of FMO1 is the kidney [Dolphin et al. 1991, 1996; Phillips et al. 1995; Yeung et al. 2000]. The gene is also expressed in the small intestine [Yeung et al. 2000] and stomach, and in a number of endocrine tissues, including pancreas, adrenal cortex and medulla, thyroid, thymus and testis [Hernandez et al. 2004]. The amount of FMO1 in adult human kidney (47 ± 9 pmol/ mg microsomal protein) [Yeung et al. 2000] is not much lower than that observed in liver for the major hepatic cyto-chrome P450 (CYP), CYP3A4 (96 ± 51 pmol/mg microso-mal protein) [Shimada et al. 1994], and is greater than that of the total content of CYPs in adult human kidney [Jakobsson and Cintig, 1973]. Thus, in adult human, FMO1 is likely to be a major contributor to the renal metabolism and clearance of therapeutic drugs. Another study reported lower amounts of FMO1 in adult kidney (3.2 – 11.5 pmol/mg microsomal protein) [Krause et al. 2003]. It has been suggested that dif-ferences in the amounts of FMO1 detected in these two stud-ies may have been due to the use of different antibodies [Krause et al. 2003]. Krause et al. [2003] report also that FMO1 amounts are greater in individuals of African descent (African Americans) than in Caucasians. However, it should be noted that the Caucasian kidney samples were obtained from cadavers, whereas the African-American samples were from biopsies.
Interindividual differences in the expression of FMO1 have been reported. Variations in expression in fetal liver of 10- to 20-fold (n=92), depending on gestational age, were observed [Koukouritaki et al. 2002]. Studies of adult human kidney samples found little variation (n=4) [Yeung et al. 2000], less than 4-fold variation (n=26) [Krause et al. 2003], or less than 5-fold variation (n=13) [Hamman et al. 2000], whereas amounts in small intestine varied by up to 5-fold (n=7) [Yeung et al. 2000].
Organization of The Human FMO1 Gene
The human FMO1 gene has 10 exons. The translation initiation codon is located in exon 2 and the protein-coding sequence is contained within exons 2 to 9. Exons 0 and 1 are upstream non-coding exons. In fetal liver, transcription is initiated from the most 5’ exon (exon 0), via the P0 pro-moter. To produce the mature FMO1 mRNA sequences de-rived from exon 0 are spliced to those derived from exon 2 [Hernandez et al. 2004]. Analysis of a cDNA isolated from the small intestine (accession no. AK097039) indicates that in this tissue transcription starts from exon 1, via the P1 promoter, and sequences derived from exon 1 are spliced to those derived from exon 2. In the kidney transcription can begin from a site within intron 1, via the P2 promoter [Shephard et al. 2007]. Therefore the human FMO1 gene has
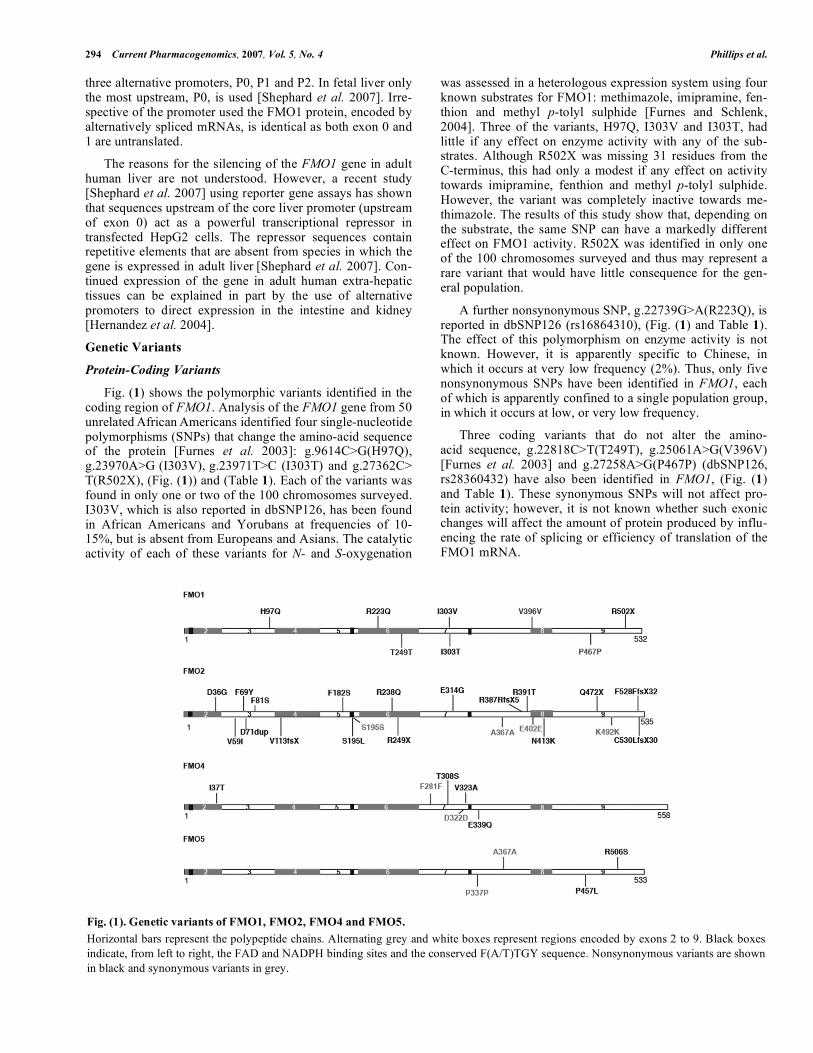
294 Current Pharmacogenomics, 2007, Vol. 5, No. 4 Phillips et al.
three alternative promoters, P0, P1 and P2. In fetal liver only the most upstream, P0, is used [Shephard et al. 2007]. Irre-spective of the promoter used the FMO1 protein, encoded by alternatively spliced mRNAs, is identical as both exon 0 and 1 are untranslated.
The reasons for the silencing of the FMO1 gene in adult human liver are not understood. However, a recent study [Shephard et al. 2007] using reporter gene assays has shown that sequences upstream of the core liver promoter (upstream of exon 0) act as a powerful transcriptional repressor in transfected HepG2 cells. The repressor sequences contain repetitive elements that are absent from species in which the gene is expressed in adult liver
[Shephard et al. 2007]. Con-
tinued expression of the gene in adult human extra-hepatic tissues can be explained in part by the use of alternative promoters to direct expression in the intestine and kidney [Hernandez et al. 2004].
Genetic Variants
Protein-Coding Variants
Fig. (1) shows the polymorphic variants identified in the coding region of FMO1. Analysis of the FMO1 gene from 50 unrelated African Americans identified four single-nucleotide polymorphisms (SNPs) that change the amino-acid sequence of the protein [Furnes et al. 2003]: g.9614C>G(H97Q), g.23970A>G (I303V), g.23971T>C (I303T) and g.27362C> T(R502X), (Fig. (1)) and (Table 1). Each of the variants was found in only one or two of the 100 chromosomes surveyed. I303V, which is also reported in dbSNP126, has been found in African Americans and Yorubans at frequencies of 10-15%, but is absent from Europeans and Asians. The catalytic activity of each of these variants for N- and S-oxygenation
was assessed in a heterologous expression system using four known substrates for FMO1: methimazole, imipramine, fen-thion and methyl p-tolyl sulphide [Furnes and Schlenk, 2004]. Three of the variants, H97Q, I303V and I303T, had little if any effect on enzyme activity with any of the sub-strates. Although R502X was missing 31 residues from the C-terminus, this had only a modest if any effect on activity towards imipramine, fenthion and methyl p-tolyl sulphide. However, the variant was completely inactive towards me-thimazole. The results of this study show that, depending on the substrate, the same SNP can have a markedly different effect on FMO1 activity. R502X was identified in only one of the 100 chromosomes surveyed and thus may represent a rare variant that would have little consequence for the gen-eral population.
A further nonsynonymous SNP, g.22739G>A(R223Q), is reported in dbSNP126 (rs16864310), (Fig. (1) and Table 1). The effect of this polymorphism on enzyme activity is not known. However, it is apparently specific to Chinese, in which it occurs at very low frequency (2%). Thus, only five nonsynonymous SNPs have been identified in FMO1, each of which is apparently confined to a single population group, in which it occurs at low, or very low frequency.
Three coding variants that do not alter the amino- acid sequence, g.22818C>T(T249T), g.25061A>G(V396V) [Furnes et al. 2003] and g.27258A>G(P467P) (dbSNP126, rs28360432) have also been identified in FMO1, (Fig. (1) and Table 1). These synonymous SNPs will not affect pro-tein activity; however, it is not known whether such exonic changes will affect the amount of protein produced by influ-encing the rate of splicing or efficiency of translation of the FMO1 mRNA.
Fig. (1). Genetic variants of FMO1, FMO2, FMO4 and FMO5.
Horizontal bars represent the polypeptide chains. Alternating grey and white boxes represent regions encoded by exons 2 to 9. Black boxes
indicate, from left to right, the FAD and NADPH binding sites and the conserved F(A/T)TGY sequence. Nonsynonymous variants are shown
in black and synonymous variants in grey.

The Flavin-Containing Monoooxygenases (FMOs) Current Pharmacogenomics, 2007, Vol. 5, No. 4 295
Table 1. Protein-coding SNPs for FMOs 1, 2, 4 and 5
Gene Variant Exon Amino Acid
Change
Functional Consequence Reference
FMO1 g.9614C>G 3 H97Q no effect Furnes et al. 2003;
Furnes and Schlenk, 2004
FMO1 g.22739G>A 6 R223Q n.d. dbSNP126
FMO1 g.22818C>T 6 T249T - Furnes et al. 2003; dbSNP126
FMO1 g.23970A>G 7 I303V no effect Furnes et al. 2003;
Furnes and Schlenk, 2004; dbSNP126
FMO1 g.23971T>C 7 I303T no effect Furnes et al. 2003;
Furnes and Schlenk, 2004; dbSNP126
FMO1 g.25061A>G 8 V396V - Furnes et al. 2003; dbSNP126
FMO1 g.27258A>G 9 P467P - dbSNP126
FMO1 g.27362C>T 9 R502X substrate-dependent decrease Furnes et al. 2003;
Furnes and Schlenk, 2004
FMO2 g.107A>G 2 D36G n.d. Furnes et al. 2003
FMO2 g.7661G>A 3 V59I n.d. Furnes et al. 2003
FMO2 g.7695T>A 3 F69Y n.d. dbSNP126
FMO2 g.7700_7702dupGAC 3 D71dup loss of function Furnes et al. 2003;
Krueger et al. 2005
FMO2 g.7731T>C 3 F81S n.d. dbSNP126
FMO2 g.10951delG 4 V113fsX loss of function Furnes et al. 2003;
Krueger et al. 2005
FMO2 g.13693T>C 5 F182S n.d. Furnes et al. 2003
FMO2 g.13732C>T 5 S195L loss of function Furnes et al. 2003;
Krueger et al. 2005
FMO2 g.13733A>G 5 S195S - Furnes et al. 2003
FMO2 g.18237G>A 6 R238Q n.d. Furnes et al. 2003
FMO2 g.18269C>T 6 R249X n.d. (but likely loss of function) dbSNP126
FMO2 g.19679A>G 7 E314G n.d. dbSNP126
FMO2 g.19839G>A 7 A367A - Furnes et al. 2003
FMO2 g.19898_19899ins
TCAAGCTC
7 R387RfsX5 n.d. (but likely loss of function) Furnes et al. 2003
FMO2 g.19910G>C 7 R391T n.d. Furnes et al. 2003
FMO2 g.22027G>A 8 E402E - Furnes et al. 2003
FMO2 g.22060T>G 8 N413K no effect Furnes et al. 2003;
Krueger et al. 2005
FMO2 g.23238C>T 9 Q472X loss of function Dolphin et al. 1998;
Whetstine et al. 2000
FMO2 g.23300A>G 9 K492K - Furnes et al. 2003
FMO2 g.23405_23406insT 9 F528FfsX32 n.d. dbSNP126
FMO2 g.23412_23413insT 9 C530LfsX30 n.d. Whetstine et al. 2000

296 Current Pharmacogenomics, 2007, Vol. 5, No. 4 Phillips et al.
(Table 1. Contd….)
Gene Variant Exon Amino Acid Change Functional Consequence Reference
FMO4 g.110T>C 2 I37T n.d. Furnes et al. 2003
FMO4 g.14601C>T 7 F281F n.d. dbSNP126
FMO4 g.14680A>T 7 T308S n.d. dbSNP126
FMO4 g.14724T>C 7 D322D n.d. Furnes et al. 2003
FMO4 g.14726T>C 7 V323A n.d. Furnes et al. 2003
FMO4 g.14770G>C 7 E339Q n.d. Furnes et al. 2003
FMO5 g.23716G>A 7 P337P n.d. dbSNP126
FMO5 g. 23806A>G 7 A367A n.d. Furnes et al. 2003
FMO5 g.37917C>T 9 P457L n.d. Furnes et al. 2003
FMO5 g.38059G>T 9 R506S n.d. dbSNP126
Mutation nomenclature follows that recommended by the Human Genome Organization (http://www.hgvs.org/mutnomen/). n.d., not determined.
Untranslated Coding Variants
Four verified SNPs have been identified in the 3’ un-translated region (UTR) of the FMO1 mRNA: g.27568C>T (rs12954) [Hines et al. 2003], g.27578 G>A (dbSNP126, rs28360434), g.27590 G>A(dbSNP126, rs28360435;) and g.27664C>T(rs7877) [Hines et al. 2003] (Table 1). Two of these, g.27568C>T and g.27664C>T, are discussed below in the section on FMO1 and disease.
Promoter Variants
A limited number of reports indicate that in rat expres-sion of FMO1 can be modulated in response to 3-methyl-cholanthrene [Chung et al. 1997], indoles [Katchamart et al. 2000] and corticosterone [Chen et al. 2005]. However, two of these studies are of liver [Chung et al. 1997; Katchamart et al. 2000], a tissue in which FMO1 is not expressed in adult human. Consequently, the relevance of these findings for humans is not clear. The evidence available to date sug-gests that in humans FMO1 expression, in contrast to that of CYP genes, is not greatly influenced by foreign chemicals. Thus the observed interindividual variations in amounts of FMO1 (see above) are more likely due to genetic rather than environmental factors.
To identify nucleotide changes that might affect the ex-pression of FMO1, Hines and co-workers analysed the FMO1 gene from 177 unrelated individuals representing the world’s ethnic diversity: northern Europeans, Africans, Mexican- and native-Americans, and east- and south-Asians [Hines et al. 2003]. A region extending about 1 kb upstream of exon 0 [Hernandez et al. 2004], exons 0, 2-9 and the immediate flanking intronic sequences were examined for SNPs. This study assessed the novel SNPs identified, together with pre-viously reported SNPs, for any that were likely to influence the expression of FMO1. None of the four SNPs in the 5’ sequence of FMO1, g.-10361T>A, g.-10330C>T, g.-10046A >G and g.-9782C>A, were located in regulatory elements previously identified and implicated in the regulation of tran-scription of the gene [Luo et al. 2001]. However, the SNP g.-9536C>A (in exon 0) was located in a YY1 element previ-
ously shown to be involved in regulation of rabbit FMO1 [Luo et al. 2001]. Electrophoretic mobility shift assays using extracts from HepG2 cells revealed a complex set of DNA-protein interactions when 24-bp sequences containing either of the g.-9536C>A SNP variants were used as probes [Hines et al. 2003]. The C A transversion prevented YY1 binding to DNA, but increased the affinity for the transcription fac-tors Oct1, HNF1 and HNF1 . Transfection of HepG2 cells with reporter gene constructs under the control of either the g.-9536C (FMO1*1) or g.-9536A (FMO1*6 ) alleles showed no difference when the plasmid contained the FMO1 mini-mal promoter. However, constructs containing longer sec-tions of either of the two alleles showed a 2- to 3-fold de-crease in reporter gene activity when the g.-9536A was pre-
sent.
The FMO1*6 allele is present in African Americans at a frequency of 13%, in northern-European Americans at 11% and in Hispanic Americans at 30%. The effect of this rela-tively common variant (g.-9536C>A) on FMO1 gene expres-sion in vivo is not clear. Two fetal liver samples, homozy-gous for the FMO1*6 allele, showed FMO1 expression lev-els in the upper quartile range for their age bracket rather than the lower range [Koukouritaki et al. 2002] that would be predicted from the results of the transfection experiments described above. It is possible that other transcription factors compensate for the loss of YY1 binding in FMO1*6 indi-viduals. Therefore at present little is known about SNPs that might influence the amount of FMO1 protein produced.
Two SNPs, g.-11T>C and g.17248T>C, are located within polypyrimidine splice donor sites. However, such pyrimidine for pyrimidine changes are unlikely to affect splicing of the FMO1 transcript and hence would not be ex-
pected to influence the amount or type of protein produced.
Therapeutic Drug Substrates For FMO1: Detoxification
Versus Bioactivation
Among all FMO isoforms, FMO1 has the broadest range of substrates. A wide range of xenobiotics and foreign com-

The Flavin-Containing Monoooxygenases (FMOs) Current Pharmacogenomics, 2007, Vol. 5, No. 4 297
pounds are among its substrates, which include therapeutic drugs, pesticides and endogenous compounds. A list of sub-strates for human FMO1 that are of therapeutic importance is given in Tables 2 and 3.
A detailed discussion of the activity of FMO1 towards each of these drugs is beyond the scope of this review. For more information on this topic the reader is referred to the review by Krueger and Williams [2005]. However, we have selected two drugs, tamoxifen and thiacetazone, for special mention because of their widespread use in the treatment, respectively, of breast cancer and tuberculosis, and the po-tential conflict between bioactivation and detoxification with respect to drug metabolism and therapeutic outcome.
Recent work has highlighted interesting results concern-ing the relationship between FMOs and CYPs with regard to tamoxifen metabolism [Parte and Kupfer, 2005]. Tamoxifen is converted to its N-oxide by FMO1 and, less effectively, by FMO3 (see below). N-oxygenation of a drug by a FMO is generally considered as a detoxification pathway, with the N-oxide being a non-toxic product. In contrast to FMO1-
mediated detoxification of tamoxifen, the drug can be bioac-tivated by CYP-mediated hydroxylation, a reaction catalyzed mainly by CYP3A4, the major hepatic CYP (reviewed in [Krueger et al. 2006]). The products of this reaction can bind covalently to DNA and proteins, causing macromolecular damage and potential health risks. Because FMO1 is not present in adult human liver, the ratio of the CYP-bio-activated tamoxifen products to the N-oxide detoxification product is expected to be high. However, in tissues in which FMO1 is expressed, for example, the kidney, in which the amounts of FMO1 more closely resemble that of CYP3A4, tamoxifen-related DNA adducts would be expected to be low. This has been shown to be the case in a study of tissues of monkey treated with tamoxifen [Shibutani et al. 2003]. Tamoxifen and its metabolites are widely distributed through-out the body in patients treated with the drug for short or long periods [Lien et al. 1991]. The study of Parte and Kupfer [2005] has raised some interesting possibilities with regard to the interplay between CYP and FMO1 metabolism in different tissues. The N-oxide of tamoxifen, formed by FMO-mediated action, can be reduced to tamoxifen by CYPs
Table 2. Nitrogen-containing Drugs Oxygenated by Human FMO1
Substrate Type of Drug and Health Condition Product Reference
Benzydamine nonsteroidal antiinflammatory N-oxide Lang and Rettie, 2000;
Stormer et al. 2000
Chlorpromazine dopamine D2 antagonist
(antipsychotic)
- Kim et al. 2000
Deprenyl monoamine oxidase type B inhibitor (Parkinson’s disease) hydroxylamine Cashman et al. 1999;
Szoko et al. 2004
Imipramine 5HT/noradrenalin re-uptake inhibitor (antidepressant) N-oxide Kim and Ziegler, 2000
Itopride dopamine D2 antagonist
(gastroprokinetic)
N-oxide Mushiroda et al. 2000
Methamphetamine psychostimulant hydroxylamine Cashman et al. 1999;
Szoko et al. 2004
N-deacetyl ketoconazole* antifungal agent N-hydroxyl Rodriguez and Miranda, 2000
Olopatadine antihistamine N-oxide Kajita et al. 2002
Orphenadrine anticholinergic
(Parkinson’s disease)
- Kim and Ziegler, 2000
SNI-2011 muscarinic receptor agonist
(Sjogren's Syndrome)
N-oxide Washio et al. 2003
Tamoxifen estrogen receptor modulator
(Breast Cancer Therapy)
N-oxide Parte and Kupfer, 2005
Xanomeline muscarinic receptor agonist
(Alzheimer’s Disease)
N-oxide Ring et al. 1999
*Major metabolite of the antifungal agent ketoconazole; - Products not identified/unpublished.
In many cases FMO1 is not the only enzyme involved in the metabolism of the drug in vivo.

298 Current Pharmacogenomics, 2007, Vol. 5, No. 4 Phillips et al.
and other heme proteins. Thus, depending on the ratio of FMO1 to CYPs in a particular tissue, reduction of tamoxifen N-oxide back to tamoxifen could provide an additional source of the drug for bioactivation by CYPs, or, by acting as a potential store of tamoxifen, the N-oxide might increase the amount of available drug and thus lead to greater drug effi-cacy.
The anti-tubercular drug thiacetazone is a thiocarbamide prodrug, which is activated in Mycobacterium tuberculosis by the FMO enzyme EtaA to form a sulfenic acid intermedi-ate [Qian and Ortiz de Montellano, 2006]. This is further oxidized to two metabolites, a sulfinic acid and a carbodi-imide. The mechanism of cytotoxicity within the bacterial cell is not known, but it is suggested that metabolites of thiacetazone may lower the concentration of mycothiol (a bacterial antioxidant that has a role similar to that of glu-tathione in eukaryotic cells), eventually resulting in cell death. Thiacetazone is a substrate in vitro for both human FMO1 and FMO3 (see below), the products being the same as those of the reaction catalyzed by the bacterial FMO [Qian and Ortiz de Montellano, 2006]. There is evidence to suggest bioactivation of thiocarbamide drugs by mammalian monooxygenases in both humans and rats [Ruse and Waring, 1991 a, b]. The in vivo detoxification routes for thiacetazone are unclear, but FMOs may well play a role in both detoxifi-cation and bioactivation pathways. This poses a question concerning the response of individuals to the drug. Will po-lymorphic variants in FMO1 that affect the amount or activ-ity of the protein influence the distribution of the drug in extra-hepatic tissues and thus the amount of drug ultimately delivered to the bacterium?
The examples of bioactivation versus detoxification dis-cussed above pose important questions regarding an individ-ual’s response to drug therapy. In the case of tamoxifen, tis-sue distribution of the drug and its metabolites, and hence the balance between drug efficacy and harmful side effects, is likely to be influenced by the combined effects of FMO1 and CYP genetic variants. In the case of thiacetazone, the inter-play between the bacterial EtaA protein and FMO1- (or FMO3-) mediated metabolism is predicted to play a role in
drug efficacy. However, adverse drug reactions are expected to be due to host FMO-mediated effects.
FMO1 And Disease
Gene expression profiling of human myocardial tissue from patients diagnosed with atrial fibrillation (AF) showed a significant increase in the expression of FMO1 mRNA and of several other mRNAs encoding proteins thought to be involved in oxidative stress [Kim et al. 2003]. The role, if any, of specific FMO1 SNPs in AF is not known. Other DNA profiling experiments have indicated that FMO1 mRNA is under-represented in the spinal cord of patients with amyotrophic lateral sclerosis (ALS) [Malaspina et al. 2001]. A recent study [Cereda et al. 2006] examined the allelic fre-quency of two FMO1 SNPs, g.27568C>T (rs12954) and g.27664C>T (rs7877), located within the 3’ UTR of the mRNA, in a group of sporadic ALS patients and a control group. Both SNPs were found to be over-represented in fe-male, but not male, ALS patients. The short distance (97 bp) between the SNPs explains the strong linkage disequilibrium between these two polymorphisms. It is not known whether the two SNPs affect the stability of the mRNA, but this is thought to be unlikely [Hines et al. 2003]. The authors sug-gest that the expression of FMO1 may be down-regulated in males compared with females and thus the role of FMO1 in neurometabolism may be less important in males than in females. In contrast to the situation in mouse [Cherrington et al. 1998b], no significant gender differences in the expres-sion of FMO1 have been reported for human.
FMO2
The main site of FMO2 expression is the lung, where in most mammals it constitutes the major form of the enzyme present [Lawton et al. 1990; Nikbakht et al. 1992; Yueh et al. 1997]. In humans the gene is also expressed in skeletal muscle, kidney, prostate gland and blood vessels [Hernandez et al. 2004]. In contrast to other FMOs, FMO2 can mediate the N-oxygenation of some primary alkylamines to their oximes, via an N-hydroxylamine intermediate [Tynes et al. 1986; Poulsen et al. 1986], but is unable to catalyze the oxy-genation of certain tertiary amines, such as imipramine and
Table 3. Sulphur-containing Drugs Oxygenated by Human FMO1
Substrate Type of Drug or Health Condition Product Reference
Ethionamide antibiotic (tuberculosis) - Krueger and Williams, 2005
Methimazole thyroperoxidase inhibitor
(hyperthyroidism)
S-oxide Furnes et al. 2004
S-methyl esonarimod* cytokine production inhibitor
(rheumatism)
S-oxide Ohmi et al. 2003
Tazarotenic acid** retinoic acid receptor modulator
(acne/psoriasis)
S-oxide Attar et al. 2003
Thiacetazone antibiotic (tuberculosis) sulfinic acid/carbodiimide Qian and Ortiz de Montellano 2006
Products not identified/unpublished; * active metabolite of parent compound esonarimod; ** active metabolite of parent compound tazarotene
In some cases FMO1 is not the only enzyme involved in the metabolism of the drug in vivo.

The Flavin-Containing Monoooxygenases (FMOs) Current Pharmacogenomics, 2007, Vol. 5, No. 4 299
chlorpromazine [Ohmiya and Mehendale, 1982; Williams et al. 1984], that are good substrates for FMO1. In comparison with other FMOs, FMO2 exhibits a greater restriction in the size of its substrates, displaying a marked preference for sub-strates with a long side chain. This suggests that the active site of FMO2 is located further from the surface of the en-zyme than that of other FMOs and is accessed by a relatively narrow channel. In addition, FMO2 is less sensitive to inac-tivation by elevated temperature and anionic detergents. The gene for FMO2, which was mapped to the long arm of hu-man chromosome 1 [M
cCombie et al. 1996] comprises 9
exons, the first of which is non-coding.
Genetic Variants
Analysis of cDNAs for human FMO2 revealed that they encoded a polypeptide that, in comparison with FMO2 of rabbit [Lawton et al. 1990], guinea pig [Nikbakht et al. 1992] and rhesus macaque [Yueh et al. 1997], lacks 64 resi-dues from its carboxy terminus [Dolphin et al. 1998]. This was the result of C T mutation that changed a glutamine codon at position 472 to a stop codon. The presence of the premature stop codon in the human FMO2 gene was con-firmed by sequencing genomic DNA from several individu-als [Dolphin et al. 1998]. The nonsense mutation, g.23238C >T (Q472X), that gave rise to the truncated polypeptide is not present in non-human primates such as chimpanzee (Pan-troglodytes) and gorilla (Gorilla gorilla) [Dolphin et al. 1998] and must therefore have arisen in the human lineage some time after the divergence of the Homo and Pan clades took place some 6 million years ago.
Analysis of individuals of different racial and ethnic backgrounds, namely European Caucasians, Orientals (Japa-nese and Chinese), Africans (including African Americans and UK Afro-Caribbeans), New-Guinea Aboriginals, Indians and Maoris, revealed that the allele encoding the truncated FMO2, g.23238T (FMO2*2A), occurred at a frequency of 100% in all groups investigated, with the exception of indi-viduals of African descent, in which the ancestral g.23238C allele (FMO2*1), which encodes a full-length polypeptide (FMO2.1), was present at a frequency of 4% [Dolphin et al. 1998]. These results were confirmed and extended by a larger population study [Whetstine et al. 2000]. All Europe-ans (n=79) and Asians (n=120) investigated to date are ho-mozygous for the FMO2*2A allele, whereas in African Americans (n=180) the FMO2*1 allele is present at a fre-quency of 13%. FMO2*1 has also been identified in Hispan-ics [Krueger et al. 2002a], and a subsequent study [Krueger et al. 2004] found that it is present in Hispanics of Puerto Rican (n=327) and Mexican (n=280) descent at frequencies of 3.5 and 1%, respectively.
Analysis of products of heterologously expressed cDNAs revealed that the truncated protein (X472) encoded by the major allele (FMO2*2A) is inactive, whereas the full-length protein (Q472) encoded by the minor allele (FMO2*1) is catalytically active [Dolphin et al. 1998]. The presence of full-length, active FMO2 in lung microsomes isolated from an individual heterozygous for FMO2*1/FMO2*2A was sub-sequently confirmed [Krueger et al. 2002b].
A frame-shift mutation, g.23412_23413insT, has been observed at frequencies of 7 and 13% in African Americans
and Caucasians, respectively [Whetstine et al. 2000]. This mutation would change the last six amino-acid residues and add 23 residues to the C-terminus of the protein. However, the frame-shift mutation was found to segregate with the g.23238T allele encoding the premature stop codon and thus would have no functional consequence.
A survey of 50 African Americans [Furnes et al. 2003] identified an additional 14 coding-region variants in FMO2. Four were synonymous; the other ten (seven nonsynony-mous, two frame-shifts and one in-frame 3-bp duplication) would result in a change in amino acid sequence. Four of the latter, g.7700_7702dupGAC(D71dup), g.10951delG (V113fsX), g.13732C>T(S195L) and g.22060T>G(N413K), occurred at high frequency (>25%) in this population. The effect on FMO2 activity of these four mutations has been investigated [Krueger et al. 2005]. The frame-shift mutation (g.10951delG) results in the replacement of valine at position 113 with a stop codon and thus produces a severely truncated protein. When expressed in a baculovirus-insect cell system the truncated protein was not detected and thus may have been targeted for degradation. The D71dup protein failed to bind FAD and was thus catalytically inactive. Although S195L bound FAD it retained only 2% of the activity of FMO2.1. In contrast, the activity of N413K was similar to that of FMO2.1.
With the exception of g13732C>T(S195L), which is pre-sent at high frequency in Africans (35-60%), Asians (45-55%) and Europeans (15-30%), the other mutations are ei-ther absent or present in much lower frequency in non-African populations. Of particular importance is whether variants that affect the function of FMO2 occur on the FMO2*1 allele, which encodes a full-length protein, or on the FMO2*2A allele, which encodes a truncated non-func-tional protein. Haplotype analysis of g.10951delG(V113fsX), g.13732C>T(S195L) and g.22060T>G(N413K) indicated that all three variants segregated with the g.23238T(Q472X) variant and would thus be associated with a protein that is already inactive [Krueger et al. 2005]. This implies that indi-viduals who possess a FMO2*1 allele are likely to express a protein that is catalytically active.
The other coding-region variants identified by Furnes et al. [Furnes et al. 2003] plus additional ones reported in dbSNP126 are shown in Fig. (1) and Table 1. The functional effect of the nonsynonymous SNPs has not been established. Of the nonsynonymous SNPs, three, g.7695T>A(F69Y), g.18237G>C(R238Q) and g.19910G>C(R391T) are appar-ently restricted to African populations, where they occur at low frequency (4 to 7%). G.19679A>G(E314G) is particu-larly common (25-35%) in Asians, whereas g.7731T>C (F81S) is absent from Asians, but relatively common (12-30%) in Africans. Of the synonymous SNPs, g.13733A>G (S195S) occurs at high frequency (25-60%) in all popula-tions, whereas g.19839G>A(A367A) and g.22027G>A(E402E) are restricted to Africans (15-23%).
A large study1 (more than 1800 individuals from 25 dif-
ferent populations) demonstrated that the FMO2*1 allele is widely distributed throughout Africa. The allele occurs at
1 Veeramah et al. (submitted).

300 Current Pharmacogenomics, 2007, Vol. 5, No. 4 Phillips et al.
relatively low frequency (2-6%) in north Africa, but is more common in sub-Saharan Africa, in some regions reaching frequencies as high as 26%, with almost 50% of individuals having at least one FMO2*1 allele.
FMO2 Substrates
Substrates of FMO2 include the thioether-containing organophosphate insecticides phorate and disulfoton [Hen-derson et al. 2004a]. Organophosphates are bioactivated by CYP-mediated desulfuration to produce the oxon, which is a far more potent inhibitor of acetylcholinesterase than is the parent compound [Kulkarni and Hodgson, 1984]. In contrast, FMO2 catalyzes the S-oxygenation of organophosphates [Henderson et al. 2004a], which represents a detoxification pathway. Thus, individuals who express functional FMO2 may have a reduced risk of toxicity if exposed to organo-phosphates.
Of particular concern is the role of FMO2 in bioactiva-tion. FMO2 has been shown to catalyze the S-oxygenation of thioureas, including thiourea, 1-phenylthiourea and ethylene thiourea, which are known or suspected lung toxicants, to produce the more toxic sulfenic and/or sulfinic acid metabo-lites [Henderson et al. 2004b]. The sulfenic acid derivatives can combine with glutathione and undergo redox cycling, leading to oxidative stress and toxicity. Thus, individuals who express functional FMO2 would be predicted to be at increased risk of pulmonary toxicity following exposure to thiourea or its derivatives.
Little is known about the role of FMO2 in the metabo-lism of drugs. However, prochloperazine and trifluoperazine have been shown to be substrates for FMO2 of rabbit [Lomri et al. 1993]. Of particular interest is the recent finding that the anti-tubercular drug thiacetazone is a good substrate for human FMO2
2, which has implications for the efficacy and
toxicity of this drug in African populations.
Potential Animal Model
A gene encoding a truncated, non-functional FMO2 is present in strains of laboratory rats (Sprague-Dawley and Wistar) and in the species, Rattus norvegicus, from which they were derived, but not in the closely related species Rat-tus rattus [Lattard et al. 2002b]. However, the mutation that gives rise to the truncated protein, a 2-bp deletion in codon 421, which results in a premature stop codon at position 433, is different from that present in humans, and must have oc-curred independently after the divergence of Rattus nor-vegicus and Rattus rattus. Interestingly, the mutation is po-lymorphic in wild Rattus norvegicus and thus this species may represent a good model for investigating the metabolic and toxicological consequences of the human FMO2 poly-morphism [Hugonnard et al. 2004].
Conclusions
Evidence to date indicates that in most of the world’s population groups essentially all individuals are homozygous for the FMO2*2 allele (g.23238C>T[Q472X]) and thus pro-duce no functional FMO2. However, in sub-Saharan Africa and in populations recently descended from this region, a
2 Francois, A., Phillips, I.R. and Shephard, E. A. (unpublished).
substantial proportion of individuals (almost 50% in some regions) possess at least one copy of the ancestral FMO2*1 allele and thus express functional FMO2. This has implica-tions for inter-ethnic and, in African populations, interindi-vidual variations in response to drugs, and in susceptibility to toxic chemicals, that are substrates of FMO2, particularly
those for which the lung is the target organ or route of entry.
FMO3
A cDNA for human FMO3 was identified in 1992 by Lomri et al. [Lomri et al. 1992]. The FMO3 gene was mapped to the long arm of chromosome 1 [Shephard et al. 1993]. It comprises 9 exons, of which exon 1 is non-coding [Dolphin et al. 1997a], and encodes a polypeptide of 532 amino-acid residues and molecular mass 60,047 [Phillips et
al. 1995].
Tissue Distribution
FMO3 is the predominant FMO isoform expressed in the liver of the human adult [Lomri et al. 1992; Phillips et al. 1995; Dolphin et al. 1996]. FMO3 mRNA has been detected also in lung, kidney, adrenal medulla and cortex, pancreas, thyroid, gut and brain [Hernandez et al. 2004]. FMO3 ex-pression is switched on after birth in humans [Koukouritaki et al. 2002] and in other species such as mouse [Janmo-hamed et al. 2004]. However, small amounts of FMO3 pro-tein have been detected in the human embryonic, but not fetal, liver [Koukouritaki et al. 2002]. The mRNA for FMO3 is also not detectable in fetal liver [Dolphin et al. 1996]. The mechanisms and factors required to express the FMO3 gene in the embryo, to silence its expression during fetal devel-opment and then to re-activate expression of the gene after birth are unknown. A comprehensive, immunochemical study [Koukouritaki et al. 2002] of human liver samples from 240 individuals, ranging in age from 8 weeks gestation to 18 years old, detected small amounts of FMO3 as early as 8 weeks (the embryonic stage), but not in the fetus, 15-40 weeks gestation. Analysis of postnatal samples showed that, during the first 3 weeks postpartum, in most individuals FMO3 was undetectable or present in only small amounts. Three subsequent developmental phases of FMO3 expres-sion were apparent. In the first phase, between 3 weeks and 10 months of age, amounts of FMO3 increased 5-fold, to 4.7 ± 5.9 pmol/mg microsomal protein. Between 10 months and 11 years of age another 3-fold increase in expression was observed (to 12.7 ± 8.0 pmol/mg microsomal protein). In the third phase, between 11 and 18 years of age, there was a fur-ther 2-fold increase (to 26.9 ± 8.6 pmol/mg microsomal pro-tein). The amount of FMO3 produced was not influenced by
gender.
The data indicate that birth is necessary, but not suffi-cient, for the onset of FMO3 expression in human liver. The age at which FMO3 expression is switched on varies from birth to up to 2 years old. However, by ten months of age, the majority of individuals are expressing FMO3. This con-trasts with the extinction of FMO1 expression in human liver, which is tightly linked to the process of birth, being switched off within a few days of birth, irrespective of gesta-tional age [Koukouritaki et al. 2002] (see above). Conse-quently, during the first year of life many individuals will
The Flavin-Containing Monoooxygenases (FMOs) Current Pharmacogenomics, 2007, Vol. 5, No. 4 301
have no, or very small amounts of drug-metabolizing FMOs in their liver, which has important implications for their abil-ity to metabolize therapeutic drugs that are substrates for these enzymes.
Interindividual variations of 10- to 20-fold in the expres-sion of FMO3 have been reported [Overby et al. 1997; Koukouritaki et al. 2002; Cashman and Zhang, 2002]. The amounts of hepatic FMO3 reported by Overby et al., [Overby et al. 1997] (60 ± 43 pmol/mg microsomal protein) were higher than those reported by Koukouritaki et al. [2002] (see above). However, the samples analysed in the former study were from adult liver, whereas those in the lat-ter study were from livers of 11 to 18 year olds. Therefore, it is possible that the differences reflect a further increase in FMO3 expression from the teenage years to adulthood. The amounts of FMO3 present in adult liver are therefore similar to those of the most abundant hepatic CYPs, CYP3A4, CYP2C and CYP1A2, with reported specific contents of 96 ± 51, 60 ± 27 and 42 ± 23 pmol/mg microsomal protein, re-spectively [Shimada et al. 1994]. FMO3 expression has been found to be inducible by dioxin in male mouse liver [Tijet et al. 2006] and, in humans, may be influenced by physiologi-cal factors, e.g., FMO3 declines during menstruation [Zhang et al. 1996; Shimizu et al. 2007a]. However, the majority of the observed interindividual variation in FMO3 expression is likely to be due to genetic factors.
Genetic Variants
Trimethylaminuria
Loss-of-function mutations in the FMO3 gene (MIM 136132) cause the inherited disorder trimethylaminuria (TMAuria) (MIM 60279), also known as fish-odor syn-drome. Affected individuals are unable to metabolize die-tary-derived trimethylamine (TMA) to its non-odorous N-oxide, a reaction catalyzed by FMO3 [Lang et al. 1998]. Consequently, they secrete the smelly free amine in their breath, sweat and urine, which imparts a bodily odor remi-niscent of rotting fish [Mitchell and Smith, 2001]. Sufferers often display a variety of psychological and antisocial reac-tions to their condition, including anxiety, chronic depres-sion, and attempted suicide [Mitchell and Smith, 2001]. The disorder is inherited in a recessive manner [Al-Waiz et al. 1988].
The incidence of heterozygotes in British Caucasians is estimated to be about 1%, but may be higher in other popula-tion groups [Hadidi et al. 1995; Mitchell et al. 1997; Mitchell and Smith, 2001]. The first report identifying a causative mutation for this disorder, g.15153C>T(P153L), was in 1997 [Dolphin et al. 1997b]. The mutant protein, ex-pressed in a baculovirus-insect cell system, was unable to catalyze the N-oxygenation of TMA. Subsequently, more than 30 mutations have been identified that cause TMAuria [Mitchell and Smith, 2001; Hernandez et al. 2003; Cashman and Zhang, 2006; Phillips and Shephard, 2007], (Fig. (2) and Table 4). The resultant mutant enzymes are unable to cata-lyze TMA N-oxygenation and, with one exception, N61S, are also inactive towards other substrates tested, such as 10-(N,N-dimethylaminopentyl)-2-(trifluoromethyl) phenothiaz-ine (5’-DPT), tyramine and methimazole. Although N61S is
incapable of catalyzing N-oxygenation of TMA, its ability to catalyze S-oxygenation of methimazole is unaffected [Dol-
phin et al. 2000].
Individuals displaying symptoms of TMAuria are re-ferred to in the ancient Indian epic the Mahabharata and in Shakespeare’s the Tempest [Mitchell and Smith, 2001]. Al-though we now understand the genetic basis of TMAuria, there has been little improvement in the lives of those af-fected by this distressing disorder. Antibiotics are sometimes prescribed in an attempt to kill gut flora that produce TMA from dietary precursors such as choline and lecithin. The dietary supplements copper chlorophyllin and charcoal are reported to decrease the amount of TMA in the urine [Yama-zaki et al. 2004]. However, patients report variable effec-tiveness of these treatments. Strict diets that limit the intake of foodstuffs rich in precursors of TMA, such as meat, eggs, soya and marine fish, have been reported to help control the
condition.
Polymorphic Variants
In the course of studies on the genetic causes of TMAu-ria, several polymorphic variants of FMO3 have been dis-covered, (Fig. (2) and Table 5). Common variants that affect enzyme function are of particular interest because of their potential effect on the metabolism of therapeutic drugs and other foreign chemicals by the general population. The first such variant identified was g.15167G>A(E158K) [Brunelle et al. 1997; Dolphin et al. 1997b]. Although initially identi-fied in TMAuria kindreds, the variant did not segregate with the disorder and was found to be common in the general population. Subsequently, it was found to be present at high frequency in all populations (dbSNP126): 40-45% in Afri-cans, 35-45% in Europeans and 20-25% in Asians. Many studies have investigated the effect of this common variant on catalytic activity, both in vitro and in vivo (reviewed in [Cashman 2004; Krueger and Williams 2005; Koukouritaki and Hines, 2005 and Cashman and Zhang, 2006); Shimizu et al. 2007b]. The results are conflicting. Some reports indicate that the 158K variant has a lower catalytic activity towards some substrates, whereas others indicate no effect, or sub-strate-dependent effects.
Another variant, g.21443A>G(E308G) [Treacy et al. 1998], is relatively common in Asians and Europeans (at allele frequencies of 15-25%), but is rare in Africans (fre-quency of 1 to 2%) (dbSNP126). As is the case for E158K (see above), studies on the effect of E308G on enzyme activ-ity report conflicting results [Cashman 2004; Krueger and Williams 2005; Koukouritaki and Hines, 2005; Cashman and Zhang, 2006]. In Asians and Europeans, the E158K and E308G variants are often linked, occurring on the same haplotype [Sachse et al. 1999; Kang et al. 2000; Cashman et al. 2001; Park et al. 2002]. Evidence from several studies indicates that the effect on enzyme activity is greater when both mutations are present than when either is present alone [Lattard et al. 2003; Cashman 2004; Krueger et al. 2005; Koukouritaki and Hines, 2005; Cashman and Zhang, 2006; Shimizu et al. 2007b]. Individuals homozygous for the linked E158K/E308G variants may exhibit symptoms of ‘mild’ or transient TMAuria [Mayatepek and Kohlmüller,

302 Current Pharmacogenomics, 2007, Vol. 5, No. 4 Phillips et al.
1998; Zschocke et al. 1999]. However, many of the cases reported are of young children, in whom low expression of FMO3 [Koukouritaki et al. 2002] (see above) may contribute
to symptoms.
A third variant, g.18281G>A(V257M) [Treacy et al. 1998], is relatively common in Asian (allele frequency of 16 to 28%), but less so in African (0 to 4%) or European (4 to 7%) populations (dbSNP126). V257M has little effect on enzyme activity [Dolphin et al. 2000; Cashman 2004;
Table 4. Rare FMO3 Mutations Causative of TMAuria or Implicated in the Disorder
Mutation Exon Amino Acid Change Reference
g.-2092 to 10145del Forrest et al. 2001
g.94G>A 2 E32K Zhang et al. 2003
g.110T>C 2 I37T Teresa et al. 2006
g.11145A>G 3 R51G Mazon Ramos et al. 2003
g.11148G>T 3 A52T Akerman et al. 1999a
g.11166G>A 3 V58I Kubota et al. 2002
g.11177A>G 3 N61S Dolphin et al. 2000
g. 11185delA 3 K64KfsX2 Zhang et al. 2003
g.11192G>T 3 M66I
Cashman et al. 1997;
Akerman et al. 1999b;
Forrest et al. 2001
g.11239T>C 3 M82T Murphy et al. 2000
g.15036A>G 4 N114S Shimizu et al. 2007c
g.15123T>A 4 V143E Basarab et al. 1999
g.15137G>T 4 G148X Park et al. 1999
g.15153C>T 4
P153L Dolphin et al. 1997b;
Cashman et al. 1997
g.15526_15527delTG 5 C197fsX Yamazaki et al. 2007
g.15531T>A 5 D198E Fujieda et al. 2003
g.15533T>C 5 I199T Zschocke et al. 1999
g.15539C>A 5 T201K Shimizu et al. 2006
g.18177G>A 6 R223Q Preti et al. 2002
g.18225G>C 6 R238P Teresa et al. 2006
g.21429G>T 7 E305X Treacy et al. 1998; Akerman et al. 1999a
g.21460G>T 7 E314X Akerman et al. 1999a
g.21680G>T 7 R387L Akerman et al. 1999a
g.21684G>A 7 W388X Shimizu et al. 2007c
g.21702delG 7 K394KfsX11 Teresa et al. 2006
g.23580delG 8 M405IfsX Teresa et al. 2006
g.24486G>A 9 M434I Dolphin et al. 2000
g.24592C>T 9 Q470X Shimizu et al. 2007c
g.24608G>A 9 G475D Zschocke et al. 1999
g.24658C>T 9 R492W Akerman et al. 1999b; Dolphin, 2000
g.24682C>T 9 R500X Shimizu et al. 2006
K64KfsX2 has also been referred to as M66X
Mutation nomenclature follows that recommended by the Human Genome Organization (http://www.hgvs.org/mutnomen/)

The Flavin-Containing Monoooxygenases (FMOs) Current Pharmacogenomics, 2007, Vol. 5, No. 4 303
Krueger and Williams 2005; Koukouritaki and Hines, 2005; Cashman and Zhang, 2006; Shimizu et al. 2007b].
A further 20 coding-region SNPs, 8 synonymous and 12 nonsynonymous, have been identified in FMO3 [Dolphin et al. 2000; Cashman 2002; Furnes et al. 2003; Fujieda et al.
2003; Koukouritaki et al. 2005b; and dbSNP126], (Fig. (2) and Table 5). Of the nonsynonymous SNPs only g.21350T> C(V277A) is relatively common, occurring at a frequency of 13% in Africans and ~20% in Asians, but it is absent from Europeans. Another, g.11177C>A(N61K), is present in Afri-cans and Europeans at frequencies of 3.5 and 5%, respec-
Table 5. Polymorphic Variants of FMO3
Variant Exon Amino Acid
Change Functional Consequence
Reference
g.72G>T 2 E24D limited Koukouritaki et al. 2007
g.11177C>A 3 N61K* reduced or abolished Koukouritaki et al. 2007
g.15089G>C 4 D132H substrate-dependent decrease Kobayashi et al. 2001; Furnes et al. 2003;
Lattard et al. 2003
g.15167G>A 4 E158K moderate, substrate- dependent decrease
Dolphin et al. 1997b; Brunelle et al. 1997; Treacy et al. 1998; Zschocke et al. 1999; Furnes et al. 2003
g.15475G>T 5 G180V no effect Dolphin et al. 2000
g.15550C>T 5 R205C moderate decrease Fujieda et al. 2003
g.18281G>A 6 V257M no effect or limited substrate de-pendent decrease
Treacy et al. 1998; Dolphin et al. 2000; Furnes et al. 2003
g.18290A>G 6 M260V n.d. Shimizu et al. 2006
g.21350T>C 7 V277A n.d. Cashman 2002
g.21443A>G 7 E308G moderate
substrate dependent decrease
Treacy et al. 1998; Zschocke et al. 1999
g.21599T>C 7 L360P increased activity Furnes et al. 2003; Lattard et al. 2003
g.21604G>C 7 E362Q n.d. Cashman 2002; Furnes et al. 2003
g.23613G>T 8 K416N limited Koukouritaki et al. 2007
g.24642G>A 9 I486M n.d. Cashman 2002
g.24691G>C 9 G503R n.d. Furnes et al. 2003
*likely to be causative for TMAuria
Fig. (2). Genetic variants of FMO3.
Horizontal bars represent the polypeptide chains. Alternating grey and white boxes represent regions encoded by exons 2 to 9. Black boxes
indicate, from left to right, the FAD and NADPH binding sites and the conserved FATGY sequence. The upper bar shows the identity and
position of rare mutations that are causative of TMAuria, or implicated in the disorder. The lower bar shows the identity and position of non-
synonymous polymorphic variants. *SNP likely to be causative for TMAuria.

304 Current Pharmacogenomics, 2007, Vol. 5, No. 4 Phillips et al.
tively. The remaining SNPs occur at low frequency (<4%, in some cases <1%) and are confined to a single population
group.
G180V [Dolphin et al. 2000], K416N and E24D [Kouk-ouritaki et al. 2007] have little or no effect on catalytic activ-ity. The effect of D132H appears to be substrate-dependent, decreasing N-oxygenation of TMA and S-oxygenation of methimazole, but not N-oxygenation of 5’DPT [Koukouri-taki et al. 2007]. R205C has a moderate effect on enzyme activity and, interestingly, exhibits substrate-inhibition of sulindac sulfide S-oxygenation [Shimizu et al. 2007b]. N61K either abolished or dramatically reduced enzyme activity towards four different substrates [Koukouritaki et al. 2007]. In contrast, L360P causes a 2- to 5-fold increase in catalytic activity [Lattard et al. 2003], and is the only genetic variant of FMO3 known to substantially increase enzyme activity. As such, it could increase the rate of drug metabolism, with a consequent decrease in efficacy. However, it has been de-tected only in African populations and then at low frequency (2 to 4%). Consequently, it is of limited significance for the general population. The functional consequence of V277A, which is relatively common in Asian and African popula-tions, but absent from Europeans, has not been investigated. However, valine is not conserved in FMOs at this position and thus the substitution, which represents a conservative change, is not expected to affect activity.
Polymorphisms in Upstream Regulatory Region
Resequencing of 24 DNA samples from the Coriell Poly-morphism Discovery Resource [Koukouritaki et al. 2005b] identified seven variants in the FMO3 5’-flanking sequence: g.-2650C>A, g.-2589C>T, g.-2543T>A, g.-2177G>C, g.-2106G>A, g.-2099A>G and g.-1961T>C. Based on the frequencies of individual alleles in northern-European Whites, African Americans or Hispanic Americans of Mexi-can descent, 15 haplotypes were inferred. Seven haplotypes were considered common (frequency >1%) and were found in one or more of the ethnic groups at significantly different frequencies. The effect of individual haplotypes on gene ex-pression was measured in HepG2 cells transfected with dif-ferent FMO3-reporter constructs [Koukouritaki et al. 2005b]. Haplotype 2, (g.-2650C>A, g.-2543T>A, g.-2177G>C) caused an 8-fold increase in reporter gene activity compared with haplotype 1 (the reference sequence). Haplotype 2 was present at frequencies of 29, 11 and 6%, respectively, in the Hispanic, African-American and White groups. Two haplo-types, 8 (g.-2589C>T, g.-2106G>A) and 15 (g.-2106G>A, g.-1961T>C), resulted in very low reporter gene activity. Haplotype 8 (-2589C>T, -2106G>A) is present only in the White group, at a frequency of 4%, whereas haplotype 15 (-2106G>A, -1961T>C) was found only in the African-American group (frequency 1.5%). The effects on reporter gene activity of haplotypes 3 (-2650C>G), 4 (-2650C>G, -2543T>A) and 11 (-2543T>A) were similar to those of the
reference haplotype 1.
Individuals with haplotype 2, particularly homozygotes, would be expected to metabolize FMO3 substrates more rapidly if the increased promoter activity observed in vitro [Koukouritaki et al. 2005b] translates into increased produc-
tion of FMO3 protein in the liver. Similarly, those individu-als homozygous for haplotypes 8 or 15 are predicted to pro-duce lower amounts of the protein. If the relative promoter activities seen in the HepG2 cell transfection experiments are similar to those in vivo then individuals homozygous for haplotypes 8 or 15 would be expected to suffer some of the symptoms of TMAuria, due to the low amount of FMO3 protein produced in their liver. Individuals who are com-pound heterozygotes for haplotypes 2 and 15 (African American) or haplotypes 2 and 8 (White) would be expected to have amounts of the protein closer to that produced under the influence of haplotype 1.
This study was extended over a longer region of the FMO3 gene to examine linkage between the promoter SNP clusters (see above) and downstream coding variants, in 404 Hispanic (Mexican), 400 Latino White and 402 African Americans [Koukouritaki et al. 2007]. Haplotype 2 [Kouk-ouritaki et al. 2005b], which caused an 8-fold increase in reporter gene activity (see above) was found to be associated with E158K, E308G or the linked variant E158K/E308G. The combination of a high activity promoter with a coding variant that causes substrate-dependent reduction in enzyme activity may balance out and result in the production of suf-ficient protein to compensate for an enzyme with lower ac-tivity. The haplotype analysis undertaken by Koukouritaki et al. [Koukouritaki et al. 2007] underlines the importance, and the difficulties we face, in understanding the complete rela-
tionship between genotype and phenotype in vivo.
Human FMO3 Variation And Clinical Implications
TMAuria sufferers lack functional FMO3 and, conse-quently, are expected to have impaired ability to metabolize therapeutic drugs that are substrates for FMO3. Owing to the relatively small number of patients identified to date, little systematic investigation of this has been undertaken. How-ever, one study (Mayatepek et al. 2004) found that TMAuria sufferers have a markedly reduced capacity for N-oxyge-nation of benzydamine, a non-steroidal anti-inflammatory, and there are numerous anecdotal accounts of patients expe-riencing poor responses to other drugs. Tables 6 and 7 sum-marize the known drug substrates for FMO3.
In this section we highlight some recent studies of the effect of polymorphic FMO3 variants on drug metabolism. The first study to show that FMO3 variants influence clinical outcomes was in a group of patients treated with sulindac [Hisamuddin et al. 2004], a nonsteroidal anti-inflammatory drug prescribed to patients with familial adenomatous poly-posis (FAP) or to individuals who are perceived to be pre-disposed to this condition, judged by mutations in the APC gene. Sulindac is a prodrug and is converted by gut flora to its active metabolite, sulindac sulfide, which is then absorbed [Duggan et al. 1977; Etienne et al. 2003]. Human FMO3 catalyzes the oxygenation of sulindac sulfide to its sulfoxide [Hamman et al. 2000], which is virtually inactive [Duggan et al. 1977]. Forty one individuals who were known to have mutations in the APC gene, but had not developed polyps at the start of the study, were divided into two groups. One group was given sulindac for 4 years, while the other re-ceived a placebo. At the end of the trial 57% of the sulindac-

The Flavin-Containing Monoooxygenases (FMOs) Current Pharmacogenomics, 2007, Vol. 5, No. 4 305
treated group were polyp-free compared with 45% of the placebo-treated group. When the individuals were genotyped for common FMO3 polymorphic variants, those homozygous for E158K (33%) or E308G (17%), and who had received sulindac, had not developed polyps. Individuals who had developed polyps were not homozygous for either of the FMO3 variant alleles [Hisamuddin et al. 2004]. A follow-on study with 19 individuals already suffering from FAP as-sessed whether FMO3 genotype correlated with polyp re-gression following sulindac treatment [Hisamuddin et al. 2005]. All individuals homozygous or heterozygous for the E158K allele or heterozygous for both E158K and E308G alleles showed a reduction in polyp number. No individuals homozygous for E308G were included in this study.
The reasons for the increased sulindac efficacy in patients with E158K and E308G variants might be due to the reduc-tion in the conversion by FMO3 of sulindac sulfide to inac-tive metabolites. Thus the amount of sulindac sulfide avail-able to the patient’s circulation would be expected to in-crease and the longer duration of the active drug may con-
tribute to the regression of polyps and/or more effectively prevent their formation.
This study raises an important question with respect to sulindac efficacy and other FMO3 polymorphisms. Recently, the N61K variant was shown to have a 30-fold decrease in catalytic activity towards sulindac [Koukouritaki et al. 2007]. It remains to be seen whether sulindac will be a less effective treatment against FAP in individuals with FMO3 variants that increase promoter activity [Koukouritaki et al. 2005b] or enzyme activity (L360P) [Lattard et al. 2003] (see above).
Clozapine, an antipsychotic, is metabolized to its N-oxide by both FMO3 [Tugnait et al. 1997] and CYP3A4 [Fang et al. 1998]. A study of 396 individuals of German ethnicity found no correspondence between serum N-oxide concentra-tions and FMO3 haplotypes [Sachse et al. 1999].
Most studies on the effect of FMO3 polymorphisms have been carried out in vitro. An interesting example of the effect of the E158K polymorphism in vitro is with respect to
Table 6. Nitrogen-containing Drugs Oxygenated by Human FMO3
Substrate Type of Drug or Health Condition Product(s) Reference
Amphetamine dopamine transporter ligand (antipsychotic) hydroxylamine Cashman et al. 1999; Szoko et al. 2004
Benzydamine nonsteroidal antiinflammatory (rheumatism) N-oxide Lang and Rettie, 2000; Stormer et al. 2000
Clozapine antipsychotic agent N-oxide Tugnait et al. 1997
Deprenyl monoamine oxidase type B inhibitor (Parkin-son’s disease)
hydroxylamine Szoko et al. 2004
Itopride dopamine D2 antagonist (gastroprokinetic agent)
N-oxide Mushiroda et al. 2000
K11777 cysteine protease inhibitor agent against Trypanosoma cruzi
N-oxide Jacobsen et al. 2000
Methamphetamine psychostimulant hydroxylamine Cashman et al. 1999; Szoko et al. 2004
N-deacetyl ketoconazole* antifungal N-hydroxy/nitrone Rodriguez and Miranda, 2000
Nicotine stimulant Trans N-oxide Park et al. 1993
Olopatadine antihistamine N-oxide Kajita et al. 2002
Pyrazolacridine antitumour N-oxide Reid et al. 2004
Ranitidine Antihistamine (stomach ulcers/ Zollinger Ellison syndrome)
N-oxide Overby et al. 1997; Chung et al. 2000
S16020 topoisomerase II inhibitor (antitumour) N-oxide Pichard-Garcia et al. 2004
Tamoxifen estrogen receptor modulator (breast cancer therapy)
N-oxide Parte and Kupfer, 2005
Xanomeline muscarinic receptor agonist (Alzheimer’s Disease)
N-oxide Ring et al. 1999
*Major metabolite of antifungal agent ketoconazole.
In many cases FMO3 is not the only enzyme involved in the metabolism of the drug in vivo.

306 Current Pharmacogenomics, 2007, Vol. 5, No. 4 Phillips et al.
tamoxifen N-oxidation: when catalyzed by baculovirus-expressed FMO3 variants this was 5-fold greater with FMO3(K158) than with FMO3(E158) [Krueger et al. 2006]. Therefore the K158 variant would be expected to increase the amount of tamoxifen N-oxide in the liver, which may be important in the therapeutic response (see FMO1 section above).
Benzydamine, an anti-rheumatic drug is metabolized by FMO3 to its N-oxide [Lang and Rettie, 2000]. A study in-volving human liver microsomes from individuals genotyped for FMO3 variants, found that microsomes from individuals homozygous for the K158 variant showed significantly re-duced activity compared with those from individuals with at least one copy of the E158 variant [Stormer et al. 2000]. However, a study using recombinantly expressed E158 and K158 variants found no difference in oxygenation of benzy-damine [Shimizu et al. 2007b]. The different results obtained by different groups when studying the effect of FMO3 vari-ants on enzyme activity indicates the need for the validation of methods used to express the recombinant proteins and to assay their activity.
FMO3, like FMO1 (see above), metabolizes thiaceta-zone, an anti-tubercular drug prescribed in certain parts of Africa because it is cheap. Thiacetazone is a thiocarbamide prodrug and is a substrate for human FMO3. The main prod-ucts of the reaction are the sulfinic and sulfenic acids of the drug [Qian and Ortiz de Montellano, 2006], which have been shown to be genotoxic in mammalian cells [Ziegler-Skylakakis et al. 1998] and are thought to affect the redox state [Qian and Ortiz de Montellano, 2006]. The use of this drug in areas of the world other than Africa is limited, due to severe hepatotoxic effects. It would be of interest to know whether polymorphic variants of FMO3 contribute to this
toxicity. Although the large-scale genotyping of individuals in developing countries may not be realistic on economic grounds, it may be worth considering in cases where a com-mon polymorphism has been identified that has a significant effect on response to a commonly prescribed drug.
FMO4
When cDNA clones for human FMO4 were first isolated [Dolphin et al. 1992] the isoform was designated FMO2. The nomenclature was subsequently changed to FMO4 [Lawton et al. 1994]. FMO4 is 558 amino-acid residues long and has a molecular mass of 63,338. Other members of the FMO family, with the exception of the truncated form of FMO2, encoded by the FMO2*2A allele (see above), contain between 532 and 535 residues [Phillips et al. 1995]. From sequence comparisons, it is apparent that the additional resi-dues in FMO4 are contained in a single block located at the C-terminus of the polypeptide [Dolphin et al. 1992]. Inspec-tion of the nucleotide sequence of the FMO4 cDNA lead these authors to suggest that the extension may have been the result of a single point mutation in the termination codon of the ancestral FMO4 gene. A similar extension is present in FMO4s of other mammals and thus the predicted mutation would have occurred before the radiation of mammals.
The FMO4 gene was mapped to the long arm of human chromosome 1 [Shephard et al. 1993]. It contains ten exons, of which eight are coding [Hernandez et al. 2004]. In con-trast to other FMO mRNAs the mRNA for FMO4 contains sequences derived from 10, not 9 exons, the first two of which are entirely non-coding. FMO4 is expressed in rela-tively low amounts in several tissues, the main sites of ex-pression being liver and kidney [Dolphin et al. 1996; Her-nandez et al. 2004; Zhang and Cashman, 2006; Cashman and
Table 7. Sulfur-containing
Drugs Oxygenated by Human
FMO3ubstrate Type of Drug Or Health Condition Product(s) Reference
Ethionamide antibiotic (tuberculosis) - Krueger and Williams, 2005
MK-0767 methyl sulfide peroxisome proliferator receptor activator
(diabetes)
S-oxide Karanam et al. 2004
Methimazole thyroperoxidase inhibitor
(hyperthyroidism)
S-oxide Overby et al. 1997
Ranitidine Antihistamine
(stomach ulcers/ Zollinger Ellison syndrome)
S-oxide Chung et al. 2000
S-methyl esonarimod * cytokine production inhibitor
(rheumatism)
S-oxide Ohmi et al. 2003
Sulindac sulfide** nonsteroidal anti-inflammatory
(colorectal cancer)
S-oxide Hamman et al. 2000
Tazarotenic Acid*** retinoic acid receptor modulator
(acne/psoriasis)
S-oxide Attar et al. 2003
Thiacetazone antibiotic (tuberculosis) sulfinic acid/
carbodiimide
Qian and Ortiz de Montellano, 2006
- Products not identified/unpublished; * active metabolite of parent drug esonarimod; **active metabolite of parent drug sulindac; *** active metabolite of parent drug tazarotene.
In many cases FMO3 is not the only enzyme involved in the metabolism of the drug in vivo.

The Flavin-Containing Monoooxygenases (FMOs) Current Pharmacogenomics, 2007, Vol. 5, No. 4 307
Zhang, 2006]. Alternative splice variants of FMO4 have been reported [Lattard et al. 2004]. However, the relevance of this for the metabolism of foreign chemicals is not known.
Polymorphic Variants
A survey of 50 African Americans identified four cod-ing-region SNPs, Fig. (1) and Table 1 [Furnes et al. 2004]. One was synonymous. The other three, g.110T>C(I37T), g.14726T>C(V323A) and g.14770G>C(E339Q), were non-synonymous. Of these, I37T and E339Q each occurred only once in the 100 chromosomes surveyed and thus may repre-sent rare mutations. However, V323A, which is also reported in dbSNP126, is common in Africans (20-33%), but is ab-sent from Europeans and Asians. Although the functional consequence of this SNP has not been investigated, valine at position 323 is not conserved among FMOs and the change of amino acid (val ala) is conservative. This SNP is there-fore unlikely to have a significant effect on protein function. A further two SNPs are reported in dbSNP126. One of these is a synonymous SNP, g.14601C>T(F281F), which is pre-sent at low frequency (4 to 7%) in Asians, but is absent from Africans and Europeans. The other, which is nonsynony-mous, g.14680A>T(T308S), is present in Japanese, at fre-quency ~1%, but has not been detected in Africans or Euro-peans.
Although FMO4 is expressed in many tissues, in each case expression is low [Dolphin et al. 1996]. Furthermore, expression of the protein in a stable form in heterologous systems has proved difficult [Itagaki et al. 1996] and, conse-quently, little is known about the substrate specificity of FMO4. Nevertheless, it has been shown that FMO4 is capa-ble of oxidizing methimazole [Itagaki et al. 1996], L-methionine and S-allyl-L-cysteine [Ripp et al. 1999].
FMO5
A cDNA for FMO5 of human was isolated in 1995 [Overby et al. 1995; Phillips et al. 1995]. The FMO5 gene is not part of the FMO gene cluster on human chromosome 1q24.3, but is located ~26Mb closer to the centromere, at 1q21.1 [Hernandez et al. 2004]. However, the internal orga-nization of the gene is similar to that of other FMO genes: it comprises nine exons, the first of which is non-coding, and encodes a polypeptide of 533 amino-acid residues and has a molecular mass of 60,225. FMO5 is expressed in many fetal and adult tissues, but in human its main site of expression is adult liver [Janmohamed et al. 2001; Hernandez et al. 2004; Cashman and Zhang, 2006; Zhang and Cashman, 2006], where, along with FMO3, it is a major form of the enzyme present [Overby et al. 1997; Cashman and Zhang, 2006; Zhang and Cashman, 2006]. It is also the most abundantly expressed FMO in the small intestine [Cashman and Zhang, 2006; Zhang and Cashman, 2006] and skin [Janmohamed et al. 2001].
FMO5 exhibits little catalytic activity towards compounds, such as methimazole, that are good substrates for other FMOs [Rettie et al. 1994; Overby et al. 1995; Cherrington et al. 1998a; Krueger and Williams, 2005], but does catalyze the N-oxygenation of short-chain aliphatic primary amines such as N-octylamine [Overby et al. 1995]. Aliphatic pri-mary amines are substrates of FMO2, but this enzyme has a
marked preference for molecules with longer chains (see above). More recently, FMO5 has been reported to catalyze the oxygenation of other compounds, for instance, thioethers with proximal carboxylic acids that are not utilized as sub-strates for other FMOs. For example, esonarimod, an anti-rheumatic drug is converted to the active metabolite S-methyl esonarimod by FMO5 [Ohmi et al. 2003].
Thus, with respect to substrate specificity, FMO5 is re-garded as an atypical FMO and, despite its high level of ex-pression in adult human liver, the enzyme is not thought to play a significant role in the metabolism of drugs, with the possible exception of esonarimod.
Polymorphic Variations
In a survey of 50 African Americans [Furnes et al. 2003] only two coding-region mutations were identified, of which only one, g.37917C>T(P457L), results in a change in amino-acid sequence, Fig. (1) and Table 1. Although the effect of this change on protein function has not been investigated, a proline at this position is conserved in all mammalian FMOs sequenced to date. However, the variant was identified in only one of the 100 chromosomes surveyed and thus may represent a rare mutation that would have little consequence for the general population. The other mutation detected in this study, g.23806A>G(A367A), was synonymous. Two additional coding-region SNPs are reported in dbSNP126. One is a synonymous SNP, g.23716G>A(P337P). The other, g.38059G>T(R506S), is nonsynonymous, but is found only in Yorubans, at a frequency of 9%.
Physiological And Xenobiotic Factors Influence FMO5
Expression
Interindividual variations of 10-fold in the amount of FMO5 in adult human liver (3.5 to 34 pmol/mg microsomal protein) have been reported [Overby et al. 1997]. Although no polymorphisms have been identified that affect FMO5 catalytic activity, it is possible that promoter variants exist that influence the amount of FMO5 produced. Unlike other human FMOs, FMO5 is inducible and interindividual varia-tions in amounts of the protein may be due in part to physio-logical effects or to exposure to xenobiotics. The synthetic progestin R5020 increased FMO5 expression in a breast can-cer cell line stably expressing the progesterone B-receptor [Miller et al. 1997]. The authors suggested that increased expression of FMO5 might lead to increased carcinogenicity of tamoxifen in target tissues that overexpress progesterone B-receptors. However, FMO5, unlike FMO1 and FMO3, does not metabolize tamoxifen [Hodgson et al. 2000]. A recent profiling study of primary breast tumours showed that FMO5 expression may be up-regulated by estrogen receptor
(ER ) [Bieche et al. 2004]. FMO5 mRNA was increased in ER -positive tumours, but was not detected in ER -negative tumours. There was a strong correlation in this study between FMO5 over-expression and N-acetyl trans-ferase 1 (NAT-1) over-expression, with regard to relapse-free survival. However, statistical analysis found that only NAT-1 expression was of prognostic value [Bieche et al. 2004]. FMO5 is increased by the xenobiotic hyperforin [Krusekopf and Roots, 2005], a component of St. John’s Wort, and the antibiotic rifampicin [Rae et al. 2001]. Both compounds are known to increase CYP3A4 through the action of the preg-
308 Current Pharmacogenomics, 2007, Vol. 5, No. 4 Phillips et al.
nane X receptor (PXR) [Kliewer et al. 1999; Moore et al. 2000]. No study on the mechanism of action of FMO5 gene activation, by any of the compounds mentioned, has been published.
Extensive expression profiling of human liver samples found that FMO5 mRNA was markedly down-regulated in individuals with type-2 diabetes compared with unaffected individuals [Takamura et al. 2004]. As knowledge of the role of FMO5 in both endogenous and xenobiotic metabolism is limited, the significance, if any, for drug treatment of those with type-2 diabetes is unknown.
CONCLUDING REMARKS
Five functional FMOs, FMO1, 2, 3, 4 and 5, are present in humans. Based on substrate-specificity and site and amount of expression, FMO1 and FMO3 are the most impor-tant for the metabolism of therapeutic drugs. For both of these FMOs the pattern of expression in humans is markedly different from that in other mammals, particularly rodents used as animal models for the investigation of drug metabo-lism. In humans, the expression of the FMO1 gene is switched off after birth and FMO1 is undetectable in adult liver. This is in contrast to other mammals, in which FMO1 represents the major form of the enzyme present in adult liver. FMO3 is the major drug-metabolizing FMO in adult human liver. These species differences in the tissue-specific pattern of expression of FMO1 and FMO3 have important consequences for the extrapolation of drug metabolism data from experimental animals to humans.
Essentially all individuals of European or Asian origin express no functional FMO2, which in most other mammals is the major form of the enzyme present in the lung. How-ever, in sub-Saharan Africa, and in populations recently de-scended from this region, a substantial proportion of indi-viduals do express functional FMO2 in the lung. This has implications for inter-ethnic and, in African populations, interindividual variations in response to drugs and toxic chemicals that are substrates for FMO2.
There are very few examples of induction or inhibition of FMOs by endogenous or foreign chemicals, suggesting that drug-drug interactions would not be an important feature of therapeutic agents that are metabolized predominantly by FMOs. Variations in the expression and activity of FMOs are thus mainly due to genetic factors. An understanding of the pharmacogenetics of FMOs would help identify individuals who would respond favourably to a particular drug and those who would be at risk of experiencing harmful side effects, and thereby contribute significantly to drug development by decreasing the failure rate of new candidate drugs and reduc-ing the time taken for approval of a drug by regulatory authorities.
The number of validated nonsynonymous SNPs identi-fied in FMO2 and FMO3 is considerably more than in FMO1, FMO4 or FMO5 (see Tables 1 and 5). In the case of FMO2 and FMO3, several variants are present in high fre-quency in some, or all, major population groups and are known to affect enzyme activity. In FMO1, FMO4 and FMO5, however, all variants are confined to only one popu-lation group and, with the exception of V323A in FMO4, which is unlikely to affect enzyme function, are present at
low or very low frequency. The differences in the number of nonsynonomous variants identified in various members of the FMO family may reflect greater interest in FMO3, as a consequence of its role in the inherited disorder TMAuria, and in FMO2, as a result of the discovery of the common Q472X polymorphism. This seems unlikely, however, be-cause the total number of genetic variants, i.e., coding and noncoding, reported in dbSNP126 for FMO1 and FMO5 is greater than for FMO3 and is comparable with that for FMO2.
The relatively high number and frequency of nonsynono-mous SNPs in FMO2 may be the result of an accumulation of potentially deleterious mutations in an allele, FMO2*2, which is already defective. In FMO3, the ratio of non-synonomous to synonomous polymorphisms is significantly more than expected under a neutral model of evolution, pro-viding evidence that the gene has been the subject of balanc-ing natural selection (Allerston et al. 2007). In the case of FMO1 and FMO5, the relative paucity and low frequency of nonsynonymous SNPs may be indicative of an important physiological role for the proteins encoded by these genes.
ACKNOWLEDGEMENTS
AAF is a recipient of a post-graduate studentship from the Biotechnology and Biological Sciences Research Coun-cil, UK.
ABBREVIATIONS
ALS = Amyotrophic lateral sclerosis
AF = Atrial fibrillation
CYP = Cytochrome P450
5’-DPT = 10-(N,N-dimethylaminopentyl)-2-(trifluoromethyl) phenothiazine
ER = Estrogen receptor
FAD = Flavin adenine dinucleotide
FAP = Familial adenomatous polyposis
FMO = Flavin-containing monooxygenase
NAT-1 = N-acetyl transferase 1
SNP = Single-nucleotide polymorphism
TMA = Trimethylamine
TMAuria = Trimethylaminuria
UTR = untranslated region
REFERENCES
Akerman, B. R.; Lemass, H.; Chow, L. M.; Lambert, D. M.; Greenberg, C.; Bibeau, C.; Mamer, O. A. and Treacy, E. P. (1999a) Trimethy-
laminuria is Caused by Mutations of the FMO3 Gene in a North American Cohort. Mol. Genet. Metab. 68, 24-31.
Akerman, B. R.; Forrest, S.; Chow, L.; Youil, R.; Knight, M. and Treacy, E. P. (1999b) Two Novel Mutations of the FMO3 Gene in a Proband
with Trimethylaminuria. Hum. Mutat. 13, 376-379. Allerston, C. K.; Shimizu, M.; Fujieda, M.; Shephard, E. A.; Yamazaki, H.
and Phillips, I. R. (2007) Molecular Evolution and Balancing Se-lection in the Flavin-Containing Monooxygenase 3 Gene (FMO3).
Pharmacogenet. Genomics 17, 827-839.

The Flavin-Containing Monoooxygenases (FMOs) Current Pharmacogenomics, 2007, Vol. 5, No. 4 309
Al-Waiz, M.; Ayesh, R.; Mitchell, S. C.; Idle, J. R. and Smith, R. L. (1988)
Trimethylaminuria ('Fish-Odour Syndrome'): A Study of an Af-fected Family. Clin. Sci. 74, 231-236.
Attar, M.; Dong, D.; Ling, K. H. and Tang-Liu, D. D. (2003) Cytochrome P450 2C8 and Flavin-Containing Monooxygenases Are Involved in
the Metabolism of Tazarotenic Acid in Humans. Drug Metab. Dis-pos. 31, 476-481.
Basarab, T.; Ashton, G. H.; Menage, H. P. and McGrath, J. A. (1999) Se-quence Variations in the Flavin-Containing Mono-Oxygenase 3
Gene (FMO3) in Fish Odour Syndrome. Br. J. Dermatol. 140, 164-167.
Bieche, I.; Girault, I.; Urbain, E.; Tozlu, S. and Lidereau, R. (2004) Rela-tionship between Intratumoral Expression of Genes Coding for
Xenobiotic-Metabolizing Enzymes and Benefit from Adjuvant Ta-moxifen in Estrogen Receptor Alpha-Positive Postmenopausal
Breast Carcinoma. Breast Cancer Res. 6, R252-263. Brunelle, A.; Bi, Y. A.; Lin, J.; Russell, B.; Luy, L.; Berkman, C. and
Cashman, J. (1997) Characterization of Two Human Flavin-Containing Monooxygenase (Form 3) Enzymes Expressed in Es-
cherichia Coli as Maltose Binding Protein Fusions. Drug Metab. Dispos. 25, 1001-1007.
Cashman, J. R. (2002) Human Flavin-Containing Monooxygenase (Form 3): Polymorphisms and Variations in Chemical Metabolism. Pharma-
cogenomics 3, 325-329. Cashman, J. R. (2004) The Implications of Polymorphisms in Mammalian
Flavin-Containing Monooxygenases in Drug Discovery and Devel-opment. Drug Discov. Today 9, 574-581.
Cashman, J. R. and Zhang, J. (2002) Interindividual Differences of Human Flavin-Containing Monooxygenase 3: Genetic Polymorphisms and
Functional Variation. Drug Metab. Dispos. 30, 1043-1052. Cashman, J. R. and Zhang, J. (2006) Human Flavin-Containing Monooxy-
genases. Ann. Rev. Pharmacol. Toxicol. 46, 65-100. Cashman, J. R.; Bi, Y. A.; Lin, J.; Youil, R.; Knight, M.; Forrest, S. and
Treacy, E. (1997) Human Flavin-Containing Monooxygenase Form 3: cDNA Expression of the Enzymes Containing Amino Acid Sub-
stitutions Observed in Individuals with Trimethylaminuria. Chem. Res. Toxicol. 10, 837-841.
Cashman, J. R.; Xiong, Y. N.; Xu, L. and Janowsky, A. (1999) N-Oxygenation of Amphetamine and Methamphetamine by the Hu-
man Flavin-Containing Monooxygenase (Form 3): Role in Bioacti-vation and Detoxication. J. Pharmacol. Exp. Ther. 288, 1251-1260.
Cashman, J. R.; Zhang, J.; Leushner, J. and Braun, A. (2001) Population Distribution of Human Flavin-Containing Monooxygenase Form 3:
Gene Polymorphisms. Drug Metab. Dispos. 29, 1629-1637. Cereda, C.; Gabanti, E.; Corato, M.; de Silvestri, A.; Alimonti, D.; Cova, E.;
Malaspina, A. and Ceroni, M. (2006) Increased Incidence of FMO1 Gene Single Nucleotide Polymorphisms in Sporadic Amyotrophic
Lateral Sclerosis. Amyotroph. Lateral Scler. 7, 227-234. Chen, Q. M.; Alexander, D.; Sun, H.; Xie, L.; Lin, Y.; Terrand, J.; Morrissy,
S. and Purdom, S. (2005) Corticosteroids Inhibit Cell Death In-duced by Doxorubicin in Cardiomyocytes: Induction of Antiapop-
tosis, Antioxidant, and Detoxification Genes. Mol. Pharmacol. 67, 1861-1873.
Cherrington, N. J.; Falls, J. G.; Rose, R. L.; Clements, K. M.; Philpot, R. M.; Levi, P. E. and Hodgson, E. (1998a) Molecular Cloning, Se-
quence, and Expression of Mouse Flavin-Containing Monooxy-genases 1 and 5 (FMO1 and FMO5). J. Biochem. Mol. Toxicol. 12,
205-212. Cherrington, N. J.; Cao, Y.; Cherrington, J. W.; Rose, R. L. and Hodgson, E.
(1998b) Physiological Factors Affecting Protein Expression of Fla-vin-Containing Monooxygenases 1, 3 and 5. Xenobiotica 28, 673-
682. Chung, W.G.; Park, C. S.; Roh, H. K and Cha, Y. N. (1997) Induction of
Flavin-containing Monooxygenase (FMO1) by a Polycyclic Aro-matic Hydrocarbon, 3-Methylcholanthrene, in Rat Liver. Mol. Cells
7, 738-741. Chung, W. G.; Park, C. S.; Roh, H. K.; Lee, W. K. and Cha, Y. N. (2000)
Oxidation of Ranitidine by Isozymes of Flavin-Containing Monooxygenase and Cytochrome P450. Jpn. J. Pharmacol. 84,
213-220. Dolphin, C.; Shephard, E. A.; Povey, S.; Palmer, C. N.; Ziegler, D. M.;
Ayesh, R.; Smith, R. L. and Phillips, I. R. (1991) Cloning, Primary Sequence, and Chromosomal Mapping of a Human Flavin-
Containing Monooxygenase (FMO1). J. Biol. Chem. 266, 12379-12385.
Dolphin, C. T.; Shephard, E. A.; Povey, S.; Smith, R. L. and Phillips, I. R.
(1992) Cloning, Primary Sequence and Chromosomal Localization of Human FMO2, a New Member of the Flavin-Containing Mono-
Oxygenase Family. Biochem. J. 287, 261-267. Dolphin, C. T.; Cullingford, T. E.; Shephard, E. A.; Smith, R. L. and Phil-
lips, I. R. (1996) Differential Developmental and Tissue-Specific Regulation of Expression of the Genes Encoding Three Members
of the Flavin-Containing Monooxygenase Family of Man, FMO1, FMO3 and FMO4. Eur. J. Biochem. 235, 683-689.
Dolphin, C. T.; Riley, J. H.; Smith, R. L.; Shephard, E. A. and Phillips, I. R. (1997a) Structural Organization of the Human Flavin-Containing
Monooxygenase 3 Gene (FMO3), the Favored Candidate for Fish-Odor Syndrome, Determined Directly from Genomic DNA. Ge-
nomics 46, 260-267. Dolphin, C. T.; Janmohamed, A.; Smith, R. L.; Shephard, E. A. and Phillips,
I. R. (1997b) Missense Mutation in Flavin-Containing Mono-Oxygenase 3 Gene, FMO3, Underlies Fish-Odour Syndrome. Nat.
Genet. 17, 491-494. Dolphin, C. T.; Beckett, D. J.; Janmohamed, A.; Cullingford, T. E.; Smith,
R. L.; Shephard, E. A. and Phillips, I. R. (1998) The Flavin-Containing Monooxygenase 2 Gene (FMO2) of Humans, but Not
of Other Primates, Encodes a Truncated, Nonfunctional Protein. J. Biol. Chem. 273, 30599-30607.
Dolphin, C. T.; Janmohamed, A.; Smith, R. L.; Shephard, E. A. and Phillips, I. R. (2000) Compound Heterozygosity for Missense Mutations in
the Flavin-Containing Monooxygenase 3 (FMO3) Gene in Patients with Fish-Odour Syndrome. Pharmacogenetics 10, 799-807.
Duescher, R. J.; Lawton, M. P.; Philpot, R. M. and Elfarra, A. A. (1994) Flavin-Containing Monooxygenase (FMO)-Dependent Metabolism
of Methionine and Evidence for FMO3 Being the Major FMO In-volved in Methionine Sulfoxidation in Rabbit Liver and Kidney
Microsomes. J. Biol. Chem. 269, 17525-17530. Duggan, D. E.; Hooke, K. F.; Risley, E. A.; Shen, T. Y. and Arman, C. G.
(1977) Identification of the Biologically Active Form of Sulindac. J. Pharmacol. Exp. Ther. 201, 8-13.
Eswaramoorthy, S.; Bonanno, J. B.; Burley, S. K. and Swaminathan, S. (2006). Mechanism of Action of a Flavin-Containing Monooxy-
genase. Proc. Natl. Acad. Sci. USA 103, 9832-9837. Etienne, F.; Resnick, L.; Sagher, D.; Brot, N. and Weissbach, H. (2003)
Reduction of Sulindac to Its Active Metabolite, Sulindac Sulfide: Assay and Role of the Methionine Sulfoxide Reductase System.
Biochem. Biophys. Res. Commun. 312, 1005-1010. Fang, J.; Coutts, R. T.; McKenna, K. F. and Baker, G. B. (1998) Elucidation
of Individual Cytochrome P450 Enzymes Involved in the Metabo-lism of Clozapine. Naunyn Schmiedebergs Archiv. Pharmacol. 358,
592-599. Forrest, S. M.; Knight, M.; Akerman, B. R.; Cashman, J. R. and Treacy, E.
P. (2001) A Novel Deletion in the Flavin-Containing Monooxy-genase Gene (FMO3) in a Greek Patient with Trimethylaminuria.
Pharmacogenetics 11, 169-174. Fujieda, M.; Yamazaki, H.; Togashi, M.; Saito, T. and Kamataki, T. (2003)
Two Novel Single Nucleotide Polymorphisms (SNPs) of the FMO3 Gene in Japanese. Drug Metab. Pharmacokinet. 18, 333-335.
Furnes, B. and Schlenk, D. (2004) Evaluation of Xenobiotic N- and S-Oxidation by Variant Flavin-Containing Monooxygenase 1
(FMO1) Enzymes. Toxicol. Sci. 78, 196-203. Furnes, B.; Feng, J.; Sommer, S. S. and Schlenk, D. (2003) Identification of
Novel Variants of the Flavin-Containing Monooxygenase Gene Family in African Americans. Drug Metab. Dispos. 31, 187-193.
Gasser, R.; Tynes, R. E.; Lawton, M. P.; Korsmeyer, K. K.; Ziegler, D. M. and Philpot, R. M. (1990) The Flavin-Containing Monooxygenase
Expressed in Pig Liver: Primary Sequence, Distribution, and Evi-dence for a Single Gene. Biochemistry 29, 119-124.
Hadidi, H. F.; Cholerton, S.; Atkinson, S.; Irshaid, Y. M.; Rawashdeh, N. M. and Idle, J. R. (1995) The N-Oxidation of Trimethylamine in a
Jordanian Population. Br. J. Clin. Pharmacol. 39, 179-181. Hamman, M. A.; Haehner-Daniels, B. D.; Wrighton, S. A.; Rettie, A. E. and
Hall, S. D. (2000) Stereoselective Sulfoxidation of Sulindac Sulfide by Flavin-Containing Monooxygenases. Comparison of Human
Liver and Kidney Microsomes and Mammalian Enzymes. Bio-chem. Pharmacol. 60, 7-17.
Henderson, M. C.; Krueger, S. K.; Siddens, L. K.; Stevens, J. F. and Wil-liams, D. E. (2004a) S-Oxygenation of the Thioether Organophos-
phate Insecticides Phorate and Disulfoton by Human Lung Flavin-Containing Monooxygenase 2. Biochem. Pharmacol. 68, 959-967.
310 Current Pharmacogenomics, 2007, Vol. 5, No. 4 Phillips et al.
Henderson, M. C.; Krueger, S. K.; Stevens, J. F. and Williams, D. E.
(2004b) Human Flavin-Containing Monooxygenase Form 2 S-Oxygenation: Sulfenic Acid Formation from Thioureas and Oxida-
tion of Glutathione. Chem. Res. Toxicol. 17, 633-640. Hernandez, D.; Addou, S.; Lee, D.; Orengo, C.; Shephard, E. A. and Phil-
lips, I. R. (2003) Trimethylaminuria and a Human FMO3 Mutation Database. Hum. Mut. 22, 209-213.
Hernandez, D.; Janmohamed, A.; Chandan, P.; Phillips, I. R. and Shephard, E. A. (2004) Organization and Evolution of the Flavin-Containing
Monooxygenase Genes of Human and Mouse: Identification of Novel Gene and Pseudogene Clusters. Pharmacogenetics 14, 117-
130. Hines, R. N.; Hopp, K. A.; Franco, J.; Saeian, K. and Begun, F. P. (2002)
Alternative Processing of the Human FMO6 Gene Renders Tran-scripts Incapable of Encoding a Functional Flavin-Containing
Monooxygenase. Mol. Pharmacol. 62, 320-325. Hines, R. N.; Luo, Z.; Hopp, K. A.; Cabacungan, E. T.; Koukouritaki, S. B.
and McCarver, D. G. (2003) Genetic Variability at the Human FMO1 Locus: Significance of a Basal Promoter Yin Yang 1 Ele-
ment Polymorphism (FMO1*6). J. Pharmacol. Exp. Ther. 306, 1210-1218.
Hisamuddin, I. M.; Wehbi, M. A.; Chao, A.; Wyre, H. W.; Hylind, L. M.; Giardiello, F. M. and Yang, V. W. (2004) Genetic Polymorphisms
of Human Flavin Monooxygenase 3 in Sulindac-Mediated Primary Chemoprevention of Familial Adenomatous Polyposis. Clin. Can-
cer Res. 10, 8357-8362. Hisamuddin, I. M.; Wehbi, M. A.; Schmotzer, B.; Easley, K. A.; Hylind, L.
M.; Giardiello, F. M. and Yang, V. W. (2005) Genetic Polymor-phisms of Flavin Monooxygenase 3 in Sulindac-Induced Regres-
sion of Colorectal Adenomas in Familial Adenomatous Polyposis. Cancer Epidemiol. Biomarkers Prev. 14, 2366-2369.
Hodgson, E.; Rose, R. L.; Cao, Y.; Dehal, S. S. and Kupfer, D. (2000) Fla-vin-Containing Monooxygenase Isoform Specificity for the N-
Oxidation of Tamoxifen Determined by Product Measurement and Nadph Oxidation. J. Biochem. Mol. Toxicol. 14, 118-120.
Hugonnard, M.; Benoit, E.; Longin-Sauvageon, C. and Lattard, V. (2004) Identification and Characterization of the FMO2 Gene in Rattus
Norvegicus: A Good Model to Study Metabolic and Toxicological Consequences of the FMO2 Polymorphism. Pharmacogenetics 14,
647-655. Itagaki, K.; Carver, G. T. and Philpot, R. M. (1996) Expression and Charac-
terization of a Modified Flavin-Containing Monooxygenase 4 from Humans. J. Biol. Chem. 271, 20102-20107.
Jacobsen, W.; Christians, U. and Benet, L. Z. (2000) In Vitro Evaluation of the Disposition of a Novel Cysteine Protease Inhibitor [in Process
Citation]. Drug Metab. Dispos. 28, 1343-1351. Jakobsson, S. V. and Cintig, D. L. (1973) Studies on the Cytochrome P-450-
Containing Mono-Oxygenase System in Human Kidney Cortex Microsomes. J. Pharmacol. Exp. Ther. 185, 226-234.
Janmohamed, A.; Dolphin, C. T.; Phillips, I. R. and Shephard, E. A. (2001) Quantification and Cellular Localization of Expression in Human
Skin of Genes Encoding Flavin-Containing Monooxygenases and Cytochromes P450. Biochem. Pharmacol. 62, 777-786.
Janmohamed, A.; Hernandez, D.; Phillips, I. R. and Shephard, E. A. (2004) Cell-, Tissue-, Sex- and Developmental Stage-Specific Expression
of Mouse Flavin-Containing Monooxygenases (FMOs). Biochem. Pharmacol. 68, 73-83.
Jones, K. C. and Ballou, D. P. (1986) Reactions of the 4a-Hydroperoxide of Liver Microsomal Flavin-Containing Monooxygenase with Nu-
cleophilic and Electrophilic Substrates. J. Biol. Chem. 261, 2553-2559.
Kajita, J.; Inano, K.; Fuse, E.; Kuwabara, T. and Kobayashi, H. (2002) Effects of Olopatadine, a New Antiallergic Agent, on Human Liver
Microsomal Cytochrome P450 Activities. Drug Metab. Dispos. 30, 1504-1511.
Kang, J. H.; Chung, W. G.; Lee, K. H.; Park, C. S.; Kang, J. S.; Shin, I. C.; Roh, H. K.; Dong, M. S.; Baek, H. M. and Cha, Y. N. (2000) Phe-
notypes of Flavin-Containing Monooxygenase Activity Determined by Ranitidine N-Oxidation Are Positively Correlated with Geno-
types of Linked FMO3 Gene Mutations in a Korean Population. Pharmacogenetics 10, 67-78.
Karanam, B. V.; Hop, C. E.; Liu, D. Q.; Wallace, M.; Dean, D.; Satoh, H.; Komuro, M.; Awano, K. and Vincent, S. H. (2004) In Vitro Me-
tabolism of Mk-0767 [(+/-)-5-[(2,4-Dioxothiazolidin-5-Yl)Methyl]-2-Methoxy-N-[[(4-Trifluoromet Hyl) Phenyl]Methyl]Benzamide],
a Peroxisome Proliferator-Activated Receptor Alpha/Gamma Ago-
nist. I. Role of Cytochrome P450, Methyltransferases, Flavin Monooxygenases, and Esterases. Drug Metab. Dispos. 32, 1015-
1022. Katchamart, S.; Stresser, D. M.; Dehal, S. S.; Kupfer, D. and Williams, D.
E. (2000) Concurrent Flavin-containing Monooxygenase Down-regulation and Cytochrome P-450 Induction by Dietary Indoles in
Rat: Implications for Drug-drug Interaction. Drug Metab. Dispos. 28, 930-936.
Kim, Y. H.; Lim, D. S.; Lee, J. H.; Shim, W. J.; Ro, Y. M.; Park, G. H.; Becker, K. G.; Cho-Chung, Y. S. and Kim, M. K. (2003) Gene Ex-
pression Profiling of Oxidative Stress on Atrial Fibrillation in Hu-mans. Exp. Mol. Med. 35, 336-349.
Kim, Y. M. and Ziegler, D. M. (2000) Size Limits of Thiocarbamides Ac-cepted as Substrates by Human Flavin- Containing Monooxy-
genase 1. Drug Metab. Dispos. 28, 1003-1006. Kliewer, S. A.; Lehmann, J. M.; Milburn, M. V. and Willson, T. M. (1999)
The PPARs and PXRs: Nuclear Xenobiotic Receptors That Define Novel Hormone Signaling Pathways. Recent Prog. Horm. Res. 54,
345-367. Kobayashi, S.; Kim, J.; Lawley, H.; Tjoa, S.; Fennessey, P.; Preti, G. and
Fakharzadeh, S. (2001) Identification of a Novel D132H Missense Mutation in the Flavin-Containing Monoosygenase 3 Gene in
Trimethylaminuria. J. Invest. Dermatol. 117, 789. Koukouritaki, S. B. and Hines, R. N. (2005) Flavin-Containing Monooxy-
genase Genetic Polymorphism: Impact on Chemical Metabolism and Drug Development. Pharmacogenomics 6, 807-822.
Koukouritaki, S. B.; Simpson, P.; Yeung, C. K.; Rettie, A. E. and Hines, R. N. (2002) Human Hepatic Flavin-Containing Monooxygenases 1
(FMO1) and 3 (FMO3) Developmental Expression. Pediatr. Res. 51, 236-243.
Koukouritaki, S. B.; Poch, M. T.; Cabacungan, E. T.; McCarver, D. G. and Hines, R. N. (2005) Discovery of Novel Flavin-Containing
Monooxygenase 3 (FMO3) Single Nucleotide Polymorphisms and Functional Analysis of Upstream Haplotype Variants. Mol. Phar-
macol. 68, 383-392. Koukouritaki, S. B.; Poch, M. T.; Henderson, M. C.; Siddens, L. K.;
Krueger, S. K.; VanDyke, J. E.; Williams, D. E.; Pajewski, N. M.; Wang, T. and Hines, R. N. (2007) Identification and Functional
Analysis of Common Human Flavin-Containing Monooxygenase 3 Genetic Variants. J. Pharmacol. Exp. Ther. 320, 266-273.
Krause, R. J.; Lash, L. H. and Elfarra, A. A. (2003) Human Kidney Flavin-Containing Monooxygenases and Their Potential Roles in Cysteine
S-Conjugate Metabolism and Nephrotoxicity. J. Pharmacol. Exp. Ther. 304, 185-191.
Krueger, S. K. and Williams, D. E. (2005) Mammalian Flavin-Containing Monooxygenases: Structure/Function, Genetic Polymorphisms and
Role in Drug Metabolism. Pharmacol. Ther. 106, 357-387. Krueger, S. K.; Williams, D. E.; Yueh, M. F.; Martin, S. R.; Hines, R. N.;
Raucy, J. L.; Dolphin, C. T.; Shephard, E. A. and Phillips, I. R. (2002a) Genetic Polymorphisms of Flavin-Containing Monooxy-
genase (FMO). Drug Metab. Rev. 34, 523-532. Krueger, S. K.; Martin, S. R.; Yueh, M. F.; Pereira, C. B. and Williams, D.
E. (2002b) Identification of Active Flavin-Containing Monooxy-genase Isoform 2 in Human Lung and Characterization of Ex-
pressed Protein. Drug Metab. Dispos. 30, 34-41. Krueger, S. K.; Siddens, L. K.; Martin, S. R.; Yu, Z.; Pereira, C. B.; Caba-
cungan, E. T.; Hines, R. N.; Ardlie, K. G.; Raucy, J. L. and Wil-liams, D. E. (2004) Differences in FMO2*1 Allelic Frequency be-
tween Hispanics of Puerto Rican and Mexican Descent. Drug Me-tab. Dispos. 32, 1337-1340.
Krueger, S. K.; Siddens, L. K.; Henderson, M. C.; Andreasen, E. A.; Tan-guay, R. L.; Pereira, C. B.; Cabacungan, E. T.; Hines, R. N.; Ard-
lie, K. G. and Williams, D. E. (2005) Haplotype and Functional Analysis of Four Flavin-Containing Monooxygenase Isoform 2
(FMO2) Polymorphisms in Hispanics. Pharmacogenet. Genomics 15, 245-256.
Krueger, S. K.; Vandyke, J. E.; Williams, D. E. and Hines, R. N. (2006) The Role of Flavin-Containing Monooxygenase (FMO) in the Metabo-
lism of Tamoxifen and Other Tertiary Amines. Drug Metab. Rev. 38, 139-147.
Krusekopf, S. and Roots, I. (2005) St. John's Wort and Its Constituent Hy-perforin Concordantly Regulate Expression of Genes Encoding En-
zymes Involved in Basic Cellular Pathways. Pharmacogenet. Ge-nomics 15, 817-829.

The Flavin-Containing Monoooxygenases (FMOs) Current Pharmacogenomics, 2007, Vol. 5, No. 4 311
Kubota, M.; Nakamoto, Y.; Nakayama, K.; Ujjin, P.; Satarug, S.; Mushi-
roda, T.; Yokoi, T.; Funayama, M. and Kamataki, T. (2002) A Mu-tation in the Flavin-Containing Monooxygenase 3 Gene and Its Ef-
fects on Catalytic Activity for N-Oxidation of Trimethylamine in Vitro. Drug Metab. Pharmacokinet. 17, 207-213.
Kulkarni, A. P. and Hodgson, E. (1984) The Metabolism of Insecticides: The Role of Monooxygenase Enzymes. Annu. Rev. Pharmacol.
Toxicol. 24, 19-42. Lang, D. H. and Rettie, A. E. (2000) In Vitro Evaluation of Potential in Vivo
Probes for Human Flavin- Containing Monooxygenase (FMO): Metabolism of Benzydamine and Caffeine by FMO and P450 Iso-
forms. Br. J. Clin. Pharmacol. 50, 311-314. Lang, D. H.; Yeung, C. K.; Peter, R. M.; Ibarra, C.; Gasser, R.; Itagaki, K.;
Philpot, R. M. and Rettie, A. E. (1998) Isoform Specificity of Trimethylamine N-Oxygenation by Human Flavin-Containing
Monooxygenase (FMO) and P450 Enzymes: Selective Catalysis by FMO3. Biochem. Pharmacol. 56, 1005-1012.
Lattard, V.; Longin-Sauvageon, C.; Lachuer, J.; Delatour, P. and Benoit, E. (2002a) Cloning, Sequencing, and Tissue-Dependent Expression of
Flavin-Containing Monooxygenase (FMO) 1 and FMO3 in the Dog. Drug Metab. Dispos. 30, 119-128.
Lattard, V.; Longin-Sauvageon, C.; Krueger, S. K.; Williams, D. E. and Benoit, E. (2002b) The FMO2 Gene of Laboratory Rats, as in Most
Humans, Encodes a Truncated Protein. Biochem. Biophys. Res. Commun. 292, 558-563.
Lattard, V.; Zhang, J.; Tran, Q.; Furnes, B.; Schlenk, D. and Cashman, J. R. (2003) Two New Polymorphisms of the FMO3 Gene in Caucasian
and African-American Populations: Comparative Genetic and Functional Studies. Drug Metab. Dispos. 31, 854-860.
Lattard, V.; Zhang, J. and Cashman, J. R. (2004) Alternative Processing Events in Human FMO Genes. Mol. Pharmacol. 65, 1517-1525.
Lawton, M. P.; Gasser, R.; Tynes, R. E.; Hodgson, E. and Philpot, R. M. (1990) The Flavin-Containing Monooxygenase Enzymes Ex-
pressed in Rabbit Liver and Lung Are Products of Related but Dis-tinctly Different Genes. J. Biol. Chem. 265, 5855-5861.
Lawton, M. P.; Cashman, J. R.; Cresteil, T.; Dolphin, C. T.; Elfarra, A. A.; Hines, R. N.; Hodgson, E.; Kimura, T.; Ozols, J.; Phillips, I. R.;
Philpot, R. M.; Poulsen, L. L.; Rettie, A. E.; Shephard, E. A.; Wil-liams, D. E. and Ziegler, D. M. (1994) A Nomenclature for the
Mammalian Flavin-Containing Monooxygenase Gene Family Based on Amino Acid Sequence Identities. Arch. Biochem. Bio-
phys. 308, 254-257. Lien, E. A.; Solheim, E. and Ueland, P. M. (1991) Distribution of Ta-
moxifen and Its Metabolites in Rat and Human Tissues During Steady-State Treatment. Cancer Res. 51, 4837-4844.
Lomri, N.; Gu, Q. and Cashman, J. R. (1992) Molecular Cloning of the Flavin-Containing Monooxygenase (Form II) cDNA from Adult
Human Liver. Proc. Natl. Acad. Sci. USA 89, 1685-1689. Lomri, N.; Yang, Z. and Cashman, J. R. (1993) Regio- and Stereoselective
Oxygenations by Adult Human Liver Flavin-Containing Monooxy-genase 3. Comparison with Forms 1 and 2. Chem. Res. Toxicol. 6,
800-807. Luo, Z. and Hines, R. N. (2001) Regulation of Flavin-Containing
Monooxygenase 1 Expression by Ying Yang 1 and Hepatic Nu-clear Factors 1 and 4. Mol. Pharmacol. 60, 1421-1430.
Malaspina, A.; Kaushik, N. and de Belleroche, J. (2001) Differential Ex-pression of 14 Genes in Amyotrophic Lateral Sclerosis Spinal Cord
Detected Using Gridded Cdna Arrays. J. Neurochem. 77, 132-145. Mayatepek, E. and Kohlmüller, D. (1998) Transient Trimethylaminuria in
Childhood. Acta Paediatr. 87, 1205-1207. Mayatepek, E.; Flock, B. and Zschocke, J. (2004) Benzydamine Metabolism
in vivo is Impaired in Patients with Deficiency of Flavin-Containing Monooxygenase 3. Pharmacogenetics 14, 775-777.
Mazon Ramos, A.; Gil-Setas, A.; Berrade Zubiri, S.; Bandres Echeverri, T.; Wevers, R.; Engelke, U. and Zschocke, J. (2003) Primary Trimeth-
ylaminuria or Fish Odor Syndrome. A Novel Mutation in the First Documented Case in Spain. Med. Clin. (Barc.) 120, 219-221.
McCombie, R. R.; Dolphin, C. T.; Povey, S.; Phillips, I. R. and Shephard, E. A. (1996) Localization of Human Flavin-Containing Monooxy-
genase Genes FMO2 and FMO5 to Chromosome 1q. Genomics 34, 426-429.
Miller, M. M.; James, R. A.; Richer, J. K.; Gordon, D. F.; Wood, W. M. and Horwitz, K. B. (1997) Progesterone Regulated Expression of Fla-
vin-Containing Monooxygenase 5 by the B-Isoform of Progester-
one Receptors: Implications for Tamoxifen Carcinogenicity. J.
Clin. Endocrinol. Metab. 82, 2956-2961. Mitchell, S. C. and Smith, R. L. (2001) Trimethylaminuria: The Fish Malo-
dor Syndrome. Drug Metab. Dispos. 29, 517-521. Mitchell, S. C.; Zhang, A. Q.; Barrett, T.; Ayesh, R. and Smith, R. L. (1997)
Studies on the Discontinuous N-Oxidation of Trimethylamine among Jordanian, Ecuadorian and New Guinean Populations.
Pharmacogenetics 7, 45-50. Moore, L. B.; Goodwin, B.; Jones, S. A.; Wisely, G. B.; Serabjit-Singh, C.
J.; Willson, T. M.; Collins, J. L. and Kliewer, S. A. (2000) St. John's Wort Induces Hepatic Drug Metabolism through Activation
of the Pregnane X Receptor. Proc. Natl. Acad. Sci. USA 97, 7500-7502.
Murphy, H. C.; Dolphin, C. T.; Janmohamed, A.; Holmes, H. C.; Michelakakis, H.; Shephard, E. A.; Chalmers, R. A.; Phillips, I. R.
and Iles, R. A. (2000) A Novel Mutation in the Flavin-Containing Monooxygenase 3 Gene, FMO3, That Causes Fish-Odour Syn-
drome: Activity of the Mutant Enzyme Assessed by Proton NMR Spectroscopy. Pharmacogenetics 10, 439-451.
Mushiroda, T.; Douya, R.; Takahara, E. and Nagata, O. (2000) The In-volvement of Flavin-Containing Monooxygenase but not CYP3A4
in Metabolism of Itopride Hydrochloride, a Gastroprokinetic Agent: Comparison with Cisapride and Mosapride Citrate. Drug
Metab. Dispos. 28, 1231-1237. Nikbakht, K. N.; Lawton, M. P. and Philpot, R. M. (1992) Guinea Pig or
Rabbit Lung Flavin-Containing Monooxygenases with Distinct Mobilities in SDS-PAGE Are Allelic Variants That Differ at Only
Two Positions. Pharmacogenetics 2, 207-216. Ohmi, N.; Yoshida, H.; Endo, H.; Hasegawa, M.; Akimoto, M. and Higuchi,
S. (2003) S-Oxidation of S-Methyl-Esonarimod by Flavin-Containing Monooxygenases in Human Liver Microsomes. Xeno-
biotica 33, 1221-1231. Ohmiya, Y. and Mehendale, H. M. (1982) Metabolism of Chlorpromazine
by Pulmonary Microsomal Enzymes in the Rat and Rabbit. Bio-chem. Pharmacol. 31, 157-162.
Overby, L. H.; Buckpitt, A. R.; Lawton, M. P.; Atta-Asafo-Adjei, E.; Schulze, J. and Philpot, R. M. (1995) Characterization of Flavin-
Containing Monooxygenase 5 (FMO5) Cloned from Human and Guinea Pig: Evidence That the Unique Catalytic Properties of
FMO5 Are Not Confined to the Rabbit Ortholog. Arch. Biochem. Biophys. 317, 275-284.
Overby, L. H.; Carver, G. C. and Philpot, R. M. (1997) Quantitation and Kinetic Properties of Hepatic Microsomal and Recombinant Fla-
vin-Containing Monooxygenases 3 and 5 from Humans. Chem. Biol. Interact. 106, 29-45.
Park, C. S.; Chung, W. G.; Kang, J. H.; Roh, H. K.; Lee, K. H. and Cha, Y. N. (1999) Phenotyping of Flavin-Containing Monooxygenase Us-
ing Caffeine Metabolism and Genotyping of FMO3 Gene in a Ko-rean Population. Pharmacogenetics 9, 155-164.
Park, C. S.; Kang, J. H.; Chung, W. G.; Yi, H. G.; Pie, J. E.; Park, D. K.; Hines, R. N.; McCarver, D. G. and Cha, Y. N. (2002) Ethnic Dif-
ferences in Allelic Frequency of Two Flavin-Containing Monooxygenase 3 (FMO3) Polymorphisms: Linkage and Effects
on in Vivo and in Vitro FMO Activities. Pharmacogenetics 12, 77-80.
Park, S. B.; Jacob, P.; Benowitz, N. L. and Cashman, J. R. (1993) Stereose-lective Metabolism of (S)-(-)-Nicotine in Humans: Formation of
Trans-(S)-(-)-Nicotine N-1'-Oxide. Chem. Res. Toxicol. 6, 880-888. Parte, P. and Kupfer, D. (2005) Oxidation of Tamoxifen by Human Flavin-
Containing Monooxygenase (FMO) 1 and FMO3 to Tamoxifen-N-Oxide and Its Novel Reduction Back to Tamoxifen by Human Cy-
tochromes P450 and Hemoglobin. Drug Metab. Dispos. 33, 1446-1452.
Phillips, I. R. and Shephard, E. A. (2007) Trimethylaminuria. In: GeneRe-views at GeneTests: Medical Genetics Information Resource (data-
base online). Copyright, University of Washington, Seattle. 1997-2007. Available at http://www.genetests.org.
Phillips, I. R.; Dolphin, C. T.; Clair, P.; Hadley, M. R.; Hutt, A. J.; McCom-bie, R. R.; Smith, R. L. and Shephard, E. A. (1995) The Molecular
Biology of the Flavin-Containing Monooxygenases of Man. Chem. Biol. Interact. 96, 17-32.
Pichard-Garcia, L.; Weaver, R. J.; Eckett, N.; Scarfe, G.; Fabre, J. M.; Lu-cas, C. and Maurel, P. (2004) The Olivacine Derivative S 16020 (9-
Hydroxy-5,6-Dimethyl-N-[2-(Dimethylamino)Ethyl)-6h-Pyrido(4, 3-B)-Carbaz Ole-1-Carboxamide) Induces CYP1A and Its Own

312 Current Pharmacogenomics, 2007, Vol. 5, No. 4 Phillips et al.
Metabolism in Human Hepatocytes in Primary Culture. Drug Me-
tab. Dispos. 32, 80-88. Poulsen, L. L.; Taylor, K.; Williams, D. E.; Masters, B. S. and Ziegler, D.
M. (1986) Substrate Specificity of the Rabbit Lung Flavin-Containing Monooxygenase for Amines: Oxidation Products of
Primary Alkylamines. Mol. Pharmacol. 30, 680-685. Preti, G.; Ubriani, R.; Kim, J.; Lawley, H.; Tjoa, S.; Fennessey, P. and Fak-
harzadeh, S. (2002) Identification of a Novel R223Q Missense Mu-tation in the Flavin-Containing Monooxygenase 3 Gene in
Trimethylaminuria. J. Invest. Dermatol. 119, 218. Prough, R. A.; Freeman, P. C. and Hines, R. N. (1981) The Oxidation of
Hydrazine Derivatives Catalyzed by the Purified Microsomal FAD-Containing Monooxygenase. J. Biol. Chem., 256, 4178-4184.
Qian, L. and Ortiz de Montellano, P. R. (2006) Oxidative Activation of Thiacetazone by the Mycobacterium Tuberculosis Flavin
Monooxygenase EtaA and Human FMO1 and FMO3. Chem. Res. Toxicol. 19, 443-449.
Rae, J. M.; Johnson, M. D.; Lippman, M. E. and Flockhart, D. A. (2001) Rifampin Is a Selective, Pleiotropic Inducer of Drug Metabolism
Genes in Human Hepatocytes: Studies with cDNA and Oligonu-cleotide Expression Arrays. J. Pharmacol. Exp. Ther. 299, 849-
857. Reid, J. M.; Walker, D. L.; Miller, J. K.; Benson, L. M.; Tomlinson, A. J.;
Naylor, S.; Blajeski, A. L.; LoRusso, P. M. and Ames, M. M. (2004) The Metabolism of Pyrazoloacridine (NSC 366140) by Cy-
tochromes P450 and Flavin Monooxygenase in Human Liver Mi-crosomes. Clin. Cancer Res. 10, 1471-1480.
Rettie, A. E.; Lawton, M. P.; Sadeque, A. J.; Meier, G. P. and Philpot, R. M. (1994) Prochiral Sulfoxidation as a Probe for Multiple Forms of the
Microsomal Flavin-Containing Monooxygenase: Studies with Rab-bit FMO1, FMO2, FMO3, and FMO5 Expressed in Escherichia
coli. Arch. Biochem. Biophys. 311, 369-377. Ring, B. J.; Wrighton, S. A.; Aldridge, S. L.; Hansen, K.; Haehner, B. and
Shipley, L. A. (1999) Flavin-Containing Monooxygenase-Mediated N-Oxidation of the M(1)-Muscarinic Agonist Xanomeline. Drug
Metab. Dispos. 27, 1099-1103. Ripp, S. L.; Itagaki, K.; Philpot, R. M. and Elfarra, A. A. (1999) Methionine
S-oxidation in Human and Rabbit Liver Microsomes: Evidence for a High-affinity Methionine S-Oxidase Activity that is Distinct from
Flavin-containing Monooxygenase 3. Arch. Biochem. Biophys. 367, 322-332.
Rodriguez, R. J. and Miranda, C. L. (2000) Isoform Specificity of N-Deacetyl Ketoconazole by Human and Rabbit Flavin-Containing
Monooxygenases. Drug Metab. Dispos. 28, 1083-1086. Ruse, M. J. and Waring, R. H. (1991a) The Effect of Methimazole on
Thioamide Bioactivation and Toxicity. Toxicol. Lett. 58, 37-41. Ruse, M. J. and Waring, R. H. (1991b) The S-oxidation of Thioamides in
Rat Liver Microsomes. Biochem. Soc. Trans. 19, 233S. Sachse, C.; Ruschen, S.; Dettling, M.; Schley, J.; Bauer, S.; Muller-
Oerlinghausen, B.; Roots, I. and Brockmoller, J. (1999) Flavin Monooxygenase 3 (FMO3) Polymorphism in a White Population:
Allele Frequencies, Mutation Linkage, and Functional Effects on Clozapine and Caffeine Metabolism. Clin. Pharmacol. Ther. 66,
431-438. Shephard, E. A.; Dolphin, C. T.; Fox, M. F.; Povey, S.; Smith, R. and Phil-
lips, I. R. (1993) Localization of Genes Encoding Three Distinct Flavin-Containing Monooxygenases to Human Chromosome 1q.
Genomics 16, 85-89. Shephard, E. A.; Chandan, P.; Stevanovic-Walker, M.; Edwards, M. and
Phillips, I. R. (2007) Alternative Promoters and Repetitive DNA Elements Define the Species-dependent Tissue-specific Expression
of the FMO1 Genes of Human and Mouse. Biochem. J. 406, 491-499.
Shibutani, S.; Suzuki, N.; Laxmi, Y. R.; Schild, L. J.; Divi, R. L.; Grollman, A. P. and Poirier, M. C. (2003) Identification of Tamoxifen-DNA
Adducts in Monkeys Treated with Tamoxifen. Cancer Res. 63, 4402-4406.
Shimada, T.; Yamazaki, H.; Mimura, M.; Inui, Y. and Guengerich, F. P. (1994) Interindividual Variations in Human Liver Cytochrome P-
450 Enzymes Involved in the Oxidation of Drugs, Carcinogens and Toxic Chemicals: Studies with Liver Microsomes of 30 Japanese
and 30 Caucasians. J. Pharmacol. Exp. Ther. 270, 414-423. Shimizu, M.; Fujita, H.; Aoyama, T. and Yamazaki, H. (2006) Three Novel
Single Nucleotide Polymorphisms of the FMO3 Gene in a Japanese Population. Drug Metab. Pharmacokinet. 21, 245-247.
Shimizu, M.; Cashman, J. R. and Yamazaki, H. (2007a) Transient Trimethy-
laminuria Related to Menstruation. BMC Med. Genet. 8, 2. Shimizu, M.; Yano, H.; Nagashima, S.; Murayama, N.; Zhang, J.; Cashman,
J. R. and Yamazaki, H. (2007b) Effect of Genetic Variants of the Human Flavin-Containing Monooxygenase 3 on N- and S-
Oxygenation Activities. Drug Metab. Dispos. 35, 328-330. Shimizu, M.; Tomioka, S.; Murayama, N. and Yamazaki, H. (2007c) Mis-
sense and Nonsense Mutations of the Flavin-Containing Monooxy-genase 3 Gene in a Japanese Cohort. Drug Metab. Pharmacokinet.
22, 61-64. Smyser, B. P. and Hodgson, E. (1985) Metabolism of Phosphorous-
Containing Compounds by Pig Liver Microsomal FAD-Containing Monooxgenase. Biochem. Pharmacol. 34, 1145-1150.
Stevens, J. C.; Melton, R. J.; Zaya, M. J. and Engel, L. C. (2003) Expression and Characterization of Functional Dog Flavin-Containing
Monooxygenase 1. Mol. Pharmacol. 63, 271-275. Stormer, E.; Roots, I. and Brockmoller, J. (2000) Benzydamine N-Oxidation
as an Index Reaction Reflecting FMO Activity in Human Liver Microsomes and Impact of FMO3 Polymorphisms on Enzyme Ac-
tivity [in Process Citation]. Br. J. Clin. Pharmacol. 50, 553-561. Szoko, E.; Tabi, T.; Borbas, T.; Dalmadi, B.; Tihanyi, K. and Magyar, K.
(2004) Assessment of the N-Oxidation of Deprenyl, Metham-phetamine, and Amphetamine Enantiomers by Chiral Capillary
Electrophoresis: An in Vitro Metabolism Study. Electrophoresis 25, 2866-2875.
Takamura, T.; Sakurai, M.; Ota, T.; Ando, H.; Honda, M. and Kaneko, S. (2004) Genes for Systemic Vascular Complications Are Differen-
tially Expressed in the Livers of Type 2 Diabetic Patients. Diabe-tologia 47, 638-647.
Teresa, E.; Lonardo, F.; Fiumara, A.; Lombardi, C.; Russo, P.; Zuppi, C.; Scarano, G.; Musumeci, S. and Gianfrancesco, F. (2006) A Spec-
trum of Molecular Variation in a Cohort of Italian Families with Trimethylaminuria: Identification of Three Novel Mutations of the
FMO3 Gene. Mol. Genet. Metab. 88, 192-195. Tijet, N.; Boutros, P. C.; Moffat, I. D.; Okey, A. B.; Tuomisto, J. and Poh-
janvirta, R. (2006) Aryl Hydrocarbon Receptor Regulates Distinct Dioxin-Dependent and Dioxin-Independent Gene Batteries. Mol.
Pharmacol. 69, 140-153. Treacy, E. P.; Akerman, B. R.; Chow, L. M. L.; Youil, R.; Bibeau, C.; Lin,
J.; Bruce, A. G.; Knight, M.; Danks, D. M.; Cashman, J. R. and Forrest, S. M. (1998) Mutations of the Flavin-Containing
Monooxygenase Gene (FMO3) Cause Trimethylaminuria, a Defect in Detoxication. Hum. Mol. Genet. 7, 839-845.
Tugnait, M.; Hawes, E. M.; McKay, G.; Rettie, A. E.; Haining, R. L. and Midha, K. K. (1997) N-Oxygenation of Clozapine by Flavin-
Containing Monooxygenase. Drug Metab. Dispos. 25, 524-527. Tynes, R. E.; Sabourin, P. J.; Hodgson, E. and Philpot, R. M. (1986) Forma-
tion of Hydrogen Peroxide and N-Hydroxylated Amines Catalyzed by Pulmonary Flavin-Containing Monooxygenases in the Presence
of Primary Alkylamines. Arch. Biochem. Biophys. 251, 654-664. Washio, T.; Kohsaka, K.; Arisawa, H. and Masunaga, H. (2003) Pharma-
cokinetics and Metabolism of the Novel Muscarinic Receptor Ago-nist Sni-2011 in Rats and Dogs. Arzneimittelforschung 53, 26-33.
Whetstine, J. R.; Yueh, M.; McCarver, D. G.; Williams, D. E.; Park, C.; Kang, J. H.; Cha, Y.; Dolphin, C. T.; Shephard, E. A.; Phillips, I.
R. and Hines, R. N. (2000) Ethnic Differences in Human Flavin-Containing Monooxygenase 2 (FMO2) Polymorphisms: Detection
of Expressed Protein in African-Americans. Toxicol. Appl. Phar-macol. 168, 216-224.
Wierenga, R. K.; De Maeyer, M. C. H. and Hol, W. G. J. (1985) Interactions of Pyrophospate Moieties with -Helixes in Dinucleotide Binding
Proteins. Biochemistry 24, 1346-1357. Williams, D. E.; Ziegler, D. M.; Nordin, D. J.; Hale, S. E. and Masters, B. S.
(1984) Rabbit Lung Flavin-Containing Monooxygenase Is Immu-nochemically and Catalytically Distinct from the Liver Enzyme.
Biochem. Biophys. Res. Commun. 125, 116-122. Yamazaki, H.; Fujieda, M.; Togashi, M.; Saito, T.; Preti, G.; Cashman, J. R.
and Kamataki, T. (2004) Effects of the Dietary Supplements, Acti-vated Charcoal and Copper Chlorophyllin, on Urinary Excretion of
Trimethylamine in Japanese Trimethylaminuria Patients. Life Sci. 74, 2739-2747.
Yamazaki, H.; Fujita, H.; Gunji, T.; Zhang, J.; Kamataki, T.; Cashman, J. R. and Shimizu, M. (2007) Stop Codon Mutations in the Flavin-
Containing Monooxygenase 3 (FMO3) Gene Responsible for

The Flavin-Containing Monoooxygenases (FMOs) Current Pharmacogenomics, 2007, Vol. 5, No. 4 313
Trimethylaminuria in a Japanese Population. Mol. Genet. Metab.
90, 58-63. Yeung, C. K.; Lang, D. H.; Thummel, K. E. and Rettie, A. E. (2000) Immu-
noquantitation of FMO1 in Human Liver, Kidney, and Intestine. Drug Metab. Dispos. 28, 1107-1111.
Yueh, M. F.; Krueger, S. K. and Williams, D. E. (1997) Pulmonary Flavin-Containing Monooxygenase (FMO) in Rhesus Macaque: Expres-
sion of FMO2 Protein, mRNA and Analysis of the cDNA. Biochim. Biophys. Acta 1350, 267-271.
Zhang, A. Q.; Mitchell, S. C. and Smith, R. L. (1996) Exacerbation of Symptoms of Fish-Odour Syndrome During Menstruation. Lancet
348, 1740-1741. Zhang, J. and Cashman, J. R. (2006) Quantitative Analysis of FMO Gene
mRNA Levels in Human Tissues. Drug Metab. Dispos. 34, 19-26. Zhang, J.; Tran, Q.; Lattard, V. and Cashman, J. R. (2003) Deleterious Mu-
tations in the Flavin-Containing Monooxygenase 3 (FMO3) Gene Causing Trimethylaminuria. Pharmacogenetics 13, 495-500.
Ziegler, D. M. (1980) Microsomal Flavin-Containing Monooxygenase: Oxygenation of Nucleophilic Nitrogen and Sulfur Compounds. In
Enzymatic Basis of Detoxication; Jakoby, W. B., Ed.; Academic Press: New York, pp. 201-277.
Ziegler, D. M. (1991) The 1990 Bernard B. Brodie Award Lecture. Unique
Properties of the Enzymes of Detoxication. Drug Metab. Dispos. 19, 847-852.
Ziegler, D. M. (1993) Recent Studies on the Structure and Function of Mul-tisubstrate Flavin-Containing Monooxygenases. Annu. Rev. Phar-
macol. Toxicol. 33, 179-199. Ziegler, D. M.; Poulsen, L. L. and McKee, E. M. (1971) Interaction of Pri-
mary Amines with a Mixed-Function Amine Oxidase Isolated from Pig Liver Microsomes. Xenobiotica 1, 523-531.
Ziegler, D. M.; Graf, P.; Poulsen, L. L.; Stahl, W. and Sies, H. (1992) Nadph-Dependent Oxidation of Reduced Ebselen, 2-Selenylben-
zanilide, and of 2-(Methylseleno)Benzanilide Catalyzed by Pig Liver Flavin-Containing Monooxygenase. Chem. Res. Toxicol. 5,
163-166. Ziegler-Skylakakis, K.; Nill, S.; Pan, J. F. and Andrae, U. (1998) S-
Oxygenation of Thiourea Results in the Formation of Genotoxic Products. Environ. Mol. Mutagen 31, 362-373.
Zschocke, J.; Kohlmueller, D.; Quak, E.; Meissner, T.; Hoffmann, G. F. and Mayatepek, E. (1999) Mild Trimethylaminuria Caused by Common
Variants in FMO3 Gene. Lancet 354, 834-835.