Multi-element atmospheric deposition study in Croatia
17
This article was downloaded by: [Universitetbiblioteket I Trondheim NTNU] On: 27 July 2012, At: 01:10 Publisher: Taylor & Francis Informa Ltd Registered in England and Wales Registered Number: 1072954 Registered office: Mortimer House, 37-41 Mortimer Street, London W1T 3JH, UK International Journal of Environmental Analytical Chemistry Publication details, including instructions for authors and subscription information: http://www.tandfonline.com/loi/geac20 Multi-element atmospheric deposition study in Croatia Zdravko Špirić a , Marina Frontasyeva b , Eiliv Steinnes c & Trajce Stafilov d a OIKON – Institute for Applied Ecology, Avenija Dubrovnik 6-8, 10 020 Zagreb, Croatia b Frank Laboratory of Neutron Physics, Joint Institute for Nuclear Research, str. Joliot-Curie 6, 141980 Dubna, Moscow Region, Russian Federation c Department of Chemistry, Norwegian University of Science and Technology, NO-7491 Trondheim, Norway d Faculty of Natural Sciences and Mathematics, Institute of Chemistry, Sts. Cyril and Methodius University, POB 162, 1000 Skopje, Macedonia Version of record first published: 11 Nov 2011 To cite this article: Zdravko Špirić, Marina Frontasyeva, Eiliv Steinnes & Trajce Stafilov (2012): Multi-element atmospheric deposition study in Croatia, International Journal of Environmental Analytical Chemistry, 92:10, 1200-1214 To link to this article: http://dx.doi.org/10.1080/03067319.2011.561336 PLEASE SCROLL DOWN FOR ARTICLE Full terms and conditions of use: http://www.tandfonline.com/page/terms-and- conditions This article may be used for research, teaching, and private study purposes. Any substantial or systematic reproduction, redistribution, reselling, loan, sub-licensing, systematic supply, or distribution in any form to anyone is expressly forbidden. The publisher does not give any warranty express or implied or make any representation that the contents will be complete or accurate or up to date. The accuracy of any instructions, formulae, and drug doses should be independently verified with primary sources. The publisher shall not be liable for any loss, actions, claims, proceedings,
-
Upload
facultynaturalsciencesmathematics -
Category
Documents
-
view
0 -
download
0
Transcript of Multi-element atmospheric deposition study in Croatia

This article was downloaded by: [Universitetbiblioteket I Trondheim NTNU]On: 27 July 2012, At: 01:10Publisher: Taylor & FrancisInforma Ltd Registered in England and Wales Registered Number: 1072954 Registeredoffice: Mortimer House, 37-41 Mortimer Street, London W1T 3JH, UK
International Journal of EnvironmentalAnalytical ChemistryPublication details, including instructions for authors andsubscription information:http://www.tandfonline.com/loi/geac20
Multi-element atmospheric depositionstudy in CroatiaZdravko Špirić a , Marina Frontasyeva b , Eiliv Steinnes c & Trajce
Stafilov da OIKON – Institute for Applied Ecology, Avenija Dubrovnik 6-8, 10020 Zagreb, Croatiab Frank Laboratory of Neutron Physics, Joint Institute for NuclearResearch, str. Joliot-Curie 6, 141980 Dubna, Moscow Region,Russian Federationc Department of Chemistry, Norwegian University of Science andTechnology, NO-7491 Trondheim, Norwayd Faculty of Natural Sciences and Mathematics, Institute ofChemistry, Sts. Cyril and Methodius University, POB 162, 1000Skopje, Macedonia
Version of record first published: 11 Nov 2011
To cite this article: Zdravko Špirić, Marina Frontasyeva, Eiliv Steinnes & Trajce Stafilov (2012):Multi-element atmospheric deposition study in Croatia, International Journal of EnvironmentalAnalytical Chemistry, 92:10, 1200-1214
To link to this article: http://dx.doi.org/10.1080/03067319.2011.561336
PLEASE SCROLL DOWN FOR ARTICLE
Full terms and conditions of use: http://www.tandfonline.com/page/terms-and-conditions
This article may be used for research, teaching, and private study purposes. Anysubstantial or systematic reproduction, redistribution, reselling, loan, sub-licensing,systematic supply, or distribution in any form to anyone is expressly forbidden.
The publisher does not give any warranty express or implied or make any representationthat the contents will be complete or accurate or up to date. The accuracy of anyinstructions, formulae, and drug doses should be independently verified with primarysources. The publisher shall not be liable for any loss, actions, claims, proceedings,

demand, or costs or damages whatsoever or howsoever caused arising directly orindirectly in connection with or arising out of the use of this material.
Dow
nloa
ded
by [
Uni
vers
itetb
iblio
teke
t I T
rond
heim
NT
NU
] at
01:
10 2
7 Ju
ly 2
012

Intern. J. Environ. Anal. Chem.Vol. 92, No. 10, 20 August 2012, 1200–1214
Multi-element atmospheric deposition study in Croatia
Zdravko Spirica*, Marina Frontasyevab, Eiliv Steinnesc and Trajce Stafilovd
aOIKON – Institute for Applied Ecology, Avenija Dubrovnik 6-8, 10 020 Zagreb, Croatia;bFrank Laboratory of Neutron Physics, Joint Institute for Nuclear Research, str. Joliot-Curie 6,141980 Dubna, Moscow Region, Russian Federation; cDepartment of Chemistry, NorwegianUniversity of Science and Technology, NO-7491 Trondheim, Norway; dFaculty of NaturalSciences and Mathematics, Institute of Chemistry, Sts. Cyril and Methodius University,
POB 162, 1000 Skopje, Macedonia
(Received 20 July 2010; final version received 3 January 2011)
For the first time the moss biomonitoring technique and two complementaryanalytical techniques � neutron activation analyses (NAA) and atomic absorp-tion spectrometry (AAS) � were applied to study multi-element atmosphericdeposition in the Republic of Croatia. Moss samples were collected during thesummer of 2006 from 98 sites evenly distributed over the country. Samplingwas performed in accordance with the LRTAP Convention - ICP Vegetationprotocol and sampling strategy of the European Programme on Biomonitoringof Heavy Metal Atmospheric Deposition. Conventional and epithermal NAAand AAS made it possible to determine concentrations of 41 elements includingkey toxic metals such as Pb, Cd, Hg, and Cu. Factor analysis (Principalcomponent analysis with varimax rotation) was applied to distinguish elementsmainly of anthropogenic origin from those predominantly originating fromnatural sources. Geographical distribution maps of the elements over the sampledterritory were constructed using GIS technology. For the elements included in theEuropean programme, the median values for Croatia were generally aroundthe average median values observed in Europe. The Adriatic coastline of Croatiamay be considered as an environmentally pristine area. This study was conductedin order to provide a reliable assessment of air quality throughout Croatia andto produce information needed for better identification of pollution sources andimproving the potential for assessing environmental and health risks in Croatiaassociated with toxic metals.
Keywords: moss biomonitoring; atmospheric deposition; trace elements; neutronactivation analysis; atomic absorption spectrometry; GIS technology; principalcomponent analysis; Croatia
1. Introduction
Air pollution is still a problem in most countries, not only because of environmentaldamage but also because it affects human health and represents a key economic problem.In the European Union the air quality strategy is based on physico-chemical measurementsof ambient pollution concentrations and complementary modelling techniques asregulated by the Air Quality Framework Directive [1,2] in order to establish air qualitystandards (limit and target values, respectively) for the major groups of air pollutants, and
*Corresponding author. Email: [email protected]
ISSN 0306–7319 print/ISSN 1029–0397 online
� 2012 Taylor & Francis
http://dx.doi.org/10.1080/03067319.2011.561336
http://www.tandfonline.com
Dow
nloa
ded
by [
Uni
vers
itetb
iblio
teke
t I T
rond
heim
NT
NU
] at
01:
10 2
7 Ju
ly 2
012

measurement programmes to monitor pollutant concentrations in the air. A daughterdirective relating to arsenic, cadmium, mercury, nickel and polycyclic aromatichydrocarbons in ambient air [3] recommends that, in addition to mandatory measurementsof atmospheric pollutant concentrations, ‘‘the use of bioindicators may be consideredwhere regional patterns of the impact on ecosystems are to be assessed’’. In fact, theregular use of epiphytic/epigeic plants (mainly mosses and lichens), so-called biomonitors,is already a well-established method for monitoring of atmospheric deposition of metalsin Europe [4–8] not only scientifically, but also politically and economically.
Terrestrial mosses have several advantages as biomonitors when compared to higherplants: (a) they lack a developed root system; (b) variability of morphology throughthe growing season is small; (c) they have a high surface-to-volume ratio, and (d) a highcation exchange capacity [9]. The bryophytes are evergreen and perennial plants, so itis easy to collect them at different times of the year and over large territories [10]. It isassumed that mosses to a great extent absorb nutrients directly from the atmosphere.Procedures of sampling and chemical analysis of bryophytes are rather simple compared tothe collection and analysis of precipitation samples, and comparisons have shown thatconcentrations of metals in moss in most cases reflect adequately the atmosphericdeposition during the growth period of the moss [11]. Detailed statistical analyseshave shown that cadmium and lead concentrations in mosses are primarily correlatedwith modelled atmospheric deposition across Europe [12]. However, correlations were lessstrong for mercury.
The first European moss survey was in 1990 [13]. Croatia joined the fourth Europeanmoss survey in 2005/2006 [14]. The purpose of this paper is a presentation and discussionof the results obtained for mosses collected in Croatia in 2006. To the knowledge of theauthors this is the first application in Croatia of biomonitoring atmospheric depositionof metals, except for a local study of mercury and some other elements from the petroleumindustry undertaken in 1996–2004 using lichens [15,16].
2. Experimental
2.1 Selection of moss species
Previous large-scale projects in northern and central Europe have successfully used themosses Hylocomium splendens, Pleurozium schreberi, Hypnum cupressiforme andPseudoscleropodium purum as recommended species [5,10]. All these species have similarphysiognomy, as they grow in dense mats able to produce a high rate of bioaccumulation.However, since the above species are not widespread in arid areas of southern countriesof Europe, it was necessary to find additional corresponding alternative moss species formonitoring studies in Croatia. Also, naturally growing moss is rarely present in urbanareas, and sometimes it is very difficult to find and sample sufficient quantity of mossmaterial for analysis, and one of the criteria for a choice of suitable biomonitor is thespecies abundance. The moss species Hylocomium splendens, Hypnum cupressiforme,Brachythecium rutabulum and Homalothecium sericeum were found suitable for assessingatmospheric deposition of key metals and other elements in Croatia. This combination ofspecies had already been used for biomonitoring purposes in some European countries[17–19] where other recommended species were not available. Interspecies calibration hadshown that Brachythecium rutabulum and Homalothecium sericeum could be used alongwith Hylocomium splendens, Pleurozium schreberi, and Hypnum cupressiforme.
International Journal of Environmental Analytical Chemistry 1201
Dow
nloa
ded
by [
Uni
vers
itetb
iblio
teke
t I T
rond
heim
NT
NU
] at
01:
10 2
7 Ju
ly 2
012

2.2 Sampling
Sampling was carried out according to the guidelines of the UNECE ICP Vegetation [20]using a 23� 23 km moss sampling network. The resulting 94 sampling sites were evenlydistributed over the territory of Croatia (Figure 1). Sampling was carried out during theperiod July–August 2006.
Samples were collected at least 300m from main roads; at least 100m from local roadsand at least 200m from villages, in forest glades or on open heath to reduce through-falleffects from the forest canopy. In order to make the moss samples representative for a site,each sample was composed of five to ten subsamples collected within an area of 50� 50m.Collected material was stored in paper bags. A separate set of disposable polyethylenegloves was used for collection of each sample. All collected moss samples were preliminarycleaned from extraneous material and transferred to the analytical laboratories.
2.3 Analysis
NAA. The neutron activation analysis (NAA) was performed at the pulsed fast reactorIBR-2 at the Frank Laboratory of Neutron Physics, Dubna, Russia. In the laboratorythe samples were air-dried to constant weight at 30–40�C for 48 h. Green-yellow mossshoots representing the 2–3 years’ growth were subjected to analysis, corresponding
Figure 1. Sampling sites.
1202 Z. Spiric et al.
Dow
nloa
ded
by [
Uni
vers
itetb
iblio
teke
t I T
rond
heim
NT
NU
] at
01:
10 2
7 Ju
ly 2
012

approximately to the deposition over the last 2–3 years. The samples were not washed andnot homogenised. Previous experience from the use of NAA in moss biomonitoring hadshown that Hylocomium splendens samples of 0.3 gs are sufficiently large to be usedwithout homogenization [21]. The samples were pelletized before irradiation using simplepress-forms. For short irradiation samples of about 0.3 g were heat-sealed in polyethylenebags. For long irradiation samples of the same weight (about 0.3 g) were packed inaluminium cups. Characteristics of neutron flux density in the channels equipped with thepneumatic system are given in Table 1.
To determine short-lived isotopes samples were irradiated for 3min. After irradiationtwo gamma-spectrometric measurements were performed; the first one for 5min after2–3min of decay, and the second one for 20min after 9–10min decay.
Long-lived isotopes were determined after irradiation for 100 h in the cadmium-screened channel 1. After irradiation samples were re-packed into clean containers andmeasured after 4–5 and 20–23 days for 45min and for 3 h, respectively. Gamma spectrawere registered and processed as described elsewhere [22]. The comparator method wasused for calculation of concentrations of all elements except for Ti, which was determinedby the absolute method based on nuclear constants [23].
AAS. The environmentally important element Pb cannot be determined by NAA, andHg, Cd, and Cu are difficult at low concentration levels. These elements were thereforedetermined by atomic absorption spectrometry (AAS). Moss samples (0.5 g) were placedin a Teflon digestion vessels, 5ml concentrated nitric acid and 2ml H2O2 (30%, m/V)was added, and closed vessels were placed in the rotor of the microwave digestionsystem Milestone, Ethos Touch Control. The digestion was carried out with thefollowing digestion program: (1) temperature 180�C, 5min ramp time, 500W and20 bar; (2) temperature 180�C, 5min hold time, 500W and 20 bar. Finally the vessels werecooled, carefully opened, and digests quantitatively transferred to 10ml calibrated flasks.
Pb was determined by Zeeman electrothermal atomic absorption spectrometry(ZETAAS, Varian SpectrAA 640Z), copper and cadmium with flame atomic absorptionspectrometry (FAAS, Thermo Solaar S4) and Hg by cold vapour atomic absorptionspectrometry (CV-AAS) using a continuous flow vapour generation accessory (VGA-76,Varian) connected to an atomic absorption spectrometer (SpectrAA 55B, Varian).
2.4 Quality control
The QC of NAA results was ensured by simultaneous analysis of the examined samplesand reference materials (RM) Lichen 336 IAEA (International Atomic Energy Agency) andNORD DK-1 (moss reference sample prepared for inter-comparison in Scandinavia [24]).The NAA data generally agreed with the certified values within �10% (Table 2). The QCof AAS determinations was performed by standard addition method and it was foundthat the recovery for the investigated elements ranges between 98.5 to 101.2%. Beside the
Table 1. Flux parameters of irradiation positions [36].
Irradiationposition
�th � 1012 n cm�2 s�1
E¼ 0–0.55 eV�epi � 10
12 n cm�2 s�1
E¼ 0.55–105 eV�fast � 10
12 n cm�2 s�1
E¼ 105–25� 106 eV
Ch1 (Cd-screened) 0.023 3.3 4.2Ch2 1.23 2.9 4.1
International Journal of Environmental Analytical Chemistry 1203
Dow
nloa
ded
by [
Uni
vers
itetb
iblio
teke
t I T
rond
heim
NT
NU
] at
01:
10 2
7 Ju
ly 2
012

standard addition method, blank tests parallel to the decomposition of samples and
preparation of sample solutions for analysis were also performed. Possible loss of Hg was
checked by standard additions. The recovery was found to be within the range 95.5–99.5%.
2.5 Statistical analysis
Data were processed by factor analysis (principal component analysis (PCA) with
varimax rotation) using the software package STATISTICA-8 (http://www.statsoft.com/).
Table 2. NAA data and certified values of reference materials, mg kg�1.
ElementDK-1
(Determined)DK-1
(Certified)Lichen-336(Determined)
Lichen-336(Certified)
Na 303� 25 315� 31 304� 26 320� 40Mg 850� 150 910� 91 – –Al 830� 84 810� 81 720� 65 680� 109Cl 328� 35 328� 33 1927� 288 1900� 304K 3350� 165 3300� 297 1910� 90 1840� 202Ca 1604� 180 1630� 40 – –Sc 0.16� 0.02 0.16� 0.02 0.176� 0.014 0.17� 0.20V 4.12� 0.31 3.8� 0.3 1.38� 0.19 1.47� 0.22Cr 1.94� 0.15 1.7� 0.4 1.10� 0.17 1.06� 0.17Mn 143� 10 120� 10 69� 5.1 63� 7Fe 575� 53 550� 50 430� 8.5 430� 51Co 0.26� 0.01 0.23� 0.01 0.303� 0.070 0.29� 0.05Ni 1.58� 0.33 1.8� 0.2 – –Cu 87� 2.5 85� 5 3.7� 0.5 3.6� 0.5Zn 30.8� 4.0 29� 2 28.2� 2.3 30.4� 3.3As 0.64� 0.02 0.64� 0.02 0.54� 0.71 0.63� 0.08Se 0.43� 0.04 0.43� 0.04 0.22� 0.033 0.22� 0.04Br 13.5� 0.94 12.8� 1.0 14.2� 2.3 12.9� 1.6Rb 12.9� 0.86 12.6� 0.9 1.7� 0.17 1.76� 0.22Sr 15.1� 3.0 10� 0.1 11.4� 0.55 9.3� 1.1Zr 11.0� 1.2 11� 1.2 – –Mo 0.21� 0.02 0.2� 0.02 – –Ag 0.05� 0.004 0.05� 0.004 – –Cd 0.3� 0.11 0.3� 0.02 0.13� 0.015 0.117� 0.0006Sb 0.347� 0.02 0.347� 0.02 0.078� 0.01 0.073� 0.0067I 3.8� 0.07 3.8� 0.3 – –Cs 0.285� 0.02 0.30� 0.02 0.12� 0.024 0.110� 0.013Ba 12.5� 0.12 12� 2 6.6� 0.7 6.4� 1.1La 1.22� 0.34 1.22� 0.1 0.70� 0.06 0.66� 0.10Ce 2.92� 0.53 2.92� 0.22 1.3� 0.25 1.28� 0.17Sm 0.231� 0.05 0.231� 0.01 0.106� 0.06 0.106� 0.014Eu 0.042� 0.01 0.042� 0.01 0.021� 0.003 0.023� 0.003Tb 0.0218� 0.01 0.0216� 0.002 0.015� 0.002 0.014� 0.002Hf 0.21� 0.06 0.21� 0.009 – –Ta 0.026� 0.005 0.026� 0.0036 – –W 0.73� 0.11 0.73� 0.21 – –Au 0.00074� 0.0014 0.00074� 0.00004 – –Th 0.16� 0.08 0.15� 0.0011 0.14� 0.01 0.14� 0.02U 0.192� 0.02 0.192� 0.015 – –
1204 Z. Spiric et al.
Dow
nloa
ded
by [
Uni
vers
itetb
iblio
teke
t I T
rond
heim
NT
NU
] at
01:
10 2
7 Ju
ly 2
012

Factor analysis is a multivariate statistical technique commonly used in atmosphericdeposition and other environmental studies to deduce source from data set [25].
From a matrix of correlation or covariance, factor analysis generates a few underlying«factors» that describe group of variables and each factor is generally treated as a source.From the knowledge of the element composition of each factor and values of factorloadings, the major sources may be identified. PCA is a special case of factor analysiswhich transforms the original set of inter-correlated variables into a set of uncorrelatedvariables that are linear combinations of the original variables. The first principalcomponent (PC) is the linear combination of the original variables which explains amaximum of the variability of the entire data set. The second PC is the linear combinationwhich best explains the variability not explained by the first PC. The third PC, fourth PC,etc. are defined similarly [26]. One advantage of principal component analysis for mostlarge environmental datasets is that only a small number of PCs are usually needed torepresent most of the information in data. In our case, 33% of the variability wasexplained by seven components. The minor principal components which explain little ofthe data can be eliminated, thus simplifying the analysis. Because of the normalization,negative values of the component scores and loadings are allowed; they represent valuesless than the mean value. Physical interpretation of components is easiest if a few elementshave large loadings and the loadings of the remaining elements are near zero. The principalcomponents seldom have this form and several transformations of the PCs are in use toimprove their ease of interpretation. The factor loadings and the geographical distributionof the factor scores are given in Figures 2–5.
2.6 Mapping
Multilevel B-spline algorithm for spatial interpolation of scattered data was used. Theprogram GRINVEIW from the geographical information system software packageGIS-INTEGRO with raster and vector graphics was used to generate raster-basedpollution contour maps for the elements of interest for the entire study area. The systemis supplied with interfaces for all international standard GIS: ARC-info, MAP-info, etc.,and is described in detail elsewhere [27].
3. Results and discussion
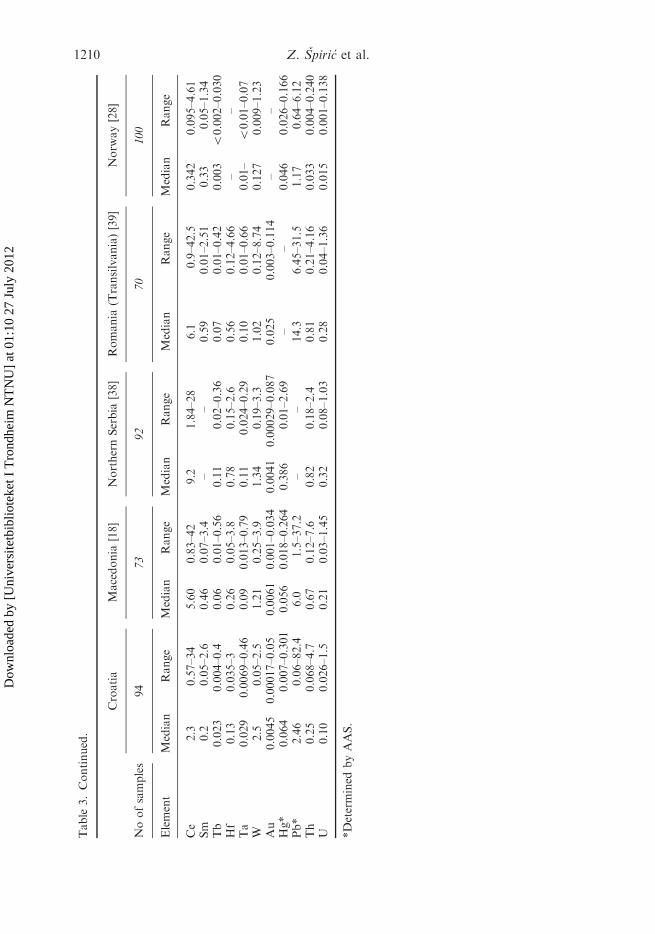
The results of the descriptive statistical analysis of the elemental concentrationsdetermined in the Croatian moss samples (min, max, median) are given in Table 3 andcompared with those of other Balkan countries. For comparison with a pristine area,corresponding values from a selection of Norwegian moss data from 2005 [28],representing territories with minor influence from air pollution, are also shown in thesame table. Considering elements typically associated with air pollution (V, Cr, Ni, Cu, As,Cd, Pb) the present median values are generally somewhat lower than those presentedfrom Macedonia, Romania, and Serbia, but substantially higher than the correspondingnumbers from northern Norway. It should be pointed out however that whereas theCroatian data refer to sampling in 2006 the data from the other Balkan countries are fromthe 2000–2001 moss survey, and the situation in those countries may have changed in themeantime.
International Journal of Environmental Analytical Chemistry 1205
Dow
nloa
ded
by [
Uni
vers
itetb
iblio
teke
t I T
rond
heim
NT
NU
] at
01:
10 2
7 Ju
ly 2
012
Results from the statistical analysis are given in Table 4, where values for six factors,each explaining more than 4% of the variance, are presented. Below is the interpretationof the six factors in the sequence of their significance:
Factor 1 has particularly high values of Na, Mg, Al, Sc, Ti, V, Cr, Fe, Co, Ni, Cs, Ba,Hf, Ta, Th, U, and REE (rare-earth elements). Most of these elements are typical forcrustal material, and probably this component at least partly reflects the contaminationof moss samples with soil particles. However, high values for elements such as V, Cr, Co,and Ni and the fact that the factor scores are highest in/around Zagreb (sites 4, 5, 93B)and Sisak and Kutina (34, 35) indicate that Factor 1 is a general pollution factor.Contributions could be e.g. from fly-ash particles produced by high-temperature processes
Figure 2. The geographical distribution of Cr, Ni, V, and U relevant to Factor 1 built on its factorscores.
1206 Z. Spiric et al.
Dow
nloa
ded
by [
Uni
vers
itetb
iblio
teke
t I T
rond
heim
NT
NU
] at
01:
10 2
7 Ju
ly 2
012
< 0
0 - 0.5
0.5 - 1
1 - 2
2 - 3
> 3
Factorscores
Factor 2
< 0.3
0.3 - 0.5
0.5 - 0.7
0.7 - 1
1 - 2
2 - 3
3 - 4
4 - 5
> 5
As Content[ mg/kg ]
< 20
20 - 30
30 - 40
40 - 50
50 - 70
70 - 100
100 - 150
150 - 200
> 200
Zn Content[ mg/kg ]
Figure 3. The geographical distribution of As, and Zn relevant to Factor 2 built on its factor scores.
< 0
0 - 0.5
0.5 - 1
1 - 2
2 - 3
> 3
Factorscores
Factor 3
< 1
1 - 1.5
1.5 - 2
2 - 2.5
2.5 - 3
3 - 3.5
3.5 - 4
4 - 4.5
> 4.5
Br Content[ mg/kg ]
< 1
1 - 1.5
1.5 - 2
2 - 2.5
2.5 - 3
3 - 3.5
3.5 - 4
4 - 4.5
> 4.5
I Content[ mg/kg ]
Figure 4. The geographical distribution of Br, and I relevant to Factor 3 built on its factor scores.
International Journal of Environmental Analytical Chemistry 1207
Dow
nloa
ded
by [
Uni
vers
itetb
iblio
teke
t I T
rond
heim
NT
NU
] at
01:
10 2
7 Ju
ly 2
012
such as coal burning, which may have a major element composition similar to crustalmaterial, and from burning of heavy fuel oils, where V and Ni are characteristiccomponents. The geographical distribution of Factor 1 is shown in Figure 2, along withdistribution maps of Cr, Ni, and V. The corresponding distribution map of U is alsoshown in the figure as a representative of an element of assumed geogenic origin.
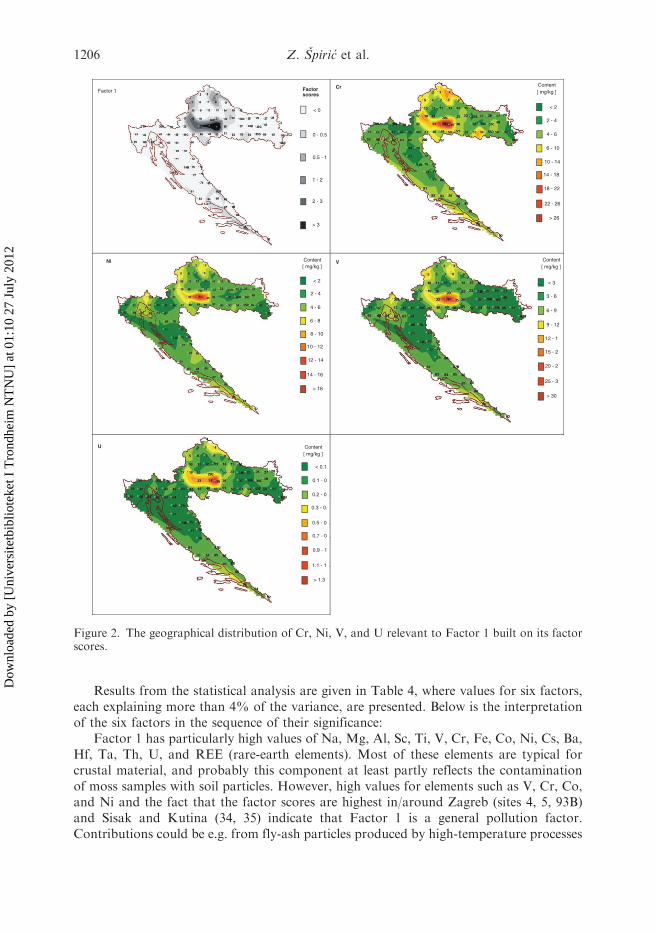
Factor 2, with high factor loadings particularly for Zn, As, and Cd, looks like a typicalpollution component associated with a point source. The geographical distribution ofFactor 2 is shown in Figure 3, along with distribution maps of Zn and As. High factorscores are evident at sites 3 and 4 to the northeast of the town Varazdin, which has steelindustry. However, the fact that the impact of Factor 2 is significantly higher at site 4,which is more distant from Varazdin, focuses the attention on possible transboundarytransport from Hungary. One candidate source is glass industry in the town Nagykanisza,situated about 50 km east of the Croatian border. The fact that site 4 also is high in Pb,a characteristic pollutant from glass industries, supports this hypothesis.
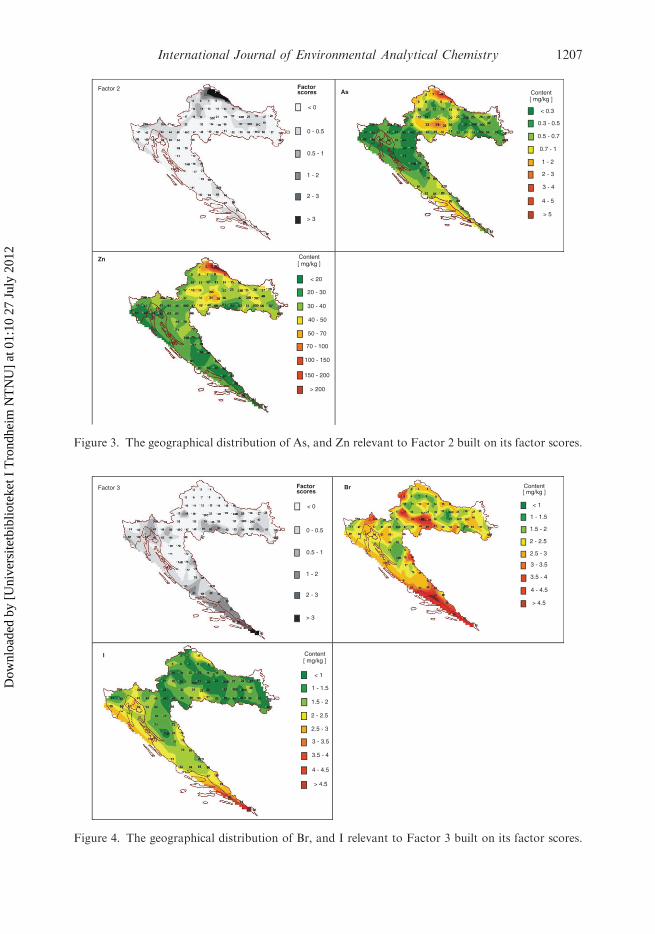
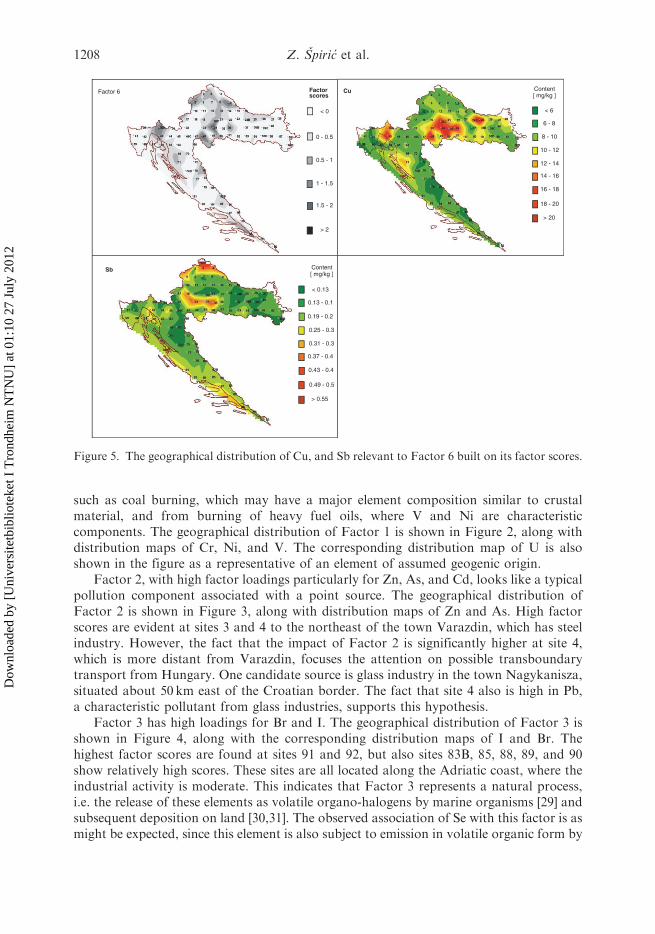
Factor 3 has high loadings for Br and I. The geographical distribution of Factor 3 isshown in Figure 4, along with the corresponding distribution maps of I and Br. Thehighest factor scores are found at sites 91 and 92, but also sites 83B, 85, 88, 89, and 90show relatively high scores. These sites are all located along the Adriatic coast, where theindustrial activity is moderate. This indicates that Factor 3 represents a natural process,i.e. the release of these elements as volatile organo-halogens by marine organisms [29] andsubsequent deposition on land [30,31]. The observed association of Se with this factor is asmight be expected, since this element is also subject to emission in volatile organic form by
< 0
0 - 0.5
0.5 - 1
1 - 1.5
1.5 - 2
> 2
Factorscores
Factor 6
< 6
6 - 8
8 - 10
10 - 12
12 - 14
14 - 16
16 - 18
18 - 20
> 20
Cu Content[ mg/kg ]
< 0.13
0.13 - 0.1
0.19 - 0.2
0.25 - 0.3
0.31 - 0.3
0.37 - 0.4
0.43 - 0.4
0.49 - 0.5
> 0.55
Sb Content[ mg/kg ]
Figure 5. The geographical distribution of Cu, and Sb relevant to Factor 6 built on its factor scores.
1208 Z. Spiric et al.
Dow
nloa
ded
by [
Uni
vers
itetb
iblio
teke
t I T
rond
heim
NT
NU
] at
01:
10 2
7 Ju
ly 2
012

Table
3.Comparisonofthepresentresultswithpublished
data
from
other
BalkancountriesandnorthernNorw
ay,mgkg�1.
Croatia
Macedonia
[18]
NorthernSerbia
[38]
Romania
(Transilvania)[39]
Norw
ay[28]
Noofsamples
94
73
92
70
100
Element
Median
Range
Median
Range
Median
Range
Median
Range
Median
Range
Na
169
67–2332
419
118–8673
694
178–2440
902
192–4330
––
Mg
2120
676–12740
2377
674–7421
2780
1100–8130
2850
480–6840
1730
940–2370
Al
1350
398–21460
3736
825–17600
6800
1280–22090
5545
830–23000
200
67–820
Cl
170
64–2433
149
43–693
256
105–1030
370
160–1300
––
K8085
2565–23720
8615
2861–18190
5090
2710–11750
7770
4770–19980
––
Ca
7623
2832–26740
5593
1207–23640
7720
2890–18120
5770
1250–23500
2820
1680–5490
Sc
0.36
0.10–5
0.81
0.12–6.79
1.31
0.27–4.13
0.94
0.21–6.13
0.052
0.009–0.220
Ti
105
23–1711
163
12–1365
71
11–297
––
23.5
12.4–66.4
V3.1
0.91–32
6.9
1.79–43
11
2.85–39
8.7
1.95–32
0.92
0.39–5.1
Cr
2.8
0.76–33
7.47
2.33–122
6.51
1.14–22
13.8
2.72–51.9
0.55
0.10–4.2
Mn
106
20–1421
186
37–1475
217
30–2340
265
27–1470
256
22–750
Fe
1000
320–12140
2458
424–17380
3110
720–9230
3290
815–21340
209
77–1370
Co
0.45
0.06–5
1.09
0.24–13.6
8.24
1.42–39
1.41
0.32–7.0
0.202
0.065–0.654
Ni
2.7
0.66–18
2.4
0.09–24
6.73
1.96–26
5.4
0.6–32
1.14
0.12–6.6
Cu*
7.5
3.7–22.7
22
3–83
16.9
6.31–3140
21.5
2.21–2420
3.6
2.1–9.2
Zn
29
12–283
39
14–203
44
14–415
135
39–2950
26.5
7.9–173
As
0.37
0.10–6
0.80
0.12–8.0
3.35
0.46–61
2.2
0.59–45.1
0.093
0.020–0.505
Se
0.18
0.014–0.60
0.18
0.013–0.61
0.39
0.046–10
0.36
0.08–5.01
0.33
0.05–1.30
Br
2.5
0.38–5
2.16
0.06–7.7
5.75
1.83–18
8.6
2.03–20.9
4.5
1.4–20.3
Rb
13
2.8–57
10.9
5–47
13
3–47
15.0
5.8–135
7.7
1.3–51.5
Sr
21
4–125
31
11.8–136
22
6.8–95
37.4
1.8–290
15.8
3.6–43.3
Mo
0.16
0.05–1
0.19
0.03–1.12
0.85
0.12–23
0.65
0.13–10
0.135
0.065–0.70
Cd*
0.27
0.07–1.9
0.16
0.016–2.95
50.4
50.4–6.5
––
0.058
0.025–0.171
Sb
0.16
0.04–1.5
0.2
0.039–1.4
0.52
0.13–7
0.88
0.16–51
0.033
0.004–0.240
I1.3
0.29–5
1.18
0.36–2.8
2.09
0.87–4
2.17
0.76–5.55
2.5
0.6–41.7
Cs
0.22
0.07–2.5
0.39
0.097–1.7
0.76
0.11–18.2
0.51
0.12–3.4
0.072
0.016–0.88
Ba
32
7–192
54
14–256
39
13–130
101
20–658
17.1
5.6–50.5
La
1.1
0.29–18
2.32
0.50–22
4.66
1.09–13
2.4
0.4–15.2
0.189
0.045–2.56
(continued
)
International Journal of Environmental Analytical Chemistry 1209
Dow
nloa
ded
by [
Uni
vers
itetb
iblio
teke
t I T
rond
heim
NT
NU
] at
01:
10 2
7 Ju
ly 2
012
Table
3.Continued.
Croatia
Macedonia
[18]
NorthernSerbia
[38]
Romania
(Transilvania)[39]
Norw
ay[28]
Noofsamples
94
73
92
70
100
Element
Median
Range
Median
Range
Median
Range
Median
Range
Median
Range
Ce
2.3
0.57–34
5.60
0.83–42
9.2
1.84–28
6.1
0.9–42.5
0.342
0.095–4.61
Sm
0.2
0.05–2.6
0.46
0.07–3.4
––
0.59
0.01–2.51
0.33
0.05–1.34
Tb
0.023
0.004–0.4
0.06
0.01–0.56
0.11
0.02–0.36
0.07
0.01–0.42
0.003
50.002–0.030
Hf
0.13
0.035–3
0.26
0.05–3.8
0.78
0.15–2.6
0.56
0.12–4.66
––
Ta
0.029
0.0069–0.46
0.09
0.013–0.79
0.11
0.024–0.29
0.10
0.01–0.66
0.01–
50.01–0.07
W2.5
0.05–2.5
1.21
0.25–3.9
1.34
0.19–3.3
1.02
0.12–8.74
0.127
0.009–1.23
Au
0.0045
0.00017–0.05
0.0061
0.001–0.034
0.0041
0.00029–0.087
0.025
0.003–0.114
––
Hg*
0.064
0.007–0.301
0.056
0.018–0.264
0.386
0.01–2.69
––
0.046
0.026–0.166
Pb*
2.46
0.06–82.4
6.0
1.5–37.2
––
14.3
6.45–31.5
1.17
0.64–6.12
Th
0.25
0.068–4.7
0.67
0.12–7.6
0.82
0.18–2.4
0.81
0.21–4.16
0.033
0.004–0.240
U0.10
0.026–1.5
0.21
0.03–1.45
0.32
0.08–1.03
0.28
0.04–1.36
0.015
0.001–0.138
*Determined
byAAS.
1210 Z. Spiric et al.
Dow
nloa
ded
by [
Uni
vers
itetb
iblio
teke
t I T
rond
heim
NT
NU
] at
01:
10 2
7 Ju
ly 2
012

marine organisms [32], and thus present at higher concentrations e.g., in moss [4] andsurface soil [33] near the ocean than farther inland. In the case of Br high loadings alsoat sites inland (5, 18, 34) indicate contribution from anthropogenic sources such as oilindustry.
Factor 4, with high factor loadings for Cl and K, and Factor 5, with high loadingsfor Mn, are probably not pollution-related, but connected to the normal nutrient uptakeof the moss [34].
Table 4. Factor analysis of NAA and AAS data on moss samples from Croatia.
Element Factor 1 Factor 2 Factor 3 Factor 4 Factor 5 Factor 6 Factor 7
Na 0.891 0.178 �0.091 0.272 �0.027 0.076 0.085Mg 0.817 0.253 �0.160 0.321 0.024 0.149 0.106Al 0.954 0.033 0.067 0.037 �0.121 0.113 0.005Cl 0.144 0.251 0.015 0.853 �0.010 �0.018 �0.048K 0.201 0.052 �0.254 0.847 0.116 0.051 0.076Ca 0.151 0.724 0.346 0.094 0.059 �0.072 0.124Sc 0.959 0.053 0.056 0.044 �0.071 0.129 0.011Ti 0.969 0.010 0.038 0.067 �0.037 0.146 0.039V 0.888 0.098 0.155 �0.048 �0.148 0.262 0.015Cr 0.920 0.174 0.144 0.125 0.028 0.100 �0.057Mn 0.291 �0.131 �0.032 0.115 0.835 0.142 �0.001Fe 0.932 0.170 0.118 0.121 0.041 0.120 �0.037Co 0.935 0.142 0.103 0.093 0.132 0.130 �0.048Ni 0.867 0.092 0.176 �0.007 �0.113 0.260 �0.008Cu 0.127 �0.096 0.068 0.319 0.095 0.638 0.211Zn 0.320 0.827 �0.129 0.227 0.057 0.062 0.006As 0.701 0.596 0.069 0.173 �0.117 0.131 �0.054Se �0.011 0.190 0.566 �0.292 0.289 0.310 0.026Br 0.431 0.087 0.734 0.021 0.073 0.123 �0.013Rb 0.338 �0.055 �0.218 0.295 �0.080 0.102 Z0.635
Sr 0.242 0.375 0.031 0.169 0.071 �0.188 0.400
Mo 0.198 0.473 0.116 �0.010 �0.323 0.399 0.051Cd �0.005 0.819 0.039 �0.028 �0.008 0.140 0.035Sb 0.542 0.255 0.147 �0.014 �0.147 0.520 0.079I 0.130 0.168 0.783 �0.251 �0.171 �0.047 �0.116Cs 0.855 0.112 0.113 0.122 �0.103 0.115 �0.111Ba 0.724 0.355 �0.056 0.198 0.317 0.049 0.117La 0.962 0.045 0.122 0.036 0.176 �0.042 0.008Ce 0.969 0.051 0.096 0.045 0.142 �0.050 0.022Sm 0.959 0.111 0.097 0.043 0.096 �0.035 0.051Tb 0.955 0.094 0.092 0.075 0.203 �0.029 0.018Yb 0.944 0.119 0.109 0.093 0.215 �0.034 0.024Hf 0.965 0.021 0.052 0.060 0.126 �0.054 0.029Ta 0.927 0.111 0.035 0.025 0.270 �0.044 0.047W 0.538 0.352 �0.110 0.035 0.551 �0.021 0.108Au 0.252 �0.204 0.590 0.152 �0.418 �0.046 0.067Hg 0.017 0.107 �0.004 �0.095 0.090 0.615 �0.083Pb 0.096 0.065 �0.181 0.115 �0.050 0.177 0.667
Th 0.975 0.090 0.078 0.087 0.074 �0.012 �0.011U 0.963 0.124 0.101 0.084 0.027 �0.028 0.024Expl.Var 19.720 3.424 2.396 2.281 1.916 1.762 1.188Prp.Totl 0.493 0.086 0.060 0.057 0.048 0.044 0.030
International Journal of Environmental Analytical Chemistry 1211
Dow
nloa
ded
by [
Uni
vers
itetb
iblio
teke
t I T
rond
heim
NT
NU
] at
01:
10 2
7 Ju
ly 2
012

Factor 6, with high loadings for Cu, Sb, and Hg, appears like a typical pollution factor.The geographical distribution of Factor 6 is shown in Figure 5, along with distributionmaps of Cu and Sb. The highest factor score is observed at site 93B located in the centreof Zagreb, but moderate to high values are also observed at sites 5, 9, 30A, 34, and 48.Cu and Sb are known to be emitted from automobile traffic [35], and we may ascribeFactor 6 to this source.
Factor 7, with relatively high positive loading for Pb, is strongly dominated by a highPb value at site 21 located east of Zagreb, the reason of which is not known.
Some of the elements of priority in the European moss survey [36] call for specificcomments:
Arsenic in general shows low to moderate values in the moss. The highest value isevident at site 4, and may be attributed to the same source responsible for high valuesof Zn, Cd, and Pb at this site. The geographical distribution of As is shown in Figure 3.
Cadmium follows Factor 2 with highest levels at sites 3 and 4, see above.Chromium follows Factor 1 with the highest values at sites 33, 34, and 35, near Sisak
and Kutina. The geographical distribution of Cr is shown in Figure 2.Copper shows highest values at sites 20, 67, 70, 72, 75, and 92, and is associated with
Factor 6. These sites are scattered and not particularly associated with any known pointsources. This supports the above hypothesis that Factor 6 may be related to automobiletraffic. The geographic distribution of Cu is shown in Figure 5.
Lead shows much higher values at sites 14 and 21 than at any other sites, and formsa separate Factor 7. The explanation of this factor is not clear.
Mercury is generally low (50.2 mg g�1) but is associated with Factor 6, ascribed aboveto petroleum industry and automobile traffic.
Nickel does not show any marked maximum anywhere, but is present at concentrationssignificantly above average at 5–6 sites spread over the country, and may be associatedwith burning of heavy fuel oil for heating and electricity production, or metal industry. Inthe factor analysis this metal is associated with Factor 1, and its distribution map is shownin Figure 2.
Vanadium: The same comments as for Ni apply to this element. The two metals showsufficient co-variation to support the conclusion that combustion of heavy fuel oil is asignificant factor, as also indicated from the distribution of V shown in Figure 2.
Zinc is associated with factor 2, and shows the highest concentrations at site 4,followed by site 3. Elsewhere the level is fairly constant and probably near the naturalbackground in the moss. This supports the assumption made above concerning the mainsource of the Factor 2 elements. The geographical distribution of Zn is shown in Figure 3.
The other elements reported in Table 3 are not of primary relevance with respect toair pollution. However, they are important for factor analysis, contributing to animprovement of the statistics.
4. Conclusion
As evident from the median values in Table 3, Croatia is considerably polluted comparedto many other countries in Europe. The most polluted territories are the cities Zagreb andSisak and the surrounding areas. Still the situation in Croatia with respect to metaldeposition is markedly better than in some of its neighbouring countries, in particularwith relation to the presence of strong point sources. Some parts of the country appearto be relatively pristine with respect to metal deposition. This in particular concerns most
1212 Z. Spiric et al.
Dow
nloa
ded
by [
Uni
vers
itetb
iblio
teke
t I T
rond
heim
NT
NU
] at
01:
10 2
7 Ju
ly 2
012

of the Adriatic coast, which is very important for Croatia as a very popular area fortourism.
Acknowledgements
The authors express their gratitude to V. Kusan, D. Bukovec, L. Barandovski and Z. Mesic forcollaboration and help in collecting of moss samples, V. Enmiteva for analyses and E. Povtoreykofor preparation of GIS maps. This paper is the result of research within the scientific-research project‘‘Bioindication of Air Pollution in Terrestrial Ecosystems’’ – Partnership Program ‘‘Pollution andRadioactivity in the Environment’’, funded by the Ministry of Science, Education and Sports of theRepublic of Croatia through contract No. 273-0222-882-2698. The survey was conducted within thebilateral agreement on scientific cooperation between Joint Institute for Nuclear Research (JINR)from Frank Laboratory of Neutron Physics (FLNP) Dubna and Oikon Ltd. - Institute for AppliedEcology, Zagreb.
References
[1] European Union, Council Directive 96/62/EC of 27 September 1996 on ambient air quality
assessment and management. OJEC, 21.11.1996, L 296/55–63 (1996).[2] European Union, Directive 2008/50/EC of the European Parliament and of the Council
of 21 May 2008 on ambient air quality and cleaner air for Europe. OJEC, 11.06.2008,L152/1-44 (2008).
[3] European Union, Directive 2004/107/EC of the European Parliament and of the Council of15 December 2004 relating to arsenic, cadmium, mercury, nickel and polycyclic aromatic
hydrocarbons in ambient air. OJEC, 26.01.2005, L 23/3-16 (2004).[4] E. Steinnes, J.P. Rambaek, and J.E. Hanssen, Chemosphere 35, 735 (1992).
[5] A. Ruhling, E. Steinnes, T. Berg, Atmospheric Heavy Metal Deposition in northern Europe1995, Nord 1996:37, Nordic Council of Ministers, Copenhagen, (1996) 46 pp.
[6] M.C. Freitas, M.A. Reis, L.C. Alves, H.T. Wolterbeek, Nuclear analytical techniquesin atmospheric trace element studies in Portugal, in Trace Elements/Their Distribution and
Effects in the Environment, edited by B. Markert and K. Friese, pp 187–213 (Elsevier,Amsterdam, Tokyo, New York, 2000).
[7] H.T. Wolterbeek, Environ. Pollut. 120, 11 (2002).[8] H. Harmens, A. Buse, P. Buker, D. Norris, G. Mills, B. Williams, B. Reynolds, T.W. Ashenden,
A. Ruhling, and E. Steinnes, Atmos. Chem. 49, 425 (2004).[9] R. Bargagli, D.H. Brown, and L. Nelli, Environ. Pollut. 89, 169 (1995).[10] A. Ruhling, L. Rasmussen, K. Pilegaard, A. Makinen, and E. Steinnes, Survey of atmospheric
heavy metal deposition in the Nordic countries in 1985 � monitored by moss analyses, NORD
21, 44 (1987).[11] T. Berg and E. Steinnes, Environ. Pollut. 98, 61 (1997).[12] M. Holy, R. Pesch, W. Schroder, H. Harmens, I. Ilyin, R. Alber, Y. Aleksiayenak, O. Blum,
M. Coscun, M. Dam, L. De Temmerman, N. Fedorets, R. Figueira, M. Frolova,
M. Frontasyeva, N. Goltsova, L. Gonzalez Miqueo, K. Grodzinska, Z. Jeran, S. Korzekwa,M. Krmar, E. Kubin, K. Kvietkus, M. Larsen, S. Leblond, S. Liiv, S. Magnusson,
B. Mankovska, R. Mocanu, J. Piispanen, A. Ruhling, J. Santamaria, E. Steinnes, I. Suchara,
L. Thoni, G. Turcsanyi, V. Urumov, H.T. Wolterbeek, L. Yurukova, and H.G. Zechmeister,J. Atmos. Chem. 63, 109 (2010).
[13] A. Ruhling, Atmospheric heavy metal deposition in Europe – estimation based on mossanalysis. NORD 1994:9, Nordic Council of Ministers, Copenhagen, Denmark.
[14] H. Harmens, D.A. Norris, E. Steinnes, E. Kubin, J. Piispanen, R. Alber, Y. Aleksiayenak,O. Blum, M. Coscun, M. Dam, L. De Temmerman, J.A. Fernandez, M. Frolova,
International Journal of Environmental Analytical Chemistry 1213
Dow
nloa
ded
by [
Uni
vers
itetb
iblio
teke
t I T
rond
heim
NT
NU
] at
01:
10 2
7 Ju
ly 2
012

M. Frontasyeva, L. Gonzalez Miqueo, K. Grodzinska, Z. Jeran, S. Korzekwa, M. Krmar,K. Kvietkus, S. Leblond, S. Liiv, S. Magnusson, B. Mankovska, R. Pesch, A. Ruhling,J. Santamaria, W. Schroder, Z. Spiric, I. Suchara, L. Thoni, V. Urumov, L. Yurukova, andH.G. Zechmeister, Environ. Pollut. 158, 3144 (2010).
[15] M. Horvat, Z. Jeran, Z. Spiric, R. Jacimovic, and V. Miklavcic, J. Environ. Monit. 2,139 (2000).
[16] Z. Spiric and N.R. Mashyanov, J. Anal. Chem. 366, 429 (2000).
[17] J. Sucharova and I. Suchara, Chemosphere 57, 1389 (2004).[18] L. Barandovski, M. Cekova, M.V. Frontasyeva, S.S. Pavlov, T. Stafilov, E. Steinnes, and
V. Urumov, Environ. Monit. Assess. 138, 107 (2008).
[19] R. Mocanu and E. Steinnes, Air pollution monitoring in Romania, in Global AtmosphericChange and its Impact on Regional Air Quality, edited by I. Barnes, pp. 43–48 (Kluwer,Dordrecht, Netherlands, 2002).
[20] International Cooperative Programme on Effects of Air Pollution on Natural Vegetationand Crops: Heavy metals in European mosses: 2005/2006 survey, Monitoring manual (2005).http://icpvegetation.ceh.ac.uk/publications.htm
[21] E. Steinnes, J.E. Hanssen, J.P. Rambæk, and N.B. Vogt, Water, Air, Soil Pollut. 74, 121 (1994).
[22] E. Steinnes and M.V. Frontasyeva, Analyst 120, 1437 (1995).[23] T.M. Ostrovnaya, L.S. Nefedyeva, V.M. Nazarov, S.B. Borzakov, L.P. Strelkova, Software for
NAA on the basis of relative and absolute methods using nuclear data base, Activation Analysis
in Environmental Protection, Dubna (1993).[24] M.V. Frontasyeva, F. Grass, V.M Nazarov, and E. Steinnes, J. Radioanal. Nucl. Chem. 192,
371 (1995).
[25] D. Garson, Factor Analysis. PA 765: Quantitative Research in Public Administration NorthCarolina State University (2000) http://www2.chass.ncsu.edu/garson/pa765/index.htm
[26] J. Schaug, J.P. Rambek, E. Steinnes, and R.C. Henry, Atmospheric Environment 24A,2625 (1990).
[27] Y.N. Cheremisina, M.Y. Finkelstein, and O.V. Mitrakova, Geoinformatika 3, 7 (in Russian)(1999).
[28] E. Steinnes, T. Berg, H. Uggerud, M. Vadset, Atmospheric Deposition of Heavy Metals
in Norway. Nation-wide survey in 2005, State Program for Pollution Monitoring, Report980/2007. Norwegian State Pollution Control Authority, Oslo (2007) (in Norwegian).
[29] S. Yoshida and Y. Muramatsu, J. Radioanal. Nucl. Chem. 196, 295 (1995).
[30] J. Lag and E. Steinnes, Geoderma 16, 317 (1976).[31] E. Steinnes and M.V. Frontasyeva, J. Radioanal. Nucl. Chem. 253, 173 (2002).[32] T.D. Cooke and K.W. Bruland, Environ. Sci. Technol. 21, 1214 (1987).
[33] J. Lag and E. Steinnes, Ambio 3, 237 (1974).[34] E. Steinnes, Sci. Total Environ. 160/161, 243 (1995).[35] D.R. Gomez, M.F. Gine, A.C.S. Bellato, and P. Smichowski, J. Environ. Monit. 7, 1162 (2005).[36] European Atlas: Spatial and temporal trends in heavy metal accumulation in mosses in Europe
(1990–2005), UNECE ICP Vegetation, in: H. Harmens, D. Norris and participants of the mosssurvey, (Eds.), Centre for Ecology & Hydrology, University of Wales Bangor, United Kingdom,SBN: 978-1-85531-239-5, 2008, pp. 51.
[37] M.V. Frontasyeva and S.S. Pavlov, Analytical investigations at the IBR-2 reactor in Dubna.JINR Preprint E14-2000-177, Dubna, Russia, 2000.
[38] M.V. Frontasyeva, T. Ye. Galinskaya, M. Krmar, M. Matavuly, S.S. Pavlov, D. Radnovic, and
E. Steinnes, J. Radioanal. Nucl. Chem. 259, 141 (2004).[39] O. Stan, A. Lucaciu, M.V. Frontasyeva, E. Steinnes, New results from air pollution studies
in Romania, in: M.V. Frontasyeva, P. Vater, V.P. Perelygin (Eds.), Proceedings of NATO ARWMan-Made Radionuclides and Heavy Metals in Environment, NATO Science Series, IV Earth
and Environmental Sciences – Vol. 5, Kluwer Academic Publishers, 2001, pp. 179–190.
1214 Z. Spiric et al.
Dow
nloa
ded
by [
Uni
vers
itetb
iblio
teke
t I T
rond
heim
NT
NU
] at
01:
10 2
7 Ju
ly 2
012