Health-risk behaviour in Croatia
29
Središnja medicinska knjižnica Bécue-Bertaut, M., and Kern, J., and Hernández-Maldonado, M. L., and Jureša, V., and Vuletić, S., (2008) Health-risk behaviour in Croatia. Public Health, 122 (2). pp. 140-150. http://www.elsevier.com/locate/issn/0033-3506 http://www.sciencedirect.com/science/journal/00333506 http://dx.doi.org/10.1016/j.puhe.2007.05.009 http://medlib.mef.hr/365 University of Zagreb Medical School Repository http://medlib.mef.hr/
Transcript of Health-risk behaviour in Croatia

Središnja medicinska knjižnica
Bécue-Bertaut, M., and Kern, J., and Hernández-Maldonado, M. L., and Jureša, V., and Vuletić, S., (2008) Health-risk behaviour in Croatia. Public Health, 122 (2). pp. 140-150.
http://www.elsevier.com/locate/issn/0033-3506
http://www.sciencedirect.com/science/journal/00333506
http://dx.doi.org/10.1016/j.puhe.2007.05.009
http://medlib.mef.hr/365
University of Zagreb Medical School Repository
http://medlib.mef.hr/

1
Health-Risk Behaviour in Croatia
Mónica Bécue-Bertauta, Josipa Kern
b,*, Maria-Luisa Hernández-Maldonado
a, Vesna
Juresab, Silvije Vuletic
b
aDepartment of Statistics and Operational Research, Polytechnical University of
Catalonia, Barcelona, Spain
bAndrija Stampar School of Public Health, School of Medicine, University of Zagreb,
Zagreb, Croatia
Corresponding author:
Josipa Kern
Andrija Stampar School of Public Health
Zagreb University Medical School
Rockefellerova 4
10000 Zagreb, Croatia
Tel. +385 1 290 2536
Fax +385 1 290 3752
E-mail: [email protected]
Total word count: 2701
Short running head: HEALCROATIA
Manuscript Number: PUHE-D-06-00114

2
Abstract. Objective: To identify the health-risk behaviour of various homogeneous
clusters of individuals.
Study design: The study was conducted in thirteen out of twenty Croatian counties as
well as in Zagreb, the Croatian capital. At a first stage, in every county, GP offices were
selected. Then, a second-stage sample was created by drawing a random sub-sample of
10% of the patients registered in each selected GP office in the first-stage sample.
Methods: The obtained sample was divided into seven homogenous clusters by means
of statistical methodology combining multiple factor analysis with a hybrid clustering
method.
Results: Seven homogeneous clusters were identified, three composed of males and four
of females, based on statistically significant differences between selected characteristics
(p<0.001). Although in general, self-assessed health declines with age, we observed
significant variations within specific age intervals. Self-assessed health strongly
improved with a higher level of education and/or socio-economic position. People, and
especially females who self-reported poor health, were heavy consumers of sleeping
pills.
Males and females reported different health-risk behaviours, related to lifestyle, food
choices and the use of healthcare. Heavier alcohol and tobacco use, carefree dietary
behaviour, risky physical activity and the lack of regular utilization of the health care
system impacted the males’ self-assessed health. Females at the same age and
educational level as males were slightly less satisfied with their health. Even highly-
educated females, who followed preventive health care and testing, and kept a healthy
diet, surprisingly reported a less satisfactory self-assessed health level than could have
been expected.

3
Conclusion: Socio-demographic characteristics, lifestyle, reported self-assessed health,
and the use of health care, allowed us to identify seven homogeneous population
clusters. A comprehensive analysis of these clusters serves health-related prevention
and intervention efforts geared towards specific populations.
Abstract word count: 296
Keywords: Health self-assessment survey; health-risk behaviours; free-text answers;
multiple correspondence analysis; cluster analysis.

4
Introduction
Health improvement, the key objective of public health policy, first of all, requires solid
factual information about the population’s current health status.1 Particularly interesting
are health surveys conducted by means of the general population’s health self-
assessments and some other tools in periods of major transitions. They help us to define
priority concerns and design the most effective health case systems. The project
“Analysis of the Croatian Health Care System in Transition” (Andrija Stampar School
of Public Health, School of Medicine, University of Zagreb) was focused on the post-
war transitional period, and it comprised a major health survey. Preliminary results from
specific parts of that survey have already been published2-6
. In our work, we use the data
collected by that survey in a way that allows us to identify particular health-risk
behavioural patterns.
In public health surveys, several model-based research designs have been used,
generally limited to selected features of the population. For example, the relationships
between the following variables have been studied: self-assessed health and lifestyle7;
self-assessed health and personality8; legal drug use, gender, morbidity, use of
healthcare and lifestyle9; nutrition and socio-demographic characteristics
10,11; risky
lifestyle factors12-14
, the use of healthcare and lifestyle15
; promotion of healthy
lifestyle16
; as well as isolated risky lifestyle such as smoking.17,18
However, in times of dramatic change, the previously obtained information is no longer
valid19
and questions concerning the health status of the population cannot be answered
by the use of models constructed by using a priori selected criteria, such as previously
chosen variables. It is necessary to go back to the individuals and their characteristics,
that is, to introduce a multidimensional holistic approach that integrates a great number
of variables. Thus, the most important variables can be detected and the examination of

5
all cross-tables avoided. In our case, this approach appeared to be a powerful tool and
helped us identify diverse health-risk behaviour patterns among homogeneous clusters
of individuals.
Methods
Data
The data are derived from the Croatian health survey conducted in 1997/1998, i.e. two
years after the end of the war, in order to estimate the health status of the population and
evaluate the health system in transition.
The study was conducted in thirteen out of twenty Croatian counties (Zagreb,County,
Split, Dubrovnik, Bjelovar, Osijek, Primorska, Zadar, Sibenik, Istria, Koprivnica, Lika,
Pozega and Vukovar) as well as in Zagreb, the Croatian capital. At a first stage, in every
county, 2 GPs were selected (in Zagreb County and Zagreb Capital, respectively, 3 and
7 GPs). The selection of the GPs suffered a selection bias, due to the substitution of the
those reluctant to participate. Then, a second-stage sample was created by drawing a
random sub-sample of 10% of the patients registered in each selected GP office.
Face-to-face interviews were conducted at the respondents’ households by trained
students from the School of Medicine. To reduce the non-responses, repeated visits
were attempted. However, since the study was carried out two years after the war which
affected half of the Croatian territory, the sampling and field strategies appeared not to
work as expected. The statistical information was incomplete and the pollsters lacked
the necessary experience. A total of 5048 respondents returned the questionnaire.
Among them, there were 3065 females but only 1983 males. This shows an obvious
imbalance between genders.
Only 8.7% explicit refusals were observed, varying from 3.4% to 14.4% among the
counties. Referring to non-response rate, we only could evaluate it. Neither

6
information about the replacements of GPs has been centralised, nor absentees were
systematically recorded. First, we computed this evaluation from both the observed
and total numbers of GPs (34 and 2400), the total population over 18 (4,437,000,
inhabitants counted up in the 2001 census) and the sampling rate at the second stage.
Secondly, we performed another evaluation from supposing homogeneous rates of
refusals in males and females, a negligible proportion of absentees in females and
taking into account the relative proportion of males and females in the population
over 18. Both evaluations gave close results, respectively 20% and 22%. Recent
studies conducted on the general population in Croatia have shown non-response rate
close to 16%. In this latter case, they have carefully taken into account the out-of-
cope units. In our case, we had no information and only knew that there were more
deaths and moves in males than in females.
Moreover, neither the 1991 nor the 2001 censuses could be used as a frame of reference.
Considerable and unpredictable demographic changes had taken place during and after
the war. Furthermore, the study only concerns the individuals registered at GP offices in
the thirteen mentioned counties at the time of the study. Thus, no reliable re-weighting
of data was advisable
Thus, our study suffers obvious limitations. Means, proportions and the domain sizes
estimations would be biased and no inference to the general population could be
performed.
Nevertheless, the methodology that we use (described in the following section) is based
on correlation structures. The identified patterns are much less dependent on the
individual weight system than sample means or frequencies20
(see p 182). As a check, a
simulated weighting that balanced the numbers of males and females (weight 1 for
females and 1.5 for males) has confirmed the stability of the patterns. Therefore, we can

7
conclude that observed health-risk behaviours did actually take place in the population,
although we could not calibrate the relative weights of the identified clusters. Other
different patterns could exist, corresponding to subpopulations not observed or under-
represented in the sample.
Despite the aforementioned shortcomings of the analysed data, they were a sufficient
source of information about health-related problems in the time of a major societal
transition.
The Questionnaire
The questionnaire addressed five areas. Four of them listed below, required answers to
closed-ended questions. These were:
• Socio-demographic data: gender, age, education and economic status;
• Lifestyle: smoking and drinking habits, sport or physical activities;
• Self-assessed health by using the SF-36 questionnaire;
• Use of health care: visits to GP’s, a specialist’s office and preventive services.
The fifth area referred to food choices and offered the following open-ended question:
"What did you eat and drink yesterday (state all meals and beverages)?" Every answer
consisted of a complete list of items that were carefully copied (e.g. bijela_kava, kruh,
juha, riza, kuhano_meso, mlijeko/ white coffee, bread, soup, rice, cooked meat, milk).
This free-text recording of meals and beverages did not allow us to measure the
individual diet intake, but it permitted for a comparison of food cultures21,22
, and that
was one of our goals. This way of data collection was time-saving and worked well as
part of a larger questionnaire. The absence of a provided list of meals and beverages
played a positive role in establishing an atmosphere of confidence, and thus answers
that could have been perceived as non-desirable were not concealed.22
In fact, we were

8
much more interested in responses provided by clusters of individuals than by particular
individuals (who could vary any day) because we wanted to identify specific nutrition
trends and their link to health-related problems. This particular question was very well
received, it was found interesting and evoked consistent answers (only 2% refusal rate
among the respondents; mean length of the answers was 8.5 words).
Statistical methods
Overall strategy
Our goal was to divide all individuals according to the characteristics obtained by the
first four sets of close-ended questions. We used the principal axes method as a pre-
processing step. 23
It allowed us to synthesize all the initial variables, gave us the
principal coordinate vectors and helped us identify the clusters. Then, every cluster was
described by the features that made it significantly different from the rest of the sample.
At first, we dealt with individuals who were simultaneously identified by categorical
variables, as well as in a referential way, by means of multiple correspondence analysis
(MCA).23,24
However, since we wanted to balance the influence of the different areas
(every area consisted of a set of variables), we used the extended form of MCA, based
on multiple factorial analysis (MFA).25,26
MFA standardizes the highest axial variance
of each set to 1 by conveniently re-weighting every variable depending on the set to
which it belongs. Thus, the first principal axis is not determined by the variables of only
one area. So as in MCA, also in MFA the distance between two individuals decreases if
the number of common characteristics increases. MFA offers a graphic representation of
the inter-individual and the inter-categories distances; the interpretation rules are the
same as in MCA. Responses of eleven individuals were eliminated from our analysis
because they presented many missing values.

9
Next, the hybrid clustering method was used starting with the first and the most
statistically significant principal coordinate vectors, while filtering the noise conveyed
by the last ones.20,25,27
First, a hierarchical clustering was performed using classic
Euclidean distance and the Ward aggregation criterion.25,27
Then, after cutting the tree, a
sequence of k-means iterations were performed to consolidate the clusters.
Finally, the clusters were described by the significantly over and under represented
characteristics of the gathered individuals.27
Even though the answers concerning food choices did not intervene in the clustering,
they were included as supplementary information. Meals and beverages significantly
over or under represented in each cluster were identified by means of a statistical
criterion.22
Results
Main trends illustrated by maps
MFA allowed us to detect three axes that summarized the relationships between various
areas. They retained only 15% of the total variance. However, in MCA the rates of
variance corresponding to the first axes were necessarily low because of the
codification.25,27
.
The shapes of the individual distribution (Figure 1) and the distribution by categories
(Figures 2 and 3), suggested interpretation of the bisectors rather than the axes, which
was in accordance with the close proportions of variance retained by the two first axes
(6.94% versus 4.97%). The first bisector (Figure 2) revealed the difference between
genders, mainly due to different lifestyles (See in Tables 1 and 2 the distributions of
drinking and smoking habits by gender and age intervals). The second bisector (Figures
2 and 3) separated the categories characterized by very good or excellent health (and the
absence of activity restrictions) from the categories with bad health (and many activity

10
limitations). As expected, self-assessed health declined with age and improved with
educational level. Since younger people were more educated, we had to inquire about
the education effect on individuals of the same age. Figure 3 and Table 3 clearly showed
that a lower level of education was linked to poor health in both genders. Self-rated
income and socio-economic status, highly correlated to one another, had a similar
effect: lower income and/or socio-economic status accounted for self-assessed poor
health. This was the first finding related to health inequalities.
INSERT TABLES 1-3 HERE
INSERT FIGURE 2 HERE
INSERT FIGURE 3 HERE
Furthermore, we also observed that:
• there was a strong connection between various limitations in performing daily
activities, suggesting that different aspects of health were closely related, and thus, any
action undertaken to improve self-assessed health influenced all its dimensions;
• the mean of female self-assessed health was poorer than that of males, who selected
the descriptive “excellent” much more often than females; categories reflecting positive
health self-assessment were slightly closer to the male than female sub-cluster, while
those with a negative health self-assessment were closer to the female sub-cluster;
• the total trajectory of age intervals showed a bigger gap between “46-55” and “56-
65” age-intervals than between any other consecutive age intervals, which suggested
that around the age of 55 there is a turning point for many aspects of self-assessed
health;
• the relative positioning of “PAP-yes” and “PAP-no, on the one hand, and
“Mammogram-yes” and “Mammogram-no” on the other, suggested a link between

11
higher education and higher income of younger females and their participation in
preventive testing.
Cluster analysis
Starting with the coordinates of the individuals on the three first axes, we were able to
identify seven clusters. The elevated value (78%) of the quotient between-clusters
variance and total variance indicated strong internal homogeneity of the clusters.
INSERT TABLE 4 HERE
A detailed description of all clusters is presented in Table 4, by means of categories
significantly over-represented as compared to the whole sample (P-value < 0.001).
Referring to health status, we also calculated the mean within the cluster of the General
health score (GH-score) derived from SF-36. Meals and beverages over-represented in
every cluster compared to the whole sample were also reported (p<0.05), giving an
insight about the different food cultures.
Figure 4 shows the centroid of every cluster on the first principal plane, providing
information about the relative proximity of different clusters.
INSERT FIGURE 4 HERE
Discussion
This research suggests a number of possible directions for further studies.
Social inequality and health: Health is related to age but, for any given age, we found a
large range of self-assessed health conditions, suggesting not only age related
inequalities in health. Although the reasons were complex and intertwined, we were
able to capture the significance of education, economic status and, to some extent, of
gender.
Healthcare and preventive behaviour: As expected, females29
participated in preventive
healthcare more often than males. Seniors were expected to use such services even more

12
often and to display preventive behaviours.30
Males seemed to fulfil this expectation,
but females did not. Only middle aged and highly educated females (cluster 6)
participated in gynaecological preventive testing. Regarding other preventive checkups,
females from cluster 6 revealed preventive behaviour as intensive as senior females
from cluster 4, and even more intensive than that of the youngest females with average
education, from cluster 7. In the case of females, preventive behaviour was linked to
socioeconomic status and education, and this link was particularly strong in the case of
preventive gynaecological tests.
Food choice: Young males adopted a modern eating pattern, including fast food and
non-traditional products (sandwiches, French fries, pizzas, cola, whisky), while senior
males followed the more traditional pattern, favouring meat and starchy meals31,32
.
Although all female clusters avoided heavy traditional meals such as bacon and pork fat,
only clusters 6 (middle-aged females, higher education, intense use of preventive care)
and 4 (senior females) seemed to follow a diet, the first of these two clusters to keep a
balanced diet, and the second, for medical reasons.
Health and gender: Females, even the youngest ones, showed less satisfaction with
their health status than males. The comparison between clusters 6 and 5 gave us some
clues as to why that was the case. Figure 4 pointed out that Cluster 6 (middle-aged
females, higher education, intense use of preventive care) was positioned close to
cluster 5 (middle-aged and elderly females, little physical activity, lower education, very
little use of healthcare and traditional lifestyle and food choices). Thus, the females in
cluster 6 showed a lower self-assessed health status than it could have been predicted on
the basis of age and education. The following hypothesis could be formulated: females
were disturbed by the changes in society, they had to develop strategies to manage
work-family conflict, and they paid the high cost of adaptation. Our results differed
13
from those obtained in Canada33
, but they were similar to the findings from Spain28
, a
country where females are experiencing a dramatic change in lifestyle. Besides, the
comparison between clusters 2 and 5 (middle-aged males and females) led to the
conclusion that males and females had different attitudes to health, rather than
significantly different health statuses.
Conclusion
In conclusion, our results provided a comprehensive picture of the different health
related behaviour patterns and the concomitant variables. They constitute a starting
point for further studies of more specific problems related to health inequalities in
Croatia. Such studies could address, on the one hand, significant implications for health-
related issues of dramatic socio-economic changes, particularly impacting females and,
on the other, the development of new methodologies incorporating, for example, the
techniques to collect information about food choices.
Software note
The results have been obtained by using SPAD software (http://www.decisia.fr).
Acknowledgments
This work has been supported by the Ministry of Science, Education and Sport of the
Republic of Croatia (Regionalism of cardiovascular behavioural risk factors – model of
intervention; No: 108-1080135-0264) and by the Spanish Ministry of Education and
Science and FEDER (grant SEJ2005-00741/ECON). We are grateful to Professors Jean-
Pierre Nakache, Jérôme Pagès and Ludovic Lebart and Barbara Strassberg for their
advice.

14
References
1. Griffiths S, Jewell T, Donnelly P. Public health in practice: the three domains of
public health. Public Health 2005; 119:907-13.
2. Juresa V, Ivankovic D, Vuletic G, Babic-Banaszak A, Srcek I, Mastilica M, Budak
A. The Croatian Health Survey – SF-36: I. General Quality of life Assessment. Coll
Antropol 2000; 24:69-78.
3. Babic-Banaszak A, Kovacic L, Mastilica M, Babic S, Ivankovic D, Budak A. The
Croatian health survey--patient's satisfaction with medical service in primary health
care in Croatia. Coll Antropol 2001; 25:449-58.
4. Babic-Banaszak A, Kovacic L, Kovacevic L, Vuletic G, Mujkic A, Ebling Z. Impact
of war on health related quality of life in Croatia: population study.
Croat Med J. 2002; 43:396-402. (in Croatian)
5. Babic-Banaszak A, Kovacic L, Mastilica M. What the citizens of Croatia think
about their health. Acta Med Croatica. 2002; 56:145-50. (in Croatian)
6. Budak A, Babic-Banaszak A, Katic M, Vuletic S. Analysis of the health care system
transition: what the health care users think. Lijec Vjesn. 2003; 125:32-5. Croatian.
7. Milne BJ, Logan AG, Flanagan PT. Alterations in health perception and lifestyle in
treated hypertensives. Journal of Chronic Diseases 1985; 38:37-45.
8. Goodwin R, Engstrom G. Personality and the perception of health in the general
population. Psychological Medicine 2002; 32:325-32.
9. Furu K, Straume B, Thelle DS. Legal drug use in a general population: association
with gender, morbidity, health care utilization, and lifestyle characteristics. Journal
of Clinical Epidemiology 1997; 50:341-9.

15
10. Kelleher CC, Friel S, Gabhainn SN, Tay JB. Socio-demographic predictors of self-
rated health in the Republic of Ireland: findings from the National Survey on
Lifestyle, Attitudes and nutrition, SLAN. Soc Sci Med 2003; 57:477-86.
11. Zhu S, Heo M, Plankey M, Faith MS, Allison DB. Associations of body mass index
and anthropometric indicators of fat mass and fat free mass with all-cause mortality
among women in the first and second National Health and Eating habits
Examination Surveys follow-up studies. Annals of Epidemiology 2003; 13:286-93.
12. Schuit AJ, van Loon AJM, Tijhuis M, Ocke MC. Clustering of lifestyle risk factors
in a general adult population. Preventive Medicine 2002; 35: 219-24.
13. Roubenoff R, Scrimshaw N, Shetty P, Woo J. (2000). International Dietary Energy
Consultative Group. Report of the IDECG Working Group on the role of lifestyle
including eating habits for the health of the elderly. Eur J of Clinic Eating Habits
2000; 54: S164-5.
14. Maeno T, Ohta A, Hayashi K, Kobayashi Y, Mizunuma H, Nakai S,. Ohashi Y,
Suzuki S. Impact of reproductive experience on women's smoking behaviour in
Japanese nurses. Public Health 2005; 119: 816-824.
15. Tucker LA, Clegg AG. Differences in health care costs and utilization among adults
with selected lifestyle-related risk factors. American Journal of Health Promotion
2002;16:225-33.
16. Anonymous. For a healthful lifestyle: promoting cooperation among nutrition
professionals and physical activity professionals. American College of Sports
Medicine, the American Dietetic Association, International Food Information
Council. Journal of the American Dietetic Association 1999; 99:994-7.
17. Dedobbeleer N, Beland F, Contandriopoulos AP, Adrian M. Gender and the social
context of smoking behaviour. Soc Sci Med 2004; 58:1-12.

16
18. Cho HJ, Song YM, Smith GD, Ebrahim S. Trends in socio-economic differentials in
cigarette smoking behaviour between 1990 and 1998: a large prospective study in
Korean men. Public Health 2004; 118: 553-558.
19. Bourdieu P. What makes a social class? On the theoretical and practical existence of
groups. Berkeley Journal of Sociology 1987; 32:137.
20. Lebart L, Morineau A, Warwick K. Multivariate Descriptive Statistical Analysis.
New York: Wiley; 1984.
21. Akuto H. (Ed.). International Comparison of Dietary Cultures, Tokyo: Nihon Keizai
Shimbun; 1992.
22. Lebart, L., Salem A. and E. Berry E. Exploring textual data. Dordrecht: Kluwer;
1998.
23. Lebart, L Complementary Use of Correspondence Analysis and Cluster Analysis.
In: Greenacre M, Blasius J, editors. Correspondence analysis in the Social Science,
San Diego: Academic Press; 1994, p. 162-178.
24. Tenenhaus M, Young FW, An analysis and synthesis of multiple correspondence
analysis, optimal scaling, dual scaling, homogeneity analysis and other methods for
quantifying categorical multivariate data. Psychometrika 1985; 50: 91-119.
25. Escofier B, Pagès J. Analyses factorielles simples et multiples; objectifs, méthodes
et interprétation [Simple and Multiple Factor Analyses. Objectives, methods and
interpretation]. Paris: Dunod; 1998.
26. Escofier B, Pagès J. Multiple factor analysis: AFMULT package. Comput. Statist.
Data Anal. 1994;18:121-40.
27. Lebart L., Morineau A. et Piron M. (2000). Statistique exploratoire
multidimensionnelle [Exploratory Multidimensional Statistics]. Paris: Dunod; 2000.

17
28. Borrell C, Muntaner C, Benach J, Artazcoz L. Social class and self-reported health
conditions among men and women: what is the role of work organization,
household material standards and household labour?, Soc Sci Med 2004;58:1869-
87.
29. Brotons C, Iglesias M, Martinzurro A, Martinrabadan M, Gene J. Evaluation of
preventive and health promotion activities in 166 primary care practice in Spain.
Family Practice 1996;13:144-51.
30. Llovera I, Ward MF, Ryan JG, LaTouche T, Sama A. A survey of the emergency
department population and their interest in preventive health education. Academic
Emergency Medicine 2003;10:155-60.
31. Bell AC, Swinburn BA. What are the keyfood groups to target for preventing
obesity and improving eating habits in schools? Eur J of Clinic Eating Habits
2004;58:258-63.
32. French SA, Harnack L, Jeffery RW. Fast food restaurant use among women in the
Pound of Prevention study: dietary, behavioural and demographic correlates.
International Journal of Obesity 2000;24:1353-9.
33. Denton MPrS, Walter V. Gender differences in health: a Canadian study of the
psychosocial, structural and behavioural determinants of health, Soc Sci Med 2004;
58:2585-600.

18
Figure captions
Figure 1. Projection of the individual cloud on the first principal plane; the centroids of
the male and female subclouds are also represented.
-4 -2 0 2
-4
-2
0
2
4
Axis 1 - 6.94 %
Axis 2 - 4.97 %
male
female
Legend:
Centroid of Male/ female subclouds
Individual point •
•

19
Figure 2. Strong connections between different aspects of health, shown on the first
principal plane. The first bisector separates male and female behaviour. The second
bisector shows how age accounts for differences in health self-assessment.
-3.0 -1.5 0 1.5 3.0
-3.0
-1.5
0
1.5
3.0
+
Axis 1 - 6.94 %
Axis 2 - 4.97 %
GP-no
health-excellent
66-75
health-poor
male
health-very good
health-good
health-fair
female
PAP test (female)-yes
mammogram (female)-yes
mammogram(female)-no
46-55
PAP test (female)-noblood/urine-no
specialist-yes
GP-yessmoking-noblood/urine-yes
blood pressure checking-yes
36-45
alcohol-every day
normal standard activity
difficulties in bending, kneeling
hard training and sport
smoking-yes
smoking-sometimes
alcohol-never
alcohol-not now
many limitations in tough physical activities
Self-asses. health trajectory
inactive leisure
18-25
Age trajectory
76+
56-65
no limitations in tough physical activities
reduced standard activity
26-35
jogging and similar
walking
difficulties in climbing stairs
no difficulties in climbing stairs/ bending
Legend:
SELF-ASSESSED HEALTH
FEMALE HABITS
AGEMALE HABITS
Lifestyle category
Health care category
SF36 category
Demographic category

20
Figure 3. The influence of education and gender. The trajectories of age by gender and
education (primary school and high school/university) are compared to the trajectories
of age by self-assessed-health (poor and excellent).
-3.0 -1.5 0 1.5 3.0
-3.0
-1.5
0
1.5
3.0
Axis 1 - 6.94 %
Axis 2 - 4.97 %
1
3
3
2
1
2
2
2
high school and over
Age intervals 1=18-35; 2=36-55; 3=56+
3
1
1
1
1
1
2
2
2
2
1
3
3
3
3
Primary school
3
high school
Primaryschool
high school
MALES TRAJECTORY
FEMALES TRAJECTORY
high school
primary
health poor
Healthexcellent
primary school
health excellent
health poor
Legend:
MALE HABITS
FEMALE HABITS
AGE
-3.0 -1.5 0 1.5 3.0
-3.0
-1.5
0
1.5
3.0
Axis 1 - 6.94 %
Axis 2 - 4.97 %
1
3
3
2
1
2
2
2
high school and over
Age intervals 1=18-35; 2=36-55; 3=56+
3
1
1
1
1
1
2
2
2
2
1
3
3
3
3
Primary school
3
high school
Primaryschool
high school
MALES TRAJECTORIES
FEMALES TRAJECTORIES
high school
primary
health poor
Healthexcellent
primary school
health excellent
health poor
Legend:
MALE HABITS
FEMALE HABITS
AGE
SELF-ASSESSED HEALTH
GLOBALS TRAJECTORIES

21
Figure 4. Projection of cluster centroids on the first principal plane derived from MFA
-3.0 -1.5 0 1.5
-3
-2
-1
0
1
2
Axis1 - 6.94 %
Axis 2 - 4.97 %
-3.0 -1.5 0 1.5
-3
-2
-1
0
1
2
-3.0 -1.5 0 1.5
-3
-2
-1
0
1
2
Axis1 - 6.94 %
Axis 2 - 4.97 %
●
●
●
●
●
●
●
FEMALES
MALES
18-25
26-35
36-45
46-55
56-65
66-75
76+
Cluster 1
Cluster 2
Cluster 3
Cluster 4
Cluster 5
Cluster 6
Cluster 7
●
MALE HABITS
FEMALE HABITS
AGELegend:
○Cluster centroid (size proportional to counts):●Demographic category
SELF-ASSESSED HEALTH
Age trajectory
22
Education
Gender Age No
school
Prima
ry
school
Training
college
Secon
dary
school
High
school
Uni
versity
Total
18-35 9
4.00
49
3.59
72
3.71
369
3.65
28
3.29
77
3.81
604
3.7
36-55 13
2.46
72
2.42
126
2.66
237
2.77
62
2.98
87
3.33
597
2.8
Males
56 and
over
123
1.89
154
1.99
197
2.21
168
2.17
56
2.57
81
2.36
779
2.1
18-35 14
3.86
119
3.31
55
3.47
528
3.46
42
3.62
110
3.33
868
3.5
36-55 48
2.00
213
2.31
67
2.54
411
2.66
98
2.99
126
3.06
963
2.6
Femal
es
56 and
over
424
1.72
400
1.92
95
2.03
217
2.13
48
2.17
42
2.4
1226
1.9
Total Total 631
1.9
1007
2.3
612
2.6
1930
3.0
334
2.9
523
3.2
5037
2.7
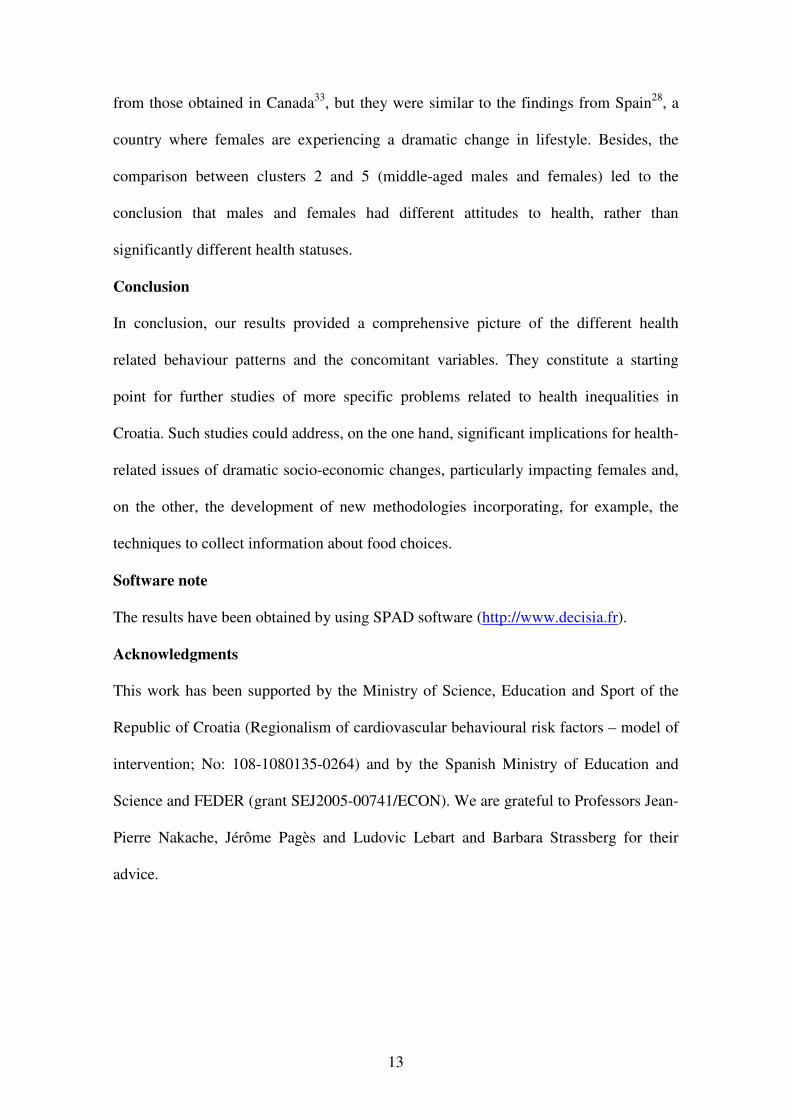
Table 1. Self-assessed health by age, gender and education.
In every cell, the number of individuals and the mean value of self-assessed health
(varying from 1= poor to 5=excellent).

23
Drinking habits
Gender Age No
drinker
Occasional
drinker
Usual
drinker
Missing
data
Total
18-35 68
(11.3%)
272
(45.0%)
260
(43.0%)
4
(0.7%)
604
(100%)
36-55 89
(14.9%)
206
(34.5%)
301
(50.4%)
1
(0.2%)
597
(100%)
Males
56 and
over
151
(19.4%)
207
(26.6%)
417
(53.5%)
4
(0.5%)
779
(100%)
18-35 221
(25.5%)
555
(63.9%)
87
(10.0%)
5
(0.6%)
868
(100%)
36-55 304
(31.6%)
511
(53.1%)
142
(14.7%)
6
(0.6%)
963
(100%)
Females
56 and
over
557
(45.4%)
450
(36.7%)
212
(17.3%)
7
(0.6%)
1226
(100%)
Total Total
1390
(27.6%)
2201
(43.7%)
1419
(28.2%)
27
(0.5%)
5037
(100%)
Table 2. Distribution of drinking habits by age and gender.
In every cell, numbers and percentages of individuals.

24
Smoking habits
Gender Age No
smoker
Occasional
smoker
Usual
Smoker
Missing
Data
Total
18-35 260
(43.1%)
80
(13.3%)
262
(43.4%)
2
(0.3%)
604
(100%)
36-55 255
(42.7%)
59
(9.9%)
283
(47.4%)
0
(0.0%)
597
(100%)
Males
56 and
over
158
(20.3%)
38
(4.9%)
582
(74.7%)
1 0.
(1%)
779
(100%)
18-35 270
(31.1%)
134
(15.4%)
464
(53.5%)
0
(0.0%)
868
(100%)
36-55 279
(29.0%)
72
(7.5%)
609
(63.2%)
3
(0.3%)
963
(100%)
Females
56 and
over
94
(7.7%)
38
(3.1%)
1088
(88.7%)
12
(0.5%)
1226
(100%)
Total Total
1316
(26.1%)
421
(8.4%)
3288
(65.3%)
12
(0.2%)
5037
(100%)
Table 3. Distribution of smoking habits by age and gender.
In every cell, numbers and percentages of individuals.

25
Cluster 1. (n=549) Male: (96%;39%)
Average age: 65.1
Economic status: below average (56%;
38%)
Education: low/middle (69%; 47%)
Self-assessed health: poor/fair (86%;
47%)
Use of health care: GP & specialist:
(92%; 78%)& (70%; 50%), BP
measurement (93%; 76%); Drugs: for
heart (56%; 29%), sleeping pills (34%;
22%)
Lifestyle: drinkers/former drinkers: wine
(68%; 36%); Former smokers: (52%;
32%); Physically non active: (62%;
45%).
Average GH-score (SF-36): 32.6
Meals and beverages: polenta, pork,
soup, bread, pepper, lard, onion, cracker,
broad bean, bacon, roasted beef, green
beans, pudding, cabbage/ wine, tea, raki
Cluster 2. (n=780) Male: (96%; 39%)
Average age: 47.0
Economic status: average (55%; 49%)
Education: middle/ high (89%; 67%)
Self-assessed health: good/fair (69%;
53%)
Use of health care: GP & specialist:
(92%; 78%) & (60%; 50%); BP
measurement (87%; 76%)
Lifestyle: drinkers/former drinkers: wine
(76%;36%); Smoker/former smokers:
(92%;58%); walking/running
(58%;48%).
Average GH-score (SF-36): 57.7
Meals and beverages: French fries,
goulash, fish, lard, tripe, white beans,
cheese, meat, cold roasted meats/ wine,
beer, salami, raki,
Cluster 3. (n=700) Male: (98%;39%)
Average age: 37.5
Economic status: higher than average
(22%; 12%)
Cluster 4. (n=864) Female: (99.7%;
61%)
Average age: 66.4
Economic status: low (58%; 38%)
26
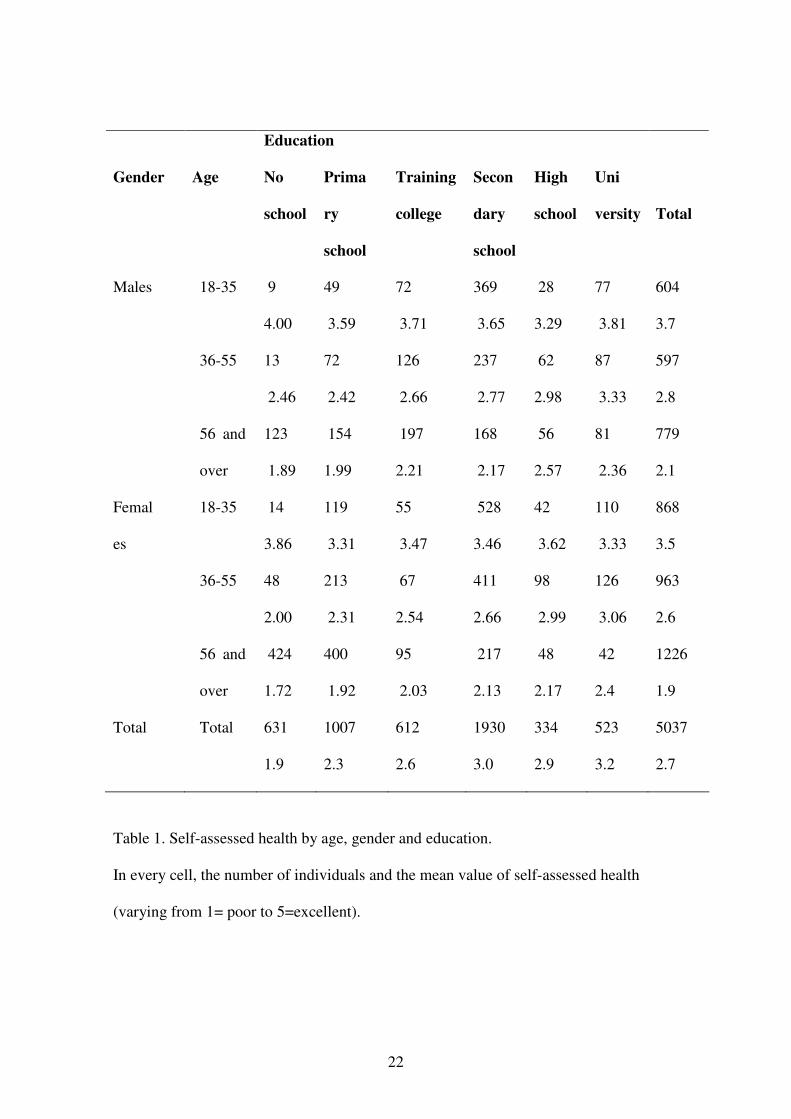
Education: middle (65%; 50%)
Self-assessed health: excellent/very good
(59%; 28%)
Use of health care: non-users of GP &
specialist: (60%; 20%) & (85%; 50%);
non-BP measurement: (54%; 21%)
Lifestyle: drinkers: beer (54%; 28%);
Smokers/former smokers: (79%; 58%);
training sport/running (46%; 21%).
Average GH-score (SF-36): 73.3
Meals and beverages: raw ham, lard,
mayonnaise, ham, salami, sandwich,
pizza, salad, French fries, chocolate,
artichoke, cheeseburger, bologna, cocoa,
egg, fish, cucumber /beer, wine, coke,
other alcoholic drinks, raki
Education: low (75%; 33%)
Self-assessed health: poor (59%; 21%)
Use of health care: GP & specialist: (96;
78 & 69; 50); BP measurement (97%;
76%), no PAP test (72%; 34%), no
mammogram (75%; 42%) Drugs: for
heart (66%; 29%), sleeping pills (45%;
22%)
Lifestyle: Non drinkers: (59%; 20%);
Non smokers: (92%; 65%); Physically
non active: (75%; 45%) (75%; 42%).
Average GH-score (SF-36): 32.5
Meals and beverages: soup, chicken,
bread, yoghurt, polenta, flour products,
beetroot, semolina, cabbage, white
beans, orange, compote/ milk, tea,
coffee, water
Cluster 5. (n=478) Female: (98.5%;
61%)
Average age: 56.8
Economic status: lower than average
(24%; 38%)
Education: low (70%; 33%)
Self-assessed health: good/fair (70%;
53%)
Cluster 6. (n=890) Female: (99.7%;
61%)
Average age: 42.8
Economic status: average (56%; 49%)
Education: middle/high (77%; 55%)
Self-assessed health: good/fair (67%;
53%)
Use of health care: Users of GP &

27
Use of health care: Non-users of GP &
specialist: (43%; 78%)& (83%; 44%);
no BP measurement (41%; 21%), no
PAP test (94%; 34%), no mammogram
(96%; 42%)
Lifestyle: Non drinkers: (43%; 20%);
Non smokers: (92%; 65%); Physically
non active: (48%; 45%)
Average GH-score (SF-36): 56.3
Meals and beverages: corn salad, puff
pastry, white beans, plum jam, bacon,
bread /coffee, water, milk, raki
specialist (94%; 78%) & (80%; 50%);
BP measurement (89%; 76%), PAP test
(77%; 22%), mammogram (51%; 13%)
Lifestyle: occasional drinkers: wine
(63%; 43%); Smokers: (32%; 26%);
Physical activity: walking (42%; 31%)
Average GH-score (SF-36): 55.9
Meals and beverages: banana, fruit, kiwi,
cake, buns, yogurt, pear, apple, tomato,
beetroot, mashed potatoes, gnocchi,
butter, orange /fruit juice, coffee
Cluster 7. (n=776) Female: (99.7%, 61%)
Average age: 33.5 years
Economic status: average (60%; 49%)
Education: middle (62%; 38%)
Self-assessed health: excellent/very
good/good (83%; 53%)
Use of health care: Non-users of GP &
specialist: (32%; 78%) & (60%; 44%);
no BP measurement (56%; 38%), PAP
test (35%; 22%), no mammogram (79%;
42%)
Lifestyle: occasional drinkers: (42%;
25%); Smokers: (33%; 26%); walking
(43%; 31%)
Average GH-score (SF-36): 70.2
Meals and beverages: chocolate,
cornflakes, ice-cream, buns, yoghurt,
sandwich, French fries, candies, banana,
doughnut, pizza, Frankfurt sausages,
apple, cheeseburger, cakes, sauce,
pancakes, carrot, dairy product, spread,
courgette, mandarine /fruit juice, coke,
instant coffee.
28
Table 4. Description of the clusters.
For every selected characteristic the occurrence is significantly higher in any given
cluster than in the whole sample (p-value <0.001). In parentheses, percentages of
individuals carrying those characteristics within a given cluster and in the whole
sample.
Listed meals/ beverages have been cited significantly more often in a given cluster than
in the whole sample (p-value <0.05). Meals/beverages were ranked depending on the
associated p-value.
Age and GH score (SF36) are presented in mean values.