Historical rates of atmospheric Pb deposition using 210 Pb dated peat cores: Corroboration,...
18
HISTORICAL RATES OF ATMOSPHERIC Pb DEPOSITION USING 21~ DATED PEAT CORES: CORROBORATION, COMPUTATION, AND INTERPRETATION MELANIE A. VILE * Department of Biology, Villanova University, Villanova, PA 19085, U.S.A. MARTIN J. V. NOVAK and EVA BI~fZOVA Czech Geological Survey, Kldrov 3, 118 21 Prague 1, Czech Republic R. KELMAN WIEDER Department of Biology, Villanova University, Villanova, PA 19085, U.S.A. and WILLIAM R. SCHELL Centerfor Environmental and Occupational Health and Toxicology, University of Pittsburgh, Pittsburgh, PA 15328, U.S.A. (Received July 29, 1994; accepted August 11, 1994) Abstract. Lead-210 dating of peat cores is one approach that has been used to arrive at historical rates of heavy metal deposition. Despite concerns regarding the validity of 21~ dating due to Pb mobility, 21~ dating can be used if the dates are corroborated with some other independent dating technique. In this study, based on analyses of ~l~ dated, pollen corroborated peat cores from two sites in the Czech Republic (Jezernf sla[ and Bo~f Dar Bog), we illustrate a previously unexplored problem concerning the computation of metal deposition, using Pb as an example. When peat cores are collected, sectioned into depth intervals, 21~ dated and analyzed for metal contents, the 21~ dates most appropriately correspond to the midpoint depth for each interval, whereas the metal contents correspond to the interval between the top and bottom of each section. Thus the Zi~ dates and metal content values throughout the core are offset by half the distance of each depth interval. In calculating historical rates of heavy metal deposition two approaches are available for correcting for the depth interval offsets, the traditional approach of date interpolation and our newly proposed metal content interpolation. We see no a priori reason for choosing one approach over the other, and suggest simultaneous use of both date and metal content interpolation. Additionally, acid-insoluble ash (AIA), which has been proposed as a dating technique in and of itself, may be more useful as an interpretive tool which may provide insights into the nature or sources of atmospherically deposited Pb. For example, plots of Pb content per core section versus AIA content per core section for Jezernf sla[, located in a relatively pristine area, reveal increased Pb content without increased AIA contents in depths shallower than 6 cm, indicating deposition of gasoline-derived Pb after its introduction in 1922. Similar plots for Bo~f Dar Bog, located in a polluted industrialized region, indicate greater inputs of Pb than would be predicted from AIA, based on the Jezernf sla[ analyses. We interpret the apparent excess Pb deposition at Bo~f Dar Bog as being contributed by soil-derived dust from local metal mining. Elevated rates in Pb deposition at Bo~f Dar Bog are consistent with the history of local mining known to have occurred in the vicinity. Finally, magnetic susceptibility measurements identify combustion of fossil fuels as a source of atmospheric Pb deposition at Bo~f Dar Bog, but not at Jezernf sla~ * Author for all correspondence. Water, Air and Soil Pollution 79: 89-I06, 1995. @ 1995 Kluwer Academic Publishers. Printed in the Netherlands.
Transcript of Historical rates of atmospheric Pb deposition using 210 Pb dated peat cores: Corroboration,...

HISTORICAL RATES OF ATMOSPHERIC Pb DEPOSITION USING 21~ DATED PEAT CORES: CORROBORATION, COMPUTATION,
AND INTERPRETATION
MELANIE A. VILE * Department of Biology, Villanova University, Villanova, PA 19085, U.S.A.
MARTIN J. V. N O V A K and EVA BI~fZOVA Czech Geological Survey, Kldrov 3, 118 21 Prague 1, Czech Republic
R. K E L M A N WIEDER Department of Biology, Villanova University, Villanova, PA 19085, U.S.A.
and
W I L L I A M R. SCHELL Center for Environmental and Occupational Health and Toxicology, University of Pittsburgh,
Pittsburgh, PA 15328, U.S.A.
(Received July 29, 1994; accepted August 11, 1994)
Abstract. Lead-210 dating of peat cores is one approach that has been used to arrive at historical rates of heavy metal deposition. Despite concerns regarding the validity of 21~ dating due to Pb mobility, 21~ dating can be used if the dates are corroborated with some other independent dating technique. In this study, based on analyses of ~l~ dated, pollen corroborated peat cores from two sites in the Czech Republic (Jezernf sla[ and Bo~f Dar Bog), we illustrate a previously unexplored problem concerning the computation of metal deposition, using Pb as an example. When peat cores are collected, sectioned into depth intervals, 21~ dated and analyzed for metal contents, the 21~ dates most appropriately correspond to the midpoint depth for each interval, whereas the metal contents correspond to the interval between the top and bottom of each section. Thus the Zi~ dates and metal content values throughout the core are offset by half the distance of each depth interval. In calculating historical rates of heavy metal deposition two approaches are available for correcting for the depth interval offsets, the traditional approach of date interpolation and our newly proposed metal content interpolation. We see no a priori reason for choosing one approach over the other, and suggest simultaneous use of both date and metal content interpolation. Additionally, acid-insoluble ash (AIA), which has been proposed as a dating technique in and of itself, may be more useful as an interpretive tool which may provide insights into the nature or sources of atmospherically deposited Pb. For example, plots of Pb content per core section versus AIA content per core section for Jezernf sla[, located in a relatively pristine area, reveal increased Pb content without increased AIA contents in depths shallower than 6 cm, indicating deposition of gasoline-derived Pb after its introduction in 1922. Similar plots for Bo~f Dar Bog, located in a polluted industrialized region, indicate greater inputs of Pb than would be predicted from AIA, based on the Jezernf sla[ analyses. We interpret the apparent excess Pb deposition at Bo~f Dar Bog as being contributed by soil-derived dust from local metal mining. Elevated rates in Pb deposition at Bo~f Dar Bog are consistent with the history of local mining known to have occurred in the vicinity. Finally, magnetic susceptibility measurements identify combustion of fossil fuels as a source of atmospheric Pb deposition at Bo~f Dar Bog, but not at Jezernf sla~
* Author for all correspondence.
Water, Air and Soil Pollution 79: 89-I06, 1995. @ 1995 Kluwer Academic Publishers. Printed in the Netherlands.

90 MELANIE A. VILE ET AL.
1. Introduction
Monitoring programs can provide information about present day atmospheric depo- sition of materials to the earth's surface (e.g., Moldan, 1991; Pylv/in~iinen, 1993), but often little is known about the history of atmospherically-derived pollution of terrestrial and aquatic ecosystems. For heavy metals, S p h a g n u m - d o m i n a t e d peat- lands are one type of natural deposit that have been used to reconstruct historical rates of atmospherically-derived metal deposition (Madsen, 1981; Schell et al., 1986, Schell, 1987; Norton, 1987; Clymo et al., 1990; Cole et al., 1990). Sphag- num plants grow apically from compact structures called capitula while dying at the base (Clymo and Hayward, 1982). When the rate of production of organic matter at the surface of a peat deposit exceeds the rate at which the underlying dead remains decompose, the result is a vertical accumulation of an organic peat deposit. For atmospherically deposited metals that are effectively retained and immobilized in the surface peat, a vertically aggrading peat deposit preserves a record of the history of atmospherically-derived metal pollution.
Determination of changes in metal concentration as a function of depth in peat profiles does not provide sufficient information to make inferences about historical rates of heavy metal deposition (Norton and Kahl, 1987). Without bulk density data, metal concentrations cannot be converted to metal quantities per volume of peat. Moreover, because of ongoing compaction and decomposition within the peat deposit, depth is not linearly related to age (Clymo, 1984). Bulk density and metal concentration measurements along with dating of peat profiles, however, permit the calculation of peat accumulation and metal deposition rates, which are corrected for both compaction and decomposition of the peat. By replacing the depth and metal concentration axes with age and metal deposition axes, respectively, an accurate reconstruction of historical rates of heavy metal deposition can be established.
A popular approach for calculating peat accumulation rates of recently formed deposits is 21~ dating, with application of the constant rate of supply model (Appleby and Oldfield, 1978). There are two main assumptions associated with 21~ dating of a peat deposit or sediment column: (1) there is a constant flux of 21~ from the atmosphere to the surface of a peat deposit, and (2) atmospherically deposited 21~ is immobilized at the surface of the peat or sediment column and becomes buried as the peat or sediment grows vertically. The first assumption generally is accepted, but the validity of the second assumption has been challenged more frequently. While it has been suggested that both changing redox conditions associated with a fluctuating water table, and minimal (25 %) retention of Pb inputs due to complexation of Pb with dissolved organic carbon in peat bog waters, may result in Pb or 21~ mobility (Clymo, 1965; Damman, 1978; Clymo, 1987; Urban et al., 1990), several studies have provided evidence indicating that Pb, once deposited on a peat bog, does not migrate within the peat column (Hvatum et al., 1983; Livett et al., 1979; Livett 1988; Clymo et al., 1990). Until agreement is reached, in the question of Pb mobility in peat, prudence dictates that the 210pb

HISTORICAL RATES OF ATMOSPHERIC Pb DEPOSITION 91
dates be corroborated with some other independent dating method (cf., Urban et al., 1990), such as pollen (Urban et al., 1989; Cole et aL, 1990; Wieder et al., 1994), upward extrapolation of 14C dates of deeper sections in a peat deposit (e.g., Cole et al., 1990), pesticides (Rapaport et al., 1985; Rapaport and Eisenreich, 1986), or acid-insoluble ash (Urban, 1983; Urban et al., 1989).
In this study, we present information regarding the history of atmospheric Pb deposition at two sites in the Czech Republic, based on analyses of 21~ dated, pollen corroborated peat cores. Although we use Pb as an example, the principles apply to other metals as well. Additionally, we suggest that acid-insoluble ash (AIA), which was used by Urban (1983) as a dating technique per se, may be more useful as an interpretive tool which may provide insights into the nature or sources of atmospherically deposited Pb.
2. Study Sites
The two sites, Bo~.f Dar Bog (50~ 12~ and Jezerni sla[ (49~ 13 ~ 36'E) are located in the Czech Republic and have a predominantly Sphagnum- derived peat deposit. There is little living Sphagnum at these sites today, and there- fore no current Sphagnum peat accumulation. Both bogs are situated in regions with past peat mining activity, but both the Bo~i Dar Bog and the Jezernl sla[ cores were collected from undisturbed regions within each bog. Dwarf pine (Pinus mugo) and grasses are the dominant vegetation, and both directly incident precipitation and upland runoff provide inputs of water to the bogs (NovAk and Wieder, 1992). Mean annual precipitation is 850 and 760 mm for Bo~f Dar Bog and Jezerni sla~, respectively. Bo~f Dar Bog covers 81 ha and its peat deposit reaches a maximum depth of 5.5 m; Jezernf sla[ is a 156 ha bog with a 1 m thick floating mat on top of a lake (Novfik, 1990). Jezernf sla[ is located between the towns of Kvilda and Horsk~ Kvildq and Bo~f Dar Bog is located between the towns of Bo~f Dar and Blatn~. Whereas Jezernf sla~ is located in the relatively pristine Sumava Moun- tains of southern Bohemia at an elevation of 1070 m, Bo~f Dar Bog is located in the Kru~n6 hory Mountains of northern Bohemia, one of the most air polluted regions of Europe (Moldan and Schnoor, 1992). Total atmospheric Pb deposition throughout Bohemia and Moravia averages 10 mg m -2 yr- 1, with somewhat higher values in the extremely polluted mountainous region where Bo~f Dar is located and lower values in the relatively pristine area where Jezernf sla[ is located (Moldan, 1991).
3. Methods
In October 1989, one 40 cm long peat core was collected from each peatland using a 10 cm diameter PVC cylinder with a sharpened bottom edge. Insertion of

92 MELANIE A. VILE ET AL.
the PVC cylinder into the peat was facilitated by first cutting through the fibrous surface peat with a sharp bread knife, and care was taken to minimize compaction. If compaction caused the top of the peat core to be more than 4 cm from the peat surface, the core was abandoned and another attempt to extract a core was initiated. After excavating the peat external to the PVC cylinder, the bottom of the cylinder was covered by hand and the entire cylinder was lifted from the peatland. In the field, each core was extruded and sliced into 2 cm sections. Each section was placed into a plastic bag which was sealed after removing entrained air, placed under refrigeration, returned to the laboratory, and then frozen. All analyses were carried out on peat samples that were freeze-dried and homogenized by grinding to pass a 2 mm mesh screen in a Tecator Cyclotec sample mill.
Peat profiles were 21~ dated using acid digestion of peat (W.R. Schell, personal communication) and application of the constant rate of supply (CRS) model of Appleby and Oldfield (1978). A 3 g subsample from each 2 cm section, along with approximately 15 dpm of Z~ as a chemical yield tracer, was digested using concentrated HCI, concentrated HNO3, and H202. The Pb and Po isotopes were plated onto silver discs for activity measurement on an ORTEC 576 alpha spectrometer. In using the CRS model to date the cores, each date has an error term which comprises both counting error and propagated error associated with fitting the CRS model to the data. The magnitude of the error term increases with depth (Schell 1987). In this paper, depths for which the error term exceeded the estimated age (yr) of the section were not included in the construction of core chronologies.
Peat profiles were analyzed for Pb content by digesting 0.5 g of peat from each 2 cm section, using concentrated HC1 and 50% H202 to solubilize and destroy organic matter, respectively (Schell, personal communication). The resulting mix- ture was evaporated to near dryness, flushed with 0.3 M HC1 into a 25 mL volu- metric flask, and filled to volume. Lead concentrations in the final 25 mL solutions were determined by atomic absorption spectrophotometry using an air-acetylene flame. ~,ead concentrations were then converted to deposition rates by means of the bulk densities and radiogenic ages of the individual 2 cm depth intervals. The HC1/H2Oa digestion procedure was verified by determining Pb concentrations in river sediment (National Institute of Standards and Technology standard reference material #1645). Lead concentrations (#g g- 1) in the river sediment were 714 i28 and 6934-0.20 (mean 4- standard error, n = 5), as determined by NIST and the HCI/HaO2 digestion procedure, respectively.
Peat profiles were analyzed for pollen composition by digesting 0.1 g for humi- fled peat (below 8 cm) and 0.2 g for non-humified peat (above 8 cm) from each 2 cm section in HF acid to destroy organic matter (Overbeck, 1958), and acetolysis using a modified procedure from Erdtman (1943, 1954) to dissolve cellulose and other organic remnants which otherwise hamper counting of individual pollen grains and spores. The resulting pollen mixture was then placed on a smear glass along with a mixture of glycerin, ethanol and water for counting and identification of pollen and

HISTORICAL RATES OF ATMOSPHERIC Pb DEPOSITION 93
net
0
2
4
6
8
10
12
14
16
Year
u ! | i i ! 0 i ! i !
�9 Bo~.i Dar [ - -~-- - Jezerni sla[
",,
~ M
Fig. 1. Year/depth depiction of the 21~ based chronologies. The horizontal bars associated with 210 each data point represent error terms which comprise both Pb counting error and propagated error
associated with fitting the CRS model to the 21~ data.
spores. Approximately 500 arboreal pollen grains and usually a lower number of non-arboreal pollen objects were counted from each 2 cm section of each core.
Acid-insoluble ash (AIA) content for each 2 cm section was determined by subjecting a 0.5 g subsample to combustion at 550 ~ for 4 hr in a muffle furnace to destroy the organic matter. The resulting ash was digested in hot (135 ~ aqua regia (concentrated HC1 and concentrated HNO3, 3:1 v/v) for 1 hr (Urban, 1983). The digested mixture was filtered through Whatman No. 42 ashless filter paper and repeatedly rinsed. The ashless filter paper along with its retained residue was placed in a muffle furnace at 550 ~ for 4 hr. The material remaining after this step was referred to as AIA.
Magnetic susceptibility measurements were carried out on subsamples of dry peat from each 2 cm section. For each subsample between 0.5-2.0 g of dry peat was packed into a 16.4 cm 3 plastic sample cube and placed into a Sapphire Mag- netometer for magnetic susceptibility determination.

94 MELANIE A. VILE ET AL.
4. Results and Discussion
4.1. POLLEN ANALYSIS
Prior to using 210pb to calculate historical rates of atmospheric metal deposi- tion, some independent approach should be used to verify that the 21~ based dates for the various depth intervals (Figure 1) are valid (Urban et al., 1990). For North American peat deposits, aspects of pollen profiles, notably the appearance of Ambrosia pollen associated with European colonization or the disappearance of Castanea dentata (American chestnut) pollen associated with the progression of chestnut blight (Urban et al., 1989; Cole et al., 1990; Wieder et al., 1994) have provided key markers. Although comparable single species markers with clearcut increases or decreases in abundance over relatively short time periods are not avail- able for use in corroborating the Zl~ chronologies at our two Czech sites, known historical changes in forest structure and in agriculture within the Czech Republic may be reflected in the pollen profiles, and thus may be useful in corroborating the 21~ chronologies.
Pollen analysis enables the classification of the peat profile at Jezerni sla~ as having originated in the Younger Stage of the Upper Subatlantic period (Xb, 1200 AD to present; Firbas 1949, 1952). The peat core from Bo~i Dar Bog extends from the Lower Subatlantic (IX, 28-32 cm, 800 BC to 500 AD), through the Younger Stage of the Upper Subatlantic (Xb, above 22 cm; cf. Bi'izowi, 1993). Of relevance with regard to corroboration of 21~ dates is that the Upper Subatlantic period is characterized by gradual human disturbances, altering the aboriginal vegeta- tion which was dominated by Fagus, Abies, and Picea, with a minor admixture of other hardwood species including Quercus, Ulmus, Corylus, Tilia, and Betula (Jankovskti, 1992). Historical records show that human disturbances to the abo- riginal forests date back to the 16th century, but of particular significance is the beginning of the practice of replacement of harvested stands with large scale plant- ing of a single species in the 1760's (No~i~ka, 1957). Complete forest renewal by the establishment of monocultures (mostly Pinus and Picea) dates to the second half of the 19th century. By 1938 approximately one third of the land in Czechoslovakia was covered by conifer plantations (Hermann 1975). The documented progressive destruction of the native forest with replacement by conifer monocultures, occur- ring between the late 1700's and continuing through the mid-1900'S, is clearly reflected in the pollen profiles at both Jezerni sla~ and Bo~i Dar Bog, especially with regard to the decrease in Fagus pollen abundance and the attendant increase in Pinus pollen abundance (Figures 2 and 3).
Bohemian agriculture is known to have experienced periods of consider- able productivity after 1780 when the Patent of Serfdom abolished many feudal impediments. Agricultural production of cereals continued to increase during the Napoleanic Wars, was interrupted by the financial crash in 1811 and the unfavorable tax reform of 1817, began to boom after the economic and industrial expansion

HISTORICAL RATES OF ATMOSPHERIC Pb DEPOSITION 95
from 1848-1860, and continued to increase (Bradley, 1971). Although by 1900 more people were employed in agriculture than in industry and between 1870 and 1913 per hectare yields doubled (Bradley, 1971), from the early 1920's through 1947 the population employed in agricultural practices progressively declined (Busek and Spulber, 1971). These historical changes in Bohemian agriculture are clearly reflected in the changes in Cerealia pollen in the 21~ Jezernf sla~ profile (Figure 2). The area around Bo~f Dar Bog is less suited for grain produc- tion (Busek and Spulber, 1957); evidence of cereal grain production in the Bo~i Dar Bog pollen profile does not appear until the mid 1800's (Figure 3), the time of considerable economic and industrial expansion and an attendant increase in agricultural productivity.
Finally, we note that Agrostemma githago, a field weed which first appeared in Czech lands after the discovery of America, was successfully suppressed in the 1950's and today is virtually absent in the Czech Republic. At Jezernf sla~, Agrostemma githago pollen was found at 24-26 cm (beyond the range of 21~ dating) and at 6-8 cm (dated at 1897), but not at any shallower depths (Figure 2).
Another important feature of the pollen diagrams is the appearance of a large amount of Calluna vulgaris and Ericaceae pollen simultaneously with a dramatic decrease in the percentage of Sphagnum spores, indicating a gradual degradation of the bog ecosystems (Figures 2, 3). The onset of degradation is evident at similar depths for the two sites, but is more striking at Bo~f Dar Bog than at Jezernf sla~. From 1800 to the present Sphagnum decreases from 60 to 0 % of total pollen and from 20 to 0 % of total pollen at Jezernf sla~ and Bo~f Dar Bog, respectively (Figures 2, 3). The fact that both bogs presently are not accumulating Sphagnum- derived peat is evident from the pollen diagrams. Moreover, the pollen diagrams reflect the greater anthropogenic impact on Bo~.f Dar Bog than on the Jezernl sla~ bog ecosystem (Figures 2, 3).
Based on concordance between the known history of anthropogenic impacts on the forested ecosystems and the known history of agriculture, especially with regard to cereal crops, within the Czech Republic, we conclude that palynological analysis has corroborated the 21~ chronologies.
4.2. COMPUTATION OF ATMOSPHERIC PB DEPOSITION
Despite the potential usefulness of 210pb dating, in that 21~ dating of an intact peat core yields a date for each depth increment, calculated Pb deposition values can differ considerably depending upon the computational approach taken. Each 21~ date corresponds to the average date of a particular 2 cm section, and hence most appropriately applies to the midpoint depth of each section, viz. 1 cm, 3 cm, 5 cm, and 7 cm in the example given in Figure 4. Subtraction of the 21~ date of the 0-2 cm section from the date of core collection (1989), along with subtraction of 21~ dates for adjacent sections gives values for the number of years over which the 0-1, 1-3, 3-5, and 5-7 cm sections accumulated (Figure 4). Contrastingly, Pb

96 MELANIE A. VILE ET AL.
0 0 5
2 ' 4 6 ' 8
~ 10 ~ 12
e~ 16 18 2 0 2 2 24 26
0
6 8
~10 ~2
16 18 20 22 24 26
15 25 35 45
~ ~ < ~
55 0 5 " 7 ' '
15 2 5 0 5 0 5 1 0 0 5 0 5 0 5 0 5 1 5 0 5 1 5 0 10 20 30 4 0 0 5 1 0 0 5 1 0 " ~ "-'"' .Fraxinu~ 0.34
Juniperu$ 0.14 7Juglarg 0.15
. ? Juglans 0.48 15 .Juniperus 0.15
Fraxinus 0.15 Populus type 0.17
I [ F r a x i n u s O . 1 4 "Fr~m~ 0.16
Tiliacordata 0.17
o ~s
50 5 0 5100 50 50 5 0 5 0 5 0 5 0
/
.e:
1 5 0 5
.o, +
0 5 1 0 0 5 fir- I ssg
2 1 1575"
6== ,TN
o 10 522 1 2 1 1 1 - 553
14 f 1 6 . 16 ! "
20 ~- 18 - 612
22 17~ 1625
24 , �9 26 1655
1 5 0 5 0 5 1 0 0 5 1 0 0 5 1 0 0 5 1 0 0 10 2 0 0 5 1 5 0 5 1 0 0 5 1 0
b !'i ---r- ~---r-~gnaut/a - type 0.34
",L ? . , t?ros~e~a gi~go 0.42,
I �9 I "UrCica 0.15
7 --):Urt/ca 0.89.
" "Urtica 0.16,
i
25 35 0 5100 5 1 0 0 5 0 5
\ X /
i
"~ I 4icrothvrium microscoptcum 0.30
~yco ium ~ u m 0.15
4i<roth rium nucro coptum 0.17 4icrot~n~num rracrosgopmm 0.15 "~ : o .1 7
, >
Agrostemma githa go 0.15 Potamogeton 1.07
Pinus = = = AP i i Betula -o--tr-o- t----"n NAP t l Cyperaceae : : : Poaceae ..o--o-o- AP/NAP
AP NAP 0 I0 20 30 40 50 60 70 80 90 100%
12 14 16 18 20 22 24 26
Fig. 2. Pollen diagram for Jezemi sla[. Percentages are based on the sum of the arboreal and the nonarboreal pollen, excluding spores and microscopic remnants of species. Spores and microscopic remnants are expressed as percentages of arboreal plus nonarboreal pollen. The percentage axes should be divided by 10 for profiles plotted in white instead of black. For nonarboreal pollen (NAP), only additional species whose percentages are greater than 0.20 for at least one depth are shown in the Figure; asterisks indicate additional species, and percentage of total pollen for the following depths: 2-4 cm, Comarum O. 17, Potentilla O. 17, B idens 0.17, and Humulus-Cannabis 0.17; 4-6 cm, Utricularia 0.16, Comarum 0.16, Rubiaceae 0.16, Humulus-Cannabis 0.16, Urtica 0.16; 6-8 cm, Myriophyllum verticillatum 0.14, Agrostemma githago 0.42, Centaurea cyanus 0.14, Plantago sp. 0 .15 ; 8 - 1 0 cm, Filipendula 0.15, C aryophyllaceae 0.15, B oraginaceae 0.15, Humulus-Cannabis O. 15, Polemonium-type 0.15; 10-12 cm, Myriophyllum spicatum 0.16, Comarum 0.16, Rubiaceae 0.16; 16-18 cm, Comarum 0.15, Bistorta 0.15; 18-20 cm, Centaurea cyanus 0.17, 20-22 cm, Centaurea cyanus O. 16.

~" ~
=
~
~o
,~
o
~.
~o
~
~"
"" r
o
~'o
~
o~
~"
~"
'• CO
~
~
o
~
o_
~
Dep
th (
cm)
~ ~
__
~
Var
la
'~' ~
N'N
'~',~
'~"~
'~'~
'~,'~
' '~
'~,%
' z
~ §
NA
P
' ~
~ ~
t~ P
olyp
odia
ceae
phag
num
~ A
scom
ycet
es
]~ T
tlle
la sp
hagm
J~ A
mph
itrem
a fla
vum
"~ ]~
Neb
ella
I~ A
rcel
la ttt
t
Depth (cm)
....
....
]~
Po
acea
e
~ ]o
C
yper
acea
e
~ R
....
. la
ccae
J~
~ Fa
bace
ae
" -
J~
Ast
erac
eae
Ligu
liflo
rae
~ J~
A
ster
acea
e Tu
bulif
lora
e ~
l
- _
_
IIII
1~
Eric
acea
e
~ ~
Cal
luna
vul
gari
s , ~
.,
----
----
~ B
~i~
a~
i
J~
Cen
taur
ea c
yanu
s �9
o Jt~
Plan
|ago
lanc
eola
~a -
type
,
Plan
tago
maj
or-m
edia
- ty
pe
--]~
U
rtic
a
]~
Rum
ex
g
Arte
mes
ia
Cer
ealia
sp.
I
J~
Cer
ealia
T, T
rffic
um
t.-."
----
---~
.~ ~
Cer
ealia
T, S
ecal
e '~
.~! ~
~
~ ~
~'~"
~-
~ ~
o~
~
o~
. o,
.
z 't,
~p
th (
r
, Pin
us
"'4
~ v
__
v ~
V
V
~ Be
tula
J~ c
o,r;
,,
J ~ Q
....
.
J ~ T
ilia
plat
yehy
llos
,J~A
cer
t ~ Pl
cea
~ Fag
us
~~
C
arpi
nus
.q
z~
7~
..] 5 z D

98 MELANIE A. VILE ET AL.
Interpolated 210pb date of date 2 cm section
1977.0 1965.1 . . . . . . . . .
1953.2 1941.9 . . . . . . . . .
1930.6 1925.1 . . . . . . . . .
1919.5 1901.6 . . . . . . . . .
Calculation of Pbcontent Interpolated Depth Calculation of Pb content per i cm section Pb content (cm) per 2 cm section (pg) (Itg)
I•'•--* O p g P ~ 405 ~ 5 4 pg Pldgdm= 81 ~Of I -- -- --- 1923
--2288 I 183 It 8 I~ldgd m = 4 S 7 ~ -4701
..25 grim" 193 p8 Pblgdm = 4825 pg PbJ "224/33""
Pb Deposition = grams dry mass (gdm) * Pb concentration (llg/gdm) / surface area (78.54 cm 2 ) / number of years per section
Fig. 4. Schematic representation of the top 8 cm of the BoLl Dar Bog core. The core was collected in 1989, which thus is the date at 0 cm. For each 2 cm section the total Pb content (corresponding to 0-2, 2-4, 4-6, and 6-8 cm intervals) and 21~ dates (corresponding to 1, 3, 5, and 7 cm) were determined; actual measured values are represented in bold face type whereas all interpolated values are italicized.
contents represent the total amount of Pb contained in each 2 cm section of the core; Pb content values correspond to depth intervals of 0-2, 2-4, 4-6, and 6-8 cm (Figure 4). In calculating Pb deposition, the number of years over which a particular section accumulated along with Pb content of the same section is needed. However, as is evident from Figure 4, the depth increments for number of years over which a section accumulated (0-1, 1-3, 3-5, and 5-7 cm) and the depth increments for Pb content of a section (0-2, 2-4, 4-6, and 6-8 cm) are offset by 1 cm. To calculate Pb deposition, adjustment must be made to correct for this 1 cm offset, using either date interpolation or Pb interpolation.
The traditional approach to correcting for the 1 cm offset involves interpolating the dates for the top and bottom of each 2 cm section by averaging the 21~ date for a particular section with the 2t~ dates of the overlying and underlying sections, respectively (Figure 4). The difference between the interpolated dates for the top and bottom of each 2 cm section represents the number of years over which the peat in that particular section accumulated. Having corrected for the ! cm offset by date interpolation, the age values in the deposition versus date plots in Figures 5A and 5B ( - - I I - - ) correspond to the interpolated date at the bottom of each 2 cm section.
As an alternative method for correcting for the 1 cm offset we suggest a new method, Pb interpolation, which involves dividing the total quantity of Pb in each 2 cm section (0-2, 2-4, 4-6, and 6-8 cm) in half, presumably corresponding to the Pb content in each of two 1 cm sections, and recalculating the Pb contents for the 0-1, 1-3, 3-5, and 5-7 cm sections. Having corrected for the 1 cm offset by Pb interpolation, the age values in the deposition versus date plots in Figures 5A,

HISTORICAL RATES OF ATMOSPHERIC Pb DEPOSITION 99
Pb Depos i t i on (mg m "2 yr .1)
0 5 10 15 20 0 1990 . . . . 1990'
1970
1950
1930
191o
1890
1870
1850
1830
1810
1790
1970 n ~ 1950
1930
1910
1890
1870
1850
1830
1810 A 1790
10 20 30 40 50 60 I I I | I I
k
B
0 5 10 15 20 25 0 10 20 30 40
1990 . . . . . . 1990 . . . . .
1970 ~ 1 9 7 0 ~
1950 ..................... I 1 9 5 0 ~
1930 19301
~ 191018701890 1870-1890"1910 ~ i
1830. 1830j: 1810 - 1810q
C 1790 - 1790 a
50 60 70 i ! i
D
Jezernf sla[ Bo~f Dar
Fig. 5. Lead deposition as a function of date by interpolation of date (--I--), and interpolation of Pb content (--Vq--) for (A) Jezernf sla[ and (B) BoZf Dar Bog, and Pb deposition as a function of date using both date and Pb interpolation for (C) Jezernf sla[ and (D) BoZf Dar Bog. The heights of the horizontal bars represent the number of years over which each 1 cm section of peat accumulated.

100 MELANIE A. VILE ET AL.
and 5B(--E]--) correspond to the original 21~ dates at the midpoint of each 2 cm section.
Note that the shape of the deposition versus age plots is different depending upon whether date or Pb is interpolated to correct for the 1 cm offset (Figure 5A, B). For example, if Pb is interpolated, a sharp increase in Pb content between the 0-2 and 2-4 cm sections for Jezernf sla~ (Figure 6A) results in a flattened Pb deposition peak (Figure 5A) because the Pb content for the 1-3 cm section was calculated by averaging the Pb content values for the 0-2 and 2-4 cm sections. Similarly, if date is interpolated at Bo~i Dar Bog, a sharp decrease in the number of years per section between the 5-7 and 7-9 cm section (Figure 6D) also results in a flattened Pb deposition peak relative to the peak that results if Pb instead is interpolated (Figure 5B). Interpolation of either date or Pb content throughout an entire peat core has the potential to result in confounded deposition values. We see no a priori reason for choosing one method of interpolation over the other method, and suggest a new approach of interpolating both the dates and the Pb contents for the entire peat core (Figure 5C, D). Interpolation of both Pb content and date not only preserves peaks in Pb deposition that would otherwise be flattened if only one of the two variables were interpolated, but also provides twice the amount of information in that Pb deposition is estimated for doubly interpolated 1 cm depth intervals, rather than for 2 cm intervals using only date or Pb interpolation.
4.3. ACID-INSOLUBLE ASH: CORROBORATION AND INTERPRETATION
Acid-insoluble ash (AIA) is the acid-insoluble residue remaining after peat is subjected to combustion at 550 ~ for 4 hr and the ash dissolved in hot aqua regia (Urban, 1983). Acid-insoluble ash consists mainly of refractory oxides and silicates, which are the basic components of soil. Urban (1983) dated peat cores using AIA by assuming the AIA content in individual peat sections to be conservative (i.e., chemically inert and immobile in the peat column) and to have a constant rate of input to the bog, where the input rate was determined from the amount of AIA in one year's growth of vegetation.
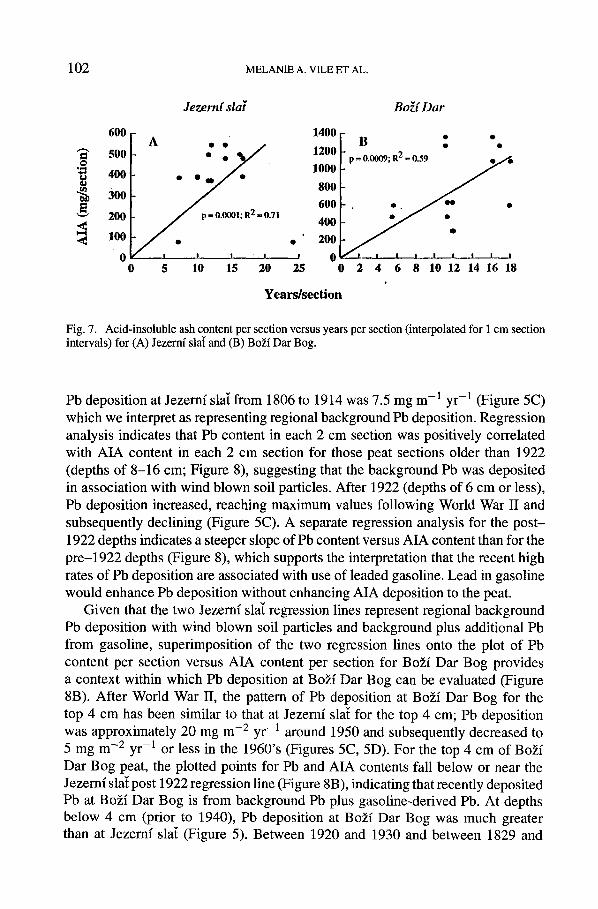
If AIA represents a valid dating technique per se, it can be used to corroborate the 21~ dates, specifically by regressing the AIA content for each core section against the number of years over which the peat in each section accumulated (as determined from the 21~ dates) with the stipulation that the regression line pass through the origin. The regressions were significant for both sites (Figure 7), but we note that considerable deviations of the data points from the regression lines indicate that the input of AIA per year is not constant throughout either core. There are two possible explanations for the variability in the yearly inputs of AIA: (1) either the inputs of AIA are not constant from year to year, or (2) the inputs of AIA are constant and the 21~ dates are not correct. We accept the former explanation as more tenable than the latter for two reasons. First, the 21~ dates for Jezernf sla[ and Bo~f Dar Bog were corroborated by pollen analysis (Figures
HISTORICAL RATES OF ATMOSPHERIC Pb DEPOSITION
�9 v Jezerm slat Bo~" Dar
101
,'-, 0-2 G "-" 2-4
~, 4-6
�9 ~ 8-10
10-12 eL
12-14
14-16
1 2 3 0 4 8 12 m m i i
B
Pb content (mg/per section)
A 0-2
2-4
*, I I I
8-10 l
10-12 l
12-14 l
" " 0-1
~'~ 1-3
3"5
5-7
'~ 7-9
~- 9-11
11-13
13-15
0 10 20 3O 20 30 40
O
Age (number of years per section)
40 0 10
' I C a-1
1-3 l
l I , - , i
7-9 l
9-11 l
11-13 l
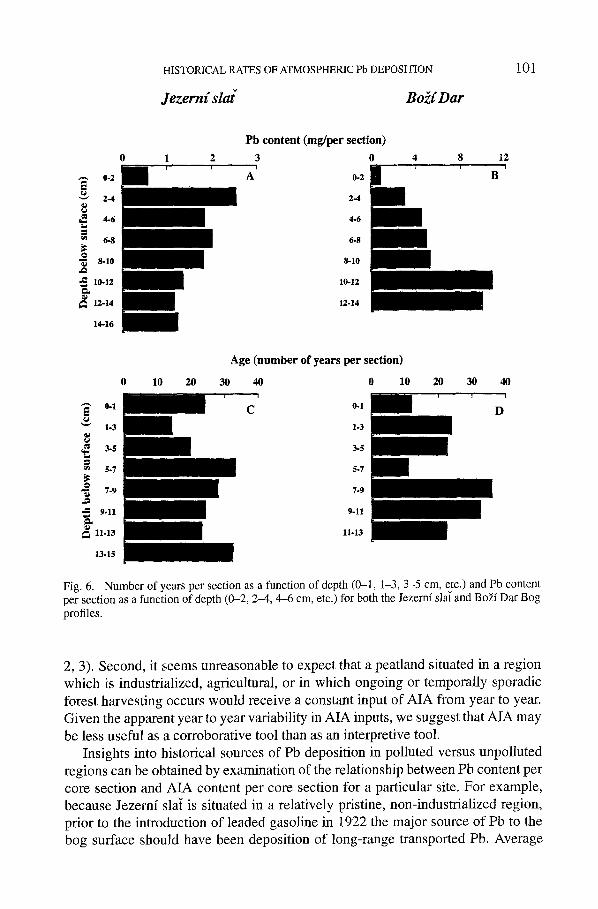
Fig. 6. Number of years per section as a function of depth (0-1, 1-3, 3-5 cm, etc.) and Pb content per section as a function of depth (0-2, 2--4, 4-6 cm, etc.) for both the Jezern/sla[ and Bo~/Dar Bog profiles.
2, 3). Second, it seems unreasonable to expect that a peatland situated in a region which is industrialized, agricultural, or in which ongoing or temporally sporadic forest harvesting occurs would receive a constant input of AIA from year to year. Given the apparent year to year variability in AIA inputs, we suggest that AIA may be less useful as a corroborative tool than as an interpretive tool.
Insights into historical sources of Pb deposition in polluted versus unpolluted regions can be obtained by examination of the relationship between Pb content per core section and AIA content per core section for a particular site. For example, because Jezemf sla{ is situated in a relatively pristine, non-industrialized region, prior to the introduction of leaded gasoline in 1922 the major source of Pb to the bog surface should have been deposition of long-range transported Pb. Average
102 MELANIE A. VILE ET AL.
600
500 0
'~ 400
300 ~'~ 200
,< 100
Jezernf sla?
1400 A , .
�9 . ~ / ~ / 1200
�9 * 1000
800
600 p = 0 . 0 0 0 ! ; R 2 _ 0 71
" ; - " 400
, 200
I I I I I 0
5 10 15 20 25 0
Years/section
Bo~( Dar
B �9 �9
0 .0009; R 2 ~ 0 .59
2 4 6 8 10 12 14 16 18
Fig. 7. Acid-insoluble ash content per section versus years per section (interpolated for 1 cm section intervals) for (A) Jezernf sla[ and (B) Bo~f Dar Bog.
Pb deposition at Jezemf sla~ from 1806 to 1914 was 7.5 mg m - t yr -1 (Figure 5C) which we interpret as representing regional background Pb deposition. Regression analysis indicates that Pb content in each 2 cm section was positively correlated with AIA content in each 2 cm section for those peat sections older than 1922 (depths of 8-16 cm; Figure 8), suggesting that the background Pb was deposited in association with wind blown soil particles. After 1922 (depths of 6 cm or less), Pb deposition increased, reaching maximum values following World War II and subsequently declining (Figure 5C). A separate regression analysis for the post- 1922 depths indicates a steeper slope of Pb content versus AIA content than for the pre-1922 depths (Figure 8), which supports the interpretation that the recent high rates of Pb deposition are associated with use of leaded gasoline. Lead in gasoline would enhance Pb deposition without enhancing AIA deposition to the peat.
Given that the two Jezernf sla~ regression lines represent regional background Pb deposition with wind blown soil particles and background plus additional Pb from gasoline, superimposition of the two regression lines onto the plot of Pb content per section versus AIA content per section for Bo~f Dar Bog provides a context within which Pb deposition at Bo~f Dar Bog can be evaluated (Figure 8B). After World War II, the pattern of Pb deposition at Bo~f Dar Bog for the top 4 cm has been similar to that at Jezemf sla~ for the top 4 cm; Pb deposition was approximately 20 mg m -2 yr -1 around 1950 and subsequently decreased to 5 mg m -2 yr -1 or less in the 1960's (Figures 5C, 5D). For the top 4 cm of Bo~f Dar Bog peat, the plotted points for Pb and AIA contents fall below or near the Jezerni sla~ post 1922 regression line (Figure 8B), indicating that recently deposited Pb at Bo~f Dar Bog is from background Pb plus gasoline-derived Pb. At depths below 4 cm (prior to 1940), Pb deposition at Bo~f Dar Bog was much greater than at Jezernf sla~ (Figure 5). Between 1920 and 1930 and between 1829 and

HISTORICAL RATES OF ATMOSPHERIC Pb DEPOSITION 103
~" 3.0 o
2.5
2.0
"~ 1.5 g ~ 1.o
= 0.5 o rO ,-, 0
t~
Jezernf sla[ �9 post
A / ' 1922 12
., 10
,,,/ 7 .~ pre 8 ./,," 5 . . . , ,~" 1922
/~* 1L 4.,I" 6
/ . j " 2
/ " " , , , , , i 0 0 0.2 0.4 0.6 0.8 1.0 1.2
Bo~f Dar
B I1 13
~ n TM ' ! I I I I
0 0.5 1.0 1.5 2.0 2.5 3.0
Acld-insoluble Ash Content (g/2 cm section)
Fig. 8. Lead content versus acid-insoluble ash content for 2 cm sections at (A) Jezernf sla[ and (B) Bo~f Dar Bog. Data points are plotted as numbers which correspond to the midpoint of the depth intervals for each core. The two regression lines for Jezernf sla[ represent pre-leaded gasoline (< 5 cm, pre-1922, y = 0.0025x, p = 0.003, R 2 = 0.97) and post-gasoline (> 7 cm, post 1922, y = 0.0015x, p = 0.0003, R 2 = 0.97) eras. These two regression lines were then superimposed on the Bo~f Dar Bog plot.
1851, Pb deposition at Bo~i Dar Bog was especially high, approaching 60 mg m -2 yr -1 (Figure 5D). These elevated Pb deposition values were recorded at peat depths where the plotted points for Pb and AIA contents were well above either the post-1922 or pre-1922 Jezerni sla~ regression lines (Figure 8). Assuming that deposition of gasoline-derived Pb is similar at Jezerni sla~ and Bo~i Dar Bog, the most likely source of past high Pb deposition to Bo2i Dar Bog is particulate dust from local mining activity. Mining-derived dust would be expected to have higher Pb concentrations than background soil derived particles, and hence would displace plotted points in Figure 8 upward toward more positive Pb-content values.
In addition to being located in both a highly industrialized region within the Czech Republic and within one of the most air-polluted areas in the world (Moldan and Schnoor, 1992), the area in the vicinity of Bo~f Dar Bog contains several types of ore deposits (Kratochvfl, 1943; Bernard and Pouba, 1986). While there is no active mining in the region today, many of these ore deposits have been exploited sporadically over the past 200 y. In the 19th century, small veins of galena (PbS), sphalerite (ZnS), and chalcopyrite (FeCuS2) were mined by hand by local people. Although there is no clear indication of when this mining activity occurred, in 1833, K. Chotek, the Governor of Bohemia, founded the Bohemian Association for the Encouragement of Industry, which created a full industrial explosion that continued for 20 y (Bradley, 1971). Also, 1 km from Bo~i Dar Bog is the 'Golden Hill,' a skarn deposit consisting of magnetite (Fe304), SnO2, ZnS, PbS, and FeAsS. In this century, Joachimstal was operated as an U mine, exploiting the same ore veins from which Madame Curie discovered Po and Ra (1898); later exploitation

104 MELANIE A. VILE ET AL.
Magnetic Susceptibility [(Cgs x lO'5)/g]
0-2. 0 2
if' 2
f 12
14
16
Jezernf sial
4 6 8 w
10 12 -2 0
6
8
I0
12
14
16
Bo~f Dar 0 2 4 6 8 10
i /> 12
Fig. 9. Magnetic susceptibility as a function of depth for Jezernf sla[ and Bo~i Dar Bog. Values represent mean 4- standard error for 3 replicate measurements per depth interval.
of these deposits may have resulted in high Pb deposition observed from 1920 to 1930. The known history of local mining is consistent with peaks in Pb deposition at Bo~f Dar Bog (Figure 5).
Magnetic susceptibility provides another tool for interpreting the history of Pb deposition. During combustion of fossil fuels, hematite and magnetite minerals are released to the atmosphere and can then be deposited in a bog. Because mag- netite and hematite have magnetic properties, the presence of these minerals in peat as determined by magnetic susceptibility measurements, indicates combus- tion products have been deposited to the surface of the bog. Magnetic susceptibility measurements indicate that combustion products have not contributed greatly to Pb deposition at Jezerni sla[, while at Bo~i Dar Bog combustion of fossil fuels has contributed Pb to the bog, especially in the post World War II years (Figure 9).
5. Conclusions
Although al~ dating of Sphagnum-dominated peat cores has been criticized because of concerns of Pb mobility, for these two Czech sites, pollen analysis corroborates the al~ dates. There are two approaches available for calculating Pb deposition, the traditional date interpolation and our newly proposed Pb interpola- tion. Not only is there no a priori reason to preferentially use one over the other, but also simultaneous use of both date and Pb interpolation provides a more detailed and accurate record of historical rates of heavy metal deposition. Acid-insoluble ash may be less useful as a corroborative tool than as an interpretive tool. Rela-

HISTORICAL RATES OF ATMOSPHERIC PB DEPOSITION 105
tionships between AIA content and Pb content in core sections may allow for the
differentiation between background Pb deposited as soil-derived particles, deposi- tion o f gasoline-derived Pb, deposition of combustion-derived Pb, and deposition of Pb as particulate dust from local mining.
Acknowledgments
This work was supported by the U.S. Environmental Protection Agency (Grant R-812379) , and by the National Science Foundation (Grant BSR-9020583) , and by the Depar tment of Biology, Villanova University. We thank Dr. William Harbert for his assistance and allowing us to make magnetic susceptibility measurements in the Paleomagnet ism Laboratory at the University of Pittsburgh. We thank Dr. Franti~ek Veselovsk~, Czech Geological Survey, and Dr. Bed~ich Moldan, Charles University, Prague for facilitating the collection of peat cores.
References
Appleby, P. G. and Oldfield, E: 1978, 'The Calculation of 21~ Dates Assuming a Constant Rate of Supply of Unsupported 21~ to the Sediment', Catena 5, 1-8.
Bernard, J. H. and Pouba, A.: 1986, Ore Deposits and Metallurgy of the Czechoslovak Part of the Bohemian Massif, Academia, Prague.
Bradley, J. E N.: 1971, Czechoslovakia - A Short History, University Press, Edinburgh. Bi'fzov~i, E.: 1993, 'Reconstruction of Vegetation Succession of the Peat Bog Bo~f Dar Using Pollen
Analysis,' M.S., Geofund, Prague (in Czech). Busek, V. and Spulber, N.: 1957, Czechoslovakia, East-Central Europe Under the Communists,
Atlantic Books, New York. Clymo, R. S.: 1965, 'Experiments on Breakdown of Sphagnum in Two Bogs.' J. Ecol. 53, 747-758. Clymo, R. S. and Hayward, E M.: 1982, 'The Ecology of Sphagnum', in A. J. E. Smith (ed.),
Bryophyte Ecology, Chapman and Hall Publishers, London, pp. 229-289. Clymo, R. S.: 1984, 'The Limits to Peat Bog Growth', Phil. Trans. Royal Soc. Land. B 303,605-654. Clymo, R. S.: 1987, 'Interactions of Sphagnum with Water and Air', in T. C. Hutchinson and K.
M. Meema (eds.), Effects of Atmospheric Pollutants on Forests, Wetlands and Agricultural Ecosystems, Springer-Verlag, Berlin, pp. 513-529.
Clymo, R. S, Oldfield, E, Appleby, E G., Pearson, G. W., Ratnesar, E and Richardson, N.: 1990, 'The Record of Atmospheric Deposition on a Rainwater Dependent Peatland.', Phil. Trans. Royal Soc. Lond. B 327, 331-338.
Cole, K. L., Engstrom, D. R., Futyma, R. E and Stottlemeyer, R.: 1990, 'Past Atmospheric Deposition of Metals in Northern Indiana Measured in a Peat Core From Cowles Bog', Environ. Sci. Technol. 24, 543-549.
Damman, A.: 1978, 'Distribution and Movement of Elements in Ombrotrophic Peat Bogs', Oikos 30, 48(I--495.
Erdtman, G.: 1943, An Introduction to Pollen Analysis, Ronald Press, New York. Erdtman, G.: 1954, An Introduction to Pollen Analysis, Chronica Botanica Co., Waltham, Mas-
sachusetts. Firbas, E: 1949, Spat- und nacheiszeitliche Waldgeschichte Mitteleuropas nOrdich der Alpen, Allege-
meine Waldgeschichte, Jena. Firbas, E: 1952, Spat- und nacheiszeitliche Waldgeschichte Mitteleuropas nOrdich der Alpen.
Waldgeschichte der einzelnen Landschaften, Jena. Hermann, A. H.: 1975, A History of The Czechs, Penguin Books Ltd., London.

106 MELANIE A. VILE ET AL.
Hvatum, O. C., Br B. and Steinnes, E.: 1983, 'Heavy Metals in Norwegian Ombrotrophic Bogs', Environ. Biogeochem. 35, 351-356.
Jankovsk~i, V.: 1992, The History of the Kru~n6 hory Forests in the Post-Glacial Times, Lesnick6 pr~ice, 3, 73.
Kratochvfl, J.: 1943, Topographical Mineralogy of Bohemia, l~ivn~i~, Prague. Livett, E., Lee, J. A. and Tallis, J. H.: 1979, 'Lead, Zinc and Copper Analyses of British Blanket
Peats', J. Ecol. 67, 865-891. Livett, E. A.: 1988, 'Geochemical Monitoring of Atmospheric Heavy Metal Pollution: Theory and
Application', Adv. Ecol. Res. 18, 65-177. Madsen, P. P.: 1981, 'Peat Bog Records of Atmospheric Mercury Deposition', Nature 293, 127-135. Moldan, B. and Schnoor, J. L.: 1992, 'Czechoslovakia-Examining a Critically Ill Environment',
Environ. Sci. Technol. 26, 14-21. Moldan, B.: 1991, Atmospheric Deposition: A Biogeochemical Process, Academia, Praha. Norton, S. A.: 1987, 'The Stratigraphic Record of Atmospheric Loading of Metals at the Ombrotrophic
Big Heath Bog, Mt. Desert Island', in T. C. Hutchinson. and K. M. Meema (eds.), Effects of Atmospheric Pollutants on Forests, Wetlands and Agricultural Ecosystems, Springer-Verlag, Berlin, pp. 561-575.
Norton, S. A. and Kahl, J.: 1987, 'A Comparison of Lake Sediments and Ombrotrophie Peat Deposits as Long-term Monitors of Atmospheric Pollution', in T. P. Boyle (ed.), New Approaches to Monitoring Aquatic Ecosystems, ASTM, Philadelphia, pp. 40-57.
NovLk, M. J. V. and Wieder, R. K.: 1992, 'Inorganic and Organic Sulfur Profiles in Nine Sphagnum Peat Bogs in the United States and Czechoslovakia', Water, Air, and Soil Pollut. 65, 353-369.
Nov~tk, M. J. V.: 1990, 'Speciation of Sulfur and Vertical ~34S Profiles in Sphagnum-Dominated Wetlands: Indirect Evidence for Openness of the System Toward Buried Sulfur', M. S. Thesis, Villanova University, Villanova, Pennsylania.
No~i~ka, J.: 1957, The Development of the Czechoslovak Forests in Brief, Prague. Overbeck, F.: 1958, 'Pollen Analyse Quartarer Bildungen', in H. Freund (ed.), Handbuch der
Mikroakipie in der Technik, Frankfurt am Main. Pylv~infiinen, M.: 1993, Manual for Integrated Monitoring, Environmental Data Centre, National
Board of Waters and the Environment, Helsinki. Rapaport, R. A. and Eisenreich, S. J.: 1986, 'Atmospheric Deposition of Toxaphene to Eastern North
America Derived from Peat Accumulation', Atmos. Environ. 20, 2367-2379. Rapaport, R. A., Urban, N. R., Capel, P. D., Baker, J. E., Looney, B. B, Eisenreich, S. J. and Gorham,
E.: 1985, "'New" DDT Inputs to North America: Atmospheric Deposition', Chemosphere 14, 1167-1173.
Schell, W. R.: 1987, 'A Historical Perspective of Atmospheric Chemicals Deposited on a Mountain Top Peat Bog in Pennsylvania', Int. J. Coal Geol. 8, 147-173.
Schell, W. R., Sanchez, A. L. and Gruland, C.: 1986, 'New Data from Peat Bogs May Give a Historical Perspective on Acid Deposition', Water, Air, and Soil Pollut. 30, 393--409.
Urban, N. R., Eisenreich, S. J., Grigal, D. E and Schurr, K. T.: 1990, 'Mobility and Diagenesis of Pb and 21~ in Peat', Geochim. Cosmochim. Acta 54, 3329-3346.
Urban, N. R., Eisenreich, S. J. and Grigal, D. E: 1989, 'Sulfur Cycling in a Forested Sphagnum Bog in Northern Minnesota', Biogeochemistry 7, 81-109.
Urban, N. R.: 1983, 'The Nitrogen Cycle in a Forested Bog Watershed in Northern Minnesota', M. S. Thesis, Univ. of Minnesota, Minneapolis, Minnesota.
Wieder, R. K., Nov~lk, M. J. V., ScheU, W. R. and Rhodes, T.: 1994, 'Rates of Peat Accumulation over the Past 200 Years in Five Sphagnum-Dominated Peatlands in the United States', J. Paleolimnol 11, 1-13.