ENERGIJA U HRVATSKOJ ENERGY IN CROATIA
285
ENERGIJA U HRVATSKOJ GODIŠNJI ENERGETSKI PREGLED ANNUAL ENERGY REPORT ENERGY IN CROATIA ISSN 1847-0602 MMIX 2009
-
Upload
khangminh22 -
Category
Documents
-
view
2 -
download
0
Transcript of ENERGIJA U HRVATSKOJ ENERGY IN CROATIA

ENERGIJA U HRVATSKOJ GODIŠNJI ENERGETSKI PREGLED
ANNUAL ENERGY REPORT
ENERGY IN CROATIA
ISSN 1847-0602
MMIX
2009

ENERGIJA U HRVATSKOJ GODIŠNJI ENERGETSKI PREGLED
ANNUAL ENERGY REPORT
ENERGY IN CROATIA
2009
MMIX


Sadržaj Content

4
ENERGIJA MMIX
Predgovor
1. OSNOVNI PODACI, GOSPODARSKI I FINANCIJSKI POKAZATELJI
1.1. Osnovni statistički podaci Republike Hrvatske
1.2. Gospodarstvo Republike Hrvatske u 2009.
1.2.1. Pregled gospodarskih kretanja
1.2.2. Makroekonomski pokazatelji
1.2.3. Financijski pokazatelji u energetici
2. ENERGIJA U HRVATSKOJ 2009.
2.1. Uvod
2.2. Proizvodnja primarne energije
2.3. Uvoz i izvoz energije
2.4. Ukupna potrošnja energije
2.5. Energija za energetske transformacije
2.6. Proizvodnja transformiranih oblika energije
2.7. Gubici energetskih transformacija
2.8. Potrošnja transformiranih oblika energije
2.9. Energija za pogon energetskih postrojenja
2.10. Struktura ukupno utrošene energije
2.11. Neposredna potrošnja energije
2.12. Potrošnja energije u industriji
2.13. Potrošnja energije u prometu
2.14. Potrošnja energije u općoj potrošnji
3. NAFTA I DERIVATI NAFTE
3.1. Rezerve
3.2. Kapaciteti u naftnom sustavu
3.2.1. Proizvodnja i prerada
3.2.2. Transport Jadranskim naftovodom
3.2.3. Prodaja
3.2.4. Biogoriva
3.3. Energetske bilance tekućih goriva
3.4. Energetski subjekti
3.5. Cijene derivata nafte
4. PRIRODNI PLIN
4.1. Rezerve
4.2. Kapaciteti plinskog sustava i mreže
Foreword
1 GENERAL DATA, ECONOMIC AND FINANCIAL INDICATORS
1.1 Basic Facts About the Republic of Croatia
1.2 Economy of the Republic of Croatia in 2009
1.2.1 Overview of economic trends
1.2.2 Macroeconomic indicators
1.2.3 Energy sector financial indicators
2 ENERGY IN CROATIA 2009
2.1 Introduction
2.2 Primary Energy Production
2.3 Energy Import and Export
2.4 Total Primary Energy Supply
2.5 Energy Transformation Input
2.6 Energy Transformation Output
2.7 Energy Conversion Losses
2.8 Consumption of Transformed Energy Form
2.9 Energy Sector Own Use
2.10 Total Primary Energy Supply by Sectors
2.11 Final Energy Demand
2.12 Final Energy Demand in Industry
2.13 Final Energy Demand in Transport Sector
2.14 Final Energy Demand in Other Sectors
3 OIL AND OIL DERIVATES
3.1 Reserves
3.2 Oil Sector Capacities
3.2.1 Production and processing
3.2.2 JANAF pipeline transportation
3.2.3 Selling capacities
3.2.4 Biofuels
3.3 Energy Balances of Liquid Fuels
3.4 Energy Companies
3.5 Petroleum Product Prices
4 NATURAL GAS
4.1 Reserves
4.2 Gas Sector Capacities and Networks
7
13
15
16
17
25
26
33
35
40
46
51
57
63
68
71
79
84
89
93
99
104
111
113
113
113
114
115
116
117
134
135
137
139
139

5
ENERGY MMIX
4.2.1. Proizvodnja i prerada
4.2.2. Transport
4.2.3. Skladištenje
4.2.4. Distribucija
4.2.5. Opskrba
4.3. Energetska bilanca prirodnog plina
4.4. Energetski subjekti
4.5. Cijene prirodnog plina
4.5.1. Cijena dobave prirodnog plina za tarifne kupce
4.5.2. Cijene transporta prirodnog plina
4.5.3. Cijene skladištenja prirodnog plina
4.5.4. Cijene opskrbnim plinom tarifnih kupaca
4.5.5. Cijene distribucije prirodnog plina
5. ELEKTRIČNA ENERGIJA
5.1. Proizvodni kapaciteti i mreže
5.1.1. Kapaciteti za proizvodnju električne energije
5.1.2. Kapaciteti mreže
5.2. Energetska bilanca električne energije
5.3. Energetski subjekti
5.4. Cijene električne energije
6. TOPLINSKA ENERGIJA
6.1. Zakonodavno okruženje
6.2. Energetski subjekti
6.3. Energetska bilanca toplinske energije
6.4. Cijene toplinske energije
7. UGLJEN
7.1. Rezerve ugljena
7.2. Energetska bilanca ugljena i koksa
7.3. Cijene ugljena
8. OBNOVLJIVI IZVORI
8.1. Klimatološki pokazatelji
8.2. Kapaciteti
8.2.1. Registar OIE i kogeneracije
4.2.1 Production and processing
4.2.2 Transportation
4.2.3 Storage
4.2.4 Distribution
4.2.5 Supply
4.3 Energy Balances of Natural Gas
4.4 Energy Companies
4.5 Natural Gas Prices
4.5.1 Natural gas supply price for tariff customers
4.5.2 Natural gas transmission prices
4.5.3 Natural gas storage prices
4.5.4 Prices of natural gas supply to tariff customers
4.5.5 Natural gas distribution prices
5 ELECTRICITY
5.1 Generation Capacities and Networks
5.1.1 Electricity generation capacities
5.1.2 Network capacities
5.2 Energy Balance of Electricity
5.3 Energy Companies
5.4 Electricity Prices
6 HEAT ENERGY
6.1 Legal Framework
6.2 Energy Companies
6.3 Energy Balance of Heat Energy
6.4 Heat Energy Prices
7 COAL
7.1 Coal Reserves
7.2 Coal and Coke Energy Balance
7.3 Coal Prices
8 RENEWABLE ENERGY SOURCES
8.1 Climate Indicators
8.2 Capacities
8.2.1 Registry of RES and cogeneration
139
139
142
143
143
144
146
148
149
149
150
150
151
153
155
155
161
164
167
168
171
173
174
176
178
181
183
184
186
189
191
195
197

6
ENERGIJA MMIX
8.3. Proizvodnja električne energije
8.3.1. Visina tarifne stavke
8.4. Proizvodnja toplinske energije
8.5. Proizvodnja krutih biogoriva
8.6. Proizvodnja tekućih biogoriva
9. ENERGETSKA UČINKOVITOST
9.1. Indeksi i trendovi
9.2. Energetska učinkovitost u zgradarstvu
9.2.1. Sektor opće potrošnje
9.2.2. Zgradarstvo
9.3. Energetska učinkovitost u industriji
9.4. Energetska učinkovitost u prometu
9.5. Institucionalne aktivnosti u području energetske učinkovitosti
10. EMISIJE ONEČIŠĆUJUĆIH TVARI U ZRAK IZ ENERGETSKOG SEKTORA
10.1. Međunarodne obveze
10.2. Emisije u zrak
10.2.1. Emisija SO2
10.2.2. Emisija NOx
10.2.3. Emisija čestica
10.2.4. Emisija CO2
11. ENERGETSKE BILANCE
11.1. Energetske bilance po IEA metodi
11.2. Energetske bilance po EUROSTAT metodi
12. PRILOZI
12.1. Ogrjevne vrijednosti i pretvorbeni faktori
12.2. Skraćenice i akronimi
12.3. Skraćenice naziva zemalja
8.3 Electricity Generation
8.3.1 Tariff item
8.4 Heat Generation
8.5 Solid Biofuels Production
8.6 Liquid Biofuels Production
9 ENERGY EFFICIENCY
9.1. Indices and Trends
9.2 Energy Efficiency in Buildings Sector
9.2.1 Other consumption sectors
9.2.2 The buildings sector
9.3 Energy Efficiency in Industry Sector
9.4 Energy Efficiency in Transport Sector
9.5 Institutional activities in the field of energy efficiency
10 AIR POLLUTANT EMISSIONS FROM ENERGY SECTOR
10.1 International Obligations
10.2 Air Emissions
10.2.1 SO2 emission
10.2.2 NOx emission
10.2.3 Emission of particles
10.2.4 CO2 emission
11 ENERGY BALANCES
11.1 Energy Balances (IEA method)
11.2 Energy Balances (EUROSTAT method)
12 ANNEXES
12.1 Net Calorific Values and Conversion Factors
12.2 Abbreviations and Acronyms
12.3 Official Short Country Names
200
201
206
207
208
209
211
214
214
217
225
228
241
255
257
258
260
262
263
265
267
269
272
277
279
280
281

Predgovor Foreword
8
ENERGIJA MMIX
Dear Reader,
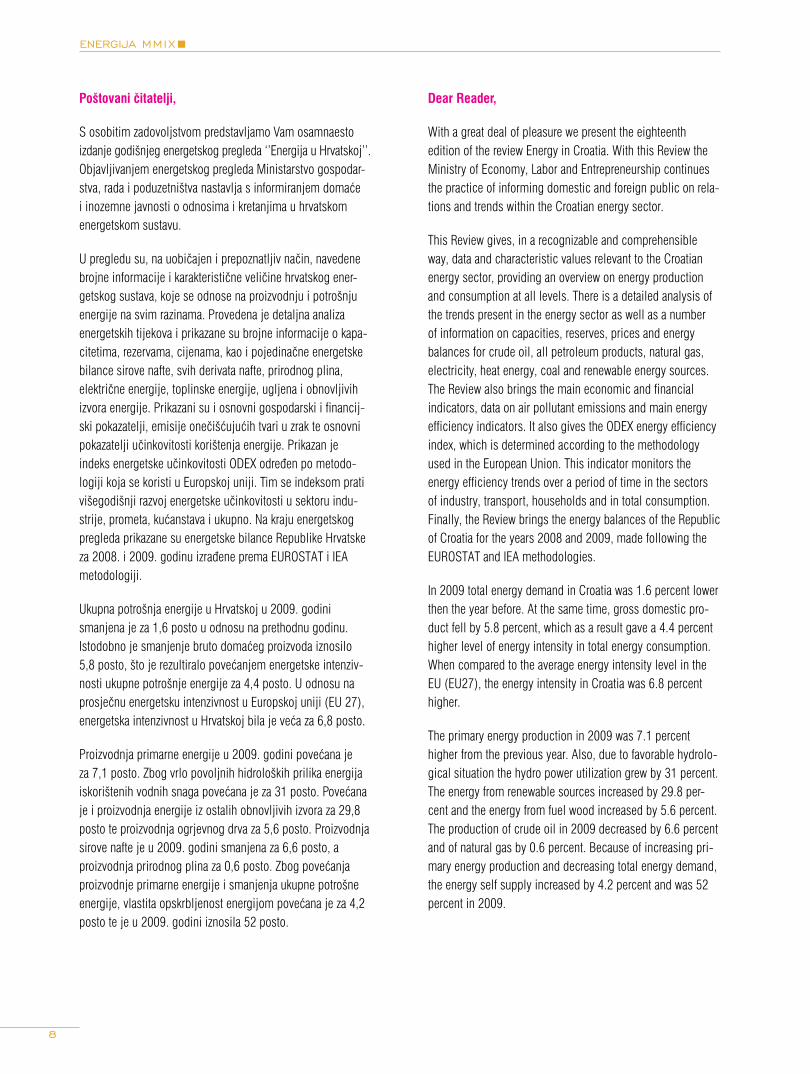
With a great deal of pleasure we present the eighteenth edition of the review Energy in Croatia. With this Review the Ministry of Economy, Labor and Entrepreneurship continues the practice of informing domestic and foreign public on rela-tions and trends within the Croatian energy sector.
This Review gives, in a recognizable and comprehensible way, data and characteristic values relevant to the Croatian energy sector, providing an overview on energy production and consumption at all levels. There is a detailed analysis of the trends present in the energy sector as well as a number of information on capacities, reserves, prices and energy balances for crude oil, all petroleum products, natural gas, electricity, heat energy, coal and renewable energy sources. The Review also brings the main economic and financial indicators, data on air pollutant emissions and main energy efficiency indicators. It also gives the ODEX energy efficiency index, which is determined according to the methodology used in the European Union. This indicator monitors the energy efficiency trends over a period of time in the sectors of industry, transport, households and in total consumption. Finally, the Review brings the energy balances of the Republic of Croatia for the years 2008 and 2009, made following the EUROSTAT and IEA methodologies.
In 2009 total energy demand in Croatia was 1.6 percent lower then the year before. At the same time, gross domestic pro-duct fell by 5.8 percent, which as a result gave a 4.4 percent higher level of energy intensity in total energy consumption. When compared to the average energy intensity level in the EU (EU27), the energy intensity in Croatia was 6.8 percent higher.
The primary energy production in 2009 was 7.1 percent higher from the previous year. Also, due to favorable hydrolo-gical situation the hydro power utilization grew by 31 percent. The energy from renewable sources increased by 29.8 per-cent and the energy from fuel wood increased by 5.6 percent. The production of crude oil in 2009 decreased by 6.6 percent and of natural gas by 0.6 percent. Because of increasing pri-mary energy production and decreasing total energy demand, the energy self supply increased by 4.2 percent and was 52 percent in 2009.
Poštovani čitatelji,
S osobitim zadovoljstvom predstavljamo Vam osamnaestoizdanje godišnjeg energetskog pregleda ‘’Energija u Hrvatskoj’’. Objavljivanjem energetskog pregleda Ministarstvo gospodar-stva, rada i poduzetništva nastavlja s informiranjem domaće i inozemne javnosti o odnosima i kretanjima u hrvatskom energetskom sustavu.
U pregledu su, na uobičajen i prepoznatljiv način, navedene brojne informacije i karakteristične veličine hrvatskog ener-getskog sustava, koje se odnose na proizvodnju i potrošnju energije na svim razinama. Provedena je detaljna analiza energetskih tijekova i prikazane su brojne informacije o kapa-citetima, rezervama, cijenama, kao i pojedinačne energetske bilance sirove nafte, svih derivata nafte, prirodnog plina, električne energije, toplinske energije, ugljena i obnovljivih izvora energije. Prikazani su i osnovni gospodarski i financij-ski pokazatelji, emisije onečišćujućih tvari u zrak te osnovni pokazatelji učinkovitosti korištenja energije. Prikazan je indeks energetske učinkovitosti ODEX određen po metodo-logiji koja se koristi u Europskoj uniji. Tim se indeksom prati višegodišnji razvoj energetske učinkovitosti u sektoru indu-strije, prometa, kućanstava i ukupno. Na kraju energetskog pregleda prikazane su energetske bilance Republike Hrvatske za 2008. i 2009. godinu izrađene prema EUROSTAT i IEA metodologiji.
Ukupna potrošnja energije u Hrvatskoj u 2009. godini smanjena je za 1,6 posto u odnosu na prethodnu godinu. Istodobno je smanjenje bruto domaćeg proizvoda iznosilo 5,8 posto, što je rezultiralo povećanjem energetske intenziv-nosti ukupne potrošnje energije za 4,4 posto. U odnosu na prosječnu energetsku intenzivnost u Europskoj uniji (EU 27), energetska intenzivnost u Hrvatskoj bila je veća za 6,8 posto.
Proizvodnja primarne energije u 2009. godini povećana je za 7,1 posto. Zbog vrlo povoljnih hidroloških prilika energija iskorištenih vodnih snaga povećana je za 31 posto. Povećana je i proizvodnja energije iz ostalih obnovljivih izvora za 29,8 posto te proizvodnja ogrjevnog drva za 5,6 posto. Proizvodnja sirove nafte je u 2009. godini smanjena za 6,6 posto, a proizvodnja prirodnog plina za 0,6 posto. Zbog povećanja proizvodnje primarne energije i smanjenja ukupne potrošne energije, vlastita opskrbljenost energijom povećana je za 4,2 posto te je u 2009. godini iznosila 52 posto.

9
ENERGY MMIX
When the structure of total energy consumption is concer-ned, there is an increase of energy conversion losses by 4.7 percent; of energy sector own use by 19.7 percent, and of transport and distribution losses by 9.1 percent. The final energy demand, as well as non energy use decreased by 4.2 and 15.7 percent respectively. In all final energy demand sectors - industry, transport and other consump-tion sectors, the energy consumption was lower. Industrial sector decreased its energy consumption significantly, by as much as 16.4 percent, while other two sectors reduced their final energy demand by 0.7 percent.
In 2009, renewable energy sources accounted for 20.1 per-cent of total energy consumption (according to the EIHP met-hodology), or about 11 percent according to the EUROSTAT method. Total production of electricity in 2009 was 12777.1 GWh, where the output of electricity from renewable energy sources, hydro power plants included, made 54 percent of total production: 52.6 percent from large hydro power plants and 1.4 percent from other renewable energy sources (small hydro power plants, wind energy, landfill gas and biogas). In terms of total primary energy supply in Croatia, electricity from renewable energy sources accounted for 37.4 percent: the share of electricity from large hydro power plants was 36.4 percent, while electricity from other renewable energy sources accounted for 1 percent.
In 2009 there was a drop in consumption of electricity, liquid fuels, natural gas, coal and coke and of heat energy. Only the consumption of fuel wood and biomass increased, by 4.5 percent. As for the consumption of all petroleum products combined, it decreased by 3.3 percent from the previous year. There was a drop in consumption of almost all petroleum products, except for the consumption of fuel oil which rose by 7.2 percent. The biggest reduction was in consumption of jet fuel and all other derivatives non-mentioned here combined, by 14.1 and 11.1 percent respectively. The consumption of heating gas oil fell by 9.3 percent, of LPG by 3.8 percent and of diesel fuel by 2.9 percent. A minimal drop, of 0.6 percent, was recorded in consumption of motor gasoline. Biofuels made 0.3 percent of consumed motor gasoline in 2009.
Total consumption of electricity in the Republic of Croatia in 2009 amounted to 18459.2 GWh which is 2.3 percent lower from the previous year. The consumption of natural gas fell by 7.7 percent; total consumption of heat energy fell by 4.5 per-cent and the consumption of coal and coke by 27.7 percent.
U strukturi ukupne potrošnje energije gubici energetskih transformacija povećani su za 4,7 posto, potrošnja energije za pogon energetskih postrojenja za 19,7 posto i gubici transporta i distribucije energije za 9,1 posto. Neposredna potrošnja energije, kao i neenergetska potrošnja energije smanjene su i to za 4,2 odnosno 15,7 posto. U svim sek-torima neposredne potrošnje – industriji, prometu i općoj potrošnji ostvareno je smanjenje potrošnje energije. U industriji je smanjenje potrošnje bilo značajno i iznosilo je 16,4 posto, dok je u ostala dva sektora neposredna potrošnja energije smanjena za 0,7 posto.
Udio obnovljivih izvora energije u ukupnoj potrošnji iznosio je u 2009. godini oko 20,1 posto (primjenom EIHP metodo-logije), odnosno oko 11 posto ako se u proračunu primjeni EUROSTAT metoda. Ukupna proizvodnja električne energije u Republici Hrvatskoj iznosila je u 2009. godini 12 777,1 GWh, pri čemu je iz obnovljivih izvora energije, uključujući i velike hidroelektrane, proizvedeno oko 54 posto. U tom postotku su velike hidroelektrane sudjelovale s 52,6 posto, a 1,4 posto električne energije proizvedeno je iz ostalih obnovljivih izvora (male hidroelektrane, energija vjetra, deponijski i bioplin). U ukupnoj potrošnji električne energije u Hrvatskoj, električna energija proizvedena iz obnovljivih izvora energije sudjelovala je s 37,4 posto. Pri tome je električna energija proizvedena u velikim hidroelektranama ostvarila udio od 36,4 posto, dok je električna energije proizvedena iz ostalih obnovljivih izvora sudjelovala s 1 posto.
Tijekom 2009. godine smanjena je potrošnja električne ener-gije, tekućih goriva, prirodnog plina, ugljena i koksa te toplin-ske energije, a samo je u potrošnji ogrjevnog drva i ostale biomase ostvareno povećanje od 4,5 posto. Ako se promatra potrošnja svih derivata nafte zajedno, onda je ostvareno sma-njenje potrošnje od 3,3 posto u odnosu na prethodnu godinu. Ostvareno je smanjenje potrošnje skoro svih derivata, a samo je u potrošnji loživog ulja ostvaren porast od 7,2 posto. Najveće smanjenje ostvareno je u potrošnji mlaznog goriva i svih ostalih nespomenutih derivata promatranih zajedno i to za 14,1 odnosno 11,1 posto. Potrošnja ekstralakog loživog ulja smanjena je za 9,3 posto, ukapljenog naftnog plina za 3,8 posto i dizelskog goriva za 2,9 posto. Minimalno smanje-nje od 0,6 posto ostvareno je u potrošnji motornog benzina. Udio biogoriva u motornim gorivima u 2009. godini iznosio je 0,3 posto.

10
ENERGIJA MMIX
The trend of improving energy efficiency in energy consump-tion continued in 2009. Thus, in the period from 1995 to 2009 the energy efficiency index for all final energy consu-mers combined was reduced by 14.4 percent. Such a deve-lopment is mostly due to the transport and industrial sectors of consumption, which improved their respective energy efficiency indices by 23.6 and 19.1 percent.
The emissions from fuel combustion have a dominant influence on the total national SO2, NOx and CO2 emissions. According to the preliminary results for 2009, SO2 emissi-ons were lower by 20 percent, while NOx emissions were 9 percent lower when compared with the limits set out in the National Environmental Strategy for 2010. Due to its global impact on the climate change, monitoring of GHG emission trends, particularly the emissions of CO2, is of paramount importance. Total emissions in 2009 were estimated at 22.7 million tons, out of which 87 percent derive from fuel com-bustions in the stationary and mobile energy sources. It is possible to recognize that, after CO2 emission increase over a number of years, in the last two years there was a slow down of CO2 emission. Estimated CO2 emissions in 2009 were 4 percent lower in comparison with the emissions in the previo-us year and 2 percent lower than the 1990 emission level.
Average sale prices of all petroleum products in 2009 were decreased with respect to 2008. The average retail price of unleaded motor gasoline, branded Super 95, decreased by 12.6 per cent, of unleaded motor gasoline, branded Super plus 98, by 14.0 per cent, of unleaded motor gasoline, bran-ded Eurosuper 95, by 13.6 per cent, of diesel fuel branded Eurodizel by 21.3 per cent, of diesel fuel branded Dizel by 21.8 per cent, of diesel for agriculture by 27.1 per cent and of fuel heating gas oil by 30.0 per cent.
In 2009 three new wind power plants with overall installed power of about 53 MW started electricity generation. During 2009 three transmission lines and two substations were put into regular operation, of which the reconstructed cross-border 220 kV transmission line Mraclin-Prijedor (BiH) is the most significant for enhancing the security of supply. In the distribu-tion network five 110/10(20) kV substations, seven 35/10(20) kV substations and two 35 kV lines were renewed or construc-ted.The share of eligible customer’s consumption increased to 41% and average electricity prices experienced little changes after a sharp increase in the second half of 2008.
Ukupna potrošnja električne energije u Republici Hrvatskoj u 2009. godini iznosila je 18 459,2 GWh te je bila za 2,3 posto manja u odnosu na prethodnu godinu. U potrošnji prirodnog plina ostvareno je smanjenje potrošnje za 7,7 posto, ukupna potrošnja toplinske energije smanjena je za 4,5 posto, dok je potrošnja ugljena i koksa smanjena za 27,7 posto.
Nastavio se trend poboljšanja učinkovitosti potrošnje energije u Hrvatskoj pa se tako, tijekom razdoblja od 1995. do 2009. godine, indeks poboljšanja energetske učinkovitosti za sve finalne potrošače energije promatrane zajedno smanjio za 14,4 posto. Ovoj promjeni najviše su pridonijeli sektori pro-meta i industrije s poboljšanjem indeksa energetske učinko-vitosti za 23,6 i 19,1 posto.
Emisije uslijed izgaranja goriva imaju dominantan utjecaj na ukupne emisije SO2, NOx i CO2. Prema preliminarnim rezul-tatima proračuna za 2009. godinu emisija SO2 bila je za 20 posto, a emisija NOx za 9 posto niža od limita postavljenih za 2010. godinu u okviru Strategije zaštite okoliša. Zbog glo-balnog utjecaja na promjenu klime vrlo je važno pratiti trend emisija stakleničkih plinova, osobito emisije CO2. Ukupna emisija CO2 u 2009. godini iznosila je oko 22,7 milijuna tona, od čega je 87 posto emisije posljedica izgaranja goriva u sta-cionarnim i mobilnim energetskim izvorima. Može se uočiti da je, nakon višegodišnjeg porasta, u posljednje dvije godine došlo do smanjenja emisije CO2. Emisija CO2 u 2009. godini je bila niža za oko 4 posto u odnosu na prethodnu godinu i za 2 posto niža od razine emisije u 1990. godini.
Prosječne cijene naftnih derivata u 2009. godinu niže su u odnosu na 2008. godinu. Prosječna prodajna cijena bezolov-nog motornog benzina Super 95 smanjena je za 12,6 posto, bezolovnog motornog benzina Super plus 98 za 14,0 posto, bezolovnog motornog benzina Eurosuper 95 za 13,6 posto, dizelskog goriva Eurodizel za 21,3 posto, dizelskog goriva Dizel za 21,8 posto, dizelskog goriva Dizel plavi za 27,1 posto i loživog ulja ekstra lakog za 30,0 posto.
Tijekom 2009. godine s isporukom električne energije u mrežu počele su tri nove vjetroelektrane, ukupne snage oko 53 MW. Također su u pogon puštena tri voda i dvije transfor-matorske stanice, a značajem za povećanje sigurnosti opskrbe posebno se ističe obnovljeni prekogranični 220 kV dalekovod Mraclin–Prijedor (BiH). U distribucijskoj mreži je obnovljeno ili izgrađeno pet TS 110/10(20) kV, sedam TS 35/10(20) kV

11
ENERGY MMIX
Valid price for natural gas shipping for all tariff customers suppliers was defined by the Decision on gas shipping price for gas suppliers of tariff customers, and was set at 1.32 HRK/m3/33,338.35 kJ excl. VAT. Average price for suppliers on distribution system in 2009 was 1.3476 HRK/m3/33,338.35 kJ excl. VAT, whereas average price for eligible customers (direct industrial customers) was 1.3497 HRK/m3/33,338.35 kJ excl. VAT. In 2009, average transmission price for all customers on transportation system was 0.21 HRK/m3.
Average selling price of natural gas in 2009 was 2.41 HRK/m3 for households, 2.44 HRK/m3 for services and 2.43 HRK/m3 for industry. On September 1st, 2009 the new Decision on the level of tariff items in the Tariff system for natural gas supply, with the exception of eligible customers, without tariff items came into force. The Decision is based on the Amendments to the Tariff system for natural gas supply, with the exception of eligible customers, without tariff items.
According to the data obtained from the Croatian Energy Regulatory Agency, in 2009 22 companies held a license for heat energy production, 17 companies held a licensed for heat energy distribution, while 23 companies held license for heat energy supply, which represents an increase in number of heat energy undertakings. In the Republic of Croatia the DH sector is regulated through the Tariff System based on the regulation of the maximum total revenue in the year of regula-tion within a regulatory cycle.
Zagreb, 6 December 2010
i dva voda 35 kV. Udio potrošnje povlaštenih kupaca porastao je na 41 posto, a prosječne cijene električne energije nisu se bitno mijenjale nakon skoka u drugoj polovici 2008. godine.
Cijena dobave prirodnog plina određena je Odlukom o cijeni za dobavu plina dobavljaču plina za opskrbljivače tarifnih kupaca u iznosu od 1,32 kn/m3/33 338 kJ. Prosječna cijena prirodnog plina za opskrbljivače na distribucijskom sustavu u 2009. godini iznosila je 1,3476 kn/m3/33 338 kJ, dok je cijena dobave za povlaštene kupce (direktne industrijske potrošače) iznosila 1,3497 kn/m3/33 338 kJ. Prosječna cijena transporta prirodnog plina u 2009. godini za sve kupce plina na transpor-tnom sustavu iznosila je 0,21 kn/m3. Dana 1. rujna 2009. stu-pila je na snagu nova Odluka o visini tarifnih stavki u Tarifnom sustavu za opskrbu prirodnim plinom, s iznimkom povlaštenih kupaca, bez visine tarifnih stavki. Prosječna prodajna cijena pri-rodnog plina u 2009. godine iznosila je 2,41 kn/m3 za kućan-stva, 2,44 kn/m3 u sektoru usluga i 2,43 kn/m3 za industriju.
Prema podacima Hrvatske energetske regulatorne agencije u 2009. godini 22 tvrtke su posjedovale dozvolu za proizvod-nju toplinske energije, 17 tvrtki je posjedovalo dozvolu za distribuciju toplinske energije, dok su 23 tvrtke posjedovale dozvolu za opskrbu toplinskom energijom. U svim djelatnosti-ma zabilježen je porast broja subjekata. U Republici Hrvatskoj primjenjuje se tarifni sustav za regulaciju sektora toplinarstva zasnovanu na regulaciji maksimalnog ukupnog prihoda u regulacijskoj godini unutar određenog regulacijskog ciklusa.
U Zagrebu 6. prosinca 2010.


OSNOVNI PODACI, GOSPODARSKIOSNOVNI PODACI, GOSPODARSKII FINANCIJSKI POKAZATELJII FINANCIJSKI POKAZATELJI GENERAL DATA, ECONOMIC GENERAL DATA, ECONOMIC
AND FINANCIAL INDICATORSAND FINANCIAL INDICATORS
II


15
ENERGY MMIXI GENERAL DATA, ECONOMIC AND FINANCIAL INDICATORS
1.1. Osnovni statistički podaci Republike Hrvatske
Površina: 56 594 km2
Površina teritorijalnih mora i unutrašnjih morskih voda: 31 067 km2
Duljina obalne linije s otocima: 5 835,3 km
Duljina kopnene granice: 2 028 km
Najviši vrh: Dinara (1 831 m)
Broj otoka (47 nastanjeno): 1 185
Otoci veći od 100 km2: Krk, Cres, Brač, Hvar, Pag, Korčula, Dugi otok, Mljet
Broj stanovnika (popis stanovništva 2001.): 4 437 460
Gustoća stanovništva na km2: 78,5
Glavni grad: Zagreb (779 145 stanovnika)
Vjeroispovijesti: Rimokatolička, pravoslavna, muslimanska, židovska, protestantska i druge
Jezik: Hrvatski
Pismo: Latinično
Novčana jedinica: Kuna (kn)
Politički sustav: Parlamentarna demokracija
Sveučilišta: Zagreb, Split, Rijeka, Osijek, Zadar, Dubrovnik, Pula
Nacionalni parkovi: Plitvička jezera, Krka, Paklenica, Mljet, Risnjak, Brijuni, Kornati, Sjeverni Velebit
Izvor | Source: DZS (CBS)
1.1 Basic Facts about the Republic of Croatia
Area: 56 594 km2
Territorial sea and inland sea area: 31 067 km2
Length of sea coastline with islands: 5 835,3 km
Land border length: 2 028 km
The highest mountain: Dinara (1 831 m)
Number of islands (47 inhabited): 1 185
Islands over 100 km2: Krk, Cres, Brač, Hvar, Pag, Korčula, Dugi otok, Mljet
Population (2001 Census): 4 437 460
Population density per km2: 78.5
Capital: Zagreb (779 145 inhabitants)
Religions: Roman Catholic, Orthodox, Islamic, Jewish, Protestant and others
Language: Croatian
Script: Latin
Currency: Kuna (HRK)
Political system: Parliamentary democracy
Universities: Zagreb, Split, Rijeka, Osijek, Zadar, Dubrovnik, Pula
National parks: Plitvička jezera, Krka, Paklenica, Mljet, Risnjak, Brijuni, Kornati, Sjeverni Velebit

16
ENERGIJA MMIXI OSNOVNI PODACI, GOSPODARSKI I FINANCIJSKI POKAZATELJI
1.2. Gospodarstvo Republike Hrvatske u 2009. godini
Hrvatska je, kao i gotovo sve druge zemlje Europe, tijekom 2009. zabilježila izrazitu kontrakciju gospodarske aktivnosti, pri čemu se realni rast bruto domaćeg proizvoda (BDP) sma-njio s 2,4 posto u 2008. godini na -5,8 posto u 2009. godini, što je 8,8 postotnih bodova manje u usporedbi s 2008. godi-nom. To se može smatrati izravnom posljedicom usporavanja ekonomske aktivnosti u drugom dijelu 2009. godine, uslijed prelijevanja efekata globalne financijske krize.
Bruto domaći proizvod po glavi stanovnika smanjen je s 10 700 eura u 2008. na 10 200 eura u 2009. godini. Svi ostali osnovni makroekonomski pokazatelji također su zabi-lježili smanjenje u odnosu na ostvarenja iz 2008. godine.
Industrijska proizvodnja smanjena je u 2009. godini za 9,2 posto, trgovina na malo zabilježila je realno smanjenje od 15,3 posto, a broj noćenja turista smanjen je 1,4 posto. Posljedica smanjene potražnje te međugodišnjeg pada cijena primarnih sirovina na svjetskom tržištu bila je usporavanje prosječne godišnje inflacije mjerene indeksom potrošačkih cijena sa 6,1 posto u 2008. godine na 2,4 posto u 2009. godini. Makroekonomski poremećaji odrazili su se i na tržište rada te je nakon siječnja 2009. godine započeo trend ubr-zanja međugodišnjeg rasta administrativne nezaposlenosti, dok je prosječna stopa anketne nezaposlenosti porasla s 8,4 posto u 2008. godini na 9,1 posto u 2009. godini. Uslijed korekcije domaće agregatne potražnje, deficit tekućeg računa bilance plaćanja smanjen je s 9,2 posto BDP-a iz prethodne godine na 5,2 posto BDP-a u 2009. godini kao posljedica smanjenja deficita na računu roba. Vođena osnovnim ciljem održavanja stabilnosti tečaja, monetarna politika u 2009. godini mijenjala se u skladu s pritiscima na tečaj kune te je najrestriktivnija bila početkom godine u uvjetima pojačanih pritisaka na slabljenje kune.
1.2 Economy of the Republic of Croatia in 2009
Croatia, like almost all other European countries, reported in 2009 a distinct contraction in economic activity, with real gross domestic product (GDP) decrease from 2.4% in year 2008 to -5.8% in year 2009, which is a decrease of 8.8 percentage points compared to year 2008. This can be con-sidered as a direct consequence of a slowdown in economic activity in the second half of 2009, due to the spillover effects of the global financial crisis.
Gross domestic product per capita fell from EUR 10,700 in 2008 to EUR 10,200 in 2009. All other basic macroeconomic indicators have also noted a decrease from the achievements of 2008.
Industrial production fell in 2009. for 9.2%, retail trade recor-ded a real decrease of 15.3% and the number of tourist nights decreased by 1.4%. The consequence of reduced demand and price decrease, primary raw materials, in the world market was slowing down the average annual inflation mea-sured by consumer price index from 6.1% in 2008. to 2.4% in 2009. year. Macroeconomic disturbances were reflected in the labor market. After January 2009. began an accelerated growth of acceleration interyear unemployment, while the average rate of registered unemployment increased from 8.4% in 2008. to 9.1% in 2009. year. Due to the correction of domestic aggregate demand, current balance account was reduced from 9.2% of GDP in 2008. to 5.2% of GDP in 2009. year, as a result of a deficit reduction on a goods account. Guided by the basic aim of maintaining exchange rate stabi-lity, monetary policy in 2009. were changed in accordance with the pressures on the exchange rate. Monetary policy was the most restrictive in the beginning of the year in terms of increased pressure on the weakening of the Kuna.

17
ENERGY MMIXI GENERAL DATA, ECONOMIC AND FINANCIAL INDICATORS
1.2.1. Pregled gospodarskih kretanja
Realni sektor
Realno smanjenje bruto domaćeg proizvoda iznosilo je 5,8 posto u 2009. godini. Nominalno je bruto domaći proizvod iznosio 333,1 milijardu kuna, što predstavlja nominalni pad od 2,7 posto u usporedbi s 2008. godinom. Bruto domaći proizvod po glavi stanovnika u eurima zabilježio je međugo-dišnje smanjenje od 4,2 posto. Međugodišnji rast deflatora bruto domaćeg proizvoda iznosio je u 2009. godini 3,3 posto, odnosno 3,0 postotna boda manje nego u 2008. godini.
Promatrajući rashodnu stranu bruto domaćeg proizvoda gotovo sve kategorije ostvarile su realna smanjenja na među-godišnjoj razini. Najveće realno smanjenje zabilježeno je kod uvoza roba i usluga, koji je u odnosu na 2008. godinu sma-njen 20,7 posto te kod izvoza roba i usluga čiji je pad iznosio 16,2 posto. Realno smanjenje investicija u fiksni kapital iznosilo je u 2009. godini 11,8 posto, a osobne potrošnje 8,5 posto. Državna potrošnja jedina je komponenta koja je u 2009. godini zabilježila realni međugodišnji rast, u iznosu od 0,2 posto. Promatrajući doprinose međugodišnjem rastu bruto domaćeg proizvoda u 2009. godini, doprinos osobne potrošnje iznosio je -5,3 postotna boda, doprinos investicija u fiksni kapital -3,4 postotna boda, a doprinos promjena zaliha (koje uključuju statističku diskrepanciju) -1,2 postotna boda. Doprinos državne potrošnje bio je neutralan i iznosio je 0,0 postotnih bodova. Doprinos izvoza roba i usluga realnom rastu bruto domaćeg proizvoda iznosio je -7,3 postotna boda, no zbog višeg pozitivnog doprinosa uvoza roba i usluga, u iznosu od 12,0 postotnih bodova, doprinos neto izvoza bio je pozitivan i iznosio 4,7 postotnih bodova. Obračun bruto domaćeg proizvoda s proizvodne strane pokazuje da je najveće međugodišnje realno smanjenje bruto dodane vri-jednosti u 2009. godini zabilježeno kod djelatnosti trgovine (-14,3%). Slijedi industrija (realno smanjenje bruto dodane vrijednosti od 8,5%), prijevoz, skladištenje i veze (-6,4%), građevinarstvo (-6,1%) te hoteli i restorani (-2,9%). Rast bruto dodane vrijednosti na međugodišnjoj razini ostvaren je kod poljoprivrede (2,1%), financijskog posredovanja (1,4%) i javne uprave (1,1%). Navedena kretanja rezultirala su realnim međugodišnjim smanjenjem ukupne bruto dodane vrijednosti od 4,0 posto u 2009. godini.
1.2.1 Overview of economic trends
Real sector
Real decrease of the gross domestic product was 5.8% in 2009. Nominal gross domestic product amounted to 333.1 billion in year 2009, representing a nominal decrease of 2.7% compared to year 2008. Gross domestic product per capita in Euros recorded an annual decrease of 4.2%. The annual growth in gross domestic product deflator was in 2009 3.3%, or 3.0 percentage points less than in year 2008.
Looking at the expenditure side of gross domestic product, almost all categories have made a real reduction on annual basis. The greatest reduction in real terms was recorded in imports of goods and services, which in comparison to 2008 was reduced by 20.7%, and exports of goods and services, whose decline was 16.2% in comparison to 2008. Real decline in 2009 of investments in fixed capital was 11.8%, and decline of investments in personal consumption was 8.5%. Government spending is the only component in 2009 that registered a real annual increase in the amount of 0.2%. Looking at contributions to interyear growth rates of gross domestic product in 2009., we can say that the contribution of personal consumption was -5.3 percentage points, the contribution of investments in fixed capital was -3.4 percentage points, and the contribution of changes in inventories (including statistical discrepancy) amounted -1.2 percentage points. The contribution of government spending was neutral (0.0 percentage points). The contribution of exports of goods and services to real GDP growth was -7.3 percentage points, but due to the higher positive contribution of imports of goods and services of 12.0 percentage points, the contribution of net exports was positive and amounted 4.7 percentage points. The calculation of gross domestic product from the production side shows that the highest real annual decrease in gross value added in 2009. was recorded in the trade sector (-14.3%). Followed by industry (real fall in gross value added of 8.5%), transport, storage and communication (-6.4%), construction (-6.1%) and hotels and restaurants (-2.9%). Growth of gross value added at interyear level was achieved in agriculture (2.1%), financial intermediation (1.4%) and public administration (1.1%). These trends have resulted in real annual decrease in total gross value added of 4.0% in year 2009.

18
ENERGIJA MMIXI OSNOVNI PODACI, GOSPODARSKI I FINANCIJSKI POKAZATELJI
Slika | Figure 1.2.2. Bruto domaći proizvod po glavi stanovnika | Gross domestic product per capita Izvor | Source: DZS (CBS) i OECD (IEA)
Slika | Figure 1.2.1. Bruto domaći proizvod | Gross domestic product Izvor | Source: DZS (CBS) i OECD (IEA)
0
10000
20000
30000
40000
50000
60000
70000
1996. 2000. 2005. 2009.
mili
juni
USD
200
5 |
milli
on U
S$ 2
005
0
50000
100000
150000
200000
250000
300000
milij
unik
n20
05|
milli
onHR
K20
05
Primjenom tečaja | using exchange rates (milijuni USD 2005 | million US$ 2005)Primjenom pariteta kupovne moći | using PPP (milijuni USD 2005 | million US$ 2005)U nacionalnoj valuti | in national currency (milijuni kn 2005 | million HRK 2005)
0
2000
4000
6000
8000
10000
12000
14000
16000
1996. 2000. 2005. 2009.
USD
2005
/sta
novn
iku
| US
$ 20
05/c
apita
0
10000
20000
30000
40000
50000
60000
70000
kn 2
005/
stan
ovni
ku |
HRK
200
5/ca
pita
Primjenom tečaja | using exchange rates (USD 2005/stanovniku | US$ 2005/capita)Primjenom pariteta kupovne moći | using PPP (USD 2005/stanovniku | US$ 2005/capita)U nacionalnoj valuti | in national currency (kn 2005/stanovniku | HRK 2005/capita)

19
ENERGY MMIXI GENERAL DATA, ECONOMIC AND FINANCIAL INDICATORS
Cijene
Prosječni međugodišnji rast indeksa potrošačkih cijena uspo-ren je sa 6,1 posto zabilježenih u 2008. godini na 2,4 posto u 2009. godini. Međugodišnji rast indeksa potrošačkih cijena u prosincu 2009. godine iznosio je 1,9 posto. Cijene dobara prosječno su porasle 1,9 posto, a cijene usluga 4,3 posto. Dominantan utjecaj na kretanje potrošačkih cijena u 2009. imao je pad osobne potrošnje te smanjenje uvezenih inflator-nih pritisaka. Učinak prijenosa inflacije iz 2008. godine tako-đer nije bio naglašen. Najveći doprinos rastu cijena u 2009. godini bio je od cijena duhana, koje su u odnosu na 2008. godinu uvećane za 17,3 posto te cijena prehrane koje su porasle za 1,7 posto. Unutar kategorije prehrane rastu cijena najviše su doprinijele cijene mesa (međugodišnji rast od 4,3%) te kruha i žitarica (3,2%). Rastu cijena u 2009. godini također je znatno pridonio i rast cijena plina (17,4%) te elek-trične energije (7,4%). Najveći utjecaj u suprotnom smjeru u 2009. godini imale su cijene goriva i maziva za osobna vozila koje su u odnosu na 2008. smanjene 13,9 posto.
Monetarna politika
Tijekom 2009. godine glavna preokupacija središnje banke bila je zadržavanje stabilnosti nominalnog tečaja kune kao osnovnog monetarnog instrumenta za očuvanje makroe-konomske stabilnosti. Budući da nije bilo većih promjena tečaja, u uvjetima makroekonomskih poremećaja izazvanih ekonomskom krizom stabilnost cijena u 2009. godini nije predstavljala značajniju brigu za monetarne vlasti. Početkom 2009. godine nastavljeni su deprecijacijski pritisci na tečaj kune s kraja 2008. godine pod utjecajem smanjenog priljeva inozemnog kapitala te pesimističkih očekivanja. U takvim uvjetima središnja banka reagirala je promjenama monetarnih instrumenata te smanjenim obujmom repo aukcija. Promjene instrumenata odnosile su se na uvećanje obračunatog kun-skog dijela devizne obvezne pričuve s 50 na 75 posto u siječnju, te smanjivanje stope minimalno potrebnih deviznih potraživanja s 28,5 na 20,0 posto u veljači. Devizna likvidnost bila je pospješena i prodajom deviza poslovnim bankama na dvjema deviznim intervencijama u siječnju i veljači. U nastavku godine, prvenstveno uslijed povećanog inozemnog zaduživanja domaćih sektora, pojavili su se aprecijacijski pritisci te je središnja banka u više navrata otkupljivala devize od poslovnih banaka i države. Tako je do kraja godine održa-no još pet deviznih intervencija otkupa eura - jedna krajem veljače, a preostale krajem godine. Izuzev početka godine,
Prices
Average interyear growth in the consumer price index slowed from 6.1% in 2008 to 2.4% in 2009. The annual growth of CPI in December 2009 was 1.9%. Prices of goods in 2009 rose average for 1.9%, while prices of services for 4.3%. The dominant influence on the movement of consumer prices in 2009 had a decline in personal consumption and to reduce of imported inflationary pressures. The effect of inflation from 2008. was not significant. The largest contribution to the growth rate in 2009. came from the price of tobacco, which increased for 17.3% compared to 2008., and food prices, which increased for 1.7%. Within the food category, the highest influence on price growth came form the price of meat (an annual increase of 4.3%) and bread and cereals (3.2%). The growth rate in 2009. significantly contributed to the growth of gas prices (17.4%) and electricity (7.4%). The highest impact in the opposite direction in 2009 have the prices of fuel and lubricants for personal vehicles that are in relation to 2008. decreased for 13.9%.
Monetary policy
During 2009. the main concern of the central bank was keeping a stable nominal exchange rate as a monetary base instrument for preserving macroeconomic stability. Since there were no major changes in the exchange rate, in terms of macroeconomic disturbances caused by the economic crisis of price stability in 2009. there was not a significant con-cern for monetary authorities. In the beginning of 2009 the depreciation pressures on the exchange rate continued to the end of 2008. under the influence of reduced inflow of foreign capital, and pessimistic expectations. In such circumstances the central bank reacted with changes in monetary instru-ments, and reduced the volume of repo auctions. Changes in instruments are related with the increase of the Kuna currency reserve requirements from 50% to 75% in January, and redu-cing the rate of minimum required foreign currency demands from 28.5% to 20.0% in February. Foreign currency liquidity was improved by selling foreign currency to commercial banks two times, in January and February. Due to the incre-ase in foreign borrowings by domestic sectors, appreciation pressures have appeared and the central bank has repeatedly purchased foreign currency from commercial banks and the state. So by the end of the year, there were five more foreign exchange intervention, one in late February, and the remai-ning at end of the year. Except in the beginning of the year,
20
ENERGIJA MMIXI OSNOVNI PODACI, GOSPODARSKI I FINANCIJSKI POKAZATELJI
financijski sustav karakterizirala je zadovoljavajuća razina kunske likvidnosti, naročito u posljednjem tromjesečju, te su glavni instrument kreiranja primarnog novca bile devizne transakcije središnje banke, dok je obujam obratnih repo auk-cija i u 2009. godini bio ograničen. Obvezna pričuva je ostala osnovni instrument za povlačenje likvidnosti.
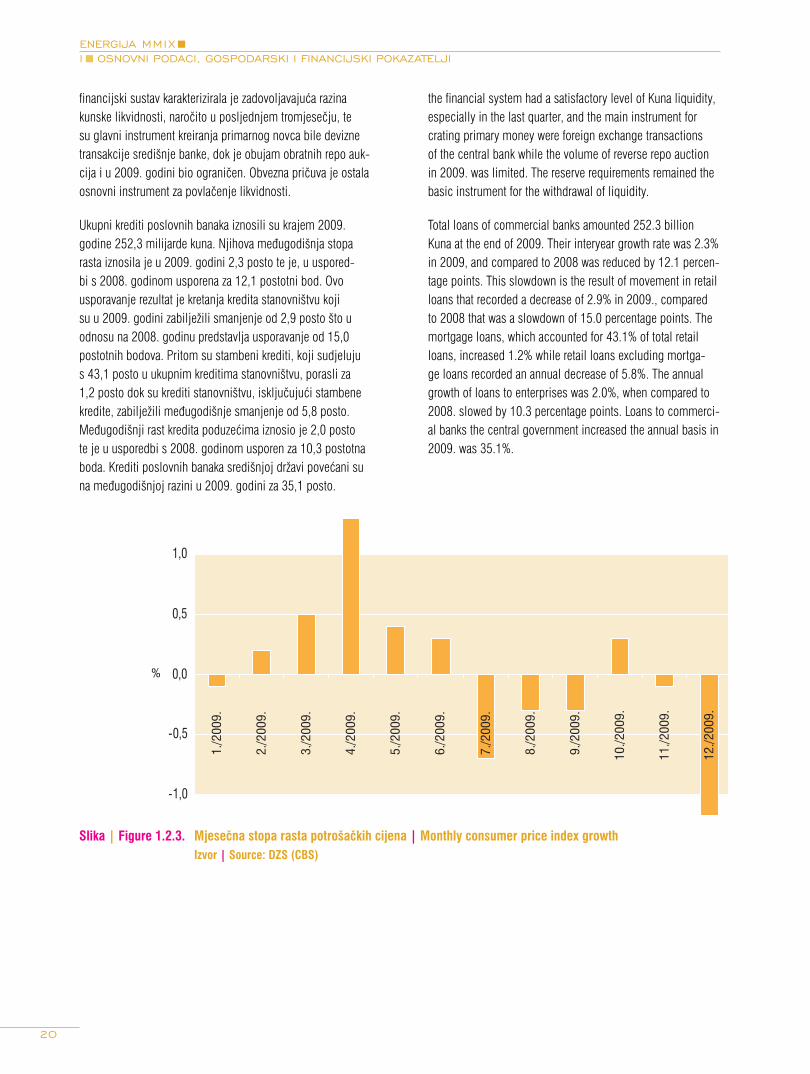
Ukupni krediti poslovnih banaka iznosili su krajem 2009. godine 252,3 milijarde kuna. Njihova međugodišnja stopa rasta iznosila je u 2009. godini 2,3 posto te je, u uspored-bi s 2008. godinom usporena za 12,1 postotni bod. Ovo usporavanje rezultat je kretanja kredita stanovništvu koji su u 2009. godini zabilježili smanjenje od 2,9 posto što u odnosu na 2008. godinu predstavlja usporavanje od 15,0 postotnih bodova. Pritom su stambeni krediti, koji sudjeluju s 43,1 posto u ukupnim kreditima stanovništvu, porasli za 1,2 posto dok su krediti stanovništvu, isključujući stambene kredite, zabilježili međugodišnje smanjenje od 5,8 posto. Međugodišnji rast kredita poduzećima iznosio je 2,0 posto te je u usporedbi s 2008. godinom usporen za 10,3 postotna boda. Krediti poslovnih banaka središnjoj državi povećani su na međugodišnjoj razini u 2009. godini za 35,1 posto.
Slika | Figure 1.2.3. Mjesečna stopa rasta potrošačkih cijena | Monthly consumer price index growth Izvor | Source: DZS (CBS)
the financial system had a satisfactory level of Kuna liquidity, especially in the last quarter, and the main instrument for crating primary money were foreign exchange transactions of the central bank while the volume of reverse repo auction in 2009. was limited. The reserve requirements remained the basic instrument for the withdrawal of liquidity.
Total loans of commercial banks amounted 252.3 billion Kuna at the end of 2009. Their interyear growth rate was 2.3% in 2009, and compared to 2008 was reduced by 12.1 percen-tage points. This slowdown is the result of movement in retail loans that recorded a decrease of 2.9% in 2009., compared to 2008 that was a slowdown of 15.0 percentage points. The mortgage loans, which accounted for 43.1% of total retail loans, increased 1.2% while retail loans excluding mortga-ge loans recorded an annual decrease of 5.8%. The annual growth of loans to enterprises was 2.0%, when compared to 2008. slowed by 10.3 percentage points. Loans to commerci-al banks the central government increased the annual basis in 2009. was 35.1%.
-1,0
-0,5
0,0
0,5
1,0
1./2
009.
2./2
009.
3./2
009.
4./2
009.
5./2
009.
6./2
009.
7./2
009.
8./2
009.
9./2
009.
10./2
009.
11./2
009.
12./2
009.
%

21
ENERGY MMIXI GENERAL DATA, ECONOMIC AND FINANCIAL INDICATORS
Devizni tečaj
Unatoč izraženim deprecijacijskim pritiscima početkom godine te aprecijacijskim pritiscima u nastavku godine, tečaj kune prema euru je tijekom 2009. godine bio pretežno sta-bilan. Blaga deprecijacija prosječnog tečaja kune u odnosu na 2008. godinu uzrokovana je prvenstveno pojačanom potražnjom domaćih sektora za stranom valutom radi plaćanja dospjelih obveza prema inozemstvu u vrijeme iznimno nepo-voljnih kretanja na financijskim tržištima, ponajviše početkom 2009. godine.
Prosječni godišnji tečaj kune prema euru povećan je s 7,22 kune za euro u 2008. godini na 7,34 kune za euro u 2009. godini, što predstavlja deprecijaciju kune prema euru od 1,6 posto. Tečaj kune prema euru na kraju razdoblja neznatno je aprecirao, odnosno spustio se s 7,32 kune za euro krajem 2008. na 7,31 kunu za euro krajem 2009. godine. Hrvatska narodna banka je tijekom 2009. godine na deviznom tržištu intervenirala sedam puta od čega su se dvije intervencije početkom godine odnosile na prodaju eura, u ukupnom iznosu od 513,0 milijuna eura, dok se preostalih pet inter-vencija odnosilo na otkup eura, u ukupnom iznosu od 837,8 milijuna eura.
Tečaj američkog dolara prema kuni kretao se u skladu s fluk-tuacijama dolara prema euru na svjetskim deviznim tržištima. Tako je krajem prosinca 2009. godine iznosio 5,09 kuna za dolar, dok je prosječni tečaj u cijeloj 2009. godini iznosio 5,28 kuna za dolar te je u odnosu na 2008. godinu kuna prema dolaru deprecirala 7,0 posto.
Odnosi s inozemstvom
U 2009. godini je međugodišnje smanjenje robnog izvoza iznosilo 20,3 posto, a robnog uvoza 25,7 posto. Ukoliko se iz robnog izvoza i uvoza isključi kategorija ostalih pri-jevoznih sredstava, koja iskrivljuje trend kretanja ukupne robne razmjene, robni izvoz je u 2009. godini smanjen 15,7 posto, a uvoz 23,7 posto. Pokrivenost robnog uvoza robnim izvozom iznosila je u 2009. godini 49,4 posto, što je pove-ćanje od 3,4 postotna boda u usporedbi s 2008. godinom. Vanjskotrgovinski deficit je smanjen u 2009. godini za 30,3 posto (slika 1.2.4.). Ukoliko se promatra robna razmjena izražena u američkim dolarima, robni izvoz je u 2009. godini zabilježio međugodišnje smanjenje od 25,8 posto, dok je
Exchange rate
Despite the significant depreciation pressures at the beginning of the year and the appreciation pressures in the second part of the year, the exchange rate was in 2009 mostly stable. The mild depreciation of the average exchange rate compared to 2008 was primarily due to the increased demand of domestic sectors for foreign currency, because of paying obligations to foreign countries during extremely adverse developments in financial markets, particularly in the beginning of 2009.
Annual average HRK/EUR exchange rate increased from 7.22 Kuna for the Euro in 2008 to 7.34 Kuna for the Euro in 2009, resulting with Kuna depreciation against the Euro with 1.6%. At the end of the year exchange rate slightly appreciated, from 7.32 Kuna for the Euro rate for the Euro at the end of 2008. to 7.31 Kuna for the Euro at the end of 2009. Croatian National Bank intervened seven times in 2009 on the foreign exchange market, out of which two interventions early in the year were related to the sale of Euros, in total amount of 513.0 million Euros, while the remaining five interventions were related to the purchase of Euros, in a total amount of 837.8 million Euros.
U.S. dollar exchange rate moved to Kuna in accordance with the fluctuations of Dollar against the Euro on world foreign exchange market. So at the end of December 2008. exchange rate amounted 5.09 Kuna for Dollar, while the average rate across the 2009 amounted to 5.28 Kuna for dollar, over 2008. Kuna depreciated to the Dollar 7.0 %.
External sector
Interyear decline in export of goods, in 2009, amounted 20.3%. At the same time interyear decline in import of goods amounted 25.7%. If we from export and import of goods and services exclude other vehicles category, which distorts the trend in total trade, exports in 2009. decreased 15.7% and imports 23.7%. The coverage of goods import by goods exports was in 2009. 49.4%, an increase of 3.4 percentage points compared to 2008. year. The foreign trade deficit in 2009 was reduced 30.3% (Figure 1.2.4). If we observe exc-hange of commodities expressed in U.S. dollar terms, export of goods recorded an annual decrease of 25.8% in 2009, while import of goods reduced for 31.0%. Higher annual

22
ENERGIJA MMIXI OSNOVNI PODACI, GOSPODARSKI I FINANCIJSKI POKAZATELJI
robni uvoz smanjen za 31,0 posto. Veća međugodišnja sma-njenja izvoza i uvoza izraženog u američkim dolarima rezultat su činjenice da se većina robne razmjene Hrvatske odvija sa zemljama Europske unije, a utjecaj na rast izvoza i uvoza ima i promjena tečaja američkog dolara prema euru.
Promatrajući robnu razmjenu prema djelatnostima najveći doprinos smanjenju izvoza u 2009. godini došao je od pro-izvodnje ostalih prijevoznih sredstava (čiji je izvoz smanjen za 49,0 posto), proizvodnje koksa i rafiniranih naftnih proi-zvoda (-25,3%), proizvodnje kemikalija i kemijskih proizvoda (-32,7%), proizvodnje strojeva i uređaja (-24,1%) te proi-zvodnje gotovih metalnih proizvoda, osim strojeva i opreme (-19,6%). Kategorije koje su u 2009. godini najviše dopri-nijele smanjenju robnog uvoza bile su proizvodnja motornih vozila, prikolica i poluprikolica (međugodišnje smanjenje uvoza od 47,9%), vađenje sirove nafte i prirodnog plina (-22,7%), proizvodnja metala (-39,0%), proizvodnja strojeva i uređaja (-17,1%) te proizvodnja ostalih prijevoznih sredstava (-61,0%).
Slika | Figure 1.2.4. Račun roba i usluga | Goods and services account Izvor | Source: HNB (CNB)
increase in exports and imports expressed in U.S. dollars are the result of the fact that most trade of Croatia takes place within the EU countries, and on the other hand exchange rate of the U.S. dollar against the euro has also the impact on export and import of goods and services.
Looking at trade by sectors, the largest contribution to reduc-tion of export in 2009. year came from the manufacture of other transport equipment, whose export declined 49.0%, production of coke and refined petroleum products (-25.3%), manufacture of chemicals and chemical products (-32.7%), manufacture of machinery and equipment ( -24.1%) and manufacture of fabricated metal products, except machinery and equipment (-19.6%). Categories that in 2009. mostly contributed to the reduction of imports were the production of motor vehicles, trailers and semitrailers (annual decrease of imports by 47.9%), extraction of crude oil and natu-ral gas (-22.7%), manufacture of basic metals (-39.0%), Manufacture of machinery and equipment (-17.1%) and manufacture of other transport equipment (-61.0%).
-7,387
5,676
-10,794
-9,434-8,364
-7,522-6,728
4,7695,318
6,9576,267
5,713
-10
-8
-6
-4
-2
0
2
4
6
2004. 2005. 2006. 2007. 2008. 2009.
Milij
ardi
€ |
Billio
n €
Račun roba | Goods account
Račun usluga | Services account
23
ENERGY MMIXI GENERAL DATA, ECONOMIC AND FINANCIAL INDICATORS
Deficit tekućeg računa bilance plaćanja iznosio je u 2009. godini 2,4 milijarde eura te je u usporedbi s 2008. godinom smanjen za 2,0 milijardi eura ili za 46,0 posto. To je rezultat kretanja deficita na računu roba koji je zabilježio međugodiš-nje smanjenje od 31,5 posto te iznosio 7,4 milijarde eura. Suficit na računu usluga smanjen je u odnosu na 2008. godinu za 18,6 posto te je iznosio 5,7 milijardi eura. Na smanjenje suficita na računu usluga najviše je utjecao pad prihoda od turizma koji je u 2009. godini iznosio 6,4 milijar-de eura te zabilježio međugodišnje smanjenje od 14,6 posto. Deficit na računu dohotka je blago povećan u odnosu na 2008. godinu za 5,9 posto te je iznosio 1,7 milijardi eura, dok je suficit na računu tekućih transfera neznatno smanjen za 0,1 posto te je iznosio 1,0 milijardi eura. Deficit tekućeg računa izražen u postotku BDP-a smanjen je s 9,2 posto u 2008. godini na 5,2 posto BDP-a u 2009. godini. Pokrivenost uvoza roba i usluga izvozom iznosila je u 2009. godini 90,3 posto, a u usporedbi s 2008. godinom povećana je za 6,5 postotnih bodova.
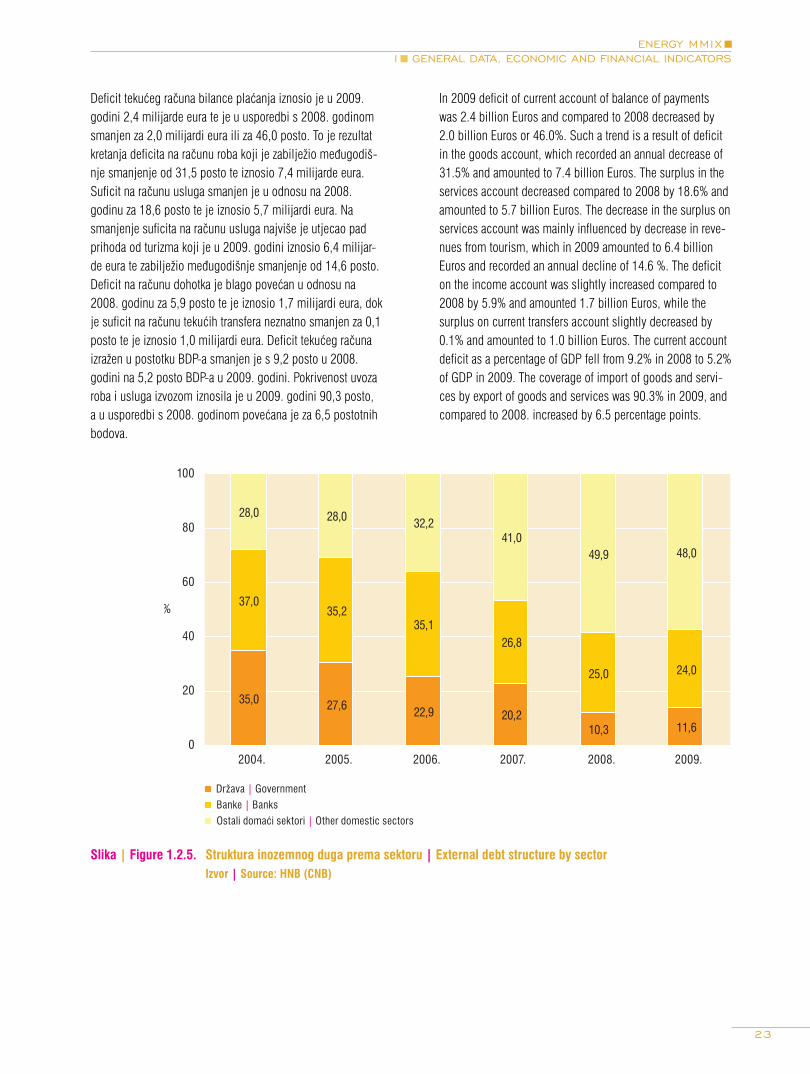
Slika | Figure 1.2.5. Struktura inozemnog duga prema sektoru | External debt structure by sector Izvor | Source: HNB (CNB)
In 2009 deficit of current account of balance of payments was 2.4 billion Euros and compared to 2008 decreased by 2.0 billion Euros or 46.0%. Such a trend is a result of deficit in the goods account, which recorded an annual decrease of 31.5% and amounted to 7.4 billion Euros. The surplus in the services account decreased compared to 2008 by 18.6% and amounted to 5.7 billion Euros. The decrease in the surplus on services account was mainly influenced by decrease in reve-nues from tourism, which in 2009 amounted to 6.4 billion Euros and recorded an annual decline of 14.6 %. The deficit on the income account was slightly increased compared to 2008 by 5.9% and amounted 1.7 billion Euros, while the surplus on current transfers account slightly decreased by 0.1% and amounted to 1.0 billion Euros. The current account deficit as a percentage of GDP fell from 9.2% in 2008 to 5.2% of GDP in 2009. The coverage of import of goods and servi-ces by export of goods and services was 90.3% in 2009, and compared to 2008. increased by 6.5 percentage points.
35,0 27,6 22,9 20,210,3 11,6
37,035,2
35,126,8
25,0 24,0
28,0 28,0 32,241,0
49,9 48,0
0
20
40
60
80
100
2004. 2005. 2006. 2007. 2008. 2009.
%
Država | Government
Banke | Banks
Ostali domaći sektori | Other domestic sectors

24
ENERGIJA MMIXI OSNOVNI PODACI, GOSPODARSKI I FINANCIJSKI POKAZATELJI
Krajem 2009. godine ukupni inozemni dug iznosio je 44,6 milijardi eura što predstavlja 98,3 posto bruto domaćeg pro-izvoda. Međugodišnji rast inozemnog duga iznosio je krajem 2009. godine 10,6 posto, što predstavlja usporavanje od 9,5 postotnih bodova u usporedbi s 2008. godinom. Najveći porast inozemnog duga tijekom 2009. godine zabilježen je kod inozemnog duga vlasnički povezanih poduzeća putem inozemnih izravnih ulaganja, u iznosu od 1,4 milijarde eura te inozemnog duga ostalih domaćih sektora, koji je povećan za 1,3 milijarde eura. Inozemni dug države povećan je za 1,0 milijardi eura tijekom 2009. godine, a inozemni dug banaka za 616 milijuna eura. Promatrajući strukturu inozemnog duga, udio duga države u ukupnom inozemnom dugu povećan je s 10,3 posto u prosincu 2008. na 11,6 posto u prosincu 2009. godine Inozemni dug banaka smanjen je u istom razdoblju s 25,0 na 24,0 posto, a inozemni dug ostalih domaćih sektora smanjen je s 49,9 na 48,0 posto ukupnog inozemnog duga.
Makroekonomske projekcije za razdoblje 2011. – 2012.
Vlada Republike Hrvatske u rujnu 2009. godine donosi Smjernice ekonomske i fiskalne politike za razdoblje 2010.-2012. radi utvrđivanja smjera fiskalne politike u narednom trogodišnjem razdoblju.
Smjernice su do sada predstavljale prvi korak u procesu pla-niranja državnog proračuna dajući ekonomske i fiskalne pret-postavke na kojima počiva njegova daljnja izrada. Primjenom novog Zakona o proračunu Smjernice su po prvi puta izrađene uvažavajući Strategiju Vladinih programa za razdoblje od 2010. do 2012. koju je Vlada usvojila na sjednici održanoj 10. rujna 2009. godine.
U 2011. godini se predviđa realni rast bruto domaćeg proi-zvoda od 3,0 posto, a u 2012. godini njegovo daljnji porast na 3,5 posto. Navedeni gospodarski rast rezultirat će prvo smanjenjem nominalnog bruto domaćeg proizvoda po glavi stanovnika s oko 10 700 eura u 2008. na oko 10 300 eura u 2009. godini, a zatim povećanjem na oko 12 100 eura u 2012. godini. Smanjenje gospodarske aktivnosti dovest će do pada zaposlenosti te povećanja anketne stope nezaposlenosti
At the end of 2009 the total external debt amounted to 44.6 billion Euros, which represents 98.3% of gross domestic product. The interyear growth of external debt amounted at the end of 2009. 10.6%, representing a slowdown of 9.5 percentage points compared to 2008. The largest increase of external debt during 2009 was recorded in foreign debt ownership companies through foreign direct investment, amounting to 1.4 billion Euros, and the external debt of other sectors, which increased to 1.3 billion Euros. External debt increased by 1.0 billion Euros in 2009, a foreign bank debt for 616 million Euros. Looking at the structure of external debt, the share of foreign debt in total external debt increased from 10.3% in December of 2008 to 11.6% in December of 2009, banks’ external debt was reduced in the same period from 25.0% to 24.0%, while the external debt of other sectors declined from 49.9% to 48.0% of total external debt.
Macroeconomic outlook for period 2011 – 2012
Croatian Government has defined The guidelines for the economic and fiscal policy for the period 2010 - 2012 in September 2009 in order to determine the direction of fiscal policy in the next three years.
The guidelines represent the first step so far in the process of planning of the state budget, giving economic and fiscal assumptions on which rests its further development. Applying the new Law on the budget Guidelines were for the first time made taking into account the Government’s Strategy for the period of 2010 - 2012 adopted by the government at its mee-ting held on September 10 2009.
For year 2011 a real growth of 3.0 percent is predicted, and for year 2012 a further acceleration to level of 3.5 % is forecasted. The mentioned economic growth will first result in the reduction of the nominal gross domestic product per capita, from about 10 700 EUR in 2008 to around 10 300 EUR in 2009, then increasing to around 12 100 EUR in 2012. Slowdown in economic activity will lead to falling employment and increasing survey unemployment rates of

25
ENERGY MMIXI GENERAL DATA, ECONOMIC AND FINANCIAL INDICATORS
Tablica | Table 1.2.1. Projekcije makroekonomskih pokazatelja Republike Hrvatske za razdoblje 2011.-2012. | Macroeconomic indicators forecast for period 2011-2012
NazivDescription
2007. 2008. 2009.Projekcija
2011. Forecast
Projekcija 2012.
Forecast
BDP (milijuni HRK)GDP (million HRK) 314 223 342 159 333 063 369 090 394 231
BDP po stanovniku (HRK)GDP per capita (HRK) 70 835 77 158 74 789 83 231 88 901
BDP po stanovniku EUR)GDP per capita (EUR) 9 656 10 683 10 245 11 293 12 063
Stopa rasta realnog BDP-a (%)Real GDP growth rate (%) 5,5 2,4 -5,8 3 3,5
Realni rast pojedinih komponenti BDP-aReal GDP components growth:
Indeks potrošačkih cijena (%) Consumer price indeks 2,9 6,1 2,4 3 3
Anketna stopa nezaposlenosti (%) Unemployment rate (%) 9,6 8,4 9,7 9,4 8,3
Tekući račun platne bilance (% BDP-a)Current account balance (% of GDP) -7,6 -9,2 -5,4 -5,4 -5,4
Inozemni dug (% BDP-a)External debt (% of GDP) 76,9 82,6 94,9 90,1 89,9
Izvor | Source: Ministarstvo financija Republike Hrvatske, DZS (CBS), EUROSTAT
1.2.2. Makroekonomski pokazatelji
Sažetak glavnih makroekonomskih trendova za Republiku Hrvatsku tijekom 2009. godine prikazan je u tablici 1.2.2.
na 9,5 posto tijekom 2009. godine. U 2011. godini se oče-kuje smanjenje stope nezaposlenosti, a u 2012. godini bi to iznosilo i do 8,3 posto. Do kraja projekcijskog razdoblja pred-viđa se kako će se inflacija zadržati na razini iz 2009. godine.
Sažetak makroekonomskih projekcija za razdoblje 2011.-2012. prikazan je u sljedećoj tablici.
9.5 % during 2009. In year 2011 a decrease of the unem-ployment rate is expected, and in 2012 a decrease even to 8,3% is expected. By the end of the forecasted period it is predicted that inflation will maintain the level of the 2009.
Summary of macroeconomic forecasts for period 2011-2012 is given in the next table.
1.2.2 Macroeconomic indicators
The summary of the main macroeconomic trends in 2009 is shown in the Table 1.2.2.

26
ENERGIJA MMIXI OSNOVNI PODACI, GOSPODARSKI I FINANCIJSKI POKAZATELJI
Tablica | Table 1.2.2. Makroekonomski pokazatelji Republike Hrvatske | Macroeconomic indicators of the Republic of Croatia
2004. 2005. 2006. 2007. 2008. 2009.
BDP (milijuni HRK 2005. stalne cijene) GDP (million HRK, 2005 constant prices)
253 689 264 367 276 897 292 047 298 937 281 563
Stopa rasta realnog BDP-a (%)Real GDP growth rate (%)
4,2 4,2 4,7 5,5 2,4 -5,8
BDP (milijuni USD 2005. stalne cijene) GDP (million USD 2005 constant prices)
42 637 44 432 46 538 49 084 50 242 47 322
BDP (milijuni USD 2005. stalne cijene PKM)GDP (million USD 2005 constant prices PPP)
64 794 67 521 70 719 74 588 76 348 71 911
BDP po stanovniku (USD 2005. stalne cijene)GDP per capita (USD 2005 constant prices)
9 599 10 009 10 477 11 055 11 326 10 673
BDP po stanovniku (USD 2005. stalne cijene PKM)GDP per capita (USD 2005 constant prices PPP)
14 586 15 210 15 921 16 799 17 211 16 218
Godišnji rast potrošačkih cijena (%)Year-on-year consumer price growth (%)
2,1 3,3 3,2 2,9 6,1 2,4
Tekući račun platne bilance (milijuna EUR)Current account balance (million EUR)
-1 434 -1 976 -2 726 -3 236 -4 338 -2 477
Tekući račun platne bilance (% BDP-a)Current account balance (% of GDP)
-4,4 -5,5 -6,9 -7,6 -9,2 -5,4
Izvoz robe i usluga (% BDP-a)Export of goods and services (% of GDP)
43,5 42,8 43,5 42,8 42,0 35,6
Uvoz robe i usluga (% BDP-a)Import of goods and services (% of GDP)
49,4 48,8 50,2 50,2 50,1 39,4
Inozemni dug (milijuna EUR. kraj razdoblja)External debt (million EUR. end of period)
22 933 25 748 29 274 32 929 39 125 43 089
Inozemni dug (% BDP-a)External debt (% of GDP)
70,0 72,1 74,9 76,9 82,6 94,9
Nezaposlenost (%, prema ILO)Unemployment rate (%, ILO)
13,8 12,7 11,2 9,6 8,4 9,7
Zaposlenost (% prema ILO, stariji od 15. god.)Employment rate (%, ILO, persons aged over 15)
43,5 43,3 43,6 44,2 44,5 43,3
Prosječni devizni tečaj (HRK:EUR)Average exchange rate HRK:EUR)
7,4957 7,4000 7,3228 7,3360 7,2232 7,3396
Prosječni devizni tečaj (HRK:USD)Average exchange rate HRK:USD)
6,0312 5,9500 5,8392 5,3660 4,9344 5,2804
Prosječne mjesečne neto plaće (HRK)*Average net monthly wage (HRK)*
4 172 4 375 4 603 4 841 5 207 5 311
Međunarodne pričuve RH, mil. EUR2International reserves, mil. EUR2
6 436 7 438 8 725 9 307 9 121 10 376
Broj zaposlenih, godišnji prosjekTotal persons in employment
1 409 634 1 420 573 1 467 876 1 516 909 1 544 232 1 525 480
Izvor | Source: HNB (CNB), DZS (CBS), EUROSTAT
1.2.3. Financijski pokazatelji u energetici
Financijski podaci za energetski sektor u cjelini i pojedinačno po djelatnostima dani su u sljedećim tablicama (u tisućama kuna).
1.2.3 Energy sector fi nancial indicators
Financial data for the energy sector are given in aggregate for all companies as well as for specific activities (in thousands of HRK).

27
ENERGY MMIXI GENERAL DATA, ECONOMIC AND FINANCIAL INDICATORS
Tablica | Table 1.2.3. Konsolidirana bilanca financijskih rezultata | Consolidated financial results
Naziv Description
2004. 2005. 2006. 2007. 2008. 2009. 2009./2008.
Broj zaposlenihEmployment
32 710 33 078 33 799 33 813 34 289 33 683 98,2
Ukupni prihodi Revenues
45 278 012 52 691 082 59 894 991 63 673 302 73 966 316 64 037 477 86,6
Ukupni rashodi Total expenses
42 722 282 50 262 009 57 208 917 61 503 295 73 127 365 64 304 630 87,9
Dobit prije oporezivanjaIncome before taxes
2 620 386 2 508 153 2 710 036 25 14 644 2 129 138 1 500 572 70,5
Gubitak prije oporezivanjaLoss before taxes
64 656 79 079 75 194 344 637 1 290 187 1 497 726 116,1
Porez na dobit Income taxes
415 833 397 291 555 314 446 765 174 782 130 358 74,6
Dobit nakon oporezivanjaNet income
2 204 597 2 110 906 2 155 074 2 070 369 1 752 467 1 240 695 70,8
Gubitak nakon oporezivanjaNet loss
64 702 79 119 75 552 347 127 1 088 298 1 368 211 125,7
Konsolidirani rezultatConsolidated results
2 139 896 2 031 785 2 079 518 1 723 240 664 169 -127 516 -19,2
Izvor | Source: FINA
Tablica | Table 1.2.4. Vađenje energetskih sirovina | Energy resource extraction
Naziv Description
2004. 2005. 2006. 2007. 2008. 2009. 2009./2008.
Broj poduzetnikaNumber of employers
15 17 24 23 14 18 -
Broj zaposlenihEmployment
3 852 3 917 3 857 3 899 3 907 3.832 98,08
Ukupni prihodi Revenues
3 503 751 4 052 738 5 120 711 4 661 092 7 349 624 6 376 826 86,80
Ukupni rashodi Total expenses
3 217 799 3 488 392 3 950 031 4 139 763 5 743 529 5 520 182 93,10
Dobit prije oporezivanjaIncome before taxes
322 664 599 746 1 208 535 521 538 1 607 040 857 305 53,30
Gubitak prije oporezivanjaLoss before taxes
36 712 35 400 37 854 209 945 661 70,00
Porez na dobit Income taxes
63 393 94 182 232 248 117 653 308 086 160 576 52,10
Dobit nakon oporezivanjaNet income
259 271 505 565 976 317 403 885 1 298 953 696 759 53,60
Gubitak nakon oporezivanjaNet loss
36 712 35 400 37 885 209 945 692 73,30
Konsolidirani rezultatConsolidated results
222 559 470 164 938 431 403 676 1 298 008 696 067 53,63
Izvor | Source: FINA

28
ENERGIJA MMIXI OSNOVNI PODACI, GOSPODARSKI I FINANCIJSKI POKAZATELJI
Tablica | Table 1.2.5. Proizvodnja naftnih derivata | Production of petroleum products
Naziv Description
2004. 2005. 2006. 2007. 2008. 2009. 2009./2008.
Broj poduzetnikaNumber of employers
9 9 9 12 12 8 -
Broj zaposlenihEmployment
10 806 10 807 11 077 11 053 10 996 10 748 97,74
Ukupni prihodi Revenues
17 282 944 20 831 880 23 325 433 25 159 688 27 934 435 20 643 573 74,70
Ukupni rashodi Total expenses
15 751 348 19 711 755 22 443 345 23 902 719 28 926 081 21 334 147 74,50
Dobit prije oporezivanjaIncome before taxes
1 531 872 1 132 476 882 367 1 259 099 41 846 79 596 190,20
Gubitak prije oporezivanjaLoss before taxes
276 12 350 279 2 129 1 041 785 770 170 73,90
Porez na dobit Income taxes
299 443 227 376 179 631 216 229 -192 393 -121 506 63,20
Dobit nakon oporezivanjaNet income
1 232 428 905 100 702 736 1 042 870 32 373 62 558 193,20
Gubitak nakon oporezivanjaNet loss
276 12 350 279 2 129 839 918 631 626 75,20
Konsolidirani rezultatConsolidated results
1 232 153 892 750 702 457 1 040 740 -807 545 -569 068 70,47
Izvor | Source: FINA
Tablica | Table 1.2.6. Proizvodnja nuklearnog goriva | Production of nuclear fuel
Naziv Description
2004. 2005. 2006. 2007. 2008. 2009. 2009./2008.
Broj poduzetnikaNumber of employers
- 1 1 1 2 2 -
Broj zaposlenihEmployment
8 8 - - 58 67 115,52
Ukupni prihodi Revenues
4 176 4 344 - 12 42 653 40 721 95,5
Ukupni rashodi Total expenses
3 994 4 162 - 11 39 227 41 927 106,9
Dobit prije oporezivanjaIncome before taxes
181 182 - 1 3 426 511 14,9
Gubitak prije oporezivanjaLoss before taxes
- - - 0 0 1 717 -
Porez na dobit Income taxes
43 46 - 0 785 172 22,0
Dobit nakon oporezivanjaNet income
139 136 - 1 2 641 338 12,8
Gubitak nakon oporezivanjaNet loss
- - - 0 0 1 717 -
Konsolidirani rezultatConsolidated results
139 136 - 1 - -1.379 -
Izvor | Source: FINA

29
ENERGY MMIXI GENERAL DATA, ECONOMIC AND FINANCIAL INDICATORS
Tablica | Table 1.2.7. Proizvodnja i distribucija električne energije | Electricity generation and distribution
Naziv Description
2004. 2005. 2006. 2007. 2008. 2009. 2009./2008.
Broj poduzetnikaNumber of employers
15 23 31 51 82 114 -
Broj zaposlenihEmployment
14 001 13 887 13 791 13 669 13 759 13 731 99,80
Ukupni prihodi Revenues
15 942 805 16 831 049 18 120 834 18 582 525 21 018 042 22 312 883 106,20
Ukupni rashodi Total expenses
15 349 167 16 213 728 17 700 829 18 353 372 20 780 340 21 930 274 105,50
Dobit prije oporezivanjaIncome before taxes
598 338 623 594 429 151 485 149 334 783 461 533 137,90
Gubitak prije oporezivanjaLoss before taxes
4 700 6 274 9 146 255 998 97 081 78 924 81,30
Porez na dobit Income taxes
29 543 50 263 111 137 75 203 18 485 76 246 412,50
Dobit nakon oporezivanjaNet income
568 795 573 332 318 014 411 846 316 296 396 573 125,40
Gubitak nakon oporezivanjaNet loss
4 700 6 274 9 146 257 897 97 078 90 210 92,90
Konsolidirani rezultatConsolidated results
564 095 567 058 308 867 153 949 219 218 306 363 139,75
Izvor | Source: FINA
Tablica | Table 1.2.8. Proizvodnja plina i distribucije plinskih goriva | Gas production and gaseous fuel distribution
Naziv Description
2004. 2005. 2006. 2007. 2008. 2009. 2009./2008.
Broj poduzetnikaNumber of employers
31 32 35 36 46 55 -
Broj zaposlenihEmployment
1 872 2 082 2 150 2 008 2 095 2 057 98,19
Ukupni prihodi Revenues
1 955 845 2 210 680 2 278 304 2 238 737 2 610 986 3 030 091 116,10
Ukupni rashodi Total expenses
1 896 283 2 157 302 2 181 445 2 201 878 2 552 597 3 007 450 117,80
Dobit prije oporezivanjaIncome before taxes
65 063 56 820 59 663 59 652 62 148 45 107 72,60
Gubitak prije oporezivanjaLoss before taxes
5 501 3 441 14 038 22 793 3 760 22 467 597,50
Porez na dobit Income taxes
5 726 7 883 11 435 10 589 10 367 9 905 95,50
Dobit nakon oporezivanjaNet income
59 337 48 938 48 227 49 063 51 781 35 566 68,70
Gubitak nakon oporezivanjaNet loss
5 501 3 441 14 038 22 793 3 760 22 831 607,20
Konsolidirani rezultatConsolidated results
53 836 45 496 34 188 26 270 48 021 12 735 26,52
Izvor | Source: FINA

30
ENERGIJA MMIXI OSNOVNI PODACI, GOSPODARSKI I FINANCIJSKI POKAZATELJI
Tablica | Table 1.2.9. Trgovina na malo motornim gorivima i mazivima | Motor fuel and lubricant retail sale
Naziv Description
2004. 2005. 2006. 2007. 2008. 2009. 2009./2008.
Broj poduzetnikaNumber of employers
86 97 100 98 100 106 -
Broj zaposlenihEmployment
884 897 1 179 1 180 1 262 1 283 101,64
Ukupni prihodi Revenues
3 109 171 4 423 285 6 007 361 6 743 165 7 632 079 5 556 506 72,80
Ukupni rashodi Total expenses
3 090 542 4 404 748 5 965 998 6 629 056 7 691 404 5 591 392 72,70
Dobit prije oporezivanjaIncome before taxes
27 906 31 912 47 118 125 321 31 328 32 104 102,50
Gubitak prije oporezivanjaLoss before taxes
9 276 13 375 5 754 11 212 90 653 66 990 73,90
Porez na dobit Income taxes
2 140 4 912 5 976 11 267 5 825 363 6,20
Dobit nakon oporezivanjaNet income
25 804 27 028 41 465 114 054 25 503 29 076 114,00
Gubitak nakon oporezivanjaNet loss
9 315 13 402 6 079 11 212 60 653 64 325 71,00
Konsolidirani rezultatConsolidated results
16 489 13 626 35 386 102 842 - 35 150 -35 249 100,28
Izvor | Source: FINA
Tablica | Table 1.2.10. Posredovanje u trgovini gorivima, rudama i metalima | Fuel, mineral and metal trading
Naziv Description
2004. 2005. 2006. 2007. 2008. 2009. 2009./2008.
Broj poduzetnikaNumber of employers
29 36 46 56 27 30 -
Broj zaposlenihEmployment
82 107 155 62 96 136 141,67
Ukupni prihodi Revenues
86 327 153 638 216 590 144 680 219 389 223 498 101,90
Ukupni rashodi Total expenses
86 082 155 720 215 025 145 789 219 344 221 345 100,90
Dobit prije oporezivanjaIncome before taxes
1 222 1 423 2 728 1 529 1 546 4 066 262,90
Gubitak prije oporezivanjaLoss before taxes
977 3 505 1 163 2 638 1 502 1 914 127,40
Porez na dobit Income taxes
270 267 317 291 389 953 245,00
Dobit nakon oporezivanjaNet income
951 1 169 2 410 1 238 1 157 3 119 269,50
Gubitak nakon oporezivanjaNet loss
977 3 518 1 163 2 638 1 502 1 920 127,90
Konsolidirani rezultatConsolidated results
-26 -2349 1 246 -1 400 -345 1 199 347,53
Izvor | Source: FINA
31
ENERGY MMIXI GENERAL DATA, ECONOMIC AND FINANCIAL INDICATORS
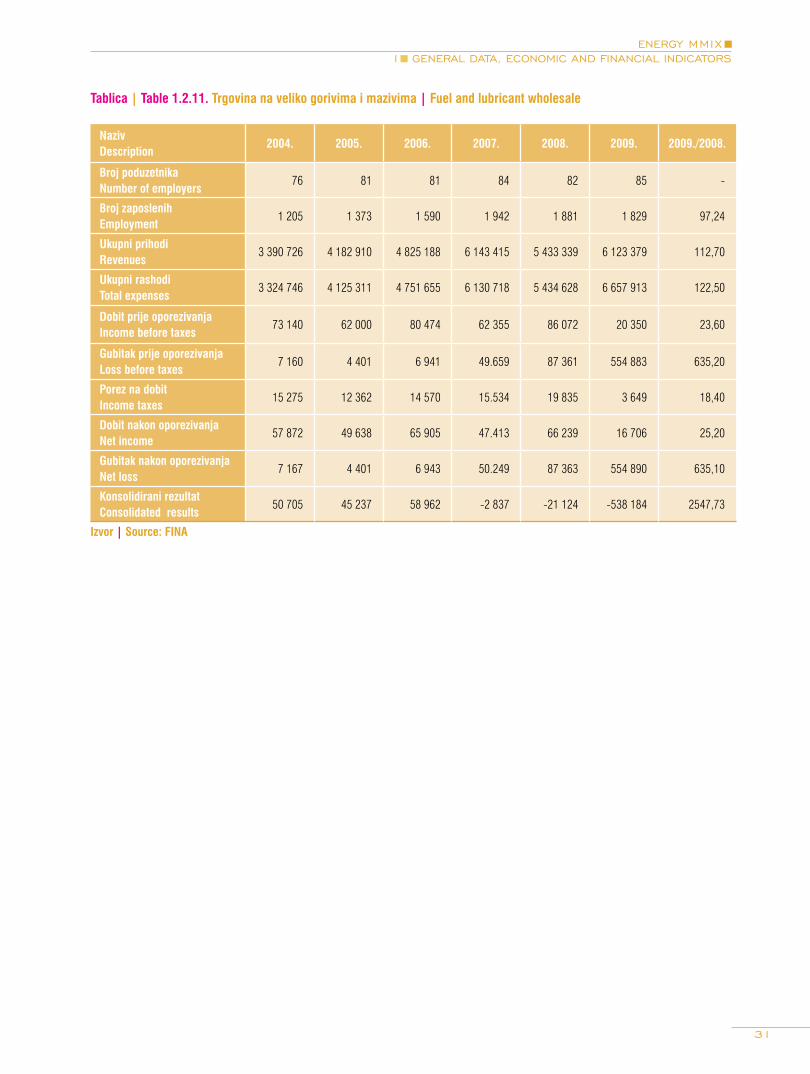
Tablica | Table 1.2.11. Trgovina na veliko gorivima i mazivima | Fuel and lubricant wholesale
Naziv Description
2004. 2005. 2006. 2007. 2008. 2009. 2009./2008.
Broj poduzetnikaNumber of employers
76 81 81 84 82 85 -
Broj zaposlenihEmployment
1 205 1 373 1 590 1 942 1 881 1 829 97,24
Ukupni prihodi Revenues
3 390 726 4 182 910 4 825 188 6 143 415 5 433 339 6 123 379 112,70
Ukupni rashodi Total expenses
3 324 746 4 125 311 4 751 655 6 130 718 5 434 628 6 657 913 122,50
Dobit prije oporezivanjaIncome before taxes
73 140 62 000 80 474 62 355 86 072 20 350 23,60
Gubitak prije oporezivanjaLoss before taxes
7 160 4 401 6 941 49.659 87 361 554 883 635,20
Porez na dobit Income taxes
15 275 12 362 14 570 15.534 19 835 3 649 18,40
Dobit nakon oporezivanjaNet income
57 872 49 638 65 905 47.413 66 239 16 706 25,20
Gubitak nakon oporezivanjaNet loss
7 167 4 401 6 943 50.249 87 363 554 890 635,10
Konsolidirani rezultatConsolidated results
50 705 45 237 58 962 -2 837 -21 124 -538 184 2547,73
Izvor | Source: FINA


ENERGIJA U HRVATSKOJ 2009. ENERGY IN CROATIA 2009
IIII


35
ENERGY MMIXI I ENERGY IN CROATIA 2009
2.1. Uvod 2.1. Introduction
Značenje kratica na slici 2.1.1. je sljedeće:
GDP - bruto domaći proizvodTPES - ukupna potrošnja energijeTFC - neposredna potrošnja energije GEC - ukupna potrošnja električne energijeNEC - neto potrošnja električne energije (bez gubitaka)
TPES/GDP - energetska intenzivnost ukupno utrošene energi-je, veličina koja pokazuje ukupno utrošenu energiju za ostva-renje jedinice bruto domaćeg proizvodaTFC/GDP - energetska intenzivnost neposredne potrošnje energije, veličina koja pokazuje neposrednu potrošnju energi-je za ostvarenje jedinice bruto domaćeg proizvoda GEC/GDP - energetska intenzivnost ukupne potrošnje elek-trične energije, veličina koja pokazuje prosječnu bruto potroš-nju električne energije za ostvarenje jedinice bruto domaćeg proizvodaNEC/GDP - energetska intenzivnost neto potrošnje električne energije, veličina koja pokazuje prosječnu potrošnju električ-ne energije bez gubitaka za ostvarenje jedinice bruto doma-ćeg proizvoda
U 2009. godini bruto domaći proizvod smanjen je za 5,8 posto u odnosu na prethodnu godinu. Ukupna potrošnja
Acronyms used in Figure 2.1.1:
GDP - Gross Domestic Product;TPES - Total Primary Energy Supply;TFC - Total Final Energy Consumption GEC - Gross Electricity Consumption;NEC - Net Electricity Consumption (losses excluded);
TPES/GDP - Total Primary Energy Supply/Gross Domestic Product – the ratio showing the energy intensity of the total primary energy supply, i.e. the total primary energy supply per unit of gross domestic product;TFC/GDP - energy intensity of the final energy consumption, the measurement showing final energy consumption per unit of gross domestic product; GEC/GDP - Gross Electricity Consumption/Gross Domestic Product – the ratio showing the energy intensity of gross electricity consumption, i.e. the average electricity consump-tion per unit of gross domestic product;NEC/GDP - Net Electricity Consumption/Gross Domestic Product - the ratio showing the energy intensity of net elec-tricity consumption, i.e. the average loss-free electricity con-sumption per unit of gross domestic product.
Slika | Figure 2.1.1. Osnovni pokazatelji razvoja | Main indicators of development Izvor | Source: EIHP
0,80
0,85
0,90
0,95
1,00
1,05
1,10
1,15
1,20
1,25
2004. 2005. 2006. 2007. 2008. 2009.
GDP TPES TFC GEC NEC TPES/GDP TFC/GDP GEC/GDP NEC/GDP

36
ENERGIJA MMIXI I ENERGIJA U HRVATSKOJ 2009.
energije smanjena je za 1,6 posto, dok je ukupna potrošnja električne energije smanjena za 2,3 posto. Smanjenje od 4,4 posto ostvareno je za neto potrošnju električne energije u koju nisu uključeni gubici prijenosa i razdiobe, koji su u 2009. godini povećani za 18,3 posto. Tijekom razdoblja od 2004. do 2009. godine bruto domaći proizvod povećavao se s pro-sječnom godišnjom stopom od 2,1 posto, dok je za ukupnu potrošnju energije ostvareno minimalno smanjenje s prosječ-nom godišnjom stopom od 0,3 posto. U potrošnji električne energije ostvarene su stope rasta pa je tako ukupna potrošnja električne energije ostvarila porast s prosječnom godišnjom stopom od 1,7 a neto potrošnja 2,2 posto. Gubici prijenosa i razdiobe električne energije smanjivali su se prosječno 1,9 posto godišnje. Na slici 2.1.1. prikazan je i razvoj neposredne potrošnje energije koja je u promatranom razdoblju ostvarila trend porasta s prosječnom godišnjom stopom od 0,6 posto.
Navedeni trendovi razvoja bruto domaćeg proizvoda, ukupne potrošnje energije i potrošnje električne energije rezultirali su porastom energetskih intenzivnosti u 2009. u odnosu na 2008. godinu. Energetska intenzivnost ukupne potrošnje energije povećana je za 4,4 posto, a energetska intenzivnost ukupne potrošnje električne energije za 3,7 posto. Energetska intenziv-nost neto potrošnje električne energije također je povećana za 1,5 posto, odnosno energetska intenzivnost neposredne potroš-nje energije za 1,7 posto. Tijekom razdoblja od 2004. do 2009. godine ostvareni su pozitivni trendovi smanjenja energetske intenzivnosti ukupne potrošnje energije, ukupne potrošnje električne energije i neposredne potrošnje energije. Energetska intenzivnost ukupne potrošnje energije smanjivala se s prosječ-nom godišnjom stopom od 2,3 posto, ukupne potrošnje elek-trične energije 0,4 posto i neposredne potrošnje energije 1,4 posto. Samo je energetska intenzivnost neto potrošnje električ-ne energije ostvarila minimalan rast s prosječnom godišnjom stopom od 0,1 posto (slika 2.1.1.).
Na slici 2.1.2. prikazan je razvoj ukupne potrošnje energije u razdoblju od 1988. do 2009. godine. U odnosu na prethodnu godinu ukupna potrošnja energije u 2009. godini smanjena je za 1,6 posto. Smanjenje ukupne potrošnje energije svakako je posljedica smanjenih gospodarskih aktivnosti zbog čega je smanjena neposredna potrošnja energije u svim sektorima, a najveće smanjenje ostvareno je u industriji. U razdoblju od 2004. do 2009. godine ostvaren je trend smanjenja ukupne potrošnje energije s prosječnom godišnjom stopom od 0,3 posto. Od 1992. godine, kada je u Hrvatskoj ostvarena mini-malna ukupna potrošnja, ukupna potrošnja energije do 2009. godine rasla je s prosječnom godišnjom stopom od 1,8 posto.
In 2009 gross domestic product fell by 5.8 percent from the previous year. Total primary energy supply decreased by 1.6 percent, and total electricity consumption by 2.3 percent. Net electricity consumption decreased by 4.4 percent, not inclu-ding distribution and transmission losses, which were 18.3 percent higher than in 2008. Over the period 2004 to 2009, gross domestic product grew at an average rate of 2.1 per-cent per annum, while total primary energy supply minimally decreased by an average 0.3 percent per annum. Electricity consumption had a growing trend: total electricity production grew at an average annual rate of 1.7 percent, and net elec-tricity consumption at an average 2.2 percent per annum. Distribution and transmission losses of electricity decreased at a rate of 1.9 percent annually. Figure 2.1.1. shows the trends in final energy demand, which had an upward trend in the observed period, with an average annual rate of 0.6 percent.
The described trends in gross domestic product, total primary energy supply and total electricity consumption resulted in increasing energy intensities in 2009 in relation to 2008. Energy intensity of total primary energy supply in 2009 incre-ased by 4.4 percent, and energy intensity of total electricity consumption by 3.7 percent. Also, energy intensity of net electricity consumption increased by 1.5 percent, and energy intensity of final energy demand by 1.7 percent. Over the period 2004 to 2009 positive trends in reducing energy inten-sities were seen in total primary energy supply, total elec-tricity demand and in final energy demand. Energy intensity in total primary energy supply was decreasing at an average annual rate of 2.3 percent, in total electricity consumption at 0.4 percent and in final energy demand at 1.4 percent per annum. It was only the energy intensity of net electricity con-sumption that increased at an average 0.1 percent annually (Figure 2.1.1.).
Figure 2.1.2. shows the trends in total primary energy supply in the period 1988 to 2009. Compared to the previous year, in 2009 energy consumption decreased by 1.6 percent. Certainly, the reduction of primary energy supply is the result of slowdown in economic activities which led to reducing final energy demand in all consumption sectors. The biggest decrease in energy demand was recorded in the industrial sector. In the period 2004 to 2009 total primary energy supply decreased at an average annual rate of 0.3 percent . Since 1992, when the primary energy supply was at its mini-mum, until 2009 total primary energy supply had an average growing rate of 1.8 percent per annum.

37
ENERGY MMIXI I ENERGY IN CROATIA 2009
Slika | Figure 2.1.2. Ukupna potrošnja energije | Total primary energy supply Izvor | Source: EIHP
Slika | Figure 2.1.3. Potrošnja električne energije | Electricity consumption Izvor | Source: EIHP
0
50
100
150
200
250
300
350
400
450
500
1988. 1990. 1995. 2000. 2005. 2009.
PJ
0
2000
4000
6000
8000
10000
12000
14000
16000
18000
20000
1988. 1990. 1995. 2000. 2005. 2009.
GWh
Bruto potrošnja | Gross consumptionNeto potrošnja (bez gubitaka) | Net consumptionGubici prijenosa i distribucije | Transmission and Distribution Losses

38
ENERGIJA MMIXI I ENERGIJA U HRVATSKOJ 2009.
Slika | Figure 2.1.4. Bruto domaći proizvod po stanovniku - PKM | Gross domestic product per capita - PPP Izvor | Source: EIHP
Na slici 2.1.3. prikazan je razvoj bruto i neto potrošnje električne energije u razdoblju od 1988. do 2009. godine. U razdoblju od 2004. do 2009. godine prosječna godišnja stopa porasta bruto potrošnje električne energije iznosila je 1,7 posto, odnosno neto potrošnje 2,2 posto. U razdoblju od 1992. godine, kada je u Hrvatskoj ostvarena najmanja potrošnja, bruto potrošnja električ-ne energije ostvarila je prosječnu godišnju stopu porasta od 2,7 posto, odnosno neto potrošnja električne energije rasla je malo brže s prosječnom godišnjom stopom od 2,9 posto. U istom razdoblju gubici električne energije povećavali su se sporije tako da je prosječna godišnja stopa iznosila 1,8 posto. U 2009. godini u Hrvatskoj je nakon 1992. godine prvi puta ostvareno smanjenje potrošnje električne energije tako da je bruto potroš-nja iznosila 18 459,2 GWh, a neto potrošnja 16 440,4 GWh.
Na slici 2.1.4. prikazan je ostvareni bruto domaći proizvod u 2009. godini u Hrvatskoj, europskim zemljama, SAD-u i Japanu. Bruto domaći proizvod je određen primjenom pariteta kupovne moći te je u 2009. godini u Hrvatskoj iznosio približno 16 456 USD 2005 po stanovniku. U odnosu na prosječan bruto domaći proizvod u Europskoj uniji (EU 27), bruto domaći proizvod po stanovniku u Hrvatskoj bio je manji za 38 posto. U četrnaest europskih zemalja ostvaren je manji bruto domaći proizvod, dok je u svim ostalim zemljama prikazanim na slici on bio veći.
Figure 2.1.3. shows the trends in total and net electricity consumption in the period 1988 to 2009. In the period 2004 to 2009 the average annual increasing rate of gross electricity consumption was 1.7 percent, and of net electricity con-sumption 2.2 percent. In the period from 1992, the year when the consumption in Croatia was at its lowest level, total elec-tricity consumption had an average annual growing rate of 2.7 percent and net electricity consumption grew slightly faster, at an average 2.9 percent per annum. In the same period the electricity losses were increasing at slower pace so that the average annual rate was 1.8 percent. For the first time after 2009 electricity consumption in Croatia decreased so that total consumption was 18,459.2 GWh, while net consumption was 16,440,4 GWh.
Figure 2.1.4. shows the realized gross domestic product in 2009 in Croatia, in the European countries, USA and Japan. GDP is determined by application of purchase power parities, and in 2009 the Croatian GDP amounted to approximately 16,456 USD 2005 per capita. In comparison to the GDP ave-rage of the European Union (EU 27), gross domestic product per capita in Croatia was 38 percent lower. Fourteen European countries had a lower GDP level, while in all other countries shown in the Figure below it was higher than Croatian.
0
5000
10000
15000
20000
25000
30000
35000
40000
45000
50000
55000
60000
65000
70000
LU NO US CH NL IE AT IS BE DK GB SE DE FI JP FREU
27 ES IT GR SI CZ PT SK HU PL HR EE LT RU LV TR BY RO BG RS MK ALBA UA MD
USD
2005
/sta
novn
iku
| US
$ 20
05/in
habi
tant
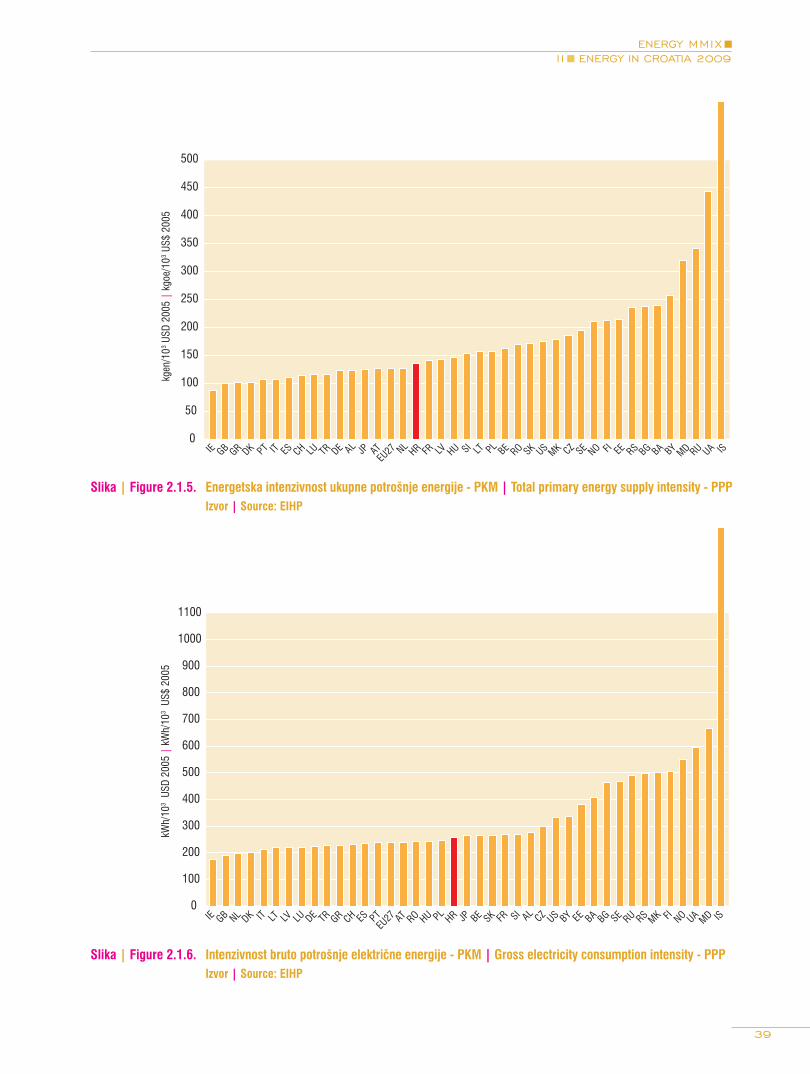
39
ENERGY MMIXI I ENERGY IN CROATIA 2009
Slika | Figure 2.1.5. Energetska intenzivnost ukupne potrošnje energije - PKM | Total primary energy supply intensity - PPP Izvor | Source: EIHP
Slika | Figure 2.1.6. Intenzivnost bruto potrošnje električne energije - PKM | Gross electricity consumption intensity - PPP Izvor | Source: EIHP
0
50
100
150
200
250
300
350
400
450
500
IE GB GR DK PT IT ES CH LU TR DE AL JP ATEU
27 NLHR FR LV HU SI LT PL BE RO SK US MK CZ SE NO FI EE RS BG BA BY MD RU UA IS
kgen
/103 U
SD 2
005
| kg
oe/1
03 US$
200
5
0
100
200
300
400
500
600
700
800
900
1000
1100
IE GB NL DK IT LT LV LU DE TR GR CH ES PTEU
27 AT RO HU PLHR JP BE SK FR SI AL CZ US BY EE BA BG SE RU RS MK FI NO UA MD IS
kWh/
103
USD
2005
| k
Wh/
103
US$
2005

40
ENERGIJA MMIXI I ENERGIJA U HRVATSKOJ 2009.
Na slikama 2.1.5. i 2.1.6. prikazane su energetske intenziv-nosti ukupne potrošnje energije i bruto potrošnje električne energije. Određene su korištenjem bruto domaćeg proizvoda određenog primjenom pariteta kupovne moći i izraženog u USD 2005. U 2009. godini u Hrvatskoj je za ostvarenje tisuću USD 2005 određenih primjenom pariteta kupovne moći utro-šeno 135 kg ekvivalentne nafte ukupne energije, što je za 6,8 posto više u odnosu na prosjek u Europskoj uniji (EU 27). Povoljnije vrijednosti energetske intenzivnosti ukupno utroše-ne energije ostvarene su 16 promatranih zemalja, dok ostale zemlje prikazane na slici imaju lošiju energetsku intenzivnost. Ukupna potrošnja električne energije za tisuću USD 2005 bruto domaćeg proizvoda, određenog primjenom pariteta kupovne moći, u Hrvatskoj je u 2009. godini iznosila 257 kWh, što je za 7,6 posto više u odnosu na europski prosjek (EU 27). U odnosu na pojedine europske zemlje energetska intenzivnost ukupne potrošnje električne energije nepovolj-nija je u odnosu na energetsku intenzivnost ukupno utrošene energije, pa je tako u devetnaest zemalja na slici ostvarena manja potrošnja električne energije za jedinicu bruto doma-ćeg proizvoda.
2.2. Proizvodnja primarne energije
Proizvodnja primarne energije tijekom razdoblja od 2004. do 2009. godine prikazana je u tablici 2.2.1. Na slici 2.2.1. prikazan je razvoj proizvodnje primarne energije od 1988. godine kao i predviđanje proizvodnje do 2030. godine. U budućnosti se očekuje postepeno smanjivanje proizvodnje fosilnih goriva i porast proizvodnje obnovljivih izvora, koji bi u daljoj budućnosti trebali imati sve značajniju ulogu. Proizvodnja primarne energije u 2009. godini povećana je za 7,1 posto u odnosu na prethodnu godinu. Zbog vrlo povoljnih hidroloških prilika energija iskorištenih vodnih snaga poveća-na je za 31 posto. Također je povećana i proizvodnja energije iz obnovljivih izvora za 29,8 posto te energija ogrjevnog drva za 5,6 posto. U energiji obnovljivih izvora sadržana je ener-gije vjetra, energija Sunca, geotermalna energija, biodizel te deponijski i bioplin, dok je energiji ogrjevnog drva dodana energija drvnih otpadaka u industriji, energija drvnih peleta i briketa te energija drvenog ugljena. Proizvodnja sirove nafte u 2009. godini smanjena je za 6,6 posto, a proizvodnja prirod-nog plina za 0,6 posto.
Figures 2.1.5. and 2.1.6. show energy intensities of primary energy supply and gross electricity consumption. They are determined by use of gross domestic product defined by pur-chase power parities and expressed in USD 2005. In 2009 in Croatia for realization of one thousand USD 2005 determined by PPP, 135 kilograms of oil equivalent of total energy was used, which is 6.8 percent above the European average (EU 27). More favorable energy intensity values of total primary energy supply were recorded in 16 observed countries, while other countries in the Figure above had les favorable energy intensities. In 2009 in Croatia for 1000 USD 2005 of gross domestic product determined by PPP 257 kWh of total elec-tricity consumption was used, which is 7.6 percent above the European average (EU 27). In comparison to the European countries, total electricity consumption intensity was less favorable in relation to total primary energy supply intensity: in 19 countries shown in the Figure above electricity con-sumption per unit of GDP was lower.
2.2. Primary Energy Production
The primary energy production in the period 2004 to 2009 is given in Table 2.2.1. Figure 2.2.1. shows the trends in primary energy production from 1988 as well as production forecasts to 2030. It is expected that in the future, fossil fuels production will gradually decrease, while the production of renewable energy sources is expected to grow. Renewables are expected to have an increasingly important role. In 2009 primary energy production increased by 7.1 percent from the previous year. Due to favorable hydrology, the energy from hydro power utilization increased by 31 percent. Also, the production from renewable energy sources increased by 29.8 percent, as well as the energy from fuel wood which was 5.6 percent higher. The energy from renewables included wind energy, solar energy, geothermal energy, biodiesel and landfill gas and biogas, while the energy from fuel wood also included energy from industrial wood waste, wood pallets, briquettes, and charcoal. In 2009 the production of crude oil decreased by 6.6 percent, and the production of natural gas by 0.6 percent .

41
ENERGY MMIXI I ENERGY IN CROATIA 2009
Tablica | Table 2.2.1. Proizvodnja primarne energije | Primary energy production
2004. 2005. 2006. 2007. 2008. 2009. 2009./08. 2004.-09.
PJ %
Ogrjevno drvoFuel Wood
16,09 14,96 17,38 15,42 17,01 17,97 5,6 2,2
Sirova naftaCrude Oil
42,44 40,11 38,90 37,27 35,42 33,07 -6,6 -4,9
Prirodni plinNatural Gas
77,08 79,76 94,27 100,12 94,05 93,50 -0,6 3,9
Vodne snageHydro Power
69,00 62,40 58,18 42,21 50,19 65,77 31,0 -1,0
Obnovljivi izvoriRenewables
0,02 0,20 0,24 0,84 1,03 1,34 29,8 132,8
UKUPNOTOTAL
204,62 197,42 208,96 195,87 197,70 211,64 7,1 0,7
Izvor | Source: EIHP
Slika | Figure 2.2.1. Proizvodnja primarne energije | Primary energy production Izvor | Source: EIHP
0
50
100
150
200
250
300
1988. 1990. 2000. 2010. 2020. 2030.
PJ
Ugljen | Coal Drvo i biomasa | Biomass Sirova nafta | Crude Oil
Prirodni plin | Natural Gas Vodne snage | Hydro Power Obnovljivi izvori | Renewables

42
ENERGIJA MMIXI I ENERGIJA U HRVATSKOJ 2009.
2004. godina
Year: 2004
Tijekom šestogodišnjeg razdoblja od 2004. do 2009. godine proizvodnja primarne energije u Hrvatskoj povećavala se s prosječnom godišnjom stopom od 0,7 posto. Najbrže je rasla proizvodnja energije iz obnovljivih izvora, gdje je zbog vrlo niske početne vrijednosti ostvarena godišnja stopa rasta od čak 132,8 posto. Također je ostvaren trend porasta proizvod-nje prirodnog plina i ogrjevnog drva, dok je u proizvodnji sirove nafte zabilježen trend smanjivanja proizvodnje s pro-sječnom godišnjom stopom od 4,9 posto. Proizvodnja prirod-nog plina povećavala se s prosječnom godišnjom stopom od 3,9 posto, a ogrjevnog drva 2,2 posto. Hidrološke prilike bile su u 2004. godini nešto povoljnije u odnosu na 2009. godinu tako da je u korištenju vodnih snaga ostvareno smanjenje s prosječnom godišnjom stopom od 1 posto.
Udjeli pojedinih oblika energije u ukupnoj proizvodnji primar-ne energije za dvije karakteristične godine proteklog razdoblja i za 2030. godinu prikazani su na slici 2.2.2. U razdoblju od 2004. do 2009. godine povećan je udio prirodnog plina i ogr-jevnog drva. Udio prirodnog plina povećan je s 37,7 na 44,2 posto, a udio ogrjevnog drva s 7,9 na 8,5 posto. Također je u stalnom porastu bio i udio ostalih obnovljivih izvora energije (energija vjetra, biodizel, energija Sunca, geotermalna energi-ja, deponijski i bio plin) tako da su oni u 2009. godini sudje-lovali s 0,63 posto. Hidrološke prilike bila su takve da se udio vodnih snaga smanjio s 33,7 na 31,1 posto. Udio sirove nafte smanjen je za 5,1 posto te je u 2009. godini iznosio 15,6 posto. U razdoblju do 2030. godine udio fosilnih goriva postupno će se smanjivati tako da će prirodni plin i sirova nafta zajedno sudjelovati s približno 25 posto. Preostale tri četvrtine proizvodnje primarne energije činit će obnovljivi izvori energije pri čemu će udio vodnih snaga iznositi oko 32 posto, udio ogrjevnog drva i biomase 19,6 posto, a udio ostalih obnovljivih izvora 23,6 posto.
Over the six year period between 2004 and 2009 primary energy production in Croatia increased at an average annual rate of 0.7 percent. The fastest growth was in the energy production from renewables, where due to low basic levels the annual growth rate was as high as 132.8 percent. An increase was also recorded in natural gas production and fuel wood production, while crude oil production had a downward trend with an average annual rate of 4.9 percent. The produc-tion of natural gas increased by an average 3.9 percent per annum, and fuel wood production by 2.2 percent per annum . Hydrologic conditions in 2004 were somewhat more favora-ble than in 2009 so that the utilization of hydro power saw a decline at an annual average 1 percent .
Figure 2.2.2 shows the shares of specific energy forms in total primary energy production for two characteristic years of the observed period and for the year 2030. In the period 2004 to 2009 the shares of natural gas and fuel wood were increa-sed. The share of natural gas grew from 37.7 to 44.2 percent and the share of fuel wood from 7.9 to 8.5 percent. Also, the share of renewables was in constant increase (wind energy, biodiesel, solar energy, geothermal energy, landfill gas and biogas) so that in 2009 these energy sources made for 0.63 percent of total primary energy production. Hydrologic conditions were such that the share of hydro power dropped from 33.7 to 31.1 percent. The share of crude oil fell by 5.1 percent so that in 2009 it was 15.6 percent. In the period to 2030 the share of fossil fuels will gradually decrease and natural gas and crude oil combined will make approximately 25 percent of total primary energy production. The remaining three quarters would consist of renewable energy sources, where the share of hydro power will be about 32 percent, of fuel wood and biomass 19.6 percent, and the share of other renewables 23.6 percent.
Vodne snage | Hydro Power 33,7%
Obnovljivi izvori | Renewables 0,01%
Sirova nafta | Crude Oil 20,7%
Prirodni plin | Natural Gas 37,7%
Ogrjevno drvo | Fuel Wood 7,9%

43
ENERGY MMIXI I ENERGY IN CROATIA 2009
2009. godina
Year: 2009
2030. godina
Year: 2030
Na četiri sljedeće slike prikazana je ukupna proizvodnja primarne energije i proizvodnja pojedinih primarnih oblika energije po stanovniku u Hrvatskoj te u četrdeset europskih zemalja uključujući Europsku uniju (EU 27), SAD i Japan. Uz ukupnu proizvodnju primarne energije prikazana je specifična proizvodnja prirodnog plina, sirove nafte i električne energije u hidroelektranama. U ukupnoj proizvodnji primarne energije, u koju je uključena i nuklearna, povoljnija situacija u odnosu na specifičnu proizvodnju u Hrvatskoj vidljiva je u dvadeset i šest zemalja, uglavnom zbog korištenja nuklearne energije u pojedinim zemljama. U proizvodnji prirodnog plina veća spe-cifična proizvodnja ostvarena je u šest zemalja, u proizvodnji sirove nafte u devet zemalja, uključujući i prosjek za Europsku uniju (EU 27) te u proizvodnji električne energije u hidroelek-tranama u osam zemalja.
The following four Figures show the total primary energy production and production of individual primary energy forms per inhabitant in Croatia and in 40 countries including European Union (EU 27), USA and Japan. In addition to pri-mary energy production, shown is the production of natural gas, crude oil, and hydro electricity. In total primary energy production, which includes nuclear energy, 26 countries had more favorable situation than Croatia when specific producti-on is concerned. This is mainly because of the use of nuclear energy in some of these countries. In natural gas production six countries had a higher specific production; nine countries in crude oil production including the EU average (EU27), and eight countries in hydro electricity production.
Slika | Figure 2.2.2. Udjeli u proizvodnji primarne energije | Shares in primary energy production Izvor | Source: EIHP
Vodne snage | Hydro Power 31,1%
Obnovljivi izvori | Renewables 0,63%
Prirodni plin | Natural Gas 44,2%
Ogrjevno drvo | Fuel Wood 8,5%
Sirova nafta | Crude Oil 15,6%
Ogrjevno drvo | Fuel Wood 19,6% Obnovljivi izvori | Renewables 23,6%
Vodne snage | Hydro Power 31,9% Prirodni plin | Natural Gas 15,4%
Sirova nafta | Crude Oil 9,5%

44
ENERGIJA MMIXI I ENERGIJA U HRVATSKOJ 2009.
Slika | Figure 2.2.3. Proizvodnja primarne energije po stanovniku | Primary energy production per capita Izvor | Source: EIHP
Slika | Figure 2.2.4. Proizvodnja prirodnog plina po stanovniku | Natural gas production per capita Izvor | Source: EIHP
0
1000
2000
3000
4000
5000
6000
7000
8000
9000
10000
11000
12000
13000
NO IS RU US SE DK NL FI EE CZ GB CH FR SI AT PLEU
27 UA DE RS RO BG BE BA SK LT HR HU LV GR MK JP ES AL IT PT TR BY IE LU MD
kgen
/sta
novn
iku
| kg
oe/in
habi
tant
5017
119
102
0
500
1000
1500
2000
2500
3000
3500
4000
NO RU NL DK US GB HR RO UAEU
27 HU AT DE IT PL IE RS JP BG BY SK CZ FR TR EE ALGR SI ES BE FI IS LU PT SE CH BA LV LT MK MD
kgen
/sta
novn
iku
| kg
oe/in
habi
tant
1826
5
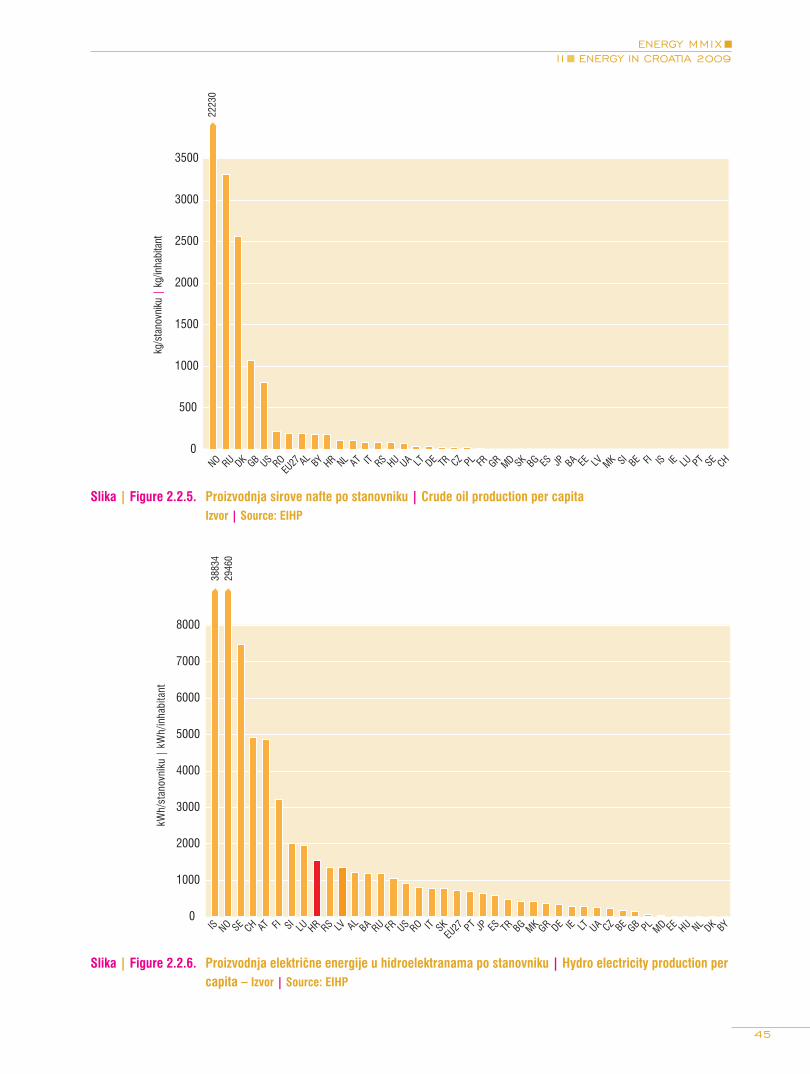
45
ENERGY MMIXI I ENERGY IN CROATIA 2009
Slika | Figure 2.2.5. Proizvodnja sirove nafte po stanovniku | Crude oil production per capita Izvor | Source: EIHP
Slika | Figure 2.2.6. Proizvodnja električne energije u hidroelektranama po stanovniku | Hydro electricity production per capita – Izvor | Source: EIHP
0
1000
2000
3000
4000
5000
6000
7000
8000
IS NO SE CH AT FI SILU HR RS LV AL BA RU FR US RO IT SK
EU27 PT JP ES TR BG MK GR DE IE LT UA CZ BE GB PL
MD EE HU NL DK BY
kWh/
stan
ovni
ku |
kW
h/in
habi
tant
3883
429
460
0
500
1000
1500
2000
2500
3000
3500
NO RU DK GB US ROEU
27 AL BY HR NL AT IT RS HU UA LT DE TR CZ PL FR GR MD SK BG ES JP BA EE LV MK SI BE FI IS IE LU PT SE CH
kg/s
tano
vnik
u |
kg/in
habi
tant
2223
0

46
ENERGIJA MMIXI I ENERGIJA U HRVATSKOJ 2009.
2.3. Uvoz i izvoz energije
U tablici 2.3.1. prikazani su podaci o uvozu energije u razdo-blju od 2004. do 2009. godine, dok je na slici 2.3.1. prikazan razvoj uvoza pojedinih oblika energije u proteklom razdoblju od 1988. do 2009. godine. Ukupni uvoz energije u Hrvatsku u 2009. godini smanjen je za 9,3 posto u odnosu na prethodnu godinu. Smanjen je uvoz većine proizvoda, dok je uvoz sirove nafte i ogrjevnog drva, uključujući i ostalu biomasu, povećan. Uvoz sirove nafte povećan je za 17,1 posto, a drva i biomase za vrlo visokih 259,4 posto, ali se tu radi o vrlo maloj količini energije. Uvoz derivata nafte te ugljena i koksa smanjen je za 41,1 odnosno 40,9 posto, a uvoz prirodnog plina i električne energije za 14,9, odnosno 7,1 posto. Tijekom razdoblja od 2004. do 2009. godine ostvaren je trend smanjenja uvoza energije u Hrvatsku s prosječnom godišnjom stopom od 0,8 posto. U uvozu električne energije i derivata nafte ostvaren je trend porasta uvoza s prosječnim godišnjim stopama od 7,4 posto, odnosno 3,1 posto. U uvozu svih ostalih oblika energi-je ostvaren je trend smanjenja pa je tako uvoz ugljena i koksa padao s prosječnom godišnjom stopom od 7,2 posto, uvoz sirove nafte 1,9 posto i uvoz prirodnog plina 0,2 posto.
Tablica | Table 2.3.1. Uvoz energije u Hrvatsku | Energy import in Croatia
2004. 2005. 2006. 2007. 2008. 2009. 2009./08. 2004.-09.
PJ %
Ugljen i koksCoal and Coke
33,73 31,51 35,56 35,69 39,26 23,21 -40,9 -7,2
Sirova naftaCrude Oil
189,49 182,57 167,96 191,31 147,27 172,45 17,1 -1,9
Derivati naftePetroleum Products
40,01 43,34 53,10 50,86 79,01 46,54 -41,1 3,1
Prirodni plinNatural Gas
35,82 38,56 38,30 35,87 41,71 35,50 -14,9 -0,2
Električna energijaElectricity
19,07 31,49 29,93 28,12 29,39 27,29 -7,1 7,4
Drvo i biomasaBiomass
0,00 0,00 0,03 0,03 0,11 0,38 259,4
UKUPNOTOTAL
318,12 327,47 324,89 341,89 336,74 305,37 -9,3 -0,8
Izvor | Source: EIHP
2.3. Energy Import and Export
Table 2.3.1. gives the data on energy import in the period 2004 to 2009, and Figure 2.3.1. shows the trends in imports of specific energy forms in the period 1988 to 2009. Total import of energy in Croatia in 2009 decreased by 9.3 percent from the previous year. Most of the products were imported in smaller quantities, while the import of crude oil and fuel wood and biomass was increased. The import of crude oil increa-sed by 17.1 percent and of wood and biomass by high 259.4 percent, but the latter involves a very small quantity of energy. The import of oil derivates and coal and coke was decreased by 41.1 percent and 40.9 percent respectively; the import of natural gas and electricity decreased by 14.9 percent and 7.1 percent respectively. Over the period 2004 to 2009 there was a decreasing trend in the Croatian energy import which declined by an average 0,8 percent per annum. The import of electricity and oil derivates had an upward trend with average annual rates of 7.4 percent and 3.1 percent respectively. The import of all other energy forms declined: the import of coal and coke decreased at an average rate of 7.2 percent per annum, the import of crude oil at an annual rate of 1.9 percent and import of natural gas at 0.2 percent annually.

47
ENERGY MMIXI I ENERGY IN CROATIA 2009
Slika | Figure 2.3.1. Uvoz energije u Hrvatsku | Energy import in Croatia Izvor | Source: EIHP
Udjeli pojedinih oblika energije u ukupnoj uvoznoj energiji, u 2004. i 2009. godini, prikazani su na slici 2.3.2. U razdoblju od 2004. do 2009. godine ostvarene su određene strukturne promjene te je tako udio uvozne sirove nafte te ugljena i koksa smanjen, dok su udjeli ostalih energenata povećani. Udio sirove nafte smanjen je s 59,6 na 56,5 posto, a udio ugljena i koksa s 10,6 na 7,6 posto. Udio uvoznih derivata povećan je s 12,6 na 15,2 posto, dok je udio prirodnog plina minimalno povećan s 11,3 na 11,6 posto. Također je povećan i udio električne energije s 6 na 8,9 posto. Udio uvozne bio-mase iznosio je u 2009. godini samo 0,12 posto.
Figure 2.3.2. shows the shares of individual energy forms in total imported energy in 2004 in 2009. In the period 2004 to 2009 certain structural changes occurred, so that the share of imported crude oil and coke and coal declined while the shares of other energy products increased. The share of crude oil fell form 59.6 to 56.5 percent, and the share of coal and coke from 10.6 to 7.6 percent. The share of imported oil derivates incre-ased from 12.6 to 15.2 percent, while the share of natural gas increased from 11.3 to 11.6 percent. Also, the share of electri-city increased from 6 to 8.9 percent. The share of biomass was only 0.12 percent in 2009.
50
0
100
150
200
250
300
350
1988. 1990. 1995. 2000. 2005. 2009.
PJ
Ugljen i koks | Coal and Coke Sirova nafta | Crude Oil Derivati nafte | Petroleum Products
Prirodni plin | Natural Gas Električna energija | Electricity Drvo i biomasa | Biomass

48
ENERGIJA MMIXI I ENERGIJA U HRVATSKOJ 2009.
Slika | Figure 2.3.2. Udjeli u uvoznoj energiji | Shares in imported energy Izvor | Source: EIHP
2004. godina
Year: 2004
2009. godina
Year: 2009
Struktura oblika energije koji su se izvozili iz Hrvatske u raz-doblju od 2004. do 2009. godine prikazana je u tablici 2.3.2. te na slici 2.3.3. za razdoblje od 1988. do 2009. godine. U 2009. godini ukupni izvoz energije iz Hrvatske povećan je za 10,8 posto. Pri tome je povećan izvoz gotovo svih energena-ta, a samo je izvoz krutih goriva smanjen za 36 posto. Izvoz električne energije povećan je za 19,6 posto, prirodnog plina za 15,7 posto, ogrjevnog drva i ostale biomase za 13,8 posto te derivata nafte za 9,1 posto. Tijekom razdoblja od 2004. do 2009. godine ostvaren je trend porasta izvoza energije s pro-sječnom godišnjom stopom od 2,3 posto. U izvozu prirodnog plina i električne energije ostvaren je trend porasta s prosječ-nim godišnjim stopama od 18,3 posto, odnosno 3,1 posto. Izvoz ugljena i koksa je padao s prosječnom godišnjom stopom od 11,6 posto, dok se izvoz derivata nafte smanjivao sporije uz prosječnu godišnju stopu od 1,7 posto.
Table 2.3.2. gives the shares of the energy forms exported from Croatia in the period 2004 to 2009. and Figure 2.3.3. shows the energy export structure for the period 1988 to 2009. In 2009 total export of energy from Croatia increased by 10.8 percent. The increase was recorded in the export of all energy products, except for solid fuels where export fell by 36 percent. The export of electricity increased by 19.6 percent, of natural gas by 15.7 percent, of fuel wood and biomass by 13.8 percent and of oil derivates by 9.1 percent. Over the period from 2004 to 2009 there was a growing trend in energy export at an average annual rate of 2.3 percent. The export of natural gas and electricity had a growing trend with average annual rates of 18.3 and 3.1 percent respectively. The export of coal and coke decreased at an annual average rate of 11.6 percent, and the export of oil derivates decreased at a slower pace, at an average annual rate of 1.7 percent.
Derivati nafte | PetroleumProducts 12,6%
Prirodni plin | Natural Gas 11,3%
Električna energija | Electricity 6,0%
Ugljen i koks | Coal and Coke 10,6%
Sirova nafta | Crude Oil 59,6%
Derivati nafte | Petroleum Products 15,2%
Drvo i biomasa | Biomass 0,12%
Prirodni plin | Natural Gas 11,6%
Električna energija | Electricity 8,9%
Ugljen i koks | Coal and Coke 7,6%
Sirova nafta | Crude Oil 56,5%

49
ENERGY MMIXI I ENERGY IN CROATIA 2009
Tablica | Table 2.3.2. Izvoz energije Iz Hrvatske | Energy exports from Croatia
2004. 2005. 2006. 2007. 2008. 2009. 2009./08. 2004.-09.
PJ %
Ugljen i koksCoal and Coke
1,28 1,08 1,14 1,29 1,08 0,69 -36,0 -11,6
Drvo i biomasaBiomass
1,92 1,86 3,38 3,84 13,8
Derivati naftePetroleum Products
86,71 79,00 77,95 85,42 73,02 79,69 9,1 -1,7
Prirodni plinNatural Gas
11,82 15,18 30,45 25,56 23,66 27,37 15,7 18,3
Električna energijaElectricity
5,88 13,08 9,69 5,22 5,71 6,83 19,6 3,1
UKUPNOTOTAL
105,69 108,34 121,15 119,35 106,85 118,43 10,8 2,3
Izvor | Source: EIHP
Slika | Figure 2.3.3. Izvoz energije Iz Hrvatske | Energy exports from Croatia Izvor | Source: EIHP
25
0
50
75
100
125
150
175
1988. 1990. 1995. 2000. 2005. 2009.
PJ
Ugljen i koks | Coal and Coke Sirova nafta | Crude Oil Derivati nafte | Petroleum Products
Prirodni plin | Natural Gas Električna energija | Electricity Drvo i biomasa | Biomass

50
ENERGIJA MMIXI I ENERGIJA U HRVATSKOJ 2009.
2004. godina
Year: 2004
2009. godina
Year: 2009
Slika | Figure 2.3.4. Udjeli u izvezenoj energiji | Shares in exported energy Izvor | Source: EIHP
Na slici 2.3.4 prikazani su udjeli pojedinih oblika energije u ukupnom izvozu energije iz Hrvatske u 2004. i 2009. godini. U promatranom razdoblju ostvarene su značajne promjene u strukturi izvoza pojedinih oblika energije. Tako je udio derivata nafte smanjen s 82 na 67,3 posto, dok je udio prirodnog plina povećan s 11,2 na 23,1 posto. Neznatno je povećan i udio električne energije s 5,6 na 5,8 posto, a izvoz ogrjevnog drva i ostale biomase s udjelom od 3,2 posto u 2009. godini zauzima sve značajnije mjesto. Udio ugljena i koksa u struk-turi izvoza energije smanjen je s 1,2 na 0,6 posto.
Figure 2.3.4 shows the shares of individual energy forms in total energy exports from Croatia in 2004 and 2009. In the observed period there were significant changes in the struc-ture of energy exports: the share of oil derivates in exports decreased from 82 to 67.3 percent, while the share of natural gas increased from 11.2 to 23.1 percent. The share of electri-city slightly increased from 5.6 to 5.8 percent, and the export of fuel wood and biomass with share of 3.2 percent in 2009 is becoming increasingly important. The share of coal and coke in total energy export fell from 1.2 to 0.6 percent.
Električna energija | Electricity 5,6%
Derivati nafte | Petroleum Products 82,0%
Prirodni plin | Natural Gas 11,2% Ugljen i koks | Coal and Coke 1,2%
Električna energija | Electricity 5,8%
Prirodni plin | Natural Gas 23,1%
Derivati nafte | Petroleum Products 67,3%
Ugljen i koks | Coal and Coke 0,6%
Biomasa | Biomass 3,2%

51
ENERGY MMIXI I ENERGY IN CROATIA 2009
2.4. Ukupna potrošnja energije
Struktura oblika energije u ukupnoj potrošnji tijekom prote-klog razdoblja od 2004. do 2009. godine prikazana je u tabli-ci 2.4.1. Na slici 2.4.1. prikazan je razvoj ukupne potrošnje energije tijekom proteklog razdoblja od 1988. godine, kao i očekivani razvoj potrošnje u budućnosti. Ukupna potrošnja energije u Hrvatskoj u 2009. godini smanjena je u odnosu na ostvarenu ukupnu potrošnju u prethodnoj godini za 1,6 posto. To smanjenje je rezultat smanjene potrošnje ugljena i koksa, uvozne električne energije, prirodnog plina i tekućih goriva te odgovarajućeg porasta energije iskorištenih vodnih snaga, porasta potrošnje ogrjevnog drva, kao i ostalih obnovljivih izvora. Ukupna potrošnja tekućih goriva bila je manja za 1,2 posto, a prirodnog plina za 7,3 posto. Najveće smanjenje ostvareno je u potrošnji ugljena i koksa i to za 28,8 posto, kao i u potrošnji uvozne električne energije gdje je smanjenje iznosilo 13,6 posto. Energija vodnih snaga je zbog povoljnijih hidroloških prilika u odnosu na prethodnu godinu povećana za 31 posto. U potrošnji obnovljivih izvora energije ostvarena je vrlo visoka stopa porasta od 47,4 posto, dok je porast potrošnje ogrjevnog drva i ostale biomase iznosio 4,5 posto, sve u odnosu na prethodnu godinu.
Tijekom razdoblja od 2004. do 2009. godine također je ostvaren blagi trend smanjenja ukupne potrošnje energije s prosječnom godišnjom stopom od 0,3 posto. U tome razdo-blju ostvaren je trend smanjenja potrošnje gotovo svih oblika energije, a samo je za uvoznu električnu energiju ostvareno povećanje s prosječnom godišnjom stopom od 9,2 posto. Najbrže se smanjivala potrošnja ugljena i koksa i to s prosječ-nom godišnjom stopom od 3,6 posto te potrošnja ogrjevnog drva i ostale biomase s prosječnom godišnjom stopom od 2,2 posto. Smanjenje potrošnje prirodnog plina ostvareno je uz prosječnu godišnju stopu od 0,5 posto, dok je trend smanjenja tekućih goriva bio minimalan tako da je godišnja stopa iznosila samo 0,2 posto. Hidrološke prilike bile su u 2004. godini malo povoljnije u odnosu na 2009. godinu pa je i u korištenju vodnih snaga ostvarena negativna stopa od 1 posto.
2.4. Total Primary Energy Supply
Table 2.4.1. gives the shares of energy forms in total primary energy supply in the period between 2004 and 2009. Figure 2.4.1. shows the trends in total primary energy supply in the period from 1988, as well as the projected trends in the future primary energy supply. In 2009 total primary energy supply in Croatia decreased by 1.6 percent from the previous year. This reduction is the results of decreased consumption of coal and coke, imported electricity, natural gas and liquid fuels. It is also due to the relevant increase in hydro power utilization, larger consumption of fuel wood and other renewables. Total consumption of liquid fuels decreased by 1.2 percent, and of natural gas by 7.3 percent. The largest decrease was recor-ded in the consumption of coal and coke, which was 28.8 percent, and in the consumption of imported electricity which decrease by 13.6 percent. Due to good hydrology situation, hydro power energy increased by 31 percent from the pre-vious year. Also, the consumption of renewables had a high 47.4 percent increase, and the consumption of fuel wood and biomass increased by 4.5 percent from the previous year.
Over the period 2004 to 2009 total primary energy supply increased at an average annual rate of 0.3 percent. Almost all energy forms had decreasing consumption trends in this period, except for imported electricity, where consumption actually growth over these years, by average 9.2 percent per annum. The fastest consumption decrease was in coal and coke, at average annual rate of 3.6 percent and the consump-tion of fuel wood and biomass, by an average 2.2 percent per annum. The consumption of natural gas decreased at an average annual rate of 0.5 percent, while in liquid fuels the decrease was minimal with an average annual rate of only 0.2 percent. In 2004 hydrologic situation were somewhat more favorable in relation to 2009 so that hydro power utilization decreased at an average annual rate of 1 percent per.

52
ENERGIJA MMIXI I ENERGIJA U HRVATSKOJ 2009.
Tablica | Table 2.4.1. Ukupna potrošnja energije | Total Primary Energy Supply
2004. 2005. 2006. 2007. 2008. 2009. 2009./08. 2004.-09.
PJ %
Ugljen i koksCoal and Coke
29,70 32,95 31,61 33,74 34,65 24,66 -28,8 -3,6
Drvo i biomasaBiomass
16,09 14,96 15,48 13,62 13,80 14,42 4,5 -2,2
Tekuća gorivaLiquid Fuels
179,62 181,88 185,15 189,70 180,15 178,04 -1,2 -0,2
Prirodni plinNatural Gas
104,66 101,06 99,86 114,22 110,22 102,15 -7,3 -0,5
Vodne snageHydro Power
69,00 62,40 58,18 42,21 50,19 65,77 31,0 -1,0
Električna energijaElectricity
13,19 18,41 20,24 22,90 23,68 20,46 -13,6 9,2
Obnovljivi izvoriRenewables
0 0 0,24 0,82 0,97 1,43 47,4
UKUPNOTOTAL
412,27 411,85 410,76 417,21 413,66 406,92 -1,6 -0,3
Izvor | Source: EIHP
Slika | Figure 2.4.1. Ukupna potrošnja energije u Hrvatskoj | Total Primary Energy Supply in Croatia Izvor | Source: EIHP
0
100
200
300
400
500
600
700
1988
.
1990
.
1995
.
2000
.
2005
.
2009
.20
10.
2015
.
2020
.
2025
.
2030
.
PJ
Ugljen i koks | Coal and coke
Drvo i biomasa | Biomass
Tekuća goriva | Liquid Fuels
Prirodni plin | Natural Gas
Vodne snage | Hydro Power
Električna energija | Electricity
Obnovljivi izvori | Renewables

53
ENERGY MMIXI I ENERGY IN CROATIA 2009
Na slici 2.4.2. prikazani su ostvareni udjeli pojedinih energe-nata u ukupnoj potrošnji energije u 2004. i 2009. godini, kao i udjeli u predviđenoj potrošnji energije u 2030. godini. Najveći udio u ukupnoj potrošnji energije u Hrvatskoj ostvarila su tekuća goriva. Njihov udio iznosio je 43,6 posto u 2004. godini te se do 2009. godine nije značajnije mijenjao, odnosno mini-malno je povećan na 43,8 posto. Nakon tekućih goriva prema visini udjela slijedi prirodni plin koji je u 2009. godini sudjelo-
2004. godina
Year: 2004
2009. godina
Year: 2009
2030. godina
Year: 2030
Slika | Figure 2.4.2. Udjeli u ukupnoj potrošnji energije | Shares in total primary energy supply Izvor | Source: EIHP
Figure 2.4.2. presents the shares of energy products in total primary energy supply in 2004 and 2009, as well as in the projected total primary energy supply to 2030. Liquid fuels had the biggest share in total primary energy supply in Croatia, with 43.6 percent in 2004 which did not significantly change until 2009. Its share was minimally increased up to 43.8 percent. Its is followed by natural gas, which in 2009 accounted for 25.4 percent of total primary energy supply and
Obnovljivi izvori | Renewables 0,005%
Tekuća goriva | Liquid Fuels 43,6%
Ogrjevno drvo | Fuel Wood 3,9%
Ugljen i koks | Coal and coke 7,2% Električna energija | Electricity 3,2%
Vodne snage | Hydro Power 16,7%
Prirodni plin | Natural Gas 25,4%
Obnovljivi izvori | Renewables 0,35%
Tekuća goriva | Liquid Fuels 43,8%
Ogrjevno drvo | Fuel Wood 3,5%
Ugljen i koks | Coal and coke 6,1% Električna energija | Electricity 5,0%
Vodne snage | Hydro Power 16,2%
Prirodni plin | Natural Gas 25,1%
Tekuća goriva | Liquid Fuels 36,2%
Obnovljivi izvori | Renewables 6,7%
Ogrjevno drvo | Fuel Wood 5,5%
Ugljen i koks | Coal and coke 11,4%
Vodne snage | Hydro Power 9,0%
Prirodni plin | Natural Gas 31,2%

54
ENERGIJA MMIXI I ENERGIJA U HRVATSKOJ 2009.
vao s 25,1 posto. U 2004. godini udio prirodnog plina je izno-sio 25,4 posto što znači da se u promatranom razdoblju mini-malno smanjio za 0,3 posto. Udio vodnih snaga varira ovisno o hidrološkim prilikama pa im je tako udio u 2004. godini iznosio 16,7 posto, a u 2009. godini bio je malo manji i iznosio je 16,2 posto. Smanjen je udio ugljena i koksa s 7,2 posto u 2004. godini na 6,1 posto u 2009. godini. Sa sve većim udjelom u ukupnoj potrošnji energije sudjeluje uvozna električna energija kojoj je udio s 3,2 povećan na 5 posto. Suprotno takvom trendu udio ogrjevnog drva je smanjen i to s 3,9 posto u 2004. godini na 3,5 posto u 2009. godini. U ukupnoj potrošnji obnovljivih izvora energije (energija vjetra, energija Sunca, geotermalna energija, biodizel, deponijski plin i bio plin) ostvarena je visoka stopa porasta, ali se njihov udio nije značajnije povećao te je u 2009. godini iznosio 0,35 posto. Za razdoblje do 2030. godine predviđeno je povećanje udjela ugljena, prirodnog plina, drva i biomase, kao i ostalih obnovljivih izvora. Udio tekućih goriva će se do 2030. godine smanjiti na oko 36 posto. Udio prirodnog plina iznosit će oko 31 posto, ugljena 11,4 posto, vodnih snaga 9 posto, obnovljivih izvora 6,7 posto te drva i biomase 5,5 posto. Predviđeno je da će se elektroenergetski sustav razvijati tako da neće biti potreban uvoz električne energije.
Na četiri sljedeće slike prikazana je ukupna potrošnja ener-gije po glavi stanovnika, ukupna potrošnja tekućih goriva po glavi stanovnika, ukupna potrošnja prirodnog plina po glavi stanovnika i ukupna potrošnja ugljena po glavi stanovnika u Hrvatskoj i u europskim zemljama, Europskoj uniji (EU 27), SAD-u i Japanu. Ukupna potrošnja energije po stanovniku u Hrvatskoj u 2009. godini iznosila je 2 194 kg ekvivalentne nafte te je u odnosu na odgovarajuću potrošnju u Europskoj uniji (EU 27) bila manja za 39,1 posto. Manja potrošnja ostvarena je u sedam zemalja, dok je u ostale 33 promatrane zemlje, uključujući i prosjek za EU 27, ta potrošnja bila veća. U potrošnji tekućih goriva ostvarena je prosječna potrošnja po stanovniku od 960 kg ekvivalentne nafte, manja potrošnja po glavi stanovnika ostvarena je u 17 zemalja, dok je u odnosu na prosjek za Europsku uniju ta potrošnja bila manja za 21 posto. Vrlo slični odnosi su i u potrošnji prirodnog plina gdje je potrošnja po glavi stanovnika bila manja za 37,6 posto u odnosu na Europsku uniju. Manja potrošnja ostvarena je u 17 zemalja, a veća potrošnja u preostale 23 zemlje. U potrošnji ugljena ostvareno je najveće zaostajanje u odnosu na Europsku uniju. Potrošnja ugljena po glavi stanovnika u Hrvatskoj u 2009. godini iznosila je 133 kg ekvivalentne nafte što je za 78,2 posto manje u odnosu na prosječnu potrošnju ugljena u Europskoj uniji od 610 kg ekvivalentne nafte. Manja potrošnja ugljena ostvarena je u 6 promatranih zemalja, dok je u preostale 34 zemlje ta potrošnja bila veća.
over the observed period its share decreased by 0.3 percent. The share of hydro power varied pending on hydrology; in 2004 it was 16.7 percent while in 2009 it slightly decreased to 16.2 percent. The share of coal and coke dropped from 7.2 percent in 2004 to 6.1 percent in 2009. Imported electricity had an increasing share in total primary energy supply, from 3.2 percent to 5 percent. Contrary to this trend, the share of fuel wood was reduced from 3.9 percent in 2004 down to 3.5 percent in 2009. The consumption of energy from renewa-ble energy sources (wind energy, solar, energy, geothermal energy, biodiesel, landfill gas and biogas) had a fast growth, but this share did not grow significantly. In 2009 they acco-unted for only 0.35 percent of primary energy supply. For the period to 2030, the projection is that the shares of coal, natural gas, wood and biomass as well as the shares of other renewables will grow. In this period, liquid fuels are expected to make 36 percent in total primary energy supply. Natural gas would make about 31 percent, coal 11.4 percent, hydro power 9 percent, renewable energy sources 6.7 percent, and wood and biomass 5.5 percent. Also, the projection of the development of the electric power system is such that import of electricity would not be necessary.
Four Figures below present total primary energy supply per inhabitant, total consumption of liquid fuels per inhabitant, total consumption of natural gas per inhabitant, and total consumption of coal per inhabitant in Croatia and in the European countries, European Union (EU27), USA and Japan. In 2009 the Croatian total primary energy supply per inha-bitant was 2194 kilograms of oil equivalent and was 39.1 percent lower than the primary energy supply level in the European Union (EU27). Seven countries of this selection had lower primary energy supply while in other 33 countries, including the EU27 average, it was higher than Croatian. The average consumption of liquid fuels was 960 kilograms of oil equivalent per inhabitant; 17 countries had lower liquid fuels consumption per inhabitant, while this consumption was 21 percent below the EU average. Similar relations were in natural gas consumption where the average consumption per inhabitant was 37.6 percent below the EU level; lower consumption was recorded in 17 countries, while higher con-sumption was recorded in 23 countries. In coal consumption there is a wider gap between Croatia and the EU. In 2009 coal consumption per inhabitant in Croatia was 133 kilograms of oil equivalent or 78.2 percent below the EU average of 610 kilograms of oil equivalent. Lower coal consumption was realized in six countries while the remaining 34 countries had higher coal consumption.

55
ENERGY MMIXI I ENERGY IN CROATIA 2009
Slika | Figure 2.4.3. Ukupna potrošnja energije po stanovniku | Total primary energy supply per capita Izvor | Source: EIHP
Slika | Figure 2.4.4. Ukupna potrošnja tekućih goriva po stanovniku | Total consumption of liquid fuels per capita Izvor | Source: EIHP
0
1000
2000
3000
4000
5000
6000
7000
8000
9000
10000
11000
IS NO LU US FI SE BE RU NL AT FR CZ CH SI EE DE JPEU
27 SK DK GB IE ES IT UA BY GR LT BG HU PL RS PT HR LV RO BA MK TR ALMD
kgen
/sta
novn
iku
| kg
oe/in
habi
tant
2188
4
0
500
1000
1500
2000
2500
3000
3500
4000
4500
5000
LU US IS NO BE NL FI IE JP AT SISE GR CH ES DE DK FR
EU27 IT PT GB RU HR CZ BY LT HU SK PL LV BG RS EE MK RO AL TR BA UA MD
kgen
/sta
novn
iku
| kg
oe/in
habi
tant

56
ENERGIJA MMIXI I ENERGIJA U HRVATSKOJ 2009.
Slika | Figure 2.4.5. Ukupna potrošnja prirodnog plina po stanovniku | Total consumption of natural gas per capita Izvor | Source: EIHP
Slika | Figure 2.4.6. Ukupna potrošnja ugljena i koksa po stanovniku | Total consumption of cola and coke per capita Izvor | Source: EIHP
0
200
400
600
800
1000
1200
1400
1600
1800
2000
2200
2400
RU LU NL US BY BE GB IT UA HU NO IE SK DE ATEU
27 ES DK FI LT CZ JP FR HR EE LV RO MD TR SI PT CH BG PL GR RS SE BA MK AL IS
kgen
/sta
novn
iku
| kg
oe/in
habi
tant
0
200
400
600
800
1000
1200
1400
1600
1800
2000
2200
2400
EE CZ US PL RS FI BA DE BG JP UA RU MK SISK GR DK
EU27 GB IE NL AT RO TR BE HU ES IS IT SE PT FR NO LU HR LT BY LV MD CH AL
kgen
/sta
novn
iku
| kg
oe/in
habi
tant

57
ENERGY MMIXI I ENERGY IN CROATIA 2009
Na slici 2.4.7. prikazan je razvoj vlastite opskrbljenosti ener-gijom u proteklom razdoblju, kao i predviđanje za buduće razdoblje do 2030. godine. Vlastita opskrbljenost energijom je odnos ukupne proizvodnje primarne energije i ukupne potrošnje energije. Ona je u 2009. godini iznosila 52 posto, što je za 4,2 posto više u odnosu na prethodnu godinu, iako je u proteklom razdoblju ostvaren trend njezinog smanjenja. U budućnosti će se vlastita opskrbljenost energijom nastaviti smanjivati tako da će 2030. godine ona iznositi oko 28 posto, odnosno ostalu potrebnu energiju Hrvatska će morati osigurati iz uvoza.
2.5. Energija za energetske transformacije
U tablici 2.5.1. prikazana je struktura oblika energije koji su u razdoblju od 2004. do 2009. godine iskorišteni za energetske transformacije u Hrvatskoj. U 2009. godini ukupna energija za energetske transformacije povećana je za 5,4 posto u odnosu na prethodnu godinu. Povećana je potrošnja tekućih goriva i obnovljivih izvora energije, kao i energija iskorištenih vodnih snaga, dok je potrošnja ugljena, drvnih industrijskih otpadaka i plinovitih goriva smanjena. U odnosu na prethodnu godinu povećanje potrošnje tekućih goriva iznosilo je 7,2 posto, dok
Figure 2.4.7. presents the trend in energy self supply in the observed period as well as the projection for the period to 2030. Energy self-supply is the ratio between total primary energy production and total primary energy supply. In 2009 this ratio was 52 percent, which is 4.2 percent higher than in 2008, although in the previous period it had a declining trend. In the future, energy self supply will continue to decre-ase so that in 2030 it will reach 28 percent, i.e., Croatia will have to cover the remaining energy demand by import.
2.5. Energy Transformation Inputs
Table 2.5.1. gives the share of energy forms that were used for energy transformations in Croatia in the period 2004 to 2009. Total energy transformation inputs in 2009 increased by 5.4 percent from the previous year. The increase was recorded in liquid fuels and renewables, as well as in hydro power utilization, while the use of coal, industrial wood waste and gaseous fuels was lower. In relation to the previ-ous year, the increase in liquid fuels was 7.2 percent, while the hydro power utilization increased by 31 percent. Also,
Slika | Figure 2.4.7. Vlastita opskrbljenost primarnom energijom u Hrvatskoj | Primary energy self supply in Croatia Izvor | Source: EIHP
51,059,9 52,0
0
10
20
30
40
50
60
70
80
1988
.
1990
.
1995
.
2000
.
2005
.
2009
.20
10.
2015
.
2020
.
2025
.
2030
.
%

58
ENERGIJA MMIXI I ENERGIJA U HRVATSKOJ 2009.
Tablica | Table 2.5.1. Struktura energije za energetske transformacije | Energy transformation inputs by energy forms
2004. 2005. 2006. 2007. 2008. 2009. 2009./08. 2004.-09.
PJ %
Ugljen i koksCoal and Coke
21,88 23,36 21,94 23,23 24,03 16,50 -31,3 -5,5
Drvni otpaciSolid Biomass
2,72 2,26 2,16 2,06 1,81 1,74 -3,8 -8,6
Tekuća gorivaLiquid Fuels
261,55 257,19 246,32 264,05 225,95 242,28 7,2 -1,5
Plinovita gorivaGaseous Fuels
44,47 36,69 37,91 50,77 44,05 38,25 -13,2 -3,0
Vodne snageHydro Power
69,00 62,40 58,18 42,21 50,19 65,77 31,0 -1,0
Obnovljivi izvoriRenewables
0,02 0,20 0,24 0,40 0,59 0,80 36,7 110,1
UKUPNOTOTAL
399,64 382,09 366,75 382,72 346,60 365,34 5,4 -1,8
Izvor | Source: EIHP
je iskorištena energija vodnih snaga povećana je za 31 posto. Također je povećana potrošnja energije iz obnovljivih izvora za 36,7 posto, ali treba naglasiti da se tu radi o maloj količini energije jer obnovljivi izvori u energiji za energetske transfor-macije sudjeluju s vrlo malim udjelom. Potrošnja ugljena za energetske transformacije smanjena je za 31,3 posto, a drvnih industrijskih otpadaka za 3,8 posto. Smanjenje potrošnje plino-vitih goriva za energetske transformacije iznosilo je 13,2 posto. Tijekom proteklog šestogodišnjeg razdoblja ostvaren je trend smanjenja energije za energetske transformacije s prosječnom godišnjom stopom od 1,8 posto. Opadajući trend ostvaren je u potrošnji svih energenata osim u iskorištavanju obnovljivih izvora koji u energiji za energetske transformacije sudjeluju s vrlo malim udjelom. Potrošnja drvnih industrijskih otpadaka smanjivala se s prosječnom godišnjom stopom od 8,6 posto, ugljena 5,5 posto i plinovitih goriva 3 posto. Trend smanjenja potrošnje tekućih goriva kao i korištenja vodnih snaga bio je umjereniji, pa su stope smanjenja iznosile 1,5 odnosno 1 posto. Na slici 2.5.1. prikazan je razvoj potrošnje energije za energetske transformacije tijekom proteklog razdoblja od 1988. do 2009. godine.
the use of energy from renewable energy sources increa-sed by 36.7 percent, but it should be mentioned that they make a very small portion in energy transformation inputs. The consumption of coal as energy transformation input decreased by 31.3 percent, and of industrial wood waste by 3.8 percent. The reduction in gaseous fuels as energy transformation input was 13.2 percent. During this six year period the energy transformation inputs decreased at an average annual rate of 1.8 percent. Such a trend was recor-ded in all energy products except renewables which make a very small share in total energy transformation inputs. The average annual decreasing rate in the consumption of indu-strial wood waste was 8.6 percent, of coal 5.5 percent and of gaseous fuels 3 percent. The decreasing trend in liquid fuels use and hydro power was somewhat more moderate so that the respective rates were 1.5 percent, and 1 percent. Figure 2.5.1. shows the trends in energy transformation inputs over the period 1988 to 2009.
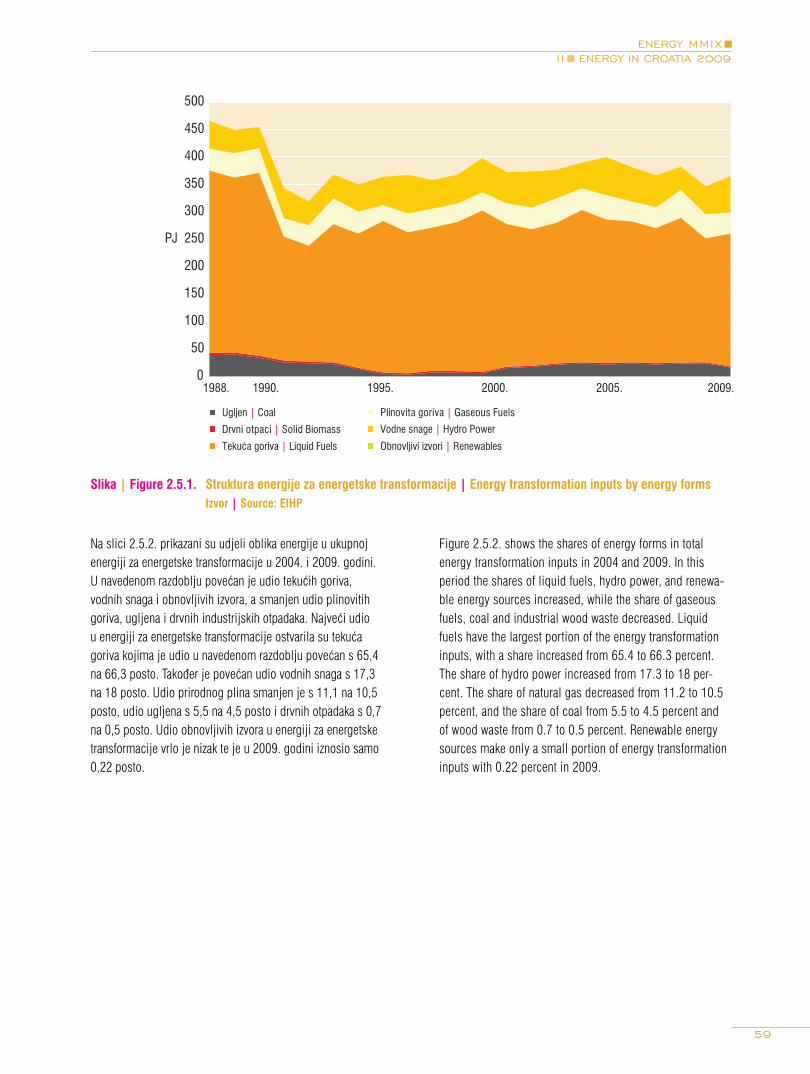
59
ENERGY MMIXI I ENERGY IN CROATIA 2009
Na slici 2.5.2. prikazani su udjeli oblika energije u ukupnoj energiji za energetske transformacije u 2004. i 2009. godini. U navedenom razdoblju povećan je udio tekućih goriva, vodnih snaga i obnovljivih izvora, a smanjen udio plinovitih goriva, ugljena i drvnih industrijskih otpadaka. Najveći udio u energiji za energetske transformacije ostvarila su tekuća goriva kojima je udio u navedenom razdoblju povećan s 65,4 na 66,3 posto. Također je povećan udio vodnih snaga s 17,3 na 18 posto. Udio prirodnog plina smanjen je s 11,1 na 10,5 posto, udio ugljena s 5,5 na 4,5 posto i drvnih otpadaka s 0,7 na 0,5 posto. Udio obnovljivih izvora u energiji za energetske transformacije vrlo je nizak te je u 2009. godini iznosio samo 0,22 posto.
Slika | Figure 2.5.1. Struktura energije za energetske transformacije | Energy transformation inputs by energy forms Izvor | Source: EIHP
Figure 2.5.2. shows the shares of energy forms in total energy transformation inputs in 2004 and 2009. In this period the shares of liquid fuels, hydro power, and renewa-ble energy sources increased, while the share of gaseous fuels, coal and industrial wood waste decreased. Liquid fuels have the largest portion of the energy transformation inputs, with a share increased from 65.4 to 66.3 percent. The share of hydro power increased from 17.3 to 18 per-cent. The share of natural gas decreased from 11.2 to 10.5 percent, and the share of coal from 5.5 to 4.5 percent and of wood waste from 0.7 to 0.5 percent. Renewable energy sources make only a small portion of energy transformation inputs with 0.22 percent in 2009.
0
50
100
150
200
250
300
350
400
450
500
1988. 1990. 1995. 2000. 2005. 2009.
PJ
Ugljen | Coal
Drvni otpaci | Solid Biomass
Tekuća goriva | Liquid Fuels
Plinovita goriva | Gaseous Fuels
Vodne snage | Hydro Power
Obnovljivi izvori | Renewables

60
ENERGIJA MMIXI I ENERGIJA U HRVATSKOJ 2009.
2004. godina
Year: 2004
2009. godina
Year: 2009
Slika | Figure 2.5.2. Udjeli u energiji za energetske transformacije | Shares of energy forms in energy transformation inputs – Izvor | Source: EIHP
Struktura energije za energetske transformacije, u razdoblju od 2004. do 2009. godine, prema postrojenjima u kojima se energetske transformacije obavljaju, prikazana ju u tablici 2.5.2. Razvoj potrošnje energije za energetske transformacije u pojedinim postrojenjima u razdoblju od 1988. do 2009. godine prikazan je na slici 2.5.3. Potrošnja energije za energetske tran-sformacije u 2009. godini povećana je za 5,4 posto. Pri tome je smanjena ulazna energija u većini postrojenja za energetske transformacije, a samo je energija vodnih snaga iskorištena u hidroelektranama povećana za 31 posto i prerada u rafinerijama nafte za 7,2 posto. Najveće smanjenje u odnosu na prethodnu godinu, izraženo u postocima, ostvareno je u elektranama (termoelektrane i vjetroelektrane) za 20,1 posto, u industrijskim kotlovnicama za 12 posto i u gradskim plinarama za 8,9 posto. Potrošnja energije za energetske transformacije u degazolinaži smanjena je za 4,5 posto, u industrijskim toplanama za 4,3 posto, u javnim toplanama za 1,7 posto i u javnim kotlovnica-ma za 1,2 posto.
Table 2.5.2. gives the structure of energy transformation inputs by plants in which the transformation is carried out over the period 2004 to 2009. Figure 2.5.3. shows the trends in energy transformation inputs in specific plants in the period from 1988 to 2009. Energy transformation inputs in 2009 increased by 5.4 percent. Specifically, the inputs were decreased in most of the energy transformation plants. Hydro power plants and refinery processing are the only energy transformation plant where transformation inputs increased in 2009, by 31 percent and 7.2 percent respec-tively. The biggest drop from the previous year, expressed in percentage, was in power plants, (thermal power plants and wind power plants) by 20.1 percent, in industrial hea-ting plants by 12 percent and in gasworks by 8.9 percent. Energy transformation inputs in NGL plants decreased by 4.5 percent, in industrial cogeneration plants by 4.3 per-cent, in public cogeneration plants by 1.7 percent, and in public heating plants by 1.2 percent.
Tekuća goriva | Liquid Fuels 65,4%
Plinovita goriva | GaseousFuels 11,1%
Vodne snage | Hydro Power 17,3%
Obnovljivi izvori | Renewables 0,005%
Ugljen | Coal 5,5%
Drvni otpaci | Solid biomass 0,7%
Tekuća goriva | Liquid Fuels 66,3%
Plinovita goriva | GaseousFuels 10,5%
Vodne snage | Hydro Power 18,0%
Obnovljivi izvori | Renewables 0,22%
Ugljen | Coal 4,5%
Drvni otpaci | Solid biomass 0,5%

61
ENERGY MMIXI I ENERGY IN CROATIA 2009
Tijekom razdoblja od 2004. do 2009. godine ostvaren je trend smanjenja energije za energetske transformacije s prosječnom godišnjom stopom od 1,8 posto. Pri tome je trend smanjenja ostvaren u svim postrojenjima. Najbrže je opadala energija za energetske transformacije u gradskim plinarama, industrijskim kotlovnicama i degazolinaži, a prosječne godišnje stope su iznosile 17,3 posto, 8,3 posto i 4,8 posto. U ostalim postro-jenjima to smanjenje odvijalo se sporije pa je tako energija za javne kotlovnice opadala s prosječnom godišnjom stopom od 2,5 posto, za industrijske toplane 2 posto i za rafinerije nafte 1,9 posto. Najsporije se smanjivala potrošnja energije u javnim toplanama, elektranama i hidroelektranama gdje su stope pada iznosile 1,1 odnosno 1 posto.
In the period 2004 to 2009 energy transformation inputs declined at an average annual rate of 1.8 percent. The decreasing trend was present in all transformation plants. The fastest decrease of energy transformation inputs was in gasworks, industrial heating plants, and NGL plants, with respective average rates of 17.3 percent, 8.3 percent and 4.8 percent. In other plants the decrease was slower, so the energy inputs for public heating plants dropped at an average 2.5 percent annually, for industrial cogeneration plants 2 percent and petroleum refineries 1.9 percent. The slowest decrease in energy transformation inputs was in public cogeneration plants, and power plants and hydro power plants, with the average annual decreasing rates of 1.1 percent and 1 percent respectively.
Tablica | Table 2.5.2. Energija za energetske transformacije u postrojenjima | Energy transformation inputs by plants
2004. 2005. 2006. 2007. 2008. 2009. 2009./08. 2004.-09.
PJ %
HidroelektraneHydro Power Plants
69,00 62,40 58,18 42,21 50,19 65,77 31,0 -1,0
ElektranePower Plants
35,37 35,25 37,58 50,04 41,98 33,54 -20,1 -1,1
Javne toplanePublic Cogeneration Plants
24,33 22,86 21,87 23,57 23,42 23,03 -1,7 -1,1
Javne kotlovnicePublic Heating Plants
4,06 4,32 3,74 3,63 3,62 3,57 -1,2 -2,5
Industrijske toplaneIndustrial Cogeneration Plants
22,68 22,21 22,01 22,05 21,39 20,46 -4,3 -2,0
Industrijske kotlovniceIndustrial Heating Plants
8,02 6,88 7,10 6,63 5,93 5,22 -12,0 -8,3
RafinerijePetroleum Refineries
227,33 219,49 207,96 226,84 193,03 207,03 7,2 -1,9
DegazolinažaNGL Plant
8,34 8,14 7,75 7,32 6,83 6,52 -4,5 -4,8
Gradske plinareGasworks
0,52 0,54 0,57 0,44 0,22 0,20 -8,9 -17,3
UKUPNOTOTAL
399,64 382,09 366,75 382,72 346,60 365,34 5,4 -1,8
Izvor | Source: EIHP

62
ENERGIJA MMIXI I ENERGIJA U HRVATSKOJ 2009.
Udjeli pojedinih postrojenja u ukupnoj energiji za energetske transformacije u 2004. i 2009. godini prikazani su na slici 2.5.4. S najvećim udjelom u energiji za energetske transfor-macije sudjelovale su rafinerije nafte. Njihov je udio u 2004. godini iznosio 56,9 posto i u razdoblju do 2009. godine neznatno se smanjio na vrijednost od 56,7 posto. U navede-nom razdoblju nije bilo značajnijih promjena udjela ostalih postrojenja. Povećan je udio hidroelektrana s 17,3 na 18 posto, udio elektrana s 8,9 na 9,2 posto i udio javnih toplana s 6,1 na 6,3 posto. Udio industrijskih toplana neznatno je smanjen s 5,7 na 5,6 posto, udio degazolinaže s 2,1 na 1,8 posto i udio industrijskih kotlovnica s 2 na 1,4 posto. Udio javnih kotlovnica i gradskih plinara nije se mijenjao.
Figure 2.5.4. shows the shares of specific plants in total energy transformation inputs in 2004 and 2009. Petroleum refineries had the largest share in energy transformation inputs. It was 56.9 percent in 2004 and in the period to 2009 it only slightly decreased to 56.7 percent. In this period there was no significant changes in the shares of other plants. The share of hydro power plants increased from 17.3 to 18 percent, of power plants from 8.9 to 9.2 percent and the share of public cogeneration plants from 6.1 to 6.3 percent. The share of industrial cogeneration plants decreased from 5.7 to 5.6 percent, of NGL plants from 2.1 to 1.8 percent and the share of industrial heating plants from 2 to 1.4 percent. There was no changes in the shares of public heating plants and gasworks.
Slika | Figure 2.5.3. Energija za energetske transformacije u postrojenjima | Energy transformation inputs by plants Izvor | Source: EIHP
0
50
100
150
200
250
300
350
400
450
500
1988. 1990. 1995. 2000. 2005. 2009.
PJ
Hidroelektrane | Hydro Power Plants Elektrane | Power Plants Javne toplane | Public Cogeneration Plants Javne kotlovnice | Public Heating Plants Industrijske toplane | Industrial Cogeneration Plants Industrijske kotlovnice | Industrial Heating Plants Rafinerije | Petroleum Refineries Degazolinaža | NGL Plant Gradske plinare | Gasworks Koksara | Coke Oven Visoke peći | Blast Furnaces

63
ENERGY MMIXI I ENERGY IN CROATIA 2009
Slika | Figure 2.5.4. Udjeli postrojenja u energiji za energetske transformacije | Shares of plants in energy transformation inputs – Izvor | Source: EIHP
2004. godina
Year: 2004
2009. godina
Year: 2009
2.6. Proizvodnja transformiranih oblika energije
Proizvodnja transformiranih oblika energije u razdoblju od 2004. do 2009. godine prikazana je u tablici 2.6.1. Na slici 2.6.1. prikazan je razvoj proizvodnje transformiranih oblika energije tijekom proteklog razdoblja od 1988. do 2009. godine. U 2009. godini ukupna proizvodnja transformira-nih oblika energije povećana je za 5,6 posto u odnosu na prethodnu godinu. Samo je proizvodnja pare i vrele vode smanjena za 4,5 posto, dok je proizvodnja svih ostalih tran-sformiranih oblika energije povećana. Proizvodnja plinovitih goriva povećana je za 28,7 posto, krutih goriva za 13,7 posto i tekućih goriva za 6,7 posto. Najmanji porast od 3,7 posto ostvaren je u proizvodnji električne energije. Tijekom razdo-blja od 2004. do 2009. godine ostvaren je trend smanjenja proizvodnje transformirane energije s prosječnom godišnjom stopom od 1,9 posto. Trend smanjivanja ostvaren je u proi-zvodnji svih transformiranih oblika energije, a najbrže je opa-
2.6. Energy Transformation Outputs
Table 2.6.1 gives the trends in energy transformation outputs in the period 2004 to 2009. Figure 2.6.1. shows the trends in energy transformation outputs in the period 1988 to 2009. In 2009 total energy transformation out-puts increased by 5.6 percent from the previous year. The decrease was recorded only in steam and hot water by 4.5 percent, while the output of all other energy forms actually increased. In gaseous fuels outputs were increased by 28.7 percent, in solid fuels by 13.7 percent and in liquid fuels by 6.7 percent. The slowest growth, of 3.7 percent, was recor-ded in electricity production. In the period 2004 to 2009 there was a downward trend in energy transformation out-puts at an average annual rate of 1.9 percent. The decrease was recorded in all energy transformation outputs, and the
Rafinerije | Petroleum Refineries 56,9%
Degazolinaža | NGL Plant 2,1%
Gradske plinare | Gasworks 0,1%
Javne toplane | Public Cogeneration Plants 6,1%
Javne kotlovnice | Public Heating Plants 1,0%
Industrijske toplane | Industrial Cogeneration Plants 5,7%
Industrijske kotlovnice | Industrial Heating Plants 2,0%
Hidroelektrane | Hydro Power Plants 17,3%
Elektrane | Power Plants 8,9%
Rafinerije | Petroleum Refineries 56,7%
Degazolinaža | NGL Plant 1,8%
Gradske plinare | Gasworks 0,1%
Javne toplane | Public Cogeneration Plants 6,3%
Javne kotlovnice | Public Heating Plants 1,0%
Industrijske toplane | Industrial Cogeneration Plants 5,6%
Industrijske kotlovnice | Industrial Heating Plants 1,4%
Hidroelektrane | Hydro Power Plants 18,0%
Elektrane | Power Plants 9,2%

64
ENERGIJA MMIXI I ENERGIJA U HRVATSKOJ 2009.
dala proizvodnja plinovitih goriva s prosječnom godišnjom stopom od 5,6 posto. Smanjenje proizvodnje krutih i tekućih goriva ostvareno je uz prosječnu godišnju stopu od 1,8 posto, dok se proizvodnja pare i vrele vode smanjivala s prosječnom godišnjom stopom od 2,6 posto. Najsporiji trend smanjenja ostvaren je u proizvodnji električne energije, a prosječna godišnja stopa je iznosila 0,8 posto.
fastest decrease was in gaseous fuels, at an annual average rate of 5.6 percent. The decrease in solid fuels and liquid fuels outputs was at an average annual rate of 1.8 percent, while the output of steam and hot water decreased at an average 2.6 percent annually. The decrease was the slowest in electricity output, at an average 0.8 percent per annum.
Tablica | Table 2.6.1. Proizvodnja transformiranih oblika energije | Energy transformation outputs by energy forms
2004. 2005. 2006. 2007. 2008. 2009. 2009./08. 2004.-09.
PJ %
Kruta gorivaSolid Fuels
3,46 3,23 3,53 3,51 2,77 3,16 13,7 -1,8
Tekuća gorivaLiquid Fuels
218,14 211,39 199,88 218,50 187,15 199,67 6,7 -1,8
Plinovita gorivaGaseous Fuels
13,24 12,22 10,76 10,98 7,71 9,92 28,7 -5,6
Električna energijaElectricity
47,96 44,85 44,75 44,08 44,37 46,00 3,7 -0,8
Para i vrela vodaSteam and Hot Water
35,09 34,42 33,22 32,45 32,16 30,72 -4,5 -2,6
UKUPNOTOTAL
317,90 306,10 292,15 309,52 274,17 289,47 5,6 -1,9
Izvor | Source: EIHP
Slika | Figure 2.6.1. Proizvodnja transformiranih oblika energije | Energy transformation outputs by energy forms Izvor | Source: EIHP
0
50
100
150
200
250
300
350
400
450
1988. 1990. 1995. 2000. 2005. 2009.
PJ
Kruta goriva | Solid Fuels Tekuća goriva | Liquid Fuels Plinovita goriva | Gaseous Fuels
Električna energija | Electricity Para i vrela voda | Steam and Hot Water

65
ENERGY MMIXI I ENERGY IN CROATIA 2009
Udjeli transformiranih oblika energije u ukupnoj proizvodnji transformirane energije u Hrvatskoj u 2004. i 2009. godini prikazani su na slici 2.6.2. U navedenom razdoblju nije bilo značajnijih promjena u strukturi proizvodnje transformirane energije. Najveći udio ostvarila su tekuća goriva te je njihov udio povećan sa 68,6 na 69 posto. Također je povećan i udio električne energije s 15,1 na 15,9 posto, dok su udjeli pare i vrele vode kao i udio plinovitih goriva smanjeni. Udio pare i vrele vode smanjen je s 11 na 10,6 posto, a plinovitih goriva s 4,2 na 3,4 posto. Udio krutih goriva se tijekom promatranog razdoblja nije mijenjao i iznosio je 1,1 posto.
Figure 2.6.2. shows the shares of energy forms in total transformation outputs in Croatia in 2004 and in 2009. In this period there were no significant changes in the energy transformation outputs structure. Liquid fuels had the big-gest share in energy transformation outputs, increasing from 68.6 to 69 percent over this period. The share of electricity also increased, from 15.1 to 15.9 percent, while steam and hot water and gaseous fuels decreased their respective shares. The share of steam and hot water dropped from 11 to 10.6 percent, and of gaseous fuels from 4.2 to 3.4 per-cent. The share of solid fuels was 1.1 percent and did not change in the observed period.
2004. godina
Year: 2004
2009. godina
Year: 2009
Slika | Figure 2.6.2. Udjeli u proizvodnji transformiranih oblika energije | Shares in energy transformation outputs Izvor | Source: EIHP
Proizvodnja transformiranih oblika energije u pojedinim postro-jenjima za energetske transformacije. prikazana je u tablici 2.6.2. i na slici 2.6.3 Tablica se odnosi na prethodno šestogodišnje razdoblje, dok je na slici prikazan razvoj tijekom proteklog razdo-blja od 1988. do 2009. godine. U odnosu na prethodnu godinu u većini je postrojenja smanjena proizvodnja transformirane energije, a porast proizvodnje ostvaren je samo u hidroelektrana-ma za 27,9 posto i u rafinerijama nafte za 8,1 posto. Smanjenje
Table 2.6.2. and Figure 2.6.3 present the energy transfor-mation outputs by energy transformation plants. The Table refers to the six year period while the Figure shows the trend from 1988 to 2009. In 2009, compared to the previous year, energy transformation outputs decreased in most of the plants and the output increase was realized only in hydro power plants, by 27.9 percent and petroleum refineries by 8.1
Plinovita goriva | Gaseous Fuels 4,2%
Električna energija | Electricity 15,1% Para i vrela voda | Steam and Hot Water 11,0%
Kruta goriva | Solid Fuels 1,1%
Tekuća goriva | Liquid Fuels 68,6%
Plinovita goriva | Gaseous Fuels 3,4%
Električna energija | Electricity 15,9% Para i vrela voda | Steam and Hot Water 10,6%
Kruta goriva | Solid Fuels 1,1%
Tekuća goriva | Liquid Fuels 69,0%

66
ENERGIJA MMIXI I ENERGIJA U HRVATSKOJ 2009.
proizvodnje u elektranama (termoelektrane i vjetroelektrane) iznosilo je 22 posto, u industrijskim kotlovnicama 11,9 posto i u degazolinaži 5,1 posto. U ostalim postrojenjima smanjenje proizvodnje bilo je nešto manje. Tako je proizvodnja u gradskim plinarama smanjena za 4,4 posto, u industrijskim toplanama za 4,2 posto, u javnim kotlovnicama za 2,1 posto i u javnim toplanama za 1,8 posto.
Tijekom razdoblja od 2004. do 2009. godine ukupna proi-zvodnja transformirane energije ostvarila je trend smanjenja s prosječnom godišnjom stopom od 1,9 posto. Trend smanjenja proizvodnje ostvaren je u svim postrojenjima. Najbrži trend smanjenja proizvodnje ostvaren je u gradskim plinarama uz prosječnu godišnju stopu od 14,3 posto. Slijede industrijske kotlovnice i degazolinaža u kojima je proizvodnja opadala uz prosječne godišnje stope od 7,7 odnosno 4,8 posto. I u pre-ostalim postrojenjima se proizvodnja transformirane energije smanjivala, i to u javnim kotlovnicama uz prosječnu godišnju stopu od 2,6 posto, u rafinerijama nafte od 1,8 posto, industrij-skim toplanama od 1,7 posto, javnim toplanama od 1,2 posto, elektranama od 0,8 posto i hidroelektranama od 0,7 posto.
percent. The decrease in power plants (thermal power plants and wind power plants) was 22 percent, in industrial heating plants 11.9 percent and in NGL plant 5.1 percent. In other plants the output decrease was somewhat lower. The outputs in gasworks decreased by 4.4 percent, in industrial cogene-ration plants by 4.2 percent, in public heating plants by 2.1 percent and in public cogeneration plants by 1.8 percent.
Over the six year period 2004 to 2009 total energy transfor-mation outputs had a decreasing trend and declined at an average annual rate of 1.9 percent. The decreasing trend was recorded in all the plants and the fastest one was in gasworks, at an annual average rate of 14.3 percent. Follow industrial heating plants and NGL plant where the outputs dropped at annual average rate of 7.7 percent and 4.8 percent respec-tively. In other plants – public heating plants, petroleum refineries, industrial cogeneration plants, public cogeneration plants, power plants and hydro power plants - energy tran-sformation outputs decreased at average annual rates of 2.6 percent, 1.8 percent, 1.7 percent, 1.2 percent, 0.8 percent and 0.7 percent respectively.
Tablica | Table 2.6.2. Proizvodnja transformiranih oblika energije u postrojenjima | Energy transformation outputs by plants
2004. 2005. 2006. 2007. 2008. 2009. 2009./08. 2004.-09.
PJ %
HidroelektraneHydro Power Plants
25,38 23,18 22,04 15,84 19,17 24,53 27,9 -0,7
ElektranePower Plants
13,01 13,10 14,24 18,78 16,04 12,52 -22,0 -0,8
Javne toplanePublic Cogeneration Plants
17,20 16,60 15,64 16,29 16,49 16,20 -1,8 -1,2
Javne kotlovnicePublic Heating Plants
3,30 3,48 2,98 2,99 2,96 2,90 -2,1 -2,6
Industrijske toplaneIndustrial Cogeneration Plants
17,76 17,29 17,29 17,25 17,01 16,29 -4,2 -1,7
Industrijske kotlovniceIndustrial Heating Plants
6,39 5,62 5,78 5,38 4,85 4,28 -11,9 -7,7
RafinerijePetroleum Refineries
226,12 218,21 205,92 225,27 190,60 206,08 8,1 -1,8
DegazolinažaNGL Plant
8,30 8,12 7,72 7,30 6,83 6,48 -5,1 -4,8
Gradske plinareGasworks
0,43 0,51 0,54 0,42 0,21 0,20 -4,4 -14,3
UKUPNOTOTAL
317,90 306,10 292,15 309,52 274,17 289,47 5,6 -1,9
Izvor | Source: EIHP

67
ENERGY MMIXI I ENERGY IN CROATIA 2009
Slika | Figure 2.6.3. Proizvodnja transformiranih oblika energije u postrojenjima | Energy transformation outputs by plants Izvor | Source: EIHP
Na slici 2.6.4. prikazani su udjeli pojedinih postrojenja za energetske transformacije u ukupnoj proizvodnji transformirane energije u 2004. i 2009. godini. Najveći udio u proizvodnji transformirane energije ostvarile su rafinerije nafte. Njihov se udio u promatranom razdoblju neznatno promijenio tako da je u 2009. godini iznosio 71,2 posto. Udjeli ostalih postrojenja promijenili su se za manje iznose, odnosno udjeli industrijskih toplana, javnih kotlovnica i gradskih plinara ostali su nepromi-jenjeni te su iznosili 5,6 posto, 1 posto, odnosno 0,1 posto. Udjeli hidroelektrana, javnih toplana i elektrana su povećani. Udio hidroelektrana povećan je s 8 na 8,5 posto, udio javnih toplana s 5,4 na 5,6 posto i elektrana (termoelektrane i vjetro-elektrane) s 4,1 na 4,3 posto. Udjeli ostalih postrojenja su u promatranom razdoblju smanjeni. Udio degazolinaže smanjen je s 2,6 na 2,2 posto, a udio industrijskih kotlovnica s 2 na 1,5 posto.
Figure 2.6.4. shows the shares of energy transformation out-puts by plants in 2004 and 2009. Petroleum refineries had the largest share in energy to output, with only a slight change over this period: in 2009 it was 71.2 percent. The shares of other plants varied but not significantly, and the shares of industrial cogeneration plants, public heating plants and gasworks remained unchanged and were: 5.6 percent, 1 per-cent, and 0.1 percent respectively. Increased are the shares of hydro power plants, public cogeneration plants and power plants. The share of hydro power plants increased from 8 to 8.5 percent, of public cogeneration plants from 5.4 to 5.6 percent and of power plants (thermal power plants and wind power plants) from 4.1 4.3 percent. Other plants lowered their share in this period. A decrease was recorded in the share of NGL plant from 2.6 to 2.2 percent, and in the share of indu-strial heating plants from 2 to 1.5 percent.
1988. 1990. 1995. 2000. 2005. 2009.
PJ
Hidroelektrane | Hydro Power Plants Elektrane | Power Plants Javne toplane | Public Cogeneration Plants Javne kotlovnice | Public Heating Plants Industrijske toplane | Industrial Cogeneration Plants Industrijske kotlovnice | Industrial Heating Plants Rafinerije | Petroleum Refineries Degazolinaža | NGL Plant
Gradske plinare | Gasworks Koksara | Coke Oven Visoke peći | Blast Furnaces
0
50
100
150
200
250
300
350
400
450

68
ENERGIJA MMIXI I ENERGIJA U HRVATSKOJ 2009.
Slika | Figure 2.6.4. Udjeli postrojenja za energetske transformacije u proizvodnji transformiranih oblika energije | Shares of energy transformation outputs by plants – Izvor | Source: EIHP
2004. godina
Year: 2004
2009. godina
Year: 2009
2.7. Gubici energetskih transformacija
Gubici energetskih transformacija u razdoblju od 2004. do 2009. godine prikazani su u tablici 2.7.1. Oni nastaju u svim postrojenjima za energetske transformacije, a određeni su kao razlika ukupne energije za energetske transformacije i ukupne proizvodnje transformirane energije. U tablici 2.7.2. su ukupni gubici energetskih transformacija podijeljeni prema proizvedenim transformiranim oblicima energije. Tijekom 2009. godine ukupni gubici energetskih transformacija pove-ćani su za 4,7 posto u odnosu na prethodnu godinu. Taj rast je rezultat porasta proizvodnje transformirane energije za 5,6 posto i porasta energije za energetske transformacije za 5,4 posto. Ostvaren je porast gubitaka u proizvodnji električne energije za 8,7 posto, dok je u proizvodnji ostalih transfor-miranih oblika energije ostvareno smanjenje gubitaka. Tako je u proizvodnji derivata nafte ostvareno smanjenje gubitaka proizvodnje za 59,1 posto, u proizvodnji pare i vrele vode za 3,9 posto i u proizvodnji plinovitih goriva za 81,3 posto.
2.7. Energy Conversion Losses
Table 2.7.1. give the energy conversion losses in the period 2004 to 2009. Energy conversion losses occur in all energy transformation plants and are defined as a difference between total energy transformation input and total energy transfor-mation output. In Table 2.7.2. total energy conversion losses are classified by energy transformation outputs. In 2009 total energy conversion losses increased by 4.7 percent from the previous year. This is the result of transformed energy output increased by 5.6 percent and energy transformation inputs increased by 5.4 percent. The conversion losses increased in electricity production, by 8.7 percent, while in production of other transformed energy forms they were reduced. In oil derivates production the losses decreased by 59.1 percent, in steam and hot water production by 3.9 percent and in gaseo-us fuels production by 81.3 percent.
Elektrane | Power Plants 4,1%
Hidroelektrane | Hydro Power Plants 8,0%
Industrijske kotlovnice | Industrial Heating Plants 2,0%
Industrijske toplane | Industrial Cogeneration Plants 5,6% Javne kotlovnice | Public
Heating Plants 1,0% Javne toplane | Public Cogeneration Plants 5,4%
Gradske plinare | Gasworks 0,1%
Degazolinaža | NGL Plant 2,6%
Rafinerije | Petroleum Refineries 71,1%
Elektrane | Power Plants 4,3%
Hidroelektrane | Hydro Power Plants 8,5%
Industrijske kotlovnice | Industrial Heating Plants 1,5%
Industrijske toplane | Industrial Cogeneration Plants 5,6% Javne kotlovnice | Public
Heating Plants 1,0% Javne toplane | Public Cogeneration Plants 5,6%
Gradske plinare | Gasworks 0,1%
Degazolinaža | NGL Plant 2,2%
Rafinerije | Petroleum Refineries 71,2%

69
ENERGY MMIXI I ENERGY IN CROATIA 2009
Tijekom razdoblja od 2004. do 2009. godine ostvaren je trend smanjenja gubitaka energetskih transformacija s prosječnom godišnjom stopom od 1,5 posto. Trend smanjenja ostvaren je u proizvodnji svih transformiranih oblika energije. U proi-zvodnji derivata nafte gubici su se smanjivali s prosječnom godišnjom stopom od 4,4 posto, dok su gubici u proizvodnji plinovitih goriva opadali s prosječnom godišnjom stopom od 51,5 posto. Najsporije su se smanjivali gubici u proizvodnji električne energije s prosječnom godišnjom stopom od 1,1 posto, dok je odgovarajuća stopa smanjivanja gubitaka u pro-izvodnji pare i vrele vode iznosila 3,3 posto.
Tablica | Table 2.7.1. Gubici energetskih transformacija | Total conversion losses
2004. 2005. 2006. 2007. 2008. 2009. 2009./08. 2004.-09.
PJ %
Energija za energetske transformacijeTransformation Sector Input
399,64 382,09 366,75 382,72 346,60 365,34 5,4 -1,8
Proizvodnja transformirane energijeTransformation Sector Output
317,90 306,10 292,15 309,52 274,17 289,47 5,6 -1,9
UKUPNI GUBICI TRANSFORMACIJATOTAL CONVERSION LOSSES
81,74 75,99 74,61 73,20 72,43 75,87 4,7 -1,5
Izvor | Source: EIHP
Tablica | Table 2.7.2. Gubici energetskih transformacija u proizvodnji transformiranih oblika energije | Energy conversion losses in transformed energy production
2004. 2005. 2006. 2007. 2008. 2009. 2009./08. 2004.-09.
PJ %
Derivati nafteOil Derivates
1,25 1,31 2,08 1,58 2,43 1,00 -59,1 -4,4
Plinovita gorivaGaseous Fuels
0,09 0,04 0,02 0,02 0,01 0,00 -81,3 -51,5
Električna energijaElectricity
69,67 64,44 62,62 61,55 60,54 65,79 8,7 -1,1
Para i vrela vodaSteam and Hot Water
10,73 10,21 9,88 10,05 9,45 9,08 -3,9 -3,3
UKUPNOTOTAL
81,74 75,99 74,61 73,20 72,43 75,87 4,7 -1,5
Izvor | Source: EIHP
Over the period 2004 to 2009 there was a decreasing trend in conversion losses at an average annual rate of 1.5 percent. This trend was seen in all transformed energy forms. In the production of oil derivates the losses decreased at an ave-rage annual rate of 4.4 percent, while the losses in gaseous fuels dropped at an average annual rate of 51.5 percent. The slowest decrease of losses was in electricity production, at an annual average 1.1 percent, while this rate in the steam and hot water production was 3.3 percent.
Na slici 2.7.1. je prikazana struktura gubitaka energetskih transformacija u razdoblju od 1988. do 2009. godine. U tome razdoblju spomenuti gubici su se povećavali s prosječnom godišnjom stopom od 0,7 posto. Udjeli gubitaka u proizvod-
Figure 2.7.1. shows the structure of energy conversion losses in the period 1988 to 2009. In this period the conversion

70
ENERGIJA MMIXI I ENERGIJA U HRVATSKOJ 2009.
nji pojedinih transformiranih oblika energije u 2004. i 2009. godini prikazani su na slici 2.7.2. Najveći gubici energetskih transformacija ostvareni su u proizvodnji električne energije. Oni su u ukupnim gubicima energetskih transformacija u 2004. godini sudjelovali s 85,2 posto, a do 2009. godine je njihov udio povećan na 86,7 posto. Značajniji udio u gubicima energetskih transformacija ostvarili su još i gubici u proizvod-nji pare i vrela vode. Njihov je udio u 2004. godini iznosio 13,1 posto, a do 2009. godine je smanjen na 12 posto. Udio gubitaka ostvarenih u proizvodnji derivata nafte u promatranom razdoblju je smanjen s 1,5 na 1,3 posto. Udio gubitaka u proi-zvodnji plinovitih goriva (gradskog plina) bio je zanemariv te je u 2009. godini iznosio samo 0,003 posto, kao rezultat smanji-vanja proizvodnje gradskog plina, odnosno njegove supstitucije prirodnim plinom.
losses increased at an average annual rate of 0.7 percent. Figure 2.7.2. shows the shares in conversion losses in tran-sformed energy production in 2004 and 2009. The highest conversion losses were in electricity production. They made 85.2 percent of total conversion losses in 2004, and in 2009 this share only increased to 86.7 percent. The steam and hot water production also had a significant shares in conversion losses. Their share in 2004 was 13.1 percent, and until 2009 it dropped to 12 percent. The share of the oil derivates production in conversion losses decreased from 1.5 to 1.3 percent in the observed period. The share of gaseous fuels production (city gas) is irrelevant and in 2009 was only 0.003 percent, as a result of reducing the city gas production and replacing it with natural gas.
Slika | Figure 2.7.1. Gubici u proizvodnji transformiranih oblika energije | Energy transformation losses in transformed energy production – Izvor | Source: EIHP
Derivati nafte | Oil Derivates Gradski plin | Gas Works Gas Električna energija | Electricity
Para i vrela voda | Steam and Hot Water Koks | Coke
0
10
20
30
40
50
60
70
80
90
1988. 1990. 1995. 2000. 2005. 2009.
PJ

71
ENERGY MMIXI I ENERGY IN CROATIA 2009
Slika | Figure 2.7.2. Udjeli gubitaka u proizvodnji transformiranih oblika energije | Shares in conversion losses in tran-sformed energy production – Izvor | Source: EIHP
2004. godina
Year: 2004
2009. godina
Year: 2009
2.8. Potrošnja transformiranih oblika energije
Razvoj potrošnje transformiranih oblika energije tijekom razdoblja od 2004. do 2009. godine prikazan je u tablici 2.8.1. Jednako tako je na slici 2.8.1. prikazan razvoj potroš-nje transformiranih oblika energije u proteklom razdoblju od 1988. godine kao i predviđeni razvoj potrošnje u budućnosti do 2030. godine. U 2009. godini potrošnja transformira-nih oblika energije u Hrvatskoj smanjena je za 2,9 posto u odnosu na prethodnu godinu. Samo je potrošnja plinovitih goriva (rafinerijski i gradski plin) povećana za 28,7 posto, dok je potrošnja svih ostalih transformiranih oblika energije sma-njena. Potrošnja pare i vrele vode smanjena je za 4,5 posto, tekućih goriva za 3,7 posto, a električne energije za 2,3 posto. Najveće smanjenje ostvareno je u potrošnji krutih goriva i to za 13,5 posto.
Tijekom razdoblja od 2004. do 2009. godine ostvaren je blagi trend smanjenja potrošnje s prosječnom godišnjom stopom od 0,3 posto. Pri tome je u potrošnji krutih goriva i električ-
2.8. Consumption of Transformed Energy Forms
Table 2.8.1. gives the consumption of transformed energy forms in the period 2004 to 2009 and Figure 2.8.1. shows the trends in the consumption of transformed energy forms in the period from 1988 and the projected trends of the future con-sumption until 2030. In 2009 the consumption of transfor-med energy forms in Croatia decreased by 2.9 percent from the previous year. Only the consumption of gaseous fuels (refinery gas and city gas) was increased by 28.7 percent, while the consumption of all other transformed energy forms decreased. The steam and hot water consumption decreased by 4.5 percent, of liquid fuels by 3.7 percent and of electricity by 2.3 percent. The biggest fall, 13.5 percent, was recorded in the consumption of solid fuels.
During the 2004 to 2009 period, the consumption had a slight decrease at an average annual rate of 0.3 percent. An increase was recorded in the consumption of solid fuels and
Gradski plin | Gas Works Gas 0,1%
Derivati nafte | Oil Derivates 1,5%
Para i vrela voda | Steam and Hot Water 13,1%
Električna energija | Electricity 85,2%
Gradski plin | Gas Works Gas 0,003%
Derivati nafte | Oil Derivates 1,3%
Para i vrela voda | Steam and Hot Water 12,0%
Električna energija | Electricity 86,7%

72
ENERGIJA MMIXI I ENERGIJA U HRVATSKOJ 2009.
ne energije ostvaren trend porasta potrošnje s prosječnim godišnjim stopama od 8,6 i 1,7 posto. U potrošnji ostalih transformiranih oblika energije ostvaren je trend smanjivanja. Potrošnja tekućih goriva, pare i vrele vode te plinovitih goriva smanjivala se s prosječnim godišnjim stopama od 0,5 posto, 2,6 posto i 5,6 posto.
electricity, at average annual rates of 8.6 percent and 1.7 per-cent respectively, while the consumption of other transformed energy forms decreased. In liquid fuels, steam and hot water and of gaseous fuels the consumption decreased at average annual rates of 0.5 percent, 2.6 percent and 5.6 percent respectively.
Tablica | Table 2.8.1. Potrošnja transformiranih oblika energije | Consumption of transformed energy forms
2004. 2005. 2006. 2007. 2008. 2009. 2009./08. 2004.-09.
PJ %
Kruta gorivaSolid Fuels
4,84 8,20 9,19 9,13 8,46 7,33 -13,5 8,6
Tekuća gorivaLiquid Fuels
177,71 181,65 184,05 193,40 179,75 173,05 -3,7 -0,5
Plinovita gorivaGaseous Fuels
13,24 12,22 10,76 10,98 7,71 9,92 28,7 -5,6
Električna energijaElectricity
61,15 63,26 64,99 66,98 68,05 66,45 -2,3 1,7
Para i vrela vodaSteam and Hot Water
35,09 34,42 33,22 32,45 32,16 30,72 -4,5 -2,6
UKUPNOTOTAL
292,04 299,73 302,20 312,94 296,14 287,47 -2,9 -0,3
Izvor | Source: EIHP
Slika | Figure 2.8.1. Potrošnja transformiranih oblika energije | Consumption of transformed energy forms Izvor | Source: EIHP
Kruta goriva | Solid Fuels Tekuća goriva | Liquid Fuels Plinovita goriva | Gaseous Fuels
Električna energija | Electricity Para i vrela voda | Steam and Hot Water Vodik | Hydrogen
0
50
100
150
200
250
300
350
400
450
1988. 1990. 2000. 2010. 2020. 2030.
PJ

73
ENERGY MMIXI I ENERGY IN CROATIA 2009
2004. godina
Year: 2004
2009. godina
Year: 2009
2030. godina
Year: 2030
Na slici 2.8.2. prikazani su udjeli pojedinih transformiranih oblika energije u 2004. i 2009. godini, kao i očekivane vrijed-nosti u 2030. godini. Najznačajniji oblici energije u potrošnji transformirane energije su tekuća goriva, električna energija te para i vrela voda. Najveći udio u potrošnji transformirane energije ostvarila su tekuća goriva. Njihov je udio s 60,9 posto u 2004. godini minimalno smanjen na 60,2 posto u 2009. godini. U istom razdoblju je udio električne energije povećan s 20,9 na 23,1 posto, dok je udio pare i vrele vode minimalno smanjen s 12 na 10,7 posto. Plinovita i kruta
Slika | Figure 2.8.2. Udjeli u ukupnoj potrošnji transformirane energije | Shares in total transformed energy consumption Izvor | Source: EIHP
Figure 2.8.2. shows the shares of specific transformed energy forms in 2004 and 2009, as well as the projected values for the year 2030. The most important energy forms in transfor-med energy consumption are liquid fuels, electricity and steam and hot water. The largest share in the transformed energy consumption was that of liquid fuels, with 60.9 per-cent in 2004, which only minimally dropped to 60.2 percent in 2009. In the same period the share of electricity increased from 20.9 to 23.1 percent, while the share of steam and hot water decreased only slightly from 12 to 10.7 percent.
Para i vrela voda | Steam and Hot Water 12,0%
Plinovita goriva | Gaseous Fuels 4,5%
Električna energija | Electricity 20,9% Kruta goriva | Solid Fuels 1,7%
Tekuća goriva | Liquid Fuels 60,9%
Para i vrela voda | Steam and Hot Water 10,7%
Plinovita goriva | Gaseous Fuels 3,5%
Električna energija | Electricity 23,1% Kruta goriva | Solid Fuels 2,5%
Tekuća goriva | Liquid Fuels 60,2%
Para i vrela voda | Steam and Hot Water 16,5%
Plinovita goriva | Gaseous Fuels 2,8%
Električna energija | Electricity 26,3%
Kruta goriva | Solid Fuels 0,8%
Tekuća goriva | Liquid Fuels 51,8%
Vodik | Hydrogen 1,8%

74
ENERGIJA MMIXI I ENERGIJA U HRVATSKOJ 2009.
goriva u ukupnoj potrošnji transformirane energije sudjeluju sa znatno manjim udjelima pa se tako udio plinovitih goriva smanjio s 4,5 na 3,5 posto. Potrošnja krutih goriva je u proma-tranom razdoblju rasla najbrže zbog čega je i njihov udio s 1,7 posto u 2004. godini povećan na 2,5 posto. u 2009. godini.
Na slikama 2.8.3. i 2.8.4. prikazan je razvoj potrošnje najzna-čajnijih transformiranih oblika energije – električne energije i pojedinih derivata nafte, u razdoblju od 1988. do 2009. godine. Ukupna potrošnja električne energije u 2009. godini smanjena je za 2,3 posto u odnosu na prethodnu godinu. Pri tome je potrošnja električne energije u sektoru usluga povećana za 1 posto, a gubici prijenosa i distribucije za 18,3 posto. U svim ostalim sektorima ostvareno je smanjenje potrošnje i to u prometu za 3,6 posto, u kućanstvima za 3,7 posto, u grupi ostalih potrošača (poljoprivreda i građevinar-stvo) za 4,8 posto i u industriji za 10,9 posto. U sektoru ener-getike (potrošnja za pogon energetskih postrojenja) potrošnja električne energije smanjena je za 11,7 posto u odnosu na prethodnu godinu.
Gaseous fuels and solid fuels make only minor shares in total transformed energy consumption: the share of gaseous fuels dropped from 4.5 to 3.5 percent. The consumption of solid fuels in the observed period had the fastest increase so that their share changed from 1.7 percent in 2004 to 2.5 percent in 2009.
Figures 2.8.3. and 2.8.4. show the trends in the consumption of the most important transformed energy forms – electricity and some oil derivates, in the period from 1988 to 2009. Total consumption of electricity in 2009 decreased by 2.3 percent from the previous year. The consumption of electricity in the services sector increased by 1 percent and distribution and transmission losses by 18.3 percent. In all other sectors the consumption was reduced: in transport by 3.6 percent, in households by 3.7 percent, in other consumption sectors (agriculture and construction) by 4.8 percent, and in industry by 10.9 percent. In the energy sector (energy sector own use) the electricity consumption was reduced by 11.7 percent from to the previous year.
Slika | Figure 2.8.3. Potrošnja električne energije u pojedinim sektorima | Electricity consumption by sectors Izvor | Source: EIHP
0
1000
2000
3000
4000
5000
6000
7000
8000
1988. 1990. 1995. 2000. 2005. 2009.
GWh
Gubici | Losses Energetika | Energy SectorIndustrija | Industry Promet | TransportKućanstva | Households Usluge | Service sectorOstalo | Others

75
ENERGY MMIXI I ENERGY IN CROATIA 2009
U razdoblju od 2004. do 2009. godine ostvaren je trend porasta potrošnje električne energije s prosječnom godišnjom stopom od 1,7 posto. Pri tome se potrošnja u sektoru energetike sma-njivala s prosječnom godišnjom stopom od 2,4 posto, a gubici prijenosa i distribucije s prosječnom godišnjom stopom od 1,9 posto. U svim ostalim sektorima ostvaren je trend porasta potrošnje. Najbrže je rasla potrošnja električne energije u sek-toru usluga i u grupi ostalih potrošača (građevinarstvo i poljo-privreda), gdje su prosječne godišnje stope iznosile 5,9 i 2,6 posto. Potrošnja električne energije u prometu i u kućanstvima povećavala se s prosječnim godišnjim stopama od 1,7 odno-sno 1,3 posto, dok je najsporiji rast ostvaren u industriji gdje je prosječna godišnja stopa porasta iznosila 0,4 posto.
Ukupna potrošnja tekućih goriva u 2009. godini smanjila se u odnosu na prethodnu godinu za 3,8 posto. Potrošnja loživog ulja povećana za 7,2 posto, dok je u potrošnji svih ostalih karakterističnih grupa tekućih goriva ostvareno smanjenje potrošnje. Tako je potrošnja plinskog ulja i ukapljenog plina bila manja za 3,9 i 3,8 posto, a motornog benzina za 0,6
In the period 2004 to 2009 the electricity consumption had a growing trend at an average annual rate of 1.7 percent. The energy sector own use decreased at average annual rate of 2.4 percent, and the transmission and distribution losses at an average 1.9 percent per annum. In all other sectors the consumption had an upward trend. The fastest was the growth of electricity consumption in the services sector and in the other sectors (construction and agriculture), where average annual rates were 5.9 and 2.6 percent respectively. The consumption of electricity in the transport sector and in hou-seholds increased at average annual rates of 1.7 percent and 1.3 percent respectively, while the slowest growth was in the industry at an average annual rate of 0.4 percent.
Total consumption of liquid fuels in 2009 decreased from the previous year by 3.8 percent. The consumption of fuel oil increased by 7.2 percent, while the consumption of all characteristic groups of liquid fuels was reduced. The con-sumption of gasoil and liquefied gas dropped by 3.9 and 3.8 percent, and of motor gasoline by 0.6 percent. The biggest
Slika | Figure 2.8.4. Potrošnja tekućih goriva | Liquid fuels consumption Izvor | Source: EIHP
1988. 1990. 1995. 2000. 2005. 2009.
103 t
0
200
400
600
800
1000
1200
1400
1600
1800
2000
Ukapljeni plin | LPGMotorni benzin | Motor GasolinePlinsko ulje | Gas Oil
Loživo ulje | Fuel OilOstali derivati | Other Petroleum Products

76
ENERGIJA MMIXI I ENERGIJA U HRVATSKOJ 2009.
reduction was in the consumption of other oil derivates and was 19.1 percent. In the period 2004 to 2009 the consump-tion of liquid fuels decreased at an average annual rate of 0.6 percent. In this period the consumption of LPG and gasoil increased at average annual rates of 6.4 percent and 0.8 per-cent respectively, while the consumption of other liquid fuels decreased. The fastest decrease was in consumption of other derivates at an average annual rate of 5 percent. The con-sumption of motor gasoline and fuel oil decreased at average annual rates of 0.9 percent and 1.2 percent respectively.
Four Figures below give the comparison of the specific total consumption per capita of electricity, motor gasoline, gas oils and residual fuel oils in Croatia and in forty selected countri-es including the EU27 average. This specific consumption of typical transformed energy forms in Croatia has the following characteristics when compared to other countries:
• Gross electricity consumption per capita in Croatia is 38.7 percent below the European Union (EU27) average; 10 European countries had lower electricity consumption level than Croatia,
• Consumption of motor gasoline per capita in Croatia is 15.4 percent below the European Union (EU27) average; 18 countries had lower motor gasoline consumption than Croatia,
• Consumption of gas oils per capita in Croatia is 24.5 percent below the European Union (EU27) average; 18 countries had lower consumption of gas oils than Croatia
• Consumption of residual fuel oils per capita in Croatia is 125.3 percent above the European Union (EU27) average, while only three countries had higher consumption of fuel oils than Croatia.
posto. Najveće smanjenje ostvareno je u potrošnji ostalih derivata nafte i iznosilo je 19,1 posto. Tijekom razdoblja od 2004. do 2009. godine ostvareno je smanjenje potrošnje tekućih goriva s prosječnom godišnjom stopom od 0,6 posto. U tom razdoblju se povećavala potrošnja ukapljenog naftnog plina i plinskih ulja s prosječnim godišnjim stopama od 6,4 i 0,8 posto, dok je u potrošnji ostalih tekućih goriva ostvaren opadajući trend. Najbrže se smanjivala potrošnja ostalih deri-vata pri čemu je prosječna godišnja stopa iznosila 5 posto. Potrošnja motornog benzina i loživog ulja smanjivala se s prosječnom godišnjom stopom od 0,9 odnosno 1,2 posto.
Na četiri sljedeće slike uspoređena je specifična ukupna potrošnja električne energije, motornih benzina, plinskih ulja i loživih ulja po glavi stanovnika u Hrvatskoj i u četrdeset izabra-nih zemalja uključujući i prosjek za EU 27. Spomenuta speci-fična potrošnja karakterističnih transformiranih oblika energije u Hrvatskoj ima sljedeća obilježja u odnosu na druge zemlje:
• bruto potrošnja električne energije po glavi stanovnika u Hrvatskoj manja je za 38,7 posto u odnosu na odgovaraju-ću prosječnu potrošnju u Europskoj uniji (EU 27), a manja potrošnja ostvarena je u deset europskih zemalja
• potrošnja motornog benzina po glavi stanovnika u Hrvatskoj manja je za 15,4 posto u odnosu na odgovarajuću prosječ-nu potrošnju u Europskoj uniji (EU 27), a manja potrošnja ostvarena je u osamnaest zemalja
• potrošnja plinskih ulja po glavi stanovnika u Hrvatskoj manja je za 24,5 posto u odnosu na odgovarajuću prosječnu po-trošnju u Europskoj uniji, a manja potrošnja ostvarena je u osamnaest zemalja
• potrošnja loživih ulja po glavi stanovnika u Hrvatskoj veća je za 125,3 posto u odnosu na odgovarajuću prosječnu potrošnju u Europskoj uniji (EU 27), a veća potrošnja ostvarena je samo u tri zemlje

77
ENERGY MMIXI I ENERGY IN CROATIA 2009
Slika | Figure 2.8.5. Bruto potrošnja električne energije po stanovniku | Gross electricity consumption per capita Izvor | Source: EIHP
Slika | Figure 2.8.6. Potrošnja motornog benzina po stanovniku | Motor gasoline consumption per capita Izvor | Source: EIHP
0
2000
4000
6000
8000
10000
12000
14000
16000
18000
20000
22000
24000
26000
28000
30000
IS NO FI LU SE US BE CH AT JP FR DE NL EE SIRU CZ DK
EU27 IE ES GB GR IT SK BG PT RS MK HU HR PL UA LT BY LV BA RO TR AL
MD
kWh/
stan
ovni
ku |
kW
h/in
habi
tant
5146
3
0
200
400
600
800
1000
1200
US LU IS CH IE SE GR JP SIDK FI NO GB NL EE DE RU AT CZ IT
EU27 LV HR HU PT ES BE FR LT BY SK UA PL BA BG RO MD RS MK TR AL
kg/s
tano
vnik
u |
kg/in
habi
tant

78
ENERGIJA MMIXI I ENERGIJA U HRVATSKOJ 2009.
Slika | Figure 2.8.7. Potrošnja plinskih ulja po stanovniku | Gas oils consumption per capita Izvor | Source: EIHP
Slika | Figure 2.8.8. Potrošnja loživog ulja po stanovniku | Heavy fuel oil consumption per capita Izvor | Source: EIHP
0
100
200
300
400
500
600
700
800
900
1000
1100
1200
1300
1400
LU BE IS SI AT IE CH NO FI ES DK FR DE US GREU
27 SE IT PT NL EE GB HR LV CZ JP LT PLHU BY SK AL BG RU RS TR RO MK BA UA MD
kg/s
tano
vnik
u |
kg/in
habi
tant
4037
0
50
100
150
200
250
300
GR IS FI HR IT JP PT IE MK LT SE BY RU ES BE AT DEEU
27 DK RS BA SK EE US NO GB FR TR PL CZ BG RO HU UA CH NL LV AL SIMD
kg/s
tano
vnik
u |
kg/in
habi
tant

79
ENERGY MMIXI I ENERGY IN CROATIA 2009
2.9. Energija za pogon energetskih postrojenja
Potrošnja energije za pogon energetskih postrojenja ostvaruje se u energetskim postrojenjima prilikom proizvodnje primarnih ili transformiranih oblika energije. Struktura oblika energije koji su utrošeni u spomenutim postrojenjima u razdoblju od 2004. do 2009. godine prikazana je u tablici 2.9.1. Ukupna potrošnja energije za pogon energetskih postrojenja povećana je za 19,7 posto u odnosu na prethodnu godinu. Smanjena je potrošnja električne energije za 11,7 posto, dok je potrošnja ostalih oblika energije povećana. Potrošnja tekućih goriva povećana je za 44,2 posto, potrošnja plinovitih goriva za 43,1 posto, a potrošnja krutih goriva za 30,4 posto. Porast potrošnje pare i vrele vode bio je znatno manji te je iznosilo 1,2 posto. Tijekom razdoblja od 2004. do 2009. godine energija za pogon energetskih postro-jenja ostvarila je trend smanjenja s prosječnom godišnjom stopom od 0,7 posto. Također je u potrošnji tekućih goriva, električne energije i pare i vrele vode ostvaren trend smanjenja, dok je u potrošnji krutih i plinovitih goriva ostvaren trend porasta. Potrošnja krutih goriva povećavala se s prosječnom godišnjom stopom od 1,7 posto, a potrošnja plinovitih goriva s prosječnom godišnjom stopom od 1 posto. Najbrže se smanjivala potrošnja tekućih goriva i to s prosječnom godišnjom stopom od 9,8 posto. Smanjenje potrošnje električne energije te pare i vrele vode ostvarivalo se s prosječnim godišnjim stopama od 2,4 odnosno 0,7 posto.
Tablica | Table 2.9.1. Energija za pogon energetskih postrojenja | Energy sector own use
2004. 2005. 2006. 2007. 2008. 2009. 2009./08. 2004.-09.
PJ %
Kruta gorivaSolid Fuels
1,97 1,99 1,71 2,10 1,64 2,14 30,4 1,7
Tekuća gorivaLiquid Fuels
3,20 3,39 2,70 3,65 1,33 1,91 44,2 -9,8
Plinovita gorivaGaseous Fuels
14,13 14,45 12,59 14,79 10,35 14,82 43,1 1,0
Električna energijaElectricity
3,87 3,73 3,89 4,37 3,88 3,42 -11,7 -2,4
Para i vrela vodaSteam and Hot Water
9,62 9,14 9,16 9,05 9,18 9,29 1,2 -0,7
UKUPNOTOTAL
32,78 32,70 30,05 33,97 26,38 31,59 19,7 -0,7
Izvor | Source: EIHP
2.9. Energy Sector Own Use
Energy sector own use takes place in the energy plants in the production processes of primary and transformed energy forms. The shares of energy forms used in these plants in the period 2004 to 2009 is given in Table 2.9.1. Total energy sector own use increased by 19.7 percent from the previous year. The use of electricity was decreased by 11.7 percent while the use of all other energy forms increased. The consumption of liquid fuels increased by 44.2 percent, of gaseous fuels by 43.1 percent and of sold fuels by 30.4 percent. The increase of steam and hot water use was much slower, as it grew by 1.2 percent. In the period 2004 to 2009 energy sector own use had a decreasing trend with an average annual rate of 0.7 percent. Also, the use of liquid fuels, electricity and gaseous fuels had a decreasing trend, while the use of solid fuels and gaseous fuels had a growing trend. The use of solid fuels increased at an average annual rate of 1.7 percent, and the use of gaseous fuels at an ave-rage annual rate of 1 percent. The fastest growth was in the use of liquid fuels, at an average annual rate of 9.8 percent. The reduction of electricity use and of steam and hot water use had average annual rates of 2.4 percent and 0.7 percent respectively.

80
ENERGIJA MMIXI I ENERGIJA U HRVATSKOJ 2009.
Slika | Figure 2.9.1. Pogonska potrošnja oblika energije | Energy sector own use by energy forms Izvor | Source: EIHP
Udjeli oblika energije u ukupnoj energiji za pogon energetskih postrojenja u 2004. i 2009. godini prikazani su na slici 2.9.2. Najveće udjele u energiji za pogon energetskih postrojenja ostvarila su plinovita goriva te para i vrela voda. U razdoblju od 2004. do 2009. godine udio plinovitih goriva je povećan s 43,1 na 46,9 posto, a udio pare i vrele vode se nije promije-nio te je iznosio 29,4 posto. Povećan je udio krutih goriva s 6 na 6,8 posto, dok je udio električne energije i tekućih goriva smanjen. Udio električne energije smanjen je s 11,8 na 10,8 posto, a tekućih goriva s 9,8 na 6,1 posto.
Figure 2.9.2. shows the shares of energy forms in energy sector own use in 2004 and 2009. Gaseous fuels and steam and hot water had the largest shares in energy sector own use. In the period 2004 to 2009 the share of gaseous fuels increased from 43.1 to 46.9 percent, and the share of steam and hot water remained at 29.4 percent. The share of solid fuels increased from 6 to 6.8 percent, while the share of elec-tricity and liquid fuels decreased. Electricity lowered its share in energy sector own use from 11.8 to 10.8 percent, and liquid fuels from 9.8 to 6.1 percent.
Kruta goriva | Solid Fuels Tekuća goriva | Liquid Fuels Plinovita goriva | Gaseous Fuels
Električna energija | Electricity Para i vrela voda | Steam and Hot Water
0
10
20
30
40
50
60
1988. 1990. 1995. 2000. 2005. 2009.
PJ

81
ENERGY MMIXI I ENERGY IN CROATIA 2009
2004. godina
Year: 2004
2009. godina
Year: 2009
Slika | Figure 2.9.2. Udjeli oblika energije u energiji za pogon energetskih postrojenja | Shares of energy forms in energy sector own use – Izvor | Source: EIHP
U tablici 2.9.2. prikazana je potrošnja energije za pogon u pojedinim energetskim postrojenjima tijekom razdoblja od 2004. do 2009. godine. Na slici 2.9.3. isti taj razvoj prikazan za vremensko razdoblje od 1988. do 2009. godine. Tijekom 2009. godine smanjena je potrošnja energije za pogon u termoelek-tranama, hidroelektranama i javnim toplanama, dok je u ostalim postrojenjima potrošnja energije za pogon povećana. U termo-elektranama je potrošnja energije za pogon smanjena za 25,7 posto, u hidroelektranama za 19,6 posto i u javnim toplanama za 5 posto. Najveći porast potrošnje ostvaren je u proizvodnji nafte i plina i iznosio je 77 posto. Porast potrošnje u degazo-linaži iznosio je 25,5 posto, a u rafinerijama nafte 16,1 posto. Tijekom razdoblja od 2004. do 2009. godine ostvaren je trend smanjena potrošnje energije u većini postrojena, a samo je u potrošnji energije za proizvodnju nafte i plina ostvaren trend porasta potrošnje s prosječnom godišnjom stopom od 10,1 posto. Najbrže se smanjivala potrošnja energije u degazolinaži i javnim toplanama s 4,8 odnosno 3,6 posto prosječno godišnje. Stope smanjenja potrošnje energije za pogon u rafinerijama nafte, termoelektranama i hidroelektranama iznosile su 2,3 posto, 1,9 posto i 1,2 posto.
Table 2.9.2. gives the energy sector own use in specific energy plants over the period 2004 to 2009. Figure 2.9.3. shows these trends in the period 1988 to 2009. During the year 2009 the energy sector own use decreased in thermal power plants, hydro power plants and public cogeneration plants while in other plants energy sector own use was higher than previously. In thermal power plants this use of energy dropped by 25.7 percent, in hydro power plants by 19.6 percent and in public cogeneration plants by 5 percent. The highest increase was recorded in the oil and gas production where it was 77 percent. The increase of energy sector own use in NGL plants was 25.5 percent, and in petroleum refi-neries 16.1 percent. Over the period 2004 to 2009, energy sector own use decreased in most of the plants. Only in the oil and gas production plants there was an increase, at an average annual rate of 10.1 percent. The fastest average annual decrease in own energy use was in NGL plant and public cogeneration plants, 4.8 percent and 3.6 percent res-pectively. The average annual rates of decreasing energy own use in petroleum refineries, thermal power plants and hydro power plants were 2.3 percent, 1.9 percent and 1.2 percent.
Plinovita goriva | Gaseous Fuels 43,1% Električna energija | Electricity 11,8%
Para i v. voda | Steam and Hot Water 29,4%
Kruta goriva | Solid Fuels 6,0% Tekuća goriva | Liquid Fuels 9,8%
Plinovita goriva | Gaseous Fuels 46,9% Električna energija | Electricity 10,8%
Para i v. voda | Steam and Hot Water 29,4%
Kruta goriva | Solid Fuels 6,8% Tekuća goriva | Liquid Fuels 6,1%

82
ENERGIJA MMIXI I ENERGIJA U HRVATSKOJ 2009.
Tablica | Table 2.9.2. Pogonska potrošnja energije u energetskim postrojenjima | Energy sector own use by plants
2004. 2005. 2006. 2007. 2008. 2009. 2009./08. 2004.-09.
PJ %
Proizvodnja nafte i plinaOil and Gas Extraction
3,42 4,84 4,10 5,17 3,13 5,54 77,0 10,1
Proizvodnja bioplinaBiogas Production
0,05
ElektroprivredaElectric Energy Supply Industry
0,11 0,12 0,12 0,12 0,11 0,12 1,9 0,7
HidroelektraneHydro Power Plants
0,60 0,66 0,78 0,95 0,70 0,56 -19,6 -1,2
TermoelektraneThermal Power Plants
1,03 1,07 1,14 1,40 1,26 0,93 -25,7 -1,9
Javne toplanePublic Cogeneration Plants
1,43 1,24 1,12 1,14 1,25 1,19 -5,0 -3,6
RafinerijePetroleum Refineries
25,17 23,94 22,05 24,52 19,29 22,40 16,1 -2,3
DegazolinažaNGL Plant
1,03 0,83 0,74 0,65 0,64 0,81 25,5 -4,8
UKUPNOTOTAL
32,78 32,70 30,05 33,97 26,38 31,59 19,7 -0,7
Izvor | Source: EIHP
Slika | Figure 2.9.3. Pogonska potrošnja energije u energetskim postrojenjima | Energy sector own use by plants Izvor | Source: EIHP
1988. 1990. 1995. 2000. 2005. 2009.
Hidroelektrane | Hydro Power PlantsElektroprivreda | Electric Energy Supply Industry Javne toplane | Public Cogeneration PlantsTermoelektrane | Thermal Power Plants
Proizvodnja ugljena | Coal MinesProizvodnja nafte i plina | Oil and Gas Extraction
Rafinerije | Petroleum Refineries Degazolinaža | NGL PlantKoksara | Coke Oven Plant
0
10
20
30
40
50
60
PJ

83
ENERGY MMIXI I ENERGY IN CROATIA 2009
Udjeli pojedinih postrojenja u ukupnoj potrošnji energije za pogon energetskih postrojenja u 2004. i 2009. godini prikazani su na slici 2.9.4. Najveći udio u ukupnoj potrošnji energije za pogon ostvarile su rafinerije nafte. Njihov je udio u 2009. godini iznosio 70,9 posto te je u odnosu na 2004. godinu bio manji za 5,9 posto. Značajan udio u odnosu na ostala postrojenja ostvarila je potrošnja energije za proizvodnju sirove nafte i pri-rodnog plina. Taj udio je u 2009. godini iznosio 17,5 posto te je u odnosu na ostvarenje u 2004. godini bio veći za 7,1 posto. Udjeli ostalih postrojenja u pogonskoj potrošnji energije bili su znatno manji i kretali su se do 3,8 posto, koliko je u 2009. godini iznosio udio energije utrošene za pogon javnih toplana.
Figure 2.9.4. shows the shares of specific plants in total energy sector own use in 2004 and 2009. Petroleum refine-ries had the biggest share, which in 2009 was 70.9 percent and in relation to 2004 it decreased by 5.9 percent. Crude oil and natural gas production plants had a significant share in energy use in comparison to other plants. In 2009 their share was 17.5 percent and it was by 7.1 percent higher than in 2004. The shares of other plants were significantly lower, not exceeding 3.8 percent, which was the share of energy used for operation of public heating plants in 2009.
2004. godina
Year: 2004
2009. godina
Year: 2009
Slika | Figure 2.9.4. Udjeli postrojenja u potrošnji energije za pogon | Shares of plants in energy sector own use Izvor | Source: EIHP
Rafinerije | Petroleum Refineries 76,8%
Proizvodnja nafte i plina | Oil and Gas Extraction 10,4%
Javne toplane | PublicCogeneration Plants 4,3%
Termoelektrane | Thermal Power Plants 3,1%
Hidroelektrane | Hydro Power Plants 1,8% Elektroprivreda | Electric Energy Supply Industry 0,3%
Degazolinaža | NGL Plant 3,1%
Rafinerije | Petroleum Refineries 70,9%
Proizvodnja nafte i plina | Oil and Gas Extraction 17,5%
Javne toplane | PublicCogeneration Plants 3,8%
Termoelektrane | Thermal Power Plants 3,0%
Hidroelektrane | Hydro Power Plants 1,8%
Elektroprivreda | Electric Energy Supply Industry 0,4%
Degazolinaža | NGL Plant 2,6%
Proizvodnja bioplina | Biogas production 0,2%

84
ENERGIJA MMIXI I ENERGIJA U HRVATSKOJ 2009.
2.10. Struktura ukupno utrošene energije
Struktura oblika energije u ukupnoj potrošnji analizirana je u poglavlju 2.4. Ukupnom potrošnjom energije zadovoljavaju se sve potrebe za energijom u energetskom sustavu - ukupna neposredna potrošnja energije, neenergetska potrošnja energi-je, potrošnja energije za pogon energetskih postrojenja, gubici energije u energetskim transformacijama i gubici energije u transportu i razdiobi energije. Struktura potreba u ukupnoj potrošnji energije tijekom proteklog razdoblja od 2004. do 2009. godine prikazana je u tablici 2.10.1. Struktura ukupno potrebne energije tijekom proteklog razdoblja od 1988. do 2009. godine, kao i predviđeni razvoj strukture u budućem razdoblju do 2030. prikazani su na slici 2.10.1. U 2009. godini ukupna potrošnja energije smanjena je za 1,6 posto u odnosu na prethodnu godinu. Pri tome su gubici energetskih transfor-macija povećani za 4,7 posto, potrošnja energije za pogon energetskih postrojenja za 19,7 posto i gubici transporta i dis-tribucije energije za 9,1 posto. Neposredna potrošnja energije, kao i neenergetska potrošnja energije su smanjene i to za 4,2 odnosno za 15,7 posto.
2.10. Primary Energy Supply Structure
The structure of energy forms is analyzed in Chapter 2.4. Total primary energy supply is the amount of energy that meets all demand for energy in an energy system – total final energy demand, non-energy use, energy sector own use, energy conversion losses, and energy transport and distribution losses. Table 2.10.1. gives the structure of needs in total primary energy supply during the 2004 to 2009 period. Also, Figure 2.10.1. presents the structure of total primary energy supply during the period 1988 to 2009 and the projected trends in primary energy supply to 2030. In 2009, total primary energy supply decreased by 1.6 percent from the previous year. Energy conversion losses increased by 4.7 percent, energy sector own use by 19.7 percent and energy transport and distribution losses by 9.1 percent. Final energy demand as well as non-energy use decreased by 4.2 percent and 15.7 per-cent respectively.
Tablica | Table 2.10.1. Struktura ukupno utrošene energije | Total primary energy supply by sectors
2004. 2005. 2006. 2007. 2008. 2009. 2009./08. 2004.-09.
PJ %
UKUPNA POTROŠNJA ENERGIJETOTAL PRIMARY ENERGY SUPPLY
412,04 411,85 410,76 417,21 413,66 406,92 -1,6 -0,3
Gubici transformacijaConversion Losses
81,74 75,99 74,61 73,20 72,43 75,87 4,7 -1,5
Pogonska potrošnjaEnergy Sector Own Use
32,78 32,70 30,05 33,97 26,38 31,59 19,7 -0,7
Gubici transporta i distribucijeTransmission Losses
12,14 11,47 10,62 10,79 9,43 10,29 9,1 -3,3
Neenergetska potrošnjaNon Energy Use
29,83 28,17 27,39 29,75 29,89 25,19 -15,7 -3,3
NEPOSREDNA POTROŠNJA ENERGIJEFINAL ENERGY DEMAND
255,55 263,52 268,10 269,50 275,54 263,99 -4,2 0,6
IndustrijaIndustry
57,15 57,99 59,88 60,83 61,17 51,14 -16,4 -2,4
PrometTransport
76,68 80,02 84,81 91,07 90,47 89,84 -0,70 3,2
Opća potrošnjaOther Sectors
121,23 125,51 123,40 117,59 123,89 123,01 -0,71 0,3
Izvor | Source: EIHP

85
ENERGY MMIXI I ENERGY IN CROATIA 2009
Tijekom proteklog razdoblja od 2004. do 2009. godine ukupna potrošnja energije imala je trend blagog opadanja, a prosječna godišnja stopa smanjenja potrošnje iznosila je 0,3 posto. Trend porasta je ostvaren samo u neposrednoj potrošnji energije i to s prosječnom godišnjom stopom od 0,6 posto, dok se u svim ostalim sektorima potrošnja energije smanjivala. Gubici ener-getskih transformacija smanjivali su se s prosječnom godiš-njom stopom od 1,5 posto, a potrošnja energije za pogon ener-getskih postrojenja s prosječnom godišnjom stopom od 0,7 posto. Neenergetska potrošnja energije, kao i gubici transporta i distribucije energije ostvarili su trend smanjenja s prosječnom godišnjom stopom od 3,3 posto.
Slika | Figure 2.10.1. Struktura ukupno utrošene energije | Total primary energy supply by sectors Izvor | Source: EIHP
In the period 2004 to 2009, total primary energy supply was slightly decreasing, at an average annual rate of 0.3 percent. Only final energy demand had an increase, at an average 0.6 percent annually, while in all other sectors primary energy supply was in decline. Energy conversion losses decreased at an average annual rate of 1.5 percent, and energy sector own use at an average 0.7 percent. Non energy use, transport and distribution losses decreased at an average 3.3 percent annually.
Figure 2.10.2. shows the shares of specific sectors in total primary energy supply in the years 2004, 2009 and 2030. Final energy demand had the largest share in the primary energy supply and in 2009 it was 64.9 percent. In the period 2004 to 2009 the share of final energy demand increased by 2.9 percent. All other sectors decreased their shares in total primary energy supply. The share of energy conversion losses decreased from 19.8 percent in 2004 down to 18.6 percent in 2009. In the same period the share of energy sector own use was slightly lowered, from 8 to 7.8 percent; the share of
Udjeli pojedinih sektora u ukupnoj potrošnji energije u 2004., 2009. i 2030. godini prikazani su na slici 2.10.2. Najveći udio u ukupnoj potrošnji energije ostvarila je neposredna potrošnja te je njezin udio u 2009. godini iznosio 64,9 posto. U razdoblju od 2004. do 2009. godine udio neposredne potrošnje energije povećan je za 2,9 posto. Udjeli svih ostalih sektora u ukupnoj potrošnji energije su smanjeni. Tako je udio gubitaka energet-skih transformacija smanjen s 19,8 posto u 2004. godini na 18,6 posto u 2009. godini. U istom razdoblju je udio energije za pogon energetskih postrojenja minimalno smanjen s 8 na
0
100
200
300
400
500
600
700
1988
.
1990
.
1995
.
2000
.
2005
.
2009
.20
10.
2015
.
2020
.
2025
.
2030
.
PJ
Gubici transformacija | Conversion Losses Pogonska potrošnja | Energy Sector Own Use Gubici transporta i distribucije | Transmission Losses Ne energetska potrošnja | Non Energy Use Neposredna potrošnja energije | Final Energy Demand

86
ENERGIJA MMIXI I ENERGIJA U HRVATSKOJ 2009.
7,8 posto, a udio gubitaka u transportu i razdiobi energije s 2,9 na 2,5 posto. Također je smanjen i udio neenergetske potrošnje i to s 7,2 na 6,2 posto. U razdoblju do 2030. godine predviđen je porast udjela neposredne potrošnje energije na 71,4 posto. Udjeli neenergetske potrošnje i potrošnje energije za pogon energetskih postrojenja će se smanjivati, dok se udjeli gubitaka energetskih transformacije i gubitaka transporta i distribucije energije neće značajnije mijenjati.
transport and distribution losses was lowered from 2.9 to 2.5 percent. Also, the share of non energy use decreased from 7.2 to 6.2 percent. In the projections for the period to 2030 final energy demand would increase up to 71.4 percent. The shares of non energy use and energy sector own use are projected to decline, while energy conversion losses and transport and distribution losses will not significantly change their respective shares.
Slika | Figure 2.10.2. Udjeli sektora u ukupnoj potrošnji energije | Shares of sectors in total primary energy supply Izvor | Source: EIHP
2004. godina
Year: 2004
2009. godina
Year: 2009
2030. godina
Year: 2030
Gubici transporta i distribucije | Transmission Losses 2,9%
Pogonska potrošnja | Energy Sector Own Use 8,0%
Gubici transformacija | Conversion Losses 19,8%
Neposredna potrošnja energije | Final Energy Demand 62,0%
Neenergetska potrošnja | Non Energy Use 7,2%
Gubici transporta i distribucije | Transmission Losses 2,5%
Pogonska potrošnja | Energy Sector Own Use 7,8%
Gubici transformacija | Conversion Losses 18,6%
Neposredna potrošnja energije | Final Energy Demand 64,9%
Neenergetska potrošnja | Non Energy Use 6,2%
Gubici transporta i distribucije | Transmission Losses 2,6%
Pogonska potrošnja | Energy Sector Own Use 4,0%
Gubici transformacija | Conversion Losses 18,7%
Neposredna potrošnja energije | Final Energy Demand 71,4%
Neenergetska potrošnja | Non Energy Use 3,3%

87
ENERGY MMIXI I ENERGY IN CROATIA 2009
U tablici 2.10.1. prikazana je i struktura potrošnje energije u tri karakteristična sektora neposrednih potrošača - industriji, pro-metu i općoj potrošnji. Jednako je tako na slici 2.10.3. prikazan razvoj potrošnje energije u tri spomenuta sektora u proteklom razdoblju od 1988. godine, kao i predviđeni razvoj do 2030. godine. U odnosu na potrošnju energije ostvarenu u 2008. godini, potrošnja energije u industriji u 2009. godini značajno je smanjena i to za 16,4 posto. Također je smanjena potrošnja energije u ostala dva sektora i to u općoj potrošnji i prometu za 0,7 posto. U razdoblju od 2004. do 2009. godine u industriji je ostvaren trend opadanja potrošnje energije s prosječnom godišnjom stopom od 2,4 posto. U prometu i u općoj potrošnji ostvaren je trend porasta potrošnje s prosječnom godišnjom stopom od 3,2 odnosno 0,3 posto.
Table 2.10.1. gives the structure of primary energy supply in three characteristic final demand sectors of – industry, transport and other sectors. Figure 2.10.3. shows the trends in primary energy supply in these three sectors in the period from 1988 as well as the projected trends to 2030. Compared to energy demand in 2008, energy demand in industry in 2009 significantly decreased by 16.4 percent. Energy demand was also lower in other two sectors: in other sectors and in transport by 0.7 percent. In the period 2004 to 2009 energy demand in the industry declined at an average annual rate of 2.4 percent. In the transport sector and other sectors over this period energy demand had a growing trend, at ave-rage annual rates of 3.2 percent and 0.3 percent respectively.
Slika | Figure 2.10.3. Neposredna potrošnja energije u pojedinim sektorima | Final energy demand by sectors Izvor | Source: EIHP
Na slici 2.10.4. prikazani su udjeli pojedinih sektora nepo-sredne potrošnje energije u 2004., 2009. i 2030. godini. Najveći udio u neposrednoj potrošnji energije ostvarila je opća potrošnja. Udio opće potrošnje se u razdoblju od 2004. do 2009. godine smanjio s 47,5 na 46,6 posto. U istom razdoblju je povećan i udio prometa i to s 30,1 na 34 posto, dok je udio industrije smanjen. U 2004. godini udio industrije
Figure 2.10.4. shows the shares of specific sectors of final energy demand in the years 2004, 2009 and 2030. Other sectors had the highest share in final energy demand. In the period 2004 to 2009 this share dropped from 47.5 to 46.6 percent. In the same period the share of transport was increa-sed from 30.1 to 34 percent, while industry lowered its share. In 2004 the share of industry was 22.4 percent and in 2009 it
1988
.
1990
.
1995
.
2000
.
2005
.
2009
.20
10.
2015
.
2020
.
2025
.
2030
.0
50
100
150
200
250
300
350
400
450
PJ
Industrija | Industry Promet | Transport Opća potrošnja | Other Sectors
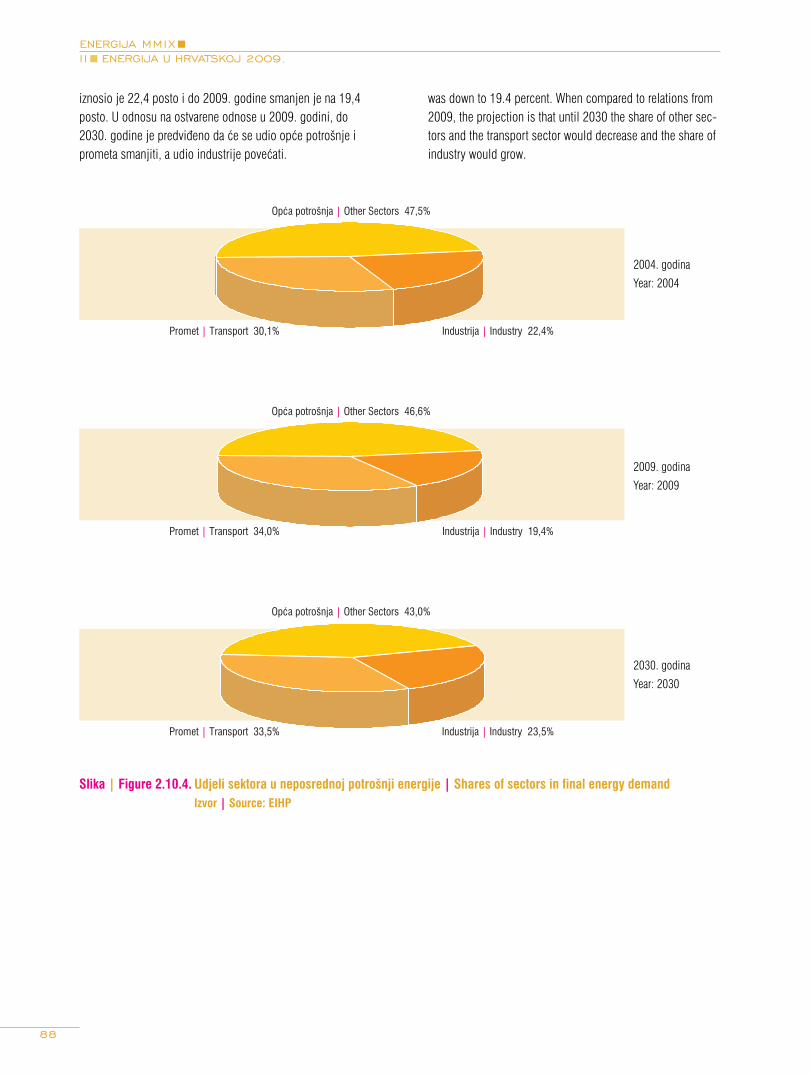
88
ENERGIJA MMIXI I ENERGIJA U HRVATSKOJ 2009.
iznosio je 22,4 posto i do 2009. godine smanjen je na 19,4 posto. U odnosu na ostvarene odnose u 2009. godini, do 2030. godine je predviđeno da će se udio opće potrošnje i prometa smanjiti, a udio industrije povećati.
was down to 19.4 percent. When compared to relations from 2009, the projection is that until 2030 the share of other sec-tors and the transport sector would decrease and the share of industry would grow.
2004. godina
Year: 2004
2009. godina
Year: 2009
2030. godina
Year: 2030
Slika | Figure 2.10.4. Udjeli sektora u neposrednoj potrošnji energije | Shares of sectors in final energy demand Izvor | Source: EIHP
Opća potrošnja | Other Sectors 47,5%
Promet | Transport 30,1% Industrija | Industry 22,4%
Opća potrošnja | Other Sectors 46,6%
Promet | Transport 34,0% Industrija | Industry 19,4%
Opća potrošnja | Other Sectors 43,0%
Promet | Transport 33,5% Industrija | Industry 23,5%

89
ENERGY MMIXI I ENERGY IN CROATIA 2009
2.11. Neposredna potrošnja energije
U tablici 2.11.1. prikazan je razvoj potrošnje oblika energije u neposrednoj potrošnji u razdoblju od 2004. do 2009. godine. Isti razvoj strukture oblika energije u neposrednoj potrošnji prikazan je na slici 2.11.1. za proteklo razdoblje od 1988. do 2009. godine, kao i predviđeni budući razvoj do 2030. godine. Neposredna potrošnja energije u 2009. godini smanjena je za 4,2 posto u odnosu na prethodnu godinu. Samo je potrošnja ogrjevnog drva i ostale biomase te ostalih obnovljivih izvora povećana, dok je potrošnja svih ostalih oblika energije sma-njena. Porast potrošnje ogrjevnog drva i ostale biomase izno-sio je 7,6 posto, a ostalih obnovljivih izvora 4,9 posto. Najveće smanjenje potrošnje od 21,9 posto ostvareno je u potrošnji ugljena i koksa. Potrošnja pare i vrela vode smanjena je za 5,7 posto, a potrošnja električne energije za 3,9 posto. Smanjena je i potrošnja tekućih goriva i prirodnog plina za 3,7 posto.
2.11. Final Energy Demand
Table 2.11.1. gives the trends in final energy demand by energy forms in the period 2004 to 2009. Figure 2.11.1. shows the trends in the shares of energy forms in final energy demand over the period 1988 to 2009 as well as the projections to 2030. Final energy demand in 2009 fell by 4.2 percent from the previous year. Only fuel wood and bio-mass and other renewables increased, while the consump-tion of all other energy forms decreased. The consumption of fuel wood and biomass grew by 7.6 percent, and of other renewables by 4.9 percent. The biggest reduction, of 21.9 percent, was in consumption of coal and coke. The con-sumption of steam and hot water decreased by 5.7 percent, and electricity consumption fell by 3.9 percent. A decrease was recorded in the consumption of liquid fuels as well as in the consumption of natural gas, by 3.7 percent.
Tablica | Table 2.11.1. Struktura neposredne potrošnje energije | Final energy demand by energy forms
2004. 2005. 2006. 2007. 2008. 2009. 2009./08. 2004.-09.
PJ %
Ugljen i koksCoal and coke
9,31 10,83 11,49 11,92 11,76 9,18 -21,9 -0,3
Ogrjevno drvo i biomasaBiomass
13,14 12,70 13,32 11,68 12,06 12,97 7,6 -0,3
Ostali obnovljivi izvoriOther renewables
0,29 0,32 0,33 4,9
Tekuća gorivaLiquid Fuels
119,66 120,77 124,36 128,02 127,34 122,59 -3,7 0,5
Plinovita gorivaGaseous Fuels
40,25 43,75 42,14 40,62 44,65 42,98 -3,7 1,3
Električna energijaElectricity
49,28 51,86 54,22 55,32 58,03 55,76 -3,9 2,5
Para i vrela vodaSteam and Hot Water
23,91 23,61 22,56 21,65 21,38 20,17 -5,7 -3,3
UKUPNOTOTAL
255,55 263,52 268,10 269,50 275,54 263,99 -4,2 0,7
Izvor | Source: EIHP
Tijekom razdoblja od 2004. do 2009. godine ostvaren je trend povećanja neposredne potrošnje energije s prosječnom godišnjom stopom od 0,7 posto. U potrošnji električne ener-gije, prirodnog plina i tekućih goriva ostvaren je trend porasta potrošnje, dok je u potrošnji svih ostalih energenata ostvareno smanjenje potrošnje. Potrošnja ogrjevnog drva i ostale bio-mase, kao i potrošnja ugljena i koksa smanjivala se s prosječ-nom godišnjom stopom od 0,3 posto, dok je potrošnja pare
Over the period 2004 to 2009 final energy demand was on an upward trend at an average annual rate of 0.7 percent. The consumption of electricity, natural gas and liquid fuels had a grown trend, while the consumption of all other energy products decreased. The consumption of fuel wood and biomass as well as of coal and coke decreased at an average annual rate of 0.3 percent, while the consumption

90
ENERGIJA MMIXI I ENERGIJA U HRVATSKOJ 2009.
i vrele vode opadala s prosječnom godišnjom stopom od 3,3 posto. Najbrži trend porasta ostvaren je u potrošnji električne energije i to s prosječnom godišnjom stopom od 2,5 posto. Potrošnja prirodnog plina i tekućih goriva u promatranom se razdoblju povećavala s prosječnim godišnjim stopama od 1,3 odnosno 0,5 posto.
of steam and hot water fell at an average annual rate of 3.3 percent. The fastest growth was in the electricity consumpti-on, at an average annual rate of 2.5 percent. The consumption of natural gas and of liquid fuels in the observed period grew at average annual rates of 1.3 percent and 0.5 percent respectively.
Slika | Figure 2.11.1. Neposredna potrošnja oblika energije | Final energy demand by energy forms Izvor | Source: EIHP
Na slici 2.11.2. prikazani su udjeli pojedinih oblika energije u neposrednoj potrošnji u 2004. i 2009. godini, kao i predviđe-ne vrijednosti udjela u 2030. godini. U razdoblju od 2004. do 2009. godine povećan je udio električne energije i prirodnog plina, dok su udjeli svih ostalih oblika energije smanjeni. Najveći udio u neposrednoj potrošnji energije ostvarila su tekuća goriva, a njihov se udio s 46,8 posto u 2004. godini neznatno smanjio na 46,4 posto u 2009. godini. U istom razdoblju udio električne energije povećan je s 19,3 na 21,1 posto. Po visini udjela u neposrednoj potrošnji energije slijedi prirodni plin, čiji je udio s 15,7 posto povećan na 16,3 posto. Udio pare i vrele vode je smanjen i to s 9,4 na 7,6 posto. Sa znatno manjim udjelima u neposrednoj potrošnji energije sudjelovali su ogrjevno drvo i ostala biomasa te ugljen i koks. U razdoblju od 2004 do 2009. godine udio ugljena i koksa neznatno je smanjen s 3,6 na 3,5 posto, dok je udio ogr-jevnog drva smanjen s 5,1 posto na 4,9 posto. Udio ostalih
Figure 2.11.2. shows the shares of specific energy forms in final energy demand in 2004 and 2009 and the their projec-tions to 2030. Over the period 2004 to 2009 the shares of electricity and natural gas increased while the shares of all other energy forms decreased. Liquid fuels had the biggest share in final energy demand with 46.8 percent in 2004, which slightly dropped to 46.4 percent in 2009. In the same period the share of electricity increased from 19.3 to 21.1 percent. It is followed by natural gas whose share increased from 15.7 percent in 2004 to 16.3 percent. The share of steam and hot water decreased from 9.4 to 7.6 percent. Fuel wood and biomass and coal and coke had significantly lower shares in final energy consumption. In the period 2004 to 2009 the share of coal and coke was slightly decreased, from 3.6 to 3.5 percent, while the share of fuel wood also dropped from 5.1 to 4.9 percent. The share of other renewables in
1988
.
1990
.
1995
.
2000
.
2005
.
2009
.20
10.
2015
.
2020
.
2025
.
2030
.
PJ
Ugljen i koks | Coal and coke
Ogrjevno drvo i biomasa | Biomass
Tekuća goriva | Liquid Fuels
Plinovita goriva | Gaseous Fuels
Para i vrela voda | Steam and Hot Water
Električna energija | Electricity
Obnovljivi izvori | Renewables
0
50
100
150
200
250
300
350
400
450

91
ENERGY MMIXI I ENERGY IN CROATIA 2009
obnovljivih izvora u 2009. godini iznosio je samo 0,1 posto. U razdoblju do 2030. godine predviđeno je povećanje udjela prirodnog plina, pare i vrele vode te ostalih obnovljivih izvora u odnosu na ostvarene vrijednosti u 2009. godini. Udjeli tekućih goriva, električne energije, ugljena i koksa te ogrjev-nog drva i ostale biomase će se u tom razdoblju smanjiti.
Slika | Figure 2.11.2. Udjeli oblika energije u neposrednoj potrošnji | Shares of energy forms in final energy demand Izvor | Source: EIHP
2009 was only 0.1 percent. For the period to 2030 the pro-jection shows increased shares of natural gas, steam and hot water and other renewables in relation to the 2009 levels. The shares of liquid fuels, electricity, coal and coke, and fuel wood and biomass would decreased.
2004. godina
Year: 2004
2009. godina
Year: 2009
2030. godina
Year: 2030
Tekuća goriva | Liquid Fuels 46,8%
Ogrjevno drvo i biomasa | Biomass 5,1%
Ugljen i koks | Coal and coke 3,6% Para i vrela voda | Steam and Hot Water 9,4%
Električna energija | Electricity 19,3%
Plinovita goriva | Gaseous Fuels 15,7%
Tekuća goriva | Liquid Fuels 46,4%
Ogrjevno drvo i biomasa | Biomass 4,9%
Ugljen i koks | Coal and coke 3,5% Para i vrela voda | Steam and Hot Water 7,6%
Električna energija | Electricity 21,1%
Plinovita goriva | Gaseous Fuels 16,3%
Obnovljivi izvori | Renewables 0,1%
Tekuća goriva | Liquid Fuels 38,7%
Ogrjevno drvo i biomasa | Biomass 4,8%
Ugljen i koks | Coal and coke 0,7% Para i vrela voda | Steam and Hot Water 12,2%
Električna energija | Electricity 20,9%
Plinovita goriva | Gaseous Fuels 17,4%
Obnovljivi izvori | Renewables 5,4%
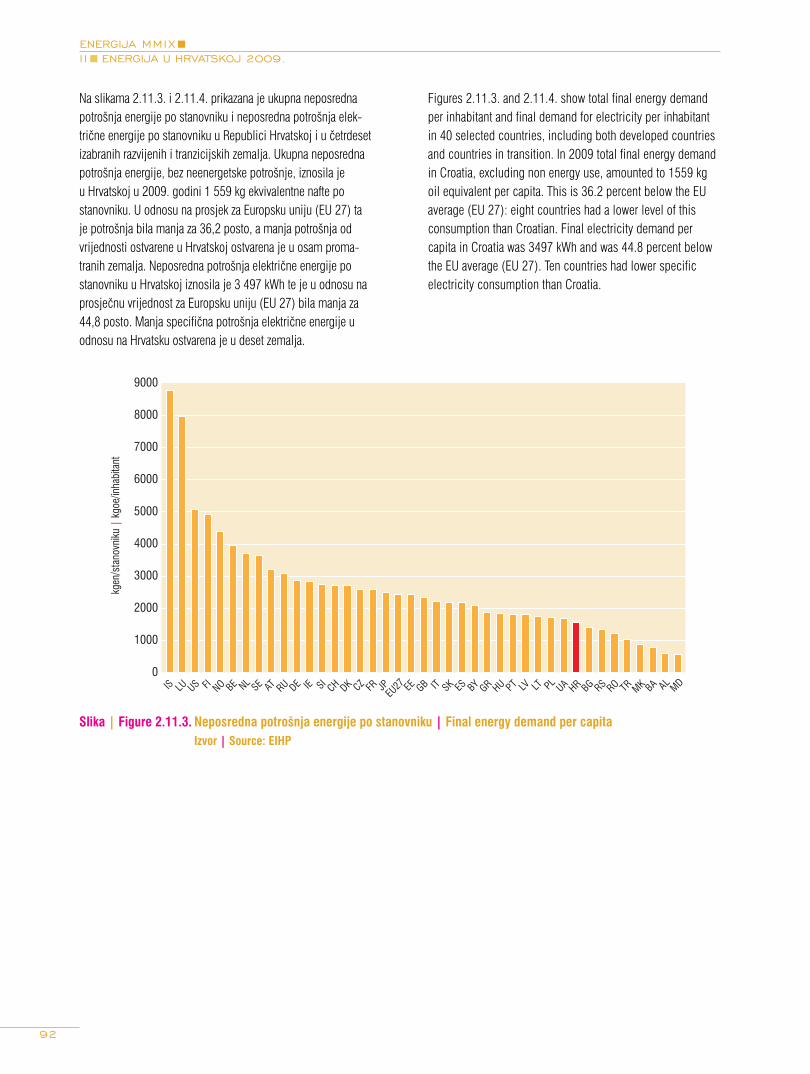
92
ENERGIJA MMIXI I ENERGIJA U HRVATSKOJ 2009.
Na slikama 2.11.3. i 2.11.4. prikazana je ukupna neposredna potrošnja energije po stanovniku i neposredna potrošnja elek-trične energije po stanovniku u Republici Hrvatskoj i u četrdeset izabranih razvijenih i tranzicijskih zemalja. Ukupna neposredna potrošnja energije, bez neenergetske potrošnje, iznosila je u Hrvatskoj u 2009. godini 1 559 kg ekvivalentne nafte po stanovniku. U odnosu na prosjek za Europsku uniju (EU 27) ta je potrošnja bila manja za 36,2 posto, a manja potrošnja od vrijednosti ostvarene u Hrvatskoj ostvarena je u osam proma-tranih zemalja. Neposredna potrošnja električne energije po stanovniku u Hrvatskoj iznosila je 3 497 kWh te je u odnosu na prosječnu vrijednost za Europsku uniju (EU 27) bila manja za 44,8 posto. Manja specifična potrošnja električne energije u odnosu na Hrvatsku ostvarena je u deset zemalja.
Figures 2.11.3. and 2.11.4. show total final energy demand per inhabitant and final demand for electricity per inhabitant in 40 selected countries, including both developed countries and countries in transition. In 2009 total final energy demand in Croatia, excluding non energy use, amounted to 1559 kg oil equivalent per capita. This is 36.2 percent below the EU average (EU 27): eight countries had a lower level of this consumption than Croatian. Final electricity demand per capita in Croatia was 3497 kWh and was 44.8 percent below the EU average (EU 27). Ten countries had lower specific electricity consumption than Croatia.
Slika | Figure 2.11.3. Neposredna potrošnja energije po stanovniku | Final energy demand per capita Izvor | Source: EIHP
kgen
/sta
novn
iku
| kg
oe/in
habi
tant
0
1000
2000
3000
4000
5000
6000
7000
8000
9000
IS LU US FI NO BE NL SE AT RU DE IE SICH DK CZ FR JP
EU27 EE GB IT SK ES BY GR HU PT LV LT PL
UA HR BG RS RO TR MK BA ALMD

93
ENERGY MMIXI I ENERGY IN CROATIA 2009
Slika | Figure 2.11.3. Neposredna potrošnja električne energije po stanovniku | Final electricity demand per capita Izvor | Source: EIHP
2.12. Potrošnja energije u industriji
Struktura potrošnje oblika energije u industriji tijekom pro-matranog razdoblja od 2004. do 2009. godine prikazana je u tablici 2.12. 1. Taj je razvoj za proteklo razdoblje od 1988. do 2009. godine prikazan na slici 2.12.1. Potrošnja energije u industriji u 2009. godini smanjena je za 16,4 posto u odnosu na prethodnu godinu. Takvom padu doprinijelo je smanjenje potrošnje svih oblika energije. Najveće smanjenje ostvareno je u potrošnji tekućih goriva i u potrošnji ugljena i koksa, a iznosi-lo je 33,4 odnosno 22,2 posto. I u potrošnji ostalih energenata zabilježen je značajan pad pa je tako potrošnja prirodnog plina smanjena za 16,2 posto, potrošnja električne energije za 10,9 posto i potrošnja ogrjevnog drva i ostale biomase za 10,2 posto. Smanjenje potrošnje pare i vrele vode bilo je najmanje i iznosilo je 9,5 posto.
U razdoblju od 2004. do 2009. godine ostvaren je trend sma-njenja potrošnje energije u industriji s prosječnom godišnjom stopom od 2,4 posto. U tome razdoblju ostvaren je vrlo blagi trend porasta potrošnje električne energije s prosječnom godiš-njom stopom od 0,4 posto i gotovo zanemarivi porast potrošnje ugljena i koksa, gdje je stopa porasta iznosila samo 0,04 posto. U potrošnji ostalih energenata ostvaren je trend smanjenja pa je
2.12. Final Energy Demand in Industry
Table 2.12. 1. gives the structure of final energy demand by energy forms in industry over the period 2004 to 2009. Figure 2.12. 1. shows the trends in this structure over the period 1988 to 2009. The final energy demand by industry in 2009 decreased by 16.4 percent from the previous year. Such a decrease in the result of falling demand for all energy forms. The biggest drops in demand were recorded in liquid fuels and coal and coke and were 33.4 percent and 22.2 per-cent respectively. The consumption of other energy products also decreased: of natural gas by 16,2 percent, of electricity by 10.9 percent, and of fuel wood and biomass by 10.2 per-cent. The slowest decrease was in steam and hot water, by 9.5 percent.
Over the period 2004 to 2009 the energy consumption by industry had a downward trend at an average annual rate of 2.4 percent. There was also a very slow increasing trend in electricity consumption, at an average 0.4 percent annually and a very low increase in coal and coke consumption, at an average 0.04 percent annually. The consumption of other energy products had a decreasing trend: liquid fuels con-
0
2000
4000
6000
8000
10000
12000
14000
16000
18000
IS NO FI LU SE US BE CH AT JP FR NL DE DK CZ SIEU
27 ES IE GB GR IT EE SK RU PT HU BG PL RS HR MK BY UA LV LT TR BA RO ALMD
kWh/
stan
ovni
ku |
kW
h/in
habi
tant
4966
324
858

94
ENERGIJA MMIXI I ENERGIJA U HRVATSKOJ 2009.
tako potrošnja tekućih goriva opadala s prosječnom godišnjom stopom od 12,4 posto, a potrošnja pare i vrele vode s prosječ-nom godišnjom stopom od 4,5 posto. Najsporije se smanjivala potrošnja prirodnog plina i to s prosječnom godišnjom stopom od 0,6 posto.
Tablica | Table 2.12.1. Neposredna potrošnja energije u industriji | Final energy demand in industry
2004. 2005. 2006. 2007. 2008. 2009. 2009./08. 2004.-09.
PJ %
Ugljen i koksCoal and coke
8,98 10,43 11,15 11,74 11,56 9,00 -22,2 0,04
Ogrjevno drvo i biomasaBiomass
0,19 0,72 0,85 0,93 0,83 -10,2
Tekuća gorivaLiquid Fuels
8,29 6,44 6,66 6,94 6,44 4,29 -33,4 -12,4
Plinovita gorivaGaseous Fuels
13,17 14,09 13,96 13,65 15,25 12,78 -16,2 -0,6
Električna energijaElectricity
11,58 11,77 12,44 13,29 13,27 11,82 -10,9 0,4
Para i vrela vodaSteam and Hot Water
15,63 15,07 14,96 14,38 13,73 12,43 -9,5 -4,5
UKUPNOTOTAL
57,65 57,99 59,88 60,83 61,17 51,14 -16,4 -2,4
Izvor | Source: EIHP
sumption decreased at an average annual rate of 12.4 per-cent; the consumption of steam and hot water was reduced at an average annual rate of 4.5 percent. The slowest decrease was in the consumption of natural gas, at an average annual rate of 0.6 percent.
Slika | Figure 2.12.1. Neposredna potrošnja oblika energije u industriji | Final energy demand in industry by energy forms Izvor | Source: EIHP
Električna energija | Electricity Para i vrela voda | Steam and Hot Water
0
10
20
30
40
50
60
70
80
90
100
1988. 1990. 1995. 2000. 2005. 2009.
PJ
Ugljen i koks | Coal and coke Ogrjevno drvo i biomasa | Fuel wood and biomass Tekuća goriva | Liquid Fuels Plinovita goriva | Gaseous Fuels
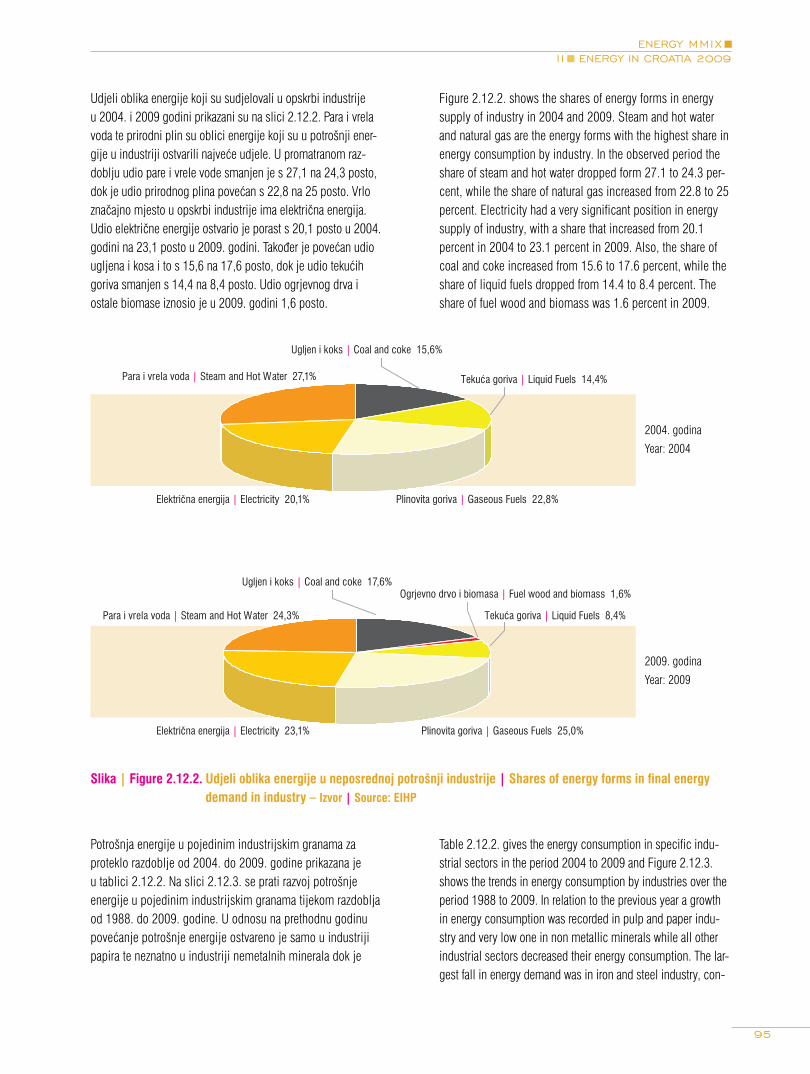
95
ENERGY MMIXI I ENERGY IN CROATIA 2009
Udjeli oblika energije koji su sudjelovali u opskrbi industrije u 2004. i 2009 godini prikazani su na slici 2.12.2. Para i vrela voda te prirodni plin su oblici energije koji su u potrošnji ener-gije u industriji ostvarili najveće udjele. U promatranom raz-doblju udio pare i vrele vode smanjen je s 27,1 na 24,3 posto, dok je udio prirodnog plina povećan s 22,8 na 25 posto. Vrlo značajno mjesto u opskrbi industrije ima električna energija. Udio električne energije ostvario je porast s 20,1 posto u 2004. godini na 23,1 posto u 2009. godini. Također je povećan udio ugljena i kosa i to s 15,6 na 17,6 posto, dok je udio tekućih goriva smanjen s 14,4 na 8,4 posto. Udio ogrjevnog drva i ostale biomase iznosio je u 2009. godini 1,6 posto.
2004. godina
Year: 2004
2009. godina
Year: 2009
Figure 2.12.2. shows the shares of energy forms in energy supply of industry in 2004 and 2009. Steam and hot water and natural gas are the energy forms with the highest share in energy consumption by industry. In the observed period the share of steam and hot water dropped form 27.1 to 24.3 per-cent, while the share of natural gas increased from 22.8 to 25 percent. Electricity had a very significant position in energy supply of industry, with a share that increased from 20.1 percent in 2004 to 23.1 percent in 2009. Also, the share of coal and coke increased from 15.6 to 17.6 percent, while the share of liquid fuels dropped from 14.4 to 8.4 percent. The share of fuel wood and biomass was 1.6 percent in 2009.
Slika | Figure 2.12.2. Udjeli oblika energije u neposrednoj potrošnji industrije | Shares of energy forms in final energy demand in industry – Izvor | Source: EIHP
Potrošnja energije u pojedinim industrijskim granama za proteklo razdoblje od 2004. do 2009. godine prikazana je u tablici 2.12.2. Na slici 2.12.3. se prati razvoj potrošnje energije u pojedinim industrijskim granama tijekom razdoblja od 1988. do 2009. godine. U odnosu na prethodnu godinu povećanje potrošnje energije ostvareno je samo u industriji papira te neznatno u industriji nemetalnih minerala dok je
Table 2.12.2. gives the energy consumption in specific indu-strial sectors in the period 2004 to 2009 and Figure 2.12.3. shows the trends in energy consumption by industries over the period 1988 to 2009. In relation to the previous year a growth in energy consumption was recorded in pulp and paper indu-stry and very low one in non metallic minerals while all other industrial sectors decreased their energy consumption. The lar-gest fall in energy demand was in iron and steel industry, con-
Plinovita goriva | Gaseous Fuels 22,8% Električna energija | Electricity 20,1%
Para i vrela voda | Steam and Hot Water 27,1% Tekuća goriva | Liquid Fuels 14,4%
Ugljen i koks | Coal and coke 15,6%
Plinovita goriva | Gaseous Fuels 25,0% Električna energija | Electricity 23,1%
Para i vrela voda | Steam and Hot Water 24,3% Tekuća goriva | Liquid Fuels 8,4%
Ugljen i koks | Coal and coke 17,6% Ogrjevno drvo i biomasa | Fuel wood and biomass 1,6%

96
ENERGIJA MMIXI I ENERGIJA U HRVATSKOJ 2009.
u svim ostalim granama industrije ostvaren pad potrošnje. Najveće smanjenje potrošnje energije ostvareno je u industriji željeza i čelika, u industriji građevnog materijala i u prehram-benoj industriji i to za 24,1 posto, 23,8 posto i za 21,2 posto. U kemijskoj industriji, ostaloj industriji i industriji obojenih metala smanjenje potrošnje energije bilo je umjerenije i izraženo u postocima iznosilo je 11,4 posto, 10,2 posto i 7,9 posto. Potrošnja energije u industriji papira povećana je za 16,7 posto, a u industriji nemetalnih minerala 0,2 posto.
Tijekom razdoblja od 2004. do 2009. godine u industriji je ostvaren trend smanjenja potrošnje energije s prosječnom godišnjom stopom od 2,4 posto. Samo je u industriji želje-za i čelika i industriji papira u promatranom vremenskom razdoblju ostvaren trend porasta potrošnje energije, dok je u svim ostalim granama industrije potrošnja energije opadala. U industriji željeza i čelika potrošnja energije je rasla s pro-sječnom godišnjom stopom od 3,4 posto, a u industriji papira s prosječnom godišnjom stopom od 1,3 posto. Najbrže se smanjivala potrošnja energije u industriji nemetalnih minerala, u kemijskoj industriji i u industriji obojenih metala gdje su prosječne godišnje stope pada iznosile 7,4 posto, 5,4 posto i 4,3 posto. Potrošnja energije u ostaloj industriji, industriji građevnog materijala i prehrambenoj industriji smanjivala se s prosječnim godišnjim stopama 2,4 posto, 2 posto i 0,3 posto.
Tablica | Table 2.12.2. Potrošnja energije u industrijskim granama | Final energy demand by industrial sectors
2004. 2005. 2006. 2007. 2008. 2009. 2009./08. 2004.-09.
PJ %
Industrija željeza i čelikaIron and Steel Industry
1,98 2,24 2,62 2,68 3,08 2,34 -24,1 3,4
Industrija obojenih metalaNon-Ferrous Metals Industry
0,68 0,64 0,60 0,67 0,60 0,55 -7,9 -4,3
Industrija nemetalnih mineralaNon-Metallic Minerals Industry
3,48 3,58 3,30 3,34 2,36 2,37 0,2 -7,4
Kemijska industrijaChemical Industry
11,93 9,46 10,69 11,13 10,23 9,06 -11,4 -5,4
Industrija građevnog materijalaConstruction Materials Industry
18,08 19,54 19,31 20,32 21,47 16,35 -23,8 -2,0
Industrija papiraPulp and Paper Industry
2,97 3,36 3,45 2,98 2,72 3,17 16,7 1,3
Prehrambena industrijaFood Industry
9,46 9,71 10,06 9,64 11,80 9,30 -21,2 -0,3
Ostala industrijaOther Manufacturing Industries
9,05 9,45 9,86 10,08 8,92 8,00 -10,2 -2,4
UKUPNO INDUSTRIJATOTAL INDUSTRY
57,65 57,99 59,88 60,83 61,17 51,14 -16,4 -2,4
Izvor | Source: EIHP
struction materials industry and food processing industry. Their consumption dropped by the following respective rates: 24.1 percent, 23.8 percent and 21.2 percent. In chemical industry, other manufacturing industries and non-ferrous metals indu-stry the decrease in energy consumption was somewhat more moderate, with the following respective rates: 11.4 percent, 10.2 percent and 7.9 percent. Energy consumption of paper and pulp industry increased by 16.7 percent, and in non-metal minerals industry by 0.2 percent.
Over the period 2004 to 2009 energy consumption by industry was on a downward trend at an average annual rate of 2.4 per-cent. In the observed period only iron and steel industry and paper and pulp industry increased energy consumption, while in all other manufacturing industries energy consumption was decreased. The consumption by the iron and steel industry grew at an average annual rate of 3.4 percent, and paper and pulp industry increased their energy consumption at an average annual rate of 1.3 percent. The fastest decrease in energy con-sumption was in non-metallic minerals industry, in chemical industry and non-ferrous metals industry, with respective average decreasing rates: 7.4 percent, 5.4 percent and 4.3 percent. Energy consumption in other manufacturing industries, construc-tion materials and food processing decreased at average annual rates of 2.4 percent, 2 percent and 0.3 percent respectively.

97
ENERGY MMIXI I ENERGY IN CROATIA 2009
Slika | Figure 2.12.3. Potrošnja energije u industrijskim granama | Final energy demand by industrial sectors Izvor | Source: EIHP
Figure 2.14.2. shows the shares of industrial sectors in total final energy demand by industry in 2004 and 2009. Over this period food processing industry, iron and steel industry, paper and pulp industry, and construction materials increased their respective shares in final energy demand, while the shares of chemical industry, non-metallic minerals industry and non-ferrous metals industry decreased. The share of other manufacturing industries did not change and was 15.7 percent. The share of chemical industry fell by 3 percent so that in 2009 it was 17.7 percent. The share of non-metallic minerals decreased from 6 to 4.6 percent, while the share of non-ferrous metal industry decreases only minimally, by 0.1 percent and in 2009 it was 1.1 percent. The biggest share in industrial final energy demand was in construction materials industry, with a share growing from 31.4 to 32 percent. The share of food processing industry increased by 1.8 percent so that in 2009 this industry made 18.2 percent of final energy demand by industry. The shares of iron and steel industry and paper and pulp industry increased by 1.2 percent, or by 1 percent and their shares in 2009 were 4.6 percent and 6.2 percent respectively.
Udjeli industrijskih grana u ukupnoj potrošnji energije u industriji, u 2004. i 2009. godini prikazani su na slici 2.12.4. U promatranom razdoblju povećan je udio prehrambene indu-strije, industrije željeza i čelika, industrije papira i industrije građevinskog materijala, dok je udio kemijske industrije, industrije nemetalnih minerala i industrije obojenih metala smanjen. Udio ostale industrije nije se mijenjao i iznosio je 15,7 posto. Udio kemijske industrije smanjen je za 3 posto tako da je ona u 2009. godini sudjelovala s 17,7 posto. Udio industrije nemetalnih minerala smanjen je s 6 na 4,6 posto, dok je smanjenje udjela industrije obojenih metala bilo mini-malno za 0,1 posto pa je udio te industrijske grane u 2009. godini iznosio 1,1 posto. Najveći udio u potrošnji energije u industriji ostvarila je industrija građevinskog materijala kojoj je udio s 31,4 povećan na 32 posto. Udio prehrambene industrije je povećan za 1,8 pa je ona u potrošnji energije u 2009 sudjelovala s 18,2 posto. Udjeli industrije željeza i čelika i industrije papira povećani su za 1,2 posto, odnosno za 1 posto te su im udjeli u 2009. godini iznosili 4,6 posto i 6,2 posto.
0
10
20
30
40
50
60
70
80
90
100
1988. 1990. 1995. 2000. 2005. 2009.
PJ
Industrija željeza i čelika | Iron and Steel Industry Industrija obojenih metala | Non-Ferrous Metals Industry Industrija nemetalnih minerala | Non-Metallic Minerals Industry Kemijska industrija | Chemical Industry Industrija građevnog materijala | Construction Materials Industry Industrija papira | Pulp and Paper Industry Prehrambena industrija | Food Industry Ostala industrija | Other Manufacturing Industries

98
ENERGIJA MMIXI I ENERGIJA U HRVATSKOJ 2009.
Slika | Figure 2.12.4. Udjeli grana industrije u potrošnji energije | Shares of industrial sectors in final energy demand Izvor | Source: EIHP
2004. godina
Year: 2004
2009. godina
Year: 2009
Industrija obojenih metala | Non-Ferrous Metals Industry 1,2%
Industrija željeza i čelika | Iron and Steel Industry 3,4%
Industrija papira | Pulp and Paper Industry 5,2%
Industrija građevnog materijala | Construction Materials Industry 31,4% Kemijska industrija | Chemical
Industry 20,7%
Industrija nemetalnih minerala | Non-Metallic Minerals Industry 6,0%
Ostala industrija | Other Manufacturing Industries 15,7%Prehrambena industrija | Food Industry 16,4%
Industrija obojenih metala | Non-Ferrous Metals Industry 1,1%
Industrija željeza i čelika | Iron and Steel Industry 4,6%
Industrija papira | Pulp and Paper Industry 6,2%
Industrija građevnog materijala | Construction Materials Industry 32,0% Kemijska industrija | Chemical
Industry 17,7%
Industrija nemetalnih minerala | Non-Metallic Minerals Industry 4,6%
Ostala industrija | Other Manufacturing Industries 15,7%Prehrambena industrija | Food Industry 18,2%
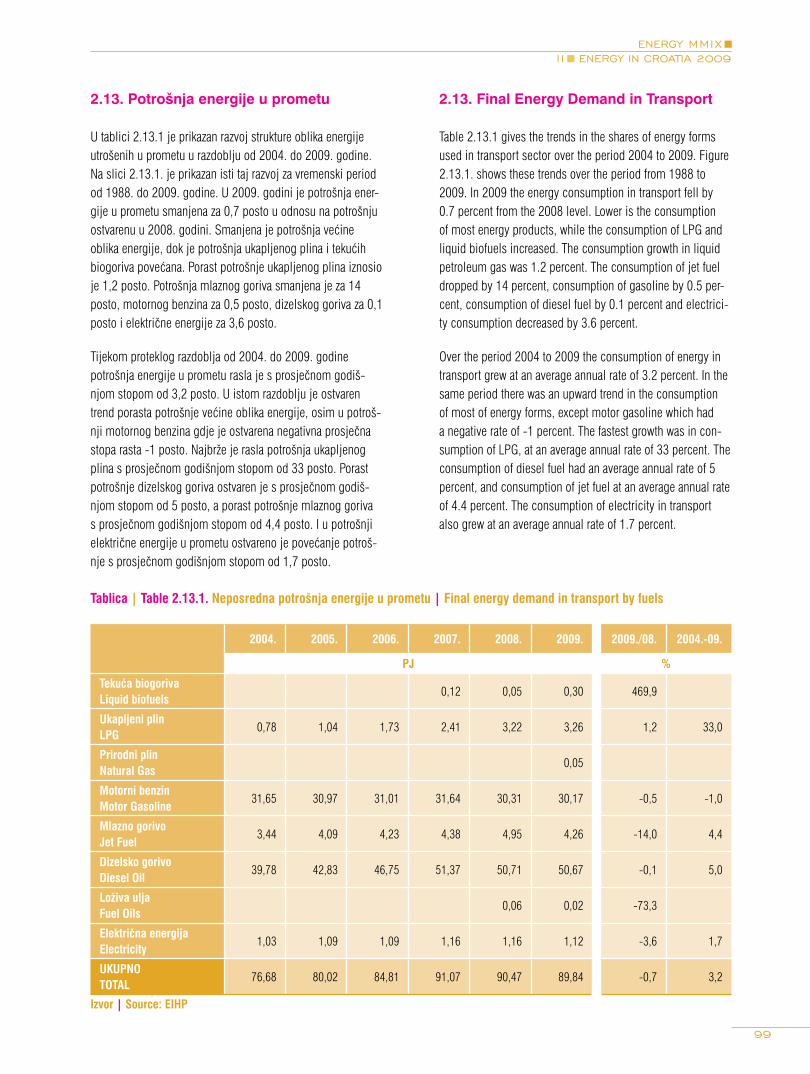
99
ENERGY MMIXI I ENERGY IN CROATIA 2009
2.13. Final Energy Demand in Transport
Table 2.13.1 gives the trends in the shares of energy forms used in transport sector over the period 2004 to 2009. Figure 2.13.1. shows these trends over the period from 1988 to 2009. In 2009 the energy consumption in transport fell by 0.7 percent from the 2008 level. Lower is the consumption of most energy products, while the consumption of LPG and liquid biofuels increased. The consumption growth in liquid petroleum gas was 1.2 percent. The consumption of jet fuel dropped by 14 percent, consumption of gasoline by 0.5 per-cent, consumption of diesel fuel by 0.1 percent and electrici-ty consumption decreased by 3.6 percent.
Over the period 2004 to 2009 the consumption of energy in transport grew at an average annual rate of 3.2 percent. In the same period there was an upward trend in the consumption of most of energy forms, except motor gasoline which had a negative rate of -1 percent. The fastest growth was in con-sumption of LPG, at an average annual rate of 33 percent. The consumption of diesel fuel had an average annual rate of 5 percent, and consumption of jet fuel at an average annual rate of 4.4 percent. The consumption of electricity in transport also grew at an average annual rate of 1.7 percent.
2.13. Potrošnja energije u prometu
U tablici 2.13.1 je prikazan razvoj strukture oblika energije utrošenih u prometu u razdoblju od 2004. do 2009. godine. Na slici 2.13.1. je prikazan isti taj razvoj za vremenski period od 1988. do 2009. godine. U 2009. godini je potrošnja ener-gije u prometu smanjena za 0,7 posto u odnosu na potrošnju ostvarenu u 2008. godini. Smanjena je potrošnja većine oblika energije, dok je potrošnja ukapljenog plina i tekućih biogoriva povećana. Porast potrošnje ukapljenog plina iznosio je 1,2 posto. Potrošnja mlaznog goriva smanjena je za 14 posto, motornog benzina za 0,5 posto, dizelskog goriva za 0,1 posto i električne energije za 3,6 posto.
Tijekom proteklog razdoblja od 2004. do 2009. godine potrošnja energije u prometu rasla je s prosječnom godiš-njom stopom od 3,2 posto. U istom razdoblju je ostvaren trend porasta potrošnje većine oblika energije, osim u potroš-nji motornog benzina gdje je ostvarena negativna prosječna stopa rasta -1 posto. Najbrže je rasla potrošnja ukapljenog plina s prosječnom godišnjom stopom od 33 posto. Porast potrošnje dizelskog goriva ostvaren je s prosječnom godiš-njom stopom od 5 posto, a porast potrošnje mlaznog goriva s prosječnom godišnjom stopom od 4,4 posto. I u potrošnji električne energije u prometu ostvareno je povećanje potroš-nje s prosječnom godišnjom stopom od 1,7 posto.
Tablica | Table 2.13.1. Neposredna potrošnja energije u prometu | Final energy demand in transport by fuels
2004. 2005. 2006. 2007. 2008. 2009. 2009./08. 2004.-09.
PJ %
Tekuća biogorivaLiquid biofuels
0,12 0,05 0,30 469,9
Ukapljeni plinLPG
0,78 1,04 1,73 2,41 3,22 3,26 1,2 33,0
Prirodni plinNatural Gas
0,05
Motorni benzinMotor Gasoline
31,65 30,97 31,01 31,64 30,31 30,17 -0,5 -1,0
Mlazno gorivoJet Fuel
3,44 4,09 4,23 4,38 4,95 4,26 -14,0 4,4
Dizelsko gorivoDiesel Oil
39,78 42,83 46,75 51,37 50,71 50,67 -0,1 5,0
Loživa uljaFuel Oils
0,06 0,02 -73,3
Električna energijaElectricity
1,03 1,09 1,09 1,16 1,16 1,12 -3,6 1,7
UKUPNOTOTAL
76,68 80,02 84,81 91,07 90,47 89,84 -0,7 3,2
Izvor | Source: EIHP

100
ENERGIJA MMIXI I ENERGIJA U HRVATSKOJ 2009.
Slika | Figure 2.13.1. Potrošnja energije u prometu | Final energy demand in transport Izvor | Source: EIHP
Udjeli pojedinih oblika energije u ukupnoj energiji utrošenoj u prometu u 2004. i 2009. godini prikazani su na slici 2.13.2. U navedenom razdoblju je došlo do promjena u strukturi potrošnje energije u prometu i to takvih da je udio dizelskog goriva i ukapljenog plina povećan za 4,5 odnosno 2,6 posto, dok je udio motornog benzina smanjen za 7,7 posto. U 2004. godini udio motornog benzina iznosio je 41,3 posto te se do 2009. godine smanjio na 33,6 posto. Suprotno tome udio dizelskog goriva povećao se s 51,9 posto u 2004. godini na 56,4 posto u 2009. godini. Zbog vrlo brzog porasta potrošnje i ukapljeni plin zauzima sve značajnije mjesto, pa mu je udio povećan s 1 na 3,6 posto. Udjeli mlaznog goriva i električne energije promijenjeni su za znatno manje iznose. Tako je udio mlaznog goriva povećan za 0,2 posto te je u 2009. godini iznosio 4,7 posto, a udio električne energije je smanjen za 0,1 posto i u 2009. godini je iznosio 1,2 posto.
Figure 2.13.2. shows the shares of specific energy forms in energy consumption by transport in 2004 and 2009. Over this period the following changes occurred in the structure of energy consumption in transport: the share of diesel fuels and LPG increased by 4.5 percent and by 2.6 percent respective-ly, while the share of motor gasoline decreased by 7.7 per-cent. In 2004 the share of motor gasoline was 41.3 percent and until 2009 it decreased by 33.6 percent. Contrary to this trend, the share of diesel fuels increased from 51.9 percent in 2004 up to 56.4 percent in 2009. Due to a fast growing consumption, LPG has an increasingly important place and its share increased from 1 to 3.6 percent. The shares of jet fuel and electricity changed in minor amounts. The share of jet fuel increased by 0.2 percent and in 2009 it reached 4.7 percent, and the share of electricity decreased by 0.1 percent to reach 1.2 percent in 2009.
0
10
20
30
40
50
60
70
80
90
100
1988. 1990. 1995. 2000. 2005. 2009.
PJ
Ugljen | Coal Tekuća biogoriva | Liquid biofuels Ukapljeni plin | LPG Motorni benzin | Motor gasoline
Mlazno gorivo | Jet fuel Dizelsko gorivo | Diesel oil Loživa ulja | Fuel oils Električna energija | Electricity

101
ENERGY MMIXI I ENERGY IN CROATIA 2009
Slika | Figure 2.13.2. Udjeli oblika energije u neposrednoj potrošnji energije u prometu | Final energy demand in transport by energy forms – Izvor | Source: EIHP
2004. godina
Year: 2004
2009. godina
Year: 2009
Potrošnja energije u pojedinim vrstama prometa u razdoblju od 2004. do 2009. godine prikazana je u tablici 2.13.2, a na slici 2.13.3. prikazan je isti taj razvoj za razdoblje od 1988. do 2009. godine. U 2009. godini je ostvareno povećanje potrošnje energije u pomorskom i riječnom prometu, u cestovnom pro-metu, u javnom gradskom prometu i u ostalom prometu, dok je u zračnom i željezničkom prometu potrošnja energije sma-njena. Izraženo u postocima najveće povećanje od 9,9 posto ostvareno je u pomorskom i riječnom prometu, povećanje potrošnje u ostalom prometu iznosilo je 7,5 posto, u javnom gradskom prometu 1,8 posto i u cestovnom prometu samo 0,1 posto. U zračnom prometu je potrošnja energije smanjena za 13,6 posto i u željezničkom prometu za 10,8 posto.
Tijekom razdoblja od 2004. do 2009. godine ostvaren je trend porasta potrošnje energije u svim vrstama prometa, osim u željezničkom prometu gdje je potrošnja stagnirala. Tako je potrošnja energije u pomorskom i riječnom prometu rasla najbrže s prosječnom godišnjom stopom od 8,9 posto, dok je u zračnom prometu potrošnja energije rasla s prosječnom godišnjom stopom od 4,4 posto. Porast potrošnje energije
Table 2.13.2. gives energy consumption by means of tran-sport over the period 2004 to 2009. Figure 2.13.3. shows the trends in this structure over the period from 1988 to 2009. In 2009 the energy consumption in sea and river transport, road transport, public city transport and non specified transport increased, while air transport and rail transport decreased their energy consumption. In percentages, the fastest increa-se, of 9.9 percent, took place in sea and river transport; non specified transport increased its consumption by 7.5 percent, public city transport by 1.8 percent and road transport only by 0.1 percent. In air transport the consumption dropped by 13.6 percent and in rail transport by 10.8 percent.
Over the period 2004 to 2009, energy consumption increa-sed in all means of transport, except rail transport where the consumption stagnated. Energy consumption in sea and river transport had the fastest growth at an average annual rate of 8.9 percent, while in air transport it grew at an average rate 4.4 percent annually. Energy consumption in road transport grew at an average rate of 3.2 percent per annum. The lowest
Električna energija | Electricity 1,3% Ukapljeni plin | LPG 1,0%
Dizelsko gorivo | Diesel oil 51,9%
Mlazno gorivo | Jet fuel 4,5%
Motorni benzin | Motor gasoline 41,3%
Ukapljeni plin | LPG 3,6%
Tekuća biogoriva | Liquid biofuels 0,3%
Dizelsko gorivo | Diesel oil 56,4%
Mlazno gorivo | Jet fuel 4,7%
Motorni benzin | Motor gasoline 33,6%
Prirodni plin | Natural gas 0,1%
Loživa ulja | Fuel oils 0,02%
Električna energija | Electricity 1,2%

102
ENERGIJA MMIXI I ENERGIJA U HRVATSKOJ 2009.
u cestovnom prometu ostvaren je s prosječnom godišnjom stopom od 3,2 posto. Najniže prosječne godišnje stope porasta potrošnje energije ostvarene su u ostalom i javnom gradskom prometu, a iznosile su 2,6 odnosno 1,3 posto.
Tablica | Table 2.13.2. Potrošnja energije pojedinih vrsta prometa | Final energy demand by means of transport
2004. 2005. 2006. 2007. 2008. 2009. 2009./08. 2004.-09.
PJ %
Željeznički prometRail Transport
1,84 1,93 2,03 2,07 2,06 1,84 -10,8 0,0
Cestovni prometRoad Transport
68,53 70,92 75,54 81,49 79,97 80,03 0,1 3,2
Zračni prometAir Transport
3,54 4,21 4,32 4,50 5,07 4,38 -13,6 4,4
Pomorski i riječni prometSea and River Transport
1,35 1,45 1,51 1,56 1,88 2,07 9,9 8,9
Javni gradski prometPublic City Transport
1,34 1,41 1,33 1,35 1,40 1,43 1,8 1,3
Ostali prometNon Specified
0,08 0,11 0,08 0,10 0,09 0,09 7,5 2,6
UKUPNO PROMETTOTAL TRANSPORT
76,68 80,02 84,81 91,07 90,47 89,84 -0,7 3,2
Izvor | Source: EIHP
growing rates were in the consumption by non specified tran-sport and public city transport and were 2.6 percent and 1.3 percent respectively.
Slika | Figure 2.13.3. Potrošnja energije pojedinih vrsta prometa | Final energy demand by means of transport Izvor | Source: EIHP
Željeznički transport | Rail Transport Cestovni promet | Road Transport Zračni promet | Air Transport Pomorski i riječni promet | Sea and River Transport Gradski promet | Public City Transport Ostali promet | Non Specified
0
10
20
30
40
50
60
70
80
90
100
1988. 1990. 1995. 2000. 2005. 2009.
PJ

103
ENERGY MMIXI I ENERGY IN CROATIA 2009
Udjeli pojedinih vrsta prometa u 2004. i 2009. godini prika-zani su na slici 2.13.4. U spomenutom razdoblju ostvarene su vrlo male strukturne promjene. Udjeli pomorskog i riječnog te zračnog prometa povećani su za 0,5 odnosno 0,3 posto. Udjeli željezničkog, cestovnog i javnog gradskog prometa su smanjeni za 0,4 posto, 0,3 posto i 0,2 posto. Udio osta-log prometa se u promatranom vremenskom razdoblju nije promijenio ta se zadržao na vrlo niskoj vrijednosti od samo 0,1 posto. Većina potrošnje energije u prometu ostvaruje se u cestovnom prometu tako da je njegov udio u 2009. godini iznosio 89,1 posto. Udio zračnog prometa je u istoj godini iznosio 4,9 posto, a udio pomorskog i riječnog prometa 2,3 posto. Udjeli željezničkog i javnog gradskog prometa smanje-ni su na vrijednosti od 2 odnosno 1,6 posto.
Figure 2.13.4. shows the shares of means of transport in final energy demand in 2004 and 2009. In this period, they went through just minor changes. The shares of sea and river and air transport increased by 0.5 percent and 0.3 percent respectively. The shares of rail transport, road transport and public city transport decreased by 0.4 percent, 0.3 percent and 0.2 percent respectively. Non specific transport did not change its share in the observed period and remained at a low level of only 0.1 percent. Most of energy consumption by transport takes place in road transport, which in 2009 made 89.1 percent of total consumption. The share of air transport was 4.9 percent, and of sea and river transport 2.3 percent. The shares of rail and public city transport decreased to 2 percent and 1.6 percent respectively.
Slika | Figure 2.13.4. Udjeli vrsta prometa u neposrednoj potrošnji energije | Shares of means of transport in final energy demand – Izvor | Source: EIHP
2004. godina
Year: 2004
2009. godina
Year: 2009
Zračni promet | Air Transport 4,6%
Pomorski i riječni promet | Sea and River Transport 1,8%
Gradski promet | Public City Transport 1,7%
Ostali promet | Non Specified 0,1%
Željeznički transport | Rail Transport 2,4%
Cestovni promet | Road Transport 89,4%
Zračni promet | Air Transport 4,9%
Pomorski i riječni promet | Sea and River Transport 2,3%
Gradski promet | Public City Transport 1,6% Ostali promet | Non Specified 0,1%
Željeznički transport | Rail Transport 2,0%
Cestovni promet | Road Transport 89,1%

104
ENERGIJA MMIXI I ENERGIJA U HRVATSKOJ 2009.
2.14. Potrošnja energije u općoj potrošnji
Potrošnja energije u općoj potrošnji obuhvaća potrošnju ener-gije u kućanstvima, uslužnom sektoru, poljoprivredi i građe-vinarstvu. Razvoj strukture oblika energije utrošenih u općoj potrošnji u razdoblju od 2004. do 2009. godine prikazan je u tablici 2.14.1. Isti taj razvoj tijekom proteklog razdoblja od 1988. do 2009. godine prikazan je na slici 2.14.1. Potrošnja energije u općoj potrošnji smanjena je za 0,7 posto u odnosu na prethodnu godinu. Pri tome je ostvareno povećanje potroš-nje ogrjevnog drva i ostale biomase, prirodnog plina, pare i vrele vode te ostalih obnovljivih izvora, dok je potrošnja ostalih energenata smanjena. Najveći porast potrošnje izražen u posto-cima ostvaren je u korištenju ogrjevnog drva i ostale biomase (peleti, briketi i drveni ugljen) te je iznosio 7 posto. Porast potrošnje prirodnog plina iznosio je 2,6 posto, porast potrošnje pare i vrele vode 1,2 posto i porast potrošnje ostalih obnovljivih izvora (energija Sunca, geotermalna energija i biogoriva) 0,2 posto. U potrošnji ostalih oblika energije zabilježeno je sma-njenje potrošnje koje je za ugljen iznosilo 8,4 posto, za tekuća goriva 5,4 posto i za električnu energiju 1,8 posto.
Tijekom razdoblja od 2004. do 2009. godine potrošnja energije u općoj potrošnji ostvarila je blagi trend porasta s prosječnom godišnjom stopom od 0,3 posto. U tome razdoblju trend pora-sta ostvaren je u potrošnji električne energije i prirodnog plina, dok je u potrošnji ostalih oblika energije ostvaren trend smanje-nja. Najbrže se smanjivala potrošnja ugljena i to s prosječnom godišnjom stopom od 11,7 posto. U potrošnji tekućih goriva ostvareno je smanjenje potrošnje s prosječnom godišnjom stopom od 3,5 posto, potrošnja ogrjevnog drva i ostale bio-mase smanjivala se s prosječnom godišnjom stopom od 2,1 posto, a potrošnja pare i vrele vode s prosječnom godišnjom stopom 1,3 posto. Suprotno takvome trendu, potrošnje elek-trične energije i prirodnog plina povećavale su se s prosječnim godišnjim stopama od 3,1 i 2,2 posto.
2.14. Final Energy Demand in Other Sectors
Energy demand by other sectors encompasses consumption in household, services, agriculture and construction indu-stry. Table 2.14.1. gives the trends in energy products con-sumed by these sub sectors over the period 2004 to 2009. Figure 2.14.1. shows the trends in energy demand over the period 1988 to 2009. The energy consumption by other sec-tors decreased by 0.7 percent from the previous year. This sector increased its consumption of fuel wood and biomass, natural gas, steam and hot water, and other renewables, while the consumption of other energy products decreased. The highest increase, of 7 percent, was recorded in the con-sumption of fuel wood and biomass (pellets, briquettes and charcoal). The consumption of natural gas increased by 2.6 percent, of steam and hot water by 1.2 percent and of other renewables (energy of sun, geothermal energy and biofuels) by 0.2 percent. The consumption of other energy forms decreased: coal consumption by 8.4 percent, consumption of liquid fuels by 5.4 percent and consumption of electricity 1.8 percent.
Over the period 2004 to 2009 energy consumption in other sectors had a slightly upward trend at an average annual rate of 0.3 percent. In this period the growth was recorded in consumption of electricity and natural gas, while the consumption of other energy forms decreased. The fastest decrease was in coal consumption at an average annual rate of 11.7 percent. The consumption of liquid fuels decreased at an average rate of 3.5 percent per annum, consumption of fuel wood and biomass decreased at an average annual rate of 2.1 percent, and consumption of steam and hot water at an average annual rate of 1.3 percent. Contrary to this, electricity consumption and natural gas consumption grew at average annual rates of 3.1 percent and 2.2 percent respectively.

105
ENERGY MMIXI I ENERGY IN CROATIA 2009
Tablica | Table 2.14.1. Neposredna potrošnja energije u općoj potrošnji | Final energy demand in other sectors
2004. 2005. 2006. 2007. 2008. 2009. 2009./08. 2004.-09.
PJ %
UgljenCoal
0,34 0,39 0,35 0,18 0,20 0,18 -8,4 -11,7
Ogrjevno drvo i biomasaBiomass
13,14 12,51 12,60 10,71 11,07 11,85 7,0 -2,1
Tekuća gorivaLiquid Fuels
35,72 35,41 33,99 31,29 31,65 29,93 -5,4 -3,5
Plinovita gorivaGaseous Fuels
27,08 29,67 28,17 26,97 29,40 30,16 2,6 2,2
Električna energijaElectricity
36,67 38,99 40,70 40,87 43,59 42,82 -1,8 3,1
Para i vrela vodaSteam and Hot Water
8,28 8,54 7,60 7,28 7,65 7,74 1,2 -1,3
Obnovljivi izvoriRenewables
0,29 0,33 0,33 0,2
UKUPNOTOTAL
121,23 125,51 123,40 117,59 123,89 123,01 -0,7 0,3
Izvor | Source: EIHP
Slika | Figure 2.14.1. Potrošnja oblika energije u sektoru opće potrošnje | Final energy demand in other sectors by energy forms – Izvor | Source: EIHP
Električna energija | Electricity Obnovljivi izvori | Renewables
Para i vrela voda | Steam and Hot Water
1988. 1990. 1995. 2000. 2005. 2009.
Ugljen i koks | Coal and coke Ogrjevno drvo i biomasa | Fuel wood and biomass Tekuća goriva | Liquid Fuels Plinovita goriva | Gaseous Fuels
0
20
40
60
80
100
120
140
PJ

106
ENERGIJA MMIXI I ENERGIJA U HRVATSKOJ 2009.
Na slici 2.14.2. prikazani su udjeli oblika energije koji su utro-šeni u sektoru opće potrošnje u 2004. i 2009. godini. Strukturne promjene koje su se dogodile tijekom promatranog šestogodiš-njeg razdoblja karakterizira povećanje udjela električne energije i prirodnog plina te smanjenje udjela ostalih oblika energije. Udio električne energije povećan je za 4,6 posto, s 30,2 posto u 2004. godini na 34,8 posto u 2009. godini. Istodobno je udio tekućih goriva smanjen za 5,2 posto, s 29,5 posto u 2004. godini na 24,3 posto u 2009. godini. Također je povećan i udio prirodnog plina za 2,2 posto te je u 2009. godini iznosio 24,5 posto. Udjeli ostalih oblika energije koji se koriste u općoj potrošnji su smanjeni. Smanjenje udjela ostvareno za ogrjevno drvo i ostalu biomasu iznosilo je 1,2 posto tako da je udio ogr-jevnog drva u 2009. godini imao vrijednost od 9,6 posto. Udio pare i vrele vode smanjen je za 0,5 posto i to s 6,8 na 6,3 posto, odnosno udio ugljena za 0,2 posto, tako da je u 2009. godini iznosio samo 0,1 posto. Obnovljivi izvori energije (geotermalna energija, Sunčeva energija i biogoriva) sudjelovali su u općoj potrošnji s 0,3 posto.
Figure 2.14.2. shows the shares of energy forms consumed in the other sectors in 2004 and 2009. The characteristic of structural changes that took place over the six year observed period is increasing share of electricity and natural gas and reduction of shares of other energy forms. The share of elec-tricity grew by 4.6 percent, from 30.2 percent in 2004 up to 34.8 percent in 2009. At the same time, the share of liquid fuels decreased by 5.2 percent, from 29.5 percent in 2004 down to 24.3 percent in 2009. Also, natural gas increased its share by 2.2 percent, so in 2009 it reached 24.5 percent. The shares of other energy forms used by other sectors decrea-sed: the share of fuel wood and biomass by 1.2 percent so that in 2009 it was 9.6 percent; the share of steam and hot water decreased by 0.5 percent, from 6.8 to 6.3 percent; and the share of coal by 0.2 percent, so that in 2009 it was only 0.1 percent. Renewables (geothermal energy, solar energy and biofuels) made only 0.3 percent of the other sectors’ energy demand in 2009.
2004. godina
Year: 2004
2009. godina
Year: 2009
Slika | Figure 2.14.2. Udjeli oblika energije u općoj potrošnji energije | Shares of energy forms in other sectors’ final energy demand – Izvor | Source: EIHP
Plinovita goriva | GaseousFuels 24,5%
Električna energija | Electricity 34,8%
Para i vrela voda | Steam and Hot Water 6,3%
Ugljen | Coal 0,1%
Ogrjevno drvo i biomasa | FuelWood and biomass 9,6%
Tekuća goriva | Liquid Fuels 24,3%
Obnovljivi izvori | Renewables 0,3%
Plinovita goriva | GaseousFuels 24,5%
Električna energija | Electricity 34,8%
Para i vrela voda | Steam and Hot Water 6,3%
Ugljen | Coal 0,1%
Ogrjevno drvo i biomasa | FuelWood and biomass 9,6%
Tekuća goriva | Liquid Fuels 24,3%
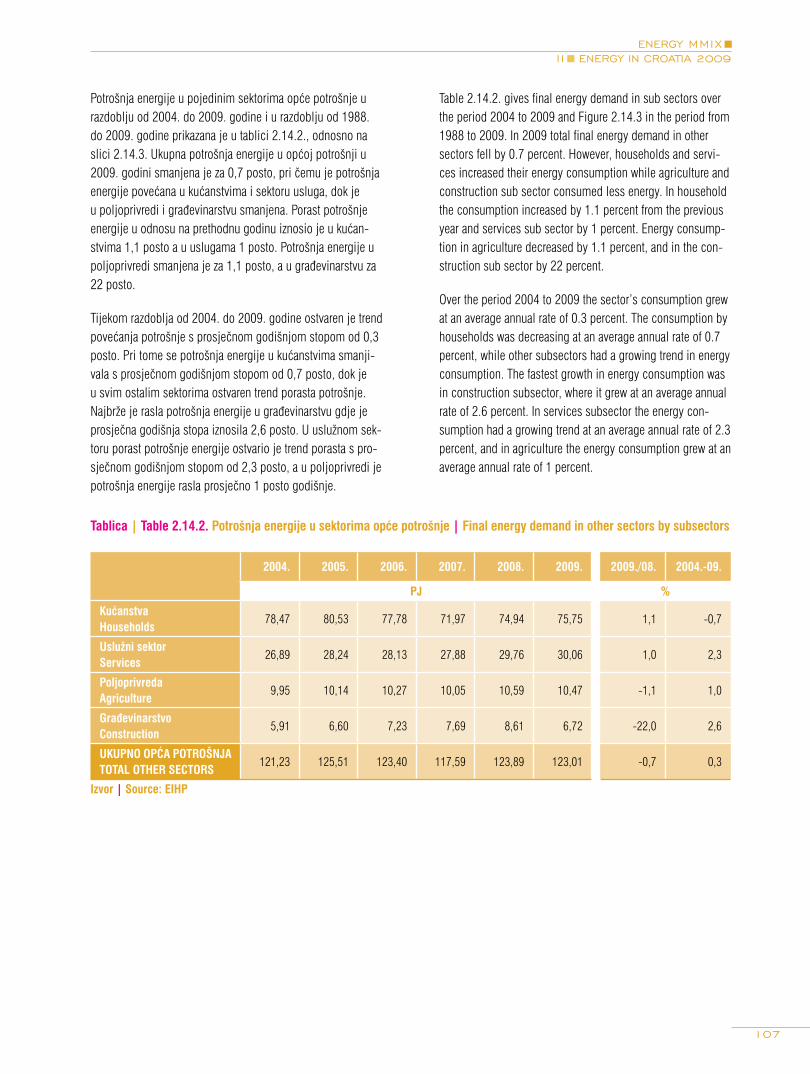
107
ENERGY MMIXI I ENERGY IN CROATIA 2009
Potrošnja energije u pojedinim sektorima opće potrošnje u razdoblju od 2004. do 2009. godine i u razdoblju od 1988. do 2009. godine prikazana je u tablici 2.14.2., odnosno na slici 2.14.3. Ukupna potrošnja energije u općoj potrošnji u 2009. godini smanjena je za 0,7 posto, pri čemu je potrošnja energije povećana u kućanstvima i sektoru usluga, dok je u poljoprivredi i građevinarstvu smanjena. Porast potrošnje energije u odnosu na prethodnu godinu iznosio je u kućan-stvima 1,1 posto a u uslugama 1 posto. Potrošnja energije u poljoprivredi smanjena je za 1,1 posto, a u građevinarstvu za 22 posto.
Tijekom razdoblja od 2004. do 2009. godine ostvaren je trend povećanja potrošnje s prosječnom godišnjom stopom od 0,3 posto. Pri tome se potrošnja energije u kućanstvima smanji-vala s prosječnom godišnjom stopom od 0,7 posto, dok je u svim ostalim sektorima ostvaren trend porasta potrošnje. Najbrže je rasla potrošnja energije u građevinarstvu gdje je prosječna godišnja stopa iznosila 2,6 posto. U uslužnom sek-toru porast potrošnje energije ostvario je trend porasta s pro-sječnom godišnjom stopom od 2,3 posto, a u poljoprivredi je potrošnja energije rasla prosječno 1 posto godišnje.
Tablica | Table 2.14.2. Potrošnja energije u sektorima opće potrošnje | Final energy demand in other sectors by subsectors
2004. 2005. 2006. 2007. 2008. 2009. 2009./08. 2004.-09.
PJ %
KućanstvaHouseholds
78,47 80,53 77,78 71,97 74,94 75,75 1,1 -0,7
Uslužni sektorServices
26,89 28,24 28,13 27,88 29,76 30,06 1,0 2,3
PoljoprivredaAgriculture
9,95 10,14 10,27 10,05 10,59 10,47 -1,1 1,0
GrađevinarstvoConstruction
5,91 6,60 7,23 7,69 8,61 6,72 -22,0 2,6
UKUPNO OPĆA POTROŠNJATOTAL OTHER SECTORS
121,23 125,51 123,40 117,59 123,89 123,01 -0,7 0,3
Izvor | Source: EIHP
Table 2.14.2. gives final energy demand in sub sectors over the period 2004 to 2009 and Figure 2.14.3 in the period from 1988 to 2009. In 2009 total final energy demand in other sectors fell by 0.7 percent. However, households and servi-ces increased their energy consumption while agriculture and construction sub sector consumed less energy. In household the consumption increased by 1.1 percent from the previous year and services sub sector by 1 percent. Energy consump-tion in agriculture decreased by 1.1 percent, and in the con-struction sub sector by 22 percent.
Over the period 2004 to 2009 the sector’s consumption grew at an average annual rate of 0.3 percent. The consumption by households was decreasing at an average annual rate of 0.7 percent, while other subsectors had a growing trend in energy consumption. The fastest growth in energy consumption was in construction subsector, where it grew at an average annual rate of 2.6 percent. In services subsector the energy con-sumption had a growing trend at an average annual rate of 2.3 percent, and in agriculture the energy consumption grew at an average annual rate of 1 percent.

108
ENERGIJA MMIXI I ENERGIJA U HRVATSKOJ 2009.
Slika | Figure 2.14.3. Potrošnja energije u pojedinim sektorima opće potrošnje | Final energy demand in other sectors by subsectors – Izvor | Source: EIHP
Na slici 2.14.4. prikazani su udjeli pojedinih sektora u uku-pnoj potrošnji energije u općoj potrošnji u 2004. i 2009. godini. U navedenom razdoblju udjeli uslužnog sektora, građevinarstva i poljoprivrede su se povećavali, a udio kućan-stava se smanjio. Najviše energije trošilo se u kućanstvima kojima je udio s 64,7 smanjen na 61,6 posto. Udio sektora usluga povećan je za 2,2 posto te je u 2009. godini iznosio 24,4 posto, dok je udio građevinarstva povećan s 4,9 na 5,5 posto. Udio poljoprivrede povećan je za 0,3 posto, s 8,2 na 8,5 posto u 2009. godini.
Figure 2.14.4. shows the shares of subsectors in total final energy demand in 2004 and 2009. In this period the shares of services, construction sectors and agriculture increased while the share of households decreased. Households, which make the largest portion in the sector’s energy consumption, decreased their share from 64.7 to 61.6 percent. The share of services grew by 2.2 percent and in 2009 it reached 24.4 percent, while construction sector increased its share from 4.9 to 5.5 percent. Agriculture increased its share by 0,3 per-cent, i.e., from 8.2 to 8.5 percent in 2009.
1988. 1990. 1995. 2000. 2005. 2009.0
20
40
60
80
100
120
140
PJ
Kućanstva | Households Uslužni sektor | Services Građevinarstvo | Construction Poljoprivreda | Agriculture

109
ENERGY MMIXI I ENERGY IN CROATIA 2009
Slika | Figure 2.14.4. Udjeli podsektora opće potrošnje u potrošnji energije | Shares of subsectors in other sectors’ final energy demand – Izvor | Source: EIHP
2004. godina
Year: 2004
2009. godina
Year: 2009
Poljoprivreda | Agriculture 8,2%
Uslužni sektor | Services 22,2%
Kućanstva | Households 64,7%
Građevinarstvo | Construction 4,9%
Poljoprivreda | Agriculture 8,5%
Uslužni sektor | Services 24,4%
Kućanstva | Households 61,6%
Građevinarstvo | Construction 5,5%


NAFTA I DERIVATI NAFTE OIL AND OIL PRODUCTS
IIIIII


113
ENERGY MMIXI I I OIL AND OIL PRODUCTS
3.1. Rezerve
Tablica | Table 3.1.1. Bilančne rezerve i proizvodnja nafte i kondenzata | Oil and condensate reserves and production
Nafta i kondenzatOil and Condensate
2000. 2001. 2002. 2003. 2004. 2005. 2006. 2007. 2008. 2009.
Rezerve (1 000 m3)Reserves (1 000 m3)
11 474,3 10 622,5 10 152,7 10 356,1 11 794,0 9 330,9 9 690,1 11 719,1 11 472,5 8 454,8
Proizvodnja (1 000 t)Production (1 000 t)
1 213,9 1 120,8 1 108,5 1 052,1 1 001,0 946,0 917,4 879,1 835,4 776,2
Izvor | Source: Ministarstvo gospodarstva, rada i poduzetništva | Ministry of Economy, Labour and Entrepreneurship
3.2. Kapaciteti u naftnom sustavu
3.2.1. Proizvodnja i prerada
Sirova nafta proizvodi se iz 34 naftna polja, a plinski kondenzat iz osam plinsko-kondenzatnih polja. Kapaciteti prerade u rafine-rijama nafte u Republici Hrvatskoj prikazani su u tablici 3.2.1.
Tablica | Table 3.2.1. Kapaciteti prerade u rafinerijama nafte u RH | Processing capacities of oil refineries in the Republic of Croatia
Kapaciteti preradeProcessing capacities
Instalirani (1 000 tona/god.)Installed (1 000 tons/year)
1. RAFINERIJA NAFTE RIJEKA (URINJ) OIL REFINERY RIJEKA (URINJ)
atmosferska destilacija atmospheric destillation 5 000
reformiranje reforming 730
FCC FCC 1 000
visbreaking visbreaking 600
izomerizacija isomerization 250
HDS/MHC 1 040/560
2. MAZIVA RIJEKA (MLAKA) LUBE REFINERY RIJEKA (MLAKA)
vakuum destilacija vacuum destillation 630
deasfaltacija deasphalting 110
furfural ekstrakcija furfural extraction 220
deparafinacija deparaffination 140
ferofining ferofining 200
deoiling deoiling 30
bitumen bitumen 250
3. RAFINERIJA NAFTE SISAK OIL REFINERY SISAK
atmosferska destilacija atmospheric destillation 4 000
reformiranje reforming 720
FCC FCC 500
koking coking 240
vakum destilacija vacuum destillation 800
bitumen bitumen 350
3.1 Reserves
3.2 Oil Sector Capacities
3.2.1 Production and processing
Crude oil is produced from 34 oil fields and gas condensation products from 8 gas-condensation fields. Processing capaciti-es of the Croatian refineries are shown in the following Table.

114
ENERGIJA MMIXI I I NAFTA I DERIVATI NAFTE
Kapaciteti preradeProcessing capacities
Instalirani (1 000 tona/god.)Installed (1 000 tons/year)
4. MAZIVA ZAGREB LUBE REFINERY ZAGREB
atmosferska destilacija atmospheric destillation -
maziva lubricants 60
Izvor | Source: INA
Napomena: Pogon Maziva Rijeka više ne proizvodi bitumen
i loživa ulja nego samo proizvode iz grupe motornih ulja i
maziva.
3.2.2. Transport Jadranskim naftovodom
Jadranski naftovod izgrađen je 1979. godine kao međuna-rodni sustav transporta nafte od tankerske luke i terminala Omišalj do domaćih i inozemnih rafinerija u istočnoj i sre-dišnjoj Europi. Projektirani kapacitet cjevovoda je 34 milijuna tona transporta nafte godišnje, a instalirani 20 milijuna tona. Kapacitet skladišta na terminalima Omišalj, Sisak i Virje iznosi 900 000 m3 za naftu te 100 000 m3 za derivate u Omišlju i Zagrebu (tablica 3.2.2.).
Note: Lube Refinery Rijeka does not produce bitumen and
fuel oils any more. It produces only products from motor oil
and grease category.
3.2.2 JANAF pipeline transportation
JANAF pipeline was constructed in 1979 as an international oil transportation system from the tanker and terminal port of Omišalj to domestic and foreign refineries in Eastern and Mid-Europe. The designed pipeline capacity amounts to 34 million tons of oil a year, and the installed one is 20 million tons. The storage capacity at the Omišalj, Sisak and Virje ter-minals equals 900 000 m3 for oil (Table 3.2.2) and 100 000 m3 for oil products in Omišalj and Zagreb.
Tablica | Table 3.2.2. Kapaciteti naftnih terminala JANAF-a | Capacities of JANAF oil terminals
TerminalSkladište | Storage (m3)
Sirova naftaCrude oil
Derivati naftePetroleum products
Omišalj 760 000 60 000
Sisak 100 000 -
Virje 40 000 -
Zagreb (Žitnjak) - 40 000
Izvor | Source: JANAF
Sustav JANAF-a sastoji se od:
• prihvatno-otpremnog terminala Omišalj na otoku Krku
• cjevovoda dugačkog 622 km s dionicama: Omišalj-Sisak; Sisak-Virje (s dionicom do Lendave)-Gola (hrvatsko-mađarska granica); Sisak-Slavonski Brod (s dionicom do Bosanskog Broda)-Sotin (hrvatsko-srpska granica)
• prihvatno-otpremnih terminala u Sisku, Virju i kod Slavonskog Broda
The JANAF system consists of the following:
• Reception and forwarding terminal of Omišalj on the island of Krk;
• Pipelines in the total length of 622 km with the following sections: Omišalj-Sisak; Sisak-Virje (with a section to Lendava)-Gola (Croatian-Hungarian border); Sisak-Slavonski Brod (with a section to Bosanski Brod)-Sotin (Croatian-Serbian border);
• Reception and forwarding terminals in Sisak, Virje and near Slavonski Brod;

115
ENERGY MMIXI I I OIL AND OIL PRODUCTS
• podmorskog naftovoda Omišalj-Urinj, koji povezuje termi-nal Omišalj na otoku Krku s INA-Rafinerijom nafte Rijeka na kopnu. Cjevovod je ukupne duljine 7,2 km, od čega je približno 6 km podmorski dio
Promjeri i duljine trasa JANAF-a prikazani su u tablici 3.2.3.
• Omišalj-Urinj submarine pipeline, which connects terminal port of Omišalj on the island of Krk with the INA-Rijeka Oil Refinery on land. The total pipeline length is 7.2 km, with the submarine section of approximately 6 km.
Diameters and lengths of JANAF pipeline routes are shown in the Table 3.2.3.
Tablica | Table 3.2.3. Trase JANAF-a | JANAF pipeline routes
TrasaRoute
PromjerDiameter (“)
DuljinaLenght (km)
Omišalj-Sisak 36 180
Omišalj-Urinj 20 7,2
Sisak-Virje-Gola (hrvatsko-mađarska granica / Croatian-Hungarian border)
28 109
Virje-Lendava 12 73
Sisak-Slavonski Brod 28 156
Slavonski Brod - Bosanski Brod (BiH / Bosnia and Herzegovina)
26 13
Slavonski Brod–Sotin (hrvatsko-srpska granica / Croatian-Serbian border)
26 84
Izvor | Source: JANAF
3.2.3. Prodaja
Po procjeni je u Hrvatskoj u 2009. godini bilo 797 benzinskih postaja. Od toga je u vlasništvu INA Grupe bilo njih 438; INA d.d. imala je 413, INA CROBENZ - 14 i INA OSIJEK PETROL – 11 benzinskih postaja. Na autocestama u Republici Hrvatskoj nalaze se 43 benzinske postaje u vlasništvu INA d.d.
Kretanje ukupnog broja benzinskih postaja u Republici Hrvatskoj u razdoblju od 2000. do 2009. godine prikazano je u tablici 3.2.4. i na slici 3.2.1.
3.2.3 Selling capacities
In 2009, there were about 797 petrol stations in total in Croatia. 438 petrol stations were owned by INA Group, among them 413 owned by INA Inc., 14 by INA CROBENZ and 11 by INA OSIJEK PETROL. On Croatian motorways there are 43 petrol stations owned by INA Inc.
Trends in the total number of petrol stations in the Republic of Croatia from 2000 to 2009 are shown in the following Table and Figure.
Tablica | Table 3.2.4. Broj benzinskih postaja u Republici Hrvatskoj od 2000. do 2009. godine | Number of petrol stations in the Republic of Croatia from 2000 to 2009
VlasništvoOwnership
2000. 2001. 2002. 2003. 2004. 2005. 2006. 2007. 2008. 2009.
INA d.d. 402 403 403 405 414 418 420 412 413 413
OstaliOthers
223 231 255 278 301 313 354 345 371 384
UKUPNOTOTAL
625 634 658 683 715 731 774 757 785 797
Izvor | Source: INA, EIHP

116
ENERGIJA MMIXI I I NAFTA I DERIVATI NAFTE
Slika | Figure 3.2.1. Broj benzinskih postaja u Republici Hrvatskoj od 2000. do 2009. godine | Number of petrol stations in the Republic of Croatia from 2000 to 2009 – Izvor | Source: EIHP
3.2.4. Biogoriva
Ukupni proizvodni kapaciteti biogoriva u Hrvatskoj su u 2009. godini iznosili 61 000 tona biodizela ili 53 763 toe.
Tijekom 2009. godine u Republici Hrvatskoj proizvedeno je 6 333,2 tone biodizela (4 084,18 toe) od čega je manji dio plasiran na domaće tržište. Oko 10% biodizela proizvedeno je iz sakupljenog otpadnog jestivog ulja.
U 2009. godini je u Republiku Hrvatsku uvezeno 2 520 t biodizela i 3 633,3 t bioetanola ili 4 570,05 toe kroz motorna goriva s udjelom biokomponene do 5% v/v.
3.2.4 Biofuels
Total production capacities for liquid biofuels in Croatia for 2009 are 61 000 tons per year of biodiesel.
In 2009, it was produced 6 333.2 t of biodiesel in Croatia or 4 084.18 toe, out of which only small share ended up at the domestic market. Some 10 percent of the total amount origi-nated from collected waste cooking oil.
In 2009, 2 520 t of biodiesel and 3 633.3 t of bioethanol amounting 4 570.05 toe were imported through imports of blended motor fuels (until 5% v/v).
0
100
200
300
400
500
600
700
800
2000. 2001. 2002. 2003. 2004. 2005. 2006. 2007. 2008. 2009.
INA d.d.
Ostali | Others
Ukupno | Total

117
ENERGY MMIXI I I OIL AND OIL PRODUCTS
3.3. Energetske bilance tekućih goriva 3.3 Energy Balances of Liquid Fuels
Tablica | Table 3.3.1. Sirova nafta | Crude oil
2004. 2005. 2006. 2007. 2008. 2009. 2009/08. 2004-09.
tisuće tona Thousand metric tons %
Proizvodnja Production 1001,0 946,0 917,4 879,1 835,4 776,2 -7,1 -5,0
Uvoz Import 4197,6 3998,7 3799,0 4198,3 3473,3 4048,2 16,6 -0,7
Izvoz Export 0,0 0,0 0,0 0,0 0,0 0,0 0,7
Saldo skladišta Stock change -8,7 46,4 23,9 -11,2 114,7 -20,2 -21,6
Ukupna potrošnja Energy supplied 5189,9 4991,1 4740,3 5066,2 4423,4 4804,2 8,6 -1,5
Prerada u degazolinaži NGL Plant input 110,6 116,1 110,5 110,9 118,1 109,2 -7,5 -0,3
Prerada u rafinerijama Petroleum Refineries input 5079,3 4875,0 4629,8 4955,3 4305,3 4695,0 9,1 -1,6
Ukupna prerada rafinerija Gross Refinery intake 5361,5 5176,7 4902,6 5345,6 4549,9 4854,1 6,7 -2,0
Gubici u rafinerijama Refinery losses 41,8 37,8 37,1 33,7 46,6 22,8 -51,1 -11,4
Ukupna proizvodnja rafinerija | Gross refinery output
Rafinerijski proizvodi Oil refinery products 5319,7 5138,9 4865,5 5311,9 4503,3 4831,3 7,3 -1,9
-ukapljeni plin -LPG 298,6 290,5 266,2 307,5 254,3 295,4 16,2 -0,2
-motorni benzin -motor gasoline 1226,3 1167,6 1083,0 1202,4 1000,9 1206,7 20,6 -0,3
-petrolej i MG -kerosene type yet fuel 92,1 99,3 69,7 96,5 97,1 93,7 -3,5 0,3
-dizelsko gorivo -diesel oil 1191,9 1080,9 1124,6 1286,4 1047,2 1220,2 16,5 0,5
-ekstralako loživo ulje -light fuel oil 549,0 522,2 440,1 390,1 349,6 268,4 -23,2 -13,3
-loživo ulje -fuel oil 1011,8 1159,6 1097,0 1180,4 1128,6 1065,9 -5,6 1,0
-primarni benzin -naphtha 212,1 176,5 170,2 187,9 129,0 138,3 7,2 -8,2
-bitumen -bitumen 217,2 180,7 215,9 189,5 169,1 107,1 -36,7 -13,2
-rafinerijski plin -refinery gas 263,8 241,1 210,4 217,4 154,5 200,2 29,6 -5,4
-ostali derivati -other products 256,9 220,5 188,4 253,8 173,0 235,4 36,1 -1,7
Izvor | Source: EIHP

118
ENERGIJA MMIXI I I NAFTA I DERIVATI NAFTE
Slika | Figure 3.3.1. Raspoloživa sirova nafta u Republici Hrvatskoj | Crude oil supply in the Republic of Croatia Izvor | Source: EIHP
Slika | Figure 3.3.2. Proizvodnja naftnih derivata u hrvatskim rafinerijama | Petroleum products production in Croatian oil refineries – Izvor | Source: EIHP
-1000
0
1000
2000
3000
4000
5000
6000
7000
8000
1988. 1990. 1995. 2000. 2005. 2009.
tisuć
e to
na |
thou
sand
met
ric to
ns
Proizvodnja | ProductionUvoz | Import
Izvoz | ExportSaldo skladišta | Stock change
Ukupna potrošnja | Energy supplied
0
1000
2000
3000
4000
5000
6000
7000
1988. 1990. 1995. 2000. 2005. 2009.
tisuć
e to
na |
thou
sand
met
ric to
ns
Ukapljeni plin | LPG
Motorni benzin | Motor gasoline
Petrolej i MG | Kerosene type jet fuel
Dizelsko gorivo | Diesel oil
Ekstralako loživo ulje | Extra light fuel oil
Loživo ulje | Fuel oil
Primarni benzin | Naphtha
Bitumen | Bitumen
Rafinerijski plin | Refinery gas
Ostali derivati | Other products

119
ENERGY MMIXI I I OIL AND OIL PRODUCTS
Tablica | Table 3.3.2. Naftni derivati | Petroleum products
2004. 2005. 2006. 2007. 2008. 2009. 2009/08. 2004-09.
tisuće tona Thousand metric tons %
UKUPNA PROIZVODNJA TOTAL PRODUCTION 5497,8 5313,2 5031,1 5468,6 4649,7 4971,0 6,9 -2,0
-Rafinerije -Petroleum refineries 5319,7 5138,9 4865,5 5311,9 4503,3 4831,3 7,3 -1,9
-Degazolinaža -NGL plant 178,1 174,3 165,6 156,7 146,4 139,7 -4,6 -4,7
Uvoz Import 1313,0 1518,6 1637,1 1728,5 2074,3 1250,8 -39,7 -1,0
Izvoz Export 2054,5 1869,4 1851,7 2020,2 1735,7 1866,5 7,5 -1,9
Saldo skladišta Stock change -102,8 -139,9 55,2 -74,7 -301,2 164,8 0,7
Bunker brodova International marine bunkers 23,6 25,5 19,7 24,5 21,7 7,0 -67,7 -21,6
Bruto raspoloživo Energy supplied 4629,9 4797,0 4852,0 5077,7 4665,4 4513,1 -3,3 -0,5
Potrošnja za pogon Energy sector own use 383,3 369,1 316,3 357,3 218,4 311,3 42,5 -4,1
-proizvodnja nafte i plina -oil and gas extraction 6,3 5,5 2,5 0,0 0,0 0,0
-elektroprivreda -electric energy supply industry 0,0 0,0 0,0 0,0 0,0 0,0
-rafinerije -petroleum refineries 377,0 363,6 313,8 357,3 218,4 311,3 42,5 -3,8
Energetske transformacije Total transformation sector 1040,3 1139,1 1129,3 1218,2 966,7 932,7 -3,5 -2,2
-termoelektrane -thermo power plants 253,7 287,0 312,4 425,5 332,7 306,4 -7,9 3,8
-javne toplane -public cogeneration plants 113,8 163,5 156,1 102,1 125,6 173,6 38,2 8,8
-javne kotlovnice -public heating plants 45,4 45,7 38,8 32,8 25,8 25,9 0,4 -10,6
-industrijske toplane -industrial cogeneration plants 289,8 283,0 288,4 241,1 213,9 231,3 8,1 -4,4
-industrijske kotlovnice -industrial heating plants 44,3 46,6 48,7 40,5 31,1 30,1 -3,2 -7,4
-rafinerije -petroleum refineries 282,2 301,7 272,8 366,9 232,9 163,8 -29,7 -10,3
-gradske plinare -gas works 11,1 11,6 12,1 9,3 4,7 1,6 -66,0 -32,1
Neenergetska potrošnja Non energy use 370,9 327,2 320,9 348,0 354,4 305,3 -13,9 -3,8
Neposredna potrošnja Final energy demand 2835,4 2961,6 3085,5 3154,2 3125,9 2963,8 -5,2 0,9
Industrija Industry 269,2 326,4 374,0 365,5 343,9 241,9 -29,7 -2,1
-željeza i čelika -iron and steel 5,8 8,3 6,5 9,9 7,8 3,6 -53,8 -9,1
-obojenih metala -non-ferrous metals 7,8 6,3 5,8 6,0 6,2 5,2 -16,1 -7,8
-stakla i nem. minerala -non-metallic minerals 9,2 8,8 11,3 11,6 1,1 2,6 136,4 -22,3
-kemijska -chemical 61,1 3,4 45,3 40,7 28,3 7,6 -73,1 -34,1
-građevnog materijala -construction materials 149,3 250,6 265,5 249,6 253,8 182,2 -28,2 4,1
-papira -pulp and paper 1,7 2,8 1,9 1,9 2,0 2,0 0,0 3,3
-prehrambena -food production 13,3 21,0 15,4 19,8 27,9 24,4 -12,5 12,9
-ostala -not elsewhere specified 21,0 25,2 22,3 26,0 16,8 14,3 -14,9 -7,4
Promet Transport 1736,0 1812,5 1923,2 2063,2 2050,0 2029,8 -1,0 3,2
-željeznički -rail 29,4 30,5 32,3 32,6 32,3 28,5 -11,8 -0,6
-cestovni -road 1571,6 1627,8 1734,6 1869,7 1835,1 1830,2 -0,3 3,1
-zračni -air 79,3 94,1 97,4 100,7 113,7 97,9 -13,9 4,3
-pomorski i riječni -sea and river 29,1 31,8 33,1 34,4 41,8 46,4 11,0 9,8
-javni gradski -public city 26,6 28,3 25,8 25,8 27,1 26,8 -1,1 0,1
Opća potrošnja Other sectors 830,2 822,7 788,3 725,5 732,0 692,1 -5,5 -3,6
-kućanstva -households 346,6 330,1 296,0 249,3 230,6 236,8 2,7 -7,3
-usluge -services 154,2 146,7 126,3 104,2 100,6 98,6 -2,0 -8,6
-poljoprivreda -agriculture 211,8 212,9 219,2 215,1 225,0 223,2 -0,8 1,1
-graditeljstvo -construction 117,6 133,0 146,8 156,9 175,8 133,5 -24,1 2,6
Izvor | Source: EIHP

120
ENERGIJA MMIXI I I NAFTA I DERIVATI NAFTE
Slika | Figure 3.3.3. Raspoloživi naftni derivati u Republici Hrvatskoj | Petroleum products supply in the Republic of Croatia – Izvor | Source: EIHP
Slika | Figure 3.3.4. Ukupna potrošnja naftnih derivata u Republici Hrvatskoj | Petroleum products consumption in the Republic of Croatia – Izvor | Source: EIHP
-3000
-2000
-1000
1000
0
2000
3000
4000
5000
6000
7000
8000
1988. 1990. 1995. 2000. 2005. 2009.
tisuć
e to
na |
thou
sand
met
ric to
ns
Proizvodnja rafinerija | Petroleum refineriesProizvodnja degazolinaže | NGL plantUvoz | Import
Izvoz | ExportSaldo skladišta | Stock changeBunker brodova | International marine bunkers
Ukupna potrošnja | Energy supplied
0
1000
2000
3000
4000
5000
1988. 1990. 1995. 2000. 2005. 2009.
tisuć
e to
na |
thou
sand
met
ric to
ns
Pogon energetike | Energy sector own use
Termoelektrane | Thermal power plants
Javne toplane | Public cogeneration plants
Ostale transformacije | Other transformations
Neenergetska potrošnja | Non energy use
Industrija | Industry
Promet | Transport
Opća potrošnja | Other sectors

121
ENERGY MMIXI I I OIL AND OIL PRODUCTS
Tablica | Table 3.3.3. Ukapljeni plin | LPG
2004. 2005. 2006. 2007. 2008. 2009. 2009/08. 2004-09.
tisuće tona Thousand metric tons %
UKUPNA PROIZVODNJA TOTAL PRODUCTION 375,9 364,2 335,1 372,4 316,9 354,6 11,9 -1,2
-Rafinerije -Petroleum refineries 298,6 290,5 266,2 307,5 254,3 295,4 16,2 -0,2
-Degazolinaža -NGL plant 77,3 73,7 68,9 64,9 62,6 59,2 -5,4 -5,2
Uvoz Import 7,6 3,4 2,2 2,0 9,4 16,5 75,5 16,8
Izvoz Export 249,2 226,6 171,6 198,8 133,6 185,6 38,9 -5,7
Saldo skladišta Stock change 0,2 -2,9 -2,3 -2,4 -1,7 -1,8
Bruto raspoloživo Energy supplied 134,5 138,1 163,4 173,2 191,0 183,7 -3,8 6,4
Potrošnja za pogon Energy sector own use 5,7 6,6 5,5 7,3
-proizvodnja nafte i plina -oil and gas extraction
-elektroprivreda -electric energy supply industry
-rafinerije -petroleum refineries 5,7 6,6 5,5 7,3
Energetske transformacije Total transformation sector 23,7 16,0 16,7 13,1 5,0 3,1 -38,0 -33,4
-javne kotlovnice -public heating plants
-industrijske toplane -industrial cogeneration plants 11,6 2,9 4,2 3,6
-industrijske kotlovnice -industrial heating plants 1,0 1,5 0,4 0,2 0,3 1,5 400,0 8,4
-gradske plinare -gas works 11,1 11,6 12,1 9,3 4,7 1,6 -66,0 -32,1
Neposredna potrošnja Final energy demand 105,1 115,5 141,2 152,8 186,0 180,6 -2,9 11,4
Industrija Industry 15,5 18,7 23,9 25,5 26,3 16,2 -38,4 0,9
-željeza i čelika -iron and steel 3,6 4,2 4,9 5,7 6,7 2,1 -68,7 -10,2
-obojenih metala -non-ferrous metals 1,8 2,1 2,6 2,7 2,9 2,7 -6,9 8,4
-stakla i nem. minerala -non-metallic minerals 2,1 2,2 2,2 2,2 0,8 0,5 -37,5 -25,0
-kemijska -chemical
-građevnog materijala -construction materials 3,8 4,6 7,1 8,9 9,1 5,4 -40,7 7,3
-papira -pulp and paper 0,1 0,1 0,1 0,1 0,1 0,1
-prehrambena -food production 0,2 0,7 3,0 1,0 1,5 1,1 -26,7 40,6
-ostala -not elsewhere specified 3,9 4,8 4,0 4,9 5,2 4,3 -17,3 2,0
Promet Transport 16,7 22,1 36,9 51,3 68,7 69,5 1,2 33,0
-željeznički -rail
-cestovni -road 16,7 22,1 36,9 51,3 68,7 69,5 1,2 33,0
-zračni -air
-pomorski i riječni -sea and river
-javni gradski -public city
Opća potrošnja Other sectors 72,9 74,7 80,4 76,0 91,0 94,9 4,3 5,4
-kućanstva -households 59,6 60,9 66,0 61,8 74,0 77,8 5,1 5,5
-usluge -services 8,1 8,5 9,3 9,0 10,4 11,9 14,4 8,0
-poljoprivreda -agriculture 2,7 2,7 2,8 2,7 2,8 2,8 0,7
-graditeljstvo -construction 2,5 2,6 2,3 2,5 3,8 2,4 -36,8 -0,8
Izvor | Source: EIHP

122
ENERGIJA MMIXI I I NAFTA I DERIVATI NAFTE
Slika | Figure 3.3.5. Raspoložive količine ukapljenog plina u Republici Hrvatskoj | LPG supply in the Republic of Croatia Izvor | Source: EIHP
Slika | Figure 3.3.6. Ukupna potrošnja ukapljenog plina u Republici Hrvatskoj | LPG consumption in the Republic of Croatia – Izvor | Source: EIHP
0
20
40
60
80
100
120
140
160
180
200
1988. 1990. 1995. 2000. 2005. 2009.
tisuć
e to
na |
thou
sand
met
ric to
ns
Pogon energetike | Energy sector own use
Energetske transformacije | Transformation sector
Industrija | Industry
Promet | Transport
Opća potrošnja | Other sectors
-300
-200
-100
0
100
200
300
400
1988. 1990. 1995. 2000. 2005. 2009.
tisuć
e to
na |
thou
sand
met
ric to
ns
Proizvodnja rafinerija | Petroleum refineriesProizvodnja degazolinaže | NGL plantUvoz | Import
Izvoz | ExportSaldo skladišta | Stock change
Ukupna potrošnja | Energy supplied

123
ENERGY MMIXI I I OIL AND OIL PRODUCTS
Tablica | Table 3.3.4. Motorni benzin | Motor gasoline
2004. 2005. 2006. 2007. 2008. 2009. 2009/08. 2004-09.
tisuće tona Thousand metric tons %
UKUPNA PROIZVODNJA TOTAL PRODUCTION 1226,3 1167,6 1083,0 1202,4 1000,9 1206,7 20,6 -0,3
Uvoz Import 137,0 257,1 307,0 255,0 288,2 221,1 -23,3 10,0
Izvoz Export 609,5 706,2 680,0 717,3 583,8 718,9 23,1 3,4
Saldo skladišta Stock change -30,1 -8,9 1,3 -14,8 -9,0 -16,6
Bruto raspoloživo Energy supplied 723,7 709,6 711,3 725,3 696,3 692,3 -0,6 -0,9
Neposredna potrošnja Final energy demand 723,7 709,6 711,3 725,3 696,3 692,3 -0,6 -0,9
Industrija - Industry 0,1 0,1 0,1 0,1
Promet Transport 709,8 694,6 695,5 709,5 679,8 676,7 -0,5 -1,0
-željeznički -rail
-cestovni -road 708,7 693,5 694,4 708,4 678,8 675,7 -0,5 -0,9
-zračni -air 1,1 1,1 1,1 1,1 1,0 1,0 -1,9
-pomorski i riječni -sea and river
-javni gradski -public city
Opća potrošnja Other sectors 13,9 15,0 15,7 15,7 16,4 15,5 -5,5 2,2
-kućanstva -households
-usluge -services
-poljoprivreda -agriculture 7,2 8,1 8,4 8,1 8,5 8,5 3,4
-graditeljstvo -construction 6,7 6,9 7,3 7,6 7,9 7,0 -11,4 0,9
Izvor | Source: EIHP
Slika | Figure 3.3.7. Raspoloživa količina motornog benzina u Republici Hrvatskoj | Motor gasoline supply in the Republic of Croatia – Izvor | Source: EIHP
1988. 1990. 1995. 2000. 2005. 2009.
Ukupna proizvodnja | Total production
Uvoz | Import
Izvoz | Export
Saldo skladišta | Stock change
Bruto rapoloživo | Energy supplied
-800
-600
-400
-200
0
200
400
600
800
1000
1200
1400
1600
tisuć
e to
na |
thou
sand
met
ric to
ns

124
ENERGIJA MMIXI I I NAFTA I DERIVATI NAFTE
Slika | Figure 3.3.8. Potrošnja motornog benzina u Republici Hrvatskoj | Motor gasoline consumption in the Republic of Croatia – Izvor | Source: EIHP
Tablica | Table 3.3.5. Mlazno gorivo i petrolej | Jet fuel and kerosene
2004. 2005. 2006. 2007. 2008. 2009. 2009/08. 2004-09.
tisuće tona Thousand metric tons %
UKUPNA PROIZVODNJA TOTAL PRODUCTION 92,1 99,3 69,7 96,5 97,1 93,7 -3,5 0,3
Uvoz Import 0,6 3,6 28,5 4,0 20,5 0,8 -96,1 5,9
Izvoz Export 9,5 2,2 3,4 0,2 0,6 0,8 33,3 -39,0
Saldo skladišta Stock change -4,2 -6,7 2,4 0,5 -3,2 4,1
Bruto raspoloživo Energy supplied 79,0 94,0 97,2 100,8 113,8 97,8 -14,1 4,4
Neposredna potrošnja Final energy demand 79,0 94,0 97,2 100,8 113,8 97,8 -14,1 4,4
Promet Transport 78,2 93,0 96,3 99,6 112,7 96,9 -14,0 4,4
-željeznički -rail
-cestovni -road
-zračni -air 78,2 93,0 96,3 99,6 112,7 96,9 -14,0 4,4
-pomorski i riječni -sea and river
-javni gradski -public city
Opća potrošnja Other sectors 0,8 1,0 0,9 1,2 1,1 0,9 -18,2 2,4
-kućanstva -households 0,8 1,0 0,9 1,2 1,1 0,9 -18,2 2,4
-usluge -services
-poljoprivreda -agriculture
-graditeljstvo -construction
Izvor | Source: EIHP
0
100
200
300
400
500
600
700
800
1988. 1990. 1995. 2000. 2005. 2009.
tisuć
e to
na |
thou
sand
met
ric to
ns
Industrija | Industry
Cestovni promet | Road transport
Ostali promet | Public city transport
Poljoprivreda | Agriculture Građevinarstvo | Construction

125
ENERGY MMIXI I I OIL AND OIL PRODUCTS
Slika | Figure 3.3.9. Raspoloživo mlazno gorivo i petrolej u Republici Hrvatskoj | Jet fuel and kerosene supply in the Republic of Croatia – Izvor | Source: EIHP
Slika | Figure 3.3.10. Potrošnja mlaznog goriva i petroleja u Republici Hrvatskoj | Jet fuel and kerosene consumption in the Republic of Croatia – Izvor | Source: EIHP
Ukupna proizvodnja | Total production
Uvoz | Import
Izvoz | Export
Saldo skladišta | Stock change
Bruto rapoloživo | Energy supplied
-100
-50
0
50
100
150
200
250
tisuć
e to
na |
thou
sand
met
ric to
ns
1988. 1990. 1995. 2000. 2005. 2009.
0
25
50
75
100
125
150
175
200
1988. 1990. 1995. 2000. 2005. 2009.
tisuć
e to
na |
thou
sand
met
ric to
ns
Pogon energetike | Energy sector own use
Industrija | Industry
Zračni promet | Transport
Ostali promet | Non-specified transport
Opća potrošnja | Other sectors

126
ENERGIJA MMIXI I I NAFTA I DERIVATI NAFTE
Tablica | Table 3.3.6. Dizelsko gorivo | Diesel fuel
2004. 2005. 2006. 2007. 2008. 2009. 2009/08. 2004-09.
tisuće tona Thousand metric tons %
UKUPNA PROIZVODNJA TOTAL PRODUCTION 1191,9 1080,9 1124,6 1286,4 1047,2 1220,2 16,5 0,5
Uvoz Import 423,2 502,9 615,5 653,5 1005,7 520,3 -48,3 4,2
Izvoz Export 367,2 253,9 282,0 403,5 431,6 245,3 -43,2 -7,8
Saldo skladišta Stock change -18,3 -9,3 -24,8 12,1 -64,5 18,2
Bunker brodova International marine bunkers 7,8 9,1 6,4 4,4 1,4 -29,1
Bruto raspoloživo Energy supplied 1221,8 1311,5 1426,9 1544,1 1556,8 1512,0 -2,9 4,4
Neposredna potrošnja Final energy demand 1221,8 1311,5 1426,9 1544,1 1556,8 1512,0 -2,9 4,4
Industrija Industry 11,6 15,1 19,2 21,7 27,7 19,6 -29,2
Promet Transport 931,3 1002,8 1094,5 1202,8 1187,3 1186,3 -0,1 5,0
-željeznički -rail 29,4 30,5 32,3 32,6 32,3 28,5 -11,8 -0,6
-cestovni -road 846,2 912,2 1003,3 1110,0 1087,6 1085,0 -0,2 5,1
-zračni -air
-pomorski i riječni -sea and river 29,1 31,8 33,1 34,4 40,3 46,0 14,1 9,6
-javni gradski -public city 26,6 28,3 25,8 25,8 27,1 26,8 -1,1 0,1
Opća potrošnja Other sectors 278,9 293,6 313,2 319,6 341,8 306,1 -10,4 1,9
-kućanstva -households
-usluge -services
-poljoprivreda -agriculture 183,1 183,0 189,0 185,5 192,6 192,4 -0,1 1,0
-graditeljstvo -construction 95,8 110,6 124,2 134,1 149,2 113,7 -23,8 3,5
Izvor | Source: EIHP

127
ENERGY MMIXI I I OIL AND OIL PRODUCTS
Slika | Figure 3.3.11. Raspoloživo dizelsko gorivo u Republici Hrvatskoj | Diesel fuel supply in the Republic of Croatia Izvor | Source: EIHP
Slika | Figure 3.3.12. Potrošnja dizelskog goriva u Republici Hrvatskoj | Diesel fuel consumption in the Republic of Croatia Izvor | Source: EIHP
Ukupna proizvodnja | Total productionUvoz | Import
Izvoz | ExportSaldo skladišta | Stock changeBunker brodova | International marine bunkersUkupna potrošnja | Energy supplied
-1000
-800
-600
-400
-200
0
200
400
600
800
1000
1200
1400
1600
1800
2000
1988. 1990. 1995. 2000. 2005. 2009.
tisuć
e to
na |
thou
sand
met
ric to
ns
0
200
400
600
800
1000
1200
1400
1600
1988. 1990. 1995. 2000. 2005. 2009.
tisuć
e to
na |
thou
sand
met
ric to
ns
Termoelektrane | Thermal power plants Industrija | IndustryCestovni promet | Road transport
Ostali promet | Public city transportPoljoprivreda | Agriculture Graditeljstvo | Construction

128
ENERGIJA MMIXI I I NAFTA I DERIVATI NAFTE
Tablica | Table 3.3.7. Ekstralako loživo ulje | Extra light fuel oil
2004. 2005. 2006. 2007. 2008. 2009. 2009/08. 2004-09.
tisuće tona Thousand metric tons %
UKUPNA PROIZVODNJA TOTAL PRODUCTION 549,0 522,2 440,1 390,1 349,6 268,4 -23,2 -13,3
Uvoz Import 47,9 39,8 69,9 67,0 57,7 64,6 12,0 6,2
Izvoz Export 127,9 95,0 112,0 109,7 101,6 56,7 -44,2 -15,0
Saldo skladišta Stock change 27,6 -0,5 -3,0 -14,7 1,0 1,9
Bruto raspoloživo Energy supplied 496,6 466,5 395,0 332,7 306,7 278,2 -9,3 -10,9
Potrošnja za pogon Energy sector own use 6,3 5,5 2,5 0,0 0,0 0,0 4,4
-proizvodnja nafte i plina -oil and gas extraction 6,3 5,5 2,5 0,0 0,0 0,0 4,4
-proizvodnja ugljena -coal mines 0,0 0,0 0,0 0,0 0,0 0,0
-elektroprivreda -electric energy supply industry 0,0 0,0 0,0 0,0 0,0 0,0 5,0
Energetske transformacije Total transformation sector 17,1 18,0 11,3 7,1 8,8 6,8 -22,7 -16,8
-termoelektrane -thermo power plants 2,2 3,0 1,1 1,6 1,1 1,6 45,5 -6,2
-javne toplane -public cogeneration plants 0,3 1,5 0,0 0,0 0,2 0,1 -50,0 -19,7
-javne kotlovnice -public heating plants 6,8 6,7 5,3 4,2 5,6 4,3 -23,2 -8,8
-industrijske toplane -industrial cogeneration plants 0,0 0,0 0,0 0,0 0,0 0,0 0,1
-industrijske kotlovnice -industrial heating plants 7,8 6,8 4,9 1,3 1,9 0,8 -57,9
Neposredna potrošnja Final energy demand 473,2 443,0 381,2 325,6 297,9 271,4 -8,9 -10,5
Industrija Industry 36,0 31,3 22,7 29,3 28,5 20,5 -28,1 -10,7
-željeza i čelika -iron and steel 1,8 2,5 1,3 1,2 0,8 1,2 50,0 -7,8
-obojenih metala -non-ferrous metals 3,4 0,2 0,5 0,3 0,4 0,2 -50,0 -43,3
-stakla i nem. minerala -non-metallic minerals 4,1 2,7 1,8 1,9 0,0 0,1 -52,4
-kemijska -chemical 0,7 0,5 0,6 0,5 0,6 0,3 -50,0 -15,6
-građevnog materijala -construction materials 7,6 6,9 6,3 6,1 7,1 4,1 -42,3 -11,6
-papira -pulp and paper 0,0 0,1 0,0 0,0 0,1 0,1 0,0
-prehrambena -food production 9,5 9,5 5,4 10,7 13,1 8,2 -37,4 -2,9
-ostala -not elsewhere specified 8,9 8,9 6,8 8,6 6,4 6,3 -1,6 -6,7
Opća potrošnja Other sectors 437,2 411,7 358,5 296,3 269,4 250,9 -6,9 -10,5
-kućanstva -households 270,9 252,8 218,5 177,7 151,0 147,3 -2,5 -11,5
-usluge -services 139,5 131,6 112,5 91,6 87,0 78,3 -10,0 -10,9
-poljoprivreda -agriculture 14,2 14,4 14,5 14,3 16,5 14,9 -9,7 1,0
-graditeljstvo -construction 12,6 12,9 13,0 12,7 14,9 10,4 -30,2 -3,8
Izvor | Source: EIHP

129
ENERGY MMIXI I I OIL AND OIL PRODUCTS
Slika | Figure 3.3.13. Raspoloživo ekstralako loživo ulje u Republici Hrvatskoj | Extra light fuel oil supply in the Republic of Croatia – Izvor | Source: EIHP
Slika | Figure 3.3.14. Potrošnja ekstralakog loživog ulja u Republici Hrvatskoj | Extra light fuel oil consumption in the Republic of Croatia – Izvor | Source: EIHP
Proizvodnja | Production
Uvoz | Import
Izvoz | Export
Saldo skladišta | Stock change
Ukupna potrošnja | Energy supplied
1988. 1990. 1995. 2000. 2005. 2009.-400
-300
-200
-100
0
100
200
300
400
500
600
700
800
tisuć
e to
na |
thou
sand
met
ric to
ns
1988. 1990. 1995. 2000. 2005. 2009.
Pogon energetike | Energy sector own use
Energetske transformacije | Transformation sector
Industrija | Industry
Promet | Transport
Opća potrošnja | Other sectors
0
50
100
150
200
250
300
350
400
450
500
550
tisuć
e to
na |
thou
sand
met
ric to
ns
Kućanstva | Households
Ostali potrošači | Not specified

130
ENERGIJA MMIXI I I NAFTA I DERIVATI NAFTE
Tablica | Table 3.3.8. Loživo ulje | Residual fuel oil
2004. 2005. 2006. 2007. 2008. 2009. 2009/08. 2004-09.
tisuće tona Thousand metric tons %
UKUPNA PROIZVODNJA TOTAL PRODUCTION 1011,8 1159,6 1097,0 1180,4 1128,6 1065,9 -5,6 1,0
Uvoz Import 213,6 85,0 118,0 96,8 73,2 74,9 2,3 -18,9
Izvoz Export 304,5 233,6 225,8 215,4 176,2 336,0 90,7 2,0
Saldo skladišta Stock change 14,3 -30,3 1,3 -46,6 -194,4 68,3
Bunker brodova International marine bunkers 15,8 16,4 13,3 20,1 21,7 5,6 -74,2 -18,7
Bruto raspoloživo Energy supplied 919,4 964,3 977,2 995,1 809,5 867,5 7,2 -1,2
Potrošnja za pogon Energy sector own use 66,2 70,8 58,1 82,4 33,0 47,6 44,2 -6,4
-rafinerije -petroleum refineries 66,2 70,8 58,1 82,4 33,0 47,6 44,2 -6,4
Energetske transformacije Total transformation sector 689,0 777,8 806,4 807,5 693,0 750,6 8,3 1,7
-termoelektrane -thermo power plants 251,5 284,0 311,3 423,9 331,6 304,8 -8,1 3,9
-javne toplane -public cogeneration plants 113,5 162,0 156,1 102,1 125,4 173,5 38,4 8,9
-javne kotlovnice -public heating plants 38,6 39,0 33,5 28,6 20,2 21,6 6,9 -11,0
-industrijske toplane -industrial cogeneration plants 249,9 254,5 262,1 213,9 186,9 222,9 19,3 -2,3
-industrijske kotlovnice -industrial heating plants 35,5 38,3 43,4 39,0 28,9 27,8 -3,8 -4,8
Neposredna potrošnja Final energy demand 164,2 115,7 112,7 105,2 83,5 69,3 -17,0 -15,8
Industrija Industry 137,7 89,0 93,1 88,5 69,7 45,1 -35,3 -20,0
-željeza i čelika -iron and steel 0,2 1,6 0,3 0,3 0,3 0,3 8,4
-obojenih metala -non-ferrous metals 2,6 4,0 2,7 3,0 2,9 2,3 -20,7 -2,4
-stakla i nem. minerala -non-metallic minerals 3,0 3,8 2,8 2,6 0,2 2,0 900,0 -7,8
-kemijska -chemical 59,3 2,2 43,6 40,2 27,7 7,3 -73,6 -34,2
-građevnog materijala -construction materials 59,2 52,5 27,3 26,9 18,3 12,6 -31,1 -26,6
-papira -pulp and paper 1,6 2,6 1,8 1,8 1,8 1,8 2,4
-prehrambena -food production 3,6 10,8 7,0 8,1 13,3 15,1 13,5 33,2
-ostala -not elsewhere specified 8,2 11,5 7,6 5,6 5,2 3,7 -28,8 -14,7
Promet Transport 1,5 0,4 -73,3
-željeznički -rail
-cestovni -road
-zračni -air
-pomorski i riječni -sea and river 1,5 0,4 -73,3
-javni gradski -public city
Opća potrošnja Other sectors 26,5 26,7 19,6 16,7 12,3 23,8 93,5 -2,1
-kućanstva -households 15,3 15,4 10,6 8,6 4,5 10,8 140,0 -6,7
-usluge -services 6,6 6,6 4,5 3,6 3,2 8,4 162,5 4,9
-poljoprivreda -agriculture 4,6 4,7 4,5 4,5 4,6 4,6
-graditeljstvo -construction
Izvor | Source: EIHP

131
ENERGY MMIXI I I OIL AND OIL PRODUCTS
Slika | Figure 3.3.15. Raspoloživo loživo ulje u Republici Hrvatskoj | Residual fuel oil supply in the Republic of Croatia Izvor | Source: EIHP
Slika | Figure 3.3.16. Potrošnja loživog ulja u Republici Hrvatskoj | Residual fuel oil consumption in the Republic of Croatia Izvor | Source: EIHP
1988. 1990. 1995. 2000. 2005. 2009.
Proizvodnja rafinerija | Oil refineries productionUvoz | Import
Izvoz | ExportSaldo skladišta | Stock changeBunker brodova | International marine bunkersUkupna potrošnja | Energy supplied
-600
-400
-200
0
200
400
600
800
1000
1200
1400
1600
1800
2000
2200
tisuć
e to
na |
thou
sand
met
ric to
ns
Pogon energetike | Energy sector own use
Termoelektrane | Thermal power plants
Industrija | Industry
Promet | Transport
Opća potrošnja | Other sectorsJavne toplane | Public cogeneration plants
0
200
400
600
800
1000
1200
1400
1600
1800
1988. 1990. 1995. 2000. 2005. 2009.
tisuć
e to
na |
thou
sand
met
ric to
ns
Ostale transformacije | Other transformations

132
ENERGIJA MMIXI I I NAFTA I DERIVATI NAFTE
Tablica | Table 3.3.9. Ostali naftni derivati | Non specified petroleum products
2004. 2005. 2006. 2007. 2008. 2009. 2009/08. 2004-09.
tisuće tona Thousand metric tons %
UKUPNA PROIZVODNJA TOTAL PRODUCTION 1050,8 919,4 881,6 940,4 709,4 761,5 7,3 -6,2
-Rafinerije -Petroleum refineries 950,0 818,8 784,9 848,6 625,6 681,0 8,9 -6,4
-Degazolinaža -NGL plant 100,8 100,6 96,7 91,8 83,8 80,5 -3,9 -4,4
Uvoz Import 483,1 626,8 496,0 650,2 619,6 352,6 -43,1 -6,1
Izvoz Export 386,7 351,9 376,9 375,3 308,3 323,2 4,8 -3,5
Saldo skladišta Stock change -92,3 -81,3 80,3 -8,8 -29,4 90,7
Bruto raspoloživo Energy supplied 1054,9 1113,0 1081,0 1206,5 991,3 881,6 -11,1 -3,5
Potrošnja za pogon Energy sector own use 305,1 286,2 250,2 267,6 185,4 263,7 42,2 -2,9
-rafinerije -petroleum refineries 305,1 286,2 250,2 267,6 185,4 263,7 42,2 -2,9
Energetske Total transformation sector 310,5 327,3 294,9 390,5 259,9 172,2 -33,7 -11,1
-industrijske toplane -industrial cogeneration plants 28,3 25,6 22,1 23,6 27,0 8,4 -68,9 -21,6
-rafinerije -petroleum refineries 282,2 301,7 272,8 366,9 232,9 163,8 -29,7
Neenergetska potrošnja Non energy use 370,9 327,2 320,9 348,0 354,4 305,3 -13,9 -3,8
Neposredna potrošnja Final energy demand 68,4 172,3 215,0 200,4 191,6 140,4 -26,7 15,5
Industrija Industry 68,4 172,3 215,0 200,4 191,6 140,4 -26,7 15,5
-željeza i čelika -iron and steel 0,2 2,7
-obojenih metala -non-ferrous metals
-stakla i nem. minerala -non-metallic minerals 4,4 4,6
-kemijska -chemical 1,1 0,7 1,1
-građevnog materijala -construction materials 67,1 171,6 205,6 186,2 191,6 140,4 -26,7 15,9
-papira -pulp and paper
-prehrambena -food production
-ostala -not elsewhere specified 3,9 6,9
Izvor | Source: EIHP

133
ENERGY MMIXI I I OIL AND OIL PRODUCTS
Slika | Figure 3.3.17. Ostali naftni derivati raspoloživi u Republici Hrvatskoj | Non specified petroleum products supply in the Republic of Croatia – Izvor | Source: EIHP
Slika | Figure 3.3.18. Potrošnja ostalih naftnih derivata u Republici Hrvatskoj | Non specified petroleum products consumption in the Republic of Croatia – Izvor | Source: EIHP
-900
-600
-300
0
300
600
900
1200
1500
1800
1988. 1990. 1995. 2000. 2005. 2009.
tisuć
e to
na |
thou
sand
met
ric to
ns
Proizvodnja rafinerija | Petroleum refineriesProizvodnja degazolinaže | NGL plantUvoz | Import
Izvoz | ExportSaldo skladišta | Stock change
Ukupna potrošnja | Energy supplied
0
100
200
300
400
500
600
700
800
900
1000
1100
1200
1300
1988. 1990. 1995. 2000. 2005. 2009.
tisuć
e to
na |
thou
sand
met
ric to
ns
Pogon energetike | Energy sector own use
Energetske transformacije | Energy transformations
Neenergetska potrošnja | Non energy use
Industrija | Industry
Promet | Transport
Opća potrošnja | Other sectors

134
ENERGIJA MMIXI I I NAFTA I DERIVATI NAFTE
3.4. Energetski subjekti
U kategoriji proizvodnje naftnih derivata energetski subjekti u 2009. godini bili su INA-INDUSTRIJA NAFTE d.d. i MODIBIT d.o.o. U kategoriji transporta nafte naftovodima i drugim oblicima transporta energetski subjekti bili su JADRANSKI NAFTOVOD d.d. i HRVATSKE ŽELJEZNICE d.o.o. U kategoriji transporta naftnih derivata produktovodima i drugim oblicima transporta prisutni su bili JADRANSKI POMORSKI SERVIS d.d, HRVATSKE ŽELJEZNICE d.o.o. i DINAMARIN d.o.o.
Do kraja 2009. godine je u kategoriji transporta nafte, naftnih derivata i biogoriva cestovnim vozilima dozvolu za obavljanje energetske djelatnosti od Hrvatske energetske regulatorne agencije dobila ukupno 121 tvrtka.
Dozvolu za obavljanje energetske djelatnosti trgovine na veliko naftnim derivatima je do kraja 2009. godine ishodilo ukupno 19 tvrtki: INA-INDUSTRIJA NAFTE d.d, TIFON d.o.o, PETROL HRVATSKA d.o.o, OMV HRVATSKA d.o.o, ANTUNOVIĆ TA d.o.o, OG ADRIATIC d.o.o, NAUTICA VUKOVAR d.o.o, SIROVINA BENZ d.o.o, CROBENZ d.d, MODIBIT d.o.o, TANKERKOMERC d.o.o, EURO-PETROL d.o.o, INA-OSIJEK PETROL d.d, LUKOIL Croatia d.o.o, LUKA PLOČE - TRGOVINA d.o.o, MS PROMET d.o.o, VELIS d.o.o, NAFTA CENTAR d.o.o. i Hrvatska agencija za obvezne zalihe nafte i naftnih derivata.
Dozvolu za obavljanje energetske djelatnosti skladištenja nafte i naftnih derivata je do kraja 2009. godine ishodilo ukupno 23 tvrtke: TANKERKOMERC d.d, JADRANSKI NAFTOVOD d.d, TIFON d.o.o, NAFTNI TERMINALI FEDERACIJE d.o.o, MAZIVA-ZAGREB d.o.o, NAUTICA VUKOVAR d.o.o, GRIČ PETROL d.o.o, EURO-PETROL d.o.o, ANTUNOVIĆ TA d.o.o, CROBENZ d.d, LUKA PLOČE - TRGOVINA d.o.o, INA-INDUSTRIJA NAFTE d.d, MODIBIT d.o.o, TERMINAL SLAVONSKI BROD d.o.o, DIOKI Organska petrokemija d.d, KEPOL TERMINAL d.o.o, PROPLIN d.o.o., BUTAN PLIN d.o.o. TERMINAL DUNAV d.o.o, SIROVINA BENZ d.o.o, BRALA TRADE d.o.o, JADRANPLIN d.o.o. i CRODUX PLIN d.o.o.
Dozvolu za trgovinu na veliko i malo ukapljenim naftnim plinom (UNP) su do kraja 2009. godine dobile ukupno četiri tvrtke: PROPLIN d.o.o, INA-INDUSTRIJA NAFTE d.d, CROBENZ d.d. i MODIBIT d.o.o.
Dozvolu za trgovinu na veliko ukapljenim naftnim plinom (UNP) je do kraja 2009. godine dobilo ukupno pet tvrtki: BUTAN PLIN d.o.o., BRALA TRADE d.o.o., JADRANPLIN d.o.o., ZAGREBAČKI PROMETNI ZAVOD d.o.o. i CRODUX PLIN d.o.o.
3.4 Energy Companies
In the production of oil products the energy companies in 2009 were INA-INDUSTRIJA NAFTE and MODIBIT. In the transport of oil and oil products by pipelines and other means of transport two parties were involved: JADRANSKI NAFTOVOD (Adriatic Pipeline) and HRVATSKE ŽELJEZNICE (Croatian Railways). As far as the transport of oil products by product pipelines and other means of transport is concerned, the players are JADRANSKI POMORSKI SERVIS, HRVATSKE ŽELJEZNICE (Croatian Railways) and DINAMARIN.
In the category of road transport of crude oil, oil products and liquid biofuels, the Croatian Energy Regulatory Council had issued 121 licenses by the end of 2009.
By the end of 2009, the oil products wholesale license had been obtained by 19 companies: INA – INDUSTRIJA NAFTE, TIFON, PETROL HRVATSKA, OMV HRVATSKA, ANTUNOVIĆ TA, OG ADRIATIC, NAUTICA VUKOVAR, SIROVINA BENZ, CROBENZ, MODIBIT, TANKERKOMERC, EURO-PETROL, INA-OSIJEK PETROL, LUKOIL Croatia, LUKA PLOČE – TRGOVINA, MS PROMET, VELIS, NAFTA CENTAR and Hrvatska agen-cija za obvezne zalihe nafte i naftnih derivata (Croatian Compulsory Oil Stocks Agency).
By the end of 2009 the license for oil and oil products stora-ge had been obtained by 23 companies: TANKERKOMERC, JADRANSKI NAFTOVOD, TIFON, NAFTNI TERMINALI FEDERACIJE, MAZIVA-ZAGREB, NAUTICA VUKOVAR, GRIČ PETROL, EURO-PETROL, ANTUNOVIĆ TA, CROBENZ, LUKA PLOČE - TRGOVINA, INA-INDUSTRIJA NAFTE, MODIBIT, TERMINAL SLAVONSKI BROD, DIOKI Organska petrokemi-ja, KEPOL TERMINAL, PROPLIN, BUTAN PLIN, TERMINAL DUNAV, SIROVINA BENZ, BRALA TRADE, JADRANPLIN and CRODUX PLIN.
The license for LPG wholesale and retail sale had been obtained by 4 companies by the end of 2009: PROPLIN, INA-INDUSTRIJA NAFTE, CROBENZ and MODIBIT.
The license for LPG wholesale had been obtained by 5 com-panies by the end of 2009: BUTAN PLIN, BRALA TRADE, JADRANPLIN, ZAGREBAČKI PROMETNI ZAVOD and CRODUX PLIN.

135
ENERGY MMIXI I I OIL AND OIL PRODUCTS
3.5. Cijene naftnih derivata
Slika | Figure 3.5.1. Kretanje maloprodajnih cijena naftnih derivata od 1998. do 2009. godine| Changes in petroleum product retail prices from 1998 to 2009 – Izvor | Source: INA, EIHP
Tablica | Table 3.5.1. Maloprodajne cijene naftnih derivata (kn/l) – godišnji prosjek | Petroleum product retail prices (HRK/l) – annual average
god. | Yr. BMB 95 BMB 98 BMB EURO 95 DG-EURO DG DG-PLAVI LUEL
1998. 3,86 4,00 - - 3,50 - 2,11
1999. 4,03 4,19 - - 3,66 - 2,10
2000. 5,76 5,96 - - 4,78 2,76 2,64
2001, 6,32 6,85 - - 5,20 3,01 3,14
2002, 6,40 6,73 - 5,36 5,19 2,56 2,71
2003, 6,44 6,66 - 5,44 5,24 2,56 2,77
2004, 6,94 7,14 - 6,00 5,89 3,08 3,29
2005, 7,40 7,72 - 6,96 6,78 4,02 4,17
2006, 7,63 8,24 7,88 7,26 7,11 4,21 4,70
2007, 7,72 8,16 7,92 7,40 7,27 4,24 4,66
2008, 8,25 8,58 8,48 8,63 8,5 5,05 5,83
2009. 7,21 7,38 7,33 6,79 6,65 3,68 4,08
Izvor | Source: INA, EIHP
3.5 Petroleum Product Prices
1,50
2,50
3,50
4,50
5,50
6,50
7,50
8,50
1998. 1999. 2000. 2001. 2002. 2003. 2004. 2005. 2006. 2007. 2008. 2009.
kn/l
BMB 98 Bezolovni motorni benzin | Unleaded Motor Gasoline
BMB EURO 95 Bezolovni motorni benzin Eurosuper | Unleaded Motor Gasoline
BMB 95 Bezolovni motorni benzin | Unleaded Motor Gasoline
DG-EURO Dizelsko gorivo Eurodizel | EurodieselDG Dizelsko gorivo | Diesel
DG-PLAVI Dizelsko gorivo Plavi | Eurodiesel for Agriculture
LUEL Ekstralako loživo ulje | Light Fuel Oil for Households


PRIRODNI PLIN NATURAL GAS
IVIV


139
ENERGY MMIXIV NATURAL GAS
4.1. Rezerve
Tablica | Table 4.1.1. Bilančne rezerve i proizvodnja prirodnog plina | Natural gas reserves and production
Prirodni plin (u 106 m3)Natural Gas (in 106 m3)
1990. 1995. 2000. 2005. 2006. 2007. 2008. 2009.
RezerveReserves
48 475,3 38 878,8 29 204,5 30 358,6 30 110,5 40 919,7 36 436,1 34 500,2
ProizvodnjaProduction
1 982,3 1 966,4 1 658,5 2 283,4 2 713,5 2 892,1 2729,4 2704,8
Izvor | Source: Ministarstvo gospodarstva, rada i poduzetništva | Ministry of economy, labour and entrepreneurship, EIHP
4.2. Kapaciteti plinskog sustava i mreže
4.2.1. Proizvodnja i prerada
Prirodni plin se proizvodi iz 17 plinskih polja Panona i 6 plin-skih polja Jadrana čime se podmiruje 64,2 posto domaćih potreba. Najveći dio plina iz Panona dolazi iz ležišta Molve i Kalinovac uz koja su izgrađena postrojenja za preradu i pri-premu plina za transport - Centralne plinske stanice Molve I, II i III. Njihovi kapaciteti prerade prikazani su u tablici 4.2.1.
4.1. Reserves
4.2. Gas Sector Capacities and Networks
4.2.1. Production and processing
Natural gas is produced from 17 on-shore and 6 off-shore gas fields meeting 64.2 percent of total domestic demand. The lar-gest share of gas produced in Panon area is coming from the fields Molve and Kalinovac. They include the units for processing and preparation of gas for transportation - Central gas stations Molve I, II and III. Their capacities are shown in the Table 4.2.1.
Tablica | Table 4.2.1. Proizvodni kapaciteti centralnih plinskih stanica | Production capacities of the central gas stations
Centralna plinska stanicaCentral gas station
Instalirani kapaciteti (106 m3/dan)Installed capacities (106 m3/day
Molve I 1
Molve II 3
Molve III 5
Ukupno | Total 9
Izvor | Source: INA
4.2.2. Transport
Transport prirodnog plina je regulirana energetska djelatnost koja se obavlja kao javna usluga i predstavlja osnovnu dje-latnost tvrtke Plinacro d.o.o., Zagreb koja je vlasnik i operator plinskoga transportnoga sustava. Tvrtka Plinacro je u potpu-nosti u vlasništvu Republike Hrvatske.
4.2.2. Transportation
Natural gas transportation is a regulated energy activity per-formed as a public service and represents the primary activity of the company Plinacro Ltd., which is the owner and opera-tor of the gas transport system. Plinacro is fully owned by the Republic of Croatia.

140
ENERGIJA MMIXIV PRIRODNI PLIN
U 2009. godini sustavom je transportirano 3,148 milijardi m3 prirodnog plina, od čega 2,777 milijardi m3 od ulaza u transportni sustav do izlaznih mjerno-redukcijskih stanica te ostatak od 370 milijuna m3 do podzemnog skladišta plina Okoli. Transport prirodnog plina u vršnoj potrošnji iznosio je u prosjeku 630 000 m3/h, dok je maksimalna ostvarena predaja plina iznosila 790 000 m3/h.
In 2009, 3.148 billion m3 of natural gas were transported, of which 2.777 billion m3 from entry to exit measuring-reduction stations, and 370 million m3 to the underground storage Okoli. During the peak demand periods the quantities of approximately 630 000 m3/h were transported, while the maximum quantities of 790 000 m3/h were delivered to customers.
Slika | Figure 4.2.1. Struktura transportiranih količina prirodnog plina prema izlaznim mjerno-redukcijskim stanicama (IMRS) tijekom 2009. godine | Structure of transported natural gas volumes per exit measuring- reduction stations (EMRS) per month in 2009 – Izvor | Source: PLINACRO
Transportni sustav obuhvaća 2 113 km plinovoda, 154 mjesta isporuke plina s 257 mjernih linija te 19 mjesta ulaza u sustav. Tijekom 2009. godine na transportni je sustav priključena mjerno-redukcijska stanica Pula. Transportni sustav omoguću-je predaju plina na području 16 županija.
The natural gas transport system comprises 2 113 km of pipe-lines, 154 exit measuring-reduction stations with 257 measu-ring lines and 19 entry measuring stations. New measuring-reduction station Pula was attached to the transport system in 2009. The whole system transmits gas in 16 Counties.
0
50000
100000
150000
200000
250000
300000
350000
400000
I II III IV V VI VII VIII IX X XI XII
količ
ina
| vo
lum
es (×
103 m
3 /h)
IMRS za kupce na distribucijskom sustavu | EMRS for customers on distribution system
IMRS za kupce na transportnom sustavu | EMRS for customers on transmission system
IMRS za podzemno skladište plina Okoli | EMRS for underground gas storage Okoli

141
ENERGY MMIXIV NATURAL GAS
Slika | Figure 4.2.2. Struktura transportiranih količina prirodnog plina po županijama tijekom 2009. godine | Structure of transported natural gas volumes per County in 2009 – Izvor | Source: PLINACRO
Tablica | Table 4.2.2. Promjeri i duljine transportnih plinovoda u Republici Hrvatskoj | Diameters and lengths of transportation pipelines in the Republic of Croatia
DN (mm) 700 600 500 450 400 350 300 250 200 150 <150Ukupno
Total
L (km) 53 175 592 95 122 62 367 76 129 337 105 2 113
Izvor | Source: PLINACRO
Tablica | Table 4.2.3. Kategorizacija transportnih plinovoda u Republici Hrvatskoj | Categorization of transportation pipelines in the Republic of Croatia
Transportni plinovodiTransportation gas pipelines
Međunarodni
International
Magistralni
Main transmission lines
Regionalni
Regional
Spojni
Local linking linesUkupno
Total
DuljinaLenght (km)
35 1 191 647 240 2 113
Izvor | Source: PLINACRO
Vukovarsko-srijemska 3,33%
Karlovačka 0,53%
Istarska 0,20%
Brodsko-posavska 1,87%
Primorsko-goranska 1,10%
Požeško-slavonska 0,80%
Osječko-baranjska 7,90%
Sisačko-moslavačka 27,13%
Koprivničko-križevačka 2,49%
Međimurska 2,58%Bjelovarsko-bilogorska 2,70%
Varaždinska 4,33%
Krapinsko-zagorska 4,63%
Zagrebačka i Grad Zagreb 37,95%
Virovitičko-podravska 2,45%

142
ENERGIJA MMIXIV PRIRODNI PLIN
4.2.3. Skladištenje
Skladište plina Okoli u sastavu je tvrtke Podzemno skladište plina d.o.o. koje je od 01. svibnja 2009. u vlasništvu tvrtke Plinacro koja je preuzela upravljanje i organizaciju djelatno-sti skladištenja prirodnog plina. Projektirani radni obujam podzemnog skladišta plina Okoli iznosi 553 milijuna m3. Maksimalni kapacitet utiskivanja iznosi 3,8 milijuna m3/dan, a maksimalni kapacitet crpljenja 5,8 milijuna m3/dan.
1. siječnja 2009. godine na snagu je stupio Tarifni sustav za skladištenje prirodnog plina, bez visine tarifnih stavki (NN 151/2008) kojim je opisana metodologija za utvrđivanje tarifnih stavki za skladištenje prirodnog plina, a dužni su ga primjenjivati energetski subjekti koji obavljaju energetsku dje-latnost skladištenja prirodnog plina. Metodologija ovog tarif-nog sustava zasniva se na opravdanim troškovima poslovanja,
4.2.3. Storage
The underground gas storage Okoli is a part of the company Podzemno skladište plina, Ltd. which is from May 1st 2009 owned by Plinacro that took over management and organi-sation of natural gas storage activities. Designed capacity of underground gas storage is 558 million m3. Maximum injection capacity is 3.8 million m3/day and the maximum withdrawal capacity is 5.8 million m3/day.
January 1st 2009 Tariff system for the storage of natural gas, without tariff items (Official Gazette 151/2008) which descri-bes a methodology for determination of tariff items for storage of natural gas, entered into force. Energy entities engaged in energy storage business of natural gas are obliged to apply the Tariff system. The methodology of the Tariff system is based
Slika | Figure 4.2.3. Plinski transportni sustav u Republici Hrvatskoj | Transport system of natural gas in the Republic of Croatia – Izvor | Source: PLINACRO
Postojeći plinovodni sustav | Existing pipelines 75 bar
50 bar
Plinovodi u izgradnji | Pipelines in construction
Planirani plinovodi | Planned pipelines
Objekti | Objects mjesta ulaza | enter point
PSP Okoli | UGS Okoli
mjesta izlaza | exit point

143
ENERGY MMIXIV NATURAL GAS
održavanja, zamjene, izgradnje ili rekonstrukcije objekata i zaštite okoliša, uključujući razuman rok povrata sredstava od investicija u sustav skladišta plina. U ovom tarifnom sustavu primjenjuje se metoda regulacije, odnosno metoda priznatih troškova poslovanja.
Od 1. studenoga 2009. na snagu su stupila i Pravila korište-nja sustava skladišta plina (NN 50/2009) kojima su uređeni tehnički uvjeti za pogon, vođenje i razvoj sustava skladišta plina, povezivanje s ostalim dijelovima plinskog sustava, priključenje na transportni sustav te mjerna pravila pri skladi-štenju plina.
4.2.4. Distribucija
U Hrvatskoj je u 2009. godini poslovalo 38 tvrtki koje su se bavile distribucijom prirodnog plina te jedna tvrtka (Plinara d.o.o., Pula) koja se bavila distribucijom prirodnog plina, gradskog plina i isparenog UNP-a. Duljina distribucijske plin-ske mreže za plin iznosi 17 666 km.
on reasonable business expenses, maintenance, replacement, construction or reconstruction of facilities and environmental protection, including a reasonable rate of return of investments in gas storage system. This tariff system applies the method of regulation, and method of recognized operating costs.
2009 The Rules of using a gas storage system (Official Gazette 50/09) which have entered into force November 1st regulate the technical conditions for operation, management and sto-rage system development, linking with other parts of the gas system, the connection to the transmission system and mea-suring rules for gas storage.
4.2.4. Distribution
There are 38 companies for distribution of natural gas in the Republic of Croatia, and one company for distribution of natu-ral gas, town gas and evaporated LPG (Plinara, Pula), making altogether 39 distribution companies. Total gas distribution network in Croatia is 17 666 km long.
Tablica | Table 4.2.4. Duljina distribucijske plinske mreže u Republici Hrvatskoj (1995.-2009.) | Distribution pipeline length in the Republic of Croatia (1995-2009)
Distribucijski plinovodiDistribution gas pipelines
1995. 1996. 1997. 1998. 1999. 2000. 2001. 2002.
DuljinaLenght (km)
7 190 8 980 10 850 12 220 13 340 14 366 14 366 14 515
4.2.5. Opskrba
Dozvolu za obavljanje djelatnosti opskrbe plinom do kraja 2009. godine ishodilo je 45 tvrtki.
Uredbom o sigurnosti opskrbe prirodnim plinom (NN 112/2008) određene su mjere za osiguranje pouzdane i učinkovite opskrbe prirodnim plinom kao i kriteriji i način određivanja dovoljne količine prirodnog plina za osiguranje pouzdane opskrbe zaštićenih kupaca, redoslijed smanjenja ili obustave opskrbe prirodnim plinom pojedinim kategorijama kupaca u slučaju kriznog stanja te sadržaj izvješća opskrblji-vača plinom o sigurnosti opskrbe prirodnim plinom.
4.2.5. Supply
By the end of 2009, 45 companies obtained natural gas supply licence.
The Regulation regarding the security of supply of natural gas (Official Gazette 112/08) defines measures to secure reliable and effective supply of natural gas as well as the criteria and a method of assigning sufficient amounts of natural gas for secure supply to protected customers, order of decrease or suspending of supply to particular customer categories in the event of crisis, and contents of supplier’s report on the securi-ty of supply of natural gas.
Distribucijski plinovodiDistribution gas pipelines
2003. 2004. 2005. 2006. 2007. 2008. 2009.
DuljinaLenght (km)
14 984 15 531 16 219 16 541 17 184 17 581 17 666
Izvor | Source: PLINACRO

144
ENERGIJA MMIXIV PRIRODNI PLIN
4.3. Energetska bilanca prirodnog plina
Tablica | Table 4.3.1. Prirodni plin | Natural gas
2004. 2005. 2006. 2007. 2008. 2009. 2009/08. 2004-09.
milijuna m3 Millon cubic meters %
Proizvodnja Production 2198,1 2283,4 2713,5 2892,1 2729,4 2704,8 -0,9 4,2
Uvoz Import 1053,6 1134,1 1126,5 1055,1 1226,8 1044,2 -14,9 -0,2
Izvoz Export 347,6 446,6 895,6 751,7 695,9 804,9 15,7 18,3
Saldo skladišta Stock change 105,2 -61,0 -66,6 111,2 -55,2 15,3
Ukupna potrošnja Energy supplied 3009,3 2909,9 2877,8 3306,7 3205,1 2959,4 -7,7 -0,3
Potrošnja za pogon Energy sector own use 70,2 107,9 91,5 149,7 115,3 157,8 36,9 17,6
-proizvodnja nafte i plina -oil and gas extraction 56,1 98,7 85,7 133,1 55,3 128,9 133,1 18,1
-rafinerije -oil refineries 0,3 1,2 0,4 12,4 54,0 18,2 -66,3
-degazolinaža -NGL plant 13,8 8,0 5,4 4,2 6,0 10,7 78,3 -5,0
Energet. transformacije Total transformation sector 1206,7 988,2 1032,5 1414,1 1227,1 1071,8 -12,7 -2,3
-termoelektrane -thermo power plants 130,4 36,3 118,1 301,0 151,3 143,7 -5,0 2,0
-javne toplane -public cogeneration plants 581,0 479,0 458,7 572,6 540,3 472,2 -12,6 -4,1
-javne kotlovnice -public heating plants 64,3 71,3 62,1 66,3 75,5 74,2 -1,7 2,9
-industrijske toplane -industrial cogenerat. plants 287,8 286,1 271,4 329,1 340,6 298,5 -12,4 0,7
-industrijske kotlovnice -industrial heating plants 104,8 83,3 91,2 88,4 86,2 69,6 -19,3 -7,9
-rafinerije - petroleum refineries 0,0 0,0 0,0 32,5 16,3 0,0 -100,0
-gradske plinare - gas works 0,0 0,0 0,0 0,0 0,0 3,7
-degazolinaža -NGL-plant 38,4 32,2 31,0 24,2 16,9 9,9 -41,4 -23,7
Neenergetska potrošnja Non energy use 484,7 478,1 462,9 507,8 505,8 419,6 -17,0 -2,8
Gubici Losses 74,9 61,9 65,3 51,1 49,5 51,6 4,2 -7,2
Neposredna potrošnja Final energy demand 1172,8 1273,8 1225,6 1184,0 1307,4 1258,6 -3,7 1,4
Industrija Industry 385,5 411,6 408,0 399,4 447,7 375,6 -16,1 -0,5
-željeza i čelika -iron and steel 19,1 20,1 27,2 27,3 33,5 29,1 -13,1 8,8
-obojenih metala -non-ferrous metals 1,8 1,0 0,3 1,7 1,2 1,2 0,0 -7,8
-stakla i nem. minerala -non-metallic minerals 67,9 70,9 61,0 61,1 49,3 50,5 2,4 -5,7
-kemijska -chemical 76,7 79,1 69,1 72,5 67,6 77,9 15,2 0,3
-građevnog materijala -construction materials 119,8 124,2 118,3 129,4 138,3 98,1 -29,1 -3,9
-papira -pulp and paper 1,7 2,1 6,3 6,4 5,7 6,5 14,0 30,8
-prehrambena -food production 56,4 62,6 71,9 51,4 104,4 70,2 -32,8 4,5
-ostala -not elsewhere specified 42,1 51,6 53,9 49,6 47,7 42,1 -11,7 0,0
Promet Transport 1,4
-cestovni -road 1,4
Opća potrošnja Other sectors 787,3 862,2 817,6 784,6 859,7 881,6 2,5 2,3
-kućanstva -households 629,5 687,8 651,7 622,5 682,7 699,5 2,5 2,1
-usluge -services 138,4 151,2 147,0 144,2 156,2 162,5 4,0 3,3
-poljoprivreda -agriculture 19,4 23,2 18,9 17,9 20,8 19,6 -5,8 0,2
Izvor | Source: EIHP

145
ENERGY MMIXIV NATURAL GAS
Slika | Figure 4.3.1. Raspoložive količine prirodnog plina u Republici Hrvatskoj | Natural gas supply in the Republic of Croatia – Izvor | Source: PLINACRO
Slika | Figure 4.3.2. Struktura potrošnje prirodnog plina u Republici Hrvatskoj | Natural gas consumption in the Republic of Croatia – Izvor | Source: PLINACRO
Proizvodnja | Production
Uvoz | Import
Izvoz | Export
Saldo skladišta | Stock change
Ukupna potrošnja | Energy supplied
1988. 1990. 1995. 2000. 2005. 2009.-1000
-500
0
500
1000
1500
2000
2500
3000
3500
4000
4500
milij
uni m
3 | m
illion
cub
ic m
eter
s
0
500
1000
1500
2000
2500
3000
3500
1988. 1990. 1995. 2000. 2005. 2009.
Gubici | LossesPotrošnja za pogon | Energy sector own useTermoelektrane | Thermal power plants Javne toplane | Public cogeneration plants Ostale transformacije | Other Transformations
Neenergetska potrošnja | Non energy useIndustrija | IndustryKućanstva | Households Ostali potrošači | Not specified
milij
uni m
3 | m
illion
cub
ic m
eter
s

146
ENERGIJA MMIXIV PRIRODNI PLIN
4.4. Energetski subjekti
Dozvolu za obavljanje djelatnosti dobave prirodnog plina imaju tvrtke INA Industrija nafte d.d., Zagreb i Prirodni plin d.o.o., Zagreb. Dozvole su izdane na 15 godina. Za skladištenje pri-rodnog plina registrirane su INA Industrija nafte d.d., Zagreb i Podzemno skladište plina d.o.o., Zagreb, obje na 5 godina. Dozvolu za obavljanje djelatnosti transporta prirodnog plina u Republici Hrvatskoj od 2003. godine ima tvrtka Plinacro d.o.o., Zagreb, a izdana je za razdoblje od 15 godina. Zakonom o izmjenama i dopunama Zakona o tržištu plina („Narodne novine“, broj 152/2008) definirane su i nove djelatnosti u području plinskog tržišta: organizacija tržišta plina i trgovina plinom. Za organizaciju tržišta plina dozvolu je u 2009. godini dobila tvrtka Hrvatski operator tržišta energije d.o.o. za organi-ziranje tržišta električne energije i plina, Zagreb, dok za trgovi-nu plinom još nije registrirana nijedna tvrtka.
Dozvolu za obavljanje energetske djelatnosti opskrbe plinom, do kraja 2009. godine, ishodilo je 45 tvrtki – njih 11 za razdoblje od 15 godina (Međimurje - plin d.o.o., Čakovec; HEP - Plin d.o.o., Osijek; Gradska plinara Zagreb d.o.o., Zagreb; Termoplin d.d., Varaždin; Darkom d.o.o., Daruvar; Elektrometal d.d., Bjelovar; Plin VTC d.o.o., Virovitica; Komunalac d.o.o., Koprivnica; Plin Konjščina d.o.o., Konjščina; Gradska plinara Zagreb - opskrba d.o.o., Zagreb i Prirodni plin d.o.o., Zagreb), a većina ostalih za razdoblje od pet godina te dvije na razdoblje od 3 godine.
Dozvolu za obavljanje energetske djelatnosti distribucije plina u 2009. godini imalo je 39 tvrtki. Većina ih posjeduje dozvolu za razdoblje od pet godina, a samo deset tvrtki za razdoblje od 15 godina (Termoplin d.d., Varaždin; Energo d.o.o., Rijeka; HEP Plin d.o.o., Osijek; Elektrometal d.d., Bjelovar; Gradska plinara Zagreb d.o.o., Zagreb; Koprivnica plin - distribucija plina d.o.o., Koprivnica; Međimurje - plin d.o.o., Čakovec; Darkom distribucija plina d.o.o., Daruvar; Plin Konjščina d.o.o., Konjščina; Plin VTC d.o.o., Virovitica). U tablici 4.4.1. su prikazane sve tvrtke registrirane za distribuciju plina do kraja 2009. godine te njihova potrošnja i udjel na tržištu.
4.4. Energy Companies
Licence for shipping of natural gas hold INA Industrija nafte and Prirodni plin, Ltd. Licences are issued for the period of 15 years. Licence for storage of natural gas hold INA Industrija nafte and Podzemno skladište plina, Ltd., both on the period of 5 years. 15-year period licence for transport of natural gas in the Republic of Croatia holds Plinacro since 2003. Law on amendments of Law on gas market (Official Gazette 152/2008) defined new activities within natural gas market: organisation of gas market and gas trading. Licence for organisation of gas market obtained Hrvatski operator tržišta energije, Ltd. for organization of gas and electricity markets whereas no company holds license for gas trading.
Until the end of 2009, a total of 45 companies obtained a gas supply licence. Most of the companies hold licence for a period of 5 or 3 years, while 11 companies were granted a 15-year licence (these are: Međimurje - plin d.o.o, Čakovec; HEP - Plin d.o.o, Osijek; Gradska plinara Zagreb d.o.o, Zagreb; Termoplin d.d, Varaždin; Darkom d.o.o, Daruvar; Elektrometal d.d, Bjelovar; Plin VTC d.o.o., Virovitica; Komunalac d.o.o, Koprivnica; Plin Konjščina d.o.o, Konjščina; Gradska plinara Zagreb - opskrba d.o.o, Zagreb i Prirodni plin d.o.o., Zagreb).
In 2009, licence for gas distribution held 39 companies. Most of them obtained licence for the period of 5 years, and only 10 of them for the 15-year period (Termoplin d.d, Varaždin; Energo d.o.o, Rijeka; HEP Plin d.o.o, Osijek; Elektrometal d.d, Bjelovar; Gradska plinara Zagreb d.o.o, Zagreb; Koprivnica plin - distribucija plina d.o.o, Koprivnica; Međimurje - plin d.o.o, Čakovec; Darkom distribucija plina d.o.o, Daruvar; Plin Konjščina d.o.o, Konjščina; Plin VTC d.o.o, Virovitica). The table below presents all registered gas distribution companies, their gas consumptions and market shares in 2009.

147
ENERGY MMIXIV NATURAL GAS
Tablica | Table 4.4.1. Tvrtke koje obavljaju distribuciju plina na temelju dobivene energetske dozvole, njihova potrošnja i udjel na tržištu u 2009. godini | Companies carrying out licence-based gas distribution activity, their consumptions and market shares in 2009
Naziv i sjedište pravne osobeName and headquarters of legal person
Ukupna potrošnja (mil. m3)Total consumption (mil. m3)
Udjel na tržištuMarket share
DISTRIBUCIJA PRIRODNOG PLINA NATURAL GAS DISTRIBUTION
1. Gradska plinara Zagreb d.o.o., Zagreb 439,771 35,89%
2. HEP Plin d.o.o., Osijek 157,357 12,84%
3. Termoplin d.d., Varaždin 94,862 7,74%
4. Međimurje - plin d.o.o., Čakovec 63,699 5,20%
5. Plinara istočne Slavonije d.o.o., Vinkovci 42,204 3,44%
6. Koprivnica plin - distribucija plina d.o.o., Koprivnica 41,933 3,42%
7. Montcogim - plinara d.o.o., Sveta Nedjelja 38,285 3,12%
8. Brod-plin d.o.o., Slavonski Brod 33,398 2,73%
9. Elektrometal d.d., Bjelovar 29,896 2,44%
10. Energo d.o.o. Rijeka 29,718 2,43%
11. Zagorski metalac d.o.o., Zabok 21,843 1,78%
12. Plin VTC d.o.o., Virovitica 19,508 1,59%
13. Prvo plinarsko društvo d.o.o., Vukovar 18,244 1,49%
14. Moslavina plin d.o.o., Kutina 15,357 1,25%
15. Dukom d.o.o., Dugo Selo 14,697 1,20%
16. Komus d.o.o. - u stečaju, Donja Stubica 13,682 1,12%
17. Energometan d.o.o., Samobor 13,455 1,10%
18. Plin Vrbovec d.o.o., Vrbovec 12,507 1,02%
19. Ivaplin d.o.o., Ivanić Grad 11,794 0,96%
20. Darkom distribucija plina d.o.o., Daruvar 10,778 0,88%
21. Papuk - plin d.o.o., Orahovica 10,099 0,82%
22. Termoplin - Novi Marof d.d., Novi Marof 9,265 0,76%
23. Gradska plinara Krapina d.o.o., Krapina 9,038 0,74%
24. Komunalije - plin d.o.o., Ðurđevac 8,677 0,71%
25. Plin Konjščina d.o.o., Konjščina 8,513 0,69%
26. Ivkom d.d., Ivanec 8,452 0,69%
27. Radnik - plin d.d., Križevci 8,194 0,67%
28. Zelina - plin d.o.o., Sveti Ivan Zelina 7,287 0,59%
29. Humkom d.o.o., Hum na Sutli 5,598 0,46%
30. Komunalac d.o.o., Pakrac 5,514 0,45%
31. Plin - projekt d.o.o., Nova Gradiška 4,502 0,37%
32. Plinkom d.o.o., Pitomača 4,229 0,35%
33. Zelenjak d.o.o., Klanjec 4,105 0,33%

148
ENERGIJA MMIXIV PRIRODNI PLIN
Naziv i sjedište pravne osobeName and headquarters of legal person
Ukupna potrošnja (mil. m3)Total consumption (mil. m3)
Udjel na tržištuMarket share
34. Plin d.o.o., Garešnica 3,926 0,32%
35. Čaplin d.o.o., Čazma 2,046 0,17%
36. Plinara d.o.o. Pula 1,905 0,16%
37. Metalprodukt d.d., Šandrovac 1,000 0,08%
38. AMGA Adria d.o.o., Kraljevica 0 0,00%
39. Elektrometal - distribucija plina d.o.o., Bjelovar 0 0,00%
Ukupno | Total 1 225,336 100%
DISTRIBUCIJA UNP-A LPG DISTRIBUTION
Plinara d.o.o, Pula-gradski plin/town gas 10,154
Plinara d.o.o, Pula - ispareni UNP/ evaporated LPG 0,082
Izvor | Source: HSUP, EIHP
Slika | Figure 4.4.1. Udjeli potrošnje prirodnog plina pojedinih tvrtki na tržištu tijekom 2009. godine | Market shares of distribution companies in 2009 – Izvor | Source: HSUP, EIHP
4.5. Cijene prirodnog plina
Osnovni elementi cijene plina su cijena dobave prirodnog plina, cijena transporta prirodnog plina i dozvoljeni prihod distributera i opskrbljivača. Transport, distribucija i opskrba plinom tarifnih kupaca, kao i skladištenje prirodnog plina regulirani su odgovarajućim tarifnim sustavima koje je doni-jela Hrvatska energetska regulatorna agencija (HERA).
4.5. Natural Gas Prices
Basic gas price elements include natural gas shipping rate, transmission price, and supplier’s and distributor’s revenue cap. Transport, distribution and supply of tariff customers are regulated by the tariff systems defined by the Croatian Energy Regulatory Agency (CERA).
Ostale 31 tvrtke / Other31 companies 20,75%
Gradska plinara Zagreb d.o.o. 35,89%
HEP Plin d.o.o.Osijek 12,84%
Termoplin d.d.Varaždin 7,74%
Međimurje - plin d.o.o.Čakovec 5,20%
Plinara istočne Slavonije d.o.o.Vinkovci 3,44%
Koprivnica plin - distribucija plina d.o.o. Koprivnica 3,42%
Energo d.o.o.Rijeka 2,43%
Elektrometal d.d.Bjelovar 2,44%
Montcogim - plinara d.o.o.Sveta Nedjelja 3,12%
Brod-plin d.o.o.Slavonski Brod 2,73%

149
ENERGY MMIXIV NATURAL GAS
4.5.1. Cijena dobave prirodnog plina za opskrbljivače tarifnih kupaca
Cijena dobave prirodnog plina određena je Odlukom o cijeni za dobavu plina dobavljaču plina za opskrbljivače tarifnih kupaca (NN 142/2008) u iznosu od 1,32 kn/m3/33 338,35 kJ. Prosječna cijena prirodnog plina za opskrbljivače na distribu-cijskom sustavu u 2009. godini iznosila je 1,3476 kn/m3/33 338,35 kJ dok je cijena dobave za povlaštene kupce (direktne industrijske potrošače) iznosila 1,3497 kn/m3/33 338,35 kJ.
4.5.2. Cijene transporta prirodnog plina
Cijena transporta prirodnog plina kroz transportni sustav utvrđuje se primjenom Tarifnog sustava za transport prirodnog plina, bez visine tarifnih stavki (NN 32/2006 i 03/2007).
Odlukom Vlade Republike Hrvatske utvrđene su visine tarif-nih stavki za transport prirodnog plina za 2009. godinu (NN 154/2008):
Tvršno = 5,16 kn po m3 po danu,
Tsrednje = 4,30 kn po m3 po danu,
Tosnovno = 2,58 kn po m3 po danu.
U cilju zadržavanja istih cijena i nakon donošenja nove stope poreza na dodanu vrijednost od 23%, Vlada RH donijela je novu Odluku o visini tarifnih stavki za transport plina za 2009. godinu (NN 103/2009) s primjenom od 01.09.2009. godine, kako slijedi:
Tvršno = 5,13 kn po m3 po danu,
Tsrednje = 4,265 kn po m3 po danu,
Tosnovno = 2,58 kn po m3 po danu.
Cijena transporta prirodnog plina izražava se kroz naknadu za korištenje transportnog sustava. Iznos naknade utvrđuje se prema rezerviranom kapacitetu (zahtijevanom najvećem dnevnom opterećenju) za pojedinog korisnika transportnog sustava i neovisno o stvarnom korištenju istog. Udio cijene transporta u konačnoj cijeni prirodnog plina ovisi o razini iskoristivosti rezerviranog kapaciteta, odnosno o karakteristi-kama potrošnje pojedinog kupca plina. Po isteku obračunske godine obavlja se konačni obračun naknade za korištenje transportnog sustava plinovoda za tu obračunsku godinu, za
4.5.1. Natural gas shipping prices for tariff customers suppliers
Valid price for natural gas shipping for all tariff customers suppliers was defined by the Decision on gas shipping price for gas suppliers of tariff customers (Official Gazette 142/08) and was set at 1.32 HRK/m3/33,338.35 kJ excl. VAT. Average price for suppliers on distribution system in 2009 was 1.3476 HRK/m3/33 338,35 kJ excl. VAT, whereas average price for eligible customers (direct industrial customers) was 1.3497 HRK/m3/33 338,35 kJ exl. VAT.
4.5.2. Natural gas transmission prices
The gas transmission price for the use of transport system is defined by the Tariff system for natural gas transport, without the amounts of tariff items (Official Gazette 32/06, 03/07).
Tariff items were defined by the Decision of the Government of the Republic of Croatia on tariff items for gas transport for year 2009 (Official Gazette 154/09):
Tpeak = 5.16 HRK/m3/day,
Tshoulder = 4.30 HRK/m3/day,
Toffpeak = 2.58 HRK/m3/day.
In order to maintain the same price levels after enacting a higher VAT rate of 23%, the Government issued new Decision on tariff items for natural gas transport for year 2009 (Official Gazette 103/09) that came into effect September 1st, 2009 setting the tariff items for natural gas transport as follows:
Tpeak = 5.13 HRK/m3/day,
Tshoulder = 4.265 HRK/m3/day,
Toffpeak = 2.58 HRK/m3/day.
Natural gas transmission price is expressed as compensation for use of transportation system. Compensation is established according to customer’s requested capacities (requested highest daily load) for each user of the transmission system and independent of its actual utilisation. The share of tran-smission price within the end price depends on the level of reserved capacity utilisation and the characteristics of natural gas consumption of a particular customer. By the end of the financial year the final fee for use of the transmission pipeline system in the financial year is calculated for the difference

150
ENERGIJA MMIXIV PRIRODNI PLIN
razliku između rezerviranog i ostvarenog najvećeg dnevnog opterećenja u pojedinom mjesecu.
Prosječna cijena transporta prirodnog plina u 2009. godini za sve kupce plina na transportnom sustavu iznosila je 0,21 kn/m3. Prosječna cijena transporta plina za opskrbljivače plinom kupaca na distribucijskim sustavima iznosila je 0,23 kn/m3, a za krajnje kupce plina na transportnom sustavu 0,18 kn/m3.
4.5.3. Cijene skladištenja prirodnog plina
Sredinom 2009. godine Vlada Republike Hrvatske donijela je Odluku o visini tarifnih stavki za skladištenje prirodnog plina (NN 73/2009) kojom su tvrđeni iznosi tarifnih stavki za 2009. godinu kao slijedi:
Trv = 8,77 kn/MWh,
Tu = 270,65 kn/MWh/dan,
Tp = 195,41 kn/MWh/dan,
gdje je: Trv - tarifna stavka za zakup radnog volumena,Tu - tarifna stavka za zakup i korištenje dnevnog kapaciteta utiskivanja plina u radni volumen, a Tp - tarifna stavka za zakup i korištenje dnevnog kapaciteta povlačenja plina iz radnog volumena.
4.5.4. Cijene opskrbe prirodnim plinom tarifnih kupaca
Vlada Republike Hrvatske donijela je Odluku o visini tarifnih stavki u Tarifnom sustavu za opskrbu prirodnim plinom, s iznimkom povlaštenih kupaca, bez visine tarifnih stavki (NN 154/2008) kojom je određena visina pojedinih tarifnih stavki za energetske subjekte. Tarifna stavka Ts1 (jedinična cijena isporučene količine prirodnog plina osnovne ogrjevne vrijednosti) za opskrbu prirodnim plinom iznosila je od 1,86 do 2,21 kn/Sm3 za prirodni plin, odnosno 5,44 kn/Sm3 za miješani plin, 2,02 kn/Sm3 za gradski plin i 11,01 kn/Sm3 za ispareni ukapljeni plin. Ova odluka vrijedila je od 1. siječnja do 31. kolovoza 2009., a 1. rujna 2009. stupila je na snagu nova Odluka o visini tarifnih stavki u Tarifnom sustavu za opskrbu prirodnim plinom, s iznimkom povlaštenih kupaca, bez visine tarifnih stavki (NN 103/2009) temeljena na Izmjenama i dopunama Tarifnog sustava za opskrbu prirod-nim plinom, s iznimkom povlaštenih kupaca, bez visine tarif-nih stavki (NN 87/2009). Tarifna stavka Ts1 (jedinična cijena
between booked and actual maximum daily load in a particu-lar month.
In 2009 average transmission price for all customers on tran-sportation system was 0.21 HRK/m3. Average transmission price for suppliers of tariff customers on distribution system amounted 0.23 HRK/m3, and for end customers on transport system 0.18 HRK/m3.
4.5.3. Natural gas storage prices
Mid-2009 the Croatian Government adopted the Decision on tariff items for storage of natural gas (Official Gazette 73/09), which defined the tariff items for 2009 as follows:
Trv = 8.77 HRK/MWh,
Tu = 270.65 HRK/MWh/day,
Tp = 195.41 HRK/MWh/day,
where: Trv - tariff item for the lease of the working volume,Tu - tariff item for the lease and use of a daily injection capa-city of gas into the working volume, and Tp - tariff item for the lease and use of a daily withdrawal capacity of gas from the working volume.
4.5.4. Prices of natural gas supply to tariff customers
The Croatian Government adopted the Decision on tariff items in the Tariff system for natural gas supply, with the exception of eligible customers, without tariff items (Official Gazette 154/08), which determined the height of the individual tariff items for the energy entities. Tariff item Ts1 (unit price of supplied natural gas of basic calorific value) for the supply of natural gas amounted to 1.86 to 2.21 kn/Sm3 for natural gas, 5.44 kn/Sm3 for mixed gas, 2.02 kn/Sm3 for town gas and 11.01 kn/Sm3 for the evaporated LPG. This decision was valid from 1st January to 31st August 2009., whereas September 1st a new Decision on the level of tariff items in the Tariff system for natural gas supply, with the exception of eligible customers, without tariff items (Official Gazette 103/09) came into force. Decision is based on the Amendments to the Tariff system for natural gas supply, with the exception of eligible customers, without tariff items (Official Gazette 87/09). Tariff item Ts1 (unit price of delivered natural gas) for the supply of

151
ENERGY MMIXIV NATURAL GAS
isporučene količine prirodnog plina) za opskrbu prirodnim plinom iznosila je od 1,83 do 2,20 kn/Sm3 za prirodni plin, odnosno 5,44 kn/Sm3 za miješani plin, 2,02 kn/Sm3 za grad-ski plin i 11,01 kn/Sm3 za ispareni ukapljeni plin.
4.5.5. Cijene distribucije prirodnog plina
Vlada Republike Hrvatske donijela je Odluku o visini tarifnih stavki u Tarifnom sustavu za distribuciju prirodnog plina, bez visine tarifnih stavki (NN 154/2008) kojom je određena visina pojedinih tarifnih stavki za energetske subjekte. Tarifna stavka Ts1 (jedinična cijena distribuirane količine prirodnog plina) za distribuciju prirodnog plina iznosila je od 0,30 do 0,56 kn/m3.
natural gas amounted to 1.83 to 2.20 kn/Sm3 for natural gas, 5.44 kn/Sm3 for mixed gas, 2.02 kn/Sm3 for town gas and 11.01 kn/Sm3 the evaporated LPG.
4.5.4. Natural gas distribution prices
The Croatian Government adopted the Decision on tariff items in the Tariff system for natural gas distribution, without tariff items (Official Gazette 154/08), which determined the height of the individual tariff items for the energy entities. Tariff item Ts1 (unit price of distributed natural gas) for distribution of natural gas amounted between 0.30 to 0.56 kn/m3.
Tablica | Table 4.5.1. Prosječna prodajna cijena prirodnog plina od 2000. do 2009. godine (s PDV-om) | Average selling price of natural gas from 2000 to 2009 (VAT included)
Vrsta potrošačaCustomer category
2000. 2001. 2002. 2003. 2004. 2005. 2006. 2007. 2008. 2009.
KućanstvaHouseholds
1,45 1,72 1,94 1,95 2,04 2,04 2,05 2,05 2,05 2,41
UslugeServices
1,45 1,72 1,98 1,99 2,08 2,06 2,07 2,07 2,08 2,44
IndustrijaIndustry
1,38 1,72 1,94 1,94 2,04 2,05 2,05 2,04 2,05 2,43
Izvor | Source: EIHP
Slika | Figure 4.5.1. Kretanje prosječne prodajne cijene prirodnog plina od 2000. do 2009. godine (s PDV-om) | Trends in natural gas average selling prices from 2000 to 2009 (VAT included) – Izvor | Source: EIHP
1,25
1,50
1,75
2,00
2,25
2,50
2000. 2001. 2002. 2003. 2004. 2005. 2006. 2007. 2008. 2009.
kn/m3
Kućanstva | HouseholdsUsluge | ServicesIndustrija | Industry


ELEKTRIČNA ENERGIJA ELECTRICITY
VV


155
ENERGY MMIXV ELECTRICITY
5.1. Proizvodni kapaciteti i mreže
5.1.1. Kapaciteti za proizvodnju električne energije
Instalirani kapaciteti za proizvodnju električne energije u Republici Hrvatskoj obuhvaćaju hidro i termoelektrane u sastavu HEP grupe (oko 95% kapaciteta), određeni broj industrijskih termoelektrana i nekoliko elektrana na obnovljive izvore energije u privatnom vlasništvu.
Kapaciteti za proizvodnju električne energije u sastavu HEP grupe
Kapaciteti za proizvodnju električne energije u sastavu HEP grupe obuhvaćaju 16 pogona hidroelektrana, sedam pogona termoelektrana i polovinu instaliranih kapaciteta u nuklearnoj elektrani Krško (na teritoriju Slovenije). Termoelektrane kori-ste ugljen, plin i loživo ulje. Većinski vlasnik nad proizvodnim kapacitetima Republike Hrvatske je HEP d.d. Objekti koji nisu u potpunom vlasništvu HEP–a su:
• NE Krško d.o.o. – mješovito vlasništvo HEP d.d. (udio 50%) i slovenskog partnera ELES GEN d.o.o. (udio 50%)
• TE Plomin d.o.o. – mješovito vlasništvo HEP d.d. (udio 50%) i njemačkog partnera RWE Power (udio 50%). HEP Proizvodnja d.o.o. ima ugovor o vođenju i održavanju pogona s TE Plomin d.o.o.
Ukupna raspoloživa snaga elektrana u sastavu HEP grupe na teritoriju Republike Hrvatske je 3 769,22 MW (uračunata TE Plomin d.o.o, bez NE Krško d.o.o.), odnosno ukupna snaga elektrana za potrebe hrvatskog EES-a je 4 117,22 MW (s 50% NE Krško). Od toga je 1 681 MW u termoelektranama (uračunata TE Plomin d.o.o, bez NE Krško d.o.o.), 2 088,22 MW u hidroelektranama te 348 MW u NE Krško (50% ukupno raspoložive snage). U ovu snagu nisu uračunati proizvodni kapaciteti na teritoriju drugih zemalja iz kojih elektroenerget-ski sustav Republike Hrvatske ima pravo isporuke električne energije na temelju zakupa snage i energije ili udjela u vla-sništvu. Kapaciteti u drugim zemljama obuhvaćaju:
• u Bosni i Hercegovini - TE Gacko, instalirana snaga 300 MW, gorivo ugljen. Temelj prava – udio u vlasništvu (1/3 snage i energije na razdoblje od 25 godina)
5.1 Generation Capacities and Networks
5.1.1 Electricity generation capacities
The installed electricity generating capacities in the Republic of Croatia include hydro and thermal power plants owned by the HEP Group (Croatian Power Company), a certain number of industrial power plants and a few privately owned power plants (wind power plants, small hydro power plants).
HEP’s electricity generation capacities
Electricity generation capacities within the HEP Group consist of 16 locations with hydro power plants, 7 locations with ther-mal power plants and one half of the installed capacities of the nuclear power plant Krško (located in the territory of Slovenia). Thermal power plants are gas-fired, coal-fired and fuel oil-fired. The majority owner over the generation capacities in the Republic of Croatia is HEP d.d. The facilities that are not fully owned by HEP d.d. are the following:
• NE Krško d.o.o. (Nuclear power plant Krško Ltd.) under the joint ownership of the HEP d.d. (50%) and the Slovenian company ELES GEN d.o.o. (50%)
• TE Plomin d.o.o. (Thermal power plant Plomin Ltd.) under the joint ownership of the HEP d.d. (50%) and the German company RWE Power (50%). HEP Proizvodnja d.o.o. (HEP Generation Ltd.) won a management and operation and maintenance contract for the thermal power plant Plomin.
Total available capacities of all HEP’s power plants in the Republic of Croatia amount to 3 769.22 MW (including TPP Plomin and excluding NPP Krško) i.e., total capacities serving the needs of the Croatian electric power system amount to 4 117.22 MW (with 50% of Krško capacities). Out of this amount, 1 681 MW is placed in thermal power plants (inclu-ding TPP Plomin and excluding NPP Krško), 2 088.22 MW in hydro power plants and 348 MW in the nuclear unit Krško (50% of total available capacity). These capacities do not include generating units in other countries from which the Croatian electric power system has the right to withdraw electricity on the basis of capacity lease and share-ownership arrangements. The capacities in other countries are the following:
• Thermal power plant Gacko (Bosnia and Herzegovina) – total installed capacity of 300 MW, coal-fired. Legal basis – shared ownership (1/3 of capacity and power for a 25 year period)

156
ENERGIJA MMIXV ELEKTRIČNA ENERGIJA
• u Srbiji - TE Obrenovac, instalirana snaga 305 MW, gorivo ugljen. Pravo zakupa snage i energije na temelju kredita za izgradnju
Snaga i električna energija iz navedenih objekata nije raspo-loživa jer još uvijek nije riješen položaj objekata. Otvorena pitanja po ugovorima vezanim za ulaganja u navedene objekte svode se na trajanje ugovora, tretman uloženih sredstava i način utvrđivanja cijene isporuke električne energije.
U tablici i na slici 5.1.1. prikazani su ukupni kapaciteti za proizvodnju električne energije u vlasništvu HEP grupe, a u tablicama 5.1.2. i 5.1.3. nalaze se popisi svih hidroelektrana i termoelektrana u Republici Hrvatskoj. Na slici 5.1.2. prikaza-na je struktura termoelektrana prema vrsti goriva.
U srpnju 2009. godine je s hrvatskim elektroenergetskim sustavom prvi put sinkronizirana i plinska turbina Bloka L u TE-TO Zagreb. Blok je ukupne električne snage 108 MW na pragu elektrane i u 2009. godini je ukupno proizveo 367 000 MWh električne energije.
• Thermal power plant Obrenovac (in the Republic of Serbia) – installed capacity 305 MW, coal-fired. Legal basis – capa-city and power lease on the basis of a credit for construction
The capacity and power from the above-mentioned facilities is not available, as the status of these facilities has not been resolved yet. The open issues regarding the agreements on investments in these facilities refer to the duration period, the way of treatment of the invested funds and what pricing met-hods should be applied to electricity deliveries.
In table 5.1.1 (Figure 5.1.1) are shown total electricity pro-duction capacities in HEP Group ownership. In tables 5.1.2 and 5.1.3 are listed all hydro and thermal power plants, and in figure 5.1.2 is shown fuel share in thermal power plants.
In July 2009 has been for the first time synchronised to power network new unit L (gas turbine) in power plant TE-TO Zagreb. New unit has available electrical power of 108 MW. Produced electricity delivered to the network in 2009 amounted at 367 000 MWh.
Tablica | Table 5.1.1. Proizvodni kapaciteti za potrebe Republike Hrvatske u sastavu HEP grupe | Electricity generation capacity for the Republic of Croatia (HEP Group ownership)
Kapaciteti za proizvodnju električne energijeElectricity generation capacity
Raspoloživa snagaAvailable power (MW)
UdioShare (%)
Proizvedena električna energija u 2009.Electricity produced in 2009 (GWh)
Hidroelektrane (HE) Hydro power plants (HPP)
2 088,22 51 6 767
Termoelektrane (TE)Thermal power plants (TPP)
1 489 36 4 381
TE Plomin d.o.o.TE Plomin Ltd.
192 4,6 797
Ukupno u Republici HrvatskojTotal in the Republic of Croatia
3 769,22 91,6 11 945
Nuklearna elektrana Krško (NE Krško) – 50%Nuclear power plant Krško (NPP Krško) – 50%
348 8,4 2 730
UKUPNOTOTAL
4 117,22 100 14 675
Izvor | Source: EIHP, HEP

157
ENERGY MMIXV ELECTRICITY
Slika | Figure 5.1.1. Raspoloživa snaga proizvodnih kapaciteta za potrebe Republike Hrvatske u sastavu HEP grupe | Available electricity generation capacity for the Republic of Croatia (HEP group ownership) Izvor | Source: EIHP
Tablica | Table 5.1.2. Hidroelektrane u Republici Hrvatskoj u sastavu HEP grupe | Hydro power plants in the Republic of Croatia (HEP Group ownership)
Akumulacijske hidroelektraneStorage plants
Raspoloživa snagaAvailable power (MW)
Protočne hidroelektraneRun-of-river plants
Raspoloživa snagaAvailable power (MW)
HE Zakučac 486 HE Varaždin 86,46
RHE Velebit 276/(-240) HE Čakovec 77,44
HE Orlovac 237 HE Dubrava 77,78
HE Senj 216 HE Gojak 55,5
HE Dubrovnik 216 HE Rijeka 36
HE Vinodol 90 HE Miljacka 24
HE Kraljevac 46,4 Male protočne hidroelektrane | Small run-of-river plants
HE Peruća 60 HE Jaruga 7,2
HE Ðale 40,8 HE Golubić 6,54
HE Sklope 22,5 HE Ozalj 5,5
RHE Buško Blato 11,7/(-10,2) HE Krčić 0,3
Male akumulacijske hidroelektrane | Small storage plants Ukupno male HE | Total small HPP 28,64
RHE Fužina 4,6/(-5,7)
HE Zavrelje 2
RHE* Lepenica 0,8/(-1,2)
HE Zeleni Vir 1,7
Ukupno akumulacijske HETotal storage HPP
1 711,50 Ukupno protočne HETotal run-of-river HPP
376,72
*RHE – reverzibilna HE | reversible HPPUKUPNO HETOTAL HPP
2 088,22
Izvor | Source: HEP – Godišnje izvješće 2009. | HEP – Annual Report for 2009
Hidroelektrane (HE)Hydro Power Plants (HPP) 51%
Termoelektrane (TE)Thermal Power Plants (TPP) 36%
TE Plomin d.o.o.TPP Plomin Ltd. 4,6%
Nuklearna elektranaNuclear Power Plant
Krško 8,4%

158
ENERGIJA MMIXV ELEKTRIČNA ENERGIJA
Tablica | Table 5.1.3. Termoelektrane u Republici Hrvatskoj u sastavu HEP grupe | Thermal power plants in the Republic of Croatia (HEP Group ownership)
TeremoelektraneThermal power plants
Raspoloživa snaga na praguAvailable net capacity (MW)
GorivoFuel
TE Sisak 396loživo ulje / prirodni plinfuel oil / natural gas
TE-TO Zagreb 422prirodni plin / loživo uljenatural gas / fuel oil
TE Rijeka 303loživo uljefuel oil
TE Plomin 1 110ugljencoal
EL-TO Zagreb 90prirodni plin / loživo uljenatural gas / fuel oil
KTE Jertovec 78prirodni plin / ekstralako uljenatural gas / extra light oil
PTE Osijek 48prirodni plin / ekstralako uljenatural gas / extra light oil
TE-TO Osijek 42loživo ulje / prirodni plinfuel oil / natural gas
TE Plomin d.o.o. 192ugljencoal
UKUPNOTOTAL
1 681
Izvor | Source: HEP – Godišnje izvješće 2009. | HEP – Annual Report for 2009
Slika | Figure 5.1.2. Struktura termoelektrana prema vrsti goriva | Structure of thermal power plants by fuel type Izvor | Source: EIHP
Ugljen | Coal302 MW
18%
Lož ulje | Fuel oil303 MW
18%
Prirodni plin | Natural gas1076 MW
64%

159
ENERGY MMIXV ELECTRICITY
Industrijske i ostale elektrane
Industrijske elektrane obuhvaćaju elektrane u sklopu indu-strijskih postrojenja koje su priključene na prijenosnu/distri-bucijsku mrežu. Industrijske elektrane proizvode električnu/toplinsku/mehaničku energiju za potrebe nekog industrijskog procesa, a viškove proizvedene električne energije mogu plasirati u prijenosnu/distribucijsku mrežu. Ove elektrane nisu u sastavu HEP-a, ali imaju ugovore za plasman i prodaju elek-trične energije u elektroenergetski sustav Republike Hrvatske. Ukupna instalirana snaga industrijskih elektrana je oko 210 MW, što je prikazano u tablici 5.1.4.
Tablica | Table 5.1.4. Industrijske elektrane u Republici Hrvatskoj | Industrial power plants in the Republic of Croatia
ElektranaPlant name
VrstaType
Instalirana snagaInstalled capacity
(MW)
Predano u mrežu 2009. | Sale to
network 2009 (GWh)
GorivoFuel
Termoelektrane (plin, tekuća goriva, ugljen, drvo) | Thermal power plants (gas, liquid fuels, coal, wood)
Belišće d.d.Belišće
parna turbinasteam turbine
31 0,06prirodni plin / drvni otpadnatural gas / wood
Viro d.o.o.Virovitica
parna turbinasteam turbine
8 0,35prirodni plinnatural gas
INA Rafinerija nafteRijeka
dizel motordiesel engine
40,5 1,96loživo uljefuel oil
DINA Omišalj
plinska turbinagas turbine
14 0loživo uljefuel oil
Pliva d.d.Savski Marof
parna turbinasteam turbine
4,875 3,16prirodni plinnatural gas
INA Rafinerija nafte, Sisak
plinski motorgas engine
30 0loživo ulje / rafinerijski plin /naftni koksfuel oil / refinery gas / petroleum coke
Gavrilović d.d.Petrinja
parna turbinasteam turbine
1,6 n/aprirodni plinnatural gas
Kandit premijer d.o.o. (tvornica šećera Osijek)
plinska turbinagas turbine
18,5 n/aprirodni plin / loživo ulje / ugljennatural gas / fuel oil / coal
INA d.d. Naftaplin CPS Molve, Ðurđevac
plinska turbinagas turbine
11,1 n/aprirodni plinnatural gas
INA d.d. Naftaplin pogon Etan, Ivanić Grad
parna turbinasteam turbine
5,6 n/aprirodni plinnatural gas
INA d.d. Maziva Rijeka
parna turbinasteam turbine
3 n/aprirodni plin / loživo uljenatural gas / fuel oil
Petrokemija d.d. Kutina
parna turbinasteam turbine
35 n/aprirodni plin / loživo uljenatural gas / fuel oil
Sladorana d.d.Županja
parna turbinasteam turbine
7 n/aprirodni plin / loživo ulje / ugljennatural gas / fuel oil / coal
UKUPNOTOTAL
210,18 5,53
Izvor | Source: HEP
Industrial and other power plants
Industrial power plants include units within the industrial installations which are connected to the transmission or dis-tribution grid. Industrial power plants generate electricity/heat/mechanical energy for own use in industrial processes, while the electricity surplus can be sold to the transmission/ distribu-tion grid. These power plants are not a part of the HEP Group, but they have purchase agreements and can deliver the power they produce into the power system. Total installed capacity of industrial power plants amounts to about 210 MW (Table 5.1.4).
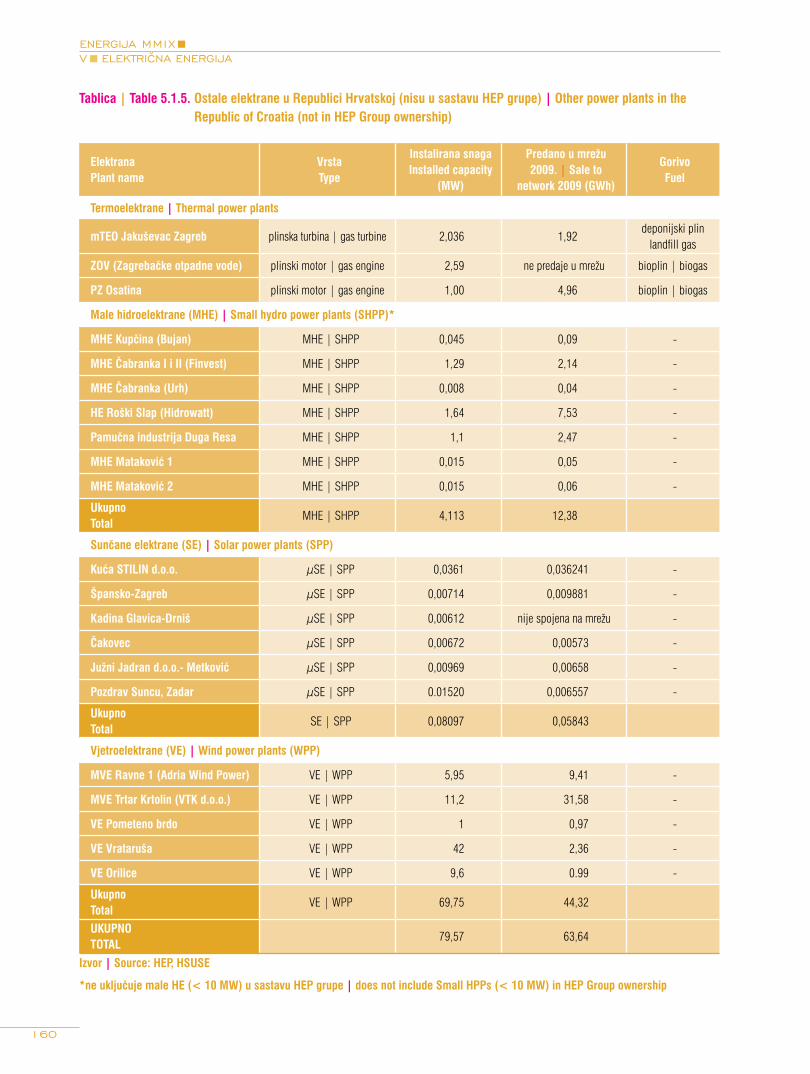
160
ENERGIJA MMIXV ELEKTRIČNA ENERGIJA
Tablica | Table 5.1.5. Ostale elektrane u Republici Hrvatskoj (nisu u sastavu HEP grupe) | Other power plants in the Republic of Croatia (not in HEP Group ownership)
ElektranaPlant name
VrstaType
Instalirana snagaInstalled capacity
(MW)
Predano u mrežu 2009. | Sale to
network 2009 (GWh)
GorivoFuel
Termoelektrane | Thermal power plants
mTEO Jakuševac Zagreb plinska turbina | gas turbine 2,036 1,92deponijski plin
landfill gas
ZOV (Zagrebačke otpadne vode) plinski motor | gas engine 2,59 ne predaje u mrežu bioplin | biogas
PZ Osatina plinski motor | gas engine 1,00 4,96 bioplin | biogas
Male hidroelektrane (MHE) | Small hydro power plants (SHPP)*
MHE Kupčina (Bujan) MHE | SHPP 0,045 0,09 -
MHE Čabranka I i II (Finvest) MHE | SHPP 1,29 2,14 -
MHE Čabranka (Urh) MHE | SHPP 0,008 0,04 -
HE Roški Slap (Hidrowatt) MHE | SHPP 1,64 7,53 -
Pamučna industrija Duga Resa MHE | SHPP 1,1 2,47 -
MHE Mataković 1 MHE | SHPP 0,015 0,05 -
MHE Mataković 2 MHE | SHPP 0,015 0,06 -
UkupnoTotal
MHE | SHPP 4,113 12,38
Sunčane elektrane (SE) | Solar power plants (SPP)
Kuća STILIN d.o.o. μSE | SPP 0,0361 0,036241 -
Špansko-Zagreb μSE | SPP 0,00714 0,009881 -
Kadina Glavica-Drniš μSE | SPP 0,00612 nije spojena na mrežu -
Čakovec μSE | SPP 0,00672 0,00573 -
Južni Jadran d.o.o.- Metković μSE | SPP 0,00969 0,00658 -
Pozdrav Suncu, Zadar μSE | SPP 0.01520 0,006557 -
UkupnoTotal
SE | SPP 0,08097 0,05843
Vjetroelektrane (VE) | Wind power plants (WPP)
MVE Ravne 1 (Adria Wind Power) VE | WPP 5,95 9,41 -
MVE Trtar Krtolin (VTK d.o.o.) VE | WPP 11,2 31,58 -
VE Pometeno brdo VE | WPP 1 0,97 -
VE Vrataruša VE | WPP 42 2,36 -
VE Orilice VE | WPP 9,6 0.99 -
UkupnoTotal
VE | WPP 69,75 44,32
UKUPNOTOTAL
79,57 63,64
Izvor | Source: HEP, HSUSE
*ne uključuje male HE (< 10 MW) u sastavu HEP grupe | does not include Small HPPs (< 10 MW) in HEP Group ownership

161
ENERGY MMIXV ELECTRICITY
Osim industrijskih elektrana u Republici Hrvatskoj postoji oko 23 MW instaliranih kapaciteta za proizvodnju električne ener-gije koji, također, nisu u sastavu HEP grupe (tablica 5.1.5.).
Ukupna instalirana snaga industrijskih i ostalih elektrana je oko 230 MW.
5.1.2. Kapaciteti mreže
Sastavni dio svakog elektroenergetskog sustava je i elek-troenergetska mreža koja ima zadatak povezati proizvodna postrojenja i potrošače te omogućiti sigurnu opskrbu potro-šača električnom energijom. Elektroenergetska mreža dijeli se na dva dijela: prijenosnu i distribucijsku mrežu. U Republici Hrvatskoj vlasnik je svih distribucijskih i prijenosnih vodova (do mjernog mjesta) HEP d.d. Upravljanje prijenosnom mrežom je u nadležnosti HEP Operatora prijenosnog sustava d.o.o, a upravljanje distribucijskom mrežom je u nadležnosti HEP Operatora distribucijskog sustava d.o.o.
Tijekom 2009. godine je u redovni pogon pušteno više obje-kata prijenosne mreže, od kojih se povećanjem sigurnosti opskrbe ističu: obnovljeni prekogranični 220 kV daleko-vod Mraclin–Prijedor (BiH), obnovljeni 110 kV dalekovod Dubrova-Raša, novi 110 kV kabelski vod Osijek 3 – Osijek 4, te nove trafostanice TS 110/10 (20) kV Osijek 4 i TS 30/110 kV Vrataruša, kao i TS 220/110 kV Ðakovo (spojno-mjerno polje 220 kV), TS 110/35/10 kV Švarča (transformatorsko polje 110 kV) i TS 110/20 kV Botinec (dalekovodno polje 110 kV TE-TO). Pored navedenih objekata dovršeni su radovi na izgradnji hrvatske dionice novog dvostrukog 400 kV dale-kovoda Ernestinovo – Pečuh (Mađarska), te su započete aktiv-nosti vezane uz tehnički pregled i puštanje u pogon.
Nastavljena je revitalizacija sustava vođenja hrvatskog elek-troenergetskog sustava s obuhvaćenim nacionalnim dispe-čerskim centrom i četiri mrežna centra. U sklopu realizacije Programa Dubrovnik nastavljene su aktivnosti na pripremi izgradnje TS 220/110 kV Plat.
U 2009. godini su završena ulaganja u rekonstrukciju 110 kV transformatorskih stanica: TS 110/10(20) kV Botinec (pojača-nje transformacije), TS 110/10(20) kV Tupljak sa SN rasple-tom, TS 110/10(20) kV Novalja (rekonstrukcija dijela 35 kV u 20 kV postrojenje), TS 110/10(20) kV Matulji (pojačanje transformacije) te TS 110/10(20) kV Dubec (ugradnja MTU 110 kV postrojenja). Također je završena izgradnja, odnosno
Beside industrial power plants there is in Republic of Croatia about 23 MW installed capacity for electricity generation in private ownership (Table 5.1.5).
Total installed capacity of industrial and other power plants is about 230 MW.
5.1.2 Network capacities
Power network is part of the power system as a whole. Its purpose is to connect generators to end-users and to combine generation from power plants within the system with customer supply pattern under given security criteria. Power network is divided in two parts: transmission network and distribution network. In the Republic of Croatia all transmission and distri-bution capacities are owned (up to the metering points) by HEP d.d. and operated by HEP Group companies HEP Transmission system operator and HEP Distribution system operator.
During 2009 several transmission facilities were put into regu-lar operation, of which the more significant are: the reconstruc-ted cross-border 220 kV transmission line Mraclin-Prijedor (BiH), reconstructed 110 kV transmission line Dubrova-Raša, new 110 kV cable transmission line Osijek 3 – Osijek 4, and new transformer stations TS 110/10 (20) kV Osijek 4 and TS 30/110 kV Vrataruša,as well as TS 220/110 kV Ðakovo (cou-pling-metering bay 220 kV), TS 110/35/10 kV Švarča (tran-sformer bay 110 kV) i TS 110/20 kV Botinec (feeder bay 110 kV TE-TO). Construction work was completed on the Croatian section of the new cross-border transmission line 2x400 kV Ernestinovo-Pecs (Hungary) and preparatory activities began for technical inspection and putting the line into operation.
The refurbishment continued of the control system of the Croatian electricity system, including National Dispatch Center and four network centers, especially of those parts that support the functioning of the electricity market. As part of the imple-mentation of Dubrovnik program, the activities to prepare the construction of TS 220/110 kV Plat continued.
In 2009, investments in reconstruction of 110 kV transformer stations were completed: TS 110/10(20) kV Botinec (tran-sformation reinforcement), TS 110/10(20) kV Tupljak with MV phase arrangement, TS 110/10(20) kV Novalja (reconstruction of part of 35 kV in 20 kV switchyard), TS 110/10(20) kV Matulji (transformation reinforcement) and TS 110/10(20) kV Dubec (installation of ripple control units110 kV switchyard). Also completed was construction or reconstruction of a number of

162
ENERGIJA MMIXV ELEKTRIČNA ENERGIJA
rekonstrukcija više 35 kV i 20 kV objekata: TS 35/10(20)kV Novi Marof (zamjena relejne zaštite i uključenje u sustav daljinskog vođenja); TS 35/10(20) kV Orlovnjak (potpuna rekonstrukcija u ratu uništene transformatorske stanice); TS 35/10(20) kV Brodsko brdo, Brodski Stupnik, Brod 3 (rekon-strukcija i uključenje u SDV); TS 35/10(20) kV Lapad (poja-čanje transformacije i rekonstrukcija dijela postrojenja); TS 35/10(20) kV Suhopolje (pojačanje transformacije i rekon-strukcija postrojenja); KB 35 kV Bjelovar – Predavac – Žabno (III. dionica); DV i KB 20(35) kV Pločice – Prevlaka s odcje-pom za Molunat; RS 10(20) kV Sunja; Rasplet KB 10(20) kV iz TS Ludbreg – Selnik; Spojni vod 10(20) kV Novigrad – Drnje; prijelaz na 20 kV područja Sunja; Revitalizacija sustava daljinskog vođenja u DP Elektroistra Pula.
Kapaciteti prijenosne mreže HEP OPS-a prikazani su u tablici 5.1.6, a kapaciteti distribucijske mreže HEP ODS-a u tablici 5.1.7.
35 and 20 kV facilities: TS 35/10(20)kV Novi Marof, replace-ment of relay protection and inclusion in the remote control system; TS 35/10(20) kV Orlovnjak (full reconstruction of the transformer station destroyed in war); TS 35/10(20) kV Brodsko brdo, Brodski Stupnik, Brod 3 (reconstruction and inclusion in the remote control system); TS 35/10(20) kV Lapad (transfor-mation reinforcement and reconstruction of part of the plant); TS 35/10(20) kV Suhopolje (transformation reinforcement and plant reconstruction); KB 35 kV Bjelovar – Predavac – Žabno (III section); Cable and OHL 20(35) kV Pločice – Prevlaka with a branch to Molunat; RS 10(20) kV Sunja; Cable 10(20) kV from TS Ludbreg – Selnik; connecting line 10(20) kV Novigrad – Drnje; switch to 20 kV of Sunja area; refurbishment of remote control system at Elektra Pula.
HEP TSO transmission network capacities are shown in Table 5.1.6 while HEP DSO distribution network capacities are given in Table 5.1.7.
Tablica | Table 5.1.6. Kapaciteti prijenosne mreže HEP OPS-a | HEP-TSO transmission network capacities
Naponska razinaVoltage level
400 kV 220 kV 110 kVSrednji napon
Medium voltage
Duljina vodovaLines length (km)*
1 159 1 210 4 755 192
Broj TSNumber of substations
5 6 112
Snaga transformacije Installed power (MVA)
2 000 (400/220 kV) + 2 100 (400/110 kV) 2 120 4 881
Izvor | Source: HEP OPS | HEP TSO
* ukupne duljine vodova odnose se na pogonski napon u nadležnosti HEP OPS-a, kao i broj TS te broj i snaga transformatora | total length of lines, number of substations, number and power of transformers refer to the operational voltage levels coordinated by HEP-TSO
Tablica | Table 5.1.7. Kapaciteti distribucijske mreže HEP ODS-a | HEP-DSO distribution network capacities
Naponska razinaVoltage level
110 kV 35 (30) kV 20 kV 10 kV 0.4 kVKućni
priključci
Duljina vodovaLines length (km)*
77,9 4 725 5 031 30 341 62 559 30 204
Broj TSNumber of substations
8+2 (110/10(20) kV)
325(35(30)/10(20) kV)
3 421(20/0,4 kV)
20 916(10/0,4 kV)
Izvor | Source: HEP ODS | HEP DSO
* duljina vodova obuhvaća zbroj duljine nadzemnih vodova, kabela i podmorskih kabela iste naponske razine | length of lines is a sum of lengths of overhead lines, cables and marine cables of the same voltage level

163
ENERGY MMIXV ELECTRICITY
Slika | Figure 5.1.3. Elektroenergetska mreža Republike Hrvatske u 2009. godini | Electric network of the Republic of Croatia in 2009 – Izvor | Source: HEP OPS | HEP TSO
Total Cross-Border Exchange (GWh)
Izlaz izHrvatske
From Croatia
Razlikarazmjene
ExchangeBalance
11886 5525 6361
Godina
Year
2007
2009
2008
11840
5668
5682
6577122456158

164
ENERGIJA MMIXV ELEKTRIČNA ENERGIJA
5.2. Energetska bilanca električne energije
Tablica | Table 5.2.1. Električna energija | Electricity
2004. 2005. 2006. 2007. 2008. 2009. 2009/08. 2004-09.
GWh %
Proizvodnja Production 13321,3 12458,9 12429,6 12245,1 12325,6 12777,1 3,7 -0,8
-hidroelektrane -hydro power plants 7051,3 6438,6 6123,5 4400,2 5325,9 6814,4 27,9 -0,7
-vjetro elektrane -wind power plants 2,0 9,5 19,0 34,9 39,9 54,2 35,8 93,5
-fotonaponske ćelije -photovoltaic 0,0 0,0 0,0 0,0 0,1 0,1 0,0
-termoelektrane -thermal power plants 3612,5 3628,0 3936,2 5181,4 4414,3 3422,2 -22,5 -1,1
-javne toplane -public cogeneration plants 2120,9 1877,2 1875,4 2115,5 2085,7 2085,3 0,0 -0,3
-industrijske toplane -industrial cogeneration plants 534,6 505,6 475,5 513,1 459,7 400,9 -12,8 -5,6
Uvoz Import 5298,0 8746,4 8313,1 7811,8 8163,8 7580,7 -7,1 7,4
Izvoz Export 1632,8 3633,5 2690,9 1450,7 1586,9 1898,6 19,6 3,1
Ukupna potrošnja Energy supplied 16986,5 17571,8 18051,8 18606,2 18902,5 18459,2 -2,3 1,7
Gub.prijenosa i distribucije Transmiss. and distribution losses 2223,9 2130,9 1908,8 2026,8 1706,3 2018,8 18,3 -1,9
Gubici prijenosa Transmission losses 586,6 560,4 544,0 547,5 483,4 511,0 5,7 -2,7
Gubici distribucije Distribution losses 1637,3 1570,5 1364,8 1479,3 1222,9 1507,8 23,3 -1,6
Neto potrošnja Total consumption 14762,6 15440,9 16143,0 16579,4 17196,2 16440,4 -4,4 2,2
Potrošnja energetike Total energy sector 1074,8 1036,1 1080,7 1213,4 1077,6 951,0 -11,7 -2,4
-proizvodnja nafte i plina -oil and gas extraction 106,7 112,3 113,4 115,9 111,3 103,1 -7,4 -0,7
-proizvodnja ugljena -coal mines 0,0 0,0 0,0 0,0 0,0 0,0
-elektroprivreda -electric energy supply industry 30,9 33,2 33,4 34,0 31,4 32,0 1,9 0,7
-hidroelektrane -hydro power plants 166,0 182,7 216,5 264,6 194,6 156,5 -19,6 -1,2
-termoelektrane -thermo power plants 285,0 297,0 317,5 390,2 348,8 259,2 -25,7 -1,9
-javne toplane -public cogeneration plants 148,6 101,6 96,1 94,5 107,9 110,5 2,4 -5,8
-rafinerije -petroleum refineries 323,4 295,4 290,6 304,0 273,7 277,3 1,3 -3,0
-degazolinaža -NGL plant 14,2 13,9 13,2 10,2 9,9 12,4 25,3 -2,7
Neposredna potrošnja Final demand 13687,8 14404,8 15062,3 15366,0 16118,6 15489,4 -3,9 2,5
Industrija Industry 3215,8 3270,5 3455,3 3690,6 3685,7 3283,8 -10,9 0,4
-željeza i čelika -iron and steel 252,8 249,7 293,6 310,1 398,1 281,9 -29,2 2,2
-obojenih metala -non-ferrous metals 80,2 93,2 90,6 96,0 77,5 76,4 -1,4 -1,0
-stakla i nem. minerala -non-metallic minerals 126,4 130,3 133,1 138,6 118,8 113,4 -4,5 -2,1
-kemijska -chemical 478,6 484,3 483,9 600,0 494,6 456,7 -7,7 -0,9
-građevnog materijala -construction materials 590,5 611,0 648,8 652,8 675,3 565,7 -16,2 -0,9
-papira -pulp and paper 241,4 249,5 263,3 259,4 249,1 244,5 -1,8 0,3
-prehrambena -food production 571,7 522,0 555,6 575,6 632,1 615,6 -2,6 1,5
-ostala -not elsewhere specified 874,2 930,5 986,4 1058,1 1040,2 929,6 -10,6 1,2
Promet Transport 286,1 304,1 302,2 322,3 323,6 311,9 -3,6 1,7
-željeznički -rail 161,9 174,7 180,4 189,4 188,6 171,9 -8,9 1,2
-pomorski i riječni -sea and river 29,7 24,2 25,6 25,5 27,3 23,9 -12,5 -4,3
-javni gradski -public city 56,8 57,1 62,5 61,2 63,2 68,7 8,7 3,9
-ostali -not elsewhere specified 37,7 48,1 33,7 46,2 44,5 47,4 6,5 4,7
Opća potrošnja Other sectors 10185,9 10830,2 11304,8 11353,1 12109,3 11893,7 -1,8 3,1
-kućanstva -households 6072,1 6333,2 6520,3 6392,5 6711,4 6461,9 -3,7 1,3
-usluge -services 3808,5 4182,5 4455,3 4625,7 5033,3 5084,6 1,0 5,9
-poljoprivreda -agriculture 65,4 66,5 68,3 67,6 70,0 70,3 0,4 1,5
-graditeljstvo -construction 239,9 248,0 260,9 267,3 294,6 276,9 -6,0 2,9
Izvor | Source: EIHP
5.2 Energy Balance of Electricity

165
ENERGY MMIXV ELECTRICITY
Slika | Figure 5.2.1. Raspoloživa električna energija u Republici Hrvatskoj | Electricity supply in the Republic of Croatia Izvor | Source: HEP OPS | HEP TSO
Slika | Figure 5.2.2. Struktura potrošnje električne energije u Republici Hrvatskoj | Electricity consumption in the Republic of Croatia – Izvor | Source: HEP OPS | HEP TSO
-4000
-2000
0
2000
4000
6000
8000
10000
12000
14000
16000
18000
20000
22000
1988. 1990. 1995. 2000. 2005. 2009.
GWh
Hidroelektrane | Hydro power plants Vjetroelektrane | Wind power plants Termoelektrane | Thermal power plants Javne toplane | Public cogeneration plants Industrijske toplane | Industrial cogeneration plants Uvoz | ImportIzvoz | Export Ukupna potrošnja | Energy supplied
0
2000
4000
6000
8000
10000
12000
14000
16000
18000
20000
1988. 1990. 1995. 2000. 2005. 2009
GWh
Gubici prijenosa i distribucije | Transmission and distribution losses Potrošnja energetike | Energy sector own useIndustrija | Industry Promet | TransportKućanstva | Households Usluge | Services Ostala potrošnja | Agriculture, Construction

166
ENERGIJA MMIXV ELEKTRIČNA ENERGIJA
Tablica | Table 5.2.2. Potrošnja električne energije po distribucijskim područjima u 2009. godini (kWh) | Electricity consumption by distribution areas in 2009 (kWh)
Dist
ribuc
ijsko
po
druč
jeDi
strib
utio
n ar
ea
Viso
ki
napo
nHi
gh
Volta
ge
Sred
nji
napo
nM
ediu
m
Volta
ge
Nisk
i nap
on
Podu
zetn
ištv
o Lo
w V
olta
ge
Busi
ness
NN J
avna
ra
svje
taLV
Pub
lic
light
ing
Nisk
i nap
on
Kuća
nstv
aLo
w V
olta
ge
Hous
ehol
ds
Ukup
no
nisk
i nap
onTo
tal
Low
Vol
tage
UKUP
NOTO
TAL
Ukup
no ta
rifni
ku
pci
Tota
l tar
iff
cust
omer
s
Ukup
no p
ovl.
potr
ošač
iTo
tal e
ligib
le
cust
omer
s
Elek
tra
Zagr
eb40
.657
.789
926.
687.
996
1.24
5.03
7.40
612
2.11
3.64
91.
375.
217.
649
2.74
2.36
8.70
43.
709.
714.
489
2.25
9.42
5.63
21.
450.
288.
857
Elek
tra
Zabo
k-
128.
749.
855
113.
704.
084
9.68
3.03
415
0.16
8.60
827
3.55
5.72
640
2.30
5.58
120
0.36
5.13
020
1.94
0.45
1
Elek
tra
Vara
ždin
-15
5.99
2.65
813
6.23
7.47
012
.138
.565
169.
955.
221
318.
331.
256
474.
323.
914
236.
933.
752
237.
390.
162
Elek
tra Ča
kove
c-
74.0
59.6
1697
.055
.807
5.74
1.17
012
0.37
1.35
922
3.16
8.33
629
7.22
7.95
216
2.77
2.60
413
4.45
5.34
8
Elek
tra
Kopr
ivni
ca-
98.3
15.4
3381
.788
.349
8.10
5.58
812
8.43
7.47
221
8.33
1.40
931
6.64
6.84
216
7.69
8.79
514
8.94
8.04
7
Elek
tra
Bjel
ovar
-25
.454
.120
112.
872.
361
8.76
9.27
713
4.57
3.69
425
6.21
5.33
228
1.66
9.45
217
3.48
0.08
210
8.18
9.37
0
ELEK
TRA
KRIŽ
-13
1.18
5.94
311
5.34
2.98
511
.828
.013
180.
480.
411
307.
651.
409
438.
837.
352
237.
028.
829
201.
808.
523
Elek
tros
lavo
nija
Osi
jek
-21
8.46
4.49
722
0.36
6.49
025
.175
.561
433.
514.
918
679.
056.
969
897.
521.
466
561.
567.
850
335.
953.
616
Elek
tra
Vink
ovci
-83
.692
.893
99.9
74.9
2917
.517
.806
252.
640.
197
370.
132.
932
453.
825.
825
310.
934.
493
142.
891.
332
Elek
tra
Sl. B
rod
-85
.028
.580
77.6
88.0
3812
.421
.137
182.
047.
783
272.
156.
958
357.
185.
538
231.
329.
946
125.
855.
592
Elek
troi
stra
Pul
a-
335.
495.
435
279.
724.
173
25.9
20.7
1845
1.64
3.55
475
7.28
8.44
41.
092.
783.
879
641.
228.
435
451.
555.
444
Elek
trop
rimor
je R
ijeka
-35
8.40
9.89
138
2.50
0.40
132
.389
.628
629.
674.
668
1.04
4.56
4.69
71.
402.
974.
588
839.
122.
095
563.
852.
493
Elek
trod
alm
acija
Spl
it41
1.34
019
3.37
6.38
355
9.93
9.64
251
.399
.122
914.
654.
926
1.52
5.99
3.69
01.
719.
781.
413
1.22
2.49
4.15
449
7.28
7.25
9
Elek
tra
Zada
r-
124.
218.
465
161.
287.
360
24.5
71.9
5833
7.12
7.08
952
2.98
6.40
764
7.20
4.87
244
8.82
6.13
619
8.37
8.73
6
Elek
tra
Šibe
nik
-48
.033
.429
127.
926.
456
15.0
96.3
3920
9.01
1.26
435
2.03
4.05
940
0.06
7.48
827
9.56
9.32
012
0.49
8.16
8
Elek
troj
ug D
ubro
vnik
-73
.850
.964
117.
818.
986
12.6
79.8
7419
6.22
7.21
332
6.72
6.07
340
0.57
7.03
727
3.01
8.67
012
7.55
8.36
7
Elek
tra
Karlo
vac
-12
6.04
5.47
510
7.32
6.92
719
.625
.402
208.
122.
932
335.
075.
261
461.
120.
735
282.
589.
048
178.
531.
687
Elek
tra
Sisa
k13
9.25
6.87
548
.854
.986
68.5
07.2
9612
.847
.701
159.
066.
401
240.
421.
398
428.
533.
259
203.
027.
452
225.
505.
807
Elek
trol
ika
Gosp
ić-
28.3
77.2
3864
.585
.510
7.67
4.57
686
.970
.328
159.
230.
414
187.
607.
652
126.
022.
859
61.5
84.7
93
Elek
tra
Viro
vitic
a-
40.4
79.1
9242
.632
.856
4.93
6.14
677
.145
.003
124.
714.
005
165.
193.
197
96.4
91.4
9668
.701
.701
Elek
tra
Pože
ga-
57.3
72.2
6528
.038
.418
5.69
4.02
074
.717
.780
108.
450.
218
165.
822.
483
91.8
96.9
2473
.925
.559
UKUP
NO |
TOT
AL18
0.32
6.00
43.
362.
145.
314
4.24
0.35
5.94
444
6.32
9.28
46.
471.
768.
469
11.1
58.4
53.6
9614
.700
.925
.014
9.04
5.82
3.70
25.
655.
101.
312
Izvo
r | S
ourc
e: H
EP

167
ENERGY MMIXV ELECTRICITY
U tablicama 5.2.2. i 5.2.3. nalazi se pregled broja kupaca i potrošnja električne energije po naponskim razinama, katego-rijama potrošnje i distribucijskim područjima.
Tablica | Table 5.2.3. Broj mjernih mjesta po kategorijama potrošnje (naponskim razinama) | Number of metering points by consumption categories (voltage levels)
2003. 2004, 2005, 2006, 2007, 2008. 2009,
VNHV
49 37 31 44 40 11*+5 34**+4
SNMV
1 905 1 927 1 935 2 008 2 015 2 056 2 081
NN PoduzetništvoLV Business
170 053 10 462 175 534 181 771 190 370 191 520 188 775
NN Javna rasvjetaLV Public lighting
17 987 18 412 19 103 19 498 19 843 20 401 20 818
NN KućanstvaLV Households
1 911 758 1 938 230 1 962 554 1 990 030 2 028 935 2 069 016 2 099 133
UKUPNOTOTAL
2 101 751 2 129 068 2 159 157 2 193 351 2 241 203 2 283 009 2 310 845
Izvor | Source: HEP ODS | HEP DSO
* 11 kupaca priključenih na HEP OPS i 5 mjernih mjesta priključenih na HEP ODS | 11 customers connected to HEP TSO and 5 metering points connected to HEP DSO** Ugovori o opskrbi sklapaju se prema načelu jedan kupac – jedan ugovor – jedan račun za sva obračunska mjerna mjesta | Contracts on electricity supply are based on the principle of one client – one contract – one invoice for all metering points
In Tables 5.2.2 and 5.2.3 are shown numbers of customers by voltage level, consumption categories and distribution areas.
5.3. Energetski subjekti
Za izdavanje dozvola za obavljanje energetskih djelatnosti, kao i za privremeno i trajno oduzimanje dozvola nadležna je Hrvatska energetska regulatorna agencija (HERA) u skladu sa Zakonom o regulaciji energetskih djelatnosti (NN 177/2004) i Zakonom o izmjenama i dopunama Zakona o energiji (NN 177/2004).
Energetska dozvola potrebna je za 26 energetskih djelatnosti. Do 31. prosinca 2009. godine izdano je ukupno 20 dozvola za elektroenergetske djelatnosti te 35 dozvola za djelatnost trgovanja, posredovanja i zastupanja na tržištu energije. U tablici 5.3.1 prikazan je broj subjekata s važećim dozvolama za obavljanje pojedinih djelatnosti na kraju 2009. godine (neki nisu produljili dozvole). Detaljniji podaci o svim regi-striranim subjektima dostupni su na internetskim stranicama HERA-e (www.hera.hr).
5.3 Energy Companies
The Croatian Energy Regulatory Agency (CERA) issues licen-ses for energy activities according to the Energy Law and its amendments and Law on Regulation of Energy Activities (Official Gazette 177/04).
Energy licenses are required for 26 energy activities. Until December 31st, 2009 a total of 20 licenses were issued in the electric power sector and 35 licenses in category of trade, representation and agency on energy market. Table 5.3.1 shows number of subjects with valid licences for specific energy activities at the end of 2009 (some subjects have not prolonged their licences). More detailed information on all ever registered subjects can be obtained on CERA’s web page (www.hera.hr).

168
ENERGIJA MMIXV ELEKTRIČNA ENERGIJA
Tablica | Table 5.3.1. Subjekti s važećim dozvolama za obavljanje elektroenergetskih djelatnosti na kraju 2009. godine | Subjects with valid licences in the electricity sector at the end of 2009
Energetska djelatnostEnergy activity
Broj subjekata s važećim dozvolama na kraju 2009.Number of valid licences at the end of 2009
Energetski subjektCompany
Proizvodnja električne energije Electricity generation
12
Prijenos električne energijeElectricity transmission
1 HEP Operator prijenosnog sustava d.o.o.
Distribucija električne energijeElectricity distribution
1 HEP Operator distribucijskog sustava d.o.o.
Opskrba električnom energijomElectricity supply
5
HEP Opskrba d.o.o.
HEP Operator distribucijskog sustava d.o.o.
HEP Toplinarstvo d.o.o.
KORLEA d.o.o.
PARTNER ELEKTRIK d.o.o
Organiziranje tržišta električne energijeElectricity market control
1 Hrvatski operator tržišta energije d.o.o.
Trgovanje, posredovanje i zastupanje na tržištu energijeTrade, representation and agency on energy market
30
Izvor | Source: HERA
5.4. Cijene električne energije
Ostvarena prosječna prodajna cijena električne energije u 2009. godini prikazana je u tablici 5.4.1. po kategorijama kupaca prema Eurostat metodi.
Od 1. srpnja 2008. godine primjenjuju se nove tarifne stavke za obračun potrošnje električne energije strukturirane prema tarifnim sustavima za pojedine energetske djelatnosti: proizvodnju električne energije (s iznimkom za povlaštene kupce), prijenos i distribuciju električne energije te opskrbu električnom energijom (s iznimkom za povlaštene kupce). Odluka o provedbi mjera za ublažavanje porasta cijena elek-trične energije građanima i kućanstvima također se primje-njuje za obračun potrošene električne energije od 1. srpnja 2008. do 30. lipnja 2010. godine.
5.4 Electricity Prices
Average selling price of electrical energy in year 2009 (exc-luded VAT) according to Eurostat categories is shown in Table 5.4.1.
Since July 1st, 2008 new tariffs, structured according to the tariff systems for all the energy activities: electricity genera-tion (with the exception for eligible customers), electricity transmission and distribution as well as supply (with the exception for eligible customers), are applied. In addition, until June 30, 2010 the Decree on implementation of measu-res for mitigation of electricity prices increase for citizens and households is valid.
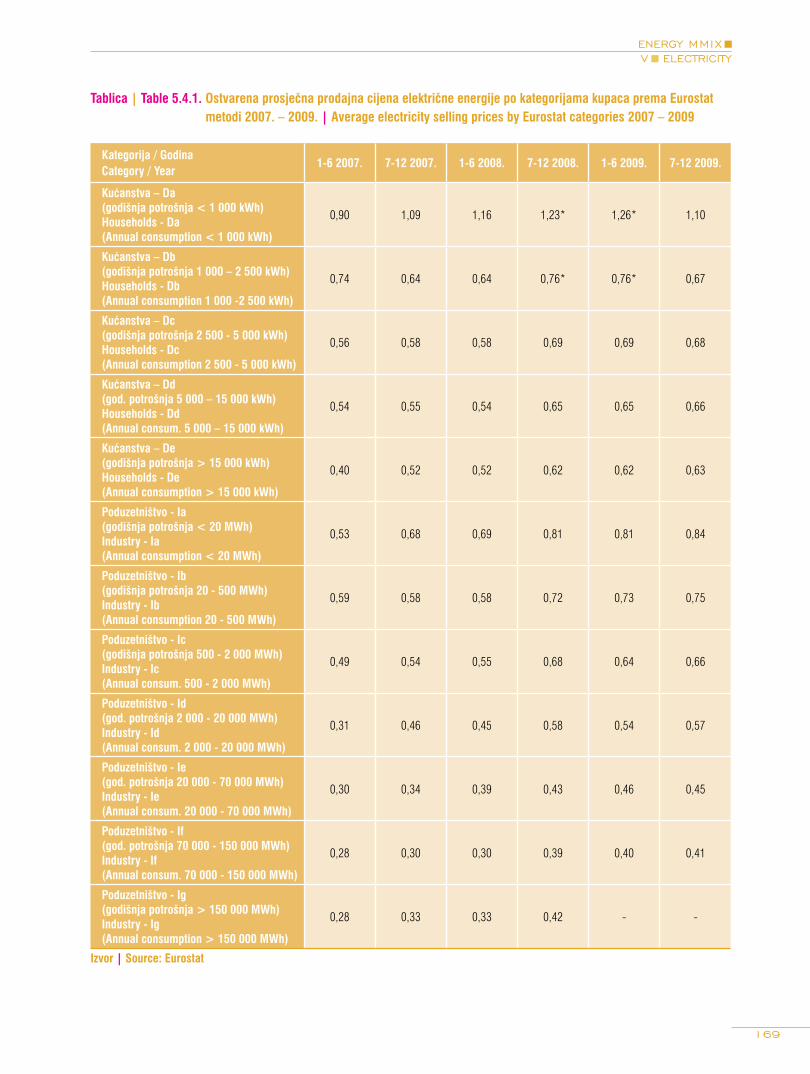
169
ENERGY MMIXV ELECTRICITY
Tablica | Table 5.4.1. Ostvarena prosječna prodajna cijena električne energije po kategorijama kupaca prema Eurostat metodi 2007. – 2009. | Average electricity selling prices by Eurostat categories 2007 – 2009
Kategorija / GodinaCategory / Year
1-6 2007. 7-12 2007. 1-6 2008. 7-12 2008. 1-6 2009. 7-12 2009.
Kućanstva – Da (godišnja potrošnja < 1 000 kWh)Households - Da (Annual consumption < 1 000 kWh)
0,90 1,09 1,16 1,23* 1,26* 1,10
Kućanstva – Db (godišnja potrošnja 1 000 – 2 500 kWh)Households - Db (Annual consumption 1 000 -2 500 kWh)
0,74 0,64 0,64 0,76* 0,76* 0,67
Kućanstva – Dc (godišnja potrošnja 2 500 - 5 000 kWh)Households - Dc (Annual consumption 2 500 - 5 000 kWh)
0,56 0,58 0,58 0,69 0,69 0,68
Kućanstva – Dd (god. potrošnja 5 000 – 15 000 kWh)Households - Dd (Annual consum. 5 000 – 15 000 kWh)
0,54 0,55 0,54 0,65 0,65 0,66
Kućanstva – De (godišnja potrošnja > 15 000 kWh)Households - De (Annual consumption > 15 000 kWh)
0,40 0,52 0,52 0,62 0,62 0,63
Poduzetništvo - Ia (godišnja potrošnja < 20 MWh)Industry - Ia (Annual consumption < 20 MWh)
0,53 0,68 0,69 0,81 0,81 0,84
Poduzetništvo - Ib (godišnja potrošnja 20 - 500 MWh)Industry - Ib (Annual consumption 20 - 500 MWh)
0,59 0,58 0,58 0,72 0,73 0,75
Poduzetništvo - Ic (godišnja potrošnja 500 - 2 000 MWh)Industry - Ic (Annual consum. 500 - 2 000 MWh)
0,49 0,54 0,55 0,68 0,64 0,66
Poduzetništvo - Id (god. potrošnja 2 000 - 20 000 MWh)Industry - Id (Annual consum. 2 000 - 20 000 MWh)
0,31 0,46 0,45 0,58 0,54 0,57
Poduzetništvo - Ie (god. potrošnja 20 000 - 70 000 MWh)Industry - Ie (Annual consum. 20 000 - 70 000 MWh)
0,30 0,34 0,39 0,43 0,46 0,45
Poduzetništvo - If (god. potrošnja 70 000 - 150 000 MWh)Industry - If (Annual consum. 70 000 - 150 000 MWh)
0,28 0,30 0,30 0,39 0,40 0,41
Poduzetništvo - Ig (godišnja potrošnja > 150 000 MWh)Industry - Ig (Annual consumption > 150 000 MWh)
0,28 0,33 0,33 0,42 - -
Izvor | Source: Eurostat

TOPLINSKA ENERGIJA HEAT ENERGY
VIVI


173
ENERGY MMIXVI HEAT ENERGY
6.1. Zakonodavno okruženje
Ratificiranjem Ugovora o Energetskoj povelji (NN - Međuna-rodni ugovori, brojevi 15/1997 i 06/2003) Republika Hrvatska je započela proces zakonodavnog restrukturiranja energetskog sektora i usklađivanje nacionalnog zakonodavnog okvira s pravnim okvirom Europske unije. Tim činom Hrvatska se obvezala da će se u postupku pridruživanja na području sek-tora energetike voditi načelima tržišne ekonomije, povećanja energetske učinkovitost i zaštite okoliša. Konzekventno su doneseni i drugi energetski propisi koji bi trebali osigurati provedbu navedenog, a od kojih su najznačajniji i u 2009. godini bili:
• Nacionalna strategija zaštite okoliša (NN 46/2002)
• Zakon o energiji (NN 68/2001, 177/2004, 76/2007 i 152/2008)
• Zakon o regulaciji energetskih djelatnosti (NN 177/2004)
• Zakon o proizvodnji, distribuciji i opskrbi toplinskom ener-gijom ( NN 42/2005 i 76/2007)
• Tarifni sustav za usluge energetskih djelatnosti proizvodnje, distribucije i opskrbe toplinskom energijom, bez visine tarifnih stavki (NN 57/2006 i 154/2008)
• Opći uvjeti za opskrbu toplinskom energijom (NN 129/2006)
• Odluka o visini tarifnih stavki u Tarifnom sustavu za usluge energetskih djelatnosti proizvodnje, distribucije i opskrbe toplinskom energijom (NN 154/2008)
• Pravilnik o načinu raspodjele i obračunu troškova za ispo-ručenu toplinsku energiju (NN 139/2008)
Zakon o energiji je krovni zakon kojim su određene mjere za pouzdanu opskrbu energijom i njezinu učinkovitu proizvod-nju i korištenje. Zakonom se: određuje modus provođenja energetske politike i razvoja sektora, definiraju energetske djelatnost bilo kao tržišne djelatnosti ili kao javne usluge te način obavljanja istih, definiraju cijene energije i metodo-logija donošenja tarifnih sustava, općih uvjeta za obavljanje djelatnosti i ostalih pravnih odredbi.
6.1. Legislation
By ratifying the Energy Charter Treaty (Official Gazette – International Agreements no. 15/1997 and 06/2003) the Republic of Croatia started the process of legislative restruc-turing of the energy sector and the process of harmonization of the national legal framework with relevant legal framework of the European Union. Thus, in its process of the EU acce-ssion, Croatia took commitment to comply with principles of market economy in the energy sector, enhancing energy efficiency and environmental protection. Accordingly, Croatia has adopted other legal acts regulating the energy issues in order to ensure such a compliance: Among these, the most important ones that were in force in 2009 are the following :
• National Strategy for Environmental Protection (Official Gazette 46/2002)
• Energy Law (Official Gazette 68/2001, 177/2004, 76/2007 and 152/2008)
• Law on Regulation of Energy Activities (Official Gazette 177/2004)
• Law on Production, Distribution and Supply of Heat Energy (Official Gazette 42/2005 and 76/2007)
• Heat Tariff System without Tariff Item Amounts (Official Gazette 57/2006 and 154/2008)
• General Conditions for District Heating Supply (Official Gazette 129/2006)
• Decision on the Tariff Item Amounts in the Heat Tariff System (Official Gazette 154/2008)
• Ordnance on Allocation and Calculation of Costs for Supplied Thermal Energy (Official Gazette 139/2008)
The Energy law in the umbrella law which sets up instruments for reliable energy supply and efficient production and use of energy. The Law determines: the way of implementing energy policy and development of the energy sector; definition of the energy activities, either as market-based activities or as public service activities and the way they must be performed; definition of the energy prices and methodologies of adopting tariff systems; general conditions for activity performance and other legal provisions.

174
ENERGIJA MMIXVI TOPLINSKA ENERGIJA
Zakon o proizvodnji, distribuciji i opskrbi toplinskom ener-gijom, donesen 1. travnja 2005. godine, je krovni zakon za sektor toplinarstva i njime se određuju uvjeti za obavljanje djelatnosti proizvodnje, distribucije i opskrbe toplinskom energijom. Osim toga Zakonom se određuju: prava i obaveze subjekta koji te djelatnosti obavljaju, prava i obaveze kupaca toplinske energije, osiguravanje sredstava za obavljanje tih djelatnosti i izgradnju infrastrukture (objekata i tehničke opreme) te nadzor nad njegovom primjenom.
Proizvođači toplinske energije u skladu sa Zakonom moraju ishodovati dozvolu nadležnog tijela - Hrvatske energetske regulatorne agencije (HERA). Zakonom se uvode pojmovi koji će biti pobliže definirani pravilnicima koje treba donijeti u budućnosti, a to su kategorije kao što je npr. povlaštenost proizvodnje, jamstvo o porijeklu, kriteriji učinkovitosti i sl.
6.2. Energetski subjekti
Prema Zakonu o energiji proizvodnja, distribucija i opskrba toplinskom energijom postaju energetske djelatnosti, te svi energetski subjekti koji djeluju u sektoru toplinarstva trebaju ishoditi dozvolu za obavljanje ovih djelatnosti od strane Hrvatske energetske regulatorne agencije.
Energetski subjekti u sektoru toplinarstva mogu obavljati slje-deće djelatnosti:
1. Proizvodnju toplinske energije koja se definira kao fizikalni ili kemijski proces pretvorbe goriva ili obnovljivih izvora u toplinsku energiju
2. Distribuciju toplinske energije koja se definira kao prijenos toplinske energije do kupca, od mjernog mjesta za preu-zimanje toplinske energije do mjernog mjesta za prodaju toplinske energije
3. Opskrbu toplinskom energijom koja se definira kao prodaja toplinske energije kupcu
Tvrtke koje obavljaju toplinske djelatnosti moraju ispunjavati uvjete utvrđene Pravilnikom o uvjetima za obavljanje energet-skih djelatnosti (NN 06/2003 i 94/2005).
Prema podacima Hrvatske energetske regulatorne agencije u 2009. godini je 22 tvrtki posjedovalo dozvolu za proizvodnju toplinske energije, 17 tvrtki je posjedovalo dozvolu za distri-
The Law on Production, Distribution and Supply of Heat Energy was adopted on 1 April 2005, as the umbrella law for the heat energy sector. The Law defines the conditions for performance of production, distribution and supply of heat energy. It also determines: rights and obligations of the energy companies performing heat energy activities; rights and obligations of heat energy buyers; provisions of means for performing heat energy activities and development of infrastructure (facilities and technical equipment); and over-seeing its implementation.
The law provides that all heat energy producers must obtain a license from a competent authority – the Croatian Energy Regulatory Agency (HERA). The Law also introduces the terms, such as production eligibility, guarantee of origin, efficiency criteria, etc. These terms will be defined in more details by rules and regulations to be adopted in the future.
6.2. Energy companies in Heat Energy Sector
Under the Energy Law, the production, distribution and supply of heat energy became energy activities, and all energy entiti-es operating in the heat energy sector must obtain a relevant license for performing these activities from the Croatian Energy Regulatory Agency.
The energy entities operating in the heat energy sector may carry out the following activities:
1. Production of heat energy which is defined as physical and chemical process of transforming fuel or renewable sour-ces in to heat energy
2. Distribution of heat energy which is defined as transfer of heat energy to customers, from a metering point for heat energy delivery to a metering point of sale of heat energy
3. Supply of heat energy which is defined as selling heat energy to customers
Companies which perform the energy activities must meet the requirements set out in the Regulation on Conditions for Performing Energy Activities (Official Gazette 06/2003 and 94/2005).
In 2009, according to data from the Croatian Energy Regulatory Agency, 22 companies were license holders for

175
ENERGY MMIXVI HEAT ENERGY
buciju toplinske energije, dok je 23 tvrtki posjedovalo dozvo-lu za opskrbom toplinskom energijom.
Podaci o energetskim subjektima koji su do sada dobili dozvole za toplinske djelatnosti mogu se naći na službenoj internetskoj stranici Hrvatske energetske regulatorne agencije (www.hera.hr).
Osnovni podaci o energetskim subjektima u sektoru toplinar-stva dani su u tablici 6.2.1.
heat energy production in 2009; 17 companies were license holders for heat energy distribution, and 23 companies were license holders for heat energy supply.
The data on energy entities who have been issued the heat energy licenses until now can be found on the web page of the Croatian Energy Regulatory Agency (www.hera.hr).
Table 6.2.1. gives general information about energy entities in the heat energy sector.
Tablica | Table 6.2.1. Osnovni podaci o važnijim energetskim subjektima u sektoru toplinarstva Republike Hrvatske | General data on major energy entities in the heat energy sector in the Republic of Croatia
Tvrtka, gradCompany, town
Broj potrošačaNo. of consumers
Instalirana topl. snagaInstalled ther. capacity
Instal. snaga u par. kotlovimaInstalled steam power
MWt t/h
Brod-plin d.o.o.Slavonski Brod
3 773 49,34 0
Energo d.o.o.Rijeka
9 513 103,61 0
HEP Toplinarstvo - Pogon toplinske mrežeZagreb
89 367 909,52 263,75
HEP Toplinarstvo - Pogon posebne toplaneZagreb, Velika Gorica, Zaprešić, Samobor
16 945 133,24 0
HEP Toplinarstvo - Pogon OsijekOsijek
11 307 100,1 140
HEP Toplinarstvo - Pogon SisakSisak
4 065 38,93 n/a
HVIDRA d.o.o.Split
3 265 22,1 11,5
Tehnostan d.o.o.Vukovar
3 370 45,64 0
Tekija d.o.o.Požega
460 7,2 0
Termalna Voda d.o.o.Topusko
175 8,2 0
Grijanje Varaždin d.o.o.Varaždin
2 786 40,8 0
Toplana d.o.o.Karlovac
8 124 117,63 0
Vinkovački vodovod i kanalizacija d.o.o.Vinkovci
n/a 16,8 0
Plin VTC d.o.o.Virovitica
484 9,8 0
UKUPNOTOTAL
145 510 1602,91 415,25
Izvor | Source: EIHP

176
ENERGIJA MMIXVI TOPLINSKA ENERGIJA
6.3. Energetska bilanca toplinske energije
Tablica | Table 6.3.1. Para i vrela voda | Steam and hot water
2004. 2005. 2006. 2007. 2008. 2009. 2009/08. 2004-09.
PJ %
PROIZVODNJA Production 35,093 34,418 33,224 32,447 32,161 30,723 -4,5 -2,6
-javne toplane -public cogeneration plants 9,561 9,847 8,888 8,676 8,986 8,695 -3,2 -1,9
-javne kotlovnice -public heating plants 3,304 3,478 2,984 2,988 2,964 2,903 -2,1 -2,6
-industrijske toplane -industrial cogen. plants 15,836 15,468 15,576 15,398 15,359 14,850 -3,3 -1,3
-industrijske kotlovnice -industrial heating plants 6,392 5,625 5,775 5,385 4,851 4,275 -11,9 -7,7
Ukupna potrošnja Energy supplied 35,093 34,418 33,224 32,447 32,161 30,723 -4,5 -2,6
Gubici distribucije Distribution losses 1,564 1,673 1,504 1,746 1,596 1,260 -21,1 -4,2
Neto potrošnja Total consumption 33,529 32,745 31,719 30,700 30,565 29,463 -3,6 -2,6
Potrošnja energetike Total energy sector 9,621 9,136 9,160 9,047 9,183 9,241 0,6 -0,8
-proizvodnja nafte i plina -oil and gas extraction 0,858 0,847 0,669 0,231 0,848 0,783 -7,7
-degazolinaža -NGL plant 0,508 0,512 0,512 0,470 0,402 0,397 -1,2
-javne toplane -public cogeneration plants 0,891 0,871 0,770 0,798 0,860 0,789 -8,3 -2,4
-rafinerije -petroleum refineries 7,364 6,907 7,209 7,548 7,073 7,273 2,8 -0,2
Neposredna potrošnja Final demand 23,908 23,609 22,559 21,653 21,382 20,222 -5,4 -3,3
Industrija Industry 15,625 15,072 14,956 14,377 13,727 12,430 -9,5 -4,5
-željeza i čelika -iron and steel 0,164 0,142 0,114 0,010 0,036 0,101 180,2 -9,3
-obojenih metala -non-ferrous metals 0,000 0,002 0,000 0,000 0,000 0,000
-stakla i nem. minerala -non-metallic minerals 0,091 0,070 0,197 0,185 0,187 0,132 -29,7 7,7
-kemijska -chemical 5,115 4,893 4,788 4,776 5,012 4,463 -11,0 -2,7
-građevnog materijala -construction materials 0,036 0,030 0,033 0,019 0,009 0,001 -87,2 -49,4
-papira -pulp and paper 1,975 2,278 2,207 1,748 1,545 1,988 28,7 0,1
-prehrambena -food production 4,726 4,548 4,745 4,740 4,588 3,512 -23,4 -5,8
-ostala -not elsewhere specified 3,518 3,108 2,872 2,901 2,350 2,233 -5,0 -8,7
Opća potrošnja Other sectors 8,283 8,536 7,603 7,276 7,655 7,744 1,2 -1,3
-kućanstva -households 6,587 6,876 6,119 5,785 5,998 6,142 2,4 -1,4
-usluge -services 1,696 1,661 1,485 1,491 1,657 1,603 -3,3 -1,1
Izvor | Source: EIHP

177
ENERGY MMIXVI HEAT ENERGY
Slika | Figure 6.3.1. Proizvodnja pare i vrele vode u Hrvatskoj | Steam and hot water production in Croatia Izvor | Source: EIHP
Slika | Figure 6.3.2. Struktura potrošnje pare i vrele vode | Shares in steam and hot water consumption Izvor | Source: EIHP
0
5
10
15
20
25
30
35
40
45
50
1988. 1990. 1995. 2000. 2005. 2009.
PJ
Javne toplane | Public cogeneration plants
Javne kotlovnice | Public heating plants
Industrijske toplane | Industrial cogeneration plants
Industrijske kotlovnice | Industrial heating plants
Ukupna potrošnja | Energy supplied
0
5
10
15
20
25
30
35
40
45
50
1988. 1990. 1995. 2000. 2005. 2009.
PJ
Gubici distribucije | Distribution losses
Potrošnja energetike | Energy sector own use
Industrija | Industry
Kućanstva | Households
Usluge | Services

178
ENERGIJA MMIXVI TOPLINSKA ENERGIJA
6.4. Cijena toplinske energije
Cijene u sektoru toplinarstva regulirane su na nacionalnoj razini. Tarifnim sustavom se određuju tarifne stavke na teme-lju reguliranog maksimalnog ukupnog prihoda u regulacijskog godini unutar određenog regulacijskog ciklusa. Na ovaj način određuje se dopuštena visina ukupno ostvarenog godišnjeg prihoda pojedinog subjekta u sektoru toplinarske djelatnosti.
Vlada Republike Hrvatske donosi odluku o visini tarifnih stavki. Temeljem članka 28, stavka 2, Zakona o energiji Vlada je na sjednici održanoj 19. prosinca 2008. godine donijela Odluku o visini tarifnih stavki u tarifnom sustavu za usluge energetskih djelatnosti proizvodnje, distribucije i opskrbe toplinskom energijom (NN 154/2008). Visine tarifnih stavki određenih spomenutom Odlukom na snazi su od 1. siječnja 2009. godine.
6.4. Heat Energy Prices
The heat energy sector prices are regulated at the national level. The tariff system determines the tariff items on the basis of regulated cap revenue in a regulated year within a regulatory period. In this system a maximum amount of annual revenues that an energy entity is allowed to receive from performing a heat energy activity is determined.
The amounts of the tariff items are set out by the Decision of the Government of the Republic of Croatia. Based on Article 28 paragraph 2 of the Energy Law, the Government issued on 19 December 2008 the Decision on the amounts of tariff items in the tariff system for services of production distribution and supply of heat energy (Official Gazette 154/2008). The amo-unts of tariff items from the mentioned Decision have been in force since 1 January 2009.
Tablica | Table 6.4.1. Tarifne stavke toplinarskih tvrtki prema Odluci Vlade iz prosinca 2008., važećih u 2009. | Tariff items of heat energy companies based on the Government’s Decision of December 2008, effective in 2009
Energija | Energy Snaga | Capacity
kn*/MWh kn*/MW
način obrač. | calc. method prema očitanoj potrošnji | consumption based mjesečno | monthly
kućanstva | residential gospodarstvo | business kućanstva | residential gospodarstvo | business
HEP Toplinarstvo Zagreb
120 230 11.130 14.420
HEP Toplinarstvo Osijek
120 230 11.130 14.420
HEP Toplinarstvo Sisak
120 230 11.130 14.420
HEP Toplinarstvo – Posebne toplane
200 230 14.420 14.420
Virkom d.o.o.Virovitica
220 230 18.000 18.000
Termoplin d.d.Varaždin
220 240 18.700 18.700
Vinkovački vodovod i kanaliz. d.o.o., Vinkovci
220 240 18.700 18.700
Energo d.o.o.Rijeka
230 280 17.000 18.260
Tehnostan d.o.o.Vukovar
230 300 18.380 18.380
Brod-Plin d.o.o.Slavonski Brod
230 300 18.700 18.700
Tekija d.o.o.Požega
240 0 18.700 -
Hvidra d.o.o.Split
270 310 11.220 14.590
Toplana d.o.o.Karlovac
0 773 5,51 kn/m2 19,92 kn/m2
Izvor | Source: EIHP *bez PDV-a | excl. VAT

179
ENERGY MMIXVI HEAT ENERGY
Slika | Figure 6.4.1. Usporedba tarifnih stavki za energiju po toplinarskim tvrtkama | Comparison of tariff items for energy by heat energy companies – Izvor | Source: EIHP
Slika | Figure 6.4.2. Usporedba tarifnih stavki za snagu po toplinarskim tvrtkama, mjesečni trošak | Comparison of tariff items for energy by heat energy companies, monthly cost – Izvor | Source: EIHP
0
50
100
150
200
250
300
350
HEP
Topl
inar
stvo
Zagr
eb
HEP
Topl
inar
stvo
Osije
k
HEP
Topl
inar
stvo
Sisa
k
HEP
Topl
inar
stvo
-Po
sebn
e to
plan
e
Virk
om d
.o.o
.,Vi
rovi
tica
Term
oplin
d.d
.,Va
ražd
in
Vink
ovač
kivo
dovo
d i
kana
lizac
ija d
.o.o
.,Vi
nkov
ci
Ener
go d
.o.o
.,Ri
jeka
Tehn
osta
n d.
o.o.
,Vu
kova
r
Brod
-Plin
d.o
.o.,
Slav
onsk
i Bro
d
Teki
ja d
.o.o
.,Po
žega
Hvid
ra d
.o.o
., Sp
lit
kn/M
Wh
Kućanstva | Households
Gospodarstvo | Industry
HEP
Topl
inar
stvo
Zagr
eb
HEP
Topl
inar
stvo
Osije
k
HEP
Topl
inar
stvo
Sisa
k
Pose
bne
topl
ane
Virk
om d
.o.o
.,Vi
rovi
tica
Term
oplin
d.d
.,Va
ražd
in
Vink
ovač
kivo
dovo
d i
Vink
ovci
Ener
go d
.o.o
.,Ri
jeka
Tehn
osta
n d.
o.o.
,Vu
kova
r
Brod
-Plin
d.o
.o.,
Slav
onsk
i Bro
d
Teki
ja d
.o.o
.,Po
žega
Hvid
ra d
.o.o
., Sp
lit2000
0
4000
6000
8000
10000
12000
14000
16000
18000
20000
kn/M
W
Kućanstva | Households
Gospodarstvo | Industry


UGLJEN COAL
VIIVII


183
ENERGY MMIXVI I COAL
7.1. Rezerve ugljena
Tablica | Table 7.1.1. Rezerve ugljena | Coal reserves
1990. 1995. 2000. 2005. 2006. 2007. 2008. 2009.
tisuće t Thousand metric tons
Kameni ugljenHard coal
4 214,3 3 672,0 3 716,0 3 716,0 3 716,0 3 716,0
Mrki ugljenBrown coal
2 925,8 2 917,0 3 646,0 3 646,0 3 646,0 3 646,0
LignitLignite
33 315,5 33 291,0 37 787,0 37 787,0 37 787,0 37 787,0
UGLJEN UKUPNOCOAL TOTAL*
40 455,6 39 880,0 45 149,0 45 149,0 45 149,0 45 149,0 6 460,9 6 460,9
Izvor | Source: Ministarstvo gospodarstva, rada i poduzetništva | Ministry of Economy, Labour and Entrepreneurship
Slika | Figure 7.1.1. Proizvodnja i rezerve ugljena | Coal production and reserves Izvor | Source: Ministarstvo gospodarstva, rada i poduzetništva | Ministry of Economy, Labour and Entrepreneurship
* Od 1999. godine rezerve ugljena su razvrstane u izvanbilančne. Od 2008. godine je razlika do ukupnih količina prebačena u kategoriju potencijalnih rezervi | Since 1999, coal reserves are classified as non-exploitable. The difference to the total quantity since 2008 was transferred to the category of potential reserves
7.1 Coal Reserves
0
5000
10000
15000
20000
25000
30000
35000
40000
45000
50000
1988. 1990. 1995. 2000. 2005. 2009.
Reze
rve
| Re
serv
es (1
03 t)
0
30
60
90
120
150
180
210
240
Proi
zvod
nja
| Pr
oduc
tion
(103
t)
Kameni ugljen | Hard coal (Rezerve | Reserves)
Mrki ugljen | Brown coal (Rezerve | Reserves)
Lignit | Lignite (Rezerve | Reserves)
Kameni ugljen | Hard coal (Proizvodnja | Production)
Mrki ugljen | Brown coal (Proizvodnja | Production)
Lignit | Lignite (Proizvodnja | Production)
Ugljen ukupno | Coal total (Rezerve | Reserves)

184
ENERGIJA MMIXVI I UGLJEN
7.2. Energetska bilanca ugljena i koksa
Tablica | Table 7.2.1. Ugljen i koks | Coal and coke
2004. 2005. 2006. 2007. 2008. 2009. 2009/08. 2004-09.
tisuće t Thousand metric tons %
UKUPNA PROIZVODNJA TOTAL PRODUCTION 0,0 0,0 0,0 0,0 0,0 0,0 -2,6
Uvoz Import 1.320,5 1.063,4 1.187,5 1.195,6 1.352,5 785,6 -41,9 -9,9
Izvoz Export 1,2 0,3 0,0 0,7 0,0 0,2 -30,1 -2,6
Saldo skladišta Stock change -111,0 99,2 -95,9 -20,8 -145,6 87,7 -1,3
Ukupna potrošnja Energy supplied 1.208,3 1.162,3 1.091,6 1.174,1 1.206,9 873,1 -27,7 -6,3
Energ. transformacije Total transformation sector 905,7 935,2 890,1 944,4 971,6 677,1 -30,3 -5,7
-termoelektrane -thermo power plants 852,4 887,5 835,6 895,7 925,5 640,3 -30,8 -5,6
-industrijske toplane -industrial cogen. plants 51,3 47,7 54,5 48,7 46,1 36,8 -20,2 -6,4
-industrijske kotlovnice -industrial heating plants 2,0 0,0 0,0 0,0 0,0 0,0 -0,8
Neposredna potrošnja Final energy demand 302,6 227,1 201,5 229,7 235,3 196,0 -16,7 -8,3
Industrija Industry 280,0 201,6 178,7 218,2 221,6 183,9 -17,0 -8,1
-željeza i čelika -iron and steel 0,0 5,3 7,6 7,3 2,7 1,8 -33,3
-obojenih metala -non-ferrous metals 0,0 0,0 0,0 0,0 0,0 0,0 -0,2
-stakla i nem. minerala -non-metallic minerals 7,3 7,8 3,5 3,6 0,0 0,0 -3,3
-kemijska -chemical 1,6 0,2 0,0 3,6 0,0 0,0 -4,5
-građevnog materijala -construction materials 263,5 173,3 154,0 191,5 210,8 175,9 -16,6 -7,8
-papira -pulp and paper 0,0 0,0 0,0 0,0 0,0 0,0
-prehrambena -food production 6,8 9,6 7,3 8,4 7,5 5,9 -21,3 -2,8
-ostala -not elsewhere specified 0,8 5,4 6,3 3,8 0,6 0,3 -50,0 -17,8
Opća potrošnja Other sectors 22,6 25,5 22,8 11,5 13,7 12,1 -11,7 -11,7
-kućanstva -households 17,2 24,7 18,1 9,0 9,5 7,9 -16,8 -14,4
-usluge -services 5,4 0,8 4,7 2,5 4,2 4,2 0,0 -4,9
Izvor | Source: EIHP
7.2 Coal and Coke Energy Balance

185
ENERGY MMIXVI I COAL
Slika | Figure 7.2.1. Raspoložive količine ugljena i koksa u Hrvatskoj | Coal and coke supply in the Republic of Croatia Izvor | Source: EIHP
Slika | Figure 7.2.2. Potrošnja ugljena i koksa u Hrvatskoj | Coal and coke consumption in the Republic of Croatia Izvor | Source: EIHP
-750-500-250
0250500750
1000125015001750200022502500275030003250
1988. 1990. 1995. 2000. 2005. 2009.
tisuć
e to
na |
thou
sand
met
ric to
ns
Proizvodnja | Production
Uvoz | Import
Izvoz | Export
Saldo skladišta | Stock change
Ukupna potrošnja | Total consumption
0
250
500
750
1000
1250
1500
1750
2000
2250
2500
2750
1988. 1990. 1995. 2000. 2005. 2009.
tisuć
e to
na |
thou
sand
met
ric to
ns
Termoelektrane | Thermo power plants
Koksara | Coke oven plant
Ostale transformacije | Other transformations
Industrija | Industry
Kućanstva | Households
Ostala potrošnja | Not specified

186
ENERGIJA MMIXVI I UGLJEN
7.3 Coal Prices
Total coal consumed in the Republic of Croatia is provided from import. Brown coal and lignite are mostly imported from Bosnia and Herzegovina and some small quantities from the Czech Republic. Coke is mainly imported from the neighbo-ring countries, while hard coal is procured at the international market and comes from the major coal exporting countries. The import prices paid for specific types of coal in 2009 are given in Table 7.3.1. and Figure 7.3.1. Dynamics of import prices from 2004 till 2009 are given in Figure 7.3.2.
7.3. Cijene ugljena
Ukupne količine ugljena koje se troše u Republici Hrvatskoj osiguravaju se iz uvoza. Mrki ugljen i lignit pretežito se uvozi iz Bosne i Hercegovine te vrlo malim dijelom iz Češke. Koks se uglavnom uvozi iz susjednih zemalja, dok se kameni ugljen kupuje na međunarodnom tržištu iz zemalja koje su glavni svjetski izvoznici. Ostvarene uvozne cijene pojedinih vrsta ugljena i koksa u 2009. godini prikazane su u tablici 7.3.1. i na slici 7.3.1. Kretanje uvozne cijene ugljena i koksa u razdo-blju od 2004. do 2009. godine prikazano je na slici 7.3.2.
Tablica | Table 7.3.1. Uvozne cijene ugljena i koksa | Coal and coke import prices
HRK 2009/t HRK 2009/GJ USD (US$) 2009/t USD (US$) 2009/GJ
Kameni ugljenHard coal
485 19,7 91,9 3,7
Mrki ugljen i lignitBrown coal and lignite
466 27,1 88,2 5,1
KoksCoke
2043 69,7 386,9 13,2
Izvor | Source: EIHP
Slika | Figure 7.3.1. Uvozne cijene ugljena i koksa | Coal and coke import prices Izvor | Source: EIHP
485 466
2043
91,9 88,2
386,9
3,7 5,1
13,2
19,7
27,1
69,7
0
500
1000
1500
2000
2500
3000
Kameni ugljenHard coal
Mrki ugljen i lignitBrown coal and lignite
KoksCoke
HRK
2009
/t [U
SD (U
S$) 2
009/
t]
0
10
20
30
40
50
60
70
80
HRK
2009
/GJ
[USD
(US$
) 200
9/GJ
]
HRK 2009/t USD (US$) 2009/t HRK 2009/GJ USD (US$) 2009/GJ

187
ENERGY MMIXVI I COAL
Slika | Figure 7.3.2. Kretanje uvozne cijene ugljena i koksa od 2004. do 2009. godine | Coal and coke import prices from 2004 till 2009 – Izvor | Source: EIHP
0
500
1000
1500
2000
2500
3000
2004. 2005. 2006. 2007. 2008. 2009.
kn (H
RK)/
t
Kameni ugljen | Hard coal
Mrki ugljen i lignit | Brown coal and lignite
Koks | Coke


OBNOVLJIVI IZVORI ENERGIJE RENEWABLE ENERGY SOURCES
VIIIVIII


191
ENERGY MMIXVI I I RENEWABLE ENERGY SOURCES
8.1. Klimatološki pokazatelji
Slika | Figure 8.1.2. Zagreb – Maksimir, količina oborina | Zagreb – Maksimir, Precipitation Izvor | Source: DHMZ
Slika | Figure 8.1.1. Zagreb – Maksimir, srednja temperatura zraka po mjesecima | Zagreb – Maksimir, Monthly average air temperature – Izvor | Source: DHMZ
8.1 Climate Indicators
-5
0
5
10
15
20
25
30
35
I II III IV V VI VII VIII IX X XI XII
2000. 2001. 2002. 2003. 2004. 2005. 2006. 2007. 2008. 2009.
prosjek | average (1961.-1990.)
˚C
2000. 2001. 2002. 2003. 2004. 2005. 2006. 2007. 2008. 2009.
prosjek | average (1961.-1990.)
0
50
100
150
200
250
I II III IV V VI VII VIII IX X XI XII
mm
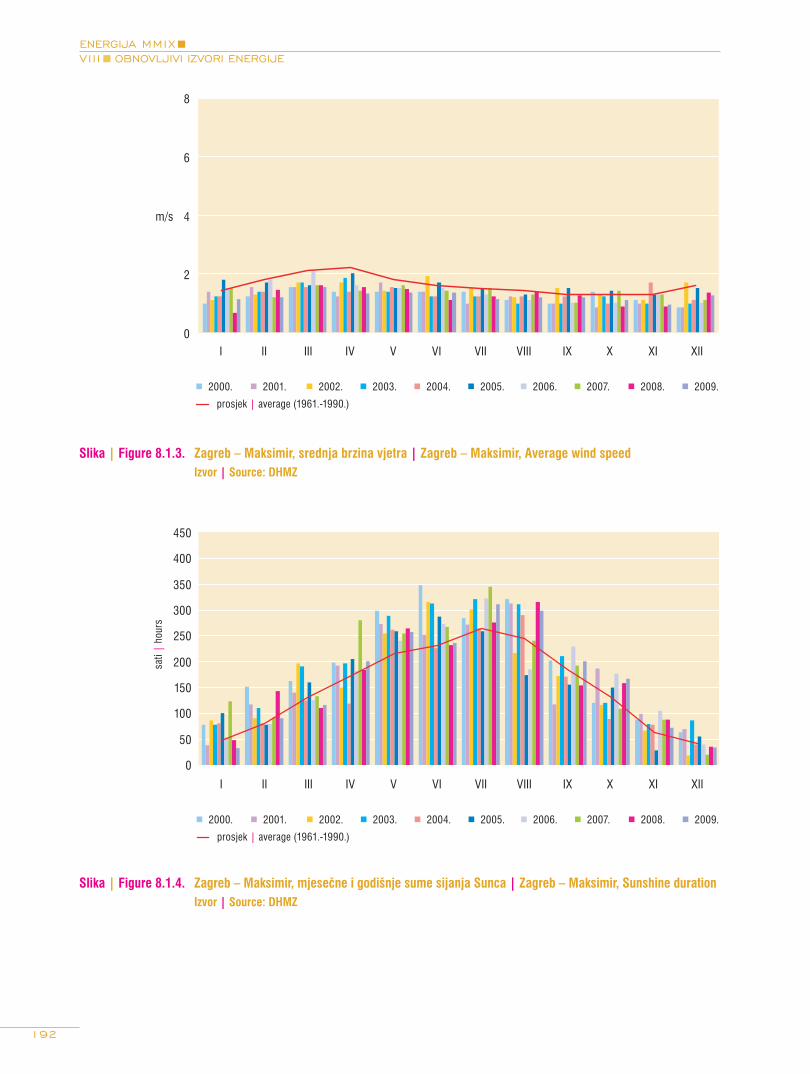
192
ENERGIJA MMIXVI I I OBNOVLJIVI IZVORI ENERGIJE
Slika | Figure 8.1.3. Zagreb – Maksimir, srednja brzina vjetra | Zagreb – Maksimir, Average wind speed Izvor | Source: DHMZ
Slika | Figure 8.1.4. Zagreb – Maksimir, mjesečne i godišnje sume sijanja Sunca | Zagreb – Maksimir, Sunshine duration Izvor | Source: DHMZ
2000. 2001. 2002. 2003. 2004. 2005. 2006. 2007. 2008. 2009.
prosjek | average (1961.-1990.)
I II III IV V VI VII VIII IX X XI XII0
2
4
6
8
m/s
2000. 2001. 2002. 2003. 2004. 2005. 2006. 2007. 2008. 2009.
prosjek | average (1961.-1990.)
I II III IV V VI VII VIII IX X XI XII
0
50
100
150
200
250
300
350
400
450
sati
| ho
urs

193
ENERGY MMIXVI I I RENEWABLE ENERGY SOURCES
Slika | Figure 8.1.5. Split – Marjan, srednja temperatura zraka po mjesecima | Split – Marjan, Monthly average air temperature – Izvor | Source: DHMZ
Slika | Figure 8.1.6. Split – Marjan, količina oborina | Split – Marjan, Precipitation Izvor | Source: DHMZ
-5
0
5
10
15
20
25
30
35
I II III IV V VI VII VIII IX X XI XII
2000. 2001. 2002. 2003. 2004. 2005. 2006. 2007. 2008. 2009.
prosjek | average (1961.-1990.)
˚C
2000. 2001. 2002. 2003. 2004. 2005. 2006. 2007. 2008. 2009.
prosjek | average (1961.-1990.)
0
50
100
150
200
250
I II III IV V VI VII VIII IX X XI XII
mm

194
ENERGIJA MMIXVI I I OBNOVLJIVI IZVORI ENERGIJE
Slika | Figure 8.1.7. Split – Marjan, srednja brzina vjetra | Split – Marjan, Average wind speed Izvor | Source: DHMZ
Slika | Figure 8.1.8. Split – Marjan, mjesečne i godišnje sume sijanja Sunca | Split – Marjan, Sunshine duration Izvor | Source: DHMZ
2000. 2001. 2002. 2003. 2004. 2005. 2006. 2007. 2008. 2009.
prosjek | average (1961.-1990.)
I II III IV V VI VII VIII IX X XI XII0
2
4
6
8
m/s
2000. 2001. 2002. 2003. 2004. 2005. 2006. 2007. 2008. 2009.
prosjek | average (1961.-1990.)
I II III IV V VI VII VIII IX X XI XII
0
50
100
150
200
250
300
350
400
450
sati
| ho
urs

195
ENERGY MMIXVI I I RENEWABLE ENERGY SOURCES
8.2. Kapaciteti
U tablici 8.2.1. dane su procjene podataka o instaliranim kapacitetima za proizvodnju toplinske energije iz obnovljivih izvora (OIE) te statistički podaci o instaliranim kapacitetima za proizvodnju električne energije iz OIE za 2009. godinu.
Tablica | Table 8.2.1. Instalirani kapaciteti za proizvodnju toplinske i električne energije iz OIE u Hrvatskoj 2009. godine | Installed capacities for heat and electricity generation from RES in Croatia for 2009
OIERES
Instalirana toplinska snagaInstalled heat capacity (MW)
Instalirana električna snagaInstalled power capacity (MW)
SunceSolar
58,80 * 0,109 **
VjetarWind
0 69,75 ***
BiomasaBiomass
513,65 * 5,59
Male hidroelektraneSmall hydro power plants
0 31,05
GeotermalnaGeothermal
36,66
113,900
UKUPNOTOTAL
609,11
686,35106,47
Izvor | Source: EIHP, HEP, Šumarski fakultet Sveučilišta u Zagrebu: Drvno-tehnološki odsjek, INA Naftaplin, WGC 2005 | EIHP, HEP, University of Zagreb, Faculty of Forestry – Department of Wood Processing, INA Naftaplin, WGC 2005
* procjena | estimation** sustavi priključeni na elektroenergetsku mrežu | systems connected to the grid*** od toga 42 MW je u probnom pogonu | out of which 42MW are in testing period
8.2 Capacities
Table 8.2.1 provides estimated data on installed capacities for heat generation from the renewable energy sources (RES-H) and statistical data on installed capacities for electricity generation from RES (RES-E) for 2009.
Kod tumačenja navedenih podataka o instaliranim kapacite-tima za proizvodnju toplinske energije iz OIE mora se uzeti u obzir činjenica da ne postoje pouzdani statistički podaci o instaliranim snagama za Sunce i biomasu, a da kod geo-termalne toplinske energije postoje dvije metode praćenja podataka.
Instalirana toplinska snaga sunčanih kolektora procijenjena je na temelju podataka o njihovoj površini prikupljenih putem ankete EIHP-a, dok je toplinska snaga sunčanih sustava pro-računata prema smjernicama udruge European Solar Thermal Industry Federation (ESTIF).
Podatak o instaliranoj toplinskoj snazi kotlovnica na biomasu odnosi se na industrijske kotlovnice na biomasu te ne sadrži toplinsku snagu malih peći za grijanje i pripremu tople vode u kućanstvima.
When interpreting data on installed capacities on RES-H, it is necessary to bare in mind that there are no reliable statistical data on installed capacities for solar and biomass heating systems while heat from geothermal sources includes two methodologies for reporting the values.
Installed heat capacity of solar systems has been estimated according to the surface and type of collectors as recom-mended by the European Solar Thermal Industry Federation (ESTIF), data from the EIHP survey on installed capacities until 1998 and data on sales and imports of plate and vacuum solar collectors for period of 1998 – 2009.
The data on the heat capacity of heating plants using biomass refer to biomass-fired industrial facilities and do not contain information on heat capacity of small heating furnaces and hot water preparation in households.

196
ENERGIJA MMIXVI I I OBNOVLJIVI IZVORI ENERGIJE
U stručnoj literaturi postoje dvije metodologije prikazivanja iskorištene geotermalne energije: kada se promatra samo energija za grijanje prostora i kada se promatra energija za grijanje prostora i pripremu tople vode. Ukupni instalirani kapacitet geotermalnih izvora u Hrvatskoj s 18 lokacija na kojima se koristi je 36,66 MWt ako se promatra samo grijanje prostora, odnosno 113,9 MWt ako se promatra geotermalna energija za grijanje prostora i pripremu tople vode.
Podatak o instaliranoj snazi fotonaponskih sustava razlikuje se od službenog podatka HROTE-a jer uključuje i one sustave koji nisu u statusu povlaštenog proizvođača, a poznato je da proizvode električnu energiju. Isto se odnosi i na podatke o proizvedenoj energiji. Snaga autonomnih fotonaponskih sustava koji se koriste za opskrbu električnom energijom objekata koji nisu spojeni na mrežu (svjetionici, kuće za odmor, bazne GSM postaje i slično) procijenjena je na oko 400 kW.
Trend porasta instaliranih kapaciteta za proizvodnju toplinske i električne energije iz obnovljivih izvora prikazan je na slikama 8.2.1 i 8.2.2.
* geotermalna toplinska energija za grijanje prostora | geothermal heat for space heating
**uključujući i geotermalnu toplinsku energiju za grijanje tople vode za kupanje | including geothermal heat for hot water and bathing
Slika | Figure 8.2.1. Instalirani kapaciteti za proizvodnju toplinske energije iz obnovljivih izvora u Hrvatskoj | Installed capacities for RES-H generation in Croatia – Izvor | Source: EIHP
Professional literature mentions two methodologies of expre-ssing the used geothermal energy: one for the energy used for space heating only and the other for the energy used for heating and hot water. Total installed capacities of geothermal sources in 18 locations in use in Croatia amount to 36.66 MWt when space heating is concerned, and 113.9 MWt when geothermal energy for space heating and hot water preparati-on in spas and recreational centres is concerned.
Installed power capacity of photovoltaic systems differs from the value provided by HROTE as it refers to grid connected systems including autonomous PV systems. Installed capa-city of autonomous PV systems that supply facilities without grid connection (lighting houses, holiday houses, GSM bases, parking machines etc.) is estimated to 400 kW.
Trend of installed capacities for RES-H and RES-E is shown on figures 8.2.1 and 8.2.2.
0,00
100,00
200,00
300,00
400,00
500,00
600,00
700,00
800,00
2004. 2005. 2006. 2007. 2008. 2009.
MW
Sunce | Solar
Biomasa | Biomass
Geotermalna | Geothermal* Geotermalna | Geothermal**
Ukupno | Total**Ukupno | Total*
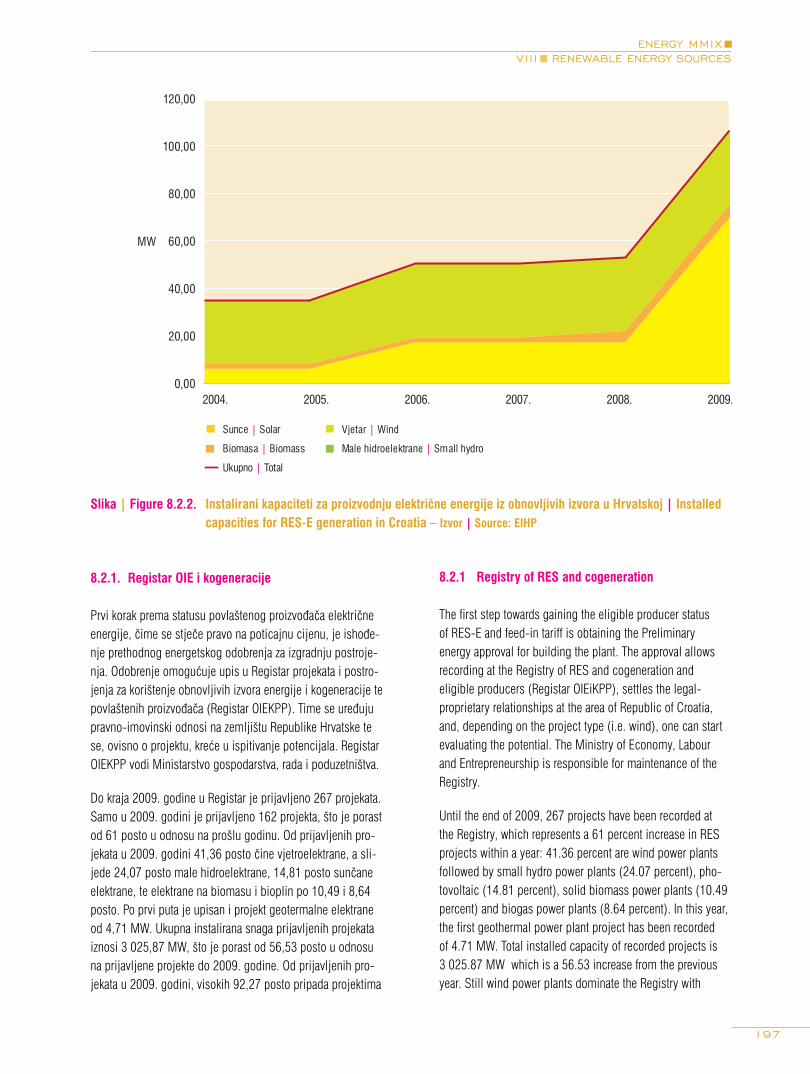
197
ENERGY MMIXVI I I RENEWABLE ENERGY SOURCES
Slika | Figure 8.2.2. Instalirani kapaciteti za proizvodnju električne energije iz obnovljivih izvora u Hrvatskoj | Installed capacities for RES-E generation in Croatia – Izvor | Source: EIHP
8.2.1. Registar OIE i kogeneracije
Prvi korak prema statusu povlaštenog proizvođača električne energije, čime se stječe pravo na poticajnu cijenu, je ishođe-nje prethodnog energetskog odobrenja za izgradnju postroje-nja. Odobrenje omogućuje upis u Registar projekata i postro-jenja za korištenje obnovljivih izvora energije i kogeneracije te povlaštenih proizvođača (Registar OIEKPP). Time se uređuju pravno-imovinski odnosi na zemljištu Republike Hrvatske te se, ovisno o projektu, kreće u ispitivanje potencijala. Registar OIEKPP vodi Ministarstvo gospodarstva, rada i poduzetništva.
Do kraja 2009. godine u Registar je prijavljeno 267 projekata. Samo u 2009. godini je prijavljeno 162 projekta, što je porast od 61 posto u odnosu na prošlu godinu. Od prijavljenih pro-jekata u 2009. godini 41,36 posto čine vjetroelektrane, a sli-jede 24,07 posto male hidroelektrane, 14,81 posto sunčane elektrane, te elektrane na biomasu i bioplin po 10,49 i 8,64 posto. Po prvi puta je upisan i projekt geotermalne elektrane od 4,71 MW. Ukupna instalirana snaga prijavljenih projekata iznosi 3 025,87 MW, što je porast od 56,53 posto u odnosu na prijavljene projekte do 2009. godine. Od prijavljenih pro-jekata u 2009. godini, visokih 92,27 posto pripada projektima
8.2.1 Registry of RES and cogeneration
The first step towards gaining the eligible producer status of RES-E and feed-in tariff is obtaining the Preliminary energy approval for building the plant. The approval allows recording at the Registry of RES and cogeneration and eligible producers (Registar OIEiKPP), settles the legal-proprietary relationships at the area of Republic of Croatia, and, depending on the project type (i.e. wind), one can start evaluating the potential. The Ministry of Economy, Labour and Entrepreneurship is responsible for maintenance of the Registry.
Until the end of 2009, 267 projects have been recorded at the Registry, which represents a 61 percent increase in RES projects within a year: 41.36 percent are wind power plants followed by small hydro power plants (24.07 percent), pho-tovoltaic (14.81 percent), solid biomass power plants (10.49 percent) and biogas power plants (8.64 percent). In this year, the first geothermal power plant project has been recorded of 4.71 MW. Total installed capacity of recorded projects is 3 025.87 MW which is a 56.53 increase from the previous year. Still wind power plants dominate the Registry with
2004. 2005. 2006. 2007. 2008. 2009.
Sunce | Solar
Biomasa | Biomass
Vjetar | Wind
Ukupno | Total
0,00
20,00
40,00
60,00
80,00
100,00
120,00
MW
Male hidroelektrane | Small hydro

198
ENERGIJA MMIXVI I I OBNOVLJIVI IZVORI ENERGIJE
vjetroelektrana. U udjelu ukupne instalirane snage projekata dalje slijede male hidroelektrane (4,19 posto), elektrane na biomasu (2,06 posto), elektrane na bioplin (0,80 posto) te sunčane elektrane (0,53 posto). Operator prijenosnog sustava odredio je granicu od 360 MW instalirane snage vjetroelek-trana koju hrvatski elektroenergetski sustav može prihvatiti, a pri kojem se jamči sigurnost pogona sustava. Na sljedećih pet slika prikazana je prijavljena instalirana snaga elektrana po pojedinom obnovljivom izvoru energije te status prijav-ljenih projekata: PEO – prethodno energetsko odobrenje; PEOz – prethodno energetsko odobrenje zatečenog stanja; EO – energetsko odobrenje; Upis – upis u Registar postojećeg objekta (što ne znači da je objekt stekao status povlaštenog proizvođača energije).
92.27 percent of enlisted capacity. The rest is divided among small hydro power plants (4.19 percent), biomass power plants (2.06 percent), biogas power plants (0.80 percent) and photovoltaic (0.53 percent). HEP-OTS has set the limit of 360 MW installed capacity from wind power plants to be safely included in the Croatian power system. The next five figures present recorded installed capacity of power plants according to the each type of RES together with the status of the projects: PEO – preliminary energy approval; PEOz – pre-liminary energy approval according to the situation existed; EO – energy approval; Upis – recording in the Registry of the existing power plant (which does not imply that the plant has gained the eligible producer status).
Slika | Figure 8.2.3. Instalirana snaga sunčanih elektrana prijavljenih u Registar OIEiK tijekom 2009. | Installed capacity of solar power plants recorded in the Registry during 2009 Izvor | Source: Ministarstvo gospodarstva, rada i poduzetništva | Ministry of Economy, Labour and Entrepreneurship
Slika | Figure 8.2.4. Instalirana snaga malih hidroelektrana prijavljenih u Registar OIEiK tijekom 2009. | Installed capacity of small hydro power plants recorded in the Registry during 2009 Izvor | Source: Ministarstvo gospodarstva, rada i poduzetništva | Ministry of Economy, Labour and Entrepreneurship
Sunčane elektrane | Solar PP15,9295 MW (total 16,8662 MW)
PEO 99,68%
EO 0,32% Upis 0,00%
Male hidroelektrane | Small HPP126,64 MW (total 170,982 MW)
PEO 99,92%
EO 0,08% Upis 0,00%

199
ENERGY MMIXVI I I RENEWABLE ENERGY SOURCES
Slika | Figure 8.2.5. Instalirana snaga vjetroelektrana prijavljenih u Registar OIEiK tijekom 2009. | Installed capacity of wind power plants recorded in the Registry during 2009 Izvor | Source: Ministarstvo gospodarstva, rada i poduzetništva | Ministry of Economy, Labour and Entrepreneurship
Slika | Figure 8.2.6. Instalirana snaga elektrana na biomasu prijavljenih u Registar OIEiK tijekom 2009. | Installed capacity of biomass power plants recorded in the Registry during 2009 Izvor | Source: Ministarstvo gospodarstva, rada i poduzetništva | Ministry of Economy, Labour and Entrepreneurship
Slika | Figure 8.2.7. Instalirana snaga elektrana na bioplin prijavljenih u Registar OIEiK tijekom 2009. | Installed capacity of biogas power plants recorded in the Registry during 2009 Izvor | Source: Ministarstvo gospodarstva, rada i poduzetništva | Ministry of Economy, Labour and Entrepreneurship
Vjetroelektrane | Wind PP2792,1 MW (total 5061,96 MW)
PEOz 0,35
PEO 0,65
EO 0,01 Upis 0,00
Elektrane na biomasu | Biomass PP62,20 MW (total 70,10 MW)
PEO 90,77%
EO 9,23% Upis 0,00%
Elektrane na bioplin | Biogas PP: 24,20 MW (total 28,15 MW)
PEO 0,69
EO 0,22 Upis 0,09

200
ENERGIJA MMIXVI I I OBNOVLJIVI IZVORI ENERGIJE
Slika | Figure 8.2.8. Instalirana snaga geotermalnih elektrana prijavljenih u Registar OIEiK tijekom 2009. | Installed capacity of geothermal power plants recorded in the Registry during 2009 Izvor | Source: Ministarstvo gospodarstva, rada i poduzetništva | Ministry of Economy, Labour and Entrepreneurship
8.3. Proizvodnja električne energije
U sljedećoj tablici je prikazana proizvodnja električne energije iz OIE u 2009. godini.
Tablica | Table 8.3.1. Proizvodnja električne energije iz OIE u Hrvatskoj 2009. godine | Electricity generation from RES in Croatia for 2009
Vrsta izvoraType of renewable energy source
Proizvodnja električne energije Electricity generation
SunceSolar
91,36 MWh
VjetarWind
54,2 GWh
BiomasaBiomass
24,9 GWh
Male hidroelektraneSmall hydro power plants
99,5 GWh
GeotermalnaGeothermal
0
UKUPNOTOTAL
178,69 GWh
Izvor | Source: EIHP, HEP
8.3. Electricity Generation
Table 8.3.1 shows electricity production from RES for 2009.
U 2009. godini je proizvodnja električne energije iz obnov-ljivih izvora činila 1,4 posto ukupne proizvodnje, uz izuzetak velikih hidroelektrana.
In 2009 RES-E made 1.4 percent of the total electricity gene-ration, excluding large hydro.
Geotermalne elektrane | Geothermal PP4,71 MW (total 4,71 MW)
PEO 1,00
EO 0,00 Upis 0,00

201
ENERGY MMIXVI I I RENEWABLE ENERGY SOURCES
Slika | Figure 8.3.1. Proizvodnja električne energije iz OIE u Hrvatskoj u odnosu na cilj u 2010. godini | RES-E in Croatia in respect to the 2010 national target share – Izvor | Source: EIHP
8.3.1. Visina tarifne stavke
U tablicama 8.3.2. i 8.3.3. prikazane su posebne poticajne tarife po vrstama obnovljivih izvora energije iz tarifnog sustava za proizvodnju električne energije iz OIE, uvažavajući korekcij-ski faktor koji ovisi o udjelu domaće komponente u projektu, a uzima vrijednosti od 1 (od 60% udjela naviše) do 0,93 (za 45% udjela domaće komponente i manje).
Prema članku 5. Tarifnog sustava za proizvodnju električne energije iz OIE i kogeneracije, visina poticajne cijene elek-trične energije proizvedene iz postrojenja koja koriste OIE (za vrijeme važenja ugovora o otkupu električne energije) na godišnjoj razini se korigira za indeks cijena na malo, na način da se poticajna cijena iz prethodne kalendarske godine pomnoži s godišnjim indeksom cijena na malo za prethodnu kalendarsku godinu. Novelirane visine poticajne cijene tako-đer su prikazane u tablicama 8.3.2. i 8.3.3.
8.3.1 Tariff item
Tables 8.3.2 and 8.3.3 show the incentive prices from the Tariff System to promote production of electricity from various RES, having in mind that the values for incentive prices are obtained by multiplying the tariff item (C) with the correction factor that depends on the share of domestic component in the project. The correction factor takes values between 1 (from 60% of domestic share and more) and 0.93 (for dome-stic share of 45% and less).
According to the article 5 of the Tariff system, the level of the subsidised price for RES-E is to be corrected for the con-sumer price index during the contracted time for selling the electricity. Updated subsidised items for 2009 are shown also in the tables 8.3.2 and 8.3.3.
Sunce | Solar
Biomasa | Biomass Geotermalna | Geothermal
Ukupno | Total
1080 GWh
0,00
200,00
400,00
600,00
800,00
1000,00
1200,00
2004. 2005. 2006. 2007. 2008. 2009. 2010.
GWh
Vjetar | Wind
Male hidroelektrane | Small hydro

202
ENERGIJA MMIXVI I I OBNOVLJIVI IZVORI ENERGIJE
Tablica | Table 8.3.2. Visina tarifne stavke (C) za isporučenu električnu energiju iz postrojenja koja koriste OIE instalirane električne snage ≤ 1 MW | Tariff item (C) for the delivered electricity from plants using RES with installed electrical capacity ≤ 1 MW
Tip postrojenjaPlant type
C (kn/kWh)
2007. 2008. 2009.
a. sunčane elektrane | solar power plants
a1. sunčane elektrane instalirane snage do uključivo 10 kW | solar power plants with installed power up to and including 10 kW
3,4 3,5972 3,70415
a2. sunčane elektrane instalirane snage veće od 10 kW do uključivo 30 kW | solar power plants with installed power exceeding 10 kW up to and including 30 kW
3 3,174 3,266
a3. sunčane elektrane instalirane snage veće od 30 kW | solar power plants with installed power exceeding 30 kW
2,1 2,2218 2,2862
b. hidroelektrane | hydro power plants 0,69 0,73 0,7512
c. vjetroelektrane | wind power plants 0,64 0,6771 0,6967
d. elektrane na biomasu | biomass power plants
d1. kruta biomasa iz šumarstva i poljoprivrede (granjevina, slama, koštice…) | solid biomass from forestry and agriculture (branches, straw, kernels…)
1,2 1,2696 1,3064
d2. kruta biomasa iz drvno-prerađivačke industrije (kora, piljevina, sječka...) | solid biomass from wood – processing industry (bark, saw dust, chaff…)
0,95 1,0051 1,0342
e. geotermalne elektrane | geothermal power plants 1,26 1,3331 1,3718
f. elektrane na bioplin iz poljoprivrednih nasada (kukuruzna silaža...) te organskih ostataka i otpada iz poljoprivrede i prehrambeno-prerađivačke industrije (kukuruzna silaža, stajski gnoj, klaonički otpad, otpad iz proizvodnje biogoriva…) | biomass power plants from agricultural plants (corn silage…) and organic remains and waste from agriculture and food processing industry (corn silage, manure, slaugh terhouse waste, waste from the production of biofuel…)
1,2 1,2696 1,3064
g. elektrane na tekuća biogoriva | liquid biofuel power plants 0,36 0,3809 0,3919
h. elektrane na deponijski plin i plin iz postrojenja za pročišćavanje otpadnih voda | landfill gas power plants and waste water treatment biogas power plants
0,36 0,3809 0,3919
i. elektrane na ostale obnovljive izvore (morski valovi, plima i oseka...) | power plants on other renewable energy sources (sea waves, tidal…)
0,6 0,6348 0,6532
Izvor | Source: Tarifni sustav za proizvodnju električne energije iz obnovljivih izvora energije i kogeneracije (NN 33/07), HROTE | Tariff system for the production of electricity from renewable energy sources and cogeneration (Official Gazette 33/07), HROTE

203
ENERGY MMIXVI I I RENEWABLE ENERGY SOURCES
Tablica | Table 8.3.3. Visina tarifne stavke (C) za isporučenu električnu energiju iz postrojenja koja koriste OIE instalirane električne snage > 1 MW | Tariff item (C) for the delivered electricity from plants using RES with installed electrical capacity > 1 MW
Tip postrojenjaPlant type
C (kn/kWh)
2007. 2008. 2009.
a. hidroelektrane instalirane snage do uključivo 10 MW | hydro power plants with installed power up to and including 10 MW
a1. energija do uključivo 5 000 MWh proizvedenih u kalendarskoj godini | power up to and including 5 000 MWh produced in the calendar year
0,69 0,73 0,7512
a2. energija za više od 5 000 MWh do uključivo 15 000 MWh proizvedenih u kal. godini | power exceeding 5 000 MWh up to and including 15 000 MWh produced in the calendar year
0,55 0,5819 0,5988
a3. energija za više od 15 000 MWh proizvedenih u kalendarskoj godini | power exceeding 15 000 MWh produced in the calendar year
0,42 0,4444 0,4573
b. vjetroelektrane wind | power plants 0,65 0,6877 0,7076
c. elektrane na biomasu | biomass power plants
c1. kruta biomasa iz šumarstva i poljoprivrede (granjevina, slama, koštice…) | solid biomass from forestry and agriculture (branches, straw, kernels…)
1,04 1,1003 1,1322
c2. kruta biomasa iz drvno-prerađivačke industrije (kora, piljevina, sječka…) | solid biomass from wood – processing industry (bark, saw dust, chaff…)b
0,83 0,8781 0,9036
d. geotermalne elektrane | geothermal power plants 1,26 1,3331 1,3718
e. elektrane na bioplin iz poljoprivrednih nasada (kukuruzna silaža...) te organskih ostataka i otpada iz poljoprivrede i prehrambeno-prerađivačke industrije (kukuruzna silaža, stajski gnoj, klaonički otpad, otpad iz proizvodnje biogoriva…) | biomass power plants from agricultural plants (corn silage…) and organic remains and waste from agriculture and food processing industry (corn silage, manure, slaugh terhouse waste, waste from the production of biofuel…)
1,04 1,1003 1,1322
f. elektrane na tekuća biogoriva | liquid biofuel power plants 0,36 0,3809 0,3919
g. elektrane na deponijski plin i plin iz postrojenja za pročišćavanje otpadnih voda | landfill gas power plants and waste water treatment biogas power plants
0,36 0,3809 0,3919
h. elektrane na ostale obnovljive izvore (morski valovi, plima i oseka…) | power plants on other renewable energy sources (sea waves, tidal…)
0,50 0,529 0,5443
Izvor | Source: Tarifni sustav za proizvodnju električne energije iz obnovljivih izvora energije i kogeneracije (NN 33/07), HROTE | Tariff system for the production of electricity from renewable energy sources and cogeneration (Official Gazette 33/07), HROTE

204
ENERGIJA MMIXVI I I OBNOVLJIVI IZVORI ENERGIJE
Za kogeneracijska postrojenja se utvrđuju tarifne stavke i visine tarifnih stavki (C) izražene u kn/kWh za isporučenu električnu energiju za vrijeme trajanja više (VT) i niže (NT) dnevne tarifne stavke (tablica 8.3.4.). Trajanje VT i NT odre-đeno je Tarifnim sustavom za proizvodnju električne energije. Električna energija se mora proizvesti u kogeneracijskom pro-cesu na način utvrđen propisom koji uređuje stjecanje statusa povlaštenog proizvođača.
For cogeneration plants, the tariff items and their correspon-ding amounts (C) are expressed in HRK/kWh are shown in the Table 8.3.4 for the delivered electricity for the duration of higher (HT) and lower (LT) daily tariff systems. The duration of HT and LT is determined by the tariff system for electricity generation. Electricity must be produced in the cogeneration process in the manner prescribed by the regulation governing the acquisition of the eligible producer status.
Tablica | Table 8.3.4. Visine tarifnih stavki (C) za isporučenu električnu energiju iz kogeneracije za vrijeme trajanja više (VT) i niže (NT) dnevne tarifne stavke | Amounts of tariff items (C) for the delivered electricity from cogeneration plants during the higher (HT) and lower (LT) daily tariff systems
Tip postrojenjaPlant type
C (kn/kWh) za | for 01/09
C (kn/kWh) od | from 02/09
VT | HT NT | LT VT | HT NT | LT
Kogeneracijska postrojenja instalirane električne snage do uključivo 50 kW, tzv. mikrokogeneracije te sva kogeneracijska postrojenja koje koriste gorivne ćelije na vodik | Cogeneration plants with installed power up to and including 50 kW, so-called micro-cogene-ration units and all cogeneration plants using hydrogen fuels
0,6615 0,3470 0,7685 0,4031
Kogeneracijska postrojenja instalirane električne snage veće od 50 kW do uključivo 1 MW, tzv. male kogeneracije | Cogeneration plants with installed power exceeding 50 kW and up to and including 1 MW, so-called small scale cogeneration units
0,5531 0,2820 0,6425 0,3275
Kogeneracijska postrojenja instalirane električne snage veće od 1 MW do uključivo 35 MW, tzv. srednje kogeneracije priključene na distribucijsku mrežu | Cogeneration plants with installed power exceeding 1 MW and up to and including 35 MW, so-called medium scale cogeneration units connected to the distribution network
0,4772 0,2386 0,5543 0,772
Kogeneracijska postrojenja instalirane električne snage veće od 35 MW, tzv. velike kogeneracije te sva kogeneracijska postrojenja pri-ključena na prijenosnu mrežu | Cogeneration plants with installed power exceeding 35 MW so-called large scale cogeneration units, and all cogeneration plants connected to the transmission network
0,3254 0,1627 0,3779 0,1890
Izvor | Source: Tarifni sustav za proizvodnju električne energije iz obnovljivih izvora energije i kogeneracije (NN 33/07) | Tariff system for the production of electricity from renewable energy sources and cogeneration (Official Gazette 33/07)
U sljedećim tablicama su prikazani podaci o isplaćenim poticajnim cijenama povlaštenim proizvođačima električne energije prema tehnologijama (tablica 8.3.5.), prema povla-štenim proizvođačima (tablica 8.3.6.) te prema obavezama opskrbljivača (tablica 8.3.7.).
The following tables show data on paid amounts based on the subsidised prices to the eligible producers of RES-E accor-ding to the technology (table 8.3.5), eligible producer (table 8.3.6) and liabilities of the operators (table 8.3.7).

205
ENERGY MMIXVI I I RENEWABLE ENERGY SOURCES
Tablica | Table 8.3.5. Isplaćene poticajne cijene povlaštenim proizvođačima električne energije prema tehnologijama za 2009. godinu | Paid amounts based on the subsidised prices to the eligible producers of RES-E according to the technology in 2009
Tip postrojenjaPlant type
Predano u mrežu tijekom 2009. | Delivered to the grid during 2009 (kWh)
Isplaćena sredstva s osnove isplate poticaja povlaštenim proizvođa-čima u 2009. godini (kn) | Amount paid based on the subsidies to the eligible producers in 2009 (HRK)
Iznos bez PDV-aAmount excl. VAT
PDVVAT
Ukupni iznosTotal
VjetroelektraneWind PP
42 342 461 29 961 525 6 727 211 36 688 737
Sunčane elektraneSolar PP
16 464 60 942 13 729 74 670
Male hidroelektraneSmall Hydro PP
112 030 84 157 18 818 102 975
Elektrane na bioplinBiogas PP
4 959 750 6 479 417 1 469 817 7 949 235
UKUPNOTOTAL
47 430 705 36 586 041 8 229 575 44 815 616
Izvor | Source: HROTE
Tablica | Table 8.3.6. Predaja električne energije u mrežu od povlaštenih proizvođača električne energije prema proizvođačima za 2009. godinu | Paid amounts based on the subsidised prices to the eligible producers of RES-E according to the producer in 2009
Povlašteni proizvođačEligible producer
PostrojenjePower plant
Predano u mrežu tijekom 2009. |Delivered to the grid during 2009 (kWh)
ADRIA WIND POWER d.o.o. mVE Ravne 1, Otok Pag 9 413 232
VJETROELEKTRANA TRTAR-KRTOLIN d.o.o. VE Trtar-Krtolin 31 584 026
MARIMONT d.o.o. SE Solarni krov Špansko-Zagreb 9 881
MATAKOVIĆ obrt za proizvodnju el. Energije mHE Mataković 57 210
MATAKOVIĆ strojna obrada metala mHE Mataković 54 820
PZ OSATINA - Semeljci* Bioplinsko postrojenje-biogas PP 4 959 750
JUŽNI JADRAN d.o.o.** solarni fotonaponski sustav-PV 6 583
Končar*** Prototip vjetroagregata KO-VA57/1 354 087
Vjetroelektrana Orlince d.o.o.**** VE Orlice 991 116
UKUPNOTOTAL
47 430 705
Izvor | Source: HROTE
Ugovor o otkupu električne energije stupio na snagu | Power purchase contract is valid since:
* 25.05.2009. *** 24.09.2009.
** 06.07.2009. **** 22.12.2009.

206
ENERGIJA MMIXVI I I OBNOVLJIVI IZVORI ENERGIJE
Tablica | Table 8.3.7. Ukupne obveze opskrbljivača s osnova naknade za poticaje i za preuzeti udio električne energije u 2009. godini | Total liabilities of the Operators based on the subsidies and received RES-E in 2009
OpskrbljivačOperator
Obveza opskrbljivačaOperators liability
Prikupljena sredstva s osnove obveze opskrbljivača u 2009. godini (kn)Collected amounts based on the liabliaties of operators for 2009 (HRK)
Iznos bez PDV-aAmount excl. VAT
PDVVAT
Ukupni iznosTotal
HEP - Operator distribucijskog sustava d.o.o.
za naknadu
subsidies80 377 451 17 990 350 98 367 801
za preuzetu električnu energiju
received electricity12 054 429 2 704 484 14 758 913
HEP - Opskrba d.o.o.
za naknadu
subsidies57 400 844 12 892 657 70 293 501
za preuzetu električnu energiju
recieved electricity8 701 025 1 960 076 10 661 101
UKUPNOTOTAL
158 533 749 35 547 567 194 081 316
Izvor | Source: HROTE
8.4. Proizvodnja toplinske energije
Tablica | Table 8.3.8. Proizvodnja toplinske energije iz OIE u Hrvatskoj 2009. godine | Heat generation from RES in Croatia for 2009
Vrsta izvoraType of renewable energy source
Proizvodnja toplinske energijeHeat production (TJ)
SunceSolar
200,3
BiomasaBiomass
14 171
Geotermalna*Geothermal*
132,15
555,47
Izvor | Source: EIHP, INA Naftaplin, WGC 2005
* Za proizvodnju toplinske energije iz geotermalne energije u 2009. godini iskorišteno je 132,15 TJ samo za grijanje prostora odnosno ukupno 555,47 TJ ako se promatra zajedno grijanje prostora i pripremu tople vode | in 2009, from geothermal heat 132.15 TJ was used for space heating and, including bathing, 555.47 TJ
8.4 Heat Generation
Proizvedena toplinska energija sunčanih sustava nastavlja se na anketno istraživanje EIHP-a i ESTIF metodologije, a prora-čunata je kao konačna iskoristiva toplinska energija i uzima u obzir prostornu distribuciju sunčanih toplinskih sustava, gubitke u pretvorbi i ponašanje korisnika.
Currently there are no reliable data which would enable determination of the installed heat capacities of solar collec-tors. Therefore the data on heat generation are derived from estimations given in the table 8.3.1 (EIHP and ESITF) and assumptions on spatial distribution, conversion losses and consumer behaviour.

207
ENERGY MMIXVI I I RENEWABLE ENERGY SOURCES
Proizvodnja toplinske energije iz krute i plinovite biomase, uključujući proizvodnju iz industrijskih kotlovnica te proizvod-nju toplinske energije iz ogrjevnog drva za grijanje i pripremu tople vode u kućanstvima, iznosila je 14 171 TJ.
8.5. Proizvodnja krutih biogoriva
Heat generation from both solid and gaseous biomass inclu-des the generation in industrial heating facilities and heat generation from fuel wood for heating and hot water preparati-on in households totalling 14 171 TJ.
8.5 Solid Biofuel Production
Tablica | Table 8.3.8. Proizvodnja toplinske energije iz OIE u Hrvatskoj 2009. godine | Heat generation from RES in Croatia for 2009
Vrsta krutog biogorivaSolid bioefuels
Proizvodnja Production
Drveni peletiWood pellets
51 111 t
Drveni briketi*Wood briquettes*
25 000 t
Drveni ugljen*Charcoal*
6 900 t
Ogrjevno drvoFirewood
1 579 200 m3
Izvor | Source: HGK, Belišće d.d., Hrvatske šume, Šumarski fakultet Sveučilišta u Zagrebu: Drvno-tehnološki odsjek, Ministarstvo regionalnograzvoja, šumarstva i vodnog gospodarstva RH: Uprava za drvnu industriju | Croatian Chamber of Economy, Belišće d.d., Croatian Forests, University of Zagreb, Faculty of Forestry – Department of Wood Processing. Ministry of regional development, forestry and water management
* procjena | estimation
Tijekom 2009. godine peleti su se proizvodili u devet pogona. Ukupni kapacitet proizvodnje peleta iznose preko 205 000 tona godišnje, ali je za sada svega jedna četvrtina iskorištena. Od ukupne proizvedene količine peleta u 2009. godini 95 posto je plasirano na strana tržišta, a manji je dio iskorišten na domaćem tržištu.
Kapacitet proizvodnje briketa procijenjen je na oko 60 000 tona godišnje, ali se njihova proizvodnja uglavnom obavlja periodično prema dostupnoj sirovini – otpadu iz drvno-pre-rađivačke industrije. Briketi se, također, velikom većinom plasiraju na strano tržište.
Proizvodnja drvenog ugljena je procijenjena budući da u Republici Hrvatskoj postoji samo jedan industrijski proizvo-đač drvenog ugljena - Belišće d.d. koji proizvodi polovicu godišnje proizvodnje u svojim kapacitetima (3 456 tona u 2009. godini), a ostalo proizvedu deseci srednjih i malih pro-izvođača drvenog ugljena. Belišće d.d. ima i jedini industrij-ski pogon za proizvodnju grill briketa, a tijekom 2009. godine su ih proizveli 936 tona.
In 2008 pellets are produced in 9 plants. Total installed capacity for pellet production is more than 205 000 t/yr, out of which only a quarter was utilised during 2009. 95 percent of the total production of pellets was exported while little was placed on the domestic market.
Wooden briquettes capacity is estimated at some 60 000 t/yr while its actual production is highly dependent on the feedstock availability – waste from wood processing industry. Briquettes are also mostly exported.
Production of charcoal has been estimated since there is only one industrial charcoal producer in Croatia, Belišće d.d. that has been producing about half of the total annual charcoal production (3 456 tons in 2009). The rest of the production belongs to a dozen middle and numerous small charcoal producers. Belišće d.d. has the only industrial processing line for charcoal grill briquettes with total production in 2009 of 936 tons.

208
ENERGIJA MMIXVI I I OBNOVLJIVI IZVORI ENERGIJE
8.6. Proizvodnja tekućih biogoriva
Ukupni proizvodni kapaciteti biogoriva u Hrvatskoj se pri kraju 2009. godine povećavaju na 61 000 tona biodizela godišnje.
Tijekom 2009. godine u Republici Hrvatskoj je proizvedeno 6 333,2 tone biodizela ili 0,17 PJ od čega je samo manji dio plasiran na domaće tržište. Oko 10 posto proizvedenog biodi-zela nastao je iz sakupljenog otpadnog jestivog ulja.
Uvozom motornih goriva s biokomponentom u 5-postotnom volumnom udjelu u Republiku Hrvatsku je uvezeno 2 520 t biodizela i 3633,3 t bioetanola ili 0,19 PJ.
Neto potrošnja biogoriva u 2009. godini iznosila je 0,295 PJ pri čemu je udio biogoriva u ukupnom udjelu goriva, prema Uredbi o kakvoći biogoriva (NN 141/05) za 2009. godinu iznosio 0,38 posto nacionalnog indikativnog cilja od 5,75 posto do 2010. godine.
8.6 Liquid Biofuel Production
Total capacities for liquid biofuels in Croatia are increased in late 2009 to 61 000 tons per year of biodiesel.
In 2009, it was produced 6 333.2 t of biodiesel in Croatia or 0.17 PJ, out of which only small share ended up at the dome-stic market. Some 10 percent of the total amount originated from collected waste cooking oil.
Imports of motor fuels blended with 5 percent v/v of biofuels were 2 520 t of biodiesel and 3 633.3 t of bioethanol or total 0.19 PJ.
For 2009, net consumption of biofuels in Croatia amounted 0.295 PJ which makes the achieved share of biofuels in total fuels, as defined in the Ordinance on Biofuels Quality (OG 141/05) is 0.38 percent for 2009 of the national indicative target of 5.75 percent by 2010.

ENERGETSKA UČINKOVITOST ENERGY EFFICIENCY
IXIX


211
ENERGY MMIXIX ENERGY EFFICIENCY
Pokazatelji energetske učinkovitosti razmatraju se za sektor opće potrošnje (u sklopu kojeg se promatraju kućanstva, uslužni sektor i zgradarstvo, poljoprivreda i građevinarstvo te industrija i promet). Osim neposredne potrošnje energije i bruto dodane vrijednosti (BDV), kao pokazatelji se promatraju i indeks poboljšanja energetske učinkovitosti ODEX, indeks energetske intenzivnosti, odnos primarne i finalne energetske intenzivnosti i energetska intenzivnost te strukturni makroeko-nomski efekt.
9.1. Indeksi i trendovi
Indeks poboljšanja energetske učinkovitosti ODEX sastoji se od agregiranog i tehničkog indeksa. Agregirani indeks promatra utjecaj različitih čimbenika koji utječu na potrošnju energije, ali nisu direktno vezani za energetsku učinkovitost poput klimatskih utjecaja, promjena u gospodarskoj i industrijskoj strukturi i pro-mjena u stilu života (poput povećanja površine kućanstva), dok je tehnički indeks povezan s energetskom učinkovitosti.
Indeks poboljšanja energetske učinkovitosti ODEX određuje se za sve sektore potrošnje energije (industrija, promet, kućanstva) ili za ukupno gospodarstvo (sve finalne potrošače energije). Ovaj indeks dobiva se na temelju podataka o promjenama potrošnje energije u podsektorima ili prema namjeni potrošnje energije u promatranom vremenskom razdoblju.
Tijekom razdoblja od 1995. do 2009. godine indeks pobolj-šanja energetske učinkovitosti za ukupno gospodarstvo ODEX u Hrvatskoj smanjio se za 14,4 posto. Ovoj promjeni najviše su pridonijeli sektor prometa (23,6 posto) i industrije (19,1 posto). Na slici 9.1.1. prikazan je indeks poboljšanja energet-ske učinkovitosti ODEX za sve sektore potrošnje.
Drugi način prikazivanja učinkovitosti pojedinog sektora potrošnje je putem praćenja energetske intenzivnosti, vezane za ekonomske pokazatelje. Energetska intenzivnost prati ukupnu potrošnju energije u pojedinom podsektoru te bruto dodanu vrijednost ostvarenu unutar tog podsektora, a izražava se kao omjer tih vrijednosti u promatranoj godini.
Indeksi energetske intenzivnosti u neposrednoj potrošnji kao referentnu godinu uzimaju 1995. te izražavaju omjer energetske intenzivnosti pojedinog podsektora u tekućoj i u referentnoj godini, kao što je prikazano na slici 9.1.2. za razdoblje od 1995. do 2009. godine.
Energy efficiency indices are regarded for groups of energy consumers within other consumption sectors (which encom-passes residential and services sectors and public service, buildings, agricultural and construction sub sectors as well as industrial and transport sectors).This report looks in to direct energy consumption, gross value added (GVA), as well as index of energy efficiency progress ODEX, energy intensity, primary to final energy intensity ratio and energy intensity and structural macroeconomic effect.
9.1. Indices and Trends
The energy efficiency index ODEX consists of the aggregate index and the technical index. The aggregate index considers various influences that are not linked to energy efficiency, such as climate fluctuations, changes in economic and indu-stry structures, lifestyle changes (increase in size of dwellin-gs), while the technical index is linked to energy efficiency.
The index of energy efficiency progress ODEX is defined at the sector level (industry, transport, households) or whole economy level (all final consumers). It is obtained on the basis of the information on consumption changes at detailed levels, by sub sectors or end-use, observed over a given period of time.
In the period between 1995 and 2009 the ODEX index, which measures energy efficiency improvements, decreased by 14.4 percent in the economy as a whole. This change is mostly due to transport (23.6 percent) and industry (19.1 percent). Figure 9.1.1. shows the energy efficiency improvement index (ODEX) for all consumption sectors.
Another way of describing the efficiency of the specific con-sumption sectors is tracking their energy intensity in relation to economic characteristics. The energy intensity gives the ratio of totally consumed energy and gross value added within a specific sector for the year observed.
The referent year for energy intensity indices of final con-sumption is 1995, and the indices express the ratio of energy intensity of individual sub sector in the observed and in the referent year, as given in Figure 9.1.2. which refers to the period 1995 to 2009.
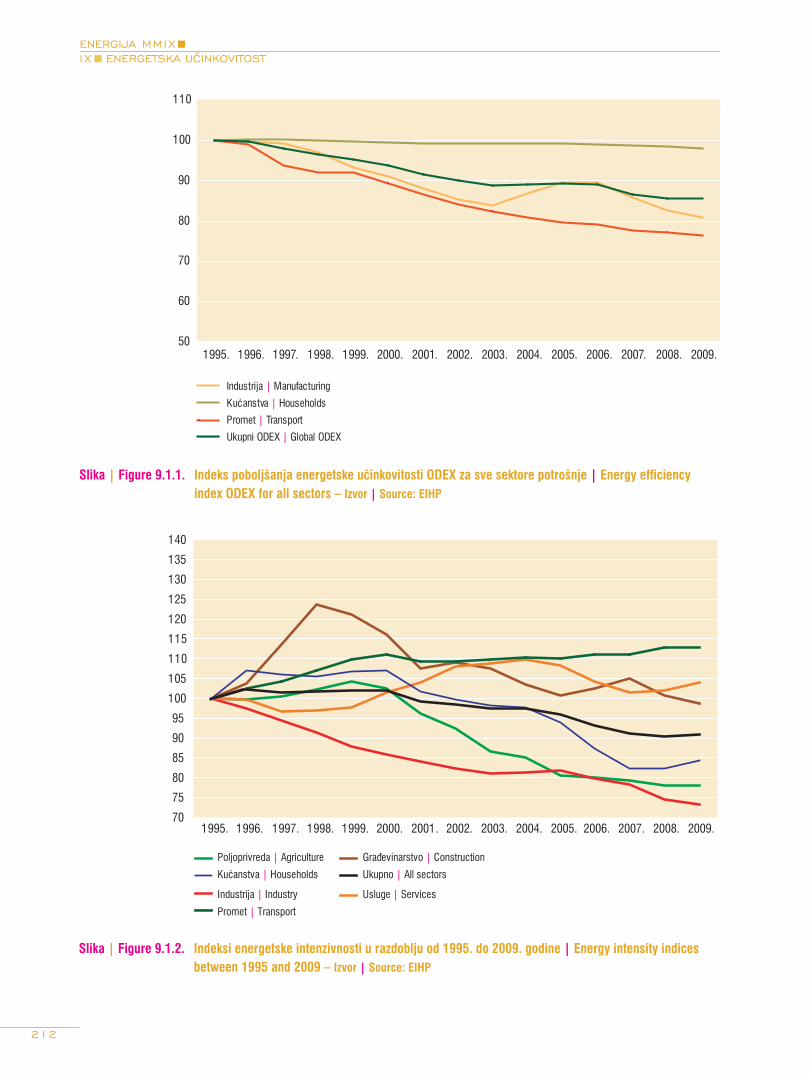
212
ENERGIJA MMIXIX ENERGETSKA UČINKOVITOST
Slika | Figure 9.1.1. Indeks poboljšanja energetske učinkovitosti ODEX za sve sektore potrošnje | Energy efficiency index ODEX for all sectors – Izvor | Source: EIHP
Slika | Figure 9.1.2. Indeksi energetske intenzivnosti u razdoblju od 1995. do 2009. godine | Energy intensity indices between 1995 and 2009 – Izvor | Source: EIHP
50
60
70
80
90
100
110
1995. 1996. 1997. 1998. 1999. 2000. 2001. 2002. 2003. 2004. 2005. 2006. 2007. 2008. 2009.
Industrija | Manufacturing
Promet | Transport
Kućanstva | Households
Ukupni ODEX | Global ODEX
70
75
80
85
90
95
100
105
110
115
120
125
130
135
140
1995. 1996. 1997. 1998. 1999. 2000. 2001. 2002. 2003. 2004. 2005. 2006. 2007. 2008. 2009.
Poljoprivreda | Agriculture
Industrija | Industry
Građevinarstvo | Construction
Usluge | Services
Kućanstva | Households
Promet | Transport
Ukupno | All sectors

213
ENERGY MMIXIX ENERGY EFFICIENCY
Slika | Figure 9.1.3. Odnos primarne i finalne energetske intenzivnosti od 1995. do 2009. | Primary to final energy intensity ratio from 1995 to 2009 – Izvor | Source: EIHP
Slika | Figure 9.1.4. Energetska intenzivnost i strukturni makroekonomski efekt (1995=100) | Energy intensity and structural macroeconomic effect (1995=100) – Izvor | Source: EIHP
80
85
90
95
100
105
110
1995. 1996. 1997. 1998. 1999. 2000. 2001. 2002. 2003. 2004. 2005. 2006. 2007. 2008. 2009.
Primarna intenzivnost | Primary intensity
Finalna intenzivnost | Final intensity
85
90
95
100
105
1995. 1996. 1997. 1998. 1999. 2000. 2001. 2002. 2003. 2004. 2005. 2006. 2007. 2008. 2009.
Ostvarena intenzivnost | Obtained intensity
Uz intenzivnost iz 1995. | With 1995 intensity
Intenzivnost 1995. | Intensity in 1995
Strukturni efekt | Structural effect
Efekt jedinične potrošnje | Unit consumption effect

214
ENERGIJA MMIXIX ENERGETSKA UČINKOVITOST
Pokazatelj primarne i finalne energetske intenzivnosti prikazuje odnos energetskih intenzivnosti promatranih pri potrošnji primarne energije, odnosno transformiranih oblika energije.. I ovdje je kao referentna godina uzeta 1995. te su u odnosu na nju promatrane primarna i finalna energetska intenzivnost. Odnos primarne i finalne energetske intenzivnosti u razdoblju od 1995. do 2009. godine prikazan je na slici 9.1.3.
Indeksi energetske intenzivnosti pokazatelji su promjena u korištenju energije po jediničnom proizvodu ili usluzi i uspješ-nosti u ostvarenju tržišne vrijednosti proizvoda ili usluge, dakle oni su utjecajni strukturnim efektom i efektom jedinične potrošnje. Pokazatelj energetske intenzivnosti i strukturnog makroekonomskog efekta prikazan je na slici 9.1.4.
Ovdje se uspoređuje ostvarena energetska intenzivnost s inten-zivnošću iz 1995. godine, tj. pretpostavljena potrošnja energije u promatranoj godini kakva bi bila postignuta s razinom inten-zivnosti iz 1995. godine prema ostvarenom bruto domaćem proizvodu u danoj godini. Time se razlučuje utjecaj strukturnog efekta, tj. tržišnog pokazatelja i utjecaj efekta jedinične potroš-nje, tj. pokazatelja energetske učinkovitosti.
9.2. Energetska učinkovitost u zgradarstvu
9.2.1. Sektor opće potrošnje
Specifična potrošnja energije za grijanje po kućanstvu u razdoblju od 1995. do 2009. godine se povećavala (iznimke su 2002. i 2006. godina koje su bile toplije pa je i potrošnja bila manja). Indeks poboljšanja energetske učinkovitosti ODEX u kućanstvima smanjio se za 15,9 posto za grijanje (s klimatskom korekcijom), odnosno 12,4 posto za toplu vodu, zbog porasta potrošnje energije za grijanje i pripremu tople vode, kao što je prikazano na slici 9.2.1. Indeks poboljšanja energetske učinkovitosti za kuhanje iznosio je 6,1 posto u istom razdoblju zbog smanjenja potrošnje energije za kuhanje. Ukupni indeks poboljšanja energetske učinkovitosti ODEX u kućanstvima u razdoblju od 1995. do 2009. godine smanjiio se za 1,7 posto.
Tehnički indeks poboljšanja energetske učinkovitosti u kućan-stvima u promatranom razdoblju bio je konstantan, tj. u kućan-stvima nije bilo poboljšanja energetske učinkovitosti.
The primary to final energy intensity ratio gives the relation between intensities observed in primary energy consump-tion, and those observed in final energy consumption. The year 1995 is also taken as referent year. The primary to final energy intensity ratio from 1995 to 2009 is given in Figure 9.1.3.
The energy efficiency indices show the changes in energy use per unit of product or service and the efficiency improvements in obtaining the market value of a product or service. As such, they are result both of structural effect and of unit consumption effect. The energy intensity and structural macroeconomic effects up to 2009 are presented in Figure 9.1.4.
Here, the effectuated energy intensity is compared with the 1995 energy intensity level. This indicator reflects the com-parison of the presumed energy consumption in the observed year, assuming the 1995 energy intensity level, with gross domestic product realized in the given year. In this way, the influence of structural effect, i.e. the market characteristic indicator, is distinguished from the influence of unit con-sumption effect, i.e. the energy efficiency indicator.
9.2. Energy Effi ciency in Buildings
9.2.1. Other Sectors
In the period from 1995 to 2009 there was a growing trend in specific energy consumption for heating per household (with exception of the years 2002 and 2006, when the consump-tion was lower due to mild weather). The energy efficiency index ODEX in the households decreased by 15.9 percent for heating (including climate correction), and by 12.4 percent for hot water due to higher consumption of energy for heating and hot water preparation, as shown in Figure 9.2.1. In the same period the indicator of energy efficiency for cooking improved by 6.1 percent due to lower energy consumption for this use. Over the 1995 to 2009 period, the overall energy efficiency index ODEX for the households decreased by 1.7 percent.
Technical index of energy efficiency progress in the househol-ds in the observed period is constant, i.e., the households did not improve their energy efficiency.

215
ENERGY MMIXIX ENERGY EFFICIENCY
Slika | Figure 9.2.1. Indeks poboljšanja energetske učinkovitosti ODEX u kućanstvima | Energy efficiency index ODEX for households – Izvor | Source: EIHP
Na slici 9.2.2. prikazana je specifična potrošnja ukupne ener-gije po kućanstvu, specifična potrošnja energije za grijanje (s klimatskom korekcijom u jedinicama toe/kućanstvu) i specifična potrošnja električne energije (za kućanske uređaje, hlađenje i rasvjetu u jedinicama kWh/kućanstvu). Prosječni porast specifične potrošnje ukupne energije po kućanstvu u promatranom razdoblju bio je 0,4 posto, za grijanje 0,1 posto i za netoplinsku potrošnju električne energije 1,8 posto. Porast potrošnje električne energije za kućanske uređaje, hlađenje i rasvjetu uzrokovan je povećanim brojem kućanskih uređaja i uređaja za hlađenje prostora.
Na slici 9.2.3. prikazana je specifična potrošnja ukupne ener-gije i električne energije po zaposlenom u uslužnom sektoru (u razdoblju od 1998. do 2009. godine). Specifična potrošnja ukupne energije po zaposlenom rasla je s prosječnom godiš-njom stopom od 0,6 posto, a specifična potrošnja električne energije s prosječnom godišnjom stopom od 3,1 posto u razdoblju od 1998. do 2009. godine.
Figure 9.2.2. gives the specific consumption of total energy per household, specific energy consumption for heating (incl. climate correction in units toe/household), and specific electricity use (for domestic appliances, cooling and lighting in units kWh/household). In the observed period, the average increase of specific consumption of total energy per house-hold was 0.4 percent, for heating 0.1 percent and for non-heat use of electricity 1.8 percent. The increase of electricity consumption for domestic appliances, cooling and lighting is due to a larger number of appliances and space cooling devices.
Figure 9.2.3. shows specific total energy consumption and electricity consumption per employee in the services sector (over the period 1998 - 2009). Specific consumption of total energy per employee grew at an average annual rate of 0.6 percent in the period from 1998 to 2009, while specific con-sumption of electricity per employee grew by 3.1 percent in the same period.
70
80
90
100
110
120
130
140
150
1995. 1996. 1997. 1998. 1999. 2000. 2001. 2002. 2003. 2004. 2005. 2006. 2007. 2008. 2009.
Grijanje (s klimatskom korekcijom) | Heating (with cc)Priprema tople vode | Hot waterKuhanje | CookingUkupno | Total

216
ENERGIJA MMIXIX ENERGETSKA UČINKOVITOST
Slika | Figure 9.2.2. Specifična potrošnja energije u kućanstvima: ukupna, za grijanje s klimatskom korekcijom (ten/ kućanstvu) i potrošnja električne energije za uređaje, hlađenje i rasvjetu (kWh/kućanstvu) | Unit of consumption of households (total and space heating with climate correction (toe/dwelling) and electricity for appliances, air conditioning and lighting (kWh/dwelling) – Izvor | Source: EIHP
Slika | Figure 9.2.3. Specifična potrošnja energije po zaposlenom u uslužnom sektoru | Energy consumption per employee in services – Izvor | Source: EIHP
0,00
0,20
0,40
0,60
0,80
1,00
1,20
1,40
1,60
1995. 1996. 1997. 1998. 1999. 2000. 2001. 2002. 2003. 2004. 2005. 2006. 2007. 2008. 2009.
ten/
kuća
nstv
u |
toe/
dwel
ling
0
500
1000
1500
2000
2500
3000
3500
kWh/
kuća
nstv
u |
kWh/
dwel
ling
Ukupno | Total
Grijanje | Space heating
Električna energija | Electricity
0,0
0,1
0,2
0,3
0,4
0,5
0,6
0,7
0,8
0,9
1998. 1999. 2000. 2001. 2002. 2003. 2004. 2005. 2006. 2007. 2008. 2009.
ten/
zapo
slen
om |
toe
/em
ploy
ee
0
1000
2000
3000
4000
5000
6000
kWh/
zapo
slen
om |
kW
h/em
ploy
ee
ten/zaposlenom | toe/employee
kWh/zaposlenom | kWh/employee

217
ENERGY MMIXIX ENERGY EFFICIENCY
9.2.2. Zgradarstvo
Zgrade su najveći pojedinačni potrošači energije i danas predstavljaju veliki potencijal za energetske, ekonomske i ekološke uštede.
Smanjenje energetske potrošnje u zgradama direktno sma-njuje troškove života i održavanja zgrada, povećava komfor i produžuje životni vijek zgrada.
Povećanje energetske učinkovitosti u zgradama doprinosi povećanju standarda života, gospodarskom razvoju, razvoju industrije, zapošljavanju i većoj konkurentnosti cijele nacio-nalne ekonomije.
U 2009. godini u sektoru opće potrošnje, u kojem su naj-veći potrošači zgrade – kućanstva i usluge, bilježimo porast potrošnje finalne energije za 1,1 posto u odnosu na 2008. godinu. Finalna potrošnja energije u zgradama u 2009. godini iznosi 105,8 PJ, što predstavlja 40 posto ukupne energetske potrošnje u 2009. godini, koja iznosi 264,25 PJ. Ukupna potrošnja u sektoru opće potrošnje u 2009. godini iznosi 123,00 PJ.
Uočljiv je trend manjeg pada ukupne energetske potrošnje, no u sektoru zgradarstva – kućanstva i usluge, potrošnja energije i dalje raste. S obzirom da se u ovom sektoru energetske potrošnje mogu ostvariti najveće energetske uštede, potrebno je sve aktivnosti za povećanje energetske učinkovitosti priori-tetno usmjeriti upravo na područje energetske obnove posto-jećih zgrada i gradnju suvremenih niskoenergetskih zgrada.
Slika | Figure 9.2.4. Udio kućanstva i usluga u sektoru opće potrošnje u Republici Hrvatskoj 2009. godine | The share of households and services in other sectors in the Republic of Croatia 2009 – Izvor | Source: EIHP
9.2.2. Buildings
The buildings are the largest single consumers of energy and today they carry large potential for energy, economic and environmental preservation.
Lowering energy consumption in the buildings will directly contribute to lowering the maintenance costs as well as the costs of living,. It will also enable better comfort of living and expand lifetime of the buildings.
Enhancing energy efficiency in the buildings helps improving the living standard and contributes to economic growth, indu-strial development, job creation and boosting competitivene-ss of the national economy as a whole.
In 2009, the other sectors, where the buildings – households and services – are the largest single consumer, saw an incre-ase of final energy consumption by 1.1 percent from the 2008 level. In 2009 final energy consumption in the buildings was 105.8 PJ, which makes 40 percent of total energy consump-tion in that year, which amounted to 264.25 PJ. In 2009 total consumption in the other sectors amounted to 123.00 PJ.
We can observe a trend of a minor drop in total energy con-sumption, but in the building sector – households and servi-ces, the consumption is still growing. Given the fact that this consumption sector has potential for the biggest energy savin-gs, it is necessary, as a priority, to focus all activities on energy efficiency enhancing in to energy reconstruction of the existing buildings and construction of modern low-energy buildings.
Kućanstva | Households 61,6%
Uslužni sektor | Services 24,4%
Poljoprivreda | Agriculture 8,5%Građevinarstvo | Construction 5,5%

218
ENERGIJA MMIXIX ENERGETSKA UČINKOVITOST
Slika | Figure 9.2.5. Udio ukupne potrošnje u zgradarstvu u 2009. godini u ukupnoj potrošnji finalne energije | The share of total energy consumption in buildings in the final energy consumption in 2009 – Izvor | Source: EIHP
Očekuje se da će provedba obavezne energetske certifikacije zgrada u Hrvatskoj potaknuti niz novih aktivnosti u građevinar-stvu kroz integralan pristup osmišljavanju energetike zgrada kao što su:
• energetski pregledi zgrada
• energetska obnova i osuvremenjivanje postojećih zgrada
• integralno planiranje suvremenog energetskog koncepta novih zgrada.
Implementacijom EU Direktive 2002/91/EC o energetskim svojstvima zgrada (EPBD) u hrvatsko zakonodavstvo se uvodi obavezna energetska certifikacija zgrada za nove i postojeće zgrade. EPBD se implementira na temelju Akcijskog plana za implementaciju izrađenog u Ministarstvu zaštite okoliša, prostornog uređenja i graditeljstva (MZOPUG), usvojenog u travnju 2008. godine, kroz Zakon o prostornom uređenju i gradnji (NN 76/2007 i 38/2009) i Zakon o učinkovitom korištenju energije u neposrednoj potrošnji (NN 152/2008) te putem niza tehničkih propisa i pravilnika, od kojih su do sada usvojeni: Tehnički propis o racionalnoj uporabi energije i toplinskoj zaštiti zgrada, Tehnički propis o sustavima grija-nja i hlađenja zgrada, Pravilnik o energetskom certificiranju zgrada i Pravilnik o uvjetima i mjerilima za osobe koje pro-vode energetske preglede i energetsko certificiranje zgrada. U lipnju 2009. godine usvojena je i nacionalna Metodologija provođenja energetskog pregleda zgrada, čime su ostvareni osnovni preduvjeti za početak energetske certifikacije zgrada.
It is expected that the implementation of the mandatory energy certification of the buildings in Croatia will set off a number of new activities in the construction industry through an integra-ted approach to energy performance of the buildings, such as:
• Energy audits
• Energy reconstruction and modernization of the existing buildings
• Integrated energy planning for new buildings based on modern energy concepts.
The implementation of EU Directive 2002/91/EC on the energy performance of buildings (EPBD) in the Croatian legislation will introduce the mandatory energy certification both for the new buildings and the existing ones. EPBD is implemented on the basis of the Action Plan defined by the Ministry of Environmental Protection, Physical Planning and Construction as adopted in April 2008, through the Law on Physical Planning and Construction (Official Gazette 76/07 and 38/09) and the Law on Efficient Use of Energy in Final Energy Demand (OG 152/08) and through a number of technical regulations and rules. The following regulations have been adopted so far: Technical Regulation on Energy Economy and Heat Retention in Buildings; Technical Regulation on Heating and Cooling Systems in Buildings; Ordinance on Energy Certification of Buildings; and Ordinance on Requirements and Criteria to be met by Energy Auditors and Energy Certifiers of Buildings. In June 2009 the National methodology for energy audits of buil-dings was adopted, which created conditions for the energy certification of buildings.
Ukupna potrošnja energije u zgradama | Total energy consumption in buildings 40,0%
Poljoprivreda | Agriculture 4,0%
Građevinarstvo | Construction 2,5%Industrija | Industry 22,1%
Promet | Transport 34,1%

219
ENERGY MMIXIX ENERGY EFFICIENCY
Postupak energetskog certificiranja postojeće zgrade sastoji se od:
• energetskog pregleda zgrade
• vrednovanja i/ili završnog ocjenjivanja radnji energetskog pregleda zgrade
• izrade energetskog certifikata zgrade s prijedlogom mjera za poboljšanje energetskih svojstava zgrade koje su ekonomski opravdane s izračunatim razdobljem povrata investicije.
Postupak energetskog certificiranja nove zgrade sastoji se od:
• određivanja energetskog razreda zgrade
• izrade energetskog certifikata s preporukama za korištenje zgrade vezano uz ispunjenje bitnog zahtjeva uštede ener-gije i toplinske zaštite te ispunjenje energetskih svojstava zgrade
Suvremeno upravljanje energijom u zgradama uključuje široku analizu svih energetskih sustava zgrade. Energetski pregled zgrade podrazumijeva analizu toplinskih karakteristika i energetskih sustava zgrade radi utvrđivanja učinkovitosti i/ili neučinkovitosti potrošnje energije te donošenja zaključaka i preporuka za povećanje energetske učinkovitosti. Energetskim pregledom utvrđuje se način korištenja energije, područja rasipanja energije i identificiraju se mjere za povećanje ener-getske učinkovitosti. Osnovni cilj energetskog pregleda je pri-kupljanjem i obradom niza parametara dobiti što točniji uvid u zatečeno energetsko stanje zgrade s obzirom na: građevin-ske karakteristike u smislu toplinske zaštite; kvalitetu sustava za grijanje, hlađenje, prozračivanje i rasvjetu; zastupljenost i kvalitetu energetskih uređaja; strukturu upravljanja zgradom te pristup stanara ili zaposlenika energetskoj problematici, nakon čega se odabiru konkretne optimalne energetsko-eko-nomske mjere za povećanje energetske učinkovitosti.
Uvođenjem energetske certifikacije zgrada, odnosno klasifika-cije i ocjenjivanja zgrada prema potrošnji energije, energetski pregled zgrade postaje nezaobilazna metoda utvrđivanja učinkovitosti, odnosno neučinkovitosti potrošnje energije te podloga za izradu energetskog certifikata zgrade.
Energetski certifikat je dokument koji predočuje energetska svojstva zgrade, ali i jaki marketinški instrument s ciljem
The energy certification procedure for the existing buildings consists of:
• Energy audit of the building,
• Evaluation and/or final assessment of energy auditing activities,
• Preparing energy certificate of the building with proposal of economically viable measures for improving energy perfor-mance of the building, including the calculation of return of investment period.
The energy certification procedure for new buildings consists of:
• Determining the energy class of the building, and
• Preparing energy certificate with recommendations for building use with regard to essential requirement of energy saving and thermal protection and energy performance of the building.
Modern energy management in the buildings includes a com-prehensive analysis of all of their energy systems. Energy audi-ting presumes the analysis of the building’s thermal properties and energy systems with the aim to determine efficiency and/or lack of efficiency in energy use and making proper conclusions and recommendations for enhancing energy efficiency. Energy auditing is a mean to determine the way the energy is used, where the energy is wasted, and to identify the measures for increasing energy efficiency. The main goal of energy audits is to obtain as accurate as possible an insight in the current energy state of the building by collecting and processing a number of parameters, such as: construction features in terms of thermal protection; quality of heating, ventilation and lighting systems; presence and quality of energy devices; structure of building management and approach of dwellers or employees to the energy issues. After that, the choice is made of specific energy efficiency measures which are optimal in economic and energy terms.
By introducing energy certification of buildings, i.e., building classification and evaluation based on energy consumption, energy audits become an indispensable method of identifying efficiency or lack of efficiency of energy use and the basis for energy certification of the building.
Energy certificate is a document which shows the energy perfor-mance of a building, but it is also a strong marketing instrument

220
ENERGIJA MMIXIX ENERGETSKA UČINKOVITOST
promocije energetske učinkovitosti i nisko energetske grad-nje i postizanja višeg komfora života i boravka u zgradama. Energetskim certificiranjem zgrada dobivaju se transparentni podaci o potrošnji energije u zgradama na tržištu, energetska učinkovitost prepoznaje se kao znak kvalitete, potiču se ulaga-nja u nove inovativne koncepte i tehnologije, potiče se kori-štenje alternativnih sustava za opskrbu energijom u zgradama, razvija se tržište novih nisko energetskih zgrada i modernizira sektor postojećih zgrada te se doprinosi ukupnom smanjenju potrošnje energije i zaštiti okoliša.
Na temelju izračuna specifične godišnje potrebne toplinske energije za grijanje QH,nd,ref zgrada se svrstava u razred ener-getske potrošnje, od A+ razreda s najmanjom potrošnjom toplinske energije za grijanje (QH,nd,ref ≤ 15 kWh/(m2a)), do G razreda zgrade s najvećom energetskom potrošnjom (QH,nd,ref > 250 kWh/(m2a)) i to u dvije referentne klime, kontinental-noj i primorskoj Hrvatskoj, s granicom na 2 200 stupanj dana grijanja. Pri tome je važno napomenuti da zgrade projektirane u skladu s današnjim propisima uglavnom ulaze u razred energetske potrošnje C te je potrebno značajno poboljšati energetska svojstava zgrade kako bi ona bila svrstana u ener-getski razred B, A ili A+.
Energetskim certificiranjem zgrada uvodi se:
• obveza vlasnika zgrade da prilikom izgradnje, prodaje ili iznajmljivanja zgrade predoči budućem vlasniku, odnosno potencijalnom kupcu ili najmoprimcu energetski certifikat kojemu rok valjanosti nije duži od deset godina
• obveza izdavanja i izlaganja energetskog certifikata ne sta-rijeg od deset godina na jasno vidljivom mjestu, za zgrade javne namjene ukupne korisne površine veće od 1000 m2 koje koriste tijela javne vlasti i zgrade institucija koje pru-žaju javne usluge velikom broju ljudi
Zgrade javne namjene koje imaju ukupnu korisnu površinu veću od 1 000 m2 moraju imati energetski certifikat izložen na mjestu jasno vidljivom posjetiteljima zgrade. Energetski certifikat se izrađuje uvećan na format A3, zaštićen od even-tualnih oštećenja i pričvršćen na siguran način u roku od 36 mjeseci od donošenja Metodologije provođenja energetskih pregleda zgrade, dakle najkasnije do lipnja 2012. godine. Javno se izlaže prva strana energetskog certifikata koja sadrži
for promoting energy efficiency and low-energy building design as well as achieving higher comfort of dwelling. Energy certification enables to obtain transparent data on energy consumption in the buildings that are traded on the market. Energy efficiency is recognized as a quality feature and it supports the investments in new and innovative concepts and technologies; promotes the use of alternative energy supply systems in the buildings; helps to develop the market of low-energy buildings and to modernize the sector of the existing buildings, contributing to general energy conservation and environmental protection.
Based on calculation of specific annual needs for thermal energy for heating QH,nd,ref the building is put in energy con-sumption classes, starting from A+, a class of the lowest consumption of energy for heating (QH,nd,ref ≤ 15 kWh/(m2a)), up to G, a class with the highest energy consumption (QH,nd,ref > 250 kWh/(m2a)), for two reference climates: inland and coastal zones of Croatia, with 2200 heating day limit. It is important to mention that the buildings designed in accordan-ce with the current regulations fall in the energy class C, and it is necessary to significantly improve their energy performance so that they could be put in the energy classes B, A or A+.
The energy certification of the buildings will introduce:
• Obligation for the building owners to present to future owner or potential buyer or tenant the energy certificate valid for up to ten years maximum,
• Obligation to issue and display energy certificate not older than ten years in a clearly visible place. This obligation refers to public buildings with total useful surface larger than 1000 m2 used by public authorities and buildings of the institutions providing public services to a large number of people
In public buildings with total useful surface larger than 1,000 m2 the energy certificate must be displayed in a way that it is clearly visible to the visitors. The energy certificate should be enlarged to A3 size and protected from potential damages and fastened in a secure way. What should be publicly displayed is the first page which contains basic information about the buil-ding and the scale of energy classes, and the third page which contains the recommendations for improving the building’s energy performance. The public buildings, which are subject to obligation of public displaying energy certificate, must have and display the energy certificate as well as the list of energy

221
ENERGY MMIXIX ENERGY EFFICIENCY
osnovne podatke o zgradi i skalu energetskih razreda te treća strana certifikata koja sadrži preporuke za poboljšanje ener-getskih svojstava zgrade.
S ciljem ujednačavanja kvalitete i metoda provedbe ener-getskih pregleda zgrada, u lipnju 2009. godine, usvojena je nacionalna Metodologija provođenja energetskog pregleda zgrada. Prema njoj, energetski pregled zgrade obavezno uključuje:
1. Analizu građevinskih karakteristika zgrade u smislu toplin-ske zaštite (analizu toplinskih karakteristika vanjske ovojni-ce zgrade)
2. Analizu energetskih svojstava sustava grijanja i hlađenja
3. Analizu energetskih svojstava sustava klimatizacije i ventilacije
4. Analizu energetskih svojstava sustava za pripremu potrošne tople vode
5. Analizu energetskih svojstava sustava potrošnje električne energije – sustav elektroinstalacija, rasvjete, kućanskih aparata i drugih podsustava potrošnje električne energije
6. Analizu upravljanja svim tehničkim sustavima zgrade
7. Potrebna mjerenja za ustanovljavanje energetskog stanja i /ili svojstava gdje je to nužno
8. Analizu mogućnosti promjene izvora energije
9. Analizu mogućnosti korištenja obnovljivih izvora energije i učinkovitih sustava
10. Prijedlog ekonomski povoljnih mjera poboljšanja ener-getskih svojstava zgrade, ostvarive uštede, procjenu inve-sticije i jednostavni period povrata
11. Izvještaj s preporukama za optimalni zahvat i redoslijed prioritetnih mjera koje će se implementirati kroz jednu ili više faza
Energetski pregled zgrade opcionalno može uključivati i druge radnje ovisno o namjeni i vrsti zgrade, kao npr. analizu potrošnje sanitarne vode i preporuke za smanjenje njene potrošnje.
efficiency measures, not later than 36 months from adoption of the Methodology for implementation of the energy audit of buildings, i.e., June 2012.
In order to standardize the quality and methods of energy audits of the buildings, the National methodology for implementation of energy audits was adopted in June 2009, which provides that an energy audit must include:
1. analysis of construction features of the buildings in terms of thermal protection (analysis of thermal characteristics of the building’s envelope),
2. analysis of energy performance of the heating and cooling systems,
3. analysis of energy performance of the air conditioning and ventilation systems,
4. analysis of energy performance of the hot water systems,
5. analysis of energy performance of the electricity using systems – electrical installations, lighting, house applian-ces and other sub systems of electricity use,
6. analysis of management of all technical systems of the building,
7. required measurements, if necessary for establishing the energy status and/or characteristics,
8. analysis of potential change of energy source,
9. analysis of potential use of renewable energy sources and efficient systems,
10. proposal for economically viable measures for improving energy performance of the building, feasible savings, evaluation of investment and simple payback period of investment,
11. report with recommendations for optimal changes and priority order of measures to be implemented in one or multiple steps.
The energy audit may, as an option, include other actions pending on purpose and type of the building, such as analysis of sanitary water consumption and recommendations for its reduction.

222
ENERGIJA MMIXIX ENERGETSKA UČINKOVITOST
Osnovna karakteristika energetskog pregleda zgrade je pri-kupljanje podataka o zgradi i izračun godišnjih energetskih potreba za grijanje i potrošnu toplu vodu, prema HRN EN 13790:2008. Za stambene i nestambene zgrade nije oba-vezno mjerenje niti prikupljanje podataka o potrošnji i troš-kovima za energiju, već se cijeli energetski pregled temelji na prikupljanju ulaznih podataka i izračunu. Ukoliko postoje podaci, moguće je opcionalno analizirati i potrošnju i troško-ve za energiju te provesti određena mjerenja u svrhu utvrđiva-nja kvalitete izvedbe kod novih zgrada, odnosno identifikacije problema i točnijeg utvrđivanja energetskih svojstava kod postojećih zgrada.
Energetskim pregledom se za potrebe energetskog certifi-ciranja analiziraju svi tehnički sustavi zgrade, a izračunava se godišnja potrebna toplinska energija za grijanje QH,nd za stvarne i referentne klimatske uvjete koja se za sada obavezno unosi u energetski certifikat, dok je unos ostalih energetskih potreba opcionalan. U konačnosti, energetski certifikat bi trebao sadržavati podatke o ukupnoj primarnoj energiji Eprim (kWh/a), odnosno podatke o računski određenoj količini ener-gije za potrebe zgrade tijekom jedne godine, koja obuhvaća ukupnu primarnu energiju za grijanje, pripremu potrošne tople vode, hlađenje i rasvjetu te energiju za pomoćne uređa-je i regulaciju. Uz to trebaju biti iskazane i CO2 emisije prema utrošku pojedinog izvora energije.
Analiza mogućih mjera poboljšanja energetskih svojstava i povećanja energetske učinkovitosti obavezno uključuje:
• poboljšanje toplinskih karakteristika vanjske ovojnice
• poboljšanje energetskih svojstava sustava grijanja prostora
• poboljšanje energetskih svojstava sustava hlađenja prostora
• poboljšanje energetskih svojstava sustava ventilacije i klimatizacije
• poboljšanje energetskih svojstava sustava pripreme potrošne tople vode
• poboljšanje energetskih svojstava sustava potrošnje elek-trične energije – rasvjeta, uređaji i ostala trošila
• poboljšanje energetskih svojstava specifičnih podsustava
The basic feature of the energy audit is collecting of data and calculation of annual energy needs for heating and sanitary hot water according to HRN EN 13790:2008. For residential and non residential buildings measuring and data collection on consumption and energy costs is not mandatory, but the whole energy audit is based on collecting input data and calculation. If the data exist, there is option to analyze consumption and energy costs and to implement certain measurements in order to determine the quality of implementation of the new buildin-gs, or identification of the problems and accurate identification of energy performance of the existing buildings.
When conducting an energy audit for energy certification pur-pose, all the building’s technical system are scrutinized and annual needs for thermal energy for heating QH,nd is calculated, for actual and reference climate conditions. These information must be entered in the energy certificate, while the entries of other energy needs are optional. Finally, energy certificates should contain information on total primary energy Eprim (kWh/a), i.e., data of pre-calculated quantity of energy for the building’s needs during one year, which encompasses total primary energy for heating, hot water preparation, cooling and lighting, as well as energy for ancillary devices and regulation. In addition, the CO2 emission generated by consume of each energy source should be stated.
The analysis of possible energy performance and energy effici-ency measures must include:
• Improvement of thermal performance of the building’s envelope,
• Improvement of energy performance of the space heating systems,
• Improvement of energy performance of the space cooling systems,
• Improvement of energy performance of the ventilation and air conditioning systems ,
• Improvement of energy performance of the hot water systems,
• Improvement of energy performance of the electricity using systems – lights, appliances and other consumers,
• Improvement of energy performance of specific sub systems,

223
ENERGY MMIXIX ENERGY EFFICIENCY
• analiza mogućnosti zamjene energenta ili korištenja obnovljivih izvora energije za proizvodnju toplinske i/ili električne energije
• poboljšanje sustava regulacije i upravljanja
• poboljšanje sustava opskrbe vodom i potrošnje (opcionalno)
• potrebne procjene i izračuni ušteda za odabrane mjere
Mogućnosti poboljšanja energetskih svojstava zgrade možemo podijeliti u dvije skupine:
1. Mjere uz male troškove i brzi povrat investicije
2. Mjere uz veće troškove i dulji povrat investicije
Energetske preglede i energetsko certificiranje zgrada provo-de za to educirane i ovlaštene stručne osobe, arhitektonske, građevinske, strojarske i elektrotehničke struke. Stručno osposobljavanje i obvezno usavršavanje osoba koje provode energetske preglede i/ili energetsko certificiranje zgrada pro-vode sveučilišta, veleučilišta, instituti, strukovne organizacije koji imaju suglasnost Ministarstva zaštite okoliša, prostornog uređenja i graditeljstva za obavljanje tih poslova.
Ministarstvo zaštite okoliša, prostornog uređenja i gradi-teljstva vodi registar izdanih energetskih certifikata zgrada. Podatke u registar unosi ovlaštena osoba koja izrađuje ener-getski certifikat, putem web stranice Ministarstva.
Metodologija energetskih pregleda zgrada svrstava zgrade prema karakteristikama potrošnje energije u nekoliko grupa-cija, ovisno o razdoblju izgradnje. Sa stajališta energetske potrošnje, razdoblje izgradnje je izuzetno važan parametar. Period izgradnje kao i period eventualne obnove zgrade prvi su i osnovni podatak koji će se provjeriti prilikom provođe-nja energetskog pregleda zgrade. Taj podatak puno govori o karakteristikama izgradnje i tipovima konstrukcija koje su korištene u pojedinom periodu izgradnje. Također govori i o eventualnom postojanju toplinske zaštite, ovisno o zakono-davnom okruženju u području toplinske zaštite u odnosu na period izgradnje.
Prema starosti i vrsti gradnje, a u ovisnosti o zakonodavnom okruženju, postojeće zgrade u Hrvatskoj možemo podijeliti u sljedeće grupacije:
• Analysis of potential replacement of fuel or of using renewable energy sources for generating thermal energy/ electricity,
• Improvement of the regulation and control systems,
• Improvement of the water supply and consumption systems (optional),
• Necessary evaluations and calculations of savings for the selected measures.
The potentials for improving energy performance of the buildin-gs can be divided in two groups:
1. low cost measures with fast return on investment
2. higher cost measures with longer return of investment
The energy audits and energy certification of buildings are con-ducted by authorized experts who have received relevant trai-ning and are professionals in architecture, construction, mec-hanical or electrical engineering. The expert training and man-datory specialization of the persons conducting energy auditing and/or certification of buildings are carried out by universities, polytechnics, institutes, professional organizations which hold appropriate approval of the Ministry of Environmental Protection, Physical Planning and Construction.
The Ministry of Environmental Protection, Physical Planning and Construction keeps the Registry of authorized persons and of issued energy certificates. The authorized persons who make energy certificates enter the data in the Registry of issued certi-ficates through the Ministry’s web page.
The energy audit methodology classifies the buildings in seve-ral groups depending on characteristics of energy use and on the period when a building was built. In terms of energy use, the period of construction is a very significant parameter, and together with the time of renovation (if applicable), it is the first and basic information which will be checked up in energy audit exercise. This information reveals a lot on the construction features and types of the building structure. Also, it indicates if the building has any thermal protection or not. This depends on the legislation requirements concerning thermal protection that were valid in the period of construction of the building.
In terms of building’s age and type of construction, and pen-ding on legislation environment, the buildings in Croatia can be classified in the following characteristic groups:

224
ENERGIJA MMIXIX ENERGETSKA UČINKOVITOST
• zgrade građene prije 1940. godine
• zgrade građene u periodu od 1940. do 1970. godine
• zgrade građene u periodu od 1970. do 1987. godine
• zgrade građene u periodu od 1987. do 2006. godine
• novogradnja usklađena s Tehničkim propisom o uštedi toplinske energije i toplinskoj zaštiti u zgradama (NN 79/2005) s obaveznom primjenom od 1. srpnja 2006. godine te Tehničkim propisom o racionalnoj uporabi ener-gije i toplinskoj zaštiti zgrada (NN 110/2008 i 89/2009)
Aktivnosti na povećanju energetske učinkovitosti povećanjem toplinske zaštite zgrada treba usmjeriti na zgrade građene prije 1987. godine. Taj sektor zgrada potrebno je sustavno obnavljati, uz dobro razrađen višegodišnji akcijski plan za energetsku obnovu zgrada. Energetska obnova zgrada uvijek treba biti usmjerena radi postizanja niskoenergetskog stan-darda i što niže energetske potrošnje. U zgradama građenim u razdoblju od 1987. do 2006. godine potrebno je dodatnim preporukama za uštedu energije - regulacijom, štednom rasvjetom i sl. i manjim zahvatima na ovojnici zgrade smanjiti potrošnju energije. Pri svakoj rekonstrukciji energetske susta-ve treba pažljivo optimirati u što bolju energetski učinkovitu cjelinu. Nove zgrade potrebno je integralno planirati i detaljno osmisliti kroz energetski koncept.
Odabir energetski, ekološki i ekonomski optimalnog ener-getskog sustava zgrade, podrazumijevajući i fiziku zgrade i energetske procese koji se odvijaju u njoj, kao i korištenih energenta, ima ključnu ulogu u kasnijoj eksploataciji zgrade, kako u pogledu troškova tako i utjecaja na čovjekov okoliš.
Energetski koncept je integralno i optimalno rješenje u smislu kvalitete gradnje, opskrbe energijom i racionalne energetske potrošnje u projektiranim građevinama. Takvo rješenje dugo-ročno ostvaruje niske troškove pri korištenju i održavanju zgrada te produžava životni vijek zgrade uz smanjenje njezi-nog ekološkog otiska.
S obzirom na postavljene ciljeve za smanjenje energetske potrošnje, možemo očekivati da će glavne aktivnosti u sektoru zgradarstva, odnosno građevinarstva u budućnosti biti usmje-rene upravo na sustavnu energetsku obnovu postojećih zgrada te gradnju suvremenih niskoenergetskih zgrada.
• Building constructed before 1940
• Building constructed in the period from 1940 to 1970
• Building constructed in the period from 1970 to 1987
• Building constructed in the period from 1987 to 2006
• New constructions in conformity with Technical Regulation on Thermal Energy Economy and Heat Retention in Buildings (OG 79/05) applicable from July 2006, and Technical Regulation on Energy Economy and Heat Retention in Buildings (OG 110/08, OG 89/09)
The activities aimed at enhancing energy efficiency by incre-asing thermal protection should be focused on the buildings built in the pre-1987 period. This building sector should be systematically renovated based on a well elaborated action plan for energy renovation of the buildings that spans over several years. The energy renovation should always aim at the low energy standards and as low energy consumption as possible. In the buildings built in the 1987 to 2006 period it is necessary to reduce energy consumption based on additional recom-mendations for energy savings, such as better regulation, low energy lights, and by minor works on the building’s envelope. In any reconstruction it is necessary to carefully optimize the energy systems so that they form an integrated and energy efficient structure. In the new constructions, integrated planning and comprehensive energy concepts should be applied.
The choice of an optimal energy system in a building in terms of energy, environmental and economy, presuming the physical features of the building and its energy processes, as well as the use of energy products, has a key role in the use of the buil-ding, both in terms of costs and its environmental impact.
The energy concept is an integrated and optimal solution in the sense of quality of construction, energy supply and economical energy use in the buildings. Such a solution is a way to achieve low maintenance costs in long term. It extends the building’s lifetime and lowers its environmental footprint.
Given the goal to reduce energy consumption, we can expect that the main activities in the building sector and construction industry will be aimed at systematic energy renovation of the existing buildings and construction of low energy buildings.

225
ENERGY MMIXIX ENERGY EFFICIENCY
9.3. Energetska učinkovitost u industriji
Porast energetske intenzivnosti u 2009. godini bilježe četiri promatrane grane: papirna industrija, proizvodnja transportnih sredstava, prerada metala te industrija kartona i ambalaže. Papirna industrija, unutar koje se promatraju i tiskarske djelatnosti, ima u ovoj godini vrlo velik porast intenzivno-sti od 119,0 posto, kao i prerada metala od 103,0 posto. Proizvodnja transportnih sredstava ima porast od 29,0 posto, a industrija kartona i ambalaže od 22,0 posto. Energetske intenzivnosti u ostalim granama industrije su se smanjile. Industrija primarnih metala bilježi znatan pad intenzivnosti od 54,0 posto, industrija nemetalnih minerala od 26,0 posto, proizvodnja gume i plastike od 17,0 posto, kemijska industri-ja od 19,0 posto, industrija hrane, pića i duhana pad inten-zivnosti od 15,0 posto, strojogradnja i industrija metalnih proizvoda 10,0 posto pada. Ostale grane bilježe padove do 10,0 posto. Promjena energetske intenzivnosti industrijskih grana u 2009. godini prikazana je na slici 9.3.1.
Što se tiče odnosa energetske intenzivnosti i neposredne potrošnje energije u industriji, mogu se razmotriti poka-zatelji za pojedine grane za 2009. u odnosu na prethodnu 2008. godinu. Ukupna potrošnja energije u industriji pala je u 2009. za 16,1 posto, uz pad opsega proizvodnje od 9,2 posto. Sve grane bilježe pad neposredne potrošnje energije, osim prerađenih metala, proizvodnje papira te proizvodnje transportnih sredstava, koja zadržava otprilike istu razinu. Prerada metala bilježi porast intenzivnosti od 60,0 posto, no ndeks opsega proizvodnje je za tu industriju u padu od 24,0 posto. Najveći pad potrošnje energije ima proizvodnja primarnih metala za 30,8 posto, uz manji indeks proizvodnje od oko 25,0 posto. Tome najviše doprinosi pad proizvodnje čelika. Od najvećih potrošača energije, industrija nemetalnih minerala pada za 21,5 posto u potrošnji energije, uz 10,8 posto manji indeks proizvodnje. Tu su najutjecajnija kretanja u proizvodnji cementa. Prehrambena industrija ima 20,0 postotni pad potrošnje uz 4,6 posto manji indeks proizvod-nje. Nadalje, kemijska industrija bilježi pad potrošnje od 7,8 posto, uz značajniji pad indeksa proizvodnje od 23,0 posto. Proizvodnja papira se bitnije razlikuje s 11,4 postotnim pove-ćanjem energetske potrošnje, uz 1,6 posto veći proizvodni indeks. Ostale značajnije skupine bilježe smanjenje potrošnje od oko 10,0 posto.
9.3. Energy Effi ciency in Industry
In 2009, energy intensity increase occurred in four observed branches of industry: paper and printing industry, transport equipment, fabricated metals and paper and board industry. The paper and printing industry had a high energy intensity increase in this year, 119 percent, as well as the fabricated metals, 103 percent. The transport equipment had an incre-ase of 29 percent, while the paper and board industry had an intensity increase of 22 percent. The energy intensities in other branches of industry decreased. The primary metals industry had a significant drop in intensity, of 54 percent, the non-metallic minerals industry of 26 percent, the rubber and plastics of 17 percent, the chemical industry had a decrease in intensity of 19 percent, the food, beverage and tobacco indu-stry of 15 percent, the machinery & metal products industry had a 10 percent intensity drop. Other industrial branches had intensity drops up to 10 percent. The changes in energy inten-sities of the industrial sectors in 2009 are given in Figure 9.3.1.
Regarding the relationship between the energy intensity and the final energy consumption in industry, the indicators for individual branches can be considered for year 2009 compared to 2008. Total energy consumption in industry dropped by 16.1 percent in 2009., with the decrease in production index of 9.2 percent. All branches experienced the decrease in final energy consumption, except fabricated metals industry, paper industry, and transport vehicles industry, the latter keeping the same level. The fabricated metals had an intensity increase of 60 percent, while the production index for this branch dropped by 24 percent. The biggest decrease in energy consumption was present at the primary metals industry, with a 30.8 percent drop, with a 25 percent lower production index. This is mostly the result of decreased steel production. Of the largest energy consumers, the non-metallic mineral industry had a 21.5 percent energy consumption drop with 10.8 percent lower pro-duction index. This is mostly due to the situation in the cement production. The next branch with large consumption, the food processing industry, had a 20 percent decrease with 4.6 per-cent lower production index. Further, the chemical industry experienced a 7.8 percent drop in energy consumption with a significant drop in production index of 23 percent. With 11.4% increase in energy consumption the paper production differs from these trends, with 1.6 percent higher production index. Other significant branches decreased their energy consumption by about 10 percent.

226
ENERGIJA MMIXIX ENERGETSKA UČINKOVITOST
Regarding the fuel use, the non-metallic minerals production mostly used natural gas, with a consumption decrease of 21 percent, and liquid fuels, with a 30 percent decrease from 2008. The electricity consumption has a 16 percent drop here. The food processing industry also primarily used natural gas, with a 27 percent drop, then electricity, with a 3 percent consumption decrease. The chemical industry had a 10 per-cent increase in natural gas consumption as a main fuel, and a 8 percent decrease in electricity consumption. At the paper production, a 20 percent increase in heavy fuel oil is recorded, while electricity, as the most used fuel in this industry, remai-ned at approximately the same level.
U proizvodnji nemetalnih minerala najviše se trošio prirodni plin, s padom od 21,0 posto, i tekuća goriva, manje za 30,0 posto u odnosu na 2008. Potrošnja električne energije manja je za 16,0 posto. U prehrambenoj industriji se također najvi-še trošio prirodni plin, manje za 27,0 posto, zatim električna energija s 3,0 postotnim padom potrošnje. Kemijska indu-strija bilježi 10,0 postotni porast potrošnje prirodnog plina kao najzastupljenijeg energenta, a 8,0 postotni pad potrošnje električne energije. Kod proizvodnje papira je prisutno 20,0 postotno povećanje potrošnje lož ulja (LUS), dok električna energija, kao energent s najvećom potrošnjom, ne bilježi bitne promjene.
Slika | Figure 9.3.1. Energetska intenzivnost industrijskih grana od 1995. do 2009. (indeks 1995=100) | Energy intensities of manufacturing industry branches in the period 1995 - 2009 (index 1995=100) – Izvor | Source: EIHP
Energetska učinkovitost potrošnje energije u industriji u raz-doblju od 1995. do 2009. godine napredovala je za indeks od 19,0 posto. Tome su najviše pridonijele proizvodnja čelika (-77,0 posto), proizvodnja vozila (-44,0 posto), proizvodnja tekstila (-31,7 posto) i metala (-17,7 posto), zbog smanjenja specifične potrošnje energije, dok su kemijska i industrija obojenih metala imale povećanje indeksa energetske učinko-vitosti (5,6 i 1,8 posto). Indeks energetske učinkovitosti ODEX za industriju prikazan je na slici 9.3.2.
In the period from 1995 to 2009, the energy efficiency index in industry improved by 15 percent. This was mostly due to the steel industry (-77 percent), transport vehicles industry (-44 percent), textiles (-31.7 percent) and metal production industry (-17.7 percent) because of reduction in specific energy con-sumption, while the energy efficiency index in chemical and non-ferrous metal industry increased by 5.6 percent and 1.8 percent respectively. The energy efficiency index ODEX of the industry is given in Figure 9.3.2.
0
20
40
60
80
100
120
140
160
180
1995. 1996. 1997. 1998. 1999. 2000. 2001. 2002. 2003. 2004. 2005. 2006. 2007. 2008. 2009.
rudarstvo i vađenje kamena | mines and quarrying
prerađivačka industrija | manufacturing industry
industrija hrane, pića i duhana | food, beverage, tobacco
tekstilna i kožarska industrija | textiles, clothing, leather
drvna industrija | wood industry
papirna industrija | paper andprinting
industrija kartona i ambalaže | paper and board
kemijska industrija | chemicals
industrija nemetalnih minerala | non metallic minerals
industrija primarnih metala | primary metals
strojogradnja i ind. met. proizvoda machinery & metal products
prerada metala | fabricatedmetals
proizvodnja transportnihsredstava | transport equipement
ostala proizvodnja | othermanufacturing
proizvodnja gume i plastike | rubber and plastics

227
ENERGY MMIXIX ENERGY EFFICIENCY
Slika | Figure 9.3.2. Indeks energetske učinkovitosti ODEX u industriji | Energy efficiency index ODEX for industry Izvor | Source: EIHP
Slika | Figure 9.3.3. Indeks energetske intenzivnosti u industriji | Index of energy intensity for industry Izvor | Source: EIHP
70
80
90
100
110
120
130
140
1995
.
1996
.
1997
.
1998
.
1999
.
2000
.
2001
.
2002
.
2003
.
2004
.
2005
.
2006
.
2007
.
2008
.
2009
.
Kemijske industrija | chemicals Ind. nemet. min | non metallic Industrija cementa | cement
Industrija papira | paper Prehrambena ind. | food Strojogradnja | machinery & fabricated met.
Građevinarstvo | construction Prerađivačka ind. | total manuf. Industrija ukupno | total industry
70
75
80
85
90
95
100
105
1995. 1996. 1997. 1998. 1999. 2000. 2001. 2002. 2003. 2004. 2005. 2006. 2007. 2008. 2009.
228
ENERGIJA MMIXIX ENERGETSKA UČINKOVITOST
Another indicator of the energy use in industry is energy intensity index. This indicator shows the ratio between energy consumption (in PJ) and gross value added (in HRK at 1997 level) against the referent year 1995. Over the past period of about ten years the tendency of reducing energy intensity in the industry has been relatively constant. This is the result of reducing specific energy consumption per unit of product, i.e., better energy efficiency, and of more effective increase of market value of the production. The energy intensity index in the industry is given in Figure 9.3.3.
9.4. Energy Effi ciency in Transport
Today the transport sector in Croatia is one of the most signi-ficant consumers of energy and it is expected that in the near future this sector will see a fast growing consumption trend. In the period from 1991 until 2009 the share of transport sector in the final consumption rose from 21 percent to 34 percent with an average annual increase of 4.0 percent, indicating great potential for implementing energy efficiency measures.
The potentials for an energy efficiency increase in this sector lie mostly in increased vehicle occupancy, usage of more energy efficient engines and vehicles and appropriate driving regimes.
Since year 2007 when maximum fuel consumption in Croatia was achieved equating to 2,171 toe, a continuous reduction in consumption has been recorded reaching 2,157 toe in 2008, and 2,148 in 2009 respectively. The main reason for this negative trend change came from the global economy - finance crisis in which Croatia stepped in the second half of 2008, which further lowered the needs for mobility, and thus lowered the fuel consumption.
One of the basic indicators of energy efficiency in the tran-sport sector is modal structure i.e. the share of different tran-sport modes. For instance, the share of rail transport compa-red to road transport is an indicator of energy efficiency in the cargo transport.
The structure of tone kilometers (tkm) in the cargo transport shows that the primary transport mode in the cargo transport in the Republic of Croatia is road transport, although the Croatian general modal structure is still more favorable than the modal structure of the EU 27.
Drugi pokazatelj trendova korištenja energije u industriji je indeks energetske intenzivnosti. Ovaj indeks pokazuje omjer potrošnje energije (u PJ) i ostvarene bruto dodane vrijednosti u industriji (u kn na razini 1997. godine), u odnosu na 1995. kao referentnu godinu. Trend smanjenja energetske intenziv-nosti u industriji relativno je kontinuiran tijekom posljednjih desetak godina, što je posljedica kako smanjenja specifične potrošnje energije po jedinici proizvoda, dakle povećanja energetske učinkovitosti, tako i ukupne uspješnosti u poveća-nju tržišne vrijednosti proizvodnje. Indeks energetske inten-zivnosti u industriji prikazan je na slici 9.3.3.
9.4. Energetska učinkovitost u prometu
Sektor prometa jedan je od najintenzivnijih potrošača energije u Republici Hrvatskoj, a i u budućnosti se očekuje brži rast potrošnje nego kod ostalih sektora. U razdoblju od 1991. do 2009. godine udio potrošnje prometnog sektora u finalnoj potrošnji porastao je s 21 posto na 34 posto uz prosječan godišnji porast od 4,0 posto, što ukazuje na veliki potencijal za provedbu mjera energetske učinkovitosti.
Potencijali za povećanja učinkovitosti leže uglavnom u opti-miranju strukture transportnih oblika, u što većem iskorištenju kapaciteta (povećanje loading faktora) te implementaciji što učinkovitijih motora i vozila.
Od 2007. godine kada je postignuta maksimalna potrošnja goriva u iznosu od 2 171 ten bilježi se kontinuirani pad i to na iznos od 2 157 ten u 2008. godini te na 2 148 ten u 2009. godini.. Glavni uzročnik ovoj promjeni trenda potrošnje energije proizlazi iz globalne ekonomsko – financijske krize u koju je Hrvatska ušla u drugoj polovici 2008. godine, što se manifestiralo kroz manju potrebom za mobilnošću, a samim time i manjom potrošnjom goriva.
Osnovni pokazatelj energetske učinkovitosti u prometu sva-kako je struktura pojedinih oblika prijevoza te je, primjerice, veći udio prijevoza tereta željeznicom pokazatelj višeg stupnja energetske učinkovitosti u prijevozu tereta.
Struktura tonskih kilometara u prijevozu tereta pokazuje da je u Republici Hrvatskoj primarni oblik cestovni prijevoz, iako je sama struktura pojedinih oblika prijevoza još uvijek povoljnija u odnosu na EU 27.

229
ENERGY MMIXIX ENERGY EFFICIENCY
Slika | Figure 9.4.1. Struktura tonskih kilometara u transportu tereta u Republici Hrvatskoj 2009. i EU 27 2008. | Modal structure of cargo transport in the Republic of Croatia (2009) and EU 27 (2008) – Izvor | Source: DZS,
Directorate-General for Energy and Transport, Eurostat
Potrebno je naznačiti da je iz promatranja izuzet pomorski i obalni prijevoz koji daje donekle iskrivljenu sliku jer zbog velike prijeđene udaljenosti u međunarodnom brodskom pri-jevozu dolazi do velikog udjela tonskih kilometara.
U strukturi putničkih kilometara (procjena za prijevoz osobnim vozilima u Republici Hrvatskoj na temelju broja registriranih osobnih vozila, prosječne godišnje prijeđene udaljenosti i prosječne popunjenosti vozila), sukladno očekivanjima, pre-vladava cestovni prijevoz osobnim vozilima.
Udio cestovnog prijevoza osobnim vozilima je nešto viši nego u EU 27, zbog nižeg udjela zračnog prijevoza. Nadalje, udio javnog gradskog prijevoza je nešto viši u EU 27, dijelom i zbog udjela novih zemalja članica u kojima je, zbog povije-snih razloga, udio javnog gradskog prijevoza tradicionalno bio viši nego u zemljama članicama EU 15 (iako je u navedenim zemljama u posljednjih nekoliko godina također iskazan izuzetno snažan porast broja osobnih vozila i porast udjela kamionskog prijevoza).
It should be mentioned that sea and coastal transport is excluded from this comparison in order to avoid a distorted picture it may create due to large distances covered in the international sea transport resulting in a large number of tkm compared to other transport modes.
Expectedly, the modal structure of passenger kilometers (with an estimation for the road transport with private cars based on the number of registered private cars, average vehicle occu-pancy and average annual mileage) shows that private cars dominate in total passenger kilometers (pkm).
The share of private cars in road transport in total pkm in Croatia is somewhat higher compared to the EU 27. However, this happens at the expense of a lower share of air transport. Furthermore, the share of public transport is somewhat higher in the EU 27, partially due to the impact of the new member states with a historically higher share of public transport compared to the EU 15 (although in most of the new EU member states the share of private cars in passen-ger transport and trucks in cargo transport has increased significantly).
Željeznički prijevoz | Rail transport 18,8%
Cestovni prijevoz | Road transport 67,1%
Cjevovodni transport | Pipelines transport 12,8%
Unutrašnji vodeni putevi | Inland waterway 1,4%
Željeznički prijevoz | Rail transport 17,1%
Cestovni prijevoz | Road transport 72,5%
Cjevovodni transport | Pipelines transport 4,8%
Unutrašnji vodeni putevi | Inland waterway 5,6%
EU 27
Republika HrvatskaRepublic of Croatia

230
ENERGIJA MMIXIX ENERGETSKA UČINKOVITOST
Slika | Figure 9.4.2. Struktura putničkih kilometara u prijevozu putnika u Republici Hrvatskoj 2009. i EU 27 2008. | Modal structure of passenger transport in the Republic of Croatia (2009) and EU 27 (2008) – Izvor | Source:
DZS, Directorate-General for Energy and Transport, Eurostat, EIHP
Cestovni prijevoz – osobna vozila
U razdoblju od 1995. do polovine 2008. godine zabilježeno je gotovo konstantno povećanje broja svih vozila u Republici Hrvatskoj s prosječnom godišnjom stopom rasta od 4,8 posto. Broj registriranih osobnih vozila u 1995. godini iznosio je 817 229, dok je krajem 2008. godine dostigao brojku od 1 537 876. U 2009. godini je po prvi puta zabilježen pad broja registriranih vozila koji je iznosio 1 534 265 (što predstavlja približno 346 osobnih vozila na 1 000 stanovnika, odnosno pri-bližno svaki treći stanovnik Hrvatske posjeduje osobno vozilo).
U Republici Hrvatskoj je u promatranom razdoblju (1995. - 2009.) ostvareno značajno povećanje udjela dizelskih auto-mobila u ukupnom broju osobnih vozila, pri čemu se zadržao daljnji pozitivan trend (ukupno povećanje broja dizelskih automobila iznosilo je čak 260 posto). U strukturi ukupnog broja osobnih vozila, udio benzinskih automobila smanjio se s 80,5 posto u 1995. godini na 61,2 posto u 2009. godini, dok je u tom istom razdoblju udio dizelskih automobila pora-stao s 17,5 na 34,3 posto. Udio vozila s pogonom na ukaplje-ni naftni plin (UNP) porastao je s 2,0 posto u 1995. godini na 4,6 posto u 2009. godini te se ukupan broj UNP vozila procjenjuje na oko 70 000.
Road Transport by Cars
Between 1995 and mid-2008 in the Republic of Croatia the number of registered private vehicles almost continuously increased with an average yearly increase of 4.8 percent. Thus, the number of registered private cars grew from around 817,229 in 1995 to 1,537,876 in 2008. In 2009 for the very first time after 1993 a drop was recorded in total registered vehicles, down to 1,534,265 (this is approximately 346 vehicles per 1,000 inhabitants, which means that approxima-tely every third inhabitant of Croatia owns a car).
In the Republic of Croatia in the period 1995 - 2009 there was a large increase in the number of new diesel passen-ger cars (increased by 260 percent overall), with a further upward trend. In total passenger car stock structure, the share of gasoline-run cars decreased from 80.5 percent in 1995 to 61.2 percent in 2009, while the share of diesel-run cars increased from 17.5 percent up to 34.3 percent. The share of liquefied petroleum gas (LPG)-run cars increased from 2.0 percent in 1995 year up to 4.6 percent in 2009, as shown in the following figure. The total number of LPG vehicles in 2009 is estimated at 70,000.
Željeznički prijevoz | Rail transport 3,6%
Cestovni prijevoz (osobna vozila) | Road transport (personal cars) 85,3%
Javni gradski prijevoz | Public transport 6,8%
Zračni prijevoz | Air transport 3,2%
Pomorski i obalni prijevoz | Sea and coastal transport 1,0%
Željeznički prijevoz | Rail transport 7,8%
Cestovni prijevoz (osobna vozila) | Road transport (personal cars) 74,2%
Javni gradski prijevoz | Public transport 8,6%
Zračni prijevoz | Air transport 8,8%
Pomorski i obalni prijevoz | Sea and coastal transport 0,6%
EU 27
Republika HrvatskaRepublic of Croatia

231
ENERGY MMIXIX ENERGY EFFICIENCY
Slika | Figure 9.4.3. Broj osobnih vozila na 1 000 stanovnika u pojedinim zemljama Europe 2007. i u Hrvatskoj u 2009. godini | Number of private cars per 1,000 inhabitants in Europe in 2007 and in Croatia in 2009 Izvor | Source: DZS, Directorate-General for Energy and Transport, Eurostat
Slika | Figure 9.4.4. Struktura osobnih vozila prema vrsti pogonskog goriva | Structure of the cars by fuel type Izvor | Source: MUP, EIHP
470
346
100
200
300
400
500
600
700
800
TR MK RO SK HU BG HREU
12 DK EE LV PT PL CZ IE EL NL NO SEEU
27 UK BE ES FR LTEU
15 DE FI AT SICH MT CY IT IS LU
Bro
j oso
bnih
aut
omob
ila n
a 10
00 s
tano
vnik
a |
Num
ber o
f pas
seng
er c
ars
per 1
000
inha
bita
nts
80,5
61,2
17,5
34,3
2,0 4,6
0
10
20
30
40
50
60
70
80
90
100
1995. 2009.
UNP automobili | LPG cars
Dizel automobili | Diesel cars
Benzinski automobili | Gasoline cars
%

232
ENERGIJA MMIXIX ENERGETSKA UČINKOVITOST
U strukturi dizelskih automobila najveći udio tijekom proma-tranog razdoblja zauzimaju vozila u kategoriji od 1,3 litre – 2,0 litre, unatoč najbrže rastućoj kategoriji zapremine motora iznad 2,0 litre. Glavnu strukturu benzinskih otto automobila također čine oni iz kategorije od 1,3 litre – 2,0 litre zapremine motora, što ujedno predstavlja najbrže rastuću kategoriju ovih automobila.
Navedena struktura upućuje na evidentne promjene u navikama kupaca u pogledu potrebe za sve većim i jačim vozilima, dok se istovremeno relativno dobro udovoljavaju kriteriji nabave energetski učinkovitijih vozila, kroz sve veći udio dizelskih automobila. Mehanizam pozitivne strukturalne promjene utemeljen je isključivo na tržišnim principima i to preko povoljnije cijene dizelskog goriva tijekom promatrano razdoblja, dakle bez prisustva posebnih poticajnih mjera.
Ukupna potrošnja energije u prometu u 1995. godini iznosila je 1 121 Mten, a u 2008. godini taj je iznos porastao na 2 148 Mten. Time je ostvaren ukupan porast potrošnje od 81 posto u promatranom razdoblju s prosječnim godišnjim povećanjem od 5,1 posto .
The structure of diesel personal vehicles mainly consist of cars in engines category between 1.3 – 2.0 liters, despite the fact that the fastest growing category of diesel vehicles is the one with engine volumes larger than 2.0 liters. Majority of the gasoline powered cars constitute of otto engines in category between 1.3 – 2.0 liters engines and that at the same time represents the fastest growing category of gasoline cars.
The mentioned structure discovers changes in customers behavior in respect of the needs for larger and more powerful vehicles, while at the same time positive energy efficient trend has been kept by purchasing more efficient vehicles (bigger share of diesel vehicles). This positive structural changes mechanism is established purely on market prin-ciples by more favorable prices of diesel fuel on the market over that period, hence without any other incentive measures.
In the Republic of Croatia, between 1995 and 2008, total energy consumption in the transport sector increased by 81 percent, from 1,121 Mtoe up to 2,148 Mtoe with an average yearly growth of 5.1 percent.
Slika | Figure 9.4.5. Struktura ukupne potrošnje goriva po obliku prijevoza | Fuel consumption by transport mode Izvor | Source: EIHP
0
10
20
30
40
50
60
70
80
90
100
%90,1 92,8
4,6 2,12,82,5
2,8 2,3
1995. 2009.
Domaći vodeni promet | Domestic water transport
Domaći zračni promet | Domestic air transport
Željeznički promet | Rail transport
Cestovni promet | Road transport

233
ENERGY MMIXIX ENERGY EFFICIENCY
Slika | Figure 9.4.6. Struktura ukupne potrošnje goriva po vrsti vozila u cestovnom prometu | Energy consumption in road transport by type of vehicles – Izvor | Source: EIHP
U cestovnom prijevozu je u 1995. godini ostvareno 90,1 posto od ukupne potrošnje energije u prometnom sektoru, dok je taj udio u 2009. godini porastao na 92,8 posto. Također je pora-stao i udio potrošnje goriva u domaćem zračnom prijevozu s 2,5 na 2,8 posto. Istovremeno se potrošnja energije smanjiva-la u željezničkom prometu s 4,6 na 2,1 posto te u domaćem vodenom prijevozu s 2,8 na 2,3 posto.
U ukupnoj potrošnji energije cestovnog prijevoza porastao je udio potrošnje kamiona s 17,5 posto u 1995. godini na 21,1 posto u 2009. godini. Udio cestovnog prijevoza u uku-pnoj potrošnji u kategoriji osobnih vozila se nakon godina pada, izazvanog snažnom penetracijom potrošnje goriva u kategoriji kamiona, zbog direktnog utjecaja recesije ponovo vratio na 60,6 posto, dok se udio autobusa smanjio s 6,4 na 3,4 posto te lakih dostavnih vozila s 15,3 na 14,5 posto.
Specifična potrošnja osobnih vozila iskazana u l/100km se u Republici Hrvatskoj sustavno smanjivala tijekom promatranog razdoblja (1995. – 2009.) s prosječnom godišnjom stopom od 0,77 posto, dok je u slučaju EU 27 iznosila čak 1,05 posto godišnje. Glavni pokretač tog pozitivnog trenda je sustavna zamjena postojećeg voznog parka novim i tehnološko napred-nijim vozilima čija je prosječna godišnja stopa u Republici Hrvatskoj (1995. – 2008.) iznosila 12,5 posto.
The road transport made for 90.1 percent of the total con-sumption in 1995, while in 2009 its share increase to 92.8 percent. Beside road transport, the share of domestic air tran-sport increased from 2.5 percent to 2.8 percent. At the same time, the share of rail transport decreased from 4.6 percent in 1995 to 2.1 percent in 2009 as well as the share of the domestic water transport which dropped from 2.8 percent to 2.3 percent.
In the road transport energy consumption, the share of trucks consumption rose from 17.5 percent in 1995 to 21.1 percent in 2009. the share of cars in the road transport energy con-sumption retuned to the 1995 level i.e., at 60.6 percent and while the share of buses dropped from 6.4 percent to 3.4 and of light duty vehicles from 15.3 to 14.5 percent.
The specific consumption by cars expressed in liters/100 km was constantly decreasing between 1995 and 2009 by 0.77 percent/year, while at the same time EU 27 member states recorded a 1.05 percent /yearly progress. A key driver for such a positive trend comes from gradual substitution of the existing vehicles with new and technologically more advanced vehicles. The purchase of these vehicles in Croatia grew at an average rate of 12.5 percent per year for the period between 1995 and 2008.
0
10
20
30
40
50
60
70
80
90
100
%
60,6 60,6
17,5 21,1
15,314,5
6,4 3,4
1995. 2009.Autobusi | Buses
Motocikli | Motorcycles
Laka dostavna vozila | Light vehicles
Kamioni | Trucks
Osobni automobili | Personal cars
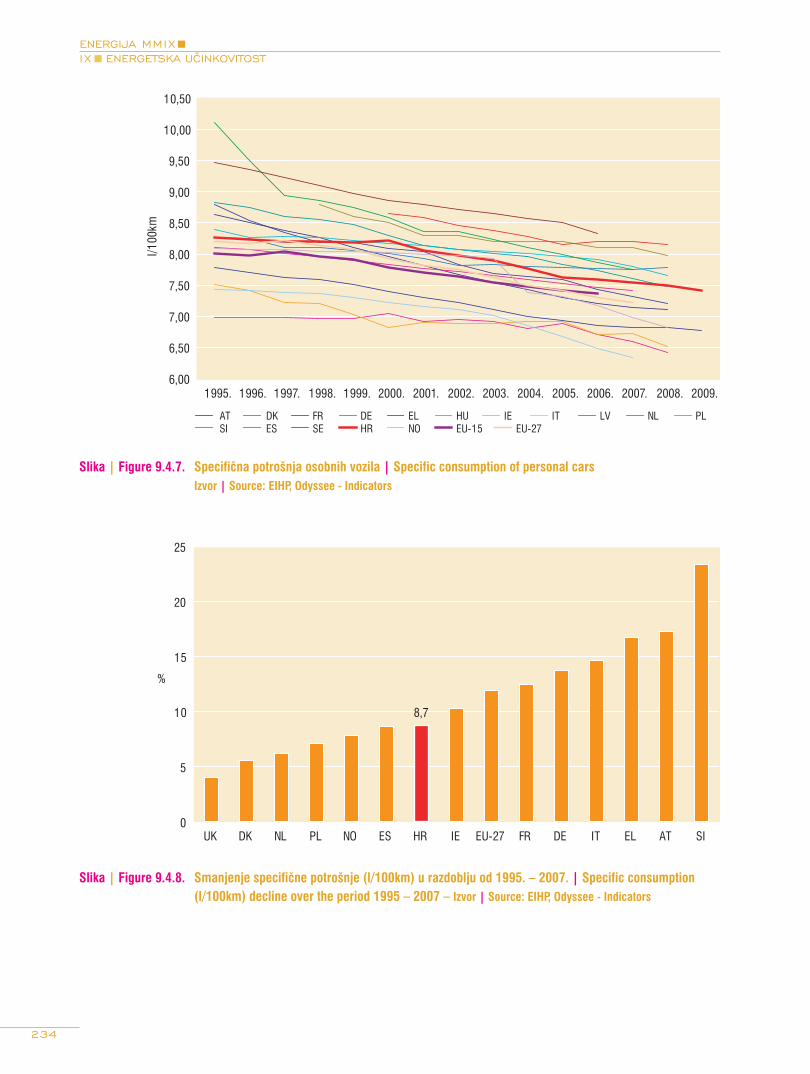
234
ENERGIJA MMIXIX ENERGETSKA UČINKOVITOST
Slika | Figure 9.4.7. Specifična potrošnja osobnih vozila | Specific consumption of personal cars Izvor | Source: EIHP, Odyssee - Indicators
Slika | Figure 9.4.8. Smanjenje specifične potrošnje (l/100km) u razdoblju od 1995. – 2007. | Specific consumption (l/100km) decline over the period 1995 – 2007 – Izvor | Source: EIHP, Odyssee - Indicators
6,00
6,50
7,00
7,50
8,00
8,50
9,00
9,50
10,00
10,50
1995. 1996. 1997. 1998. 1999. 2000. 2001. 2002. 2003. 2004. 2005. 2006. 2007. 2008. 2009.
l/100
km
AT DK FR DE EL HU IE IT LV NL PLSI ES SE HR NO EU-15 EU-27
8,7
0
5
10
15
20
25
UK DK NL PL NO ES HR IE EU-27 FR DE IT EL AT SI
%

235
ENERGY MMIXIX ENERGY EFFICIENCY
Cestovni prijevoz tereta
Teretni prijevoz je poseban slučaj u pogledu učinkovitosti s obzirom da je on prvenstveno funkcija strukture transportnih oblika kojima se u pojedinoj zemlji ostvaruju prijevoz robe. Pa tako zemlje poput Italije, Njemačke, Poljske, Austrije itd, u kojima u prijevozu tereta dominira željeznički promet, kao najučinkovitiji kopneni oblik transporta, imaju znatno nižu ukupnu specifičnu potrošnju energije po ostvarenom ton-skom kilometru. Ukupnoj učinkovitosti prometnog sustava također doprinosi zastupljenost pojedine kategorije kamiona. Naime, veća zastupljenost kamiona većih i najvećih nosivosti (kategorije iznad 7,5 tona nosivosti) znatno utječe na ukupno povećanje učinkovitosti u prijevozu tereta.
Unatoč dominantnoj zastupljenosti manjih dostavnih vozila u kategoriji <3,5 tona nosivosti (78 posto u ukupnom broju registriranih teretnih vozila u RH u 2007.), učinkovitost teretnog prijevoza Republike Hrvatske se u posljednjih nekoliko godina približila prosjeku zemalja članica EU 27 s 0,063 kten/tonskom kilometru tereta.
Slika | Figure 9.4.9. Specifična potrošnja ukupnog cestovnog teretnog prijevoza | Total specific consumption of goods transport (ktoe/tkm) – Izvor | Source: EIHP, Odyssee - Indicators
Road Freight Transport
Freight transport has its specificity regarding energy effici-ency since it is primarily a function of particular structure of transport meanings by which goods are carried on. Thus, countries which mostly use rail transport such as Italy, Germany, Poland, Austria, etc., have the most efficient freight transport when it comes to the specific energy consumption by transported tone kilometer. The share of specific cate-gories of heavy duties have also a high influence on final energy efficiency. Namely, a higher share of bigger and big-gest loading categories of trucks (over 7.5 tones of carrying capacity) significantly contribute to overall increase of energy efficiency.
Despite the fact that light duty vehicles in Croatia < 3.5 tones of carrying capacity had a dominant share of 78 per-cent in total number of all registered freight vehicles in the country in 2007, efficiency of the freight transport in Croatia approached the average level of efficiency in EU 27 member countries.
0,03
0,04
0,05
0,06
0,07
0,08
0,09
0,1
0,11
1995. 2000. 2005.
kten
/tkm
| k
toe/
tkm
AT HR FR DE IE IT NO PL SI
SE UK EU15 EU27

236
ENERGIJA MMIXIX ENERGETSKA UČINKOVITOST
Željeznički prijevoz
Međunarodne usporedbe pokazuju da su Hrvatske željeznice u cjelini učinkovitije u pogledu specifične potrošnje energije od turskih i rumunjskih željeznica, a izrazito nepovoljne u odnosu na litvanske, latvijske i poljske željeznice čija je potrošnja pri-bližno za polovinu manja od HŽ-a.
U putničkom prijevozu je jedinična potrošnja latvijskih željezni-ca za 47,4 posto manja, a u teretnom prijevozu poljskih želje-znica za čak 60,1 posto manja od iste HŽ-a. To govori koliko se dosadašnji ostvareni rezultati u povećanju energetske učinkovi-tosti prijevoza Hrvatskih željeznica i dalje moraju povećavati.
Jedinična potrošnja dizel i elektro vuče za putnički i teretni prijevoz, kao ukupna potrošnja za obje podjele u brutoton-skim kilometrima po željezničkim tvrtkama ukazuje na velike razlike. Manju jediničnu potrošnju od Hrvatskih željeznica (HŽ-Putničkog prijevoza d.o.o.) dizel vuče u putničkom prijevo-zu ostvarila su poduzeća Belgije, Češke, Latvije (za 73,1 posto manje), Litve, Mađarske i Turske, dok su u teretnom prijevozu sve zemlje osim Češke, Bugarske i Rumunjske ostvarile manju specifičnu potrošnju. U putničkom prijevozu sve promatrane željezničke uprave, osim Češke, imaju veću potrošnju po jedi-nici za elektro vuču od HŽ-a, a u teretnom prijevozu je obrnuto.
Slika | Figure 9.4.10. Specifična potrošnja energije željeznica s dizel vučom | Specific energy consumption of railways with diesel traction – Izvor | Source: International Railway Statistics 2007, UIC, Paris, November 2008;
HŽ Putnički prijevoz d.o.o.; EIHP
Rail Transport
International comparisons show that the Croatian Railways (CR) as a whole are more efficient regarding energy consumption than the Turkish and Romanian Railways, while lag rather behind when compared to the Lithuanian, Latvian and Polish railways, whose consumption is about half lower than the CR’s.
The specific consumption of the Latvian railways is about 47.4 percent lower in the passenger transport, while the specific consumption of the Polish freight transport is even 60.1 percent less than the same CR. According to the mentioned benchmark analysis it is evident that the Croatian Railways have to face greater challenge in order to improve their energy efficiency.
Specific consumption of diesel and electric traction for pass-enger and freight transport, as well as the total consumption for both divisions in gross-tone-miles by railway companies indicates a large difference. Lower specific consumption of diesel traction in the passenger transport than in the Croatian Railways has been achieved in Belgium, the Czech Republic, Latvia (for 73.1 percent less), Lithuania, Hungary and Turkey while in the freight transport all other countries except Czech Republic, Bulgaria and Romania achieved lower specific con-sumption. All the observed countries except Czech Republic
0
2
4
6
8
10
12
14
16
LT LV FI PL BE TR SI HU SK CZ BG RO
kg/1
000
brtk
m
Putnički | Passenger
Teretni | Freight
Ukupno | Total
HR

237
ENERGY MMIXIX ENERGY EFFICIENCY
Slika | Figure 9.4.11. Specifična potrošnja energije željeznica s elektro vučom | Specific energy consumption of railways with electro traction – Izvor | Source: International Railway Statistics 2007, UIC, Paris, November 2008;
HŽ Putnički prijevoz d.o.o.; EIHP
Slika | Figure 9.4.12. Indeksi specifične potrošnje željeznica | Railways specific consumption index Izvor | Source: International Railway Statistics 2007, UIC, Paris, November 2008; HŽ Putnički prijevoz d.o.o.;
EIHP
0
10
20
30
40
50
60
SK PL RO FI SI CZ BG LT HU LV BE TR
kWh/
1000
brt
km
Putnički | Passenger
Teretni | Freight
Ukupno | Total
HR
0
20
40
60
80
100
120
140
LT LV PL FI SI SK CZ BE BG HU RO TR
Putnički | Passenger
Teretni | Freight
Ukupno | Total
HR

238
ENERGIJA MMIXIX ENERGETSKA UČINKOVITOST
Važno je napomenuti da potrošnja pogonske energije želje-znica ovisi o stupnju elektrifikacije pruga, kao i udjelu put-ničke (u čemu motornih vlakova) i teretne vuče, a unutar toga posebno dizel i elektro vuče, starosti vučnih vozila i stanju motora (kvaliteta održavanja i njegove performanse), kon-figuraciji pruge i terena (usponi, padovi, udio ravnog dijela pruge), sastavu vlaka (prosječna težina vlaka), režimu vožnje, kontroli utrošaka (uspješnost u manipulaciji i sprečavanju krađa goriva) i drugim čimbenicima.
Do razine prosjeka Europske unije od 51,6 posto po stupnju elektrifikacije prve su belgijske željeznice s 89,0 posto pruga, bugarske s 68,2 posto, poljske s 60,9 posto i finske s 51,7 posto. S druge strane, niži stupanj imaju litvanske željeznice sa svega 6,9 posto elektrificiranih pruga, latvijske s 11,3 posto i turske s 22,1 posto. Prosječan stupanj elektrifikacije imaju Hrvatske željeznice s 36,0 posto, mađarske s 35,1 posto, češke s 32,0 posto, rumunjske s 37,4 posto, sloven-ske s 41,0 posto i slovačke s 43,5 posto. Iako ima značajnu ulogu, prethodni čimbenik ne mora biti presudan u slučaju svake pojedine željeznice.
Rezultati analize ukazuju na sljedeće činjenice o kretanjima prijevoznog učinka, ukupne i specifične potrošnje energije u Republici Hrvatskoj u razdoblju od 2001. do 2007. godine:
• u razdoblju od 2001. do 2007. godine prijevozni učinak u putničkim kilometrima povećan je na razini ukupnog prijevoza za 27,6 posto, a potrošnja energije u putničkom prijevozu za 26,5 posto, pa je time smanjena jedinična potrošnja za 0,9 posto
• u istom razdoblju prijevozni učinak u tonskim kilometrima povećan je za 60,1 posto na razini ukupnog prijevoza, a potrošnja energije u teretnom prijevozu povećana je za 45,0 posto uz smanjenje od 9,5 posto po jedinici na razini ukupnog prijevoza
• u razdoblju od 2001. do 2007. godine HŽ je postigao značajne rezultate u smanjenju specifične potrošnje ener-gije (po brutonskim kilometrima) U usporedbi s nekim europskim željezničkim tvrtkama vidi se da je putnički i teretni prijevoz Hrvatskih željeznica u odnosu na nekoliko visoko energetski učinkovitih željeznica gotovo dvostruko manje učinkovit, pa to zahtijeva daljnje provođenje mjera racionalizacije.
have larger specific consumption in passenger transport ope-rated by electrical traction, while the situation in the freight transport is quite opposite.
It is important to note that the operating power consump-tion depends on the railway electrification level, as well as the share of passenger and freight traction, and within that, particularly the share of diesel and electric traction, vehicle age, propulsion engine conditions (maintenance quality and its performance), tracks and landscape configuration (ups, downs, the share of the flat line), train assembly (the avera-ge train weight), driving regime, consumption control (the success of the manipulation and prevent theft of fuel) and other factors.
A level higher than European average in railways electrifi-cation degree (51,6 percent) is achieved in Belgian railway lines with 89.0 percent, Bulgarian with 68.2 percent, Polish with 60.9 percent and Finland with 51.7 percent. On the other hand, lower degree of electrification have Lithuanian railways with only 6.9 percent railway electrified, Latvian with 11.3 percent, and Turkish with 22.1 percent. The average level of electrification within Croatian Railways is 36.0 percent, of the Hungarian 35.1 percent, the Czech Railways 32.0 per-cent, Romanian 37.4 percent, Slovenian 41.0 percent and Slovakian 43.5 percent. Although it has a significant role, previous factor may not be critical in the case of each railway.
For the period 2001 – 2007 transport and energy efficiency performance of Croatian railways could be summarized as follows:
• Over the period 2001 – 2007 passenger transport perfor-mance (pkm) based on whole system rose by 27.6 percent while energy consumption rose only by 26.5 percent, eventually making specific consumption lower by 0.9 percent
• In the same period, the freight transport performance (tkm) rose by 60.1 percent based on a whole system, while energy consumption rose only by 45.0 percent, eventually making specific consumption lower by 9.5 percent
• The Croatian Railways have achieved significant results in terms of specific energy consumption (by gross-tone-kilometers) reduction within itself, but in comparison with the European highly efficient railways it is evident that energy efficiency of Croatian railways is almost twice lower and thus requires further enforcement of rationalization measures.
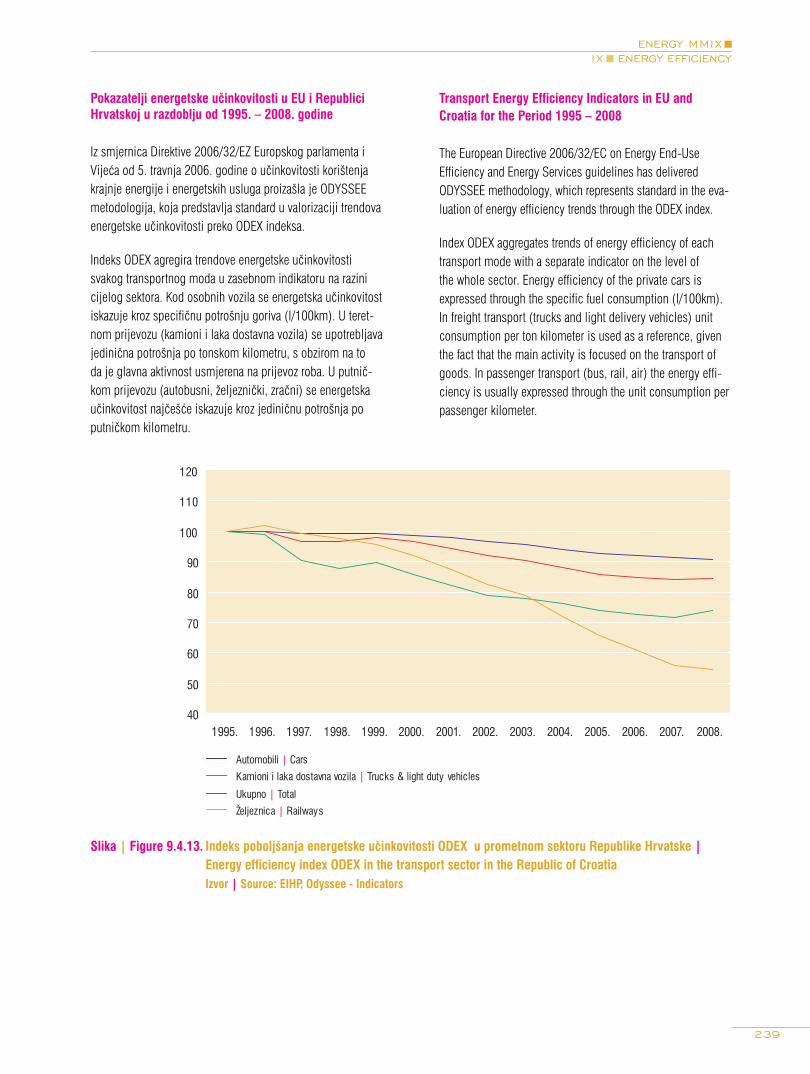
239
ENERGY MMIXIX ENERGY EFFICIENCY
Transport Energy Efficiency Indicators in EU and Croatia for the Period 1995 – 2008
The European Directive 2006/32/EC on Energy End-Use Efficiency and Energy Services guidelines has delivered ODYSSEE methodology, which represents standard in the eva-luation of energy efficiency trends through the ODEX index.
Index ODEX aggregates trends of energy efficiency of each transport mode with a separate indicator on the level of the whole sector. Energy efficiency of the private cars is expressed through the specific fuel consumption (l/100km). In freight transport (trucks and light delivery vehicles) unit consumption per ton kilometer is used as a reference, given the fact that the main activity is focused on the transport of goods. In passenger transport (bus, rail, air) the energy effi-ciency is usually expressed through the unit consumption per passenger kilometer.
Pokazatelji energetske učinkovitosti u EU i Republici Hrvatskoj u razdoblju od 1995. – 2008. godine
Iz smjernica Direktive 2006/32/EZ Europskog parlamenta i Vijeća od 5. travnja 2006. godine o učinkovitosti korištenja krajnje energije i energetskih usluga proizašla je ODYSSEE metodologija, koja predstavlja standard u valorizaciji trendova energetske učinkovitosti preko ODEX indeksa.
Indeks ODEX agregira trendove energetske učinkovitosti svakog transportnog moda u zasebnom indikatoru na razini cijelog sektora. Kod osobnih vozila se energetska učinkovitost iskazuje kroz specifičnu potrošnju goriva (l/100km). U teret-nom prijevozu (kamioni i laka dostavna vozila) se upotrebljava jedinična potrošnja po tonskom kilometru, s obzirom na to da je glavna aktivnost usmjerena na prijevoz roba. U putnič-kom prijevozu (autobusni, željeznički, zračni) se energetska učinkovitost najčešće iskazuje kroz jediničnu potrošnja po putničkom kilometru.
Slika | Figure 9.4.13. Indeks poboljšanja energetske učinkovitosti ODEX u prometnom sektoru Republike Hrvatske | Energy efficiency index ODEX in the transport sector in the Republic of Croatia Izvor | Source: EIHP, Odyssee - Indicators
40
50
60
70
80
90
100
110
120
1995. 1996. 1997. 1998. 1999. 2000. 2001. 2002. 2003. 2004. 2005. 2006. 2007. 2008.
Automobili | Cars
Kamioni i laka dostavna vozila | Trucks & light duty vehicles
Ukupno | Total
Željeznica | Railways

240
ENERGIJA MMIXIX ENERGETSKA UČINKOVITOST
U razdoblju od 1995. do 2008. godine indeks energetske učinkovitosti (ODEX) za cjelokupan prometni sektor smanjio se za 15,4 posto. Najveći napredak ostvaren je u kategoriji željeznica i to za čak 45,3 posto, čemu je doprinijelo zna-čajno povećanje popunjenosti poglavito u putničkom, ali i teretnom prometu.
Učinkovitost kamiona i lakih dostavnih vozila iznosila je 25,8 posto, dok se u kategoriji osobnih vozila ODEX smanjio za 9,3 posto. Argument koji ide u prilog relativno velikom ostvarenju energetske učinkovitosti u kategoriji teretnih vozila je činjenica da upravo taj sektor bilježi najveće stope rasta u pogledu novo nabavljenih, tehnološki naprednijih vozila (pro-sječna godišnja stopa rasta u iznosu od 6,1 posto).
U razdoblju od 2000. – 2008. godine, prosječna godišnja stopa ostvarene energetske učinkovitosti u prometnom sektoru Republike Hrvatske iznosila je 1,7 posto godišnje. Ostvarena učinkovitost gotovo je dvostruko veća od minimal-no potrebne godišnje stope energetske učinkovitosti na razini ukupne potrošnje, koja bi prema europskoj Direktivi o ener-getskoj učinkovitosti i energetskim uslugama (2006/32/EC), u razdoblju od 2009. – 2016. godine trebala, iznositi mini-malno 1 posto /godišnje u svim zemljama članicama EU-a.
In the period from 1995 to 2008, energy efficiency index (ODEX) rose by 15.4 percent. Most of this improvement came from the railway, even 45.3 percent, which could be mainly contributed to significant increase of vehicle occupancy especially in the passenger but even in freight transport.
Efficiency of trucks and light duty vehicles rose by 25.8 percent while ODEX of cars decreased by 9.3 percent. The argument that goes in favor of achieving a relatively high energy effici-ency in the category of freight cars is the fact that this sector recorded the highest growth rates in terms of launching more advanced technology vehicles on the market (average annual growth rate equates to 6.1 percent).
In the period between 2000 – 2008, the average yearly rate of achieved energy efficiency in the traffic sector of the Republic of Croatia was 1.7 percent /yearly. The obtained rate of energy efficiency is almost twice as high than compulsory rate which has been set by the Directive on Energy End-Use Efficiency and Energy Services (2006/32/EC); within the period 2009 – 2016 the average yearly savings should amount to at least 1 percent /yearly for all sectors in final consumption in all EU member states.
Slika | Figure 9.4.13. Prosječna godišnja stopa povećanja energetske učinkovitosti u prometu od 2000. do 2008. | Average yearly rate of energy savings in the Croatian transport sector between 2000 - 2008 Izvor | Source: EIHP, Odyssee - Indicators
1,7
-3
-2
-1
0
1
2
3
4
CZ PL LT ES DK NL IE AT NO GR FR DE IT GB EU-27 SI HR LV CY HU
%

241
ENERGY MMIXIX ENERGY EFFICIENCY
9.5. Institucionalne aktivnosti u području energetske učinkovitosti
Ministarstvo gospodarstva, rada i poduzetništva
U okviru Uprave za energetiku djeluje Odjel za obnovljive izvore energije i energetsku učinkovitost. Odjel za obnovljive izvore energije i energetsku učinkovitost obavlja upravne i stručne poslove u svezi s obnovljivim izvorima energije i energetske učinkovitosti kao dijela energetske politike Republike Hrvatske. Odjel izrađuje prijedloge zakona i propisa iz područja obnovljivih izvora energije i energetske učinko-vitosti, predlaže i prati ekonomske instrumente za poticanje korištenja obnovljivih izvora energije i energetske učinko-vitosti, prati i analizira ostvarivanje politike i strategije u segmentu obnovljivih izvora energije i energetske učinkovito-sti, utvrđuje prepreke i predlaže mjere za uklanjanje prepreka za provedbu politike i mjera za korištenje obnovljivih izvora energije i energetske učinkovitosti.
Osim toga, Odjel analizira i ocjenjuje planove razvoja ener-getskog sektora u segmentu obnovljivih izvora energije i energetske učinkovitosti, obavlja upravne i stručne poslove koji se odnose na obnovljive izvore energije i kogeneraciju, izdaje prethodna i energetska odobrenja za stjecanje statusa povlaštenog proizvođača, vodi propisan Registar projekata i postrojenja za korištenje obnovljivih izvora energije i kogene-racije te povlaštenih proizvođača, koordinira, prati, usklađuje i surađuje u provedbi mjera za korištenje obnovljivih izvora energije i energetske učinkovitosti u okviru sektorskih politika (zaštita okoliša-posebice ublažavanje klimatskih promjena, poljoprivreda, industrija, promet, šumarstvo, graditeljstvo, upravljanje državnom imovinom i dr.); obavlja stručne poslove u svezi s međunarodnim i bilateralnim ugovorima u području obnovljivih izvora energije i energetske učinkovitosti te obavlja i druge poslove iz svoga djelokruga.
U Odjelu za obnovljive izvore energije i energetsku učinkovi-tost ustrojeni su:
Odsjek za obnovljive izvore energije
Odsjek za energetsku učinkovitost
Odsjek za biogoriva.
9.5. Institutional activities in the field of energy efficiency
Ministry of Economy, Labor and Entrepreneurship
The Division for renewable energy sources and energy effi-ciency was established as a part of the Ministry’s Energy Department to carry out administrative and expert activities concerning renewable energy sources and energy efficiency as a part of the energy policy of the Republic of Croatia. The Division is responsible for drawing up proposals for laws and regulations in the field of renewable energy sources and energy efficiency. Its tasks also include proposing and moni-toring of economic instruments for promoting the use of RES and energy efficiency; monitoring and analyses of the imple-mentation of the policies and strategies in the field of renewa-ble energy sources and energy efficiency, and, specially, monitoring the fulfillment of the goals (targets); identifying the obstacles and proposing the measures for removal of barriers to RES and energy efficiency policies and measures.
This Division carries out analysis and evaluation of plans for energy sector development in RES and energy efficiency issues; carries out administrative and expert activities con-cerning RES and cogeneration; it also issues preliminary approvals and energy approvals for eligible producer status; keeps the RES and Cogeneration Project Registry and Eligible Producers Registry; coordinates, monitors, harmonizes and cooperates in implementing the RES and energy efficiency measures in the frame of the sector policies (in environmen-tal protection – particularly in mitigating climate change, agriculture, industry, forestry, construction industry, state’s assets management, etc.);
It also deals with expert activities with regard to international and bilateral agreements concerning RES and energy effici-ency and conducts other activities in the framework of issues the Division is responsible for.
The Division for RES and energy efficiency includes the following sub-divisions:
Sub-division for renewable energy sources
Sub-division for energy efficiency
Sub-division for biofuels.
242
ENERGIJA MMIXIX ENERGETSKA UČINKOVITOST
Ministarstvo zaštite okoliša, prostornog uređenja i graditeljstva
Temeljne aktivnosti Ministarstva zaštite okoliša, prostornog uređenja i graditeljstva u području energetske učinkovi-tosti u 2009. godini vezane su za sektor zgradarstva. One obuhvaćaju:
- pripremne aktivnosti za provođenje propisa iz područja energetske učinkovitosti u zgradarstvu – ocjene i izda-vanje suglasnosti institucijama za provođenje Programa obuke stručnih osoba, ažuriranje drugih potrebnih stručnih podloga za provedbu propisa: metodologije o provođenju energetskih pregleda, studije primjenjivosti alternativnih energetskih sustava i slično
- suradnja u regiji
- sudjelovanja na radionicama u sklopu provođenja progra-ma Vlade RH – „Dovesti svoju kuću u red“ – edukacija djelatnika državnih tijela
- međunarodna suradnja u okviru projekta EK: CA-EPBD i CENSE
Fond za zaštitu okoliša i energetsku učinkovitost
Fond sufinancira programe i projekte putem srednjoročnih i jednogodišnjih programa rada. U 2009. godini su u području energetske učinkovitosti dodijeljena sredstva za projekte kojima se provode mjere vezane uz povećanje energetske učinkovitosti u zgradarstvu, u javnom sektoru, kućanstvima, sektoru industrije, prometu i sektoru usluga, radi povećanja racionalizacije poslovanja, smanjenja potrošnje energije, povećanja konkurentnosti, smanjenja onečišćivanja okoliša te izravnog i neizravnog smanjenja utjecaja na okoliš.
U području provedbe nacionalnih energetskih programa sufi-nancirane susljedeće aktivnosti:
- zamjena energenta u energetskim postrojenjima i optimiza-cija sustava loženja
- uvođenje učinkovitijih elektromotornih pogona i agregata
- izgradnja ili rekonstrukcija kogeneracijskih postrojenja u naseljima i gradovima, kod velikih potrošača
- zamjena dijelova distribucijske mreže predizoliranim cijevima
Ministry of Environmental Protection, Physical Planning and Construction
In 2009 the main activities of the Ministry of Environmental Protection, Physical Planning and Construction when energy efficiency is concerned were linked to the construction sector and included:
- Preparation for implementation of the regulations con-cerning energy efficiency in buildings – assessment and issuance of approvals to the institutions for implementing the Program of training of the professionals; updating other necessary expert bases for implementing the regulations: methodologies for conducting energy audits, applicability studies for alternative energy sources
- Regional cooperation
- Participation in workshops in the frame of implementing the program of the Government of the Republic of Croatia – Bring Your House in Order – education of the government’s employees
- International cooperation in the framework of the European Commission projects: CA-EPBD and CENSE
Fund for Environmental Protection and Energy Efficiency
The Fund co-finances the programs and projects through its medium-term and one-year activity programs. In 2009 the funds were allocated to the projects for application of the energy efficiency measures in the public sector buildings, households, industrial sector, transport and services, aimed at improving cost efficiency of businesses, reducing energy con-sumption, boosting competitiveness, reducing environmental pollution, and directly and indirectly mitigating environmental impact.
In the frame of implementation of the national energy programs the following types of projects were co-financed:
- replacement of energy products in the energy installations, and the optimization of the heating regimes
- introduction of efficient electromotor drives and aggregates
- construction or reconstruction of cogeneration plants in townships and cities, as well as at large consumers
- replacement of the parts of the distribution district heating network with pre-insulated pipes

243
ENERGY MMIXIX ENERGY EFFICIENCY
- analiza potencijala crpki u toplinskim stanicama u gradovi-ma sa sustavima za područno grijanje
- zamjena dotrajalih toplinskih stanica indirektnim stanicama
- ugradnja termoregulacijskih ventila i mjerača u toplinskim stanicama
- uvođenje ekološke i energetski učinkovite javne rasvjete i automatska regulacije rasvjete
- realizacija programa mjerenja potrošnje
U području održive gradnje, odnosno energetske učinkovitosti u zgradarstvu sufinancirane su sljedeće aktivnosti:
- poboljšanje energetske učinkovitosti zgrada u sustavu rasvjete i grijanja, što uključuje i ugradnju regulacijske i mjerne opreme u postojećim i novim stambenim i poslov-nim objektima, priprema energetski učinkovitog sustava sanitarne tople vode, sustava hlađenja i ventilacije
- ugradnja termostatskih ventila na radijatorima
- realizaciju programa mjerenja potrošnje
- izgradnja energetski učinkovite ovojnice zgrade
- zamjena primarnog energenta u kotlovnicama
U području poticanja čistijeg prijevoza odnosno energetske učinkovitosti u prijevozu sufinancirane su sljedeće aktivnosti:
- racionalizacija potrošnje goriva
- korištenje alternativnih goriva kao što je stlačeni prirodni plin
- korištenje vozila na električni pogon
- zamjena vozila nižeg standarda s vozilom standarda EURO 5
Fond je u 2009. godini isplatio ukupno 80 208 594,23 kune a po područjima je to izgledalo ovako:
1. Provedba nacionalnih energetskih programa - 27 846 063,04 kn
2. Održiva gradnja - 7 844 385,27 kn
3. Poticanje čistijeg transporta - 44 518 145,92 kn
Fond ostvaruje ciljeve povećanja energetske učinkovitosti u zgradarstvu putem financiranja drugih programa i projekata odnosno sufinanciranjem informativne kampanje „Poticanje
- analysis of potentials of the pumps in thermal stations in the towns with district heating system facilities
- replacement of old thermal stations with indirect stations
- installation of heat regulation valves and meters in the thermal stations
- installation of environment-friendly and energy efficient public lighting and automated light control
- realization of the consumption metering program
In the area of sustainable construction, i.e., energy efficiency in buildings, the following types of projects were co-financed:
- enhancing energy efficiency in buildings in the lighting and heating systems, which includes the installation of regulation and metering devices both in the existing and new residential and commercial buildings, preparation of energy efficient hot water systems, cooling and ventilation systems
- installation of thermostat valves on radiators
- realization of the consumption metering programs
- making energy efficient envelops of buildings
- replacement of a primary energy product in the heating plants
In supporting clean transport and energy efficiency in transport the following types of projects were co-financed:
- fuel consumption
- use of alternative fuels, such as compressed natural gas
- use of electric drive vehicles
- replacement of low standard vehicles with EURO 5 stan-dard vehicles
The financial amounts the Fund disbursed in 2009 totaled 80,208,594.23 HRK and they were allocated as follows:
1. Implementation of the national energy programs 27,846,063.04 HRK
2. Sustainable construction 7,844,385.27 HRK
3. Promotion of clean transport 44,518,145.92 HRK
The Fund fulfils the objectives of enhancing energy efficiency in buildings by financing other programs and projects as well. The Fund participates in financing the awareness raising cam-paign Promoting energy efficiency in Croatia and the project One Tone Heavy CO2 Challenge, which have been completed;

244
ENERGIJA MMIXIX ENERGETSKA UČINKOVITOST
energetske efikasnosti u Hrvatskoj“ i projekta „Izazov težak jednu tonu CO2“ (koji su završeni), sufinanciranjem projekta „Sustavno gospodarenje energijom u gradovima i županija-ma“ i Programa „Dovesti svoju kuću u red“ koje zajednički provodi s Ministarstvom gospodarstva, rada i poduzetništva i Uredom Ujedinjenih naroda za razvoj u Hrvatskoj u razdoblju od 2008. do 2013. godine, kojima se posredno i neposredno provode mjere povećanja energetske učinkovitosti u zgradar-stvu, a čine ih:
- uspostavljanje sustava educiranja zaposlenika držav-ne uprave i lokalne, odnosno područne (regionalne) samouprave
- informiranje i educiranje javnosti u Hrvatskoj te uspostav-ljanje mjesta za nadzor potrošnje energije
- provedba energetskih pregleda objekata u vlasništvu držav-ne uprave te jedinica lokalne odnosno područne (regional-ne) samouprave
- stručna i tehnička potpora gradovima, županijama i držav-noj upravi u provođenju mjera i projekata energetske učin-kovitosti u zgradarstvu, odnosno u izvođenju pilot projekata malih mjera, kao zahvata za zgradama državne uprave
- uspostavljanje informatičkog sustava za gospodarenje energijom
Isplaćena sredstva Fonda za navedene projekte u 2009. godini iznosila su 7 917 752,73 kune.
Program Ujedinjenih naroda za razvoj (UNDP)
Program Ujedinjenih naroda za razvoj (UNDP) i Ministarstvo gospodarstva, rada i poduzetništva (MINGORP) pokrenuli su u srpnju 2005. godine projekt „Poticanje energetske efika-snosti u Hrvatskoj“, koji se provodi u suradnji s Fondom za zaštitu okoliša i energetsku učinkovitost (FZOEU) i Globalnim fondom za okoliš (GEF). U okviru ovog projekta se provodi model kontinuiranog i sustavnog gospodarenja energijom, strateško planiranje energetike i održivog upravljanja ener-getskim resursima u javnim zgradama kroz dva nacionalna programa: „Sustavno gospodarenje energijom u gradovima i županijama u Republici Hrvatskoj“ (SGE) i „Dovesti svoju kuću u red“ (HiO). Oba programa bave se javnim zgradama u Republici Hrvatskoj, tj. zgradama u vlasništvu gradova, župa-nija i Vlade Republike Hrvatske. Projekt SGE odnosi se na sve objekte u vlasništvu gradova i županija u Republici Hrvatskoj,
by co-financing the project Systematic Energy Management in Cities and Counties in the Republic of Croatia and the program Bring Your House in Order, which is being conducted together with the Ministry of Economy, Labor and Entrepreneurship and the UNDP Office in Croatia in the period from 2008 to 2013. These projects directly or indirectly contribute to implementa-tion of the energy efficiency measures in buildings, and they consist of:
- Establishing training scheme for employees of the gover-nment bodies and local and regional self-government bodies
- Informing and educating the general public in Croatia and establishing the energy consumption monitoring points
- Implementation of energy audits of the buildings owned by the state administration, and the local or regional self-government bodies
- Expert and technical support to the cities, counties and state administration in implementation of measures and projects of energy efficiency in buildings, or in implementation of pilot projects of small scale measures, such as works on the state administration’s buildings
- Establishing information system for energy management
The funds disbursed by the Fund in 2009 for the above projects amounted to 7,917,752.73 HRK.
United nations Development Program (UNDP)
United nations Development Program (UNDP) and the Ministry of Economy, Labor and Entrepreneurship launched in July 2005 the project Promoting energy efficiency in Croatia. The project is being conducted in cooperation with the Fund for Environmental Protection and Energy Efficiency and Global Environment Fund. This project presumes the implementation of the model of continuous and systematic energy manage-ment, strategic energy planning and sustainable energy resour-ces management in public buildings through two national pro-grams: Systematic Energy Management in Cities and Counties in the Republic of Croatia (SEM project) and Bring Your House in Order (HiO project). Both programs deal with public buildin-gs in the Republic of Croatia i.e., buildings owned by the cities, counties and the government of the Republic of Croatia. The SEM project deals with all the buildings owned by the cities

245
ENERGY MMIXIX ENERGY EFFICIENCY
a objekti u državnom vlasništvu obuhvaćeni su programom „Dovesti svoju kuću u red“ (HiO).
S obzirom na to da gospodarenje energijom uvijek poči-nje od vrha, u sklopu SGE projekta je pokrenuta inicijativa potpisivanja Energetske povelje gradonačelnika i župana Republike Hrvatske, koju su potpisale županije (20) i gradovi (127). Nadalje, potpisivanjem Pisma namjere županija ili grad usuglašava suradnju s UNDP-om. Pismom namjere se definira opseg i trajanje projekta, aktivnosti i obveze grada ili županije te koraci potrebni za realizaciju. Do 31. prosinca 2009. godine u SGE projekt se potpisivanjem Pisma namjere uključilo 79 gradova i 18 županija, a 57 gradova i 9 županija je usvojilo i javno objavilo politiku energetske efikasnosti i zaštite okoliša.
U sklopu SGE projekta su osnovani Uredi za gospodarenje energijom (EE-uredi) u 46 gradova i 14 županija s ukupno 114 djelatnika (EE-timovi). Glavni cilj uspostave Ureda za sustavno gospodarenje energijom je nadzor i povećanje učinkovitosti potrošnje svih oblika energije u objektima u vla-sništvu lokalne i regionalne samouprave. Jedan od osnovnih zadataka Ureda za gospodarenje energijom je uspostavljanje Registra zgrada (baza podataka) podržanog s informacijskim sustavom za gospodarenje energijom (ISGE). ISGE je raču-nalni program kojemu se može pristupiti putem interneta i koji omogućava pohranjivanje i pristup informacijama o potrošnji energije i vode u svim zgradama koje su obuhva-ćene sustavom. U ISGE su uneseni podaci za ukupno 2.029 objekata. Na 516 objekta se redovito prate troškovi i potrošnja preko računa za energente,a na 272 objekta se na tjednoj razini prati potrošnja energenta putem očitanja brojila za svaki pojedini energent.
Tijekom provedbe SGE projekta kontinuirano se provode i edukativne aktivnosti preko predviđenih modula edukacije (SGE radionica za ravnatelje i tehničko osoblje, ISGE radioni-ca za djelatnike EE ureda, SGE Zeleni ured, SGE M&A radio-nica, Tečaj za energetske savjetnike, Osamostaljivanje ureda). Do 31.12.2009. godine održane su:
- SGE radionica za ravnatelje i domare u 53 grada i 14 župa-nija s ukupno 1 653 polaznika,
- ISGE obuka za djelatnike EE ureda u 16 gradova i 4 županije
- SGE Zeleni ured za EE timove u 9 gradova i 2 županije
and counties in the Republic of Croatia. The state owned buil-dings are covered by the HiO project.
Given the fact that energy management is a top-to-bottom activity, an initiative has been launched within the SEM project to sign the Energy Charter of the Mayors and County Prefects of the Republic of Croatia. The Charter has been signed by the counties (20) and towns (127). In addition, by signing the Letter of Intent a county or a city coordinate their cooperation with UNDP. The Letter of Intent defines the scope and duration of a project, activities and obligations of a city or a county as well as the steps needed for the project realization. Until 31 December 2009, 79 cities and 18 counties signed the Letter of Intent and entered the SEM project. Also, 57 cities and nine counties adopted and published their policy concerning energy efficiency and environmental protection.
Until 31 December 2009 and in the frame of the SEM project the energy management offices (EE Offices) were established in 46 cities and 14 counties, with total of 114 employees (EE-teams). The main goal of founding the Systematic Energy Management Office is to monitor and enhance efficiency of using all forms of energy in the buildings owned by local and regional self-government. One of the main tasks of the Energy Management Office is to establish the registry of buildings (database) supported by the Energy Management Information System. The system is a computing program which is acce-ssible via internet and enables archiving of and access to information on energy and water consumption in all buildings included in the system. Until 31 December 2009 the data for 2,029 buildings were entered in the Energy Management Information System. The costs and consumption are monitored for 516 buildings on a regular basis through the energy product accounts, and 272 buildings are monitored on a weekly basis by meter reading for each energy product.
During the implementation of the SEM project the educational activities are being carried out on a permanent basis as well, through the educational modules (SEM workshops for mana-gers and technical staff, SEM workshop for the employees of EE Offices, SEM Green Office, SEM M&A workshop, Course for energy counselors, Independent Office). Until 31 December 2009 the following workshops were held:
- SEM workshop for managers and care takers in 53 towns and 14 counties attended by 1,653 persons,
- Training in Energy Management Information System for the employees in 16 towns and 4 counties
- SEM Green Office for EE teams in 9 towns and 2 counties

246
ENERGIJA MMIXIX ENERGETSKA UČINKOVITOST
- Tečaj za energetske savjetnike (uspješno završilo 125 polaznika)
Program „Dovesti svoju kuću ured“ (HiO, skraćenica od engl. House in order) usvojen je zaključkom Vlade Republike Hrvatske od 29. svibnja 2008. Za operativno vođenje HiO programa zadužen je UNDP, dok je Fond za zaštitu okoliša i energetsku učinkovitost (FZOEU) zadužen za financiranje. Ministarstvo gospodarstva, rada i poduzetništva (MINGORP) zaduženo je za provedbu programa i izvještavanje Vlade RH. Program HiO službeno je pokrenut 29. listopada 2008. godine.
Cilj programa je uspostava sustavnog gospodarenja energi-jom u objektima u vlasništvu i na korištenju Vlade Republike Hrvatske uz smanjenje potrošnje energenata od 10 do 30 posto. Potpisivanjem Pisma namjere UNDP i ministarstva su usuglasili suradnju na programu Dovesti svoju kuću u red. Pismo namjere je potpisano od strane 10 ministara koji su time donijeli službenu odluku o provođenju svih aktivnosti programa u svojim ministarstvima, a program se aktivno provodi u još tri ministarstva. Do listopada 2009. godine je prikupljen popis za 2 062 objekata koji su u nadležnosti navedenih 13 ministarstava. Devet ministarstava je službeno imenovalo odgovorne osobe za EE tim. U Informacijski sustav za gospodarenje energijom ISGE uneseni su podaci (opći, konstrukcijski i energetski) za ukupno 794 objekta. Prema pri-kupljenim podacima može se zaključiti da je državna uprava značajan potrošač svih energenata i vode, čiji ukupni troškovi prelaze 500 milijuna kuna godišnje.
U prvoj godini (srpanj 2008. – listopad 2009.) u okviru pro-vedbe programa su provedenim besplatnim mjerama ostvare-ne su financijske uštede u iznosu od 2,56 milijuna kuna.
S obzirom na to da je ljudski faktor pri provođenju progra-ma energetske učinkovitosti od izuzetnog značaja, u okviru programa „Dovesti svoju kuću u red“ (HiO) osmišljena je motivacijsko – edukacijska kampanja za djelatnike državne uprave u obliku prezentacija, predavanja, seminara, trening radionica i slično. UNDP je razvio slijedeće vrste edukacij-sko-motivacijskih radionica koje se koriste u svrhu provedbe programa: Prezentacija programa za odgovorne osobe, Radionice za odgovorne na nivou objekata i tehničko osoblje za uspostavu registra, Radionica za korištenje Informacijskog sustava za gospodarenje energijom (ISGE), Tečaj za energet-ske savjetnike – EE tim, Radionica za voditelje Zelenog ureda,
- Course for energy counselors (successfully completed by 125 attendants)
The program Bring Your House in Order was adopted by the Conclusion of the Government of the Republic of Croatia of 29 May 2008. UNDP is in charge of the HiO program operation, while the Fund for Environmental Protection and Energy Efficiency is responsible for financing. The Ministry of Economy, Labor and Entrepreneurship is responsible for imple-mentation of the program and reporting to the Government. The HiO program was officially launched on 29 October 2008.
The aim of the Bring Your House in Order program is to set up a systematic energy management in the buildings owned and used by the Croatian Government and to reduce consumption of energy products by 10 to 30 percent. By signing the Letter of Intent UNDP and the ministries coordinated the cooperation on the HiO program. Ten ministers signed the Letter of Intent and with this they brought an official decision on carrying out all the program activities in their respective ministries. In addi-tion, the program is carried out in another three ministries as well. Until October 2009 the list was made containing 2,062 buildings that these 13 ministries are responsible for. Nine ministries have officially nominated the persons responsible for the EE Team. The data for 794 buildings (general, construc-tion and energy related data) have been entered in the Energy Management Information System. The data gathered so far allow to conclude that the state administration is a large consu-mer of all energy products and water, with total costs exceeding 500 million HRK a year.
In the first year (July 2008 – October 2009) the program Bring Your House in Order enabled the savings of 2.56 million HRK achieved thanks to the measures that were implemented with no charge.
Given the fact that human factor is of paramount importance in implementing the energy efficiency programs, the program Bring Your House in Order devised a motivation and education campaign for the state administration employees in form of presentations, lectures, seminars, training workshops and similar activities. UNDP has developed the following types of educational-motivation workshops for realization of the pro-gram Bring Your House in Order: presentations for responsible persons; workshops for persons responsible for buildings and technical staff for establishing registry; workshop for use of Energy Management Information System; course for energy counselors – EE team; workshop for Green Office managers; educational-motivation workshop Green Office for all public

247
ENERGY MMIXIX ENERGY EFFICIENCY
Edukacijsko-motivacijska radionica Zeleni ured za sve djelat-nike javne uprave, Tečaj za tehničko osoblje zgrada (domare), Individualna obuka tehničkog osoblja za dnevni i tjedni unos u ISGE, Godišnji i polugodišnji skupovi, Konferencije, Interna edukacija. Na edukacijsko-informacijskim radionicama u sklopu programa prisustvovalo je ukupno 861 djelatnik držav-ne uprave iz ministarstava.
Za potrebe programa koriste se slijedeći edukacijsko informa-tivni materijali razvijeni od strane UNDP: Priručnik za energet-ske savjetnike, Priručnik za poboljšanje energetske učinko-vitosti „Tipske mjere“, Brošura 200 savjeta, Brošura 1 t CO2, Zeleni ured – priručnik, Zeleni ured – radna knjiga, Brošura Programa, Letak Programa, Pojmovnik za ispunu registra, Vodič za korištenje ISGE-a i Vodič za unos tjedne potrošnje.
UNDP koordinira i uređuje Priručnik za certificiranje zgrada koji će se koristiti u svim ovlaštenim institucijama za obuku certifikatora. S obzirom na to da je prema dosadašnjim spo-znajama oko 25 posto javnih zgrada pod zaštitom države, tj. konzervatora, UNDP u suradnji s konzervatorskim odjelima priprema prijedloge za povećanje energetske učinkovitosti zgrada koje se smatraju kulturnom baštinom.
Agencije, gradovi i županije
U 2009. godini svoj rad u području energetske učinkovitosti intenzivira nekoliko regionalnih energetskih agencija, kao što su REGEA – Regionalna energetska agencija sjeverozapadne Hrvatske, MENEA – Međimurska energetska agencija, REA KVARNER-Regionalna energetska agencija Primorsko goran-ske županije, IRENA – Istarska regionalna energetska agenci-ja, REA SJEVER – Regionalna energetska agencija Sjeverne Hrvatske te niz drugih razvojnih agencija.
Niz aktivnosti u području energetske učinkovitosti provedeno je i u gradovima i županijama, u suradnji s regionalnim i razvojnim agencijama, te programom UNDP-a.
Međimurska energetska agencija MENEA i Regionalna razvojna agencija Međimurje – REDEA provode projekt NIMSEC – Novel and Integrated Model of Sustainable Energy Communities, kojim se želi poboljšati energetska učinkovi-tost na lokalnoj razini i povećati udio energije iz obnovljivih izvora energije u Međimurskoj županiji. Osnovni cilj projekta je osmišljavanje energetski održivih zajednica i prijedlog mjera za njihovu provedbu. Projekt se financira iz programa Intelligent Energy Europe – IEE. Međimurska energetska
administration employees; course for buildings’ technical staff (care takers); individual training of technical staff for daily and weekly entries in the Energy Management Information System; annual and semi-annual conferences; internal education. Total of 861 employees of various state ministries attended the wor-kshops in the frame of the Bring Your House in Order program.
For the purpose of the Bring Your House in Order program UNDP has developed the following educational-informative handouts: Manual for energy counselors, Manual for enhancing energy efficiency ‘Typical Measures’, Booklet 200 advices, Booklet 1 ton CO2, Green Office – manual, Green Office Workbook, Program Booklet, Program Leaflet, Glossary for the Registry, Glossary for Registry filing, Guideline for use of Energy Management Information System, Guidelines for entry of weekly consumption.
UNDP coordinates and edits the manual for building certifica-tion to be used in all authorized institutions for training of the certifiers. Since according to the current findings, about 25 percent of the public buildings is under State protection, UNDP is preparing, in cooperation with monument conservation bodies, proposals for increasing energy efficiency in buildings which have the status as cultural heritage.
Agencies, cities, counties
In 2009 several regional energy agencies dealing with energy efficiency intensified their activities. They are REGEA – North-West Croatia Regional Energy Agency, MENEA – Međimurje Energy Agency, REA KVARNER- Regional Energy Agency of Primorsko-goranska County, IRENA – Istrian Regional Energy Agency, REA SJEVER – Regional Energy Agency North, and a number of development agencies.
Many activities in the field of energy efficiency were conducted in the cities and counties, in cooperation with the regional and development agencies as well as with the UNDP program. Below are described some of the these activities.
Međimurje Energy Agency MENEA and Regional Development Agency of Međimurje – REDEA are carrying out the project NIMSEC – Novel and Integrated Model of Sustainable Energy Communities, which is aimed at impro-ving energy efficiency at local level and increase the share of renewable energy sources in the energy mix of the Međimurje County. The main project goal is to devise the energy sustaina-ble communities and to propose measures for their realization. The project is financed by the funds of the program Intelligent

248
ENERGIJA MMIXIX ENERGETSKA UČINKOVITOST
agencija provodi na području Međimurske županije program Sustavnog gospodarenja energijom u gradovima i županijama u Republici Hrvatskoj (SGE). U okviru programa izrađuje se Registar zgrada radi uspostavljanja tjednog i mjesečnog pra-ćenja potrošnje energije. Osnovano je ukupno četiri EE ureda na području Međimurske županije (jedan EE ured u sklopu MENEA-e, tri EE ureda u gradovima Čakovec, Prelog i Mursko Središće).
Međimurska županija u partnerstvu s tvrtkom HEP-ESCO d.o.o. provodi „Projekt energetske učinkovitosti u školama Međimurske županije“ po ESCO modelu. Tvrtka HEP ESCO d.o.o. osigurava pripremu i izvedbu projekta te financiranje u dijelu energetske učinkovitosti. Osnovni cilj projekta je povećanje energetske učinkovitosti i doprinos racionalnom korištenju i upravljanju energijom kroz smanjenje potrošnje ukupne električne i toplinske energije u 14 osnovnih i srednji škola u Međimurskoj županiji te prelaskom s dosad korište-nog loživog ulja na prirodni plin (kao čišći energent).
U suradnji s tvrtkom HEP ESCO d.o.o. provodi se i projekt „Primjena mjera energetske učinkovitosti na javnoj rasvjeti grada Čakovca“ radi uštede električne energije za javnu rasvjetu.
Regionalna energetska agencija Sjever je uspješno implementirala projekt „Modernizacija i optimizacija javne rasvjete grada Koprivnice“ zamjenom postojeće živine rasvje-te visokotlačnom natrijevom rasvjetom, pri čemu su potrošnja električne energije i emisija CO2 smanjeni za 29,68 posto.
Zagorska razvojna agencija je tijekom 2009. godine provela edukativni program za učenike srednjih škola u Krapinsko-zagorskoj županiji: „Znanjem do energetskih ušteda“. Nadalje, Zagorska razvojna agencija je u sklopu projekta „Uspostava registra zgrada i provođenje EU Display kampanje u Krapinsko-zagorskoj županiji“ sudjelovala u izradi Registra za ukupno 46 zgrada javne namjene na u vla-sništvu Krapinsko-zagorske županije. Prikupljeni su podaci o potrošnji energije, koji su uneseni u Informacijski sustav za gospodarenje energijom (ISGE). U drugoj fazi projekta prikupljeni su podaci o potrošnji energije i vode te emisiji CO2 za 10 osnovnih i srednjih škola na području županije pa su zatim izrađeni tzv. Display posteri u kojima je prikazana energetska oznaka s obzirom na potrošnju energije, vode i ekvivalent CO2. U 2009. godini je raspisan natječaj za pro-vedbu programa „1000 solarnih kolektora za fizičke osobe u Krapinsko-zagorskoj županiji“ kojim je obuhvaćena ugradnja solarnih kolektora za pripremu potrošne tople vode i grijanje u
Energy Europe – IEE. Međimurje Energy Agency is carrying out the Systematic Energy Management Program in the County’s territory. In the framework of this program the Agency is wor-king on the Registry of buildings with the aim to establish daily and weekly energy consumption monitoring. Four EE Offices were established in the County (one EE Office operates in the frame of MENEA, other three EE offices are open in the towns Čakovec, Prelog and Mursko Središće).
In partnership with the company HEP-ESCO d.o.o Međimurje County is carrying out the project Energy Efficiency in Schools of the Međimurje County based on ESCO model. The company HEP ESCO d.o.o. will provide for preparation and implemen-tation of the project as well as for funding in the part of energy efficiency. The main goal is to enhance energy efficiency and to contribute to energy economy and management by reducing total electricity and heat consumption in 14 elementary and secondary schools in the County and by switching from fuel oil to natural gas.
In cooperation with HEP ESCO company the project Implementation of energy efficiency measures in public lighting of the town Čakovec is being implemented with the aim to reduce electricity use for public lighting.
Regional Energy Agency North successfully implemented the project Modernization and optimization of public lighting of the city of Koprivnica by replacing mercury lights with high-pressure sodium lights resulting in 29.68 percent reduction in electricity consumption and CO2 emission.
Zagorje Development Agency implemented in 2009 the educational program for secondary school students in the Krapinsko-Zagorska County: Learning to save energy. Also, in the framework of the project Establishing Registry of buildings and implementing the EU Display Campaign in the Krapinsko-Zagorska County the Development Agency took part in prepa-ring the registry for 46 buildings for public use owned by the County. The data about energy consumption were collected and entered in the Energy Management Information System. In the second phase of the project data were collected on the consumption of energy and water and CO2 emission for 10 elementary and secondary schools in the County; so called Display posters were produced, presenting energy labels that show consumption of energy, water and CO2 equivalent. In 2009 public competition was open for implementation of the program „1000 solar panels for individuals in Krapinsko-Zagorska County “. The project includes the installation of solar panels for hot water preparation and house heating, envisaging

249
ENERGY MMIXIX ENERGY EFFICIENCY
kućanstvima na području Županije. Programom je predviđeno sufinanciranje ukupnih troškova opreme i ugradnje sunčevog sustava u visini od 40 posto, odnosno maksimalno 12 000,00 kn po kućanstvu.
Primorsko-goranska županija je u veljači 2009. godine osnovala trgovačko društvo REA Kvarner (Regionalna energet-ska agencija Primorsko-goranske županije d.o.o. Rijeka) uz pomoć sredstava EU iz programa CIP-IEE (Inteligent Energy Europe), koja će provoditi projekte energetske učinkovito-sti. Jedan od osnovnih zadataka novoosnovane agencije je poticanje proizvodnje energije iz obnovljivih i alternativnih izvora u Primorsko-goranskoj županiji. Agencija također pruža informacije i savjete vezane uz energetsku učinkovitost i obnovljive izvore energije, provodi projekte te vodi program „Sustavno gospodarenje energijom u gradovima i županijama u Republici Hrvatskoj“ (SGE) zajedno u suradnji s UNDP-om i MINGORP-om. Financiranje agencije REA vrši se putem proračuna.
Grad Split i Splitska razvojna agencija provode program „Sustavno gospodarenje energijom u gradovima i župani-jama u Republici Hrvatskoj“ (SGE) u suradnji s UNDP-om i MINGORP-om, a uz potporu Fonda za zaštitu okoliša i energetsku učinkovitost (FZOEU) i Globalnog fonda za okoliš (GEF).
Izvori financiranja projekata su Splitska razvojna agencija, Grad Split i UNDP Hrvatska.
Za građane je na Fakultetu elektrotehnike, strojarstva i brodo-gradnje (FESB) u ožujku 2009. godine otvoren EE info kutak. U periodu od 28. listopada 2009. do 2. prosinca 2009. godine održano je ukupno šest edukativnih radionica za teh-ničko osoblje svih gradskih objekata radi tjednog prikupljanja podataka o potrošnji energije. U Službi za gospodarstvo, poduzetništvo i razvitak grada Splita pripremljen je natječaj za sufinanciranje ugradnje solarnih kolektora za građane grada Splita.
Karlovačka županija sudjeluje u projektu „Sustavno gos-podarenje energijom u gradovima i županijama u Republici Hrvatskoj“ (SGE) te je u suradnji s UNDP-om osigurala provedbu ukupno 112 energetskih pregleda zgrada javnih ustanova Karlovačke županije. U sklopu INTERREG progra-ma – Adriatic New Neighbourhood Programme Karlovačka županija je zajedno s talijanskim partnerom provela projekt „Sustavno gospodarenje energijom u Karlovačkoj županiji“ – SEM (Systematic Energy Management). Sredinom 2009.
co-financing for costs of equipment and installation of the solar system, at share of 40 percent or maximum 12,000 HRK per household.
Primorsko-Goranska County established in February 2009 the company REA Kvarner (Regional Energy Agency of Primorsko-Goranska County d.o.o. Rijeka) using the EU assistance funds from the CIP-IEE program (Intelligent Energy Europe). The Agency deals with energy efficiency projects. One of the main tasks of this newly established entity is to promote production of energy from renewable energy sources and alter-native energy sources in the County. It also provides informa-tion and counsel concerning energy efficiency and renewable energy sources, implements the projects and operates the pro-gram Systematic Energy Management in Cities and Counties in the Republic of Croatia together with UNDP and the Ministry of Economy, Labor and Entrepreneurship. The REA Agency is financed on the County’s budget.
City of Split and Split Development Agency carries out the program Systematic Energy Management in Cities and Counties in the Republic of Croatia in cooperation with UNDP and the Ministry of Economy, Labor and Entrepreneurship, with support of the Fond for Environmental Protection and Energy Efficiency and Global Environment Fund.
Sources for financing of the projects are Split Development Agency, city of Split and UNDP Croatia.
In March 2009 the Faculty of Electrical Engineering, Mechanical Engineering and Naval Architecture opened an EE info point for general public. In the period from 28 October 2009 to 02 December 2009 six educational workshops were held for technical staff of all city buildings with the aim to esta-blish collecting energy consumption data on a weekly basis. For the City’s Department for Economy, Entrepreneurship and Development a public competition was prepared for co-finan-cing the installation of solar panels for the citizens of Split.
Karlovac County participates in the project Systematic Energy Management in Cities and Counties in the Republic of Croatia and in cooperation with UNDP ensured 112 energy audits of public buildings of the County. In the frame of the INTERREG – Adriatic New Neighbourhood Programme the Karlovac County, together with the Italian partner, it carried out the Systematic Energy Management in the County. At mid-2009 the North-West Croatia Regional Energy Agency drafted the County’s Strategy for sustainable use of energy. In March 2009 the County called a public competition for the project

250
ENERGIJA MMIXIX ENERGETSKA UČINKOVITOST
godine izrađena je Strategija održivog korištenja energije Karlovačke županije od strane Regionalne energetske agenci-je Sjeverozapadne Hrvatske (REGEA). U ožujku je Karlovačka županija raspisala javni natječaj za projekt pod nazivom „Poticanje korištenja obnovljivih izvora energije kod fizičkih osoba u Karlovačkoj županiji“. Ukupna vrijednost financijskih sredstava je iznosila 1 691 302,09 kuna. Projekt je financiran iz proračuna Karlovačke županije (12%), Fonda za zaštitu oko-liša i energetsku učinkovitost (27 %), te sredstvima građana (61%). Sufinanciranje troškova ugradnje sunčevih kolektora pojedinog kućanstva iznosilo je 40 posto, odnosno najviše 12 000,00 kn po kućanstvu.
Virovitičko-podravska županija je potpisivanjem Pisma namjere u ožujku 2009. godine pristupila programu „Sustavno gospodarenje energijom u gradovima i župani-jama u Republici Hrvatskoj“ (SGE). U okviru tog programa uspostavljen je registar objekata u vlasništvu županije te su educirane odgovorne osobe u navedenim objektima za prikupljanje i unos potrebnih podataka u Registar radi konti-nuiranog praćenja potrošnje i sustavnog gospodarenja ener-gijom. Prikupljeni podaci o ukupno 118 objekata u vlasništvu Virovitičko-podravske županije uneseni su u Informacijski sustav za gospodarenje energijom (ISGE). U 2009. godini su pokrenuti „Projekti izgradnje područnih škola po načelima održive gradnje“ uz sufinanciranje FZOEU-a. Izgrađeno je ukupno pet osnovnih škola pri čemu je dio troškova finan-ciran iz Proračuna Virovitičko-podravske županije. Provedeni su i „Projekti sanacije građevina osnovnog obrazovanja u Virovitičko-podravskoj županiji“ (ukupno sedam osnovnih škola). Sudjelovanje Fonda u sufinanciranju navedenih radova je 40 posto, dok su ostali troškovi financirani iz Proračuna Virovitičko-podravske županije. Fond je sudjelovao i u sufi-nanciranju projekta „Opća bolnica Virovitica – energetski blok i kotlovnica“.
U 2009. godini je na području Dubrovačko-neretvanske županije provedeno niz aktivnosti na sanaciji domova zdrav-lja te osnovnih i srednjih škola i učeničkih domova, radi povećanja energetske učinkovitosti.
Požeško-slavonska županija provodi program „Sustavnog gospodarenje energijom u gradovima i županijama u Republici Hrvatskoj“ (SGE). U 2009. godini je u okviru nave-denog programa napravljen popis svih objekata u vlasništvu županije te je izvršena priprema za energetske preglede. Imenovana je odgovorna osoba koja je prošla tečaj za ener-getske savjetnike te je uspostavljen sustav za mjerenje i
entitled Promoting the Use of Renewable Energy Sources by Individuals in the Karlovac County. Total value of the funds was 1,691,302.09 HRK. The project was financed by the County’s budget (12 percent), Fund for Environmental Protection and Energy Efficiency (27 percent), and private funds of the citi-zens (61 percent). The installation of the solar panels in hou-seholds was co-financed in amount of 40 percent, or 12,000 HRK at maximum per household. Technical executor of the project was the North-West Croatia Regional Energy Agency.
Virovitičko-Podravska County signed the Letter of Intent in March 2009 and thus joined the Systematic Energy Management in Cities and Counties in the Republic of Croatia. In the frame of this program the Registry of buildings owned by the County was established and persons respon-sible for these buildings received training for collection and entry of data in the Registry with the aim to establish a regular consumption monitoring and systematic energy management. The data were gathered for 118 buildings in the County’s ownership and entered in the Energy Management Information System. In 2009 the project of Building Regional Schools on Principles of Sustainable Construction was launched, which is co-financed by the Fund for Environmental Protection and Energy Efficiency. Five schools were built, with a part of expenses covered with the County budget funds. Other projects implemented in 2009 are sanation of the elementary schools’ facilities in the Virovitičko-Podravska County (total of seven elementary schools). The participation of the Fund in financing these works was 40 percent, while the remaining expenses were covered with the County’s budget funds. The Fund for Environmental Protection and Energy Efficiency also participated in co-financing of the project Virovitica General Hospital – energy unit and boiler unit.
In the area of the Dubrovnik-Neretva County a number of activities was conducted in 2009 in projects of improving the conditions of health centers, elementary schools, secondary schools and student residence houses, in order to increase energy efficiency. The projects were performed in coope-ration between the County and the Fund for Environmental Protection and Energy Efficiency.
Požeško-Slavonska County is implementing the program Systematic Energy Management in Cities and Counties in the Republic of Croatia. In the framework of this program in 2009 the list of all buildings owned by the County was made, together with preparations for the energy audits. A responsible person was designated, and received the training

251
ENERGY MMIXIX ENERGY EFFICIENCY
nadzor potrošnje energije za svaki objekt. Sve aktivnosti su financirane isključivo iz sredstava Fonda za zaštitu okoliša i energetsku učinkovitost i Ministarstva zaštite okoliša i pro-stornog uređenja.
Brodsko-posavska županija provodi program „Sustavnog gospodarenja energijom u gradovima i županijama u Republici Hrvatskoj“ (SGE). Navedeni program je započeo potpisivanjem Energetske povelje i Pisma namjere u ožujku 2009. godine u kojima se Brodsko-posavska županija obve-zala aktivno promicati energetsku učinkovitost, obnovljive izvore energije i održivo gospodarenje energijom u zgradama te informirati sve građane i poslovni sektor. Politika ener-getske učinkovitosti je javno objavljena početkom travnja 2009. godine. Polovicom studenog 2009. godine imenovan je EE tim. Unosom potrebnih podataka za 157 objekata uspo-stavljen je Registar zgrada na području Brodsko-posavske županije.
Radi povećanja energetske učinkovitosti, sigurne dobave i opskrbe energijom te prije svega zaštite okoliša Zadarska županija provodi slijedeće programa: „Plinofikacija Zadarske županije –program PLINCRO“, „Potencijali obnovljivih izvora energije u Zadarskoj županiji“, „Sustavno gospodarenje ener-gijom u Zadarskoj županiji „(SGE) i program „Greenbuilding“.
U području obnovljivih izvora energije i energetske učinkovi-tosti na području Zadarske županije prihvaćeni su programi: iskoristivost potencijala vjetra (ENWIND), sunčeve energije (SUNEN), biomase i otpada (BIOEN) te program energetske učinkovitosti u zgradarstvu (KUEN). U 2009. godini su pro-vođene aktivnosti na realizaciji projekta izrade „Atlasa vjetra za Zadarsku županiju“, koji će osigurati pouzdane, visoko-kvalitetne i reprezentativne službene podatke gospodarskom i poduzetničkom sektoru koji će imati interesa za izgradnju vjetroparkova na ovom području. Nadalje u 2009. godini je revidiran i dopunjen projekt „Smanjenja potrošnje goriva u OB Zadar primjenom solarne energije i regulacije potrošnje topline“ te je dostavljen na razmatranje Upravnom odboru Fonda za zaštitu okoliša i energetsku učinkovitost. Također, na osnovama projekta „Analiza mogućnosti korištenja bio-mase za energiju na području Zadarske županije“ osigurani su temeljni pokazatelji i preduvjeti korištenja biomase iz stočarstva i poljoprivrede te šumske biomase u primjenama tehnoloških postupaka prerade i pretvorbe u energiju. U lipnju 2009. godine je Upravnom odjelu Zadarske županije dodijeljena nagrada Hrvoje Požar za popularizaciju energe-tike, odnosno za svesrdno zalaganje u promicanju projekata
course for energy counselors. The system for metering and monitoring consumption for each building was established. All the activities are financed only with the means of the Fund for Environmental Protection and Energy Efficiency and of the Ministry of Environmental Protection, Physical Planning and Construction.
Brodsko-Posavska County is implementing the program Systematic Energy Management in Cities and Counties in the Republic of Croatia. This program started with signing the Energy Charter and the Letter of Intent in March 2009, when the Brodsko-Posavska County took commitment to actively promote energy efficiency, renewable energy sources and sustainable energy management in buildings, and dissemi-nate information to the general public and the businesses. The policy of energy efficiency was published in April 2009. In mid-November the EE team was nominated. The data for 157 buildings were entered in the Registry of buildings esta-blished for the County.
Pursuing the goals of increasing energy efficiency, and achi-eving secure purchase and supply of energy and, first of all, environmental protection the Zadar County is implementing the following programs: Gasification of the Zadar County – PLINCRO program, Potentials for renewable energy sources in the Zadar County, Systematic Energy Management in the Zadar County and the Greenbuilding program.
In the field of renewable energy sources and energy effici-ency, the County accepted the following programs: ENWIND (usability of wind energy potentials), SUNEN (solar energy), BIOEN (biomass and waste) as well as the KUEN (energy efficiency in buildings). In 2009 the activities were conducted on the projects Wind Atlas for the Zadar County, with which high quality, reliable and representative data will be provided for the commercial and entrepreneurship sector interested in construction of wind parks in this area. Furthermore, in 2009 the project of Reducing fuel consumption in the Zadar General Hospital through solar energy and heat regulation was revised and extended and then sent to the Steering Board of the Fund for Environmental Protection and Energy Efficiency for consideration. Also, the project Analysis of Potentials for Energy Use of Biomass in the Zadar County provided basic indicators and prerequisites for using biomass from farming and agriculture and forestry in applications of the technologi-cal processes of processing and transformation in to energy. In June 2009 the County’s Administration Department rece-ived the Hrvoje Požar reward for popularization of the energy

252
ENERGIJA MMIXIX ENERGETSKA UČINKOVITOST
energetske učinkovitosti, implementacije projekata korištenja obnovljivih izvora energije te podizanja razine ekološke svije-sti na području Zadarske županije.
Potpisivanjem Energetske povelje i Pisma namjere u Zadarskoj županiji se provodi i program „Sustavnog gospo-darenja energijom“ (SGE) u suradnji s UNDP-om i MINGORP-om s glavnim ciljem poboljšanja energetske učinkovitosti u zgradama u vlasništvu gradova i županija. Tijekom 2009. godine su od strane UNDP-a raspisana dva natječaja za provođenje energetske analize objekata. Pravo na besplatni pregled su dobile 23 škole i šest ustanova kojima je osnivač Zadarska županija.
Cilj programa „Greenbuilding“, kao dobrovoljnog programa Europske komisije, koji je pokrenut u okviru Intelligente Energy Europe 2005. godine, je povećanje učinkovitosti kori-štenja energije, promocija i korištenje obnovljivih izvora ener-gije, smanjenje korištenja fosilnih goriva, smanjenje utjecaja na okoliš smanjenjem emisija CO2 te povećanje sigurnosti opskrbe energijom.
U suradnji s Energetskim institutom Hrvoje Požar organizirana je radionica na kojoj su sudionici upoznati sa suvremenim dostignućima u području graditeljstva. Prezentirana je studija „Program procjene potencijala obnovljive energije i poveća-nja energetske učinkovitosti na području Zadarske županije“ te je predstavljen novootvoreni Centar za solarnu energiju u sklopu Strukovne škole Vice Vlatković.
U Koprivničko-križevačkoj županiji je u veljači 2009. godine prijavljeno šest objekata (pet škola ukupne površine 5 477,75 m2 i Zavod za javno zdravstvo površine 2 689,05 m2) iz Registra objekata Koprivničko-križevačke županije za preliminarne energetske preglede.
Krapinsko-zagorska županija je ugovorila s tvrtkom HEP ESCO d.o.o. projekt izrade energetskih studija za ukupno dvanaest škola na području županije. Provedeni su pregledi svih škola te su kao krajnji rezultati studija sumarno za svaku školu posebno dani pregled mjera energetske učinkovitosti, potrebni investicijski troškovi, očekivane uštede i jednostavni periodi povrata investicije.
U 2009. godini je proveden cijeli niz aktivnosti od strane tvrtke HEP ESCO d.o.o. radi smanjenja potrošnje energije (poboljšanje toplinske izolacije objekata, zamjena starih kotlova, spremnika potrošne tople vode, ugradnja termo-statskih radijatorskih ventila, zamjena energenata – zamjena loživog ulja s prirodnim plinom, poboljšanje rasvjete).
issues and great efforts in promoting energy efficiency pro-jects, implementation of the RES projects and raising public awareness on environmental issues in the County.
After signing the Energy Charter and the Letter of Intent the County started to implement the Systematic Energy Management Program in cooperation with UNDP and the Ministry of Economy, Labor and Entrepreneurship. The main goal is to enhance energy efficiency in the buildings owned by the towns and the County itself. In the course of 2009 UNDP called two competitions for carrying out energy analysis of the buildings. The check-up free of charge was granted to 23 schools and 6 institutions whose founder is the Zadar County.
The aim of the Greenbuilding program as a voluntary program of the European Commission which was set off in the frame of the Intelligent Energy Europe in 2005 is to increase the effi-ciency in energy use, promoting and use of renewable energy sources, reducing consumption of fossil fuels, lowering envi-ronmental impact by reducing CO2 emissions and enhancing security of supply.
In cooperation with Energy Institute Hrvoje Požar a workshop was organized where participants learned about up-to-date achievements in the construction industry. Also, the study Program of evaluation of potentials for RES and energy effici-ency increase in the Zadar County was presented in the wor-kshop as well as the newly opened Center for Solar Energy which makes part of the Vocational School ‘Vice Vlatković’.
In February 2009 in Koprivničko-Križevačka County six buildings from the Registry of buildings of this County appli-ed for walk-through energy audits (five schools with total surface of 5,477.75 square meters and the Institute of Public Health with 2,689.05 square meters).
Krapinsko-Zagorska County signed a contract with the company HEP ESCO for energy studies of 12 schools in the County. The audits in all the schools are completed and summarized findings are given regarding energy efficiency measures, needed investment costs, expected savings and simple payback period of investment.
During 2009 a number of activities were conducted by the company HEP ESCO with the aim to reduce energy consump-tion (by improving thermal insulation of buildings; replace-ment of old boilers; consume hot water tanks; installation of thermostat radiator valves; fuel switching – replacing fuel oil with natural gas, better lighting).

253
ENERGY MMIXIX ENERGY EFFICIENCY
U okviru investicijskog i tekućeg održavanja u 2009. godini je u Osječko-baranjskoj županiji proveden cijeli niz aktivnosti na osnovnim i srednjim školama kao što su sanacije krovova, zamjene kotlova, sanacije kotlovnica, zamjena postojeće sto-larije, građevinski popravci na sportskim dvoranama itd.
Skupština Zagrebačke županije je na sjednici održanoj u srpnju 2009. godine donijela „Strategiju održivog korištenja energije Zagrebačke županije“ s osnovnim ciljem određiva-nja smjernica za uspješan gospodarski i energetski razvitak Zagrebačke županije. Pri tom je glavni naglasak stavljen na obnovljive izvore energije i učinkovito korištenje energije. Na području Zagrebačke županije proizvodnja toplinske energije iz obnovljivih izvora energije prema navedenoj Strategiji moguća je na tri načina: korištenjem energije biomase, ener-gije Sunca i manjim dijelom korištenjem dizalica toplina. Izradu Strategije vodila je Regionalna energetska agencija Sjeverozapadne Hrvatske, a financirala Zagrebačka županija.
S obzirom na to da posljednjih godina u Zagrebačkoj županiji raste interes za korištenje dizalica topline, u 2009. godini je pokrenut projekt pokazne primjene dizalica topline za grijanje zgrada javne namjene na području Zagrebačke županije. Prvom fazom provedbe projekta obuhvaćeno je ukupno šest zgrada javne namjene u općinama Pokupsko, Pušća, Kravarsko, Marija Gorica, Orle i Gradec. Tijekom realizacije projekta provodile su se razne promotivne i informativne aktivnosti vezane za kontinuirano i pravodobno informiranje široke javnosti o samom projektu i njegovim rezultatima.
Nadalje, Zagrebačka županija je pokrenula projekt „Poticanje korištenja obnovljivih izvora energije kod fizičkih osoba u Zagrebačkoj županiji – I ja mogu imati solarne kolektore! „ Prvom fazom objekta obuhvaćeno je 50 kućanstava u Zagrebačkoj županiji u kojima se ugrađuju solarni sustavi za grijanje i pripremu potrošne tople vode. Ukupni troškovi opreme i ugradnje sunčevog sustava u pojedino kućanstvo financirano je u iznosu od 40 posto, odnosno do maksimal-nog iznosa od 12 000,00 kn po kućanstvu.
In the framework of the investment and current maintenance in 2009 in the Osječko-Baranjska County a number of activities were conducted in the elementary and secondary schools such as sanation of roofs, replacement of boilers, sanation of boiler units, replacement of finish carpentry, structural repairs on the sport halls, etc.
The Assembly of the Zagreb County in July 2009 adopted the Strategy for Sustainable Use of Energy of the Zagreb County with general aim to determine the guidelines for successful economic and energy development of the County. The emphasis is put on renewable energy sources and effici-ent use of energy. According to the Strategy, in the County’s territory the production of heat energy from renewable energy sources could be performed in three ways: by use of biomass energy, solar energy and, at minor extent, by use of heat pumps. The Strategy for Sustainable Use of Energy of the Zagreb County was made under North-west Croatia Regional Energy Agency and was financed by the Zagreb County budget.
Given the fact that in the recent years there has been a growing interest in the County for use of heat pumps, in 2009 the project was launched with the aim to present the use of heat pumps for heating of the buildings in the County’s area. The first phase of the project implementation encompasses six public buildings in the municipalities Pokupsko, Pušća, Kravarsko, Marija Gorica, Orle and Gradec. During the project realization, various promotional activities were conducted for continuous and timely informing of the broad public about the project itself and its results.
Also, the Zagreb County launched the project Promoting the use of renewable energy sources by individuals in the Zagreb County – I can have solar panels! The first phase of the pro-ject encompassed 50 household in the County where solar system for heating and hot water are being installed. Out of total costs for equipment and installation of the solar systems in a household, the County covered 40 percent or maximum 12,000 HRK per household.


EMISIJE ONEČIŠĆUJUĆIH TVARI U ZRAK IZ ENERGETSKOG SEKTORA AIR POLLUTANT EMISSIONS
FROM ENERGY SECTOR
XX


257
ENERGY MMIXX AIR POLLUTANT EMISSIONS FROM ENERGY SECTOR
Krajem sedamdesetih godina, Konvencijom o prekogranič-nom onečišćenju zraka na velikim udaljenostima (CLRTAP) i Prvom svjetskom konferencijom o klimi, počinje se sustavno analizirati utjecaj čovjeka na okoliš. Analize ukazuju na zna-čajan doprinos antropogenih emisija iz energetskog sektora na zakiseljavanje, eutrofikaciju, prizemni ozon te na globalno zatopljene i promjenu klime.
10.1. Međunarodne obveze
Hrvatska je ratificirala CLRTAP konvenciju (NN - Međunarodni ugovori, 1/1992). U okviru CLRTAP konvencije doneseno je više važnih protokola za energetiku, a ovdje se komentiraju obveze iz Protokola o suzbijanju zakiseljavanja, eutrofikacije i prizemnog ozona, ratificiranog u svibnju 2008. godine. Ovim Protokolom se ograničava emisija SO2, NOx, NMVOC i NH3 (eng. Multi-Pollutant) radi smanjenja zakiseljavanja, eutrofi-kacije i prizemnog ozona (eng. Multi-Effect). Ciljevi smanje-nja emisije postavljeni u okviru Nacionalne strategije zaštite okoliša, temeljeni na hrvatskim obvezama iz Protokola, su smanjiti emisiju SO2 za 61 posto, NMVOC za 14 posto, NH3 za 19 posto do 2010. godine (u odnosu na 1990. godinu), dok je emisiju NOx potrebno održati ispod razine emisije iz 1990. godine.
Hrvatska je stranka Okvirne konvencije Ujedinjenih naroda o promjeni klime (UNFCCC) od 1996. godine, na temelju odluke Hrvatskog sabora o ratifikaciji (NN - Međunarodni ugovori, 2/1996), preuzevši opseg svoje odgovornosti u okviru Priloga 1 UNFCCC konvencije. Hrvatska je u travnju 2007. godine ratificirala Protokol iz Kyota i time preuzela obvezu smanjenja emisije stakleničkih plinova iz antropoge-nih izvora za 5 posto, u razdoblju od 2008. do 2012. godine, a u odnosu na referentnu 1990. godinu.
U pripremi je novi globalni sporazum o smanjenju emisije stakleničkih plinova za post-kyotsko razdoblje (nakon 2012. godine). U borbu s klimatskim promjenama nastoji se uklju-čiti sve zemlje, ali bi njihove obveze ovisile o stupnju razvoja pojedine zemlje i potencijalu za smanjenje emisije. EU ima aktivnu ulogu u pronalaženju rješenja za klimatski problem i spremna je na sebe preuzeti obvezu smanjenja emisije stakleničkih plinova od najmanje 20 posto do 2020. godine u odnosu na emisiju iz 1990. godine. Očekuje se donošenje novog sporazuma o globalnom smanjenju emisija stakle-ničkih plinova do kraja 2011. godine, koji bi bio spreman
In the late 1970s, the Convention on Long-Range Transboundary Air Pollution (CLRTAP) and the First World Climate Conference saw the beginning of systematic analyses of anthropogenic impact on the environment. The results indi-cate a significant contribution of anthropogenic emissions from energy sector to acidification, eutrophication and ground-level ozone, as well as to the global worming and climate change.
10.1 International obligations
Croatia ratified the CLRTAP Convention (Official Gazette - International Agreements, 1/92). Within the framework of the CLRTAP Convention several protocols of relevance for energy issues were adopted. Here we comment on the com-mitments deriving from the Protocol to Abate Acidification, Eutrophication and Ground-level Ozone, ratified in May 2008. This Protocol limits SO2, NOx, NMVOC and NH3 (multi-pollu-tant) emissions in order to reduce acidification, eutrophi-cation and ground-level ozone (multi-effect). Based on the Croatian obligations according to the Protocol, the emission reductions targets set out within the framework of the National Environmental Strategy are to reduce SO2 emissions by 61 percent, NMVOC by 14 percent, NH3 by 19 percent by 2010 in relation to the 1990 levels, while NOx emissions should be maintained below the 1990 level.
The Croatian Parliament ratified the United Nations Framework Convention on Climate Change (UNFCCC) in 1996 (Official Gazette – International Agreements, 2/96) by which Croatia, as a signatory party, has assumed the scope of its commitments within the framework of the Annex 1 to the Convention. Croatia ratified the Kyoto Protocol in the April 2007. According to the Kyoto Protocol, Croatia has the obligation to reduce the emissions of greenhouse gases from anthropogenic sources by 5 percent in the period from 2008 to 2012, in relation to the base year 1990.
The new global agreement on greenhouse gas (GHG) emission reduction for the post-kyoto period (beyond 2012) are in pre-paratory phase. Intention is to involve all countries in combat with climate changes, but the obligations should depend on development level of countries and potentials for emission reduction. The EU has an active role in working out solutions for the climate issue and is ready to take the commitment of significant emission reduction, at least by 20 percent by 2020 in comparison to 1990. The new global agreement on green-house gas emission reduction should be achieved at the end of

258
ENERGIJA MMIXX EMISIJE ONEČIŠĆUJUĆIH TVARI U ZRAK IZ ENERGETSKOG SEKTORA
za implementaciju od 2013. godine. Za očekivati je da će Hrvatska u okviru novog sporazuma također imati kvantificira-nu obvezu smanjenja emisija stakleničkih plinova, vjerojatno strožu nego u okviru Protokola iz Kyota.
Republika Hrvatska je u završnoj fazi usklađivanja politike u području klimatskih promjena s pravnom stečevinom EU. Jedan od zadataka je i uvođenje sustava trgovanja emisijskim jedinicama stakleničkih plinova. Radi uspostave sustava usvojene su dvije uredbe: Uredba o emisijskim kvotama stakleničkih plinova i načinu trgovanja emisijskim jedinicama (NN 142/2008) i Uredba o provedbi fleksibilnih mehanizama Kyotskog protokola (NN 142/2008). Donesena je i Uredba o izmjenama i dopunama Uredbe o emisijskim kvotama stakle-ničkih plinova i načinu trgovanja emisijskim jedinicama (NN 113/2010), radi uključivanja zrakoplovne djelatnosti u sustav trgovanja emisijskim jedinicama od 2012. godine. Iako će samo trgovanje emisijskim jedinicama započeti tek u trenutku ulaska Hrvatske u EU, operateri postrojenja koja sudjeluju u sustavu trgovanja imaju obvezu praćenja, izvješćivanja i verifikacije emisija stakleničkih plinova od 1. siječnja 2010. godine, a operateri zrakoplova od 1. siječnja 2012. godine, kako bi spremno dočekali ulazak na EU tržište emisijskih dozvola.
10.2. Emisije u zrak
Nacionalni proračun emisija SO2, NOx, čestica i ostalih one-čišćujućih tvari izrađuje se primjenom AE-DEM programskog paketa i EMEP/CORINAIR metodologije, a za potrebe CLRTAP konvencije. Emisija CO2 i drugih stakleničkih plinova odre-đuje se primjenom IPCC metodologije razvijene u okviru UNFCCC konvencije. Za prikupljanje podataka potrebnih za proračun nacionalnih emisija u zrak zadužena je Agencija za zaštitu okoliša, a proračun se izrađuje u suradnji s tvrtkom EKONERG – Institutom za energetiku i zaštitu okoliša.
Za energetiku je svakako najznačajnije pratiti emisije SO2, NOx i CO2, a interesantno je prikazati i emisije čestica iako je njihov negativni utjecaj na zdravlje i ekosustav uglavnom lokalnog karaktera. Plinovi SO2 i NOx, osim potencijalno štetnog djelovanja na zdravlje, poznati su kao „kiseli” plinovi jer njihovom transformacijom prilikom daljinskog transporta nastaju kiseli sastojci koji se talože iz atmosfere u obliku mokrog (kisele kiše) i suhog taloženja. Osim zakiseljavanja
the year 2011, and the agreement should be ready for imple-mentation in the year 2013. Accordingly, it can be expected that, in the framework of the new agreement, Croatia will have a quantified obligation to reduce GHG emissions, probably more strict than the Kyoto’s obligation.
Republic of Croatia is in the final phase of harmonization of its climate change policy with EU acquis. One of the tasks is implementation of the GHG emission trading scheme (ETS). In order to implement the ETS, two regulations were adopted: Regulation on greenhouse gas emission quotas and the method of emission allowance trading (Official Gazette, 142/08) and Regulation on implementation of the Kyoto Protocol flexible mechanisms (Official Gazette, 142/08). Amendments on the Regulation on greenhouse gas emissi-on quotas and the method of emission allowance trading (Official Gazette, 113/10) was also adopted, in order to implement air transport in the emission trading scheme from the year 2012. The emission trading will be started when Croatia join to the EU, but operator of facilities included in the trading scheme have the obligation of GHG emission moni-toring, reporting and verification from 1st January 2010, while operator of airplanes from 1st January 2012, in order to be ready for joining to the EU emission market.
10.2 Air emissions
National inventory of SO2, NOx, particles and other pollutant emissions is preparing using the AE-DEM programme packa-ge and EMEP/CORINAIR methodology, following the CLRTAP Convention. CO2 and other greenhouse gases are calculated using the IPCC methodology, developed within the framework of the UNFCCC Convention. Croatian Environment Agency is responsible for gathering data for calculations of national air emissions, while calculation has been conducted in coope-ration with EKONERG – Energy Research and Environmental Protection Institute.
SO2, NOx and CO2 represent the most important pollutants which are to be monitored in the energy sector. It is also inte-resting to show particle emissions, despite their negative influ-ence on health and ecosystem are mainly of local importance. Besides their potential harmful effect on health, SO2 and NOx gases are also known as „acid“ gases as they transform during the remote transport and develop acid components which are accumulating from the atmosphere as wet (acid rains) or dry

259
ENERGY MMIXX AIR POLLUTANT EMISSIONS FROM ENERGY SECTOR
NOx sudjeluje u procesu eutrofikacije i stvaranju troposferskog ozona. S druge strane, staklenički plin CO2 je najznačajniji antropogeni uzročnik globalnog zatopljenja.
Pregled emisija SO2, NOx, čestica i CO2 u Hrvatskoj, za razdo-blje od 1990. do 2009. godine, prikazan je na slikama 10.2.1 i 10.2.2. Prikazane su emisije iz stacionarnih i mobilnih ener-getskih izvora te emisije iz neenergetskog sektora (industrijski procesi, poljoprivreda, otpad...), uz napomenu da su rezultati za 2009. godinu preliminarni.
Emisije uslijed izgaranja goriva imaju dominantan utjecaj na ukupne emisije SO2, NOx i CO2. Prema preliminarnim rezulta-tima proračuna za 2009 godinu, emisija SO2 bila je 20 posto, a emisija NOx 9 posto niža od limita postavljenih za 2010. godinu u okviru Strategije zaštite okoliša. Emisija čestica je u posljednjih nekoliko godina varirala na razini od oko 36 kt,dok je emisija CO2 bila niža za oko 4 posto u odnosu na prethodnu godinu i za 2 posto niža od razine emisije u 1990. godini. Smanjenje emisija u zrak uglavnom je posljedica pada gospodarskih aktivnosti u 2009. godini.
Slika | Figure 10.2.1. Trend emisija SO2 i NOx u Republici Hrvatskoj | Trends in SO2 and NOx emissions in the Republic of Croatia – Izvor | Source: EKONERG, EIHP
depositions. NOx also generates eutrophication and troposp-heric ozone. On the other hand, the greenhouse gas CO2 is the major anthropogenic source of the global warming.
The overview of SO2, NOx, particle and CO2 emissions from Croatia for the period from 1990 to 2009 is given in Figures 10.2.1 and 10.2.2. The emissions originate from stationary and mobile energy sources and from non-energy sectors (industrial processes, agriculture, waste, etc.). Note that the data for 2009 are preliminary.
The emissions from fuel combustion have a dominant influence on the total national SO2, NOx and CO2 emissions. According to the preliminary results for 2009, SO2 emissions were below for 20 percent, while NOx emissions were below for 9 percent in comparison with the limits set out in the National Environmental Strategy for 2010. Particle emissions fluctuate in last few years around 36 kt. CO2 emissions were lower for 4 percent in comparison with the emissions in pre-vious year and 2 percent lower than the emissions in 1990. The downward trend in air pollutant emissions is mostly a consequence of economic activities decline in the year 2009.
0
20000
40000
60000
80000
100000
120000
140000
160000
180000
200000
t
Stacionarni energetski izvori | Stationary energy sources Mobilni energetski izvori | Mobile energy sources Neenergetski izvori | Non-energy sources Cilj Strategije zaštite okoliša | National Environmental Strategy target
SO2 NOx
1990.1995.2000.2001.2002.2003.2004.2005.2006.2007.2008. 2009.* 1990.1995.2000.2001.2002.2003.2004.2005.2006.2007.2008. 2009.*
*preliminarni rezultati | preliminary results
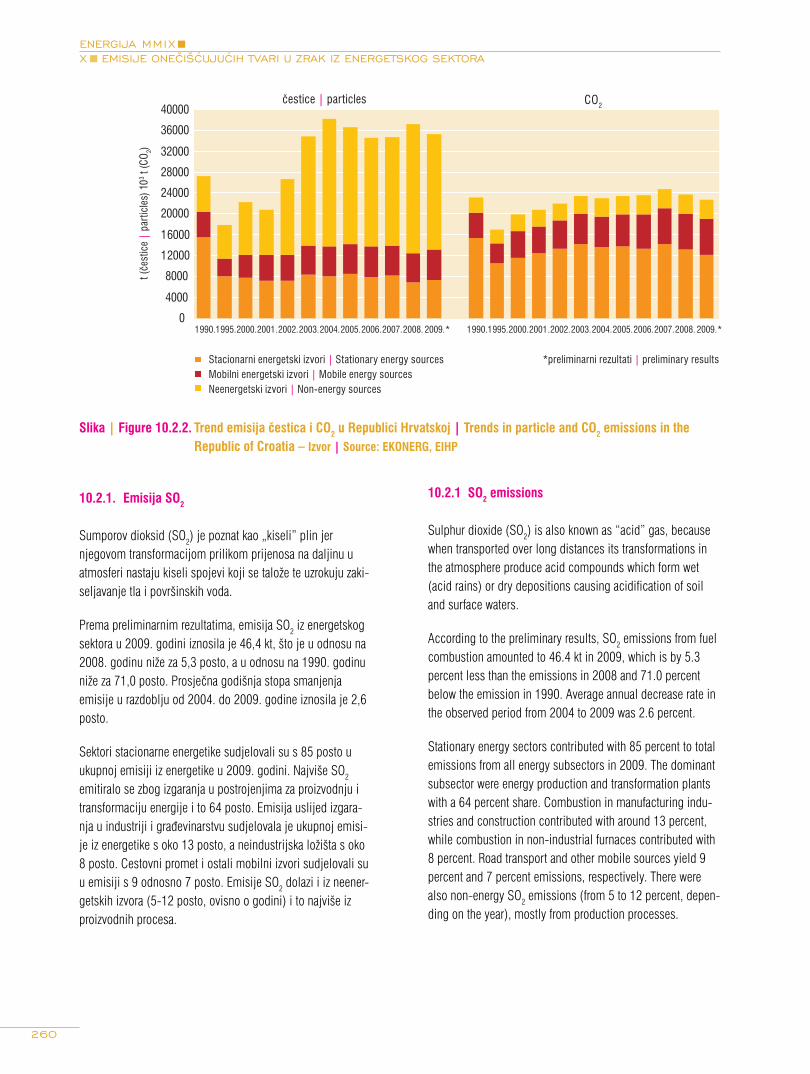
260
ENERGIJA MMIXX EMISIJE ONEČIŠĆUJUĆIH TVARI U ZRAK IZ ENERGETSKOG SEKTORA
Slika | Figure 10.2.2. Trend emisija čestica i CO2 u Republici Hrvatskoj | Trends in particle and CO2 emissions in the Republic of Croatia – Izvor | Source: EKONERG, EIHP
10.2.1. Emisija SO2
Sumporov dioksid (SO2) je poznat kao „kiseli” plin jer njegovom transformacijom prilikom prijenosa na daljinu u atmosferi nastaju kiseli spojevi koji se talože te uzrokuju zaki-seljavanje tla i površinskih voda.
Prema preliminarnim rezultatima, emisija SO2 iz energetskog sektora u 2009. godini iznosila je 46,4 kt, što je u odnosu na 2008. godinu niže za 5,3 posto, a u odnosu na 1990. godinu niže za 71,0 posto. Prosječna godišnja stopa smanjenja emisije u razdoblju od 2004. do 2009. godine iznosila je 2,6 posto.
Sektori stacionarne energetike sudjelovali su s 85 posto u ukupnoj emisiji iz energetike u 2009. godini. Najviše SO2 emitiralo se zbog izgaranja u postrojenjima za proizvodnju i transformaciju energije i to 64 posto. Emisija uslijed izgara-nja u industriji i građevinarstvu sudjelovala je ukupnoj emisi-je iz energetike s oko 13 posto, a neindustrijska ložišta s oko 8 posto. Cestovni promet i ostali mobilni izvori sudjelovali su u emisiji s 9 odnosno 7 posto. Emisije SO2 dolazi i iz neener-getskih izvora (5-12 posto, ovisno o godini) i to najviše iz proizvodnih procesa.
10.2.1 SO2 emissions
Sulphur dioxide (SO2) is also known as “acid” gas, because when transported over long distances its transformations in the atmosphere produce acid compounds which form wet (acid rains) or dry depositions causing acidification of soil and surface waters.
According to the preliminary results, SO2 emissions from fuel combustion amounted to 46.4 kt in 2009, which is by 5.3 percent less than the emissions in 2008 and 71.0 percent below the emission in 1990. Average annual decrease rate in the observed period from 2004 to 2009 was 2.6 percent.
Stationary energy sectors contributed with 85 percent to total emissions from all energy subsectors in 2009. The dominant subsector were energy production and transformation plants with a 64 percent share. Combustion in manufacturing indu-stries and construction contributed with around 13 percent, while combustion in non-industrial furnaces contributed with 8 percent. Road transport and other mobile sources yield 9 percent and 7 percent emissions, respectively. There were also non-energy SO2 emissions (from 5 to 12 percent, depen-ding on the year), mostly from production processes.
0
4000
8000
12000
16000
20000
24000
28000
32000
36000
40000
1990.1995.2000.2001.2002.2003.2004.2005.2006.2007.2008. 2009.* 1990.1995.2000.2001.2002.2003.2004.2005.2006.2007.2008. 2009.*
t (če
stic
e |
part
icle
s) 1
03 t (C
O2)
Stacionarni energetski izvori | Stationary energy sources Mobilni energetski izvori | Mobile energy sources Neenergetski izvori | Non-energy sources
CO2čestice | particles
*preliminarni rezultati | preliminary results

261
ENERGY MMIXX AIR POLLUTANT EMISSIONS FROM ENERGY SECTOR
Trend emisija SO2 iz stacionarnih i mobilnih energetskih izvora, za razdoblje od 1990. do 2009. godine, prikazan je na slici 10.2.3, a za posljednjih šest godina i u tablici 10.2.1.
The trend in SO2 emissions from stationary and mobile energy sources, for the period from 1990 to 2009, is shown in Figure 10.2.3 and for the last 6 years in Table 10.2.1.
Slika | Figure 10.2.3. Trend emisija SO2 uslijed izgaranja goriva | Trend in SO2 emissions from fuel combustion Izvor | Source: EKONERG, EIHP
Tablica | Table 10.2.1. Emisija SO2 iz energetskih podsektora za razdoblje od 2004. do 2009. godine | SO2 emissions from energy subsectors in the period from 2004 to 2009
2004. 2005. 2006. 2007. 2008. 2009.* 2009./08. 2004.-09.
tona metric tons %
Postrojenja za proizvodnju i transfor-maciju energije | Energy production and transformation plants
25 655 32 761 30 442 38 936 25 210 29 722 17,9 3,0
Neindustrijska ložišta | Non-industrial combustion furnaces
5 525 5 232 4 402 3 439 3 089 3 523 14,1 -8,6
Industrija i građevinarstvo | Manufacturing industries and construction
11 588 9 334 9 241 14 794 12 703 6 095 -52,0 -12,1
Cestovni prometRoad transport
7 314 7 818 8 308 4 656 4 385 3 954 -9,8 -11,6
Ostali mobilni izvori Other mobile sources
2 811 3 029 3 213 3 321 3 598 3 102 -13,8 2,0
UKUPNOTOTAL
52 893 58 173 55 606 65 145 48 986 46 396 -5,3 -2,6
Izvor | Source: EKONERG, EIHP *preliminarni rezultati | preliminary results
0
20000
40000
60000
80000
100000
120000
140000
160000
180000
1990. 1991. 1992. 1993. 1994. 1995. 1996. 1997. 1998. 1999. 2000. 2001. 2002. 2003. 2004. 2005. 2006. 2007. 2008. 2009.*
Ostali mobilni izvori | Other mobile sources Cestovni promet | Road transport Industrija i građevinarstvo | Manufacturing industries and construction Neindustrijska ložišta | Non-industrial combustion furnaces Postrojenja za proizvodnju i transformaciju energije | Energy production and transformation plants
t
*preliminarni rezultati | preliminary results
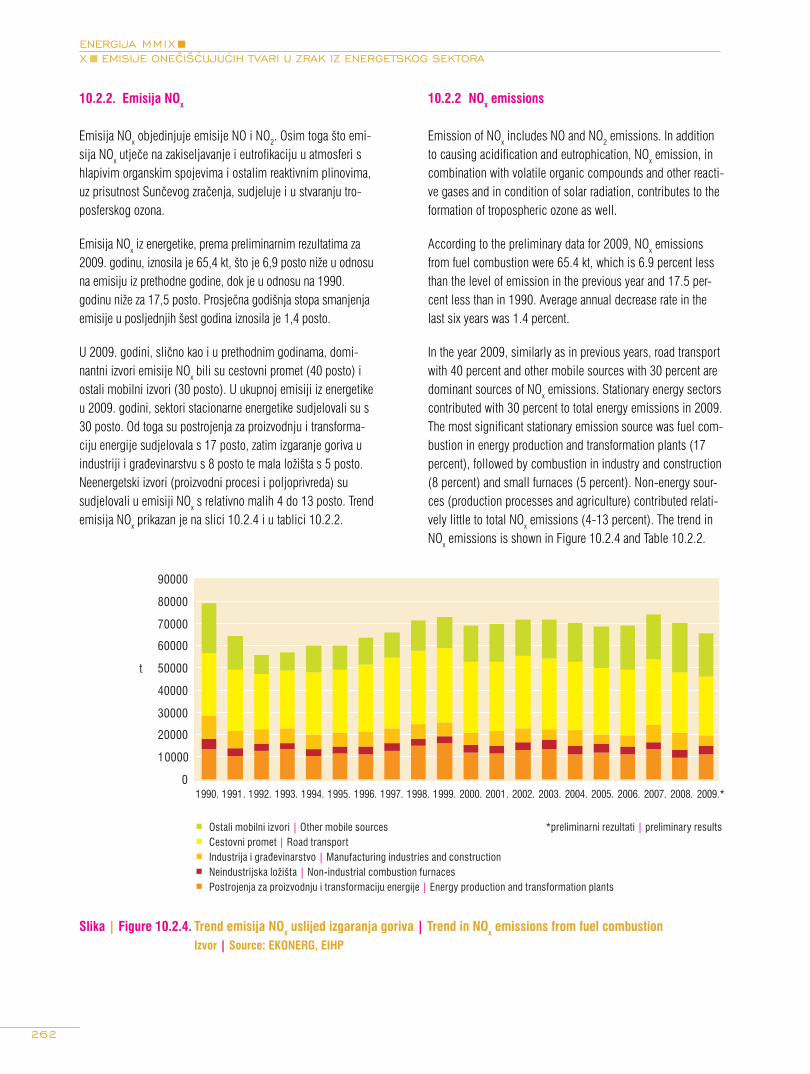
262
ENERGIJA MMIXX EMISIJE ONEČIŠĆUJUĆIH TVARI U ZRAK IZ ENERGETSKOG SEKTORA
10.2.2. Emisija NOx
Emisija NOx objedinjuje emisije NO i NO2. Osim toga što emi-sija NOx utječe na zakiseljavanje i eutrofikaciju u atmosferi s hlapivim organskim spojevima i ostalim reaktivnim plinovima, uz prisutnost Sunčevog zračenja, sudjeluje i u stvaranju tro-posferskog ozona.
Emisija NOx iz energetike, prema preliminarnim rezultatima za 2009. godinu, iznosila je 65,4 kt, što je 6,9 posto niže u odnosu na emisiju iz prethodne godine, dok je u odnosu na 1990. godinu niže za 17,5 posto. Prosječna godišnja stopa smanjenja emisije u posljednjih šest godina iznosila je 1,4 posto.
U 2009. godini, slično kao i u prethodnim godinama, domi-nantni izvori emisije NOx bili su cestovni promet (40 posto) i ostali mobilni izvori (30 posto). U ukupnoj emisiji iz energetike u 2009. godini, sektori stacionarne energetike sudjelovali su s 30 posto. Od toga su postrojenja za proizvodnju i transforma-ciju energije sudjelovala s 17 posto, zatim izgaranje goriva u industriji i građevinarstvu s 8 posto te mala ložišta s 5 posto. Neenergetski izvori (proizvodni procesi i poljoprivreda) su sudjelovali u emisiji NOx s relativno malih 4 do 13 posto. Trend emisija NOx prikazan je na slici 10.2.4 i u tablici 10.2.2.
Slika | Figure 10.2.4. Trend emisija NOx uslijed izgaranja goriva | Trend in NOx emissions from fuel combustion Izvor | Source: EKONERG, EIHP
10.2.2 NOx emissions
Emission of NOx includes NO and NO2 emissions. In addition to causing acidification and eutrophication, NOx emission, in combination with volatile organic compounds and other reacti-ve gases and in condition of solar radiation, contributes to the formation of tropospheric ozone as well.
According to the preliminary data for 2009, NOx emissions from fuel combustion were 65.4 kt, which is 6.9 percent less than the level of emission in the previous year and 17.5 per-cent less than in 1990. Average annual decrease rate in the last six years was 1.4 percent.
In the year 2009, similarly as in previous years, road transport with 40 percent and other mobile sources with 30 percent are dominant sources of NOx emissions. Stationary energy sectors contributed with 30 percent to total energy emissions in 2009. The most significant stationary emission source was fuel com-bustion in energy production and transformation plants (17 percent), followed by combustion in industry and construction (8 percent) and small furnaces (5 percent). Non-energy sour-ces (production processes and agriculture) contributed relati-vely little to total NOx emissions (4-13 percent). The trend in NOx emissions is shown in Figure 10.2.4 and Table 10.2.2.
1990. 1991. 1992. 1993. 1994. 1995. 1996. 1997. 1998. 1999. 2000. 2001. 2002. 2003. 2004. 2005. 2006. 2007. 2008. 2009.*
Ostali mobilni izvori | Other mobile sources Cestovni promet | Road transport Industrija i građevinarstvo | Manufacturing industries and construction Neindustrijska ložišta | Non-industrial combustion furnaces Postrojenja za proizvodnju i transformaciju energije | Energy production and transformation plants
0
10000
20000
30000
40000
50000
60000
70000
80000
90000
t
*preliminarni rezultati | preliminary results

263
ENERGY MMIXX AIR POLLUTANT EMISSIONS FROM ENERGY SECTOR
Tablica | Table 10.2.2. Emisija NOx iz energetskih podsektora za razdoblje od 2004. do 2009. godine | NOx emissions from energy subsectors in the period from 2004 to 2009
2004. 2005. 2006. 2007. 2008. 2009.* 2009./08. 2004.-09.
tona metric tons %
Postrojenja za proizvodnju i transfor-maciju energije | Energy production and transformation plants
11 196 12 040 11 149 13 392 9 802 11 368 16,0 0,3
Neindustrijska ložišta | Non-industrial combustion furnaces
3 899 3 880 3 673 3 228 3 371 3 572 6,0 -1,7
Industrija i građevinarstvo | Manufacturing industries and construction
7 000 4 296 4 861 7 759 7 784 4 965 -36,2 -6,6
Cestovni prometRoad transport
30 671 29 677 29 701 29 364 27 093 26 164 -3,4 -3,1
Ostali mobilni izvori Other mobile sources
17 390 18 651 19 812 20 482 22 160 19 322 -12,8 2,1
UKUPNOTOTAL
70 156 68 544 69 196 74 225 70 209 65 390 -6,9 -1,4
Izvor | Source: EKONERG, EIHP *preliminarni rezultati | preliminary results
10.2.3. Emisija čestica
Čestice se u pravilu talože blizu izvora emisije i predstavljaju uglavnom lokalni problem. Jedino se najsitnije čestice, pro-mjera manjeg od 2,5 μm (PM2.5), mogu prenijeti vjetrom i taložiti na većim udaljenostima od izvora te osim lokalnog predstavljaju i regionalni problem.
Sukladno rezultatima preliminarnog proračuna emisija za 2009. godinu, ukupna emisija čestica iz energetike iznosila je 13,2 kt što je povećanje u odnosu na 2008. godinu za 6,3 posto, a u odnosu na 1990. godinu niže za 35,2 posto. U pro-matranom razdoblju od 2004. do 2009. prosječna godišnja stopa smanjenja emisije čestica iznosila je 0,7 posto.
Trend emisija čestica iz energetike, od 1990. do 2009. godine, prikazan je na slici 10.2.5, a za razdoblje od 2004. do 2009. godine i u tablici 10.2.3.
10.2.3 Emission of particles
Particles are usually deposited in the vicinity of the emission sources and are mainly a local problem. Only the smallest particles, with diameters below 2.5 μm (PM2.5), can be transported by wind and deposited at large distance from their source. Thus, they represent not only a local, but also a regional problem.
According to the preliminary results for 2009, total particle emission from energy amounted to 13.2 kt, which is 6.3 percent higher than the emissions in 2008 and 35.2 percent lower than the emission in 1990. In the analysed period from 2004 to 2009, average annual decrease rate was 0.7 percent.
The trend in particle emissions from energy sources for the period from 1990 to 2009 is shown in Figure 10.2.5, while the period from 2004 to 2009 is presented also in Table 10.2.3.
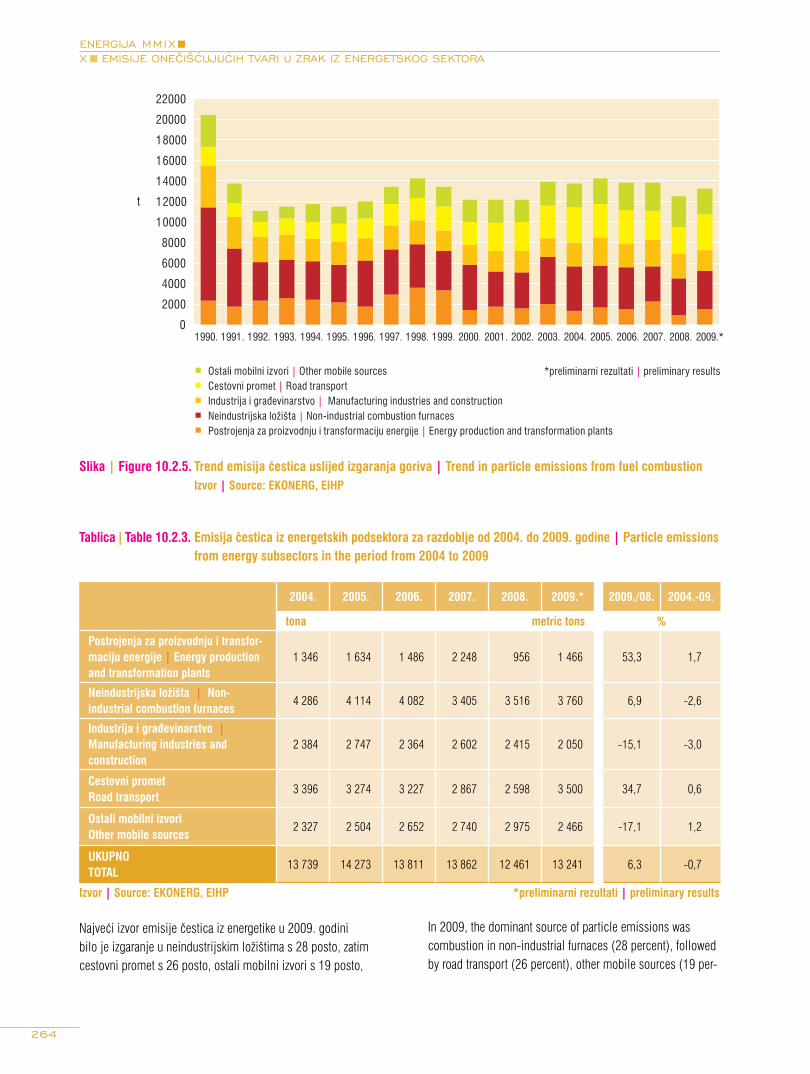
264
ENERGIJA MMIXX EMISIJE ONEČIŠĆUJUĆIH TVARI U ZRAK IZ ENERGETSKOG SEKTORA
Slika | Figure 10.2.5. Trend emisija čestica uslijed izgaranja goriva | Trend in particle emissions from fuel combustion Izvor | Source: EKONERG, EIHP
Tablica | Table 10.2.3. Emisija čestica iz energetskih podsektora za razdoblje od 2004. do 2009. godine | Particle emissions from energy subsectors in the period from 2004 to 2009
2004. 2005. 2006. 2007. 2008. 2009.* 2009./08. 2004.-09.
tona metric tons %
Postrojenja za proizvodnju i transfor-maciju energije | Energy production and transformation plants
1 346 1 634 1 486 2 248 956 1 466 53,3 1,7
Neindustrijska ložišta | Non-industrial combustion furnaces
4 286 4 114 4 082 3 405 3 516 3 760 6,9 -2,6
Industrija i građevinarstvo | Manufacturing industries and construction
2 384 2 747 2 364 2 602 2 415 2 050 -15,1 -3,0
Cestovni prometRoad transport
3 396 3 274 3 227 2 867 2 598 3 500 34,7 0,6
Ostali mobilni izvori Other mobile sources
2 327 2 504 2 652 2 740 2 975 2 466 -17,1 1,2
UKUPNOTOTAL
13 739 14 273 13 811 13 862 12 461 13 241 6,3 -0,7
Izvor | Source: EKONERG, EIHP *preliminarni rezultati | preliminary results
In 2009, the dominant source of particle emissions was combustion in non-industrial furnaces (28 percent), followed by road transport (26 percent), other mobile sources (19 per-
Najveći izvor emisije čestica iz energetike u 2009. godini bilo je izgaranje u neindustrijskim ložištima s 28 posto, zatim cestovni promet s 26 posto, ostali mobilni izvori s 19 posto,
1990. 1991. 1992. 1993. 1994. 1995. 1996. 1997. 1998. 1999. 2000. 2001. 2002. 2003. 2004. 2005. 2006. 2007. 2008. 2009.*
Ostali mobilni izvori | Other mobile sources Cestovni promet | Road transport Industrija i građevinarstvo | Manufacturing industries and construction Neindustrijska ložišta | Non-industrial combustion furnaces Postrojenja za proizvodnju i transformaciju energije | Energy production and transformation plants
0
2000
4000
6000
8000
10000
12000
14000
16000
18000
20000
22000
t
*preliminarni rezultati | preliminary results

265
ENERGY MMIXX AIR POLLUTANT EMISSIONS FROM ENERGY SECTOR
industrija i građevinarstvo s 15 posto te izgaranje u postro-jenjima za proizvodnju i transformaciju energije s 11 posto. Neenergetski izvori emisije čestica sudjeluju u ukupnim nacionalnim emisijama s 25 do 66 posto (ovisno o godini), a dominantna je emisija uslijed asfaltiranja cesta.
10.2.4. Emisija CO2
Ugljikov dioksid je najznačajniji antropogeni staklenički plin. Porast antropogene emisije CO2 uzrokuje povećanje njegove koncentracije u atmosferi (s oko 290 ppm prije industrijske revolucije na oko 380 ppm danas) te posljedično dovodi do globalnog zatopljenja i promjene klime.
Prema preliminarnim rezultatima proračuna za 2009. godinu, emisija CO2 iz energetike je iznosila 19,0 milijuna tona, što je 5,1 posto niže od emisije prethodne godine i za 5,7 posto niže od emisije iz 1990. godine. Prosječni godišnji pad emi-sije CO2 u razmatranom razdoblju od 2004. do 2009. iznosio je 0,5 posto.
Trend emisije CO2 uslijed izgaranja goriva te doprinos poje-dinih energetskih podsektora prikazani su na slici 10.2.6. i u tablici 10.2.4.
Slika | Figure 10.2.6. Trend emisija CO2 uslijed izgaranja goriva | Trend in CO2 emissions from fuel combustion Izvor | Source: EKONERG, EIHP
cent), industry and construction (15 percent), and combustion in energy production and transformation plants (11 percent). Non-energy sources contributed to total particle emissions with 25 to 66 percent (depending on the year), with dominant sources of emission from road paving with asphalt.
10.2.4 CO2 emissions
Greenhouse gas CO2 is the most important anthropogenic greenhouse gas. Due to significant CO2 emission increase, as well as the increase in CO2 concentrations in the atmosphere (from about 290 ppm before the industrial revolution to 380 ppm today), leads to the global warming and climate change.
According to the preliminary results for the year 2009, CO2 emissions from the energy sector amounted to around 19.0 million tons, which is 5.1 percent less than in the previous year and 5.7 percent less than in 1990. In the observed period, the CO2 emission decreased by an average annual rate of 0.5 percent.
The trend in CO2 emissions from fossil fuel combustion, as well as contribution of individual energy subsectors, are given in Figure 10.2.6 and Table 10.2.4.
1990. 1991. 1992. 1993. 1994. 1995. 1996. 1997. 1998. 1999. 2000. 2001. 2002. 2003. 2004. 2005. 2006. 2007. 2008. 2009.*
Ostali mobilni izvori | Other mobile sources Cestovni promet | Road transport Industrija i građevinarstvo | Manufacturing industries and construction Neindustrijska ložišta | Non-industrial combustion furnaces Postrojenja za proizvodnju i transformaciju energije | Energy production and transformation plants
0
2000
4000
6000
8000
10000
12000
14000
16000
18000
20000
22000
103 t
*preliminarni rezultati | preliminary results

266
ENERGIJA MMIXX EMISIJE ONEČIŠĆUJUĆIH TVARI U ZRAK IZ ENERGETSKOG SEKTORA
The main source of CO2 emissions is fuel combustion. In 2009, stationary energy sources emitted 64 percent of CO2, namely, 33 percent of CO2 were emitted from energy produc-tion and transformation plants, 16 percent from manufactu-ring industries and construction and 15 percent from non-industrial combustion furnaces. Road transport contributed to total energy emissions with 30 percent, while other mobile sources contributed with 5 percent. In addition to the energy sector, production processes without fuel combustion (mainly cement industry) and extraction and distribution of fossil fuels (CO2 extraction from natural gas in CPS Molve) are also significant sources of CO2 emissions, which contribution with 13 to 16 percent in total national CO2 emissions in Croatia.
Tablica | Table 10.2.4. Emisija CO2 iz energetskih podsektora za razdoblje od 2004. do 2009. godine | CO2 emissions from energy subsectors in the period from 2004 to 2009
2004. 2005. 2006. 2007. 2008. 2009.* 2009./08. 2004.-09.
tisuća tona Thousand metric tons %
Postrojenja za proizvodnju i transfor-maciju energije | Energy production and transformation plants
6 814 6 841 6 629 7 737 6 704 6 369 -5,0 -1,3
Neindustrijska ložišta | Non-industrial combustion furnaces
3 194 3 224 2 990 2 680 2 777 2 800 0,8 -2,6
Industrija i građevinarstvo | Manufacturing industries and construction
3 552 3 658 3 780 3 762 3 768 3 043 -19,2 -3,0
Cestovni prometRoad transport
5 057 5 249 5 596 6 010 5 814 5 774 -0,7 2,7
Ostali mobilni izvori Other mobile sources
882 905 918 907 974 1 035 6,3 3,3
UKUPNOTOTAL
19 498 19 878 19 913 21 097 20 037 19 022 -5,1 -0,5
Izvor | Source: EKONERG, EIHP *preliminarni rezultati | preliminary results
Iz stacionarnih energetskih izvora u 2009. godini se emitiralo 64 posto, i to 33 posto iz postrojenja za proizvodnju i tran-sformaciju energije, 16 posto iz industrije i građevinarstva te 15 iz neindustrijskih ložišta. Cestovni promet je sudjelovao u emisiji s 30 posto, a ostali mobilni izvori s 5 posto. Osim iz energetskih sektora do emisije dolazi i iz proizvodnih pro-cesa bez izgaranja goriva (najviše iz cementara) te iz sektora pridobivanja i distribucije fosilnih goriva (izdvajanje CO2 iz prirodnog plina na CPS Molve), što iznosi od 13 do 16 posto ukupne emisije CO2 u Hrvatskoj.

ENERGETSKE BILANCE ENERGY BALANCES
XIXI

Izvor | Source: EIHP
11.1. Energetske bilance po IEA metodi | Energy Balances (IEA Method)
11.2. Energetske bilance po EUROSTAT metodi | Energy Balances (EUROSTAT Method)

Tablica | Table 11.1.1. Energetska bilanca za 2008. (IEA) | Energy Balance Table 2008 (IEA)
Uglje
nCo
al
Siro
va n
afta
Crud
e Oi
l
Deriv
ati n
afte
Petr
oleu
m
Prod
ucts
Plin
ovita
go
riva
Gas
Vodn
e sn
age
Hydr
o
Geot
er.,
sunc
e,
vjet
ar |
Geo
th,
Sola
r, W
ind
Goriv
i OIE
i ot
p. |
Com
bst.
RES
& W
aste
Elek
trič
na
ener
gija
Elec
tric
ity
Topl
insk
a en
ergi
jaHe
at
UKUP
NOTO
TAL
1000 ten 1000 toe
Proizvodnja Production - 889,5 - 2.216,5 448,5 11,0 414,2 - - 3.979,7
Uvoz Imports 795,8 3.758,1 1.788,3 996,3 - - 2,5 702,1 - 8.042,9
Izvoz Exports - - -1.769,8 -565,1 - - -80,6 -136,5 - -2.552,0
Bunker brodova International Marine Bunkers - - -20,8 - - - - - - -20,8
Saldo skladišta Stock Changes -86,6 84,4 -264,7 -44,8 - - - - - -311,8
Ukupna potrošnja Total Primary Energy Supply 709,2 4.731,9 -267,1 2.602,8 448,5 11,0 336,1 565,6 - 9.138,0
Transferi Transfers - -163,1 163,1 - - - - - - -
Statističke razlike Statistical Differences 0 0 0 -0,0 - - -0,0 0 0 0
Energetske transformacije Transformation Sector -551,4 -4.568,8 4.028,3 -701,1 -448,5 -3,4 -5,5 1.050,5 285,4 -914,5
Javne elektrane Public Electricity Plants -550,4 - -319,4 -122,9 -447,5 -3,4 -0,9 830,5 - -614,0
Samostalne elektrane Autoproducer Electricity Plants - - - - -1,0 - - 1,0 - -
Javne toplane Public CHP Plants - - -120,6 -438,8 - - - 179,4 214,6 -165,4
Samostalne toplane Autoproducer CHP Plants -0,9 - -25,3 -69,8 - - -4,6 39,5 - -61,2
Javne kotlovnice Public Heat Plants - - -25,1 -61,3 - - - - 70,8 -15,6
Gradske plinare Gas Works - - -5,3 5,0 - - - - - -0,3
Rafinerije nafte Petroleum Refineries - -4.568,8 4.524,1 -13,2 - - - - - -58,0
Sektor energetike Energy Sector - - -388,2 -172,5 - - - -80,5 -20,5 -661,7
Proizvodnja nafte i plina Oil and Gas Extraction - - - -108,0 - - - -10,4 - -118,4
Rafinerije nafte Petroleum Refineries - - -388,2 -64,5 - - - -23,5 - -476,2
Elektr., toplane, kotlovnice Own Use in Electricity, CHP and HP - - - - - - - -42,4 -20,5 -63,0
Potrošnja za pump. vode Used for Pumped Storage - - - - - - - -4,1 - -4,1
Gubici distribucije Distribution Losses - - - -40,3 - - - -146,7 -38,1 -225,2
Neposredna potrošnja Final Consumption 157,8 - 3.536,1 1.688,9 - 7,6 330,6 1.388,9 226,7 7.336,7
Industrija Industry Sector 152,2 - 525,2 572,5 - - 65,1 342,3 46,9 1.704,2
Željeza i čelika Iron and Steel 1,8 - 5,5 19,9 - - - 21,0 0,02 48,2
Kemijska i petrokemijska Chemical and Petrochemical - - 48,7 142,3 - - 0,02 42,5 17,9 251,5
Obojenih metala Non-Ferrous Metals - - 6,4 1,0 - - 0,2 6,7 - 14,3
Nemetalnih minerala Non-Metallic Minerals 126,7 - 173,5 157,5 - - 10,4 63,8 0,2 532,1
Transportnih sredstava Transport Equipment - - 4,6 1,2 - - 0,02 14,2 - 20,0
Strojogradnja Machinery 0,6 - 5,8 20,2 - - 0,8 30,9 6,1 64,4
Rudarstvo i kamenolomi Mining and Quarrying - - 33,1 0,5 - - - 4,5 - 38,2
Prehrambena i cigareta Food and Tobacco 23,2 - 44,5 161,1 - - 0,06 56,2 13,7 298,9
Papira i grafike Paper, Pulp and Print - - 12,7 41,1 - - 2,6 27,8 1,3 85,5
Drva i drvnih proizvoda Wood and Wood Products - - 1,9 7,7 - - 13,3 14,2 0,002 37,1
Građevinarstvo Construction - - 180,1 - - - 0,4 25,3 - 205,8
Tekstila i kože Textile and Leather - - 5,9 15,3 - - - 13,9 2,0 37,1
Ostala Non-specified (Industry) - - 2,3 4,7 - - 37,4 21,2 5,7 71,2
Promet Transport Sector - - 2.131,9 - - - 1,2 23,7 - 2.156,9
Međunarodni zračni International Civil Aviation - - 52,3 - - - - - - 52,3
Domaći zračni Domestic Air Transport - - 67,1 - - - - - - 67,1
Cestovni Road - - 1.937,0 - - - 1,2 - - 1.938,2
Željeznički Rail - - 32,9 - - - - 21,7 - 54,6
Cjevovodni Pipeline Transport - - - - - - - 2,1 - 2,1
Domaći vodeni Internal Navigation - - 42,6 - - - - - - 42,6
Opća potrošnja Other Sectors 5,6 - 576,0 705,7 - 7,6 264,3 1.022,9 179,8 2.761,8
Poljoprivreda Agriculture - - 229,9 16,9 - - - 6,0 - 252,8
Uslužni sektor Commerce and Public Services 1,7 - 103,7 131,4 - 3,2 1,9 439,7 36,6 718,2
Kućanstva Residential 3,9 - 242,4 557,4 - 4,4 262,3 577,2 143,2 1.790,8
Neenergetska potrošnja Non-Energy Use - - 303,1 410,7 - - - - - 713,8
U ind., transf., energetici Non-Energy Use Ind/Transf/Energ. - - 278,9 410,7 - - - - - 689,6
-Sirovina za petrokem. ind. -Feedstock Use in Petchem. Ind. - - 71,5 410,7 - - - - - 482,3
U transportu Non-Energy Use in Transport - - 22,7 - - - - - - 22,7
U općoj potrošnji Non-Energy Use in Other Sectors - - 1,4 - - - - - - 1,4

270
ENERGIJA MMIXXI ENERGETSKE BILANCE Izvor | Source: EIHP

271
ENERGY MMIXXI ENERGY BALANCES
Tablica | Table 11.1.2. Energetska bilanca za 2009. (IEA) | Energy Balance Table 2009 (IEA)
Uglje
nCo
al
Siro
va n
afta
Crud
e Oi
l
Deriv
ati n
afte
Petr
oleu
m
Prod
ucts
Plin
ovita
go
riva
Gas
Vodn
e sn
age
Hydr
o
Geot
er.,
sunc
e,
vjet
ar |
Geo
th,
Sola
r, W
ind
Goriv
i OIE
i ot
p. |
Com
bst.
RES
& W
aste
Elek
trič
na
ener
gija
Elec
tric
ity
Topl
insk
a en
ergi
jaHe
at
UKUP
NOTO
TAL
1000 ten 1000 toe
Proizvodnja Production - 833,4 - 2.196,5 578,8 12,6 440,6 - - 4.061,8
Uvoz Imports 455,6 4.178,0 1.151,1 848,0 - - 9,0 651,9 - 7.293,6
Izvoz Exports -0,1 - -1.919,8 -653,6 - - -91,7 -163,3 - -2.828,6
Bunker brodova International Marine Bunkers - - -6,8 - - - - - - -6,8
Saldo skladišta Stock Changes 51,8 55,9 86,0 12,4 - - - - - 206,1
Ukupna potrošnja Total Primary Energy Supply 507,2 5.067,2 -689,5 2.403,3 578,8 12,6 357,9 488,7 - 8.726,1
Transferi Transfers - -154,7 154,7 - - - - - - -
Statističke razlike Statistical Differences 0 0 0 0 0 0 0 0 0 0
Energetske transformacije Transformation Sector -376,7 -4.912,5 4.380,2 -608,9 -578,8 -4,7 -6,0 1.091,6 277,0 -738,8
Javne elektrane Public Electricity Plants -376,2 - -294,2 -116,7 -577,7 -4,7 -1,3 876,7 - -494,1
Samostalne elektrane Autoproducer Electricity Plants - - - - -1,1 - - 1,1 - -
Javne toplane Public CHP Plants - - -166,6 -383,5 - - - 179,3 207,6 -163,1
Samostalne toplane Autoproducer CHP Plants -0,5 - -21,8 -50,2 - - -4,7 34,5 - -42,7
Javne kotlovnice Public Heat Plants - - -25,1 -60,3 - - - - 69,3 -16,1
Gradske plinare Gas Works - - -1,8 1,7 - - - - - -0,1
Rafinerije nafte Petroleum Refineries - -4.912,5 4.889,8 - - - - - - -22,7
Sektor energetike Energy Sector - - -509,7 -184,0 - - -1,3 -71,8 -18,8 -785,6
Proizvodnja nafte i plina Oil and Gas Extraction - - - -159,8 - - - -9,9 - -169,7
Rafinerije nafte Petroleum Refineries - - -509,7 -24,2 - - - -23,8 - -557,7
Elektr., toplane, kotlovnice Own Use in Electricity, CHP and HP - - - - - - - -34,9 -18,8 -53,7
Potrošnja za pump. vode Used for Pumped Storage - - - - - - - -3,1 - -3,1
Gubici distribucije Distribution Losses - - - -42,1 - - - -173,6 -30,1 -245,8
Neposredna potrošnja Final Consumption 130,5 - 3.335,7 1.568,3 - 7,9 350,6 1.334,8 228,0 6.956,0
Industrija Industry Sector 125,5 - 386,0 506,1 - - 60,7 306,2 43,1 1.427,5
Željeza i čelika Iron and Steel 0,8 - 0,5 16,7 - - - 12,0 0,02 30,1
Kemijska i petrokemijska Chemical and Petrochemical - - 23,3 157,1 - - 0,04 39,3 12,1 231,9
Obojenih metala Non-Ferrous Metals - - 5,4 1,0 - - 0,2 6,6 - 13,1
Nemetalnih minerala Non-Metallic Minerals 105,4 - 123,9 124,3 - - 10,4 53,5 0,0 417,5
Transportnih sredstava Transport Equipment - - 4,3 4,3 - - 0,02 11,5 - 20,2
Strojogradnja Machinery 0,6 - 5,8 19,7 - - 0,6 25,9 4,4 57,0
Rudarstvo i kamenolomi Mining and Quarrying - - 25,2 0,5 - - - 4,9 - 30,6
Prehrambena i cigareta Food and Tobacco 18,7 - 37,8 118,3 - - 0,09 54,3 10,2 239,4
Papira i grafike Paper, Pulp and Print - - 14,5 39,5 - - 3,4 27,5 10,3 95,2
Drva i drvnih proizvoda Wood and Wood Products - - 1,4 4,7 - - 15,6 13,7 0,002 35,4
Građevinarstvo Construction - - 136,7 - - - - 23,8 - 160,6
Tekstila i kože Textile and Leather - - 5,1 14,8 - - 0,0 13,0 1,2 34,1
Ostala Non-specified (Industry) - - 1,9 5,0 - - 30,4 20,3 4,9 62,5
Promet Transport Sector - - 2.110,8 1,1 - - 7,1 22,9 - 2.141,9
Međunarodni zračni International Civil Aviation - - 44,6 - - - - - - 44,6
Domaći zračni Domestic Air Transport - - 58,2 - - - - - - 58,2
Cestovni Road - - 1.931,6 1,1 - - 7,1 - - 1.939,8
Željeznički Rail - - 29,1 - - - - 20,7 - 49,8
Cjevovodni Pipeline Transport - - - - - - - 2,2 - 2,2
Domaći vodeni Internal Navigation - - 47,3 - - - - - - 47,3
Opća potrošnja Other Sectors 5,0 - 578,0 720,4 - 7,9 282,9 1.005,7 184,9 2.784,8
Poljoprivreda Agriculture - - 228,1 15,9 - - - 6,0 - 250,0
Uslužni sektor Commerce and Public Services 1,7 - 101,3 133,4 - 3,2 3,0 443,9 38,3 724,7
Kućanstva Residential 3,2 - 248,7 571,1 - 4,8 279,9 555,7 146,7 1.810,1
Neenergetska potrošnja Non-Energy Use - - 260,9 340,7 - - - - - 601,7
U ind., transf., energetici Non-Energy Use Ind/Transf/Energ. - - 237,7 340,7 - - - - - 578,5
-Sirovina za petrokem. ind. -Feedstock Use in Petchem. Ind. - - 62,3 340,7 - - - - - 403,1
U transportu Non-Energy Use in Transport - - 21,8 - - - - - - 21,8
U općoj potrošnji Non-Energy Use in Other Sectors - - 1,4 - - - - - - 1,4

Tablica | Table 11.2.1. Energetska bilanca za 2008. godinu (Eurostat) | Energy Balance Table 2008 (Eurostat)
SVEU
KUPN
OTO
TAL
All P
rod.
Kam
eni u
glje
nHa
rd c
oal
Koks
Coke
Lign
it uk
upno
Tota
l lig
nite
Siro
va n
afta
Crud
e oi
l
Polu
proi
zvod
iFe
edst
ocks
Ukup
no d
er. n
afte
Tota
l pet
. pro
duct
s
Rafin
erijs
ki p
linRe
finer
y ga
s
Ukap
ljeni
plin
LPG
1000 ten 1000 toe
Primarna proizvodnja Primary production 3.974,4 874,7
Uvoz Imports 8.042,8 753,4 17,4 24,9 3.517,4 240,6 1.788,3 10,5
Saldo skladišta Stock change -311,8 -86,6 116,2 -31,8 -264,7 -1,9
Izvoz Exports 2.552,0 1.769,8 149,6
Bunker brodova Bunkers 20,8 20,8
Ukupna potrošnja Gross inland consumption 9.132,6 666,8 17,4 24,9 4.508,3 208,8 -267,1 -141,0
Energija za transformacije Transformation input 6.355,9 550,4 0,9 4.360,0 208,8 524,2 5,3
Javne termoelektrane Public thermal power stations 1.553,0 550,4 440,0
Samostalne termoelektrane Autoprod. thermal power stations 100,7 0,9 25,3
Gradske plinare Gas works 5,3 5,3 5,3
Rafinerije Refineries 4.610,5 4.360,0 208,8 28,4
Javne kotlovnice District heating plants 86,4 25,1
Proizvodnja transformirane energije Transformation output 5.441,3 4.552,5 179,2 284,8
Javne termoelektrane Public thermal power stations 773,5
Samostalne termoelektrane Autoprod. thermal power stations 39,5
Gradske plinare Gas works 5,0
Rafinerije Refineries 4.552,5 4.552,5 179,2 284,8
Javne kotlovnice District heating plants 70,8
Promjene i transferi, povrat Exchanges and transfers, returns 14,8 -148,3 163,1 70,1
Transferi među proizvodima Interproduct transfers 14,8 -148,3 163,1 70,1
Potrošnja energetike Consumption of the energy branch 671,1 388,2 179,2
Gubici distribucije Distribution losses 225,1
Neposredna potrošnja Available for final consumption 7.336,5 116,4 17,4 24,0 0,0 0,0 3.536,1 208,6
Neposredna neenergetska potrošnja Final non-energy consumption 713,8 303,1
Kemijska industrija Chemical industry 485,3 74,6
Ostali sektori Other sectors 228,5 228,5
Neposredna energetska potrošnja Final energy consumption 6.622,7 116,4 17,4 24,0 0,0 0,0 3.233,1 208,6
Industrija Industry 1.704,2 116,4 17,4 18,4 525,2 34,0
Industrija željeza i čelika Iron & steel industry 48,2 1,8 5,5 5,5
Industrija obojenih metala Non-ferrous metal industry 14,2 6,4 3,2
Kemijska industrija Chemical industry 251,5 48,7
Industrija stakla i građ. materijala Glass, pottery & building mat. ind. 532,1 116,4 9,9 0,4 173,5 11,1
Rudarstvo Ore-extraction industry 38,2 33,1 0,2
Industrija hrane, pića i cigareta Food, drink & tobacco industry 298,9 5,3 18,0 44,5 1,9
Industrija tekstila, kože i odjeće Textile, leather & clothing industry 37,1 5,9 0,6
Industrija papira i grafike Paper and printing industry 85,5 12,7 2,7
Strojogradnja i metalna industrija Engineering & other metal industry 84,5 0,6 10,5 4,1
Ostala industrija Other industries 314,1 184,3 4,7
Promet Transport 2.156,8 2.131,9 76,9
Željeznički promet Railways 54,6 32,9
Cestovni promet Road transport 1.938,2 1.937,0 76,9
Zračni promet Air transport 119,4 119,4
Pom. i riječni promet Inland navigation 42,6 42,6
Opća potrošnja Households, commerce, pub.aut. etc. 2.761,7 5,6 576,0 97,7
Kućanstva Households 1.790,8 3,9 242,4 82,9
Poljoprivreda Agriculture 252,8 229,9 3,1

Mot
orni
ben
zin
Mot
or s
pirit
Petr
olej
i m
laz.
gor
.Ke
rose
ns, j
et fu
els
Prim
arni
ben
zin
Naph
tha
Plin
sko
ulje
Gas
/ die
sel o
il
Loži
vo u
ljeRe
sidu
al fu
el o
il
Osta
li de
rivat
iOt
her p
et. p
rodu
cts
Priro
dni p
linNa
tura
l gas
Grad
ski p
linDe
rived
gas
Ukup
no O
IETo
tal R
ES
Sunč
eva
ener
gija
Sola
r hea
t
Geot
erm
alna
ene
r.Ge
othe
rmal
hea
t
Biom
asa
Biom
ass
Ener
gija
vje
tra
Win
d en
ergy
Vodn
e sn
age
Hydr
o en
ergy
Topl
insk
a en
ergi
jaDe
rived
hea
t
Elek
trič
na e
nerg
ijaEl
ectr
ical
ene
rgy
2.216,5 883,2 4,4 3,2 414,3 3,4 457,9
306,9 21,5 1.084,8 70,3 294,2 996,3 2,5 2,5 702,0
-9,6 -3,4 0,7 -64,8 -186,6 0,8 -44,8
621,8 0,6 138,0 543,9 169,1 146,7 565,1 80,6 80,6 136,4
20,8
-324,4 17,5 -137,3 476,1 -306,3 148,3 2.602,8 805,1 4,4 3,2 336,2 3,4 457,9 565,5
28,4 7,0 483,4 706,0 5,5 5,5
1,3 438,7 561,6 0,9 0,9
25,3 69,8 4,6 4,6
28,4 13,2
5,7 19,4 61,3
1.066,0 102,0 137,4 1.424,9 1.083,4 274,9 5,0 285,4 598,4
214,6 558,9
39,5
5,0
1.066,0 102,0 137,4 1.424,9 1.083,4 274,9
70,8
28,3 64,6 -461,4 -0,01 -3,4 -457,9 461,4
28,3 64,6 -461,4 -0,01 -3,4 -457,9 461,4
166,1 42,9 172,5 20,5 90,0
40,2 0,1 38,1 146,7
741,6 119,5 1.893,9 127,6 444,9 1.684,1 4,8 338,2 4,4 3,2 330,7 226,8 1.388,7
303,1 410,7
74,6 410,7
228,5
741,6 119,5 1.893,9 127,6 141,9 1.273,3 4,8 338,2 4,4 3,2 330,7 226,8 1.388,7
8,5 226,5 114,3 141,9 571,8 0,7 65,1 65,1 46,9 342,2
19,9 0,02 21,0
0,4 2,8 1,0 0,2 0,2 6,7
0,6 48,1 142,3 0,02 0,02 17,9 42,5
3,3 17,3 141,9 157,1 0,5 10,39 10,4 0,2 63,8
0,1 32,3 0,5 0,5 0,03 4,5
14,3 28,3 161,1 0,02 0,06 0,06 13,7 56,2
1,8 3,6 15,3 2,0 13,9
1,2 8,8 41,1 2,6 2,6 1,3 27,7
2,9 3,5 21,4 0,1 0,8 0,8 6,1 45,1
8,4 169,6 1,5 12,3 0,1 51,0 51,0 5,7 60,7
724,0 118,3 1.211,2 1,4 1,2 1,2 23,7
32,9 21,7
722,9 1.137,1 1,2 1,2
1,1 118,3
41,1 1,4
9,1 1,2 456,3 11,8 701,6 4,1 271,9 4,4 3,2 264,3 179,8 1.022,7
1,2 154,0 4,3 554,4 3,0 266,8 4,4 262,4 143,2 577,1
9,1 213,3 4,4 16,9 6,0

Tablica | Table 11.2.2. Energetska bilanca za 2009. godinu (Eurostat) | Energy Balance Table 2009 (Eurostat)
SVEU
KUPN
OTO
TAL
All P
rod.
Kam
eni u
glje
nHa
rd c
oal
Koks
Coke
Lign
it uk
upno
Tota
l lig
nite
Siro
va n
afta
Crud
e oi
l
Polu
proi
zvod
iFe
edst
ocks
Ukup
no d
er. n
afte
Tota
l pet
. pro
duct
s
Rafin
erijs
ki p
linRe
finer
y ga
s
Ukap
ljeni
plin
LPG
1000 ten 1000 toe
Primarna proizvodnja Primary production 4.056,5 820,8
Uvoz Imports 7.293,5 418,9 16,5 20,1 4.119,0 59,0 1.151,1 18,5
Saldo skladišta Stock change 206,1 50,4 1,4 -20,6 76,4 86,0 -2,0
Izvoz Exports 2.828,6 0,1 1.919,8 207,9
Bunker brodova Bunkers 6,8 6,8
Ukupna potrošnja Gross inland consumption 8.720,7 469,3 17,8 20,1 4.919,2 135,4 -689,5 -191,4
Energija za transformacije Transformation input 6.450,6 376,2 0,5 4.777,1 135,4 541,8 0,1 1,8
Javne termoelektrane Public thermal power stations 1.338,6 376,2 460,9
Samostalne termoelektrane Autoprod. thermal power stations 77,2 0,5 21,8 0,1
Gradske plinare Gas works 4,8 1,8 1,8
Rafinerije Refineries 4.944,7 4.777,1 135,4 32,2
Javne kotlovnice District heating plants 85,4 25,1
Proizvodnja transformirane energije Transformation output 5.711,8 4.922,0 232,2 330,8
Javne termoelektrane Public thermal power stations 681,2
Samostalne termoelektrane Autoprod. thermal power stations 34,5
Gradske plinare Gas works 4,7
Rafinerije Refineries 4.922,0 4.922,0 232,2 330,8
Javne kotlovnice District heating plants 69,3
Promjene i transferi, povrat Exchanges and transfers, returns 12,5 -142,1 154,7 66,3
Transferi među proizvodima Interproduct transfers 12,5 -142,1 154,7 66,3
Potrošnja energetike Consumption of the energy branch 792,9 509,7 232,1
Gubici distribucije Distribution losses 245,7
Neposredna potrošnja Available for final consumption 6.955,8 93,1 17,8 19,6 0,0 0,0 3.335,7 203,9
Neposredna neenergetska potrošnja Final non-energy consumption 601,7 260,9
Kemijska industrija Chemical industry 405,7 65,0
Ostali sektori Other sectors 195,9 195,9
Neposredna energetska potrošnja Final energy consumption 6.354,2 93,1 17,8 19,6 0,0 0,0 3.074,8 203,9
Industrija Industry 1.427,5 93,1 17,8 14,6 386,0 22,5
Industrija željeza i čelika Iron & steel industry 30,1 0,2 0,6 0,5 0,4
Industrija obojenih metala Non-ferrous metal industry 13,1 5,4 3,0
Kemijska industrija Chemical industry 231,9 23,3
Industrija stakla i građ. materijala Glass, pottery & building mat. ind. 417,5 92,6 12,7 0,0 123,9 6,4
Rudarstvo Ore-extraction industry 30,6 25,2 0,2
Industrija hrane, pića i cigareta Food, drink & tobacco industry 239,4 4,1 14,6 37,8 2,9
Industrija tekstila, kože i odjeće Textile, leather & clothing industry 34,1 5,1 0,2
Industrija papira i grafike Paper and printing industry 95,2 14,5 2,6
Strojogradnja i metalna industrija Engineering & other metal industry 77,2 0,3 0,3 10,1 3,6
Ostala industrija Other industries 258,4 140,1 3,1
Promet Transport 2.141,9 2.110,8 77,8
Željeznički promet Railways 49,8 29,1
Cestovni promet Road transport 1.939,8 1.931,6 77,8
Zračni promet Air transport 102,8 102,8
Pom. i riječni promet Inland navigation 47,3 47,3
Opća potrošnja Households, commerce, pub.aut. etc. 2.784,7 5,0 578,0 103,6
Kućanstva Households 1.810,1 3,2 248,7 87,1
Poljoprivreda Agriculture 250,0 228,1 3,1

Mot
orni
ben
zin
Mot
or s
pirit
Petr
olej
i m
laz.
gor
.Ke
rose
ns, j
et fu
els
Prim
arni
ben
zin
Naph
tha
Plin
sko
ulje
Gas
/ die
sel o
il
Loži
vo u
ljeRe
sidu
al fu
el o
il
Osta
li de
rivat
iOt
her p
et. p
rodu
cts
Priro
dni p
linNa
tura
l gas
Grad
ski p
linDe
rived
gas
Ukup
no O
IETo
tal R
ES
Sunč
eva
ener
gija
Sola
r hea
t
Geot
erm
alna
ene
r.Ge
othe
rmal
hea
t
Biom
asa
Biom
ass
Ener
gija
vje
tra
Win
d en
ergy
Vodn
e sn
age
Hydr
o en
ergy
Topl
insk
a en
ergi
jaDe
rived
hea
t
Elek
trič
na e
nerg
ijaEl
ectr
ical
ene
rgy
2.196,5 1.039,2 4,8 3,2 440,7 4,7 585,9
235,5 0,8 596,7 71,9 227,8 848,0 9,0 9,0 651,8
-17,7 4,3 3,1 20,5 65,6 12,3 12,4
765,6 0,8 150,4 308,1 322,5 164,5 653,6 91,7 91,7 163,3
1,4 5,4
-547,8 4,3 -147,3 307,7 -190,4 75,5 2.403,3 956,5 4,8 3,2 358,0 4,7 585,9 488,6
27,7 6,1 501,6 4,5 613,6 6,0 6,0
1,7 459,1 500,2 1,3 1,3
21,7 50,2 4,7 4,7
3,0
27,7 4,5
4,4 20,7 60,3
1.285,2 98,4 147,3 1.518,5 1.023,2 286,4 4,7 277,0 508,0
207,7 473,6
34,5
4,7
1.285,2 98,4 147,3 1.518,5 1.023,2 286,4
69,3
27,7 60,7 -590,6 -0,01 -4,7 -585,9 590,6
27,7 60,7 -590,6 -0,01 -4,7 -585,9 590,6
224,3 53,2 184,0 1,3 1,3 18,8 79,0
41,9 0,2 30,1 173,6
737,3 102,7 0,0 1.820,1 106,8 364,9 1.563,7 4,6 358,6 4,8 3,2 350,7 228,1 1.334,6
260,9 340,7
65,0 340,7
195,9
737,3 102,7 0,0 1.820,1 106,8 104,0 1.223,0 4,6 358,6 4,8 3,2 350,7 228,1 1.334,6
7,6 168,3 83,6 104,0 505,9 0,1 60,7 60,7 43,1 306,2
0,1 16,7 0,01 0,02 12,0
0,2 2,2 1,0 0,2 0,2 6,6
0,3 23,0 157,1 0,04 0,04 12,1 39,3
1,7 11,8 104,0 124,3 10,38 10,4 0,03 53,5
0,1 22,5 2,3 0,4 0,07 4,9
9,2 25,7 118,3 0,01 0,09 0,09 10,2 54,2
1,7 3,2 14,8 0,02 0,02 1,2 13,0
1,2 10,7 39,5 3,4 3,4 10,3 27,5
2,9 3,6 24,0 0,05 0,6 0,6 4,4 37,4
7,5 128,4 1,1 9,7 0,004 46,0 46,0 4,9 57,8
720,7 101,7 1.210,2 0,4 1,1 7,1 7,1 22,9
29,1 20,7
719,6 1.134,2 1,1 7,1 7,1
1,1 101,7
46,9 0,4
9,1 0,9 441,6 22,8 715,9 4,4 290,9 4,8 3,2 282,9 185,0 1.005,5
0,9 150,3 10,4 568,0 3,0 284,7 4,8 279,9 146,7 555,6
9,1 211,5 4,4 15,9 6,0


PRILOZI ANNEXES
XIIXII


279
ENERGY MMIXXI I ANNEXES
12.1. Ogrjevne vrijednosti i pretvorbeni faktori
Tablica | Table 12.1.1. Ogrjevne vrijednosti | Net calorific values
Jedinica | Unit kcal MJ kgoe kgce
Kameni ugljen Hard Coal kg 5 800-7 000 24,28-29,31 0,580-0,700 0,829-1,000
Kameni ug, za koksiranje Coking Coal kg 7 000 29,31 0,700 1,000
Mrki ugljen Brown Coal kg 4 000-4 600 16,75-19,26 0,400-0,460 0,571-0,657
Lignit Lignite kg 2 300-3 000 9,63-12,56 0,230-0,300 0,329-0,429
Koks Coke Oven Coke kg 6 300-7 000 26,38-29,31 0,630-0,700 0,900-1,000
Ogrjevno drvo Fuel Wood dm3 2 150 9,00 0,215 0,307
Biodizel Biodiesel kg 8 837 36,90 0,884 1,262
Bioetanol Bioethanol kg 6 370 26,67 0,637 0,910
Deponijski plin Landfill Gas m3 4 060 17,00 0,406 0,580
Bioplin Biogas m3 4 777 20,00 0,478 0,682
Prirodni plin Natural Gas m3 8 120-8 570 34-35,88 0,812-0,857 1,160-1,224
Sirova nafta Crude Oil kg 10 127 42,40 1,013 1,447
Ukapljeni plin Liquefied Petroleum Gases kg 11 200 46,89 1,120 1,600
Motorni benzin Motor Gasoline kg 10 650 44,59 1,065 1,521
Primarni benzin Naphtha kg 10 650 44,59 1,065 1,521
Petrolej Kerosene kg 10 500 43,96 1,050 1,500
Mlazno gorivo Jet Fuel kg 10 500 43,96 1,050 1,500
Ekstralako loživo ulje Light Heating Oil kg 10 200 42,71 1,020 1,457
Dizelsko gorivo Diesel Oil kg 10 200 42,71 1,020 1,457
Loživo ulje Fuel Oil kg 9 600 40,19 0,960 1,371
Naftni koks Petroleum Coke kg 7 400 31,0 0,740 1,057
Ostali derivati Other Products kg 8 000-9 600 33,49-40,19 0,800-0,960 1,143-1,371
Rafinerijski plin Refinery Gas kg 11 600 48,57 1,160 1,657
Etan Ethane kg 11 300 47,31 1,130 1,614
Koksni plin Coke Oven Gas m3 4 278 17,91 0,428 0,611
Gradski plin Gas Works Gas m3 6 630 27,76 0,663 0,947
Visokopećni plin Blast Furnace Gas m3 860 3,60 0,086 0,123
Električna energija Electricity kWh 860 3,60 0,086 0,123
Izvor | Source: EIHP kcal 1 000 kalorija 1 000 Calories
MJ 1 000 000 Joula 1 000 000 Joules
kgen (kgoe) 1 kg ekvivalentne nafte 1 kg of oil equivalent
kgeu (kgce) 1 kg ekvivalentnog ugljena 1 kg of coal equivalent
12.1 Net Calorifi c Values and Conversion Factors
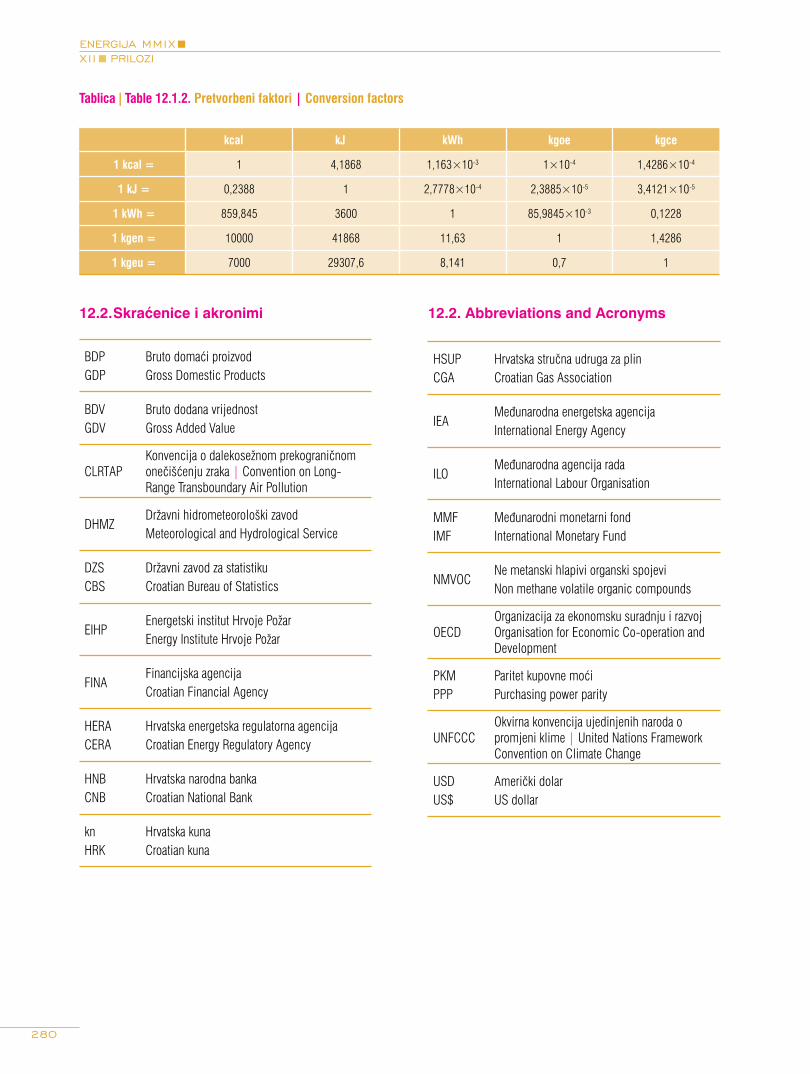
280
ENERGIJA MMIXXI I PRILOZI
12.2. Abbreviations and Acronyms
Tablica | Table 12.1.2. Pretvorbeni faktori | Conversion factors
kcal kJ kWh kgoe kgce
1 kcal = 1 4,1868 1,163×10-3 1×10⁻⁴ 1,4286×10⁻⁴
1 kJ = 0,2388 1 2,7778×10⁻⁴ 2,3885×10⁻⁵ 3,4121×10⁻⁵
1 kWh = 859,845 3600 1 85,9845×10⁻³ 0,1228
1 kgen = 10000 41868 11,63 1 1,4286
1 kgeu = 7000 29307,6 8,141 0,7 1
12.2. Skraćenice i akronimi
BDPGDP
Bruto domaći proizvodGross Domestic Products
BDVGDV
Bruto dodana vrijednostGross Added Value
CLRTAPKonvencija o dalekosežnom prekograničnom onečišćenju zraka | Convention on Long-Range Transboundary Air Pollution
DHMZDržavni hidrometeorološki zavod Meteorological and Hydrological Service
DZSCBS
Državni zavod za statistikuCroatian Bureau of Statistics
EIHPEnergetski institut Hrvoje PožarEnergy Institute Hrvoje Požar
FINAFinancijska agencijaCroatian Financial Agency
HERACERA
Hrvatska energetska regulatorna agencijaCroatian Energy Regulatory Agency
HNBCNB
Hrvatska narodna banka Croatian National Bank
knHRK
Hrvatska kunaCroatian kuna
HSUPCGA
Hrvatska stručna udruga za plinCroatian Gas Association
IEAMeđunarodna energetska agencija International Energy Agency
ILOMeđunarodna agencija radaInternational Labour Organisation
MMFIMF
Međunarodni monetarni fondInternational Monetary Fund
NMVOCNe metanski hlapivi organski spojeviNon methane volatile organic compounds
OECDOrganizacija za ekonomsku suradnju i razvoj Organisation for Economic Co-operation and Development
PKMPPP
Paritet kupovne moćiPurchasing power parity
UNFCCCOkvirna konvencija ujedinjenih naroda o promjeni klime | United Nations Framework Convention on Climate Change
USDUS$
Američki dolar US dollar

281
ENERGY MMIXXI I ANNEXES
12.3. Skraćenice naziva zemalja
Skraćenice zemalja prema ISO 3166-1-alpha-2 code ele-ments i odgovarajuća imena na hrvatskom i engleskom jeziku (ISO 3166-1) koje su korištene u publikaciji:
AL Albanija | Albania
AT Austrija | Austria
BA Bosna i Hercegovina | Bosnia and Herzegovina
BE Belgija | Belgium
BG Bugarska | Bulgaria
BY Bjelarus | Belarus
CH Švicarska | Switzerland
DE Njemačka | Germany
DK Danska | Denmark
CZ Češka Republika | Czech Republic
EE Estonija | Estonia
ES Španjolska | Spain
FI Finska | Finland
FR Francuska | France
GR Grčka | Greece
GB Ujedinjeno Kraljevstvo | United Kingdom
HR Hrvatska | Croatia
HU Mađarska | Hungary
IE Irska | Ireland
IS Island | Iceland
12.3 Offi cial short country names
Below are showed official short country names in Croatian and English (ISO 3166-1) and the corresponding ISO 3166-1-alpha-2 code elements used in the publication:
IT Italija | Italy
JP Japan | Japan
LT Litva | Lithuania
LU Luksemburg | Luxembourg
LV Latvija | Latvia
MD Moldavija | Moldova, Republic of
MK Makedonija | FYR Macedonia
NL Nizozemska | The Netherlands
NO Norveška | Norway
PL Poljska | Poland
PT Portugal | Portugal
RO Rumunjska | Romania
RU Ruska Federacija | Russian Federation
SI Slovenija | Slovenia
RS Srbija | Serbia
SE Švedska | Sweden
SK Slovačka | Slovakia
TR Turska | Turkey
UA Ukrajina | Ukraine
US Sjedinjene Američke Države | United States


IzdavačMinistarstvo gospodarstva, rada i poduzetništvaRepublike HrvatskeZagreb, Ulica grada Vukovara 78
Odgovorna osobaDarko Horvat, dipl. ing.
UredniciDr. sc. Goran GranićMr.sc. Sandra Antešević
AutoriDr.sc. Branko Vuk
Sara Vukman, dipl.oec.Marko Karan, dipl.oec.Mr.sc. Robert FabekDr.sc. Sanja ŽivkovićMr.sc. Mario MaričevićTomislav Baričević, dipl.ing.Mr.sc. Sandra Antešević Danica Maljković, dipl.ing.Mr.sc. Biljana KulišićDr.sc. Helena BožićŽeljka Hrs Borković, dipl.ing.Mr.sc. Vedran KrstulovićDino Novosel, dipl. ing.Mr.sc. Željko Jurić
Energetski institut Hrvoje PožarZagreb, Savska cesta 163
Lektura hrvatskog tekstaProf. Anita Filipović, dipl.bibl.
Dizajn i priprema za tisakDarko Juričić, dipl. diz.
Informatička podrškaFranjo Klečina, dipl.ing.
Energetski institut Hrvoje PožarZagreb, Savska cesta 163
Engleski prijevod i lekturaDavorka ZmijarevićAgena Mark, Zagreb
TisakAZP Grafis, Samobor
Autorska pravaMinistarstvo gospodarstva, rada i poduzetništvaRepublike HrvatskeZagreb, Ulica grada Vukovara 78
Naklada1 500 primjeraka
Publisher Ministry of Economy, Labour and EntrepreneurshipRepublic of CroatiaZagreb, Ulica grada Vukovara 78
Responsible personDarko Horvat B. Sc.
EditorsGoran Granić, Ph.D.Sandra Antešević, M.Sc.
AuthorsBranko Vuk, Ph.D.
Sara Vukman, B.Sc.Econ.Marko Karan, B.Sc.Econ.Robert Fabek, M.Sc.Sanja Živković, Ph.D.Mario Maričević, M.Sc.Tomislav Baričević, B.Sc.E.E.Sandra Antešević, M.Sc. Danica Maljković, M.M.Eng.Biljana Kulišić, M.Sc.Helena Božić, Ph.D.Željka Hrs Borković, B.Sc.Arch.E.Vedran Krstulović, M.Sc.Dino Novosel, B.Sc.M.E. Željko Jurić, M.Sc.
Energy Institute Hrvoje PožarZagreb, Savska cesta 163
Croatian language editingAnita Filipović, B.A.
Design and prepressDarko Juričić, B.A.
IT supportFranjo Klečina, B.Sc.E. E.
Energy Institute Hrvoje PožarZagreb, Savska cesta 163
English translation and editingDavorka ZmijarevićAgena Mark, Zagreb
PressAZP Grafis, Samobor
CopyrightMinistry of Economy, Labour and EntrepreneurshipRepublic of CroatiaZagreb, Ulica grada Vukovara 78
Edition1 500 copies