Mix It to Fix It: Emotion Regulation Variability in Daily Life - KU ...
13
Mix It to Fix It: Emotion Regulation Variability in Daily Life Elisabeth S. Blanke Humboldt-Universität zu Berlin Annette Brose Humboldt-Universität zu Berlin and KU Leuven Elise K. Kalokerinos University of Newcastle Yasemin Erbas KU Leuven Michaela Riediger Freie Universität Berlin and Max Planck Institute for Human Development, Berlin Peter Kuppens KU Leuven Emotion regulation (ER) strategies are often categorized as universally adaptive or maladaptive. How- ever, it has recently been proposed that this view is overly simplistic: instead, adaptive ER involves applying strategies variably to meet contextual demands. Using data from four experience-sampling studies (Ns 70, 95, 200, and 179), we tested the relationship between ER variability and negative affect (NA) in everyday life. The constantly changing demands of daily life provide a more ecologically valid context in which to test the role of variability. We calculated 2 global indicators of variability: within-strategy variability (of particular strategies across time) and between-strategy variability (across strategies at one time-point). Associations between within-strategy variability and NA were inconsistent. In contrast, when controlling for mean strategy endorsement, between-strategy variability was associated with reduced NA across both individuals and measurement occasions. This is the first evidence that variably choosing between different strategies within a situation may be adaptive in daily life. Keywords: emotion regulation, variability, flexibility, experience sampling In daily life, situations and emotions change dynamically, and the ability to respond flexibly to these changes has been proposed as an essential building block for psychological health (Hollen- stein, Lichtwarck-Aschoff, & Potworowski, 2013; Kashdan & Rottenberg, 2010). In response to these dynamic emotions and situations, people use strategies to influence their emotions, a process that is called emotion regulation (ER; Gross, 1998). Inef- fective ER is a risk factor for both psychological (e.g., Aldao & Nolen-Hoeksema, 2010) and physical problems (e.g., cardiovas- cular diseases; Appleton & Kubzansky, 2014). Much of the past This article was published Online First February 4, 2019. Elisabeth S. Blanke, Institute of Psychology, Humboldt-Universität zu Berlin; Annette Brose, Institute of Psychology, Humboldt-Universität zu Berlin, and Faculty of Psychology and Educational Sciences, KU Leuven; Elise K. Kalokerinos, School of Psychology, University of Newcastle; Yasemin Erbas, Faculty of Psychology and Educational Sciences, KU Leuven; Michaela Riediger, Heisenberg Research Group Socio-emotional Development and Health Across the Lifespan, Freie Universität Berlin, and Max Planck Institute for Human Development, Berlin; Peter Kuppens, Faculty of Psychology and Educational Sciences, KU Leuven. Michaela Riediger is now at the Institute for Psychology, University of Jena. We thank our student research assistants and interns for their help with the data collection. We would also like to express our gratitude to our participants. The research leading to the results reported in this article was supported in part by a grant awarded to Annette Brose by the German Research Foundation [Deutsche Forschungsgemeinschaft, DFG], BR 3782/3-1, as well as by the Research Fund of KU Leuven (GOA/15/003). Elise K. Kalokerinos was supported by a Marie Sklodowska-Curie individual fel- lowship (704298) under the European Union’s Horizon 2020 research and innovation programme. Elise K. Kalokerinos is now supported by an Australian Research Council Discovery Early Career Researcher Award (DE180100352). Yasemin Erbas was supported by a postdoctoral fellow- ship from the Flemish Fund for Scientific Research (FWO). Michaela Riediger was supported by a Heisenberg stipend of the German Research Foundation [Deutsche Forschungsgemeinschaft, DFG], RI 1797/3-1. This is a study containing multiple data sets from different laboratories. Results from these datasets were previously published to test different research questions. A list of the publications pertaining to each data set is provided in the Method section of the manuscript. We report how we determined our sample sizes, all exclusions of participants, and all mea- sures as relevant for the research questions. There were no manipulations. Results reported in this article were previously presented as a flash talk at the 2017 Annual Conference of the Society for Affective Science in Boston, Massachusetts. Correspondence concerning this article should be addressed to Elisabeth S. Blanke, Institut für Psychologie, Humboldt-Universität zu Berlin, Unter den Linden 6, 10099 Berlin, Germany. E-mail: elisabeth.blanke@hu- berlin.de This document is copyrighted by the American Psychological Association or one of its allied publishers. This article is intended solely for the personal use of the individual user and is not to be disseminated broadly. Emotion © 2019 American Psychological Association 2020, Vol. 20, No. 3, 473– 485 1528-3542/20/$12.00 http://dx.doi.org/10.1037/emo0000566 473
-
Upload
khangminh22 -
Category
Documents
-
view
2 -
download
0
Transcript of Mix It to Fix It: Emotion Regulation Variability in Daily Life - KU ...

Mix It to Fix It: Emotion Regulation Variability in Daily Life
Elisabeth S. BlankeHumboldt-Universität zu Berlin
Annette BroseHumboldt-Universität zu Berlin and KU Leuven
Elise K. KalokerinosUniversity of Newcastle
Yasemin ErbasKU Leuven
Michaela RiedigerFreie Universität Berlin and Max Planck Institute for Human
Development, Berlin
Peter KuppensKU Leuven
Emotion regulation (ER) strategies are often categorized as universally adaptive or maladaptive. How-ever, it has recently been proposed that this view is overly simplistic: instead, adaptive ER involvesapplying strategies variably to meet contextual demands. Using data from four experience-samplingstudies (Ns � 70, 95, 200, and 179), we tested the relationship between ER variability and negative affect(NA) in everyday life. The constantly changing demands of daily life provide a more ecologically validcontext in which to test the role of variability. We calculated 2 global indicators of variability:within-strategy variability (of particular strategies across time) and between-strategy variability (acrossstrategies at one time-point). Associations between within-strategy variability and NA were inconsistent.In contrast, when controlling for mean strategy endorsement, between-strategy variability was associatedwith reduced NA across both individuals and measurement occasions. This is the first evidence thatvariably choosing between different strategies within a situation may be adaptive in daily life.
Keywords: emotion regulation, variability, flexibility, experience sampling
In daily life, situations and emotions change dynamically, andthe ability to respond flexibly to these changes has been proposedas an essential building block for psychological health (Hollen-stein, Lichtwarck-Aschoff, & Potworowski, 2013; Kashdan &Rottenberg, 2010). In response to these dynamic emotions and
situations, people use strategies to influence their emotions, aprocess that is called emotion regulation (ER; Gross, 1998). Inef-fective ER is a risk factor for both psychological (e.g., Aldao &Nolen-Hoeksema, 2010) and physical problems (e.g., cardiovas-cular diseases; Appleton & Kubzansky, 2014). Much of the past
This article was published Online First February 4, 2019.Elisabeth S. Blanke, Institute of Psychology, Humboldt-Universität zu
Berlin; Annette Brose, Institute of Psychology, Humboldt-Universität zuBerlin, and Faculty of Psychology and Educational Sciences, KU Leuven;Elise K. Kalokerinos, School of Psychology, University of Newcastle;Yasemin Erbas, Faculty of Psychology and Educational Sciences, KULeuven; Michaela Riediger, Heisenberg Research Group Socio-emotionalDevelopment and Health Across the Lifespan, Freie Universität Berlin, andMax Planck Institute for Human Development, Berlin; Peter Kuppens,Faculty of Psychology and Educational Sciences, KU Leuven.
Michaela Riediger is now at the Institute for Psychology, University ofJena.
We thank our student research assistants and interns for their help withthe data collection. We would also like to express our gratitude to ourparticipants.
The research leading to the results reported in this article was supportedin part by a grant awarded to Annette Brose by the German ResearchFoundation [Deutsche Forschungsgemeinschaft, DFG], BR 3782/3-1, aswell as by the Research Fund of KU Leuven (GOA/15/003). Elise K.Kalokerinos was supported by a Marie Skłodowska-Curie individual fel-
lowship (704298) under the European Union’s Horizon 2020 research andinnovation programme. Elise K. Kalokerinos is now supported by anAustralian Research Council Discovery Early Career Researcher Award(DE180100352). Yasemin Erbas was supported by a postdoctoral fellow-ship from the Flemish Fund for Scientific Research (FWO). MichaelaRiediger was supported by a Heisenberg stipend of the German ResearchFoundation [Deutsche Forschungsgemeinschaft, DFG], RI 1797/3-1.
This is a study containing multiple data sets from different laboratories.Results from these datasets were previously published to test differentresearch questions. A list of the publications pertaining to each data set isprovided in the Method section of the manuscript. We report how wedetermined our sample sizes, all exclusions of participants, and all mea-sures as relevant for the research questions. There were no manipulations.Results reported in this article were previously presented as a flash talk atthe 2017 Annual Conference of the Society for Affective Science inBoston, Massachusetts.
Correspondence concerning this article should be addressed to ElisabethS. Blanke, Institut für Psychologie, Humboldt-Universität zu Berlin, Unterden Linden 6, 10099 Berlin, Germany. E-mail: [email protected]
Thi
sdo
cum
ent
isco
pyri
ghte
dby
the
Am
eric
anPs
ycho
logi
cal
Ass
ocia
tion
oron
eof
itsal
lied
publ
ishe
rs.
Thi
sar
ticle
isin
tend
edso
lely
for
the
pers
onal
use
ofth
ein
divi
dual
user
and
isno
tto
bedi
ssem
inat
edbr
oadl
y.
Emotion© 2019 American Psychological Association 2020, Vol. 20, No. 3, 473–4851528-3542/20/$12.00 http://dx.doi.org/10.1037/emo0000566
473
research investigated how effective different ER strategies are inaltering feelings, outward expressions, and physiological pro-cesses, or their cognitive or interpersonal costs (e.g., Gross, 2002).Based on the results of this work, strategies have been character-ized as either adaptive (e.g., the reinterpretation of emotionalstimuli referred to as reappraisal) or maladaptive (e.g., expressivesuppression).
More recently, in line with work emphasizing the benefits ofpsychological flexibility, it has been proposed that this character-ization of strategies is a fallacy (Bonanno & Burton, 2013). Con-temporary ER theory suggests that effective ER does not involveinflexibly using the same “adaptive” strategy. Instead, it is not onlyimportant how people regulate their emotions, but also how vari-ably or flexibly they choose ER strategies in response to situationaldemands. Yet, to date available empirical evidence for this prop-osition is limited for two primary reasons: First, different studieshave used diverging operationalizations of ER variability andflexibility. And second, most of the existing research has beenconducted in the laboratory. Following recommendations by Al-dao, Sheppes, and Gross (2015), we addressed these two issues inthe present research: We used experience-sampling data from fourstudies obtained in daily life (in Belgium and Germany) andinvestigated the adaptiveness of two global indicators of ER vari-ability.
Aldao et al. (2015) suggested that ER variability is a superor-dinate construct that encompasses flexibility: Flexibility occurswhen variability is synchronized with situational changes in a waythat is congruent with an individual’s goals. They proposed thatvariability can be divided into within-strategy variability andbetween-strategy variability. Within-strategy variability is the vari-ation in the intensity of usage of single strategies over differentcontexts and time. More precisely, within-strategy variability oc-curs when a person uses strategies in some occasions, but not inothers. Between-strategy variability refers to the selection of par-ticular strategies from a pool of strategies at one moment in time,possibly reflecting a search for the best strategy, or a prioritizationof certain strategies in accordance with contextual demands. Highbetween-strategy variability indicates that an individual neithertries to use all strategies simultaneously to a similar extent norstrongly prioritizes only one strategy but chooses few strategiesand uses these.
Research examining within-strategy variability, operationalizedas the self-reported ability to flexibly use different ER (or coping)1
strategies across situations, has demonstrated that it is associatedwith positive adjustment (Bonanno, Pat-Horenczyk, & Noll, 2011;Cheng, 2001; Kato, 2012). Relatedly, laboratory work has alsodemonstrated that the ability to variably modulate emotional ex-pressiveness is associated with positive long-term outcomes (Bo-nanno, Papa, Lalande, Westphal, & Coifman, 2004). Aldao andNolen-Hoeksema (2012) showed that, for two types of strategies(acceptance and problem-solving, but not the other strategies stud-ied), within-strategy variability was associated with lower levels ofpsychopathology. Furthermore, Troy, Shallcross, and Mauss(2013) demonstrated that reappraisal, a putatively adaptive strat-egy, was not adaptive in controllable situations. Research onbetween-strategy variability is scarce, but in a study by Birk andBonanno (2016), the ability to flexibly switch from a suboptimal toan optimal strategy was associated with higher satisfaction withlife.
Thus, an emerging body of lab work suggests that differentforms of ER variability may be adaptive. However, lab researchsuffers from some important limitations, particularly when appliedto the study of variability. First, studies of self-reported flexibilitymay not be reflective of actual everyday behavior because ofmemory biases (e.g., Bolger, Davis, & Rafaeli, 2003). Second, theability to display flexible ER strategy use in the laboratory may nottranslate outside the lab, where demands and situations are con-stantly changing on different dimensions (such as controllability,sociality, or importance). Relatedly, there are nonemotional (neu-tral) situations in daily life that may not warrant any regulation atall. In daily life, individuals thus need to identify situations inwhich regulation is warranted, and then choose an appropriatestrategy, whereas in laboratory experiments, they usually onlyneed to choose a strategy. To get a clear picture of the functionalityof variability, it is therefore necessary to measure people at manydifferent time-points in changing environments. To address theseissues, Aldao et al. (2015) suggested that the experience-samplingmethod (ESM) could provide an ideal lens through which to studyER variability.
Preliminary evidence from ESM and diary studies suggests thatwithin-strategy variability is indeed adaptive. In a diary study byCheng (2001), flexible coping was determined using hierarchicalcluster analysis. The flexible coping group consisted of partici-pants who reported high variability in problem-focused andemotion-focused coping over time, as well as high variability inwhether situations were perceived as controllable or uncontrolla-ble. Compared to other clusters, this group had the lowest depres-sion scores, and also scored favorably in other domains. A recentESM study (Haines et al., 2016) replicated the finding from thelaboratory study by Troy et al. (2013; see above) in daily lifeshowing that the use of reappraisal is adaptive when a situation isperceived as uncontrollable, but not when it is perceived as con-trollable.
However, this small body of research is thus far inconclusive, asthese studies focus only on the variability of one or two strategies(e.g., reappraisal), and often use retrospective reports (diary stud-ies). This single-strategy focus makes it impossible to test the roleof between-strategy variability. Thus, to the best of our knowledge,no ESM study has been published to date that has systematicallyinvestigated the adaptiveness of within- and between-strategy vari-ability in daily life. One recent study has looked at age differencesin emotion regulation variability, using a daily diary approach, butdid not focus on adaptiveness (Eldesouky & English, 2018).
To summarize, strong and consistent evidence supporting thepresumably adaptive nature of ER variability and flexibility—oneof the central propositions of modern ER theory—is thus farlacking. Previous research was primarily conducted in the lab,which provides only a small window to examine variability inlimited context, without the many time-points necessary to studyeveryday variability. In addition, the few studies conducted outsidethe lab have focused on only one or two strategies, meaning thatthe role of between-strategy variability has not been tested.
1 Coping usually refers to the downregulation of NA or stress, whereasER also considers processes such as the maintenance or upregulation ofpositive affect (Gross, 1998). In the following, we do not differentiatebetween literature on ER and coping.
Thi
sdo
cum
ent
isco
pyri
ghte
dby
the
Am
eric
anPs
ycho
logi
cal
Ass
ocia
tion
oron
eof
itsal
lied
publ
ishe
rs.
Thi
sar
ticle
isin
tend
edso
lely
for
the
pers
onal
use
ofth
ein
divi
dual
user
and
isno
tto
bedi
ssem
inat
edbr
oadl
y.
474 BLANKE ET AL.
To address these issues, we used preexisting ESM data fromfour studies that assessed different emotion regulation strategies indaily life. Because these studies were not designed for the inves-tigation of ER flexibility, we focused on ER variability in thecurrent research. As proposed by Aldao et al. (2015), we usedstandard deviations (SDs) as indicators of variability. We hypoth-esized that, on average, greater ER variability would be adaptive,as ER variability is necessary (though not sufficient) for flexibility.We investigated whether ER variability relates to lower levels ofnegative affect (NA). We chose NA as our key dependent variablebecause people are usually motivated to experience low levels ofNA (Riediger, Schmiedek, Wagner, & Lindenberger, 2009). Wethus hypothesized that greater ER variability would be associatedwith lower NA, and interpreted associations between variabilityand reduced NA as adaptive regulation.
We analyzed between-strategy and within-strategy variability asperson-level characteristics. More precisely, we had one value forbetween-strategy variability for each occasion (i.e., state informa-tion), and this was averaged across occasions to obtain a person-level characteristic. For within-strategy variability, we observedstate information on strategy use at each occasion. For each strat-egy, the distribution of these observations provided a basis toestimate the standard deviation. These within-strategy SDs foreach strategy were then averaged across strategies to obtain aperson-level indicator of participants’ average within-strategyvariability.
We were also interested in how time-varying aspects ofbetween-strategy variability (i.e., state variance components) co-varied with NA across time. For analyses, we used the time seriesof between-strategy variability values. For between-strategy vari-ability, we thus examined our hypothesis at both the between- andwithin-person level (i.e., on average and at the level of within-person dynamics). In sum, we expected that individuals who showgreater ER variability on average (between- and within-strategyvariability) would report lower NA across the measurement period.Furthermore, we expected that occasions at which individualsprioritize some strategies (i.e., show more between-strategy vari-ability) are occasions at which they experience lower levels of NA.
We expected ER variability only to be adaptive when we con-trolled for mean strategy endorsement (for a similar approach, see,e.g., Koval, Pe, Meers, & Kuppens, 2013). High ER strategyendorsement has been related to unfavorable outcomes, includinggreater NA (e.g., Dixon-Gordon, Aldao, & De Los Reyes, 2015),possibly because of failed regulation efforts (Aldao & Nolen-Hoeksema, 2013). However, it is not possible to have high levelsof variability at very low or very high levels of mean strategyendorsement. This means that variability (as assessed with the SD)can be confounded with mean strategy endorsement. We thereforeseparate the effect of mean ER endorsement from the effect ofvariability in our prediction and analyses.
Given that we used preexisting data that were not initiallydesigned to answer our research questions and hypotheses, weconsider this work to be a first step in the investigation of theadaptiveness of ER variability. Thus, despite our hypotheses, thiswork is somewhat exploratory in nature. The use of four studiesallowed us to apply meta-analytic tools to determine whether andto what extent ER variability may be adaptive for reducing NA.
Method
Participants and Procedure
All data sets reported here were parts of larger studies. Toanswer our present research questions, we used meta-analytictechniques to get an overall estimate of the effect sizes. Samplesizes for each individual study were determined by each respectiveprincipal investigator before data collection on the basis of previ-ous experiences with experience-sampling. There was no optionalstopping in any of the studies. In Study 3, the sample size wasdetermined to detect small to medium effects (r � .30, � � .05).
The items used in the four studies and the data for Studies 1–3 areavailable on the Open Science Framework. The release of data fromStudy 4 to the public is regulated by contract and will happen afterdata collection for this longitudinal study is finished. The OpenScience Framework (OSF) data is available here: https://osf.io/mxjfh/?view_only�5118406e8780402c8230a278eea0a502
Study 1. This convenience sample consisted of 70 studentsfrom various disciplines (n � 35 female) aged between 20 and 30years (M � 25.55, SD � 2.74 years; see Blanke & Brose, 2017;Blanke, Riediger, & Brose, 2018). They were recruited via posters,online advertisement, and university mailing lists in the Berlinarea, Germany. The participants took part in two laboratory ses-sions, with the ESM phase falling in between sessions. In the twosessions, they gave informed consent to participate, and filled outquestionnaires including a German version of the Center for Epi-demiologic Studies Depression Scale (CES-D; Radloff, 1977; Ger-man version by Hautzinger & Bailer, 1993). They received smart-phones (Huawei Ascend G330), which were programmed with anESM technology that was developed and applied in previousstudies (e.g., Rauers, Blanke, & Riediger, 2013; Riediger et al.,2009). The ESM phase started the following day and lasted ninedays, during which six ESM prompts (beeps) occurred semiran-domly each day in a fixed 12-hr time frame (selected by theparticipants). The students were given the opportunity to prolongthe study by up to three days if they missed more than oneassessment a day. They received a fixed reimbursement for thelaboratory sessions and an additional reimbursement according tothe number of ESM questionnaires they had completed with abonus of 10 Euros for 45 or more completed beeps; however, itwas communicated to the participants that we aimed for 54 an-swered beeps (9 days Times 6 beeps). Participants answered 54.41beeps on average (SD � 3.25; range: 48–65). Due to the extradays, participants were able to answer more than the target of 54beeps. However, if 54 beeps or more are considered a response rateof 100%, the average response rate was 98.3% (SD � 2.7%, range89–100%). For the present analyses, no participant was excludedfrom this sample. In total, participants received 65 Euros onaverage. The ethics committee of the Humboldt-Universität zuBerlin approved of the study.
Study 2. The final sample consisted of 95 undergraduatestudents (n � 59 female) aged between 18 and 24 years (M �19.06, SD � 1.28 years). They were recruited from a pool of 439undergraduates at the University of Leuven, Belgium, who com-pleted a Dutch translation of the CES-D, and who were selected tomaximize variation in depression scores (for a more detaileddescription, see Study 2 in Brans, Koval, Verduyn, Lim, & Kup-pens, 2013; for other publications with this data, see Erbas, Ceule-
Thi
sdo
cum
ent
isco
pyri
ghte
dby
the
Am
eric
anPs
ycho
logi
cal
Ass
ocia
tion
oron
eof
itsal
lied
publ
ishe
rs.
Thi
sar
ticle
isin
tend
edso
lely
for
the
pers
onal
use
ofth
ein
divi
dual
user
and
isno
tto
bedi
ssem
inat
edbr
oadl
y.
475EMOTION REGULATION VARIABILITY IN DAILY LIFE
mans, Koval, & Kuppens, 2015; Koval, Ogrinz, Kuppens, Van denBergh, Tuerlinckx, & Sütterlin, 2013; Koval, Pe, et al., 2013; Pe,Koval, & Kuppens, 2013). As participants in psychological studiesoften report relatively low levels of depressive symptoms, partic-ipants were selected to also represent higher depression levels. Theparticipants took part in an introductory session in the laboratory,in which they gave informed consent to participate, filled outquestionnaires, and received palmtops (Tungsten E2 PalmOne,Mankato, MN), which were programmed with the Experience-Sampling Program (Barrett & Barrett, 2000). The ESM phasestarted the following day and lasted 7 days, during which 10 beepsoccurred semirandomly each day in a 12-hr time frame. Partici-pants answered 91.5% of the beeps (SD � 6.2%, range: 67–100%of all beeps). From the initial sample (N � 100), one participantwithdrew from the study, and four participants were excluded fromdata analysis after data collection because of equipment malfunc-tion (n � 3), and poor compliance (n � 1; � 40% missing data;see Brans et al., 2013). The students were reimbursed with 70Euros for the entire study. The ethics committee of the Universityof Leuven approved of the study.
Study 3. The final sample consisted of 200 first-year students(n � 110 female) aged between 17 and 24 years (M � 18.32, SD �0.96 years). The majority of the participants were recruited from apool of 686 undergraduates at the University of Leuven, Belgium,who completed a Dutch translation of the CES-D. Like in Study 2,individuals were selected to maximize variation in depressionscores (for a more detailed description, see Koval et al., 2015; thissample was Wave 1 of a longitudinal study; for other publicationswith this data, see Bastian, Koval, Erbas, Houben, Pe, & Kuppens,2015; Brose, Wichers, & Kuppens, 2017; Dejonckheere et al.,2018; Erbas et al., 2018; Pe, Brose, Gotlib, & Kuppens, 2016; Pe,Koval, Houben, Erbas, Champagne, & Kuppens, 2015).
The participants took part in an introductory session in thelaboratory, in which they gave informed consent to participate,filled out questionnaires, and received smartphones (MotorolaDefy Plus), which were programmed with custom-built software.The ESM phase started the following day and lasted 7 days, duringwhich 10 beeps occurred semirandomly each day in a 12-hr timeframe (10 a.m. to 10 p.m.). Participants answered 87.27% of thebeeps on average (SD � 9.05%, range: 55–100% of all beeps). Thetarget sample size was 200; two participants were oversampled,but later excluded from the initial sample (N � 202) because theyanswered less than 50% of the beeps (see Koval et al., 2015). Thestudents were reimbursed with 60 Euros for their participation inthis wave of the study. The ethics committee of the University ofLeuven approved of the study.
Study 4. The sample consisted of 179 adults (n � 94 female)aged between 38 and 61 years (M � 50.93, SD � 5.76 years).Participants came from the innovation sample of the GermanSocio-Economic Panel (SOEP-IS), a longitudinal survey in whichparticipants are visited yearly in their private households in Ger-many (Richter & Schupp, 2015). Participants from the SOEP-ISbetween 38 and 61 years of age were contacted and invited toparticipate in our psychological study if they had participated inthe panel for at least two waves of data collection, and if theyparticipated in 2014. This sample was Wave 1 of a longitudinalstudy.
For the introductory session, participants were visited at theirhomes by interviewers from the Humboldt-Universität zu Berlin.
They gave informed consent to participate, filled out question-naires including a 10-item short version of the German CES-D(Irwin, Artin, & Oxman, 1999; German translation by Hautzinger& Bailer, 1993). Participants received smartphones (Huawei As-cend G330), which were programmed with the same program usedin Study 1 with one difference: starting the day after the visit, theESM phase included three assessment phases of four samplingdays, which were followed by four pause days. If participantsmissed more than one assessment a day, they had the opportunityto prolong each assessment wave by up to 2 days (leaving only 2pause days). The target sample size was n � 180. When datacollection was finished, we realized that one participant did notmeet the inclusion criteria. This participant was not considered tobe part of the sample and was thus excluded. Participants werereimbursed with 20 Euros for the session and 60 Euros for partic-ipation in the ESM. Participants were told that their target was 60beeps, and they received a bonus of 10 Euros if they completed60 beeps or more. Participants were able to answer more than the60 beep target, and answered 69.33 beeps on average (SD � 7.59,range: 30–85). However, if 60 beeps or more are considered aresponse rate of 100%, the average response rate was 98.7%(SD � 7.1%, range 50–100%). The ethics committee of theHumboldt-Universität zu Berlin approved of the study.
Measures
All four studies assessed various ER strategies at each beep(ESM), NA at each beep (ESM), and as depressive symptoms once(before the ESM phase). As reported in Table 1, the four studiesused different items to assess these constructs. The studies that weused to address our research questions were not collected forthe purpose of investigating ER variability. Thus, the studiesfeature different NA items and ER strategies, and the assessmentswere not aiming to be comprehensive. However, differences be-tween the studies should not be problematic for our researchquestions, as the principle of ER variability is not linked to specificstrategies. In addition, replicating findings across different sets ofitems and strategies would support the robustness of our conclu-sions.
In Studies 1 and 4, we selected NA items from the well-knownPANAS scales (Watson, Clark, & Tellegen, 1988) that showedsufficient variability in previous studies with intense longitudinaldesigns (Study 1: nervous, distressed; Study 4: nervous, distressed,jittery, upset; Röcke, Li, & Smith, 2009). We also added the itemdownhearted to capture sad/depressed mood, and because this itemhas been used successfully to assess this construct in Germanexperience sampling studies (e.g., Riediger et al., 2009). In Studies2 and 3, we selected NA items based on Russell’s core affectmodel (Russell, 2003). Items were selected to measure low arousalnegative emotion (sad, depressed) and high arousal negative emo-tion (anxious, angry). The high arousal item angry was alsoassessed in Study 4.
Items that measured ER strategies were selected to fit therationale of the studies. For example, Study 1 was primarilydesigned to measure mindfulness. As one of the main componentsof mindfulness is attention to the present moment, we selected ERstrategies that also focused on attentional deployment. In the otherstudies, we selected well-researched strategies from differentstages of the process model of emotion regulation (Gross, 1998):
Thi
sdo
cum
ent
isco
pyri
ghte
dby
the
Am
eric
anPs
ycho
logi
cal
Ass
ocia
tion
oron
eof
itsal
lied
publ
ishe
rs.
Thi
sar
ticle
isin
tend
edso
lely
for
the
pers
onal
use
ofth
ein
divi
dual
user
and
isno
tto
bedi
ssem
inat
edbr
oadl
y.
476 BLANKE ET AL.
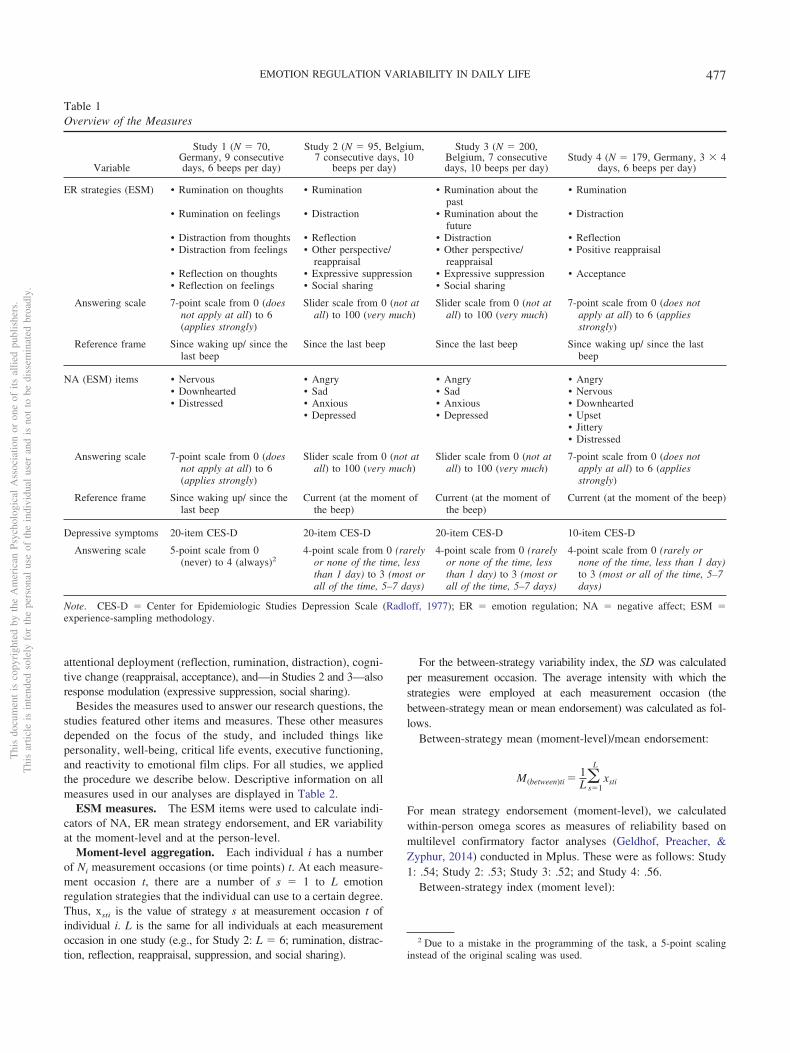
attentional deployment (reflection, rumination, distraction), cogni-tive change (reappraisal, acceptance), and—in Studies 2 and 3—alsoresponse modulation (expressive suppression, social sharing).
Besides the measures used to answer our research questions, thestudies featured other items and measures. These other measuresdepended on the focus of the study, and included things likepersonality, well-being, critical life events, executive functioning,and reactivity to emotional film clips. For all studies, we appliedthe procedure we describe below. Descriptive information on allmeasures used in our analyses are displayed in Table 2.
ESM measures. The ESM items were used to calculate indi-cators of NA, ER mean strategy endorsement, and ER variabilityat the moment-level and at the person-level.
Moment-level aggregation. Each individual i has a numberof Ni measurement occasions (or time points) t. At each measure-ment occasion t, there are a number of s � 1 to L emotionregulation strategies that the individual can use to a certain degree.Thus, xsti is the value of strategy s at measurement occasion t ofindividual i. L is the same for all individuals at each measurementoccasion in one study (e.g., for Study 2: L � 6; rumination, distrac-tion, reflection, reappraisal, suppression, and social sharing).
For the between-strategy variability index, the SD was calculatedper measurement occasion. The average intensity with which thestrategies were employed at each measurement occasion (thebetween-strategy mean or mean endorsement) was calculated as fol-lows.
Between-strategy mean (moment-level)/mean endorsement:
M(between)ti � 1L�
s�1
L
xsti
For mean strategy endorsement (moment-level), we calculatedwithin-person omega scores as measures of reliability based onmultilevel confirmatory factor analyses (Geldhof, Preacher, &Zyphur, 2014) conducted in Mplus. These were as follows: Study1: .54; Study 2: .53; Study 3: .52; and Study 4: .56.
Between-strategy index (moment level):
2 Due to a mistake in the programming of the task, a 5-point scalinginstead of the original scaling was used.
Table 1Overview of the Measures
Variable
Study 1 (N � 70,Germany, 9 consecutivedays, 6 beeps per day)
Study 2 (N � 95, Belgium,7 consecutive days, 10
beeps per day)
Study 3 (N � 200,Belgium, 7 consecutivedays, 10 beeps per day)
Study 4 (N � 179, Germany, 3 � 4days, 6 beeps per day)
ER strategies (ESM) • Rumination on thoughts • Rumination • Rumination about thepast
• Rumination
• Rumination on feelings • Distraction • Rumination about thefuture
• Distraction
• Distraction from thoughts • Reflection • Distraction • Reflection• Distraction from feelings • Other perspective/
reappraisal• Other perspective/
reappraisal• Positive reappraisal
• Reflection on thoughts • Expressive suppression • Expressive suppression • Acceptance• Reflection on feelings • Social sharing • Social sharing
Answering scale 7-point scale from 0 (doesnot apply at all) to 6(applies strongly)
Slider scale from 0 (not atall) to 100 (very much)
Slider scale from 0 (not atall) to 100 (very much)
7-point scale from 0 (does notapply at all) to 6 (appliesstrongly)
Reference frame Since waking up/ since thelast beep
Since the last beep Since the last beep Since waking up/ since the lastbeep
NA (ESM) items • Nervous • Angry • Angry • Angry• Downhearted • Sad • Sad • Nervous• Distressed • Anxious • Anxious • Downhearted
• Depressed • Depressed • Upset• Jittery• Distressed
Answering scale 7-point scale from 0 (doesnot apply at all) to 6(applies strongly)
Slider scale from 0 (not atall) to 100 (very much)
Slider scale from 0 (not atall) to 100 (very much)
7-point scale from 0 (does notapply at all) to 6 (appliesstrongly)
Reference frame Since waking up/ since thelast beep
Current (at the moment ofthe beep)
Current (at the moment ofthe beep)
Current (at the moment of the beep)
Depressive symptoms 20-item CES-D 20-item CES-D 20-item CES-D 10-item CES-D
Answering scale 5-point scale from 0(never) to 4 (always)2
4-point scale from 0 (rarelyor none of the time, lessthan 1 day) to 3 (most orall of the time, 5–7 days)
4-point scale from 0 (rarelyor none of the time, lessthan 1 day) to 3 (most orall of the time, 5–7 days)
4-point scale from 0 (rarely ornone of the time, less than 1 day)to 3 (most or all of the time, 5–7days)
Note. CES-D � Center for Epidemiologic Studies Depression Scale (Radloff, 1977); ER � emotion regulation; NA � negative affect; ESM �experience-sampling methodology.
Thi
sdo
cum
ent
isco
pyri
ghte
dby
the
Am
eric
anPs
ycho
logi
cal
Ass
ocia
tion
oron
eof
itsal
lied
publ
ishe
rs.
Thi
sar
ticle
isin
tend
edso
lely
for
the
pers
onal
use
ofth
ein
divi
dual
user
and
isno
tto
bedi
ssem
inat
edbr
oadl
y.
477EMOTION REGULATION VARIABILITY IN DAILY LIFE
SD(between)ti �� 1L � 1�s�1
L (xsti � M(between)ti)2
Figure 1 illustrates these calculations. At each beep, we alsocalculated the mean of the respective NA items. For mean NA, wecalculated within-person omega scores as measures of reliability(Geldhof et al., 2014). These were as follows: Study 1: .67; Study2: .76; Study 3: .76; and Study 4: .81. These measures for NA werebased on two-factor models that also incorporated positive affect(see Footnote 3).
Average NA and ER strategy use across the study (person-level aggregation). For each individual, we calculated the meanNA level across all beeps. As a person-level measure of mean ERstrategy endorsement, we calculated the mean across all ER strat-egies across all beeps. Between-person reliabilities were calculatedin the same models as the within-person reliabilities (Geldhof etal., 2014). Between-person omegas were as follows for mean ERstrategy endorsement: Study 1: .83; Study 2: .81; Study 3: .85; and
Study 4: .85. Between-person omegas were as follows for NA:Study 1: .93; Study 2: .94; Study 3: .96; and Study 4: .96.
Average ER within-strategy and between-strategy variabil-ity (person-level aggregation). As an indicator of within-strategy variability, Aldao et al. (2015) proposed the SD of a givenER strategy endorsement across different contexts. A high SDindicates that a person does not apply a strategy in question inevery situation to a similar extent but is able to inhibit a strategy.
The average intensity with which one strategy is used across allmeasurement occasions t for each individual i was calculated asfollows.
M(within)i � 1Ni
�t�1
Ni
xti
The within-strategy SD for each individual i for one strategy wasthen calculated as follows.
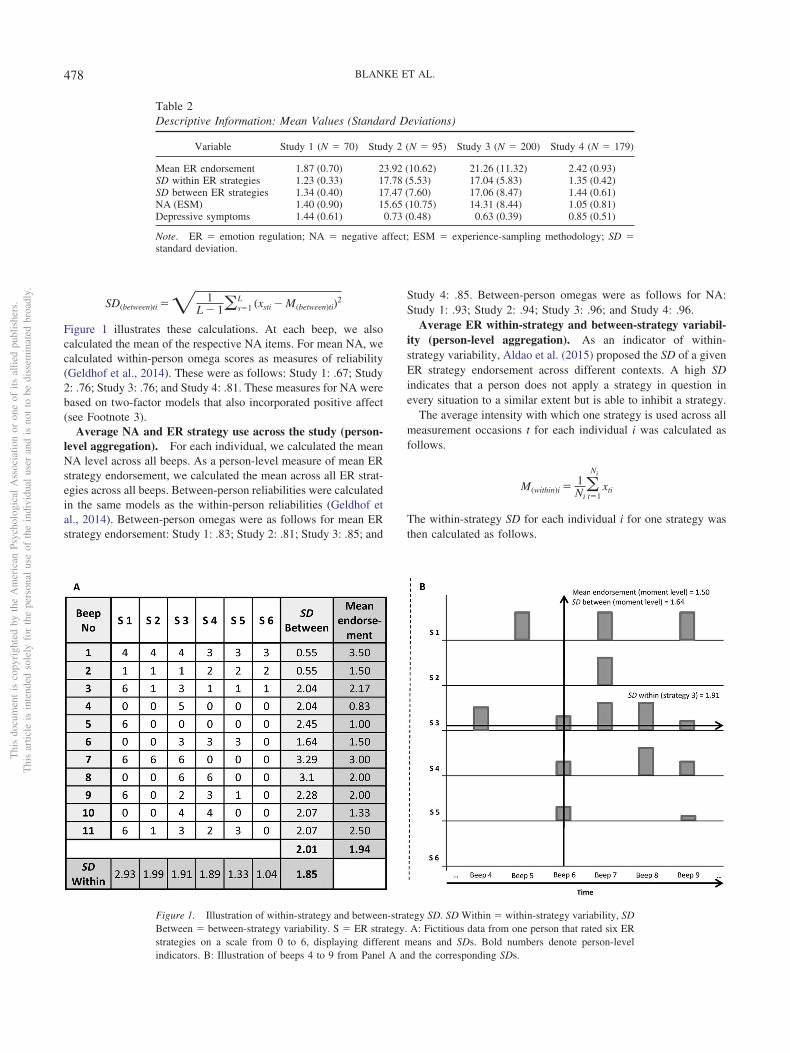
Table 2Descriptive Information: Mean Values (Standard Deviations)
Variable Study 1 (N � 70) Study 2 (N � 95) Study 3 (N � 200) Study 4 (N � 179)
Mean ER endorsement 1.87 (0.70) 23.92 (10.62) 21.26 (11.32) 2.42 (0.93)SD within ER strategies 1.23 (0.33) 17.78 (5.53) 17.04 (5.83) 1.35 (0.42)SD between ER strategies 1.34 (0.40) 17.47 (7.60) 17.06 (8.47) 1.44 (0.61)NA (ESM) 1.40 (0.90) 15.65 (10.75) 14.31 (8.44) 1.05 (0.81)Depressive symptoms 1.44 (0.61) 0.73 (0.48) 0.63 (0.39) 0.85 (0.51)
Note. ER � emotion regulation; NA � negative affect; ESM � experience-sampling methodology; SD �standard deviation.
Figure 1. Illustration of within-strategy and between-strategy SD. SD Within � within-strategy variability, SDBetween � between-strategy variability. S � ER strategy. A: Fictitious data from one person that rated six ERstrategies on a scale from 0 to 6, displaying different means and SDs. Bold numbers denote person-levelindicators. B: Illustration of beeps 4 to 9 from Panel A and the corresponding SDs.
Thi
sdo
cum
ent
isco
pyri
ghte
dby
the
Am
eric
anPs
ycho
logi
cal
Ass
ocia
tion
oron
eof
itsal
lied
publ
ishe
rs.
Thi
sar
ticle
isin
tend
edso
lely
for
the
pers
onal
use
ofth
ein
divi
dual
user
and
isno
tto
bedi
ssem
inat
edbr
oadl
y.
478 BLANKE ET AL.
SD(within)i �� 1Ni � 1�t�1
Ni (xti � Mi)2
For the mean within-strategy variability index, the SDs of the strate-gies were averaged across strategies for each individual. Becausewithin-strategy variability depends on the assessment of multiplemeasurement occasions, this measure could only be obtained at theperson level. High global within-strategy variability indicates that aperson uses all considered strategies variably across time.
Within-strategy variability index (person level):
MSD(within)i � 1L�
s�1
L
SD(within)si
Reliabilities calculated using Cronbach’s alpha for each studywere as follows: Study 1: .86; Study 2: .88; Study 3: .86; and Study4: .88. As a person-level measure of between-strategy variability,the between-strategy SD (calculated at the moment-level) wasaveraged across all measurement occasions for each person.
Between-strategy index (person level):
MSD(between)i � 1Ni
�t�1
Ni
SD(between)ti
Figure 1 illustrates examples of different patterns of higher andlower SD values, indicating the pathways through which higherand lower scores on between-strategy variability can be obtained.A higher SD between the strategies at each beep can be obtainedby several patterns, as illustrated in Figure 1. Higher values areobtained when prioritizing few strategies strongly. Lower valuesare obtained when either endorsing multiple strategies to a similarextent or endorsing few strategies, but only weakly.
Depressive symptoms. Depressive symptoms were assessedwith variations of the Center for Epidemiologic Studies Depres-sion Scale (CES-D; Radloff, 1977). Mean scores for these scaleswere computed. Reliabilities calculated using Cronbach’s alpha foreach Study were as follows: Study 1: .92; Study 2: .91; Study 3:.88; and Study 4: .84.
Data Analysis
For the between-person analyses (person level), we used multipleregression models computed in IBM SPSS Version 22 for Windows(2013). To obtain the mean effect size of the associations between ERvariability and NA across the four studies, we performed fixed effectmeta-analyses on the results using Comprehensive Meta-AnalysisVersion 2 (Borenstein, Hedges, Higgins, & Rothstein, 2005).3 Wechose to use fixed, rather than random-effect meta-analyses becauseall heterogeneity statistics [Q] were nonsignificant (Shadish & Had-dock, 1994), however we should note that the results using random-effects meta-analyses were not substantively different from the fixed-effect results reported here. In these analyses, we controlled fordepressive symptoms, because in two of the studies, the within-studyvariability of depressive symptoms was increased by the samplingtechnique (i.e., Study 2 and 3 oversampled individuals with particu-larly high and low levels of depressive symptoms).4
For the within-person association (moment-level) relating between-strategy variability to NA at particular moments, we used multilevelmodels. In these models, beeps (Level-1) were nested within persons(Level-2). NA at each beep was predicted by moment-level between-strategy variability and mean strategy endorsement (all Level-1). The
predictors were person-mean centered and modeled as fixed and asrandom effects, with the random intercept and slopes being allowed tocovary. In the following, the multilevel equations are presented.Again, xti (e.g., NAti) refers to measurement occasion t of indivi-dual i.
NAti � �0i � �1i � (between-strategy SDti) Level 1
� �2i � (mean ER endorsementti) � rti
�0i � �00 � �0i Level 2
�1i � �10 � �1i
�2i � �20 � �2i
Random effects were tested using the deviance statistic (Singer &Willett, 2003). Models were run using the PROC MIXED procedurein SAS Version 9.3. A spatial power error structure accounted for theautocorrelation of the unevenly spaced measurement occasions.
Results
Associations Between Mean Endorsement and the TwoTypes of Variability
We first examined the relationship between the ER variabilitymeasures and mean ER strategy endorsement using correlations (seeTable 3). As expected, there were generally significant positive asso-ciations between the variability measures and the mean ER strategyendorsement. An exception was the nonsignificant association be-tween the within-strategy variability and mean ER endorsement inStudy 4. A positive association between mean endorsement andvariability indicates that individuals who endorsed strategies to ahigher degree also used the strategies more variably across differentsituations. Within-strategy and between-strategy variability were alsopositively related, indicating that individuals who did not use partic-ular strategies to the same degree over time also prioritized somestrategies over others at any given moment. This association was alsosignificant for all four studies when partialing out the mean ERendorsement (Study 1: r � .480; Study 2: r � .549; Study 3: r � .413;Study 4: r � .490; all p � .01; meta-analytic result: r � .472, p �.001; 95% CI [.403, .535]).
Associations Between Variability Indicators and NA(Person Level)
Next, we examined associations between the averaged ER variabil-ity indicators and NA (Tables 4 and 5). We used multiple regression
3 We had no hypotheses regarding associations between ER variabilityand positive affect (PA). Omega scores for within- and between-personreliability for PA were as follows: Study 1: .77/.93; Study 2: .71/.91; Study3: .74/.91; and Study 4: .80/.90. However, we also computed a meta-analytic correlation based on semipartial correlations between PA andvariability controlling for mean ER endorsement and depressive symptoms.This analysis did not reveal an effect for between-strategy variability (r �.014, p � .753, 95% CI [�.071, .098]), or within-strategy variability (r �.029, p � .502, 95% CI [�.056, .114]).
4 We also computed a meta-analytic correlation based on semi-partial cor-relations between depression and variability controlling for mean ER endorse-ment. This analysis did not reveal an effect for between-strategy variability(r � .020, p � .650, 95% CI [�.065, .104]), but a small positive associationwith within-strategy variability (r � .112, p � .01, 95% CI [.028, .195]).
Thi
sdo
cum
ent
isco
pyri
ghte
dby
the
Am
eric
anPs
ycho
logi
cal
Ass
ocia
tion
oron
eof
itsal
lied
publ
ishe
rs.
Thi
sar
ticle
isin
tend
edso
lely
for
the
pers
onal
use
ofth
ein
divi
dual
user
and
isno
tto
bedi
ssem
inat
edbr
oadl
y.
479EMOTION REGULATION VARIABILITY IN DAILY LIFE

analyses. In Step 1, we controlled for mean ER strategy endorsement.This allowed us to obtain a measure of ER variability that was notconfounded with the mean. As expected, mean strategy endorsementwas positively related to NA, indicating that when participants en-dorsed many strategies intensively they also have high NA levels. InStep 2, we entered variability measures, and in Step 3, we controlledfor depressive symptoms.
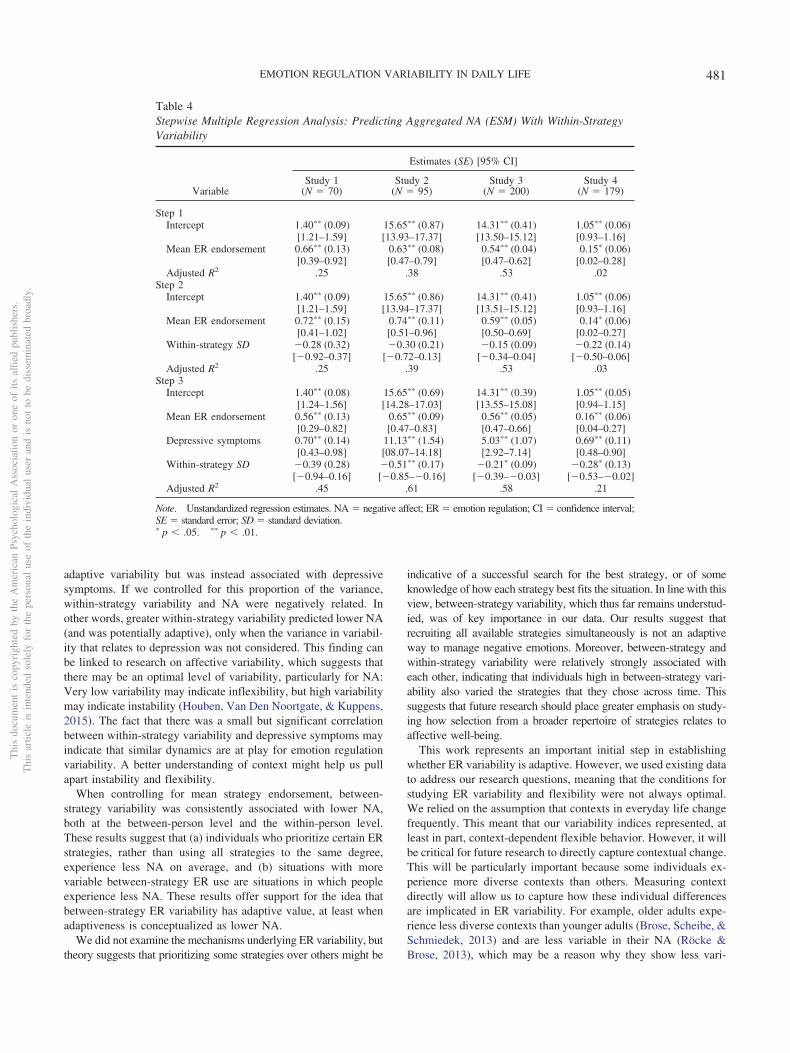
Within-strategy variability. Within-strategy variability wasnot significantly related to NA in all four studies in Step 2 (see Table4). When we controlled for depressive symptoms in Step 3, three ofthe four negative associations between within-strategy variability andNA became significant (Studies 2, 3, 4, p � .05). A meta-analysisconducted with the semipartial correlations (i.e., controlling for meanER strategy endorsement and depressive symptoms) yielded a signif-icant effect (r � �.136, p � .002, 95% CI [�.218, �.052]). Theseresults suggest that within-strategy variability is associated with lowerNA levels independent of depressive symptoms, although the mag-nitude of this relationship was small.5
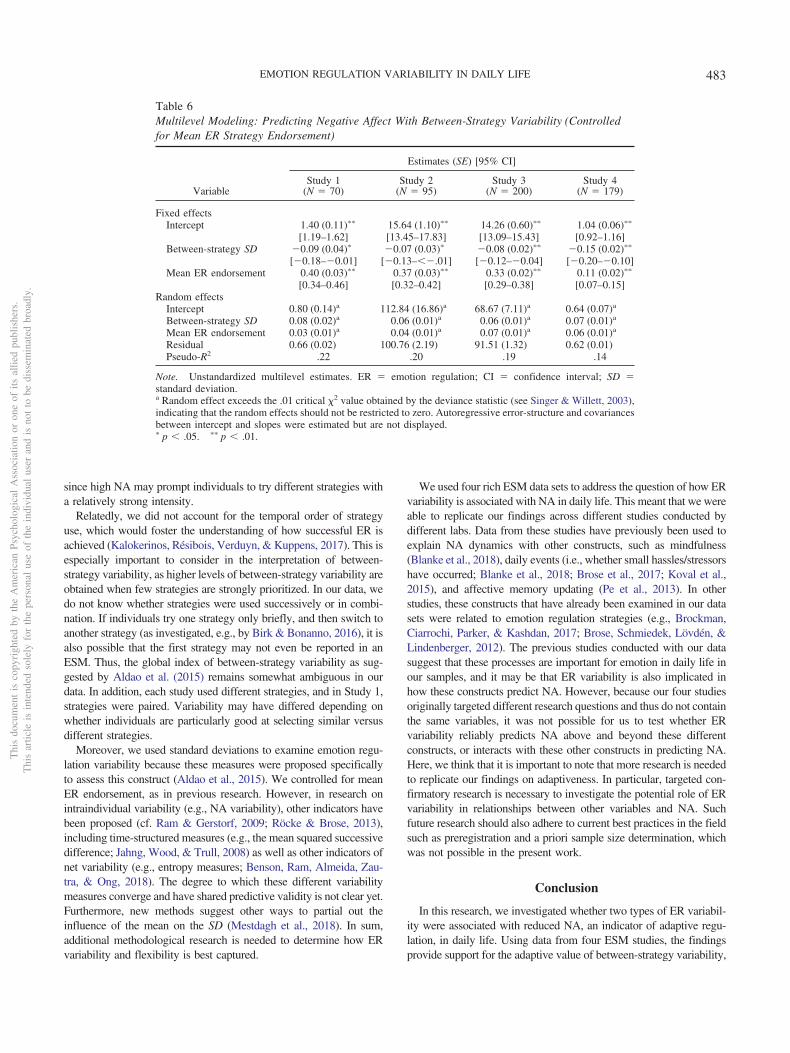
Between-strategy variability. For between-strategy variabil-ity, the results were more consistent (see Table 6): In three of the fourstudies, higher levels of between-strategy variability were signifi-cantly related to lower NA levels. Moreover, when controlling fordepressive symptoms in Step 3, all associations became significant. Ameta-analysis conducted with the semipartial correlations (controllingfor mean ER strategy endorsement and depressive symptoms) yieldeda significant effect of medium size (r � �.316, p � .001, 95% CI[�.390, �.238]). These results suggest that individuals who, onaverage, prioritized some strategies over others, experienced less NAduring the study.
Given the relationship between within- and between-strategy vari-ability, we also ran regressions with both variability indicators aspredictors. When controlling for within-strategy variability (as well asmean ER and depressive symptoms), between-strategy variabilitystayed significant in three out of the four studies. The semipartialcorrelations taken from the regression model were as follows: Study1: �.403, Study 3: �.245, and Study 4: �.387 (all p � .01); Study2: �.074 (p � .255). These results suggest that within-strategy vari-ability and between-strategy variability shared predictive variance inNA, but between-strategy variability was predictive above and be-yond within-strategy variability.
Associations Between Between-Strategy Variabilityand NA (Moment-Level)
Finally, we examined whether between-strategy variability and NAwere also associated within individuals (at the level of within-persondynamics), controlling for mean strategy endorsement (see Table 6).
In these analyses, we tested whether occasions at which individualsprioritized some ER strategies over others (i.e., did not endorse allstrategies at the same time or prioritized only one strategy, evidencedby a high SD across strategies at that moment) were also occasions atwhich they experienced less NA. These within-person results yieldedsimilar results as the between-person analyses: again, we found anegative association between NA and between-strategy variability inall four studies. This indicates that at times when individuals usedsome strategies more than others, they felt less NA. Overall, in thedifferent studies, 14–22% of the variance of NA within individualswas explained by mean ER endorsement and between-strategy vari-ability.
Discussion
Despite an ongoing theoretical discussion centering on the adap-tiveness of the variable and flexible use of ER strategies (e.g.,Aldao et al., 2015; Bonanno & Burton, 2013; Cheng, Lau, & Chan,2014; Kashdan & Rottenberg, 2010), there has yet to be a com-prehensive study conducted in daily life. Studying variability indaily life is critical, as it provides the opportunity to test the roleof variability across many time-points with changing situationaldemands. Here, we differentiated between two global indicators:within- and between-strategy ER variability. We examinedwhether they were related to reduced NA—indicating adaptivestrategy use—in data from four ESM studies. We included avariety of ER strategies, allowing us to meaningfully estimatethese two types of variability.
We found that average within-strategy variability was onlyweakly associated with NA across studies, and only when control-ling for depressive symptoms. This seems to be indicative of asuppression effect originating from the slightly positive associa-tion between within-strategy ER variability and depressive symp-toms (see Footnote 3). That is, a small, but apparently not negli-gible, proportion of the within-strategy ER variance was not
5 We also tested the effect of within-strategy variability on NA for eachsingle strategy separately for each study. The results are in Table 1 of theOSF data. We also conducted multiple regression analyses, entering meanER endorsement, the CES-D score, as well as the withinstrategy SDs for allsingle strategies (all predictors were grand-mean centered). In Studies 1and 3, none of the within-strategy SDs significantly predicted NA aboveand beyond the other predictors. In Study 2, within-strategy variability fordistraction was significantly related to lower NA above and beyond the(non-significant) effect of the other strategies. In Study 4, within-strategyvariability for distraction was significantly associated with lower NA, andwithin-strategy variability for rumination was significantly associated withhigher NA. These results are in Table 2 of the OSF data.
Table 3Correlations Between Mean ER Strategy Endorsement, Within-Strategy Variability, and Between-Strategy Variability
Variable
Mean SD within ER strategies Mean SD between ER strategies
Study 1(N � 70)
Study 2(N � 95)
Study 3(N � 200)
Study 4(N � 179)
Study 1(N � 70)
Study 2(N � 95)
Study 3(N � 200)
Study 4(N � 179)
Mean ER endorsement .471�� .681�� .669�� �.038 .322�� .679�� .742�� .437��
Mean SD within ER strategies — — — — .553�� .758�� .702�� .424��
Note. ER � emotion regulation; SD � standard deviation.�� p � .01.
Thi
sdo
cum
ent
isco
pyri
ghte
dby
the
Am
eric
anPs
ycho
logi
cal
Ass
ocia
tion
oron
eof
itsal
lied
publ
ishe
rs.
Thi
sar
ticle
isin
tend
edso
lely
for
the
pers
onal
use
ofth
ein
divi
dual
user
and
isno
tto
bedi
ssem
inat
edbr
oadl
y.
480 BLANKE ET AL.
adaptive variability but was instead associated with depressivesymptoms. If we controlled for this proportion of the variance,within-strategy variability and NA were negatively related. Inother words, greater within-strategy variability predicted lower NA(and was potentially adaptive), only when the variance in variabil-ity that relates to depression was not considered. This finding canbe linked to research on affective variability, which suggests thatthere may be an optimal level of variability, particularly for NA:Very low variability may indicate inflexibility, but high variabilitymay indicate instability (Houben, Van Den Noortgate, & Kuppens,2015). The fact that there was a small but significant correlationbetween within-strategy variability and depressive symptoms mayindicate that similar dynamics are at play for emotion regulationvariability. A better understanding of context might help us pullapart instability and flexibility.
When controlling for mean strategy endorsement, between-strategy variability was consistently associated with lower NA,both at the between-person level and the within-person level.These results suggest that (a) individuals who prioritize certain ERstrategies, rather than using all strategies to the same degree,experience less NA on average, and (b) situations with morevariable between-strategy ER use are situations in which peopleexperience less NA. These results offer support for the idea thatbetween-strategy ER variability has adaptive value, at least whenadaptiveness is conceptualized as lower NA.
We did not examine the mechanisms underlying ER variability, buttheory suggests that prioritizing some strategies over others might be
indicative of a successful search for the best strategy, or of someknowledge of how each strategy best fits the situation. In line with thisview, between-strategy variability, which thus far remains understud-ied, was of key importance in our data. Our results suggest thatrecruiting all available strategies simultaneously is not an adaptiveway to manage negative emotions. Moreover, between-strategy andwithin-strategy variability were relatively strongly associated witheach other, indicating that individuals high in between-strategy vari-ability also varied the strategies that they chose across time. Thissuggests that future research should place greater emphasis on study-ing how selection from a broader repertoire of strategies relates toaffective well-being.
This work represents an important initial step in establishingwhether ER variability is adaptive. However, we used existing datato address our research questions, meaning that the conditions forstudying ER variability and flexibility were not always optimal.We relied on the assumption that contexts in everyday life changefrequently. This meant that our variability indices represented, atleast in part, context-dependent flexible behavior. However, it willbe critical for future research to directly capture contextual change.This will be particularly important because some individuals ex-perience more diverse contexts than others. Measuring contextdirectly will allow us to capture how these individual differencesare implicated in ER variability. For example, older adults expe-rience less diverse contexts than younger adults (Brose, Scheibe, &Schmiedek, 2013) and are less variable in their NA (Röcke &Brose, 2013), which may be a reason why they show less vari-
Table 4Stepwise Multiple Regression Analysis: Predicting Aggregated NA (ESM) With Within-StrategyVariability
Variable
Estimates (SE) [95% CI]
Study 1(N � 70)
Study 2(N � 95)
Study 3(N � 200)
Study 4(N � 179)
Step 1Intercept 1.40�� (0.09) 15.65�� (0.87) 14.31�� (0.41) 1.05�� (0.06)
[1.21–1.59] [13.93–17.37] [13.50–15.12] [0.93–1.16]Mean ER endorsement 0.66�� (0.13) 0.63�� (0.08) 0.54�� (0.04) 0.15� (0.06)
[0.39–0.92] [0.47–0.79] [0.47–0.62] [0.02–0.28]Adjusted R2 .25 .38 .53 .02
Step 2Intercept 1.40�� (0.09) 15.65�� (0.86) 14.31�� (0.41) 1.05�� (0.06)
[1.21–1.59] [13.94–17.37] [13.51–15.12] [0.93–1.16]Mean ER endorsement 0.72�� (0.15) 0.74�� (0.11) 0.59�� (0.05) 0.14� (0.06)
[0.41–1.02] [0.51–0.96] [0.50–0.69] [0.02–0.27]Within-strategy SD �0.28 (0.32) �0.30 (0.21) �0.15 (0.09) �0.22 (0.14)
[�0.92–0.37] [�0.72–0.13] [�0.34–0.04] [�0.50–0.06]Adjusted R2 .25 .39 .53 .03
Step 3Intercept 1.40�� (0.08) 15.65�� (0.69) 14.31�� (0.39) 1.05�� (0.05)
[1.24–1.56] [14.28–17.03] [13.55–15.08] [0.94–1.15]Mean ER endorsement 0.56�� (0.13) 0.65�� (0.09) 0.56�� (0.05) 0.16�� (0.06)
[0.29–0.82] [0.47–0.83] [0.47–0.66] [0.04–0.27]Depressive symptoms 0.70�� (0.14) 11.13�� (1.54) 5.03�� (1.07) 0.69�� (0.11)
[0.43–0.98] [08.07–14.18] [2.92–7.14] [0.48–0.90]Within-strategy SD �0.39 (0.28) �0.51�� (0.17) �0.21� (0.09) �0.28� (0.13)
[�0.94–0.16] [�0.85–�0.16] [�0.39–�0.03] [�0.53–�0.02]Adjusted R2 .45 .61 .58 .21
Note. Unstandardized regression estimates. NA � negative affect; ER � emotion regulation; CI � confidence interval;SE � standard error; SD � standard deviation.� p � .05. �� p � .01.
Thi
sdo
cum
ent
isco
pyri
ghte
dby
the
Am
eric
anPs
ycho
logi
cal
Ass
ocia
tion
oron
eof
itsal
lied
publ
ishe
rs.
Thi
sar
ticle
isin
tend
edso
lely
for
the
pers
onal
use
ofth
ein
divi
dual
user
and
isno
tto
bedi
ssem
inat
edbr
oadl
y.
481EMOTION REGULATION VARIABILITY IN DAILY LIFE

ability in daily ER strategies (Eldesouky & English, 2018). That is,reports of contexts are not random, but likely tied to person-levelcharacteristics. In turn, some individuals may need to regulate theiremotions more variably than others, and this may pose a threat tothe validity of our findings. As three of our four samples werestudent samples, our ability to investigate questions like interindi-vidual differences in contextual diversity may be limited. In futurestudies, this problem could be addressed with an event-contingentexperience sampling design with more predictable and comparableevents across participants.
Measuring context and variability together will also be important inunderstanding effective ER in several other ways. First, previousresearch has demonstrated the importance of subjective evaluations ofthe context in determining which specific ER strategies are adaptive(e.g., perceived controllability of the situation: Cheng, 2001; Haines etal., 2016; Troy et al., 2013). These subjective context evaluations haveproven important for interventions (e.g., Cheng, Kogan, & Chio,2012). However, this line of research has yet to examine how thiscontextual information may influence the selection of strategies froma repertoire. Second, we do not know how contextual intensity mattersfor ER variability. In our data, we focused on normal daily life, andthus we primarily captured more mundane situations, instead ofemotionally more emotionally intense situations such as major lifeevents. Finally, research on context-dependent variability in ERwould inform the debate about whether certain ER strategies areinherently (mal)adaptive. Such research could investigate whetherstrategies are adaptive in a broader versus a narrower range of con-
texts. For example, rumination was related to maladaptive outcomesacross several studies and contexts (e.g., Aldao & Nolen-Hoeksema,2010; Brans et al., 2013), indicating that rumination may indeed bemaladaptive most of the time.
In the current investigation, we did not include goals or a directmarker of regulatory success. That is, we did not ask participantswhether they felt that their regulation efforts were successful inachieving their goals. As people are usually motivated to experiencelow levels of NA, we used low NA as a marker of regulatory success.In future, we believe that it will be important to test the role of goalsin driving ER variability, thus directly testing the concept of emotionregulation flexibility (Aldao et al., 2015). This could be achieved bycombining controlled laboratory research (which may foster an un-derstanding of an individual’s capacity to use strategies flexibly) withESM (which may foster an understanding of actual flexible use indaily life).
Because our data is correlational, the temporal order of eventsremains unclear. It is thus possible that individuals either successfullyreduced their NA using variable ER strategies, or that lower NA levelsprompted more variable strategy use. It is entirely possible thatvariability in ER is a consequence, not an antecedent, of lower NA indaily life. Indeed, using the data set we used in Study 2, Brans et al.(2013) found that, for single strategies, affect and ER may influenceeach other dynamically. This may also be the case for ER variability,with higher levels of variability resulting in lower levels of NA, whichin turn enables higher variability. However, it may also be that highlevels of NA make high levels of variability somewhat less likely,
Table 5Stepwise Multiple Regression Analysis: Predicting Aggregated NA (ESM) WithBetween-Strategy Variability
Variable
Estimates (SE) [95% CI]
Study 1(N � 70)
Study 2(N � 95)
Study 3(N � 200)
Study 4(N � 179)
Step1Intercept 1.40�� (0.09) 15.65�� (0.87) 14.31�� (0.41) 1.05�� (0.06)
[1.21–1.59] [13.93–17.37] [13.50–15.12] [0.93–1.16]Mean ER endorsement 0.66�� (0.13) 0.63�� (0.08) 0.54�� (0.04) 0.15� (0.06)
[0.39–0.92] [0.47–0.79] [0.47–0.62] [0.02–0.28]Adjusted R2 .25 .38 .53 .02
Step2Intercept 1.40�� (0.08) 15.65�� (0.87) 14.31�� (0.38) 1.05�� (0.05)
[1.25–1.55] [13.92–17.38] [13.56–15.07] [0.94–1.15]Mean ER endorsement 0.87�� (0.12) 0.59�� (0.11) 0.74�� (0.05) 0.35�� (0.06)
[0.64–1.11] [0.37–0.82] [0.64–0.84] [0.23–0.48]Between-strategy SD �1.18�� (0.20) 0.08 (0.16) �0.36�� (0.07) �0.71�� (0.10)
[�1.58–�0.77] [�0.24–0.39] [�0.50–�0.23] [�0.90–�0.52]Adjusted R2 .49 .38 .59 .25
Step 3Intercept 1.40�� (0.07) 15.65�� (0.70) 14.31�� (0.36) 1.05�� (0.05)
[1.27–1.54] [14.26–17.04] [13.60–15.02] [0.95–1.14]Mean ER endorsement 0.70�� (0.11) 0.62�� (0.09) 0.71�� (0.05) 0.33�� (0.06)
[0.48–0.91] [0.44–0.80] [0.61–0.80] [0.22–0.45]Depressive symptoms 0.55�� (0.12) 12.17�� (1.69) 5.32�� (0.99) 0.55�� (0.10)
[0.31–0.78] [8.80–15.53] [3.38–7.26] [0.35–0.74]Between-strategy SD �0.99�� (0.18) �0.35� (0.14) �0.40�� (0.06) �0.61�� (0.09)
[�1.36–�0.63] [�0.62–�0.07] [�0.53–�0.27] [�0.79–�0.43]Adjusted R2 .61 .60 .64 .36
Note. Unstandardized regression estimates. NA � negative affect; ER � emotion regulation; CI � confidenceinterval; SD � standard deviation; SE � standard error.� p � .05. �� p � .01.
Thi
sdo
cum
ent
isco
pyri
ghte
dby
the
Am
eric
anPs
ycho
logi
cal
Ass
ocia
tion
oron
eof
itsal
lied
publ
ishe
rs.
Thi
sar
ticle
isin
tend
edso
lely
for
the
pers
onal
use
ofth
ein
divi
dual
user
and
isno
tto
bedi
ssem
inat
edbr
oadl
y.
482 BLANKE ET AL.
since high NA may prompt individuals to try different strategies witha relatively strong intensity.
Relatedly, we did not account for the temporal order of strategyuse, which would foster the understanding of how successful ER isachieved (Kalokerinos, Résibois, Verduyn, & Kuppens, 2017). This isespecially important to consider in the interpretation of between-strategy variability, as higher levels of between-strategy variability areobtained when few strategies are strongly prioritized. In our data, wedo not know whether strategies were used successively or in combi-nation. If individuals try one strategy only briefly, and then switch toanother strategy (as investigated, e.g., by Birk & Bonanno, 2016), it isalso possible that the first strategy may not even be reported in anESM. Thus, the global index of between-strategy variability as sug-gested by Aldao et al. (2015) remains somewhat ambiguous in ourdata. In addition, each study used different strategies, and in Study 1,strategies were paired. Variability may have differed depending onwhether individuals are particularly good at selecting similar versusdifferent strategies.
Moreover, we used standard deviations to examine emotion regu-lation variability because these measures were proposed specificallyto assess this construct (Aldao et al., 2015). We controlled for meanER endorsement, as in previous research. However, in research onintraindividual variability (e.g., NA variability), other indicators havebeen proposed (cf. Ram & Gerstorf, 2009; Röcke & Brose, 2013),including time-structured measures (e.g., the mean squared successivedifference; Jahng, Wood, & Trull, 2008) as well as other indicators ofnet variability (e.g., entropy measures; Benson, Ram, Almeida, Zau-tra, & Ong, 2018). The degree to which these different variabilitymeasures converge and have shared predictive validity is not clear yet.Furthermore, new methods suggest other ways to partial out theinfluence of the mean on the SD (Mestdagh et al., 2018). In sum,additional methodological research is needed to determine how ERvariability and flexibility is best captured.
We used four rich ESM data sets to address the question of how ERvariability is associated with NA in daily life. This meant that we wereable to replicate our findings across different studies conducted bydifferent labs. Data from these studies have previously been used toexplain NA dynamics with other constructs, such as mindfulness(Blanke et al., 2018), daily events (i.e., whether small hassles/stressorshave occurred; Blanke et al., 2018; Brose et al., 2017; Koval et al.,2015), and affective memory updating (Pe et al., 2013). In otherstudies, these constructs that have already been examined in our datasets were related to emotion regulation strategies (e.g., Brockman,Ciarrochi, Parker, & Kashdan, 2017; Brose, Schmiedek, Lövdén, &Lindenberger, 2012). The previous studies conducted with our datasuggest that these processes are important for emotion in daily life inour samples, and it may be that ER variability is also implicated inhow these constructs predict NA. However, because our four studiesoriginally targeted different research questions and thus do not containthe same variables, it was not possible for us to test whether ERvariability reliably predicts NA above and beyond these differentconstructs, or interacts with these other constructs in predicting NA.Here, we think that it is important to note that more research is neededto replicate our findings on adaptiveness. In particular, targeted con-firmatory research is necessary to investigate the potential role of ERvariability in relationships between other variables and NA. Suchfuture research should also adhere to current best practices in the fieldsuch as preregistration and a priori sample size determination, whichwas not possible in the present work.
Conclusion
In this research, we investigated whether two types of ER variabil-ity were associated with reduced NA, an indicator of adaptive regu-lation, in daily life. Using data from four ESM studies, the findingsprovide support for the adaptive value of between-strategy variability,
Table 6Multilevel Modeling: Predicting Negative Affect With Between-Strategy Variability (Controlledfor Mean ER Strategy Endorsement)
Variable
Estimates (SE) [95% CI]
Study 1(N � 70)
Study 2(N � 95)
Study 3(N � 200)
Study 4(N � 179)
Fixed effectsIntercept 1.40 (0.11)�� 15.64 (1.10)�� 14.26 (0.60)�� 1.04 (0.06)��
[1.19–1.62] [13.45–17.83] [13.09–15.43] [0.92–1.16]Between-strategy SD �0.09 (0.04)� �0.07 (0.03)� �0.08 (0.02)�� �0.15 (0.02)��
[�0.18–�0.01] [�0.13–��.01] [�0.12–�0.04] [�0.20–�0.10]Mean ER endorsement 0.40 (0.03)�� 0.37 (0.03)�� 0.33 (0.02)�� 0.11 (0.02)��
[0.34–0.46] [0.32–0.42] [0.29–0.38] [0.07–0.15]Random effects
Intercept 0.80 (0.14)a 112.84 (16.86)a 68.67 (7.11)a 0.64 (0.07)a
Between-strategy SD 0.08 (0.02)a 0.06 (0.01)a 0.06 (0.01)a 0.07 (0.01)a
Mean ER endorsement 0.03 (0.01)a 0.04 (0.01)a 0.07 (0.01)a 0.06 (0.01)a
Residual 0.66 (0.02) 100.76 (2.19) 91.51 (1.32) 0.62 (0.01)Pseudo-R2 .22 .20 .19 .14
Note. Unstandardized multilevel estimates. ER � emotion regulation; CI � confidence interval; SD �standard deviation.a Random effect exceeds the .01 critical �2 value obtained by the deviance statistic (see Singer & Willett, 2003),indicating that the random effects should not be restricted to zero. Autoregressive error-structure and covariancesbetween intercept and slopes were estimated but are not displayed.� p � .05. �� p � .01.
Thi
sdo
cum
ent
isco
pyri
ghte
dby
the
Am
eric
anPs
ycho
logi
cal
Ass
ocia
tion
oron
eof
itsal
lied
publ
ishe
rs.
Thi
sar
ticle
isin
tend
edso
lely
for
the
pers
onal
use
ofth
ein
divi
dual
user
and
isno
tto
bedi
ssem
inat
edbr
oadl
y.
483EMOTION REGULATION VARIABILITY IN DAILY LIFE
an indicator capturing ER variability at one point in time. Between-strategy variability was associated with reduced NA both at theaverage level and at the level of within-person dynamics. Thus, thisstudy provides support for modern theoretical perspectives, whichemphasize flexible choice rather than universal efficacy of ER strat-egies. This study also points toward the necessity of advancing currentthinking about how best to conceptualize and capture emotion regu-lation variability in daily life.
References
Aldao, A., & Nolen-Hoeksema, S. (2010). Specificity of cognitive emotionregulation strategies: A transdiagnostic examination. Behaviour Re-search and Therapy, 48, 974–983. http://dx.doi.org/10.1016/j.brat.2010.06.002
Aldao, A., & Nolen-Hoeksema, S. (2012). The influence of context on theimplementation of adaptive emotion regulation strategies. BehaviourResearch and Therapy, 50, 493–501. http://dx.doi.org/10.1016/j.brat.2012.04.004
Aldao, A., & Nolen-Hoeksema, S. (2013). One versus many: Capturing theuse of multiple emotion regulation strategies in response to an emotion-eliciting stimulus. Cognition and Emotion, 27, 753–760. http://dx.doi.org/10.1080/02699931.2012.739998
Aldao, A., Sheppes, G., & Gross, J. J. (2015). Emotion regulation flexi-bility. Cognitive Therapy and Research, 39, 263–278. http://dx.doi.org/10.1007/s10608-014-9662-4
Appleton, A. A., & Kubzansky, L. D. (2014). Emotion regulation andcardiovascular disease risk. In J. Gross (Ed.), Handbook of emotionregulation (2nd ed., pp. 596–612). New York, NY: Guilford Press.
Barrett, D. J., & Barrett, L. F. (2000). The experience sampling program(ESP) [Software]. Retrieved from http://www.experience-sampling.org/
Bastian, B., Koval, P., Erbas, Y., Houben, M., Pe, M. L., & Kuppens, P.(2015). Sad and alone: Social expectancies for experiencing negativeemotions are linked to feelings of loneliness. Social Psychological andPersonality Science, 6, 496 –503. http://dx.doi.org/10.1177/1948550614568682
Benson, L., Ram, N., Almeida, D., Zautra, A., & Ong, A. D. (2018). Fusingbiodiversity metrics into investigations of daily life and healthy aging:Illustrations and recommendations with emodiversity. The Journals ofGerontology Series B, Psychological Sciences and Social Sciences, 73,75–86. http://dx.doi.org/10.1093/geronb/gbx025
Birk, J. L., & Bonanno, G. A. (2016). When to throw the switch: Theadaptiveness of modifying emotion regulation strategies based on affec-tive and physiological feedback. Emotion, 16, 657–670. http://dx.doi.org/10.1037/emo0000157
Blanke, E. S., & Brose, A. (2017). Mindfulness in Daily Life: A Multidi-mensional Approach. Mindfulness, 8, 737–750. http://dx.doi.org/10.1007/s12671-016-0651-4
Blanke, E. S., Riediger, M., & Brose, A. (2018). Pathways to happiness aremultidirectional: Associations between state mindfulness and everydayaffective experience. Emotion, 18, 202–211. http://dx.doi.org/10.1037/emo0000323
Bolger, N., Davis, A., & Rafaeli, E. (2003). Diary methods: Capturing lifeas it is lived. Annual Review of Psychology, 54, 579–616. http://dx.doi.org/10.1146/annurev.psych.54.101601.145030
Bonanno, G. A., & Burton, C. L. (2013). Regulatory flexibility: Anindividual differences perspective on coping and emotion regulation.Perspectives on Psychological Science, 8, 591–612. http://dx.doi.org/10.1177/1745691613504116
Bonanno, G. A., Papa, A., Lalande, K., Westphal, M., & Coifman, K.(2004). The importance of being flexible: The ability to both enhanceand suppress emotional expression predicts long-term adjustment. Psy-chological Science, 15, 482–487. http://dx.doi.org/10.1111/j.0956-7976.2004.00705.x
Bonanno, G. A., Pat-Horenczyk, R., & Noll, J. (2011). Coping flexibilityand trauma: The Perceived Ability to Cope With Trauma (PACT) scale.Psychological Trauma: Theory, Research, Practice, and Policy, 3, 117–129. http://dx.doi.org/10.1037/a0020921
Borenstein, M., Hedges, L., Higgins, J., & Rothstein, H. (2005). Compre-hensive meta-analysis (Version 2). Englewood, NJ: Biostat.
Brans, K., Koval, P., Verduyn, P., Lim, Y. L., & Kuppens, P. (2013). Theregulation of negative and positive affect in daily life. Emotion, 13,926–939. http://dx.doi.org/10.1037/a0032400
Brockman, R., Ciarrochi, J., Parker, P., & Kashdan, T. (2017). Emotionregulation strategies in daily life: Mindfulness, cognitive reappraisal andemotion suppression. Cognitive Behaviour Therapy, 46, 91–113. http://dx.doi.org/10.1080/16506073.2016.1218926
Brose, A., Scheibe, S., & Schmiedek, F. (2013). Life contexts make adifference: Emotional stability in younger and older adults. Psychologyand Aging, 28, 148–159. http://dx.doi.org/10.1037/a0030047
Brose, A., Schmiedek, F., Lövdén, M., & Lindenberger, U. (2012). Dailyvariability in working memory is coupled with negative affect: The roleof attention and motivation. Emotion, 12, 605–617. http://dx.doi.org/10.1037/a0024436
Brose, A., Wichers, M., & Kuppens, P. (2017). Daily stressful experiencesprecede but do not succeed depressive symptoms: Results from a lon-gitudinal experience sampling study. Journal of Social and ClinicalPsychology, 36, 196–220. http://dx.doi.org/10.1521/jscp.2017.36.3.196
Cheng, C. (2001). Assessing coping flexibility in real-life and laboratorysettings: A multimethod approach. Journal of Personality and SocialPsychology, 80, 814 – 833. http://dx.doi.org/10.1037/0022-3514.80.5.814
Cheng, C., Kogan, A., & Chio, J. H. M. (2012). The effectiveness of a new,coping flexibility intervention as compared with a cognitive-behaviouralintervention in managing work stress. Work & Stress, 26, 272–288.http://dx.doi.org/10.1080/02678373.2012.710369
Cheng, C., Lau, H.-P. B., & Chan, M.-P. S. (2014). Coping flexibility andpsychological adjustment to stressful life changes: A meta-analytic review.Psychological Bulletin, 140, 1582–1607. http://dx.doi.org/10.1037/a0037913
Dejonckheere, E., Mestdagh, M., Houben, M., Erbas, Y., Pe, M., Koval, P.,. . . Kuppens, P. (2018). The bipolarity of affect and depressive symp-toms. Journal of Personality and Social Psychology, 114, 323–341.http://dx.doi.org/10.1037/pspp0000186
Dixon-Gordon, K. L., Aldao, A., & De Los Reyes, A. (2015). Emotionregulation in context: Examining the spontaneous use of strategiesacross emotional intensity and type of emotion. Personality and Indi-vidual Differences, 86, 271–276. http://dx.doi.org/10.1016/j.paid.2015.06.011
Eldesouky, L., & English, T. (2018). Another year older, another yearwiser? Emotion regulation strategy selection and flexibility across adult-hood. Psychology and Aging, 33, 572–585. http://dx.doi.org/10.1037/pag0000251
Erbas, Y., Ceulemans, E., Kalokerinos, E. K., Houben, M., Koval, P., Pe,M. L., & Kuppens, P. (2018). Why I don’t always know what I’mfeeling: The role of stress in within-person fluctuations in emotiondifferentiation. Journal of Personality and Social Psychology, 115,179–191. http://dx.doi.org/10.1037/pspa0000126
Erbas, Y., Ceulemans, E., Koval, P., & Kuppens, P. (2015). The role ofvalence focus and appraisal overlap in emotion differentiation. Emotion,15, 373–382. http://dx.doi.org/10.1037/emo0000039
Geldhof, G. J., Preacher, K. J., & Zyphur, M. J. (2014). Reliabilityestimation in a multilevel confirmatory factor analysis framework. Psy-chological Methods, 19, 72–91. http://dx.doi.org/10.1037/a0032138
Gross, J. J. (1998). The emerging field of emotion regulation: An integra-tive review. Review of General Psychology, 2, 271–299. http://dx.doi.org/10.1037/1089-2680.2.3.271
Thi
sdo
cum
ent
isco
pyri
ghte
dby
the
Am
eric
anPs
ycho
logi
cal
Ass
ocia
tion
oron
eof
itsal
lied
publ
ishe
rs.
Thi
sar
ticle
isin
tend
edso
lely
for
the
pers
onal
use
ofth
ein
divi
dual
user
and
isno
tto
bedi
ssem
inat
edbr
oadl
y.
484 BLANKE ET AL.
Gross, J. J. (2002). Emotion regulation: Affective, cognitive, and social con-sequences. Psychophysiology, 39, 281–291. http://dx.doi.org/10.1017/S0048577201393198
Haines, S. J., Gleeson, J., Kuppens, P., Hollenstein, T., Ciarrochi, J.,Labuschagne, I., . . . Koval, P. (2016). The wisdom to know thedifference: Strategy-situation fit in emotion regulation in daily life isassociated with well-being. Psychological Science, 27, 1651–1659.http://dx.doi.org/10.1177/0956797616669086
Hautzinger, M., & Bailer, M. (1993). ADS—Allgemeine Depressionsskala[General Depression Scale]. Göttingen, Germany: Beltz Test GmbH.
Hollenstein, T., Lichtwarck-Aschoff, A., & Potworowski, G. (2013). Amodel of socioemotional flexibility at three time scales. Emotion Re-view, 5, 397–405. http://dx.doi.org/10.1177/1754073913484181
Houben, M., Van Den Noortgate, W., & Kuppens, P. (2015). The relationbetween short-term emotion dynamics and psychological well-being: Ameta-analysis. Psychological Bulletin, 141, 901–930. http://dx.doi.org/10.1037/a0038822
Irwin, M., Artin, K. H., & Oxman, M. N. (1999). Screening for depressionin the older adult: Criterion validity of the 10-item Center for Epidemi-ological Studies Depression Scale (CES-D). Archives of Internal Med-icine, 159, 1701–1819. http://dx.doi.org/10.1001/archinte.159.15.1701
Jahng, S., Wood, P. K., & Trull, T. J. (2008). Analysis of affectiveinstability in ecological momentary assessment: Indices using successivedifference and group comparison via multilevel modeling. Psychologi-cal Methods, 13, 354–375. http://dx.doi.org/10.1037/a0014173
Kalokerinos, E. K., Résibois, M., Verduyn, P., & Kuppens, P. (2017). Thetemporal deployment of emotion regulation strategies during negativeemotional episodes. Emotion, 17, 450–458.
Kashdan, T. B., & Rottenberg, J. (2010). Psychological flexibility as afundamental aspect of health. Clinical Psychology Review, 30, 865–878.http://dx.doi.org/10.1016/j.cpr.2010.03.001
Kato, T. (2012). Development of the Coping Flexibility Scale: Evidencefor the coping flexibility hypothesis. Journal of Counseling Psychology,59, 262–273. http://dx.doi.org/10.1037/a0027770
Koval, P., Brose, A., Pe, M. L., Houben, M., Erbas, Y., Champagne, D., &Kuppens, P. (2015). Emotional inertia and external events: The roles ofexposure, reactivity, and recovery. Emotion, 15, 625–636. http://dx.doi.org/10.1037/emo0000059
Koval, P., Ogrinz, B., Kuppens, P., Van den Bergh, O., Tuerlinckx, F., &Sütterlin, S. (2013). Affective instability in daily life is predicted byresting heart rate variability. PLoS ONE, 8, e81536. http://dx.doi.org/10.1371/journal.pone.0081536
Koval, P., Pe, M. L., Meers, K., & Kuppens, P. (2013). Affect dynamics inrelation to depressive symptoms: Variable, unstable or inert? Emotion,13, 1132–1141. http://dx.doi.org/10.1037/a0033579
Mestdagh, M., Pe, M., Pestman, W., Verdonck, S., Kuppens, P., & Tuer-linckx, F. (2018). Sidelining the mean: The relative variability index asa generic mean-corrected variability measure for bounded variables.Psychological Methods. Advance online publication. http://dx.doi.org/10.1037/met0000153
Pe, M. L., Brose, A., Gotlib, I. H., & Kuppens, P. (2016). Affectiveupdating ability and stressful events interact to prospectively predictincreases in depressive symptoms over time. Emotion, 16, 73–82. http://dx.doi.org/10.1037/emo0000097
Pe, M. L., Koval, P., Houben, M., Erbas, Y., Champagne, D., & Kuppens,P. (2015). Updating in working memory predicts greater emotion reac-
tivity to and facilitated recovery from negative emotion-eliciting stimuli.Frontiers in Psychology, 6, 372. http://dx.doi.org/10.3389/fpsyg.2015.00372
Pe, M. L., Koval, P., & Kuppens, P. (2013). Executive well-being: Updat-ing of positive stimuli in working memory is associated with subjectivewell-being. Cognition, 126, 335–340. http://dx.doi.org/10.1016/j.cognition.2012.10.002
Radloff, L. S. (1977). The CES-D Scale: A self-report depression scale forresearch in the general population. Applied Psychological Measurement,1, 385–401. http://dx.doi.org/10.1177/014662167700100306
Ram, N., & Gerstorf, D. (2009). Time-structured and net intraindividualvariability: Tools for examining the development of dynamic character-istics and processes. Psychology and Aging, 24, 778–791. http://dx.doi.org/10.1037/a0017915
Rauers, A., Blanke, E., & Riediger, M. (2013). Everyday empathic accu-racy in younger and older couples: Do you need to see your partner toknow his or her feelings? Psychological Science, 24, 2210–2217. http://dx.doi.org/10.1177/0956797613490747
Richter, D., & Schupp, J. (2015). The SOEP Innovation Sample (SOEP IS).Schmollers Jahrbuch, 135, 389–399.
Riediger, M., Schmiedek, F., Wagner, G. G., & Lindenberger, U. (2009).Seeking pleasure and seeking pain: Differences in prohedonic andcontra-hedonic motivation from adolescence to old age. PsychologicalScience, 20, 1529 –1535. http://dx.doi.org/10.1111/j.1467-9280.2009.02473.x
Röcke, C., & Brose, A. (2013). Intraindividual variability and stability ofaffect and well-being: Short-term and long-term change and stabilizationprocesses. GeroPsych: The Journal of Gerontopsychology and GeriatricPsychiatry, 26, 185–199. http://dx.doi.org/10.1024/1662-9647/a000094
Röcke, C., Li, S. C., & Smith, J. (2009). Intraindividual variability inpositive and negative affect over 45 days: Do older adults fluctuate lessthan young adults? Psychology and Aging, 24, 863–878. http://dx.doi.org/10.1037/a0016276
Russell, J. A. (2003). Core affect and the psychological construction ofemotion. Psychological Review, 110, 145–172. http://dx.doi.org/10.1037/0033-295X.110.1.145
Shadish, W. R., & Haddock, C. K. (1994). Combining estimates of effectsize. In H. Cooper & L. V. Hedges (Eds.), The handbook of researchsynthesis (pp. 261–281). New York, NY: Russell Sage Foundation.
Singer, J. D., & Willett, J. B. (2003). Applied longitudinal data analysis:Modeling change and event occurrence. New York, NY: Oxford Uni-versity Press. http://dx.doi.org/10.1093/acprof:oso/9780195152968.001.0001
Troy, A. S., Shallcross, A. J., & Mauss, I. B. (2013). A person-by-situationapproach to emotion regulation: Cognitive reappraisal can either help orhurt, depending on the context. Psychological Science, 24, 2505–2514.http://dx.doi.org/10.1177/0956797613496434
Watson, D., Clark, L. A., & Tellegen, A. (1988). Development and vali-dation of brief measures of positive and negative affect: The PANASscales. Journal of Personality and Social Psychology, 54, 1063–1070.http://dx.doi.org/10.1037/0022-3514.54.6.1063
Received February 22, 2017Revision received September 12, 2018
Accepted November 15, 2018 �
Thi
sdo
cum
ent
isco
pyri
ghte
dby
the
Am
eric
anPs
ycho
logi
cal
Ass
ocia
tion
oron
eof
itsal
lied
publ
ishe
rs.
Thi
sar
ticle
isin
tend
edso
lely
for
the
pers
onal
use
ofth
ein
divi
dual
user
and
isno
tto
bedi
ssem
inat
edbr
oadl
y.
485EMOTION REGULATION VARIABILITY IN DAILY LIFE