Microphone array based classification for security monitoring inunstructured environments
9
Int. J. Electron. Commun. (AEÜ) 69 (2015) 1715–1723 Contents lists available at ScienceDirect International Journal of Electronics and Communications (AEÜ) j ourna l h om epage: www.elsevier.com/locate/aeue Microphone array based classification for security monitoring in unstructured environments Simone Scardapane a,∗ , Michele Scarpiniti a , Marta Bucciarelli a , Fabiola Colone a , Marcello Vincenzo Mansueto b , Raffaele Parisi a a Department of Information Engineering, Electronics and Telecommunications (DIET), “Sapienza” University of Rome, Via Eudossiana 18, 00184 Rome, Italy b Intecs S.p.A., Salita del Poggio Laurentino 7, 00144 Rome, Italy a r t i c l e i n f o Article history: Received 27 October 2014 Accepted 11 August 2015 Keywords: Security monitoring Beamforming Computational scene analysis Classification Multi-level learning a b s t r a c t The aim of this paper is to describe a novel security system able to localize and classify audio sources in an outdoor environment. Its primary intended use is for security monitoring in severe scenarios, and it has been designed to cope with a large set of heterogeneous objects, including weapons, human speakers and vehicles. The system is the result of a research project sponsored by the Italian Ministry of Defense. It is composed of a large squared array of 864 microphones arranged in a rectangular lattice, whose input is processed using a classical delay-and-sum beamformer. The result of this localization process is elab- orated by a complex multi-level classification system designed in a modular fashion. In this paper, after presenting the details of the system’s design, with a particular emphasis on the innovative aspects that are introduced with respect to the state-of-the-art, we provide an extensive set of simulations show- ing the effectiveness of the proposed architecture. We conclude by describing the current limits of the system, and the projected further developments. © 2015 Elsevier GmbH. All rights reserved. 1. Introduction In the last decade, the wide availability of cheap sensor instru- mentation has made automatic surveillance an economical and technical possibility. A notable example in this sense is the Secure Perimeter Awareness Network (SPAN) in use at the J.F.K. Interna- tional Airport [1], an integrated system of sensors which is used, between others, for automatic intrusion detection in the perime- ter of the airport. Of particular interest for their flexibility and cheapness are the systems based on acoustic sensors [2]. When we consider generic outdoor scenarios, an equivalent automatic secu- rity monitoring system based on a microphone array would be an invaluable tool in assessing and controlling any type of situation occurring in them [3]. This includes, but is not limited to, handling large civil events, or increasing the awareness of a terrain in military contexts. Moreover, a sensor-based system possesses an intrinsic degree of security, being by design a completely passive device. ∗ Corresponding author. Tel.: +39 06 44585495; fax: +39 06 4873300. E-mail addresses: [email protected] (S. Scardapane), [email protected] (M. Scarpiniti), [email protected] (M. Bucciarelli), [email protected] (F. Colone), [email protected] (M.V. Mansueto), [email protected] (R. Parisi). However, implementing automatic outdoor security systems able to work with noisy, realistic and diversified data in an unstructured environment is a challenging and largely unexplored area. This is particularly due to noise, air distortion, low signal-to-noise ratio and presence of multiple, possibly conflicting sources. In this context, last year the Italian Ministry of Defense funded the SMART-OPTIGRID project, carried on by Intecs S.p.A. in collab- oration with the DIET Dept. of “Sapienza” University of Rome. The SMART-OPTIGRID project is aimed at a feasibility study of a micro- phone array based acoustic antenna for the detection, localization and classification of sound sources in severe outdoor scenarios. In particular, we are interested in classifying a set of sources acquired from a large set of sensors, and locate the concurrent presence of weapons, vehicles and/or spoken sources. Therefore the conceived system should be highly reliable, reasonably limited in size so that it can be moved if necessary, and extremely adaptive to different operative conditions. To this purpose particular attention has been devoted to the design of the microphone array geometry, to the definition of proper detection and localization strategies, and to the development of innovative classification techniques to be effective in the considered scenarios. From an algorithmic point of view, the first innovative aspect of our system is the investigation of an array composed of a large number of microphones, which are integrated into a small sur- face of limited size. The second innovative aspect, instead, is the http://dx.doi.org/10.1016/j.aeue.2015.08.007 1434-8411/© 2015 Elsevier GmbH. All rights reserved.
Transcript of Microphone array based classification for security monitoring inunstructured environments

Mu
SMa
b
a
ARA
KSBCCM
1
mtPtbtccriolcd
m(m(
h1
Int. J. Electron. Commun. (AEÜ) 69 (2015) 1715–1723
Contents lists available at ScienceDirect
International Journal of Electronics andCommunications (AEÜ)
j ourna l h om epage: www.elsev ier .com/ locate /aeue
icrophone array based classification for security monitoring innstructured environments
imone Scardapanea,∗, Michele Scarpiniti a, Marta Bucciarelli a, Fabiola Colonea,arcello Vincenzo Mansuetob, Raffaele Parisi a
Department of Information Engineering, Electronics and Telecommunications (DIET), “Sapienza” University of Rome, Via Eudossiana 18, 00184 Rome, ItalyIntecs S.p.A., Salita del Poggio Laurentino 7, 00144 Rome, Italy
r t i c l e i n f o
rticle history:eceived 27 October 2014ccepted 11 August 2015
eywords:ecurity monitoringeamforming
a b s t r a c t
The aim of this paper is to describe a novel security system able to localize and classify audio sources inan outdoor environment. Its primary intended use is for security monitoring in severe scenarios, and ithas been designed to cope with a large set of heterogeneous objects, including weapons, human speakersand vehicles. The system is the result of a research project sponsored by the Italian Ministry of Defense.It is composed of a large squared array of 864 microphones arranged in a rectangular lattice, whose inputis processed using a classical delay-and-sum beamformer. The result of this localization process is elab-
omputational scene analysislassificationulti-level learning
orated by a complex multi-level classification system designed in a modular fashion. In this paper, afterpresenting the details of the system’s design, with a particular emphasis on the innovative aspects thatare introduced with respect to the state-of-the-art, we provide an extensive set of simulations show-ing the effectiveness of the proposed architecture. We conclude by describing the current limits of thesystem, and the projected further developments.
. Introduction
In the last decade, the wide availability of cheap sensor instru-entation has made automatic surveillance an economical and
echnical possibility. A notable example in this sense is the Secureerimeter Awareness Network (SPAN) in use at the J.F.K. Interna-ional Airport [1], an integrated system of sensors which is used,etween others, for automatic intrusion detection in the perime-er of the airport. Of particular interest for their flexibility andheapness are the systems based on acoustic sensors [2]. When weonsider generic outdoor scenarios, an equivalent automatic secu-ity monitoring system based on a microphone array would be annvaluable tool in assessing and controlling any type of situationccurring in them [3]. This includes, but is not limited to, handling
arge civil events, or increasing the awareness of a terrain in militaryontexts. Moreover, a sensor-based system possesses an intrinsicegree of security, being by design a completely passive device.∗ Corresponding author. Tel.: +39 06 44585495; fax: +39 06 4873300.E-mail addresses: [email protected] (S. Scardapane),
[email protected] (M. Scarpiniti), [email protected]. Bucciarelli), [email protected] (F. Colone),
[email protected] (M.V. Mansueto), [email protected]. Parisi).
ttp://dx.doi.org/10.1016/j.aeue.2015.08.007434-8411/© 2015 Elsevier GmbH. All rights reserved.
© 2015 Elsevier GmbH. All rights reserved.
However, implementing automatic outdoor security systems ableto work with noisy, realistic and diversified data in an unstructuredenvironment is a challenging and largely unexplored area. This isparticularly due to noise, air distortion, low signal-to-noise ratioand presence of multiple, possibly conflicting sources.
In this context, last year the Italian Ministry of Defense fundedthe SMART-OPTIGRID project, carried on by Intecs S.p.A. in collab-oration with the DIET Dept. of “Sapienza” University of Rome. TheSMART-OPTIGRID project is aimed at a feasibility study of a micro-phone array based acoustic antenna for the detection, localizationand classification of sound sources in severe outdoor scenarios. Inparticular, we are interested in classifying a set of sources acquiredfrom a large set of sensors, and locate the concurrent presence ofweapons, vehicles and/or spoken sources. Therefore the conceivedsystem should be highly reliable, reasonably limited in size so thatit can be moved if necessary, and extremely adaptive to differentoperative conditions. To this purpose particular attention has beendevoted to the design of the microphone array geometry, to thedefinition of proper detection and localization strategies, and to thedevelopment of innovative classification techniques to be effectivein the considered scenarios.
From an algorithmic point of view, the first innovative aspect ofour system is the investigation of an array composed of a largenumber of microphones, which are integrated into a small sur-face of limited size. The second innovative aspect, instead, is the

1 . Com
itp
boitc([spocGiaDirlntsa
onsatfriAHscwottbwnas
cwdrfibs
d3ac
716 S. Scardapane et al. / Int. J. Electron
ntroduction of a modular four-level classification stage, designedo cope with the large number of possible sources that can beresent in an environment of interest.
Regarding the state-of-the-art, automatic security monitoringy means of collected audio signals falls under the broader fieldf Computational Auditory Scene Analysis (CASA) [4], whose aims to successfully analyze a stream of continuous audio to iden-ify and isolate the sources of interest contained in it. The audioan be acquired either (i) using large acoustic antennas [2,5,6]which is our design choice), or (ii) using distributed sensors (e.g.,7]). The subsequent analysis is typically performed by applyingtate-of-the-art machine learning techniques [8] to recognize theresence of specific objects. This last problem is a notable examplef Automatic Audio Classification (AAC) [9], the task of automati-ally labeling a given audio signal in a set of predefined classes.enerally an AAC system works by subdividing the audio signal
n small, overlapping frames, extracting some statistical features,nd finally classifying them using a standard machine learning tool.ue to the reasons detailed above, AAC has been studied primar-
ly in the context of single-level applications, where the classes areestricted to a very specific domain. For example, there exists a vastiterature regarding speech discrimination [10–13], vehicle recog-ition [14–16] and weapon classification [17,18,7]. In addition, dueo the maturity of the field there exist several commercial and open-ource products that perform these tasks, such as the Halo system1
nd the Sphinx toolkit.2
If we consider a system with the need of performing more thanne of the aforementioned tasks, however, their combination isot as straightforward as it may appear. A complex, realistic clas-ification system has the need of being highly modular, flexible,nd hierarchical, topics that were only marginally considered inhe learning literature until the last decade [19]. Regarding AACor security monitoring, a small number of systems were proposedecently that undertake this direction, particularly by first separat-ng the speech detection problem from the non-speech detection.trey et al. [20] presented a four-level system for event detection.owever, they used a single sensor to gather information, and con-
idered only binary classification tasks. In our work, instead, weonsider an array composed of a large number of microphones, ande are interested in classifying a wide range of possible sources
f interest. Abu-El-Quran [21] and Zhao et al. [22] detail two sys-ems that, starting from a microphone array, perform at the sameime speech and non-speech recognition. Although their worksear some resemblance to the system we detail in this paper, theyere primarily meant for use in an indoor application, and theon-speech classification was performed in a single step. An earlypplication of the idea of multi-stage classification to an audiotream of data is described instead in [23].
In this paper, we detail the steps taken to design the variousomponents and select the appropriate learning tools. Moreover,e show how we explicitly take into account the presence of airistortion by the use of virtual examples [24], to make our systemobust to them. The result of this is a modular and flexible classi-cation system that efficiently combines several small classifiersy virtue of its own structure. Some preliminary simulation resultshow the effectiveness of the proposed architecture.
The rest of the paper is organized as follows. In Section 2 weescribe the general architecture of our system. Then, in Sections
and 4 we go into more detail with respect to the beamforming
nd classification operations, respectively. A brief analysis of theomputational cost of the proposed architecture is given in Section1 http://www.roke.co.uk/halo/2 http://cmusphinx.sourceforge.net/
mun. (AEÜ) 69 (2015) 1715–1723
5. Some empirical evaluations are presented in Section 6 and finallySection 7 concludes the paper.
2. General system architecture
The surveillance system described in this paper is based on amicrophone array acoustic antenna to be employed for detecting,localizing and classifying heterogeneous sources in severe outdoorscenarios.
The desired system specifications include the capability to oper-ate in a wide search volume that spans the angular interval [−45◦,45◦] in both the azimuth and the elevation directions. Moreover,this should be accomplished by using narrow listening beams with−3 dB aperture of few degrees. Both impulsive and continuousacoustic emissions should be taken into account with a coveragethat might reach 8 ÷ 10 km for high power sources. In particularthe considered sources should include vehicles, aircrafts, weaponsand spoken sources.
The conceived system architecture is described schematicallyin Fig. 1. The input of the system is provided by a square array of864 microphones mounted in a triangular lattice. The microphonesare considered to be omnidirectional and have a flat frequencyresponse in the acoustic band. The design choices pertaining theacoustic array sub-system are detailed in the following section.
A set of properly steered listening beams are extracted from themicrophones’ raw output by performing a standard delay-and-sumbeamforming operation [25,26]. At this stage, particular attentionhas been devoted to the design of appropriate strategies able toguarantee the required angular coverage even in the presence ofsources with an impulsive nature (see Section 3). Once the activesources have been detected and localized at some listening beams,the corresponding signals are fed to the input of the processingstages responsible for the sources classification. This represents avery challenging task owing to the need to classify highly heteroge-neous sources, possibly active at the same time in the environment.
To this purpose each of the designated beams’ outputs is splitin small audio frames, from which a collection of 42 statisticaldescriptors are extracted. The features are then passed as input toa hierarchical classification system that categorize them on eachof the classes that we considered. The overall classifier is com-posed of four, modular stages requiring smaller binary classifiers.This allows to subdivide the original learning tasks into a series ofsmaller and simpler tasks that are efficiently solved by each of theclassifier’s modules. The detailed description of the innovative clas-sification technique proposed in this paper are reported in Sections4 and 6.
3. Beamforming
In its resting position, the microphone array consists of Nmicmicrophones arranged on a planar surface (2D array). As it is wellknown, by jointly processing the signals collected at the availablemicrophones it is possible to synthesize a listening beam steeredtowards the selected search angular quantum. The electronic steer-ing is obtained by summing the received signals after propercompensation of the different delays induced at each microphone,so that the contributions from a given direction are coherently inte-grated (so-called delay-and-sum beamforming [27,26]). This resultsin a significant improvement with respect to the single microphonesince the listening beam shows a much higher gain and increasedangular discrimination capability due to the extremely narrower
beam-width.With reference to the SMART-OPTIGRID project, aiming atlimiting the final array dimensions, the beamformer has beendesigned to guarantee a listening beam with −3 dB aperture of

S. Scardapane et al. / Int. J. Electron. Commun. (AEÜ) 69 (2015) 1715–1723 1717
Beamforming
Sourcelocalization
Featur
eExtraction
Multi-stageClassifier
Class 1
Class 2
Class 3
Class 4
Class 5
Class N
MicrophoneArray
Fig. 1. Schematic representation of the overall SMART-OPTIGRID system.
d
d3d
34s
dSshtmol
pnal
amaad
lbeew
wlt
Obviously the beam-width broadens as the listening beam issteered and when a tapering function is applied. As an exam-ple, Fig. 4 shows the pattern steered at (30◦, −30◦) in elevation
Fig. 2. Equilateral triangular lattice used for the microphone array.
◦ in both azimuth and elevation at the operating frequency of kHz when the beam is steered towards 0◦. Consequently a squaredhape has been selected where each side is about 1.5 m long.
The distance d between microphones has been carefullyesigned to avoid ambiguities appearing in the array pattern shape.pecifically this condition should be preserved when varying theteering direction within the angular sector to be monitored. Thisas been obtained by arranging the microphones on an equilateralriangular lattice shown in Fig. 2. It is worth noticing that the imple-
entation of this lattice might imply a significant saving in termf required microphones with respect to the standard rectangularattice.
Based on this choice, the distance between adjacent micro-hones should be lower than 5.59 cm. By setting d = 5.5 cm, theumber of required microphones is obtained equal to 864; thesere arranged on 64 rows and 27 columns elements following theattice depicted in Fig. 2.
Notice that the use of this huge number of microphones yields theoretical gain of about 30 dB in terms of signal to noise ratio;oreover it makes the system robust to amplitude and phase noise
ffecting the microphones since this effect is compensated by aver-ging over the many microphones if the considered noise is randomistributed [28].
Finally, the use of tapering functions has been considered toower the pattern sidelobes typically appearing at 13 dB below theeam peak. To this purpose, among all solutions available in lit-rature, due to its efficiency a Taylor weighting function has beenmployed, which allows to trade the sidelobe level with the beam-idth broadening [29].
An example of a 2D listening beam pattern is reported in Fig. 3◦
hen it is steered at 0 in both azimuth and elevation without side-obes control. In this configuration, the maximum SNR gain is equalo 29.36 dB and the highest sidelobe is 13.26 dB below the peak. The
Fig. 3. Pattern steered at (0◦ , 0◦): a 2D representation.
main lobe apertures at −3 dB in elevation and azimuth are ı� = 2.85◦
and ı� = 2.92◦, respectively.
Fig. 4. Pattern steered at (30◦ , −30◦) with amplitude tapering: a 2D representation.

1718 S. Scardapane et al. / Int. J. Electron. Com
Fa
air
sbsebttstaao−wbsefTtslscrttee
4
ticIta
ig. 5. Strategy for the coverage of the search volume and detection/localizationpproach.
nd azimuth, respectively, when using a Taylor amplitude taper-ng function that lowers the sidelobes level down to −35 dB withespect to the beam peak.
Steering the listening beam towards a given direction allows toearch for acoustic sources included in the angular sector definedy the beam-width. In this regard we recall that the consideredystem should be able to detect and classify also acoustic sourcesmitting impulsive sounds. Therefore the search function cannote performed by sequential scanning the listening beam withinhe search volume. In contrast, multiple beams should be con-emporaneously formed with steering angles properly displacedo that the required angular coverage is instantaneously guaran-eed. Obviously, the cluster of beams should be carefully designediming at limiting the maximum number of beams while yielding
partial overlapping among adjacent beams. The obtained clusterf beams is depicted in Fig. 5 where black perimeters represent the3 dB contours of beam patterns at the operative frequency of 4 kHzithout amplitude tapering. The source detection can be achieved
y searching among all the listening beams for the ones yieldingignals with power level exceeding a predetermined threshold. Forxample, in Fig. 5, we report the output for the case of two dif-erent sources from directions (30◦, 30◦) and (0◦, 0◦), respectively.he first source emits a continuous sound (like a car engine), whilehe second source is responsible for an impulsive sound (i.e., riflehot). They are received such that the impulsive sound SNR is 3 dBower than the distributed noise SNR. Different colors are repre-entative of different power levels (in dB) registered at the beamsonstituting the cluster. Once the sources have been detected, aough localization is obtained by assigning to the detected sourcehe steering angle of the beam in the cluster where the detec-ion occurred. Finally the localization procedure can be refined byxploiting a denser cluster of beams formed around the first anglestimate.
. Multi-level classifier
In this section we detail the development of the feature extrac-ion and classification blocks of Fig. 1. With respect to the former, anmportant aspect is the use of a large, heterogeneous set of statisti-
al descriptors, able to cope with a large range of possible sources.n the latter, instead, we introduce a modular four-level classifica-ion stage, and we show how to take into account the presence ofir distortions by the use of so-called virtual examples.mun. (AEÜ) 69 (2015) 1715–1723
4.1. Feature extraction
This module receives from the previous stages a set of recon-structed audio signals, one for each window in which a soundsource has been localized. Each signal is initially segmented insmall superframes of 200 ms, with an overlap of 50%. To detect thepresence of silence, superframes are on turn segmented in smallerframes of 50 ms with no overlap. If the Root Mean Square (RMS) [9]of a frame is under −30 dB, the frame is discarded as silence. Thesuperframe is then reconstructed from the remaining constituentframes.
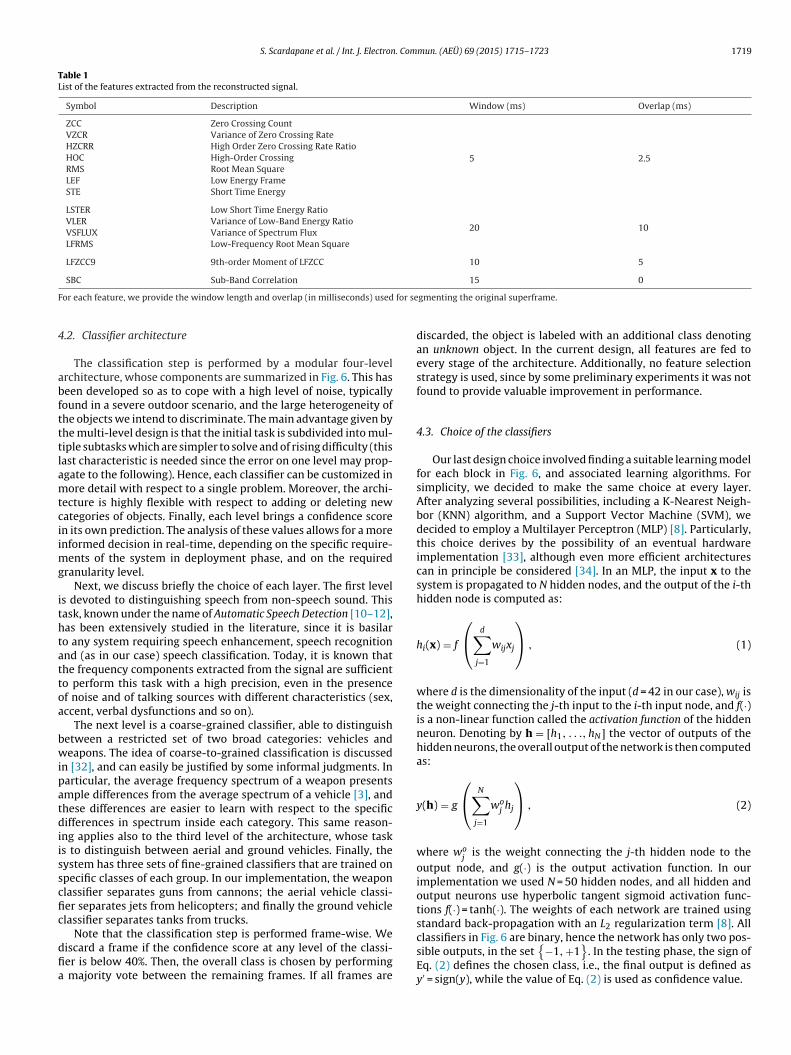
Next, 42 features are extracted from each superframe, andpassed as input to the classifier for the discrimination process. Eachfeature is obtained by segmenting again the superframe in smallerframes, computing a given descriptor for each subframe, and thenretaining only some overall statistics on the computed values. Eachcomputation uses a subframe of different length and overlap. InTable 1 we have collected the name of the features, and the spe-cific window size and overlap used for each one. The descriptorshave been chosen so as to efficiently represent different domainsof the audio signal: characteristics such as the ZCC or the RMS areextracted in the time domain, whilst VSFLUX or SBC pertain to thefrequency domain. The reason is that the utility of each descrip-tor changes depending on the nature of the task. As an example,time-domain descriptors are particularly useful whenever we areinterested in discriminating sounds of impulsive nature. Due to theheterogeneity of our classification task, a good amount of work hasbeen spent in optimizing the set described in Table 1, without mak-ing the computational load on the system too expensive. For thispurpose, we have decided to discard cepstral features since theircomputation is notoriously complex and time-consuming. For com-pleteness, in the following we provide a brief description for eachfeature. For a comprehensive explanation of each feature, we referto [9] and references therein.
The Zero Crossing Count (ZCC) is defined as the number of timesthe signal reverses its sign. The values of the ZCC over the sub-frames are subdivided into 10 bins, and the normalized frequenciesof these bins are used as features for the superframe, together withthe variance of the ZCC values (denoted as VZCR). Another featureextracted here is the High Order ZCC Ratio (HZCRR), defined as theratio of the number of frames whose ZCC is above 1.5 times theaverage ZCC of the superframe.
The RMS of each superframe is also computed. As before, theRMS values are subdivided into 10 bins, the bins are normalized,and their relative frequencies are used as features. Additionally, wecompute the ratio of Low Energy Frames (LEF), i.e., the ratio of frameswhose RMS is lower than 50% the average RMS for the superframe.The mean value of a similar feature, the Short Time Energy (STE) [9],is also computed. Then, we extract the Low Short Time Energy Ratio(LSTER), defined as the ratio of the number of frames whose STE isless than half the average STE of the superframe.
For the following features the superframe is convolved with alow-pass filter to retain only the frequencies between 1.5 kHz and1.6 kHz. Both the low-band superframe and the original superframeare then segmented. The Low-Band Energy Ratio (VLER) is definedas the variance of the ratio of the low-band STE to the whole bandSTE. Next, the variance of the Spectral Flux (VSFLUX) is computed,where the spectral flux is defined as the 2-norm between the fre-quency spectra of the current frame and of the previous frame.An additional feature computed here is the Low Frequency RMS(LFRMS), where the LFRMS is defined as the median of the RMS ofthe low-band version of the frame. The Low Frequency ZCC (LFZCC)
is computed as the 9-th moment of the ZCC values of the frames.Additionally, we compute the Sub-Band Correlation (SBC) [30]for 4 different filters of increasing frequencies, and the High-OrderCrossing (HOC) [31] up to the 4-th order.
S. Scardapane et al. / Int. J. Electron. Commun. (AEÜ) 69 (2015) 1715–1723 1719
Table 1List of the features extracted from the reconstructed signal.
Symbol Description Window (ms) Overlap (ms)
ZCC Zero Crossing Count
5 2.5
VZCR Variance of Zero Crossing RateHZCRR High Order Zero Crossing Rate RatioHOC High-Order CrossingRMS Root Mean SquareLEF Low Energy FrameSTE Short Time Energy
LSTER Low Short Time Energy Ratio
20 10VLER Variance of Low-Band Energy RatioVSFLUX Variance of Spectrum FluxLFRMS Low-Frequency Root Mean Square
LFZCC9 9th-order Moment of LFZCC 10 5
F for se
4
abftttlamtciimg
ithtattoa
bwipatdiisscfic
dfia
SBC Sub-Band Correlation
or each feature, we provide the window length and overlap (in milliseconds) used
.2. Classifier architecture
The classification step is performed by a modular four-levelrchitecture, whose components are summarized in Fig. 6. This haseen developed so as to cope with a high level of noise, typicallyound in a severe outdoor scenario, and the large heterogeneity ofhe objects we intend to discriminate. The main advantage given byhe multi-level design is that the initial task is subdivided into mul-iple subtasks which are simpler to solve and of rising difficulty (thisast characteristic is needed since the error on one level may prop-gate to the following). Hence, each classifier can be customized inore detail with respect to a single problem. Moreover, the archi-
ecture is highly flexible with respect to adding or deleting newategories of objects. Finally, each level brings a confidence scoren its own prediction. The analysis of these values allows for a morenformed decision in real-time, depending on the specific require-
ents of the system in deployment phase, and on the requiredranularity level.
Next, we discuss briefly the choice of each layer. The first levels devoted to distinguishing speech from non-speech sound. Thisask, known under the name of Automatic Speech Detection [10–12],as been extensively studied in the literature, since it is basilaro any system requiring speech enhancement, speech recognitionnd (as in our case) speech classification. Today, it is known thathe frequency components extracted from the signal are sufficiento perform this task with a high precision, even in the presencef noise and of talking sources with different characteristics (sex,ccent, verbal dysfunctions and so on).
The next level is a coarse-grained classifier, able to distinguishetween a restricted set of two broad categories: vehicles andeapons. The idea of coarse-to-grained classification is discussed
n [32], and can easily be justified by some informal judgments. Inarticular, the average frequency spectrum of a weapon presentsmple differences from the average spectrum of a vehicle [3], andhese differences are easier to learn with respect to the specificifferences in spectrum inside each category. This same reason-
ng applies also to the third level of the architecture, whose tasks to distinguish between aerial and ground vehicles. Finally, theystem has three sets of fine-grained classifiers that are trained onpecific classes of each group. In our implementation, the weaponlassifier separates guns from cannons; the aerial vehicle classi-er separates jets from helicopters; and finally the ground vehiclelassifier separates tanks from trucks.
Note that the classification step is performed frame-wise. Weiscard a frame if the confidence score at any level of the classi-er is below 40%. Then, the overall class is chosen by performing
majority vote between the remaining frames. If all frames are
15 0
gmenting the original superframe.
discarded, the object is labeled with an additional class denotingan unknown object. In the current design, all features are fed toevery stage of the architecture. Additionally, no feature selectionstrategy is used, since by some preliminary experiments it was notfound to provide valuable improvement in performance.
4.3. Choice of the classifiers
Our last design choice involved finding a suitable learning modelfor each block in Fig. 6, and associated learning algorithms. Forsimplicity, we decided to make the same choice at every layer.After analyzing several possibilities, including a K-Nearest Neigh-bor (KNN) algorithm, and a Support Vector Machine (SVM), wedecided to employ a Multilayer Perceptron (MLP) [8]. Particularly,this choice derives by the possibility of an eventual hardwareimplementation [33], although even more efficient architecturescan in principle be considered [34]. In an MLP, the input x to thesystem is propagated to N hidden nodes, and the output of the i-thhidden node is computed as:
hi(x) = f
⎛⎝
d∑j=1
wijxj
⎞⎠ , (1)
where d is the dimensionality of the input (d = 42 in our case), wij isthe weight connecting the j-th input to the i-th input node, and f(·)is a non-linear function called the activation function of the hiddenneuron. Denoting by h = [h1, . . ., hN] the vector of outputs of thehidden neurons, the overall output of the network is then computedas:
y(h) = g
⎛⎝
N∑j=1
woj hj
⎞⎠ , (2)
where woj
is the weight connecting the j-th hidden node to theoutput node, and g(·) is the output activation function. In ourimplementation we used N = 50 hidden nodes, and all hidden andoutput neurons use hyperbolic tangent sigmoid activation func-tions f(·) = tanh(·). The weights of each network are trained usingstandard back-propagation with an L2 regularization term [8]. All
classifiers in Fig. 6 are binary, hence the network has only two pos-sible outputs, in the set{−1, +1
}. In the testing phase, the sign of
Eq. (2) defines the chosen class, i.e., the final output is defined asy′ = sign(y), while the value of Eq. (2) is used as confidence value.

1720 S. Scardapane et al. / Int. J. Electron. Commun. (AEÜ) 69 (2015) 1715–1723
Fig. 6. Schema of the clas
Table 2Variables used in the analysis of Section 5.
Symbol Description Value
m Number of microphones 864B Number of beams 615L Number of samples 1024fs Sampling frequency 16 kHzTb Frame duration (beamforming) 64 msTc Frame duration (classification) 200 msd Number of features 42N Hidden nodes for each MLP 50
V
5
ccworssintvos
coTtdfSb
S Recovered sources 1–5
alues considered in the proposed system are provided in the third column.
. Considerations on the computational cost
In this section we provide a brief analysis of the computationalost required by the proposed system. In particular, we discuss theost required by the beamforming and classification operations,hen performed on a standard CUDA architecture [35], in term
f FLoating point OPerations (FLOPs) and FLOP per Second (FLOPS)espectively. To provide a flexible analysis, we consider a generaletting with a variable number of microphones, beams, etc. All theymbols that are used next are summarized in Table 2. For simplic-ty, we suppose that the GPU memory is sufficient to store all theecessary matrices and vectors, and we neglect the time requiredo transfer back and forth data from the CPU to the GPU and viceersa. A thorough analysis of these aspects goes beyond the scopef the current paper, and would require a deeper knowledge of theystem’s components.
With respect to the beamforming operation, in our analysis weonsidered the possibility to guarantee a simultaneous coveragef the desired angular sector with a fixed number of beams B.he operations to steer a beam towards a desired direction arewofold: (1) the computation of the weights to be applied to the
ata collected by each microphone in the array and (2) the beam-orming, that hereinafter is considered to operate the Delay andum operations in the frequency domain. The computation of theeamforming weights is performed just once for all the beams thatsifier architecture.
we want to form. This means that the evaluated coefficients do notneed to be computed for each frame, and they can be evaluatedoffline and stored in a memory to be accessed when needed bythe digital beamformer. On the other end the application of thesecoefficients needs to be repeated for each frame to form the desiredbeams in the angular sector of interest. This goal is achieved in foursteps: (1) amplitude weighting applied to the signal received byeach microphone in the array to lower the sidelobes of the formedpattern, (2) FFT of the signal received by each array element, (3)weighted sum of the signal from all the microphones in each fre-quency bin for each beam to form, and finally, (4) IFFT of the outputsamples for each formed beam. It is possible to verify that the num-ber of required operations is:
Cbeam = L[m(1 + 2.5log2(L) + 4B) + B(log2(L) − 1)] FLOPs. (3)
Each recovered signal is then segmented in superframes of lengthTc as detailed in Section 4.1. The analysis of the feature extrac-tion part is extremely hard to perform analytically, and it woulddepend strictly on the hardware components. However, previousworks have shown it to be particularly efficient [36], and for thisreason we consider here a fixed overhead of Cfeat for each frame.With respect to the classification part, training is performed offlineand is not considered here. Additionally, we analyze the worst-casescenario, in which no silence is present in the recovered signals, andall superframes are analyzed. For a prediction, each MLP in Fig. 6requires a vector–matrix multiplication followed by the applica-tion of a nonlinearity, and these operations are repeated twice foreach layer. If we suppose that the nonlinearity is implemented viaa standard lookup table, the classification cost is then:
Cclass ≈ P [dN + 2N + 1] FLOPs, (4)
where P is the number of MLPs that are activated in the tree hier-archy of Fig. 6. Considering the values in Table 2, we find that theoverall beamforming operation requires 34.85 GFLOPS, so that the
overall cost is:Ctot ≈ 34.85 + S
Tc
[Cfeat + P
(2 × 10⁻⁶
)]GFLOPS. (5)
. Commun. (AEÜ) 69 (2015) 1715–1723 1721
CbtQG
flcsttfsbiawltebtc
6
sopdoontt
6
euTmi1dfpotrttt[
apAfir
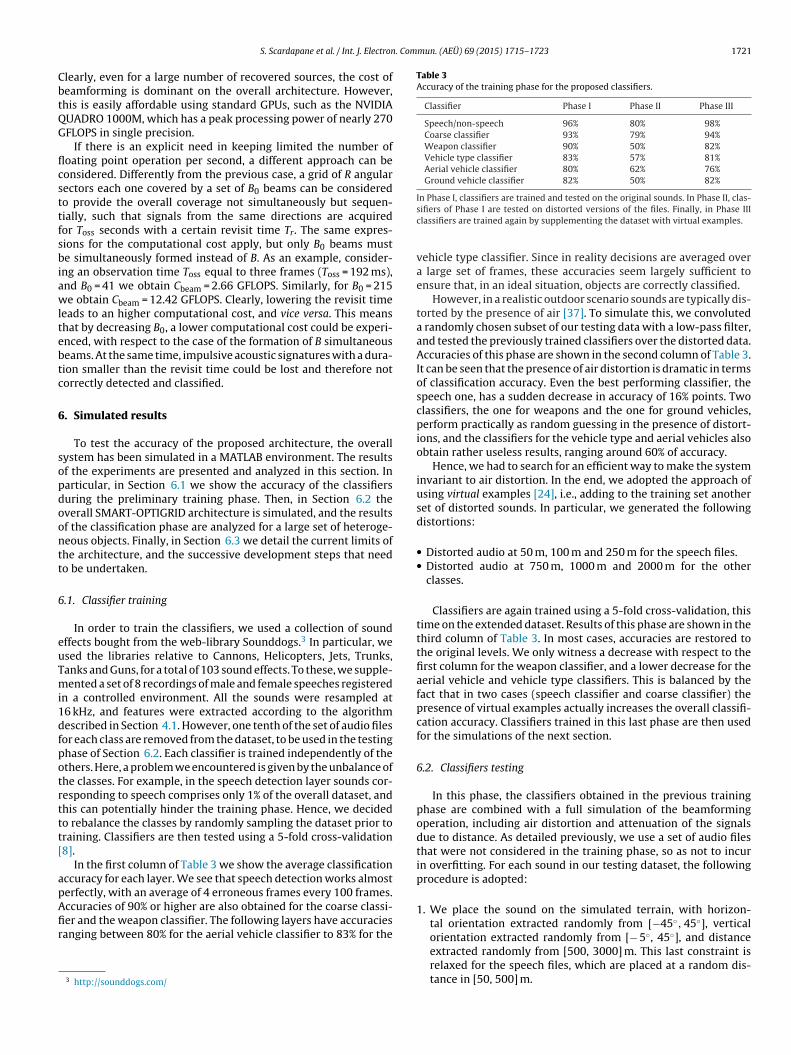
Table 3Accuracy of the training phase for the proposed classifiers.
Classifier Phase I Phase II Phase III
Speech/non-speech 96% 80% 98%Coarse classifier 93% 79% 94%Weapon classifier 90% 50% 82%Vehicle type classifier 83% 57% 81%Aerial vehicle classifier 80% 62% 76%Ground vehicle classifier 82% 50% 82%
In Phase I, classifiers are trained and tested on the original sounds. In Phase II, clas-
S. Scardapane et al. / Int. J. Electron
learly, even for a large number of recovered sources, the cost ofeamforming is dominant on the overall architecture. However,his is easily affordable using standard GPUs, such as the NVIDIAUADRO 1000M, which has a peak processing power of nearly 270FLOPS in single precision.
If there is an explicit need in keeping limited the number ofoating point operation per second, a different approach can beonsidered. Differently from the previous case, a grid of R angularectors each one covered by a set of B0 beams can be consideredo provide the overall coverage not simultaneously but sequen-ially, such that signals from the same directions are acquiredor Toss seconds with a certain revisit time Tr. The same expres-ions for the computational cost apply, but only B0 beams muste simultaneously formed instead of B. As an example, consider-
ng an observation time Toss equal to three frames (Toss = 192 ms),nd B0 = 41 we obtain Cbeam = 2.66 GFLOPS. Similarly, for B0 = 215e obtain Cbeam = 12.42 GFLOPS. Clearly, lowering the revisit time
eads to an higher computational cost, and vice versa. This meanshat by decreasing B0, a lower computational cost could be experi-nced, with respect to the case of the formation of B simultaneouseams. At the same time, impulsive acoustic signatures with a dura-ion smaller than the revisit time could be lost and therefore notorrectly detected and classified.
. Simulated results
To test the accuracy of the proposed architecture, the overallystem has been simulated in a MATLAB environment. The resultsf the experiments are presented and analyzed in this section. Inarticular, in Section 6.1 we show the accuracy of the classifiersuring the preliminary training phase. Then, in Section 6.2 theverall SMART-OPTIGRID architecture is simulated, and the resultsf the classification phase are analyzed for a large set of heteroge-eous objects. Finally, in Section 6.3 we detail the current limits ofhe architecture, and the successive development steps that needo be undertaken.
.1. Classifier training
In order to train the classifiers, we used a collection of soundffects bought from the web-library Sounddogs.3 In particular, wesed the libraries relative to Cannons, Helicopters, Jets, Trunks,anks and Guns, for a total of 103 sound effects. To these, we supple-ented a set of 8 recordings of male and female speeches registered
n a controlled environment. All the sounds were resampled at6 kHz, and features were extracted according to the algorithmescribed in Section 4.1. However, one tenth of the set of audio filesor each class are removed from the dataset, to be used in the testinghase of Section 6.2. Each classifier is trained independently of thethers. Here, a problem we encountered is given by the unbalance ofhe classes. For example, in the speech detection layer sounds cor-esponding to speech comprises only 1% of the overall dataset, andhis can potentially hinder the training phase. Hence, we decidedo rebalance the classes by randomly sampling the dataset prior toraining. Classifiers are then tested using a 5-fold cross-validation8].
In the first column of Table 3 we show the average classificationccuracy for each layer. We see that speech detection works almost
erfectly, with an average of 4 erroneous frames every 100 frames.ccuracies of 90% or higher are also obtained for the coarse classi-er and the weapon classifier. The following layers have accuraciesanging between 80% for the aerial vehicle classifier to 83% for the3 http://sounddogs.com/
sifiers of Phase I are tested on distorted versions of the files. Finally, in Phase IIIclassifiers are trained again by supplementing the dataset with virtual examples.
vehicle type classifier. Since in reality decisions are averaged overa large set of frames, these accuracies seem largely sufficient toensure that, in an ideal situation, objects are correctly classified.
However, in a realistic outdoor scenario sounds are typically dis-torted by the presence of air [37]. To simulate this, we convoluteda randomly chosen subset of our testing data with a low-pass filter,and tested the previously trained classifiers over the distorted data.Accuracies of this phase are shown in the second column of Table 3.It can be seen that the presence of air distortion is dramatic in termsof classification accuracy. Even the best performing classifier, thespeech one, has a sudden decrease in accuracy of 16% points. Twoclassifiers, the one for weapons and the one for ground vehicles,perform practically as random guessing in the presence of distort-ions, and the classifiers for the vehicle type and aerial vehicles alsoobtain rather useless results, ranging around 60% of accuracy.
Hence, we had to search for an efficient way to make the systeminvariant to air distortion. In the end, we adopted the approach ofusing virtual examples [24], i.e., adding to the training set anotherset of distorted sounds. In particular, we generated the followingdistortions:
• Distorted audio at 50 m, 100 m and 250 m for the speech files.• Distorted audio at 750 m, 1000 m and 2000 m for the other
classes.
Classifiers are again trained using a 5-fold cross-validation, thistime on the extended dataset. Results of this phase are shown in thethird column of Table 3. In most cases, accuracies are restored tothe original levels. We only witness a decrease with respect to thefirst column for the weapon classifier, and a lower decrease for theaerial vehicle and vehicle type classifiers. This is balanced by thefact that in two cases (speech classifier and coarse classifier) thepresence of virtual examples actually increases the overall classifi-cation accuracy. Classifiers trained in this last phase are then usedfor the simulations of the next section.
6.2. Classifiers testing
In this phase, the classifiers obtained in the previous trainingphase are combined with a full simulation of the beamformingoperation, including air distortion and attenuation of the signalsdue to distance. As detailed previously, we use a set of audio filesthat were not considered in the training phase, so as not to incurin overfitting. For each sound in our testing dataset, the followingprocedure is adopted:
1. We place the sound on the simulated terrain, with horizon-tal orientation extracted randomly from [−45◦, 45◦], vertical
◦ ◦
orientation extracted randomly from [− 5 , 45 ], and distanceextracted randomly from [500, 3000] m. This last constraint isrelaxed for the speech files, which are placed at a random dis-tance in [50, 500] m.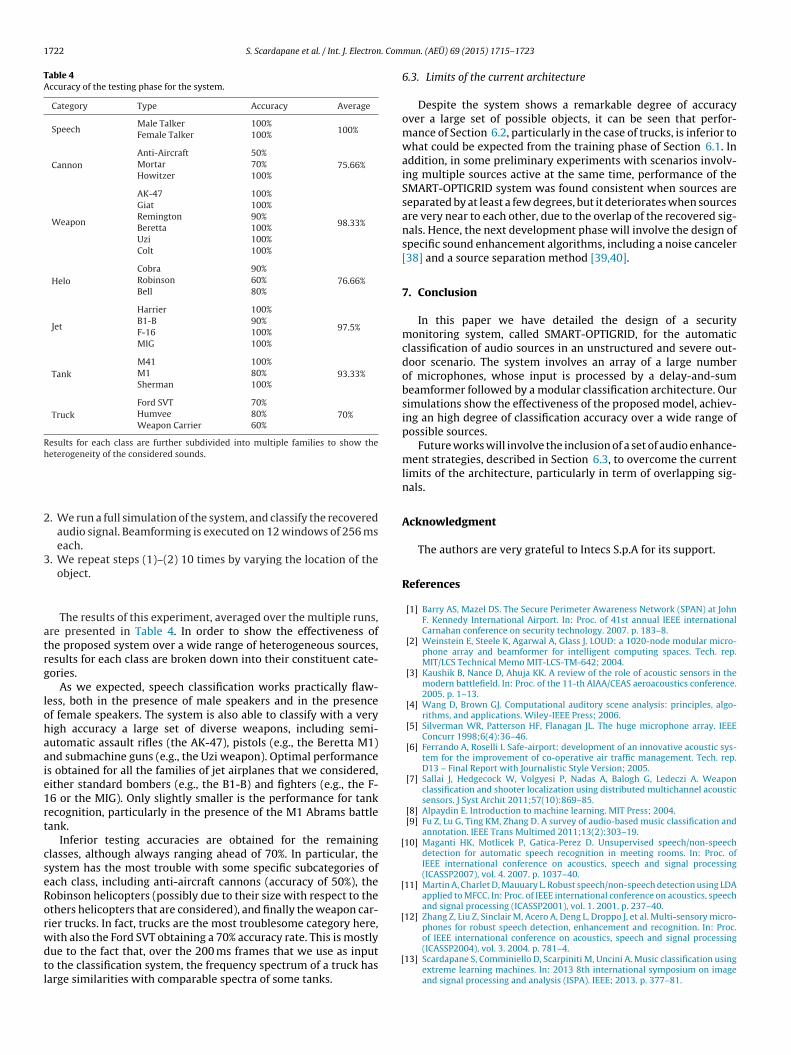
1722 S. Scardapane et al. / Int. J. Electron. Com
Table 4Accuracy of the testing phase for the system.
Category Type Accuracy Average
SpeechMale Talker 100%
100%Female Talker 100%
CannonAnti-Aircraft 50%
75.66%Mortar 70%Howitzer 100%
Weapon
AK-47 100%
98.33%
Giat 100%Remington 90%Beretta 100%Uzi 100%Colt 100%
HeloCobra 90%
76.66%Robinson 60%Bell 80%
Jet
Harrier 100%
97.5%B1-B 90%F-16 100%MIG 100%
TankM41 100%
93.33%M1 80%Sherman 100%
TruckFord SVT 70%
70%Humvee 80%Weapon Carrier 60%
Results for each class are further subdivided into multiple families to show theheterogeneity of the considered sounds.
2
3
atrg
lohaaie1rt
cseRorwdtl
[
[
[
of IEEE international conference on acoustics, speech and signal processing(ICASSP2004), vol. 3. 2004. p. 781–4.
[13] Scardapane S, Comminiello D, Scarpiniti M, Uncini A. Music classification using
. We run a full simulation of the system, and classify the recoveredaudio signal. Beamforming is executed on 12 windows of 256 mseach.
. We repeat steps (1)–(2) 10 times by varying the location of theobject.
The results of this experiment, averaged over the multiple runs,re presented in Table 4. In order to show the effectiveness ofhe proposed system over a wide range of heterogeneous sources,esults for each class are broken down into their constituent cate-ories.
As we expected, speech classification works practically flaw-ess, both in the presence of male speakers and in the presencef female speakers. The system is also able to classify with a veryigh accuracy a large set of diverse weapons, including semi-utomatic assault rifles (the AK-47), pistols (e.g., the Beretta M1)nd submachine guns (e.g., the Uzi weapon). Optimal performances obtained for all the families of jet airplanes that we considered,ither standard bombers (e.g., the B1-B) and fighters (e.g., the F-6 or the MIG). Only slightly smaller is the performance for tankecognition, particularly in the presence of the M1 Abrams battleank.
Inferior testing accuracies are obtained for the remaininglasses, although always ranging ahead of 70%. In particular, theystem has the most trouble with some specific subcategories ofach class, including anti-aircraft cannons (accuracy of 50%), theobinson helicopters (possibly due to their size with respect to thethers helicopters that are considered), and finally the weapon car-ier trucks. In fact, trucks are the most troublesome category here,ith also the Ford SVT obtaining a 70% accuracy rate. This is mostlyue to the fact that, over the 200 ms frames that we use as input
o the classification system, the frequency spectrum of a truck hasarge similarities with comparable spectra of some tanks.mun. (AEÜ) 69 (2015) 1715–1723
6.3. Limits of the current architecture
Despite the system shows a remarkable degree of accuracyover a large set of possible objects, it can be seen that perfor-mance of Section 6.2, particularly in the case of trucks, is inferior towhat could be expected from the training phase of Section 6.1. Inaddition, in some preliminary experiments with scenarios involv-ing multiple sources active at the same time, performance of theSMART-OPTIGRID system was found consistent when sources areseparated by at least a few degrees, but it deteriorates when sourcesare very near to each other, due to the overlap of the recovered sig-nals. Hence, the next development phase will involve the design ofspecific sound enhancement algorithms, including a noise canceler[38] and a source separation method [39,40].
7. Conclusion
In this paper we have detailed the design of a securitymonitoring system, called SMART-OPTIGRID, for the automaticclassification of audio sources in an unstructured and severe out-door scenario. The system involves an array of a large numberof microphones, whose input is processed by a delay-and-sumbeamformer followed by a modular classification architecture. Oursimulations show the effectiveness of the proposed model, achiev-ing an high degree of classification accuracy over a wide range ofpossible sources.
Future works will involve the inclusion of a set of audio enhance-ment strategies, described in Section 6.3, to overcome the currentlimits of the architecture, particularly in term of overlapping sig-nals.
Acknowledgment
The authors are very grateful to Intecs S.p.A for its support.
References
[1] Barry AS, Mazel DS. The Secure Perimeter Awareness Network (SPAN) at JohnF. Kennedy International Airport. In: Proc. of 41st annual IEEE internationalCarnahan conference on security technology. 2007. p. 183–8.
[2] Weinstein E, Steele K, Agarwal A, Glass J. LOUD: a 1020-node modular micro-phone array and beamformer for intelligent computing spaces. Tech. rep.MIT/LCS Technical Memo MIT-LCS-TM-642; 2004.
[3] Kaushik B, Nance D, Ahuja KK. A review of the role of acoustic sensors in themodern battlefield. In: Proc. of the 11-th AIAA/CEAS aeroacoustics conference.2005. p. 1–13.
[4] Wang D, Brown GJ. Computational auditory scene analysis: principles, algo-rithms, and applications. Wiley-IEEE Press; 2006.
[5] Silverman WR, Patterson HF, Flanagan JL. The huge microphone array. IEEEConcurr 1998;6(4):36–46.
[6] Ferrando A, Roselli I. Safe-airport: development of an innovative acoustic sys-tem for the improvement of co-operative air traffic management. Tech. rep.D13 – Final Report with Journalistic Style Version; 2005.
[7] Sallai J, Hedgecock W, Volgyesi P, Nadas A, Balogh G, Ledeczi A. Weaponclassification and shooter localization using distributed multichannel acousticsensors. J Syst Archit 2011;57(10):869–85.
[8] Alpaydin E. Introduction to machine learning. MIT Press; 2004.[9] Fu Z, Lu G, Ting KM, Zhang D. A survey of audio-based music classification and
annotation. IEEE Trans Multimed 2011;13(2):303–19.10] Maganti HK, Motlicek P, Gatica-Perez D. Unsupervised speech/non-speech
detection for automatic speech recognition in meeting rooms. In: Proc. ofIEEE international conference on acoustics, speech and signal processing(ICASSP2007), vol. 4. 2007. p. 1037–40.
11] Martin A, Charlet D, Mauuary L. Robust speech/non-speech detection using LDAapplied to MFCC. In: Proc. of IEEE international conference on acoustics, speechand signal processing (ICASSP2001), vol. 1. 2001. p. 237–40.
12] Zhang Z, Liu Z, Sinclair M, Acero A, Deng L, Droppo J, et al. Multi-sensory micro-phones for robust speech detection, enhancement and recognition. In: Proc.
extreme learning machines. In: 2013 8th international symposium on imageand signal processing and analysis (ISPA). IEEE; 2013. p. 377–81.

. Com
[
[
[
[
[
[
[
[
[
[
[
[
[
[[
[
[
[
[
[
[
[[
[[
[39] Comon P, Jutten C. Handbook of blind source separation: independent compo-
S. Scardapane et al. / Int. J. Electron
14] Duarte MF, Hu YH. Vehicle classification in distributed sensor networks. J Par-allel Distrib Comput 2004;64(7):826–38.
15] Hsieh J-W, Yu S-H, Chen Y-S, Hu W-F. Automatic traffic surveillance sys-tem for vehicle tracking and classification. IEEE Trans Intell Transp Syst2006;7(2):175–87.
16] Li D, Wong KD, Hu YH, Sayeed AM. Detection, classification, and tracking oftargets. IEEE Signal Process Mag 2002;19(2):17–29.
17] Jin X, Mukherjee K, Gupta S, Ray A, Phoha S, Damarla T. Asyn-chronous data-driven classification of weapon systems. Meas Sci Technol2009;20(12):123001.
18] Al-Qubaa A, Tian GY, Wilson J. Electromagnetic imaging system for weapondetection and classification. In: Proc. of the fifth international conference onsensor technologies and applications. 2011. p. 317–21.
19] Senator TE. Multi-stage classification. In: Proc. of the 2005 IEEE internationalconference on data mining, vol. 5. 2005. p. 386–93.
20] Atrey PK, Maddage NC, Kankanhalli MS. Audio based event detection for mul-timedia surveillance. In: Proc. of IEEE international conference on acoustics,speech and signal processing (ICASSP2006), vol. 5. 2006. p. 1–5.
21] Abu-El-Quran A. Security monitoring using microphone arrays and audio clas-sification. IEEE Trans Instrum Meas 2006;55(4):1025–32.
22] Zhao D, Ma H, Liu L. Event classification for living environment surveillanceusing audio sensor networks. In: Proc. of IEEE international conference onmultimedia and expo (ICME2010). 2010. p. 528–33.
23] Zhou N, Ser W, Yu Z, Yu J, Chen H. Enhanced class-dependent clas-sification of audio signals. In: Proc. of 2009 WRI world congress oncomputer science and information engineering, vol. 7. 2009. p. 100–4,http://dx.doi.org/10.1109/CSIE.2009.664.
24] Niyogi P, Girosi F, Poggio T. Incorporating prior information in machine learning
by creating virtual examples. Proc IEEE 1998;86(11).25] Van Veen BD, Buckley KM. Beamforming: a versatile approach to spatial filter-ing. IEEE ASSP Mag 1988;5(2):4–24.
26] Brandstein M, Ward D, editors. Microphone arrays: signal processing tech-niques and applications. Springer; 2001.
[
mun. (AEÜ) 69 (2015) 1715–1723 1723
27] Van Trees HL. Optimum array processing. Wiley; 2002.28] Caronna G, Roselli I, Testa P, Barbagelata A. Acoustic system for aircraft detec-
tion and tracking based on passive microphones arrays. In: Proc. of 148thmeeting of the acoustical society of America. 2004.
29] Oppenheim AV, Schafer RW, Buck JR. Discrete-time signal processing. 2nd ed.Prentice-Hall; 1999.
30] McAuley J, Ming J, Stewart D, Hanna P. Subband correlation and robust speechrecognition. IEEE Trans Speech Audio Process 2005;13(5):956–64.
31] Petrantonakis PC, Hadjileontiadis LJ. Emotion recognition from EEG usinghigher order crossings. IEEE Trans Inf Technol Biomed 2010;14(2):186–97.
32] Basu S, Chaudhuri C, Kundu M, Nasipuri M, Basu DK. A two-pass approachto pattern classification. In: Neural information processing. Springer; 2004. p.781–6.
33] Misra J, Saha I. Artificial neural networks in hardware: a survey of two decadesof progress. Neurocomputing 2010;74(1):239–55.
34] Scardapane S, Comminiello D, Scarpiniti M, Uncini A. Online sequential extremelearning machine with kernels. IEEE Trans Neural Netw Learning Syst 2014,http://dx.doi.org/10.1109/TNNLS.2014.2382094.
35] NVIDIA CUDA C programming guide (Version 4.2 – 4/16/12).36] Schmadecke I, Morschbach J, Blume H. GPU-based acoustic feature extraction
for electronic media processing. In: 2011 14th ITG conference on electronicmedia technology (CEMT’11). IEEE; 2011. p. 1–6.
37] Fahy F. Foundations of engineering acoustics. Elsevier; 2000.38] Comminiello D, Scarpiniti M, Parisi R, Uncini A. Combined adaptive beam-
forming schemes for nonstationary interfering noise reduction. Signal Process2013;93(12):3306–18.
nent analysis and applications. Academic press; 2010.40] Scarpiniti M, Vigliano D, Parisi R, Uncini A. Generalized splitting func-
tions for blind separation of complex signals. Neurocomputing 2008;71(10):2245–70.