The phosphorescence microphone: A device for testing oxygen sensors and films
8
The phosphorescence microphone: A device for testing oxygen sensors and films Christina M. McGraw Department of Chemistry, University of Washington, Seattle, Washington98195 Hari Shroff a) Department of Bioengineering, University of Washington, Seattle, Washington 98195 Gamal Khalil Department of Chemistry, University of Washington, Seattle, Washington98195 James B. Callis b) Department of Chemistry, University of Washington, Seattle, Washington98195 and Department of Bioengineering, University of Washington, Seattle, Washington 98195 ~Received 29 April 2003; accepted 14 September 2003! A new concept in sound pressure detection, the phosphorescence microphone, is introduced. This device replaces the diaphragm of a microphone with a thin film of pressure sensitive paint. Dynamic changes in pressure are detected by monitoring the changes in phosphorescent intensity that are due to cyclical variations in oxygen partial pressure in the sound wave. To test this new device, the acoustic resonance spectrum of a closed cylinder is measured and compared to the spectrum obtained with a commercial electret microphone. Oscillations in phosphorescent intensity that occur at the frequency of sound are observed, and the magnitude of these oscillations is dependent on sound pressure. Several experiments are presented to confirm that the spectrum obtained with the phosphorescence microphone is due to the oxygen sensitivity of the pressure sensitive paint. In addition to detecting sound, this device has shown efficacy in testing pressure sensitive paints for high frequency, low differential pressure applications. The phosphorescence microphone was used to show that selected pressure sensitive paints could detect acoustic pressure changes as small as 6 Pa in the frequency range 150–3500 Hz on a background of 10 5 Pa. © 2003 American Institute of Physics. @DOI: 10.1063/1.1626009# I. INTRODUCTION In this article, the phosphorescence microphone ~PM!,a transducer based on a pressure sensitive paint ~PSP!, 1,2 is introduced. A thin film of platinum porphyrin compound is used in place of the diaphragm of the microphone. The phos- phorescent light emitted by the porphyrin is dependent on the oxygen partial pressure at the surface of the film. Thus dy- namic changes in pressure can be detected by observing changes in the emitted phosphorescent light. All microphones are based on the transduction of acous- tic energy to electrical energy. In most microphones an acoustic pressure wave causes a flexible diaphragm to move, and the motion of the diaphragm induces a change in some property of an electrical circuit. The electret microphone, invented in 1962 by Sessler and West, is in common use. 3 In this device, the capacitance between two plates, one fixed and one acting as the diaphragm, changes according to the variation in sound pressure. The electret, a thin layer of po- larized ceramic or plastic film placed between the diaphragm and stationary electrode, obviates the need for an external bias. Despite the excellent sensitivity and uniform frequency response of the electret microphone, the last decade has seen renewed interest in optical microphones. One recent example is based on a micromachined interferometer. 4 An even sim- pler design relies on intensity modulation in which the dia- phragm oscillation is transferred directly to a beam of light. 5 One of the main advantages of an optical microphone is that it can be constructed with no electrical leads attached di- rectly to the transducer. The transducer is thus immune to electrical interference. If one incorporates low-loss glass fi- bers, it is also possible to place the photodetector and light source several hundred meters away from the microphone head, making the optical microphone a good choice for use in hard-to-reach or hazardous locations. In addition to detecting sound, the PM also offers a new method for testing the response of PSPs to high frequency, low differential pressure fluctuations. PSP response is typi- cally determined using pressure jump methods, 6 shock tubes, 7 or, more recently, a chopper-modulated free jet. 8 Baron et al. 6 developed a pressure jump apparatus to study the response of PSPs to rapid pressure changes. The response time, limited by the rate of oxygen diffusion through the polymer, is determined from the phosphorescent response of PSP to step changes in pressure. Using a fast-acting valve, the pressure in a sample chamber is changed from near vacuum to ambient pressure in 600 ms. Similar instruments a! Present address: Biophysics Graduate Group, University of California, Berkeley, CA 94720. b! Electronic mail: [email protected] REVIEW OF SCIENTIFIC INSTRUMENTS VOLUME 74, NUMBER 12 DECEMBER 2003 5260 0034-6748/2003/74(12)/5260/7/$20.00 © 2003 American Institute of Physics
-
Upload
independent -
Category
Documents
-
view
6 -
download
0
Transcript of The phosphorescence microphone: A device for testing oxygen sensors and films

REVIEW OF SCIENTIFIC INSTRUMENTS VOLUME 74, NUMBER 12 DECEMBER 2003
The phosphorescence microphone: A device for testing oxygen sensorsand films
Christina M. McGrawDepartment of Chemistry, University of Washington, Seattle, Washington 98195
Hari Shroff a)
Department of Bioengineering, University of Washington, Seattle, Washington 98195
Gamal KhalilDepartment of Chemistry, University of Washington, Seattle, Washington 98195
James B. Callisb)
Department of Chemistry, University of Washington, Seattle, Washington 98195and Department of Bioengineering, University of Washington, Seattle, Washington 98195
~Received 29 April 2003; accepted 14 September 2003!
A new concept in sound pressure detection, the phosphorescence microphone, is introduced. Thisdevice replaces the diaphragm of a microphone with a thin film of pressure sensitive paint. Dynamicchanges in pressure are detected by monitoring the changes in phosphorescent intensity that are dueto cyclical variations in oxygen partial pressure in the sound wave. To test this new device, theacoustic resonance spectrum of a closed cylinder is measured and compared to the spectrumobtained with a commercial electret microphone. Oscillations in phosphorescent intensity that occurat the frequency of sound are observed, and the magnitude of these oscillations is dependent onsound pressure. Several experiments are presented to confirm that the spectrum obtained with thephosphorescence microphone is due to the oxygen sensitivity of the pressure sensitive paint. Inaddition to detecting sound, this device has shown efficacy in testing pressure sensitive paints forhigh frequency, low differential pressure applications. The phosphorescence microphone was usedto show that selected pressure sensitive paints could detect acoustic pressure changes as small as 6Pa in the frequency range 150–3500 Hz on a background of 105 Pa. © 2003 American Institute ofPhysics. @DOI: 10.1063/1.1626009#
isothdyrv
uao
ome
.x
pogrn
cyseenple
ia-t.thatdi-tofi-
ightoneuse
ewncy,pi-
t.udyponseee ofalve,near
ni
I. INTRODUCTION
In this article, the phosphorescence microphone~PM!, atransducer based on a pressure sensitive paint~PSP!,1,2 isintroduced. A thin film of platinum porphyrin compoundused in place of the diaphragm of the microphone. The phphorescent light emitted by the porphyrin is dependent onoxygen partial pressure at the surface of the film. Thusnamic changes in pressure can be detected by obsechanges in the emitted phosphorescent light.
All microphones are based on the transduction of acotic energy to electrical energy. In most microphonesacoustic pressure wave causes a flexible diaphragm to mand the motion of the diaphragm induces a change in sproperty of an electrical circuit. The electret microphoninvented in 1962 by Sessler and West, is in common use3 Inthis device, the capacitance between two plates, one fiand one acting as the diaphragm, changes according tovariation in sound pressure. The electret, a thin layer oflarized ceramic or plastic film placed between the diaphraand stationary electrode, obviates the need for an extebias.
a!Present address: Biophysics Graduate Group, University of CaliforBerkeley, CA 94720.
b!Electronic mail: [email protected]
5260034-6748/2003/74(12)/5260/7/$20.00
s-e-
ing
s-nve,e
,
edthe-
mal
Despite the excellent sensitivity and uniform frequenresponse of the electret microphone, the last decade hasrenewed interest in optical microphones. One recent examis based on a micromachined interferometer.4 An even sim-pler design relies on intensity modulation in which the dphragm oscillation is transferred directly to a beam of ligh5
One of the main advantages of an optical microphone isit can be constructed with no electrical leads attachedrectly to the transducer. The transducer is thus immuneelectrical interference. If one incorporates low-loss glassbers, it is also possible to place the photodetector and lsource several hundred meters away from the microphhead, making the optical microphone a good choice forin hard-to-reach or hazardous locations.
In addition to detecting sound, the PM also offers a nmethod for testing the response of PSPs to high frequelow differential pressure fluctuations. PSP response is tycally determined using pressure jump methods,6 shocktubes,7 or, more recently, a chopper-modulated free je8
Baron et al.6 developed a pressure jump apparatus to stthe response of PSPs to rapid pressure changes. The restime, limited by the rate of oxygen diffusion through thpolymer, is determined from the phosphorescent responsPSP to step changes in pressure. Using a fast-acting vthe pressure in a sample chamber is changed fromvacuum to ambient pressure in 600ms. Similar instruments
a,
0 © 2003 American Institute of Physics

av,dsu
ss. Am
s.rilo-jeenpaam
tfr
fluer
re.SsceThpy
r.te
ulenurho
nu
ib
bal
ert-r
ma
und
e,
y
sedfer-t to
res-
s thefit to
5261Rev. Sci. Instrum., Vol. 74, No. 12, December 2003 Phosphorescence microphone
were used to measure the effect of paint thickness9 and paintmatrix10 on response time. Although these methods hbeen used to measure submillisecond response timespressure changes must be large and are often plagueringing artifacts. Shock tubes have been used to mearapid pressure changes for PSP characterization.7 Althoughshock tubes generate smaller pressure steps than thosewith the pressure jump instruments, the pressure changestill on the order of 25 kPa with uncertainties of 0.54 kPanew apparatus was recently developed to study the dynaresponse of PSPs to high-frequency pressure fluctuation8 APSP sensing layer was employed to detect 70–80 kPa psure fluctuations at frequencies on the order of several khertz that were generated by a sinusoidally modulated air
The motivation behind the development of the pressystem was the need for a more sensitive method to comand evaluate PSPs for low-pressure, unsteady aerodynapplications. The PM has also been used to measureacoustic response of a resonant cylinder, determine thequency response of PSPs to small differential pressuretuations, and test the sensitivity and linearity of PSPs ovsmaller pressure range than was previously possible.
II. THEORY
Since the intensity of phosphorescent moleculesquenched by collisions with oxygen molecules, phosphocence can be used to measure oxygen partial pressure11 In1989 researchers at the University of Washington, NAAmes, and Boeing developed a pressure sensitive paint uthe phenomenon of oxygen quenching of phosphoresmolecules dissolved in an oxygen permeable polymer.paint was first used to obtain a continuous pressure maan airfoil in a wind tunnel.11 It has since been used to studaircraft models,2 Navy ship air wakes,12 and automobilemodels.13
A. Pressure sensitive paint
A PSP coating consists of a luminophore~a moleculethat emits light! dissolved in an oxygen-permeable polyme1
The luminophore used in these experiments is platinumra~pentafluorophenyl!porphine ~PtTFPP!. When exposed toultraviolet radiation, the phosphorescent PtTFPP molecemit light at 650 nm. The intensity of the phosphorescemission is inversely proportional to the surface pressPtTFPP works well as an oxygen sensor because its pphorescent lifetime in typical polymers at STP is 10ms. Thisrelatively long lifetime provides ample opportunity for aexcited molecule to respond to dioxygen diffusing into or oof the polymer as the oxygen partial pressure fluctuates.
The quenching of PSP phosphorescence is descrquantitatively by the Kavandi equation@Eq. ~1!#.11 Underconstant illumination and fixed detection conditions, the oserved phosphorescence intensity is inversely proportionthe pressure:
I 0
I5A1B
P
P0, ~1!
ethebyre
eenare
ic
es--t.treic
hee-c-a
iss-
Aingnteof
t-
este.s-
t
ed
-to
whereI is the phosphorescence intensity at pressureP, I 0 isthe phosphorescence intensity at a reference pressureP0
~typically 1 atm at 298 K!, andA andB are Kavandi param-eters determined by the particular luminophore/polymcombination.A and B are extracted experimentally by ploting I 0 /I versusP/P0 and fitting the resulting data to a lineaequation with slopeB and interceptA ~Fig. 1!. The points inFig. 1 are actual data~see Sec. III A!. Once A and B aredetermined, Eq.~1! can be used to determine pressure frointensity. In practice, Kavandi plots are not linear overwide dynamic range.14
B. Expected pressure and temperature changesgenerated by a sound wave
The pressure change corresponding to a given solevel is described in Eq.~2!:15
Dpm5A2rcsI ref10SL/10, ~2!
whereDpm is the maximum amplitude of the pressure wavr is the density of air~1.21 kg/m3!, cs is the speed of sound~344 m/s at 293 K!, I ref is the reference sound intensit(4.82310213W/m2), and SL is the sound level in dB.
The fractional phosphorescence intensity change cauby a fractional change in pressure can be obtained by difentiating both sides of the Kavandi equation with respecpressure
d
dPI 5
d
dP S I 0
A1B~P/P0! D52I 0
@A1B~P/P0!#23
B
P0,
~3!
dI
I 052
dP
@A1B~P/P0!#2
B
P0. ~4!
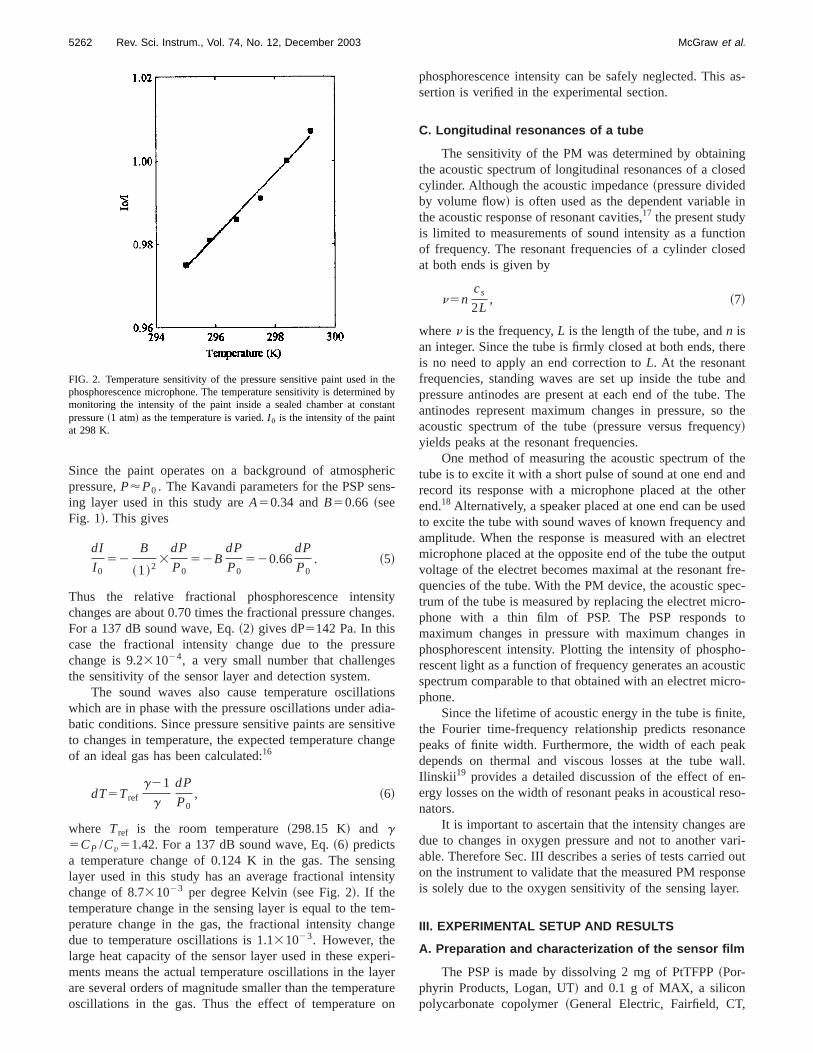
FIG. 1. Kavandi plot of the pressure sensitive paint used in the phosphocence microphone.P0 is atmospheric pressure andI 0 is the reference inten-sity at reference pressureP0 . The Kavandi plot is obtained by monitoringthe steady state intensity of a paint sample inside a sealed chamber apressure is varied. Points are experimental data and the solid line is thethe Kavandi equation.
ens
sing
sus
iodiita
sisi
ten
peaytuo
as-
ngsed
in
ionsed
ere
and. The
the
theandthersednd
ctrettputfre-ec-ro-toin
ho-sticro-
te,nceakall.
n-eso-
arevari-
outnser.
,
tedta
5262 Rev. Sci. Instrum., Vol. 74, No. 12, December 2003 McGraw et al.
Since the paint operates on a background of atmosphpressure,P'P0 . The Kavandi parameters for the PSP seing layer used in this study areA50.34 andB50.66 ~seeFig. 1!. This gives
dI
I 052
B
~1!23
dP
P052B
dP
P0520.66
dP
P0. ~5!
Thus the relative fractional phosphorescence intenchanges are about 0.70 times the fractional pressure chaFor a 137 dB sound wave, Eq.~2! gives dP5142 Pa. In thiscase the fractional intensity change due to the preschange is 9.231024, a very small number that challengethe sensitivity of the sensor layer and detection system.
The sound waves also cause temperature oscillatwhich are in phase with the pressure oscillations under abatic conditions. Since pressure sensitive paints are sensto changes in temperature, the expected temperature chof an ideal gas has been calculated:16
dT5Tref
g21
g
dP
P0, ~6!
where Tref is the room temperature~298.15 K! and g5CP /Cv51.42. For a 137 dB sound wave, Eq.~6! predictsa temperature change of 0.124 K in the gas. The senlayer used in this study has an average fractional intenchange of 8.731023 per degree Kelvin~see Fig. 2!. If thetemperature change in the sensing layer is equal to theperature change in the gas, the fractional intensity chadue to temperature oscillations is 1.131023. However, thelarge heat capacity of the sensor layer used in these exments means the actual temperature oscillations in the lare several orders of magnitude smaller than the temperaoscillations in the gas. Thus the effect of temperature
FIG. 2. Temperature sensitivity of the pressure sensitive paint used inphosphorescence microphone. The temperature sensitivity is determinmonitoring the intensity of the paint inside a sealed chamber at conspressure~1 atm! as the temperature is varied.I 0 is the intensity of the paintat 298 K.
ric-
tyes.
re
nsa-ivenge
ngty
m-ge
ri-erren
phosphorescence intensity can be safely neglected. Thissertion is verified in the experimental section.
C. Longitudinal resonances of a tube
The sensitivity of the PM was determined by obtainithe acoustic spectrum of longitudinal resonances of a clocylinder. Although the acoustic impedance~pressure dividedby volume flow! is often used as the dependent variablethe acoustic response of resonant cavities,17 the present studyis limited to measurements of sound intensity as a functof frequency. The resonant frequencies of a cylinder cloat both ends is given by
n5ncs
2L, ~7!
wheren is the frequency,L is the length of the tube, andn isan integer. Since the tube is firmly closed at both ends, this no need to apply an end correction toL. At the resonantfrequencies, standing waves are set up inside the tubepressure antinodes are present at each end of the tubeantinodes represent maximum changes in pressure, soacoustic spectrum of the tube~pressure versus frequency!yields peaks at the resonant frequencies.
One method of measuring the acoustic spectrum oftube is to excite it with a short pulse of sound at one endrecord its response with a microphone placed at the oend.18 Alternatively, a speaker placed at one end can be uto excite the tube with sound waves of known frequency aamplitude. When the response is measured with an elemicrophone placed at the opposite end of the tube the ouvoltage of the electret becomes maximal at the resonantquencies of the tube. With the PM device, the acoustic sptrum of the tube is measured by replacing the electret micphone with a thin film of PSP. The PSP respondsmaximum changes in pressure with maximum changesphosphorescent intensity. Plotting the intensity of phosprescent light as a function of frequency generates an acouspectrum comparable to that obtained with an electret micphone.
Since the lifetime of acoustic energy in the tube is finithe Fourier time-frequency relationship predicts resonapeaks of finite width. Furthermore, the width of each pedepends on thermal and viscous losses at the tube wIlinskii 19 provides a detailed discussion of the effect of eergy losses on the width of resonant peaks in acoustical rnators.
It is important to ascertain that the intensity changesdue to changes in oxygen pressure and not to anotherable. Therefore Sec. III describes a series of tests carriedon the instrument to validate that the measured PM respois solely due to the oxygen sensitivity of the sensing laye
III. EXPERIMENTAL SETUP AND RESULTS
A. Preparation and characterization of the sensor film
The PSP is made by dissolving 2 mg of PtTFPP~Por-phyrin Products, Logan, UT! and 0.1 g of MAX, a siliconpolycarbonate copolymer~General Electric, Fairfield, CT
hebynt
at
inino
he
atlleeTp
teesulnglteo-
3ex
on
t
tetidh
te
ip
g
in.beithisndof
a
toheandthetoat
wasg a,
llat-theho-
sm
olt-nce
italn-d in
mi-vel
her to
nalncetheualted.h
ndnelsdB,
the
n
ol-
p
5263Rev. Sci. Instrum., Vol. 74, No. 12, December 2003 Phosphorescence microphone
LR 3320! in 10 ml of dichloromethane. TwentymL of thissolution is pipetted onto a thin layer chromatography~TLC!plate~Aldrich, Milwaukee, WI, Z122777! to create a circulararea of dye approximately 0.8 cm in diameter. The TLC plused to support the film is a 250mm layer of 2–25mmdiameter silica particles attached to a clear polyester backThe silica particles in the TLC plate cause diffuse scatterof the exciting light, increasing the path length of each phton. The probability that a photon will be absorbed by tPtTFPP is thereby increased.
The sensor film is characterized for its response to stchanges in oxygen pressure using a computer-contro‘‘survey apparatus.’’20 The painted TLC plate is placed insida temperature and pressure controlled sample chamber.sample is excited with filtered light from a tungsten lamwhile the air is evacuated from the chamber. A compucontrolled valve mechanism slowly increases the pressur1 atm while the temperature is held constant. Changephosphorescent intensity are measured with a photomplier tube~PMT! and analyzed on a computer. The excitilight is limited using a 400 nm bandpass interference fiwith a 40 nm width at half height. The emitted light is islated using a 650 nm bandpass interference filter with anm width at half height. The Kavandi parameters aretracted by fitting the data to a line of slopeB and interceptA~Fig. 1!. Since sound waves are small and superimposed1 atm steady-state pressure, only the rangeP/P0
50.98– 1.0 is used in these experiments. Here the plolinear; over a wider range it is nonlinear.
The survey apparatus is also used to determine the insity change with temperature~Fig. 2!. In this case a constan~1 atm! pressure is maintained while the temperature insthe chamber is raised incrementally from 293 to 303 K. Tfractional change in intensity with temperature, as demined by the slope of Fig. 2, is28.731023 per degreeKelvin.
B. Experimental setup
A schematic of the phosphorescence microphoneshown in Fig. 3. The resonant tube is a section of PVC p~1.14 m in length, 3.5 cm inner diameter!. It is placed on atable with a compression horn driver~MCM Electronics,Centerville, OH, 54-060! at one end and the PM sensinlayer at the other. The PM sensing layer consists of 20ml of
FIG. 3. Schematic diagram of the phosphorescence microphone set umeasurements of the acoustic resonances of a cylinder.
e
g.g-
icd
he
rtointi-
r
5-
a
is
n-
eer-
ise
the PSP pipetted on a TLC plate of approximately 1 cm2. Tosecure the painted TLC plate to the resonant tube a 5/16diameter hole is drilled through the center of a PVC tuend-cap. The painted TLC plate is placed over the hole wthe painted side facing the horn driver. The TLC platerigidly fastened to a glass plate in order to secure it aprevent it from mechanically vibrating at the frequencythe sound wave.
Data acquisition is carried out on a PC equipped withNational Instruments data acquisition board~PCI-6110, Aus-tin, TX!. The digital-to-analog converter is programmedprovide a sinusoidal voltage of varying frequency. Tpower of the signal is increased using an audio amplifierused to drive the speaker. In the following experiments,frequency of the amplified signal is scanned from 1504000 Hz in 2 Hz increments. Sound levels of 110–137 dB790 Hz are used in these experiments. The sound levelmeasured by removing the PM sensing layer and placinsound level meter~Simpson Electric Company, Model 886Elgin, IL! through the hole in the tube end-cap.
The paint is excited using a 405 nm LED~Roithner La-sertechnik, Cat. No. HUUV-5101L, Vienna, Austria! and a405 nm bandpass filter. As the paint responds to the osciing sound wave, the phosphorescent light is modulated atfrequency of sound. Two convex lenses focus the phosprescent light onto a photomultiplier tube~PMT!. The phos-phorescent emission detected by the PMT~Hamamatsu,R928, Bridgewater, NJ! is isolated by a 650 nm bandpasfilter, which rejects stray and scattered light below 630 nand above 680 nm. The PMT current is converted to a vage by an operational amplifier operated in transconductamode. The time constant for the PMT preamp is 50ms. Theoscillating voltage from the preamp is converted to a digvalue by the National Instruments analog-to-digital coverter, the dc offset is removed, and the signal is analyzeLabVIEW.
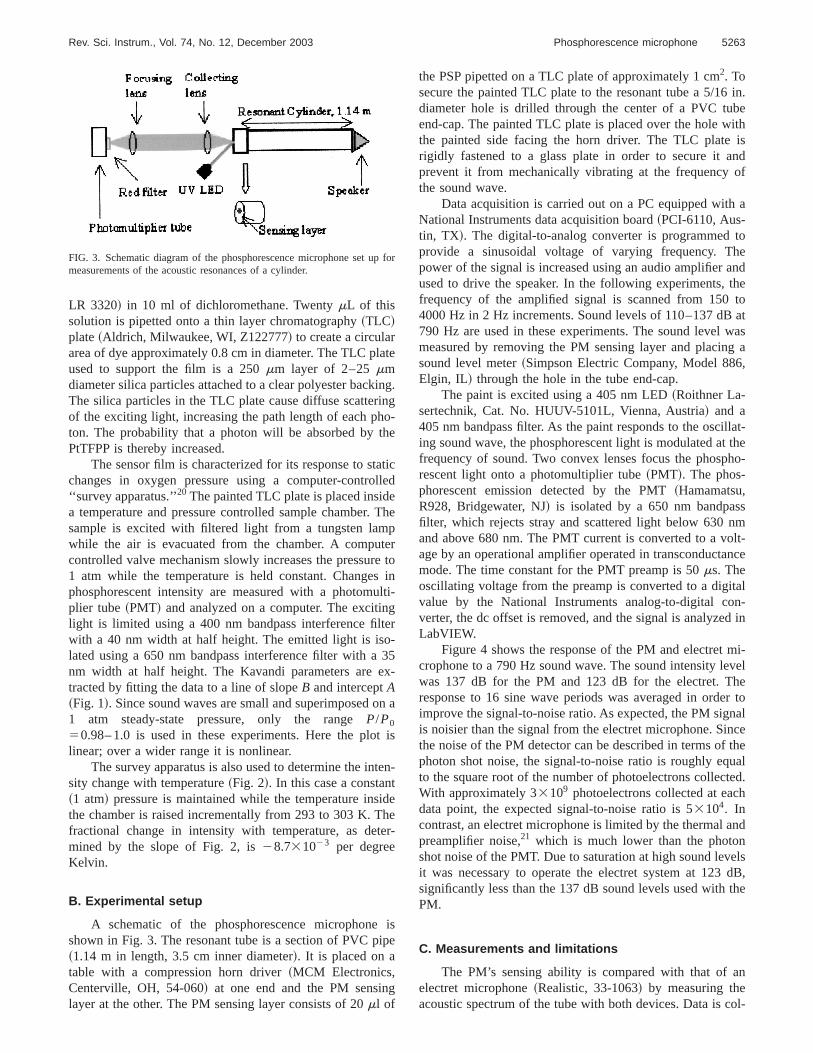
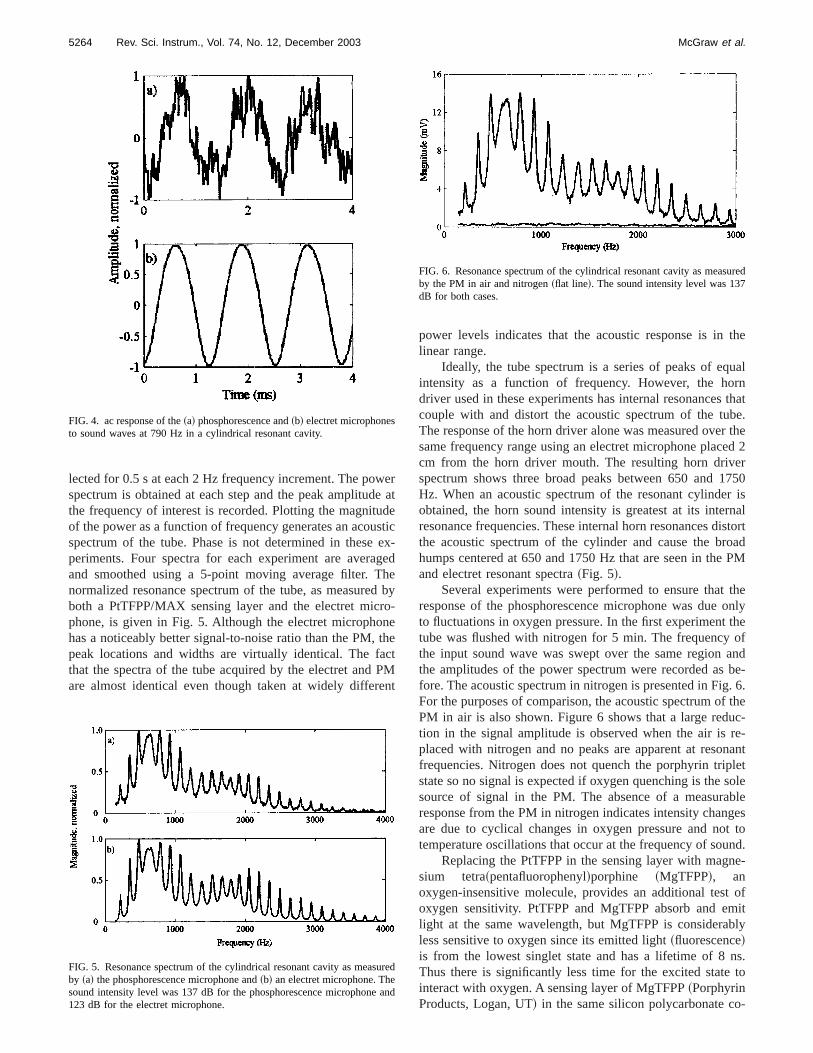
Figure 4 shows the response of the PM and electretcrophone to a 790 Hz sound wave. The sound intensity lewas 137 dB for the PM and 123 dB for the electret. Tresponse to 16 sine wave periods was averaged in ordeimprove the signal-to-noise ratio. As expected, the PM sigis noisier than the signal from the electret microphone. Sithe noise of the PM detector can be described in terms ofphoton shot noise, the signal-to-noise ratio is roughly eqto the square root of the number of photoelectrons collecWith approximately 33109 photoelectrons collected at eacdata point, the expected signal-to-noise ratio is 53104. Incontrast, an electret microphone is limited by the thermal apreamplifier noise,21 which is much lower than the photoshot noise of the PMT. Due to saturation at high sound levit was necessary to operate the electret system at 123significantly less than the 137 dB sound levels used withPM.
C. Measurements and limitations
The PM’s sensing ability is compared with that of aelectret microphone~Realistic, 33-1063! by measuring theacoustic spectrum of the tube with both devices. Data is c
for
we
udseghdronthcP
en
the
ualrnthat
be.r theed 2er1750r isrnalistortoadPM
theonlytheofandbe-. 6.
f theuc-re-nantlet
soleble
gest tond.
ne-
ofmitbly
ns.to
-
u
a
ured7
5264 Rev. Sci. Instrum., Vol. 74, No. 12, December 2003 McGraw et al.
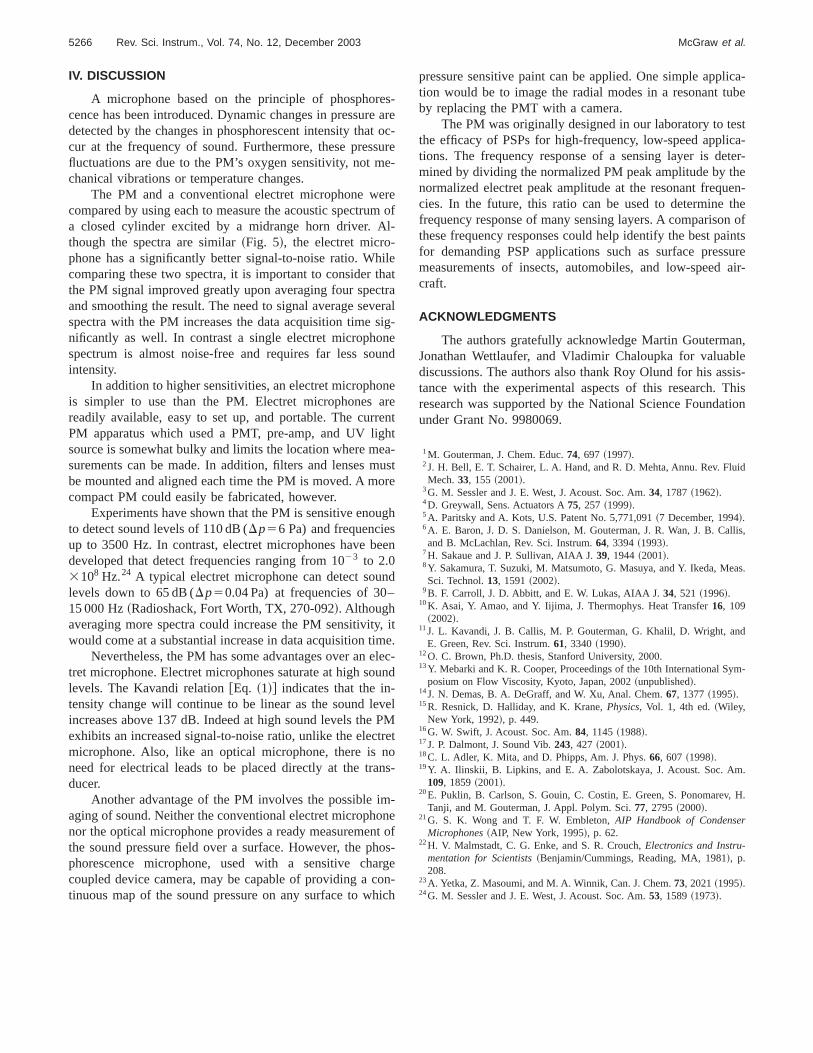
lected for 0.5 s at each 2 Hz frequency increment. The pospectrum is obtained at each step and the peak amplitudthe frequency of interest is recorded. Plotting the magnitof the power as a function of frequency generates an acouspectrum of the tube. Phase is not determined in theseperiments. Four spectra for each experiment are averaand smoothed using a 5-point moving average filter. Tnormalized resonance spectrum of the tube, as measureboth a PtTFPP/MAX sensing layer and the electret micphone, is given in Fig. 5. Although the electret microphohas a noticeably better signal-to-noise ratio than the PM,peak locations and widths are virtually identical. The fathat the spectra of the tube acquired by the electret andare almost identical even though taken at widely differ
FIG. 4. ac response of the~a! phosphorescence and~b! electret microphonesto sound waves at 790 Hz in a cylindrical resonant cavity.
FIG. 5. Resonance spectrum of the cylindrical resonant cavity as measby ~a! the phosphorescence microphone and~b! an electret microphone. Thesound intensity level was 137 dB for the phosphorescence microphone123 dB for the electret microphone.
erateticx-edeby-
eetMt
power levels indicates that the acoustic response is inlinear range.
Ideally, the tube spectrum is a series of peaks of eqintensity as a function of frequency. However, the hodriver used in these experiments has internal resonancescouple with and distort the acoustic spectrum of the tuThe response of the horn driver alone was measured ovesame frequency range using an electret microphone placcm from the horn driver mouth. The resulting horn drivspectrum shows three broad peaks between 650 andHz. When an acoustic spectrum of the resonant cylindeobtained, the horn sound intensity is greatest at its interesonance frequencies. These internal horn resonances dthe acoustic spectrum of the cylinder and cause the brhumps centered at 650 and 1750 Hz that are seen in theand electret resonant spectra~Fig. 5!.
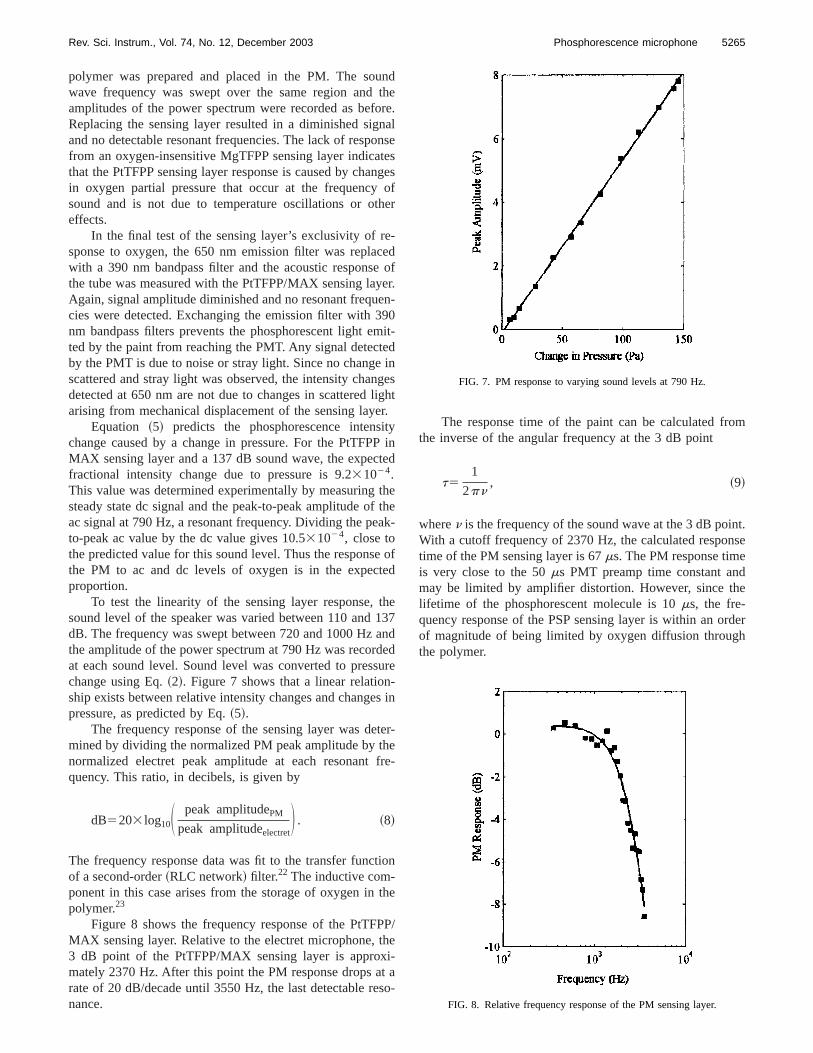
Several experiments were performed to ensure thatresponse of the phosphorescence microphone was dueto fluctuations in oxygen pressure. In the first experimenttube was flushed with nitrogen for 5 min. The frequencythe input sound wave was swept over the same regionthe amplitudes of the power spectrum were recorded asfore. The acoustic spectrum in nitrogen is presented in FigFor the purposes of comparison, the acoustic spectrum oPM in air is also shown. Figure 6 shows that a large redtion in the signal amplitude is observed when the air isplaced with nitrogen and no peaks are apparent at resofrequencies. Nitrogen does not quench the porphyrin tripstate so no signal is expected if oxygen quenching is thesource of signal in the PM. The absence of a measuraresponse from the PM in nitrogen indicates intensity chanare due to cyclical changes in oxygen pressure and notemperature oscillations that occur at the frequency of sou
Replacing the PtTFPP in the sensing layer with magsium tetra~pentafluorophenyl!porphine ~MgTFPP!, anoxygen-insensitive molecule, provides an additional testoxygen sensitivity. PtTFPP and MgTFPP absorb and elight at the same wavelength, but MgTFPP is consideraless sensitive to oxygen since its emitted light~fluorescence!is from the lowest singlet state and has a lifetime of 8Thus there is significantly less time for the excited stateinteract with oxygen. A sensing layer of MgTFPP~PorphyrinProducts, Logan, UT! in the same silicon polycarbonate co
red
nd
FIG. 6. Resonance spectrum of the cylindrical resonant cavity as measby the PM in air and nitrogen~flat line!. The sound intensity level was 13dB for both cases.
unt
ononteno
th
e-ceeyee9mte
ingligerityPte
thf ta
ete
th1adesu-
es
tehefr
tio
th
Pthi-ts
om
nt.se
de
rderh
5265Rev. Sci. Instrum., Vol. 74, No. 12, December 2003 Phosphorescence microphone
polymer was prepared and placed in the PM. The sowave frequency was swept over the same region andamplitudes of the power spectrum were recorded as befReplacing the sensing layer resulted in a diminished sigand no detectable resonant frequencies. The lack of respfrom an oxygen-insensitive MgTFPP sensing layer indicathat the PtTFPP sensing layer response is caused by chain oxygen partial pressure that occur at the frequencysound and is not due to temperature oscillations or oeffects.
In the final test of the sensing layer’s exclusivity of rsponse to oxygen, the 650 nm emission filter was replawith a 390 nm bandpass filter and the acoustic responsthe tube was measured with the PtTFPP/MAX sensing laAgain, signal amplitude diminished and no resonant frequcies were detected. Exchanging the emission filter with 3nm bandpass filters prevents the phosphorescent light eted by the paint from reaching the PMT. Any signal detecby the PMT is due to noise or stray light. Since no changescattered and stray light was observed, the intensity chadetected at 650 nm are not due to changes in scatteredarising from mechanical displacement of the sensing lay
Equation ~5! predicts the phosphorescence intenschange caused by a change in pressure. For the PtTFPMAX sensing layer and a 137 dB sound wave, the expecfractional intensity change due to pressure is 9.231024.This value was determined experimentally by measuringsteady state dc signal and the peak-to-peak amplitude oac signal at 790 Hz, a resonant frequency. Dividing the peto-peak ac value by the dc value gives 10.531024, close tothe predicted value for this sound level. Thus the responsthe PM to ac and dc levels of oxygen is in the expecproportion.
To test the linearity of the sensing layer response,sound level of the speaker was varied between 110 anddB. The frequency was swept between 720 and 1000 Hzthe amplitude of the power spectrum at 790 Hz was recorat each sound level. Sound level was converted to preschange using Eq.~2!. Figure 7 shows that a linear relationship exists between relative intensity changes and changpressure, as predicted by Eq.~5!.
The frequency response of the sensing layer was demined by dividing the normalized PM peak amplitude by tnormalized electret peak amplitude at each resonantquency. This ratio, in decibels, is given by
dB5203 log10S peak amplitudePM
peak amplitudeelectretD . ~8!
The frequency response data was fit to the transfer funcof a second-order~RLC network! filter.22 The inductive com-ponent in this case arises from the storage of oxygen inpolymer.23
Figure 8 shows the frequency response of the PtTFMAX sensing layer. Relative to the electret microphone,3 dB point of the PtTFPP/MAX sensing layer is approxmately 2370 Hz. After this point the PM response drops arate of 20 dB/decade until 3550 Hz, the last detectable renance.
dhere.alsesgesf
er
dofr.
n-0it-dnesht
.
ind
ehek-
ofd
e37nddre
in
r-
e-
n
e
P/e
ao-
The response time of the paint can be calculated frthe inverse of the angular frequency at the 3 dB point
t51
2pn, ~9!
wheren is the frequency of the sound wave at the 3 dB poiWith a cutoff frequency of 2370 Hz, the calculated respontime of the PM sensing layer is 67ms. The PM response timeis very close to the 50ms PMT preamp time constant anmay be limited by amplifier distortion. However, since thlifetime of the phosphorescent molecule is 10ms, the fre-quency response of the PSP sensing layer is within an oof magnitude of being limited by oxygen diffusion througthe polymer.
FIG. 7. PM response to varying sound levels at 790 Hz.
FIG. 8. Relative frequency response of the PM sensing layer.
esetsue
erml
ilthtr
vesinu
narreghea
uo
ugsee
nd–
y,melu
vePtrnon
mont
hoaro
hi
lica-ube
stca-ter-heen-then ofints
sureair-
n,lesis-histion
id
llis,
as.
d
m-
.
, H.
r
5266 Rev. Sci. Instrum., Vol. 74, No. 12, December 2003 McGraw et al.
IV. DISCUSSION
A microphone based on the principle of phosphorcence has been introduced. Dynamic changes in pressurdetected by the changes in phosphorescent intensity thacur at the frequency of sound. Furthermore, these presfluctuations are due to the PM’s oxygen sensitivity, not mchanical vibrations or temperature changes.
The PM and a conventional electret microphone wcompared by using each to measure the acoustic spectrua closed cylinder excited by a midrange horn driver. Athough the spectra are similar~Fig. 5!, the electret micro-phone has a significantly better signal-to-noise ratio. Whcomparing these two spectra, it is important to considerthe PM signal improved greatly upon averaging four specand smoothing the result. The need to signal average sespectra with the PM increases the data acquisition timenificantly as well. In contrast a single electret microphospectrum is almost noise-free and requires far less sointensity.
In addition to higher sensitivities, an electret microphois simpler to use than the PM. Electret microphonesreadily available, easy to set up, and portable. The curPM apparatus which used a PMT, pre-amp, and UV lisource is somewhat bulky and limits the location where msurements can be made. In addition, filters and lenses mbe mounted and aligned each time the PM is moved. A mcompact PM could easily be fabricated, however.
Experiments have shown that the PM is sensitive enoto detect sound levels of 110 dB (Dp56 Pa) and frequencieup to 3500 Hz. In contrast, electret microphones have bdeveloped that detect frequencies ranging from 1023 to 2.03108 Hz.24 A typical electret microphone can detect soulevels down to 65 dB (Dp50.04 Pa) at frequencies of 3015 000 Hz~Radioshack, Fort Worth, TX, 270-092!. Althoughaveraging more spectra could increase the PM sensitivitwould come at a substantial increase in data acquisition ti
Nevertheless, the PM has some advantages over antret microphone. Electret microphones saturate at high solevels. The Kavandi relation@Eq. ~1!# indicates that the in-tensity change will continue to be linear as the sound leincreases above 137 dB. Indeed at high sound levels theexhibits an increased signal-to-noise ratio, unlike the elecmicrophone. Also, like an optical microphone, there isneed for electrical leads to be placed directly at the traducer.
Another advantage of the PM involves the possible iaging of sound. Neither the conventional electret microphnor the optical microphone provides a ready measurementhe sound pressure field over a surface. However, the pphorescence microphone, used with a sensitive chcoupled device camera, may be capable of providing a ctinuous map of the sound pressure on any surface to w
-areoc-re-
eof
-
eataralg-end
eentt-st
re
h
n
ite.ec-nd
lM
et
s-
-eofs-
gen-ch
pressure sensitive paint can be applied. One simple apption would be to image the radial modes in a resonant tby replacing the PMT with a camera.
The PM was originally designed in our laboratory to tethe efficacy of PSPs for high-frequency, low-speed applitions. The frequency response of a sensing layer is demined by dividing the normalized PM peak amplitude by tnormalized electret peak amplitude at the resonant frequcies. In the future, this ratio can be used to determinefrequency response of many sensing layers. A comparisothese frequency responses could help identify the best pafor demanding PSP applications such as surface presmeasurements of insects, automobiles, and low-speedcraft.
ACKNOWLEDGMENTS
The authors gratefully acknowledge Martin GoutermaJonathan Wettlaufer, and Vladimir Chaloupka for valuabdiscussions. The authors also thank Roy Olund for his astance with the experimental aspects of this research. Tresearch was supported by the National Science Foundaunder Grant No. 9980069.
1M. Gouterman, J. Chem. Educ.74, 697 ~1997!.2J. H. Bell, E. T. Schairer, L. A. Hand, and R. D. Mehta, Annu. Rev. FluMech.33, 155 ~2001!.
3G. M. Sessler and J. E. West, J. Acoust. Soc. Am.34, 1787~1962!.4D. Greywall, Sens. Actuators A75, 257 ~1999!.5A. Paritsky and A. Kots, U.S. Patent No. 5,771,091~7 December, 1994!.6A. E. Baron, J. D. S. Danielson, M. Gouterman, J. R. Wan, J. B. Caand B. McLachlan, Rev. Sci. Instrum.64, 3394~1993!.
7H. Sakaue and J. P. Sullivan, AIAA J.39, 1944~2001!.8Y. Sakamura, T. Suzuki, M. Matsumoto, G. Masuya, and Y. Ikeda, MeSci. Technol.13, 1591~2002!.
9B. F. Carroll, J. D. Abbitt, and E. W. Lukas, AIAA J.34, 521 ~1996!.10K. Asai, Y. Amao, and Y. Iijima, J. Thermophys. Heat Transfer16, 109
~2002!.11J. L. Kavandi, J. B. Callis, M. P. Gouterman, G. Khalil, D. Wright, an
E. Green, Rev. Sci. Instrum.61, 3340~1990!.12O. C. Brown, Ph.D. thesis, Stanford University, 2000.13Y. Mebarki and K. R. Cooper, Proceedings of the 10th International Sy
posium on Flow Viscosity, Kyoto, Japan, 2002~unpublished!.14J. N. Demas, B. A. DeGraff, and W. Xu, Anal. Chem.67, 1377~1995!.15R. Resnick, D. Halliday, and K. Krane,Physics, Vol. 1, 4th ed.~Wiley,
New York, 1992!, p. 449.16G. W. Swift, J. Acoust. Soc. Am.84, 1145~1988!.17J. P. Dalmont, J. Sound Vib.243, 427 ~2001!.18C. L. Adler, K. Mita, and D. Phipps, Am. J. Phys.66, 607 ~1998!.19Y. A. Ilinskii, B. Lipkins, and E. A. Zabolotskaya, J. Acoust. Soc. Am
109, 1859~2001!.20E. Puklin, B. Carlson, S. Gouin, C. Costin, E. Green, S. Ponomarev
Tanji, and M. Gouterman, J. Appl. Polym. Sci.77, 2795~2000!.21G. S. K. Wong and T. F. W. Embleton,AIP Handbook of Condense
Microphones~AIP, New York, 1995!, p. 62.22H. V. Malmstadt, C. G. Enke, and S. R. Crouch,Electronics and Instru-
mentation for Scientists~Benjamin/Cummings, Reading, MA, 1981!, p.208.
23A. Yetka, Z. Masoumi, and M. A. Winnik, Can. J. Chem.73, 2021~1995!.24G. M. Sessler and J. E. West, J. Acoust. Soc. Am.53, 1589~1973!.