Do Joint Audits Improve Audit Quality? Evidence from Voluntary Joint Audits
Upload
khangminh22Category
view
3download
0
MCI Identification by Joint Learningon Multiple MRI Data
Yue Gao1, Chong-Yaw Wee1, Minjeong Kim1, Panteleimon Giannakopoulos2,Marie-Louise Montandon3, Sven Haller3, and Dinggang Shen1
1 Department of Radiology and BRIC,University of North Carolina at Chapel Hill, NC 27599, USA
2 Division of Psychiatry, Geneva University Hospitals, Switzerland3 Department of Neuroradiology, University Hospitals of Genevaand Faculty of Medicine of the University of Geneva, Switzerland
Abstract. The identification of subtle brain changes that are associated with mildcognitive impairment (MCI), the at-risk stage of Alzheimer’s disease, is still achallenging task. Different from existing works, which employ multimodal data(e.g., MRI, PET or CSF) to identify MCI subjects from normal elderly controls,we use four MRI sequences, including T1-weighted MRI (T1), Diffusion Ten-sor Imaging (DTI), Resting-State functional MRI (RS-fMRI) and Arterial SpinLabeling (ASL) perfusion imaging. Since these MRI sequences simultaneouslycapture various aspects of brain structure and function during clinical routinescan, it simplifies finding the relationship between subjects by incorporating themutual information among them. To this end, we devise a hypergraph-based semi-supervised learning algorithm. In particular, we first construct a hypergraph foreach of MRI sequences separately using a star expansion method with both thetraining and testing data. A centralized learning is then performed to model theoptimal relevance between subjects by incorporating mutual information betweendifferent MRI sequences. We then combine all centralized hypergraphs by learn-ing the optimal weight of each hypergraph based on the minimum Laplacian. Weapply our proposed method on a cohort of 41 consecutive MCI subjects and 63age-and-gender matched controls with four MRI sequences. Our method achievesat least a 7.61% improvement in classification accuracy compared to state-of-the-art methods using multiple MRI data.
1 Introduction
Alzheimer’s disease (AD) is the most common form of dementia in elderly over 65years of age. The number of AD patients has reached 26.6 million in nowadays and isexpected to double within the next 20 years, leading to 1 in every 85 people worldwidebeing affected by AD by 2050. Therefore, the diagnosis of AD at its at-risk stage ofmild cognitive impairment (MCI) [7] becomes extremely essential and has attractedextensive research efforts in recent years [11, 9]. Previous studies [10] have shown thatstructural and functional brain changes may start before clinically converted to AD andcan be used as potential biomarkers for MCI identification.
Recent studies [4, 11] show great promises for integrating multiple modalities, e.g.,MRI, PET and CSF, for improving AD/MCI diagnosis accuracy, and semi-supervised
c© Springer International Publishing Switzerland 2015N. Navab et al. (Eds.): MICCAI 2015, Part II, LNCS 9350, pp. 78–85, 2015.DOI: 10.1007/978-3-319-24571-3_10

MCI Identification by Joint MRI Data Learning 79
Fig. 1. An overview of the proposed centralized hypergraph learning for MCI diagnosis.
learning for multimodal data has also been investigated [2]. However, in most previ-ous works, modeling the relationship among subjects is often performed separately foreach modality, ignoring the crucial mutual information between different modalities. Inpractice, integrating the information acquired from different modalities is a challengingtask, since the relationship among subjects may differ for different modalities.
On the other hand, multiple MR sequences, e.g., T1-weighted (T1), Diffusion Ten-sor Imaging (DTI) and Resting-State functional MRI (RS-fMRI), can be used in clinicalroutine scans to capture different aspects of the brain structures and functions. For in-stance, T1 provides the tissue type information of the brain, DTI measures macroscopicaxonal organization in nervous system tissues, and RS-fMRI provides the regional in-teractions that take place when the subject in the absence of an explicit task. As a rela-tively new technique, Arterial Spin Labeling (ASL) [1] perfusion imaging is introducedto measure brain perfusion without any injection of a contrast agent and demonstratedconsistent reduction in basal perfusion notably in the posterior cingulate cortex in MCIand AD [1]. More recently, ASL was even able to predict very early cognitive declinein healthy elderly controls, i.e., the earliest stage of neurodegeneration. Multiple MRIsequences can be easily and simultaneously captured during clinical routine scans.
In this work, we propose a centralized hypergraph learning method (CHL) to bettermodel relationship among subjects with multiple MRIs for the purpose of MCI diagno-sis. The basic idea of the proposed method is to estimate the relevance between differentsubjects that reflects how likely two subjects belong to the same category by integratingmultiple imaging data in a semi-supervised manner. Then, the relationship informationamong subjects is represented by a hypergraph structure that connects all subjects inboth training and testing sets. Compared to the simple graph, in which an edge can onlylink two vertices, hypergraph [12] conveys more information through a set of hyper-edges that connects more than two vertices at the same occasion. It has been success-fully applied to various applications, such as image and object retrieval [3]. In this way,a hypergraph structure is able to capture the higher-order relationship among differentsubjects, i.e., whether a group of subjects share similar content. Then, MCI diagnosisis formulated as a binary classification task in the hypergraph structure to classify eachsubject as MCI patient or normal control (NC). Figure 1 presents the schematic diagram

80 Y. Gao et al.
of the proposed framework. We first construct a hypergraph using both the training andtesting data for each of multiple MRIs separately to reflect the higher-order relation-ship among subjects. In hypergraph construction, each time one subject is selected asa centroid. It is then connected to its K nearest subjects in the feature space via a hy-peredge. We then conduct a centralized hypergraph learning to explore the underneathrelationship of a set of samples, where the relevance among subjects and the hyperedgeweights are optimized simultaneously via an alternating optimization approach. Specif-ically, each time one hypergraph is first selected as the core and the rest as auxiliaryinformation in the learning process. This procedure is repeated for each hypergraph,producing a set of relevance scores for each subject for classification. To obtain the fi-nal decision, we assemble the relevance scores based on the optimal weights learned byminimizing the overall hypergraph Laplacian. Note that, for the training subjects, wejust use their imaging features to construct hypergraphs. Therefore, the relevance scoresare conveyed globally, leading to a semi-supervised learning model, and better avoidingover-fitting to the training set.
2 Method
Data and Preprocessing - A dataset containing T1, DTI, RS-fMRI and ASL from 41MCI patients and 63 normal controls was collected through the University Hospital ofGeneva in Switzerland. The T1 images were preprocessed by skull stripping, cerebel-lum removal, and tissue segmentation [6]. The anatomical automatic labeling (AAL)atlas, parcellated with 90 predefined regions-of-interest (ROIs) in cerebrum area, arealigned to the native space of each subject using a deformable registration algorithm.For T1 data, WM and GM tissue volumes in each region are computed and further nor-malized to generate a 180-dimensional feature vector, i.e., 90 WM and 90 GM features.
The DTI were first parcellated into 90 regions by propagating the AAL ROIs to eachimage using a deformable DTI registration algorithm. Whole-brain streamline fibertractography was performed on each DTI image. The number of fibers passing througheach pair of regions was counted and the averages of on-fiber fractional anisotropy (FA)for each ROI pair were computed to form a structural connectivity matrix.
For RS-fMRI, a 9min ON-OFF CO2 challenge was employed, i.e.,1 min OFF, 2 minON, 2 min OFF, 2 min ON, 2 min OFF, during data acquisition. Slice timing correctionand head-motion correction were performed using the Statistical Parametric Mappingsoftware package. To ensure magnetization equilibrium, the first 10 acquired RS-fMRIimages of each subject were discarded. The remaining 170 images were first correctedfor acquisition time delays among different slices before they were realigned to the firstvolume of the remaining images for head-motion corrections. A Pearson correlation-based connectivity matrix of dimension 90 × 90 based on AAL atlas was constructedfor each subject.
Preprocessing of ASL images was performed using ASLtbx. Similar to RS-fMRI, asymmetric connectivity matrix of dimension 90× 90 was constructed for each subject.
For DTI, RS-fMRI and ASL, the local clustering coefficients, which quantify thecliquishness of the nodes [8], are computed for the connectivity networks. For thesethree MRI sequences, both the raw feature (8100-D) and the clustering coefficients-based feature (90-D) are employed.

MCI Identification by Joint MRI Data Learning 81
Hypergraph Construction - For each type of multiple imaging data, a hypergraphis constructed. For the i-th imaging with N subjects, a hypergraph Gi = (Vi, Ei,Wi)with N vertices is constructed where each subject is represented by a vertex. Here,Vi is the vertex set, Ei is the hyperedge set, and Wi is the corresponding weight forthe hyperedges. A star expansion method is employed to generate a set of hyperedgesamong vertices. Specifically, in each feature space, a vertex is selected as the centroidvertex and then a hyperedge is developed by connecting to its nearest neighbors withinϕd distance, where d is the average distance between subjects in the feature space andϕ is set as 1 in our experiment. Incidence matrix of the hypergraph is then generated torepresent the relationship among different vertices. The (v, e)-th entry of the incidencematrix indicates whether the vertex v is connected via the hyperedge e to other vertices.The incidence matrix Hi of hypergraph Gi = (Vi, Ei,Wi) is generated as
Hi (v, e) =
{exp
(− di(v,vc)
0.1di
)if v ∈ e
0 if v /∈ e, (1)
where di(v, vc) is the distance for the i-th imaging data between a vertex v and itscorresponding centroid vertex vc in hyperedge e, and di is the average pairwise subjectdistance for the i-th imaging data. Accordingly, the vertex degree of the vertex v ∈ Vi
and hyperedge degree of the hyperedge e ∈ Ei are calculated, respectively, as di (v) =∑e∈Ei
Wi (e)Hi (v, e) and δi(e) =∑
v∈ViHi(v, e). Thus, we can define Dv
i and Dei
as diagonal matrices representing vertex degrees and hyperedge degrees, respectively.Note that all the hyperedges are initialized with an equal weight, e.g., 1.
Centralized Hypergraph Learning - To model the relationship of subjects with multi-ple imaging data, we propose a centralized hypergraph learning method. MCI diagnosisis formulated as a binary classification task in the hypergraph structure. Given four hy-pergraphs, at each stage one hypergraph is selected as the core hypergraph, while therest are used to provide extra guidance for updating the hypergraphs.
During centralized learning, hypergraphs are assigned with different weights accord-ing to their influences on the structure of the core hypergraph. The core hypergraph isassigned with a weight of α1, while the other hypergraphs are assigned with an equalweight, α2. Assume the j-th hypergraph is selected as the core hypergraph, we can havethe j-th centralized hypergraph. To learn the relevance among vertices and improvethe structure of the j-th centralized hypergraph, we optimize the following objectivefunction including the weights of hyperedges by imposing an �2-norm regularizer onWi (i=1,2,3,4) as
argminFj ,Wi (i=1,2,3,4)
{Ωc
j (Fj) + λRemp (Fj) + μ∑i
∑e∈Ei
Wi (e)2}
s.t. Hidiag (Wi) = diag (Dvi ) , diag (Wi) ≥ 0
, (2)
where Ωcj (Fj) is the regularizer for the j-th centralized hypergraph, aiming to smooth
the relationship among vertices on the hypergraph structure, Wi (e) is the weight ofthe hyperedge e ∈ Ei, Fj is the to-be-learned relevance matrix, and Remp (Fj) is
the empirical loss, and∑i
∑e∈Ei
Wi (e)2 is the �2 regularizer term to learn the weights

82 Y. Gao et al.
of hyperedges. The two constraints guarantee that the vertex degree is not changedduring the learning process and all the weights are non-negative, respectively. Ωc
j (Fj)is defined as
Ωcj (Fj) = α1Ωj (Fj) +
∑i�=j
α2Ωi (Fj) , (3)
where the first term is the regularizer for the core hypergraph and the second term is theregularizer for the other hypergraphs. We define the regularizer term Ωi (Fj) as
Ωi(Fj) =1
2
2∑k=1
∑e∈Ei
∑u,v∈Vi
Wi(e)Hi(u, e)Hi(v, e)
δi(e)
(Fj(u, k)√di(u)
−Fj(v, k)√di(v)
)2
= FTj (I−Θi)Fj ,
(4)
where Θi = Dei− 1
2HiWiDei−1HT
i Dvi− 1
2 . Ωj (Fj) can be accordingly obtained byΩj (Fj) = FT
j (I−Θj)Fj . Then, Ωcj (Fj) can be simplified as
Ωcj(Fj) = FT
j
(I− (α1Θj + α2
∑i�=j
Θi))Fj = FT
j ΔcjFj , (5)
where Δcj = I− (α1Θj + α2
∑i�=j
Θi) is the j-th centralized hypergraph Laplacian.
The empirical loss Remp (Fj) is defined as
Remp (Fj) =
2∑k=1
‖Fj(:, k)−Y(:, k)‖2, (6)
where Y ∈ Rn×2 is the label matrix and each of its entry denotes the category a subject
belongs to. Y(:, k) is the k-th column of Y. If the vertex v belongs to the first category,then the (v, 1)-th and (v, 2)-th entries in Y are set to 1 and 0, respectively.
Solution: To solve the optimization problem in Eq. (2), we employ an alternating opti-mization approach. We first fix Wi and optimize Fj as follows
argminFj
{Ωc
j (Fj) + λRemp (Fj)}, (7)
which leads to the following closed-form solution for
Fj =λ
1 + λ
(I− 1
1 + λ(α1Θj + α2
∑i�=j
Θi))−1
Y. (8)
We then fix Fj and optimize Wi as follows
argminWi (i=1,2,3,4)
{Ωc
j(Fj) + μ∑i
∑e∈Ei
Wi(e)2}
s.t. Hidiag(Wi) = diag(Dvi ), diag(Wi) ≥ 0.
(9)

MCI Identification by Joint MRI Data Learning 83
The above optimization task is convex on Wi and can be solved via quadratic pro-gramming. The learning process is repeated several times, once for each of the hy-pergraphs as the core hypergraph, to generate a centralized relevance matrix for eachimaging modality.
2.1 Relevance Matrices Fusion
To optimally integrate information from multiple MRIs, we learn the weights of eachhypergraph by minimizing the overall hypergraph Laplacian. Let ρi be the weight forthe i-th centralized hypergraph, we impose an �2-norm penalization on the weights ofall centralized hypergraphs as follows
argminρi
{∑ρiΩ
ci (Fi) + η
∑ρ2i
}s.t.
∑ρi = 1 , (10)
where η is to balance the Laplacian and the weight regularizer. Eq. (10) can be solvedusing the Lagrangian method. The final relevance matrix is then computed as F =∑
ρiFi. Classification of a subject could therefore be determined by its correspondingvalue in the final relevance matrix. If the relevance score to MCI is larger than that toNC, a subject is classified as MCI, and vice versa.
3 Experiments
Experimental Settings - To evaluate the performance of the proposed CHL method, a10-fold cross-validation strategy is used in our experiments. Specifically, we randomlypartition the subjects in the MCI and NC groups into 10 non-overlapping approximatelyequal sets. One set is first left out as testing set and the rest sets are used as the trainingset. The training set is further divided into 5 subsets for a 5-fold inner cross-validation tolearn the optimal parameters. This procedure is repeated 10 times, once for each of the10 sets, to compute the overall cross-validation classification performance. Six statisti-cal measures are used for performance evaluation, which include accuracy (ACC), sen-sitivity (SEN), specificity (SPEC), balance accuracy (BAC), positive predictive value(PPV), and negative predictive value (NPV).
Results - We compare the proposed method with two state-of-the-art methods: 1) Mul-timodal multitask learning (M3T) [11], which employs multimodal imaging data forMCI classification, and 2) Manifold regularized multitask feature learning (M2TFS)[5], which is another semi-supervised method on MCI classification. We further com-pare with two simplified versions of the proposed method: 1) centralized simple graphlearning (CSL), in which only simple graphs are employed instead of hypergraphs inour method, and 2) Multi-hypergraph learning (MHL) [3] without centralized learning.
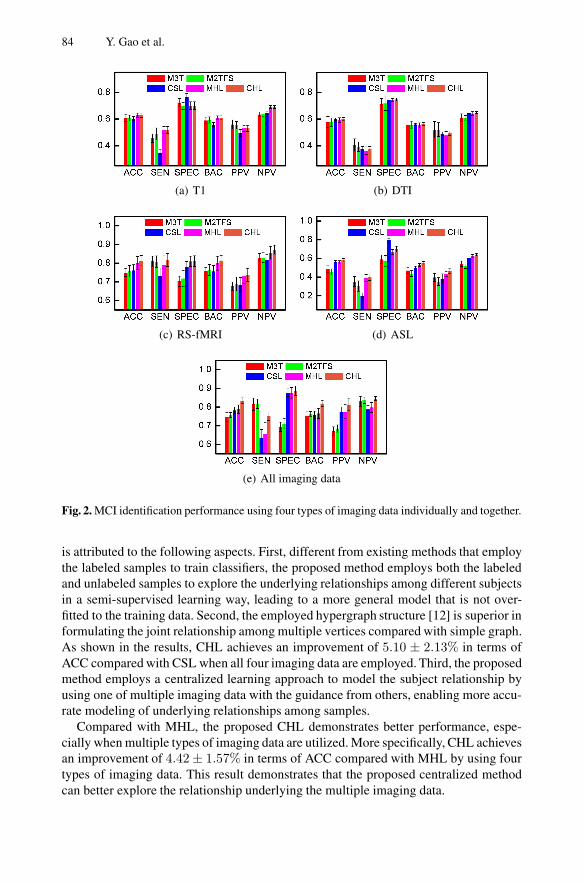
Figure 2 shows the MCI classification results of all compared methods using differ-ent imaging data individually and together. The proposed method (CHL) outperformsall competing state-of-the-arts methods. Specifically, by using four types of imagingdata, CHL achieves an improvement of 8.65 ± 2.50% and 7.61 ± 1.92%, in terms ofACC, compared with M3T and M2TFS, respectively. Better performance of our method
84 Y. Gao et al.
(a) T1 (b) DTI
(c) RS-fMRI (d) ASL
(e) All imaging data
Fig. 2. MCI identification performance using four types of imaging data individually and together.
is attributed to the following aspects. First, different from existing methods that employthe labeled samples to train classifiers, the proposed method employs both the labeledand unlabeled samples to explore the underlying relationships among different subjectsin a semi-supervised learning way, leading to a more general model that is not over-fitted to the training data. Second, the employed hypergraph structure [12] is superior informulating the joint relationship among multiple vertices compared with simple graph.As shown in the results, CHL achieves an improvement of 5.10 ± 2.13% in terms ofACC compared with CSL when all four imaging data are employed. Third, the proposedmethod employs a centralized learning approach to model the subject relationship byusing one of multiple imaging data with the guidance from others, enabling more accu-rate modeling of underlying relationships among samples.
Compared with MHL, the proposed CHL demonstrates better performance, espe-cially when multiple types of imaging data are utilized. More specifically, CHL achievesan improvement of 4.42± 1.57% in terms of ACC compared with MHL by using fourtypes of imaging data. This result demonstrates that the proposed centralized methodcan better explore the relationship underlying the multiple imaging data.

MCI Identification by Joint MRI Data Learning 85
4 Conclusion
In this paper, we proposed a centralized hypergraph learning method to model the re-lationship among subjects with multiple MRIs for MCI identification. In our method,this relationship is encoded by the structure and the weights of hyperedges in a hyper-graph. Multiple hypergraphs are constructed using multiple MRIs, respectively. In thelearning process, each time one hypergraph is selected as the core and the relationshipsamong subjects from other hypergraphs help to provide extra guidance to meliorate thestructure of the core hypergraph. Integrating hypergraphs with different weights enablesoptimal utilization of supplementary information conveyed by different imaging data.Our findings demonstrate the effectiveness of the CHL method on MCI diagnosis.
References
[1] Binnewijzend, M.A., Kuijer, J.P., Benedictus, M.R., van der Flier, W.M., Wink, A.M., Wat-tjes, M.P., van Berckel, B.N., Scheltens, P., Barkhof, F.: Cerebral blood flow measured with3D pseudocontinuous arterial spin-labeling MR imaging in alzheimer disease and mild cog-nitive impairment: a marker for disease severity. Radiology 267(1), 221–230 (2013)
[2] Cai, X., Nie, F., Cai, W., Huang, H.: Heterogeneous image features integration via multi-modal semi-supervised learning model. In: IEEE International Conference on ComputerVision, pp. 1737–1744 (2013)
[3] Gao, Y., Wang, M., Tao, D., Ji, R., Dai, Q.: 3-D object retrieval and recognition with hyper-graph analysis. IEEE Transactions on Image Processing 21(9), 4290–4303 (2012)
[4] Hinrichs, C., Singh, V., Xu, G., Johnson, S.C., Initiative, A.D.N., et al.: Predictive mark-ers for AD in a multi-modality framework: an analysis of MCI progression in the ADNIpopulation. NeuroImage 55(2), 574–589 (2011)
[5] Jie, B., Zhang, D., Cheng, B., Shen, D.: Manifold regularized multi-task feature selection formulti-modality classification in alzheimer’s disease. In: Mori, K., Sakuma, I., Sato, Y., Bar-illot, C., Navab, N. (eds.) MICCAI 2013, Part I. LNCS, vol. 8149, pp. 275–283. Springer,Heidelberg (2013)
[6] Lim, K.O., Pfefferbaum, A.: Segmentation of mr brain images into cerebrospinal fluidspaces, white and gray matter. Journal of Computer Assisted Tomography 13(4), 588–593(1989)
[7] Richiardi, J., Monsch, A.U., Haas, T., Barkhof, F., Van de Ville, D., Radu, E.W., Kressig,R.W., Haller, S.: Altered cerebrovascular reactivity velocity in mild cognitive impairmentand Alzheimer’s disease. Neurobiology of Aging (2014)
[8] Rubinov, M., Sporns, O.: Complex network measures of brain connectivity: uses and inter-pretations. NeuroImage 52(3), 1059–1069 (2010)
[9] Wang, H., Nie, F., Huang, H., Risacher, S.L., Saykin, A.J., Shen, L., et al.: Identifyingdisease sensitive and quantitative trait-relevant biomarkers from multidimensional hetero-geneous imaging genetics data via sparse multimodal multitask learning. Bioinformatics28(12), i127–i136 (2012)
[10] Ye, J., Wu, T., Li, J., Chen, K.: Machine learning approaches for the neuroimaging study ofAlzheimer’s disease. Computer 44(4), 99–101 (2011)
[11] Zhang, D., Shen, D.: Multi-modal multi-task learning for joint prediction of multiple re-gression and classification variables in Alzheimer’s disease. NeuroImage 59(2), 895–907(2012)
[12] Zhou, D., Huang, J., Schokopf, B.: Learning with hypergraphs: Clustering, classification,and embedding. In: Proceedings of Advances in Neural Information Processing Systems.pp. 1601–1608 (2006)
Copyright © 2022 FDOKUMEN