Identification of MCI individuals using structural and functional connectivity networks
30
Identification of MCI Individuals Using Structural and Functional Connectivity Networks Chong-Yaw Wee a , Pew-Thian Yap a , Daoqiang Zhang a , Kevin Denny b , Jeffrey N. Browndyke c,d,e , Guy G. Potter d , Kathleen A. Welsh-Bohmer c,d,f , Lihong Wang b , and Dinggang Shen a,* a Image Display, Enhancement, and Analysis (IDEA) Laboratory, Biomedical Research Imaging Center (BRIC) and Department of Radiology, University of North Carolina at Chapel Hill, U.S.A. b Brain Imaging and Analysis Center (BIAC), Duke University Medical Center, U.S.A. c Joseph and Kathleen Bryan Alzheimer’s Disease Research Center, Duke University Medical Center, U.S.A. d Department of Psychiatry and Behavioral Sciences, Duke University Medical Center, U.S.A. e Duke Institute for Brain Sciences, Duke University, U.S.A. f Department of Medicine, Division of Neurology, Duke University Medical Center, U.S.A. Abstract Different imaging modalities provide essential complementary information that can be used to enhance our understanding of brain disorders. This study focuses on integrating multiple imaging modalities to identify individuals at risk for mild cognitive impairment (MCI). MCI, often an early stage of Alzheimer’s disease (AD), is difficult to diagnose due to its very mild or insignificant symptoms of cognitive impairment. Recent emergence of brain network analysis has made characterization of neurological disorders at a whole-brain connectivity level possible, thus providing new avenues for brain diseases classification. Employing multiple-kernel Support Vector Machines (SVMs), we attempt to integrate information from diffusion tensor imaging (DTI) and resting-state functional magnetic resonance imaging (rs-fMRI) for improving classification performance. Our results indicate that the multimodality classification approach yields statistically significant improvement in accuracy over using each modality independently. The classification accuracy obtained by the proposed method is 96.3%, which is an increase of at least 7.4% from the single modality-based methods and the direct data fusion method. A cross- validation estimation of the generalization performance gives an area of 0.953 under the receiver operating characteristic (ROC) curve, indicating excellent diagnostic power. The multimodality classification approach hence allows more accurate early detection of brain abnormalities with greater sensitivity. © 2011 Elsevier Inc. All rights reserved. * Corresponding author. [email protected] (Dinggang Shen). Publisher's Disclaimer: This is a PDF file of an unedited manuscript that has been accepted for publication. As a service to our customers we are providing this early version of the manuscript. The manuscript will undergo copyediting, typesetting, and review of the resulting proof before it is published in its final citable form. Please note that during the production process errors may be discovered which could affect the content, and all legal disclaimers that apply to the journal pertain. Financial Disclosures There are no conflicts of interest including any financial, personal, or other relationships with people or organizations for any of the coauthors related to the work described in the article. NIH Public Access Author Manuscript Neuroimage. Author manuscript; available in PMC 2013 February 1. Published in final edited form as: Neuroimage. 2012 February 1; 59(3): 2045–2056. doi:10.1016/j.neuroimage.2011.10.015. NIH-PA Author Manuscript NIH-PA Author Manuscript NIH-PA Author Manuscript
Transcript of Identification of MCI individuals using structural and functional connectivity networks

Identification of MCI Individuals Using Structural and FunctionalConnectivity Networks
Chong-Yaw Weea, Pew-Thian Yapa, Daoqiang Zhanga, Kevin Dennyb, Jeffrey N.Browndykec,d,e, Guy G. Potterd, Kathleen A. Welsh-Bohmerc,d,f, Lihong Wangb, andDinggang Shena,*
aImage Display, Enhancement, and Analysis (IDEA) Laboratory, Biomedical Research ImagingCenter (BRIC) and Department of Radiology, University of North Carolina at Chapel Hill, U.S.A.bBrain Imaging and Analysis Center (BIAC), Duke University Medical Center, U.S.A.cJoseph and Kathleen Bryan Alzheimer’s Disease Research Center, Duke University MedicalCenter, U.S.A.dDepartment of Psychiatry and Behavioral Sciences, Duke University Medical Center, U.S.A.eDuke Institute for Brain Sciences, Duke University, U.S.A.fDepartment of Medicine, Division of Neurology, Duke University Medical Center, U.S.A.
AbstractDifferent imaging modalities provide essential complementary information that can be used toenhance our understanding of brain disorders. This study focuses on integrating multiple imagingmodalities to identify individuals at risk for mild cognitive impairment (MCI). MCI, often an earlystage of Alzheimer’s disease (AD), is difficult to diagnose due to its very mild or insignificantsymptoms of cognitive impairment. Recent emergence of brain network analysis has madecharacterization of neurological disorders at a whole-brain connectivity level possible, thusproviding new avenues for brain diseases classification. Employing multiple-kernel SupportVector Machines (SVMs), we attempt to integrate information from diffusion tensor imaging(DTI) and resting-state functional magnetic resonance imaging (rs-fMRI) for improvingclassification performance. Our results indicate that the multimodality classification approachyields statistically significant improvement in accuracy over using each modality independently.The classification accuracy obtained by the proposed method is 96.3%, which is an increase of atleast 7.4% from the single modality-based methods and the direct data fusion method. A cross-validation estimation of the generalization performance gives an area of 0.953 under the receiveroperating characteristic (ROC) curve, indicating excellent diagnostic power. The multimodalityclassification approach hence allows more accurate early detection of brain abnormalities withgreater sensitivity.
© 2011 Elsevier Inc. All rights reserved.*Corresponding author. [email protected] (Dinggang Shen).Publisher's Disclaimer: This is a PDF file of an unedited manuscript that has been accepted for publication. As a service to ourcustomers we are providing this early version of the manuscript. The manuscript will undergo copyediting, typesetting, and review ofthe resulting proof before it is published in its final citable form. Please note that during the production process errors may bediscovered which could affect the content, and all legal disclaimers that apply to the journal pertain.Financial DisclosuresThere are no conflicts of interest including any financial, personal, or other relationships with people or organizations for any of thecoauthors related to the work described in the article.
NIH Public AccessAuthor ManuscriptNeuroimage. Author manuscript; available in PMC 2013 February 1.
Published in final edited form as:Neuroimage. 2012 February 1; 59(3): 2045–2056. doi:10.1016/j.neuroimage.2011.10.015.
NIH
-PA Author Manuscript
NIH
-PA Author Manuscript
NIH
-PA Author Manuscript

KeywordsMild cognitive impairment (MCI); Alzheimer’s disease (AD); diffusion tensor imaging (DTI);resting-state functional magnetic resonance imaging (rs-fMRI); brain network analysis; multiple-kernel Support Vector Machines (SVMs); multimodality representation
1. IntroductionAlzheimer’s disease (AD) is an irreversible neurodegenerative disease characterized byprogressive cognitive and memory deficits, which are serious enough to interfere daily life.It has been reported that the prevalence of AD is expected to quadruple by year 2050, where1 in every 85 persons will be affected by the disease [3]. Thus, there is a pressing need foraccurate diagnosis of AD at its early stage in order to reduce the burden of worldwidehealthcare system.
Mild cognitive impairment (MCI), often a prodromal stage of AD, is a good target for earlydiagnosis and therapeutic interventions of AD. Recent studies show that individuals withMCI tend to progress to probable AD at a rate of approximately 10% to 15% per year [23,15], compared with healthy controls who develop dementia at a rate of 1% to 2% per year[2]. Early detection of MCI is of paramount importance for possible delay of the transitionfrom MCI to AD. Nevertheless, MCI is difficult to diagnose due to its very mild symptomsof cognitive impairment. Most pattern classification algorithms proposed for MCI or early-AD identification achieve relatively inferior performance with low sensitivity rate.
Several imaging modalities have been applied for AD and MCI diagnosis. These modalitiesprovide complementary information: diffusion tensor imaging (DTI) [16, 31] provides localmicrostructural characteristics of water diffusion; structural magnetic resonance imaging(MRI) [10, 22] can be used to delineate brain atrophy; functional MRI (fMRI) [21, 24]characterizes hemodynamic response related to neural activity; positron emissiontomography (PET) [14, 26] measures metabolic patterns. Most existing pattern classificationmethods, however, use only one of these modalities at a time for AD and MCI diagnosis.Greater effort should hence be focused on integration of different modalities sincecombining complementary information from the different imaging modalities can improveaccuracy in disease diagnosis.
To the best of our knowledge, to date, DTI and resting-state fMRI (rs-fMRI) have not beencombined at a brain connectivity network level for identifying individuals with MCI,although they have been employed separately with reasonably good classificationperformance. In this study, we propose a high-dimensional multivariate classificationframework to accurately identify individuals with MCI from those who undergo normalaging. The key idea of our approach involves employing multiple-kernel based supportvector machine (SVM) algorithm to integrate anatomical and functional connectivityinformation extracted from DTI and rs-fMRI. The current study is the first attempt tointegrate these two modalities to identify MCI individuals from cognitively normal controls.We seek to validate whether complementary structural and functional information can becombined to improve classification performance. We will also report brain regions thatcontribute most to classification. While confirming findings of previous studies, this papersheds new light on the effectiveness of applying multimodality information for diagnosis ofprogressive neurodegenerative disorders.
The rest of the paper is organized as follows: Section 2 furnishes information on the imagedataset, image acquisition protocols, and post-processing pipeline. This is followed by a
Wee et al. Page 2
Neuroimage. Author manuscript; available in PMC 2013 February 1.
NIH
-PA Author Manuscript
NIH
-PA Author Manuscript
NIH
-PA Author Manuscript

comprehensive description of the multiple-kernel-SVM based multimodality classificationframework. The proposed MCI classification framework is evaluated in Section 3. Findings,methodological issues, and limitations of the proposed framework are discussed extensivelyin Section 4. Section 5 concludes this paper.
2. Method and Materials2.1. Subjects Characterization and Diagnosis
All subjects used in this study were recruited by the Duke-UNC Brain Imaging and AnalysisCenter (BIAC), Durham, North Carolina, USA. Informed consent was obtained from allparticipants, and the experimental protocols were approved by the institutional ethics board.This cohort involved of 27 participants, 10 individuals with MCI, and 17 socio-demographically matched normal controls. All the recruited subjects were diagnosed byexpert consensus panels at the Joseph and Kathleen Bryan Alzheimer’s Disease ResearchCenter (Bryan ADRC) and the Department of Psychiatry at Duke University MedicalCenter. Diagnosis was based upon available data from a battery of general neurologicalexamination, neuropsychological assessment evaluation, collateral and subject symptom andfunctional capacity reports. Conformation of diagnosis for MCI if subjects met the followinginclusion criteria: 1) age > 55 years and any race; 2) recent worsening of cognition, but stillfunctioning independently; 3) Mini Mental State Examination (MMSE) score between 24and 30; 4a) score ≤ −1.5 SD on at least two Bryan ADRC cognitive battery memory tests forsingle-domain amnestic MCI; or 4b) score ≤ −1.5 SD on at least one of the formal memorytests and score ≤ −1.5 SD on at least one other cognitive domain task (e.g., language,visuospatial-processing, or judgment/executive function) for multi-domain MCI; 5) 4 orlower for baseline Hachinski score; 6) does not meet the NINCDS-ADRDA or DSM-IV-TRcriteria for dementia; 7) no psychological symptoms or history of depression; and 8)capacity to give informed consent and follow study procedures.
On the other hand, all healthy controls individuals met the following criteria: 1) age > 55years and any race; 2) adequate visual and auditory acuity to properly completeneuropsychological testing; 3) no self-report of neurological or depressive illness; 4) showsno evidence of depression based on the Diagnostic Interview Schedule port based on theDiagnostic Interview Schedule portion of the Duke Depression Evaluation Schedule; 5)normal score on a non-focal neurological examination; 6) a score > −1 SD on any formalmemory tests and a score > −1 SD on any formal executive function or other cognitive test;and 7) demonstrates a capacity to give informed consent and follow study procedures. Inorder for safety purposes and minimizing biases, subjects were excluded from the study ifthey have: 1) any of the traditional MRI contraindications, such as foreign metallic implantsor pacemakers; 2) a past head injury or neurological disorder associated with MRIabnormalities, including dementia, brain tumors, epilepsy, Parkinson’s disease,demyelinating diseases, etc.; 3) any physical or intellectual disability affecting completion ofassessments; 4) documentation of other Axis I psychiatric disorders; and 5) any prescriptionmedication (or nonprescription drugs) with known neurological effects. Noteworthy that thediagnosis of all cases were made on clinical grounds without any reference to MRI.Demographic information of the participants is shown in Table 1.
2.2. Data AcquisitionData acquisition was performed using a 3.0-Tesla GE Signa EXCITE scanner. Diffusion-weighted images of each participant were acquired axially parallel to the anterior andposterior commissures (AC-PC) line with twenty-five-direction diffusion-weighted whole-brain volumes using the following parameters: b = 0, 1000 s/mm2, flip angle = 90°, TR/TE =17000/78 ms, imaging matrix = 128 × 128, FOV = 256 × 256 mm2, resulting in a voxel
Wee et al. Page 3
Neuroimage. Author manuscript; available in PMC 2013 February 1.
NIH
-PA Author Manuscript
NIH
-PA Author Manuscript
NIH
-PA Author Manuscript

dimension of 2 × 2 × 2 mm3 reconstructed resolution. A total of 72 contiguous slices wereacquired.
Resting-state functional images were acquired axially parallel to the horizontal planeconnecting the AC-PC line with the following parameters: flip angle = 77°, TR/TE =2000/32 ms, 34 slices, imaging matrix = 64 × 64, FOV = 256 × 256 mm2, resulting in avoxel resolution of 4 × 4 × 4 mm3. A total of 34 slices were acquired using a SENSEinverse-spiral pulse sequence in the same plane as the low resolution T1-weighted images.All the subjects were told to keep their eyes open and stare at a fixation cross in the middleof the screen during scanning, which lasted for 5 minutes. As we know, neurons get excitedto changing stimuli across time. But when the stimuli such as the little cross sign in thisstudy was presented steadily without changing across the five minutes period, the neuralexcitation related to the stimuli can vanish quickly. Hence, this can ensure subjects notfalling into sleep and avoid saccade-related activation which is unavoidable if eyes wereclosed.
2.3. MethodProgressive degenerative neurological diseases such as Alzheimer’s disease and similardementias exhibit subtle, yet spatially and temporally diffuse pathology, where the brain isdamaged in a large-scale, highly connected network, rather than in one single isolatedregion. In view of this, designing an informative description of interregional connections,which might be more sensitive in conveying the pathological information, is necessary foraccurate diagnosis or prediction of neurological diseases.
It has been proven that information extracted from different modalities and different braintissues might complement each other and provides more comprehensive characterization ofbrain abnormalities [9, 11, 12, 18, 36]. To integrate complementary information fromdifferent modalities and different brain tissue types, we proposed in this paper an approachthat combine structural connectivity information from white matter (WM) regions andfunctional connectivity information from gray matter (GM) regions to distinguishindividuals with MCI from normal controls. The key of our multimodality classificationframework include:
• More informative description of the brain via multiple connectivity networks;
• Integration of DTI and rs-fMRI information at a whole-brain connectivity level;
• Multimodality data fusion using multiple-kernel SVM.
An overview of the proposed MCI classification framework is summarized graphically inFigure 1.
2.3.1. Processing of DTI—The DTI images were first parcellated into 90 regions (45 foreach hemisphere) by propagating the automated anatomical labeling (AAL) ROIs [28] toeach image using a deformable DTI registration algorithm called F-TIMER [33, 34] withtensor orientation corrected using the method described in [32]. Whole-brain streamlinefiber tractography was then performed on each image using ExploreDTI [19]. Whole-brainstreamline fiber tractography was performed on each DTI image using ExploreDTI [19],with minimal seed point fractional anisotropy (FA) of 0.45, stopping FA of 0.25, minimalfiber length of 20 mm, and maximal fiber length of 400 mm. The number of fibers passingthrough each pair of regions was counted. Two regions were considered as anatomicallyconnected if fibers passing through their respective masks were present, giving us theconnection topology of the network.
Wee et al. Page 4
Neuroimage. Author manuscript; available in PMC 2013 February 1.
NIH
-PA Author Manuscript
NIH
-PA Author Manuscript
NIH
-PA Author Manuscript

On top of the fiber count based connectivity network, averages of on-fiber FA, meandiffusivity (MD) and principal diffusivity values were computed to form another 5connectivity networks with the same topology but conveying different biophysicalproperties [31]. The fiber count network provides information on the number of fibersconnecting a pair of regions. The FA network provides information on the degree ofanisotropy along the fibers, the MD network provides information on the average diffusivityalong fibers, the λ1 network provides information on the on-fiber average axial diffusivity(also called the longitudinal diffusivity); and the λ2 and λ3 networks provide information onthe on-fiber average radial diffusivities (diffusivities in directions perpendicular to theaxonal direction). By including these different biophysical properties, subtle information ofWM atrophy caused by pathological disorder can be extracted and used to improveclassification performance. It has been reported in a recent paper [31] that this informativedescription is capable of significantly improving classification accuracy compared withsimple univariate description. Examples of the constructed connectivity maps are shown inFigure 2.
2.3.2. Processing the Resting-State fMRI (rs-fMRI)—Post-processing of the rs-fMRIimages, such as slice timing correction and head-motion correction were performed usingthe Statistical Parametric Mapping software package (SPM8,http://www.fil.ion.ucl.ac.uk.spm). To ensure magnetization equilibrium, the first 10 acquiredfMRI images of each subject were discarded. The remaining 140 images were first correctedfor the acquisition time delay among different slices before they were realigned to the firstvolume of the remaining images for head-motion correction. We hypothesize that thevariability of BOLD signal of GM regions is sensitive in delineating the alteration ofconnectivity patterns, caused by pathological attacks of MCI. Removing signal from theventricles and WM is motivated by the fact that these regions contain a relatively highproportion of noise caused by the cardiac and respiratory cycles [29]. Accordingly, we firstsegmented the T1-weighted image of each subject into GM, WM and CSF. For each subject,the GM was then used to mask the fMRI images. This procedure eliminated the possiblecontribution from WM and CSF in the re-fMRI time series.
The first scan of fMRI time series was coregistered to the T1-weighted image of samesubject. The estimated transformation was then applied to other fMRI scans of the samesubject. Deformation fields were estimated by warping the Automated Anatomical Labeling(AAL) [28] template (T1-weighted image) to the subject T1-weighted images using adeformable registration method called HAMMER [25]. The brain space of each subject wasthen parcellated into 90 ROIs by warping the AAL region masks to the subject space usingthe estimated deformation fields. For each subject, the mean time series of each individualROI was computed by averaging the GM-masked fMRI time series over all voxels in thatparticular ROI.
One crucial step in rs-fMRI analysis is temporal band-pass filtering. The frequency intervalof band-pass filtering varies and depends on the application, but is normally within theinterval of [0.01 – 0.10 Hz] since the fMRI dynamics of neuronal activities are most salientwithin this frequency interval. It provides a reasonable trade-off between avoiding thephysiological noise associated with higher frequency oscillations [6] and the measurementerror associated with estimating very low frequency correlations from limited time series[1].
The analysis of rs-fMRI is normally performed on full spectrum of the filtered signals - arelatively global analysis which might not be sensitive enough to delineate complex yetsubtle pathological patterns related to the neurological disease. Such global analysis onBOLD signal might cause local, subtle temporal changes to be averaged out, and thus
Wee et al. Page 5
Neuroimage. Author manuscript; available in PMC 2013 February 1.
NIH
-PA Author Manuscript
NIH
-PA Author Manuscript
NIH
-PA Author Manuscript

deteriorate classification performance. A relatively local analysis, which is more sensitive toBOLD signal changes, is hence required.
In order to extract complex, yet subtle pathological influences of MCI, we employed amulti-spectrum characterization of the regional mean time series, which utilizes multiplefrequency sub-bands, in contrast to the conventional full-spectrum description, to constructfunctional connectivity networks. The GM-masked mean time series of each region wasband-pass filtered within frequency interval [0.025 ≤ f ≤ 0.100Hz] before it wasdecomposed into five distinct, equally divided frequency sub-bands using the Fast Fouriertransform (FFT), enabling a relatively frequency specific analysis of the regional mean timeseries. By using this multi-spectral characterization, a relatively local analysis, which ismore sensitive in delineating complex yet subtle pathological patterns related to theneurological disease, can be achieved.
Functional connectivity, which represents interregional correlations in neuronal variability,was measured using pairwise Pearson correlation coefficients between the ROI pairs. Givena set of N random variables, the Pearson correlation matrix is a symmetric matrix in whicheach off-diagonal element is the correlation coefficient between a pair of variables. Weconsidered the brain regions as a set of nodes and the correlation coefficients as signedweights represented by the edges connecting the nodes. Fisher’s r-to-z transformation wasapplied on the elements of the Pearson correlation matrix to improve the normality of thecorrelation coefficients as
(1)
where r is the Pearson correlation coefficient and z is approximately a normal distributionwith standard deviation . The functional connectivity networks are representedin the form of z-maps. Examples of the constructed functional connectivity maps for anormal control (NC) and an individual with MCI are shown in the top and bottom rows ofFigure 3, respectively.
2.3.3. Feature Extraction and Feature Selection—The weighted local clusteringcoefficient, a measure that quantifies the cliquishness of the nodes, is extracted from allconnectivity maps as
(2)
where ζ is the subnetwork comprising of kp nodes directly connected to the p-th node, andz(p, q) is the edge weight between the p-th ROI and q-th ROI. Hence, a total of 90 featurescan be obtained from each connectivity map, producing for each subject a pool of (6 × 90 =540) and (5 × 90 = 450) features for DTI and fMRI modalities, respectively.
Statistical t-test was performed to select the most discriminative features for classification.Features with p-values smaller than a predefined threshold will be selected to construct theindividual kernel matrix for each imaging modality.
2.3.4. Multiple-Kernel SVM—Given n training samples with Xi = {xi,1,…, xi,D} denotingthe feature vector of the i-th sample (D = number of connectivity maps, d = 1,…, D and xi,d
Wee et al. Page 6
Neuroimage. Author manuscript; available in PMC 2013 February 1.
NIH
-PA Author Manuscript
NIH
-PA Author Manuscript
NIH
-PA Author Manuscript

= {fi,d,(1), …,fi,d(90)}), yi ∈ {− 1,1} denoting the corresponding label, the primaloptimization problem of a conventional single kernel SVM is given as
(3)
where ξi, C, b, w and ϕ(·) denote the distance of the i-th misclassified observation from itscorrect side of the margin, the model parameter that controls the amount of constraintviolations introduced by ξi, the bias term, the normal vector of hyperplane, and the kernel-induced mapping function, respectively.
By applying the kernel approach, equation (3) is normally solved using its dual form
(4)
where α is the Lagrange multiplier and k(Xi, Xj) is the kernel function for training samples,Xi and Xj.
In order to integrate the biomarkers from M modalities, multiple-kernel SVM version ofprimal optimization problem can be written as
(5)
where βm ≥ 0 denotes the weighting factor on the m-th modality. Accordingly, thecorresponding dual form can be written as
(6)
where is the kernel function for the m-th modality.
Given a new test sample X = {X(1),…, X(M)}, the decision function for the predicted labelcan be determined as
Wee et al. Page 7
Neuroimage. Author manuscript; available in PMC 2013 February 1.
NIH
-PA Author Manuscript
NIH
-PA Author Manuscript
NIH
-PA Author Manuscript

(7)
The multiple-kernel SVM can be naturally embedded into the conventional single kernel
SVM framework by noting as a mixed-kernel between the
multimodality training samples Xi and Xj, and as a mixed-kernel between the multimodality training sample between Xi and the test sample X.
2.3.5. SVM Training and Classification—A linear kernel based SVM classifier basedon the LIBSVM library [5] was adopted in the current framework based on mixed-kernel.Before we computed the kernel between pairs of feature vectors, we first performed anormalization step on each feature vector to obtain unit norm vector (i.e., ∥x∥2 = 1). In fact,linear kernel with this normalization step can be regarded as a “normalized linear kernel”and is defined as
(8)
where T denotes matrix transpose, (x, y) denotes the training set of instance-label pairs, ∥·∥2denotes l2-norm.
In order to obtain an unbiased estimation of the generalization performance of the completeframework and at the same time select the optimal SVM model, a nested cross-validationscheme was employed. Algorithmically, this can be described as two nested loops of cross-validation. Hyperparameter as part of the SVM model is determined in the inner loop ofcross-validation. The selected models are then evaluated in terms of their generalizationability using an independent validation set. This procedure is repeated until all subjects havebeen left out. We note that in each run of the outer-loop cross-validation loop, the selectedmodel and hence the hyperparameter can be different.
2.4. Summary of MethodologyThe proposed multiple-kernel SVM based multimodality classification framework issummarized as follows.
1. In the DTI modality, whole-brain streamline tractography is performed using the90-region AAL atlas to construct structural connectivity network based on thenumber of fibers passing through each pair of regions. Based on the common fibersconnecting each region pair, on-fiber average FA, MD, and principal diffusivitiesare derived to construct another five connectivity networks.
2. For each network, the clustering coefficients for each ROI are determined tocompute a total of 90 features. Feature vectors from all networks of each subjectwere concatenated to form a long feature vector to provide an informativedescription of WM connections finally resulting in a total of 540 features.
3. In the fMRI processing, the first 10 fMRI images are discarded to cater formagnetization equilibrium of each subject. Slice timing correction and intra-subjectregistration of the acquired rs-fMRI time series are performed on the remaining
Wee et al. Page 8
Neuroimage. Author manuscript; available in PMC 2013 February 1.
NIH
-PA Author Manuscript
NIH
-PA Author Manuscript
NIH
-PA Author Manuscript

images using the SPM software package to correct the slice acquisition time delayand head motion.
4. T1-weighted image of each subject is segmented and its GM regions are then usedto mask the acquired fMRI time series. The brain space is further parcellated into90 regions using the AAL template.
5. The mean time series of each ROI, which is obtained by averaging all voxels withinthe GM-masked ROI, is band-pass filtered (0.025 ≤ f ≤ 0.100Hz) before it is furtherdecomposed into five equally-divided, distinct frequency sub-bands. Fivefunctional connectivity networks are constructed using pairwise Pearson correlationcoefficients, one for each frequency sub-band.
6. For each network, the local clustering coefficients for all ROIs are determined asfeatures for classification. All clustering coefficients are concatenated to form along feature vector consisting of 450 features.
7. For each modality, features with significant discriminative power are selected usingt-tests.
8. Individual kernel matrices are then constructed from the selected features of eachmodality before they are integrated to form a single mixed-kernel matrix.
9. The constructed mixed-kernel is employed to train SVM classifiers in a leave-one-out fashion using the LIBSVM solver.
3. Experimental ResultsAs with common practice, the classifiers are evaluated based on the classification accuracyand the area under ROC curve (AUC). Classification accuracy measures the effectiveness ofpredicting the true class label. The area under receiver operating characteristic (ROC) curvemeasures the probability that when one positive and one negative samples are drawn atrandom, the decision function assigns a higher value to the positive than to the negativesample.
In addition, we also employed other statistical measures to evaluate the diagnostic power ofthe various methods used for comparison. The Youden’s index (Y), Balanced ACcuracy(BAC) and F-score (F) are defined respectively as [27]
(9)
(10)
(11)
where
Wee et al. Page 9
Neuroimage. Author manuscript; available in PMC 2013 February 1.
NIH
-PA Author Manuscript
NIH
-PA Author Manuscript
NIH
-PA Author Manuscript

with TP, TN, FP and FN denoting true positive, true negative, false positive and falsenegative, respectively. F-score is a composite measure that favors algorithms with highersensitivity and challenges those with higher specificity. Youden’s index evaluates the abilityof the algorithm to avoid failure by equally weighting its performance on positive andnegative samples.
3.1. Classification based on Multimodality Connectivity MapsThe proposed multiple-kernel SVM based multimodality classification approach wascompared with the single modality approach and the direct data fusion method. In the singlemodality approach, only features selected from a single imaging modality (DTI or rs-fMRI)were applied for kernel matrix construction. In the direct data fusion method, all 990features, including DTI and rs-fMRI features, were first concatenated into a long vectorbefore feature selection and kernel matrix construction. In the multiple-kernel approach, theoptimal weighting factor, βm, was determined via grid search. Similarly, in all experimentsparameters such as p-value for t-test feature selection method and SVM soft marginconstraint parameter, C, were also determined via grid search.
Comparison was performed via leave-one-out cross-validation due to the limited number ofavailable samples. Classification performance for identification of individuals with MCIusing single and multimodality connectivity networks are summarized in Table 2. Theproposed method yields a classification accuracy of 96.30%, which is an increment of atleast 7.41% from that of the single modality approach and the direct data fusion method. Italso outperformed all other methods in the rest of the computed statistical indices.
A cross-validation estimation of the generalization performance shows an area of 0.9529under the ROC curve (AUC), indicating excellent diagnostic power. ROC curves for allcompared methods are shown in Figure 4.
3.2. Effect of Weighting Factor, βmThe weighting factor, βm, determines the contribution of each modality in multimodalityclassification as formularized in equations (5), (6) and (7). A larger βm value indicates largercontribution of DTI to the classification and vice versa. In this experiment, we seek toinvestigate how classification performance varies with respect to βm. We fixed the constraintparameter, C to 3.0, and p-value to 0.01 for both modalities for feature selection. Theclassification accuracy and AUC value of the proposed method are shown graphically inFigure 5.
It is observed that higher classification accuracy is achieved when larger βm value is used.Accuracy of more than 90% can be achieved with βm equal or larger than 0.3. The highestaccuracy values are achieved within the range of 0.40 ≤ βm ≤ 0.65. Similar trends can beobserved for AUC values. High and consistent AUC values are obtained over a relativelywide range of 0.35 ≤ βm ≤ 0.70. This indicates that the proposed method is relatively robustto the weighting factor. The skewness of the accuracy and AUC graphs towards larger βmvalues indicates dominance of structural information carried by the DTI modality in theclassification.
Wee et al. Page 10
Neuroimage. Author manuscript; available in PMC 2013 February 1.
NIH
-PA Author Manuscript
NIH
-PA Author Manuscript
NIH
-PA Author Manuscript

3.3. Effect of Constraint Parameter, CWe investigate the influence of different values of the constraint parameter, C, on theclassification performance. We fixed the weighting factor, βm to 0.6 and varied theconstraint parameter, C, from 1 to 10, in steps of 1. The p-value used for feature selectionwere maintained as 0.01 for both modalities. The classification accuracies and AUC valueswith respect to C are shown in Figure 6.
Classification performance is relatively robust to C. Variation of constraint parameter, C,does not significantly affect the performance of the proposed method. In addition, we alsotested our method using several much larger C values, i.e., 50 and 100. The outcome againshowed that the proposed method consistently maintains high classification accuracy,despite the high C values.
3.4. Effect of Predefined Threshold for Feature SelectionIn the proposed framework, the statistical t-test is applied to select a subset of features withmost discriminative power. Features with their p-value smaller than a predefined thresholdare retained for construction of SVM classifiers. Thus, the number of features that will beselected is determined by the predefined threshold. In this subsection, an experiment isperformed to explore the robustness of the proposed framework over the number of featuresselected. The performance is summarized in Figure 7.
A high classification performance is consistenly observed with the variation of p-value(variation in the number of selected features). Classification accuracy is more than 88.0%for most of p-values. For large p-values, classification accuracy deteriorates because morefeatures, including some redundant and confounding features, are selected for constructingthe classifier. The proposed framework shows a very consistent AUC value, always largerthan 0.92, over the p-values, indicating excellent diagnostic power. The numbers of featuresselected for different p-values are provided in Table 3.
3.5. The Most Discriminant RegionsThe most discriminant regions that are selected during classifier construction include theorbitofrontal cortex, temporal pole, anterior and posterior cingulate gyrus, frontal gyrus,amygdala, precuneus, thalamus, parahip-pocampal gyrus and insula, in line with resultsreported in previous studies. Regions which are selected by t-test feature selection methodfor mixed kernel construction are shown in Table 4. The top twelve selected regions used formultimodality classification are graphically shown in Figure 8.
3.6. Classification Performance Using Linear And Nonlinear Kernel FunctionsIn this subsection, we compared the classification performance of our proposed frameworkusing the linear and nonlinear kernel-based SVMs. The best classification performance ofthe linear kernel as well as two other nonlinear kernels, i.e., radial basis function (RBF) andpolynomial, are provided after choosing the optimal parameters via grid search. Thepolynomial kernel used in this study is a homogeneous kernel defined as
(12)
where T denotes matrix transpose, (x, y) denotes the training set of instance-label pairs and ddenotes the polynomial degree. The best classification performance achieved for allcompared methods are shown in Table 5.
Wee et al. Page 11
Neuroimage. Author manuscript; available in PMC 2013 February 1.
NIH
-PA Author Manuscript
NIH
-PA Author Manuscript
NIH
-PA Author Manuscript

It can be observed that the performance of polynomial kernel is the same as the linearkernel. In fact, we found that the best performance is found to be when d = 1. RBF kernelshows significant improvement in classification performance if compared to the linear andpolynomial kernels. However, the proposed normalized linear kernel performs better thanthe RBF kernel. We adopted the normalized linear kernel in this study since choosing theappropriate value of σ for RBF kernel is very challenging in practice.
4. Discussion4.1. Significance of Results
Single modality of biomarkers has been widely employed for AD/MCI diagnosis andprediction, often achieving relatively high performance. Single-modality-based methods relyon simpler scanning protocols and hence require less image acquisition effort, making themmore clinically feasible. However, information from different imaging biomarkerscomplements to each other and potentially improve prediction accuracy. Integration ofbiomarkers of different modalities with different data fusion methods for diseases diagnosisand prediction is still an open area of research. Our study demonstrates that multimodalityconnectivity network analysis can be employed to distinguish individuals with MCI fromnormal controls with high accuracy.
It is well know that misclassifying a healthy person to be a patient may be troublesome,however, misclassifying a patient to be a healthy person may cause severe consequences. Ifa patient is mis-diagnosed as a healthy person, necessary treatments to delay or cure thedisease may not be provided on time during the critical treatment period. This will acceleratethe progression of disease from mild to severe, a point where no effective treatment isavailable, eventually causing death of patient. Hence, it is tremendously crucial for aclassifier to alleviate such circumstance by providing high sensitivity to the disease. Ourresults shown an improvement in sensitivity when both imaging modalities are combinedthrough the multiple-kernel SVM algorithm. Statistically, our method performed better thanany single modality method due to the improvement of sensitivity while maintaining highspecificity. Furthermore, our method shows a relatively stable and robust performance withrespect to the modality weighting factor and SVM constraint parameter.
The regions selected in the course of classification by our method are in agreement withprevious studies and include the prefrontal cortex and or-bitofrontal cortex [14], temporalpole [13], anterior and posterior cingulate gyrus, precuneus and insula [8], amygdala [7],thalamus [30], parahippocampal gyrus [21, 4, 24], inferior temporal left, superior temporalgyrus right and precentral gyrus right [20], inferior temporal left, inferior frontal gyrus left,insula and superior temporal gyrus [17].
4.2. Methodological Issues/LimitationsThe performance of our method may be affected by the unbalanced data between individualswith MCI and normal controls that was used for SVM model construction. This is typicallythe case in real world disease diagnosis, where patient samples are normally more difficultto collect, depending on the prevalence of the disease. A classifier will normally try to adaptitself for better prediction of the majority class; this will increase the overall classificationaccuracy. Although the sensitivity has been improved by using multimodality connectivitynetworks, the proposed framework at its current stage is not designed to handle this issue.Full investigation focusing on handling unbalanced data will be our future work.
Whole-brain connectivity network analysis, a relative new neuroimaging approach fordisease diagnosis and prediction, is still facing some fundamental problems. One of theproblems is the lack of standardized approaches for brain parcellation, resulting in network
Wee et al. Page 12
Neuroimage. Author manuscript; available in PMC 2013 February 1.
NIH
-PA Author Manuscript
NIH
-PA Author Manuscript
NIH
-PA Author Manuscript

nodes that are often define either anatomically or randomly [35]. The scale of parcellationcan affect network properties such as clustering coefficient, global and local efficiencies,path length, small-worldness, etc.
There are many other imaging modalities that have been used for AD/MCI classification andprediction, as mentioned in Section 1. Integration of imaging modalities other than DTI andfRMI will be explored in the future to further improve the classification performance basedon the proposed framework. We also plan to apply our method to distinguish between MCIsubjects who progressed to AD, and those who remained stable for a certain number ofyears.
Our current study is limited by the small sample and statistical power is hence a potentialconcern. Leave-one-out cross-validation, as employed in this study, provides an optimisticestimate of the classification accuracy since all except one of the subjects are used to trainthe classifier. Hence, almost all information available in the dataset is used in classifiermodel construction. For other classification approaches such as k-fold cross-validation, onlyN − k (N is the total number of subjects in the dataset) subjects are included during trainingprocess, and hence the performance obtained may be less optimistic to the small dataset usedin this study. However, estimation of the classification accuracy using k-fold cross-validation might be more precise when compared to leave-one-out cross-validation providedthat there are sufficient data to accurately train the classifier. Our dataset is quite diverse,and it includes both sexes and all ages between 55 to 84 for individuals with MCI and 55 to88 for normal controls. However, the results obtained have to be verified in the future withlarger datasets to reduce individual effects and to validate the effectiveness of the proposedtechnique.
5. ConclusionThis study investigated the diagnostic power of multimodality connectivity networksderived from the DTI and rs-fMRI for identifying individuals with MCI from normalcontrols. In this framework, multiple modalities integration was achieved via a multiple-kernel SVM algorithm. SVM classifiers were trained using a mixed kernel that wasconstructed from the individual kernel of each modality. This framework improvesclassification performance and hence justifies the hypothesis that the DTI and rs-fMRIcontain complementary information, and each of them is indispensable particularly forachieving better diagnostic power. High sensitivity provided by our framework ensure thatnecessary treatments can be provided to individuals with MCI during critical treatmentperiod and hence possibly delays the progression of MCI to AD or other cognitiveimpairment related dementias. The promising results shed new light on the effectiveness ofapplying multimodality information for diagnosis of progressive neurodegenerativedisorders such as AD.
Research Highlights
• Multiple imaging modalities provide complementary information that enhanceour understanding of the brain.
• Identification of MCI and cognitively healthy individuals using multimodalityconnectivity networks.
• DTI and resting-state fMRI connectivity networks are used in multimodalityclassification.
• Multimodality classification leads to better MCI classification performance.
Wee et al. Page 13
Neuroimage. Author manuscript; available in PMC 2013 February 1.
NIH
-PA Author Manuscript
NIH
-PA Author Manuscript
NIH
-PA Author Manuscript

AcknowledgmentsThis work was supported in part by NIH grants EB006733, EB008760, MH076970, EB009634, NIA L30-AG029001, P30 AG028377-02, K23-AG028982, as well as a National Alliance for Research in Schizophrenia andDepression Young Investigator Award (LW).
References1. Achard S, Basset DS, Meyer-Lindenberg A, Bullmore E. Fractal connectivity of long-memory
networks. Physical Review E. 2008; 77:036104.2. Bischkopf J, Busse A, Angermeyer MC. Mild cognitive impairment - a review of prevalence,
incidence and outcome according to current approaches. Acta Psychiatrica Scandinavica. 2002;106:403–414. [PubMed: 12392483]
3. Brookmeyer R, Johnson E, Ziegler-Graham K, Arrighi HM. Forecasting the global burden ofAlzheimer’s disease. Alzheimer’s & Dementia. 2007; 3:186–191.
4. Celone KA, Calhoun VD, Dickerson BC, Atri A, Chua EF, Miller SL, DePeau K, Rentz DM, SelkoeDJ, Blacker D, Albert MS, Sperling RA. Alterations in memory networks in mild cognitiveimpairment and Alzheimer’s disease: An independent component analysis. The Journal ofNeuroscience. 2006; 40:10222–10231. [PubMed: 17021177]
5. Chang CC, Lin CJ. LIBSVM: a library for support vector machines. 2001 Software available athttp://www.csie.ntu.edu.tw/cjlin/libsvm.
6. Cordes D, Haughton VM, Arfanakis K, Carew JD, Turski PA, Moritz CH, Quigley MA, MeyerandME. Frequencies contributing to functional connectivity in the cerebral cortex in “resting-state”data. American Journal of Neuroradiology. 2001; 22:1326–1333. [PubMed: 11498421]
7. Dai W, Lopez OL, Carmichael OT, Becker JT, Kuller LH, Gach HM. Mild cognitive impairmentand Alzheimer disease: Patterns of altered cerebral blood flow at MR imaging. Radiology. 2009;250:856–866. [PubMed: 19164119]
8. Davatzikos C, Bhatt P, Shaw LM, Batmanghelich KN, Trojanowski JQ. Prediction of MCI to ADconversion, via MRI, CSF biomarkers, and pattern classification. Neurobiol Aging. 2010
9. Dukart J, Mueller K, Horstmann A, Barthel H, M¨oller HE, Villringer A, Sabri O, Schroeter ML.Combined evaluation of FDG-PET and MRI improves detection and differentiation of dementia.PLoS ONE. 2011; 6:e18111. [PubMed: 21448435]
10. Fan Y, Batmanghelich N, Clark CM, Davatzikos C. the Alzheimers Disease NeuroimagingInitiative. Spatial patterns of brain atrophy in MCI patients, identified via high-dimensional patternclassification, predict subsequent cognitive decline. Neuroimage. 2008a; 39:1731–1743. [PubMed:18053747]
11. Fan Y, Resnick SM, Wu X, Davatzikos C. Structural and functional biomarkers of prodromalAlzheimer’s disease: A high-dimensional pattern classification study. Neuroimage. 2008b;41:277–285. [PubMed: 18400519]
12. Fjell AM, Walhovd KB, Fennema-Notestine C, McEvoy LK, Hagler DJ, Holland D, Brewer JB,Dale AM. for the Alzheimer’s Disease Neuroimaging Initiative. CSF biomarkers in prediction ofcerebral and clinical change in mild cognitive impairment and Alzheimer’s disease. The Journal ofNeuroscience. 2010; 30:2088–2101. [PubMed: 20147537]
13. Flavio N, Dario S, Silvia M, Nicola G, Arnoldo P, Andrea B, Barbara D, A, LS, Guido R, Marco P.Principal component analysis of FDG PET in amnestic MCI. Eur J Nucl Med Mol Imaging. 2008;35:2191–2202. [PubMed: 18648805]
14. Grady CL, McIntosh AR, Beig S, Keightley ML, Burian H, Black SE. Evidence from functionalneuroimaging of a compensatory prefrontal network in Alzheimer’s disease. J Neurosci. 2003;23:986–993. [PubMed: 12574428]
15. Grundman M, Petersen RC, Ferris SH, Thomas RG, Aisen PS, Bennett DA, et al. Mild cognitiveimpairment can be distinguished from Alzheimer’s disease and normal aging for clinical trials.Arch Neurol. 2004; 61:59–66. [PubMed: 14732621]
16. Haller S, Nguyen D, Rodriguez C, Emch J, Gold G, Bartsch A, Lovblad K, Giannakopoulos P.Individual prediction of cognitive decline in mild cognitive impairment using support vector
Wee et al. Page 14
Neuroimage. Author manuscript; available in PMC 2013 February 1.
NIH
-PA Author Manuscript
NIH
-PA Author Manuscript
NIH
-PA Author Manuscript

machine-based analysis of diffusion tensor imaging data. J Alzheimers Dis. 2010; 22:315–527.[PubMed: 20847435]
17. Han Y, Wang J, Zhao Z, Min B, Lu J, Li K, He Y, Jia J. Frequency-dependent changes in theamplitude of low-frequency fluctuations in amnestic mild cognitive impairment: A resting-statefMRI study. NeuroImage. 2010; 55:287–295. [PubMed: 21118724]
18. Jiang T, Liu Y, Shi F, Shu N, Liu B, Jiang J, Zhou Y. Multimodal magnetic resonance imaging forbrain disorders: Advances and perspectives. Brain Imaging and Behavior. 2008; 2:249–257.
19. Leemans, A.; Jeurissen, B.; Sijbers, J.; Jones, DK. ExploreDTI: A graphical toolbox forprocessing, analyzing, and visualizing diffusion MR data. 17th Annual Meeting of Intl Soc MagReson Med; 2009. p. 3537
20. Lenzi D, Serra L, Perri R, Pantano P, Lenzi G, Paulesu E, Caltagirone C, Bozzali M, Macaluso E.Single domain amnestic MCI: A multiple cognitive domains fMRI investigation. 2009 In Press.
21. Machulda MM, Senjem ML, Weigand SD, Smith GE, Ivnik RJ, Boeve BF, Knopman DS, PetersenRC, Jack CR Jr. Functional MRI changes in amnestic and non-amnestic MCI during encoding andrecognition tasks. J Int Neuropsych Soc. 2009; 15:372–382.
22. McEvoy LK, Fennema-Notestine C, Roddey JC Jr, DJH, Holland D, Karow DS, Pung CJ, BrewerJB, Dale AM. Alzheimer disease: Quantitative structural neuroimaging for detection andprediction of clinical and structural changes in mild cognitive impairment. Radiology. 2009;251:195–205. [PubMed: 19201945]
23. Misra C, Fan Y, Davatzikos C. Baseline and longitudinal patterns of brain atrophy in MCI patients,and their use in prediction of short-term conversion to AD: Results from ADNI. Neuroimage.2009; 44:1414–1422.
24. Pihlajam¨aki M, Sperling RA. fMRI: Use in early Alzheimer’s disease and in clinical trials. FutureNeurology. 2008; 3:409–421.
25. Shen D, Davatzikos C. HAMMER: Heirarchical attribute matching mechanism for elasticregistration. IEEE Transactions on Medical Imaging. 2002; 21:1421–1439. [PubMed: 12575879]
26. Silveira, M.; Marques, J. the Alzheimers Disease Neuroimaging Initiative. Boosting Alzheimerdisease diagnosis using PET images. 2010 International Conference on Pattern Recognition,Internatonal Association for Pattern Recognition (IAPR); Istanbul, Turkey. 2010. p. 2556-2559.
27. Sokolova M, Japkowicz N, Szpakowicz S. Beyond accuracy, F-score and ROC: A family ofdiscriminant measures for performance evaluation. AI 2006: Advances in Artificial Intelligence.2006:1015–1021.
28. Tzourio-Mazoyer N, Landeau B, Papathanassiou D, Crivello F, Etard O, Delcroix N, Mazoyer B,Joliot M. Automated anatomical labeling of activations in SPM using a macroscopic anatomicalparcellation of the MNI MRI single-subject brain. Neuroimage. 2002; 15:273–289. [PubMed:11771995]
29. Van Dijk KRA, Hedden T, Venkataraman A, Evans KC, Lazar SW, Buckner RL. Intrinsicfunctional connectivity as a tool for human connectomics: Theory, properties and optimization. JNeurophysiol. 2010; 103:297–321. [PubMed: 19889849]
30. Wang Z, Jia X, Liang P, Qi Z, Yang Y, Zhou W, Li K. Changes in thalamus connectivity in mildcognitive impairment: Evidence from resting state fMRI. Eur J Radiol. 2011
31. Wee CY, Yap PT, Li W, Denny K, Browndyke JN, Potter GG, Welsh-Bohmer KA, Wang L, ShenD. Enriched white matter connectivity networks for accurate identification of mci patients.Neuroimage. 2011; 54:1812–1822. [PubMed: 20970508]
32. Xu D, Mori S, Shen D, van Zijl PCM, Davatzikos C. Spatial normalization of diffusion tensorfields. Magnetic Resonance in Medicine. 2003; 50:175–182. [PubMed: 12815692]
33. Yap, PT.; Wu, G.; Zhu, H.; Lin, W.; Shen, D. Fast tensor image morphing for elastic registration.MICCAI 2009; 2009. p. 721-729.
34. Yap PT, Wu G, Zhu H, Lin W, Shen D. F-TIMER: Fast tensor image morphing for elasticregistration. IEEE T Med Imaging. 2010; 29:1192–1203.
35. Zalesky A, Fornito A, Harding IH, Cocchi L, Yücel M, Pantelis C, Bullmore ET. Whole-brainanatomical networks: Does the choice of nodes matter? NeuroImage. 2010; 50:970–983.[PubMed: 20035887]
Wee et al. Page 15
Neuroimage. Author manuscript; available in PMC 2013 February 1.
NIH
-PA Author Manuscript
NIH
-PA Author Manuscript
NIH
-PA Author Manuscript

36. Zhang D, Wang Y, Zhou L, Yuan H, Shen D. the Alzheimers Disease Neuroimaging Initiative.Multimodal classification of Alzheimer’s disease and mild cognitive impairment. NeuroImage.2011; 55:856–867. [PubMed: 21236349]
Wee et al. Page 16
Neuroimage. Author manuscript; available in PMC 2013 February 1.
NIH
-PA Author Manuscript
NIH
-PA Author Manuscript
NIH
-PA Author Manuscript

Figure 1.Schematic diagram illustrating the proposed classification framework.
Wee et al. Page 17
Neuroimage. Author manuscript; available in PMC 2013 February 1.
NIH
-PA Author Manuscript
NIH
-PA Author Manuscript
NIH
-PA Author Manuscript

Figure 2.Connectivity maps constructed from various DTI measures.
Wee et al. Page 18
Neuroimage. Author manuscript; available in PMC 2013 February 1.
NIH
-PA Author Manuscript
NIH
-PA Author Manuscript
NIH
-PA Author Manuscript

Figure 3.Multi-spectral functional connectivity maps for NC (top) and MCI (bottom), respectively.
Wee et al. Page 19
Neuroimage. Author manuscript; available in PMC 2013 February 1.
NIH
-PA Author Manuscript
NIH
-PA Author Manuscript
NIH
-PA Author Manuscript

Figure 4.ROC curves.
Wee et al. Page 20
Neuroimage. Author manuscript; available in PMC 2013 February 1.
NIH
-PA Author Manuscript
NIH
-PA Author Manuscript
NIH
-PA Author Manuscript

Figure 5.Performance of the multi-kernel SVM based multimodality classification with respect to theweighting factor, βm. (Left: Classification accuracy; Right: AUC)
Wee et al. Page 21
Neuroimage. Author manuscript; available in PMC 2013 February 1.
NIH
-PA Author Manuscript
NIH
-PA Author Manuscript
NIH
-PA Author Manuscript
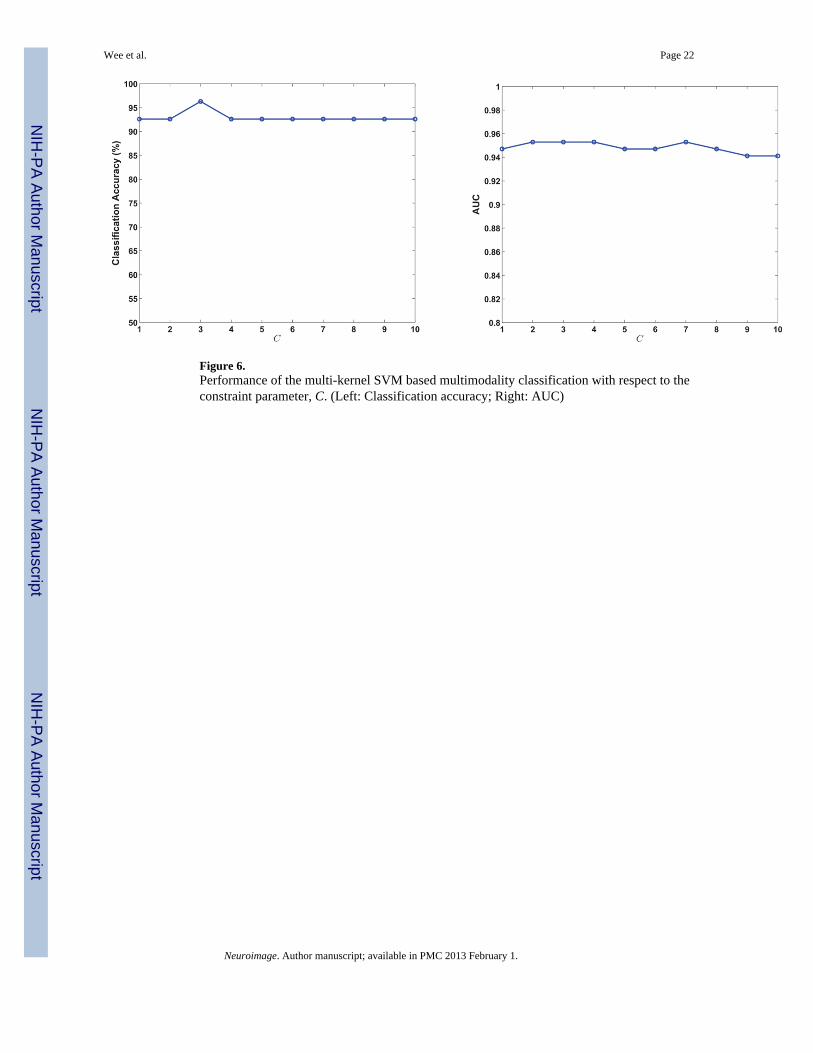
Figure 6.Performance of the multi-kernel SVM based multimodality classification with respect to theconstraint parameter, C. (Left: Classification accuracy; Right: AUC)
Wee et al. Page 22
Neuroimage. Author manuscript; available in PMC 2013 February 1.
NIH
-PA Author Manuscript
NIH
-PA Author Manuscript
NIH
-PA Author Manuscript

Figure 7.Performance of the multi-kernel SVM based multimodality classification with respect to thep-value. (Left: Classification accuracy; Right: AUC)
Wee et al. Page 23
Neuroimage. Author manuscript; available in PMC 2013 February 1.
NIH
-PA Author Manuscript
NIH
-PA Author Manuscript
NIH
-PA Author Manuscript

Figure 8.Top twelve selected regions used for classification.
Wee et al. Page 24
Neuroimage. Author manuscript; available in PMC 2013 February 1.
NIH
-PA Author Manuscript
NIH
-PA Author Manuscript
NIH
-PA Author Manuscript

NIH
-PA Author Manuscript
NIH
-PA Author Manuscript
NIH
-PA Author Manuscript
Wee et al. Page 25
Table 1
Demographic information of the participants involved in this study.
Group MCI Normal
No. of subjects 10 17
Gender (M/F) 5M/5F 8M/9F
Age (mean ± SD) 74.2 ± 8.6 72.1 ± 8.2
Years of education (mean ± SD) 17.7 ± 4.2 16.3 ± 2.4
MMSE (mean ± SD) 28.4 ± 1.5 29.4 ± 0.9
Neuroimage. Author manuscript; available in PMC 2013 February 1.

NIH
-PA Author Manuscript
NIH
-PA Author Manuscript
NIH
-PA Author Manuscript
Wee et al. Page 26
Tabl
e 2
Cla
ssifi
catio
n pe
rfor
man
ce o
f sin
gle
and
mul
timod
ality
con
nect
ivity
net
wor
ks. (
AC
C =
AC
Cur
acy;
SEN
= S
ENsi
tivity
; SPE
= S
PEci
ficity
)
Met
hod
AC
C (%
)SE
N (%
)SP
E (%
)A
UC
YB
AC
F
fMR
I70
.37
70.0
070
.59
0.78
820.
4059
0.70
290.
6364
DTI
88.8
980
.00
94.1
20.
9353
0.74
120.
8706
0.84
21
Dire
ct88
.89
90.0
088
.24
0.91
180.
7824
0.89
120.
8571
Prop
osed
96.3
010
0.00
94.1
20.
9529
0.94
120.
9524
0.97
06
Neuroimage. Author manuscript; available in PMC 2013 February 1.

NIH
-PA Author Manuscript
NIH
-PA Author Manuscript
NIH
-PA Author Manuscript
Wee et al. Page 27
Tabl
e 3
Num
bers
of f
eatu
res s
elec
ted
for d
iffer
ent p
-val
ues.
(LO
O =
leav
e-on
e-ou
t)
LO
Op-
valu
e
0.00
40.
006
0.00
80.
010
0.01
20.
014
DT
IfM
RI
DT
IfM
RI
DT
IfM
RI
DT
IfM
RI
DT
IfM
RI
DT
IfM
RI
17
17
77
167
247
267
28
27
07
37
107
158
228
24
37
57
107
137
207
247
31
46
87
177
217
257
307
36
55
47
107
147
158
208
22
67
27
67
107
128
128
15
77
07
37
77
87
127
15
87
07
37
77
118
148
20
97
07
47
87
108
138
16
107
07
17
38
108
148
20
117
07
27
67
108
108
12
127
57
107
147
177
207
25
136
17
38
49
610
1111
14
147
27
57
107
177
188
20
157
27
47
77
117
167
21
167
07
17
37
67
88
10
178
08
08
18
38
59
9
187
08
08
29
310
512
9
197
07
17
37
77
98
12
207
57
97
127
147
187
19
217
17
57
87
107
117
13
227
07
17
47
77
98
10
237
57
87
187
207
298
32
247
27
47
88
178
228
27
257
08
08
08
28
48
5
266
07
07
37
48
58
13
Neuroimage. Author manuscript; available in PMC 2013 February 1.

NIH
-PA Author Manuscript
NIH
-PA Author Manuscript
NIH
-PA Author Manuscript
Wee et al. Page 28
LO
Op-
valu
e
0.00
40.
006
0.00
80.
010
0.01
20.
014
DT
IfM
RI
DT
IfM
RI
DT
IfM
RI
DT
IfM
RI
DT
IfM
RI
DT
IfM
RI
277
07
07
07
27
47
5
Neuroimage. Author manuscript; available in PMC 2013 February 1.

NIH
-PA Author Manuscript
NIH
-PA Author Manuscript
NIH
-PA Author Manuscript
Wee et al. Page 29
Table 4
Regions selected during classification.
Regions
Rectus gyrus right
Insula right
Orbitofrontal cortex (medial) left
Temporal pole (superior) right
Orbitofrontal cortex (medial) right
Amygdala right
Posterior cingulate gyrus left
Posterior cingulate gyrus right
Anterior cingulate gyrus left
Temporal pole (superior) left
Orbitofrontal cortex (superior) right
Anterior cingulate gyrus right
Middle frontal gyrus right
Inferior frontal gyrus (opercular) right
Precentral gyrus right
Precuneus left
Thalamus right
Temporal pole (middle) left
ParaHippocampal gyrus left
Superior occipital gyrus left
Neuroimage. Author manuscript; available in PMC 2013 February 1.

NIH
-PA Author Manuscript
NIH
-PA Author Manuscript
NIH
-PA Author Manuscript
Wee et al. Page 30
Table 5
Classification performance of linear and nonlinear kernels based SVM.
Kernel ACC (%) AUC
linear 85.16 0.8941
polynomial 85.16 0.8941
RBF 92.59 0.9353
Proposed 96.30 0.9529
Neuroimage. Author manuscript; available in PMC 2013 February 1.