Mapping brain morphological and functional conversion patterns in amnestic MCI: a voxel-based MRI...
10
ORIGINAL ARTICLE Mapping brain morphological and functional conversion patterns in amnestic MCI: a voxel-based MRI and FDG-PET study Silvia Morbelli & Arnoldo Piccardo & Giampiero Villavecchia & Barbara Dessi & Andrea Brugnolo & Alessandra Piccini & Anna Caroli & Giovanni Frisoni & Guido Rodriguez & Flavio Nobili Received: 10 March 2009 / Accepted: 1 July 2009 / Published online: 7 August 2009 # Springer-Verlag 2009 Abstract Purpose To reveal the morphological and functional sub- strates of memory impairment and conversion to Alzheimer disease (AD) from the stage of amnestic mild cognitive impairment (aMCI). Methods Brain MRI and FDG-PET were performed in 20 patients with aMCI and 12 controls at baseline. During a mean follow-up of about 2 years, 9 patients developed AD (converters), and 11 did not (nonconverters). All images were processed with SPM2. FDG-PET and segmented grey matter (GM) images were compared in: (1) converters versus controls, (2) nonconverters versus controls, and (3) converters versus nonconverters. Results As compared to controls, converters showed lower GM density in the left parahippocampal gyrus and both thalami, and hypometabolism in the precuneus, posterior cingulate and superior parietal lobule in the left hemisphere. Hypometabolism was found in nonconverters as compared to controls in the left precuneus and posterior cingulated gyrus. As compared to nonconverters, converters showed significant hypometabolism in the left middle and superior temporal gyri. Conclusion The discordant topography between atrophy and hypometabolism reported in AD is already present at the aMCI stage. Posterior cingulate–precuneus hypometabolism seemed to be an early sign of memory deficit, whereas hypometabolism in the left temporal cortex marked the conversion to AD. Keywords Brain PET . Alzheimer’ s disease . Mild cognitive impairment . Voxel based morphometry . Alzheimer’ s disease biomarkers Introduction In the area of the early diagnosis of Alzheimer ’ s disease (AD), research is very active in finding, defining and validating biomarkers that can detect the typical neuro- degeneration of AD both in predementia stages, i.e. in mild cognitive impairment (MCI), and in screening of the high-risk asymptomatic population [1]. The development S. Morbelli (*) Nuclear Medicine Unit, Department of Internal Medicine, University of Genoa, Viale Benedetto XV, 6, 16132 Genoa, Italy e-mail: [email protected] A. Piccardo : G. Villavecchia Nuclear Medicine Unit, Department of Radiology, Galliera Hospital, Genoa, Italy B. Dessi : A. Brugnolo : G. Rodriguez : F. Nobili Clinical Neurophysiology Unit, Department of Neurosciences, Ophthalmology and Genetics, University of Genoa, Genoa, Italy A. Piccini Cell Biology Unit, National Cancer Research Institute, Genoa, Italy A. Caroli : G. Frisoni LENITEM - Laboratory of Epidemiology Neuroimaging & Telemedicine, IRCCS San Giovanni di Dio Fatebenefratelli, Brescia, Italy A. Caroli Medical Imaging Unit, Biomedical Engineering Department, Mario Negri Institute, Bergamo, Italy Eur J Nucl Med Mol Imaging (2010) 37:36–45 DOI 10.1007/s00259-009-1218-6
Transcript of Mapping brain morphological and functional conversion patterns in amnestic MCI: a voxel-based MRI...

ORIGINAL ARTICLE
Mapping brain morphological and functionalconversion patterns in amnestic MCI: a voxel-basedMRI and FDG-PET study
Silvia Morbelli & Arnoldo Piccardo & Giampiero Villavecchia & Barbara Dessi &Andrea Brugnolo & Alessandra Piccini & Anna Caroli & Giovanni Frisoni &Guido Rodriguez & Flavio Nobili
Received: 10 March 2009 /Accepted: 1 July 2009 /Published online: 7 August 2009# Springer-Verlag 2009
AbstractPurpose To reveal the morphological and functional sub-strates of memory impairment and conversion to Alzheimerdisease (AD) from the stage of amnestic mild cognitiveimpairment (aMCI).Methods Brain MRI and FDG-PET were performed in 20patients with aMCI and 12 controls at baseline. During amean follow-up of about 2 years, 9 patients developed AD
(converters), and 11 did not (nonconverters). All imageswere processed with SPM2. FDG-PET and segmented greymatter (GM) images were compared in: (1) convertersversus controls, (2) nonconverters versus controls, and (3)converters versus nonconverters.
Results As compared to controls, converters showed lowerGM density in the left parahippocampal gyrus and boththalami, and hypometabolism in the precuneus, posteriorcingulate and superior parietal lobule in the left hemisphere.Hypometabolism was found in nonconverters as comparedto controls in the left precuneus and posterior cingulatedgyrus. As compared to nonconverters, converters showedsignificant hypometabolism in the left middle and superiortemporal gyri.
Conclusion The discordant topography between atrophy andhypometabolism reported in AD is already present at theaMCI stage. Posterior cingulate–precuneus hypometabolismseemed to be an early sign of memory deficit, whereashypometabolism in the left temporal cortex marked theconversion to AD.
Keywords Brain PET. Alzheimer’s disease .
Mild cognitive impairment . Voxel based morphometry .
Alzheimer’s disease biomarkers
Introduction
In the area of the early diagnosis of Alzheimer’s disease(AD), research is very active in finding, defining andvalidating biomarkers that can detect the typical neuro-degeneration of AD both in predementia stages, i.e. inmild cognitive impairment (MCI), and in screening of thehigh-risk asymptomatic population [1]. The development
S. Morbelli (*)Nuclear Medicine Unit, Department of Internal Medicine,University of Genoa,Viale Benedetto XV, 6,16132 Genoa, Italye-mail: [email protected]
A. Piccardo :G. VillavecchiaNuclear Medicine Unit, Department of Radiology,Galliera Hospital,Genoa, Italy
B. Dessi :A. Brugnolo :G. Rodriguez : F. NobiliClinical Neurophysiology Unit, Department of Neurosciences,Ophthalmology and Genetics, University of Genoa,Genoa, Italy
A. PicciniCell Biology Unit, National Cancer Research Institute,Genoa, Italy
A. Caroli :G. FrisoniLENITEM - Laboratory of EpidemiologyNeuroimaging & Telemedicine,IRCCS San Giovanni di Dio Fatebenefratelli,Brescia, Italy
A. CaroliMedical Imaging Unit, Biomedical Engineering Department,Mario Negri Institute,Bergamo, Italy
Eur J Nucl Med Mol Imaging (2010) 37:36–45DOI 10.1007/s00259-009-1218-6

of effective pharmacotherapy, aimed at altering the naturalhistory of the disease from these earliest stages, requiresthe diagnosis of AD to be made with the highest accuracy[2].
Within the MCI group, patients who show an impair-ment in the memory domain (amnestic MCI, aMCI), eitherassociated or not with a slight impairment in other cognitiveareas [1, 2], are of particular interest because they havebeen proven to have a high risk of developing AD within afew years [3]. In aMCI patients, before a diagnosis ofpredementia AD becomes probable, the ‘core’ deficit inepisodic memory [1, 4] must be supported by evidence ofAD neurodegeneration through one or more ‘biomarkers’,such as brain volume loss (atrophy) on MRI, corticalhypometabolism on 18F-FDG PET in specific regions [4],and altered levels of Aβ 1–42 amyloid and tau protein inthe cerebrospinal fluid [1, 5]. Consistent with the profoundcell loss in the hippocampal formation observed inpathological studies [6, 7], MRI ROI-based studies havedemonstrated medial temporal lobe (MTL) atrophy in early-stage AD [8], as well as in MCI, involving the hippocampus,entorhinal cortex, amygdala and parahippocampal gyrus [9,10]. Studies applying voxel-based morphometry (VBM)have identified similar patterns of MTL atrophy in aMCI,but have also highlighted regions of atrophy in the inferiorand lateral temporal lobes, the cingulate gyrus, and theparietal and frontal lobes [11, 12].
While MRI findings generally match the topography ofatrophy in pathological studies, cortical hypometabolism onFDG PET is more often found in the posterior cingulate, theparietal precuneus and the posterior temporoparietal regionsand less frequently in the MTL [13]. Even if this mismatchmight be partially due to the intrinsic limited spatialresolution of the earliest PET scanners [13], some patho-physiological explanations have also been addressed.Indeed, metabolic deficit in posterior cortical regions couldbe due to distant MTL pathology, since posterior corticalregions are densely interconnected with the MTL [14].
A critical issue is that the majority of studies haveinvestigated either atrophy [12] or hypometabolism [15],while only a few [16–19] have used the two imagingmodalities in the same group of patients. In fact, given thepresence of large intersubject variability in the topographyof the disease, studies using either MRI or PET alone areless adequate to clarify the presence and the neurophysio-logical meaning of dissociating or overlapping results.Some recent studies have involved the use of both VBMand FDG PET voxel-based analysis (VBA) in the samegroup of patients with early AD or MCI [16–18]. In one ofthese studies in MCI patients, Chetelat et al. [16] found adirect correlation between both encoding and retrievalmemory scores and hippocampal grey matter (GM) density.Moreover, encoding was correlated with hippocampal
glucose consumption (CMRglc), whereas retrieval wascorrelated with the posterior cingulate CMRglc.
With the aim of concurrently investigating patterns ofatrophy and hypometabolism in patients with aMCIconverted to AD, we performed both VBM and PETVBA and compared subgroups of patients with aMCIconverted (converters) or not converted (nonconverters) toAD with a group of healthy controls.
Subjects and methods
Patients
The study included 20 consecutive outpatients (11 women,9 men; mean age 76.0±5.5 years, range 62–86 years) withmemory complaints in whom an objective memory deficitwas demonstrated by means of neuropsychological tests.These patients came from one of the outpatient clinicalunits for the diagnosis and treatment of cognitive disordersat our university hospital. This clinical unit is part of theEuropean Alzheimer Disease Consortium (EADC), joiningcentres of excellence across Europe and promoting clinicalresearch in the dementia field. Some of the patients camefrom the EU-funded multicentric ‘DESCRIPA’ study, aimedat developing screening guidelines and clinical criteria forpredementia AD [20], of which the functional neuro-imaging substudy was a spontaneous part.
Dementia was excluded on the basis of clinical interviewwith both patients and caregivers using the Mini-MentalState Examination(MMSE) [21] for general cognition,questionnaires for Activities of Daily Living (ADL) [22]and instrumental ADL (IADL) [23], and the ClinicalDementia Rating (CDR) scale, that was 0.5 in all patients.Patients underwent a standard battery of blood count, bloodchemical examinations and urinalysis, according to com-monly followed rules to exclude secondary causes ofcognitive impairment. The presence of analphabetism,major visual disturbance, psychiatric illness, epilepsy,major head trauma, Parkinsonism, previous stroke or TIA,and brain masses were further exclusion criteria. A milddepressive trait, as ascertained by the 15-item GeriatricDepression Scale (GDS), was not considered an exclusioncriterion. Neuropsychiatric symptoms were assessed byinterviewing the informant using the NeuropsychiatricInventory (NPI) [24]. Patients scoring higher than 0 onthe delusion and hallucination NPI items were excluded.
Patients underwent a neuropsychological test battery,including evaluation of (1) verbal episodic memory(immediate and delayed recall, IR and DR respectively)by the six-trial selective reminding test (SRT) [25], (2)visuomotor abilities, divided and attentional shifting by theTrail-making test, forms A (TMT-A) and B (TMT-B), (3)
Eur J Nucl Med Mol Imaging (2010) 37:36–45 37

categorical verbal fluency (2′ test for animals), (4)visuoconstructional abilities by the copying figures test,including simple copy and copying with guiding landmarksof the mental deterioration battery [26], (5) abstract andlogical reasoning by the Raven’s PM38 matrices (set A–D,according to Spinnler and Tognoni [27]), and (6) executiveattention by the Stroop colour-word test (correct itemsachieved in 30 s, according to Barbarotto et al. [28]). Theclock completion test (as evaluated according to Watsonet al. [29]) was used as a mixed measure of visuospatialabilities and executive functions, and the symbol-digit test[30] as a mixed measure of working memory and executivefunctions.
Any z-score lower than −1.5, based on the pertinentnormative database and corrected for age and education,denoted impairment in a specific cognitive domain. Accord-ing to Petersen’s criteria [1], patients with a z-score lowerthan −1.5 in either SRT IR or DR were considered as aMCI.Multi- or single-domain aMCI was defined according to thepresence or absence of z-scores lower than −1.5 in any of theother cognitive domains, respectively.
All patients were carefully treated for systemic comor-bidity; drugs known to depress brain synaptic transmission,such as benzodiazepines and tricyclic antidepressant, werewithdrawn. After the baseline examination, patients under-went clinical follow-up (including MMSE, ADL and IADLquestionnaires, and CDR) every 6 months. A follow-uptime of at least 1 year was available in all patients. Duringthe follow-up (mean time 23.5±10.1 months), 9 patientsdeveloped dementia of the AD type (converters), accordingto the NINCDS-ADRDA [31] and DSM-IV criteria, while11 patients were confirmed to have aMCI (nonconverters).Five converters showed only a memory deficit (single-domain aMCI), and four also showed deficit in othercognitive domains (multidomain aMCI), including theTMT-B (all four patients), the symbol digit test and theStroop colour-word test (both tests in the same two
patients). Among the nonconverters, four had single-domain aMCI, and seven had multidomain aMCI, showinga deficit also in the TMT-A (four patients), TMT-B (fourpatients), the symbol digit test (five patients), the construc-tional apraxia test with guiding landmarks (four patients),and the Stroop colour-word test (one patient). All patientsgave their informed consent to participate in the study.
Controls
The protocol received the approval of the local ethicscommittee. Control subjects were healthy volunteers givingtheir informed consent, recruited during university coursesdedicated to elderly people. Their health was carefullychecked by means of general medical history, clinicalexamination and the same exclusion criteria as for thepatients, with the exception of cognitive complaints.MMSE was performed and only subjects with a normalscore (i.e. >26) were further considered. Moreover, onlysubjects with a CDR of 0 were included. Healthy subjectsunderwent the same neuropsychological battery of tests asthe patients, and only subjects with normal scores (Z>−1.5)in all tests were further considered. After exclusion of 4subjects in whom MRI scan could not be performed due tometallic devices or claustrophobia, 12 subjects (4 men and8 women; mean age 70.6±7.1 years, range 62–83 years)were finally included in the study. Control subjects wereasked to undergo continued evaluation to confirm theirnormal status over time.
Table 1 shows the main baseline demographics and bothbaseline and follow-up MMSE scores of the three groups ofsubjects (12 controls, 11 nonconverters, and 9 converters).
PET data acquisition and preprocessing
PET was performed within 3 months from the baselineclinical-neuropsychological examination (mean 29.9 days
Normal controls aMCI converters aMCI nonconverters
Number 12 9 11
Age (years) 70.4±7.3 77.1±5.9* 74.0±5.3*
Sex (M/F) 2/10 2/7 6/5
Education (years) 10.6±4.5 8.6±4.3 8.7±4.5
Follow-up time (months) 22.3±10.5 22.6±10.7 26.5±11.3
MMSE score
Baseline 28.7±1.3 27.8±0.9 27.8±1.4
Follow-up 28.9±1.1 24.6±2.0* 27.0±2.7*
Recalla
Immediate 35.8±10.1 24.3±1.5* 27.1±4.3*
Delayed 5.4±2.7 1.1±0.9* 2.1±1.1*
ApoE genotype n.a. 3/7 (43%)b 2/6 (33%)b
Table 1 Main baseline demo-graphic and clinical features ofthe three groups, as identified atfollow-up
*p<0.05, converters and non-converters versus normal controls.a Buschke-Fuld selective remindingtest.b ApoE genotype was availableonly in seven converters and sixnonconverters.
38 Eur J Nucl Med Mol Imaging (2010) 37:36–45

in patients and 29.8 days in controls). Subjects fasted for atleast 6 h. Before radiopharmaceutical injection, bloodglucose was checked and was <140 mg/dl in all subjects.After 10 min rest in a silent and darkened room, with eyesclosed and ears unplugged, subjects were injected withapproximately 370 MBq of 18F-FDG via a venous cannula,according to the guidelines of the European Association ofNuclear Medicine [32]. They remained in the room for30 min after the injection, then they were moved to the PETroom where scanning started approximately 45 min afterinjection and lasted for 20 min. A polycarbonate headholder was used to reduce head movements during the scan.Images were acquired using a Discovery ST PET-CTsystem (GE Healthcare, USA) on a 128×128×64 matrix(isotropic voxel of 2.34 mm) in two-dimensional mode witha total axial field of view of 15 cm and no interplane gapspace. Images were reconstructed using an OSEM algo-rithm, 16 subsets and two iterations. Dicom files wereexported and converted to Analyse files.
PETscans were normalized to the standard space describedby Talairach and Tournoux [33] using the SPM2 package(Wellcome Department of Cognitive Neurology, London,UK) [34] running on Matlab 6.5 (Mathworks, Natick, MA).Since it was shown that the use of the standard 15O-H2OPET template provided with the SPM package to normalizeFDG PET scan may generate inconsistent results [35], a fullyMRI-based normalization was applied [36]. Each FDG PETscan was first coregistered to the pertinent MRI scan (sixparameters, rigid body transformation) using the coregistra-tion algorithm available in the SPM2 package. Each MRimage was then spatially normalized to the SPM2 T1-MRItemplate using an affine plus nonlinear transformation, andthe resulting deformation field was applied to the coregis-tered FDG PET scan. The spatially normalized PET imageswere finally smoothed with a 10-mm isotropic gaussian filterto blur individual variations in gyral anatomy and to increasethe signal-to-noise ratio.
MRI acquisition and preprocessing
All MRI volumes were obtained using 1.5-T superconductivesystem (Gyroscan Intera, Philips Medical Systems, Best, TheNetherlands) to acquire a sagittal T1-FFE sequence with thefollowing parameters: TR 8.7 ms, TE 4.1 ms, flip angle 8°,FOV 256 mm, matrix 256×256, 150 sagittal slices (1.0-mmthick), and voxel size 0.98×0.98×1.6. MR images wereobtained 0–28 days before PET examination.
Images were preprocessed with SPM2, using a modifiedoptimized VBM technique following the method of Goodet al. [37]. First, a customized sample-specific whole-braintemplate was computed, and a priori maps for GM, whitematter, and cerebrospinal fluid were determined bysegmenting the sample-specific whole-brain template into
the three components based on image intensity classifica-tion and probability of tissue class membership. Eachindividual MR scan was normalized to the whole-brainsample-specific template and then segmented into GM,white matter, and cerebrospinal fluid components usinginformation from the sample-specific tissue classificationtemplates. The individual GM images were further spatiallynormalized to the sample-specific GM template using a 12-parameter affine transformation and nonlinear adjustmentswith 7×8×7 basis functions. The segmented, normalizedimages were finally smoothed with an 8-mm full-width half-maximum gaussian kernel in order to compensate for inter-individual variability and conform the data to a gaussiandistribution to enable the use of the random field theory whichprovides for corrected statistical inference.
Statistical analysis
To fully explore GM loss and metabolic patterns related toaMCI and conversion to AD, PET and GM images from ofaMCI patients were compared on a voxel-by-voxel basis tothose from the normal controls using ANCOVA. Age,gender and years of education were included in the analysisas confounding variables. For both PET and GM images,the following comparisons were performed: (1) convertersversus controls, (2) nonconverters versus controls, and (3)converters versus nonconverters. SPM-T maps were dis-played using an uncorrected p<0.005 height threshold.This more liberal choice was adopted to avoid type IIerrors attributable to over-conservative thresholds [38]. Infact, considering the relatively low sensitivity of PETwithout repeated measures, higher thresholds could leadto false-negative results in PET studies. Clusters of differ-ences were regarded as significant if they survived thep<0.005 threshold, corrected for multiple comparisons atcluster level. Only significant clusters containing at least40 (VBM) or 100 (PET VBA) voxels were taken intoconsideration.
Results
GM density and hypometabolism patterns
Converters versus controls As compared to controls, con-verters showed reduced GM density in the left parahippo-campal gyrus and the bilateral thalamus (Fig. 1a, Table 2),and relative hypometabolism in a region including leftprecuneus, posterior cingulate and superior parietal lobule(Fig. 1b, Table 2).
aMCI Nonconverters vs normal controls No significantGM reduction was found in nonconverters as compared to
Eur J Nucl Med Mol Imaging (2010) 37:36–45 39

controls. On the other hand, nonconverters showed signif-icant relative hypometabolism in a region including the leftprecuneus and the left posterior cingulate gyrus (Fig. 2,Table 2).
Converters versus nonconverters As compared to non-converters, converters showed significant relative hypome-tabolism in the left middle and superior temporal gyri andno significant GM reduction (Fig. 3, Table 2).
Fig. 1 Comparison betweenconverters and controls in termsof GM density (a) and FDGuptake (b). For both compari-sons, the height threshold ofsignificance was set at p<0.005uncorrected (voxel level) and atp<0.05 corrected for multiplecomparisons (cluster level).Regions of significant differenceare shown colour-graded in termsof Z values. Converters showedreduced GM density in a regionincluding the left parahippocam-pal gyrus and bilateral thalamus(a) and hypometabolism in aposterior region including the leftprecuneus, posterior cingulateand superior parietal areas (b).Talairach coordinates and furtherdetails are available in Table 2
40 Eur J Nucl Med Mol Imaging (2010) 37:36–45

Table 2 Results of the comparison between controls, converters and nonconverters to AD in terms of both GM density (GM VBM) and FDGuptake (PET VBA)
Comparison Analysis Cluster level Voxel level
Cluster extent(no. of voxels)
Correctedp value
Cortical region MaximumZ score
Talairachcoordinates
Cortical region Brodmannarea
Converters vscontrols
GM VBM 7,836 0.0001 Left limbic lobe 5.02 −17, −36, 5 Parahippocampalgyrus
30
Left thalamus 3.97 −15, −29, 4 Thalamus
Right thalamus 3.92 20, −32, 4 Thalamus
PET VBA 2,085 0.0001 Left parietal 4.78 −8, −66, 38 Precuneus 7
Left parietal 3.72 −33, −62, 49 Superior parietallobule
7
Left limbic lobe 3.37 −8, −49, 13 Posterior cingulategyrus
29
Nonconverters vscontrols
PET VBA 941 0.001 Left limbic lobe 3.60 −4, −49, 23 Posterior cingulategyrus
23
Left parietal 3.53 0, −62, 33 Precuneus 7
Converters vsnonconverters
PET VBA 800 0.03 Left temporal 3.91 −51, 1, −24 Middle temporalgyrus
21
Left temporal 3.11 −53, −20, −19 Middle temporalgyrus
21
Left temporal 3.09 −40, 1, −15 Superior temporalgyrus
38
Uncorrected p<0.005 at the voxel level and p<0.05 corrected for multiple comparisons at the cluster level were accepted as statisticallysignificant.
Fig. 2 Comparison betweennonconverters and controls interms of FDG uptake. Theheight threshold of significancewas set at p<0.005 uncorrected(voxel level) and at p<0.05corrected for multiple compari-sons (cluster level). Regions ofsignificant difference are showncolour-graded in terms of Zvalues. Nonconverters showedsignificant hypometabolism in aregion including the left precu-neus and the left posterior cin-gulate gyrus. Talairachcoordinates and further detailsare available in Table 2
Eur J Nucl Med Mol Imaging (2010) 37:36–45 41

Post-hoc analysis
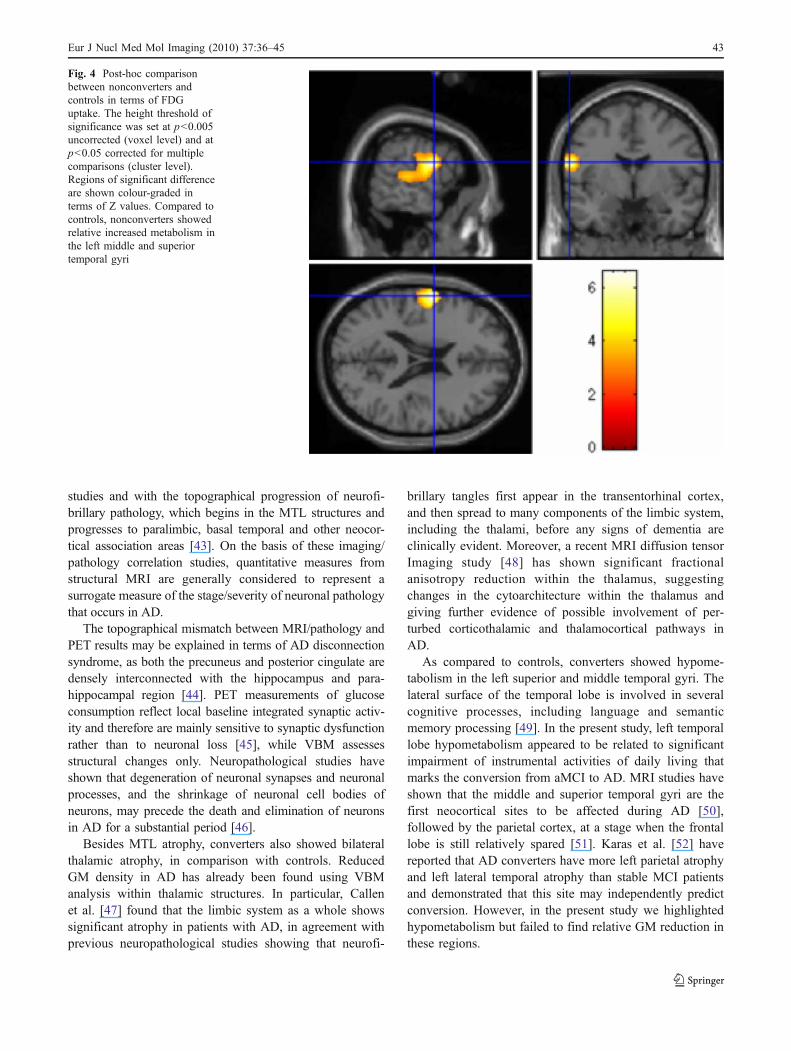
Converters showed a significant relative hypometabolism inthe left middle and superior temporal gyri as compared tononconverters; however, such hypometabolism was not foundin the comparison between converters and controls. To furtherexplore the pathophysiological meaning of this finding, wetested the hypothesis of relatively higher metabolic valueswithin these regions in nonconverters as compared to controls.Therefore, a post-hoc analysis was performed, using the sameparameters used for previous analysis. Compared to controls,nonconverters showed a relative hypermetabolism in the leftmiddle and superior temporal gyri (Fig. 4).
Discussion
The finding of posterior cingulate and precuneus hypome-tabolism in aMCI is in keeping with previous observationsconcerning both MCI [39] and very early AD [40]. Apartially overlapping posterior cingulate/precuneus hypo-metabolism pattern was found in both converters andnonconverters as compared to controls. Although thesignificance of posterior cingulate hypometabolism washigher in converters than in nonconverters, as compared tocontrols, direct comparison between converters and non-converters did not yield further significant cingulate
hypometabolism in converters. This could have been dueto the small sample size. However, as posterior cingulatehypometabolism was found in both converters and non-converters, it appears to be an early sign of memory deficitrather than a specific hallmark of AD conversion. Thisfinding is in line with previous studies. Nestor et al. [39]have suggested that significant hypometabolism in theposterior cingulate is typical of all MCI patients, withouta direct relationship to their future conversion. In a recentSPECT study, aMCI converters and nonconverters werefound to share a common retrosplenial pattern of hypo-perfusion [41], suggesting that retrosplenial cortex dys-function could be the pathophysiological correlate ofmemory impairment, without being a biomarker of conver-sion to dementia. Although the group of nonconvertersmight have included some late converter patients due to thelimited follow-up time, the risk of AD conversion is at amaximum within the first few years following the diagnosisof aMCI, and then substantially decreases [42]. FDG PETlong-term follow-up studies in stable aMCI are needed toshow whether posterior cingulate hypometabolism is con-firmed over time despite the lack of dementia or whethersubjects with hypometabolism in this region convert to AD-type dementia over longer follow-up intervals.
GM VBM highlighted neuronal loss in the left para-hippocampal gyrus in converters as compared to controls.This result is in agreement with previous structural MRI
Fig. 3 Comparison betweenconverters and nonconvertersin terms of FDG uptake. Theheight threshold of significancewas set at p<0.005 uncorrected(voxel level) and at p<0.05corrected for multiple compari-sons (cluster level). Regionsof significant difference areshown colour-graded in termsof Z values. Compared tononconverters, convertersshowed significant relativehypometabolism in the leftmiddle and superior temporalgyri. Talairach coordinates andfurther details are available inTable 2
42 Eur J Nucl Med Mol Imaging (2010) 37:36–45
studies and with the topographical progression of neurofi-brillary pathology, which begins in the MTL structures andprogresses to paralimbic, basal temporal and other neocor-tical association areas [43]. On the basis of these imaging/pathology correlation studies, quantitative measures fromstructural MRI are generally considered to represent asurrogate measure of the stage/severity of neuronal pathologythat occurs in AD.
The topographical mismatch between MRI/pathology andPET results may be explained in terms of AD disconnectionsyndrome, as both the precuneus and posterior cingulate aredensely interconnected with the hippocampus and para-hippocampal region [44]. PET measurements of glucoseconsumption reflect local baseline integrated synaptic activ-ity and therefore are mainly sensitive to synaptic dysfunctionrather than to neuronal loss [45], while VBM assessesstructural changes only. Neuropathological studies haveshown that degeneration of neuronal synapses and neuronalprocesses, and the shrinkage of neuronal cell bodies ofneurons, may precede the death and elimination of neuronsin AD for a substantial period [46].
Besides MTL atrophy, converters also showed bilateralthalamic atrophy, in comparison with controls. ReducedGM density in AD has already been found using VBManalysis within thalamic structures. In particular, Callenet al. [47] found that the limbic system as a whole showssignificant atrophy in patients with AD, in agreement withprevious neuropathological studies showing that neurofi-
brillary tangles first appear in the transentorhinal cortex,and then spread to many components of the limbic system,including the thalami, before any signs of dementia areclinically evident. Moreover, a recent MRI diffusion tensorImaging study [48] has shown significant fractionalanisotropy reduction within the thalamus, suggestingchanges in the cytoarchitecture within the thalamus andgiving further evidence of possible involvement of per-turbed corticothalamic and thalamocortical pathways inAD.
As compared to controls, converters showed hypome-tabolism in the left superior and middle temporal gyri. Thelateral surface of the temporal lobe is involved in severalcognitive processes, including language and semanticmemory processing [49]. In the present study, left temporallobe hypometabolism appeared to be related to significantimpairment of instrumental activities of daily living thatmarks the conversion from aMCI to AD. MRI studies haveshown that the middle and superior temporal gyri are thefirst neocortical sites to be affected during AD [50],followed by the parietal cortex, at a stage when the frontallobe is still relatively spared [51]. Karas et al. [52] havereported that AD converters have more left parietal atrophyand left lateral temporal atrophy than stable MCI patientsand demonstrated that this site may independently predictconversion. However, in the present study we highlightedhypometabolism but failed to find relative GM reduction inthese regions.
Fig. 4 Post-hoc comparisonbetween nonconverters andcontrols in terms of FDGuptake. The height threshold ofsignificance was set at p<0.005uncorrected (voxel level) and atp<0.05 corrected for multiplecomparisons (cluster level).Regions of significant differenceare shown colour-graded interms of Z values. Compared tocontrols, nonconverters showedrelative increased metabolism inthe left middle and superiortemporal gyri
Eur J Nucl Med Mol Imaging (2010) 37:36–45 43

The presence of functional but not structural differencesbetween converters and nonconverters in the left temporallobe was not paralleled by the finding of hypometabolismin converters in comparison to controls. We thereforeexplored the hypothesis that nonconverters may actuallyshow relatively higher metabolic levels in the left temporallobe than controls themselves, which was indeed confirmedby statistical analysis (nonconverters versus controls). Thisunexpected finding points to a possible compensatorymechanism in nonconverters, failure of which would bethe underlying pathophysiological correlate of AD conver-sion. Consistent with this hypothesis, recent papers havesuggested a “compensatory response” in stable MCIpatients, which fails in those who convert to AD [53, 54].Moreover, relatively preserved function has been reportedeven in areas affected by significant atrophy [55]. There areindeed large topographic discrepancies in compensationareas among studies, which could be explained by thedifferent analytical methodologies, intrinsic high variabilityof compensatory patterns among subjects, and the differentseverity of disease in the patients under study.
Overall, the present findings suggest that while theposterior cingulate and precuneus show a nearly linearmetabolic reduction from normal ageing to AD, functionaldeficit in other neocortical areas may mark the time ofconversion to AD. Specifically, the present results point tothe middle and superior temporal gyri, in line with previousfindings [15], while other studies have also highlighted thelateral frontal and parietal cortex [56, 57]. Since currentresults were obtained using rather small groups, studiesusing wider samples are needed to obtain more robust datathat could more clearly depict the regional metabolic failuretypical of AD conversion.
In conclusion, the present combined GM VBM and PETVBA investigation showed different patterns of atrophy/hypometabolism in the same group of aMCI patients, eitherconverting to AD or not. The role of posterior cingulatehypometabolism as an early marker of memory deficit wasconfirmed, while left temporal areas were identified aspossible predictors of conversion to AD.
Acknowledgments We are grateful to Mr. Michele Chiabrera forassistance with the English editing.
References
1. Petersen RC. Mild cognitive impairment as a diagnostic entity. JIntern Med. 2004;256:183–94.
2. Feldman HH, Jacova C. Mild cognitive impairment. Am JGeriatr Psychiatry. 2005;13:645–55.
3. Bennett DA, Wilson RS, Schneider JA, Evans DA, Beckett LA,Aggarwal NT, et al. Natural history of mild cognitive impairmentin older persons. Neurology 2002;59:198–205.
4. Mosconi L, Sorbi S, de Leon MJ, Li Y, Nacmias B, Myoung PS, etal. Hypometabolism exceeds atrophy in presymptomatic early-onsetfamilial Alzheimer’s disease. J Nucl Med. 2006;47:1778–86.
5. Dubois B, Feldman HH, Jacova C, Dekosky ST, Barberger-Gateau P, Cummings J, et al. Research criteria for the diagnosisof Alzheimer’s disease: revising the NINCDS-ADRDA criteria.Lancet Neurol. 2007;6:734–46.
6. Price JL, Davis PB, Morris JC, White DL. The distribution oftangles, plaques, and related immunohistochemical markers inhealthy aging and Alzheimer’s disease. Neurobiol Aging.1991;12:295–312.
7. Gomez-Isla T, Price JL, McKeel DW, Morris JC, Growdon JH,Hyman BT. Profound loss of layer II entorhinal cortex neuronsoccurs in very mild Alzheimer’s disease. J Neurosci.1996;16:4491–500.
8. Jack CR Jr, Petersen RC. Structural imaging approaches toAlzheimer’s disease. In: Scinto LFM, Daffner KR, editors. Earlydiagnosis and treatment of Alzheimer’s disease. Totowa, NJ:Human; 2000. p. 127–48.
9. Xu Y, Jack CR Jr, O’Brien PC, Kokmen E, Smith GE, Ivnik RJ,et al. Usefulness of MRI measures of entorhinal cortex versushippocampus in AD. Neurology 2000;54:1760–7.
10. Pennanen C, Kivipelto M, Tuomainen S, Hartikainen P, HanninenT, Laakso MP, et al. Hippocampus and entorhinal cortex in mildcognitive impairment and early AD. Neurobiol Aging2004;25:303–10.
11. Chetelat G, Desgranges B, De La Sayette V, Viader F, Eustache F,Baron JC. Mapping grey matter loss with voxel-based morphometryin mild cognitive impairment. Neuroreport 2002;13:1939–43.
12. Karas GB, Scheltens P, Rombouts SA, Visser PJ, van Schijndel RA,Fox NC, et al. Global and local grey matter loss in mildcognitive impairment and Alzheimer’s disease. Neuroimage2004;23:708–16.
13. Mosconi L. Brain glucose metabolism in the early and specificdiagnosis of Alzheimer’s disease FDG-PET studies in MCI andAD. Eur J Nucl Med Mol Imaging 2005;32:486–510.
14. Meguro K, Blaizot X, Kondoh Y, Le Mestric C, Baron JC,Chavoix C. Neocortical and hippocampal glucose hypometabo-lism following neurotoxic lesions of the entorhinal and perirhinalcortices in the non-human primate as shown by PET. Implicationsfor Alzheimer’s disease. Brain 1999;122:1519–31.
15. Chetelat G, Desgranges B, De La Sayette V, Viader F, Eustache F,Baron JC. Mild cognitive impairment: can FDG-PET predict whois to rapidly convert to Alzheimer’s disease? Neurology2003;60:1374–7.
16. Chetelat G, Desgranges B, de la Sayette V, Viader F, Berkouk K,Landeau B, et al. Dissociating atrophy and hypometabolism impacton episodic memory in mild cognitive impairment. Brain2003;126:1955–67.
17. Ishii K, Sasaki H, Kono AK, Miyamoto N, Fukuda T, Mori E.Comparison of grey matter and metabolic reduction in mildAlzheimer’s disease using FDG-PETand voxel-based morphometricMR studies. Eur J Nucl Med Mol Imaging 2005;32:959–63.
18. Kawachi T, Ishii K, Sakamoto S, Sasaki M, Mori T, Yamashita F,et al. Comparison of the diagnostic performance of FDG-PET andVBM-MRI in very mild Alzheimer’s disease. Eur J Nucl MedMol Imaging 2006;33:801–9.
19. Walhovd KB, Fjell AM, Amlien I, Grambaite R, Stenset V,Bjørnerud A, et al. Multimodal imaging in mild cognitiveimpairment: metabolism, morphometry and diffusion of thetemporal-parietal memory network. Neuroimage 2009;45(1):215–23.
20. Visser PJ, Verhey FR, BoadaM, Bullock R, De Deyn PP, Frisoni GB,et al. Development of screening guidelines and clinical criteria forpredementia Alzheimer’s disease. The DESCRIPA study. Neuro-epidemiology 2008;30:254–65.
44 Eur J Nucl Med Mol Imaging (2010) 37:36–45

21. Folstein MF, Folstein SE, McHugh PR. “Mini-Mental State”: apractical method for grading the cognitive state of patients for theclinician. J Psychiatr Res. 1975;12:189–98.
22. Katz S, Downs TD, Cash HR, Grotz RC. Progress in developmentof the index of ADL. Gerontologist 1970;10:20–30.
23. Lawton MP, Brody EM. Assessment of older people; self-maintaining and instrumental activities of daily living. Gerontologist1969;9:179–86.
24. Cummings JL, Mega M, Grey K, Rosenberg-Thompson S,Carusi DA, Gornbein J. The Neuropsychiatric Inventory: compre-hensive assessment of psychopathology in dementia. Neurology1994;44:2308–14.
25. Masur DM, Fuld PA, Blau AD, Thal LJ, Levin HS, Aronson MK.Distinguishing normal and demented elderly with selectivereminding test. J Clin Exp Neuropsychol 1989;11:615–30.
26. Carlesimo GA, Caltagirone C, Gainotti G. The Mental DeteriorationBattery: normative data, diagnostic reliability and qualitative analysisof cognitive impairment. The group for the standardization of theMental Deterioration Battery. Eur Neurol. 1996;36:378–84.
27. Spinnler H, Tognoni G. Standardizzazione e taratura Italiana ditest neuropsicologici. Ital J Neurol Sci. 1987;6(Suppl 8):1–120.
28. Barbarotto R, Laiacona M, Frosio R, Vecchio M, Farinato A,Capitani E. A normative study on visual reaction times and twoStroop colour-word tests. Ital J Neurol Sci. 1998;19:161–70.
29. Watson YI, Arfken CL, Birge SJ. Clock completion: an objectivescreening test for dementia. J Am Geriatr Soc. 1993;41:1235–40.
30. Amodio P, Wenin H, Del Piccolo F, Mapelli D, Montagnese S,Pellegrini A, et al. Variability of trail making test, symbol digittest and line trait test in normal people. A normative study takinginto account age-dependent decline and sociobiological variables.Aging Clin Exp Res. 2002;14:117–31.
31. McKhann G, Drachman D, Folstein M, Katzman R, Price D,Stadlan EM. Clinical diagnosis of Alzheimer’s disease: report ofthe NINCDS-ADRDA Work Group under the auspices ofDepartment of Health and Human Services Task Force onAlzheimer’s Disease. Neurology 1984;34:939–44.
32. Bartenstein P, Asenbaum S, Catafau A, Halldin C, Pilowski L,Pupi A, et al. European Association of Nuclear Medicineprocedure guidelines for brain imaging using [(18)F]FDG. Eur JNucl Med. 2002;29:BP43–8.
33. Talairach J, Tournoux P. Co-planar stereotaxic atlas of the humanbrain. New York: Thieme Medical; 1988.
34. Friston KJ, Holmes AP, Worsley KJ, Poline JP, Frith CD,Frackowiak RSJ. Statistical parametric maps in functional imaging:a general linear approach. Hum Brain Mapp. 1994;2:189–210.
35. Gispert JD, Pascau J, Reig S, Martínez-Lázaro R, Molina V,García-Barreno P, et al. Influence of the normalization template onthe outcome of statistical parametric mapping of PET scans.Neuroimage 2003;19:601–12.
36. Meyer JH, Gunn RN, Myers R, Grasby PM. Assessment of spatialnormalization of PET ligand images using ligand-specific templates.Neuroimage 1999;9:545–53.
37. Good CD, Johnsrude IS, Ashburner J, Henson RN, Friston KJ,Frackowiak RS. A voxel-based morphometric study of ageing in465 normal adult human brains. Neuroimage 2001;14:21–36.
38. Oishi N, Udaka F, Kameyama M, Sawamoto N, Hashikawa K,Fukuyama H. Regional cerebral blood flow in Parkinson diseasewith nonpsychotic visual hallucinations. Neurology 2005;65:1708–15.
39. Nestor PJ, Fryer TD, Smielewski P, Hodges JR. Limbichypometabolism in Alzheimer’s disease and mild cognitiveimpairment. Ann Neurol. 2003;54:343–51.
40. Kogure D,Matsuda H, Ohnishi T, Asada T, UnoM, Kunihiro T, et al.Longitudinal evaluation of early Alzheimer’s disease using brainperfusion SPECT. J Nucl Med. 2000;41:1155–62.
41. Caroli A, Testa C, Geroldi C, Nobili F, Barnden LR, Guerra UP,et al. Cerebral perfusion correlates of conversion to Alzheimer’sdisease in amnestic mild cognitive impairment. J Neurol.2007;254:1698–707.
42. Mitchell AJ, Shiri-Feshki M. Temporal trends in the long term riskof progression of mild cognitive impairment: a pooled analysis. JNeurol Neurosurg Psychiatry 2008;79(12):1386–91.
43. de Leon MJ, George AE, Stylopoulos LA, Smith G, Miller DC.Early marker for Alzheimer’s disease: the atrophic hippocampus.Lancet 1989;2:672–3.
44. Braak H, Braak E. Evolution of the neuropathology of Alzheimer’sdisease. Acta Neurol Scand Suppl. 1996;165:3–12.
45. Magistretti PJ. Cellular basis of functional brain imaging: insightfrom neural-glia metabolic coupling. Brain Res. 2000;886:108–12.
46. Price JL, Morris JC. Tangles and plaques in nondemented aging and“preclinical” Alzheimer’s disease. Ann Neurol. 1999;45:358–68.
47. Callen DJA, Black SE, Gao F, Caldwell CB, Szalai JP. Beyond thehippocampus: MRI volumetry confirms widespread limbic atrophyin AD. Neurology 2001;57:1669–74.
48. Rose SE, Janke AL, Chalk JB. Grey and white matter changes inAlzheimer’s disease: a diffusion tensor imaging study. J MagnReson Imaging 2008;27:20–6.
49. Cabeza R, Nyberg L. Imaging cognition, II: an empirical reviewof 275 PET and fMRI studies. J Cogn Neurosci. 2000;12:1–47.
50. Convit A, de Asis J, de LeonMJ, Tarshis CY, De Santi S, Rusinek H.Atrophy of the medial occipitotemporal, inferior, and middletemporal gyri in non-demented elderly predict decline to Alzheimer’sdisease. Neurobiol Aging 2000;21(1):19–26.
51. Whitwell JL, Przybelski SA, Weigand SD, Knopman DS, Boeve BF,Petersen RC, et al. 3D maps from multiple MRI illustrate changingatrophy patterns as subjects progress frommild cognitive impairmentto Alzheimer’s disease. Brain 2007;130:1777–86.
52. Karas G, Sluimer J, Goekoop R, van der Flier W, Rombouts SA,Vrenken H, et al. Amnestic mild cognitive impairment: structuralMR imaging findings predictive of conversion to Alzheimerdisease. AJNR Am J Neuroradiol 2008;29(5):944–9.
53. Hunt A, Schönknecht P, Henze M, Seidl U, Haberkorn U,Schröder J. Reduced cerebral glucose metabolism in patients atrisk for Alzheimer’s disease. Psychiatry Res. 2007;155:147–54.
54. Nobili F, Salmaso D, Morbelli S, Girtler N, Piccardo A, Brugnolo A,et al. Principal component analysis of FDG PET in amnestic MCI.Eur J Nucl Med Mol Imaging 2008;35:2191–202.
55. Caroli A, Geroldi C, Nobili F, Barnden LR, Guerra UP,Bonetti M, et al. Functional compensation in incipient Alz-heimer’s disease. Neurobiol Aging 2008. doi:10.1016/j.neurobiolaging.2008.05.001
56. Mosconi L, Perani D, Sorbi S, Herholz K, Nacmias B, Holthoff V,et al. MCI conversion to dementia and the APOE genotype: aprediction study with FDG-PET. Neurology 2004;63:2332–40.
57. Anchisi D, Borroni B, Franceschi M, Kerrouche N, Kalbe E,Beuthien-Beumann B, et al. Heterogeneity of brain glucosemetabolism in mild cognitive impairment and clinical progressionto Alzheimer disease. Arch Neurol. 2005;62:1728–33.
Eur J Nucl Med Mol Imaging (2010) 37:36–45 45