Disease Tracking Markers for Alzheimer's Disease at the Prodromal (MCI) Stage
41
Journal of Alzheimer’s Disease 26 (2011) 159–199 DOI 10.3233/JAD-2011-0043 IOS Press 159 Disease Tracking Markers for Alzheimer’s Disease at the Prodromal (MCI) Stage Valeria Drago a , Claudio Babiloni b , David Bartr´ es-Faz c , Anna Caroli a,e , Beatriz Bosch c , Tilman Hensch d , Mira Didic f , Hans-Wolfgang Klafki g , Michela Pievani a , Jorge Jovicich h , Luca Venturi a , Philipp Spitzer g , Fabrizio Vecchio i , Peter Schoenknecht d , Jans Wiltfang g , Alberto Redolfi a , Gianluigi Forloni j , Olivier Blin k , Elaine Irving l , Ceri Davis l , Hans-goran H˚ ardemark m and Giovanni B. Frisoni a,∗ a LENITEM Laboratory of Epidemiology, Neuroimaging and Telemedicine, IRCCS “San Giovanni di Dio – Fatebenefratelli”, Brescia, Italy b Department of Biomedical Sciences, University of Foggia, Foggia, Italy c Institut d’Investigaci´ o Biom` ediques August Pi i Sunyer (IDIBAPS), Barcelona, Departament de Psiquiatria i Psicobiologia Cl´ ınica, Facutat de Medicina, Universitat de Barcelona, and Alzheimer’s disease and other cognitive disorders unit, Neurology Service, Hospital Cl´ ınic de Barcelona, Barcelona, Spain d Department of Psychiatry, University of Leipzig, Leipzig, Germany e Medical Imaging Unit, Biomedical Engineering Department, Mario Negri, Institute for Pharmacological Research, Bergamo f Service de Neurologie et de Neuropsychologie, P ˆ ole de neurosciences cliniques, Assistance Publique des H ˆ opitaux de Marseille, H ˆ opitaux de la Timone, CMRR PACA Ouest & INSERM U751, Facult ´ e de M´ edecine, Universit ´ e de la M´ editerran´ ee, Marseille, France g Department of Psychiatry and Psychotherapy, University of Duisburg-Essen, LVR-Klinikum, Essen, Germany h Functional NeuroImaging Laboratory, Center for Mind Brain Sciences, University of Trento i A.Fa.R., Dip. Neurosci. Osp. FBF, Isola Tiberina, Rome, Italy j Istituto di Ricerche Farmacologiche “Mario Negri” k Clinical Investigation Centre (CIC-UPCET) and Department of Clinical Pharmacology, UMR-CNRS, 6193 Institute of Cognitive Neurosciences, CHU, Timone, Marseille, France l Neurosciences CEDD, GlaxoSmithKline, Harlow, Essex, UK m AstraZencea R&D Clinical Neuroscience Therapy Area SE-151 85 S¨ odert¨ alje, Sweden Abstract. Older persons with Mild Cognitive Impairment (MCI) feature neurobiological Alzheimer’s Disease (AD) in 50% to 70% of the cases and develop dementia within the next 5 to 7 years. Current evidence suggests that biochemical, neuroimaging, electrophysiological, and neuropsychological markers can track the disease over time since the MCI stage (also called prodromal AD). The amount of evidence supporting their validity is of variable strength. We have reviewed the current literature and categorized evidence of validity into three classes: Class A, availability of multiple serial studies; Class B a single serial study or multiple cross sectional studies of patients with increasing disease severity from MCI to probable AD; and class C, multiple ∗ Correspondence to: Giovani B. Frisoni, Via Pilastroni 1, 25125, Brescia, Italy. Tel.: +39 030 35011; Fax: +39 030 348255; E-mail: [email protected]. ISSN 1387-2877/11/$27.50 © 2011 – IOS Press and the authors. All rights reserved
Transcript of Disease Tracking Markers for Alzheimer's Disease at the Prodromal (MCI) Stage

Journal of Alzheimer’s Disease 26 (2011) 159–199DOI 10.3233/JAD-2011-0043IOS Press
159
Disease Tracking Markers for Alzheimer’sDisease at the Prodromal (MCI) Stage
Valeria Dragoa, Claudio Babilonib, David Bartres-Fazc, Anna Carolia,e, Beatriz Boschc,Tilman Henschd, Mira Didicf , Hans-Wolfgang Klafkig, Michela Pievania, Jorge Jovicichh,Luca Venturia, Philipp Spitzerg, Fabrizio Vecchioi, Peter Schoenknechtd, Jans Wiltfangg,Alberto Redolfia, Gianluigi Forlonij, Olivier Blink, Elaine Irvingl, Ceri Davisl, Hans-goranHardemarkm and Giovanni B. Frisonia,∗aLENITEM Laboratory of Epidemiology, Neuroimaging and Telemedicine, IRCCS “San Giovanni diDio – Fatebenefratelli”, Brescia, ItalybDepartment of Biomedical Sciences, University of Foggia, Foggia, ItalycInstitut d’Investigacio Biomediques August Pi i Sunyer (IDIBAPS), Barcelona, Departamentde Psiquiatria i Psicobiologia Clınica, Facutat de Medicina, Universitat de Barcelona, and Alzheimer’sdisease and other cognitive disorders unit, Neurology Service, Hospital Clınic de Barcelona, Barcelona, SpaindDepartment of Psychiatry, University of Leipzig, Leipzig, GermanyeMedical Imaging Unit, Biomedical Engineering Department, Mario Negri, Institute forPharmacological Research, Bergamof Service de Neurologie et de Neuropsychologie, Pole de neurosciences cliniques, Assistance Publiquedes Hopitaux de Marseille, Hopitaux de la Timone, CMRR PACA Ouest & INSERM U751,Faculte de Medecine, Universite de la Mediterranee, Marseille, FrancegDepartment of Psychiatry and Psychotherapy, University of Duisburg-Essen, LVR-Klinikum, Essen, GermanyhFunctional NeuroImaging Laboratory, Center for Mind Brain Sciences, University of TrentoiA.Fa.R., Dip. Neurosci. Osp. FBF, Isola Tiberina, Rome, ItalyjIstituto di Ricerche Farmacologiche “Mario Negri”kClinical Investigation Centre (CIC-UPCET) and Department of Clinical Pharmacology, UMR-CNRS,6193 Institute of Cognitive Neurosciences, CHU, Timone, Marseille, FrancelNeurosciences CEDD, GlaxoSmithKline, Harlow, Essex, UKmAstraZencea R&D Clinical Neuroscience Therapy Area SE-151 85 Sodertalje, Sweden
Abstract. Older persons with Mild Cognitive Impairment (MCI) feature neurobiological Alzheimer’s Disease (AD) in 50% to70% of the cases and develop dementia within the next 5 to 7 years. Current evidence suggests that biochemical, neuroimaging,electrophysiological, and neuropsychological markers can track the disease over time since the MCI stage (also called prodromalAD). The amount of evidence supporting their validity is of variable strength. We have reviewed the current literature andcategorized evidence of validity into three classes: Class A, availability of multiple serial studies; Class B a single serial studyor multiple cross sectional studies of patients with increasing disease severity from MCI to probable AD; and class C, multiple
∗Correspondence to: Giovani B. Frisoni, Via Pilastroni 1, 25125,Brescia, Italy. Tel.: +39 030 35011; Fax: +39 030 348255; E-mail:[email protected].
ISSN 1387-2877/11/$27.50 © 2011 – IOS Press and the authors. All rights reserved

160 V. Drago et al. / Disease Tracking Markers for AD at the Prodromal (MCI) Stage
cross sectional studies of patients in the dementia stage, not including the MCI stage. Several Class A studies suggest that episodicmemory and semantic fluency are the most reliable neuropsychological markers of progression. Hippocampal atrophy, ventricularvolume and whole brain atrophy are structural MRI markers with class A evidence. Resting-state fMRI and connectivity, anddiffusion MR markers in the medial temporal white matter (parahippocampus and posterior cingulum) and hippocampus arepromising but require further validation. Change in amyloid load in MCI patients warrant further investigations, e.g. over longerperiod of time, to assess its value as marker of disease progression. Several spectral markers of resting state EEG rhythmsthat might reflect neurodegenerative processes in the prodromal stage of AD (EEG power density, functional coupling, spectralcoherence, and synchronization) suffer from lack of appropriately designed studies. Although serial studies on late event-related potentials (ERPs) in healthy elders or MCI patients are inconclusive, others tracking disease progression and effects ofcholinesterase inhibiting drugs in AD, and cross-sectional including MCI or predicting development of AD offer preliminaryevidence of validity as a marker of disease progression from the MCI stage. CSF Markers, such as A�1-42, t-tau and p-tau arevaluable markers which support the clinical diagnosis of Alzheimer´s disease. However, these markers are not sensitive to diseaseprogression and cannot be used to monitor the severity of Alzheimer´s disease. For Isoprostane F2 some evidence exists that itsincrease correlates with the progression and the severity of AD.
Keywords: Alzheimer’s disease, Mild cognitive impairment, neuropsychology, neuroimaging, diffusion tensor imaging, func-tional MRI, spectroscopy, positron emission tomography, EEG, cerebrospinal fluid
INTRODUCTION
There is considerable evidence to support the con-cept that Alzheimer’s disease (AD) has a long preclin-ical period [1]. For example, some of the biochemicalchanges that precede the clinical onset of AD may bepresent up to 20 years before the onset of this dementia[1–3]. Thus there are many people who already havepathological alterations of AD several decades beforethe clinical onset of the sign and symptoms.
Recently much of the literature has been directed topatients with prodromal AD (Mild Cognitive Impair-ment (MCI). MCI is often a precursor to Alzheimer’sdementia and the annual rate of development of AD forpatients with MCI is 10 to 15% [4, 5]. Some individ-uals, however, do not show progression of symptomsand do not develop dementia. Some even improve andthese individuals who do not progress or even showimprovement do not have AD. While it is importantto search for treatable causes of AD, it is important totrack patients with MCI who will progress and developdementia and those who will not in order to study whatare the most sensible markers to disease progression.
A “marker of disease progression” is a marker sen-sitive to cognitive deterioration, thus a marker that canbe used to track the progression of the disease or theeffectiveness of a disease modifying drug. A “markerof disease state” can be used to diagnose AD in patientswith MCI, i.e. to predict which patients with MCI willprogress to dementia and those who will not. Althougha marker of disease state might also be a sensitivemarker of disease progression, in this review we will
focus on studies on markers of disease progression.Although we are aware that some of the markers ofdisease progression are also good markers of diseasestate, the literature regarding markers of disease statehas been neglected since it was not within the scope ofthis review.
Currently available evidence from longitudinal andcross sectional clinical studies suggest that mark-ers such as neuropsychological tests, neuroimaging,including structural magnetic resonance imaging(MRI), diffusion tensor imaging (DTI), functional MRI(fMRI), spectroscopy, positron emission tomography(PET), EEG, event-related potentials (ERP), as wellas cerebrospinal fluid (CSF) analysis may be sensi-tive to cognitive deterioration. The evidence of thesemarkers validity and sensitivity is variable, with somemarkers being supported by rigorous serial studies,and others merely suggestive based on cross sectionalobservations. For these latter markers there is a needfor additional validation that these biomarkers trackdisease progression.
The aim of this paper is to review the studies thathave been conducted in the past 10 years (2000–2010)using neuropsychological tests, neuroimaging, neu-rophysiological and biochemical markers of diseaseprogression in patients with MCI. This review willidentify the markers that have the greatest evidencefor being valid markers of disease progression as wellas those that have received less support and those thatmight be the most promising.
Validity has been assessed identifying studiesshowing parallel changes between the candidate

V. Drago et al. / Disease Tracking Markers for AD at the Prodromal (MCI) Stage 161
Table 1Categorization of markers of disease progression based on literature
evidence of validity
Class A Validity demonstrated by multiple serial studiesClass B Validity demonstrated by a single serial study or
multiple cross sectional studies of patients atdifferent severity stages including MCI
Class C Validity demonstrated by multiple cross sectionalstudies of patients at different severity stages, butnot including MCI (studies on AD patients at thedementia stage only)
“progression” marker and some measure of clinicaldeterioration (e.g. Mini Mental State Evalutation).
The related topic of reliability addresses whetherrepeated measurements or assessments provide a con-sistent result given the same initial circumstances.Clearly, after identifying candidate markers on thebasis of group studies, it will be necessary to assessthe reliability of such validated markers by testing theirability to predictively classify individual subjects.
We decided to focus on modalities used in thecontext of the “PHARMA-COG” project*. Recentlythe EU Council of Ministers for Health under-lined the importance of generating novel therapeuticagents both for symptomatic and disease modify-ing treatment of Alzheimer’s disease (AD). Bringingtogether European experts in technologies fully trans-latable from animal to human, experts in translationalmedicine, drug discovery and mathematical modelling,“PHARMA-COG” proposes to accelerate this valida-tion using a ’MATRIX’ approach i.e. conducting par-allel experiments in animals and human using a com-prehensive and standardised battery of behavioural,neurophysiological, morphological/functional imag-ing, and biochemical endpoints to: develop modelswith greater predictive capacity for the clinics, developand validate translatable pharmacodynamic markersto support dose selection, develop challenge modelsto support early hint of efficacy studies, identify andvalidate of markers of disease progression.
In this review we have categorized these markersinto three classes of decreasing strength of evidence,as illustrated in Table 1.
NEUROPSYCHOLOGY
The neuropathological changes of Alzheimer’sdementia (AD) appear well before the disease becomesclinically apparent. At the prodromic stage of the dis-ease (MCI), there are often subtle cognitive signs;however there are currently no reliable and validated
diagnostic neuropsychological test results that are ableto track progression to AD.
One of the first and most common cognitive domainsto be affected in individuals that have been diag-nosed with a Mild Cognitive Impairment (MCI) isepisodic memory. Impaired episodic memory in ADis caused by neuropathological changes that resultin dysfunction of the mesial temporal lobe. Neu-rofibrillary tangles, related to the clinical signs ofAD [6], first appear in the mesial temporal lobe[7], sequentially affecting the entorhinal cortex andthe hippocampus. Recently, there has also been evi-dence for a relationship between episodic memory lossand hippocampal-mediated beta-amyloid deposition inelderly subjects and in AD [8]. In addition to atrophyof the medial temporal lobes that accounts for thesepatients’ amnestic disorder, areas of polymodal cortexsuch as the frontal and parietal lobes can be involvedeven early in AD [9]. Dysfunction of these regions mayimpair cognitive functions such as verbal and semanticfluency.
Class A markers
In our review of the literature, we did find sev-eral studies that systematically examined the course ofepisodic memory changes in patients affected by MCI[10–13]. Although the authors of these studies useddifferent tests to assess learning and episodic memoryand their follow up intervals were different (from 1.5up to 6 years), the majority of them indicate a decline oflearning and episodic memory in individuals affectedby MCI, providing converging evidence for consider-ing declining episodic memory as a good marker ofdisease progression.
Another neuropsychological marker that has beenwidely investigated in longitudinal studies of individ-uals affected by MCI is working memory. Backman[10] and Bennett [13] used the digit span backwardand forward, the alpha span as well as digit orderingto assess working memory. These studies used a groupof healthy controls who eventually developed AD dur-ing the course of the study and a group of MCI andhealthy elderly controls respectively. These studies didnot find that a temporal change in working memoryperformances was a useful marker of progression.
Semantic fluency has also been thought to be apotential marker of disease progression. In order toproduce as many words as possible that come fromthe same semantic category the subject needs to havea good retrieval strategy, which may be an executive

162 V. Drago et al. / Disease Tracking Markers for AD at the Prodromal (MCI) Stage
Table 2Neuropsychological markers of disease progression based on literature evidence of validity
Marker N of subject and diagnosis Time B-FU1 Results References
CLASS ALearning and memory MCI 15; HC 105 3 years Stable Backman et al., 2001
33 HC; 22 sMCI2; 95 dMCI; 47Converters
4 years Decline Albert et al., 2007
20AD; 40 MCI; 40 HC 1 year Decline Leow et al., 2009211 MCI; 587 HC 6 years Decline Bennett et al., 2002
Working Memory 211 MCI; 587 HC 6 years Stable Bennett et al., 2002MCI 15; HC 105 3 years Stable Backman et al., 2001
Semantic Fluency 96HC; 21MCI; 122AD 1 year Decline Clark et al., 2009211 MCI; 587 HC 6 years Decline Bennett et al., 2002
CLASS BGlobal Cognitive
Performances (CDR andMMSE)
20 AD, 40 MCI, 40 HC 1 year Increase (CDR), Decline(MMSE)
Leow et al., 2009
Visual Memory 19 HC, 12 QD3 stable, 9 QD deter.,16 AD
2 years decline Fowler et al., 2002
Logical Memory 20 AD, 40 MCI, 40 HC 1 year Decline Leow et al., 2009Visuospatial Abilities 211 MCI, 587 HC 6 years Decline Bennett et al., 2002
15AD, 31 MCI, 27 HC NA Decline (MCI < HC) Economou et al., 2007Letter Fluency 230 CDR = 0 (non demented), 152
CDR = 0.5 (incipient and very mild),137 CDR = 1 (mild)
18 years Decline Storandt et al., 2002
HC, MCI, AD NA Stable Dudas et al., 2005Processing Speed 211 MCI, 587 HC 6 years decline Bennett et al., 2002
15AD, 31 MCI, 27 HC NA Decline (MCI < HC;AD < MCI)
Economou et al., 2007
Picture naming 230 CDR = 0 (non demented), 152CDR = 0.5 (incipient and very mild),137 CDR = 1 (mild)
18 years Decline Storandt et al., 2002
Clock drawing 36 HC, 18 MCI, 24 AD 1 year Stable De Jager, 2004
CLASS CAnosognosia (Discrepancy
between the patients andcaregivers’ estimation ofimpairments)
79 MCI, 82 AD NA AD < MCI each comparedto their caregiver’sassessment
Kalbe, et al., 2005
Stroop Test (ResponseInhibition)
22 MCI, 33 AD NA Decline Kramer et al., 2006
Trail Making Test (Setshifting)
22 MCI, 33 AD NA Decline Kramer et al., 2006
Design Fluency 22 MCI, 33 AD NA Decline Kramer et al., 2006Emotional Expression 13 HC, 30 AD NA Decline Allender, 1989Emotional Comunication 20 HC, 27 probable AD: 8 Mild, 8
Moderate, 11 SevereNA Decline Testa et al., 2001
Ideational, ideomotor and 22 AD, 10 HC NA Decline Derouesne et al., 2000.conceptual Apraxia 15 AD, 18 HC NA Decline Mozaz et al., 2006
12 AD, 21 HC NA Decline Schwartz et al., 20001Time B-FU: Time Baseline-Follow up; 2sMCI: Stable MCI; dMCI: Decliners MCI; 3QD: Questionable Dementia.
function and thus dependent upon the frontal lobe aswell as semantic knowledge about categories. Patientsaffected by AD have more difficulty with category flu-ency than letter fluency [14] and this impairment isusually attributed to a breakdown in semantic knowl-edge about categories [15]. In our review, however,we could not find longitudinal studies indicating a
decline in semantic fluency in subjects affected by MCI[16, 13].
Class B markers
As part of the AD Neuroimaging Initiative, in a lon-gitudinal study of 12 months Leow et al. [12] compared

V. Drago et al. / Disease Tracking Markers for AD at the Prodromal (MCI) Stage 163
the anatomical distribution of structural changes, in20 patients with AD, 40 healthy elderly controls, and40 individuals with MCI. Each individual’s longitu-dinal change was mapped (Jacobian map) using anunbiased registration technique, and spatially normal-ized to a geometrically-centered average image basedon healthy controls. A voxelwise statistical analysisrevealed regional differences in atrophy rates, and thesedifferences were correlated with clinical measures andbiomarkers. For clinical measures, longitudinal assess-ments of temporal lobe atrophy were significantlycorrelated with progression of cognitive impairmentin the MCI group, including an increase over time inthe Clinical Dementia Rating (CDR) scores, a decreaseover time of the participants scores on the Mini-MentalState Examination (MMSE) and a progressive perfor-mance decline on the immediate memory portion ofthe Wechler Memory Scale’s Logical Memory test. Alower score on the delayed Logical Memory test alsocorrelated with a greater rate of temporal lobe atrophy.
This longitudinal study was the only one that wewere able to find using global cognitive performancesas a marker of disease progression. For this reason thismarker has been listed as Class B evidence.
Using a computerized neuropsychological assess-ment, the CANTAB (Cambridge NeuropsychologicalTest Automated Battery), Fowler et al. [17], found alongitudinal decline in spatial short term memory anda visual recognition memory task over 6, 12, 18 and24 months in a subgroup of patients with questionabledementia at baseline who declined over the 2 yearsfollow-up. This is the only longitudinal study assess-ing visual memory as a potential marker of diseaseprogression in patients affected by MCI.
A common way to assess visuospatial abilities inpatients who are being evaluated for dementia is usingthe Judgement of Line Orientation (JOLO). Patientswith dementia frequently perform poorly on this test[18], many receiving scores much below the 18 pointcut-off.
We did find one cross sectional and one longitudi-nal study that assessed visuospatial abilities in patientswith MCI. In the longitudinal study by Bennett et al.[13], individuals affected by MCI showed a declinein visuospatial abilities, as measured by the JOLO,and Standard Progressive Matrices. The cross sectionalstudy performed by Economou et al. [19], comparedthe performance of participants with AD, MCI andHealthy Controls on the JOLO and found that the par-ticipants with MCI performed more poorly than did thehealthy controls.
Reduced capacity to generate words that start with aspecific letter (letter fluency) has been associated with awide variety dementing diseases, although the patients’performance on these assessments tends to vary [20].Letter fluency was found to be abnormal in a singlelongitudinal study that was investigating patients withincipient and mild dementia (CDR = 0.5) who were fol-lowed for 18 years [21]. In contrast, in a cross sectionalstudy, performed by Dudas et al. [22], which comparedletter fluency in subjects with, MCI and AD to that ofhealthy controls did not reveal any differences in thesegroups verbal fluency.
One of the most commonly used tests to assesspatients for the cognitive disorders associated withdementia is to have patients name series of picturesand frequently the Boston Naming test is used forthis purpose. Performance on this is test appears tobe a sensitive indicator of both the presence and thedegree of cognitive deterioration. Patients with ADhave both lexical retrieval and semantic deficits [23]and therefore, often demonstrate impaired picture nam-ing. Patients with AD tend to name supra-ordinatecategory instead of the target word [24]. We did find alongitudinal study which indicated that even with milddementia (CDR = 0.5) there is a decline in picture nam-ing as assessed by the BNT in subjects with incipientand very mild dementia (CDR = 0.5) [21].
The digit symbol test, which assesses processingspeed, is extremely sensitive and specific test in detect-ing the presence of dementia, being one of the first teststo demonstrate a decline and with little overlap with theperformance of healthy controls subjects on this test.Performance on this test also declines rapidly as thesepatient’s disease progresses [25]. Bennett et al. [13]followed a group of individuals affected by MCI over6 years and did find a decline in this test over time. Thesame results were also found in a cross sectional studyby Economou et al. [19] who studied and comparedparticipants with MCI, AD and healthy controls.
A longitudinal study assessing clock drawing inMCI, AD, and healthy controls did not indicate adecline of the performances over time.
Class C
Anosognosia was also assessed in a single cross sec-tional study comparing patients with MCI and AD andtheir caregivers. The authors indicated a discrepancybetween the patients with AD and caregivers in theirestimation of impairment Patients with MCI, howeverdid not show this difference [26].

164 V. Drago et al. / Disease Tracking Markers for AD at the Prodromal (MCI) Stage
Response inhibition, using the Stroop test, in indi-viduals affected by MCI was assessed in a crosssectional study [27]. The results of this study indicatedthat patients with AD performed more poorly thanthose with MCI. In this same study set shifting abili-ties were assessed using the Trail making test (TMT) aswell as Design fluency. The results of the study indicatethat AD patients perform worse than healthy controls.We are not aware, however, of any serial study examin-ing response inhibition, set shifting or design fluencyin patients affected by MCI.
Patients with AD may have disorders of emotionalcommunication [28, 29]. These investigators comparedhealthy controls and AD’s abilities to express and com-prehend emotional prosody. Their results indicated thatpatients with AD were impaired.
These emotional communication disorders, as wellas abulia, might be responsible for the impressionthat patients with AD are apathetic. In addition, manyemotional experiences are induced by perceiving stim-uli and understanding situations. Thus, patients withAD might also appear apathetic because they do notunderstand the circumstances that normally induceemotions.
Several cross sectional study that compared healthycontrols to AD patients on apraxia indicate a worse per-formance of AD compared to healthy controls [30–32].
Conclusions
The utility of neuropsychological tests as markersfor disease progression needs to be tested with fur-ther serial studies. Current data suggests that episodicmemory and semantic fluency are the most reliableneuropsychological markers of disease progression.
STRUCTURAL MRI
Recently, there have been remarkable advances inthe application of the neuroimaging to the study ofMCI, providing information about those brain struc-tures which are most likely to reveal changes in patientswith MCI. Volumetric MR techniques provide themost sensitive indices of brain alteration in MCI andinform us how we can classify individuals into diagnos-tic categories. The two main MR analysis techniquesemployed in these studies are the region of interest(ROI) methods and more automated methods such asvoxel based morphometry (VBM).
Medial temporal lobe (MTL) structures have longbeen known to play a critical role in episodic mem-
ory, and some of the earliest changes seen in AD arefound in this region [33]. Therefore many volumet-ric studies of MCI measured hand traced regions ofinterest (ROI’s) of specific MTL structures, such asthe hippocampus and the entorhinal cortex [34–43].The pattern of AD pathology is, however, complexand evolves as the disease progresses. Whereas ADstarts mainly in the hippocampus and entorhinal cor-tex, these pathological changes subsequently developthroughout most of the temporal lobes and the posteriorcingulate cortex. These are the changes associated withimpaired episodic memory. Subsequently, pathologi-cal changes involve neocortex; especially the cortex inthe temporal, parietal, and prefrontal regions and it isdamage to these regions that induces language deficits(e.g., anomia), apraxia, visuospatial deficits as well asexecutive disorders.
The sensitivity of a marker to track disease progres-sion depends on several factors, including the rate ofchange during the disease stage of interest, the preci-sion of the measurements, and its statistical effect size.Markers that have plateaued or have not yet changed(ceiling and floor effects, respectively) are likely to bepoor markers of progression [44]. The available evi-dence suggests that structural markers fulfil many ofthese sensitivity requirements and are therefore, goodcandidates for monitoring disease progression.
Alzheimer’s dementia (AD) is associated withprogressive accumulation of beta amyloid - A� andhyperphosphorylated tau and this accumulation leadsto progressive synaptic, neuronal, and axonal damage.Following the pathological staging scheme proposedby Braak and Braak [45], neurofibrillary tanglesfirst occur in the entorhinal cortex and hippocampus(transentorhinal stages I and II), before spreading outinto the amygdale and basolateral temporal lobe (lim-bic stages III and IV) and then into the isocorticalassociation areas (isocortical stages V and VI). Thesame pattern of progression can be identified by MRI-based assays for atrophic changes. Rates of change ina number of structural measures including volumes ofthe whole brain, the entorhinal cortex hippocampus,and temporal lobe as well as ventricular enlargement,correlate closely with changes in cognitive perfor-mance, supporting their validity as markers of diseaseprogression.
From MCI to well into the moderate dementiastage of AD, structural markers are sensitive to dis-ease progression and appear to be even more sensitiveto change than are markers of A� deposition (PIB-PET or CSF). Case control and longitudinal studies

V. Drago et al. / Disease Tracking Markers for AD at the Prodromal (MCI) Stage 165
employing a number of MR analysis techniques havesubstantially augmented our knowledge about volu-metric brain changes that characterize MCI and predictdevelopment of AD [46].
Several studies have been conducted with patientswho have MCI examining structural changes over time.Some of these studies use within group comparisonsrather than a between group comparisons at differenttimes thereby providing a correlation between struc-tural atrophy and cognitive performances. We includedthese serial studies in Class A. Additionally, not allindividuals with MCI subsequently develop AD, andindividuals with MCI who do develop AD vary in theirrate of clinical progression [47]. Therefore, there areseveral serial studies that have examined the accuracywith which volumetric MRI measures predict thoseMCI participants who will progress to AD (progressiveMCI: pMCI) versus those MCI who show functionalstability (stable MCI: sMCI) over the time to follow up[35, 48], whereas others focused on volumetric MRIchanges in pMCI versus sMCI over time [49]. We didnot focus our review on predictors of progression ratheron markers of change dividing them according to thecriteria mentioned in the introduction’s section.
Class A markers
Whole brain atrophy rate; isocortical associationareas atrophy
Studies conducting analysis of the whole brain indi-cate that faster atrophy in pMCI occurs in wide-spreadcortical regions [50]. Jack et al. [50] measured rate ofbrain atrophy from serial MRI with corresponding clin-ical changes in normal elderly subjects, patients withMCI and patients with probable AD. The annualizedchanges in volume of four structures were measuredfrom the serial MRI studies including: hippocampus,entorhinal cortex, whole brain, and ventricles. Ratesof change on several cognitive tests and rating scaleswere also assessed. Subjects who were classified asnormal or MCI at baseline could either remain stableor could convert to a lower functioning group. Patientswith AD were dichotomized into those with slow ver-sus fast progression. The atrophy rates for these fourstructures were greater among MCI subjects who con-verted to AD than MCI subjects who remained stable.The atrophy rate was also greater for patients withAD who were progressing rapidly than those who pro-gressed slowly. Among MCI subjects, correlation werecalculated between change in MRI and change in per-formance on four cognitive tests/rating scales the Mini
Mental State Examination (MMSE), Dementia RatingScale (DRS), Logical Memory II (LM II) (%) and CDRsum of boxes. Significant correlations were seen forthe hippocampal rate of atrophy with the change inDRS, and atrophy of the entorhinal cortex correlatedwith the change in CDR sum of boxes. With one excep-tion, both the whole brain and ventricular rate measureswere correlated with the changes on all these ratingscales.
Additionally, Sluimer et al. [51] determined wholebrain atrophy rate in MCI and Alzheimer’s demen-tia (AD) and its association with cognitive decline.Two magnetic resonance images were acquired with anaverage interval of 1.8 years + 0.7. Whole brain atro-phy was strongly associated with cognitive decline inthe participants with AD and MCI, but healthy controlsand subjects affected by subjective memory complaintsdid not show this atrophy.
A serial study was also conducted comparing atro-phy changes in participants with MCI with healthycontrols. In this study the subjects were 138 non-demented individuals have been followed annually forup to 10 consecutive years, but 18 of these participantswere diagnosed with MCI. This MCI group showedaccelerated changes compared to healthy controls inwhole brain volume, ventricular CSF, temporal graymatter, as well as the orbitofrontal and temporal asso-ciation cortices, including the hippocampus [52].
McDonald et al. [53] evaluated the spatial patternand regional rates of neocortical atrophy from nor-mal aging to early AD. Annual atrophy rate werederived by calculating percent cortical volume lossbetween baseline images and images taken 12 monthsafter the baseline images. Planned comparisons wereused to evaluate the change of atrophy rates acrosslevels of disease severity. The score on the ClinicalDementia Rating scale (CDR) was used to divide thestudy sample into groups reflecting degree of impair-ment. In patients with MCI with CDR scores of 0.5–1annual atrophy rates were greatest in medial temporal,middle and inferior lateral temporal, inferior parietal,and posterior cingulate gyrus. With increased impair-ment (MCI-CDR- 1.5–2.5) atrophy spread to parietal,frontal and lateral occipital cortex, followed by ante-rior cingulate cortex. Analysis of regional trajectoriesrevealed increasing rates of atrophy across all neo-cortical regions with clinical impairment. However,increase in atrophy rates were greater in early diseasewithin medial temporal cortex, whereas increases inatrophy rates were greater at later stages in prefrontal,parietal, posterior temporal, and cingulate cortex.

166 V. Drago et al. / Disease Tracking Markers for AD at the Prodromal (MCI) Stage
Table 3Structural MR markers of disease progression based on literature evidence of validity
N subjects Time B-FU Results Technical notes Referencesand diagnosis
CLASS AWhole Brain (WB)
AtrophyHC55; MCI 41;
AD 641 to 5 years Increased of atrophy in
convertersManual tracing Jack 2004
HC 10; MCI 45;AD 65
1.8 years + 0.7 WBA associated with MMSEchange in AD and MCI
Autom Structural ImageEval. SIENA or SIENAX
Sluimer et al.,2008
HC 120; MCI 18 10 years Accelerated atrophy changesin MCI compared tohealthy controls
VBM using RAVENSapproach
Driscoll et al.,2009
AD 99; MCI 235;C 131
1 year WBA associated withMMSE, ADAS-cogchanges in MCI and AD.
Software MIDAS used forWB and ventr. semiautomated segmentation.
Evans et al.,2010
aMCI progr 46; aMCIStab 23; HC 46
3 years Changes in Brain volumeover time
TIV measured by manualtracing. WB ventr atrophyrates measured with BSI.
Jack et al.,2008
C 137; MCI 105(CDR-SB = 0.5–1.0); MCI 126(CDR-SB = 1.5–2.5); Mild AD 104(CDR-SB > 2.5)
1 year Early disease: Increasedatrophy rates (AR) in MTL.Later stages: Increases ARin PFC, PL, post. Temp.,cingul. cortex.
FreeSurfer 3.02 software McDonaldet al., 2009
88 HC; Very Milddem; Mild dem.;Mod
Mean of 2.04years (+1.42SD)
Tot brain volume lossincreased in Mild and Moddem. vs HC. MMSEcorrelated with brainvolume loss.
MR image analysis wasperformed utilizing theprogram REGION.
Kaye et al.,2005
Ventricles Volume(VV)
aMCI progr 46; aMCIStab 23; HC 46
3 years Changes in ventricularexpansion over time
TIV measured manually.WB and ventr. atrophymeasured with BSI
Jack et al.,2008
79 HC (37 developedMCI)
Up to 15 years Rates of VV expansiongreater in those whodeveloped MCI.
Standardized semiautomated segmentationtechnique.
Carlson et al.,2008
AD 99; MCI 235;C 131
1 year Association betweenventricular expansion andMMSE and ADAS-cogchanges in MCI and AD.
Software MIDAS used forWB and ventr. semiautomated segmentation.
Evans et al.2010
88 HC; Very Milddem; Mild dem.;Mod
Mean of 2.04years (+1.42SD)
VV increased in Very Mildand Mild dem vs HC, andin Mod dem vs HC andMild dem. MMSE corrwith VV increase.
MR image analysis wasperformed utilizing theprogram REGION.
Kaye et al.,2005
C 152; MCI 247;AD105
NA Increase VV AD > MCI > HC Semi automated software toassess VV.
Nestor 2008
HC 104; MCI 29;Dementia 12
NA AD < MCI < C Change rate in lateralventricle-to-brain ratio(VBR) using automatedventricular and WBvolume estimation.
Carmichaelet al., 2007
HC 55; MCI 41;AD 64
1 to 5 years Increased of atrophy inconverters (either HC orMCI and fast AD progr)
Manual tracing Jack 2004
HC 120; MCI 18 10 years Accelerated VV enlargementin MCI vs HC
VBM using RAVENSapproach
Driscoll et al.,2009
Hippo Atrophy (HA) 518 HC(50 developeddementia; 36 out of50 AD)
10 years Increased in HA correlatedwith decline in delayedmemory recall.
Automated segmentationprocedures
Den Heijeret al., 2010
20 MCI (conv andstable)
3 years Increase HA of conv MCI vsstable MCI
3 D Computationalmodelling tech.
Apostolovaet al., 2006
V. Drago et al. / Disease Tracking Markers for AD at the Prodromal (MCI) Stage 167
Table 3(Continued)
N subjects Time B-FU Results Technical notes Referencesand diagnosis
88 HC; Very Milddem; Mild dem.;Mod
Mean of 2.04years (+1.42SD)
HA in Mild dem > HC MR image analysis usingthe program REGION.
Kaye et al.,2005
58 C; 43 MCI; 28 AD 3 + 1 years Increase HA over time ofcMCI vs sMCI
Manual tracing Jack 2000
HC 55; MCI 41; AD64
1 to 5 years Increased of HA in conv(either HC or MCI and fastAD progr)
Manual tracing Jack 2004
58 MCI(19 conv);20 C
2 years Conv MCI had the highestannual decline rates incognition and HVvs stableMCI and HC
Manual tracing Wang et al.,2009
33 MCI 3 years Increased HA vs HC VBM Withwell etal., 2009
35 HC; 23 MCI (11conv.);14 AD
6 years Increased rate of HA and theenthorinal cortex for thecMCI and AD vs HC.
Manual tracing Stoub et al.,2010
97 AD; 245 MCI;148 HC
1 year HA correlated with baselineand changes in MMSE andglobal sum of boxes CDRscores
Automated segmentationmethod based onAdaBoost to create 3Dhippocampal surfacemodel
Morra et al.,2009
18 MCI 18 months Greater Gray matter loss inconv. vs non conv in hippocarea, ITG, MTG, postcyngulate and precuneus
Modified VBM procedurespecially designed forlongitudinal studies
Chetelat et al.2005
CLASS BCortical Thinning pMCI 15, SMCI 45, 7 years pMCI > sMCI Reduced
Cortical thicknessAutomatic computational
surface methodJulkunen
et al., 2009HC 34, MCI 62,
AD 42NA AD > MCI > C automated MRI-based
analysis techniques inorder to determine thepattern of corticalthinning
Singh 2006
Substantia Innominata(SI) Atrophy
HC 12, AD 13 NA AD > C Automated technique ofimage regressionanalysis, implementedthrough code written inMatlab 5.3, to theanalysis of proton densityweighted structural MRIof the basal forebrain.This technique allowssearching a large portionof the substantiainnominata for signalchanges.
Teipel et al.,2005
26 aMCI, 46 HC,12 AD
NA AD > MCI > C Correlationbetween performance in theword list recall (CERADsubtest) and SI volume inAD patients
Manually tracement using acustom madesegmentation program
Muth., et al.,2010
HC 27, MCI 33,AD 19
NA AD < MCI; AD < C; MCI = C SI volumes were traced onthree consecutive gapless1 mm thick coronal slices.
George et al.,2010 (aheadof print)
WBA: Whole Brain Atrophy; VBM: Voxel Based Morphometry; TIV: Total Intracranial Volume; BSI: Boundary Shift Integral; MTL: MedialTemporal lobe; PFC: Pre-Frontal Cortex; PL: Parietal lobe.
168 V. Drago et al. / Disease Tracking Markers for AD at the Prodromal (MCI) Stage
Spatial patterns of brain atrophy as detected in neu-roimaging (SPARE A Index) has been tested as a meansearly detection or index of suspicion for diseases suchas AD. This method uses sophisticated pattern analy-sis algorithms that are trained to identify patterns ofnormal or abnormal structure and function [54] whichare used for classification at the individual level. Thisapproach considers all brain regions jointly and iden-tifies a minimal set of regions whose volumes jointlymaximally differentiate between the two groups (nor-mal control versus patients with AD) on the basis ofan individual scan. For a classifier constructed fromthe healthy controls and AD groups, a positive indeximplies AD like brain and negative index implies con-trols like brain. Davatzikos et al. [54] investigatedwhether differences in spatial pattern of brain atro-phy could be detected in cognitively healthy controlsversus patients with MCI and whether these patternsare associated with cognitive decline. Images from theAlzheimer’s Disease Neuroimaging Initiative (ADNI)dataset were used to construct a pattern classifier thatrecognized spatial patterns of brain atrophy which bestdistinguish AD patients from cognitive normal controlsubjects and MCI participants in the Baltimore Longi-tudinal Study of Aging (BLSA) neuroimaging study.The degree to which AD like patterns were presentin control and MCI subjects was evaluated serially inrelation to cognitive performance. The oldest controlparticipants showed progressively increasing AD likepattern of atrophy, and individuals with these patternshad reduced cognitive performance. MCI was asso-ciated with steeper longitudinal increases of AD likepattern of atrophy, which separated them from the cog-nitively normal control subjects.
Ventricular volumeA series of cross sectional studies have examined
changes in ventricular volumes comparing people withMCI, AD and healthy controls. All studies reportedthat the AD group had greater ventricular enlarge-ment compared to both subjects with MCI and healthycontrols. In addition, the participants with MCI hada greater rate of ventricular enlargement compared tohealthy controls. We report here three studies lookingat this phenomenon using three different techniques toassess ventricular volume, such as a semi automatedsoftware [55], an automated ventricular extractionapproach [56], and a voxel based morphometry usingRAVENS approach [52].
A longitudinal study has also been performed byJack et al. [57] with 46 subjects who had MCI and
progressed to AD (progressive MCI: pMCI), 23 parti-cipants who had sMCI (stable MCI) without progres-sion to dementia and 46 healthy controls. All subjectsincluding in this study had three or more serial MRIscans within 3 years from their initial scan when theyhad MCI or were control subjects and a final MRI whenthey were either diagnosed with AD, sMCI or a normalcontrol.
Rate of brain shrinkage and ventricular expansionwere measured across all available MRI scans in eachsubject and the results indicated that rate of atro-phy accelerate as individuals progressed from amnesicMCI (aMCI) to typical late onset AD. In pMCI thechange in pre to post diagnostic scan rate of ventricularexpansion was 1.7 cm3/year and acceleration in brainshrinkage was 5.3 cm3/year. Brain volume declinedand ventricular volume increased in all the three groupswith age. The rate of atrophy was greater in youngerthan older subjects with aMCI who progressed to ADand the rate was also less in subjects with aMCI whodid not progress (stable MCI: sMCI) that in those whodid progress (progressive MCI: pMCI). The authors didnot find that the rates of atrophy varied as a function ofage in 70-to 90 years’ old cognitively normal subjects.
A similar study was performed by Evans et al.[58], who assessed the relationships between anatomicchanges of the whole brain and ventricular volume, asdetermined by MRI, with change in cognitive scoresin participants with AD, MCI and healthy controls.Their results indicated that brain atrophy rates and ven-tricular enlargement differed between groups and insubjects with MCI and AD these atrophic changes wereassociated with lowering of the scores on the MMSE.In the subjects with MCI both of these anatomicmeasures were also associated with scores on theADAS-cog and on Trails B in MCI. For the participantswith AD, their ventricular expansion was associatedwith scores on the ADAS-cog. Additionally brain atro-phy and ventricular expansion were higher in MCIsubjects who progressed to AD within 12 months offollow up, compared with MCI subjects who remainedstable. The authors conclude that whole brain atro-phy rates and ventricular enlargement tracked diseaseprogression and psychological decline, demonstratingtheir relevance as biomarkers.
Carlson et al. [59], investigated a group of 79 healthyelderly subjects for up to 15 consecutive years withstandardized clinical evaluations and volumetric brainMRI assessments of ventricular volume. During thestudy period, 37 subjects developed MCI. Their resultsindicated that the annual rate of expansion of ven-

V. Drago et al. / Disease Tracking Markers for AD at the Prodromal (MCI) Stage 169
tricular volume were greater in those who developedcognitive impairment during follow-up than those par-ticipants who did not.
Hippocampal atrophyLongitudinal studies have examined the relationship
between brain atrophy rates and progression from MCIto AD. Most such studies collect MRI data and conductcoincident clinical /neuropsychological assessment attwo time points spaced several years apart. Severalstudies have reported a relatively low hippocampalatrophy rate ranging from 1.0–2.2%/year for healthycontrols, to 2.5–4.3%/year in subjects with MCI and2.8–4.0%/year for participants with mild AD [49, 60,61]. Most studies indicate that hippocampus showshigher annual rates of atrophy in pMCI than sMCI[49, 50, 62–64]. Estimates of annualized hippocampalatrophy in pMCI are generally about 3.7%, for sMCIestimates are about 2.5–2.8% [49, 63].
Withwell et al. [64] followed 33 MCI subjects over3 years. Voxel based morphometry was used to assesspatterns of grey matter atrophy. The pattern of greymatter atrophy involved primarily the medial temporallobes, including the amygdale, anterior hippocampus,entorhinal cortex and fusiform gyrus. Subsequently theatrophy developed in more posterior regions, such asthe parietal lobe and later with the development fromMCI to AD, atrophy developed in the temporoparietalassociation cortex and the frontal lobes.
Chetelat et al. [62] used voxel based morphometryto map structural changes associated with rapid devel-opment of AD in MCI. Eighteen amnesic MCI patientswere followed-up for a predefined fixed period of 18months and development of AD was judged accordingto NINCDS-ADRDA criteria. Each patient underwenta high resolution T1-weighted volume MRI scan bothat entry in the study and 18 months later. To map graymatter loss from baseline to follow up assessment,the authors used a modified voxel-based morphometry(VBM) procedure specially designed for longitudinalstudies. Regions of significant gray matter (GM) lossover the 18 months follow up period common to bothconverters and non-converters included the temporalneocortex, parahippocampal cortex, orbitofrontal andinferior parietal areas and the left thalamus. However,there was significantly greater GM loss in convertersrelative to non-converters in the hippocampal areas,inferior and middle temporal gyrus, posterior cingulategyrus and precuneus [62].
Another longitudinal volumetric MRI analysis of155 subjects has been performed by Kaye et al. [65]
to determine if rates and location of brain volumeloss associated with AD are phase specific, occur-ring prior to clinical onset and/or at a later stage.Subjects were divided by Clinical Dementia Rating(CDR) scale into stages of normal (CDR = 0 at base-line and CDR = 0 at follow ups), very mild (CDR = 0at baseline and CDR = 0.5 at follow up or CDR0.5 at baseline and at follow up) Mild (CDR = 0.5at baseline and CDR = 1 at follow up or CDR = 1.0at baseline and follow up) and Moderate demen-tia (CDR = 1.0 at baseline and CDR = 2.0 at followups or CDR = 2.0 at baseline and CDR = 2.0 at fol-low up). Subjects were followed for a mean of 2.04(+1.42 SD) years within a clinical stage. The authorsmeasured the volume of supratentorial intracranialcavity, total brain, frontal lobe, temporal lobe, andparieto-occipital lobar region, basal ganglia-thalamicregion, ventricular CSF, parahippocampal gyrus, andhippocampal body. Although they did find a crosssectional difference in hippocampal volume betweenthe participants with mild dementia (CDR 0.5 to 1.0or CDR 1.0 at baseline and follow up) and healthycontrols (CDR = 0 at baseline and follow up), therates of changes were not significantly accelerating.The authors attempt to explain these findings byassuming that the hippocampus might undergo a rel-atively constant slow atrophy several years beforethe onset of clinical detected cognitive changes [34,66].
In the next clinical transition stage to mild impair-ment (Mild group) the rates of both ventricularenlargement and total brain volume loss were greaterthan the normal group. In the later stage of dementia(Moderate group) in addition to the ventricles and totalbrain, the temporal lobe and basal ganglia-thalamicregions increased in the rate of atrophy when com-pared to the normal group and ventricular enlargementwas significantly greater than the very mild group aswell. Rates of global cognitive decline, measured byrate of annual MMSE change, correlated with brainvolume loss and ventricular volume increase.
Stoub et al. [67] studied three groups of elderly par-ticipants following them with yearly high resolutionMRI scans over 6 years. At baseline participants con-sisted of 35 healthy controls, 33 MCI, and 14 AD.Eleven patients affected by aMCI developed AD dur-ing the course of the study and 9 healthy controlsdeclined in cognitive functions. Longitudinal analy-sis showed that the rate of the entorhinal cortex andhippocampus for the stable healthy controls differedsignificantly from MCI participants who converted

170 V. Drago et al. / Disease Tracking Markers for AD at the Prodromal (MCI) Stage
to AD and the AD group. Additionally longitudinaldecreases in hippocampal and entorhinal volume wererelated to longitudinal decline in declarative memoryperformance.
Wang et al. [68] investigated 58 subjects withaMCI and 20 normal aging elderly controls. All theparticipants underwent an annual neuropsychologicalassessment and MRI. Annual decline in neuropsycho-logical test score, hippocampal and amygdala volumeswere calculated. Nineteen MCI converted to AD duringthe course of the study (2 years). The annual hip-pocampal atrophy rate was correlated with a decline inmemory test score. Compared to subjects with sMCIand normal aging, those with pMCI had the highestannual decline rates in cognition and hippocampal vol-ume, but no differences in the amygdala volume werefound.
Morra et al. [69] mapped the 3D profile of hippocam-pal degeneration over time in 490 subjects scannedtwice with brain MRI over a 1 year interval. There were97 participants who had AD, 148 were healthy controlsubjects and 245 who demonstrated MCI. The authorsused a validated automated segmentation method, tocreate 3D hippocampal surface models in all 980scans. Hippocampal volume loss rates increased withclinical deterioration (healthy controls 0.66%/year;MCI 3.12%/year; AD 5.59%/year) and correlatedwith both baseline and interval changes in MMSEscores and CDR sum of boxes scores. Convertersfrom MCI to AD showed faster atrophy than non-con-verters.
Den Heijer et al. [70] used sequential MRI as abiomarker of disease process in healthy individuals.The authors examined 581 elderly participants takenfrom the population based Rotterdam Scan Study. AMRI was performed at baseline in 1995–1996 that wasrepeated in 1999–2000 (in 244 persons) and in 2006 (in185 persons). All participants were free of dementia atbaseline and followed over time for cognitive declineand dementia. These subjects had 4 repeated neuropsy-chological tests at the research center over a 10 yearsperiod. During this time 50 people developed demen-tia with 36 having AD. In addition to learning that adecline in hippocampal volume predicted the onset ofclinical dementia, in those people who remained free ofdementia during the entire follow up period, they foundthat decline in hippocampal volume paralleled and pre-ceded a specific decline in delayed recall of words andthose who had a faster decline of hippocampal volumealso had a significant faster decline in delayed memoryrecall.
Class B markers
Cortical thinning patternCortical thinning patterns have been investigated
cross-sectionally by Singh et al. [71]. The authorscompared patients affected by AD, MCI and healthycontrols. Their results indicated a greater cortical thin-ning in AD compared to MCI as well as greaterthinning in MCI than in healthy controls.
Julkunen et al. [72] also analyzed the corticalthickness in pMCI and sMCI subjects. These inves-tigators followed 60 participants with MCI for 7years in order to examine the differences in corticalthickness between those participants with progressiveversus those with stable MCI. When compared to thesMCI subjects, the pMCI group displayed significantlyreduced cortical thickness bilaterally, in the superiorand middle frontal gyri, the superior, middle and infe-rior temporal, the fusiform gyrus and parahippocampalregions. In the pMCI participants the cingulate and ret-rosplenial cortices, as well as the right precuneal andparacentral regions were also atrophic.
Substantia innominataThe substantia innominata (SI) contains the nucleus
basalis of Maynert, which provides the major cholin-ergic innervations to the entire cortical mantel and theamygdale as well as the medial septal and diagonalband of Broca, which supply cholinergic innovation tothe hippocampus. Degeneration of nucleus basalis neu-rons correlates with cognitive decline in AD. Georgeet al. [73] investigated 27 healthy controls, 33 MCIand 19 AD participants comparing their SI volumes.Their results indicated that SI volume was significantlyreduced in AD group compared to MCI and normalcontrol participants; however the healthy controls andMCI participants did not differ from each other.
Muth et al. [74] recently performed a study examin-ing the volume loss of the cholinergic basal forebrainregion (substantia innominata) between healthy con-trols, and subjects with MCI and AD. Their resultsindicated the volume of SI to be significantly differ-ent between groups in that healthy controls had thelargest SI volumes, followed by aMCI and then theAD patients. In vivo quantification of these changesmight be of use as a novel neuroimaging marker ofcholinergic neurodegeneration in AD.
The authors ended their manuscript suggesting thatthe use of SI volume may serve as a surrogate markerfor the monitoring of cholinergic neurodegenerationduring the course of dementing diseases.

V. Drago et al. / Disease Tracking Markers for AD at the Prodromal (MCI) Stage 171
Conclusions
Up to date hippocampal atrophy, ventricular volumeand whole brain atrophy are the structural MRI mark-ers to have the greatest class A evidence to be goodmarkers of disease progression.
RESTING STATE FMRI
Alzheimer’s dementia is characterized by severesynaptic/neuronal dysfunction and selective neuronalloss [75]. Early on, misfolded proteins aggregatewithin small, selectively vulnerable neuron popula-tions that reside in specific brain regions [76]. Synapsesfalter, and damage develops in new regions accom-panied by increasing clinical deficits [75]. Often,later-affected regions bear known anatomical connec-tions with the sites of earlier injury [77]. Based onneuropathology [78], neuroimaging [79, 80] and evi-dence from transgenic animal models [81], it has beensuggested that neurodegeneration may relate to neuralnetwork dysfunction [79, 82].
Resting-state fMRI provides an indirect marker ofneuronal activity by measuring the spontaneous low-frequency (<0.08–0.1 Hz) fluctuations in the bloodoxygen level dependent (BOLD) signal [83]. This tech-nique allows the investigation of brain activity withinspatially distinct, functionally related group of corticaland subcortical regions [84–86]. Networks relevant toAD are (i) the default mode network (DMN), a set ofregions which comprises the posterior cingulate cortex(PCC), the hippocampus, the medial temporal cortex,the parietal lobule, and the medial prefrontal cortex(mPFC); (ii) the working memory network (WMN);and (iii) the attention/executive network. The DMN isrelevant to AD because the areas that comprise thisnetwork overlap with the regions that are selectivelyaffected by this disease [87]. The networks that medi-ate working memory and attention are relevant becauseof the forms of cognitive deficits which characterizeAD patients.
The characterization of human brain’s intrinsic func-tional networks from resting-state BOLD fMRI datatherefore has the potential of defining functional con-nectivity markers that may follow the progression inneurodegenerative diseases, such as AD.
Currently there is only a little evidence that themarkers of resting state activity are sensitive to diseaseprogression. A progressive reduction of brain activityand connectivity in the regions of the DMN (namelythe hippocampus and PCC) seems the most consistent
finding among studies. These changes, however, havenever been investigated by ad hoc serial studies. Fur-thermore, currently other networks have been not beenfully investigated.
Class A markers
There are no serial studies which have investigatedresting-state brain activity.
Class B markers
Reduced activity in the DMN is the most consistentmarker among studies [88–92]. These studies showedsignificant reductions of resting-state activity in MCIwithin the hippocampus, PCC/precuneus and medialprefrontal cortex.
Class C markers
There is little evidence that brain activity of otherfunctional networks could provide markers of diseaseprogression: a single cross-sectional study carried onMCI subjects showed reduced activity in the atten-tion/executive network [92]. Currently there is nopublished study that has investigated the WMN. Otherpotential markers for disease progression could bedrawn by measures of increased activity/connectivitybetween parietal and frontal regions [93–95]. Thesestudies were carried out on AD patients only and sug-gest that patients may rely on increased prefrontalconnectivity to compensate for reduced temporal con-nectivity. A new class of functional markers might inthe future be obtained by measures of network small-worldness [96, 97].
Conclusions
The utility of resting-state activity and connectivityas markers for disease progression still needs to betested with longitudinal studies. Current data suggeststhat resting-state activity may be a useful marker forthe diagnosis [80].
DIFFUSION TENSOR IMAGING
As mentioned earlier AD is characterized by thedeposition of two toxic proteins which target spe-cific neuronal populations [75]. AD pathology spreadsfollowing a well established pattern [78] and thedamage is accompanied by worsening of specific clin-ical deficits [75]. Given that later-affected regions bear

172 V. Drago et al. / Disease Tracking Markers for AD at the Prodromal (MCI) Stage
Table 4fMRI markers of disease progression based on literature evidence of validity.
Marker N subjects & Time B-FU Results Technical notes Referencesdiagnosis
CLASS BDMN activity 41 HC; 28
MCI; 18 ADNA Reduced mPFC:
AD < MCI < HCprecuneus:AD < HC,MCI < HC
Single site, 1.5T studyVoxel = 3 × 3 × 5 mm3 TE = 60 msAxial orientation
Rombouts et al., 2005
DMN activity (HPsynchrony)
9 HC, 5 MCI10 AD
NA Reduced(AD < MCI < HC)
Single site 1.5T studyVoxel = 3.75 × 3.75 × 7 mm3
TR = 2 s, 6 min Sagital orientation
Li et al., 2002
CLASS CAttention/executive
network activity16 HC, 24
aMCINA Reduced Single site, 1.5T
Voxel = 3.125 × 3.125 × 4 mm3
TR = 3 s, 4 min Axial ACPCorientation
Sorg et al., 2007
Small world properties(clustering coefficient)
18 HC, 21mild AD
NA Reduced Single site, 3T studyVoxel = 3.75 × 3.75 × 4 mm3
TR = 2 s, 6 min Axial ACPCorientation
Supekar et al., 2008
Activity in frontal andparietal regions(connectivity betweenprefrontal-parietal)
13 HC, 13mild AD
NA Reduced Single site, 1.5TVoxel = 3.75 × 3.75 × 4mm3
TR = 2 s, 6 min Axial ACPCorientation
Wang, et al. 2007
Activity in frontal andparietal regions(frontal/prefrontal)
18 HC, 21mild AD
NA Increased Single site, 3T studyVoxel = 3.75 × 3.75 × 4mm3
TR = 2 s, 6 min Axial ACPCorientation
Supekar et al., 2008
Activity in frontal andparietal regions(connectivity withPCC)
16 HC, 16mild AD
NA Increased Single site, 1.5TVoxel = 3.75 × 3.75 × 6mm3
TR = 3 s, 5–6.27 min
Zhang et al., 2009
Activity in frontal andparietal regions(connectivity with HP)
14 HC, 14mild AD
NA Increased Single site, 1.5TVoxel = 3.75 × 3.75 × 4mm3
TR = 2 s, 6 min Axial ACPCorientation
Wang et al., 2006
AD: Alzheimer’s disease; aMCI: amnestic mild cognitive impairment; HC: healthy controls; DMN: default mode network; HP: hippocampus;PCC:poster cingulate cortex; ACPC: Anterior Commissure, Poterior Commissure.
known anatomical connections with the sites of ear-lier injury [77], the structural integrity of white matter(WM) tracts connecting these regions is thought to playsome role in the progression of this disease. It has beenposited that cognitive deficits may be related to the dis-ruption of functionally relevant tracts [98–100]. Thedisruption of the parahippocampus, which contain atract that connects the posterior cingulate-retrosplenialcortex (PCC/RSC) with the hippocampus, is thoughtto be responsible for the dissociation between func-tional/metabolic changes (which affect mainly thePCC/RSC) and structural abnormalities (which affectprimary the hippocampus and temporal lobe) foundin AD [80]. Post-mortem studies have shown WMchanges in AD in the form of atrophy, myelin attenua-tion, axonal loss, or reactive gliosis [101, 102], but spe-cific WM tracts have not been thoroughly investigated.
Diffusion Tensor Imaging (DTI) is a non-conventional MRI technique that allows the investi-gation of the integrity of WM tracts in vivo [103].This technique, by measuring the movement of watermolecules within tissues, is sensitive to tissue changesin pathological conditions. Commonly, two indexes areobtained from DTI: mean diffusivity (MD), which isa measure of overall water diffusion, and fractionalanisotropy (FA), which is a measure of overall tissueintegrity [104]. Two additional measures of WM dam-age can be obtained from DTI: axial (DA) and radial(DR) diffusivity. DA and DR seem more specific mark-ers than MD/FA of axonal loss and myelin damage[105], but to date these markers has not been usedextensively. Commonly used methods for DTI analysisare ROI-based analyses; tractography and automatedtract analysis.

V. Drago et al. / Disease Tracking Markers for AD at the Prodromal (MCI) Stage 173
Currently, there is some evidence from cross-sectional studies carried out on MCI patients that DTIchanges in the medial temporal lobe WM could providemarkers sensitive to disease progression. Specifically,DTI changes in the parahippocampal WM tract andin the hippocampus seem the most promising mark-ers. Another tract connecting to the temporal lobe, theposterior cingulum, provide some evidence of sensi-tivity in the detection of disease, whereas less specificmarkers such as temporal lobe WM provide low evi-dence. There is some evidence that diffusivity changesin the frontal WM follow disease progression. Specificcortico-cortical association tracts (inferior and supe-rior longitudinal fasciculus, inferior fronto-occipitalfasciculus) are promising markers because of theirassociation with cognitive functions however currentlythere are a paucity of studies assessing this possiblebiomarker. The genu and splenium of the corpus callo-sum, and motor cortex tracts do not seem valid markersof disease progression. Longitudinal changes in DAand DR indexes may provide more specific diseasemarkers in the future, but currently these markers haveonly been investigated in a limited number of cross-sectional studies [106–110].
Class A markers
Unfortunately, all the candidate markers have beeninvestigated on cross-sectional studies except for a sin-gle longitudinal study [111], thus none of the markerssatisfy criteria for inclusion in Class A.
Class B markers
(1) Multiple cross-sectional studies have consis-tently shown DTI changes (reduced FA orincreased MD) in the parahippocampal tract[112–115] and in the hippocampus [116–119]of MCI subjects. As these tracts are located inkey regions of AD pathology (medial temporallobe), they are good candidate markers to trackdisease progression.
(2) DTI changes in the posterior cingulum havebeen reported quite consistently in the majority[110, 113, 114, 120–123] but not all the studies[111, 112, 116]. Compared to the above markers,the posterior cingulum has the advantage thatmeasurement of this structure is more reliablethan that of the parahippocampal tract.
(3) One longitudinal study [111] and some cross-sectional studies [114, 119], but not all [116,
118, 124–126], reported a progressive decline inthe frontal WM in MCI subjects. The changes inthe frontal WM may therefore be valid candidatemarkers of disease progression.
(4) DTI changes in the fornix have been reportedinconsistently among studies [108, 110–112].This tract is relevant to AD as it is part of the lim-bic system; however its assessment suffers frommajor technical limitations due to CSF contam-ination [127].
(5) FA reduction and MD increases in the tem-poral lobe WM have been widely investigatedbut findings are inconsistent among studies:some studies reported significant changes [106,114, 118] whereas several others showed nodifference [116, 119, 124, 125, 128, 129]. Itis likely that investigating more specific tractsconnecting to the temporal lobe may providemore accurate markers of disease progression.Indeed, studies generally showed changes in theuncinate fasciculus [108, 110, 112], in the infe-rior [110, 119] and superior [108, 110, 119,121] longitudinal fasciculus, and in the inferiorfronto-occipital fasciculus [108, 110, 121].
(6) There is very low evidence that MD or FAchanges in the splenium [119, 125] and genu[120, 121, 128] of the corpus callosum, and cor-ticospinal tract [118, 119] may be markers fordisease progression. The majority of the stud-ies indeed reported no change in the splenium[111–113, 118, 124, 126] and genu [112, 113,118, 119, 124–126, 130] of the corpus callosum,or in the CST [ 111, 113, 123].
(7) There is increasing evidence that DA and DRmay be more sensitive to WM changes than MDand FA, especially in the temporal lobe WM.
(8) Diffusivity changes in the cerebellum [112],thalamus [114], entorhinal cortex [114], andsubventricular zone [131] have been investi-gated by single studies.
Class C markers
Future DTI markers may be obtained by analysis ofWM tracts shape and deformation [132].
Conclusions
DTI changes in the WM tracts of the medial tem-poral lobe (parahippocampus and posterior cingulum)and hippocampus seem promising markers for disease

174V.D
ragoetal./D
iseaseTracking
Markers
forA
Datthe
Prodrom
al(MC
I)Stage
Table 5DTI markers of disease progression based on literature evidence of validity
Marker N subjects Time between Results Technical Referencesand diagnosis baseline and notes
follow-up
Class BPARAHIP-
POCAMPUS(FA)
HC 19, MCI 27, AD 17 NA Reduced (MCI < C; AD < C) 1.5T, 8-channel coil, (1.72 × 1.72 × 5)mm3,TE/TR = 98/5000 ms, 1b0, b = 1000, 30 dir, 2 : 53 min
Liu et al., Neurob Aging 2009
(FA, MD) HC 18, MCI 17, AD 17 NA Reduced FA (MCI < C; AD < C)Increased MD (MCI > C; AD > C)
1.5T, IR-EPI, TE/TR/TI = 100/6000/2000 ms,(2.34 × 2.34 × 5)mm3, 1b0, b = 1000, 6 dir,
Zhang et al., Neurology 2007
(FA) HC 17, aMCI 17 NA Reduced 1.5T, (1.8 × 1.8 × 2.5)mm3, TE/TR = 106/6000 ms,16b0, b = 1100, 44 dir, 8 min
Rose et al., JNNP 2006
(FA) HC 10, MCI 10, AD 10 NA Reduced (MCI < C; AD < C) 1.5T, 6 dir, TE/TR = 87/2000 ms,(3.3 × 2.5 × 2.5)mm3,1b0, b = 1200
Kalus et al., Neuroimage 2006
HIPPOCAMPUS(MD: ADC)
HC 55, MCI 19, AD 21 NA Increased (MCI > C; AD > C) 1.5T, FLAIR-DTI, 3 dir, 1b0, b = 1000;TR/TE = 9999/93 ms; 5 mm coronal
Kantarci et al., Radiology2001
(FA, MD) HC 18, aMCI 18 NA Reduced FAIncreased MD
1.5T, 6 dir, TE/TR = 100/8000 ms,(1.8 × 1.8 × 5)mm3,1b0, b = 900
Muller et al., Neuroimage2005
(MD) HC 10, MCI 14, AD 19 NA Increased (MCI > C; AD > C) 1.5T, 6 dir, NA = 4, TE/TR = 100/8000 ms,(1.8 × 1.8 × 5)mm3,1b0, b = 900
Fellgiebel et al., Dem GeriatrCogn Dis 2004
(FA, MD) HC, MCI 11 NA Reduced FA Increased MD 1.5T, 25 dir, TE/TR = 78/10000 ms,(2 × 2 × 4)mm3,1b0, b = 1000
Cho et al., J Korean Med Sci2008
POSTERIORCINGULUM(FA)
HC 25, aMCI 25, AD 25 3 M Longitudinal: unchangedCross-sectional: unchanged
(AD < C at baseline and follow-up)
3T, 6-channel RF coil, TE/TR = 80/7000 ms; 32 dir,b = 700, 5 b0 = 33;(2.2 × 2.2 × 2.2)mm3;SENSE = 2.5; ACPC, NA = 2,7 min
Mielke et al., Neuroimage2009
(FA, DA, DR) HC 26, MCI/SCI-tau- 12,MCI/SCI-tau + 35
NA Unchanged DAReduced FA: MCI-tau+<C,
MCI-tau+<MCI-tau-Increased DR: MCI-tau+>C,
MCI-tau+>MCI-tau-FA and DR correlated with CSF-tau
levels
Scan1 : 1.5T, (1.8 × 1.8 × 5)mm3,TE/TR = 131/4300 ms, 2b0, b = 1100, 12 dir,Scan2 : 1.5T, (1.2 × 1.2 × 3)mm3,TE/TR = 117/6100 ms, 5b0, b = 750, 12 dir,
Stenset et al., Neurob Aging2009
(FA) HC 19, MCI 27, AD 17 NA Unchanged (AD < C; AD < MCI) 1.5T, 8-channel coil, (1.72 × 1.72 × 5)mm3,TE/TR = 98/5000 ms, 1b0, b = 1000, 30 dir, 2 : 53 min
Liu et al., Neurob Aging 2009
(FA) HC 22, aMCI 22 NA Reduced FA correlated with MMSE 1.5T, EPI (AC-PC plane), TE/TR = 81.2/10000 ms,(1.88 × 1.88 × 4)mm3, 1b0, b = 1000, 25 dir,
Bai et al., J Neurol Sci 2009
(MD: ADC) HC 55, MCI 19, AD 21 NA Unchanged (AD > C) 1.5T, FLAIR-DTI, 3 dir, 1b0, b = 1000;TR/TE = 9999/93 ms; 5 mm coronal
Kantarci et al., Radiology2001
(FA, MD) HC 21, aMCI 17, AD 25 NA Reduced FA (aMCI < C; AD < C)Increased MD (aMCI > C; AD > C)
1.5T, 6 dir, NA = 4, TE/TR = 100/8000 ms,(1.8 × 1.8 × 5)mm3,1b0, b = 900
Fellgiebel et al., NeurobAging 2005
(FA, MD) HC 18, MCI 17, AD 17 NA Reduced FA (AD < MCI < C)Increased MD (AD > MCI > C)
1.5T, IR-EPI, TE/TR/TI = 100/6000/2000 ms,(2.34 × 2.34 × 5)mm3, 1b0, b = 1000, 6 dir,
Zhang et al., Neurology 2007
(FA) HC 17, aMCI 17 NA Reduced 1.5T, (1.8 × 1.8 × 2.5)mm3, TE/TR = 106/6000 ms,16b0, b = 1100, 44 dir, 8 min
Rose et al., JNNP 2006

V.Drago
etal./Disease
TrackingM
arkersfor
AD
attheP
rodromal(M
CI)
Stage175
(FA, MD: ADC) HC 16, MCI 16, AD 17 NA Reduced FA (MCI < C; AD < C)Increased ADC (MCI > C; AD > C)
1.5T, b = 1000, 6 dir, (1.8 × 1.8 × 3)mm3,NA = 6,TE/TR = 85/4900 ms,
Kiuchi et al., Brain Res 2009
(FA, MD, DA,DR)
HC 15, aMCI 16, AD 15 NA Increased MD, DR (aMCI > C,AD > C)
Unchanged FA (AD < C)Unchanged DA (AD > C)
3T, (1.22 × 1.22 × 2)mm3, TE/TR = 89/5600 ms, 30 dir,1b0
Bosch et al., Neurob Aging2010
FRONTAL WM(FA)
HC 25, aMCI 25, AD 25 3 M Reduced 3T, 6-channel RF coil, TE/TR = 80/7000 ms; 32 dir,b = 700, 5 b0 = 33;(2.2 × 2.2 × 2.2)mm3;SENSE = 2.5; ACPC, NA = 2,7 min
Mielke et al., Neuroimage2009
(MD: ADC) HC 55, MCI 19, AD 21 NA Unchanged 1.5T, FLAIR-DTI, 3 dir, 1b0, b = 1000;TR/TE = 9999/93 ms; 5 mm coronal
Kantarci et al., Radiology2001
(MD) HC 17, aMCI 17 NA Increased 1.5T, (1.8 × 1.8 × 2.5)mm3, TE/TR = 106/6000 ms,16b0, b = 1100, 44 dir, 8 min
Rose et al., JNNP 2006
(FA, MD: ADC) HC 19, MCI 16, AD 15 NA Unchanged 1.5T, 8-channel coil, GRAPPA (AF = 3), 10 averages,b = 1000, 6 dir, TE/TR = 71/6000 ms,1.8 × 1.8.3.6mm3, 7 : 44 min
Stahl et al., Radiology 2007
(FA) HC 18, MCI 15, AD 14 NA Unchanged 1.5T, 1b0, b = 1000, 32 dir, TE/TR = 92/7895 ms,5 : 00 min
Ukmar et al., Radiol Med2008
(FA, MD) HC 10, MCI 14, AD 19 NA Unchanged 1.5T, 6 dir, NA = 4, TE/TR = 100/8000 ms,(1.8 × 1.8 × 5)mm3,1b0, b = 900
Fellgiebel et al., Dem GeriatrCogn Dis 2004
(FA, MD) HC 11, MCI 11 NA Increased MD Unchanged FA 1.5T, 25 dir, TE/TR = 78/10000 ms,(2 × 2 × 4)mm3,1b0, b = 1000
Cho et al., J Korean Med Sci2008
(MD) HC 20, aMCI 10, AD 30 NA Unchanged (AD > C) 1.5T; 25 dir; b = 1000; NEX = 2;ACPC; 1 b0;(1.875 × 1.875 × 5)mm3, 5 min40 sec
Chen et al., Psych Res 2009
FORNIX (FA) HC 25, MCI1(CDR-SB < 1) 12,MCI2 (CDR-SB > 1.5)13, AD 25
3 M Longitudinal: unchangedCross-sectional: reduced(MCI2 < C at follow-up; AD < C at
baseline and follow-up)
3T, 6-channel RF coil, TE/TR = 80/7000 ms; 32 dir,b = 700, 5 b0 = 33;(2.2 × 2.2 × 2.2)mm3;SENSE = 2.5; ACPC, NA = 2;7 min
Mielke et al., Neuroimage2009
(FA) HC 19, MCI 27, AD 17 NA Unchanged (AD < C; AD < MCI) 1.5T, 8-channel coil, (1.72 × 1.72 × 5)mm3,TE/TR = 98/5000 ms, 1b0, b = 1000, 30 dir, 2 : 53 min
Liu et al., Neurob Aging 2009
(FA, MD, DA,DR)
HC 15, aMCI 19, AD 25 NA Unchanged MD, DAUnchanged FA (AD < C)Increased DR (aMCI > C, AD > C)
1.5T, PGSE-EPI (1.88 × 1.88 × 2.5)mm3,TE/TR = 95/6500 ms, 1b0, b = 1000, 12 dir, 8 averages
Pievani et al., Hum BrainMap 2010
(FA, MD, DA,DR)
HC 15, aMCI 16, AD 15 NA Increased MD (aMCI > C, AD > C) 3T, (1.22 × 1.22 × 2)mm3, TE/TR = 89/5600 ms, 30 dir,1b0
Bosch et al., Neurob Aging2010
TEMPORAL WM(MD: ADC,temporal stem)
HC 55, MCI 19, AD 21 NA Unchanged (AD > C) 1.5T, FLAIR-DTI, 3 dir, 1b0, b = 1000;TR/TE = 9999/93 ms; 5 mm coronal
Kantarci et al., Radiology2001
(FA) HC 17, aMCI 17 NA Reduced 1.5T, (1.8 × 1.8 × 2.5)mm3, TE/TR = 106/6000 ms,16b0, b = 1100, 44 dir, 8 min
Rose et al., JNNP 2006
(FA, MD: ADC) HC 19, MCI 16, AD 15 NA Unchanged 1.5T, 8-channel coil, GRAPPA (AF = 3), 10 averages,b = 1000, 6 dir, TE/TR = 71/6000 ms,1.8 × 1.8.3.6mm3, 7 : 44 min
Stahl et al., Radiology 2007
(FA) HC 18, MCI 15, AD 14 NA Unchanged 1.5T, 1b0, b = 1000, 32 dir, TE/TR = 92/7895 ms,5 : 00 min
Ukmar et al., Radiol Med2008

176V.D
ragoetal./D
iseaseTracking
Markers
forA
Datthe
Prodrom
al(MC
I)Stage
Table 5(Continued)
Marker N of subjects Time between Results Technical Referencesand diagnosis baseline and notes
follow-up
(MD) HC 10, MCI 14, AD 19 NA Increased (MCI > C; AD > C) 1.5T, 6 dir, NA = 4, TE/TR = 100/8000 ms,(1.8 × 1.8 × 5)mm3,1b0, b = 900
Fellgiebel et al., Dem GeriatrCogn Dis 2004
(FA) HC 16, aMCI 13, AD 11 NA Unchanged 1.5T; 25 dir; b = 1000; NEX = 2;ACPC; 1 b0;(1.875 × 1.875 × 5)mm3, 5 min40 sec
Chen et al., HBM 2009
(FA, DA, DR) HC 8, MCI 11, AD 6 NA Reduced FA (AD < MCI < C)Reduced DA (MCI < C; AD < C)Unchanged DR (AD > C)
1.5T,12 dir, 2b0, b = 1000, 7 : 06 min,(1.875 × 1.875 × 3)mm3, TE/TR = 109/8000 ms,
Huang et al., AJNR 2007
(FA, MD) HC 11, MCI 11 NA Unchanged 1.5T, 25 dir, TE/TR = 78/10000 ms,(2 × 2 × 4)mm3,1b0, b = 1000
Cho et al., J Korean Med Sci2008
(FA) HC 8, MCI 8, AD 16 NA Unchanged (AD < C) 1.5T, TE/TR = 86/8500 ms, 23mm3,60 dir, b = 700,10b0,
Damoiseaux et al., HBM 2009
UNCINATE (FA) HC 19, MCI 27, AD 17 NA Reduced (AD < MCI < C) 1.5T, 8-channel coil, (1.72 × 1.72 × 5)mm3,TE/TR = 98/5000 ms, 1b0, b = 1000, 30 dir, 2 : 53 min
Liu et al., Neurob Aging 2009
(FA, MD, DA,DR)
HC 15, aMCI 19, AD 25 NA Increased DA (aMCI > C, AD > C)Unchanged FAUnchanged MD (AD > C)Unchanged DR
1.5T, PGSE-EPI (1.88 × 1.88 × 2.5)mm3,TE/TR = 95/6500 ms, 1b0, b = 1000, 12 dir, 8 averages
Pievani et al., Hum BrainMap 2010
(FA and MD:ADC)
HC 16, MCI 16, AD 17 NA Unchanged FA (AD < C)Unchanged MD (AD > C)
1.5T, b = 1000, 6 dir, (1.8 × 1.8 × 3)mm3, NA = 6,TE/TR = 85/4900ms
Kiuchi et al., Brain Res 2009
(FA, MD, DA,DR)
HC 15, aMCI 16, AD 15 NA Increased MD (aMCI > C, AD > C)Increased DR (aMCI > C, AD > C)Unchanged FA (AD < C)Unchanged DA (AD > C)
3T, (1.22 × 1.22 × 2)mm3, TE/TR = 89/5600 ms, 30 dir,1b0
Bosch et al., Neurob Aging2010
SUPERIOR LON-GITUDINALFASCICULUS(FA)
HC 22, aMCI 22 NA Reduced Correlated with TMT A andB
1.5T, EPI (AC-PC plane), TE/TR = 81.2/10000 ms,(1.88 × 1.88 × 4)mm3, 1b0, b = 1000, 25 dir,
Bai et al., J Neurol Sci 2009
(FA, MD, DA,DR)
HC 15, aMCI 19, AD 25 NA Increased DA (aMCI > C, AD > C)Unchanged FAUnchanged MD (AD > C)Unchanged DR
1.5T, PGSE-EPI (1.88 × 1.88 × 2.5)mm3,TE/TR = 95/6500 ms, 1b0, b = 1000, 12 dir, 8 averages
Pievani et al., Hum BrainMap 2010
(FA, MD, DA,DR)
HC 15, aMCI 16, AD 15 NA Increased MD (aMCI > C, AD > C)Increased DR (aMCI > C, AD > C)Unchanged FA (AD < C)Unchanged DA (AD > C)
3T, (1.22 × 1.22 × 2)mm3, TE/TR = 89/5600 ms, 30 dir,1b0
Bosch et al., Neurob Aging2010
(FA, MD) HC 11, MCI 11 NA Reduced FAIncreased MD
1.5T, 25 dir, TE/TR = 78/10000 ms,(2 × 2 × 4)mm3,1b0, b = 1000
Cho et al., J Korean Med Sci2008
INFERIOR LON-GITUDINALFASCICULUS(FA, MD, DA,DR)
HC 15, aMCI 19, AD 25 NA Unchanged FAUnchanged MD (AD > C)Unchanged DA, DR (AD > C)
1.5T, PGSE-EPI (1.88 × 1.88 × 2.5)mm3,TE/TR = 95/6500 ms, 1b0, b = 1000, 12 dir, 8 averages
Pievani et al., Hum BrainMap 2010

V.Drago
etal./Disease
TrackingM
arkersfor
AD
attheP
rodromal(M
CI)
Stage177
(FA, MD, DA,DR)
HC 15, aMCI 16, AD 15 NA Increased DR (aMCI > C, AD > C)Unchanged FA (AD < C)Unchanged DA (AD > C)Unchanged MD (AD > C)
3T, (1.22 × 1.22 × 2)mm3, TE/TR = 89/5600 ms, 30 dir,1b0
Bosch et al., Neurob Aging2010
(FA, MD) HC 11, MCI 11 NA Reduced FAIncreased MD
1.5T, 25 dir, TE/TR = 78/10000 ms,(2 × 2 × 4)mm3,1b0, b = 1000
Cho et al., J Korean Med Sci2008
INFERIORFRONTOOCCIPITAL(FA, DA,DR)
HC 15, aMCI 19, AD 25 NA Increased DA (aMCI > C, AD > C)Unchanged FA, MDUnchanged DR
1.5T, PGSE-EPI (1.88 × 1.88 × 2.5)mm3,TE/TR = 95/6500 ms, 1b0, b = 1000, 12 dir, 8 averages
Pievani et al., Hum BrainMap 2010
(FA) HC 22, aMCI 22 NA Reduced 1.5T, EPI (AC-PC plane), TE/TR = 81.2/10000 ms,(1.88 × 1.88 × 4)mm3, 1b0, b = 1000, 25 dir,
Bai et al., J Neurol Sci 2009
(FA, MD, DA,DR)
HC 15, aMCI 16, AD 15 NA Increased MD (aMCI > C, AD > C)Increased DR (aMCI > C, AD > C)Unchanged FA (AD < C)Unchanged DA (AD > C)
3T, (1.22 × 1.22 × 2)mm3, TE/TR = 89/5600 ms, 30 dir,1b0
Bosch et al., Neurob Aging2010
SPLENIUM OFCC (FA)
HC 25, aMCI 25, AD 25 3 M Longitudinal: unchangedCross-sectional: unchanged
(AD < aMCI at baseline)
3T, 6-channel RF coil, TE/TR = 80/7000 ms; 32 dir,b = 700, 5 b0 = 33;(2.2 × 2.2 × 2.2)mm3;SENSE = 2.5; ACPC, NA = 2,7 min
Mielke et al., Neuroimage2009
(FA) HC 19, MCI 27, AD 17 NA Unchanged (AD < C; AD < MCI) 1.5T, 8-channel coil, (1.72 × 1.72 × 5)mm3,TE/TR = 98/5000 ms, 1b0, b = 1000, 30 dir, 2 : 53 min
Liu et al., Neurob Aging 2009
(FA, MD) HC 18, MCI 17, AD 17 NA Unchanged FA (AD < C; AD < MCI)Unchanged MD
1.5T, IR-EPI, TE/TR/TI = 100/6000/2000 ms,(2.34 × 2.34 × 5)mm3, 1b0, b = 1000, 6 dir,
Zhang et al., Neurology 2007
(FA, MD: ADC) HC 19, MCI 16, AD 15 NA Unchanged FA (AD < MCI)Unchanged MD
1.5T, 8-channel coil, GRAPPA (AF = 3), 10 averages,b = 1000, 6 dir, TE/TR = 71/6000 ms,1.8 × 1.8.3.6mm3, 7 : 44 min
Stahl et al., Radiology 2007
(FA) HC 18, MCI 15, AD 14 NA Reduced (MCI < C; AD < C) 1.5T, 1b0, b = 1000, 32 dir, TE/TR = 92/7895 ms,5 : 00 min
Ukmar et al., Radiol Med2008
(FA, MD) HC 10, MCI 14, AD 19 NA Unchanged 1.5T, 6 dir, NA = 4, TE/TR = 100/8000 ms,(1.8 × 1.8 × 5)mm3,1b0, b = 900
Fellgiebel et al., Dem GeriatrCogn Dis 2004
(FA, MD) HC 11, MCI 11 NA Reduced FAIncreased MD
1.5T, 25 dir, TE/TR = 78/10000 ms,(2 × 2 × 4)mm3,1b0, b = 1000
Cho et al., J Korean Med Sci2008
(FA, MD) HC 20, aMCI 10, AD 30 NA Unchanged FA (AD < C)Unchanged MD (AD > C)
1.5T; 25 dir; b = 1000; NEX = 2;ACPC; 1 b0;(1.875 × 1.875 × 5)mm3, 5 min40 sec
Chen et al., Psych Res 2009
GENU OF CC(FA, DA, DR)
HC 26, MCI/SCI tau- 12,MCI/SCI tau + 35
NA Reduced FA (MCI/SCI tau+<C)Increased DR (MCI/SCI tau+>C)Unchanged DA
Scan1 : 1.5T, (1.8 × 1.8 × 5)mm3,TE/TR = 131/4300 ms, 2b0, b = 1100, 12 dir,Scan2 : 1.5T, (1.2 × 1.2 × 3)mm3,TE/TR = 117/6100 ms, 5b0, b = 750, 12 dir,
Stenset et al., Neurob Aging2009
(FA, DA, DR) HC 40, MCI 38, AD 38 NA Unchanged (FA: AD < C, DR:AD > C)
3T, (1.8 × 1.8 × 1.8)mm3, TE/TR = 89/8500 ms, 6b0,b = 1000, 30 dir, 3 averages
Di Paola et al., Neurology2010
(FA) HC 19, MCI 27, AD 17 NA Unchanged (AD < C; AD < MCI) 1.5T, 8-channel coil, (1.72 × 1.72 × 5)mm3,TE/TR = 98/5000 ms, 1b0, b = 1000, 30 dir, 2 : 53 min
Liu et al., Neurob Aging 2009

178V.D
ragoetal./D
iseaseTracking
Markers
forA
Datthe
Prodrom
al(MC
I)Stage
Table 5(Continued)
Marker N of subjects Time between Results Technical Referencesand diagnosis baseline and notes
follow-up
(FA) HC 22, aMCI 22 NA Reduced 1.5T, EPI (AC-PC plane), TE/TR = 81.2/10000 ms,(1.88 × 1.88 × 4)mm3, 1b0, b = 1000, 25 dir,
Bai et al., J Neurol Sci 2009
(FA, MD) HC 18, MCI 17, AD 17 NA Unchanged 1.5T, IR-EPI, TE/TR/TI = 100/6000/2000 ms,(2.34 × 2.34 × 5)mm3, 1b0, b = 1000, 6 dir,
Zhang et al., Neurology 2007
(FA, MD: ADC) HC 19, MCI 16, AD 15 NA Unchanged 1.5T, 8-channel coil, GRAPPA (AF = 3), 10 averages,b = 1000, 6 dir, TE/TR = 71/6000 ms,1.8 × 1.8.3.6mm3, 7 : 44 min
Stahl et al., Radiology 2007
(FA) HC 18, MCI 15, AD 14 NA Unchanged (AD < C) 1.5T, 1b0, b = 1000, 32 dir, TE/TR = 92/7895 ms,5 : 00 min
Ukmar et al., Radiol Med2008
(FA, MD) HC 10, MCI 14, AD 19 NA Unchanged 1.5T, 6 dir, NA = 4, TE/TR = 100/8000 ms,(1.8 × 1.8 × 5)mm3,1b0, b = 900
Fellgiebel et al., Dem GeriatrCogn Dis 2004
(FA, MD) HC 16, aMCI 13, AD 11 NA Unchanged FA (AD < C)Increased MD (MCI > C; AD > C)
1.5T; 25 dir; b = 1000; NEX = 2;ACPC; 1 b0;(1.875 × 1.875 × 5)mm3, 5 min40 sec
Chen et al., HBM 2009
(FA, MD) HC 11, MCI 11 NA Unchanged 1.5T, 25 dir, TE/TR = 78/10000 ms,(2 × 2 × 4)mm3,1b0, b = 1000
Cho et al., J Korean Med Sci2008
(FA, MD) HC 20, aMCI 10, AD 30 NA Unchanged (AD > C) 1.5T; 25 dir; b = 1000; NEX = 2;ACPC; 1 b0;(1.875 × 1.875 × 5)mm3, 5 min40 sec
Chen et al., Psych Res 2009
CORTICOSPINALTRACT (FA,cerebralpeduncles)
HC 25, aMCI 25, AD 25 3 M Unchanged 3T, 6-channel RF coil, TE/TR = 80/7000 ms; 32 dir,b = 700, 5 b0 = 33;(2.2 × 2.2 × 2.2)mm3;SENSE = 2.5; ACPC, NA = 2,7 min
Mielke et al., Neuroimage2009
(FA, MD, internalcapsule)
HC, MCI 17, AD 17 NA Unchanged 1.5T, IR-EPI, TE/TR/TI = 100/6000/2000 ms,(2.34 × 2.34 × 5)mm3, 1b0, b = 1000, 6 dir,
Zhang et al., Neurology 2007
(FA, MD: ADC) HC 16, MCI 16, AD 17 NA Unchanged 1.5T, b = 1000, 6 dir, (1.8 × 1.8 × 3)mm3, NA = 6,TE/TR = 85/4900ms
Kiuchi et al., Brain Res 2009
(FA, MD centrumsemiovale)
HC 10, MCI 14, AD 19 NA Unchanged FAIncreased MD (MCI > C; AD > C)
1.5T, 6 dir, NA = 4, TE/TR = 100/8000 ms,(1.8 × 1.8 × 5)mm3,1b0, b = 900
Fellgiebel et al., Dem GeriatrCogn Dis 2004
(FA, MD internalcapsule)
HC 11, MCI 11 NA Reduced FAIncreased MD
1.5T, 25 dir, TE/TR = 78/10000 ms,(2 × 2 × 4)mm3,1b0, b = 1000
Cho et al., J Korean Med Sci2008
CEREBELLUM(FA)
HC 19, MCI 27, AD 17 NA Reduced (AD < MCI < C) 1.5T, 8-channel coil, (1.72 × 1.72 × 5)mm3,TE/TR = 98/5000 ms, 1b0, b = 1000, 30 dir, 2 : 53 min
Liu et al., Neurob Aging 2009
Entorhinal cortex(MD)
HC 17, aMCI 17 NA Increased 1.5T, (1.8 × 1.8 × 2.5)mm3, TE/TR = 106/6000 ms,16b0, b = 1100, 44 dir, 8 min
Rose et al., JNNP 2006
Thalamus (MD) HC 17, aMCI 17 NA Increased 1.5T, (1.8 × 1.8 × 2.5)mm3, TE/TR = 106/6000 ms,16b0, b = 1100, 44 dir, 8 min
Rose et al., JNNP 2006
Subventricularzone (MD)
HC 30, aMCI 30, AD 30 NA Increased (AD > aMCI > C) 3T, TE/TR = 89/500 ms; (1.5 × 1.5 × 2)mm3, 2b0,b = 1000, 12 dir, 3averages
Cherubini et al., Neurosci Lett2010
CLASS CCingulum shape
(MD)HC 19, AD 13 NA Shape compression 3T, SENSE with reduction fctor = 2.5,
TE/TR = 71/6112 ms; (2.2 × 2.2 × 2.2)mm3, 60 slicesparallel to AC-PC, 5b0, b = 700, 30
Qiu et al., Plos One 2010

V. Drago et al. / Disease Tracking Markers for AD at the Prodromal (MCI) Stage 179
progression. Given the technical difficulties related toparahippocampal assessment, the posterior cingulumand hippocampus may be the best candidate marker totrack the disease. Their validity however needs to beconfirmed by serial studies.
BETA-AMYLOID POSITRON EMISSIONTOMOGRAPHY (PET) IMAGING
A definite diagnosis of Alzheimer’s dementia (AD)is based on post-mortem identification of extracellu-lar beta- amyloid plaques and intraneuronal fibrillarytangles. Formation of neuritic plaques by beta-amyloiddeposits is thought to play a major role in the patho-physiology of AD, and several therapeutic agentsintended to remove or prevent the build-up of beta-amyloid deposits are currently in clinical development.Recent development of positron emission tomogra-phy (PET) ligands for detection of beta amyloid inpatients has provided a new potential for the diagnosisof AD during lifetime. In addition, this imaging methodmay allow investigators and clinicians to monitor dis-ease progression or regression with new treatments.When searching for a biological marker of AD amyloidimaging could hopefully replace invasive proceduressuch as lumbar puncture. There is very active researchinvestigating molecules labelled with radioactive iso-topes that might enter the brain, bind selectivelyto �-amyloid, be visualised with PET scanners andanalysed with PET imaging tools, enabling in vivoquantification of beta-amyloid plaque load in AD [133,134].
Currently, the compound at the most advanced stageof validation is the Pittsburgh compound B (PIB),a carbon-11-labelled benzothiazole derivative, whichhas been recently shown to provide information as reli-able as CSF A� 42 [135]. More than 3000 subjects at 40centers have been examined with C11-PIB [136]. Fromquantitative image evaluation a cut-off and simplifiedrating of PIB-negative vs PIB-positive has been devel-oped to facilitate the use of PIB as a diagnostic markerfor the presence of AD [137]. As C11-PIB availabilityis limited by the need for an on-site cyclotron, a (18)F-labeled PIB derivative named (18)F-flutemetamol hasrecently been developed; (18)F-Flutemetamol wasshown to perform similarly to the (11)C-PIB parentmolecule within the same cohort of AD, MCI patientsand normal control subjects, with potentially muchwider accessibility for clinical and research use [138].
Another promising radioligand applicable to imag-ing beta-amyloid plaques in living human brains withPET is [(18)F]FDDNP. The results using this tech-nique has been found to be strongly correlated withcognitive performance, especially in regions deterio-rating earliest in AD, suggesting the potential utility of[(18)F]FDDNP for early diagnosis [139]. The advan-tage of this compound is that it binds to both plaquesand tangles [140].
More recently, new F-18-labeled Abeta ligands havebeen identified. The first one is (18)F-BAY94-9172(Florbetaben), whose binding was reported to matchthe reported post-mortem distribution of Abeta plaquesin AD [141]; (18)F-GE067 was recently tested ona cohort of healthy elderly human subjects [142];18F-AV-45 (Florbetapir) was found to accumulate incortical regions expected to be high in A� deposition[143], was shown to be correlated with the presence anddensity of �-amyloid at histopathology [144] and wasshown to be easily synthetized under GMP-compliantconditions, with potentially wide availability for rou-tine clinical use [145, 146]; AZD4694 was recentlycharacterized [147] and preliminarily validated in twosmall clinical cohorts [148, 149]. Other F18-amyloidimaging radioligands are under development, currentlyat a preclinical validation step [150, 151] and couldpotentially facilitate integration of beta amyloid imag-ing into clinical practice.
Amyloid imaging as marker of disease progression.A number of markers based on amyloid PET imaginghave been used to track the progression of Alzheimer’sdisease. Longitudinal studies with repeated amyloidPET scanning are limited, and only two of theminvolved MCI patients [152, 153]. The other studieshave been cross-sectional.
Class A marker
Global indexMost amyloid imaging studies use a global index
of radioligand uptake. In these studies there is nota single global index, but rather a variety of differ-ent indexes have been reported. Most of them arecomputed as global cortical standardized uptake valueratios (SUVR) with averages on a specific set of regions(e.g., weighted average of prefrontal, orbitofrontal,parietal, temporal, anterior cingulate and posteriorcingulate/precuneus ratio values [152], average ofthe area-weighted mean for frontal, superior pari-etal, lateral temporal, lateral occipital and anterior and

180 V. Drago et al. / Disease Tracking Markers for AD at the Prodromal (MCI) Stage
posterior cingulated [141, 153, 154], volume-weightedaverage of frontal, parietal, temporal cortices, medial-temporal lobe and posterior cingulate gyrus, averageof the medial frontal, lateral frontal, temporal, pari-etal cortices and the posterior cingulate gyrus [155],and overall cortical average [143]. Other indexes arecomputed from the relative distribution volume (DVR)images, as average DVR in parietal, medial temporal,lateral temporal, posterior cingulate and frontal regions[156] or overall average DVR. There is a longitudinalstudy by Jack and colleagues assessing the global indexchange in MCI [152]. These investigators reported thatthe annual change in global PIB retention in patientswith MCI did not differ from the change observed inNC, although small was greater than zero among allsubjects. Another study shows that 2-years change inPIB retention in AD was not significantly differentfrom the change in NC [155]. Recently, a large lon-gitudinal study showed that A� deposition increasesslowly and continuously from cognitive normality tomoderately severe AD [153].
Cross-sectional studies have revealed that globalcortical PIB binding in MCI is significantly higher thanin NC, and significantly lower than in AD [154, 157].Contradictory results, however, were reported whenusing the FDDNP radioligand to assess global cor-tical binding in MCI. Whereas in one study bindingwas found to be significantly different from both ADand NC [156], in another study binding in MCI wasnot different from either AD or NC [157]. A recentstudy involving the novel radioligand AV-45 showedsignificant differences between AD and NC [143].
Class B marker
Mean uptake in single ROIs (frontalcortex/parietal cortex/temporal cortex/posteriorcingulate and precuneus)
Several cross-sectional studies involving partici-pants with MCI analyzed the mean uptake in singleROIs. For each of the following ROIs – frontal cortex,parietal cortex, temporal cortex, posterior cingulateand precuneus, mean uptake in MCI was found to besignificantly higher in participants with MCI than inNC (for both PIB [158, 159] and FDDNP [156]), andmean uptake in subjects with MCI was found to besignificantly lower than in patients with AD (for bothPIB [158] and FDDNP [156]). In those regions, meanAV-45 uptake in NC was significantly lower than inAD [143].
Class C marker
Mean uptake in single ROIs (anterior cingulate/putamen/caudate/striatum/occipital cortex)
There is a single study showing that PIB uptake inputamen and caudate in MCI is significantly higherthan in NC [159]. Two other studies showed that PIBuptake in the caudate [155] and striatum [160] in NCwas significant lower than in patients with AD.
There is a single cross sectional study showing thatPIB uptake in the occipital cortex of patients withAD is significantly higher than in NC [160]. There isalso a single study showing that FDDNP uptake in themedial temporal lobe in patients with MCI is signif-icantly higher than in NC [156, 161]. Another recentstudy showed that FDDNP uptake in the medial tem-poral lobe in NC is significant lower than in AD [140].The same study, in which both PIB-PET and FDDNP-PET were performed, shows that FDDNP uptake issignificant lower in NC than in AD both in inferior tem-poral and visual cortex [140], suggesting that FDDNPcould be more sensitive than PIB for investigating AD-related regional pathology.
Conclusion
In vivo imaging with beta amyloid PET-ligandsprovides clinicians and investigators the ability to visu-alize, localize (in specific regions) and quantify brainbeta amyloid deposition in relation to disease severity.
Longitudinal change of beta amyloid load in MCIpatients has been first addressed using an amyloid PETligand in a study showing no significant increase inbeta-amyloid burden during one year. However, sev-eral cross-sectional studies have indicated that betaamyloid load generally is lower in MCI patients ascompared to AD patients, and higher in MCI patientsas compared to healthy controls, suggesting the needfor further investigations. A recent longitudinal studyover longer (2 to 3 years) period of time showed thatA� deposition increases slowly and continuously fromcognitive normality to moderate Alzheimer’s disease,providing first evidence to the potential value of changein beta amyloid load as a marker of disease progression.
RESTING EEG
Since its introduction by Hans Berger in 1924, theelectroencephalogram (EEG) has been viewed withgreat enthusiasm as the only methodology allowinga direct, on-line view of the “brain at work” [162].

V. Drago et al. / Disease Tracking Markers for AD at the Prodromal (MCI) Stage 181
Table 6PET markers of disease progression based on literature evidence of validity
Marker Ligand N subjects and Time B-FU Results Referencesdiagnosis
Class AGlobal index 11C-PIB 106 HC, 65 MCI,
35 AD20 ± 3 months,
3 years(subgroup)
PIB uptake increases slowly and continuouslyfrom NC to moderately severe AD
Villemagne et al.,2011
11C-PIB 21 HC, 32aMCI,8 AD
Mean of 1 year The annual change in global PIB retention didnot differ by clinical group
Jack et al., 2009
11C-PIB 32 HC, 33 MCI,31 AD
Cross-sectionalstudy
neocortical PIB binding NC < MCI < AD Pike et al., 2007
Class BUptake in the
frontal cortex11C-PIB 6 HC, 21 MCI,
27 ADCross-sectional
studyPIB retention: MCI < AD Forsberg et al.,
200811C-PIB 14 HC, 13 aMCI Cross-sectional
study[11C]PIB uptake: MCI > NC Kemppainen et al.,
2007Uptake in the
parietal cortex11C-PIB 6 HC, 21 MCI,
27 ADCross-sectional
studyPIB retention: MCI < AD in the parietal cortex Forsberg et al.,
200811C-PIB 14 HC, 13 aMCI Cross-sectional
study[11C]PIB uptake: MCI > NC in parietal cortex
(voxel-based analysis). [11C]PIB uptake:MCI > NC in parietal cortex (ROI-basedanalysis)
Kemppainen et al.,2007
Uptake in thetemporal (orlateral temporal)
11C-PIB 6 HC, 21 MCI,27 AD
Cross-sectionalstudy
Lower PIB retention: MCI < AD in temporalcortex. The MCI group showed no significantdifference compared to the NC.
Forsberg et al.,2008
cortex 11C-PIB 14 HC, 13 aMCI Cross-sectionalstudy
Higher [11C]PIB uptake: MCI > NC in temporalcortex (voxel-based analysis). Increased[11C]PIB uptake: MCI > NC in lateraltemporal cortex (ROI-based analysis)
Kemppainen et al.,2007
Uptake in thePosterior cingu-late/precuneus
11C-PIB 6 HC, 21 MCI,27 AD
Cross-sectionalstudy
Lower PIB retention: MCI < AD in posteriorcingulum.
Forsberg et al.,2008
11C-PIB 14 HC, 13 aMCI Cross-sectionalstudy
Higher [11C]PIB uptake: MCI > NC in posteriorcingulate, showing the main difference(voxel-based analysis. Increased [11C]PIBuptake in posterior cingulated: MCI > NC
Kemppainen et al.,2007
Analysis of the EEG offers appreciable promise asa means to characterize significant deviations fromthe ‘natural’ aging found in Alzheimer and otherdementias [163]. From the 1970s and 1980s withthe introduction of structural imaging technologiessuch as computer assisted tomography (CAT) andmagnetic resonance imaging (MRI), these newer meth-ods produced non-invasive views of in vivo brainanatomy with considerable resolution that contributedto their clinical and therefore economic utility. Overthe course of the following two decades, develop-ment of regional metabolic-perfusion methods suchas positron emission tomography (PET), single pho-ton emission computed tomography (SPECT), and theability to map oxygen consumption and regional bloodflow in specific neural locations with functional mag-netic resonance imaging (fMRI) have reduced the roleof electroencephalography in basic and clinical stud-
ies. However, these functional brain imaging methodswith their high spatial resolution for anatomical detailsare relatively limited in their temporal resolution whenmeasuring functional brain activation (seconds to min-utes). Thus, these neuroimaging techniques cannotdiscriminate in series or parallel activation of dif-ferent relays within a distributed network [164]. Asthese imaging methods were being developed, simi-lar advances were being made for EEG measures inpart because neuroelectric signals can track informa-tion processing with millisecond precision, and maymeasure natural brain aging as well as help to dis-criminate normal aging from neurodegeneration [165,166].
In recent years, increasing attention has been paidto the application of quantitative EEG (qEEG) and/orevent-related potentials (ERPs) as useful clinical mark-ers of early disease or progression [167]. In large part,

182 V. Drago et al. / Disease Tracking Markers for AD at the Prodromal (MCI) Stage
this was made possible as a result of recent improve-ments in the ease of use of technological advances andin access to sufficient computing power with the devel-opment of algorithms that permit rapid processing andinterpretation of complex raw datasets. In addition,recent technological advances include a reduction inthe size (and portability) of EEG amplifiers as wellas the development of high-density array nets that donot require skin abrasion to place electrodes with lowimpedance.
This section briefly reviews the alterations in restingEEG that are associated with normal and pathologicalbrain aging. For the sake of brevity, the methods used toextract these EEG markers will not be reviewed; how-ever, people who are interested in these methodologicalapproaches can review references 168–187.
Resting state EEG rhythms typically change withaging, with gradual modifications in spectral powerprofile including a decrease in amplitude and adecrease of alpha (8–13 Hz) activity with global “slow-ing” of the background EEG, and an increase inpower in the slower delta (2–4 Hz) and theta (4–8 Hz)frequency ranges [188–191]. A recent study in alarge sample of healthy subjects (N = 215, 18–85years) confirmed an age-dependent power decrementof low-frequency alpha rhythms (8–10.5 Hz) in pari-etal, occipital, and temporal regions, as well as adecrease of occipital delta power [192].
There is also an extensive literature which reportschanges in quantitative electroencephalogram withclinical deterioration in progressive dementia, includ-ing longitudinal studies which have demonstrated EEGdifferences between those patients with pMCI andsMCI.
Class A markers
There have been several studies using resting stateEEGs (with eyes closed) that assessed at baseline peo-ple who were healthy elderly or patients with MCI andAD. These studies can be found in Table 1. Most ofthem assessed changes in the EEG as people had cog-nitive deterioration and also attempted to determine thechanges in the baseline EEG, such as power densityand coherence that may be able to predict a cognitivedecline. Some EEG studies addressed the issue of lin-ear EEG markers that change in line with cognitivestatus of MCI subjects along the period from “base-line” to “follow up” recordings. In the participants withMCI, the markers of disease progression included anincrease in the power of theta and delta activity in the
temporal and occipital lobes as well as the reduction ofbeta power in the temporal and occipital lobes [193].AD patients were characterized by an increase in thepower of theta and delta activity and by the reductionof alpha and beta activity in the parieto-occipital lobes[194]. Furthemore, half of the AD patients showed anincrease in the power of theta and delta activity in atemporal-occipital lead [195].
Class B and C markers
Other “cross-sectional” studies have comparedmarkers of resting state EEG rhythms between Healthycontrols, MCI and AD subjects, and have correlatedthese markers to subjects’ cognitive status (“Class Bmarkers”). Luckhaus and colleagues have shown thatalpha power was lower in AD than MCI subjects andwas correlated to cognitive status in these subjects asa whole [196]. A study by Huang and colleagues hasevaluated the use of dipole sources of resting state EEGpower for the differentiation of MCI from mild AD.Dipole sources of alpha and beta power were shiftedmore anteriorly in AD patients compared to both thecontrol and MCI subjects [197]. Abnormalities of rest-ing state EEG rhythms in AD patients obtained fromconventional spectral analysis and nonlinear dynami-cal methods have been previously reviewed [198].
A study by Babiloni and colleagues has demon-strated that cortical sources of posterior occipitaldelta and low frequency alpha power have an inter-mediate magnitude in MCI subjects compared tomild AD and Healthy controls subjects, the mildAD subjects showing the highest delta power andthe lowest alpha power [199]. These sources wereboth linearly and nonlinearly (linear, exponential,logarithmic, and power) correlated with subjects’global cognitive level as revealed by the MMSE.As a methodological remark, it is remarked thatsource estaimation was performed by the popu-lar software low resolution brain electromagnetictomography (LORETA), which can be downloadedfrom Internet (http://www.uzh.ch/keyinst/loreta.htm)and ensures replicability of the results by independentgroups.
It has been reported that the posterior (LORETA)sources of low frequency alpha power are strictlyrelated to a well known neuroanatomic marker of neu-rodegeneration such as atrophy of hippocampus [200].Specifically, it has been shown that posterior low fre-quency alpha sources were maximum in MCI withlarger hippocampal volume, intermediate in MCI with

V. Drago et al. / Disease Tracking Markers for AD at the Prodromal (MCI) Stage 183
smaller hippocampal volume, and low in AD patients.Furthermore, the power of these sources was linearlyand non-linearly correlated with the normalized hip-pocampal volume.
Other EEG markers of interest were those related tofunctional coupling of resting state EEG rhythms. It hasbeen shown that the global linear functional couplingas revealed by total spectral coherence at low frequencyalpha rhythms was highest in the healthy controls,intermediate in the MCI subjects with low cholin-ergic damage (i.e. a structural marker of AD), andlowest in the MCI subjects with high cholinergic dam-age [201]. Furthermore, these coherence values werenegatively correlated to (moderate to high) cholinergiclesion across the MCI subjects.
Another study has evaluated fronto-parietal cou-pling of resting EEG rhythms by an index capturinglinear and non-linear dimension of this coupling,namely the so called ‘synchronization likelihood’[202]. It has been shown that synchronization likeli-hood progressively decreased from healthy controlssubjects, to those with MCI, and then to those sub-jects with mild AD subjects at midline (Fz-Pz) andright (F4-P4) fronto-parietal electrodes. The same wastrue for the likelihood of delta synchronization at theright fronto-parietal electrodes (F4-P4). For these EEGbands, the synchronization likelihood correlated withglobal cognitive status as measured by the MMSE.
Spectral coherence and synchronization likelihooddo not allow the determination of the directional flux ofinformation in the fronto-parietal coupling of restingstate EEG rhythms. This dimension can be explored bya technique called direct transfer function (DTF) [203].It has been shown that parietal to frontal directionof the information flux (DTF) within functional cou-pling of alpha and beta rhythms is stronger in healthycontrols than in MCI and/or AD subjects. Notewor-thy, such a direction of the fronto-parietal functionalcoupling is relatively preserved in aMCI subjects inwhom the cognitive decline is mainly explained byextent of white-matter vascular disease [204]. Indeed,fronto-parietal functional coupling of EEG rhythmswas higher in magnitude in the healthy controls thanin MCI subjects, and the coupling was higher at theta,alpha, and low frequency beta in MCI subjects with ahigher than lower extent of vascular disease.
There are a lot of cross-sectional studies address-ing the comparison of markers of resting state EEGrhythms between AD and healthy control subjects,which did not include MCI subjects. For sake ofbrevity, here we just mentioned that by Babiloni and
colleagues showing a decline of (LORETA) sourcesof posterior low frequency alpha power in mild ADsubjects when compared to very mild AD subjects[205]. Of note, these sources characterized the wholegroup of AD subjects with respect to both subjects withcerebrovascular dementia and healthy control subjects[205]. This result is of interest since sources of alphapower are supposed to be an extremely sensitive EEGmarker for the progression of MCI to dementia.
Conclusion
The results reviewed in the present article suggestthat several spectral markers of resting state EEGrhythms might reflect neurodegenerative processes inthe preclinical and clinical stages of AD. Among thesemarkers, we include LORETA sources of EEG powerdensity and functional coupling of scalp EEG rhythmssuch as spectral coherence, DTF, and synchronization.Unfortunately, this remarkably rich literature suffersfrom the lack of integration of the various EEG mark-ers for the evaluation of physiological brain aging anddiscrimination from abnormal scenarios heralding neu-rodegenerative dementia.
EVENT RELATED POTENTIALS
Long latency event-related potentials (ERPs) areextensively used in analyzing cognitive processes. TheP3, a positive peak around 300 ms after a relevantevent, is the most often analyzed component in thiscontext. The P3 is typically elicited by an oddballparadigm [206], in which patients with AD usuallyshow increased P3 latencies and – less consistently –reduced amplitudes. Other components, preceding orfollowing the P3, such as the N2 negativity, are alsoassociated with memory and attentional processes, andhave also been analyzed in studies on MCI and AD[207].
The alterations of the P3 component in AD andMCI may be caused by several reasons (for referencessee 208): Brain areas affected in AD contribute to theP3 generation, and the P3 is related to cognitive pro-cesses, which are impaired in AD. In addition, theP3 is under cholinergic modulation. Patients with ADhave degeneration of their basal forebrain and withthis degeneration there is a reduction of the produc-tion of acetylcholine. Anticholinergic drugs lead to anincrease in P3 latency and a decrease of P3 amplitude,which is partially reversed by cholinesterase inhibit-ing drugs [209]. In patients with AD, cholinesterase

184V.D
ragoetal./D
iseaseTracking
Markers
forA
Datthe
Prodrom
al(MC
I)Stage
Table 7EEG markers of disease progression based on literature evidence of validity
Marker N subject Time B-FU Results Referencesand diagnosis
Class ADelta, theta, and beta
power (scalp)27 MCI, 15 AD,
16 HC21 months In MCI subjects, the main disease progression markers were the
increment of temporal and temporo-occipital slow EEG power(relative delta and theta) and the reduction of temporal andtemporo-occipital beta power
Jelic V, et al., 2000
Delta, theta, alpha andbeta power (scalp)
40 AD and 40 HC 30 months AD patients were characterized by an increase in the power of thetaand delta activity and by the reduction of alpha and beta activityin the parieto-occipital lobes
Coben et al., 1985
Delta, theta (scalp) 24 AD 12 months Half of the AD patients were characterized by an increase in thepower of theta and delta activity in a temporal-occipital lead
Soininen et al.,1989
Class BDelta power (scalp) 88 MCI Cross-sectional
studyAlpha power was lower in AD than MCI subjects and was
correlated to cognitive status in these subjects as a wholeLuckhaus C, et al.,
2008Alpha power (distributed
sources)155 MCI, 193 AD,
126 HCCross-sectional
studyDistributed (LORETA) sources of posterior occipital delta and
alpha power have an intermediate magnitude in MCI subjectscompared to mild AD and HC subjects, the mild AD subjectsshowing the highest delta power and the lowest alpha power.These sources were both linearly and nonlinearly (linear,exponential, logarithmic, and power) correlated with subjects’global cognitive level as revealed by mini mental stateexamination score
Babiloni C, et al.,2006
Alpha power (distributedsources)
60 HC, 88 MCI, 35AD
Cross-sectionalstudy
Distributed (LORETA) sources of posterior alpha power are strictlyrelated to a well known neuroanatomic marker ofneurodegeneration such as atrophy of hippocampus. Specifically,it has been shown that posterior alpha sources were maximum inMCI subjects with larger hippocampal volume, intermediate inMCI subjects with smaller hippocampal volume, and low in ADpatients.
Babiloni C, et al.,2009
Theta, alpha power, andbeta power (dipolesources)
38 AD, 31 MCI, 24HC
Cross-sectionalstudy
Dipole sources of alpha and beta power shifted more anteriorly inAD patients compared to both the healthy controls and MCIsubjects. Compared to stable MCI, MCI converted to AD had amore anterior localization of dipole sources of theta, alpha andbeta power (baseline antero-posterior dipole localization of alphapower predicted clinical follow up).
Huang C, et al.,2000
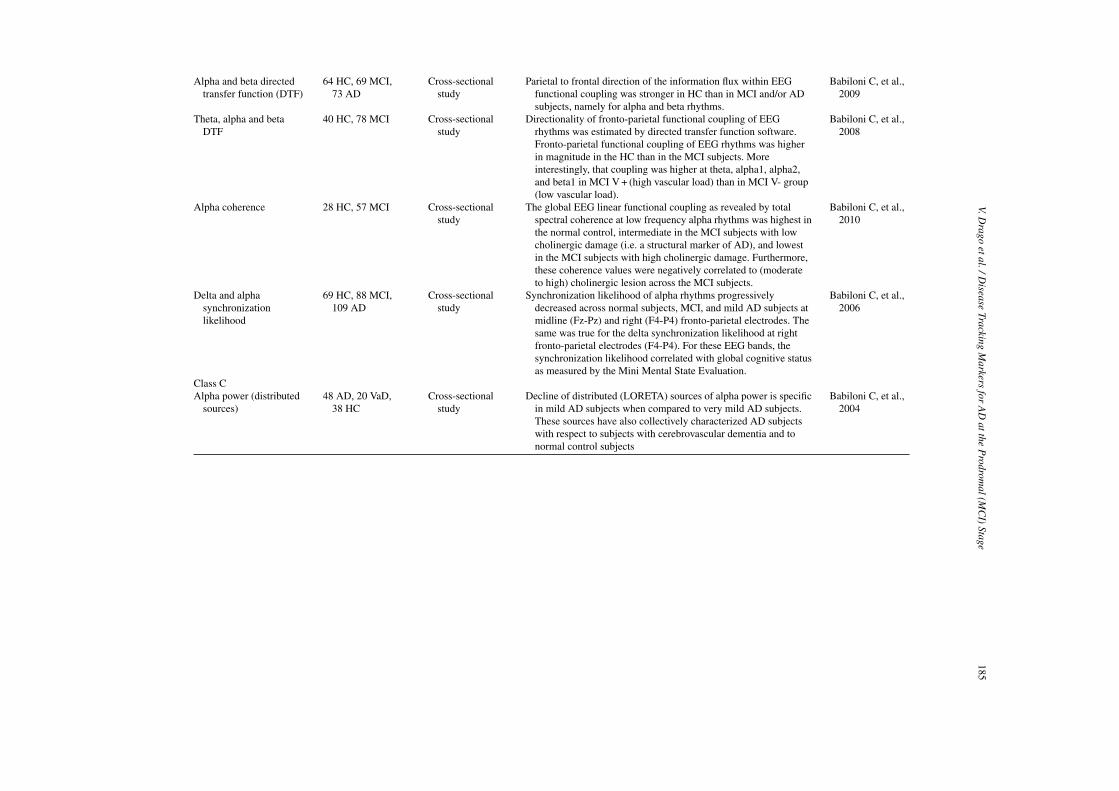
V.Drago
etal./Disease
TrackingM
arkersfor
AD
attheP
rodromal(M
CI)
Stage185
Alpha and beta directedtransfer function (DTF)
64 HC, 69 MCI,73 AD
Cross-sectionalstudy
Parietal to frontal direction of the information flux within EEGfunctional coupling was stronger in HC than in MCI and/or ADsubjects, namely for alpha and beta rhythms.
Babiloni C, et al.,2009
Theta, alpha and betaDTF
40 HC, 78 MCI Cross-sectionalstudy
Directionality of fronto-parietal functional coupling of EEGrhythms was estimated by directed transfer function software.Fronto-parietal functional coupling of EEG rhythms was higherin magnitude in the HC than in the MCI subjects. Moreinterestingly, that coupling was higher at theta, alpha1, alpha2,and beta1 in MCI V + (high vascular load) than in MCI V- group(low vascular load).
Babiloni C, et al.,2008
Alpha coherence 28 HC, 57 MCI Cross-sectionalstudy
The global EEG linear functional coupling as revealed by totalspectral coherence at low frequency alpha rhythms was highest inthe normal control, intermediate in the MCI subjects with lowcholinergic damage (i.e. a structural marker of AD), and lowestin the MCI subjects with high cholinergic damage. Furthermore,these coherence values were negatively correlated to (moderateto high) cholinergic lesion across the MCI subjects.
Babiloni C, et al.,2010
Delta and alphasynchronizationlikelihood
69 HC, 88 MCI,109 AD
Cross-sectionalstudy
Synchronization likelihood of alpha rhythms progressivelydecreased across normal subjects, MCI, and mild AD subjects atmidline (Fz-Pz) and right (F4-P4) fronto-parietal electrodes. Thesame was true for the delta synchronization likelihood at rightfronto-parietal electrodes (F4-P4). For these EEG bands, thesynchronization likelihood correlated with global cognitive statusas measured by the Mini Mental State Evaluation.
Babiloni C, et al.,2006
Class CAlpha power (distributed
sources)48 AD, 20 VaD,
38 HCCross-sectional
studyDecline of distributed (LORETA) sources of alpha power is specific
in mild AD subjects when compared to very mild AD subjects.These sources have also collectively characterized AD subjectswith respect to subjects with cerebrovascular dementia and tonormal control subjects
Babiloni C, et al.,2004

186 V. Drago et al. / Disease Tracking Markers for AD at the Prodromal (MCI) Stage
inhibiting drugs resulted in a shortening of P3 latencyand increase in P3 amplitude; and in some of these stud-ies an association was reported between improvementin cognitive test scores and reduction of P3 latencies[210–216].
Since cortical neuronal functioning is directlyreflected by EEG [217], deteriorations on the synapticlevel should be visible in ERPs at very early stages ofdisease even before pathology is reflected in disruptedcognitive functions. This assumption is supported bya recent study by Golob et al. [218], which assessedERPs in 26 subjects with a family history of FamilialAlzheimer disease (FAD): The still asymptomatic 15FAD mutations carriers, when compared to 11 partic-ipants who were not carriers, showed longer latenciesof several components, including the N2 and P3 com-ponents. These electrophysiological alterations wereobserved about ten years before estimated demen-tia onset. Similarly, cohorts carrying genetic risks forAD showed increased P3 and N2 latencies in onestudy [219], and only increased N2 latency in anotherstudy [220]. Furthermore, different ERP components,including the P50, N2 and P3, were able to longitu-dinally predict cognitive decline [220] and conversionfrom MCI to AD [207, 221–224].
Sensitivity to track disease progression
Class A markers
Longitudinal studies starting with MCI orhealthy subjects
Only three studies have been conducted that longitu-dinally followed patients with MCI or elderly subjectswho were still healthy (see Table 8). These studiesdo not primarily focus on the assessment of diseaseprogression and therefore only comprise one or twofollow-up examinations.
Applying an oddball paradigm, all three studiescross-sectionally found increased P3 latencies in ADpatients; and two of the studies [207, 225] also demon-strated increased latencies in MCI compared withhealthy controls (HCs). Longitudinally, the study byLai et al. [225] demonstrated higher mean P3 latenciesat follow up after one year within both patient groups(MCI and AD), whereas the HCs did not show a signifi-cant increase. As neither conversion from MCI to AD,nor significant changes in cognitive test scores werereported within the follow-up, Lai et al. concluded thatthe P3 latency may be more sensitive to track diseaseprogression than the cognitive tests.
The second study by Papaliagkas [207] also reporteda significant mean increase of the P3 latency betweenbaseline and 14-months follow up. However, therewas no control group at follow-up. Therefore, it isnot possible to separate the disease-associated latencyincrease in the MCI patients from the normal age-related increase. Recently, a further analysis of asubgroup of this study has been published: Papaliagkaset al. [226] analyzed a subsample of 22 MCI patients,which could be re-assessed at a second follow-up.The difference of the P3 latencies between baselineand the first 14-months follow-up was not significant,but the latencies at the second 23-months follow-upwere significantly increased compared with 14-monthsfollow-up and baseline. The authors argue that theobserved increases were higher than the age-relatedincrease in healthy subjects of an independent study.
In the third study by Gironell et al. [222], three ERPrecordings were done in outpatients with subjectivememory complaints, immediately after the first clini-cal evaluation (T0) and approximately at 12 (T1) and24 months (T2). The ERPs at T0, T1 and T2 were onlyanalyzed for the final diagnostic groups at T2, whichcomprised 28 AD and 30 MCI patients. The P3 latencywas significantly higher for the T2-AD group through-out the study, supporting the role of the P3 latency asan early predictor of AD. However, there were no dif-ferences between the participants with MCI and HC inP3 parameters throughout this entire study. Some lim-itations have to be considered when interpreting thisstudy with regard to tracking disease progression: Asthe study was designed to assess the predictive powerof P3 in subjects with memory complaints, the analy-sis of group differences is only retrospectively basedon the final diagnoses at T2. There may have beenAD subjects at T2 who might have had MCI at T1,but no data are given about the P3 latencies of thesepossible T1-MCI subjects. A further limitation is thatthe authors do not provide clear data on their partici-pants’ consumption of anticholinesterase medications.These medications reduce the latency of P3 and thusthe use of these medications could result in false nega-tive results. Data on other psychotropic medications atT0 are, however, given, revealing that in the MCI group(as classified at T2) a substantial proportion of partici-pants (33%) used benzodiazepines. This class of drugsis not only known to produce cognitive impairmentsbut also an increase of the P3 latency [227]. In addi-tion, in this report no data are given about changes inmedications throughout the study. Overall, these threelongitudinal studies do support the potential predictive

V. Drago et al. / Disease Tracking Markers for AD at the Prodromal (MCI) Stage 187
Table 8ERP markers of disease progression based on literature evidence of validity
Marker N subject and diagnosis Time B-FU Results References
Class AERPs (Oddball task) 91 MCI (54 re-examined at
follow-up), 5 converted to AD,30 HC
14 months(T0, T14)
P3 latency increase, P3 andN2 amplitude decrease
Papaliagkas et al., 2008
ERPs (Oddball task) 22 MCI (subsample ofPapaliagkas et al., 2008),3 converted to AD, 30 HC
23 months(T0, T14, T23)
P3 latency increase,N2 amplitude decrease
Papaliagkas et al., in press(subsample ofPapaliagkas et al.,2008)
ERPs (Oddball task) 18 MCI, 20 AD, 14 HC 12 months(T0, T12)
P3 latency increase (in ADand, at Pz, in MCI)
Lai et al., 2010
P3 (Oddball task) 116 outpatients with subjectivememory complaints At the endof follow-up (T24): 30 MCI,28 AD, 6 other types ofdementia, 30 cases of normalcognition, 22 “lost”.
24 months(T0, T12, T24)
P3 latency in patients withstable MCI at T24:no difference nor increasewith time compared withhealthy controls
Gironell et al., 2005
power and cross-sectional diagnostic value of ERPs,but unfortunately only give limited information aboutthe ability of ERPs to track disease progression.
In addition to the longitudinal studies assessinghealthy participants or patients with MCI, there are alsolongitudinal observations in patients with AD. WithinAD, P3 latencies increased in parallel with cognitivedeterioration [214, 228–231].
Class B and C markers
Most cross-sectional studies that assessed ERPs inMCI reported higher P3 latencies in patients with MCIcompared with HCs [223, 235–237]. However, the P3latency increase did not reach significance level in onestudy [237], and reached significance in another studyonly for the Pz electrode position [238]. It is notewor-thy that an increased P3 latency was found in MCIpatients of even those studies, in which a substantialproportion of patients were treated with cholinesteraseinhibiting drugs at the time of EEG recording [223,234]. Four cross-sectional studies included patientswith AD in addition to MCI and HCs. In these studies,the P3 latencies of MCI patients were numerically inbetween that of AD patients and HCs (with the excep-tion of one singular finding at one electrode positionin one study) [238]. However, the post-hoc compar-isons between all three groups (AD vs. MCI vs. HCs)did not always reach statistical significance. Someof the studies suffer from methodological limitations,such as small sample sizes, insufficient control of psy-chotropic drug effects and inadequate matching. Forexample, the study by Bennys et al. [235] was notwell matched according to sex and age leading to more
males and younger subjects in the HCs than the MCIgroup [235].
Several cross-sectional studies on ERPs in patientswith AD have already been reviewed elsewhere [206,233, 239]. These cross-sectional studies show thatpatients with AD have increased P3 latencies com-pared with HCs, and some [232] but not all [222],studies reported a correlation between P3 latency andcognitive tests.
Conclusions
Late ERPs may very well be a sensitive markerthat either normal people or patients with MCI willprogress to AD. So far, however, there are only threeserial studies starting with healthy elderly or MCIpatients that are unfortunately characterized by fewfollow-ups and methodological limitations. Nonethe-less, studies tracking disease progression within AD,cross-sectional studies including MCI, studies predict-ing conversion to AD, and studies tracking effectsof cholinesterase inhibiting drugs, further support theassumption that late ERPs might be a good marker fordisease progression from the earliest stages.
There are several attractive aspects for using ERPs asa marker. Recording ERPs is relatively inexpensive andnoninvasive procedure, with almost no side-effects.ERPs can be performed quickly and can be performedwith mobile equipment. Thus, additional well con-trolled longitudinal studies are warranted.
Cross-sectional studies, such as those that compareMCI with HCs, can be influenced by substantial vari-ance due to the high inter-individual variability ofthe P3, irrespective of any disease state. Whereas P3

188 V. Drago et al. / Disease Tracking Markers for AD at the Prodromal (MCI) Stage
latencies recorded at different times are relatively sta-ble within an individual, different individuals oftenhave different latencies suggesting that P3 variabilityis trait-like. Therefore, variance of P3 should presentno problem for within person-designs, such as trackingdisease progression or effects of drugs and future stud-ies should try to reduce the error variance of the lateERPs [233] in order to further improve their diagnosticpower. In addition, the use of drugs that cause increaseor decrease of P3 latencies should be better controlledin these studies.
Further research should also be performed to helpclarify which testing paradigm (e.g., odd ball, cognitivetests) [224, 240, 241] and which ERP component (orwhich combination of ERP components) is most sensi-tive or predictive of disease onset, disease progression,or disease regression with treatment. Alternative meth-ods, such as source localization analyses [208, 242,243], should also be assessed for reliability and validityas well as sensitivity and specificity.
CSF
Amyloid plaques, tau pathology, neuro-inflam-mation, oxidative stress, astrogliosis and synaptic andneuronal losses are typical neuropathological findingsin AD. To find markers useful to support the clinicaldiagnosis and to monitor disease progression andpossibly therapeutic effects in clinical trials all thesedifferent pathological processes have to be considered.Examination of the cerebral spinal fluid for beta amy-loid peptides and tau proteins may provide informationabout the pathological processes occurring in the brain.
Class A markers
The concentration of soluble beta-amyloid (1–42)(A�1-42) is selectively reduced in the CSF of individ-uals affected by AD. The inverse correlation betweenCSFA�42 and in vivo amyloid imaging load [244, 245]suggests that the selective reduction of A�42 in CSFin AD is a direct biomarker of A� deposition in humanbrain and presumably reflects the preferential deposi-tion of A�42. This decrease is already present in earlystages of the disease. Several longitudinal studies haveshown that CSF levels of A�x-40 and A�1-42.are stableduring disease progression. Coefficients of variation(CVs) around 8% were reported between baseline andfollow-up measurement [246]. Consequently, no corre-lations with the severity of the disease have been found[247]. (See table) [248–251].
CSF-biomarkers that may be related to the abnormalhyperphosphorylation tau protein are phospho-tau181and phospho-tau231. The concentration of both ofthese markers is increased in CSF early in the courseof the disease. Also some studies reported increas-ing phospho-tau levels in very early stages of AD,most authors of longitudinal studies concluded thatphospho-tau181 as well as phospho-tau231 remain sta-ble throughout the course of the disease. Correlationsof phospho-tau levels in CSF with the severity of thedisease were not conclusively observed (see table)
Tau protein in CSF is believed to be related the rateof axonal and neuronal degeneration. Although there issome conflicting data, most longitudinal studies reportconclusively increased total-tau concentrations in CSF,even in the early stages. During further progression ofthe disease, CSF total-tau remains elevated but stable[247]. Total-tau measurements at baseline and follow-up are highly correlated with each other [246]. Thereported CVs were around 8% [246].
In accordance with the postulate that tau in CSF isrelated to neuronal degeneration, Hesse et al. observedelevated total-tau levels in CSF after stroke. The CSFtau levels were correlated with the infarct area and nor-malized within five months after the initial event [252].Thus, elevated tau levels are not pathognomic of AD[253].
In regard to treatment, Gilman et al. [254] reportedreduced CSF total-tau levels in immunization respon-ders in the first abeta immunisation trial. The stabilityover time and the sensitivity to CNS consolidationmakes this marker especially interesting for the mon-itoring of neurodegeneration during the therapy withdisease modifying drugs.
A well established marker representing oxidativestress is the F2 isoprostane. Longitudinal studiesreport evidence, that isoprostanes increase early inAD and correlate with disease duration and severity.[255–258]. Furthermore, the concentration of iso-prostane can be reduced by application of Vitamin Cor tocopherol, two antioxidative vitamins [258] (seetable)
Class C markers
Gliosis of the affected brain areas is another typicalfinding in the brains of patients with AD. Follow-ing neuronal cell death, astroglia becomes activatedto form a scar. S-100B and GFAP are believed toreflect astrocyte activity. In cross sectional studies itis reported that S-100B in CSF [259] is normal in AD,

V. Drago et al. / Disease Tracking Markers for AD at the Prodromal (MCI) Stage 189
Table 9CSF markers of disease progression based on literature evidence of validity
Marker N subjects and diagnosis Time B-FU Results References
Class ACSF - A�1-42 21 HC, 22 converter, 43 sMCI 2 years stable Brys 2009CSF A�1-40CSF total-tauCSF phospho-tauCSF F2-isoprostane increaseCSF A�1-42 17 HC, 83 MCI 2 years stable Zetterberg 2007CSF total-tauCSF phospho-tauCSF A�1-42 9 HC, 7 MCI 2 years stable de Leon 2006CSF A�1-40CSF phospho-tauCSF F2-isoprostane 9 HC, 7 MCI 2 years increase de Leon 2006CSF A�1-42 10 HC; 8 MCI 1 year stable de Leon 2002CSF A�1-40CSF phospho-tau 10 HC, 8 MCI 1 year increase de Leon 2002CSF A�1-42 17 HC, 38 MCI, 50 AD 21 months increase Bouwman 2007CSF total-tauCSF phospho-tau stableCSF total-tau 9 MCI, 18 AD, 9 OD 14 months stable Blomberg 1996CSF total-tau 40 early MCI 34 months stable Andersson 2008CSF phospho-tau 40 early MCI 34 months increase Andersson 2008CSF F2-isoprostane 11 HC, 6 MCI 2 years increase de Leon 2007Class BClass CCSF GFAP 14 HC,18 AD, 22 CJD No corr. With MMSE Jesse, 2009CSF GFAP 8 HC, 27 AD increase Fukujama, 2001CSF S100B 14 HC,18 AD, 22 CJD stable Jesse, 2009CSF IL-1 9 HC, 8 AD 6 years No corr. With MMSE Lanzrein, 1998CSF IL-1 9 HC, 8 AD 6 years No corr. With MMSE Lanzrein, 1998CSF IL-1 receptor
antagonist9 HC, 8 AD 6 years No corr. With MMSE Lanzrein, 1998
CSF soluble IL-2receptor
20 HC, 42 AD no corr. With MMSE Engelborghs, 1999
CSF IL-1� MS, MID, AD increase Cacabelos 1991CSF IL-1� 20 HC, 42 AD no corr. With MMSE Engelborghs, 1999CSF IL-6 9 HC, 8 AD 6 years No corr. With MMSE Lanzrein, 1998CSF IL-6 24 HC, 41 AD No corr. With MMSE Kalman, 1997CSF IL-6 27 AD No corr. With MMSE Sun, 2003CSF IL-6 20 HC, 42 AD no corr. With MMSE Engelborghs, 1999CSF soluble IL-6
receptor20HC, 41 AD No corr. With MMSE Hampel, 1998
CSF IL10 25 HC, 30 AD no corr. With MMSE Rota, 2006CSF IL-10 20 HC, 42 AD no corr. With MMSE Engelborghs, 1999CSF IL12 25 HC, 30 AD no corr. With MMSE Rota, 2006CSF IL-12 20 HC, 42 AD no corr. With MMSE Engelborghs, 1999CSF TNF� 9 HC, 8 AD 6 years No corr. With MMSE Lanzrein, 1998CSF TNF� 27 HC; 23 AD, 15 OD, 11 depress no corr. With MMSE Blasko, 2006CSF sTNF-receptors
I and II9 HC, 8 AD 6 years No corr. With MMSE Lanzrein, 1998
CSF �1-antichymotrypsin
9 HC, 8 AD 6 years No corr. With MMSE Lanzrein, 1998
CSF �1-antichymotrypsin
141 AD No corr. With MMSE Sun, 2003
CSF �1-antitrypsin 136 AD No corr. With MMSE Sun, 2003CSF MCP-1 27 HC; 23 AD, 15 OD, 11 depress Weak corr. With MMSE Blasko, 2006CSF MCP-1 136 AD No corr. With MMSE Sun, 2003CSF oxLDL 132 AD No corr. With MMSE Sun, 2003
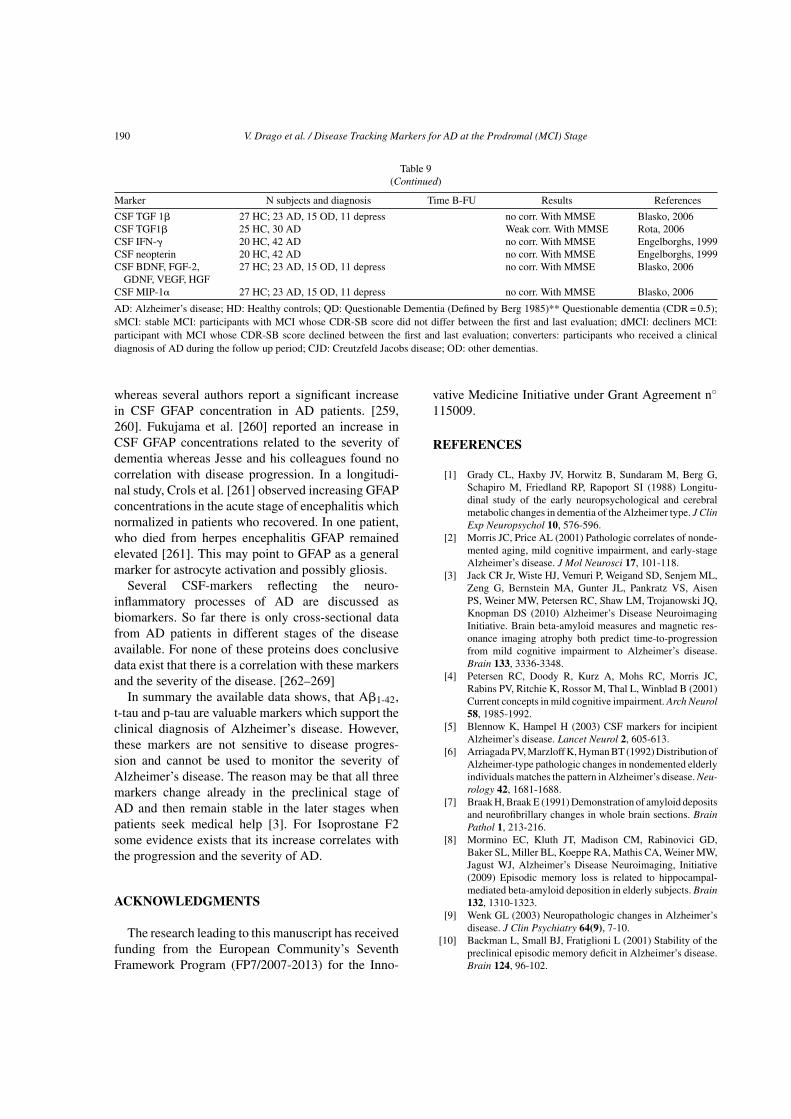
190 V. Drago et al. / Disease Tracking Markers for AD at the Prodromal (MCI) Stage
Table 9(Continued)
Marker N subjects and diagnosis Time B-FU Results References
CSF TGF 1� 27 HC; 23 AD, 15 OD, 11 depress no corr. With MMSE Blasko, 2006CSF TGF1� 25 HC, 30 AD Weak corr. With MMSE Rota, 2006CSF IFN-� 20 HC, 42 AD no corr. With MMSE Engelborghs, 1999CSF neopterin 20 HC, 42 AD no corr. With MMSE Engelborghs, 1999CSF BDNF, FGF-2,
GDNF, VEGF, HGF27 HC; 23 AD, 15 OD, 11 depress no corr. With MMSE Blasko, 2006
CSF MIP-1� 27 HC; 23 AD, 15 OD, 11 depress no corr. With MMSE Blasko, 2006
AD: Alzheimer’s disease; HD: Healthy controls; QD: Questionable Dementia (Defined by Berg 1985)** Questionable dementia (CDR = 0.5);sMCI: stable MCI: participants with MCI whose CDR-SB score did not differ between the first and last evaluation; dMCI: decliners MCI:participant with MCI whose CDR-SB score declined between the first and last evaluation; converters: participants who received a clinicaldiagnosis of AD during the follow up period; CJD: Creutzfeld Jacobs disease; OD: other dementias.
whereas several authors report a significant increasein CSF GFAP concentration in AD patients. [259,260]. Fukujama et al. [260] reported an increase inCSF GFAP concentrations related to the severity ofdementia whereas Jesse and his colleagues found nocorrelation with disease progression. In a longitudi-nal study, Crols et al. [261] observed increasing GFAPconcentrations in the acute stage of encephalitis whichnormalized in patients who recovered. In one patient,who died from herpes encephalitis GFAP remainedelevated [261]. This may point to GFAP as a generalmarker for astrocyte activation and possibly gliosis.
Several CSF-markers reflecting the neuro-inflammatory processes of AD are discussed asbiomarkers. So far there is only cross-sectional datafrom AD patients in different stages of the diseaseavailable. For none of these proteins does conclusivedata exist that there is a correlation with these markersand the severity of the disease. [262–269]
In summary the available data shows, that A�1-42,t-tau and p-tau are valuable markers which support theclinical diagnosis of Alzheimer’s disease. However,these markers are not sensitive to disease progres-sion and cannot be used to monitor the severity ofAlzheimer’s disease. The reason may be that all threemarkers change already in the preclinical stage ofAD and then remain stable in the later stages whenpatients seek medical help [3]. For Isoprostane F2some evidence exists that its increase correlates withthe progression and the severity of AD.
ACKNOWLEDGMENTS
The research leading to this manuscript has receivedfunding from the European Community’s SeventhFramework Program (FP7/2007-2013) for the Inno-
vative Medicine Initiative under Grant Agreement n◦115009.
REFERENCES
[1] Grady CL, Haxby JV, Horwitz B, Sundaram M, Berg G,Schapiro M, Friedland RP, Rapoport SI (1988) Longitu-dinal study of the early neuropsychological and cerebralmetabolic changes in dementia of the Alzheimer type. J ClinExp Neuropsychol 10, 576-596.
[2] Morris JC, Price AL (2001) Pathologic correlates of nonde-mented aging, mild cognitive impairment, and early-stageAlzheimer’s disease. J Mol Neurosci 17, 101-118.
[3] Jack CR Jr, Wiste HJ, Vemuri P, Weigand SD, Senjem ML,Zeng G, Bernstein MA, Gunter JL, Pankratz VS, AisenPS, Weiner MW, Petersen RC, Shaw LM, Trojanowski JQ,Knopman DS (2010) Alzheimer’s Disease NeuroimagingInitiative. Brain beta-amyloid measures and magnetic res-onance imaging atrophy both predict time-to-progressionfrom mild cognitive impairment to Alzheimer’s disease.Brain 133, 3336-3348.
[4] Petersen RC, Doody R, Kurz A, Mohs RC, Morris JC,Rabins PV, Ritchie K, Rossor M, Thal L, Winblad B (2001)Current concepts in mild cognitive impairment. Arch Neurol58, 1985-1992.
[5] Blennow K, Hampel H (2003) CSF markers for incipientAlzheimer’s disease. Lancet Neurol 2, 605-613.
[6] Arriagada PV, Marzloff K, Hyman BT (1992) Distribution ofAlzheimer-type pathologic changes in nondemented elderlyindividuals matches the pattern in Alzheimer’s disease. Neu-rology 42, 1681-1688.
[7] Braak H, Braak E (1991) Demonstration of amyloid depositsand neurofibrillary changes in whole brain sections. BrainPathol 1, 213-216.
[8] Mormino EC, Kluth JT, Madison CM, Rabinovici GD,Baker SL, Miller BL, Koeppe RA, Mathis CA, Weiner MW,Jagust WJ, Alzheimer’s Disease Neuroimaging, Initiative(2009) Episodic memory loss is related to hippocampal-mediated beta-amyloid deposition in elderly subjects. Brain132, 1310-1323.
[9] Wenk GL (2003) Neuropathologic changes in Alzheimer’sdisease. J Clin Psychiatry 64(9), 7-10.
[10] Backman L, Small BJ, Fratiglioni L (2001) Stability of thepreclinical episodic memory deficit in Alzheimer’s disease.Brain 124, 96-102.

V. Drago et al. / Disease Tracking Markers for AD at the Prodromal (MCI) Stage 191
[11] Albert M, Blacker D, Moss MB, Tanzi R, McArdle JJ (2007)Longitudinal change in cognitive performance among indi-viduals with mild cognitive impairment. Neuropsychology21, 158-169.
[12] Leow AD, Yanovsky I, Parikshak N, Hua X, Lee S, TogaAW, Jack CR Jr, Bernstein MA, Britson PJ, Gunter JL, WardCP, Borowski B, Shaw LM, Trojanowski JQ, Fleisher AS,Harvey D, Kornak J, Schuff N, Alexander GE, Weiner MW,Thompson PM, Alzheimer’s Disease Neuroimaging, Initia-tive (2009) Alzheimer’s disease neuroimaging initiative: aone-year follow up study using tensor-based morphometrycorrelating degenerative rates, biomarkers and cognition.Neuroimage 45, 645-655.
[13] Bennett DA, Wilson RS, Schneider JA, Evans DA, BeckettLA, Aggarwall NT, Barnes LL, Fox JH, Bach J (2002) Nat-ural history of mild cognitive impairment in older persons.Neurology 59, 198-205.
[14] Fama R, Sullivan EV, Shear PK, Marsh L, Fama R,Lim KO, Yesavage JA, Tinklenberg JR, Pfefferbaum A(1998) Fluency performance patterns in Alzheimer’s dis-ease and Parkinson’s disease. Clin Neuropsychologist 12,487-499.
[15] Monsch AU, Bondi MW, Butters N, Paulsen JS, Salmon DP,Brugger P, Swenson MR (1994) A comparison of categoryand letter fluency in Alzheimer’s disease. Neuropsychology8, 25-30.
[16] Clark LJ, Gatz M, Zheng L, Yu-Ling Chen, McCleary C,Mack WJ (2009) Longitudinal verbal fluency in normalaging, preclinical, and prevalent Alzheimer’s disease. AmJ Alzheimers Dis Other Dement 24, 461-468.
[17] Fowler KS, Saling MM, Conway EL, Semple JM, Louis WJ(2002) Paired associate performance in early detection ofDAT. J Int Neuropsychol Soc 8, 58-71.
[18] Ska B, Poissant A, Joanette Y (1990) Line orientationjudgment in normal elderly and subjects with dementia ofAlzheimer’s type. J Clin Exp Neuropsychol 12, 695-702.
[19] Economou A, Papageorgiou SG, Karageorgiou C, Vas-silopoulos D (2007) Non episodic memory deficits inamnestic MCI. Cogn Behav Neurol 20, 99-106.
[20] Troster AI, Fields JA, Testa JA, Paul RH, Blanco CR, HamesKA, Salmon DP, Beatty WW (1998) Cortical and subcorticalinfluences on clustering and switching in the performanceof verbal fluency tasks. Neuropsychologia 36, 295-304.
[21] Storandt M, Grant EA, Miller PJ, Morris JC (2002) Ratesof progression in mild cognitive impairment and earlyAlzheimer’s disease. Neurology 59, 1035-1041.
[22] Dudas RB, Clague F, Thompson SA, Graham KS, HodgesJR (2005) Episodic and semantic memory in mild cognitiveimpairment. Neuropsychologia 43, 1266-1276.
[23] Laine M, Vuorinen E, Rinne JO (1997) Picture namingdeficits in vascular dementia and Alzheimer’s disease. J ClinExp Neuropsychol 19, 126-140.
[24] Lukatela K, Malloy P, Jenkins M, Cohen R (1998) Thenaming deficit in early Alzheimer’s and Vascular dementia.Neuropsychology 12, 565-572.
[25] Lezak MD, Howieson DB, Loring DW (2004) Neuropsy-chological assessment, 4th Edition, Oxford, p. 369.
[26] Kalbe E, Salmon E, Perani D, Holthoff V, Sorbi S, ElsnerA, Weisenbach S, Brand M, Lenz O, Kessler J, LuedeckeS, Ortelli P, Herholz K (2005) Anosognosia in very mildAlzheimer’s disease but not in mild cognitive impairment.Dement Geriatr Cogn Disord 19, 349-356.
[27] Kramer JH, Nelson A, Johnson JK, Yaffe K, Glenn S, RosenHJ, Miller BL (2006) Multiple cognitive deficits in amnestic
mild cognitive impairment. Dement Geriatr Cogn Disord22, 306-311.
[28] Allender J, Kaszniak AW (1989) Processing of emotionalcues in patients with dementia of the Alzheimer’s type. IntJ Neurosci 46, 147-155.
[29] Testa JA, Beatty WW, Gleason BA, Orbelo BA, Ross ED(2001) Impaired affective prosody in AD. Neurology 57,1475-1481.
[30] Derouesne C, Lagha-Pierucci S, Thibault S, Baudouin-Madec V, Lacomblez L (2000) Apraxic disturbances inpatients with mild to moderate Alzheimer’s disease. Neu-ropsychologia 38, 1760-1769.
[31] Mozaz M, Garaigordobil M, Gonzalez Rothi LJ, AndersonJ, Crucian GP, Heilman KM (2006) Posture recognition inAlzheimer’s disease. Brain Cogn 62, 241-245.
[32] Schwartz RL, Adair JC, Raymer AM, Williamson DJ,Crosson B, Rothi LJ, Nadeau SE, Heilman KM (2000)Conceptual apraxia in probable Alzheimer’s disease asdemonstrated by the Florida Action Recall Test. J Int Neu-ropsychol Soc 6, 265-270.
[33] Braak H, Braak E, Bohl J (1993) Staging of Alzheimer-related cortical destruction. Eur Neurol 33, 403-408.
[34] Kaye JA, Swihart T, Howieson D, Dame A, Moore MM,Karnos T, Camicioli R, Ball M, Oken B, Sexton G (1997)Volume loss of the hippocampus and temporal lobe inhealthy elderly persons destined to develop dementia. Neu-rology 48, 1297-1304.
[35] Jack CR Jr, Petersen RC, Xu YC, O’Brien PC, Smith GE,Ivnik RJ, Boeve BF, Waring SC, Tangalos EG, Kokmen E(1999) Prediction of AD with MRI-based hippocampalvolume in mild cognitive impairment. Neurology 52, 1397-1403.
[36] Convit A, de Asis J, de Leon MJ, Tarshish CY, De Santi S,Rusinek H (2000) Atrophy of the medial occipitotemporal,inferior, and middle temporal gyri in non-demented elderlypredict decline to Alzheimer’s disease. Neurobiol Aging 21,19-26.
[37] Killiany RJ, Gomez-Isla T, Moss M, Kikinis R, SandorT, Jolesz F, Tanzi R, Jones K, Hyman BT, Albert MS(2000) Use of structural magnetic resonance imaging topredict who will get Alzheimer’s disease. Ann Neurol 47,430-439.
[38] Dickerson BC, Goncharova I, Sullivan MP, Forchetti C,Wilson RS, Bennett DA, Beckett LA, deToledo-Morrell L(2001) MRI-derived entorhinal and hippocampal atrophyin incipient and very mild Alzheimer’s disease. NeurobiolAging 22, 747-754.
[39] Chetelat G, Desgranges B, De La Sayette V, Viader F,Eustache F, Baron JC (2002) Mapping gray matter loss withvoxel-based morphometry in mild cognitive impairment.Neuroreport 13, 1939-1943.
[40] Visser PJ, Verhey FR, Hofman PA, Scheltens P, Jolles J(2002) Medial temporal lobe atrophy predicts Alzheimer’sdisease in patients with minor cognitive impairment. J Neu-rol Neurosurg Psychiatry 72, 491-497.
[41] Stoub TR, Bulgakova M, Leurgans S, Bennett DA, Fleis-chman D, Turner DA, deToledo-Morrell L (2005) MRIpredictors of risk of incident Alzheimer disease: a longi-tudinal study. Neurology 64, 1520-1524.
[42] de Leon MJ, DeSanti S, Zinkowski R, Mehta PD, Pratico D,Segal S, Rusinek H, Li J, Tsui W, Saint Louis LA, Clark CM,Tarshish C, Li Y, Lair L, Javier E, Rich K, Lesbre P, MosconiL, Reisberg B, Sadowski M, DeBernadis JF, Kerkman DJ,Hampel H, Wahlund LO, Davies P (2006) Longitudinal CSF

192 V. Drago et al. / Disease Tracking Markers for AD at the Prodromal (MCI) Stage
and MRI biomarkers improve the diagnosis of mild cognitiveimpairment. Neurobiol Aging 27, 394-401.
[43] Csernansky JG, Wang L, Swank J, Miller JP, Gado M, McKeel D, Miller MI, Morris JC (2005) Preclinical detection ofAlzheimer’s disease: hippocampal shape and volume predictdementia onset in the elderly. Neuroimage 25, 783-792.
[44] Frisoni GB, Fox NC, Jack CR Jr, Scheltens P, ThompsonPM (2010) The clinical use of structural MRI in Alzheimerdisease. Nat Rev Neurol 6, 67-77.
[45] Braak H, Braak E (1996) Development of Alzheimer-relatedneurofibrillary changes in the neocortex inversely recapitu-lates cortical myelogenesis. Acta Neuropathol 92, 197-201.
[46] Ries ML, Carlsson CM, Rowley HA, Sager MA, GleasonCE, Asthana S, Johnson SC (2008) Magnetic resonanceimaging characterization of brain structure and function inmild cognitive impairment: a review. J Am Geriatr Soc 56,920-934.
[47] Alexopoulos P, Grimmer T, Perneczky R, Domes G, KurzA (2006) Progression to dementia in clinical subtypes ofmild cognitive impairment. Dement Geriatr Cogn Disord22, 27-34.
[48] Jack CR Jr, Shiung MM, Weigand SD, O’Brien PC, GunterJL, Boeve BF, Knopman DS, Smith GE, Ivnik RJ, TangalosEG, Petersen RC (2005) Brain atrophy rates predict sub-sequent clinical conversion in normal elderly and amnesticMCI. Neurology 65, 1227-1231.
[49] Jack CR Jr, Petersen RC, Xu Y, O’Brien PC, Smith GE,Ivnik RJ, Boeve BF, Tangalos EG, Kokmen E (2000) Ratesof hippocampal atrophy correlate with change in clinicalstatus in aging and AD. Neurology 55, 484-489.
[50] Jack CR Jr, Shiung MM, Gunter JL, O’Brien PC, WeigandSD, Knopman DS, Boeve BF, Ivnik RJ, Smith GE, Cha RH,Tangalos EG, Petersen RC (2004) Comparison of differ-ent MRI brain atrophy rate measures with clinical diseaseprogression in AD. Neurology 62, 591-600.
[51] Sluimer JD, van der Flier WM, Karas GB, Fox NC, ScheltensP, Barkhof F, Vrenken H (2008) Whole-brain atrophy rateand cognitive decline: longitudinal MR study of memoryclinic patients. Radiology 248, 590-598.
[52] Driscoll I, Davatzikos C, An Y, Wu X, Shen D, Kraut M,Resnick SM (2009) Longitudinal pattern of regional brainvolume change differentiates normal aging from MCI. Neu-rology 72, 1906-1913.
[53] McDonald CR Jr, McEvoy LK, Gharapetian L, Fennema-Notestine C, Hagler DJ Jr, Holland D, Koyama A, BrewerJB, Dale AM (2009) Regional rates of neocortical atrophyfrom normal aging to early Alzheimer disease. Alzheimer’sDisease Neuroimaging Initiative. Neurology 73, 457-465.
[54] Davatzikos C, Xu F, An Y, Fan Y, Resnick SM (2009) Longi-tudinal progression of Alzheimer’s-like patterns of atrophyin normal older adults: the SPARE-AD index. Brain 132,2026-2035.
[55] Nestor SM, Rupsingh R, Borrie M, Smith M, AccomazziV, Wells JL, Fogarty J, Bartha R, Alzheimer’s Disease Neu-roimaging, Initiative (2008) Ventricular enlargement as apossible measure of Alzheimer’s disease progression vali-dated using the Alzheimer’s disease neuroimaging initiativedatabase. Brain 131, 2443-2454.
[56] Carmichael OT, Kuller LH, Lopez OL, Thompson PM,Dutton RA, Lu A, Lee SE, Lee JY, Aizenstein HJ, MeltzerCC, Liu Y, Toga AW, Becker JT (2007) Cerebral ventricularchanges associated with transitions between normal cog-nitive function, mild cognitive impairment, and dementia.Alzheimer Dis Assoc Disord 21, 14-24.
[57] Jack CR Jr, Weigand SD, Shiung MM, Przybelski SA,O’Brien PC, Gunter JL, Knopman DS, Boeve BF, Smith GE,Petersen RC (2008) Atrophy rates accelerate in amnesticmild cognitive impairment. Neurology 70, 1740-1752.
[58] Evans MC, Barnes J, Nielsen C, Kim LG, Clegg SL, BlairM, Leung KK, Douiri A, Boyes RG, Ourselin S, Fox NC,Alzheimer’s Disease Neuroimaging, Initiative (2010) Vol-ume changes in Alzheimer’s disease and mild cognitiveimpairment: cognitive associations. Eur Radiol 20, 674-682.
[59] Carlson NE, Moore MM, Dame A, Howieson D, Silbert LC,Quinn JF, Kaye JA (2008) Trajectories of brain loss in agingand the development of cognitive impairment. Neurology70, 828-833.
[60] Jack CR Jr, Petersen RC, Xu Y, O’Brien PC, Smith GE, IvnikRJ, Tangalos EG, Kokmen E (1998) Rate of medial tempo-ral lobe atrophy in typical aging and Alzheimer’s disease.Neurology 51, 993-999.
[61] Laakso MP, Frisoni GB, Kononen M, Mikkonen M,Beltramello A, Geroldi C, Bianchetti A, Trabucchi M, Soini-nen H, Aronen HJ (2000) Hippocampus and entorhinalcortex in frontotemporal dementia and Alzheimer’s disease:a morphometric MRI study. Biol Psychiatry 47, 1056-1063.
[62] Chetelat G, Landeau B, Eustache F, Mezenge F, Viader F, dela Sayette V, Desgranges B, Baron JC (2005) Using voxel-based morphometry to map the structural changes associatedwith rapid conversion in MCI: a longitudinal MRI study.Neuroimage 27, 934-946.
[63] Apostolova LG, Dutton RA, Dinov ID, Hayashi KM, TogaAW, Cummings JL, Thompson PM (2006) Conversion ofmild cognitive impairment to Alzheimer disease predictedby hippocampal atrophy maps. Arch Neurol 63, 693-699.
[64] Whitwell JL, Przybelski SA, Weigand SD, Knopman DS,Boeve BF, Petersen RC, Jack CR Jr (2007) 3D mapsfrom multiple MRI illustrate changing atrophy patternsas subjects progress from mild cognitive impairment toAlzheimer’s disease. Brain 130, 1777-1786.
[65] Kaye JA, Moore MM, Dame A, Quinn J, Camicioli R,Howieson D, Corbridge E, Care B, Nesbit G, SextonG (2005) Asynchronous regional brain volume losses inpresymptomatic to moderate AD. J Alzheimers Dis 8, 51-56.
[66] Marquis S, Moore MM, Howieson DB, Sexton G, PayamiH, Kaye JA, Camicioli R (2002) Independent predictors ofcognitive decline in healthy elderly persons. Arch Neurol 59,601-606.
[67] Stoub TR, Rogalski EJ, Leurgans S, Bennett DA,deToledo-Morrell L (Aging) (2010) Rate of entorhinal andhippocampal atrophy in incipient and mild AD: relation tomemory function. Neurobiol Aging 31, 1089-1098.
[68] Wang L, Goldstein FC, Veledar E, Levey AI, Lah JJ, MeltzerCC, Holder CA, Mao H (2009) Alterations in cortical thick-ness and white matter integrity in mild cognitive impairmentmeasured by whole-brain cortical thickness mapping anddiffusion tensor imaging. AJNR Am J Neuroradiol 30, 893-899.
[69] Morra JH, Tu Z, Apostolova LG, Green AE, AvedissianC, Madsen SK, Parikshak N, Hua X, Toga AW, Jack CRJr, Schuff N, Weiner MW, Thompson PM, Alzheimer’sDisease Neuroimaging Initiative (2009) Automated 3Dmapping of hippocampal atrophy and its clinical correlatesin 400 subjects with Alzheimer’s disease, mild cognitiveimpairment, and elderly controls. Hum Brain Mapp 30,2766-2788.
[70] den Heijer T, van der Lijn F, Koudstaal PJ, Hofman A, vander Lugt A, Krestin GP, Niessen WJ, Breteler MM (2010)

V. Drago et al. / Disease Tracking Markers for AD at the Prodromal (MCI) Stage 193
A 10-year follow-up of hippocampal volume on magneticresonance imaging in early dementia and cognitive decline.Brain 133, 1163-1172.
[71] Singh V, Chertkow H, Lerch JP, Evans AC, Dorr AE, KabaniNJ (2006) Spatial patterns of cortical thinning in mildcognitive impairment and Alzheimer’s disease. Brain 129,2885-2893.
[72] Julkunen V, Niskanen E, Muehlboeck S, Pihlajamaki M,Kononen M, Hallikainen M, Kivipelto M, Tervo S, VanninenR, Evans A, Soininen H (2009) Cortical thickness analysisto detect progressive mild cognitive impairment: a referenceto Alzheimer’s disease. Dement Geriatr Cogn Disord 28,404-412.
[73] George S, Mufson EJ, Leurgans S, Shah RC, Ferrari C,Detoledo-Morrell L. (Epub ahead of print) MRI-basedvolumetric measurement of the substantia innominata inamnestic MCI and mild AD. Neurobiol Aging
[74] Muth K, Schonmeyer R, Matura S, Haenschel C, SchroderJ, Pantel J (2010) Mild cognitive impairment in the elderlyis associated with volume loss of the cholinergic basal fore-brain region. Biol Psychiatry 67, 588-591.
[75] Selkoe DJ (2002) Alzheimer’s disease is a synaptic failure.Science 298, 789-791.
[76] Hyman BT, Damasio AR, Van Hoesen GW, Barnes CL(1984) Alzheimer’s disease: cell-specific pathology isolatesthe hippocampal formation. Science 225, 1168-1170.
[77] Seeley WW, Crawford RK, Zhou J, Miller BL, GreiciusMD (2009) Neurodegenerative Diseases Target Large-ScaleHuman Brain Networks. Neuron 62, 42-52.
[78] Braak H, Braak E (1991) Neuropathological staging ofAlzheimerrelated changes. Acta Neuropathol. (Berl.) 82,239-259.
[79] Buckner RL, Snyder AZ, Shannon BJ, LaRossa G, SachsR, Fotenos AF, Sheline YI, Klunk WE, Mathis CA, MorrisJC, Mintun MA (2005) Molecular, structural, and functionalcharacterization of Alzheimer’s disease: evidence for a rela-tionship between default activity, amyloid, and memory.J Neurosci 25, 7709-7717.
[80] Greicius MD, Srivastava G, Reiss AL, Menon V (2004)Default-mode network activity distinguishes Alzheimer’sdisease from healthy aging: evidence from functional MRI.Proc Natl Acad Sci U S A 101, 4637-4642.
[81] Palop JJ, Chin J, Roberson ED, Wang J, Thwin MT, Bien-LyN, Yoo J, Ho KO, Yu GQ, Kreitzer A et al. (2007) Aberrantexcitatory neuronal activity and compensatory remodel-ing of inhibitory hippocampal circuits in mouse models ofAlzheimer’s disease. Neuron 55, 697-711.
[82] Palop JJ, Chin J, Mucke L (2006) A network dysfunctionperspective on neurodegenerative diseases. Nature 443, 768-773.
[83] Peltier SJ, Noll DC (2002) T(2)(*) dependence of lowfrequency functional connectivity. Neuroimage 16, 985-992.
[84] Fox MD, Raichle ME (2007) Spontaneous fluctuations inbrain activity observed with functional magnetic resonanceimaging. Nat Rev Neurosci 8, 700-711.
[85] Greicius MD, Krasnow B, Reiss AL, Menon V (2003) Func-tional connectivity in the resting brain: a network analysisof the default mode hypothesis. Proc Natl Acad Sci U S A100, 253-258.
[86] Beckmann CF, DeLuca M, Devlin JT, Smith SM (2005)Investigations into resting-state connectivity using indepen-dent component analysis. Philos Trans R Soc Lond B BiolSci 360, 1001-1013.
[87] Buckner RL, Andrews-Hanna JR, Schacter DL (2008) Thebrain’s default network: anatomy, function, and relevance todisease. Ann N Y Acad Sci 1124, 1-38.
[88] Rombouts SA, Barkhof F, Goekoop R, Stam CJ, ScheltensP (2005) Altered resting state networks in mild cognitiveimpairment and mild Alzheimer’s disease: an fMRI study.Hum Brain Mapp 26, 231-239.
[89] Qi Z, Wu X, Wang Z, Zhang N, Dong H, Yao L, Li K(2010) Impairment and compensation coexist in amnesticMCI default mode network. Neuroimage 50, 48-55.
[90] Gili T, Cercignani M, Serra L, Perri R, Giove F, MaravigliaB, Caltagirone C, Bozzali M (2011) Regional brain atrophyand functional disconnection across Alzheimer’s diseaseevolution. J Neurol Neurosurg Psychiatry 82, 58-66.
[91] Li SJ, Li Z, Wu G, Zhang MJ, Franczak M, Antuono PG(2002) Alzheimer disease: evaluation of a functional MRimaging index as a marker. Radiology 225, 253-259.
[92] Sorg C, Riedl V, Muhlau M, Calhoun VD, Eichele T, LaerL, Drzezga A, Forstl H, Kurz A, Zimmer C, WohlschlagerAM (2007) Selective changes of resting-state networks inindividuals at risk for Alzheimer’s disease. Proc Natl AcadSci U S A 104, 18760-18765.
[93] Wang L, Zang Y, He Y, Liang M, Zhang X, Tian L, Wu T,Jiang T, Li K (2006) Changes in hippocampal connectivityin the early stages of Alzheimer’s disease: evidence fromresting state fMRI. NeuroImage 31, 496-504.
[94] Wang K, Liang M, Wang L, Tian L, Zhang X, Li K, Jiang T(2007) Altered functional connectivity in early Alzheimer’sdisease: a resting-state fMRI study. Hum Brain Mapp 28,967-978.
[95] Zhang HY, Wang SJ, Xing J, Liu B, Ma ZL, Yang M, ZhangZJ, Teng GJ (2009) Detection of PCC functional connectiv-ity characteristics in resting-state fMRI in mild Alzheimer’sdisease. Behav Brain Res 197, 103-108.
[96] Supekar K, Menon V, Rubin D, Musen M, Greicius MD(2008) Network analysis of intrinsic functional brain con-nectivity in Alzheimer’s disease. PLoS Comput Biol 4,e1000100.
[97] Sanz-Arigita EJ, Schoonheim MM, Damoiseaux JS, Rom-bouts SA, Maris E, Barkhof F, Scheltens P, Stam CJ (2010)Loss of ’small-world’ networks in Alzheimer’s disease:graph analysis of FMRI resting-state functional connectiv-ity. PLoS One 5, e13788.
[98] Fellgiebel A, Schermuly I, Gerhard A, Keller I, AlbrechtJ, Weibrich C, Muller MJ, Stoeter P (2008) Functionalrelevant loss of long association fibre tracts integrity inearly Alzheimer’s disease. Neuropsychologia 46, 1698-1706.
[99] Kavcic V, Ni H, Zhu T, Zhong J, Duffy CJ (2008) Whitematter integrity linked to functional impairments in agingand elderly Alzheimer’s disease. Alzheimers Dement 4, 381-389.
[100] Delbeuck X, Van der Linden M, Collette F (2003)Alzheimer’s disease as a disconnection syndrome? Neu-ropsychol Rev 13, 79-92.
[101] Englund E, Brun A, Alling C (1988) White matter changes indementia of Alzheimer’s type. Biochemical and neuropatho-logical correlates. Brain 111, 1425-1439.
[102] Bronge L, Bogdanovic N, Wahlund LO (2002) Post-mortem MRI and histopathology of white matter changesin Alzheimer brains. A quantitative, comparative study.Dement Geriatr Cogn Disord 13, 205-212.
[103] Basser PJ, Mattiello J, LeBihan D (1994) MR diffusiontensor spectroscopy and imaging. Biophys J 66, 259-267.

194 V. Drago et al. / Disease Tracking Markers for AD at the Prodromal (MCI) Stage
[104] Beaulieu C (2002) The basis of anisotropic water diffusionin the nervous system - a technical review. NMR Biomed 15,435-55.
[105] Pierpaoli C, Barnett A, Pajevic S, Chen R, Penix LR, Virta A,Basser P (2001) Water diffusion changes in Wallerian degen-eration and their dependence on white matter architecture.Neuroimage 13, 1174-1185.
[106] Huang J, Friedland RP, Auchus AP (2007) Diffusion tensorimaging of normal-appearing white matter in mild cogni-tive impairment and early Alzheimer disease: preliminaryevidence of axonal degeneration in the temporal lobe. Am JNeuroradiol 28, 1943-1948.
[107] Salat DH, Tuch DS, van der Kouwe AJ, Greve DN, PappuV, Lee SY, Hevelone ND, Zaleta AK, Growdon JH, CorkinS, Fischl B, Rosas HD (2010) White matter pathology iso-lates the hippocampal formation in Alzheimer’s disease.Neurobiol Aging 31, 244-256.
[108] Pievani M, Agosta F, Pagani E, Canu E, Sala S, AbsintaM, Geroldi C, Ganzola R, Frisoni GB, Filippi M (2010)Assessment of white matter tract damage in mild cognitiveimpairment and Alzheimer’s disease. Hum Brain Mapp 31,1862-1875.
[109] Acosta-Cabronero J, Williams GB, Pengas G, Nestor PJ(2010) Absolute diffusivities define the landscape of whitematter degeneration in Alzheimer’s disease. Brain 133, 529-539.
[110] Bosch B, Arenaza-Urquijo EM, Rami L, Sala-Llonch R,Junque C, Sole-Padulles C, Pena-Gomez C, Bargallo N,Molinuevo JL, Bartres-Faz D (2010) Multiple DTI indexanalysis in normal aging, amnestic MCI and AD. Rela-tionship with neuropsychological performance. NeurobiolAging. doi:10.1016/j.neurobiolaging.2010.02.004
[111] Mielke MM, Kozauer NA, Chan KC, George M, Toroney J,Zerrate M, Bandeen-Roche K, Wang MC, Vanzijl P, Pekar JJ,Mori S, Lyketsos CG, Albert M (2009) Regionally-specificdiffusion tensor imaging in mild cognitive impairment andAlzheimer’s disease. Neuroimage 46, 47-55.
[112] Liu Y, Spulber G, Lehtimaki KK, ouml K, Kononen M,Hallikainen I, Grohn H, Kivipelto M, Hallikainen M, Van-ninen R, Soininen H (2009) Diffusion tensor imagingand Tract-Based Spatial Statistics in Alzheimer’s dis-ease and mild cognitive impairment. Neurobiol Aging.doi:10.1016/j.neurobiolaging.2009.10.006
[113] Zhang Y, Schuff N, Jahng GH, Bayne W, Mori S, Schad L,Mueller S, Du AT, Kramer JH, Yaffe K, Chui H, Jagust WJ,Miller BL, Weiner MW (2007) Diffusion tensor imaging ofcingulum fibers in mild cognitive impairment and Alzheimerdisease. Neurology 68, 13-19.
[114] Rose SE, McMahon KL, Janke AL, O’Dowd B, deZubicaray G, Strudwick MW, Chalk JB (2006) Diffusionindices on magnetic resonance imaging and neuropsycho-logical performance in amnestic mild cognitive impairment.J Neurol Neurosurg Psychiatry 77, 1122-1128.
[115] Kalus P, Slotboom J, Gallinat J, Mahlberg R, Cattapan-Ludewig K, Wiest R, Nyffeler T, Buri C, Federspiel A, KunzD, Schroth G, Kiefer C (2006) Examining the gateway to thelimbic system with diffusion tensor imaging: the perforantpathway in dementia. Neuroimage 30, 713-720.
[116] Kantarci K, Jack CR Jr, Xu YC, Campeau NG, O’BrienPC, Smith GE, Ivnik RJ, Boeve BF, Kokmen E, TangalosEG, Petersen RC (2001) Mild cognitive impairment andAlzheimer disease: regional diffusivity of water. Radiology219, 101-107.
[117] Muller MJ, Greverus D, Dellani PR, Weibrich C, WillePR, Scheurich A, Stoeter P, Fellgiebel A (2005) Functionalimplications of hippocampal volume and diffusivity in mildcognitive impairment. Neuroimage 28, 1033-1042.
[118] Fellgiebel A, Wille P, Muller MJ, Winterer G, Scheurich A,Vucurevic G, Schmidt LG, Stoeter P (2004) Ultrastructuralhippocampal and white matter alterations in mild cogni-tive impairment: a diffusion tensor imaging study. DementGeriatr Cogn Disord 18, 101-108.
[119] Cho H, Yang DW, Shon YM, Kim BS, Kim YI, Choi YB, LeeKS, Shim YS, Yoon B, Kim W, Ahn KJ (2008) Abnormalintegrity of corticocortical tracts in mild cognitive impair-ment: a diffusion tensor imaging study. J Korean Med Sci23, 477-483.
[120] Stenset V, Bjørnerud A, Fjell AM, Walhovd KB, Hofoss D,Tønnessen P, Gjerstad L, Fladby T (2011) Cingulum fiberdiffusivity and CSF T-tau in patients with subjective andmild cognitive impairment. Neurobiol Aging 32, 581-589.
[121] Bai F, Zhang Z, Watson DR, Yu H, Shi Y, Yuan Y, Qian Y,Jia J (2009) Abnormal integrity of association fiber tractsin amnestic mild cognitive impairment. J Neurol Sci 278,102-106.
[122] Fellgiebel A, Muller MJ, Wille P, Dellani PR, Scheurich A,Schmidt LG, Stoeter P (2005) Color-coded diffusion-tensor-imaging of posterior cingulate fiber tracts in mild cognitiveimpairment. Neurobiol Aging 26, 1193-1198.
[123] Kiuchi K, Morikawa M, Taoka T, Nagashima T, YamauchiT, Makinodan M, Norimoto K, Hashimoto K, Kosaka J,Inoue Y, Inoue M, Kichikawa K, Kishimoto T (2009)Abnormalities of the uncinate fasciculus and posterior cin-gulate fasciculus in mild cognitive impairment and earlyAlzheimer’s disease: a diffusion tensor tractography study.Brain Res 1287, 184-191.
[124] Stahl R, Dietrich O, Teipel SJ, Hampel H, Reiser MF,Schoenberg SO (2007) White matter damage in Alzheimerdisease and mild cognitive impairment: assessment withdiffusion-tensor MR imaging and parallel imaging tech-niques. Radiology 243, 483-492.
[125] Ukmar M, Makuc E, Onor ML, Garbin G, Trevisiol M, CovaMA (2008) Evaluation of white matter damage in patientswith Alzheimer’s disease and in patients with mild cognitiveimpairment by using diffusion tensor imaging. Radiol Med113, 915-922.
[126] Chen TF, Lin CC, Chen YF, Liu HM, Hua MS, Huang YC,Chiu MJ (2009) Diffusion tensor changes in patients withamnesic mild cognitive impairment and various dementias.Psychiatry Res 173, 15-21.
[127] Concha L, Gross DW, Beaulieu C (2005) Diffusion tensortractography of the limbic system. AJNR Am J Neuroradiol26, 2267-2274.
[128] Chen TF, Chen YF, Cheng TW, Hua MS, Liu HM, Chiu MJ(2009) Executive dysfunction and periventricular diffusiontensor changes in amnesic mild cognitive impairment andearly Alzheimer’s disease. Hum Brain Mapp 30, 3826-3836.
[129] Damoiseaux JS, Smith SM, Witter MP, Sanz-Arigita EJ,Barkhof F, Scheltens P, Stam CJ, Zarei M, Rombouts SA(2009) White matter tract integrity in aging and Alzheimer’sdisease. Hum Brain Mapp 30, 1051-1059.
[130] Di Paola M, Di Iulio F, Cherubini A, Blundo C, CasiniAR, Sancesario G, Passafiume D, Caltagirone C, Spalletta G(2010) When, where, and how the corpus callosum changesin MCI and AD: a multimodal MRI study. Neurology 74,1136-1142.

V. Drago et al. / Disease Tracking Markers for AD at the Prodromal (MCI) Stage 195
[131] Cherubini A, Spoletini I, Peran P, Luccichenti G, Di PaolaM, Sancesario G, Gianni W, Giubilei F, Bossu P, SabatiniU, Caltagirone C, Spalletta G (2010) A multimodal MRIinvestigation of the subventricular zone in mild cognitiveimpairment and Alzheimer’s disease patients. Neurosci Lett469, 214-218.
[132] Qiu A, Oishi K, Miller MI, Lyketsos CG, Mori S, AlbertM (2010) Surface-based analysis on shape and fractionalanisotropy of white matter tracts in Alzheimer’s disease.PLoS One 5, e9811.
[133] Nordberg A (2008) Amyloid plaque imaging in vivo: cur-rent achievement and future prospects. Eur J Nucl Med MolImaging 35, 846-850.
[134] Villemagne VL, Fodero-Tavoletti MT, Pike KE, Cappai R,Masters CL, Rowe CC (2008) The ART of Loss: A� Imagingin the Evaluation of Alzheimer’s Disease and other Demen-tias. Mol Neurobiol 38, 1-15.
[135] Jagust WJ, Landau SM, Shaw LM, Trojanowski JQ, KoeppeRA, Reiman EM, Foster NL, Petersen RC, Weiner MW,Price JC, Mathis CA (2009) Alzheimer’s Disease Neu-roimaging Initiative. Relationships between biomarkers inaging and dementia. Neurology 73, 1193-1199.
[136] Klunk WE, Mathis CA (2008) The future of amyloid-betaimaging: a tale of radionuclides and tracer proliferation.Curr Opin Neurol 21, 683-687.
[137] Lopresti BJ, Klunk WE, Matthis CA, Hoge JA, Ziolko SK,Lu X, Meltzer CC, Schimmel K, Tsopelas ND, DeKoskyST, Price JC (2005) Simplified quantification of Pittsburgcompound B amyloid imaging PET studies: a comparativestudy. J Nucl Med 46, 1959-1972.
[138] Vandenberghe R, Van Laere K, Ivanoiu A, Salmon E, BastinC, Triau E, Hasselbalch S, Law I, Andersen A, Korner A,Minthon L, Garraux G, Nelissen N, Bormans G, Buckley C,Owenius R, Thurfjell L, Farrar G, Brooks DJ (2010) 18F-flutemetamol amyloid imaging in Alzheimer disease andmild cognitive impairment: a phase 2 trial. Ann Neurol 68,319-329.
[139] Braskie MN, Klunder AD, Hayashi KM, Protas H, KepeV, Miller KJ, Huang SC, Barrio JR, Ercoli LM, Siddarth P,Satyamurthy N, Liu J, Toga AW, Bookheimer SY, Small GW,Thompson PM (2010) Plaque and tangle imaging and cog-nition in normal aging and Alzheimer’s disease. NeurobiolAging 31, 1669-1678.
[140] Shin J, Lee SY, Kim SJ, Kim SH, Cho SJ, Kim YB (2010)Voxel-based analysis of Alzheimer’s disease PET imagingusing a triplet of radiotracers: PIB, FDDNP, and FDG. Neu-roImage 52, 488-496.
[141] Rowe CC, Ackerman U, Browne W, Mulligan R, Pike KL,O’Keefe G, Tochon-Danguy H, Chan G, Berlangieri SU,Jones G, Dickinson-Rowe KL, Kung HP, Zhang W, KungMP, Skovronsky D, Dyrks T, Holl G, Krause S, FriebeM, Lehman L, Lindemann S, Dinkelborg LM, MastersCL, Villemagne VL (2008) Imaging of amyloid [beta] inAlzheimer’s disease with 18F-BAY94-9172, a novel PETtracer: proof of mechanism. Lancet Neurology 7, 129-135.
[142] Koole M, Lewis DM, Buckley C, Nelissen N, Vandenbul-cke M, Brooks DJ, Vandenberghe R, Van Laere K (2009)Whole-Body Biodistribution and Radiation Dosimetry of18F-GE067: A Radioligand for In Vivo Brain AmyloidImaging. J Nucl Med 50, 818-822.
[143] Wong DF, Rosenberg PB, Zhou Y, Kumar A, RaymontV, Ravert HT, Dannals RF, Nandi A, Brasic JR, Ye W,Hilton J, Lyketsos C, Kung HF, Joshi AD, Skovronsky DM,
Pontecorvo MJ (2010) In vivo imaging of amyloid deposi-tion in Alzheimer disease using the radioligand 18F-AV-45(flobetapir F 18). J Nucl Med 51, 913-920.
[144] Clark CM, Schneider JA, Bedell BJ, Beach TG, Bilker WB,Mintun MA, Pontecorvo MJ, Hefti F, Carpenter AP, FlitterML, Krautkramer MJ, Kung HF, Coleman RE, DoraiswamyPM, Fleisher AS, Sabbagh MN, Sadowsky CH, ReimanPE, Zehntner SP, Skovronsky DM (2011) AV45-A07 StudyGroup. Use of florbetapir-PET for imaging beta-amyloidpathology. JAMA 305, 275-283.
[145] Yao CH, Lin KJ, Weng CC, Hsiao IT, Ting YS, Yen TC,Jan TR, Skovronsky D, Kung MP, Wey SP (2010) GMP-compliant automated synthesis of [(18)F]AV-45 (FlorbetapirF 18) for imaging beta-amyloid plaques in human brain.Appl Radiat Isot 68, 2293-2297.
[146] Liu Y, Zhu L, Plossl K, Choi SR, Qiao H, Sun X, Li S, Zha Z,Kung HF (2010) Optimization of automated radiosynthesisof [18F]AV-45: a new PET imaging agent for Alzheimer’sdisease. Nucl Med Biol 37, 917-925.
[147] Jureus A, Swahn BM, Sandell J, Jeppsson F, Johnson AE,Johnstrom P, Neelissen JA, Sunnemark D, Farde L, SvenssonSP (2010) Characterization of AZD4694, a novel fluorinatedAbeta plaque neuroimaging PET radioligand. J Neurochem114, 784-794.
[148] Cselenyi Z, Jonhagen ME, Forsberg A, Halldin C,Julin P, Schou M, Johnstrom P, Varnas K, Svensson S,Farde L (2010) Clinical validation of [18F]AZD4694, anovel amyloid-specific PET radioligand. 11th InternationalGeneva/Springfield Symposium on Advances in AlzheimerTherapy Geneva, Switzerland.
[149] Reiman E (2010) (18F)AZD4694 Amyloid PET studies inpresymptomatic and Alzheimer disease patients. 11th Inter-national Geneva/Springfield Symposium on Advances inAlzheimer Therapy Geneva, Switzerland.
[150] Wey SP, Weng CC, Lin KJ, Yao CH, Yen TC, Kung HF,Skovronsky D, Kung MP (2009) Validation of an 18F-labeled biphenylalkyne as a positron emission tomographyimaging agent for beta-amyloid plaques. Nucl Med Biol 36,411-417.
[151] Serdons K, Verduyckt T, Vanderghinste D, Cleynhens J,Borghgraef P, Vermaelen P, Terwinghe C, Van Leuven F, VanLaere K, Kung H, Bormans G, Verbruggen A (2009) Synthe-sis of 18F-labelled 2-(4′-fluorophenyl)-1,3-benzothiazoleand evaluation as amyloid imaging agent in comparison with[11C]PIB. Bioorg Med Chem Lett 19, 602-605.
[152] Jack CR, Lowe VJ, Weigand SD, Wiste HJ, Senjem ML,Knopman DS, Shiung MM, Gunter JL, Boeve BF, Kemp BJ,Weiner M, Petersen RC, Alzheimer’s Disease Neuroimag-ing, Initiative (2009) Serial PIB and MRI in normal, mildcognitive impairment and Alzheimer’s disease: implicationsfor sequence of pathological events in Alzheimer’s disease.Brain 132, 1355-1365.
[153] Villemagne VL, Pike KE, Chetelat G, Ellis KA, MulliganRS, Bourgeat P, Ackermann U, Jones G, Szoeke C, SalvadoO, Martins R, O’Keefe G, Mathis CA, Klunk WE, AmesD, Masters CL, Rowe CC (2011) Longitudinal assessmentof Aβ and cognition in aging and Alzheimer disease.Ann Neurol 69, 181-192.
[154] Pike KE, Savage G, Villemagne VL, Ng S, Moss SA, MaruffP, Mathis CA, Klunk WE, Masters CL, Rowe CC (2007)�-amyloid imaging and memory in non-demented individu-als: evidence for preclinical Alzheimer’s disease. Brain 130,2837-2844.

196 V. Drago et al. / Disease Tracking Markers for AD at the Prodromal (MCI) Stage
[155] Scheinin NM, Aalto S, Koikkalainen J, Lotjonen J, Kar-rasch M, Kemppainen N, Viitanen M, Nagren K, Helin S,Scheinin M, Rinne JO (2009) Follow-up of [11C]PIB uptakeand brain volume in patients with Alzheimer disease andcontrols. Neurology 73, 1186-1192.
[156] Small GW, Kepe V, Ercoli LM, Siddarth P, Bookheimer SY,Miller KJ, Lavretsky H, Burggren AC, Cole GM, VintersHV, Thompson PM, Huang SC, Satyamurthy N, Phelps ME,Barrio JR (2006) PET of brain amyloid and tau in mildcognitive impairment. N Engl J Med 355, 2652-2663.
[157] Tolboom N, Yaqub M, van der Flier WM, Boellaard R,Luurtsema G, Windhorst AD, Barkhof F, Scheltens P,Lammertsma AA, van Berckel BN (2009) Detection ofAlzheimer pathology in vivo using both 11C-PIB and 18F-FDDNP PET. J Nucl Med 50, 191-197.
[158] Forsberg A, Engler H, Almkvist O, Blomquist G, HagmanG, Wall A, Ringheim A, aring L, A, Langstrom B, Nord-berg A (2008) Pet imaging of amyloid deposition in patientswith mild cognitive impairment. Neurobiol Aging 29, 1456-1465.
[159] Kemppainen NM, Aalto S, Wilson IA, Nagren K, Helin S,Bruck A, Oikonen V, Kailajarvi M, Scheinin M, Viitanen M,Parkkola R, Rinne JO (2007) PET amyloid ligand [11C]PIBuptake is increased in mild cognitive impairment. Neurology68, 1603-1606.
[160] Engler H, Forsberg A, Almkvist O, Blomquist G, LarssonE, Savitcheva I, Wall A, Ringheim A, Langstrom B, Nord-berg A (2006) Two year follow-up of amyloid deposition inpatients with Alzheimer’s disease. Brain 129, 2856-2866.
[161] Small GW, Kepe V, Ercoli LM, Siddarth P, Bookheimer SY,Miller KJ, Lavretsky H, Burggren AC, Cole GM, VintersHV, Thompson PM, Huang SC, Satyamurthy N, Phelps ME,Barrio JR (2006) PET of brain amyloid and tau in mildcognitive impairment. N Engl J Med 355, 2652-2663.
[162] Berger H (1929) U ber das Elektroenkephalogramm desMenschen. Archiv fur Psychiatrie und Nervenkrankheiten87, 527-570.
[163] Berger H (1938) Das Elektroenkephalogramm des Men-schen. Halle an der Saale, Buchdruckerei des Waisenhauses.Nova acta Leopoldina Neue Folge 6(38).
[164] Rossini PM, Dal Forno G (2004) Integrated technology forevaluation of brain function and neural plasticity. Phys MedRehabil Clin N Am 15, 263-306.
[165] Celesia GG, Kaufman D, Cone S (1987) Effects of age andsex on pattern electroretinograms and visual evoked poten-tials. Electroencephalogr Clin Neurophysiol 68, 161-171.
[166] Rossini PM (2009) Implications of brain plasticity to brain-machine interfaces operation a potential paradox? Int RevNeurobiol 86, 81-90.
[167] Rossini PM, Rossi S, Babiloni C, Polich J (2007) Clini-cal neurophysiology of aging brain: from normal aging toneurodegeneration. Prog Neurobiol 83, 375-400.
[168] Nunez PL (2000) Toward a quantitative description of large-scale neocortical dynamic function and EEG. Behav BrainSci 23, 371-398.
[169] Babiloni F, Carducci F, Cincotti F, Del Gratta C, PizzellaV, Romani GL, Rossini PM, Tecchio F, Babiloni C (2001)Linear inverse source estimate of combined EEG and MEGdata related to voluntary movements. Hum Brain Mapp 14,197-209.
[170] Babiloni F, Babiloni C, Fattorini L, Carducci F, OnoratiP, Urbano A (1995) Performances of surface Laplacianestimators: a study of simulated and real scalp potentialdistributions. Brain Topogr 8, 35-45.
[171] Babiloni F, Babiloni C, Carducci F, Fattorini L, Onorati P,Urbano A (1996) Spline Laplacian estimate of EEG poten-tials over a realistic magnetic resonance-constructed scalpsurface model. Electroencephalogr Clin Neurophysiol 98,363-373.
[172] Babiloni F, Babiloni C, Carducci F, Cincotti F, Rossini PM(2003) ‘The stone of madness’ and the search for the corticalsources of brain diseases with non-invasive EEG techniques.Clin Neurophysiol 114, 1775-1780.
[173] Nunez PL, Srinivasan R (2006). In Electric Fields of theBrain: The Neurophysics of EEG, Oxford University Press,New York, USA.
[174] Nunez PL (1995). In Neocortical Dynamics and HumanEEG Rhythms, Oxford University Press, New York, USA.
[175] Kaminski MJ, Blinowska KJ (1991) A new method of thedescription of the information flow in the structures. BiolCybern 65, 203-210.
[176] Kaminski MJ, Blinowska KJ, Szclenberger W (1997) Topo-graphic analysis of coherence and propagation of EEGactivity during sleep and wakefulness. ElectroencephalogrClin Neurophysiol 102, 216-227.
[177] Korzeniewska A, Kasicki S, Kaminski M, Blinowska KJ(1997) Information flow between hippocampus and relatedstructures during various types of rat’s behavior. J NeurosciMethods 73, 49-60.
[178] Mima T, Matsuoka T, Hallett M (2000) Functional couplingof human right and left cortical motor areas demonstratedwith partial coherence analysis. Neurosci Lett 287, 93-96.
[179] Babiloni C, Vecchio F, Babiloni F, Brunelli GA, Car-ducci F, Cincotti F, Pizzella V, Romani GL, Tecchio FT,Rossini PM (2004) Coupling between “hand” primary sen-sorimotor cortex and lower limb muscles after ulnar nervesurgical transfer in paraplegia. Behav Neurosci 118, 214-222.
[180] Babiloni C, Babiloni F, Carducci F, Cincotti F, Vecchio F,Cola B, Rossi S, Miniussi C, Rossini PM (2004) Functionalfrontoparietal connectivity during short-term memory asrevealed by high-resolution EEG coherence analysis. BehavNeurosci 118, 687-697.
[181] Pascual-Marqui RD, Michel CM, Lehmann D (1994) Lowresolution electromagnetic tomography: a new method forlocalizing electrical activity in the brain. Int J Psychophysiol18, 49-65.
[182] Pascual-Marquiı RD, Lehmann D, Koenig T, Kochi K,Merlo MC, Hell D, Koukkou M (1999) Low resolutionbrain electromagnetic tomography (LORETA) functionalimaging in acute, neurolepticnaive, first-episode, productiveschizophrenia. Psychiatry Res 90, 169-179.
[183] Pascual-Marqui RD, Esslen M, Kochi K, Lehmann D (2002)Functional imaging with low resolution brain electromag-netic tomography (LORETA): a review. Methods Find ExpClin Pharmacol 24, 91-95.
[184] Isotani T, Tanaka H, Lehmann D, Pascual-Marqui RD, KochiK, Saito N, Yagyu T, Kinoshita T, Sasada K (2001) Sourcelocalization of EEG activity during hypnotically inducedanxiety and relaxation. Int J Psychophysiol 41, 143-153.
[185] Mientus S, Gallinat J, Wuebben Y, Pascual-Marqui RD,Mulert C, Frick K, Dorn H, HerrmannWM, WintererG (2002) Cortical hypoactivation during resting EEG inschizophrenics but not in depressives and schizotypalsubjects as revealed by low resolution electromagnetictomography (LORETA). Psychiatry Res 116, 95-111.
[186] Babiloni C, Binetti G, Cassetta E, Cerboneschi D, Dal FornoG, Del Percio C, Ferreri F, Ferri R, Lanuzza B, Miniussi C,

V. Drago et al. / Disease Tracking Markers for AD at the Prodromal (MCI) Stage 197
Moretti DV, Nobili F, Pascual-Marqui RD, Rodriguez G,Romani GL, Salinari S, Tecchio F, Vitali P, Zanetti O, Zap-pasodi F, Rossini PM (2004) Mapping distributed sources ofcortical rhythms in mild Alzheimer’s disease. A multicentricEEG study. Neuroimage 22, 57-67.
[187] Saletu M, Anderer P, Saletu-Zyhlarz GM, Mandl M, ArnoldO, Zeitlhofer J, Saletu B (2004) EEG-tomographic studieswith LORETA on vigilance differences between narcolepsypatients and controls and subsequent double-blind, placebo-controlled studies with modafinil. J Neurol 251, 1354-1363.
[188] Dujardin K, Bourriez JL, Guieu JD (1994) Event-relateddesynchronization (ERD) patterns during verbal memorytasks: effect of age. Int J Psychophysiol 16, 17-27.
[189] Dujardin K, Bourriez JL, Guieu JD (1995) Event-related desynchronization (ERD) patterns during memoryprocesses: effects of aging and task difficulty. Electroen-cephalogr Clin Neurophysiol 96, 169-182.
[190] Klass DW, Brenner RP (1995) Electroencephalography ofthe elderly. J Clin Neurophysiol 12, 116-131.
[191] Klimesch W (1999) EEG alpha and theta oscillations reflectcognitive and memory performance: a review and analysis.Brain Res Rev 29, 169-195.
[192] Babiloni C, Binetti G, Cassarono A, Dal Forno G, DelPercio C, Ferreri F, Ferri R, Frisoni G, Galderisi S, HirataK, Lanuzza B, Miniassi C, Mucci A, Nobili F, RodriguezG, Romani GL, Rossigni PM (2006) Sources of corticalrhythms in adults during physiological aging: a multicentricEEG study. Hum Brain Mapp 27, 162-172.
[193] Jelic V, Johansson SE, Almkvist O, Shigeta M, Julin P,Nordberg A, Winblad B, Wahlund LO (2000) Quantitativeelectroencephalography in mild cognitive impairment: lon-gitudinal changes and possible prediction of Alzheimer’sdisease. Neurobiol Aging 21, 533-540.
[194] Coben LA, Danziger W, Storandt M (1985) A longitudi-nal EEG study of mild senile dementia of Alzheimer type:changes at 1 year and at 2.5 years. Electroencephalogr ClinNeurophysiol 61, 101-112.
[195] Soininen H, Partanen J, Laulumaa V, Helkala EL, Laakso M,Riekkinen PJ (1989) Longitudinal EEG spectral analysis inearly stage of Alzheimer’s disease. Electroencephalogr ClinNeurophysiol 72, 290-297.
[196] Luckhaus C, Grass-Kapanke B, Blaeser I, Ihl R, SupprianT, Winterer G, Zielasek J, Brinkmeyer J (2008) QuantitativeEEG in progressing vs stable mild cognitive impairment(MCI): results of a 1-year follow-up study. Int J GeriatrPsychiatry 23, 1148-1155.
[197] Huang C, Wahlund L, Dierks T, Julin P, Winblad B, JelicV (2000) Discrimination of Alzheimer’s disease and mildcognitive impairment by equivalent EEG sources: a cross-sectional and longitudinal study. Clin Neurophysiol 111,1961-1967.
[198] Jeong J (2004) EEG dynamics in patients with Alzheimer’sdisease. Clin Neurophysiol 115, 1490-1505.
[199] Babiloni C, Binetti G, Cassetta E, Dal Forno G, Del Percio C,Ferreri F, Ferri R, Frisoni G, Hirata K, Lanuzza B, MiniussiC, Moretti DV, Nobili F, Rodriguez G, Romani GL, SalinariS, Rossini PM (2006) Sources of cortical rhythms change asa function of cognitive impairment in pathological aging: amulticenter study. Clin Neurophysiol 117, 252-268.
[200] Babiloni C, Frisoni GB, Pievani M, Vecchio F, Lizio R,Buttiglione M, Geroldi C, Fracassi C, Eusebi F, FerriR, Rossini PM (2009) Hippocampal volume and corticalsources of EEG alpha rhythms in mild cognitive impairmentand Alzheimer disease. Neuroimage 44, 123-135.
[201] Babiloni C, Frisoni GB, Vecchio F, Pievani M, Geroldi C,De Carli C, Ferri R, Vernieri F, Lizio R, Rossini PM (2010)Global functional coupling of resting EEG rhythms is relatedto white-matter lesions along the cholinergic tracts in sub-jects with amnesic mild cognitive impairment. J AlzheimersDis 19, 859-871.
[202] Babiloni C, Ferri R, Binetti G, Cassarino A, Dal Forno G,Ercolani M, Ferreri F, Frisoni GB, Lanuzza B, Miniussi C,Nobili F, Rodriguez G, Rundo F, Stam CJ, Musha T, Vec-chio F, Rossini PM (2006) Fronto-parietal coupling of brainrhythms in mild cognitive impairment: a multicentric EEGstudy. Brain Res Bull 69, 63-73.
[203] Babiloni C, Ferri R, Binetti G, Vecchio F, Frisoni GB,Lanuzza B, Miniussi C, Nobili F, Rodriguez G, Rundo F,Cassarino A, Infarinato F, Cassetta E, Salinari S, Eusebi F,Rossini PM (2009) Directionality of EEG synchronization inAlzheimer’s disease subjects. Neurobiol Aging 30, 93-102.
[204] Babiloni C, Frisoni GB, Pievani M, Vecchio F, InfarinatoF, Geroldi C, Salinari S, Ferri R, Fracassi C, Eusebi F,Rossini PM (2008) White matter vascular lesions are relatedto parietal-to-frontal coupling of EEG rhythms in mild cog-nitive impairment. Hum Brain Mapp 29, 1355-1367.
[205] Babiloni C, Binetti G, Cassetta E, Cerboneschi D, Dal FornoG, Del Percio C, Ferreri F, Ferri R, Lanuzza B, Miniussi C,Moretti DV, Nobili F, Pascual-Marqui RD, Rodriguez G,Romani GL, Salinari S, Tecchio F, Vitali P, Zanetti O, Zap-pasodi F, Rossini PM (2004) Mapping distributed sources ofcortical rhythms in mild Alzheimer’s disease. A multicentricEEG study. Neuroimage 22, 57-67.
[206] Polich J, Corey-Bloom J (2005) Alzheimer’s disease andP300: review and evaluation of task and modality. CurrAlzheimer Res 2, 515-525.
[207] Papaliagkas V, Kimiskidis V, Tsolaki M, Anogianakis G(2008) Usefulness of event-related potentials in the assess-ment of mild cognitive impairment. BMC Neurosci 9, 107.
[208] Pogarell O, Mulert C, Hegerl U (2006) Event related poten-tials and fMRI in neuropsychopharmacology. Clin EEGNeurosci 37, 99-107.
[209] Meador KJ, Loring DW, Davis HC, Sethi KD, Patel BR,Adams RJ, Hammond EJ (1989) Cholinergic and seroton-ergic effects on the P3 potential and recent memory. J ClinExp Neuropsychol 11, 252-260.
[210] Katada E, Sato K, Sawaki A, Dohi Y, Ueda R, Ojika K (2003)Long-term effects of donepezil on P300 auditory event-related potentials in patients with Alzheimer’s disease. JGeriatr Psychiatry Neurol 16, 39-43.
[211] Neshige R, Barrett G, Shibasaki H (1988) Auditory longlatency event-related potentials in Alzheimer’s disease andmulti-infarct dementia. J Neurol Neurosurg Psychiatry 51,1120-1125.
[212] Onofrj M, Thomas A, Luciano AL, Iacono D, Di RolloA, D’Andreamatteo G, Di Iorio A (2002) Donepezil ver-sus vitamin E in Alzheimer’s disease: Part 2: mild versusmoderate-severe Alzheimer’s disease. Clin Neuropharma-col 25, 207-215.
[213] Reeves RR, Struve FA, Patrick G, Booker JG, Nave DW(1999) The effects of donepezil on the P300 auditoryand visual cognitive evoked potentials of patients withAlzheimer’s disease. Am J Geriatr Psychiatry 7, 349-352.
[214] Thomas A, Iacono D, Bonanni L, D’Andreamatteo G,Onofrj M (2001) Donepezil, rivastigmine, and vitaminE in Alzheimer disease: a combined P300 event-relatedpotentials/neuropsychologic evaluation over 6 months. ClinNeuropharmacol 24, 31-42.

198 V. Drago et al. / Disease Tracking Markers for AD at the Prodromal (MCI) Stage
[215] Werber AE, Klein C, Rabey JM (2001) Evaluation of cholin-ergic treatment in demented patients by P300 evoked relatedpotentials. Neurol Neurochir Pol 35, 37-43.
[216] Werber EA, Gandelman-Marton R, Klein C, Rabey JM(2003) The clinical use of P300 event related potentialsfor the evaluation of cholinesterase inhibitors treatment indemented patients. J Neural Transm 110, 659-669.
[217] Hegerl U, Moller HJ (1997) Electroencephalography as adiagnostic instrument in Alzheimer’s disease: reviews andperspectives. Int Psychogeriatr 9, 237-246.
[218] Golob EJ, Ringman JM, Irimajiri R, Bright S, Schaffer B,Medina LD, Starr A (2009) Cortical event-related poten-tials in preclinical familial Alzheimer disease. Neurology73, 1649-1655.
[219] Green J, Levey AI (1999) Event-related potential changes ingroups at increased risk for Alzheimer disease. Arch Neurol56, 1398-1403.
[220] Espeseth T, Rootwelt H, Reinvang I (2009) Apolipoprotein Emodulates auditory event-related potentials in healthy aging.Neurosci Lett 459, 91-95.
[221] Chapman RM, McCrary JW, Gardner MN, SandovalTC, Guillily MD, Reilly LA, Degrush E (2009) BrainERP components predict which individuals progress toAlzheimer’s disease and which do not. Neurobiol Aging.doi:10.1016/j.neurobiolaging.2009.11.010
[222] Gironell A, Garcia-Sanchez C, Estevez-Gonzalez A, BoltesA, Kulisevsky J (2005) Usefulness of p300 in subjectivememory complaints: a prospective study. J Clin Neurophys-iol 22, 279-284.
[223] Golob EJ, Irimajiri R, Starr A (2007) Auditory cortical activ-ity in amnestic mild cognitive impairment: relationship tosubtype and conversion to dementia. Brain 130, 740-752.
[224] Olichney JM, Taylor JR, Gatherwright J, Salmon DP,Bressler AJ, Kutas M, Iragui-Madoz VJ (2008) Patientswith MCI and N400 or P600 abnormalities are at veryhigh risk for conversion to dementia. Neurology 70, 1763-1770.
[225] Lai CL, Lin RT, Liou LM, Liu CK (2010) The role ofevent-related potentials in cognitive decline in Alzheimer’sdisease. Clin Neurophysiol 121, 194-199.
[226] Papaliagkas, VT, Kimiskidis, VK, Tsolaki, MN,Anogianakis G. Cognitive event-related potentials: Long-itudinal changes in mild cognitive impairment. Clin.Neurophysiol. doi:10.1016/j.clinph.2010.12.036
[227] Ray PG, Meador KJ, Loring DW (1992) Diazepam effectson the P3 event-related potential. J Clin Psychopharmacol12, 415-419.
[228] Ball SS, Marsh JT, Schubarth G, Brown WS, Strandburg R(1989) Longitudinal P300 latency changes in Alzheimer’sdisease. J Gerontol 44, M195-M200.
[229] Onofrj M, Gambi D, Del Re ML, Fulgente T, BazzanoS, Colamartino P, Malatesta G (1991) Mapping of event-related potentials to auditory and visual odd-ball paradigmsin patients affected by different forms of dementia. EurNeurol 31, 259-269.
[230] St Clair D, Blackburn I, Blackwood D, Tyrer G (1988) Mea-suring the course of Alzheimer’s disease. A longitudinalstudy of neuropsychological function and changes in P3event-related potential. Br J Psychiatry 152, 48-54.
[231] Swanwick GR, Rowan MJ, Coen RF, Lawlor BA, CoakleyD (1997) Measuring cognitive deterioration in Alzheimer’sdisease. Br J Psychiatr 170, 580.
[232] Polich J, Ehlers CL, Otis S, Mandell AJ, Bloom FE (1986)P300 latency reflects the degree of cognitive decline in
dementing illness. Electroencephalogr Clin Neurophysiol63, 138-144.
[233] Polich J, Herbst KL (2000) P300 as a clinical assay: ratio-nale, evaluation, and findings. Int J Psychophysiol 38, 3-19.
[234] Golob EJ, Johnson JK, Starr A (2002) Auditory event-related potentials during target detection are abnormal inmild cognitive impairment. Clin Neurophysiol 113, 151-161.
[235] Bennys K, Portet F, Touchon J, Rondouin G (2007) Diag-nostic value of event-related evoked potentials N200 andP300 subcomponents in early diagnosis of Alzheimer’s dis-ease and mild cognitive impairment. J Clin Neurophysiol24, 405-412.
[236] Li X, Shao X, Wang N, Wang T, Chen G, Zhou H (2010)Correlation of auditory event-related potentials and mag-netic resonance spectroscopy measures in mild cognitiveimpairment. Brain Res 1346, 204-212.
[237] Frodl T, Hampel H, Juckel G, Burger K, Padberg F, EngelRR, Moller HJ, Hegerl U (2002) Value of event-related P300subcomponents in the clinical diagnosis of mild cognitiveimpairment and Alzheimer’s Disease. Psychophysiology 39,175-181.
[238] van Deursen JA, Vuurman EF, Smits LL, Verhey FR, RiedelWJ (2009) Response speed, contingent negative variationand P300 in Alzheimer’s disease and MCI. Brain Cogn 69,592-599.
[239] Olichney JM, Hillert DG (2004) Clinical applications ofcognitive event-related potentials in Alzheimer’s disease.Phys Med Rehabil Clin N Am 15, 205-233.
[240] Missonnier P, Deiber MP, Gold G, Herrmann FR, MilletP, Michon A, Fazio-Costa L, Ibanez V, GiannakopoulosP (2007) Working memory load-related electroencephalo-graphic parameters can differentiate progressive from stablemild cognitive impairment. Neuroscience 150, 346-356.
[241] Rossini PM, Rossi S, Babiloni C, Polich J (2007) Clini-cal neurophysiology of aging brain: from normal aging toneurodegeneration. Prog Neurobiol 83, 375-400.
[242] Hegerl U, Frodl-Bauch T (1997) Dipole source analysis ofP300 component of the auditory evoked potential: a method-ological advance? Psychiatry Res 74, 109-118.
[243] Juckel G, Clotz F, Frodl T, Kawohl W, Hampel H, Poga-rell O, Hegerl U (2008) Diagnostic usefulness of cognitiveauditory event-related p300 subcomponents in patients withAlzheimers disease? J Clin Neurophysiol 25, 147-152.
[244] Fagan AM, Mintun MA, Mach RH, Lee SY, Dence CS,Shah AR, LaRossa GN, Spinner ML, Klunk WE, MathisCA, DeKosky ST, Morris JC, Holtzman DM (2006) Inverserelation between in vivo amyloid imaging load and cere-brospinal fluid Abeta42 in humans. Ann Neurol 59, 512-519.
[245] Grimmer T, Riemenschneider M, Forstl H, Henriksen G,Klunk WE, Mathis CA, Shiga T, Wester HJ, Kurz A, DrzezgaA (2009) Beta amyloid in Alzheimer’s disease: increaseddeposition in brain is reflected in reduced concentration incerebrospinal fluid. Biol Psychiatry 65, 927-934.
[246] Zetterberg H, Pedersen M, Lind K, Svensson M, RolstadS, Eckerstrom C, Syversen S, Mattsson UB, Ysander C,Mattsson N, Nordlund A, Vanderstichele H, VanmechelenE, Jonsson M, Edman A, Blennow K, Wallin A (2007)Intra-individual stability of CSF biomarkers for Alzheimer’sdisease over two years. J Alzheimers Dis 12, 255-260.
[247] Zhou B, Teramukai S, Yoshimura K, Fukushima M (2009)Validity of cerebrospinal fluid biomarkers as endpointsin early-phase clinical trials for Alzheimer’s disease. JAlzheimers Dis 18, 89-102.

V. Drago et al. / Disease Tracking Markers for AD at the Prodromal (MCI) Stage 199
[248] Andersson C, Blennow K, Almkvist O, Andreasen N,Engfeldt P, Johansson SE, Lindau M, Eriksdotter-JonhagenM (2008) Increasing CSF phospho-tau levels during cogni-tive decline and progression to dementia. Neurobiol Aging29, 1466-1473.
[249] Blomberg M, Jensen M, Basun H, Lannfelt L, Wahlund LO(1996) Increasing cerebrospinal fluid tau levels in a sub-group of Alzheimer patients with apolipoprotein E alleleepsilon 4 during 14 months follow-up. Neurosci Lett 214,163-166.
[250] Bouwman FH, van der Flier WM, Schoonenboom NS, vanElk EJ, Kok A, Rijmen F, Blankenstein MA, Scheltens P(2007) Longitudinal changes of CSF biomarkers in memoryclinic patients. Neurology 69, 1006-1011.
[251] de Leon MJ, Segal S, Tarshish CY, DeSanti S, Zinkowski R,Mehta PD, Convit A, Caraos C, Rusinek H, Tsui W, SaintLouis LA, DeBernardis J, Kerkman D, Qadri F, Gary A,Lesbre P, Wisniewski T, Poirier J, Davies P (2002) Longitu-dinal cerebrospinal fluid tau load increases in mild cognitiveimpairment. Neurosci Lett 333, 183-186.
[252] Hesse C, Rosengren L, Andreasen N, Davidsson P, Vander-stichele H, Vanmechelen E, Blennow K (2001) Transientincrease in total tau but not phospho-tau in human cere-brospinal fluid after acute stroke. Neurosci Lett 297,187-190.
[253] Zemlan FP, Rosenberg WS, Luebbe PA, Campbell TA, DeanGE, Weiner NE, Cohen JA, Rudick RA, Woo D (1999)Quantification of axonal damage in traumatic brain injury:affinity purification and characterization of cerebrospinalfluid tau proteins. J Neurochem 72, 741-750.
[254] Gilman S, Koller M, Black RS, Jenkins L, Griffith SG, FoxNC, Eisner L, Kirby L, Rovira MB, Forette F, Orgogozo JM(2005) Clinical effects of Abeta immunization (AN1792)in patients with AD in an interrupted trial. Neurology 64,1553-1562.
[255] Brys M, Pirraglia E, Rich K, Rolstad S, Mosconi L, SwitalskiR, Glodzik-Sobanska L, De Santi S, Zinkowski R, MehtaP, Pratico D, Saint Louis LA, Wallin A, Blennow K, deLeon MJ (2009) Prediction and longitudinal study of CSFbiomarkers in mild cognitive impairment. Neurobiol Aging30, 682-690.
[256] de Leon MJ, DeSanti S, Zinkowski R, Mehta PD, Pratico D,Segal S, Rusinek H, Li J, Tsui W, Saint Louis LA, Clark CM,Tarshish C, Li Y, Lair L, Javier E, Rich K, Lesbre P, MosconiL, Reisberg B, Sadowski M, DeBernadis JF, Kerkman DJ,Hampel H, Wahlund LO, Davies P (2006) Longitudinal CSFand MRI biomarkers improve the diagnosis of mild cognitiveimpairment. Neurobiol Aging 27, 394-401.
[257] de Leon MJ, Mosconi L, Li J, De Santi S, Yao Y, Tsui WH,Pirraglia E, Rich K, Javier E, Brys M, Glodzik L, Swital-ski R, Saint Louis LA, Pratico D (2007) Longitudinal CSFisoprostane and MRI atrophy in the progression to AD. JNeurol 254, 1666-1675.
[258] Quinn JF, Montine KS, Moore M, Morrow JD, Kaye JA,Montine TJ (2004) Suppression of longitudinal increase inCSF F2-isoprostanes in Alzheimer’s disease. J AlzheimersDis 6, 93-97.
[259] Jesse S, Steinacker P, Cepek L, von Arnim CA, TumaniH, Lehnert S, Kretzschmar HA, Baier M, Otto M (2009)Glial fibrillary acidic protein and protein S-100B: differentconcentration pattern of glial proteins in cerebrospinal fluidof patients with Alzheimer’s disease and Creutzfeldt-Jakobdisease. J Alzheimers Dis 17, 541-551.
[260] Fukuyama R, Izumoto T, Fushiki S (2001) The cerebrospinalfluid level of glial fibrillary acidic protein is increased incerebrospinal fluid from Alzheimer’s disease patients andcorrelates with severity of dementia. Eur Neurol 46, 35-38.
[261] Crols R, Saerens J, Noppe M, Lowenthal A (1986) IncreasedGFAp levels in CSF as a marker of organicity in patients withAlzheimer’s disease and other types of irreversible chronicorganic brain syndrome. J Neurol 233, 157-160.
[262] Blasko I, Lederer W, Oberbauer H, Walch T, Kemmler G,Hinterhuber H, Marksteiner J, Humpel C (2006) Measure-ment of thirteen biological markers in CSF of patients withAlzheimer’s disease and other dementias. Dement GeriatrCogn Disord 21, 9-15.
[263] Cacabelos R, Barquero M, Garcıa P, Alvarez XA, Varela deSeijas E (1991) Cerebrospinal fluid interleukin-1 beta (IL-1 beta) in Alzheimer’s disease and neurological disorders.Methods Find Exp Clin Pharmacol 13, 455-458.
[264] Hampel H, Sunderland T, Kotter HU, Schneider C, Teipel SJ,Padberg F, Dukoff R, Levy J, Moller HJ (1998) Decreasedsoluble interleukin-6 receptor in cerebrospinal fluid ofpatients with Alzheimer’s disease. Brain Res 780, 356-359.
[265] Rota E, Bellone G, Rocca P, Bergamasco B, Emanuelli G,Ferrero P (2006) Increased intrathecal TGF-beta1, but notIL-12, IFN-gamma and IL-10 levels in Alzheimer’s diseasepatients. Neurol Sci 27, 33-39.
[266] Sun YX, Minthon L, Wallmark A, Warkentin S, BlennowK, Janciauskiene S (2003) Inflammatory markers inmatched plasma and cerebrospinal fluid from patients withAlzheimer’s disease. Dement Geriatr Cogn Disord 16, 136-144.
[267] Engelborghs S, De Brabander M, De Cree J, D’Hooge R,Geerts H, Verhaegen H, De Deyn PP (1999) Unchanged lev-els of interleukins, neopterin, interferon-gamma and tumornecrosis factor-alpha in cerebrospinal fluid of patients withdementia of the Alzheimer type. Neurochem Int 34, 523-530.
[268] Kalman J, Juhasz A, Laird G, Dickens P, Jardanhazy T,Rimanoczy A, Boncz I, Parry-Jones WL, Janka Z (1997)Serum interleukin-6 levels correlate with the severity ofdementia in Down syndrome and in Alzheimer’s disease.Acta Neurol Scand 96, 236-240.
[269] Lanzrein AS, Johnston CM, Perry VH, Jobst KA, KingEM, Smith AD (1998) Longitudinal study of inflamma-tory factors in serum, cerebrospinal fluid, and brain tissuein Alzheimer disease: interleukin-1beta, interleukin-6,interleukin-1 receptor antagonist, tumor necrosis factor-alpha, the soluble tumor necrosis factor receptors I and II,and alpha1-antichymotrypsin. Alzheimer Dis Assoc Disord12, 215-227.