PREVENTING DISEASE THROUGH HEALTHY ...
176
PREVENTING DISEASE THROUGH HEALTHY ENVIRONMENTS A global assessment of the burden of disease from environmental risks A Prüss-Ustün, J Wolf, C Corvalán, R Bos and M Neira
-
Upload
khangminh22 -
Category
Documents
-
view
1 -
download
0
Transcript of PREVENTING DISEASE THROUGH HEALTHY ...

ISBN 978 92 4 156519 6CONTACTPUBLIC HEALTH, ENVIRONMENTAL AND SOCIAL DETERMINANTSWORLD HEALTH ORGANIZATIONAVENUE APPIA 201211 GENEVA 27SWITZERLANDwww.who.int/phe
PREVENTING DISEASE THROUGH HEALTHY ENVIRONMENTS A global assessment of the burden of disease from environmental risks
The main message emerging from this new comprehensive global assessment is that premature death and disease can be prevented through healthier environments – and to a significant degree. Analysing the latest data on the environment-disease nexus and the devastating impact of environmental hazards and risks on global health, backed up by expert opinion, this report covers more than 130 diseases and injuries.
The analysis shows that 23% of global deaths (and 26% of deaths among children under five) are due to modifiable environmental factors – and therefore can be prevented. Stroke, ischaemic heart disease, diarrhoea and cancers head the list. People in low-income countries bear the greatest disease burden, with the exception of noncommunicable diseases.
The report’s unequivocal evidence should add impetus to coordinating global efforts to promote healthy environments – often through well-established, cost-effective interventions. This analysis will inform those who want to better understand the transformational spirit of the Sustainable Development Goals agreed by Heads of State in September 2015. The results of the analysis underscore the pressing importance of stronger intersectoral action to create healthier environments that will contribute to sustainably improving the lives of millions around the world.
PR
EVEN
TING
DISEA
SE THR
OU
GH
HEA
LTHY
ENV
IRO
NM
ENTS —
A global assessment of the burden of disease from
environmental risks
PREVENTING DISEASE THROUGH HEALTHY ENVIRONMENTS A global assessment of the burden of disease from environmental risksA Prüss-Ustün, J Wolf, C Corvalán, R Bos and M Neira


PREVENTING DISEASE THROUGH HEALTHY ENVIRONMENTS A global assessment of the burden of disease from environmental risks
A Prüss-Ustün, J Wolf, C Corvalán, R Bos and M Neira
WHO Library Cataloguing-in-Publication Data
Preventing disease through healthy environments: a global assessment of the burden of disease from environmental risks / Annette Prüss-Üstün … [et al].
1.Environmental Monitoring. 2.Cost of Illness. 3.Risk Factors. I.Prüss-Üstün, Annette. II.Wolf, J. III.Corvalán, Carlos F. IV.Bos, R. V.Neira, Maria Purificación. VI.World Health Organization.
ISBN 978 92 4 156519 6 (NLM classification: WA 30.5)
© World Health Organization 2016
All rights reserved. Publications of the World Health Organization are available on the WHO website (www.who.int) or can be purchased from WHO Press, World Health Organization, 20 Avenue Appia, 1211 Geneva 27, Switzerland (tel.: +41 22 791 3264; fax: +41 22 791 4857; email: [email protected]).
Requests for permission to reproduce or translate WHO publications – whether for sale or for non-commercial distribution – should be addressed to WHO Press through the WHO website (www.who.int/about/licensing/copyright_form/en/index.html).
The designations employed and the presentation of the material in this publication do not imply the expression of any opinion whatsoever on the part of the World Health Organization concerning the legal status of any country, territory, city or area or of its authorities, or concerning the delimitation of its frontiers or boundaries. Dotted and dashed lines on maps represent approximate border lines for which there may not yet be full agreement.
The mention of specific companies or of certain manufacturers’ products does not imply that they are endorsed or recommended by the World Health Organization in preference to others of a similar nature that are not mentioned. Errors and omissions excepted, the names of proprietary products are distinguished by initial capital letters.
All reasonable precautions have been taken by the World Health Organization to verify the information contained in this publication. However, the published material is being distributed without warranty of any kind, either expressed or implied. The responsibility for the interpretation and use of the material lies with the reader. In no event shall the World Health Organization be liable for damages arising from its use.
The named authors alone are responsible for the views expressed in this publication.
Editorial consultant: Vivien Stone
Design and layout by L’IV Com Sàrl, Villars-sous-Yens, Switzerland.
Printed by the WHO Document Production Services, Geneva, Switzerland.
CONTENTS
Acronyms and abbreviations vi
Preface vii
Executive summary x
1. Introduction 1
2. Methods: Estimating the environmental burden of disease 2
The environment: A contextual determinant of health 3The link with social determinants of health 4What is meant by the population attributable fraction of a risk factor? 6Estimating the population attributable fraction 7
Comparative risk assessment 7Calculations based on limited epidemiological data 8Disease transmission pathway 8Expert survey 8
Combining risk factors for individual diseases 9 Estimating the burden of disease attributable to the environment 9Estimating uncertainties 9
3. Results: A systematic analysis of fractions attributable to the environment, by disease Infectious and parasitic diseases 10
Infectious and parasitic diseases 14Respiratory infections 14Diarrhoeal diseases 16Intestinal nematode infections 18Malaria 19Trachoma 22Schistosomiasis 23Chagas disease 25Lymphatic filariasis 27Onchocerciasis 29Leishmaniasis 30Dengue 32Japanese encephalitis 34HIV/AIDS 36Sexually transmitted diseases 38Hepatitis B and C 38Tuberculosis 40Other infectious and parasitic diseases 41
Neonatal and nutritional conditions 42Neonatal conditions 42Protein-energy malnutrition 44
Noncommunicable diseases 46Cancers 46Mental, behavioural and neurological disorders 51Cataracts 54
PREVENTING DISEASE THROUGH HEALTHY ENVIRONMENTS i i i

Hearing loss 54Ischaemic heart disease 56Stroke 58Chronic obstructive pulmonary disease 61Asthma 64Musculoskeletal diseases 67Congenital anomalies 67Other noncommunicable diseases 68
Risks factors for noncommunicable diseases from other areas but related to the environment 69
Overweight and obesity 69Physical inactivity 70
Unintentional injuries 73Road traffic accidents 73Unintentional poisonings 75Falls 76Fires, heat and hot substances 77Drownings 78Other unintentional injuries 80
Intentional injuries 82Self-harm 82Interpersonal violence 83
The link between the environment and demographics 85
Global results of the analysis by disease and population subgroups 86Disease specific results 86Age differences 87Gender differences 88Regional and country differences 89Trends 92
4. Discussion: Leveraging environment-health links 94
Environment, health and the Sustainable Development Goals 95Strengths and weaknesses of the analysis 100
5. Conclusion: Towards healthy environments 102
Key findings 103Reducing the burden of unhealthy environments 104
Annexes 106
Annex 1: WHO Member States and country groupings by income region 106Annex 2: Results tables 107Annex 3: Technical annex on methods 120
Annex 3.1. Calculation of population attributable fractions 120Annex 3.2. Combination of risk factors for one disease: Additional information 121Annex 3.3: Additional information on estimation of PAFs for selected diseases 121
References 124
Acknowledgements 144
Photo credits 147
PREVENTING DISEASE THROUGH HEALTHY ENVIRONMENTSiv

List of figures
Figure ES1. Fraction of deaths and DALYs attributable to the environment globally, 2012 xvFigure ES2. Diseases with the highest preventable disease burden from environmental risks, in disability-adjusted life years (DALYs) – a combined measure of years of life lost due to mortality and years of life lived with disability, 2012 xviFigure ES3. Environmental fraction of global burden of disease (in DALYs) by age and disease group, 2012 xviiFigure ES4. Total burden of disease and environmental portion, by sex, 2012 xviiiFigure ES5. Fraction of disease burden attributable to the environment by country, 2012 xviiiFigure ES6. Trend in the fraction of deaths attributable to the environment by disease group, 2002–2012 xixFigure ES7. Deaths per capita attributable to the environment, by region and disease group, 2012 xxFigure ES8. Diseases with the strongest environmental contributions globally, 2012 xxFigure ES9. Age-standardized infectious, parasitic, neonatal and nutritional disease deaths attributable to the environment, 2012 xxiFigure ES10. Age-standardized noncommunicable disease deaths attributable to the environment, 2012 xxiFigure ES11. Age-standardized injury deaths attributable to the environment, 2012 xxiFigure ES12. Methods used for the estimation of burden of disease attributable to the environment xxiiFigure 1. Under-five mortality rate and access to water by income, São Paulo, Brazil 4Figure 2. Progress in sanitation coverage by typology (percentage, 1995–2010) 5Figure 3. Open defecation practices according to level of education, 2012 6Figure 4. Proportion of population aged 65 years and older, 1990 to 2030, by country groupings 85Figure 5. World population, 1990 to 2030, by country groupings 85Figure 6. Urban and rural fraction of the population, 2012 85Figure 7. Diseases with the largest environmental contribution 86Figure 8. Diseases with the largest environmental contribution, children under five years 87Figure 9. Environmental fraction of global burden of disease (in DALYs), by age and disease group, 2012 87Figure 10. Main diseases contributing to the environmental burden of disease, all ages, world, 2012 88Figure 11. Main diseases contributing to the environmental burden of disease, for children under five years 88Figure 12. Deaths attributable to the environment, by region and disease group, 2012 89Figure 13. Age-standardized environmental deaths, 2012 90Figure 14. Age-standardized infectious, parasitic, neonatal and nutritional disease deaths attributable to the environment, 2012 90Figure 15. Age-standardized noncommunicable disease deaths attributable to the environment, 2012 90Figure 16. Age-standardized injury deaths attributable to the environment, 2012 91Figure 17. Trend in the fraction of deaths attributable to the environment by disease group, 2002–2012 92Figure 18. Trend in total deaths by disease group, 2002–2012 93Figure 19. Sustainable Development Goals and environment-health links 96
List of tables
Table ES1. Summary of included and excluded environmental factors in this study xTable ES2. Diseases and injuries and key environmental interventions xiiTable ES3. Linking main sectors to primary prevention opportunities xiii
Table ES4. Selected population attributable fraction (of DALYs) by risk factor and disease (non-additive) xivTable 1. Methods used for estimating the population attributable fraction of the disease burden for main disease groups 1Table 2. Total and attributable deaths and disease burden to the environment, 2012 86Table 3. Total burden and percentage attributable to the environment, by sex, 2012 88Table 4. Methods used to estimate the burden of disease attributable to the environment 91Table A2.1. Population attributable fractions for the environment (of DALYs), by disease and region 107Table A2.2. Indicative linkages between environmental risk factor and disease or injury 111Table A2.3. Deaths attributable to the environment, by region, 2012 112Table A2.4. Burden of disease (in DALYs) attributable to the environment, by region, 2012 116Table A3.2.1 Global risk factors attribution, by disease and by risk factor (in DALYs) 121
PREVENTING DISEASE THROUGH HEALTHY ENVIRONMENTS v
ACRONYMS AND ABBREVIATIONSCI confidence intervalCOPD chronic obstructive pulmonary diseaseCRA comparative risk assessmentDALY disability-adjusted life yearHBV hepatitis BHCV hepatitis CHBsAg hepatitis B surface antigenHIA health impact assessmentHIC high-income countriesHIV/AIDS human immunodeficiency virus/acquired immunodeficiency syndromeIHD ischaemic heart diseaseIPM integrated pest managementIVM integrated vector managementJE Japanese encephalitisLMIC low- and middle-income countriesPAF population attributable fractionPCB polychlorinated biphenylsSDGs Sustainable Development GoalsSTD sexually transmitted diseaseTB tuberculosisUV ultravioletWASH water, sanitation and hygieneWHO World Health Organization
REGIONS OF THE WORLD HEALTH ORGANIZATION
AFR African RegionAMR Region of the AmericasEMR Eastern Mediterranean RegionEUR European RegionSEAR South-East Asia RegionWPR Western Pacific Region
PREVENTING DISEASE THROUGH HEALTHY ENVIRONMENTSvi
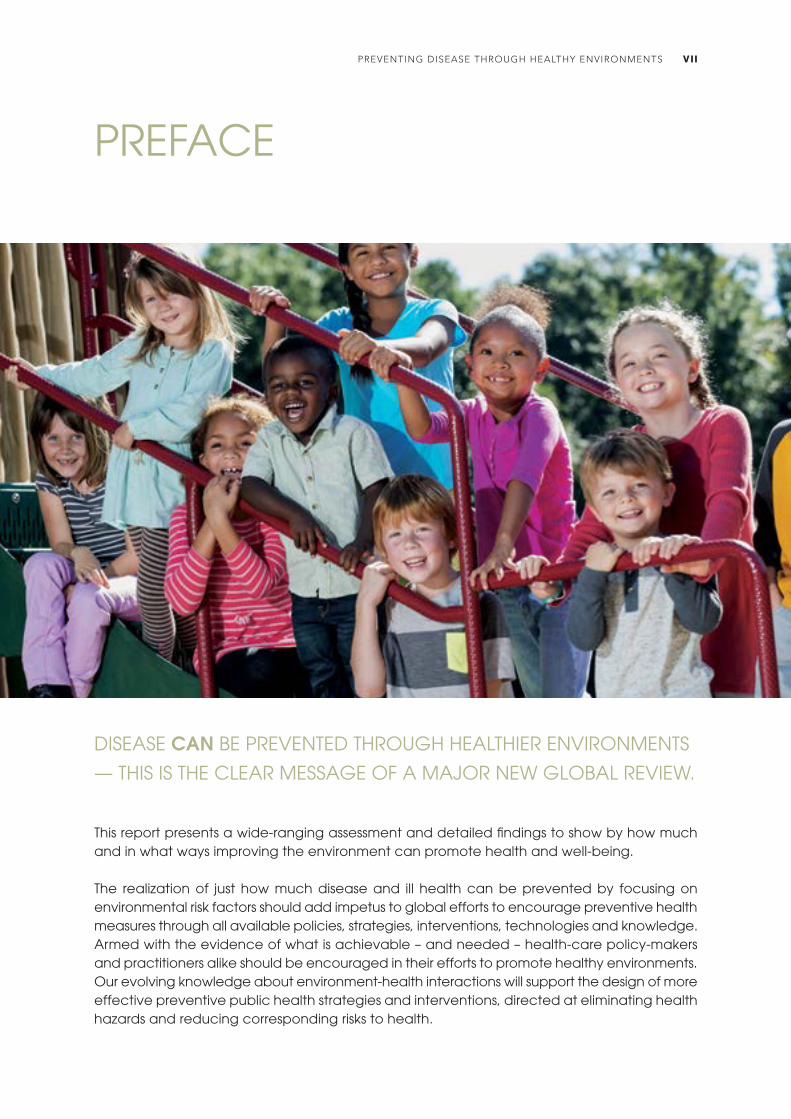
PREFACE
This report presents a wide-ranging assessment and detailed findings to show by how much and in what ways improving the environment can promote health and well-being.
The realization of just how much disease and ill health can be prevented by focusing on environmental risk factors should add impetus to global efforts to encourage preventive health measures through all available policies, strategies, interventions, technologies and knowledge. Armed with the evidence of what is achievable – and needed – health-care policy-makers and practitioners alike should be encouraged in their efforts to promote healthy environments. Our evolving knowledge about environment-health interactions will support the design of more effective preventive public health strategies and interventions, directed at eliminating health hazards and reducing corresponding risks to health.
DISEASE CAN BE PREVENTED THROUGH HEALTHIER ENVIRONMENTS
— THIS IS THE CLEAR MESSAGE OF A MAJOR NEW GLOBAL REVIEW.
PREVENTING DISEASE THROUGH HEALTHY ENVIRONMENTS vii
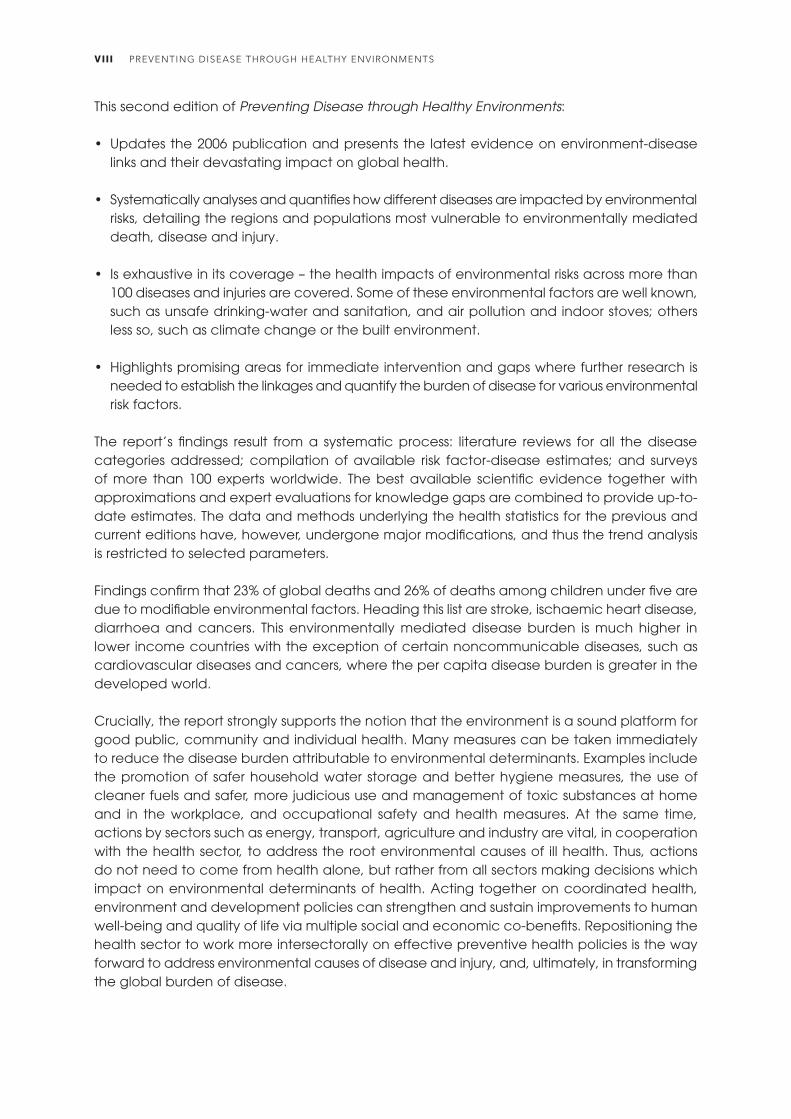
This second edition of Preventing Disease through Healthy Environments:
• Updates the 2006 publication and presents the latest evidence on environment-disease links and their devastating impact on global health.
• Systematically analyses and quantifies how different diseases are impacted by environmental risks, detailing the regions and populations most vulnerable to environmentally mediated death, disease and injury.
• Is exhaustive in its coverage – the health impacts of environmental risks across more than 100 diseases and injuries are covered. Some of these environmental factors are well known, such as unsafe drinking-water and sanitation, and air pollution and indoor stoves; others less so, such as climate change or the built environment.
• Highlights promising areas for immediate intervention and gaps where further research is needed to establish the linkages and quantify the burden of disease for various environmental risk factors.
The report’s findings result from a systematic process: literature reviews for all the disease categories addressed; compilation of available risk factor-disease estimates; and surveys of more than 100 experts worldwide. The best available scientific evidence together with approximations and expert evaluations for knowledge gaps are combined to provide up-to-date estimates. The data and methods underlying the health statistics for the previous and current editions have, however, undergone major modifications, and thus the trend analysis is restricted to selected parameters.
Findings confirm that 23% of global deaths and 26% of deaths among children under five are due to modifiable environmental factors. Heading this list are stroke, ischaemic heart disease, diarrhoea and cancers. This environmentally mediated disease burden is much higher in lower income countries with the exception of certain noncommunicable diseases, such as cardiovascular diseases and cancers, where the per capita disease burden is greater in the developed world.
Crucially, the report strongly supports the notion that the environment is a sound platform for good public, community and individual health. Many measures can be taken immediately to reduce the disease burden attributable to environmental determinants. Examples include the promotion of safer household water storage and better hygiene measures, the use of cleaner fuels and safer, more judicious use and management of toxic substances at home and in the workplace, and occupational safety and health measures. At the same time, actions by sectors such as energy, transport, agriculture and industry are vital, in cooperation with the health sector, to address the root environmental causes of ill health. Thus, actions do not need to come from health alone, but rather from all sectors making decisions which impact on environmental determinants of health. Acting together on coordinated health, environment and development policies can strengthen and sustain improvements to human well-being and quality of life via multiple social and economic co-benefits. Repositioning the health sector to work more intersectorally on effective preventive health policies is the way forward to address environmental causes of disease and injury, and, ultimately, in transforming the global burden of disease.
PREVENTING DISEASE THROUGH HEALTHY ENVIRONMENTSviii

The Sustainable Development Goals (SDGs), agreed by heads of state at the UN General Assembly in September 2015, re-set the world’s commitment to combating the world’s pressing development issues over the next 15 years. Within the 17 goals there are clear health-related targets, but these sit alongside environmental and other sectoral areas that strongly influence determinants of health.
While the SDGs build on the achievements of the Millennium Development Goals (2000–2015), they also represent a departure from their principles. Critically, the new goals aim not to consider development issues in isolation, but their 169 targets are geared towards establishing relevant and effective links that can bring about the transformational change required, without leaving anyone behind. The SDG philosophy recognizes issues related to inequality and discrimination, the need for a cyclical, green economy, and the importance of building resilience to mitigate natural and man-made disasters.
Environment-health interventions are based exactly on these principles and, as evidenced in this report, can make a significant contribution towards achieving the SDGs and improving life and health for all.
Dr Flavia Bustreo Assistant Director-General Family, Women’s and Children’s HealthWorld Health Organization
PREVENTING DISEASE THROUGH HEALTHY ENVIRONMENTS ix

EXECUTIVE SUMMARY
In 2012, this present study estimates, 12.6 million deaths globally, representing 23% (95% CI: 13–34%) of all deaths, were attributable to the environment. When accounting for both death and disability, the fraction of the global burden of disease due to the environment is 22% (95% CI: 13–32%). In children under five years, up to 26% (95% CI: 16–38%) of all deaths could be prevented, if environmental risks were removed. Of the 12.6 million deaths attributable to the environment, 8.1 million (15%) were estimated using comparative risk assessment (CRA) methods, and the remaining 4.5 million using a combination of methods including expert opinion.
This study provides an approximate estimate of how much disease can be prevented by reducing the environmental risks to health. It includes a meta-synthesis of key evidence relating diseases and injuries to the environment. It brings together quantitative estimates of the disease burden attributable to the environment using a combination of approaches that includes CRA, epidemiological data, transmission pathways and expert opinion. The synthesis of evidence linking 133 diseases and injuries, or their groupings, to the environment has been reviewed to provide an overall picture of the disease burden that could be prevented through healthier environments.
Environmental risks to health are defined, in this study, as “all the physical, chemical and biological factors external to a person, and all related behaviours, but excluding those natural environments that cannot reasonably be modified.” To increase the policy relevance of this study, its focus is on that part of the environment which can reasonably be modified (see Table ES1).
Table ES1. Summary of included and excluded environmental factors in this study
EXCLUDEDExcluded factors are:• Alcohol and tobacco consumption• Diet (unless linked to environmental degradation)• The natural environments of vectors that cannot
reasonably be modified (e.g. wetlands, lakes)• Insecticide impregnated mosquito nets (for this
study they are considered to be non-environmental interventions)
• Unemployment (provided it is not related to environmental degradation, occupational disease, etc.)
• Natural biological agents, such as pollen• Person-to-person transmission that cannot reasonably
be prevented through environmental interventions, such as improving housing, introducing sanitary hygiene or making improvements in the occupational environment
INCLUDEDIncluded factors are the modifiable parts of:• Pollution of air (including from second-hand tobacco
smoke), water or soil with chemical or biological agents• Ultraviolet (in particular, protection from) and ionizing
radiation• Noise, electromagnetic fields• Occupational risks, including physical, chemical,
biological and psychosocial risks, and working conditions
• Built environments, including housing, workplaces, land-use patterns, roads
• Agricultural methods• Man-made climate and ecosystem change• Behaviour related to environmental factors, e.g. the
availability of safe water for washing hands, physical activity fostered through improved urban design
PREVENTING DISEASE THROUGH HEALTHY ENVIRONMENTSx

Some social determinants of health are closely linked to and mediate exposure to environmental risk factors, but social determinants have not been included separately.
The population attributable fraction as used in this study is the proportional reduction in death or disease that would occur if exposure to a risk were removed or reduced to an alternative (or counterfactual) exposure distribution – the minimum exposure distribution currently achieved in certain population groups, or that which could be achieved by changes in the environment.
The following methods were used for estimating and summarizing the burden of disease attributable to the environment, informed by prior systematic reviews of the literature, in order of priority:
(1) Comparative risk assessment methods using detailed exposure and exposure-risk information for all populations; these methods are generally based on the highest levels of evidence and most comprehensive data.
(2) Calculations based on more limited epidemiological data, which require more assumptions for certain population groups or geographical regions.
(3) Certain diseases were entirely attributed to the environment according to the information about their transmission pathways.
(4) Expert surveys on population attributable fractions, based on a synthesis of the evidence of the environment-disease link or partial CRA results.
The systematic reviews and data retrievals were performed up to December 2014.
Out of 133 diseases or injuries, or their groupings, considered, 101 had significant links with the environment, 92 of which have been quantified, at least partially. Half of the environment-attributable disease burden was estimated using CRA methods. The main links between diseases and injuries and the environment, and potential areas for intervention, are summarized in Table ES2.
Modern public recreation space (Seoul, Republic of Korea).
EXECUTIVE SUMMARY xi
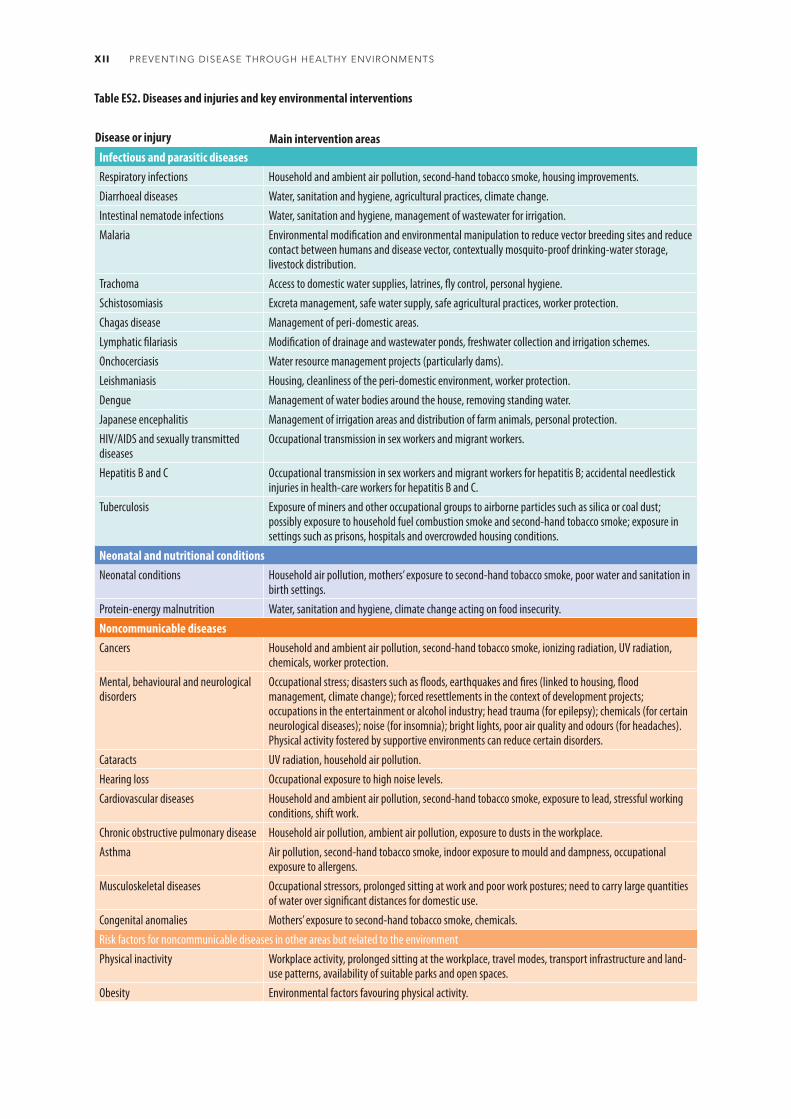
Disease or injury Main intervention areasInfectious and parasitic diseasesRespiratory infections Household and ambient air pollution, second-hand tobacco smoke, housing improvements.Diarrhoeal diseases Water, sanitation and hygiene, agricultural practices, climate change.Intestinal nematode infections Water, sanitation and hygiene, management of wastewater for irrigation.Malaria Environmental modification and environmental manipulation to reduce vector breeding sites and reduce
contact between humans and disease vector, contextually mosquito-proof drinking-water storage, livestock distribution.
Trachoma Access to domestic water supplies, latrines, fly control, personal hygiene.Schistosomiasis Excreta management, safe water supply, safe agricultural practices, worker protection.Chagas disease Management of peri-domestic areas.Lymphatic filariasis Modification of drainage and wastewater ponds, freshwater collection and irrigation schemes.Onchocerciasis Water resource management projects (particularly dams).Leishmaniasis Housing, cleanliness of the peri-domestic environment, worker protection.Dengue Management of water bodies around the house, removing standing water.Japanese encephalitis Management of irrigation areas and distribution of farm animals, personal protection.HIV/AIDS and sexually transmitted diseases
Occupational transmission in sex workers and migrant workers.
Hepatitis B and C Occupational transmission in sex workers and migrant workers for hepatitis B; accidental needlestick injuries in health-care workers for hepatitis B and C.
Tuberculosis Exposure of miners and other occupational groups to airborne particles such as silica or coal dust; possibly exposure to household fuel combustion smoke and second-hand tobacco smoke; exposure in settings such as prisons, hospitals and overcrowded housing conditions.
Neonatal and nutritional conditionsNeonatal conditions Household air pollution, mothers’ exposure to second-hand tobacco smoke, poor water and sanitation in
birth settings.Protein-energy malnutrition Water, sanitation and hygiene, climate change acting on food insecurity.Noncommunicable diseasesCancers Household and ambient air pollution, second-hand tobacco smoke, ionizing radiation, UV radiation,
chemicals, worker protection.Mental, behavioural and neurological disorders
Occupational stress; disasters such as floods, earthquakes and fires (linked to housing, flood management, climate change); forced resettlements in the context of development projects; occupations in the entertainment or alcohol industry; head trauma (for epilepsy); chemicals (for certain neurological diseases); noise (for insomnia); bright lights, poor air quality and odours (for headaches). Physical activity fostered by supportive environments can reduce certain disorders.
Cataracts UV radiation, household air pollution.Hearing loss Occupational exposure to high noise levels.Cardiovascular diseases Household and ambient air pollution, second-hand tobacco smoke, exposure to lead, stressful working
conditions, shift work.Chronic obstructive pulmonary disease Household air pollution, ambient air pollution, exposure to dusts in the workplace.Asthma Air pollution, second-hand tobacco smoke, indoor exposure to mould and dampness, occupational
exposure to allergens.Musculoskeletal diseases Occupational stressors, prolonged sitting at work and poor work postures; need to carry large quantities
of water over significant distances for domestic use.Congenital anomalies Mothers’ exposure to second-hand tobacco smoke, chemicals.Risk factors for noncommunicable diseases in other areas but related to the environmentPhysical inactivity Workplace activity, prolonged sitting at the workplace, travel modes, transport infrastructure and land-
use patterns, availability of suitable parks and open spaces. Obesity Environmental factors favouring physical activity.
Table ES2. Diseases and injuries and key environmental interventions
PREVENTING DISEASE THROUGH HEALTHY ENVIRONMENTSxii

Disease or injury Main intervention areasUnintentional injuriesRoad traffic accidents Design of roads, land-use planning; traffic intensification in development areas with big infrastructure
projects.Unintentional poisonings Safe handling and storage of chemicals, adequate product information, adequate choice of chemicals,
worker protection.Falls Safety of housing and work environment.Fires, heat and hot substances Safety of cooking, lighting and heating equipment, building fire codes, use of flammable materials in
the home, safety of occupational environments and practices, climate change.Drownings Safety of water environments, public awareness, regulations, worker safety, climate change.Other unintentional injuries Protection from animal bites and contact with venomous plants, safety of mechanical equipment,
ionizing radiation and currents.Intentional injuries Self-harm Access to toxic chemicals such as pesticides, access to firearms.Interpersonal violence Access to firearms, urban design (e.g. mobility, visibility), worker protection.
These prevention opportunities can also be mapped to sectors, and summarized by risk factor (see Tables ES3 and ES4).
Table ES3. Linking main sectors to primary prevention opportunities
Sectors Selected risks/intervention areasAgriculture • Risk of infection by parasitic diseases: domestic and peri-domestic management of vectors.
• Occupational exposure to chemicals: regulations, personal equipment.• Consumers’ exposure to chemicals: regulations.
Industry/commercial • Air pollution: industrial emission control; improved energy options; indoor tobacco smoke-free legislation.• Occupational exposure to chemicals, air pollutants, UV exposure, noise: workers’ personal protection; education
on protective behaviour; engineering approaches to reduce exposure, such as ventilation, dust suppression techniques, enclosure of pollution sources etc.; removal from sources of pollutants or other relevant exposures, regulations.
• Exposure to industrial chemicals (workers, consumers): legislation, treaties.• Water pollution: industrial emission control.• Noise: noise control regulations.
Transport • Air pollution; decreased physical activity: improved urban planning, improved and increased use of public transport; reduction of traffic congestion; replacement of older diesel vehicles, etc.
• Risk of injury: traffic-calming measures and other traffic control solutions; separation of pedestrians from motorized traffic etc.
Housing/community • Household air pollution: use of clean fuels; strategies to reduce exposure to smoke from solid fuels – implementation of WHO Indoor Air Quality Guidelines (WHO, 2014ee).
• Contact with infected excreta: safe disposal of excreta.• Contact with malaria and other vectors: environmental manipulation and modification of human habitations.• Contact with Chagas vectors: wall plastering and improved household hygiene.• Contact with dengue vectors: management of water containers around the house.• Low physical activity, obesity: better urban planning, access to sports facilities, school and workplace based
programmes.• Unsafe drinking-water: safe household water treatment.• Exposure to allergens: interventions to reduce house dust and moulds/dampness.• Exposure to radon: regulations, e.g. remediation measures.• Exposure to UV: community-based sun safety education.• Exposure to chemicals: safe management of chemicals in the home and community. • Risk of falls: improvement of home safety.• Risk of drownings: improve access and safety of water environments.• Risk of fire injuries: use of safe cooking and heating equipment and modern energy/fuels; building safety
standards.Water • Inadequate water, sanitation and hygiene: provision of adequate drinking-water and sanitation facilities;
implementation of sanitation and water safety plans; implementation of drinking-water guidelines.
EXECUTIVE SUMMARY xiii

Table ES4. Selected population attributable fractions (of DALYs) by risk factor and disease (non-additive)
CRA Epidemiological estimates Other non-CRA
OCCUPATIONAL RISKS
HIV/AIDS
Sexually transmitted diseases
Hepatitis B
Hepatitis C
Lung cancer
Hearing loss
Chronic obstructive pulmonary disease
Back pain
Road traffic injuries
Fire, heat and hot substance
Drowning
Unintentional poisonings
Falls
Other injuries
Asthma
AMBIENT AIR POLLUTION
Acute lower respiratory infection
Lung cancer
Ischaemic heart disease
Stroke
Chronic obstructive pulmonary disease
ENVIRONMENTAL VECTOR MANAGEMENT
Malaria
Chagas disease
Onchocerciasis
Leishmaniasis
HOUSEHOLD AIR POLLUTION
Acute lower respiratory infections
Ischaemic heart disease
Stroke
Lung cancer
Cataracts
Chronic obstructive pulmonary disease
SECOND-HAND TOBACCO SMOKE
Acute lower respiratory infections
Ischaemic heart disease
Stroke
RESIDENTIAL RADON
Lung cancer
0–10 11–20 21–30 81–90 91–100%31–40 41–50 51–60 61–70 71–80
10%
8%
2%
0.3%
7%
12%
26%
14%
10%
11%
14%
6%
11%
9%
7.9%
14%
9%
23%
25%
42%
56%
10%
27%
33%
18%
24%
24%
17%
26%
9%
4%
4%
7%
22%
PREVENTING DISEASE THROUGH HEALTHY ENVIRONMENTSxiv

KEY RESULTSFive key results can be identified from the study on the impact of environmental risk factors on death and disease globally.
1. Environmental risks account for a large fraction of the global burden of disease
A considerable number of deaths are attributable to modifiable environmental risks, with 23% (95% CI: 13–34%) of all deaths, and 22% (95% CI: 13–32%) of the disease burden in DALYs – a combined measure of years of life lost due to mortality and years of life lost due to disability (Figure ES1).
LEAD
Ischaemic heart disease
Stroke
Chronic kidney disease
WASH
Protein-energy malnutrition and consequences
Diarrhoeal diseases (LMIC)
Schistosomiasis
Trachoma
Lymphatic filariasis
Dengue
0–10 11–20 21–30 81–90 91–100%31–40 41–50 51–60 61–70 71–80
4%
5%
4%
58%
82%
100%
67%
95%
15%
Note: Other non-CRA = expert opinion + epidemiological estimates + pathway transmission attribution.
Attributable to the environment Not attributable to the environment
Figure ES1. Fraction of deaths and DALYs attributable to the environment globally, 2012
43 million
12.6 million▼
22.7%
DALYs (millions), 2012Deaths (millions), 2012
596 million▼
21.8%
2139 million
EXECUTIVE SUMMARY xv
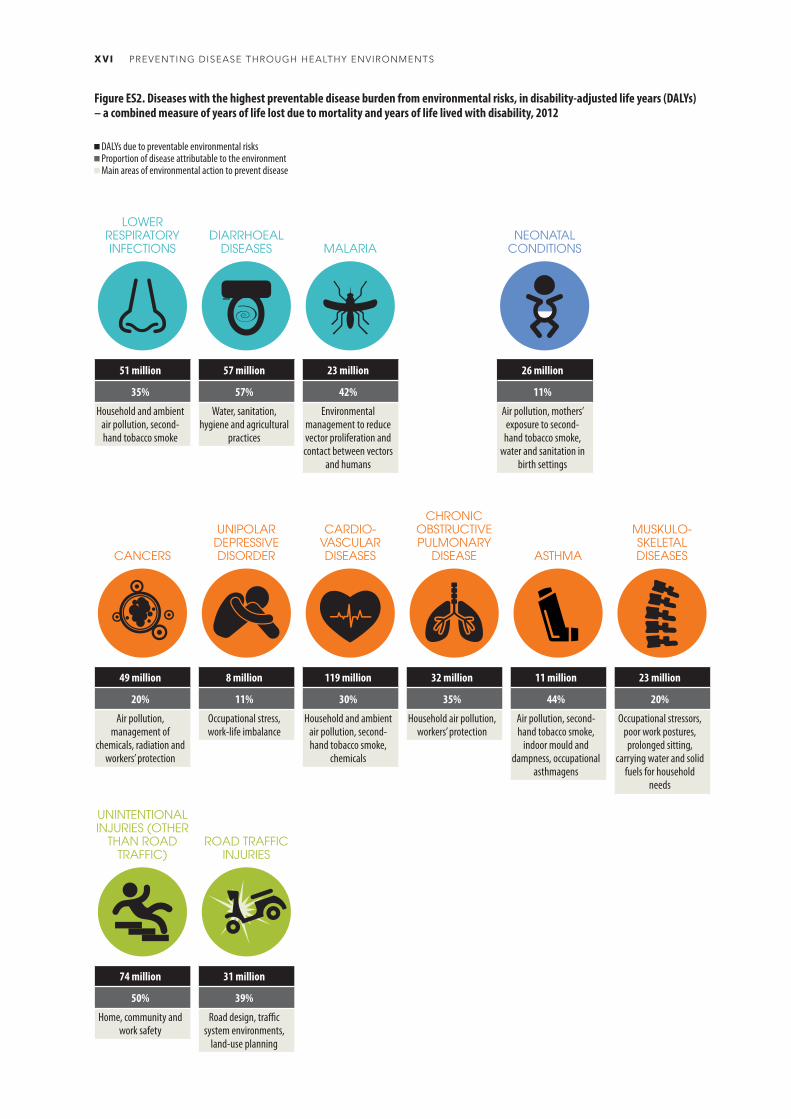
Figure ES2. Diseases with the highest preventable disease burden from environmental risks, in disability-adjusted life years (DALYs) – a combined measure of years of life lost due to mortality and years of life lived with disability, 2012
DALYs due to preventable environmental risks Proportion of disease attributable to the environment Main areas of environmental action to prevent disease
UNIPOLAR DEPRESSIVE DISORDER
8 million
11%
Occupational stress, work-life imbalance
LOWER RESPIRATORY INFECTIONS
51 million
35%
Household and ambient air pollution, second-hand tobacco smoke
MALARIA
23 million
42%
Environmental management to reduce vector proliferation and contact between vectors
and humans
NEONATAL CONDITIONS
26 million
11%
Air pollution, mothers’ exposure to second-hand tobacco smoke,
water and sanitation in birth settings
UNINTENTIONAL INJURIES (OTHER
THAN ROAD TRAFFIC)
74 million
50%
Home, community and work safety
ROAD TRAFFIC INJURIES
31 million
39%
Road design, traffic system environments,
land-use planning
CARDIO-VASCULAR DISEASES
119 million
30%
Household and ambient air pollution, second-hand tobacco smoke,
chemicals
CANCERS
49 million
20%
Air pollution, management of
chemicals, radiation and workers’ protection
MUSKULO-SKELETAL DISEASES
23 million
20%
Occupational stressors, poor work postures, prolonged sitting,
carrying water and solid fuels for household
needs
ASTHMA
11 million
44%
Air pollution, second-hand tobacco smoke,
indoor mould and dampness, occupational
asthmagens
CHRONIC OBSTRUCTIVE PULMONARY
DISEASE
32 million
35%
Household air pollution, workers’ protection
DIARRHOEAL DISEASES
57 million
57%
Water, sanitation, hygiene and agricultural
practices
PREVENTING DISEASE THROUGH HEALTHY ENVIRONMENTSxvi

2. Environmental impacts on health are uneven across life course and gender
The health of children under five, and to a lesser extent up to 10, and that of adults between 50 and 75 years is most affected by the environment. In children, the environment’s contribution to infectious and parasitic diseases, neonatal and nutritional diseases and injuries is very prominent. In older adults, the fraction of noncommunicable diseases (NCDs) caused by the environment becomes more important, and that for injuries remains constant but significant (Figure ES3).
Infectious, parasitic, neonatal and nutritional diseases Noncommunicable diseases Injuries Total
Attri
buta
ble fr
actio
n (pe
rcent
age o
f DAL
Ys)
50%
30%
20%
10%
40%
60%
0%
Figure ES3. Environmental fraction of global burden of disease (in DALYs) by age and disease group, 2012
I0
Age (years)
I5
I10
I15
I20
I25
I30
I35
I40
I45
I50
I55
I60
I65
I70
I75
Men are slightly more affected by the environment than women, with 22.8% versus 20.6% of all DALYs being attributable to the environment, respectively (see Figure ES4). Women bear higher exposures to traditional environmental risks to health, such as exposure to smoke while cooking with solid fuels or carrying water from community sources. However, men are more exposed to occupational risks to health. Men may also be exposed to increased risks of injuries due to their patterns of occupational and recreational activities.
EXECUTIVE SUMMARY xvii

Burd
en of
dise
ase (
in m
illion
DALY
s)
1000
600
400
200
800
Infectious, parasitic, neonatal and nutritional diseases Noncommunicable diseases Injuries
1200
Figure ES4. Total burden of disease and environmental portion, by sex, 2012
1400
1600
Men
Total Environmental portion
Women
Total Environmental portion
0
3. Low- and middle-income countries bear the greatest share of environmental disease
The highest fraction of deaths and disease that could be tackled through environmental improvements is in low- and middle-income countries (Figure ES5).
Figure ES5. Fraction of disease burden attributable to the environment by country, 2012
0 1700 3400850 Kilometres
Disease burden (%)9–14
15–16
17–18
19–22
23–31
Data not available
Not applicable
PREVENTING DISEASE THROUGH HEALTHY ENVIRONMENTSxviii

4. Total environmental deaths are unchanged since 2002, but show a strong shift to noncommunicable diseases
The last decade has seen a shift away from infectious, parasitic and nutritional diseases to NCDs, not only in terms of the environmental fraction but also the total burden. This shift is mainly due to a global decline of infectious disease rates, and a reduction in the environmental risks causing infectious diseases, i.e. a higher share of people having access to safe water and sanitation, and a lower share of households using solid fuels for cooking. In terms of the total disease burden, NCDs have increased globally. While the highest number of deaths per capita attributable to the environment occurs in sub-Saharan Africa, primarily from infectious diseases, other regions now have higher rates of NCDs attributable to the environment (see figures ES6 to ES11).
Popu
lation
attri
buta
ble fr
actio
n of d
eath
s
25%
15%
10%
5%
20%
30%
Figure ES6. Trend in the fraction of deaths attributable to the environment by disease group, 2002–2012
35%
40%
0%
Infectious, parasitic, neonatal and nutritional diseases
2002 2012
Noncommunicable diseases
2002 2012
Injuries
2002 2012
Total
2002 2012
31%
20%17%
22%
37% 38%
23.3% 22.7%
The main differences between this study (2012 data) and the previous edition (2002 data) are outlined in Box ES1.
Box ES1. Main changes in methods between the 2002 and 2012 studies
• More robust methods were used for 2012 for a number of diseases, based on an improved evidence base (e.g. respiratory infections, cardiovascular diseases, lung cancer).
• For 2012, the effect of water and sanitation was only estimated for low- and middle-income countries, whereas in the 2002 all countries were covered.
• Only the effects of main risk factors were taken into account for 2012 in cases where CRA estimates were available for the main risks but not for the minor ones.
• Fewer infectious diseases were included in the 2012 estimation of the consequences of malnutrition (we did not re-evaluate the diseases linked to malnutrition, only the link between environment and malnutrition).
• Significant new evidence became available on certain exposure-disease links from expert evaluation of disease attribution, which led to significant revisions in 2012 (e.g. injuries from fire and hot substances).
The modifications that these changes introduced are important for some diseases, but they are relatively limited in terms of the total disease burden.
• DALYs are not directly comparable as no age-weighting and discounting were used in the 2012 estimates.
• Additional data on total mortality and disease burden have become available since 2002, which have allowed retroactive correction of the 2002 estimates.
EXECUTIVE SUMMARY xix

The diseases with the largest environmental fraction (in DALYs, which combine years of life lost and years lived with disability for comparability of disease burden across diseases) include cardiovascular diseases, diarrhoeal diseases and lower respiratory infections. Ambient and household air pollution, and water, sanitation and hygiene are the main environmental drivers of those diseases.
Deat
hs pe
r 100
0 pop
ulatio
n 2.5
1.5
1.0
0.5
2.0
Infectious, parasitic, neonatal and nutritional diseases Noncommunicable diseases Injuries
Figure ES7. Deaths per capita attributable to the environment, by region and disease group, 2012
3.0
Africa, sub-Saharan
0Americas* Eastern
MediterraneanEurope* South-East
AsiaWestern Pacific*
High-income OECD
Notes: * Non-OECD countries. See Annex 1 for country groupings.
I0%
Environmental fraction Non environmental fraction
Fraction of total global burden of disease in DALYs
Figure ES8. Diseases with the strongest environmental contributions globally, 2012
I2%
I4%
I6%
I8%
I10%
I12%
I14%
Stroke 42%Ischaemic heart disease 35%
Diarrhoeal diseases 57%Lower respiratory infections 35%
Cancers 20%COPD 35%
Road traffic accidents 39%Neonatal conditions 11%
Malaria 42%Drowning 73%
Back and neck pain 27%Fires, heat and hot substances 76%
Falls 30%Asthma 44%
Unipolar depressive disorders 11%
Note: Percentages within bars relate to the environmental share of the respective disease.
PREVENTING DISEASE THROUGH HEALTHY ENVIRONMENTSxx

Figure ES10. Age-standardized noncommunicable disease deaths attributable to the environment, 2012
Figure ES11. Age-standardized injury deaths attributable to the environment, 2012
Figure ES9. Age-standardized infectious, parasitic, neonatal and nutritional disease deaths attributable to the environment, 2012
0 1700 3400850 Kilometres
Deaths per 100 000 population0–1
2–5
6–15
16–100
>100
Data not available
Not applicable
0 1700 3400850 Kilometres
Deaths per 100 000 population0–50
51–80
81–110
111–150
>150
Data not available
Not applicable
0 1700 3400850 Kilometres
Deaths per 100 000 population0–10
11–20
21–30
31–40
>40
Data not available
Not applicable
EXECUTIVE SUMMARY xxi

5. The evidence on quantitative links between health and environment has increased
A greater share of the estimates of the burden of disease attributable to the environment can now be determined using more robust methods than previously. Comparative risk assessment me thods, which are based on the best exposure and/or exposure-response data, now cover 68% of deaths attributable to the environment, and 56% of DALYs (Figure ES12). In other words, about 8.6 million out of the total 12.6 million environment-attributable deaths are estimated on the basis of CRA methods, and the remaining 4.1 million on epidemiological estimates using more limited data, transmission pathways, and expert opinion. It should be noted that many of the potential health implications of climate change, acting through food supply and migration, could unfortunately not be accounted for by the methods used in the report.
Comparative risk assessment Expert survey Estimations with more limited data Transmission pathway
Figure ES12. Methods used for the estimation of burden of disease attributable to the environment
68%
30%
3% 0.03%
56%40%
3% 1%
Methods used in percentage share of attributable DALYs
Methods used in percentage share of attributable deaths
PREVENTING DISEASE THROUGH HEALTHY ENVIRONMENTSxxii
The way forward
In the decade since the last review the environment-attributable disease burden has remained virtually unchanged but a significant shift in the main disease categories involved is evident. It is clear that reducing the environmental burden of death and disease is entirely possible through cost-effective interventions. However, to be most effective and sustainable these measures need to be designed and implemented holistically.
The results of the study reinforce the public health principle that creating and maintaining healthy environments should be a priority of primary prevention. A change in perception to view the environment as an essential element of health protection, while adequately preserving it, would greatly benefit people’s health. Coordinating and acting across sectors will be necessary, as many different sectors play a crucial role (e.g. energy, industry/manufacturing, water and sanitation, agriculture, housing, transport) in determining environmental risks and conditions.
In addition to this cross-sector dimension, there is a vertical dimension: action is needed at all levels of governance. Local action can be a key determinant in shaping the local use of resources and management of health determinants. Cities are a special example requiring thoughtful planning and management. By 2050, 66% of the world’s population will live in urban areas, which are often characterized by heavy traffic, pollution, poor housing, limited access to water and sanitation services and other health risks. The workplace is another setting that influences health and provides opportunities for disease prevention. More than one half of the world’s population is economically active and in a number of countries at least two thirds of workers are employed in the informal sector with dangerous, dirty and demeaning working conditions.
Finally, the direct and indirect impacts of emerging risks, such as climate change and ecosystem change, need to be tackled urgently, as they are set to become the most challenging risks populations will face in the coming decades.
The Sustainable Development Goals, with their underpinning holistic philosophy, offer opportunities to make a lasting contribution to reducing the global disease burden attributable to environmental factors, and help “ensure healthy lives and promote well-being for all at all ages”.
EXECUTIVE SUMMARY xxiii

INTRODUCTION

Estimating the burden of disease that can be reduced by taking measures to decrease environmental risks to health is a key step in identifying and evaluating the most important priorities for targeted environmental action. At the same time, such estimates support the idea that sound environmental management can play a crucial role in protecting people’s health.
Ten years ago, the global burden of disease attributable to environmental factors was estimated at 24% (in DALYs, 2002) (Prüss-Ustün & Corvalan, 2006) – a figure which agreed with earlier global studies, for example 23% (WHO, 1997) and ranging between 25% and 33% (Smith et al, 1999).
This study is based on the best available evidence for the selected diseases and injuries and their l inks with the environment. Where feasible, the study uses comprehensive and the most accurate estimates available from comparative risk assessment (CRA) methods, which were developed by WHO and have been used by WHO, the Institute of Health Metrics and Evaluation and other research groups (Lim et al, 2012; WHO, 2004a). These methods apply detailed exposure and relative risk estimates assessing the burden of disease by region, country and age group. Many major environmental and occupational risks have been covered by such methods, provided that (a) there was clear causal evidence that could be applied globally; (b) global estimates of exposure could be obtained or estimated; and (c) they had considerable impact on people’s health. However, these assessments remain limited
in terms of the range of environmental risks assessed.
Compared with the 2006 study, the present analysis incorporates available estimates of the burden of disease from a much broader range of environmental risk factors and categories of diseases and health conditions affected. The analysis makes use of the results from CRAs, complemented by extensive literature reviews, approximate epidemiological estimates and standardized surveys of expert opinion, in an approach that applies full scientific rigour and transparency. Focusing on modifiable environmental risks, the current study examines “how much” such factors affect various diseases and injuries – both in terms of premature mortality and of overall disease burden as measured by disability-adjusted life years (DALYs), a weighted measure of death and disability.
The definition of “modifiable” environmental risk factors includes those reasonably amenable to management or change given current knowledge and technology, resources and social acceptability. Factors not readily modifiable were not considered. The analysis looked at most environmental risks and related burden of diseases that were quantifiable from available evidence. However, in some cases this is not known, for example certain diseases associated with changed, damaged or depleted ecosystems, and diseases associated with exposures to endocrine disrupting substances. The resulting analysis thus remains a conservative assessment of the estimate of the disease burden attributable to environmental factors.
INTRODUCTION 1

METHODS: ESTIMATING THE ENVIRONMENTAL BURDEN OF DISEASE

The environment: A contextual determinant of health
Environmental health addresses the physical, chemical and biological factors external to a person, and all the related behaviours (WHO, 2015c). To be even more policy relevant, the focus is placed on the environments that can be modified in the short or longer term (Box 1).
Box 1. The definition of “environment” used in this study
The environment is the congregation of all the physical, chemical and biological factors external to a person, and all related behaviours, but excluding those natural environments that cannot reasonably be modified.
This definition excludes behaviour not related to the environment, as well as behaviour related to the social and cultural environment, genetics and parts of the natural environment.
Box 2. Inclusions and exclusions to the definition of “environment” used in this study
Included environmental factors are the modifiable parts (or impacts) of:• Pollution of air, water or soil by chemical or biological agents• Ultraviolet (UV) and ionizing radiation*• Noise, electromagnetic fields• Occupational risks• Built environments, including housing; land-use patterns, roads• Major infrastructural and engineering works such as roads, dams, railways, airports• Man-made vector breeding places or breeding places catering to the specific ecological requirements of
vectors, such as old tyres or water containers• Agricultural methods, irrigation schemes• Man-made climate change, ecosystem change• Behaviour related to environmental factors, e.g. the availability of safe water for washing hands or
physical activity fostered through improved urban design
Excluded factors are:• Alcohol and tobacco consumption, drug abuse• Diet (although it could be argued that food availability influences diet)• The natural environments of vectors that cannot reasonably be modified (e.g. rivers, lakes, wetlands)• Insecticide impregnated mosquito nets (for this study they are considered to be non-environmental
interventions)• Unemployment (provided that it is not related to environmental degradation, occupational disease, etc.)• Natural biological agents, such as pollen • Person-to-person transmission that cannot reasonably be prevented through environmental interventions,
such as improving housing, introducing sanitary hygiene or making improvements in the occupational environment
* Although natural UV radiation from space is not modifiable (or only in a limited way, such as by reducing substances that destroy the ozone layer), individual behaviour to protect oneself against UV radiation is modifiable. UV and other ionizing radiations are therefore included in our assessment of the environmental disease burden.
This definition considers an environment which can be modified or manipulated with a view to removing a prevailing risk, without impairing other ecosystem functions. An illustration of inclusions and exclusions under this definition is provided in Box 2. This definition is compatible with the CRA approach, which uses a baseline scenario against which the current situation is assessed.
Occupational health risks are mostly directly related to physical, chemical and biological factors in the environment and related behaviour and are included in the definition of environment. For instance, infections acquired by health-care workers from needlestick injuries, as well as sexually transmitted diseases acquired in other occupational contexts, e.g. among sex workers, refer to contact with infectious agents in the work environment, and related behaviour. Occupational health
METHODS: ESTIMATING THE ENVIRONMENTAL BURDEN OF DISEASE 3
risks may also include the more general economic and social determinants of occupational conditions, such as job insecurity. Occupational health services can be instrumental in the prevention of selected diseases and conditions. Occupational health risks will, in this document, be considered as included in what we call the “environment”.
The working definition thus aims to include those parts of the environment that can be modified by environmental management and environmental hazards against which people can be protected. For onchocerciasis (river blindness), for example, the definition of environment would include only that part of the environment that was affected by man-made interventions (in this case, dams), and which could be modified by further interventions (for example by designs with two spillways which can be used alternately).
Estimates of the environmental health impacts would not include diseases caused by vectors living in natural environments such as rivers, if those vectors could not be controlled by reasonable environmental interventions. Similarly, deaths and injuries
of soldiers during war are not included here, even though they could be considered occupational, because no intervention could possibly provide a safe working environment.
The link with social determinants of health
Environmental and social determinants of health are closely interlinked. Social determinants are funct ions of the circumstances in which people live, work and grow; largely shaped by the distribution of resources and power. These determinants are closely linked to and mediate exposure to environmental risk factors such as working conditions, housing, water and sanitation or healthy lifestyles (Commission of Social Determinants of Health, 2008). There follow four examples on how social determinants of health modify exposure to environmental risks and, by consequence, related health outcomes.
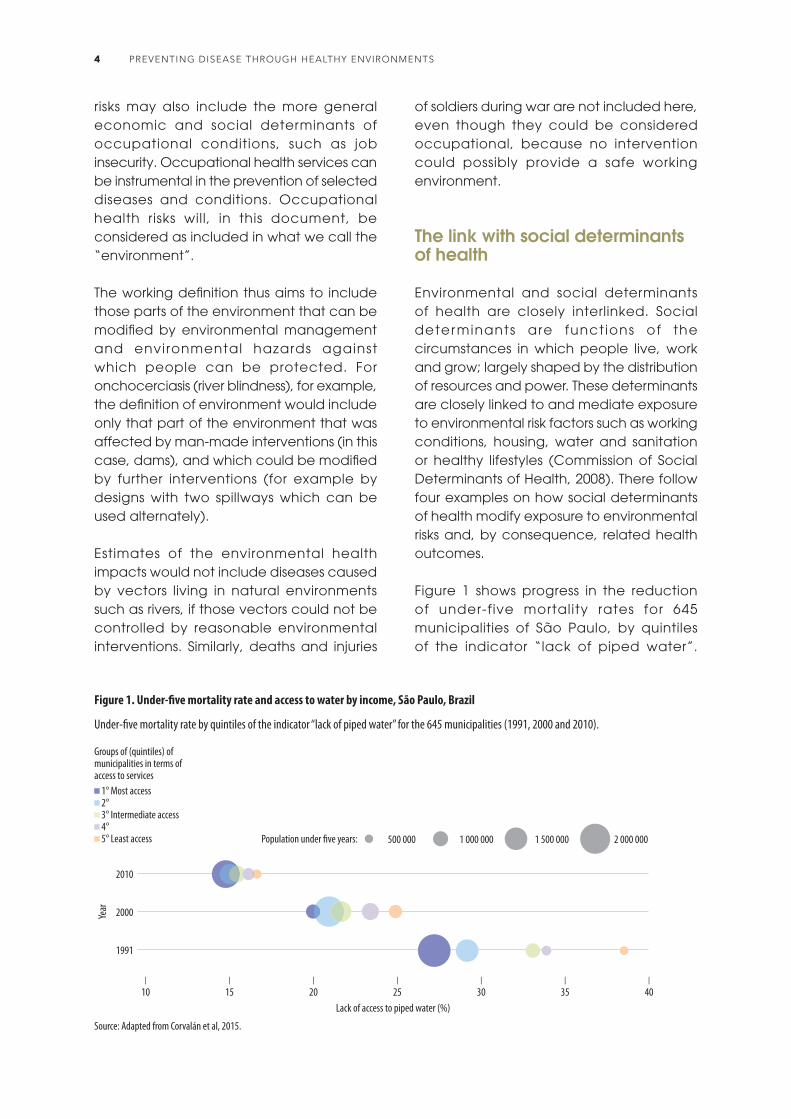
Figure 1 shows progress in the reduction of under-five mortality rates for 645 municipalities of São Paulo, by quintiles of the indicator “lack of piped water”.
Figure 1. Under-five mortality rate and access to water by income, São Paulo, Brazil
Source: Adapted from Corvalán et al, 2015.
Year
I10
I15
I20
I25
I30
I35
I40
1991
2000
2010
Lack of access to piped water (%)
Under-five mortality rate by quintiles of the indicator “lack of piped water” for the 645 municipalities (1991, 2000 and 2010).
500 000 1 000 000 1 500 000 2 000 000Population under five years:
1° Most access 2° 3° Intermediate access 4° 5° Least access
Groups of (quintiles) of municipalities in terms of access to services
PREVENTING DISEASE THROUGH HEALTHY ENVIRONMENTS4

In 1991 a large mortality difference by quintile was observed; since then there has been a reduction in mortality (move to the left) and a narrowing of the inter-quintile gaps (increasing equality). This shows the close interconnections between the socioeconomic and environmental determinants of health outcomes, in this case, of the under-five mortality rate.
Damp housing is another example of exposure difference by socioeconomic status. Damp housing may contain increased levels of bacteria, moulds and mycotoxins, which have been associated with respiratory symptoms in several epidemiological studies. Survey data from Norway have
shown that reported exposure to dampness is highest in single parent households. Also, housing below relative poverty levels is reportedly about 50% more frequently damp compared with households above the poverty level (National Survey of Living Conditions Statistics Norway 2007, see WHO Regional Office for Europe, 2012).
Sanitation coverage, which relates to the risk of diarrhoeal diseases, is linked to socioeconomic conditions. The pattern of progress in sanitation coverage may advance disproportionately benefiting the highest wealth quintiles, be equitable across wealth quintiles, level up in the lowest wealth quintiles, or stagnate across wealth quintiles (Figure 2).
Figure 2. Progress in sanitation coverage by typology (percentage, 1995–2010)
Source: WHO & UNICEF, 2014.
Improved facilities Shared facilities Unimproved facilities Open defecation
Type 1: Uneven progress, rural Pakistan
Poorest
1995 2010
Poor
1995 2010
Middle
1995 2010
Rich
1995 2010
Richest
1995 2010
Type 3: Levelling up, urban Cambodia Type 4: Stagnation, rural Burkina Faso
Richest
1995 2010
Rich
1995 2010
Middle
1995 2010
Poor
1995 2010
Poorest
1995 2010
Poorest
1995 2010
Poor
1995 2010
Middle
1995 2010
Rich
1995 2010
Richest
1995 2010
Type 2: Equitable progress, rural Peru
Poorest
1995 2010
Poor
1995 2010
Middle
1995 2010
Rich
1995 2010
Richest
1995 2010
78 76
159
25
4
11
72
57
17
16
29
4
23
66
39
19
18
3
12
7
35
61
13
17
17
2
20
7
63
41
0
16
9
3
40
7
84
75
37
14
25
1
10
1
37
74
34
14
24
2
10
2
41
67
31
19
25
2
12
2
43
58
26
22
26
2
18
4
44
3420
27
20
5
34
7
53
96
54
4
3
00
14
29
85
14
11
2
4
0
15
69
32
2
15
0
15
38
11
87
5 06
0
16
73
4
96
1 01 09
89
0
10093 96
2 232 11
92 90
4 522 32
9286
35
32
54
86 81
7 9
34
46
7265
1316
6
9
8
11
METHODS: ESTIMATING THE ENVIRONMENTAL BURDEN OF DISEASE 5
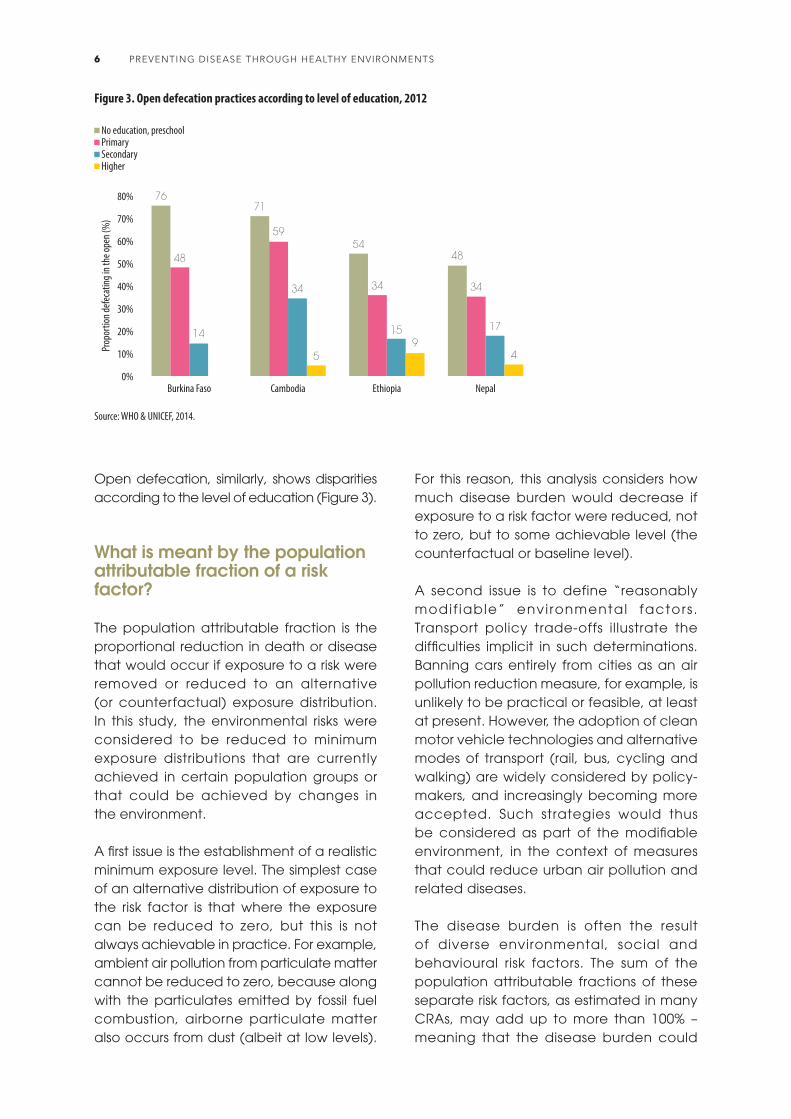
Open defecation, similarly, shows disparities according to the level of education (Figure 3).
What is meant by the population attributable fraction of a risk factor?
The population attributable fraction is the proportional reduction in death or disease that would occur if exposure to a risk were removed or reduced to an alternative (or counterfactual) exposure distribution. In this study, the environmental risks were considered to be reduced to minimum exposure distributions that are currently achieved in certain population groups or that could be achieved by changes in the environment.
A first issue is the establishment of a realistic minimum exposure level. The simplest case of an alternative distribution of exposure to the risk factor is that where the exposure can be reduced to zero, but this is not always achievable in practice. For example, ambient air pollution from particulate matter cannot be reduced to zero, because along with the particulates emitted by fossil fuel combustion, airborne particulate matter also occurs from dust (albeit at low levels).
Prop
ortio
n defe
catin
g in t
he op
en (%
)
50%
30%
20%
10%
40%
60%
Figure 3. Open defecation practices according to level of education, 2012
70%
80%
0%
No education, preschool Primary Secondary Higher
Burkina Faso
76
48
14
Cambodia
71
59
34
5
Ethiopia
54
34
159
Nepal
48
34
17
4
Source: WHO & UNICEF, 2014.
For this reason, this analysis considers how much disease burden would decrease if exposure to a risk factor were reduced, not to zero, but to some achievable level (the counterfactual or baseline level). A second issue is to define “reasonably modif iable” envi ronmental factors . Transport policy trade-offs illustrate the difficulties implicit in such determinations. Banning cars entirely from cities as an air pollution reduction measure, for example, is unlikely to be practical or feasible, at least at present. However, the adoption of clean motor vehicle technologies and alternative modes of transport (rail, bus, cycling and walking) are widely considered by policy-makers, and increasingly becoming more accepted. Such strategies would thus be considered as part of the modifiable environment, in the context of measures that could reduce urban air pollution and related diseases.
The disease burden is often the result of diverse environmental, social and behavioural risk factors. The sum of the population attributable fractions of these separate risk factors, as estimated in many CRAs, may add up to more than 100% – meaning that the disease burden could
PREVENTING DISEASE THROUGH HEALTHY ENVIRONMENTS6

be potentially reduced or eliminated by tackling different risk factors.
Estimating the population attributable fraction
This report acknowledges that the root causes of ill health are multifactorial and that social determinants can modify the impact of environmental risks in complex ways and to different degrees. A holistic approach, which addresses all types of risk factors, is highly valuable in our understanding of the modifying role social determinants play in the health status of populations, as well as in the design and implementation of overarching interventions. Such a holistic approach is, however, not useful for the quantification of the specific contributions of diverse environmental risk factors, which is the aim of this study.
To estimate comprehensive health impacts of environmental risks worldwide, available CRAs for specific environmental factors were combined for each disease, and were complemented with approximate epidemiological estimates and surveys of expert opinion. For each of the 133 diseases and injuries listed in the WHO Global Health Observatory for 2012 (WHO, 2015d), representing the entire disease burden, the literature was systematically searched to identify the best available evidence of population health impacts from environmental risks. The search strategy included each of the diseases or injuries, combined with the term “environment”, relevant environmental risks or any of the occupational groups at risk, up to the end of 2014. Older literature was included from the earlier search made for the 2006 edition of this publication. In addition, major projects of risk assessments were reviewed for relevant data. Diseases, injuries and their groupings were classified according to the International Classification of Diseases (WHO, 2015g).
The results of the literature review were used to compile quantitative estimates
and summaries of links between diseases and injuries and the environment, using the following order of priority for each disease: 1. Global est imates (such as CRAs)
of population impacts for selected environmental risks;
2. National or regional estimates of population impacts;
3. Results of systematic reviews and meta-analyses on disease reduction from interventions or on environmental determinants; and
4. Individual studies on interventions and environmental determinants.
Four different approaches were used to arrive at estimates of the fractions of disease attributable to environmental risks, according to available estimates, the type and amount of evidence available on exposure and exposure-risk relationships, and knowledge of disease transmission pathways. The various approaches are briefly outlined below, and presented in more detail in the respective disease sections and technical annexes.
In order of priority, the following approaches were applied to each disease:• Comparative risk assessment: estimates
resulting from this approach were used if available. CRA methods generally provide estimates based on the strongest evidence and most comprehensive data.
• Calculation based on limited exposure and/or epidemiological data.
• Certain diseases were entirely attributed to the environment according to knowledge of their transmission pathways.
• Expert survey: expert surveys were used when CRAs were not available, and exposure information and/or exposure-risk relations from limited epidemiological data were insufficient.
Comparative risk assessment
Whenever available, CRA methods were used. These methods use: (a) detailed population exposure data; (b) an alternative (counterfactual) exposure distribution to
METHODS: ESTIMATING THE ENVIRONMENTAL BURDEN OF DISEASE 7
which environmental risks could be reduced; and (c) matching exposure-risk relationships for the global population. For each disease, these data are combined into population attributable fractions (see Table A2.1). Furthermore, a set of basic criteria was used for selection of exposure-disease pairings, for the definition of alternative (counterfactual) exposure distribution, as well as the selection of exposure and exposure-risk data used. Detailed methods are described elsewhere (Ezzati et al, 2002; Lim et al, 2012; Prüss-Ustün & Mathers, 2003; WHO, 2009a).
Calculations based on limited epidemiological data
In cases where (a) l imited exposure information was available; (b) data on prevalence of disease in high-risk population were available; or (c) outcomes could in part be attributed to certain environmental conditions; then population attributable fractions could also be estimated, but were generally based more on assumption and extrapolation and, presumably, weaker evidence. Additional details on certain disease outcomes are provided in Annex 3.
Disease transmission pathway
In certain cases, the transmission of a disease is dependent on a pathway involving specific environmental conditions, which are modifiable. An example is intestinal nematode infections, which require the presence of inadequately disposed human excreta in the environment, and are therefore entirely attributed to the environment.
Expert survey
Where neither CRA at the global level, nor sufficient data to perform approximate calculations of population attributable fractions based on more limited evidence were available, then a survey of experts was performed. Three or more experts were consulted to provide their estimates of the population attributable fraction for one or more disease or injury.
These experts were selected on the basis of their publication record, preferably international in scope, in the area of the disease or the relevant environmental risk factor. A geographical balance was sought in their selection, in particular for diseases involving environmental risks with strong regional variation. The experts were provided with abstracts of search results from the systematic reviews, as well as an initial estimate that was based on pooled estimates from the literature. CRA results also often provided partial results for a disease and a corresponding attributable risk.
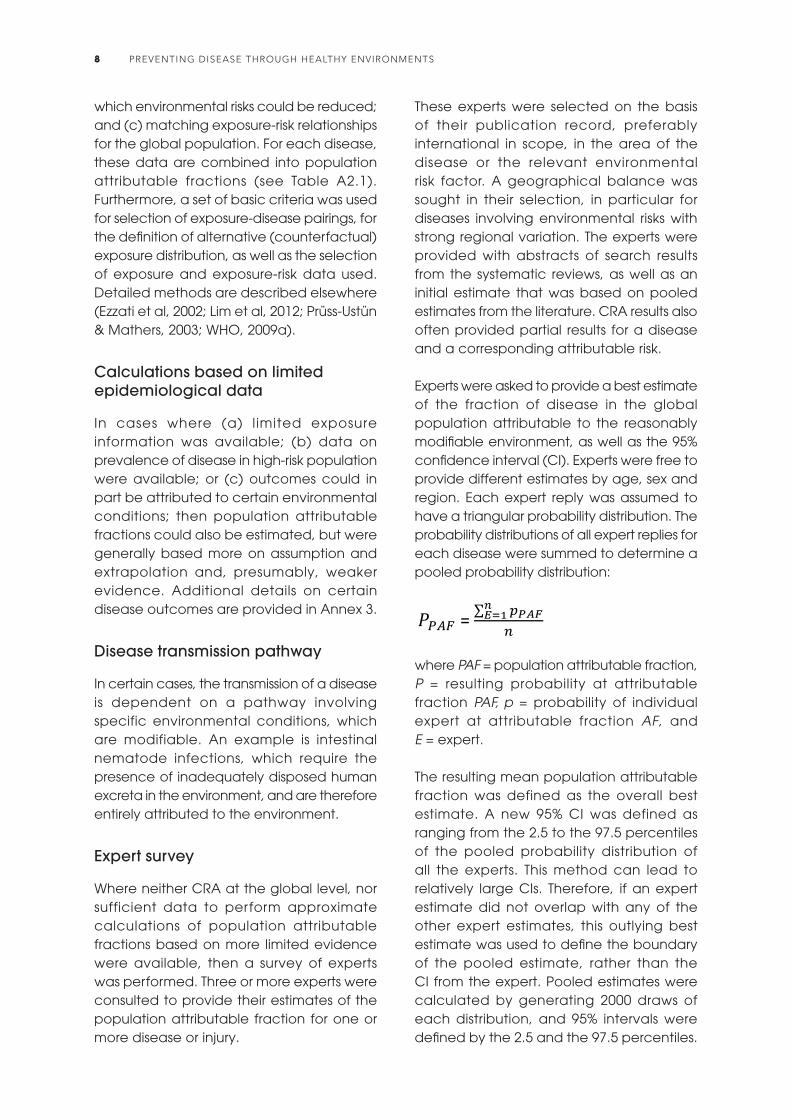
Experts were asked to provide a best estimate of the fraction of disease in the global population attributable to the reasonably modifiable environment, as well as the 95% confidence interval (CI). Experts were free to provide different estimates by age, sex and region. Each expert reply was assumed to have a triangular probability distribution. The probability distributions of all expert replies for each disease were summed to determine a pooled probability distribution:
=
where PAF = population attributable fraction, P = resulting probability at attributable fraction PAF, p = probability of individual expert at attributable fraction AF, and E = expert.
The resulting mean population attributable fraction was defined as the overall best estimate. A new 95% CI was defined as ranging from the 2.5 to the 97.5 percentiles of the pooled probability distribution of all the experts. This method can lead to relatively large CIs. Therefore, if an expert estimate did not overlap with any of the other expert estimates, this outlying best estimate was used to define the boundary of the pooled estimate, rather than the CI from the expert. Pooled estimates were calculated by generating 2000 draws of each distribution, and 95% intervals were defined by the 2.5 and the 97.5 percentiles.
PREVENTING DISEASE THROUGH HEALTHY ENVIRONMENTS8

Where the body of evidence resulting from the updated literature review did not substantially differ or was unlikely to justify a change in expert estimation of population attributable fraction, the results of the expert survey of the 2006 edition were used. Certain diseases or environmental risk factors were not included in the analysis, either because there was insufficient evidence at the global level or because the risk factor resulted in a relatively small disease burden.
Combining risk factors for individual diseases
When several estimates of a disease burden from relevant risk factors were available for a single disease, they were combined using the following assumptions:
• Exposures to the same pollutant but from different sources were considered as additive (e.g. from ambient air pollution, household air pollution and second-hand tobacco smoke). The population was thereby distributed into an exposure “profile” by country, sex and age group, for each exposure level.
• Exposures to different pollutants or affecting very specific population subgroups (e.g. certain occupations) were combined using the product of complements for the attributable fractions:
2. Methods
𝑃𝑃𝑃𝑃𝑃𝑃 = 1 − ∏(1 − 𝑃𝑃𝑃𝑃𝑃𝑃𝑟𝑟)𝑅𝑅
𝑟𝑟=1
𝑃𝑃𝐴𝐴 = 𝑃𝑃𝑃𝑃𝑃𝑃 × 𝐴𝐴
𝑃𝑃𝐴𝐴(𝐷𝐷𝑃𝑃𝐷𝐷𝐷𝐷𝐷𝐷) = 𝑃𝑃𝑃𝑃𝑃𝑃 × 𝐴𝐴(𝐷𝐷𝑃𝑃𝐷𝐷𝐷𝐷𝐷𝐷)
Annex 3
-
(Equation 1)
(Equation 1)
dxxPxRRm
x0
)()( dxxPxRRm
x0
)(')(
m
x
dxxPxRR0
)()(
PAF = =
where PAF = population attributable fraction and r = the individual risk factor (Lim et al, 2012).
This method was applied for major noncommunicable diseases (NCDs). Further details are provided in Annex 2.
For diseases with estimates of attributable burden via CRA for at least one major risk factor (e.g. air pollution or water and sanitation) no additional risk factor using any other assessment method was considered for estimating the overall population attributable fraction.
Estimating the burden of disease attributable to the environment
To calculate the fraction of disease attributable to a risk factor for any defined population, compiled or est imated population attributable fractions were multiplied by the corresponding WHO disease statistics (WHO, 2015d), by disease or injury, country, sex and age group, for deaths and DALYs. The following equations were used:
2. Methods
𝑃𝑃𝑃𝑃𝑃𝑃 = 1 − ∏(1 − 𝑃𝑃𝑃𝑃𝑃𝑃𝑟𝑟)𝑅𝑅
𝑟𝑟=1
𝑃𝑃𝐴𝐴 = 𝑃𝑃𝑃𝑃𝑃𝑃 × 𝐴𝐴
𝑃𝑃𝐴𝐴(𝐷𝐷𝑃𝑃𝐷𝐷𝐷𝐷𝐷𝐷) = 𝑃𝑃𝑃𝑃𝑃𝑃 × 𝐴𝐴(𝐷𝐷𝑃𝑃𝐷𝐷𝐷𝐷𝐷𝐷)
Annex 3
-
(Equation 1)
(Equation 1)
dxxPxRRm
x0
)()( dxxPxRRm
x0
)(')(
m
x
dxxPxRR0
)()(
PAF = =
and
2. Methods
𝑃𝑃𝑃𝑃𝑃𝑃 = 1 − ∏(1 − 𝑃𝑃𝑃𝑃𝑃𝑃𝑟𝑟)𝑅𝑅
𝑟𝑟=1
𝑃𝑃𝐴𝐴 = 𝑃𝑃𝑃𝑃𝑃𝑃 × 𝐴𝐴
𝑃𝑃𝐴𝐴(𝐷𝐷𝑃𝑃𝐷𝐷𝐷𝐷𝐷𝐷) = 𝑃𝑃𝑃𝑃𝑃𝑃 × 𝐴𝐴(𝐷𝐷𝑃𝑃𝐷𝐷𝐷𝐷𝐷𝐷)
Annex 3
-
(Equation 1)
(Equation 1)
dxxPxRRm
x0
)()( dxxPxRRm
x0
)(')(
m
x
dxxPxRR0
)()(
PAF = =
where AM = attr ibutable mortal ity, PAF = population attributable fraction, M = mortality, AB (DALYs) = attributable burden in DALYs and B (DALYs) = burden of disease in DALYs, for each disease or injury, country, sex and age group, where relevant.
Estimating uncertainties
Every estimate of a population attributable fraction was characterized by a best estimate and a CI, whether based on CRA, limited epidemiological evidence or on expert surveys. The upper and lower estimates of the attributable disease burden were defined as the 2.5 and 97.5 percentiles of 2000 draws using those distributions.
METHODS: ESTIMATING THE ENVIRONMENTAL BURDEN OF DISEASE 9

RESULTS: A SYSTEMATIC ANALYSIS OF FRACTIONS ATTRIBUTABLE TO THE ENVIRONMENT, BY DISEASE
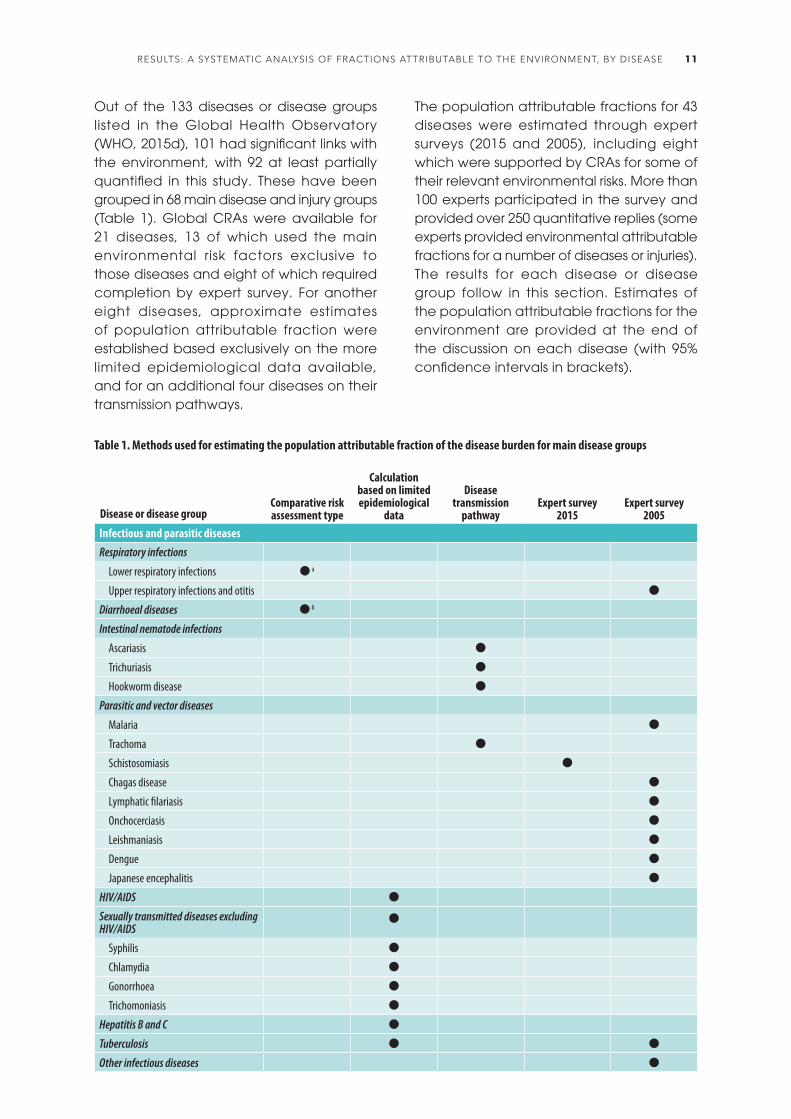
Out of the 133 diseases or disease groups listed in the Global Health Observatory (WHO, 2015d), 101 had significant links with the environment, with 92 at least partially quantified in this study. These have been grouped in 68 main disease and injury groups (Table 1). Global CRAs were available for 21 diseases, 13 of which used the main environmental risk factors exclusive to those diseases and eight of which required completion by expert survey. For another eight diseases, approximate estimates of population attributable fraction were established based exclusively on the more limited epidemiological data available, and for an additional four diseases on their transmission pathways.
The population attributable fractions for 43 diseases were estimated through expert surveys (2015 and 2005), including eight which were supported by CRAs for some of their relevant environmental risks. More than 100 experts participated in the survey and provided over 250 quantitative replies (some experts provided environmental attributable fractions for a number of diseases or injuries). The results for each disease or disease group follow in this section. Estimates of the population attributable fractions for the environment are provided at the end of the discussion on each disease (with 95% confidence intervals in brackets).
Disease or disease groupComparative risk assessment type
Calculation based on limited epidemiological
data
Disease transmission
pathwayExpert survey
2015Expert survey
2005Infectious and parasitic diseasesRespiratory infections
Lower respiratory infections a
Upper respiratory infections and otitis
Diarrhoeal diseases b
Intestinal nematode infections
Ascariasis
Trichuriasis
Hookworm disease
Parasitic and vector diseases
Malaria
Trachoma
Schistosomiasis
Chagas disease
Lymphatic filariasis
Onchocerciasis
Leishmaniasis
Dengue
Japanese encephalitis
HIV/AIDS
Sexually transmitted diseases excluding HIV/AIDS
Syphilis
Chlamydia
Gonorrhoea
Trichomoniasis
Hepatitis B and C
Tuberculosis
Other infectious diseases
Table 1. Methods used for estimating the population attributable fraction of the disease burden for main disease groups
RESULTS: A SYSTEMATIC ANALYSIS OF FRACTIONS ATTRIBUTABLE TO THE ENVIRONMENT, BY DISEASE 11

Disease or disease groupComparative risk assessment type
Calculation based on limited epidemiological
data
Disease transmission
pathwayExpert survey
2015Expert survey
2005Neonatal and nutritional conditionsNeonatal conditions
Protein-energy malnutrition
Noncommunicable diseasesLung cancer a
Other cancers ( )
Mental, behavioural and neurological disorders
Unipolar depressive disorders
Bipolar disorder
Schizophrenia
Alcohol use disorders
Drug use disorders
Anxiety disorders
Eating disorders
Pervasive developmental disorders
Childhood behavioural disorders
Idiopathic intellectual disability
Alzheimer's disease and other dementias
Parkinson's disease
Epilepsy
Multiple sclerosis
Migraine
Non-migraine headache
Other mental, behavioural and neurological conditions
Sense organ diseases
Cataracts b
Hearing loss c
Cardiovascular diseases
Rheumatic heart disease c
Hypertensive heart disease c
Ischaemic heart disease a
Stroke a
Other circulatory diseases c
Respiratory diseases
Chronic obstructive pulmonary disease a
Asthma ( )
Kidney diseases c
Musculoskeletal diseases
Rheumatoid arthritis
Osteoarthritis
Back pain c
Neck pain
Other musculoskeletal diseases
Congenital anomalies
PREVENTING DISEASE THROUGH HEALTHY ENVIRONMENTS12

Disease or disease groupComparative risk assessment type
Calculation based on limited epidemiological
data
Disease transmission
pathwayExpert survey
2015Expert survey
2005Unintentional injuriesRoad traffic injuries ( )
Unintentional poisonings ( )
Falls ( )
Fires, heat and hot substances ( )
Drownings ( )
Other unintentional injuries ( )
Intentional injuriesSelf-harm
Interpersonal violence
Notes: Estimates/method used; ( ) Estimates available, but completion by expert survey as main risk factor disease pairing not assessed; a Source is a combination of various risk factors developed for this analysis by WHO, based on IHME, 2014; WHO, 2014b; WHO, 2014d; b Source is WHO (Prüss-Ustün et al, 2014; WHO, 2014d); c Source: (IHME, 2014); see disease-specific sections and Annex 3 for further information.
The following section reviews the evidence by disease or injury group. An estimate of the fraction of disease or injury attributable
to the environment is provided in each case. This fraction refers to the disease burden in DALYs.
More than one quarter of the 6.6 million under-five child deaths every year are associated with environment-related causes and conditions.
RESULTS: A SYSTEMATIC ANALYSIS OF FRACTIONS ATTRIBUTABLE TO THE ENVIRONMENT, BY DISEASE 13

INFECTIOUS AND PARASITIC DISEASESRESPIRATORY INFECTIONS
Household air pollutionMethod: CRA
33%
Ambient air pollutionMethod: CRA
8%
Second-hand tobacco smokeMethod: CRA
9%
Total environmental risksMethod: combination of data from CRAs
35%
UPPER RESPIRATORY INFECTIONS AND OTITIS
Various forms of air pollutionMethod: expert survey
24%
Lower respiratory infections include pneumonia, bronchitis and bronchiolitis, causing 935 000 deaths per year (in 2013). These infections are the most important cause of mortality in children, accounting for 18% of deaths in children under five (WHO, 2014x; WHO, 2015d). Pneumonia is an infection of the lung which can
be caused by exposure to a number of infectious agents, including viruses, bacteria and fungi (WHO, 2014x). Main risk factors for susceptibility to the disease include a compromised immune system, malnutrition and environmental risk factors such as smoke from heating or cooking with biomass, living in crowded homes and exposure to second-hand tobacco smoke.
The most important environmental risk factor is exposure to smoke from cookstoves, which was responsible for 33% of the disease burden of lower respiratory infections (in DALYs) in 2012 (WHO, 2015d). Exposure to ambient air pollution is responsible for 7.9% of the disease burden (in DALYs) in 2012 (WHO, 2015d). Second-hand tobacco smoke also causes pneumonia in children and 9.3% of lower respiratory infections have been attributed to it (Lim et al, 2012). Living in crowded homes has also been associated with a higher risk of developing pneumonia (Jackson et al, 2013; WHO, 2014x), as has inadequate hand hygiene (Aiello et al, 2008).
Lower respiratory infections are likely to be sensitive to climate change, as their incidence varies with different weather patterns such as fluctuations in rainfall. Climate change may also indirectly impact on respiratory infections through undernutrition due to food shortages that may result from climate change, and through crowding due to large-scale population displacement (Paynter et al, 2010).
Environmental measures to prevent pneumonia include reducing ambient and household air pollution, e.g. by providing affordable options for clean home energy solutions for cooking, heating and lighting, and encouraging good hygiene practices
PREVENTING DISEASE THROUGH HEALTHY ENVIRONMENTS14
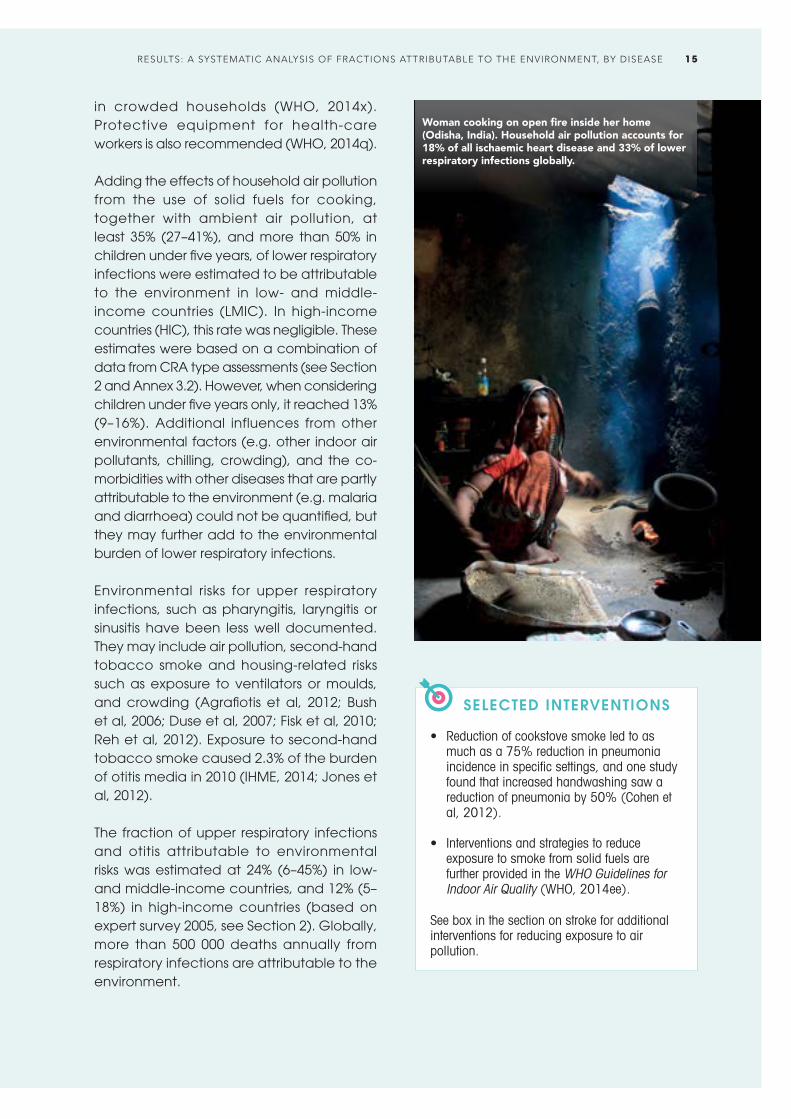
in crowded households (WHO, 2014x). Protective equipment for health-care workers is also recommended (WHO, 2014q).
Adding the effects of household air pollution from the use of solid fuels for cooking, together with ambient air pollution, at least 35% (27–41%), and more than 50% in children under five years, of lower respiratory infections were estimated to be attributable to the environment in low- and middle-income countries (LMIC). In high-income countries (HIC), this rate was negligible. These estimates were based on a combination of data from CRA type assessments (see Section 2 and Annex 3.2). However, when considering children under five years only, it reached 13% (9–16%). Additional influences from other environmental factors (e.g. other indoor air pollutants, chilling, crowding), and the co-morbidities with other diseases that are partly attributable to the environment (e.g. malaria and diarrhoea) could not be quantified, but they may further add to the environmental burden of lower respiratory infections.
Environmental risks for upper respiratory infections, such as pharyngitis, laryngitis or sinusitis have been less well documented. They may include air pollution, second-hand tobacco smoke and housing-related risks such as exposure to ventilators or moulds, and crowding (Agrafiotis et al, 2012; Bush et al, 2006; Duse et al, 2007; Fisk et al, 2010; Reh et al, 2012). Exposure to second-hand tobacco smoke caused 2.3% of the burden of otitis media in 2010 (IHME, 2014; Jones et al, 2012).
The fraction of upper respiratory infections and otitis attributable to environmental risks was estimated at 24% (6–45%) in low- and middle-income countries, and 12% (5–18%) in high-income countries (based on expert survey 2005, see Section 2). Globally, more than 500 000 deaths annually from respiratory infections are attributable to the environment.
SELECTED INTERVENTIONS
• Reduction of cookstove smoke led to as much as a 75% reduction in pneumonia incidence in specific settings, and one study found that increased handwashing saw a reduction of pneumonia by 50% (Cohen et al, 2012).
• Interventions and strategies to reduce exposure to smoke from solid fuels are further provided in the WHO Guidelines for Indoor Air Quality (WHO, 2014ee).
See box in the section on stroke for additional interventions for reducing exposure to air pollution.
Woman cooking on open fire inside her home (Odisha, India). Household air pollution accounts for 18% of all ischaemic heart disease and 33% of lower respiratory infections globally.
RESULTS: A SYSTEMATIC ANALYSIS OF FRACTIONS ATTRIBUTABLE TO THE ENVIRONMENT, BY DISEASE 15

Diarrhoeal diseases are one of the main contributors to global child mortality, causing 20% of all deaths in children under five years (WHO, 2015d). A large proportion of diarrhoeal diseases are caused by faecal-oral pathogens.
DIARRHOEAL DISEASES
Drinking-waterMethod: CRA
34%
SanitationMethod: CRA
19%
HandwashingMethod: CRA
20%
Total environmental risks (LMIC)
58%
The predominant route of transmission depends on the pathogen, local infrastructure (e.g. whether the population has access to appropriate sanitation and safe water) and human behaviour. If sanitation or related hygiene is poor, e.g. when handwashing facilities are inadequate or when faeces are disposed of improperly, excreta may contaminate hands, which can then contaminate food or other humans (person-to-person transmission). Additionally, faecal pathogens transferred to sewage systems that are not linked to treatment plants may subsequently contaminate surface and ground water. Human excreta can also directly contaminate the soil and surface water, e.g. through open defecation and come in contact with people – flies may carry pathogens from excreta to food, for example. Through these pathways, drinking-water, recreational water or food may be contaminated and cause diarrhoeal disease following ingestion (Prüss et al, 2002). Furthermore, pathogens in animal excreta may also contaminate drinking-water sources (Dufour et al, 2012).
Clogged-up open sewers, poor drainage and lack of solid waste management (here: Jakarta, Indonesia) create urban conditions around the world conducive to intense transmission of communicable diseases.
PREVENTING DISEASE THROUGH HEALTHY ENVIRONMENTS16

Rotavirus is an important pathogen for childhood diarrhoea (Kotloff et al, 2013; Tate et al, 2012), and the main pathway is the faecal-oral route, often via contact with contaminated hands, surfaces and objects, and waterborne infections (Ansari et al, 1991). Changes in climate also affect the transmission of infectious diarrhoea predicting a future increase in diarrhoea incidence, highlighting yet an additional link of diarrhoea with the environment (Levy et al, 2009; Singh et al, 2001; WHO, 2014z).
Improvements in access to water and sanitation facilities, water quality and personal hygiene are effectively reducing diarrhoea morbidity (Freeman et al, 2014; Wolf et al, 2014). Today, although 89% of the world’s population benefit from access to improved (though not necessarily safe) drinking-water sources, only 64% have access to an improved sanitation facility, and 14% still practise open defecation (Bain et al, 2014; WHO & UNICEF, 2014). Only 19% of the world’s population wash hands with soap after defecation (Freeman et al, 2014).
WHO recently estimated that 58% of all cases of diarrhoea in LMIC could be attributed to inadequate drinking-water (34%), sanitation (19%) and hygiene (20%) (Prüss-Ustün et al, 2014). This estimate only took into account the benefits of well-documented interventions, and did not factor in additional benefits such as from continuous rather than intermittent availability of drinking-water. An additional diarrhoea burden occurs through aspects of food safety that are related to water, sanitation and hygiene (i.e. food contamination by unsafe water or the lack of domestic hygiene). For high-income countries, only the fraction of diarrhoea attributable to hygiene has been estimated, amounting to 13% (0–45%) (Freeman et al, 2014).
In total, it was estimated that around 58% (34–72%) of all cases of diarrhoea in low- and middle-income countries, or 57% worldwide, were attributable to the environment, resulting in 842 000 deaths annually (CRA,
Prüss-Ustün et al, 2014). Water, sanitation and hygiene also play an important role in malnutrition (covered in the subsection, Protein-energy malnutrition).
SELECTED INTERVENTIONS
• Interventions that improved drinking-water, access to sanitation and hygiene effectively reduced diarrhoeal morbidity (by 45%, 28% and 23% respectively) (Freeman et al, 2014; Wolf et al, 2014).
• A reduction of 45% of diarrhoea morbidity could be obtained by filtering and safe storage of water from an unimproved source in the household; a reduction of 38% of diarrhoea morbidity could be obtained by doing the same with water from an improved water source (Wolf et al, 2014).
• For people living with HIV/AIDS, interventions that improved water quality reduced diarrhoea morbidity by 43% (Peletz et al, 2013).
• Implementation of the following guidelines and plans:– Guidelines for drinking-water quality
(WHO, 2011b);– Guidelines for recreational water
environments (WHO, 2003a; 2006a);– Guidelines for the safe use of wastewater,
excreta and greywater (WHO, 2006b);– Sanitation safety planning and water
safety planning (WHO, 2009c; 2015j).
ECONOMIC EVALUATIONS
• Interventions that improved water supply, water quality and access to sanitation were cost-effective in most regions and were all cost-beneficial in low-income regions. An investment of US$ 1 in such programmes led to a return of between US$ 5 and US$ 6 (Haller et al, 2007).
• Hygiene in six different low-income countries was promoted at costs ranging from US$ 1.05 to US$ 1.74 per person per year. These interventions were highly effective in reducing open defecation and improving personal hygiene (Sijbesma & Christoffers, 2009).
RESULTS: A SYSTEMATIC ANALYSIS OF FRACTIONS ATTRIBUTABLE TO THE ENVIRONMENT, BY DISEASE 17

INTESTINAL NEMATODE INFECTIONS
Sanitation Method: transmission pathway
100%
Ascariasis, trichuriasis and ancylostomiasis/necatoriasis (roundworm, whipworm and hookworm disease, respectively) are intestinal infections caused by soil-transmitted helminths. They affect more than two billion people worldwide (WHO, 2012h). Infections of heavy intensity affect the physical growth and cognitive development of children, and are a cause of micronutrient deficiencies including iron-deficiency anaemia. In countries of high endemicity, preventive administration of anti-helminthic drugs has been the main strategy to control morbidity, especially among school children. However, reinfection occurs rapidly after treatment (Jia et al, 2012) as long as the environment continues to be conducive to maintaining the transmission cycle.
Transmission does not occur from person-to-person or from fresh faeces but via
soil contaminated with human excreta containing infectious eggs or larvae. Open defecation, a daily practice of over one billion people globally (WHO & UNICEF, 2014), mainly in South Asia and Africa south of the Sahara, is the main cause. Even with access to some form of sanitation facilities, however, the subsequent poor management of human waste may still contribute to transmission risks. This includes the use of wastewater and excreta in agriculture without adequate risk management measures (WHO, 2006c). Transmission may take place near the home, in communal defecation fields or further afield in pastures or cropping areas. Transmission of Ascaris lumbricoides and Trichuris trichiura occurs when infective eggs are ingested with uncooked, unwashed or unpeeled food products contaminated with soil containing worm eggs, or grown using excreta or wastewater. In the case of hookworm, infective larvae penetrate the skin (Heymann, 2008).
Current recommendations to reduce morbidity due to intestinal nematode infections consist of combining drug administration with improved sanitation and hygiene (including the supply of enough domestic water to perform basic hygiene practices), backed up by appropriate health education (Strunz et al, 2014; WHO, 2012h; Ziegelbauer et al, 2012).
The unsafe use of wastewater in agriculture may contribute significantly to the prevalence of soil-transmitted helminth infections among farming communities and consumers (Dakar, Senegal).
PREVENTING DISEASE THROUGH HEALTHY ENVIRONMENTS18

The rapidly expanding practice of wastewater use in agriculture, particularly in peri-urban areas, contributes increasingly to the transmission of soil-transmitted helminths among agricultural workers, communities practising this form of agriculture and consumers of the resulting produce. Little is currently known about the relative importance of this pathway. WHO has published guidelines proposing a method of integrated risk assessment and management to prevent transmission and the associated adverse health impacts (WHO, 2006c). Between 4 and 20 million hectares of land were estimated to be under wastewater irrigation in 2010 (Drechsel et al, 2010).
The global mean fraction of the disease burden due to soil-transmitted helminth infections attributable to manageable environmental conditions is estimated to be 100%, based on information available on the transmission pathways (Prüss-Ustün et al, 2004).
Malaria is the most important vector-borne disease globally, causing many deaths in children under five. It is caused by species of protozoan parasites belonging to the genus Plasmodium, which are transmitted by the bites of infected Anopheles mosquitoes. Malaria is a life-threatening disease: in 2013, it caused an estimated 584 000 deaths, mostly among African children.
The larval stages of anopheline mosquitoes occur in a wide range of habitats, but most species share a preference for clean, unpolluted, stagnant or slowly moving fresh water (Muir, 1988). For local populations (rather than incidental visitors to malarial areas) clinical prevention options are limited and with respect to cure there is concern over growing drug resistance. Vector control is therefore an important component of sustainable disease reduction strategies (Karunamoorthi, 2011).
Among the arsenal of preventive measures is environmental management for malaria vector control. An array of environmental modification and manipulation methods are available for vector control in general, and malaria vector control in particular (WHO, 1982). These are specific to the ecology of local vectors. There are, however, also settings where vectors are so entrenched in the local ecology that environmental management is not an option – such is the case in large parts of Africa where perennial transmission by A. gambiae and A. funestus occurs.
MALARIA
Environmental vector managementMethod: expert survey
42%
SELECTED INTERVENTIONS
• Access to and use of facilities for the safe disposal of human excreta have shown a mean reduced likelihood of 34% in soil-transmitted nematode infections; use of treated water reduced the likelihood of soil-transmitted nematode infections by 54%, and soap use by 47%, and handwashing before eating and after defecation also reduced the likelihood (Strunz et al, 2014).
• A comprehensive control programme
in Chinese villages – a combination of environmental management, provision of domestic water supply and sanitation facilities, and health education – targeted at schistosomiasis reduced A. lumbricoides and T. trichuria infection rates in humans from 27.6% and 62.0% to 3.8% and 7.5%, respectively, as compared with a baseline situation relying on chemotherapy alone (Wang et al, 2009), in addition to reducing the prevalence of schistosomiasis.
RESULTS: A SYSTEMATIC ANALYSIS OF FRACTIONS ATTRIBUTABLE TO THE ENVIRONMENT, BY DISEASE 19

Environmental management strategies for malaria transmission interruption can be defined according to eco-epidemiological settings, which include the following:• Rural malaria attributable to water
resource development and management (e.g. irrigation systems, large dams, series of small dams (Ghebreyesus et al, 1999), wetlands, rivers, streams and coastal lagoons;
• Urban and peri-urban malaria; and• Malaria of deep forests and hills, with a
focus on forest-fringe malaria.
Details of environmental determinants of malaria have been reviewed for the various regions (Beljaev, 2002; Cox et al, 2002; Roberts et al, 2002; Sabatinelli, 2002; Schapira, 2002; Sharma, 2002). Environmental modification or manipulation to reduce vector densities or management of the human habitat (housing, distribution of domestic animals) to reduce human-vector contact can be designed for all eco-epidemiological settings except forest areas.
Environmental modification for vector control includes introducing permanent changes to the landscape (drainage, land levelling, filling depressions, borrow pits, pools and ponds, modifying river beds and lake shores) and design features and hydraulic structures in water resources development (self-draining weirs, canal lining to prevent seepage, contouring reservoirs and mosquito-proofing overhead drinking-water tanks).
In the urban environment, environmental modification options also include building drains and storm-drains, modifying house design (including gutters and roof drains) and adapting building regulations, and installing wastewater management facilities.
Environmental manipulation for vector control includes water management (e.g. intermittent or alternate wet and dry, irrigation, and introduction of sprinkler, drip or central pivot irrigation); maintenance of canals and other waterways to prevent seepage, and clearance of aquatic vegetation; conserving mangroves and stopping the expansion of prawn cultivation in areas where the brackish water breeding A. sundaicus occurs (Trung et al, 2004); safe practices for storing domestic water; management of solid waste in and around human settlements; and the proper maintenance of water supply and sanitation infrastructure in urban areas. The majority of resurging malaria events have been linked to the weakening of malaria control programmes, but also to increases in intrinsic malaria potential due to land-use changes (43% of events), climate and weather (25%), worsening of socioeconomic conditions (11%) and vector and drug resistance (32%) (Cohen et al, 2012). Climate change alone is estimated to increase the number of people at risk by 2030 (60 000 additional deaths as compared with a future without climate change). This is, however, likely to be outweighed by a reduction in the number of people at risk due to improved socioeconomic conditions (WHO, 2014z).
A health worker in Havana, Cuba, checks used tyres for the breeding of Aedes vectors of dengue, Chikungunya and Zika virus.
PREVENTING DISEASE THROUGH HEALTHY ENVIRONMENTS20
The potential of environmental management to reduce the malaria burden differs according to the type of environment (i.e. forest fringe/deep forests and hills, rural settings, and urban and peri-urban settings). This can be explained by local differences in the ecology and behaviour of Anopheles species (e.g. breeding sites, biting and resting behaviour). For the estimates presented here the use of insecticide-treated mosquito nets was not considered to be environmental management. See also Box 3 on integrated vector management (IVM).
It is estimated, through expert survey (see Section 2), that 42% (28–55%) of the global malaria burden could be prevented by environmental management, although the fraction amenable to environmental management varies by WHO region: 36% (25–47%) in the Eastern Mediterranean Region; 40% (34–46%) in the Western Pacific Region; 42% (28–55%) in the African Region; 42% (30–54%) in the South-East Asia Region; 50% (38–63%) in the European Region; and 64% (51–77%) in the Region of the Americas.
SELECTED INTERVENTIONS
• A meta-analysis of environmental management interventions to reduce malaria showed that environmental manipulation and modification of the human habitation reduced the risk of malaria by 88.0% (81.7–92.1%) and 79.5% (67.4–87.2%), respectively (Keiser et al, 2005). Results are consistent, although the number of rigorously conducted studies is low (Tusting et al, 2013).
ECONOMIC EVALUATIONS
• A review with a focus on Africa south of the Sahara estimated the costs per death and malaria attack averted were US$ 858 and US$ 22.20, respectively, reducing malaria-related morbidity, mortality and incidence by 70–95% within three to five years. The strategy would become more cost-effective in the longer term, as maintenance costs were much lower, with an estimated US$ 22–92 per DALY averted (Utzinger et al, 2001).
Box 3. Integrated vector management (IVM)
The transmission of vector-borne diseases can be interrupted by reducing the population density of disease-transmitting insects or by limiting their average life expectancy. The applicability of these two fundamentally different approaches depends on the local epidemiological situation – in areas with high transmission levels vector population density is no longer a determining factor. To reduce population densities environmental management and larviciding with chemical insecticides, with biopesticides (e.g. Bacillus thuringiensis) or with predators (e.g. larvivorous fish) can be applied. To shorten the lifespan of adult mosquitoes, indoor house spraying with residual insecticides is used (on condition that local vector species display indoor resting behaviour). Personal protection can be achieved sleeping under insecticide treated mosquito nets and by mosquito-proofing housing. The use of chemicals raises issues of human and animal toxicity, environmental pollution and sustainability as resistance remains a constant threat (WHO, 1995). A larval source management operational manual (WHO, 2013b) presents criteria for the selection of implementing specific measures and guidance on their economic value.
Important features of environmental management are its non-toxicity, relative ease of application, cost-effectiveness and sustainability (Ault, 1994; Bos & Mills, 1987; Utzinger et al, 2001). Unlike indoor residual spraying, environmental management measures must be tailor-made based on evidence of local vector ecology and biology. Different categories of environmental management are described in Environmental Management for Vector Control (WHO, 1980).
Environmental management is part of an IVM framework, which is a rational decision-making process for the optimal use of resources for vector control. Integrated vector management considers five key elements: (a) advocacy, social mobilization and legislation; (b) collaboration within the health sector and with other sectors; (c) integrated approaches to disease control; (d) evidence-based decision making; and (e) capacity-building (WHO, 2012f; WHO & TDR, 2009).
RESULTS: A SYSTEMATIC ANALYSIS OF FRACTIONS ATTRIBUTABLE TO THE ENVIRONMENT, BY DISEASE 21

TRACHOMA
Water, sanitation and hygiene, housingMethod: transmission pathway
100%
Trachoma is a chronic contagious eye disease caused by Chlamydia trachomatis and is the main infectious cause of global blindness. Trachoma is a significant public health problem in rural communities in many low-income countries (Hu et al, 2010). Worldwide, there are around 2.2 million people irreversibly visually impaired by trachoma (Pascolini & Mariotti, 2012); and an estimated 21 million cases of active disease. Some 232 million people worldwide live in affected areas (WHO, 2014dd).
Transmission routes are closely hygiene related (e.g. mechanical transmission by eye-seeking flies, and probably by person-to-person contact and via fomites, SELECTED INTERVENTIONS
• A randomized controlled trial in the Republic of the Gambia showed that latrine provision significantly reduced populations of the main fly vector (Musca sorbens) for trachoma transmission by 30%, and subsequently reduced trachoma prevalence by 30% as well (although the latter change was not statistically significant) (Emerson et al, 2004).
• In a community randomized trial in the United Republic of Tanzania an intensive face washing intervention reduced the odds of severe trachoma by 38% compared with control villages (West et al, 1995).
• In a randomized controlled trial in the Gambia, fly control decreased the number of flies by around 75% in intervention villages as compared with controls. After three months of fly control, there were also 75% fewer cases of trachoma in the intervention villages (Emerson et al, 1999).
particularly clothing used to wipe children’s faces) (Heymann, 2008). Risk factors for trachoma include poor access to domestic water supplies, limited access to and use of latrines/toilets, crowding and a high number of flies (Hu et al, 2010). Trachoma-transmitting flies can be controlled by removing human faeces (the medium on to which the females oviposit) from the environment. Transmission control i s also attempted through interventions to improve access to and use of sanitation, especially ending open defecation, and hygiene, especially facial cleanliness. Available evidence, although of limited quality, supports the hypothesis that several environmental control measures are effective (Emerson et al, 2000; Emerson et al, 1999; Esrey et al, 1991; Prüss & Mariotti, 2000; Stocks et al, 2014; Sutter & Ballard, 1983; West et al, 1995).
Globally, the mean fraction of the disease burden due to trachoma attributable to environmental conditions that can be managed is estimated to be 100%, based on information available on the transmission pathways.
The availability of clean water for face washing is vital in reducing trachoma (Bamako, Mali).
PREVENTING DISEASE THROUGH HEALTHY ENVIRONMENTS22
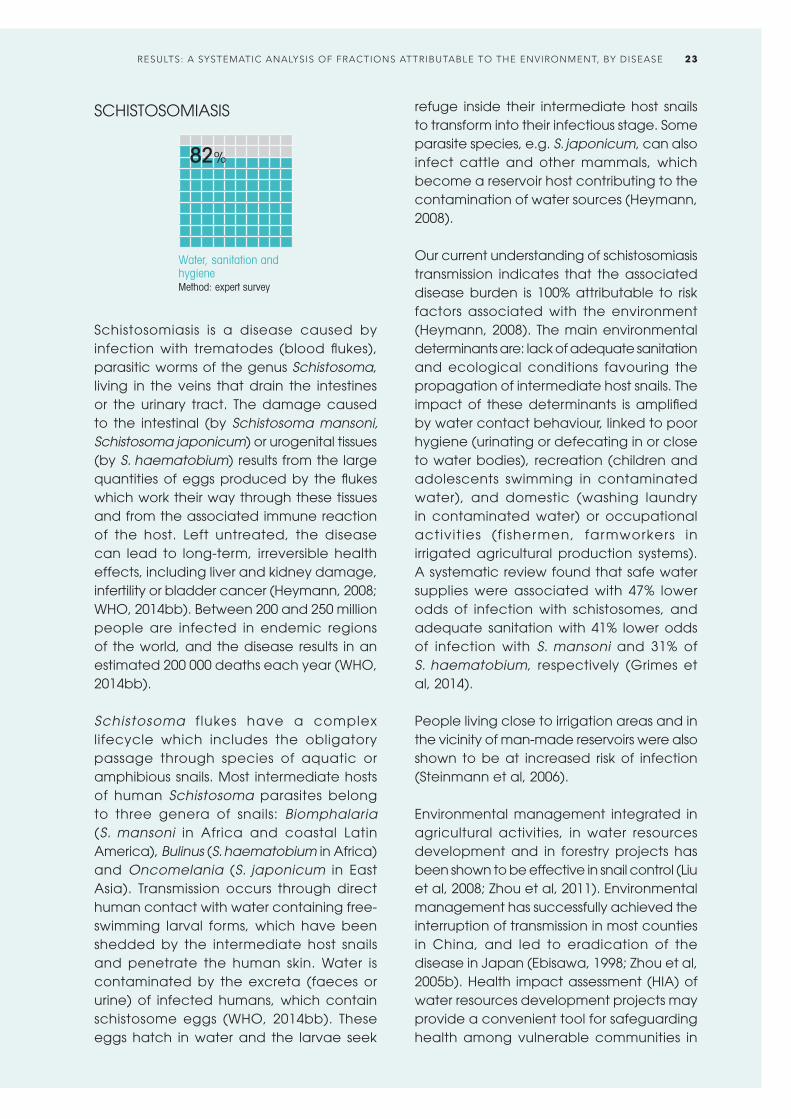
SCHISTOSOMIASIS
Water, sanitation and hygieneMethod: expert survey
82%
Schistosomiasis is a disease caused by infection with trematodes (blood flukes), parasitic worms of the genus Schistosoma, living in the veins that drain the intestines or the urinary tract. The damage caused to the intestinal (by Schistosoma mansoni, Schistosoma japonicum) or urogenital tissues (by S. haematobium) results from the large quantities of eggs produced by the flukes which work their way through these tissues and from the associated immune reaction of the host. Left untreated, the disease can lead to long-term, irreversible health effects, including liver and kidney damage, infertility or bladder cancer (Heymann, 2008; WHO, 2014bb). Between 200 and 250 million people are infected in endemic regions of the world, and the disease results in an estimated 200 000 deaths each year (WHO, 2014bb).
Schistosoma f lukes have a complex lifecycle which includes the obligatory passage through species of aquatic or amphibious snails. Most intermediate hosts of human Schistosoma parasites belong to three genera of snails: Biomphalaria (S. mansoni in Africa and coastal Latin America), Bulinus (S. haematobium in Africa) and Oncomelania (S. japonicum in East Asia). Transmission occurs through direct human contact with water containing free-swimming larval forms, which have been shedded by the intermediate host snails and penetrate the human skin. Water is contaminated by the excreta (faeces or urine) of infected humans, which contain schistosome eggs (WHO, 2014bb). These eggs hatch in water and the larvae seek
refuge inside their intermediate host snails to transform into their infectious stage. Some parasite species, e.g. S. japonicum, can also infect cattle and other mammals, which become a reservoir host contributing to the contamination of water sources (Heymann, 2008).
Our current understanding of schistosomiasis transmission indicates that the associated disease burden is 100% attributable to risk factors associated with the environment (Heymann, 2008). The main environmental determinants are: lack of adequate sanitation and ecological conditions favouring the propagation of intermediate host snails. The impact of these determinants is amplified by water contact behaviour, linked to poor hygiene (urinating or defecating in or close to water bodies), recreation (children and adolescents swimming in contaminated water), and domestic (washing laundry in contaminated water) or occupational activit ies (f ishermen, farmworkers in irrigated agricultural production systems). A systematic review found that safe water supplies were associated with 47% lower odds of infection with schistosomes, and adequate sanitation with 41% lower odds of infection with S. mansoni and 31% of S. haematobium, respectively (Grimes et al, 2014).
People living close to irrigation areas and in the vicinity of man-made reservoirs were also shown to be at increased risk of infection (Steinmann et al, 2006).
Environmental management integrated in agricultural activities, in water resources development and in forestry projects has been shown to be effective in snail control (Liu et al, 2008; Zhou et al, 2011). Environmental management has successfully achieved the interruption of transmission in most counties in China, and led to eradication of the disease in Japan (Ebisawa, 1998; Zhou et al, 2005b). Health impact assessment (HIA) of water resources development projects may provide a convenient tool for safeguarding health among vulnerable communities in
RESULTS: A SYSTEMATIC ANALYSIS OF FRACTIONS ATTRIBUTABLE TO THE ENVIRONMENT, BY DISEASE 23

schistosomiasis endemic areas (Bos et al, 2003; Konradsen et al, 2008). Global climate change might alter the distribution and transmission of schistosomiasis (Yang et al, 2010).
SELECTED INTERVENTIONS
• In China, a comprehensive S. japonicum control programme combined environmental modification for the management of water resources, health education to reduce human contact with infected water and installation of water supply and sanitation facilities, alongside chemotherapy. In eight villages prevalence decreased over three years from 9% to 3%, infections in livestock were completely eliminated and the area infested with infected snails was reduced by over 90% (Hong et al, 2011).
• Another comprehensive schistosomiasis control programme in Chinese villages – removing cattle from snail-infested grasslands, providing farmers with mechanized equipment, providing domestic water supply and sanitation facilities and health education – reduced Schistosoma infection rates in humans from 11.3% and 4.0% to 0.7% and 0.9% in village 1 and 2, respectively. Additionally, the percentage of sites with infected snails dropped from 2.2% and 0.3% to 0.1% and 0% respectively. The rate of infection in mice after exposure to lake water decreased from 79% to no infection.
• The rehabilitation of the Mushandike irrigation scheme in Zimbabwe in the 1980s included a comprehensive environmental management component aimed at interrupting schistosomiasis transmission. Hydraulics Research, Wallingford, UK and the Blair Research Laboratory in Harare, Zimbabwe collaborated in the design of a number of measures, including self-draining hydraulic structures and carefully sloped irrigation and drainage canals to prevent snail infestation, the elimination of high-risk infrastructure such as duckbill weirs, the improved management of night storage ponds and the deployment of latrines in a grid pattern in the fields to avoid contamination of water bodies. An evaluation of the schistosomiasis situation 10 years after the scheme became operational showed consistently low prevalence rates, while control schemes without the environmental measures maintained consistently higher rates (Chimbari, 2012).
The global mean fraction of the disease burden due to schistosomiasis attributable to environmental conditions that can be managed is estimated to be 82% (71–92%) (estimate based on expert survey 2015, see Section 2).
Children are particularly vulnerable to schistosomiasis in endemic regions where lack of sanitation, poor hygiene practice and recreational water use prevail (Niger).
PREVENTING DISEASE THROUGH HEALTHY ENVIRONMENTS24

ECONOMIC EVALUATIONS
• While the price of the most effective drug, Praziquantl, has come down considerably since its introduction 30 years ago (to US$ 0.08/600 mg tablet or US$ 0.20–0.30 per average cure), successful administration of the drug will lead to a dilemma between two economically poor options: to continue mass drug administration for communities where prevalence has become very low, or to deploy a labour-intensive case detection and treatment scheme. At this point, environmental management will effectively reduce or eliminate receptivity to the infection, ensure sustainable results for the investments made in the drugs programme and guarantee an important level of resilience as conditions change (e.g. climate change, breakdown of services) (WHO, 1986).
• In the Chinese setting, a comprehensive, intersectoral control programme (removing cattle from snail-
infested grasslands, providing farm machinery, improving water supply and sanitation and intensive health education) was shown to be more cost-beneficial than a health sector-confined programme based on diagnosis and treatment of humans and cattle, health education and focal mollusciciding (Lin et al, 2009; Yu et al, 2013).
• An evaluation of the integrated Chinese national schistosomiasis control programme over eight years, emphasizing amongst other interventions environmental management for snail control and health education, concluded that US$ 6.20 were gained for every US$ 1 spent ( Zhou et al, 2005a).
• In the Dez irrigation scheme in Kuzestan, Islamic Republic of Iran, environmental modification to eliminate snail habitats was initiated in the 1960s and went in parallel with a reduction in urinary schistosomiasis prevalence from 3% at its peak to 0% in 1973. Annual investments in environmental engineering works ranged from US$ 150 to US$ 670/hectare; agricultural benefits ranged from US$ 900 to US$ 1250/hectare (crop-dependent) and annual savings from the elimination of chemical mollusciciding amounted to over US$ 2000/hectare – altogether resulting in a benefit/cost ratio of over 7:1. A modelling exercise demonstrated the resilience of these environmental modifications in comparison with traditional recurrent interventions (drug administration and mollusciciding). Interruption of traditional services saw a return to peak-prevalence in two years, while in areas with environmental modifications it would take 22 years to complete regression to peak prevalence. This was corroborated when services broke down during the Iran-Iraq War in the 1980s (Jobin, 1986; Oomen et al, 1994).
CHAGAS DISEASE
Environmental vector management, occupational risks, deforestationMethod: expert survey
56%
Between 7 and 8 mill ion people are estimated to be infected with Trypanosoma cruzi, the protozoan parasite which causes Chagas disease. Around 30–40% of people with chronic Chagas infections develop chronic, potential ly l i fe-threatening alterations of the heart, the nervous system
or the gastrointestinal system (WHO, 2014g). The parasite is transmitted by various species of Mexican and Central and South American triatomine bugs (Moncayo & Silveira, 2009), which have a range of resting and breeding places in and around houses.
Three main species illustrate the ecological diversity which is l inked to different environmental management approaches.
Triatoma infestans is distributed throughout the Southern Cone countries of South America: the Plurinational State of Bolivia, Argentina, Uruguay, Paraguay, Chile, Brazil and Peru. In all these countries T. infestans is almost an exclusively domestic species, except in the Plurinational State of Bolivia where sylvatic forms have been recorded. T. infestans lives in cracks, eaves and other
RESULTS: A SYSTEMATIC ANALYSIS OF FRACTIONS ATTRIBUTABLE TO THE ENVIRONMENT, BY DISEASE 25

spaces in poorly constructed housing, and housing improvements provide the basis for sustainable transmission interruption (Schofield , 1994).
Rhodnius prolixus is the second most important triatomine vector species, with a distribution primarily in the palm tree habitats in northern South America. In Central America the exclusively (originally invasive) domestic populations have been eliminated (Hashimoto & Schofield, 2012). Palm leaf- or thatch-roofed housing provides the main domestic habitat. Replacement with corrugated iron roofing is an important vector control intervention.
Triatoma dimidiata has a distribution ranging from northern South America to southern Mexico. Its main habitat is in the peri-domestic environment (firewood piles, chicken dens and goat corrals), and environmental management should focus on this habitat (Bos, 1988; Zeledon et al, 2008).
There is a growing concern that Chagas disease may become a public health issue in non-endemic countries as a result of intensified global human mobility and migration, if parasite carriers from endemic
countries come into touch with local potential vectors – for example Triatoma rubrofasciata in South-East Asia. In 2015, there is no evidence yet of a measurable Chagas disease burden in non-endemic countries. Studies of the ecology and biology of local potential vector species are an important measure of preparedness for such public health eventualities (WHO, 2011e).
No vaccine to protect against T. cruzi exists. Drugs exist to treat Chagas disease effectively at the earliest onset and acute phase. For lack of distinct clinical symptoms, this phase often passes unnoticed. Successful treatment in the chronic phase remains extremely limited.
Environmental management strategies to reduce or eliminate vector populations or human-vector contact include housing improvements to prevent vector infestation, such as plastered walls, cement floors and corrugated-iron roofs, and peri-domestic environmental management including improved management of animals (poultry, goats and other sources of blood meals), removing organic debris and wood piles (Abad-Franch et al, 2005; Bos, 1988; Coutinho et al, 2014; Rojas-De-Arias, 2001; Rozendaal,
One of the three main Chagas vectors – Rhodnius prolixus.
PREVENTING DISEASE THROUGH HEALTHY ENVIRONMENTS26

SELECTED INTERVENTIONS
• In Guatemala, wall plastering and improved household hygiene effectively reduced the Chagas vector population densities (Monroy et al, 2009).
• In Costa Rica, housing interventions showed long-term effectiveness in Chagas vector control (Zeledon & Rojas, 2006; Zeledon et al, 2008).
1997; WHO, 2014g). Chagas transmission has also been associated with extensive deforestation and the displacement of wild animals which are the normal source of blood for the triatomines (Coura & Junqueira, 2012), and as an occupational hazard of work in plant extraction (Coura, 2013). Information on IVM is provided in Box 3 (malaria).
The global mean fraction of the Chagas disease burden attributable to environmental conditions that can be managed is estimated to be 56% (28–80%) (estimate based on expert survey 2005, see Section 2).
LYMPHATIC FILARIASIS
Water, sanitation and hygieneMethod: expert survey
67%
Lymphatic filariasis is caused by infection with one of three species of parasitic roundworms of the family Filarioidea: Wuchereria bancrofti (responsible for 90% of the cases), Brugia malayi (responsible for most of the remainder of the cases) and B. timori (with a distribution limited to the Lesser Sunda Islands of Indonesia and Timor
Leste). Over 120 million people are currently infected with lymphatic filariasis, mainly in South-East Asia and Africa, but also in other tropical areas (WHO, 2014t). The adult worms lodge in lymphatic vessels where they cause damage and disrupt the immune system, later in life leading to lymphedema, abnormal swelling of extremities or, in men, of the scrotum. The infection can be at the root of severe disability in later life.
Adult worms shed large quantities of microfilariae into their human host’s blood, which are then picked up by mosquitoes. Transmission occurs by the bite of mosquitoes harbouring the worms’ larvae. Favourable conditions for transmission depend on the ecological requirements of the different mosquito vector species involved (Rozendaal, 1997). These also determine suitable approaches of environmental management for transmission interruption. A number of general habitat types can be distinguished.
In urban settings of South and South-East Asia and in the Americas, the predominant parasitic worm (Wuchereria bancrofti) is transmitted by Culex quinquefasciatus which breeds in organically polluted water (open sewage drains and wastewater treatment ponds) (Erlanger et al, 2005; Gazzinelli et al, 2012; Meyrowitsch et al, 1998; Prichard et al, 2012).
In Africa, both Culex quinquefasciatus and Anopheles gambiae are key vectors in coastal areas, whereas inland A. gambiae complex and A. funestus are the main vectors. As a result, lymphatic filariasis is associated with organically polluted water in coastal cities, coastal freshwater collections and inland irrigation schemes (Appawu et al, 2001; Erlanger et al, 2005).
In parts of the WHO Western Pacific Region, bancroftian filariasis is transmitted by Aedes species, including A. polynesiensis which breeds in crab holes and other containers, both natural and artificial, that hold water temporarily.
RESULTS: A SYSTEMATIC ANALYSIS OF FRACTIONS ATTRIBUTABLE TO THE ENVIRONMENT, BY DISEASE 27
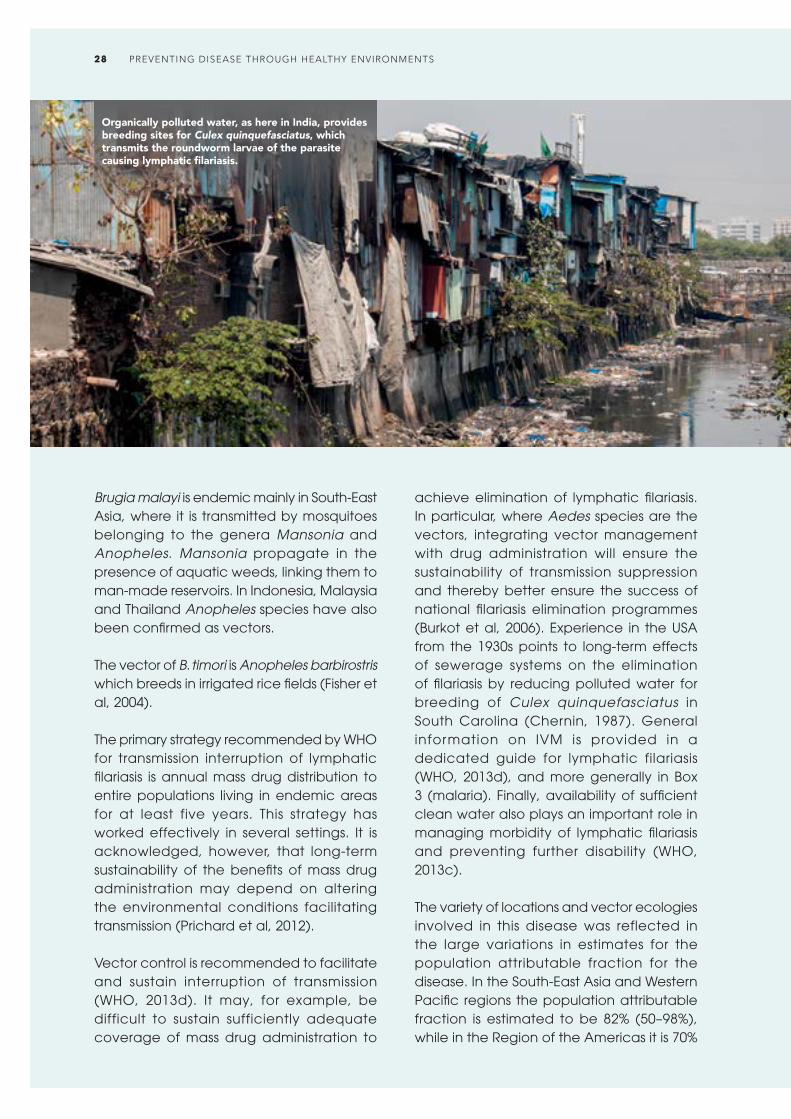
Brugia malayi is endemic mainly in South-East Asia, where it is transmitted by mosquitoes belonging to the genera Mansonia and Anopheles. Mansonia propagate in the presence of aquatic weeds, linking them to man-made reservoirs. In Indonesia, Malaysia and Thailand Anopheles species have also been confirmed as vectors.
The vector of B. timori is Anopheles barbirostris which breeds in irrigated rice fields (Fisher et al, 2004).
The primary strategy recommended by WHO for transmission interruption of lymphatic filariasis is annual mass drug distribution to entire populations living in endemic areas for at least five years. This strategy has worked effectively in several settings. It is acknowledged, however, that long-term sustainability of the benefits of mass drug administration may depend on altering the environmental conditions facilitating transmission (Prichard et al, 2012).
Vector control is recommended to facilitate and sustain interruption of transmission (WHO, 2013d). It may, for example, be difficult to sustain sufficiently adequate coverage of mass drug administration to
achieve elimination of lymphatic filariasis. In particular, where Aedes species are the vectors, integrating vector management with drug administration will ensure the sustainability of transmission suppression and thereby better ensure the success of national filariasis elimination programmes (Burkot et al, 2006). Experience in the USA from the 1930s points to long-term effects of sewerage systems on the elimination of filariasis by reducing polluted water for breeding of Culex quinquefasciatus in South Carolina (Chernin, 1987). General information on IVM is provided in a dedicated guide for lymphatic filariasis (WHO, 2013d), and more generally in Box 3 (malaria). Finally, availability of sufficient clean water also plays an important role in managing morbidity of lymphatic filariasis and preventing further disability (WHO, 2013c).
The variety of locations and vector ecologies involved in this disease was reflected in the large variations in estimates for the population attributable fraction for the disease. In the South-East Asia and Western Pacific regions the population attributable fraction is estimated to be 82% (50–98%), while in the Region of the Americas it is 70%
Organically polluted water, as here in India, provides breeding sites for Culex quinquefasciatus, which transmits the roundworm larvae of the parasite causing lymphatic filariasis.
PREVENTING DISEASE THROUGH HEALTHY ENVIRONMENTS28

SELECTED INTERVENTIONS
• In Zanzibar, United Republic of Tanzania, and in Tirukoilur, Tamil Nadu, India, interventions using drug treatment alone and those combined with applying floating layers of polystyrene beads on water containers show that the combined intervention markedly prevented resurgence of filarial infection (Curtis et al, 2002; Sunish et al, 2007).
(60–80%), derived mainly from considering urban environmental management. In the African Region, the population attributable fraction is estimated at 40% (20–68%). Globally, the mean fraction of the disease burden due to lymphatic filariasis attributable to environmental conditions that can be managed is estimated to be 67% (39–89%) (estimate based on expert survey 2005, see Section 2).
ONCHOCERCIASIS
Water resource projects, deforestationMethod: expert survey
10%
Onchocerciasis is a disease caused by the parasitic filarial worm Onchocerca volvulus. It is the second most important cause of blindness due to infection, after trachoma. More than 99% of people infected live in 31 West and Central African countries; some foci of the disease also exist in Latin America and the Republic of Yemen. Its distribution is closely linked to the distribution of its vectors – blackflies of the genus Similium. Repeated exposure to infective bites in endemic areas lead to high parasite loads, and symptoms including severe itching, disfiguring skin conditions and visual impairment, which
may lead to permanent blindness (WHO, 2014v).
Simuliid blackflies breed in fast-flowing rivers and streams – in these highly oxygenated waters the larvae are attached to rocks (Rozendaal, 1997). The adult flies take blood meals from animals and humans. High densities of blackflies make fertile river valleys practically uninhabitable due to biting nuisance. The WHO/World Bank/UNDP Onchocerciasis Control Programme successfully eliminated the disease from a number of West African countries (1974–2002) through the systematic aerial application of insecticides in rivers upstream from breeding places, followed by ivermectin mass administration. To date, the Republic of Colombia and Ecuador have eliminated the disease in 2013 and 2014, respectively (WHO, 2013h, 2014j), and a few countries in Africa (Burundi, Malawi and Niger) are very close to the elimination phase of the disease (WHO, 2014a).
In the present analysis, the focus is only on those breeding places that can be eliminated through environmental management. In river systems influenced by water resource projects, particularly dams, proper planning can help reduce vector breeding by:• Building dams with a double-spillway
design;• “Drowning” breeding places in the
reservoir area; and• Changing the hydrology downstream of
the dam (Jobin, 1986).
Natural waters have limited opportunities for environmental management and were not considered. Insecticide spraying of streams and rivers was not considered to be an environmental health action. The option of constructing small barrages upstream of breeding places to eliminate favourable ecological conditions has been considered, but for economic reasons never been put into practice. Evidence suggests that disease transmission can be increased by forest degradation related to human activity,
RESULTS: A SYSTEMATIC ANALYSIS OF FRACTIONS ATTRIBUTABLE TO THE ENVIRONMENT, BY DISEASE 29
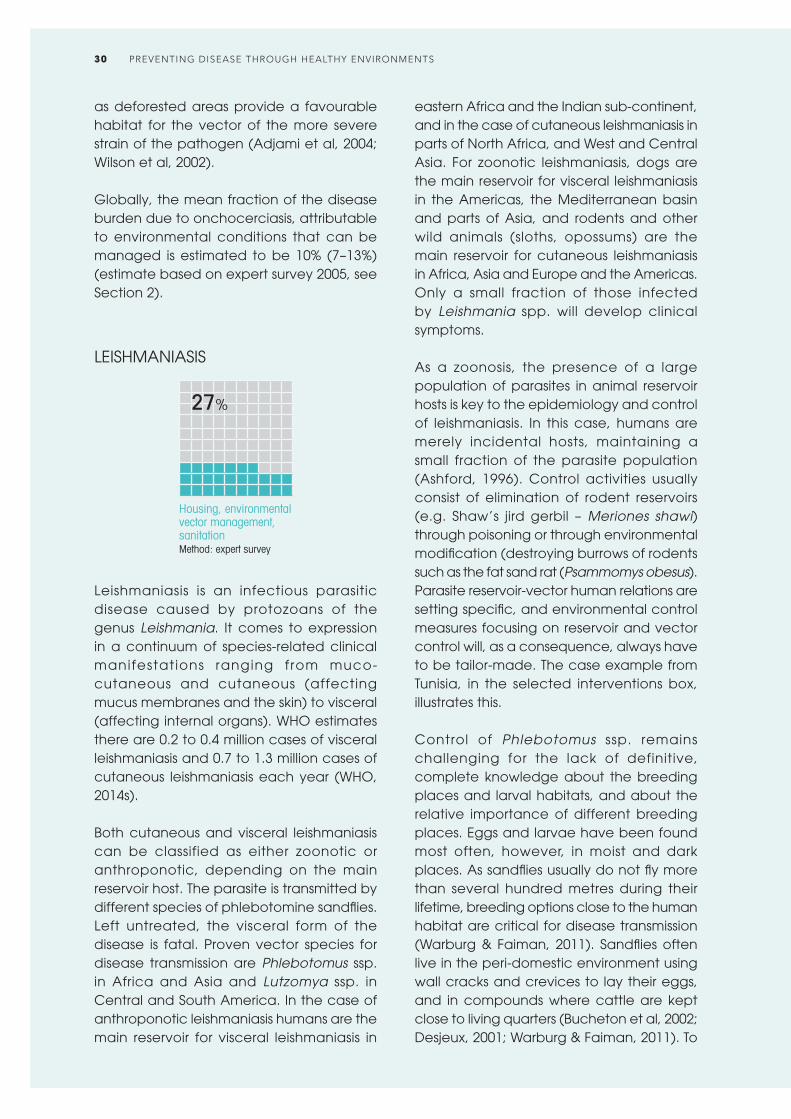
as deforested areas provide a favourable habitat for the vector of the more severe strain of the pathogen (Adjami et al, 2004; Wilson et al, 2002).
Globally, the mean fraction of the disease burden due to onchocerciasis, attributable to environmental conditions that can be managed is estimated to be 10% (7–13%) (estimate based on expert survey 2005, see Section 2).
LEISHMANIASIS
Housing, environmental vector management, sanitationMethod: expert survey
27%
Leishmaniasis is an infectious parasitic disease caused by protozoans of the genus Leishmania. It comes to expression in a continuum of species-related clinical manifestations ranging from muco-cutaneous and cutaneous (affecting mucus membranes and the skin) to visceral (affecting internal organs). WHO estimates there are 0.2 to 0.4 million cases of visceral leishmaniasis and 0.7 to 1.3 million cases of cutaneous leishmaniasis each year (WHO, 2014s).
Both cutaneous and visceral leishmaniasis can be classified as either zoonotic or anthroponotic, depending on the main reservoir host. The parasite is transmitted by different species of phlebotomine sandflies. Left untreated, the visceral form of the disease is fatal. Proven vector species for disease transmission are Phlebotomus ssp. in Africa and Asia and Lutzomya ssp. in Central and South America. In the case of anthroponotic leishmaniasis humans are the main reservoir for visceral leishmaniasis in
eastern Africa and the Indian sub-continent, and in the case of cutaneous leishmaniasis in parts of North Africa, and West and Central Asia. For zoonotic leishmaniasis, dogs are the main reservoir for visceral leishmaniasis in the Americas, the Mediterranean basin and parts of Asia, and rodents and other wild animals (sloths, opossums) are the main reservoir for cutaneous leishmaniasis in Africa, Asia and Europe and the Americas. Only a small fraction of those infected by Leishmania spp. will develop clinical symptoms.
As a zoonosis, the presence of a large population of parasites in animal reservoir hosts is key to the epidemiology and control of leishmaniasis. In this case, humans are merely incidental hosts, maintaining a small fraction of the parasite population (Ashford, 1996). Control activities usually consist of elimination of rodent reservoirs (e.g. Shaw’s jird gerbil – Meriones shawi) through poisoning or through environmental modification (destroying burrows of rodents such as the fat sand rat (Psammomys obesus). Parasite reservoir-vector human relations are setting specific, and environmental control measures focusing on reservoir and vector control will, as a consequence, always have to be tailor-made. The case example from Tunisia, in the selected interventions box, illustrates this.
Control of Phlebotomus ssp. remains challenging for the lack of definitive, complete knowledge about the breeding places and larval habitats, and about the relative importance of different breeding places. Eggs and larvae have been found most often, however, in moist and dark places. As sandflies usually do not fly more than several hundred metres during their lifetime, breeding options close to the human habitat are critical for disease transmission (Warburg & Faiman, 2011). Sandflies often live in the peri-domestic environment using wall cracks and crevices to lay their eggs, and in compounds where cattle are kept close to living quarters (Bucheton et al, 2002; Desjeux, 2001; Warburg & Faiman, 2011). To
PREVENTING DISEASE THROUGH HEALTHY ENVIRONMENTS30

House improvement has proved effective in eliminating the breeding of phlebotomine sandflies and in reducing the transmission potential for leishmaniasis.
a large extent, leishmaniasis can therefore be prevented by housing improvements, eliminating soil and wall cracks, and removing organic material in the peri-domestic environment (Joshi et al, 2009). In brief, vector control has to rely on sustained environmental sanitation efforts. Information on IVM is provided in Box 3 (malaria).
Blood meal analyses have shown sandflies to be opportunistic, taking blood meals from a range of vertebrates; domestic animals kept close to or in the house will contribute to maintaining a higher population density of vectors, for example in Tunisia (Jaouadi et al, 2013). Moving domestic animals away from human habitation may, in the short term, lead to increased biting of humans, but may, in the longer term, result in transmission reduction. This may be especially important for Africa and Asia where, in the main, the vector is thought to breed close to houses. Migrant agricultural labourers without proper housing are particularly at risk and should rely on personal protection measures, such as sleeping under mosquito nets (Argaw et al, 2013). In Central and South America, Lutzomya ssp. are traditionally found most
frequently in natural environments (e.g. forests), but due to deforestation, migration and urbanization, leishmaniasis vectors have spread to other environments (e.g. cities) and transmission to humans also occurs increasingly in and around houses (Campbell-Lendrum et al, 2001; Desjeux, 2001; Yadon et al, 2003). Leishmaniasis is climate-sensitive and climate change and land degradation can have strong effects on vectors and reservoir hosts (WHO, 2014s). In Africa and Asia, where the peri-domestic environment and reservoir habitats play a major role in disease transmission, the disease fraction attributable to the environment is estimated to be 27% (11–40%). The fraction attributable to the environment in Central and South America, where the vector is more prevalent in natural environments, is estimated to be 12% (1–30%).
Globally, the mean fraction of the leishmaniasis burden attr ibutable to environmental conditions that can be managed is estimated to be 27% (9–40%) (estimate based on expert survey 2005, see Section 2).
RESULTS: A SYSTEMATIC ANALYSIS OF FRACTIONS ATTRIBUTABLE TO THE ENVIRONMENT, BY DISEASE 31

SELECTED INTERVENTIONS
• Leishmaniasis Reservoir Control in Tunisia: In 1982, the stable transmission focus of cutaneous leishmaniasis in the Gafsa/El Guettar oases of Tunisia extended to a new focus in the Sidi Saad area following the construction of a dam. Distribution of the main reservoir host, the fat sand rat, is directly linked to the abundance of vegetation on which it specifically feeds: plants of the family of Chenopodiaceae, occurring in saline environments. A control strategy based on eliminating the rodents’ food plants and destroying its habitat by deep ploughing and the planting of trees proved successful. But the feasibility of this type of intervention depends on the density of the human population – in scarcely populated areas this preventive approach is not cost-effective when calculated on the basis of cost per case prevented. Monitoring flood regimes in river basins provides a predictive tool for outbreaks caused by explosive vegetation growth and its impact on the reservoir population (Fichet-Calvet et al, 2000).
Dengue fever is the most rapidly spreading mosquito-borne viral disease in the world. There is considerable underreporting and misclassification in the surveillance of dengue cases. One recent estimate indicates 390 million dengue infections per year (95% CI: 284–528 million), of which 96 million (95% CI: 67–136 million) with clinical manifestations (Bhatt et al, 2013). Another prevalence study estimates that 3 900 million people, in 128 countries, are at risk of infection with dengue viruses (Brady et al, 2012). Member States in three WHO regions reported nearly 2.4 million
DENGUE
Water and waste managementMethod: expert survey
95%
cases in 2010 (WHO, 2015b). The initiative to record all dengue cases partly explains the sharp increase in the number of cases reported in recent years. Other features of the disease include its epidemiological patterns, including hyper-endemicity of multiple dengue virus serotypes in many countries and the alarming impact on the global and national economies.
The dengue virus, a flavivirus, is related to West Nile, Japanese encephalitis and yellow fever viruses. Infected persons develop flu-like symptoms, especially painful joints; severe dengue has potentially deadly complications, particularly in children.
Rapid urbanization, unreliable drinking-water supply services, increased population mobility and global trade are important determinants of the resurgence of the disease (WHO, 2012e). There is no specific treatment for dengue fever. Developing a vaccine has been challenging, but there has been significant progress recently. Three tetravalent live-attenuated vaccines are in phase 2 and phase 3 clinical trials, and three other vaccine candidates are at earlier stages of clinical development.
Strategies to prevent dengue fever therefore focus on bringing down population densities of mosquito vectors (Aedes aegypti and Aedes albopictus) through source reduction and/or minimizing human/vector contact. The latter is a challenge as these mosquitoes are daytime biters, limiting the practical use of mosquito nets to babies and small toddlers. The vector breeds in clean, man-made and sometimes natural (axils of bromeliad plants, their natural habitat) water collections close to human dwellings. Various types of man-made dengue breeding places can be distinguished:• Drinking-water containers, particularly
in areas where rainwater collection is common. These can be anything from small barrels to the large (200-litre) traditional water jars found in South-East Asia;
PREVENTING DISEASE THROUGH HEALTHY ENVIRONMENTS32

• Other water containers in and around the house (ant traps, flower vases, potted plant trays, air-conditioning trays); flower vases at cemeteries have also been shown to be productive breeding places;
• Standing water in urban infrastructure (roof gutters, manholes and wells); and
• Solid waste (car tyres and fast food containers are notorious, but basically any waste that can serve as a container for rainwater collection).
It has been shown that the extension of piped drinking-water to rural communities without due attention to the reliability of services has been conducive to the spread of dengue transmission from urban to rural zones. Unreliable piped water services lead households to increase water storage in containers for longer periods of time (Kumar et al, 2001). Global trade and mobility have contributed to the spread of dengue, in particular the trade in used car tyres with Aedes larvae in water collections they may contain (WHO, 2015b). Climate and other environmental factors are crucial determinants of the distribution of the vector species and of dengue fever prevalence (Raheel et al, 2011). Global climate change may have a significant impact on this geographical distribution through changes in temperature, rainfall and humidity (Barclay, 2008; WHO, 2015b).
A range of environmental management measures, delivered as part of an IVM approach (see Box 3 – malaria) have been shown to be cost-effective in specific settings (WHO & TDR, 2009). The provision of reliable piped water supplies eliminates the need for household water storage. Mosquito-proofing of water containers, through netting or by design, can be effective but requires ongoing advocacy. Viable biological control methods include the use of larvivorous species (fish or tiny crustaceans known as copepods) in drinking-water containers for example (Kay et al, 2002). Their effectiveness and sustainability depends largely on community engagement and social acceptability. Solid
waste management and well-enforced urban building design regulations can also play a significant role in source reduction.
The global mean fraction of the disease burden due to dengue fever attributable to environmental conditions that can be managed is estimated to be 95% (89–100%) (estimate based on expert survey 2005, see Section 2).
SELECTED INTERVENTIONS
• Integrated vector management was shown to be the most effective dengue vector control measure and showed in meta-analysis a mean reduction of 83% of infested houses, of 88% reduction of infested water containers and of 67% reduction of infested containers per 100 houses inspected (Erlanger et al, 2008).
ECONOMIC EVALUATIONS
• Integrated vector management in Santiago de Cuba was more efficient and effective than routine (mainly chemical) dengue vector control. The average cost-effectiveness ratio was US$ 831 per focus for IVM and US$ 2466 for routine vector control (Baly et al, 2009).
Household water storage requires safeguards such as covers or protective netting to prevent the breeding of mosquito vectors (Salto, Uruguay).
RESULTS: A SYSTEMATIC ANALYSIS OF FRACTIONS ATTRIBUTABLE TO THE ENVIRONMENT, BY DISEASE 33

JAPANESE ENCEPHALITIS
Agricultural practices, personal protectionMethod: expert survey
95%
Japanese encephalitis (JE) virus, a flavivirus related to West Nile virus and Saint Louis encephalitis virus, is the leading cause of viral encephalitis in South, South-East and East Asia. The annual incidence of clinical disease varies both across and within countries, ranging from <10 to >100 per 100 000 population. A recent literature review estimates nearly 68 000 clinical cases of JE globally each year, with up to 20 400 deaths due to JE (Campbell et al, 2011). JE primarily affects children. Most adults in endemic countries have natural immunity after childhood infection, but individuals of any age may be affected.
Although symptomatic JE is rare, the case-fatality rate among those with encephalitis can be as high as 30% (WHO, 2014r). Of those who survive, 30–50% suffer important long-term neurological sequelae (conditions resulting from having had the disease). There is considerable misdiagnosis and under reporting, and the number of real cases is assumed to be significantly higher. The annual number of cases fluctuates importantly, with peak outbreaks occurring every 2 to 15 years. In 2011, reporting from 19 out of 24 endemic countries added up to 10 426 cases, 95% of which were reported from India and China (mainly Yunnan Province) (Tarantola et al, 2014).
The JE virus has well-defined links to specific ecologies, mainly irrigated rice production systems. The natural hosts of the virus are ardeid birds (herons and egrets living in an aquatic environment). Pigs are the main amplifying host. The mosquito vectors of the JE virus (Culex tritaenorhynchus, C. vishnui and the suspected vector C. gelidus) breed by preference in irrigated rice fields and in natural wetland areas; these Culex species are zoophilic (i.e. they prefer taking their
Recently flooded rice fields may lead to sudden high densities of the Japanese encephalitis vector Culex tritaeniorrhynchus, resulting in a spill over of the virus from the pig amplifying hosts to humans (Dali, China).
PREVENTING DISEASE THROUGH HEALTHY ENVIRONMENTS34
blood meals from animals rather than humans). In special conditions, however, mosquito populations may build up so rapidly that the virus transmission spills over into the human community. Such situations include the flooding of large areas of rice fields at the time of transplantation of the rice plants, or when there is a heavy on-set of the rainy season.
By and large, the distribution of JE is limited mainly to rural or peri-urban areas and has been associated with climate, agricultural development and rice cultivation (WHO, 2014r). As the demand for rice and pork is likely to grow substantially in the future, there is concern that the frequency and intensity of JE outbreaks will increase. Furthermore, climate change might impact on the geographical distribution of the disease, directly by changing patterns in precipitation (Gould et al, 2006) or because it may affect the migration routes and patterns of ardeid birds.
JE is a vaccine-preventable disease. The effectiveness of vaccines has greatly improved since the 1990s. The drawback of earlier vaccines, which required two boosts, six and twelve weeks after the initial vaccination to offer full protection for three years, has been eliminated with the arrival of new vaccines. Recently, the live attenuated SA14-14-2 vaccine, manufactured in China, has become the most widely used vaccine in endemic countries, and it was prequalified by WHO in October 2013. In many countries, the capacity to deliver costly vaccination programmes in rural areas remains limited. From the perspective of each individual at risk, vaccination is the only intervention ensuring 100% protection. Yet, from the public health perspective there are situations and conditions where environmental health interventions can make significant contributions to a reduction in JE transmission (Erlanger et al, 2009; Keiser et al, 2005; Rozendaal, 1997). These include:• Improved pig husbandry, providing pigs
with mosquito-proof pigsties where they can be housed during peak mosquito
biting times. Vaccinating pigs against the virus has been a successful approach in Japan, but in most countries implementing such vaccination campaigns would run into the same logistical challenges as human vaccination campaigns, and moreover, pig populations have a high turnover. Physically separating pig rearing and rice production may be a feasible option in some countries. Rural development programmes should never promote pig rearing as a secondary source of income for farmers in rice-growing areas in Asia.
• Managing irrigated rice production systems to reduce JE vector populations is a tall order in most places in Asia, but in areas where water scarcity is increasing, farmers may be forced to engage in a regime of intermittent irrigation (alternate wetting and drying of rice fields). Where this is the case, such a regime may be designed to take the larval part of the mosquito life cycle into account, ensuring larvae are stranded and killed before they reach adulthood. There are also options to coordinate integrated pest management (IPM) efforts in rice production systems with IVM methods (see Box 3 – malaria).
• Personal protection methods, particularly for the most vulnerable groups (children under 15), include the proper use of mosquito nets, impregnated or not, the use of repellents and the mosquito-proofing of houses (window screens, netting around the eaves).
The mean fraction of the disease burden due to Japanese encephalitis attributable to environmental conditions that can be managed is estimated to be 95% (90–99%) (estimate based on expert survey 2005, see Section 2).
There is a dearth of evidence on the economic aspects of JE control, but clearly measures based on improved pig husbandry, irrigation water management and housing improvements would alleviate the burden health sector budgets.
RESULTS: A SYSTEMATIC ANALYSIS OF FRACTIONS ATTRIBUTABLE TO THE ENVIRONMENT, BY DISEASE 35

HIV/AIDS
Occupational risksMethod: epidemiological estimates
10%
In 2013, around 35 million people were living with the human immunodeficiency virus (HIV). Large regional differences remain. Sub-Saharan Africa is the most affected region (with approximately 68% of adults infected globally) but other significant infected percentages are found in Caribbean, Eastern Europe and Asia. Sexual transmission accounts for the great majority of HIV infections but in some regions, i.e. in Eastern Europe and Central Asia, injecting drugs is the main risk factor (UNAIDS, 2013).
Certain occupational groups are at increased risk of acquiring or transmitting HIV. These include commercial sex workers, health-care workers who may be infected by needlestick injuries or other exposures, and workers who spend part of the year away from their families (referred to as workers at “intermediate risk”). Female sex workers are 13.5 times more likely to be HIV infected than the general female adult population (Baral et al, 2012; Kerrigan et al, 2013). Worldwide, a significant percentage of the female population is involved in the commercial sex industry. A global review estimated that female sex workers present 0.4–4.3% of the female population in urban areas in sub-Saharan Africa, 0.2–2.6% in Asia and 0.2–7.4% in Latin America (Vandepitte et al, 2006). The global proportion of health-care workers in the general population is estimated to be 0.6% and the overall fraction of HIV infection acquired through a needlestick injury among this occupational group is 4.4% (Prüss-Ustün et al, 2005).
Workers at intermediate risk mainly include the uniformed workforce (e.g. policemen), the military, miners, truck drivers, migrant construction workers, seafarers and fishermen. Because many in these sectors live away from their families part of the year, they are more likely to have sex with sex workers and other occasional partners, and thus be at increased risk of infecting themselves and their partners on return home (UNAIDS & WHO, 2009). It was shown that these occupational groups are generally more vulnerable to HIV infections compared with the general population (Fraser, 2008; Kissling et al, 2005). Thus many prevention interventions have been set up to target specific occupational groups (Kerrigan et al, 2013; Ojo et al, 2011) (see box on selected interventions). The intermediate risk group is around 3% of the total population, but its risk is relatively lower than that of commercial sex workers.
The fraction of HIV/AIDS attributable to occupation can be roughly estimated by comparing the adult prevalence rate in the general population with that of commercial sex workers (Prüss-Ustün et al, 2013), or workers at intermediate risk (after accounting for competing risks, such as intravenous drug use). In adults, for example, the prevalence of HIV in female sex workers was estimated to be 12–29 times higher than in the general female population, depending on the region (Baral et al, 2012). Around 15% of HIV in the general female adult population is thought to be attributable to female sex work (Prüss-Ustün et al, 2013). Information on male sex workers was too scarce to make an estimate. In 2005 it was estimated that about 0.02% of the global HIV/AIDS burden was caused by percutaneous injuries to health-care workers (Prüss-Ustün et al, 2005).
Based on an approximate estimation using available epidemiological data (see Annex 2 for details), the occupation-related population attributable fraction for HIV/AIDS in adults was estimated to be 1–5% (0–11%) in most regions. In regions such as
PREVENTING DISEASE THROUGH HEALTHY ENVIRONMENTS36

sub-Saharan Africa – which has higher rates of sex workers or very high rates of HIV in commercial sex workers as compared with the general population – the population attributable fraction was estimated to be as high as 10% (8–13%). Globally, occupational causes accounted for about 10% (8–13%) of HIV transmissions in adults, causing 140 000 deaths annually (calculations based on epidemiological data, see Annex 3.3). This estimate only covers HIV transmission to sex workers and workers at intermediate risk
(truck drivers, fishermen, the military etc.), but infected workers may in turn infect members of the general population. In certain countries, the HIV epidemic may even be largely driven by commercial sex activities or spread predominantly by truck drivers and other clients. The impact of prevention that is targeted to certain occupational groups may therefore be more far-reaching than simply improving workers’ health (the parameter used in this study to simplify quantification).
SELECTED INTERVENTIONS
• Behavioural interventions were shown to effectively reduce HIV and the incidence of other sexually transmitted diseases (STDs) (Wariki et al, 2012) and increased knowledge about HIV-transmission in sex workers and their clients (Ota et al, 2011).
• Cambodia and Thailand, countries with an early and rapid rise of the HIV epidemic, implemented highly successful prevention programmes that were associated with an increase in condom use in the commercial sex sector to around 90% (Rojanapithayakorn & Hanenberg, 1996; Ruxrungtham et al, 2004).
• Several forms of empowerment-based comprehensive HIV prevention among sex workers have proved successful, for example in Brazil, the Dominican Republic and India (Kerrigan et al, 2013).
• The Joint WHO-ILO-UNAIDS policy guidelines on improving health workers’ access to HIV and TB prevention, treatment, care and support services recommend the development or strengthening of existing infection control programmes, especially with respect to TB and HIV infection control, and collaboration with workplace health and safety programmes to ensure a safer work environment (WHO, UNAIDS & ILO, 2010).
• Effective measures to prevent infections from occupational exposure of health-care workers to blood include eliminating unnecessary injections, implementing universal precautions, eliminating needle recapping and disposing needles into a sharps container immediately after use, use of safer devices such as needles that sheath or retract after use, provision and use of personal protective equipment, and training workers in the risks and prevention of transmission (Wilburn & Eijkemans, 2004).
ECONOMIC EVALUATIONS
• The cost per HIV infection averted for community empowerment-based comprehensive HIV prevention depends on the HIV prevalence. It amounts to US$ 1 990 in the Ukraine, US$ 3 813 in Kenya, US$ 66 128 in Thailand and US$ 32 773 in Brazil (Kerrigan et al, 2013).
• The cost per client for the community-based, comprehensive HIV prevention intervention among sex workers ranges from US$ 102 to US$ 184. When removing the averted HIV-related medical costs, those costs are significantly reduced (Kerrigan et al, 2013).
RESULTS: A SYSTEMATIC ANALYSIS OF FRACTIONS ATTRIBUTABLE TO THE ENVIRONMENT, BY DISEASE 37
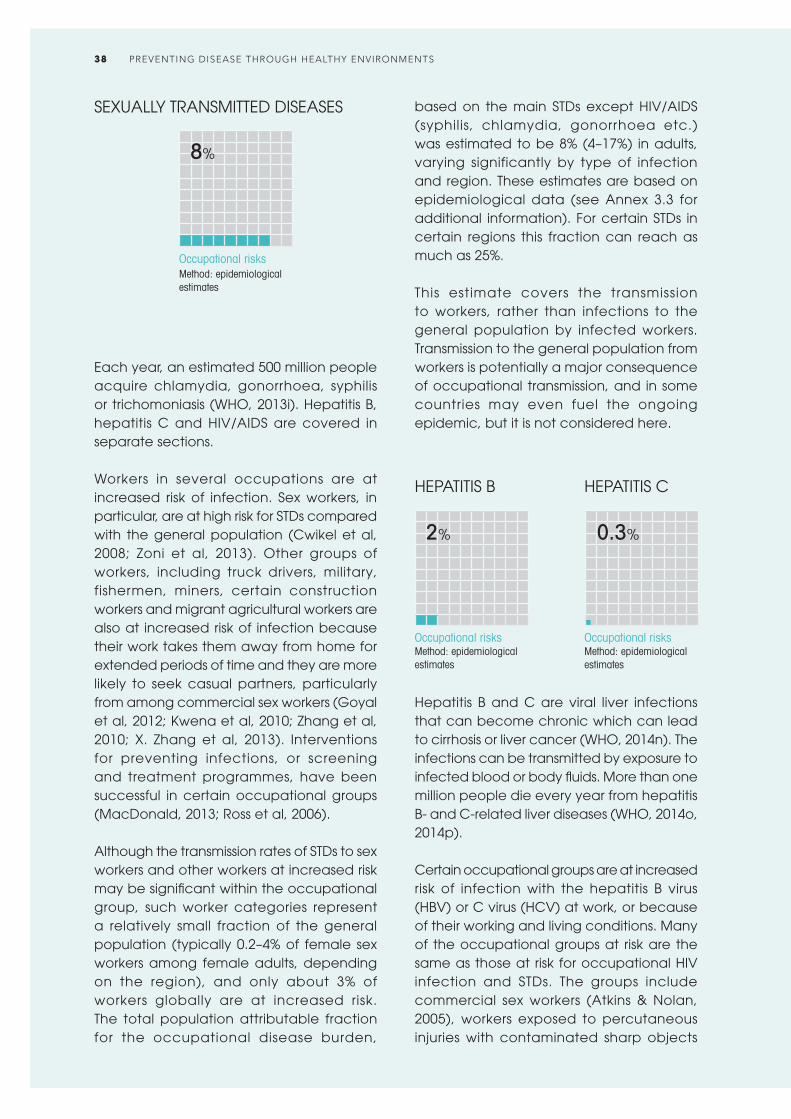
SEXUALLY TRANSMITTED DISEASES
Occupational risksMethod: epidemiological estimates
8%
Each year, an estimated 500 million people acquire chlamydia, gonorrhoea, syphilis or trichomoniasis (WHO, 2013i). Hepatitis B, hepatitis C and HIV/AIDS are covered in separate sections.
Workers in several occupations are at increased risk of infection. Sex workers, in particular, are at high risk for STDs compared with the general population (Cwikel et al, 2008; Zoni et al, 2013). Other groups of workers, including truck drivers, military, fishermen, miners, certain construction workers and migrant agricultural workers are also at increased risk of infection because their work takes them away from home for extended periods of time and they are more likely to seek casual partners, particularly from among commercial sex workers (Goyal et al, 2012; Kwena et al, 2010; Zhang et al, 2010; X. Zhang et al, 2013). Interventions for preventing infections, or screening and treatment programmes, have been successful in certain occupational groups (MacDonald, 2013; Ross et al, 2006).
Although the transmission rates of STDs to sex workers and other workers at increased risk may be significant within the occupational group, such worker categories represent a relatively small fraction of the general population (typically 0.2–4% of female sex workers among female adults, depending on the region), and only about 3% of workers globally are at increased risk. The total population attributable fraction for the occupational disease burden,
based on the main STDs except HIV/AIDS (syphilis, chlamydia, gonorrhoea etc.) was estimated to be 8% (4–17%) in adults, varying significantly by type of infection and region. These estimates are based on epidemiological data (see Annex 3.3 for additional information). For certain STDs in certain regions this fraction can reach as much as 25%.
This estimate covers the transmission to workers, rather than infections to the general population by infected workers. Transmission to the general population from workers is potentially a major consequence of occupational transmission, and in some countries may even fuel the ongoing epidemic, but it is not considered here.
HEPATITIS B
Occupational risksMethod: epidemiological estimates
2%
HEPATITIS C
Occupational risksMethod: epidemiological estimates
0.3%
Hepatitis B and C are viral liver infections that can become chronic which can lead to cirrhosis or liver cancer (WHO, 2014n). The infections can be transmitted by exposure to infected blood or body fluids. More than one million people die every year from hepatitis B- and C-related liver diseases (WHO, 2014o, 2014p).
Certain occupational groups are at increased risk of infection with the hepatitis B virus (HBV) or C virus (HCV) at work, or because of their working and living conditions. Many of the occupational groups at risk are the same as those at risk for occupational HIV infection and STDs. The groups include commercial sex workers (Atkins & Nolan, 2005), workers exposed to percutaneous injuries with contaminated sharp objects
PREVENTING DISEASE THROUGH HEALTHY ENVIRONMENTS38

(e.g. nurses, doctors, laboratory staff, waste workers) (Corrao et al, 2013; Singh, 2009; WHO, 2014n) and workers at intermediate risk (e.g. migrant workers, members of the uniformed workforce, miners, truck drivers, fishermen) who spend time away from home and are more likely to seek out the services of sex workers (Government of Kiribati & Secretariat of the Pacific Community, 2008; Manjunath et al , 2002; Pinho et al, 2011).
Although HBV is highly sexually transmissible, it is not always possible to dissociate this route of transmission from other means, for example injecting drug use, as studies of commercial sex workers have shown. Nevertheless, hepatitis B is generally more prevalent in commercial sex workers than in the general population in LMIC (Camejo et al, 2003; Forbi et al, 2008; Zhang et al, 2014). The risk of sexual transmission of HCV between monogamous partners is extremely low, but is higher among men who have sex
A vaccination team member disposes of a used syringe into a safety box.
with men, especially in case of concomitant infection (Tohme & Holmberg, 2010; WHO, 2014p).
It was estimated that the population attributable fractions for occupational HBV and HCV infections in health-care workers are 0.3% of the global hepatitis C burden, corresponding to 16 400 HCV infections per year; and 0.3% of the global hepatitis B burden, corresponding to 65 600 HBV infections per year (Prüss-Ustün et al, 2005). Based on comparisons of prevalence in commercial female sex workers, workers at intermediate risk and the general population, it was estimated that the total population attributable fraction for occupational HBV infections in adults was 2% (1–4%). These estimates are based on epidemiological data (see Annex 3.3 for additional information). In high-income countries, only infections of health-care workers from sharps injuries were considered.
RESULTS: A SYSTEMATIC ANALYSIS OF FRACTIONS ATTRIBUTABLE TO THE ENVIRONMENT, BY DISEASE 39
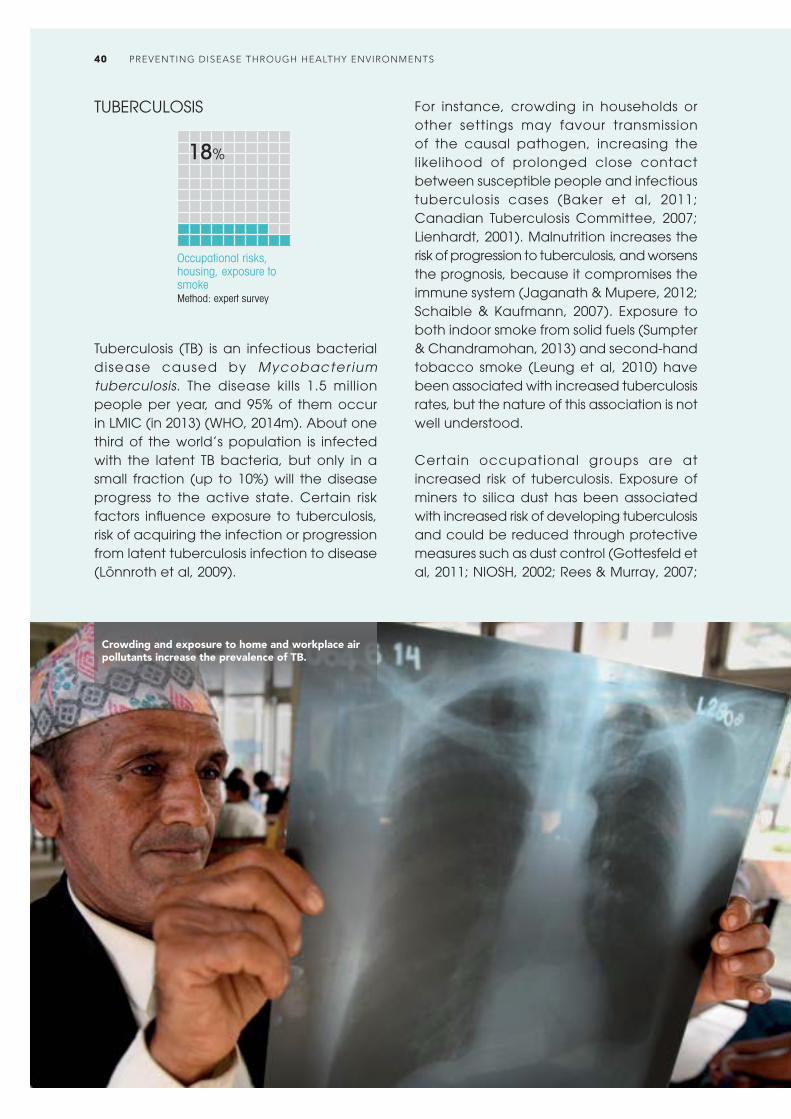
TUBERCULOSIS
Occupational risks, housing, exposure to smokeMethod: expert survey
18%
Tuberculosis (TB) is an infectious bacterial disease caused by Mycobacter ium tuberculosis. The disease kills 1.5 million people per year, and 95% of them occur in LMIC (in 2013) (WHO, 2014m). About one third of the world’s population is infected with the latent TB bacteria, but only in a small fraction (up to 10%) will the disease progress to the active state. Certain risk factors influence exposure to tuberculosis, risk of acquiring the infection or progression from latent tuberculosis infection to disease (Lönnroth et al, 2009).
For instance, crowding in households or other settings may favour transmission of the causal pathogen, increasing the likelihood of prolonged close contact between susceptible people and infectious tuberculosis cases (Baker et al, 2011; Canadian Tuberculosis Committee, 2007; Lienhardt, 2001). Malnutrition increases the risk of progression to tuberculosis, and worsens the prognosis, because it compromises the immune system (Jaganath & Mupere, 2012; Schaible & Kaufmann, 2007). Exposure to both indoor smoke from solid fuels (Sumpter & Chandramohan, 2013) and second-hand tobacco smoke (Leung et al, 2010) have been associated with increased tuberculosis rates, but the nature of this association is not well understood.
Certain occupational groups are at increased risk of tuberculosis. Exposure of miners to silica dust has been associated with increased risk of developing tuberculosis and could be reduced through protective measures such as dust control (Gottesfeld et al, 2011; NIOSH, 2002; Rees & Murray, 2007;
Crowding and exposure to home and workplace air pollutants increase the prevalence of TB.
PREVENTING DISEASE THROUGH HEALTHY ENVIRONMENTS40

Stuckler et al, 2013). Health-care workers who come into contact with tuberculosis patients are also at increased risk of infection, and the fraction of tuberculosis in the population due to this occupational exposure was estimated at about 0.4% (Baussano et al, 2011). Among detained populations (prisons, refugee camps etc.), tuberculosis rates are particularly high. The fraction of TB attributable to exposure in prisons alone was estimated to amount to more than 6% of the total TB burden (Baussano et al, 2010). The epidemiological impact of focusing on diagnosis and treatment alone has been less than expected, for example due to challenges posed by multidrug resistance and weak health systems. Additional interventions sustainably addressing living and working conditions, as well as specific risk factors are required to meet long-term targets (Lönnroth et al, 2009).
For most of the world, it was estimated that about 19% (5–46%) of the total tuberculosis burden was attributable to the environment, although in areas where the HIV epidemic had a large impact on tuberculosis incidence it was likely that environmental factors had a smaller relative effect (estimate based on expert survey 2005, see Section 2). In parts of Africa that are strongly affected by HIV/AIDS, for example, the population attributable fraction for tuberculosis associated with the environment was estimated to be only 14% (4–24%). Although tuberculosis may have a
strong environmental component, this does not mean that environmental management alone will control the epidemic. It is clear, however, that managing environmental risk factors could significantly reduce the disease burden of tuberculosis.
OTHER INFECTIOUS AND PARASITIC DISEASES
Several smaller diseases are not considered separately in terms of health statistics, but may stil l have an environmental component. Examples include leptospirosis – through environmental or occupational exposure to infected animal urine or water containing animal urine; typhus fever, transmitted through rat fleas; Q fever through occupational contact while processing infected animals; rabies, through contact with infected stray dogs or other domestic or wild animals; Chikungunya, transmitted through the same mosquitoes as dengue, and which can therefore be prevented in similar ways; other vector-borne encephalitides or fevers; hepatitis A and E, linked to poor sanitation and faecally contaminated water; coccidioidomycosis or histoplasmosis, through inhaling infective dust; dracunculiasis, through drinking-water; and Lyme’s disease or Crimean-Congo haemorrhagic fever, which can be addressed through environmental management (Heymann, 2008; WHO, 2015a).
RESULTS: A SYSTEMATIC ANALYSIS OF FRACTIONS ATTRIBUTABLE TO THE ENVIRONMENT, BY DISEASE 41
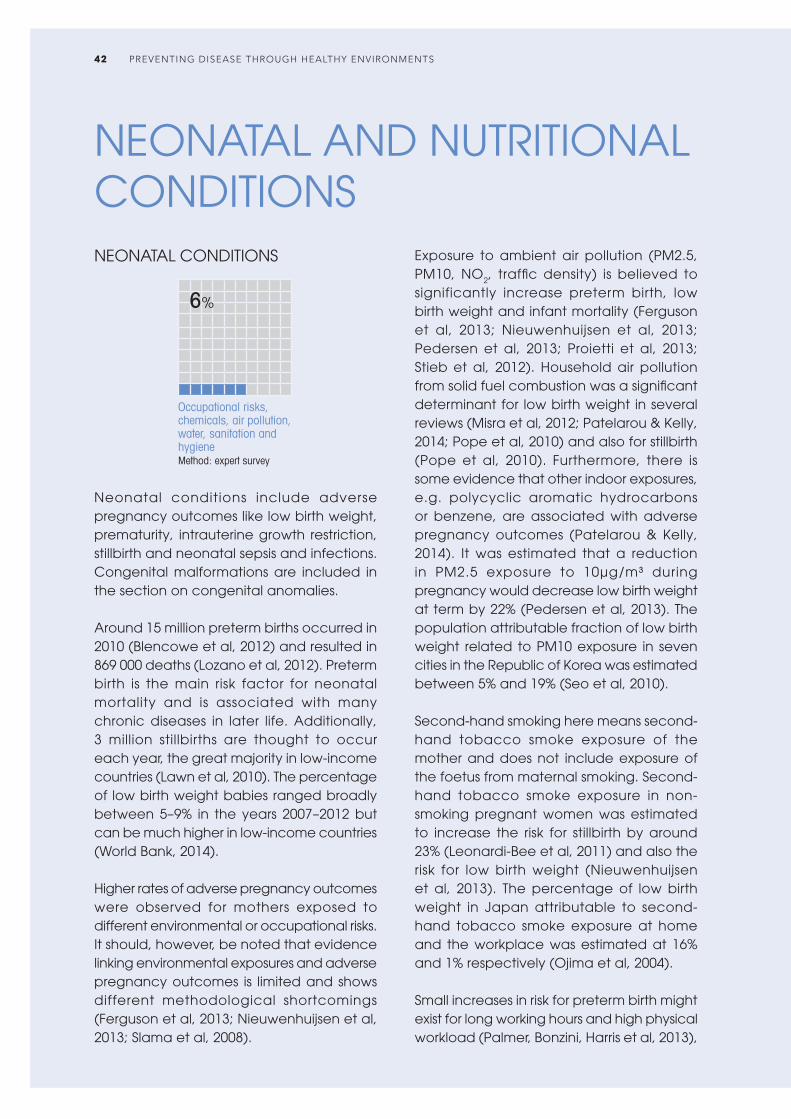
NEONATAL AND NUTRITIONAL CONDITIONSNEONATAL CONDITIONS
Occupational risks, chemicals, air pollution, water, sanitation and hygieneMethod: expert survey
6%
Neonatal conditions include adverse pregnancy outcomes like low birth weight, prematurity, intrauterine growth restriction, stillbirth and neonatal sepsis and infections. Congenital malformations are included in the section on congenital anomalies.
Around 15 million preterm births occurred in 2010 (Blencowe et al, 2012) and resulted in 869 000 deaths (Lozano et al, 2012). Preterm birth is the main risk factor for neonatal mortality and is associated with many chronic diseases in later life. Additionally, 3 million stillbirths are thought to occur each year, the great majority in low-income countries (Lawn et al, 2010). The percentage of low birth weight babies ranged broadly between 5–9% in the years 2007–2012 but can be much higher in low-income countries (World Bank, 2014).
Higher rates of adverse pregnancy outcomes were observed for mothers exposed to different environmental or occupational risks. It should, however, be noted that evidence linking environmental exposures and adverse pregnancy outcomes is limited and shows different methodological shortcomings (Ferguson et al, 2013; Nieuwenhuijsen et al, 2013; Slama et al, 2008).
Exposure to ambient air pollution (PM2.5, PM10, NO2, traffic density) is believed to significantly increase preterm birth, low birth weight and infant mortality (Ferguson et al, 2013; Nieuwenhuijsen et al, 2013; Pedersen et al, 2013; Proietti et al, 2013; Stieb et al, 2012). Household air pollution from solid fuel combustion was a significant determinant for low birth weight in several reviews (Misra et al, 2012; Patelarou & Kelly, 2014; Pope et al, 2010) and also for stillbirth (Pope et al, 2010). Furthermore, there is some evidence that other indoor exposures, e.g. polycyclic aromatic hydrocarbons or benzene, are associated with adverse pregnancy outcomes (Patelarou & Kelly, 2014). It was estimated that a reduction in PM2.5 exposure to 10μg/m³ during pregnancy would decrease low birth weight at term by 22% (Pedersen et al, 2013). The population attributable fraction of low birth weight related to PM10 exposure in seven cities in the Republic of Korea was estimated between 5% and 19% (Seo et al, 2010).
Second-hand smoking here means second-hand tobacco smoke exposure of the mother and does not include exposure of the foetus from maternal smoking. Second-hand tobacco smoke exposure in non-smoking pregnant women was estimated to increase the risk for stillbirth by around 23% (Leonardi-Bee et al, 2011) and also the risk for low birth weight (Nieuwenhuijsen et al, 2013). The percentage of low birth weight in Japan attributable to second-hand tobacco smoke exposure at home and the workplace was estimated at 16% and 1% respectively (Ojima et al, 2004).
Small increases in risk for preterm birth might exist for long working hours and high physical workload (Palmer, Bonzini, Harris et al, 2013),
PREVENTING DISEASE THROUGH HEALTHY ENVIRONMENTS42

though overall little to no negative effect on pregnancy outcomes was found for normal job-related activities (Salihu et al, 2012) and it was judged that associations might be due to confounding factors, chance or bias (Palmer, Bonzini, Bonde et al, 2013). Increased risk for other adverse pregnancy outcomes due to occupational risks is even more controversial (MacDonald et al, 2013; Palmer, Bonzini, Harris et al, 2013) and evidence is often lacking. Pregnancy might place women in the workplace under significant psychosocial stress, e.g. from pregnancy-related discrimination, and the association with adverse pregnancy outcomes is still unclear (Mutambudzi et al, 2011; Salihu et al, 2012). However, certain workgroups that predominantly include women of reproductive age are heavily exposed to different chemicals that are suspected to be associated with adverse pregnancy outcome (Pak et al, 2013).
There is accumulating, though st i l l controversial evidence (El Majidi et al, 2012), for a link between exposure to some endocrine disrupting chemicals, e.g. polychlorinated biphenyls (PCBs) and dioxins, and low birth weight and preterm
birth (Chen Zee et al, 2013; DiVall, 2013; Govarts et al, 2012; Kishi et al, 2013; Meeker, 2012; Nieuwenhuijsen et al, 2013). There is also some evidence for a link between disinfection by-products in water, exposure to e-waste, arsenic and extreme weather events and different adverse pregnancy outcomes (Beltran et al, 2014; Grant et al, 2013; Nieuwenhuijsen et al, 2013; Quansah et al, 2015).
Poor water, sanitation and hygiene (WASH) is an established risk factor for many infectious diseases, like salmonella, listeria, yersinia or influenza infections, which if occur during pregnancy increase the risk for different adverse pregnancy outcomes (Campbell et al, 2015). A large survey on health-care facilities in 54 LMIC, representing 66 000 facilities, showed that water was not readily available in about 40% of them, over a third lacked soap for handwashing, and a fifth lacked toilets; this lack of services compromises the provision of routine services such as child delivery, and the ability to prevent and control infections, including in the neonatal period (Bartram et al, 2015; WHO & UNICEF, 2015). Poor WASH also favours undernutrition with a resulting higher
Various environmental risks are linked to adverse pregnancy outcomes such as low birth weight and prematurity.
RESULTS: A SYSTEMATIC ANALYSIS OF FRACTIONS ATTRIBUTABLE TO THE ENVIRONMENT, BY DISEASE 43
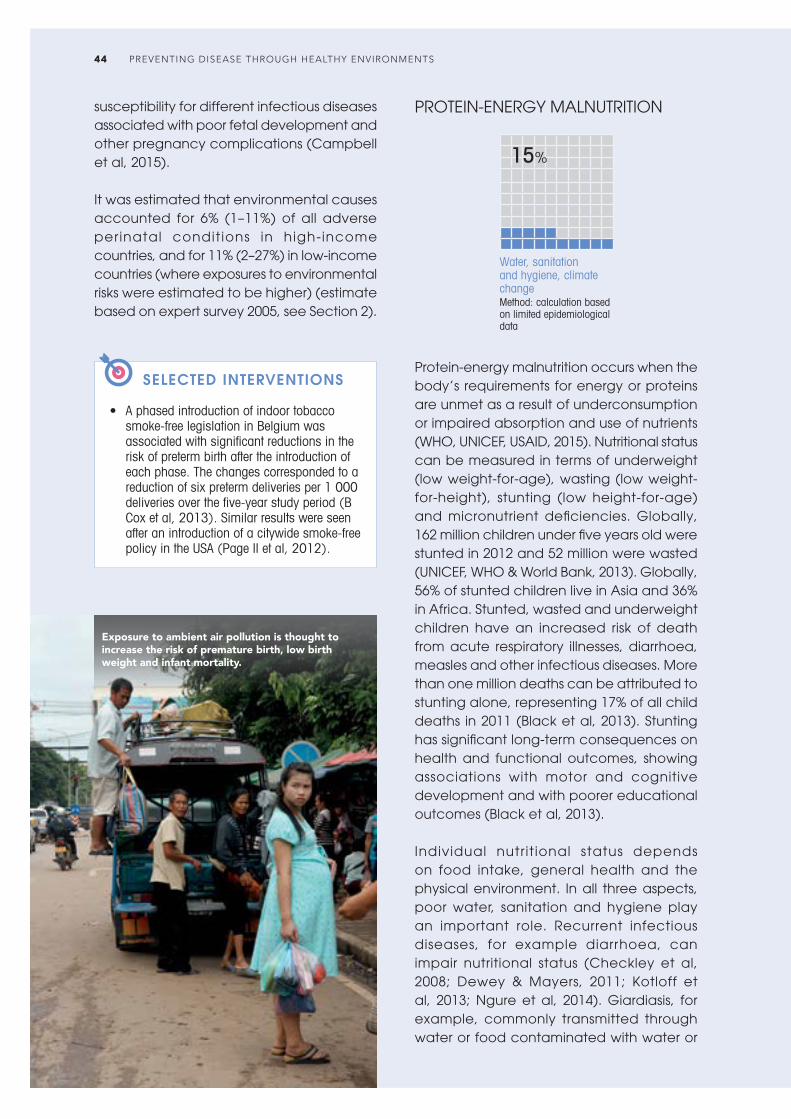
susceptibility for different infectious diseases associated with poor fetal development and other pregnancy complications (Campbell et al, 2015).
It was estimated that environmental causes accounted for 6% (1–11%) of all adverse perinatal condit ions in high-income countries, and for 11% (2–27%) in low-income countries (where exposures to environmental risks were estimated to be higher) (estimate based on expert survey 2005, see Section 2).
SELECTED INTERVENTIONS
• A phased introduction of indoor tobacco smoke-free legislation in Belgium was associated with significant reductions in the risk of preterm birth after the introduction of each phase. The changes corresponded to a reduction of six preterm deliveries per 1 000 deliveries over the five-year study period (B Cox et al, 2013). Similar results were seen after an introduction of a citywide smoke-free policy in the USA (Page II et al, 2012).
Exposure to ambient air pollution is thought to increase the risk of premature birth, low birth weight and infant mortality.
Protein-energy malnutrition occurs when the body’s requirements for energy or proteins are unmet as a result of underconsumption or impaired absorption and use of nutrients (WHO, UNICEF, USAID, 2015). Nutritional status can be measured in terms of underweight (low weight-for-age), wasting (low weight-for-height), stunting (low height-for-age) and micronutrient deficiencies. Globally, 162 million children under five years old were stunted in 2012 and 52 million were wasted (UNICEF, WHO & World Bank, 2013). Globally, 56% of stunted children live in Asia and 36% in Africa. Stunted, wasted and underweight children have an increased risk of death from acute respiratory illnesses, diarrhoea, measles and other infectious diseases. More than one million deaths can be attributed to stunting alone, representing 17% of all child deaths in 2011 (Black et al, 2013). Stunting has significant long-term consequences on health and functional outcomes, showing associations with motor and cognitive development and with poorer educational outcomes (Black et al, 2013).
Individual nutrit ional status depends on food intake, general health and the physical environment. In all three aspects, poor water, sanitation and hygiene play an important role. Recurrent infectious diseases, for example diarrhoea, can impair nutritional status (Checkley et al, 2008; Dewey & Mayers, 2011; Kotloff et al, 2013; Ngure et al, 2014). Giardiasis, for example, commonly transmitted through water or food contaminated with water or
PROTEIN-ENERGY MALNUTRITION
Water, sanitation and hygiene, climate changeMethod: calculation based on limited epidemiological data
15%
PREVENTING DISEASE THROUGH HEALTHY ENVIRONMENTS44

waste, furthermore leads to malabsorption and therefore to higher risk of malnutrition (Escobedo et al, 2010; Halliez & Buret, 2013). Beyond specific enteric infections, evidence is also growing to support a hypothesized link between living in unhygienic conditions and an intestinal disorder referred to as envi ronmental enter ic dysfunct ion, which has been associated with stunting (Keusch et al, 2014; Lin et al, 2013; Ngure et al, 2014; Prendergast & Kelly, 2012). As discussed in detail in the respective sections, many infectious diseases are related to environmental factors, for example as diarrhoeal diseases are to unsafe drinking-water, poor sanitation and personal hygiene; with a population attributable fraction of 58% globally (Prüss-Ustün et al, 2014). Limited direct evidence on water, sanitation, hygiene and nutritional status is also available (Dangour et al, 2013; Ikeda et al, 2013).
As indirect impacts, high proportions of household income spent on water from vendors where adequate services are not available, such as in informal settlements, may lead to the food budget being sacrif iced, which may contribute to malnutrition (Cairncross & Kinnear, 1992). Fetching water from distant sources may use up a significant proportion of a person’s energy (Chikava & Annegarn, 2013), and may therefore also contribute to undernutrition. Country programmes of nutrition-sensitive agriculture have been developed to maximize agriculture’s contribution to nutrition and health (FAO, 2014).
Climate change is likely to have significant effects on crop productivity of major cereals, and thus potentially increase the risk of undernutrition (IPCC, 2013; WHO, 2014z) as agriculture is climate sensitive. Furthermore, increases in water scarcity, population growth, meat consumption and land degradation are likely to additionally reduce food security and possibly to aggravate malnutrition (Wheeler & von Braun, 2013; World Food Programme, 2009).
Combining the fraction of diarrhoeal disease burden of 58% attributed to water, sanitation and hygiene (Prüss-Ustün et al, 2014) with the estimate that about 25% (8–38%) of stunting is attributed to frequent diarrhoea episodes (Checkley et al, 2008) would result in the attribution of 15% (10–19%) of malnutrition to inadequate water, sanitation and hygiene. This estimate relies on a number of assumptions, and therefore constitutes only a rough estimate. Also, it does not take into account the other potential impacts of the environment on malnutrition outlined in this section, and may therefore be an underestimate of the impact of the environment on malnutrition.
SELECTED INTERVENTIONS
• A systematic review and meta-analysis on interventions to improve water quality, water supply, sanitation and hygiene practices found suggestive evidence that they can improve nutritional status in children. None of the studies included in the analysis was graded as high quality which increases the uncertainty of the estimate (Dangour et al, 2013).
Assessing children’s weight and nutritional status (Myanmar).
RESULTS: A SYSTEMATIC ANALYSIS OF FRACTIONS ATTRIBUTABLE TO THE ENVIRONMENT, BY DISEASE 45
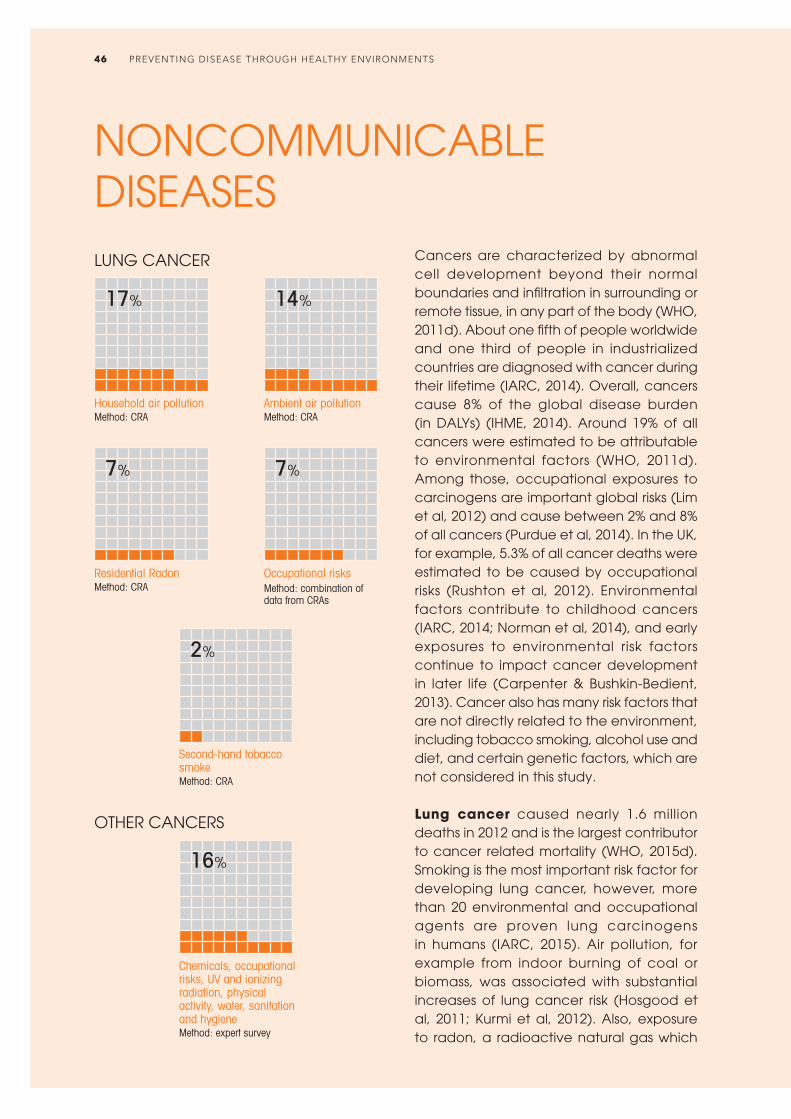
NONCOMMUNICABLE DISEASES
Cancers are characterized by abnormal cell development beyond their normal boundaries and infiltration in surrounding or remote tissue, in any part of the body (WHO, 2011d). About one fifth of people worldwide and one third of people in industrialized countries are diagnosed with cancer during their lifetime (IARC, 2014). Overall, cancers cause 8% of the global disease burden (in DALYs) (IHME, 2014). Around 19% of all cancers were estimated to be attributable to environmental factors (WHO, 2011d). Among those, occupational exposures to carcinogens are important global risks (Lim et al, 2012) and cause between 2% and 8% of all cancers (Purdue et al, 2014). In the UK, for example, 5.3% of all cancer deaths were estimated to be caused by occupational risks (Rushton et al, 2012). Environmental factors contribute to childhood cancers (IARC, 2014; Norman et al, 2014), and early exposures to environmental risk factors continue to impact cancer development in later life (Carpenter & Bushkin-Bedient, 2013). Cancer also has many risk factors that are not directly related to the environment, including tobacco smoking, alcohol use and diet, and certain genetic factors, which are not considered in this study.
Lung cancer caused nearly 1.6 million deaths in 2012 and is the largest contributor to cancer related mortality (WHO, 2015d). Smoking is the most important risk factor for developing lung cancer, however, more than 20 environmental and occupational agents are proven lung carcinogens in humans (IARC, 2015). Air pollution, for example from indoor burning of coal or biomass, was associated with substantial increases of lung cancer risk (Hosgood et al, 2011; Kurmi et al, 2012). Also, exposure to radon, a radioactive natural gas which
Household air pollutionMethod: CRA
Ambient air pollutionMethod: CRA
Residential RadonMethod: CRA
Occupational risksMethod: combination of data from CRAs
LUNG CANCER
17% 14%
7% 7%
Second-hand tobacco smokeMethod: CRA
2%
OTHER CANCERS
Chemicals, occupational risks, UV and ionizing radiation, physical activity, water, sanitation and hygieneMethod: expert survey
16%
PREVENTING DISEASE THROUGH HEALTHY ENVIRONMENTS46

can be found in indoor environments such as homes and workplaces, was associated with a 7% increased lung cancer risk with every additional 100 Bq/m3 radon exposure (Zhang et al, 2012). Second-hand tobacco smoke is estimated to have caused more than 21 000 lung cancer deaths in 2004 (Öberg et al, 2011). Occupational (Nielsen et al, 2014) and domestic (Goswami et al, 2013) asbestos exposure (including chrysotile) leads to lung cancer and mesothelioma (sufficient evidence), a rare cancer predominantly of the outer lining of the lung (IARC, 2015). Many more environmental and occupational exposures are proven causes of lung cancer, including diesel engine exhaust, hexavalent chromium, silica dust, coke or aluminium production, and painting (IARC, 2015). All these causes are supported by sufficient evidence (evidence addressed in this section refers to humans). Some of these exposures have also been linked to toxic waste sites (Chatham-
Stephens et al, 2013). It was estimated that 14% of lung cancers are attributable to ambient air pollution, 17% to household air pollution (WHO, 2014c; WHO, 2014d), 6.5% to residential radon, 1.8% to second-hand tobacco smoke and 6.6% to occupational risks (in DALYs) (IHME, 2014).
Colon and rectum cancers caused more than 700 000 cancer deaths in 2012 (WHO, 2015d). The Global Burden of Disease Study 2010 (GBD 2010) estimated that 27% of all colon and rectum cancers (in DALYs) can be attributable to low physical activity (IHME, 2014) – and physical activity levels can be modulated by the environment (see specific section). Other reviews, however, found lower numbers (<10%) (Lee et al, 2012; Park et al, 2014; Wang et al, 2012). The International Agency for Research on Cancer (IARC) lists radiation (supported by sufficient evidence) and asbestos (supported by limited evidence) as two
Melanomas are linked to excessive UV exposure yet humans continue to deplete the ozone layer and many fail to use personal sun protection.
RESULTS: A SYSTEMATIC ANALYSIS OF FRACTIONS ATTRIBUTABLE TO THE ENVIRONMENT, BY DISEASE 47

further potential environmental risk factors for this type of cancer (IARC, 2015).
Breast cancer is the most deadly cancer in women with over half a million deaths in 2012 (WHO, 2015d). The GBD 2010 estimated that 30% of breast cancer cases are attributable to physical inactivity or low physical activity (IHME, 2014), which can be influenced by the environment. As for colon cancers other analyses found lower numbers (8–10%) (Lee et al, 2012; Wang et al, 2012). The causal link with ionizing radiation is supported by strong evidence from studies of women exposed at younger ages (IARC, 2015). Causal links to several other environmental exposures such as PCBs, ethylene oxide and shift work that involves circadian disruption are supported by limited evidence (IARC, 2015).
Both lymphomas/multiple myelomas and leukaemia were responsible for around 300 000 deaths in 2012 (WHO, 2015d). Causal links have been reported for numerous environmental and occupational exposures, e.g. exposures to benzene, formaldehyde, chemicals in rubber manufacturing processes and ionizing radiation (sufficient
evidence), and var ious pest ic ides and herbicides (diazinon, glyphosate, malathion), chemicals (solvents such as dichloromethane, trichloroethylene), and occupational exposures in petroleum refining (limited evidence) (IARC, 2015). High benzene exposure, occurring for example in the production of many organic chemicals and in the production of some types of rubber, dyes, pesticides or detergents, has been associated with a nearly tripled leukaemia risk (Khalade et al, 2010). Formaldehyde, a substance widely used in manufacturing, is contained in numerous consumer products, and therefore causes numerous airborne exposures at work and in the home. Exposure to formaldehyde as a cause of leukaemia is supported by sufficient evidence (IARC, 2015). Pesticide exposure at home and of pregnant women were suggested to increase the risk for childhood leukaemia (limited evidence) (Turner et al, 2011; Van Maele-Fabry et al, 2011). Also X- and gamma-radiation cause leukaemia (supported by sufficient evidence) (IARC, 2015). There is also limited evidence that extremely low frequency magnetic fields, as produced by power lines, support the
A centuries’ old scene – a worker washes leather before it is dyed (Fez, Morocco). Many chemicals used in the leather tanning industry have been linked to various forms of cancer.
PREVENTING DISEASE THROUGH HEALTHY ENVIRONMENTS48

development of childhood leukaemia (Calvente et al, 2010; IARC, 2015; Kheifets et al, 2010). It was estimated that 1.1% of global leukaemia was attributable to occupational risks (IHME, 2014).
Mouth and oropharynx cancer were responsible for nearly 300 000 deaths in 2012 (WHO, 2015d). The causal link between exposure to asbestos and larynx cancer is supported by sufficient evidence (IARC, 2012). Significantly increased risk of larynx cancer also has been observed for many production and transport professions, including miners, tailors, blacksmiths, toolmakers, painters, bricklayers, carpenters and transport equipment operators and potential risks include exposure to polycyclic aromatic hydrocarbons, engine exhaust, textile dust and working in the rubber industry (pooled risks from meta-analyses) (Bayer et al, 2014; Paget-Bailly et al, 2012). Wood dust and formaldehyde have been identified as risk factors for nasopharynx carcinoma (IARC, 2015; Jia & Qin, 2012). It is estimated that 3.6% of larynx cancer and 0.5% of nasopharynx cancer is attributable to occupational risks (IHME, 2014).
More than 170 000 people died of bladder cancer in 2012 (WHO, 2015d). Active smoking causes a large part of those cancers, e.g. 50% of urothelial bladder cancer, but also occupational and environmental exposures play an important role (Burger et al, 2013; IARC, 2015). Sufficient and consistent evidence supports that arsenic above a certain threshold (e.g. 50 μg/l) in drinking-water increases the risk for bladder cancer (Christoforidou et al, 2013; IARC, 2015). Sufficient evidence also supports Schistosoma haematobium, a major agent of schistosomiasis, in urinary bladder cancer. Schistosomiasis can be prevented through management of water and sanitation. In painters (supported by sufficient evidence) (IARC, 2015), the relative risk for bladder cancer was increased by 25% (Guha et al, 2010). Other occupations, such as dry cleaners, hairdressers and textile manufacturers, as well as exposure
to printing processes, were also linked to bladder cancer, although supported by limited evidence (IARC, 2015). The risk for hairdressers increased with longer duration in the workplace (Harling et al, 2010). Another important risk factor for bladder cancer is exposure to aromatic amines (e.g. 2-naphthylamine, 4-aminobiphenyl and benzidine) (IARC, 2015) (sufficient evidence), which can occur through working in the plastic, chemical, dye and rubber industry (Letasiova et al, 2012). Aromatic amines are also present in diesel exhaust. More environmental risk factors, such as exposure to ionizing radiation have been reported as being causal (sufficient evidence) (IARC, 2015).
Melanoma and other skin cancers accounted for nearly 100 000 deaths in 2012 (WHO, 2015d). Ultraviolet exposure increases melanoma risk (sufficient evidence) (IARC, 2015). Occupational UV-exposure, e.g. through working outdoors, has been shown to increase the risk for basal and squamous cell carcinoma (Bauer et al, 2011; Schmitt et al, 2011). Indoor tanning is associated with a 16–25% increased melanoma risk with an increasing cancer risk for more frequent sunbed use (Boniol et al, 2012; Colantonio et al, 2014). Indoor tanning was also associated with increased squamous and basal cell carcinoma (IARC, 2015; Wehner et al, 2012). In the UK, 86% of melanomas were attributable to excess UV exposure (Parkin et al, 2011). For the US, Europe and Australia the population attributable fractions from indoor tanning were estimated at 3–22% for non-melanoma skin cancer and 3–9% for melanoma (Wehner et al, 2014). Other environmental and occupational exposures such as polychlorinated biphenyls, arsenic, soot and ionizing radiation have also been linked to cancer of the skin (sufficient evidence) (IARC, 2015).
Other different cancer types are associated with environmental or occupational exposures, for example cervix, ovarian, prostate, liver, stomach, thyroid and mesothelium cancer. Plutonium and vinyl
RESULTS: A SYSTEMATIC ANALYSIS OF FRACTIONS ATTRIBUTABLE TO THE ENVIRONMENT, BY DISEASE 49
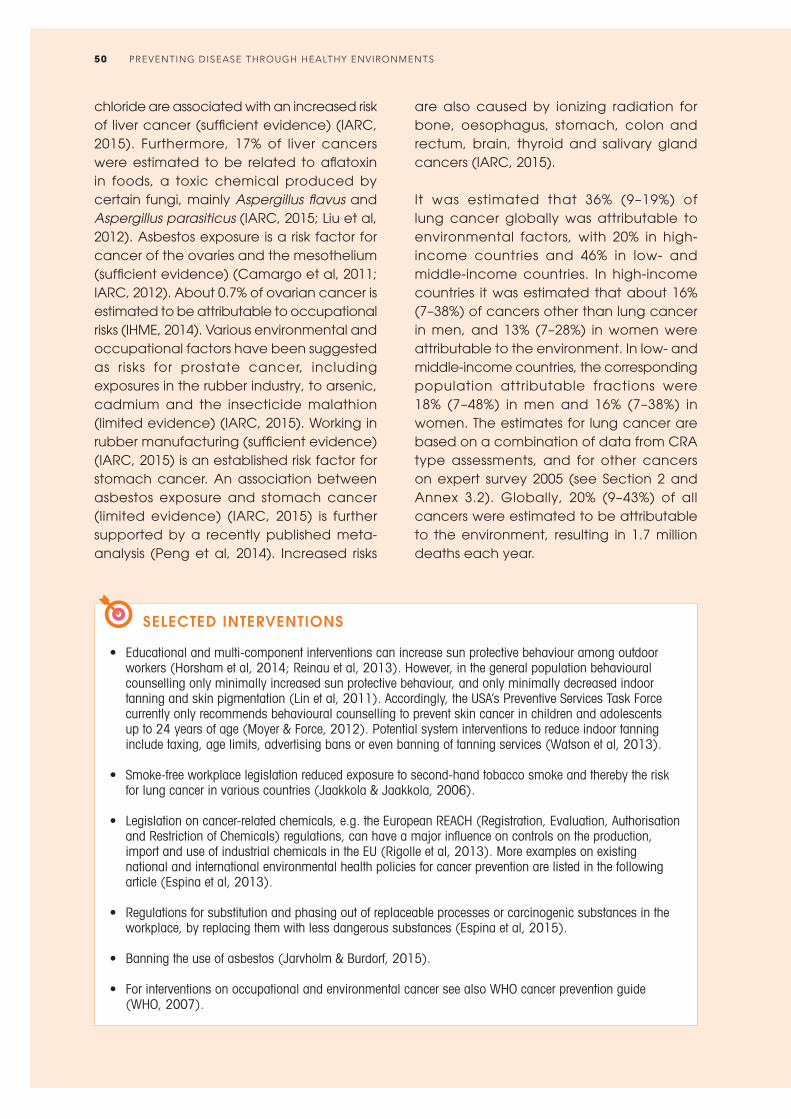
chloride are associated with an increased risk of liver cancer (sufficient evidence) (IARC, 2015). Furthermore, 17% of liver cancers were estimated to be related to aflatoxin in foods, a toxic chemical produced by certain fungi, mainly Aspergillus flavus and Aspergillus parasiticus (IARC, 2015; Liu et al, 2012). Asbestos exposure is a risk factor for cancer of the ovaries and the mesothelium (sufficient evidence) (Camargo et al, 2011; IARC, 2012). About 0.7% of ovarian cancer is estimated to be attributable to occupational risks (IHME, 2014). Various environmental and occupational factors have been suggested as risks for prostate cancer, including exposures in the rubber industry, to arsenic, cadmium and the insecticide malathion (limited evidence) (IARC, 2015). Working in rubber manufacturing (sufficient evidence) (IARC, 2015) is an established risk factor for stomach cancer. An association between asbestos exposure and stomach cancer (limited evidence) (IARC, 2015) is further supported by a recently published meta-analysis (Peng et al, 2014). Increased risks
SELECTED INTERVENTIONS
• Educational and multi-component interventions can increase sun protective behaviour among outdoor workers (Horsham et al, 2014; Reinau et al, 2013). However, in the general population behavioural counselling only minimally increased sun protective behaviour, and only minimally decreased indoor tanning and skin pigmentation (Lin et al, 2011). Accordingly, the USA’s Preventive Services Task Force currently only recommends behavioural counselling to prevent skin cancer in children and adolescents up to 24 years of age (Moyer & Force, 2012). Potential system interventions to reduce indoor tanning include taxing, age limits, advertising bans or even banning of tanning services (Watson et al, 2013).
• Smoke-free workplace legislation reduced exposure to second-hand tobacco smoke and thereby the risk
for lung cancer in various countries (Jaakkola & Jaakkola, 2006).
• Legislation on cancer-related chemicals, e.g. the European REACH (Registration, Evaluation, Authorisation and Restriction of Chemicals) regulations, can have a major influence on controls on the production, import and use of industrial chemicals in the EU (Rigolle et al, 2013). More examples on existing national and international environmental health policies for cancer prevention are listed in the following article (Espina et al, 2013).
• Regulations for substitution and phasing out of replaceable processes or carcinogenic substances in the
workplace, by replacing them with less dangerous substances (Espina et al, 2015).
• Banning the use of asbestos (Jarvholm & Burdorf, 2015).
• For interventions on occupational and environmental cancer see also WHO cancer prevention guide (WHO, 2007).
are also caused by ionizing radiation for bone, oesophagus, stomach, colon and rectum, brain, thyroid and salivary gland cancers (IARC, 2015).
It was estimated that 36% (9–19%) of lung cancer globally was attributable to environmental factors, with 20% in high-income countries and 46% in low- and middle-income countries. In high-income countries it was estimated that about 16% (7–38%) of cancers other than lung cancer in men, and 13% (7–28%) in women were attributable to the environment. In low- and middle-income countries, the corresponding population attributable fractions were 18% (7–48%) in men and 16% (7–38%) in women. The estimates for lung cancer are based on a combination of data from CRA type assessments, and for other cancers on expert survey 2005 (see Section 2 and Annex 3.2). Globally, 20% (9–43%) of all cancers were estimated to be attributable to the environment, resulting in 1.7 million deaths each year.
PREVENTING DISEASE THROUGH HEALTHY ENVIRONMENTS50
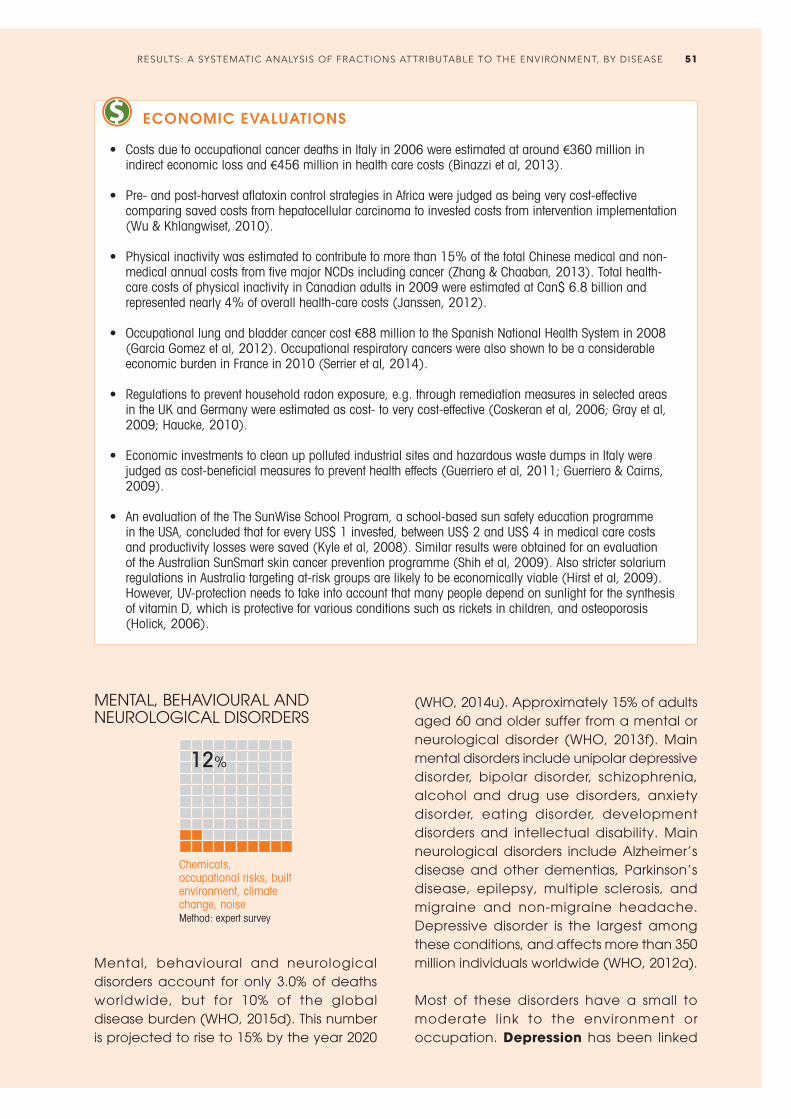
ECONOMIC EVALUATIONS
• Costs due to occupational cancer deaths in Italy in 2006 were estimated at around €360 million in indirect economic loss and €456 million in health care costs (Binazzi et al, 2013).
• Pre- and post-harvest aflatoxin control strategies in Africa were judged as being very cost-effective comparing saved costs from hepatocellular carcinoma to invested costs from intervention implementation (Wu & Khlangwiset, 2010).
• Physical inactivity was estimated to contribute to more than 15% of the total Chinese medical and non-
medical annual costs from five major NCDs including cancer (Zhang & Chaaban, 2013). Total health-care costs of physical inactivity in Canadian adults in 2009 were estimated at Can$ 6.8 billion and represented nearly 4% of overall health-care costs (Janssen, 2012).
• Occupational lung and bladder cancer cost €88 million to the Spanish National Health System in 2008 (Garcia Gomez et al, 2012). Occupational respiratory cancers were also shown to be a considerable economic burden in France in 2010 (Serrier et al, 2014).
• Regulations to prevent household radon exposure, e.g. through remediation measures in selected areas
in the UK and Germany were estimated as cost- to very cost-effective (Coskeran et al, 2006; Gray et al, 2009; Haucke, 2010).
• Economic investments to clean up polluted industrial sites and hazardous waste dumps in Italy were judged as cost-beneficial measures to prevent health effects (Guerriero et al, 2011; Guerriero & Cairns, 2009).
• An evaluation of the The SunWise School Program, a school-based sun safety education programme in the USA, concluded that for every US$ 1 invested, between US$ 2 and US$ 4 in medical care costs and productivity losses were saved (Kyle et al, 2008). Similar results were obtained for an evaluation of the Australian SunSmart skin cancer prevention programme (Shih et al, 2009). Also stricter solarium regulations in Australia targeting at-risk groups are likely to be economically viable (Hirst et al, 2009). However, UV-protection needs to take into account that many people depend on sunlight for the synthesis of vitamin D, which is protective for various conditions such as rickets in children, and osteoporosis (Holick, 2006).
MENTAL, BEHAVIOURAL AND NEUROLOGICAL DISORDERS
Chemicals, occupational risks, built environment, climate change, noise Method: expert survey
12%
Mental, behavioural and neurological disorders account for only 3.0% of deaths worldwide, but for 10% of the global disease burden (WHO, 2015d). This number is projected to rise to 15% by the year 2020
(WHO, 2014u). Approximately 15% of adults aged 60 and older suffer from a mental or neurological disorder (WHO, 2013f). Main mental disorders include unipolar depressive disorder, bipolar disorder, schizophrenia, alcohol and drug use disorders, anxiety disorder, eating disorder, development disorders and intellectual disability. Main neurological disorders include Alzheimer’s disease and other dementias, Parkinson’s disease, epilepsy, multiple sclerosis, and migraine and non-migraine headache. Depressive disorder is the largest among these conditions, and affects more than 350 million individuals worldwide (WHO, 2012a).
Most of these disorders have a small to moderate link to the environment or occupation. Depression has been linked
RESULTS: A SYSTEMATIC ANALYSIS OF FRACTIONS ATTRIBUTABLE TO THE ENVIRONMENT, BY DISEASE 51
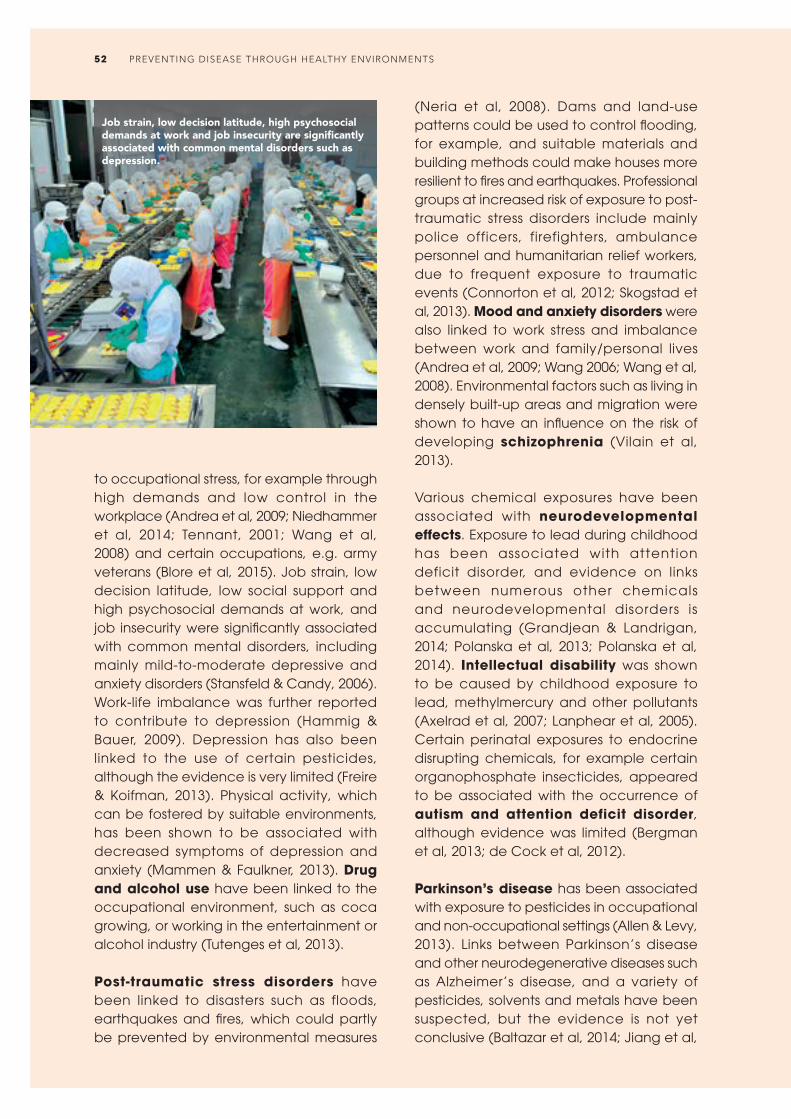
to occupational stress, for example through high demands and low control in the workplace (Andrea et al, 2009; Niedhammer et al, 2014; Tennant, 2001; Wang et al, 2008) and certain occupations, e.g. army veterans (Blore et al, 2015). Job strain, low decision latitude, low social support and high psychosocial demands at work, and job insecurity were significantly associated with common mental disorders, including mainly mild-to-moderate depressive and anxiety disorders (Stansfeld & Candy, 2006). Work-life imbalance was further reported to contribute to depression (Hammig & Bauer, 2009). Depression has also been linked to the use of certain pesticides, although the evidence is very limited (Freire & Koifman, 2013). Physical activity, which can be fostered by suitable environments, has been shown to be associated with decreased symptoms of depression and anxiety (Mammen & Faulkner, 2013). Drug and alcohol use have been linked to the occupational environment, such as coca growing, or working in the entertainment or alcohol industry (Tutenges et al, 2013).
Post-traumatic stress disorders have been linked to disasters such as floods, earthquakes and fires, which could partly be prevented by environmental measures
(Neria et al, 2008). Dams and land-use patterns could be used to control flooding, for example, and suitable materials and building methods could make houses more resilient to fires and earthquakes. Professional groups at increased risk of exposure to post-traumatic stress disorders include mainly police officers, firefighters, ambulance personnel and humanitarian relief workers, due to frequent exposure to traumatic events (Connorton et al, 2012; Skogstad et al, 2013). Mood and anxiety disorders were also linked to work stress and imbalance between work and family/personal lives (Andrea et al, 2009; Wang 2006; Wang et al, 2008). Environmental factors such as living in densely built-up areas and migration were shown to have an influence on the risk of developing schizophrenia (Vilain et al, 2013).
Various chemical exposures have been associated with neurodevelopmental effects. Exposure to lead during childhood has been associated with attention deficit disorder, and evidence on links between numerous other chemicals and neurodevelopmental disorders is accumulating (Grandjean & Landrigan, 2014; Polanska et al, 2013; Polanska et al, 2014). intellectual disability was shown to be caused by childhood exposure to lead, methylmercury and other pollutants (Axelrad et al, 2007; Lanphear et al, 2005). Certain perinatal exposures to endocrine disrupting chemicals, for example certain organophosphate insecticides, appeared to be associated with the occurrence of autism and attention deficit disorder, although evidence was limited (Bergman et al, 2013; de Cock et al, 2012).
Parkinson’s disease has been associated with exposure to pesticides in occupational and non-occupational settings (Allen & Levy, 2013). Links between Parkinson’s disease and other neurodegenerative diseases such as Alzheimer’s disease, and a variety of pesticides, solvents and metals have been suspected, but the evidence is not yet conclusive (Baltazar et al, 2014; Jiang et al,
Job strain, low decision latitude, high psychosocial demands at work and job insecurity are significantly associated with common mental disorders such as depression.
PREVENTING DISEASE THROUGH HEALTHY ENVIRONMENTS52

2013; Tanner et al, 2014; WHO Regional Office for Europe, 2009). Epilepsy has been linked to head injury (WHO, 2012b), including in the workplace. Also, exposure to methylmercury, a neurotoxic substance, and air pollution have been linked to epilepsy (Cakmak et al, 2010; Yuan, 2012). Furthermore, epilepsy has been put forward as a consequence of certain other diseases, which themselves are associated with the environment. Stroke is one example, epilepsy may therefore indirectly be prevented by action such as creating environments fostering physical activity and reducing air pollution. Another example is malaria, which has environmental links (see section on malaria); the cerebral form of malaria has also been associated with epilepsy (Anyanwu, 1999; Asindi et al, 1993). Lack of exposure to UV radiation has been repeatedly shown to influence the risk of multiple sclerosis; links between second-hand tobacco smoke, organic solvents and shift work, and multiple sclerosis have also been suggested (Hedstrom et al, 2015).
insomnia has env i ronmental and occupational components, mainly through exposure to residential and occupational noise, occupational stress, irregular working hours or jet lag (Porkka-Heiskanen et al, 2013). Triggers for migraine and other headaches were reported to include bright lights, air quality, odours, stress and noise. Remediation of triggers in the home, workplace or classroom may improve attendance and productivity (Friedman & De ver Dye, 2009). Other disorders may be associated with population density in urban settings and poor quality of the local environment. Climate change may affect mental health directly through trauma, or indirectly through physical stress (e.g. extreme heat exposure) or deteriorating environments (Berry et al, 2010).
In Finland it was estimated that 4% of mental disorders and 3% of nervous system diseases were linked to occupation (Nurminen & Karjalainen, 2001). In France, 15–20% of mental disorders were attributable to job strain for men, and 14–27% for women
SELECTED INTERVENTIONS
• Active use of parks or recreational facilities and higher levels of neighbourhood social cohesion were associated with fewer depressive symptoms in Latinos in the USA as compared with those who did not use these spaces. Strategies for promoting active use of parks or recreational activities to address depression should therefore be tested (Perez et al, 2015).
• A stress reduction programme directed towards worksite supervisors has been shown to reduce depressive symptoms and sick leave (Kawakami et al, 1997).
ECONOMIC EVALUATIONS
• Exercise has been shown to be a cost-efficient treatment alternative for mild to moderate depression and a variety of anxiety disorders (Carek et al, 2011).
• Lead-safe window replacements in all pre-1960 homes in the USA would yield a net benefit of at least US$ 67 billion; additional benefits include for example avoided attention deficit hyperactivity disorder, reduced crime and delinquency, and associated long-term costs of climate change (Nevin et al, 2008).
(Sultan-Taieb et al, 2013). In Europe, 18% and 4.5% of mental disorders were attributed to job strain and job insecurity, respectively (Niedhammer et al, 2013).
Overall, the environmental contribution to the disease burden of neuropsychiatric disorders was relatively modest, and the population attributable fraction was estimated to be 12% (3−30%). The neuropsychiatric diseases with the largest environmental components included depression and anxiety disorders, alcohol use disorders, migraine and non-migraine headaches, epilepsy and childhood behavioural disorders, with population attributable fractions ranging between 12% and 20% (estimates based on expert survey 2015, see Section 2).
RESULTS: A SYSTEMATIC ANALYSIS OF FRACTIONS ATTRIBUTABLE TO THE ENVIRONMENT, BY DISEASE 53

Household air pollution, UV exposure Method: CRA
CATARACTS
24%
Cataracts are the leading cause of blindness worldwide. Globally, cataracts are responsible for 51% of blindness – an estimated 20 million individuals suffer from this degenerative eye disease (WHO, 2014f). A cataract is the clouding of the lens of the eye, which prevents clear vision. Cataract can be removed surgically, but access to the required medical services is limited in many countries (WHO, 2014f).
The prevalence of cataracts increases with age. Cataracts have been associated with several environmental factors. Ultraviolet light exposure is a significant factor in the genesis of cataract. Globally, about one fifth of cortical cataracts have been attributed to UV radiation (Lucas et al, 2008). The depletion of the stratospheric ozone layer has led to increasing UV exposure, and, accordingly, the risk of cataract development is likely to further increase (Norval et al, 2011). Also exposure to cookstove smoke increases the risk of cataract formation, with an estimated population attributable fraction of 35% of the cataract burden in women (Smith et al, 2014), and 24% of the total burden of cataracts (in DALYs) (WHO, 2015d).
The rate of cataracts may be decreased by environmental interventions such as increased UV protection (such as protective eyewear, brimmed hat) (AOA, 1993) and reduced exposure to cookstove smoke, and using alternative, clean fuels.
In total, it is estimated that about 24% of all cataracts are attributable to environmental risks, based on the burden related to cookstove smoke (CRA, see Section 2; WHO, 2015d).
HEARING LOSS
Occupational noise Method: CRA
22%
Approximately 360 mill ion individuals suffer from hearing loss worldwide (WHO, 2014h), the majority being adults (91%). Disabling hearing loss refers to a hearing loss greater than 40dB in the better ear in adults – 25dB or better in both ears being the hearing threshold for normal hearing (WHO, 2014h). “Hard of hearing” refers to people with mild to severe hearing loss who can communicate through spoken language and can benefit from hearing aids. “Deaf” people have profound hearing loss which implies very little or no hearing. It is estimated that over one third of the global population ≥65 years of age are affected by hearing loss, most notably in regions of South Asia, Asia Pacific and sub-Saharan Africa (WHO, 2014h).
Hearing loss and deafness can have congenital causes (e.g. maternal infections during pregnancy such as rubel la, inappropriate use of certain drugs during pregnancy, low birth weight, birth asphyxia) or acquired causes. Acquired causes include consequences of certain infectious diseases such as measles, chronic ear infection, use of ototoxic drugs, age-related hearing loss, head injury and excessive noise (WHO, 2014h).
PREVENTING DISEASE THROUGH HEALTHY ENVIRONMENTS54

A worker grinds metal without ear protection (Cambodia).
Workers may be exposed to excessive noise and ototoxic substances which increases their risk of hearing loss (EU-OSHA, 2009; Kurmis & Apps, 2007; Nies, 2012). Work in certain sectors, such as mining, manufacturing, construction work or night clubs is associated with an increased risk of occupationally acquired hearing loss (Kurmis & Apps, 2007). Globally, exposure to excessive noise at work caused 22% of hearing loss in 2010 (IHME, 2014). Exposure to music at excessive levels or other leisure-related noise may also induce hearing symptoms which are associated with an increased risk of hearing loss (Zhao et al, 2010).
Noise-induced and ototoxic hearing loss are largely preventable. Preventive action to reduce the hazard from occupational noise exposure may include engineering controls (e.g. reduce noise emission from industr ial machinery), administrative controls (e.g. limiting the time a worker
spends in noisy environments) and personal protective equipment (e.g. earmuffs and plugs). Comprehensive programmes also include noise monitoring and awareness raising/training among workers, as well as audiometric testing (Hong et al, 2013; OSHA, 2014). Similarly, monitoring and control measures can reduce exposure to ototoxic substances (EU-OSHA, 2009). Reduction of exposure to loud recreational noise (e.g. at music concerts, sporting events, gun sports, personal stereo systems with headphone use) by creating awareness, using personal protective equipment, and implementing suitable legislation are also recommended (WHO, 2014h).
The disease burden of hearing loss due to the environment is estimated to amount to 22% (19–25%), and is based on the occu-pational health evidence while evidence on leisure noise is accumulating (Method: CRA; IHME, 2014).
RESULTS: A SYSTEMATIC ANALYSIS OF FRACTIONS ATTRIBUTABLE TO THE ENVIRONMENT, BY DISEASE 55
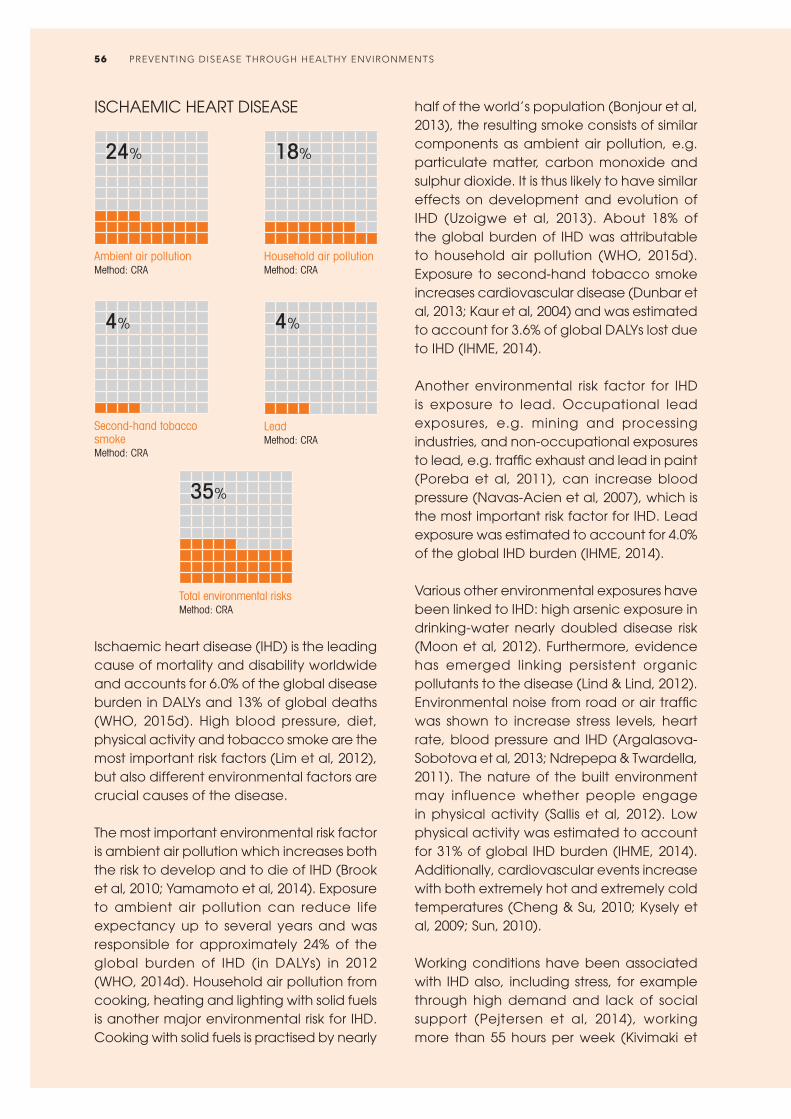
Ambient air pollution Method: CRA
24%
Second-hand tobacco smoke Method: CRA
4%
Household air pollution Method: CRA
18%
Lead Method: CRA
4%
Total environmental risksMethod: CRA
35%
ISCHAEMIC HEART DISEASE
Ischaemic heart disease (IHD) is the leading cause of mortality and disability worldwide and accounts for 6.0% of the global disease burden in DALYs and 13% of global deaths (WHO, 2015d). High blood pressure, diet, physical activity and tobacco smoke are the most important risk factors (Lim et al, 2012), but also different environmental factors are crucial causes of the disease.
The most important environmental risk factor is ambient air pollution which increases both the risk to develop and to die of IHD (Brook et al, 2010; Yamamoto et al, 2014). Exposure to ambient air pollution can reduce life expectancy up to several years and was responsible for approximately 24% of the global burden of IHD (in DALYs) in 2012 (WHO, 2014d). Household air pollution from cooking, heating and lighting with solid fuels is another major environmental risk for IHD. Cooking with solid fuels is practised by nearly
half of the world’s population (Bonjour et al, 2013), the resulting smoke consists of similar components as ambient air pollution, e.g. particulate matter, carbon monoxide and sulphur dioxide. It is thus likely to have similar effects on development and evolution of IHD (Uzoigwe et al, 2013). About 18% of the global burden of IHD was attributable to household air pollution (WHO, 2015d). Exposure to second-hand tobacco smoke increases cardiovascular disease (Dunbar et al, 2013; Kaur et al, 2004) and was estimated to account for 3.6% of global DALYs lost due to IHD (IHME, 2014).
Another environmental risk factor for IHD is exposure to lead. Occupational lead exposures, e.g. mining and processing industries, and non-occupational exposures to lead, e.g. traffic exhaust and lead in paint (Poreba et al, 2011), can increase blood pressure (Navas-Acien et al, 2007), which is the most important risk factor for IHD. Lead exposure was estimated to account for 4.0% of the global IHD burden (IHME, 2014).
Various other environmental exposures have been linked to IHD: high arsenic exposure in drinking-water nearly doubled disease risk (Moon et al, 2012). Furthermore, evidence has emerged linking persistent organic pollutants to the disease (Lind & Lind, 2012). Environmental noise from road or air traffic was shown to increase stress levels, heart rate, blood pressure and IHD (Argalasova-Sobotova et al, 2013; Ndrepepa & Twardella, 2011). The nature of the built environment may influence whether people engage in physical activity (Sallis et al, 2012). Low physical activity was estimated to account for 31% of global IHD burden (IHME, 2014). Additionally, cardiovascular events increase with both extremely hot and extremely cold temperatures (Cheng & Su, 2010; Kysely et al, 2009; Sun, 2010).
Working conditions have been associated with IHD also, including stress, for example through high demand and lack of social support (Pejtersen et al, 2014), working more than 55 hours per week (Kivimaki et
PREVENTING DISEASE THROUGH HEALTHY ENVIRONMENTS56

al, 2015), as well as occupational exposures to air pollution (Fang et al, 2010) and noise (Tomei et al, 2010). Psychosocial stress at work (high demand and low control) was found to increase the risk for IHD by 23%, and 3.4% of all IHD cases were attributed to this risk factor (Kivimaki et al, 2012). High versus low job insecurity was also associated with a 32% (9–59%) higher likelihood of IHD (Virtanen et al, 2013). Shift work increased coronary events by 24% and myocardial infarctions by 23% (Vyas et al, 2012). Sedentary behaviour, with sedentary work as a main component, was estimated to increase the risk of cardiovascular disease by 18% (Chomistek et al, 2013). In total, occupational risks accounted for 17% of deaths from IHD in Finland (Nurminen & Karjalainen, 2001). In the USA, about 12% of the IHD burden was related to occupation,
A coal-fired power station contributing to ambient air pollution.
for the age group 20–69 years (Steenland et al, 2003). The proportion of IHD cases attributable to workplace second-hand tobacco smoke exposure was estimated to range by country between 1–9% (Jaakkola & Jaakkola, 2006). In France, between 8.8% and 10.2% of IHD morbidity, and between 9.4% and 11.2% of IHD mortality, respectively, were estimated to be attributable to job strain in men (Sultan-Taieb et al, 2013).
In total, 35% (26–46%) of the total burden of IHD was attributed to the environment. Examples of interventions are provided in the section on stroke, as the same interventions may be efficient to decrease the risk of both cardiovascular diseases. These estimates are based on a combination of data from CRA type assessments (see Section 2 and Annex 3.2).
RESULTS: A SYSTEMATIC ANALYSIS OF FRACTIONS ATTRIBUTABLE TO THE ENVIRONMENT, BY DISEASE 57

Household air pollution Method: CRA
STROKE
Ambient air pollution Method: CRA
Second-hand tobacco smoke Method: CRA
Lead Method: CRA
Total environmental risksMethod: CRA
26% 25%
4% 5%
42%
Stroke is the second most important cause of global mortality, after IHD. Even though stroke mortality rates are decreasing, the global burden of ischaemic and haemorrhagic stroke increased significantly between 1990 and 2010 in terms of number of people affected, number of deaths and DALYs lost. Most of the disease burden from cerebrovascular disease occurs in LMIC (WHO, 2015d).
Risk factors for stroke are similar to those for IHD, with high blood pressure being the main risk factor for both ischaemic and haemorrhagic stroke, with an attributable risk of 68% (IHME, 2014). Other important risks include various dietary factors and active smoking (IHME, 2014).
As for IHD, different environmental factors contribute to the burden of cerebrovascular disease. Ambient air pollution has been
associated with increased hospital admissions and deaths from stroke (Galimanis et al, 2009). The evidence for an association between ischaemic stroke and both short-term and prolonged increased exposure to fine particles (PM2.5) is increasing (Brook et al, 2010; Burnett et al, 2014). Also, short-term exposure to increased ozone levels was associated with stroke incidence (Henrotin et al, 2007). In 2012, 25% of the global stroke burden (in DALYs) was attributable to ambient air pollution (WHO, 2015d).
Another important contributor to PM2.5 exposure is household air pollution mainly through cooking and heating with solid fuels. Accordingly, exposure to household air pollution has been associated with high blood pressure (Baumgartner et al, 2011). For the year 2012, 26% of stroke burden was attributable to household air pollution (WHO, 2015d).
Similar to active smoking, exposure to second-hand tobacco smoke is an important risk factor for cerebrovascular disease. A non-linear dose-response relationship has been described with substantial increases in risk already at low exposure levels. The increased risk for stroke incidence through exposure to second-hand tobacco smoke was 25%; from 16% for a daily exposure to five cigarettes up to 56% for daily exposure to 40 cigarettes (Oono et al, 2011). Second-hand tobacco smoke was estimated to account for 4% of global stroke burden in 2010 (IHME, 2014).
Occupational and environmental exposure to lead result in high blood pressure (Navas-Acien et al, 2007; Poreba et al, 2011), which is the most important risk factor for cerebrovascular disease. Lead exposure was estimated to account for 4.6% of global stroke burden in 2010 (IHME, 2014).
Physical activity, e.g. active commuting to work, has been shown to both decrease the risk for haemorrhagic and ischaemic stroke. Moderately intense physical activity compared with inactivity lowered total
PREVENTING DISEASE THROUGH HEALTHY ENVIRONMENTS58

stroke risk by 15–36% (Wendel-Vos et al, 2004). Higher risk reductions were observed at higher levels of physical activity (Hu et al, 2005). Low physical activity was estimated to account for 9% of global stroke burden in 2010 (IHME, 2014). Additionally, high residential traffic exposure as well as road traffic noise were associated with hypertension (Fuks et al, 2014; van Kempen & Babisch, 2012).
Occupational risks also play an important role in stroke burden: shift work and workplace exposure to second-hand tobacco smoke significantly increased stroke (Jaakkola & Jaakkola, 2006; Vyas et al, 2012), as well as long working hours (more than 55 hours per week) (Kivimaki et al, 2015). The proportion of stroke cases attributable to workplace second-hand tobacco smoke exposure was estimated to range by country between 1–24% (Jaakkola & Jaakkola, 2006). In Finland, it was estimated that occupational risks accounted for 11% of the deaths from stroke (Nurminen & Karjalainen, 2001). Additionally,
SELECTED INTERVENTIONS FOR CARDIOVASCULAR DISEASES
• Tobacco smoke-free legislation reduced the exposure to second-hand tobacco smoke (Callinan et al, 2010). Furthermore, the risk of acute coronary events decreased by 10% (pooled relative risk 0.90, 95% CI: 0.86–0.94) (Mackay et al, 2010). The effect was larger in the younger and non-smoking population (Meyers et al, 2009). Banning second-hand tobacco smoke in the workplace let to improvements in cardiac health (Jaakkola & Jaakkola, 2006).
• Provision of improved cookstoves lead to reductions in household air pollution and significantly reduced diastolic blood pressure (McCracken et al, 2007). Further interventions and strategies to reduce exposure to smoke from solid fuel combustion are provided in the WHO indoor air quality guidelines (WHO, 2014ee).
• Various environmental interventions, including urban planning and access to sports facilities, increased physical activity and thereby lowered the risk for NCDs including ischaemic heart disease and stroke (Brownson et al, 2006).
• A review of interventions and events that led to the reduction of air pollution showed that most of these interventions have been associated with health benefits, mainly via respiratory and cardiovascular mortality/morbidity. Examples for reduction of cardiovascular mortality include the reduction of sulphur content in fuel in Hong Kong in 1990, and the Irish coal ban in 1990. Other interventions have shown significant reductions in various air pollutants related to respiratory and cardiovascular health impacts, such as the European air emission policies (1990–2005), the London Congestion Charging Scheme and the Stockholm Congestion Charging Trial (Henschel et al, 2012). Many more approaches have been used to reduce air pollution levels, such as the replacement of older diesel vehicles, increased use of public transport, industrial emission control, and use of modern energy sources for domestic cooking and heating.
job strain resulting from high workload and few decision-making opportunities in the workplace is associated with hypertension (Babu et al, 2014; Rosenthal & Alter, 2012) and some professions are especially prone to elevated blood pressure levels (Kales et al, 2009).
Links to various other environmental risks have been suggested for increased risk of stroke or hypertension (a major stroke risk factor), including chemicals such as PCBs, dioxins, phthalates, pesticides; and radiation (Bernal-Pacheco & Roman, 2007; Shiue, 2013). High arsenic levels in drinking-water have also been linked to increased risk of stroke (Moon et al, 2012), and arsenic exposure has furthermore been linked to hypertension (Abhyankar et al, 2012).
Globally, 42% (24–53%) of the total burden of stroke was attributed to the environment. These estimates are based on a combination of data from CRA type assessments (see Section 2 and Annex 3.2).
RESULTS: A SYSTEMATIC ANALYSIS OF FRACTIONS ATTRIBUTABLE TO THE ENVIRONMENT, BY DISEASE 59
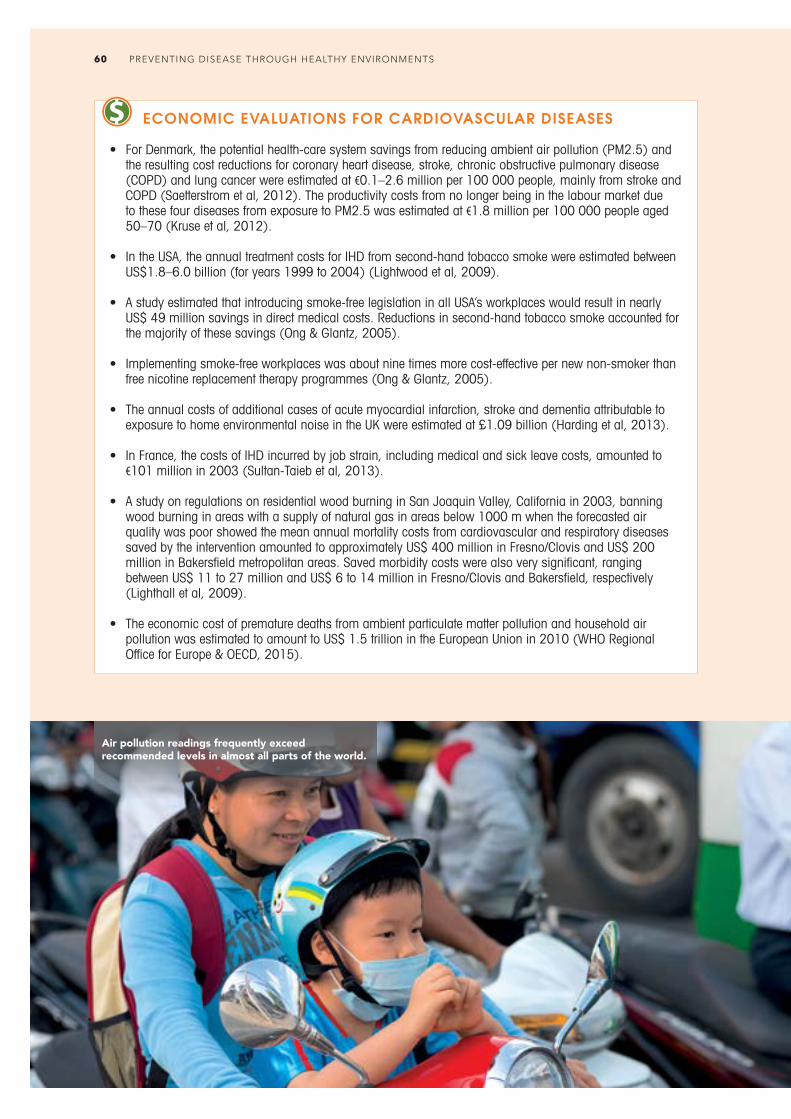
ECONOMIC EVALUATIONS FOR CARDIOVASCULAR DISEASES
• For Denmark, the potential health-care system savings from reducing ambient air pollution (PM2.5) and the resulting cost reductions for coronary heart disease, stroke, chronic obstructive pulmonary disease (COPD) and lung cancer were estimated at €0.1–2.6 million per 100 000 people, mainly from stroke and COPD (Saetterstrom et al, 2012). The productivity costs from no longer being in the labour market due to these four diseases from exposure to PM2.5 was estimated at €1.8 million per 100 000 people aged 50–70 (Kruse et al, 2012).
• In the USA, the annual treatment costs for IHD from second-hand tobacco smoke were estimated between US$1.8–6.0 billion (for years 1999 to 2004) (Lightwood et al, 2009).
• A study estimated that introducing smoke-free legislation in all USA’s workplaces would result in nearly US$ 49 million savings in direct medical costs. Reductions in second-hand tobacco smoke accounted for the majority of these savings (Ong & Glantz, 2005).
• Implementing smoke-free workplaces was about nine times more cost-effective per new non-smoker than free nicotine replacement therapy programmes (Ong & Glantz, 2005).
• The annual costs of additional cases of acute myocardial infarction, stroke and dementia attributable to exposure to home environmental noise in the UK were estimated at £1.09 billion (Harding et al, 2013).
• In France, the costs of IHD incurred by job strain, including medical and sick leave costs, amounted to €101 million in 2003 (Sultan-Taieb et al, 2013).
• A study on regulations on residential wood burning in San Joaquin Valley, California in 2003, banning wood burning in areas with a supply of natural gas in areas below 1000 m when the forecasted air quality was poor showed the mean annual mortality costs from cardiovascular and respiratory diseases saved by the intervention amounted to approximately US$ 400 million in Fresno/Clovis and US$ 200 million in Bakersfield metropolitan areas. Saved morbidity costs were also very significant, ranging between US$ 11 to 27 million and US$ 6 to 14 million in Fresno/Clovis and Bakersfield, respectively (Lighthall et al, 2009).
• The economic cost of premature deaths from ambient particulate matter pollution and household air pollution was estimated to amount to US$ 1.5 trillion in the European Union in 2010 (WHO Regional Office for Europe & OECD, 2015).
Air pollution readings frequently exceed recommended levels in almost all parts of the world.
PREVENTING DISEASE THROUGH HEALTHY ENVIRONMENTS60

Household air pollution Method: CRA
24%
Occupational risks Method: CRA
12%
Ambient air pollution Method: CRA
9%
Ozone Method: CRA
3%
Total environmental risks Method: CRA
35%
CHRONIC OBSTRUCTIVE PULMONARY DISEASE
Chronic obstructive pulmonary disease, a slowly progressing disease characterized by a gradual loss of lung function, caused 3.6% of overall global disease burden (in terms of DALYS) in 2012 (WHO, 2015d).
The most important risk factor is active smoking, estimated to contribute to 37% of the global COPD burden in 2010 (IHME, 2014). However, around one third of patients with COPD never smoked (Salvi & Barnes, 2009). Most other risk factors are environmental or occupational, including dusts and chemicals in the workplace, air pollution and second-hand tobacco smoke.
Ambient and household air pollution are associated with the development of COPD (Kurmi et al, 2010), causing a chronic inflammatory response in the airways and the lung (Ling & van Eeden, 2009)
introducing remodelling and destruction of lung tissue (Baraldo et al, 2012). Exposure to smoke from biomass fuels combustion is considered as the main risk factor for COPD in poor rural areas (Salvi & Barnes, 2009; Tan, 2011), especially for women (Po et al, 2011). Additionally, air pollution can trigger acute exacerbation and increased hospital admissions and mortality in patients with chronic COPD (Ko & Hui, 2012). Ambient air pollution was estimated to cause 9% and household air pollution 24% of the COPD burden in 2012 in DALYs (WHO, 2015d). Ozone, which can increase airway inflammation and can lead to a deterioration of lung function and gas exchange (Jerrett et al, 2009), was estimated to cause 3.1% of the COPD disease burden (DALYS) in 2010 (IHME, 2014). Second-hand tobacco smoke has also been linked to COPD (Zhou & Chen, 2013).
Antenatal and childhood exposure to household and ambient air pollution and second-hand tobacco smoke is associated with reduced lung function and predisposition to develop COPD in later life (Narang & Bush, 2012; Stocks & Sonnappa, 2013). Air pollution and second-hand tobacco smoke have furthermore been linked to adverse pregnancy outcomes like low birth weight and preterm birth which are in turn associated with reduced lung function in children and predisposition for COPD (Salvi & Barnes, 2009; Stocks & Sonnappa, 2013).
A substantial part of the COPD disease burden is attributable to occupation, e.g. from particulate matter, gases and fumes. It has been estimated that 12% of the overall COPD disease burden (DALYS) (IHME, 2014) and 31% (Salvi & Barnes, 2009) to 40% (Blanc, 2012) of COPD cases in those who have never smoked are attributable to the workplace.
Occupations with high risk for COPD are for example coal and hard-rock mining (Cohen et al, 2008; Santo Tomas, 2011), metal smelting (Soyseth et al, 2013), tunnel
RESULTS: A SYSTEMATIC ANALYSIS OF FRACTIONS ATTRIBUTABLE TO THE ENVIRONMENT, BY DISEASE 61

and construction work and manufacture of concrete, plastic, textile (Lai & Christiani, 2013), rubber, leather and food products, transportation and trucking (Hart et al, 2012) automotive repair, some personal services (e.g. beauty care) and farming (Poole, 2012; Salvi & Barnes, 2009). Additionally, second-hand tobacco smoke exposure in the workplace is a considerable risk to health (Eisner 2010) and it was estimated that workplace exposure increases the risk for COPD by 36% in certain settings in the groups with highest exposures to the unexposed (Jaakkola & Jaakkola, 2006).
Globally, it was estimated, based on combination of data from CRA types of assessments (see Section 2 and Annex
3.2), that 35% (20–48%) of the COPD disease burden could be attributed to the environment. The population attributable fractions for COPD risk factors vary significantly between countries and by gender, a result of differences in the main risk factors to which people are exposed. In countries where solid fuel is widely used in homes for cooking or heating, indoor smoke levels can be high, and mean population attributable fractions often exceeded 30%, with higher values for women than for men. In higher income regions, with little reliance on burning solid fuel in the home, mean population attributable fractions were generally between 5% and 15%, with higher values for men because of occupational exposures to smoke.
Workers wearing protection against dust particles in a cement factory.
PREVENTING DISEASE THROUGH HEALTHY ENVIRONMENTS62
ECONOMIC EVALUATIONS OF INTERVENTIONS TO REDUCE COPD AND OTHER RESPIRATORY CONDITIONS
• A cost-effectiveness analysis of installing natural gas as an alternative to using biomass fuels in rural communities on the Colombian Caribbean coast estimated that the costs of preventing one death from COPD or acute lower respiratory infections are US$ 56 000 (US$ 22 000–74 000) and preventing one DALY between US$ 43–66 (Alvis-Guzman et al, 2008).
• In Taiwan, China, the total health damage from air pollution (particulate matter) was estimated to amount to 2.4–4.9% of the city’s GDP (or 1.7 billion Yuan) in 2000. Scenarios assuming use of cleaner fuels and infrastructure changes to heating systems could have prevented 200 to 1100 PM10 related prema-ture deaths in 2010 and substantially reduce population morbidity (D. Zhang, K. Aunan et al, 2010).
• For Mumbai, India, the total monetary burden of health impacts, including personal burden, government expenditure and societal cost of respiratory symptoms and illnesses such as allergic rhinitis and chronic obstructive pulmonary disease was estimated at US$ 113 million for a 50-mg/m3 increase in PM10, and US$ 218 million for a similar increase in NO2 (Lim et al, 2012; Patankar & Trivedi, 2011).
• For Barcelona, Spain, reducing PM10 exposure from 50 mg/m3 to 20 mg/m3 was estimated to lead to 3500 fewer deaths, 1800 fewer hospitalizations for cardio-respiratory diseases, 5100 fewer cases of chronic bronchitis among adults, 31 100 fewer cases of acute bronchitis among children, and 54 000 fewer asthma attacks among children and adults. The mean total monetary benefits were estimated to be €6400 million per year (Perez et al, 2009).
• A household-level cost-benefit analysis in Nepal, Kenya and Sudan suggested that different household energy interventions provided economic returns between 19–429% to the households over a 10-year intervention period. The returns derived mostly from time and fuel cost savings (Malla et al, 2011). An earlier cost-benefit analysis with a societal perspective showed that investments in household energy interventions can be highly cost-beneficial and, in some cases, result in cost-savings (Hutton et al, 2006). Other economic evaluations of NGO programmes in different African countries support these findings (Habermehl, 2007; Renwick et al, 2007).
• In the Hong Kong SAR, China, population of 6.5 million in 1998, the annual direct costs of medical care, long-term care and productivity loss were estimated at US$ 156 million for second-hand tobacco smoke (McGhee et al, 2006).
• See the additional example from Denmark in the box on stroke.
SELECTED INTERVENTIONS
• An intervention in rural China, that improved kitchen ventilation and promoted the use of clean fuels among people using biomass, led to a significant reduction of decline in FEV1 (forced expiratory volume at intervals of one second – a test of pulmonary function), and risk of COPD in long-term follow-up (Zhou et al, 2014).
• In rural Guatemala a randomized intervention trial comparing health effects in chimney stove and open fire users found 62% reduced carbon monoxide exposure, reductions in all respiratory symptoms in the chimney stove group but no significant effects on lung function after 12–18 months (Smith-Sivertsen et al, 2009).
• Legislative smoking bans are effective in reducing exposure to second-hand tobacco smoke both in public and in workplaces (Brownson et al, 2006; Callinan et al, 2010).
• Based on 90 studies that compared exposure with and without control measures in workplaces, the average percentage reduction of exposure to risks causing occupational disease and injury was 50% (4–74%) for enclosures of sources of pollution; 82% (78–84%) for local exhaust ventilation; 87% (73–94%) for specialized ventilation systems; 43% (17–61%) for general ventilation; 83% (77–88%) for dust suppression techniques; and 87% (71–95%) for separation of workers. These exposure reductions can reduce work-related cancer, pneumoconiosis, COPD, asthma and various other respiratory diseases (Verbeek & Ivanov, 2013).
RESULTS: A SYSTEMATIC ANALYSIS OF FRACTIONS ATTRIBUTABLE TO THE ENVIRONMENT, BY DISEASE 63

Asthma, an inflammatory respiratory condition, is a major cause of disability, health-care utilization and reduced quality of life and accounts for approximately 0.9% of global overall disease burden (WHO, 2015d). Among adults, diagnosed asthma was estimated in 4.3% of the population, globally (To et al, 2012). In children, asthma is one of the most important chronic diseases, with a mean of 14% of children around the world reporting current asthma symptoms (Pearce et al, 2007).
Genetic predisposition is one major asthma determinant (Moffatt et al, 2010). However, large geographic differences and important recent time trends in asthma occurrence are likely to be in part due to variations in environmental factors (Eder et al, 2006; Heinrich 2011; Tinuoye et al, 2013). The pathogenesis of asthma can start as early as in utero and both asthma development and exacerbation can be triggered by different indoor and outdoor environmental exposures.
Air pollution induces oxidative stress leading to inflammatory responses in the airways and bronchial hyper-reactivity, typical features of asthma (Auerbach & Hernandez, 2012). There is strong evidence that acute increases of ambient air pollution provoke asthma exacerbations and increase hospital admissions in adults and children (Anderson et al, 2013; Dick et al, 2014; Jacquemin et al, 2012). Long-term exposure to ambient air pollution, e.g. from motor vehicle exhaust, was furthermore associated with asthma
development in both children and adults (Anderson et al, 2013; Gasana et al, 2012; Searing & Rabinovitch, 2011; Takenoue et al, 2012). Also, ozone exposure has been linked to acute reductions in lung function (Brown et al, 2008).
In cold and temperate climates, indoor pollutants are likely to be even more important than those outdoors as more time is spent indoors (Heinrich, 2011). Household air pollution, e.g. particulate matter or NO2 from biomass smoke or living close to busy roads, was associated with increased asthma symptoms and morbidity both in children and adults (Breysse et al, 2010; Trevor et al, 2014).
The population attributable fraction for incident asthma in preschool Canadian children from both indoor and ambient PM10, PM2.5 and NO2 were estimated at 11%, 1.6% and 4.0% respectively (Simons et al, 2011).
Another important indoor pollutant, second-hand tobacco smoke, is believed to detrimentally affect lung growth and development already prenatally (Wang & Pinkerton, 2008). Exposure in unborn children has furthermore been associated with increased wheezing, asthma exacerbations and asthma incidence in childhood (Burke et al, 2012). About 40% of children are exposed to second-hand tobacco smoke in their homes (Öberg et al, 2011). There is consistent evidence for a modest association between exposure to second-hand tobacco smoke and clinically confirmed childhood asthma (Tinuoye et al, 2013). Also increased asthma occurrence and morbidity in adults has been linked to exposure to second-hand tobacco smoke (Eisner, 2008). The population attributable fraction for incident asthma in preschool Canadian children from second-hand tobacco smoke was 2.9% (Simons et al, 2011). Population attributable fractions for asthma in different European countries and the USA from exposure to second-hand tobacco smoke in the workplace alone was estimated between 1–29% (most countries between 10–20%) (Jaakkola & Jaakkola, 2006).
Occupational risks Method: CRA
ASTHMA
Total occupational risks, indoor and ambient air pollutants Method: expert survey
9% 44%
PREVENTING DISEASE THROUGH HEALTHY ENVIRONMENTS64

Many other environmental exposures have been linked to asthma. Indoor mould is common, with about 5–30% of homes being affected (Quansah et al, 2012). Indoor mould and dampness are associated with increased asthma symptoms and also new asthma cases in children and adults across different countries (Antova et al, 2008; Dick et al, 2014; Quansah et al, 2012; Tischer et al, 2011). It was estimated that 21% of asthma cases in the USA are attributable to mould and dampness at home (Mudarri & Fisk, 2007) and 6% in the Netherlands (Schram-Bijkerk et al, 2013). Other environmental exposures include formaldehyde (McGwin et al, 2010) and phthalates (Jaakkola & Knight, 2008). Also allergen exposure, e.g. from dust mites, pollens, cockroach or mice, is associated with increased asthma exacerbations in childhood (Dick et al, 2014). Between 6.5% and 13% of incident asthma in preschool Canadian children was attributed to exposure to cockroach and mouse allergens, respectively (Simons et al, 2011). However, other surroundings might offer a protective effect: a farming environment was associated with a decrease in doctor-diagnosed asthma and current wheeze by 25% (Genuneit, 2012).
Work-related asthma is among the most frequent occupational diseases (Baur, Aasen et al, 2012). It was estimated that around 18% of all adult-onset asthma is caused by occupational factors (Toren & Blanc, 2009) and that around 22% of adults with asthma suffer from work-exacerbated asthma (Henneberger et al, 2011). A large quantity of agents in the workplace is supposed to be responsible for the development of the disease (Baur, Bakehe & Vellguth, 2012). Those can be grouped as allergens and irritants and include, amongst many others, cleaning agents, disinfectants, isocyanides, enzymes, coffee, flour, animals and green house allergens, wood dust, colophony, latex and metals (Folletti et al, 2014; Moscato et al, 2011; Perez-Rios et al, 2010; Vandenplas et al, 2011). Occupational exposures were estimated to account for about 9% of the total disease burden from asthma (IHME, 2014).
Total environmental exposures were estimated to account for 44% (26–53%) (expert survey 2005, see Section 2). The estimate for environmental exposures did not include outdoor exposure to pollen, as this is not realistically modifiable.
Asthma is a major chronic disease in children – with 14% affected globally.
RESULTS: A SYSTEMATIC ANALYSIS OF FRACTIONS ATTRIBUTABLE TO THE ENVIRONMENT, BY DISEASE 65
SELECTED INTERVENTIONS
• Repairing mould-damaged houses and offices led to a reduction of asthma-related symptoms in adults; amongst other symptoms a reduction of wheezing by around 36% (25–45%). Similar remediation work in schools decreased pupil visits to physicians due to common cold (Sauni et al, 2013). Interventions decreasing the exposure to house dust reduced physician-diagnosed asthma in high-risk children by around 26% (5–42%) without reducing parental-reported wheeze or symptoms in existing disease (MacDonald et al, 2007).
• Current evidence does not support singular measures against dust mite exposure (Arroyave et al, 2014; Gotzsche & Johansen, 2008) but interventions reducing several environmental asthma triggers demonstrated beneficial effects on asthma morbidity (Crocker et al, 2011; Matsui, 2013; Rao & Phipatanakul, 2011; Wright & Phipatanakul, 2014).
• Smoke-free legislation reduced hospital attendance for childhood asthma by about 10% (Been et al, 2014).
• Removing people with occupational asthma from the relevant exposure was associated with beneficial effects on asthma symptoms and lung function (people removed from exposure were 21 times (7–64) more likely to report an absence of asthma symptoms and experienced a mean improvement of lung function of nearly 6% (3–8%) (de Groene et al, 2011). Reduction of exposure was also associated with beneficial effect on symptoms. However, the effect size was smaller and there was no improvement of lung function compared with workers that remained exposed (de Groene et al, 2011; Vandenplas et al, 2011). Eliminating exposure to asthma allergens was also effective for the primary prevention of occupational asthma (Heederik et al, 2012). However, certain causes of occupational asthma, in particular chemicals, can be more difficult to identify (Baur, Aasen et al, 2012; Cullinan & Newman Taylor, 2010).
• A review of interventions and events that led to the reduction of air pollution showed that most of these interventions have been associated with health benefits, mainly by the way of respiratory and cardiovascular mortality/morbidity. Examples for reduction of asthma incidence or related health-care visits include the closure of a steel mill in Utah Valley, USA; and measures to reduce traffic congestion during the 1996 Summer Olympic Games in Atlanta, USA. Additional interventions leading to better air quality have been documented, such as the European air emission policies (1990–2005), the London Congestion Charging Scheme and the Stockholm Congestion Charging Trial (Henschel et al, 2012). Many more interventions are available to reduce air pollution levels, such as the replacement of diesel vehicles, increased use of public transport, industrial emission control, and use of modern energy sources for domestic cooking and heating.
ECONOMIC EVALUATIONS
• The total present value costs for all cases of occupational asthma in the UK in 2003 were estimated at between £95 and £135 million with the largest economic burden born by the state and the individual (Ayres et al, 2011).
• The annual childhood asthma-related costs attributable to air pollution in two USA communities were large (estimated at US$ 18 million) and mainly borne by the children’s families (Brandt et al, 2012). Exposure to PM2.5 was positively associated with increased costs of childhood asthma hospitalizations (Roy et al, 2011).
• Dampness and mould exposure in the home was estimated to lead to US$ 3.5 billion annual asthma costs in the USA (Mudarri & Fisk, 2007).
• Different environmental interventions were judged as cost-effective strategies against asthma, including housing interventions (Edwards et al, 2011), multi-component interventions reducing a range of indoor asthma triggers (Nurmagambetov et al, 2011) and environmental education (Jassal et al, 2013; Nguyen et al, 2011).
• Cost of illness from asthma during childhood attributable to the environment amounted to US$ 1 550 million in the EU in 2008 (Bartlett & Trasande, 2014).
PREVENTING DISEASE THROUGH HEALTHY ENVIRONMENTS66

Low back painMethod: CRA
MUSCULOSKELETAL DISEASES
Occupational risks, domestic risksMethod: CRA and expert survey
26% 17%
The main musculoskeletal diseases included in this study were rheumatoid arthritis, osteoarthritis, back and neck pain and gout. These are part of a group of 150 musculoskeletal conditions affecting millions of people globally (WHO, 2003b). These conditions are common, often progressive and associated with pain.
Low back pain has been associated with ergonomic stressors at work, and it was estimated that occupational exposures account for 26% (17–36%) of the burden of low back pain (Lim et al, 2012). The mean population attributable fraction was higher for men than for women (30% versus 21%) because men are more frequently engaged in occupations that expose them to risk. Occupational groups at highest risk of low back pain include farmers, forestry workers and fishermen, production and related workers, and service workers (Driscoll et al, 2014). Several risks in the work environment have been found to be associated with higher rates of neck pain, including high job demands and low social/work support, job insecurity, poor computer workstation design and work posture, sedentary work position, repetitive and precision work, and prolonged sitting at work (Côté et al, 2008; McLean et al, 2010). Domestic water carrying, mainly performed by women and children in Africa, has also been related to spinal pain (Geere et al, 2010).
Osteoarthritis has been associated with joint injury, obesity and occupational activity, all of which have an environmental component
(Richmond et al, 2013). Occupational activities associated with increased risk included for example heavy lifting, using vibrating tools, kneeling or exposure to cramped space. Rheumatoid arthritis has been associated with proximity to traffic, and exposures to air pollutants and vibrations (Hoovestol & Mikuls, 2011; Olsson et al, 2004). It was estimated that environmental factors account for 17% (6–31%) of the disease burden from rheumatoid arthritis and 20% (11–29%) of that from osteoarthritis (expert survey 2005, see Section 2).
The group of “other musculoskeletal diseases” includes other forms of arthritis, arthropaties, joint disorders, systemic connective tissue disorders, muscle and soft tissue disorders. Evidence indicates that these diseases are also linked to occupational conditions. Overall, it was estimated that 15% (6–24%) of the disease burden of the group of musculoskeletal diseases was attributable to occupational risk factors (CRA and expert survey).
Second-hand tobacco smoke and other air pollutants, chemicalsMethod: expert survey
CONGENITAL ANOMALIES
5%
An estimated 6% of global infant deaths are due to congenital anomalies (Higashi et al, 2015). Congenital anomalies include chromosomal conditions, like Down and Edward syndrome, and non-chromosomal conditions, like different congenital organ defects (Loane et al, 2011; WHO, CDC & ICBDSR, 2014).
Second-hand tobacco smoke exposure in non-smoking pregnant women was
RESULTS: A SYSTEMATIC ANALYSIS OF FRACTIONS ATTRIBUTABLE TO THE ENVIRONMENT, BY DISEASE 67
estimated to increase the overall risk for congenital malformations, particularly heart defects, limb-reduction defects, kidney/urinary tract defects, and cleft lip and palate defects, by 13% (Leonardi-Bee et al, 2011). There are, furthermore, potential links between prenatal exposure to pesticides, organic solvents and air pollution and congenital heart disease (Gorini et al, 2014; Vrijheid et al, 2011), exposure to some endocrine disrupting chemicals and cryptorchidism and hypospadias (DiVall, 2013; Virtanen & Adamsson, 2012), pesticide exposure and urinary malformations (Hei & Yi, 2014). Prenatal exposure might further influence male (DiVall, 2013; Meeker, 2012; Vested et al, 2014) and female (Fowler et al, 2012) reproductive health (Snijder et al, 2012). However, evidence on many of these linkages is still limited.
It was estimated that 5% (1–10%) of all congenital anomalies were attributable to environmental causes (estimate based on expert survey 2005, see Section 2).
SELECTED INTERVENTIONS
• The European (EUROCAT and EUROPLAN) “Recommendations on Policies to Be Considered for the Primary Prevention of Congenital Anomalies in National Plans and Strategies on Rare Diseases” list evidence-based actions for the reduction of congenital anomalies in Europe and include reduction of exposures to methylmercury, second-hand tobacco smoke and endocrine disruptors (Taruscio et al, 2014).
OTHER NONCOMMUNICABLE DISEASES
Links of other NCDs to environmental exposure have been documented. For example, chronic kidney diseases have been linked to exposure to lead in various settings (Ekong et al, 2006; Muntner et al, 2003; Patrick, 2006), and the fraction of chronic kidney diseases attributable to lead has been quantified at 2.5% (IHME, 2014). Exposure to lead also affects other cardiovascular diseases, causing 9% of hypertensive heart disease, 2% of rheumatic heart disease and 3% of other cardiovascular diseases worldwide (IHME, 2014). Certain occupations are at increased risk of skin diseases, for example workers frequently handling liquids and chemical substances, such as hairdressers, nurses, cleaners or metal workers (Behroozy & Keegel, 2014). Pneumoconiosis, including silicosis, asbestosis and coal-workers’ pneumoconiosis are additional chronic respiratory diseases, of largely occupational origin, causing 260 000 deaths per year (GBD 2013 Mortality Causes of Death Collaborators, 2015).
Not all diseases or disease groups have been included in this analysis, either because they were not significantly linked to the modifiable environment under the definition used, or because the evidence was too incomplete to make a reasonable estimate. Examples of diseases that have not been considered here include for example anaemia, iodine deficiency, several skin diseases, diabetes and endocrine or immune disorders, although certain links with the environment have been established.
PREVENTING DISEASE THROUGH HEALTHY ENVIRONMENTS68

RISKS FACTORS FOR NONCOMMUNICABLE DISEASES FROM OTHER AREAS BUT RELATED TO THE ENVIRONMENTCertain risk factors are strongly related to NCDs, and can be modulated by favourable environments. Overweight, obesity and physical activity are examples of such risks which can be influenced by the physical environment and occupational conditions, but which are not an integral part of the environment as they are also linked to lifestyle.
OVERWEIGHT AND OBESITY
Overweight refers to a condition of people with a body mass index (BMI) between 25 and 30 kg/m3, and obesity to a condition where BMI is greater or equal 30 kg/m3.
In 2014, 39% of adults aged 20 years and above were overweight, and 13% were obese (WHO, 2015i). 42 million children under five years were overweight or obese in 2013. Overweight and obesity are major risk factors of NCDs such as cardiovascular diseases, diabetes, musculoskeletal disorders and certain cancers (WHO, 2014l; WHO 2015i).
Overweight and obesity are caused by an increased intake of energy-dense food, and also lack of physical activity and sedentary lifestyle (WHO, 2015i). Links between physical activity and the built environment, such as urban densities, street connectivity, pavements and other
Cycling has multiple benefits, including improved health and better air quality.
RESULTS: A SYSTEMATIC ANALYSIS OF FRACTIONS ATTRIBUTABLE TO THE ENVIRONMENT, BY DISEASE 69

infrastructure facilitating walking, cycling, public transport and less car travel, and policies to increase space for recreational activity have been documented (Lopez & Hynes, 2006; O Ferdinand et al, 2012; WHO, 2009b; WHO 2011c). The home physical environment (TV limiting devices, physical activity devices) also shows an influence on physical activity levels (Kaushal & Rhodes, 2014). Physical activity can prevent several health outcomes and is further covered in a specific section in this document.
The creation of food environments that support healthy diets are also an essential component of population-wide childhood obesity prevention strategies. Policies that influence food environments may include government or local authority policies on land use, agriculture, food manufacturing and distribution, food marketing, food retail and food services (WHO, 2012g).
Schools and workplaces are settings where interventions promoting healthy diets and physical activity have been effective. Comprehensive, multi-component programmes include the provision of healthy foods options and beverages in the setting, and physical activity options or programmes (WHO, 2009b).
Occupation-related physical activity is another factor associated with obesity. Demands of physical activity at work were shown to have fallen drastically during the last decades in various regions of the world (Church et al, 2011; Ng et al, 2014). On the basis of a large population survey conducted over decades in the USA (US National Health and Nutrition Examination Survey – NHANES) it was estimated that between 1960–1962 and 2003–2006, the estimated mean daily calorie expenditure has dropped by more than 100 calories per day, which would induce a weight gain of more than 10 kg in certain age groups, corresponding to the weight gain observed during the same period (Church et al, 2011).
EXAMPLES OF INTERVENTIONS
• High-intensity school-based interventions that focus on diet and/or physical activity and are multi-component, including: – Curriculum on diet and/or physical
activity taught by trained teachers; – Supportive school environments/ policies;
and– Healthy food options available through
school food services, such as the cafeteria or vending machines.
• Multi-component programmes in the workplace, including provision of healthy food and beverages at workplace facilities (WHO, 2009b, 2012g).
• In Beijing, China, a nutrition education and physical activity intervention involving children and their parents resulted in overweight prevalence being 9.8% in intervention schools as compared with 14.4% in control schools, and obesity being 7.9% compared with 13.3%, respectively. The intervention included the provision of educational materials to parents, classroom lessons on obesity, and a physical activity component.
Climate change may lower the nutritional quality of dietary intake, exacerbate obesity and amplify health inequalities (Lake et al, 2012). The links between the environment and overweight/obesity have to date been relatively poorly documented.
PHYSICAL INACTIVITY
Physical inactivity is an important risk factor for NCDs, including ischaemic heart disease and stroke, cancers of the breast, colon and rectum, and diabetes mellitus. Through these diseases, insufficient physical activity causes 6.0% of all deaths globally (Lim et al, 2012). It was estimated that 23% of adults and 81% of adolescents globally are insufficiently active, which is defined as less than 150 minutes of moderate-intensity activity per week, or equivalent (WHO, 2015d). This means
PREVENTING DISEASE THROUGH HEALTHY ENVIRONMENTS70

that one third of the global population gets insufficient physical activity to protect them from the associated risks. In most regions of the world, inactivity is on the rise (Ng & Popkin, 2012).
Physical activity may take place at work, during transportation, while performing domestic tasks or during leisure time. Factors that have negatively affected the levels of physical activity include increased use of machinery to alleviate household and occupational tasks, and policies and practices leading to more motorized transport and less walking and cycling (Ng & Popkin, 2012). Also policies supporting decentralized land use, low urban density or low connectivity may contribute to reduced physical activity (Frumkin, 2002; Ng & Popkin, 2012).
With development, the spread of labour-saving technology in the workplace, and the shift away from agriculture to manufacturing and service sectors have been contributing to physical inactivity (Ng & Popkin, 2012). In China, for example, mean occupational physical activity has declined by 33% in men and 42% in women, respectively, between 1991 and 2011 (based on data from nine provinces) (Ng et al, 2014). Occupation is the greatest contributor of physical activity in China, accounting for more than 85% of all physical activity in men and 70% in women in 2011. Reduction in occupational physical activity alone has therefore led to an overall reduction of physical activity of 31% in men and 36% in women, respectively, between 1991 and 2011 in China (data from the Chinese Health and Nutrition survey cohort of 22 000 individuals from nine provinces followed over 20 years) (Ng et al, 2014). Occupational factors such as high job strain or passive jobs may also lead to less physical activity, suggesting a spill-over effect on leisure-time physical activity (Fransson et al, 2012). In the USA the occupational demands on physical activity have dropped significantly during the last decades also (Church et al, 2011).
Travel mode, transport infrastructure and favourable land-use patterns are also closely related to physical activity. More infrastructure facilitating walking, cycling, public transport use and less car travel have been associated with increased physical activity in numerous studies (WHO, 2011c). For example, active school transport has shown significantly higher levels of physical activity in 82% of studies reviewed in a systematic review of 68 studies (Larouche et al, 2014). Objectively measured walkability was most consistently correlated with measures of physical activity for transport (Grasser et al, 2013). Higher urban densities, less sprawl, land-use diversity (e.g. mixed residential/commercial areas), and the availability of green parks and open spaces have been associated with increased physical activity levels in numerous studies (WHO, 2011c). Furthermore, active transport options often bear multiple other co-benefits to health by reducing ambient air pollution and climate change.
The benefits of physical activity are recognized as important for all age groups.
RESULTS: A SYSTEMATIC ANALYSIS OF FRACTIONS ATTRIBUTABLE TO THE ENVIRONMENT, BY DISEASE 71
EXAMPLES OF INTERVENTIONS
• Environmental interventions targeting the built environment, policies that reduce barriers to physical activity, transport policies to increase space for recreational activity.
• Multi-targeted approaches to encourage walking and cycling to school, healthier commuting and leisure activities.
• Some decades ago, the city of Bogotá, Colombia, launched an initiative of vast environmental transformation, including the provision of pathways for non-motorized transport and an improved public transport system. It is combined with weekly limits on the access of motorized transport. The prevalence of people travelling by car has dropped from 17% to 12% during peak times.
• School-based multi-component programmes focusing, for example, on physical activity taught by trained teachers, supportive school environments/policies and physical activity programmes have shown to be effective.
• Multi-component interventions which include, for example, the provision of space for fitness or signs to encourage the use of stairs were shown to be effective.
WHO, 2009b, 2013g.
The prevalence of physical inactivity can therefore be modulated through the workplace and the environment, alongside behavioural, cultural and societal factors, via factors that induce or encourage physical activity (Kohl et al, 2012; WHO, 2014w). Environmental and policy interventions that may foster physical activity may address: (a) compact land uses, with a mix of destinations in close proximity; (b) active transport policy and practices, with cycle and pedestrian facilities and site designs, such as pavements, safe crossings or bicycle paths; (c) access to places for physical activity, such as fitness equipment in parks, with informational outreach; and (d) safety and access for all users (de Nazelle et al, 2011; Fenton, 2012; Heath et al, 2012). Promotion of physical activity through occupational health services and work organization was also shown to be promising (Kwak et al, 2014).
PREVENTING DISEASE THROUGH HEALTHY ENVIRONMENTS72

UNINTENTIONAL INJURIES
Globally, road traffic injuries are the largest cause of injury deaths, causing 1.25 million deaths per year (WHO, 2015d). Almost half of all deaths on the world’s roads are among those with the least protection – motorcyclists, cyclists and pedestrians (WHO, 2015e). Key risk factors for road traffic injuries include speeding, alcohol impairment, non-use of helmets, non-use of seat belts and child restraints, inadequate visibility of pedestrians and other road users, and inadequate enforcement of traffic laws.
The design of the built environment can either increase or reduce road traffic injury risk. Specifically, road design, in which facilities such as pavements, bicycle lanes and signalized crossings are missing, inadequate or in poor condition can create risks for pedestrians and cyclists (WHO, 2013g). A road design that does not cater for safety of different transport modes increases risks in a traffic mix situation. Thus, there is a need to consider the safety of all road users when designing roads and lanes, intersections, crossings and vehicle operating speed (Ewing & Dumbaugh, 2009).
Beyond design elements of the road itself, the design of the broader land use for commercial, industrial, recreational,
ROAD TRAFFIC ACCIDENTS
Occupational risksMethod: CRA
14%
Occupational risks, built environment, traffic regulation, land useMethod: expert survey
40%
transport, conservation, agricultural or mixed use, can contribute to the occurrence of road traffic injuries (WHO, 2013a; WHO & World Bank, 2004). In the absence of proper planning, these land uses will evolve in a haphazard pattern, and road traffic will evolve similarly to meet the needs of these various activities. This type of situation is likely to produce heavy flows of traffic through residential areas, vehicles of potentially high speed mixing with pedestrians, and heavy, long-distance commercial vehicles using routes not designed for such traffic. The resulting risk exposure affects car occupants, pedestrians, cyclists and motorized two-wheeler users (WHO & World Bank, 2004). Land-use planning factors that affect road traffic injury risk are density, land-use mix and city structure (Ewing & Dumbaugh, 2009; Mohan, 2008; Morency et al, 2012; Qin et al, 2004; WHO, 2013a). Additional environmental issues include weather and topography (Jaroszweski & McNamara, 2014; Qin et al, 2004).
Road traffic accidents are a major cause of death and injury globally.
RESULTS: A SYSTEMATIC ANALYSIS OF FRACTIONS ATTRIBUTABLE TO THE ENVIRONMENT, BY DISEASE 73

More specifically, effective road design and land-use planning measures to improve road safety include: building pavements and bicycle lanes, developing traffic-calming measures, pedestrianizing city centres, controlling vehicle speed, restricting vehicle traffic in residential areas, installing traffic signals and guard rails along roadsides, constructing under- and overpasses, including for pedestrians and, in rural areas and natural parks, for animals, creating a road network that separates access roads from through roads, designing pedestrian pathways to facilitate movement of people with mobility impairment, redesigning public spaces to cater for pedestrian safety needs, and increasing visibility of pedestrians and cyclists through road lighting (Elvik, 2001; Elvik et al, 2009; Forjuoh, 2003; Retting et al, 2003; Sethi et al, 2007; Waters et al, 2004; WHO, 2013a). Further measures include installing pedestrian countdown signals, improving the lighting, for example around pedestrian crossings, creating pedestrian zones, and using infrastructure solutions to enhance safety for school children on their routes to school (Elvik et al, 2009; Reynolds et al, 2009; WHO, 2013e; WHO, 2013g).
Work-related road traffic injuries account for an important share of workplace fatalities (WHO & World Bank, 2004). Various factors are associated with increased road traffic injury rates, such as sleepiness, time spent driving, long driving or working hours, occupational stress, alcohol use, medical conditions or excessive speed, require the attention of occupational health services (Robb et al, 2008; Rosso et al, 2007). About 14% of road traffic injuries were attributed to occupational risks (IHME, 2014).
It is relatively diff icult to assess the contribution of environmental factors using intervention studies, because most of such studies must be implemented within an existing built environment, with only minor constructional modifications possible. Also, longer term environmental changes, such as modifications to the urban geography, density or road layout, or changes in the use
of motor vehicles, could not be measured. Despite these limitations, it was estimated that 25% (10−64%) of road traffic injuries in Western Europe were attributable to the environment, 17% (0−50%) in Australia, North America and Japan, and 42% (25−65%) in low- and middle-income regions. The global average for road accidents attributable to environmental factors was 40% (23−64%) (expert survey 2005, see Section 2).
SELECTED INTERVENTIONS
• A systematic review of interventions to reduce traffic collisions and injuries has shown that the following infrastructure measures are effective: traffic-calming measures; engineering and other traffic control solutions to improve separation of pedestrians from motorized traffic, including the establishment of pedestrian streets; increasing visibility of pedestrians and cyclists; separation of roads, combined with bridges or underpasses. Overall, the various area-wide traffic-calming infrastructure measures were found effective in reducing road traffic collisions and related fatalities and injuries, with a range of 0–20% reduction (Elvik et al, 2009; Novoa et al, 2009).
ECONOMIC EVALUATIONS
• Estimates based on figures from Norway show that a variety of road improvements are of proven cost-benefit: €1 spent on simple road markings saves society €1.50, €1 spent on upgrading marked pedestrian crossings saves €14, pedestrian bridges or underpasses save €2.50 for every €1 spent and guard rails along the roadside save €10 for every €1 spent (European Transport Safety Council, 2003; Sethi et al, 2007). Further data from Norway indicate that the socioeconomic benefits of establishing a coherent network of routes for pedestrians and cyclists are at least four to five times the costs; area-wide traffic-calming measures show benefits 15% higher than costs, and the introduction of pedestrianized streets is estimated to be 20% higher than the costs (Elvik et al, 2009).
PREVENTING DISEASE THROUGH HEALTHY ENVIRONMENTS74
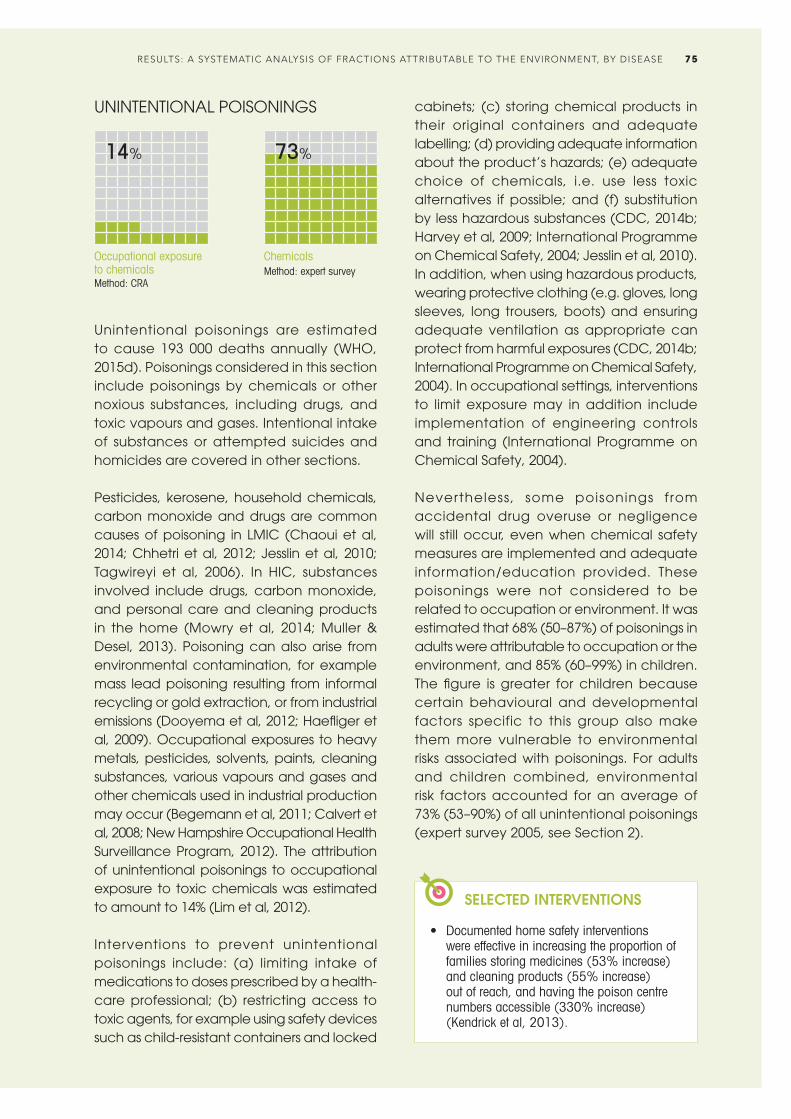
Occupational exposure to chemicalsMethod: CRA
UNINTENTIONAL POISONINGS
ChemicalsMethod: expert survey
14% 73%
Unintentional poisonings are estimated to cause 193 000 deaths annually (WHO, 2015d). Poisonings considered in this section include poisonings by chemicals or other noxious substances, including drugs, and toxic vapours and gases. Intentional intake of substances or attempted suicides and homicides are covered in other sections.
Pesticides, kerosene, household chemicals, carbon monoxide and drugs are common causes of poisoning in LMIC (Chaoui et al, 2014; Chhetri et al, 2012; Jesslin et al, 2010; Tagwireyi et al, 2006). In HIC, substances involved include drugs, carbon monoxide, and personal care and cleaning products in the home (Mowry et al, 2014; Muller & Desel, 2013). Poisoning can also arise from environmental contamination, for example mass lead poisoning resulting from informal recycling or gold extraction, or from industrial emissions (Dooyema et al, 2012; Haefliger et al, 2009). Occupational exposures to heavy metals, pesticides, solvents, paints, cleaning substances, various vapours and gases and other chemicals used in industrial production may occur (Begemann et al, 2011; Calvert et al, 2008; New Hampshire Occupational Health Surveillance Program, 2012). The attribution of unintentional poisonings to occupational exposure to toxic chemicals was estimated to amount to 14% (Lim et al, 2012).
Interventions to prevent unintentional poisonings include: (a) limiting intake of medications to doses prescribed by a health-care professional; (b) restricting access to toxic agents, for example using safety devices such as child-resistant containers and locked
cabinets; (c) storing chemical products in their original containers and adequate labelling; (d) providing adequate information about the product’s hazards; (e) adequate choice of chemicals, i.e. use less toxic alternatives if possible; and (f) substitution by less hazardous substances (CDC, 2014b; Harvey et al, 2009; International Programme on Chemical Safety, 2004; Jesslin et al, 2010). In addition, when using hazardous products, wearing protective clothing (e.g. gloves, long sleeves, long trousers, boots) and ensuring adequate ventilation as appropriate can protect from harmful exposures (CDC, 2014b; International Programme on Chemical Safety, 2004). In occupational settings, interventions to limit exposure may in addition include implementation of engineering controls and training (International Programme on Chemical Safety, 2004).
Nevertheless, some poisonings from accidental drug overuse or negligence will still occur, even when chemical safety measures are implemented and adequate information/education provided. These poisonings were not considered to be related to occupation or environment. It was estimated that 68% (50–87%) of poisonings in adults were attributable to occupation or the environment, and 85% (60–99%) in children. The figure is greater for children because certain behavioural and developmental factors specific to this group also make them more vulnerable to environmental risks associated with poisonings. For adults and children combined, environmental risk factors accounted for an average of 73% (53–90%) of all unintentional poisonings (expert survey 2005, see Section 2).
SELECTED INTERVENTIONS
• Documented home safety interventions were effective in increasing the proportion of families storing medicines (53% increase) and cleaning products (55% increase) out of reach, and having the poison centre numbers accessible (330% increase) (Kendrick et al, 2013).
RESULTS: A SYSTEMATIC ANALYSIS OF FRACTIONS ATTRIBUTABLE TO THE ENVIRONMENT, BY DISEASE 75

ECONOMIC EVALUATIONS
• Lead paint hazard control in homes to prevent children’s exposure would yield a net saving of US$ 181–269 billion in the USA if considering costs of health care, lifetime earnings, tax revenue, special education, attention deficit disorder and direct costs of crime associated with elevated lead exposure. Investing in such control measures, especially targeted at early intervention of lead poisoning in communities most likely at risk, would be very cost effective (Gould, 2009).
• The estimated annual costs of illness of acute poisoning in Nepalese farmers due to the use of pesticides accounted for nearly one third of the total annual health-care costs (Atreya, 2008).
• In the state of Paraná, Brazil, for each US$ 1 spent on pesticides, approximately US$ 1.28 may be spent on health care and sick leave due to occupational poisoning (Soares & Porto, 2012).
• In the UK, compulsory installation of carbon monoxide detectors in homes would have a cost-benefit ratio between 0.02–0.28, and was therefore not considered cost effective. Due to the higher risk, installation of such detectors in boats and caravans would, however, be cost effective (UK Department of Local Communities and Local Governments, 2010).
Occupational risksMethod: CRA
FALLS
Built environments, occupational risks Method: expert survey
6% 30%
Globally, falls are the second cause of death from unintentional injuries with 690 000 deaths in 2012 (WHO, 2015d). Each year, 37 million falls are severe enough to seek medical attention (WHO, 2012c). A fall is defined as an event where a person comes to rest inadvertently on the ground or lower level (WHO, 2012c). Falls mostly affect adults older than 60 years.
Accidental falls may be associated with physical, sensory and cognitive decline due to ageing, substance abuse, underlying medical conditions, unsafe environments and occupational hazards (WHO, 2012c). Unsafe home and community environments including poor lighting, slippery floors, loose rugs etc. may increase the risk of falls in the elderly, which can be reduced through effective interventions (Ambrose et al, 2013; Bradley, 2011; Gillespie, 2004; Lord et al, 2006; WHO, 2012c). Safe environments may include window guards or grab rails, removal of slippery surfaces, adequate lighting and good visibility. Industries and services with the highest risk of occupational falls include the construction industry, manufacturing, buildings and dwellings services, and trade (US Bureau of Labor Statistics, 2014). Falls due to occupational hazards and alcohol abuse have attributable risk factors of 6.3% and 9.2% respectively (IHME, 2014).
Weather events, such as windstorms, can also increase the risk of falls, which may be influenced by climate change in certain regions (Goldman et al, 2014).
Falls in the workplace and at home can be reduced by safeguards and other fittings.
PREVENTING DISEASE THROUGH HEALTHY ENVIRONMENTS76

In high-income countries, about 26% (15–52%) of falls were attributed to the environment, and about 31% (15–60%) in low- and middle-income countries (estimate based on expert survey 2005, see Section 2).
Occupational risksMethod: CRA
FIRES, HEAT AND HOT SUBSTANCES
Home environments, occupational risksMethod: expert survey
10% 76%
About 268 000 deaths occur each year due to burns from exposure to fire, heat or hot substances; the vast majority occurring in LMIC (WHO, 2015d). Such injuries occur when hot liquids, solids, gases or flames cause injuries to the skin or other tissues. Risk factors for burns include smoking, various environmental risks, occupational exposure to fire and alcohol abuse (WHO, 2014e). The fraction of fires attributable to alcohol abuse has been estimated to amount to be 6.8% globally (in DALYs) (IHME, 2014).
Environmental risks include: (a) cooking, lighting or heating equipment and practices, in particular, open fires, unsafe stoves or use of candles (Diekman et al, 2014; National Fire Protection Association, 2014); (b) wearing loose-fitting clothing while cooking (WHO, 2008a); (c) lack of proper building fire codes (WHO, 2008b); (d) use of kerosene for cooking and lighting and/or inadequate safety measures for liquefied petroleum gas (WHO, 2014e); (e) household products composed of flammable materials (e.g. upholstered furniture, mattresses, rubbish) (National Fire Protection Association, 2014); (f) the malfunction of other appliances and equipment (e.g. household appliances, faulty electrical wiring) (National Fire Protection Association, 2014; WHO, 2008b);
and (g) socioeconomic factors such as overcrowding (WHO, 2014e). Most burns, particularly among women and children, occur in the domestic environment, largely in the kitchen or cooking area (Diekman et al, 2014). For example, 41% of patients admitted for burns to one hospital in Sri Lanka had been injured by falling kerosene lamps (Laloe, 2002). A study from India revealed that 35% of flame burns over a nine-year period were due to malfunctioning kerosene pressure stoves (Ahuja & Bhattacharya, 2002).
Occupat ional r i sks af fect cer ta in occupations at increased exposure to fire or heat, such as work in accommodation and food services, agriculture, manufacturing and construction industries (Horwitz & McCall, 2004). The global attributable risk for occupational exposure to fire has been estimated to amount to 10% (IHME, 2014). The occupational fraction of burns treated in emergency departments in HIC tends to be much higher (Reichard et al, 2015).
Accordingly, practical measures can be taken to reduce the risk of burns, including for example: (a) enclosing fires and using safer cookstoves in the domestic environment, as well as installing stove guards; (b) lowering the temperature in hot water taps; (c) applying safety regulations to housing design and materials; (d) installing smoke detectors, fire sprinklers and fire-escape systems; (e) applying industrial safety regulations, e.g. for products used in homes and other buildings; (f) refraining from smoking in bed (Diekman et al, 2014; WHO, 2011a; WHO, 2014e). Additional domestic practices to prevent fires include never leaving food or water unattended on a stove, avoid wearing loose-fitting clothes while cooking, and keeping matches and lighters out of the reach of children (CDC, 2014a). Occupational safety measures for prevention of burns include engineering controls, use of personal protective equipment and education of workers.
Climate change is expected to increase the vulnerability to wildfires in many regions,
RESULTS: A SYSTEMATIC ANALYSIS OF FRACTIONS ATTRIBUTABLE TO THE ENVIRONMENT, BY DISEASE 77

due to draughts and temperature increase (IPCC, 2013).
In high-income countries, an estimated 42% (1–67%) of fire-related injuries were estimated to be attributable to environmental and occupational risks. In low- and middle-income countries, the fraction attributable to the environment was estimated to be higher and reach 85% (74–97%), mainly because of unsafe cooking, heating and lighting fuels and devices, but also poorer building standards (estimate based on expert survey 2015, see Section 2).
ECONOMIC EVALUATIONS
• A study in the USA found that the ratio of smoke detectors to the savings in health-care costs was 1:26 (CDC, 2000; WHO, 2008b).
• Smoke alarm giveaway and installation programmes were estimated to have a positive net benefit with a benefit-cost ratio of 2.1 and 2.3, respectively (Liu et al, 2012).
• Water at 60°C causes a burn within three seconds of exposure, while water at 49°C takes approximately 10 minutes to cause significant thermal injury to the skin. In 1992, a campaign against hot water scalds was launched in Australia, and a law was implemented to limit the water temperature to 50°C in bathrooms. Following that campaign, rates of the most serious scalds declined by 30%, resulting in an annual saving to the health-care system of between Aus$ 3.8–6.5 million (WHO, 2011a).
About 372 000 people drowned in 2012, and drowning is the leading injury in children under five years (WHO, 2015d). Drowning occurs by respiratory impairment due to submersion/immersion in liquid (WHO, 2014k). The highest drowning rates are among children aged between one and four years (WHO, 2014k). Risks factors for drowning include lack of physical barriers between people and water, particularly close to the home, as well as lack of child supervision. For example, children are at risk of drowning through proximity to water bodies, including baths when there is a lapse in supervision (Iqbal et al, 2007; WHO, 2014i). Recreational environments may present a risk of drowning, for example due to inadequate safety measures or equipment in swimming pools and other recreational water bodies (Modell, 2010), or for tourists unfamiliar with local risks and features (WHO, 2014i). Uncovered and unprotected water supplies and lack of safe water crossings also constitute a major risk (WHO, 2014k).
Certain occupational activities are at increased risk, e.g. fishing. Waterway transportation on overcrowded or unsafe vessels that lack safety equipment or insufficiently trained personnel also increases drowning risks (WHO, 2010; WHO, 2014k). Many drownings have occurred due to natural events, such as floods, torrential rains and tsunamis. Climate change may influence the frequency or amplitude of relevant natural events (WHO, 2014z). Further risks for drowning include alcohol or drug consumption that impairs swimming ability
Occupational risksMethod: CRA
DROWNINGS
Safety of home and community environments, occupational risksMethod: expert survey
11% 73%
PREVENTING DISEASE THROUGH HEALTHY ENVIRONMENTS78

or parental supervision capacity of children near water (WHO, 2010).
Strategies to prevent drowning may include improved community infrastructure, public awareness and appropriate policies and legislation (WHO, 2014k). Community-based action to improve infrastructure may be very effective and include the development and implementation of safe water systems, such as drainage systems and flood control; fencing around pools or other standing water; creating and maintaining safe water zones for recreation; covering wells and cisterns; and emptying water containers and baths (Iqbal et al, 2007; Thompson & Rivara, 2000; WHO, 2014i). Community infrastructure may also include the establishment of supervised child-care programmes (WHO, 2014k). Public awareness can be raised to highlight the particular risks of children, to signpost dangerous areas and pre-position rescue equipment. Individual and community education on drowning risks, teaching school-age children basic swimming, learning of water survival skills, the presence of lifeguards and increased capability of bystanders in safe rescue and resuscitation are further elements of drowning prevention strategies (WHO, 2014k).
Regulations to prevent drownings include safe boating, shipping and ferry regulations, such as establishing systems that ensure vessel safety, availability of flotation devices in boats, avoidance of overcrowding, and appropriate travel routes and rules. Other regulations include pool fencing, and laws on alcohol use while boating or swimming. Occupational safety measures may include the wearing of personal flotation devices and guard rails, for example on commercial fishing vessels (NIOSH, 1994). Building resilience and managing flood risks and other hazards can significantly modify those risks, which are developed in greater detail in the section on “other unintentional injuries”. The development of national water safety plans, and the involvement of other sectors, can further ensure the systematic
implementation of sound preventive action (WHO, 2014k).
The global population attributable fraction for occupational risks is 11%, while the attributable risk factor for alcohol or drug consumption that impairs swimming ability or parental supervision of children near water is 9.2% (IHME, 2014). Some alcohol-related drownings could be avoided by implementing safety measures in recreational environments, and by targeted education.
Drowning rates have decreased significantly in developed countries over the past decade, coinciding with a period in which interventions related to recreational environments and to education were emphasized. In Italy, for example, drowning rates were reduced by 64% in less than three decades (Giustini et al, 2003).
For high-income countries, it was estimated that 54% (24–79%) of drownings were attributable to the environment or to occupation. In low- and middle-income countries, where recreational safety, water transportation safety and flood control were less developed, the corresponding figure was higher with 74% (44–95%) (estimate based on expert survey 2005, see Section 2).
Flood events, as here in Amazonas, Brazil, are likely to increase with climate change.
RESULTS: A SYSTEMATIC ANALYSIS OF FRACTIONS ATTRIBUTABLE TO THE ENVIRONMENT, BY DISEASE 79

SELECTED INTERVENTIONS
• A surveillance system was implemented in a high-risk drowning area in Thailand. Following the intervention, the control area was 5.6 times more at risk for drownings than the intervention area, which saw a 90% rescue rate (Sansiritaweesook et al, 2013).
• A drowning prevention intervention for children aged between 4 and 12 years in Bangladesh, including swimming lessons, increased supervision, raised awareness about risks, and water safety and safe rescue skills, decreased the risk of drowning by more than 90%. Collective supervision of children between one and five years in child-care centres reduced drownings by more than 80%. Both interventions were evaluated as being very cost-effective (Rahman et al, 2012).
• Pool fencing reduces the risk of drowning or near drowning by about 73% (84–53%). Isolation fencing (enclosing the pool only) is superior to perimeter fencing (enclosing property with pool) (Thompson & Rivara, 2000).
Occupational risksMethod: CRA
OTHER UNINTENTIONAL INJURIES
Industrial risks, transport, natural forces, animal risks etc.Method: expert survey
11% 43%
This category includes many different injuries that occur in a variety of circumstances and settings, many of which relate to the environment. The injuries are mainly sustained from:• Mechanical forces (e.g. from tools, sports
equipment and agricultural machinery);• Explosions;• Off-road transportation accidents;• Animal bites, other contact with animals,
and contact with venomous animals and poisonous plants;
• Exposure to ionizing radiation or electric currents;
• Suffocation;• Natural forces (e.g. floods, storms, exces-
sively hot or cold weather, earthquakes); and
• Complications of medical and surgical care.
Injury prevention strategies in many areas may include a combination of environmental or engineering approaches, education/behavioural interventions and policies or legislations (Doll et al, 2007). About 14% of injuries from mechanical forces, 11% of injuries from animal contact, and also 11% of injuries not classified elsewhere, were attributed to occupational risks (IHME, 2014).
For example, there are approximately 400 000 poisonous snake bites per year result ing in 20 000 deaths, globally (Kasturiratne et al, 2008). Snakebites can be prevented through behavioural changes, e.g. wearing shoes when walking through undergrowth and avoiding contact with snakes, and keeping the ground around houses and compounds clear of bushes, long grass and rubbish (Warrell, 2010).
Although floods (and earthquakes) are natural events, both were included in this analysis because their consequences could in part be limited by environmental measures. Risks from tsunamis, floods and cyclones, e.g. coastal floods, river floods and flash floods, could be mitigated through a number of actions. These may include disaster preparedness plans and early warning systems, land-use planning to ensure that housing and critical infrastructure are not located in flood-prone areas, that buildings are designed to reduce the risk of flood damage, or that infrastructure such as levee systems or dams be implemented, as appropriate. Preserving forests, coastal mangroves, wetlands and washlands helps to retain natural storage capacity, and to maintain natural barriers, and may prevent floods and drowning fatalities (WHO, 2014k). Climate change may increase the intensity
PREVENTING DISEASE THROUGH HEALTHY ENVIRONMENTS80

of cyclones, cause sea level rise and associated floods may worsen (IPCC, 2012). Action to mitigate climate change and adaptation plans may therefore limit future risk of fatalities from such events (WHO, 2014z). The consequences of earthquakes could be limited by adequate building design.
For h igh- income countr ies , i t was estimated that 30% (19−41%) of all injuries in this category were attributable to the environment; in low- and middle-income countries the estimate was 45% (20−79%) (estimate based on expert survey 2005, see Section 2).
Protective clothing and equipment are important in reducing workplace injuries.
RESULTS: A SYSTEMATIC ANALYSIS OF FRACTIONS ATTRIBUTABLE TO THE ENVIRONMENT, BY DISEASE 81
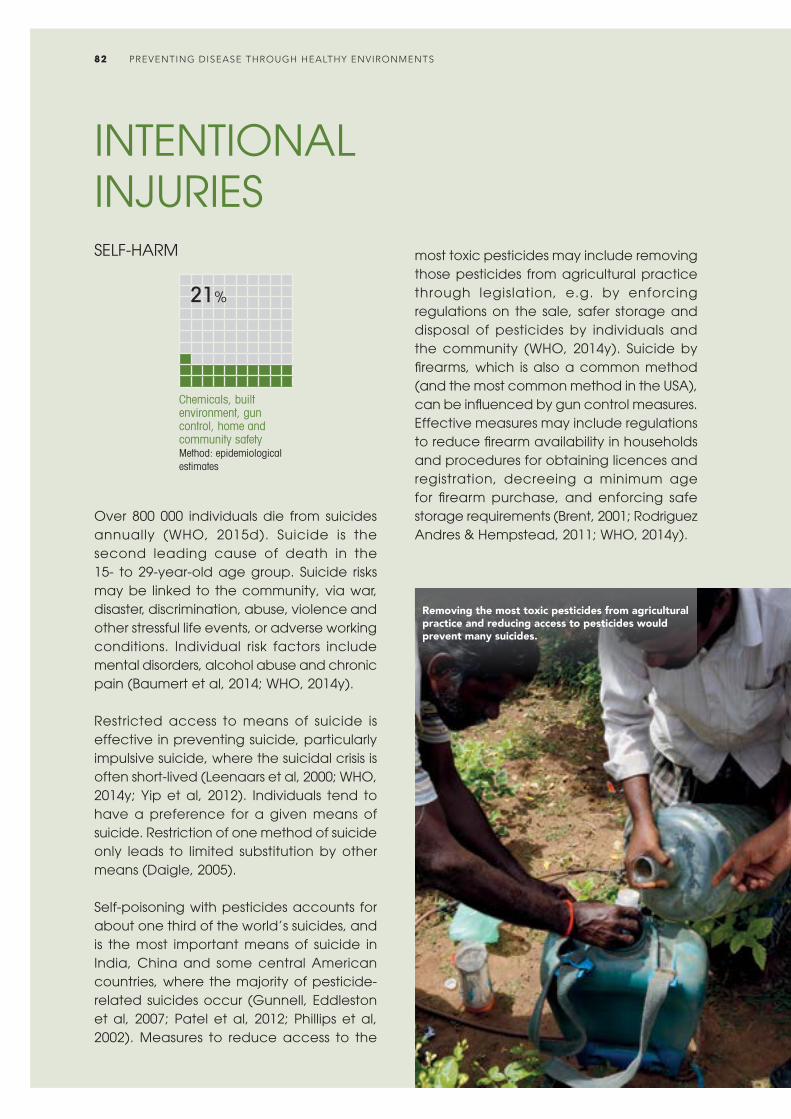
INTENTIONAL INJURIES
Chemicals, built environment, gun control, home and community safetyMethod: epidemiological estimates
SELF-HARM
21%
Over 800 000 individuals die from suicides annually (WHO, 2015d). Suicide is the second leading cause of death in the 15- to 29-year-old age group. Suicide risks may be linked to the community, via war, disaster, discrimination, abuse, violence and other stressful life events, or adverse working conditions. Individual risk factors include mental disorders, alcohol abuse and chronic pain (Baumert et al, 2014; WHO, 2014y).
Restricted access to means of suicide is effective in preventing suicide, particularly impulsive suicide, where the suicidal crisis is often short-lived (Leenaars et al, 2000; WHO, 2014y; Yip et al, 2012). Individuals tend to have a preference for a given means of suicide. Restriction of one method of suicide only leads to limited substitution by other means (Daigle, 2005).
Self-poisoning with pesticides accounts for about one third of the world’s suicides, and is the most important means of suicide in India, China and some central American countries, where the majority of pesticide-related suicides occur (Gunnell, Eddleston et al, 2007; Patel et al, 2012; Phillips et al, 2002). Measures to reduce access to the
most toxic pesticides may include removing those pesticides from agricultural practice through legislation, e.g. by enforcing regulations on the sale, safer storage and disposal of pesticides by individuals and the community (WHO, 2014y). Suicide by firearms, which is also a common method (and the most common method in the USA), can be influenced by gun control measures. Effective measures may include regulations to reduce firearm availability in households and procedures for obtaining licences and registration, decreeing a minimum age for firearm purchase, and enforcing safe storage requirements (Brent, 2001; Rodriguez Andres & Hempstead, 2011; WHO, 2014y).
Removing the most toxic pesticides from agricultural practice and reducing access to pesticides would prevent many suicides.
PREVENTING DISEASE THROUGH HEALTHY ENVIRONMENTS82
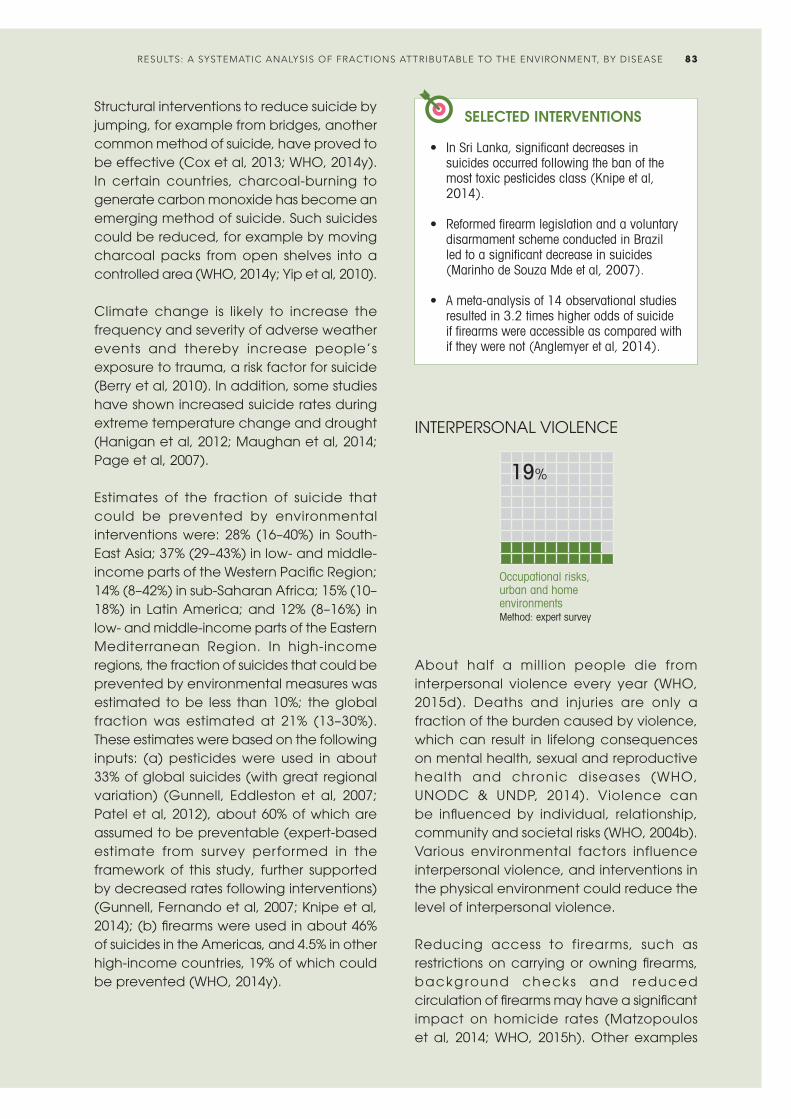
Structural interventions to reduce suicide by jumping, for example from bridges, another common method of suicide, have proved to be effective (Cox et al, 2013; WHO, 2014y). In certain countries, charcoal-burning to generate carbon monoxide has become an emerging method of suicide. Such suicides could be reduced, for example by moving charcoal packs from open shelves into a controlled area (WHO, 2014y; Yip et al, 2010).
Climate change is likely to increase the frequency and severity of adverse weather events and thereby increase people’s exposure to trauma, a risk factor for suicide (Berry et al, 2010). In addition, some studies have shown increased suicide rates during extreme temperature change and drought (Hanigan et al, 2012; Maughan et al, 2014; Page et al, 2007).
Estimates of the fraction of suicide that could be prevented by environmental interventions were: 28% (16–40%) in South-East Asia; 37% (29–43%) in low- and middle-income parts of the Western Pacific Region; 14% (8–42%) in sub-Saharan Africa; 15% (10–18%) in Latin America; and 12% (8–16%) in low- and middle-income parts of the Eastern Mediterranean Region. In high-income regions, the fraction of suicides that could be prevented by environmental measures was estimated to be less than 10%; the global fraction was estimated at 21% (13–30%). These estimates were based on the following inputs: (a) pesticides were used in about 33% of global suicides (with great regional variation) (Gunnell, Eddleston et al, 2007; Patel et al, 2012), about 60% of which are assumed to be preventable (expert-based estimate from survey performed in the framework of this study, further supported by decreased rates following interventions) (Gunnell, Fernando et al, 2007; Knipe et al, 2014); (b) firearms were used in about 46% of suicides in the Americas, and 4.5% in other high-income countries, 19% of which could be prevented (WHO, 2014y).
SELECTED INTERVENTIONS
• In Sri Lanka, significant decreases in suicides occurred following the ban of the most toxic pesticides class (Knipe et al, 2014).
• Reformed firearm legislation and a voluntary disarmament scheme conducted in Brazil led to a significant decrease in suicides (Marinho de Souza Mde et al, 2007).
• A meta-analysis of 14 observational studies resulted in 3.2 times higher odds of suicide if firearms were accessible as compared with if they were not (Anglemyer et al, 2014).
Occupational risks, urban and home environmentsMethod: expert survey
INTERPERSONAL VIOLENCE
19%
About half a million people die from interpersonal violence every year (WHO, 2015d). Deaths and injuries are only a fraction of the burden caused by violence, which can result in lifelong consequences on mental health, sexual and reproductive health and chronic diseases (WHO, UNODC & UNDP, 2014). Violence can be influenced by individual, relationship, community and societal risks (WHO, 2004b). Various environmental factors influence interpersonal violence, and interventions in the physical environment could reduce the level of interpersonal violence.
Reducing access to firearms, such as restrictions on carrying or owning firearms, background checks and reduced circulation of firearms may have a significant impact on homicide rates (Matzopoulos et al, 2014; WHO, 2015h). Other examples
RESULTS: A SYSTEMATIC ANALYSIS OF FRACTIONS ATTRIBUTABLE TO THE ENVIRONMENT, BY DISEASE 83
providing care, advice and education (nurses, teachers); (c) workers carrying out inspections or enforcement duties (ticket inspectors, police officers); (d) workers in contact with drunk or potentially violent people (prison officers, bar staff); and (e) those working alone (taxi drivers) (Chappell & Di Martino, 2006; Edward et al, 2014; ILO, 2009; Jenkins, 1996; Shahzad & Malik, 2014). For example, the retail trade and service industries accounted for about half of workplace homicides and 85% of nonfatal workplace assaults in the USA (Jenkins, 1996).
In high-income countries, environmental factors accounted for 16% (3−28%) of the injuries from interpersonal violence, and for about 19% (7−31%) in low- and middle-income countries. The global average was also about 19% (7−31%), as the majority of injuries from violence occurred in developing countries (estimate based on expert survey 2005, see Section 2).
of reducing access to dangerous items in order to reduce violence include restricting glassware in bars (Forsyth, 2008).
Urban upgrading, situational violence prevention and crime prevention through environmental designs are a group of interventions that can prevent violent crimes. Such interventions are generally targeted at low-income urban communities, and aim at improving the physical and spatial environmental conditions, for example through increased mobility, visibility, access of services or communal ownership (Cassidy et al, 2014; WHO, 2015h). For example, improved transport, lighting and buildings, police accessibility and higher vegetation densities were all suggested to reduce youth violence (Cassidy et al, 2014; Welsh & Farrington, 2008; WHO, 2015h). Poverty de-concentration experiments relocating residents of economically impoverished public housing complexes into less poor neighbourhoods have also resulted in lower rates of violent crime arrests (Sciandra et al, 2013).
Exposure to certain substances, such as lead, can affect neuropsychological development and cognitive functioning, which could increase delinquent behaviour (Carpenter & Nevin, 2010; Mielke & Zahran, 2012). Climate change could also worsen conflict outcomes in comparison with a future without climatic changes (Hsiang et al, 2013).
Workers in certain occupations or settings, or who perform certain tasks, may be at increased risk of workplace violence or homicide. These may include: (a) workers handling money or valuables (cashiers, transport workers); (b) workers
SELECTED INTERVENTIONS
• Stricter gun control and licensing conditions under the Firearms Control Act in South Africa led to taking more than 200 000 weapons out of circulation between 2001 and 2005. This coincided with a decrease in firearm homicides of 13.6% per year over the same period (Matzopoulos et al, 2014).
• Building a public transit system connecting an isolated low-income neighbourhood in Medellín, Colombia, accompanied by improvements in neighbourhood infrastructure, resulted in a 66% higher reduction in homicide rates compared with control neighbourhoods (Cerda et al, 2012). Resident reports of violence also decreased 75% more in intervention neighbourhoods than in control neighbourhoods.
PREVENTING DISEASE THROUGH HEALTHY ENVIRONMENTS84

The link between the environment and demographics
The world’s population is ageing rapidly, which in part reflects improvements in health care. Environmental determinants have different impacts according to people’s age, and although impacts may start earlier they may only result in disease after several years or decades. A drastic shift – with large proportions of the population now in older age categories – has occurred in recent decades and this trend is set to become even more evident in the future (Figure 4). The effect of environmental risks, such as air pollution, affecting NCDs primarily, is therefore likely to become more important.
Notes: BRICS: Brazil, Russian Federation, India, China, South Africa; OECD: Organisation for Economic Co-operation and Development; LLMI: low- and lower middle income; UMIH: upper middle- and high-income (classification, World Bank, 2014).
Tota
l pop
ulatio
n
15%
10%
5%
20%
BRICS LLMI OECD UMIH
Figure 4. Proportion of population aged 65 years and older, 1990 to 2030, by country groupings
25%
0%I
1995I
2000I
2005I
2015I
2020I
2025I
2030
The world’s total population is still growing rapidly, with a projected increase of more than 50% between 1990 and 2030 (Figure 5). Africa’s population is projected to more than double in just three decades, between 2000 and 2030. This growth is putting more pressure on the environment, drawing on more ecosystem services such as water, and producing more emissions into the air, pollutants into the water etc. At least two fifths of the world’s population live in the five large emerging “BRICS” economies
(Brazil, Russian Federation, India, China and South Africa) undergoing fast-growing development.
Ever more people are migrating to urban areas (Figure 6). Cities have the potential to concentrate several modern risks, such as ambient air pollution, low physical activity due to poor urban planning and sedentary work.
RESULTS: A SYSTEMATIC ANALYSIS OF FRACTIONS ATTRIBUTABLE TO THE ENVIRONMENT, BY DISEASE 85
Notes: BRICS: Brazil, Russian Federation, India, China, South Africa; OECD: Organisation for Economic Co-operation and Development; LLMI: low- and lower middle income; UMIH: upper middle- and high-income (classification, World Bank, 2014).
3
2
1
4
OECD UMIH BRICS LLMI
Figure 5. World population, 1990 to 2030, by country groupings
9
01990 2000 2015 2030
8
7
6
5
Tota
l pop
ulatio
n (bil
lions
)
Notes: BRICS: Brazil, Russian Federation, India, China, South Africa; OECD: Organisation for Economic Co-operation and Development; LLMI: low- and lower middle income; UMIH: upper middle- and high-income (classification, World Bank, 2014).
30%
20%
10%
40%
Rural Urban
Figure 6. Urban and rural fraction of the population, 2012
100%
0%Lower
incomeBRICS Higher
incomeOECD
90%
80%
70%
50%
Perce
ntag
e of t
otal
popu
lation
60%

Global results of the analysis by disease and population subgroups
Globally, 23% (13–34%) of all deaths are estimated to be attributable to the environment, and 22% (13–32%) of DALYs. In total, the number of deaths linked to the environment amounts to 12.6 million per year (based on 2012 data). This burden could be lessened significantly by reducing risks through changes to the modifiable environment.
Deaths DALYs
Disease groupTotal deaths
(million)
Attributable to the
environment (million)
Population attributable fraction (%)
Total DALYs (million)
Expert survey 2015
Population attributable fraction (%)
Infectious, parasitic, maternal, neonatal and nutritional causes 12.8 2.5 20% 925 202 22%
Noncommunicable diseases 37.7 8.2 22% 1506 276 18%Injuries 5.1 2.0 38% 305 118 39%
Total 55.6 12.6 23% 2736 596 22%
Table 2. Total and attributable deaths and disease burden to the environment, 2012
Disease specific results
The impact of the environment on health is unevenly distributed across the major disease groups (Table 2). The largest number of deaths attributed to the environment is now caused by NCDs. The highest population attributable fractions are in the area of injuries, which are often largely conditioned directly by the environment.
The diseases with the main environmental contribution are the cardiovascular diseases, followed by diarrhoeal diseases, respiratory infections and cancers (Figure 7).
Figure 7. Diseases with the largest environmental contribution
I0%
Environmental fraction Non-environmental fraction
Fraction of total global burden of disease in DALYs
Stroke 42%
Notes: COPD: chronic obstructive pulmonary disease; percentages within bars relate to the environmental share of the respective disease.
I1%
I2%
I3%
I4%
I5%
I6%
I7%
I8%
I9%
I10%
Ischaemic heart disease 35%
Diarrhoeal diseases 57%
Lower respiratory infections 35%
Cancers 20%
COPD 35%
Road traffic accidents 39%
Neonatal conditions 11%
Malaria 42%
Drowning 73%
Back and neck pain 27%
Fire, heat, hot substances 76%
Falls 30%
Asthma 44%
Unipolar depressive disorders 11%
Poisonings 73%Self-harm 21%
HIV/AIDS 8%
Tuberculosis 18%
Anxiety disorders 20%
Intestinal nematode infections 100%
Alcohol use disorders 16%
Interpersonal violence 16%
Hearing loss 22%
PREVENTING DISEASE THROUGH HEALTHY ENVIRONMENTS86

Age differences
In children under five years, the fraction of total deaths attributable to the environment amounts to 26% (16–38%) and 25% (13–34%) of DALYs. The main environment-related diseases in this age group include lower respiratory infections and diarrhoeal diseases (Figure 8).
Adults after age 50 also show important susceptibilities to environmental conditions.
At that age, the contributions of infectious diseases and injuries are still important, while NCDs, in particular cardiovascular diseases due to ambient and household air pollution, become very important. Each of the contributing disease categories varies with age, resulting in different prevention priorities over the life course (Figure 9). It should be noted that key exposures at younger ages, which may result in NCDs at older ages could not be adequately captured in this study.
I0%
Fraction of total global burden of disease in DALYs
Figure 8. Diseases with the largest environmental contribution, children under five years
Lower respiratory infections 57%
Notes: COPD: chronic obstructive pulmonary disease; percentages within bars relate to the environmental share of the respective disease.
I5%
I10%
I15%
I20%
I25%
I30%
I35%
I40%
I45%
I50%
Diarrhoeal diseases 57%
Neonatal conditions 11%
Malaria 42%
Fire, heat, hot substances 78%
Drowning 74%
Protein-energy malnutrition 15%
Congenital anomalies 15%
Road traffic accidents 41%
Poisonings 85%
Falls 31%
Environmental fraction Non-environmental fraction
Infectious, parasitic, neonatal and nutritional diseases Noncommunicable diseases Injuries Total
Attri
buta
ble fr
actio
n (pe
rcent
age o
f DAL
Ys)
50%
30%
20%
10%
40%
60%
0%
Figure 9. Environmental fraction of global burden of disease (in DALYs) by age and disease group, 2012
I0
Age (years)
I5
I10
I15
I20
I25
I30
I35
I40
I45
I50
I55
I60
I65
I70
I75
RESULTS: A SYSTEMATIC ANALYSIS OF FRACTIONS ATTRIBUTABLE TO THE ENVIRONMENT, BY DISEASE 87

The contribution of the various diseases to the total disease burden attributable to the environment for the total population, and for children under five years is shown in figures 10 and 11 respectively.
Gender differences
The environmental fraction of the global burden of disease is similar among men and women – 22.8% and 20.6% respectively. The differences vary by type of disease, with larger differences in NCDs and injuries (Table 3).
Males Females
Disease groupTotal DALYs
(‘000)
DALYs attributable
to the environment
(‘000)
Percentage attributable
to the environment
Total DALYs (‘000)
DALYs attributable
to the environment
(‘000)
Percentage attributable
to the environment
Infectious, parasitic, maternal, neonatal and nutritional causes 481 530 105 513 21.9% 443 308 96 209 21.7%
Noncommunicable diseases 790 449 154 587 19.6% 715 852 121 637 17.0%Injuries 206 480 77 628 37.6% 98 155 40 838 41.6%
Total 1 478 459 337 728 22.8% 1 257 315 258 684 20.6%
Table 3. Total burden and percentage attributable to the environment, by sex, 2012
Figure 11. Main diseases contributing to the environmental burden of disease, for children under five years
Respiratory infections 32%
Diarrhoeal diseases 22%
Congenital anomalies
1%
Protein-energy malnutrition
2%
Other 13%
Fire, heat, hot substances3%
Poisonings1%
Road traffic accidents1%
Drowning3%
Parasitic and vector diseases
12%
Neonatal conditions
15%
Figure 10. Main diseases contributing to the environmental burden of disease, all ages, world, 2012
Respiratory infections 9% Diarrhoeal
diseases 9%
Road traffic accidents
5%
Other 13%
Cardiovascular diseases20%COPD
5%
Parasitic and vector diseases5%
Neonatal conditions4%Cancers4%
Mental and behavioural disorders
4%
Other unintentional injuries
12%
Musculoskeletal diseases
4%
Men and women experience many environmental exposures at similar levels, such as exposure to ambient air pollution, unsafe water or noise. Some important differences in exposure should, however, be noted, such as for household air pollution, where women and small children are exposed to higher levels than men, as they tend to spend longer hours around the cookstove. Other exposures affect men more than women, such as many occupational risks. The employed percentage of men is about 50% higher than for women, globally
PREVENTING DISEASE THROUGH HEALTHY ENVIRONMENTS88

(ILO, 2014), and occupational exposures will, accordingly, be more frequent in men. In addition to exposures, some gender differences exist in terms of susceptibility to disease.
While the gender differences in occupational exposures and household air pollution exposures could partially be estimated, many of the more subtle differences in exposures and susceptibility could not be captured in this assessment, mainly due to limitations in the underlying body of evidence.
Regional and country differences
Environment-attributable deaths vary strongly between regions. While most deaths attributable to the environment still occur in sub-Saharan Africa, other regions have
Deat
hs pe
r 100
0 pop
ulatio
n 2.5
1.5
1.0
0.5
2.0
Infectious, parasitic, neonatal and nutritional diseases Noncommunicable diseases Injuries
Figure 12. Deaths attributable to the environment, by region and disease group, 2012
3.0
Africa, sub-Saharan
0Americas* Eastern
MediterraneanEurope* South-East
AsiaWestern Pacific*
High-income OECD
Notes: * non-OECD countries. See Annex 1 for country groupings.
higher per capita rates of NCDs, which could be prevented by lowering environmental exposures (Figure 12).
The age-standardized deaths attributable to the environment by country are shown in Figure 13, and are shown by disease type in figures 14–16. Age-standardized measures of deaths and disease are often used to compare countries, as they adjust for differences in population age distributions by applying the age-specific mortality rates for each population to a standard population. In terms of methods used, the main part of the environment-attributable disease burden could be estimated using CRA type methods; 56% when counting in DALYs, and as much as 68% when counting in deaths, respectively (Table 4).
RESULTS: A SYSTEMATIC ANALYSIS OF FRACTIONS ATTRIBUTABLE TO THE ENVIRONMENT, BY DISEASE 89
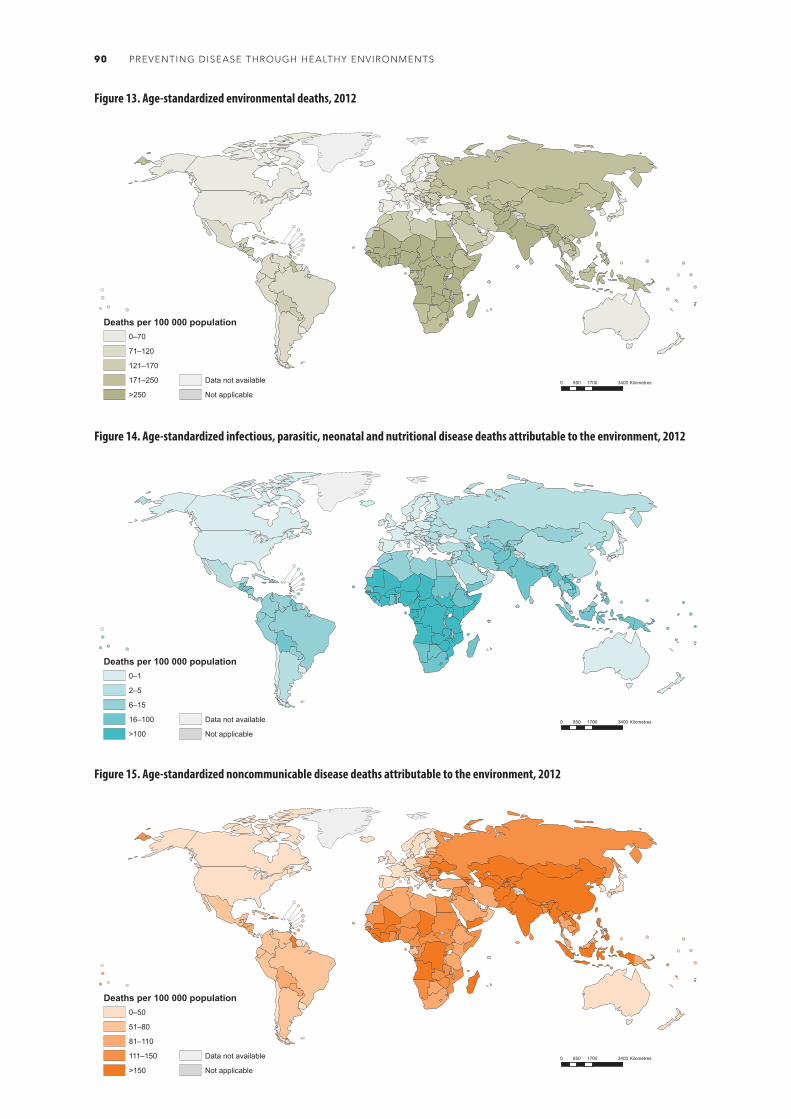
Figure 13. Age-standardized environmental deaths, 2012
Figure 14. Age-standardized infectious, parasitic, neonatal and nutritional disease deaths attributable to the environment, 2012
Figure 15. Age-standardized noncommunicable disease deaths attributable to the environment, 2012
0 1700 3400850 Kilometres
Deaths per 100 000 population0–70
71–120
121–170
171–250
>250
Data not available
Not applicable
0 1700 3400850 Kilometres
Deaths per 100 000 population0–50
51–80
81–110
111–150
>150
Data not available
Not applicable
0 1700 3400850 Kilometres
Deaths per 100 000 population0–1
2–5
6–15
16–100
>100
Data not available
Not applicable
PREVENTING DISEASE THROUGH HEALTHY ENVIRONMENTS90

Figure 16. Age-standardized injury deaths attributable to the environment, 2012
CRA type Estimation using more
limited data
Expert surveyTransmission
pathway TotalOne riskCombination
of risks 2005 2015Percentage of total environment-attributable disease burden (DALYs)
20% 36% 3% 32% 8% 1% 100%
Percentage of total environment-attributable deaths
11% 56% 3% 27% 3% 0% 100%
Table 4. Methods used to estimate the burden of disease attributable to the environment
Smoke from cookstoves and ambient air pollution together cause over 35% of pneumonia in children under five (Solukhumbu, Nepal).
0 1700 3400850 Kilometres
Deaths per 100 000 population0–10
11–20
21–30
31–40
>40
Data not available
Not applicable
RESULTS: A SYSTEMATIC ANALYSIS OF FRACTIONS ATTRIBUTABLE TO THE ENVIRONMENT, BY DISEASE 91

Popu
lation
attri
buta
ble fr
actio
n of d
eath
s
25%
15%
10%
5%
20%
30%
Figure 17. Trend in the fraction of deaths attributable to the environment by disease group, 2002–2012
35%
40%
0%
Infectious, parasitic, neonatal and nutritional diseases
2002 2012
Noncommunicable diseases
2002 2012
Injuries
2002 2012
Total
2002 2012
45%
50%
31%
20%17%
22%
37% 38%
23.3% 22.7%
Trends
The health impacts due to the environment showed a slight improvement over the 10 years – between 2002 and 2012, the number of deaths attributable to the environment decreased from 13.3 to 12.6 million deaths per year, alongside a decrease in total deaths from 57.0 to 55.6 million deaths globally. The fraction of deaths attributable to the environment also slightly decreased, from 23.3% to 22.7% over the same period.
The main change in the environment-attributable disease burden between 2002 and 2012 lies in the shift in disease categories in which they occur. There was a significant reduction in environment-attributable deaths and disease burden in the communicable, neonatal and nutritional categories. That same period saw an increase in attributable deaths and disease burden in the NCD category (Figure 17). Also, the total deaths in those disease categories have undergone significant changes during the same period. Communicable, maternal, neonatal and nutritional deaths decreased, and NCD deaths increased, partly due to population ageing (Figure 18).
The burden of disease attributable to the environment measured in DALYs estimated for 2002 and 2012, however, is not directly comparable, as some of the basic parameters in DALY estimation changed over the period. Mainly, the age weighting and discounting of DALYs were dropped in the latest analysis. The attributable disease burden has decreased from 24% to 22% between 2002 and 2012. With comparable methods, this drop would have been even greater, as more deaths are now due to NCDs, which tend to occur at older ages, and induce fewer years of life lost (and fewer DALYs).
Part of the decrease between 2002 and 2012 in attributable infectious, parasitic, neonatal and nutritional diseases, and the increase in the NCD burden may be due to stronger evidence and knowledge of the exposure-disease links. Also trends in main risk factors have occurred: significant improvements took place in access to safe water and sanitation in both relative and absolute terms (WHO & UNICEF, 2014), which act on decreasing communicable disease risks. During that same period, the number of people using primarily cleaner fuels for
PREVENTING DISEASE THROUGH HEALTHY ENVIRONMENTS92

Tota
l dea
ths (
milli
ons)
50
30
20
10
40
Infectious, parasitic, neonatal and nutritional diseases Noncommunicable diseases Injuries
60
Figure 18. Trend in total deaths by disease group, 2002–2012
20020
2012
18.3%
33.5%
5.2%
12.8%
37.7%
5.1%
Source: (WHO, 2015d).
cooking slightly increased, and the number of people using primarily solid fuels remained unchanged, as new coverage could hardly keep up with population growth (Bonjour et al, 2013). Slight decreases in ambient air
quality have been observed in many low- and middle-income cities around the world in recent years (WHO, 2014cc). Increased exposure to air pollution will mainly increase NCDs, but also respiratory infections in children under five years.
In general, traditional environmental risks, such as poor water, sanitation and unclean fuels, tend to improve with reductions in poverty. These are also the greatest risks for infectious diseases. On the other hand, modern risks, such as ambient air pollution and unsafe use of chemicals, tend to increase in countries undergoing rapid development, before control over such factors is improved when full transition to high-income societies is made. In parallel, emerging risks develop, which include risks such as climate change (Gordon et al, 2004).
RESULTS: A SYSTEMATIC ANALYSIS OF FRACTIONS ATTRIBUTABLE TO THE ENVIRONMENT, BY DISEASE 93

DISCUSSION: LEVERAGING ENVIRONMENT-HEALTH LINKS

This systematic and comprehensive review of the overall impacts of the environment on health showed that, in 2012, 23% of global deaths were attributable to the environment, amounting to 12.6 million deaths. This estimate focuses on the reasonably modifiable environment and data from intervention studies, and the results therefore indicate the potential burden of disease that could reasonably be prevented by environmental interventions.
Environment, health and the Sustainable Development Goals
Environmental improvements for health can make important contributions towards achieving the SDGs, many of which are closely interlinked with the environmental and social determinants of health (Figure 19). Numerous socioeconomic conditions are closely related to environmental exposures and health. Social determinants influence the exposure to and the effect of environmental risks, which consequently lead to illness and disease. In turn, when people fall ill this has multiple repercussions on their socioeconomic status. The section below outlines the links between SDGs, environmental risks and health, and their relevance in SDG attainment.
GOAL 1: End poverty in all its forms everywhere. Elimination of extreme poverty is the overarching theme of the SDGs and the target of the first goal. Poverty in itself is a major determinant of ill health, through various environmental and social determinants. Many environmental risks, for example traditional hazards such as inadequate water and sanitation, but also global warming and extreme weather events or occupational risks, disproportionally affect the poor and those residing in lower income countries. Poverty implies that communities have to use the natural resources at their disposal in an unsustainable way to meet their basic needs. In the vicious circle of poverty and ill health, environmental and
social impacts lead to poorer health, and poor health further precipitates people into poverty. Environmental hazards and the associated risks can affect community health status for all categories of diseases and disabi l i ty : communicable and noncommunicable diseases, malnutrition, accidents and injuries and mental ill health. These impacts result in increased health-care expenditures, loss of shelter, lost income, or increased expenditure to compensate for inadequate services. This study corroborates these associations, with higher per capita disease burden (as expressed in DALYs lost) in poorer regions compared with wealthier ones. Therefore, reducing environmental risks particularly in vulnerable populations is likely to make an important contribution to poverty reduction.
GOAL 2: End hunger, achieve food security and improved nutrition and promote sustainable agriculture.A well-cared for natural environment can provide food security for all. Climate change, coupled with other environmental changes such as ecosystem depletion and destruction, affect both food availability and food accessibility. Those already vulnerable to food insecurity will be at increased risk of reduced crop yields, loss of livestock and new patterns of pests. Inadequate water and sanitation, through repeated diarrhoea episodes, is also directly linked to malnutrition. Resource re-use and recycling of agricultural waste and of domestic wastewater will help promote the transition to a cyclical economy, including the development of nutrition sensitive agriculture. Mitigating climate change and adaptation strategies will be key for maintaining food security in the future. This study shows that already today, 0.5% of the disease burden in children under five years is related to nutritional factors linked to the environment.
GOAL 3: Ensure healthy lives and promote well-being for all at all ages. This study estimates that 22% of the global disease burden (in DALYs) is attributable to modifiable environmental risks to health.
DISCUSSION: LEVERAGING ENVIRONMENT-HEALTH LINKS 95

ENVIRONMENT-HEALTH LINKS
▼
Equitable
access t
o
informatio
n
and resource
s;
Participatory
decision-
making;
Institutio
nal
capacity
▼
▼La
nd
cons
erva
tion
and r
esto
ratio
n;Pr
otec
tion o
f bi
odive
rsity
▼
▼
Cooperation
and knowledge
transfer
on science,
technology and
innovation for
sustainable
development
▼
▼
Climate change
mitigation;
Resilience,
adaptation
and impact
reduction;
Early warning
▼
▼
Reduced waste;
Reduced
release of
substances into
the air ▼
▼Adequate housing;Safe and equitable transport systems;Clean air, safe water and adequate waste management ▼
▼Reduced
inequalities in environmental
exposures;Equal access
to basic environmental
services and infrastructure
▼
▼
Resilient
infrastructure;
Clean
technologies;
Innovative
transformation
▼
▼
Safe work
environment;
Healthy
workforce
▼
Access to safe water and sanitation;
Treatment of wastewater;Integrated water
management
▼Un
iversa
l acc
ess
to m
oder
n en
ergy
serv
ices;
Incre
ased
re
newa
ble
ener
gy sh
are
▼
▼
Adequate
access to safe
water and clean
fuels ▼▼
Schools with
electricity and
safe water and
sanitation;
Awareness on
sustainable
development
▼
▼Sustainable and resilient food production;
Access to foodEnd of malnutrition ▼
▼Access to
safe water, sanitation and
clean fuels;Resilience to
disasters▼
Wastewater management; Sustainable use of marine
resources
Figure 19. Sustainable Development Goals and environment-health links
PREVENTING DISEASE THROUGH HEALTHY ENVIRONMENTS96
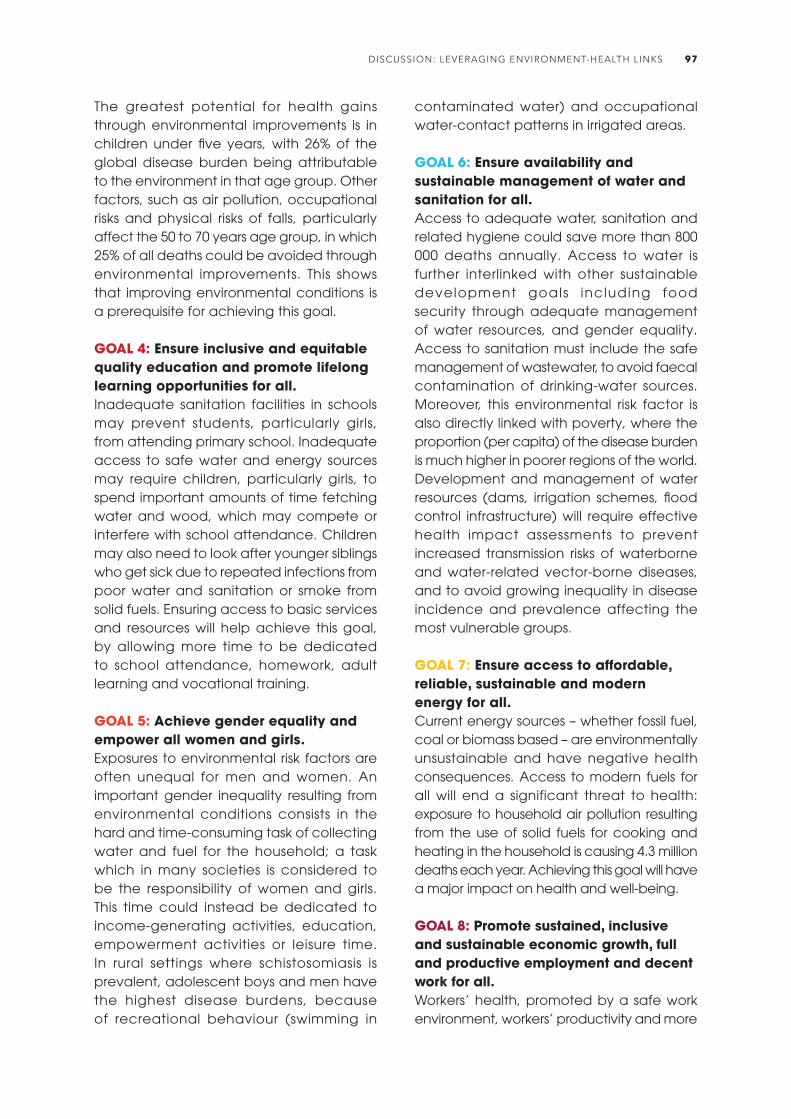
The greatest potential for health gains through environmental improvements is in children under five years, with 26% of the global disease burden being attributable to the environment in that age group. Other factors, such as air pollution, occupational risks and physical risks of falls, particularly affect the 50 to 70 years age group, in which 25% of all deaths could be avoided through environmental improvements. This shows that improving environmental conditions is a prerequisite for achieving this goal.
GOAL 4: Ensure inclusive and equitable quality education and promote lifelong learning opportunities for all. Inadequate sanitation facilities in schools may prevent students, particularly girls, from attending primary school. Inadequate access to safe water and energy sources may require children, particularly girls, to spend important amounts of time fetching water and wood, which may compete or interfere with school attendance. Children may also need to look after younger siblings who get sick due to repeated infections from poor water and sanitation or smoke from solid fuels. Ensuring access to basic services and resources will help achieve this goal, by allowing more time to be dedicated to school attendance, homework, adult learning and vocational training.
GOAL 5: Achieve gender equality and empower all women and girls. Exposures to environmental risk factors are often unequal for men and women. An important gender inequality resulting from environmental conditions consists in the hard and time-consuming task of collecting water and fuel for the household; a task which in many societies is considered to be the responsibility of women and girls. This time could instead be dedicated to income-generating activities, education, empowerment activities or leisure time. In rural settings where schistosomiasis is prevalent, adolescent boys and men have the highest disease burdens, because of recreational behaviour (swimming in
contaminated water) and occupational water-contact patterns in irrigated areas.
GOAL 6: Ensure availability and sustainable management of water and sanitation for all. Access to adequate water, sanitation and related hygiene could save more than 800 000 deaths annually. Access to water is further interlinked with other sustainable development goals including food security through adequate management of water resources, and gender equality. Access to sanitation must include the safe management of wastewater, to avoid faecal contamination of drinking-water sources. Moreover, this environmental risk factor is also directly linked with poverty, where the proportion (per capita) of the disease burden is much higher in poorer regions of the world. Development and management of water resources (dams, irrigation schemes, flood control infrastructure) will require effective health impact assessments to prevent increased transmission risks of waterborne and water-related vector-borne diseases, and to avoid growing inequality in disease incidence and prevalence affecting the most vulnerable groups.
GOAL 7: Ensure access to affordable, reliable, sustainable and modern energy for all. Current energy sources – whether fossil fuel, coal or biomass based – are environmentally unsustainable and have negative health consequences. Access to modern fuels for all will end a significant threat to health: exposure to household air pollution resulting from the use of solid fuels for cooking and heating in the household is causing 4.3 million deaths each year. Achieving this goal will have a major impact on health and well-being.
GOAL 8: Promote sustained, inclusive and sustainable economic growth, full and productive employment and decent work for all. Workers’ health, promoted by a safe work environment, workers’ productivity and more
DISCUSSION: LEVERAGING ENVIRONMENT-HEALTH LINKS 97

generally a healthy workforce, are all vital ingredients for economic growth. Working conditions are a major determinant of workers’ health and well-being. This includes access to safe drinking-water and adequate sanitation in the workplace. Providing the environmental services to address health hazards and risks can be an important source of employment – compatible with the concept of a “green economy”.
GOAL 9: Build resilient infrastructure, promote inclusive and sustainable industrialization and foster innovation. Resilience, sustainable industrialization and innovation are all required to progress towards a more health-protect ive environment. Critical changes are needed to mitigate key environmental health risks such as climate change, air pollution and water and sanitation. Innovative transformation of existing systems for a fundamentally different functioning of societies and sectors, such as carbon-free approaches, will be required in order to achieve the SDGs.
GOAL 10: Reduce inequality within and among countries. Environmental risks to health are distributed unequally within and among countries. Urban-rural and income gradients exist in terms of exposure to key environmental risks within and between countries. Improving the environment in those areas most affected by a lack of services will greatly contribute to reducing inequalities in health, access to services, income and education. Increasingly, the human rights framework will support actions, including environmental health interventions, that aim to reduce inequality and discrimination.
GOAL 11: Make cities and human settlements inclusive, safe, resilient and sustainable.Many environmental risks tend to vary significantly across urban and rural settings. As the world is becoming increasingly urbanized, one key environmental risk in cities is ambient air pollution, causing 3.7 million deaths annually. Another is the supply
of water and the proper management and disposal of waste. Addressing these risks would help progress towards this human settlement goal.
GOAL 12: Ensure sustainable consumption and production patterns. Consumption and production patterns are closely linked to key environmental risks such as ambient air pollution, exposure to chemicals and water and sanitation. Progress on this goal would greatly reduce those risks and protect health. This goal is also relevant to healthy nutrition, which can be both fostered by and prevented by specific environments.
GOAL 13: Take urgent action to combat climate change and its impacts. Climate change is one of the major health challenges of the future and its mitigation a prerequisite for sustainable development. Climate change is related to many of these goals, affecting, for example, water resources, food production, desertification, air pollution and, therefore, human health.
GOAL 14: Conserve and sustainably use the oceans, seas and marine resources for sustainable development. Sustainable use of oceans has many links with environmental determinants of health. Examples include oceans as a sustainable food resource, and the need for adequate sanitation regarding excreta management before it reaches rivers and oceans.
GOAL 15: Protect, restore and promote sustainable use of terrestrial ecosystems, sustainably manage forests, combat desertification, and halt and reverse land degradation and halt biodiversity loss. Anthropogenic in f luences on the environment are occurring at a fast pace, not allowing for the natural environment to adapt. The “Rio conventions” which address biodiversity, desertification and climate change were set up to address the environmental and human well-being impacts, and to control and reverse these
PREVENTING DISEASE THROUGH HEALTHY ENVIRONMENTS98

unwanted changes. There is now increasing evidence of the impacts of these large-scale changes on human health in the short, medium and long term.
GOAL 16: Promote peaceful and inclusive societies for sustainable development, provide access to justice for all and build effective, accountable and inclusive institutions at all levels. Inequitable access to ecosystem services, such as safe water and energy sources, and effects of extreme weather events are potential sources of conflict, displacement, inequality and exclusion. Equitable access and mitigation, in many instances supported by a legal framework of universal human rights, will help to avoid compromising progress towards this goal.
GOAL 17: Strengthen the means of implementation and revitalize the global partnership for sustainable development.Both health sector and non-health sector actors can and need to take joint action to effectively address environmentally mediated causes of disease. Such action needs to be taken at both local and global level. Many alliances already exist in the field of children’s environmental health; occupational health; in joint health sector and environment sector linkages; in the agriculture-nutrition-health nexus; and in actions in the water, chemical and transport sectors, and air pollution. Global partnerships need to be strengthened and reinforced, harnessing the full range of policy tools, strategies and technologies that are already available – to achieve the interrelated goals of health, environmental sustainability and development.
Children in lower income countries are exposed to many environmental risk factors, in particular those associated with infectious and parasitic diseases.
DISCUSSION: LEVERAGING ENVIRONMENT-HEALTH LINKS 99

All these goals are related to the environment and to health. Environmental health interventions can make a valuable and sustainable contribution towards reducing the global disease burden and improving the well-being of people everywhere. Many interventions will be cost-effective and have co-benefits beyond improving people’s health; benefits such as helping to alleviate poverty and reduce gender inequalities.
Strengths and weaknesses of the analysis
This study summarizes and analyses the available evidence between health and environment to produce quantitative estimates of the links, and the potential for disease prevention. The evidence varies in strength across risk factors and diseases. The results therefore rely on various degrees of assumptions across diseases, while reflecting the current status of knowledge.
Strength of evidence and methods used: This analysis combines estimates from various sources and various types of assessments, ranging from CRA type analyses to approximate epidemiological estimates and surveys of expert opinion, or a combination. Where general, quantified exposure-response functions and sufficient global exposure information were available, CRA estimates were generally used, provided that the risk factor-disease pairing provided important disease burden estimates or was relevant for policy-making. Where approximate epidemiological estimates or expert surveys were used to estimate the population attributable fractions, the body of evidence was usually more limited, and the estimates therefore more uncertain.
Limited accounting for certain diseases and risks: The experts generally derived their estimates from the available evidence, yet only a fraction of environmental and occupational risks is adequately covered in the literature. It appeared from the responses to our survey that the experts did
not consider poorly documented risk factors, as well as factors that are suspected to pose a risk, but for which there is no “hard” evidence. There are many examples of risks that have not been adequately evaluated, including the effects of emerging risks (e.g. more intensive agricultural practices and zoonoses), the effects of many long-term chemical exposures on cancers or endocrine disorders, and the impact of electromagnetic and other exposures from new technologies. Also the links between human health and contact with nature and benefits from biodiversity have as yet not been sufficiently assessed but could further contribute to the attributable disease burden (Sandifer et al, 2015). Finally, the potentially very wide ranging health impacts from climate change, many of them being indirect, for example acting through food prices and migration, will unfortunately not be captured by an assessment using the methods applied here. It is therefore likely that our analysis underestimates the global burden of disease attributable to reasonably modifiable environmental causes.
Changes in methods and data availability between 2002 and 2012: The changes in results between those from the 2002 data (Prüss-Ustün & Corvalan, 2006) should be interpreted with caution, as they are in part due to changes in methods and data availability, rather than actual trends in the disease burden attributable to the environment. Additional data and evidence have become available on certain diseases or injuries. The number of diseases that could be assessed with methods using higher quantities of evidence has significantly increased. The estimates should therefore have increased in precision between 2002 and 2012.
Uncertainty: A large part of this analysis is based on surveys of expert opinion and, like many such analyses, the uncertainties of such estimates are relatively large. In part, this is because expert opinion generally reflects the evidence in the literature, which may not be homogeneous, can be region-
PREVENTING DISEASE THROUGH HEALTHY ENVIRONMENTS100

specific or incomplete. We have therefore provided not only point estimates, but also the likely ranges of the estimate. The uncertainties reflect the confidence intervals provided by the experts.
Potential bias: In the framework of the expert surveys, experts in relevant risk disciplines may overestimate PAFs if they tend to work with evidence from populations with exposures. In this study, however, disease-specific rather than risk factor-specific experts were the majority. Also, epidemiological studies tend to cover mostly high-income countries where exposures to some environmental risks for noncommunicable diseases and injuries tend to be lower than in many industrializing countries, and expert surveys may therefore tend to underestimate environmental attribution for those diseases. The strong increase of CRA assessments
A modern water treatment plant (Timor-Leste).
used in this as compared to the previous study and the overall limited change in attribution of diseases to the environment however strengthens the validity of expert evaluations. More distal causes: In this analysis the effects of more peripheral causes (for example the overall impact of some sectors, such as energy or transport) have not been taken into account. And this, too, may lead to an underestimate of the global health burden attributable to modifiable environmental factors. Applicability: It is important to remember that the resulting population attributable fraction is a mean value and is not applicable to any individual country, particularly as the associated risks vary significantly from country to country.
DISCUSSION: LEVERAGING ENVIRONMENT-HEALTH LINKS 101

CONCLUSION: TOWARDS HEALTHY ENVIRONMENTS
Key findings
Environmental risks account for a large fraction of the global disease burden: Across the total population, 23% of all deaths worldwide and 22% of all DALYs are attributable to the environment. Reducing environmental exposures would greatly reduce the global burden of disease.
SDGs are closely interlinked with environmental and social determinants of health: The environment directly influences health in many ways, including through harmful exposures, inadequate infrastructure, degraded ecosystems and poor working conditions; environmental risks, such as climate change and household air pollution often disproportionally affect the poor and poorer countries. Limited access to environmental services and infrastructure, such as safe water and sanitation, impacts more on women and girls, and may limit their access to education. Environmental and social impacts lead to poorer health, and poor health further precipitates people into poverty through increased health-care expenditures, loss of shelter, lost income, or increased expenditure to compensate for inadequate services.
Nearly two thirds of all deaths attributable to the environment are now composed of NCDs: Improvement of the environment would have the greatest effect on reducing NCDs. Some 8.2 million out of 12.6 million deaths caused by the environment are NCDs, and this number could be reduced through modifiable risks in the environment. Much of the burden is linked to fossil fuel combustion, and production and consumption patterns. There has been a shift from infectious to NCDs during the last decade, and stroke and ischaemic heart disease are now the diseases with the largest contribution to the environmental burden, while it used to be respiratory infections and diarrhoea, which are now relegated to third and fourth position. This shift is also seen in the decrease in the burden of infectious diseases in children under five years. Great
progress has been made in recent years in improving the environmental conditions affecting mostly infectious diseases.
Environmental strategies often benefit multiple diseases: Many environmental interventions impact on multiple diseases at once. For example, the use of clean fuels for cooking reduces acute respiratory infections, chronic respiratory diseases, cardiovascular diseases and burns. The same is true for transport interventions, and adequate water and sanitation. The determinants of diseases linked to the environment often lie within the sphere of action of sectors other than health or environment.
interventions to improve the environment can greatly contribute to SDG targets: The link between environmental risks and SDGs shows that improving environmental conditions for health is going to be an important element in progressing towards SDGs. There are direct pathways between environmental services and conditions and health, such as the type of energy used, access to safe water and sanitation, healthy, sustainable cities and climate change. In addition, the environment is closely linked to health through several other SDGs, such as poverty and working conditions.
Children under five years and older adults are most affected by the environment: Children under five years are most affected, with 26% of all deaths being attributable to the environment, as well as adults age 50 to 75 years with between 24% and 26% of deaths across that age range attributable to the environment. In children under age five, communicable diseases and injuries have the greatest preventive potential through environmental action, while in older adults, NCDs and injuries offer most potential. A large fraction of death and disease in children under age five is still connected to living in households without access to basic services such as safe water and basic sanitation, or that are smoky due to the use of unclean fuels for cooking or unclean technologies.
CONCLUSION: TOWARDS HEALTHY ENVIRONMENTS 103

Low- and middle-income countries bear the greatest burden of environmental burden of disease: The total and per capita rate of deaths and disease burden linked to the environment tends to be higher in low- and middle-income countries. The burden of NCD and deaths, however, is not necessarily highest in the lowest income countries.
Environmental impacts on health are uneven across different social groups: Exposure to environmental risk factors is unequally distributed, and this unequal distribution is often related to social characteristics such as income, social status, employment and education, but also non-economic aspects such as gender, age and ethnicity.
More diseases evaluated with more solid methods: This update was able to take into account the contribution of additional disease categories compared with the previous analysis. And, as much as 68% of deaths (and 56% of the burden in DALYs) attributable to the environment could now be estimated with CRA methods, which are based on the most solid evidence.
Recognizing the important burden of disease linked to environmental risks and being able to point to the main areas of concern is of great significance. Given that much of this burden is preventable, although not always with immediately implementable and cost-effective interventions, working to reduce environmental health risks will greatly improve our health.
Reducing the burden of unhealthy environments
Several approaches will assist in reducing the burden linked to unhealthy environmental conditions and in promoting healthier lifestyles:
Focus on primary prevention: Shifting resources to disease prevention through reducing environmental risks will not only alleviate suffering and increase well-being,
but also lead to savings in health care. Some savings are immediate, for example reduced air pollution was shown to have an immediate effect on reducing health care, including emergency visits (Henschel et al, 2012). When evaluating the costs and benefits of prevention through healthier environments, avoided treatment costs and other externalities caused by unhealthy environments should be accounted for. The environment should be viewed as a key element for health protection and reduction of health inequalities and placed at the centre of primary prevention. This is an area where national and international leadership and cooperation will be essential.
Systematically consider health in all sectors: While the health sector can directly address certain environmental risks, others are usually managed by other sectors, and intersectoral action is essential. For example, reduced traffic congestion and improved public transport networks are important determinants of air pollution, and usually require cooperation with the transport sector and city planners. Using measures in all policy areas opens up an additional dimension in public health. Guidance on introducing Health in All Policies is available (WHO, 2015f). Sectors of particular relevance include energy, transport, industry/commerce, housing and water.
Promote and support local governance to address environmental health planning: Through their local scope and democratic nature, municipalities are natural leaders of local environment and health planning. They are often involved in developing the local economy, including transport, tourism and industry, and can play an important role in healthy planning if they are aware of the potential risks and benefits at stake, and provided with the tools and support they need. Today, more than half, and by 2050 more than 70%, of the world’s population will live in cities. Cities are often unhealthy places, characterized by heavy traffic, pollution, noise, violence and social isolation. City planning and management
PREVENTING DISEASE THROUGH HEALTHY ENVIRONMENTS104

are therefore of particular importance. Many success stories document local approaches promoting safe and healthy living in cities (WHO, 2015k; WHO Office for Europe, 2015).
Create healthy environments to support SDG achievement: The SDGs place healthy and equitable environments at the centre of their goals. Given the multiple linkages between sustainable development, environment and health in the SDGs, creating health-supportive, sustainable and equitable environments will be a prerequisite to the attainments of SDGs.
integrate actions to address the social determinants of health and provide basic services to all: As social determinants are closely linked to and mediate exposure to environmental risk factors, they need to be systematically integrated into risk monitoring and policy planning in order to reduce health inequalities. Also, providing universal access to basic services such as safe water, basic sanitation and access to clean fuels would provide great health benefits, in particular to the poorest in society.
introduce win-win strategies while building on low carbon approaches: Certain management strategies can lead to health, climate, environment, and social and development co-benefits. For example, well-conceived transport strategies can reduce air pollution, mitigate climate change and increase physical activity which all help prevent disease. They can also improve access to work and to health care. They are cost-effective and can remove certain market distortions that cause excessive motor vehicle travel leading to important negative externalities (WHO, 2011c). They can yield a wide range of equity benefits for vulnerable groups. Similar opportunities can be found in the energy and housing sectors. Changing consumption patterns and transport choices can further support such strategies.
Promote assessment of health impacts of projects and policies: The introduction of most policies and projects in a development
context will affect the environmental and social determinants of health. Tools such as health impact assessment (HIA) are available to measures or estimate these changes and translate them into predictions of health consequences, both positive and negative. It is important to perform such assessments at the planning stage in order to allow for adaptation of the project at the early concept and design stages if necessary. Assessments of health impacts need to cover health in a comprehensive way, either in a strategic, upstream and equality-focused manner, or with a sustainability, vulnerability and resilience focus. Addressing environmental determinants of health in development planning significantly reduces the transfer of hidden costs of development to the health sector.
Manage and prevent emerging risks including climate change: While solutions are available for many of the more traditional risks, emerging risks need to be closely monitored, mitigated and solutions put in place in a timely manner to avoid future burden. Climate change can affect health in many ways, ranging from heat stroke to increased risks from expanding areas of disease transmission of vector-borne diseases. Also, indirect effects may be considerable, such as malnutrition and reduced access to safe drinking-water sources, and possibly more wide-ranging effects causing political instability or migration. Climate change is therefore a major health challenge and one which is set to increase in the near term. Other risks also need to be monitored closely and adequately addressed, such as the use of hazardous chemicals in our daily lives. Not all social and environmental hazards to human health are equally understood and it essential to continue building our understanding. Trusted facts about health and environment can lead to the best possible decisions to protect people from environmental health risks and improve public health for the next decades.
CONCLUSION: TOWARDS HEALTHY ENVIRONMENTS 105
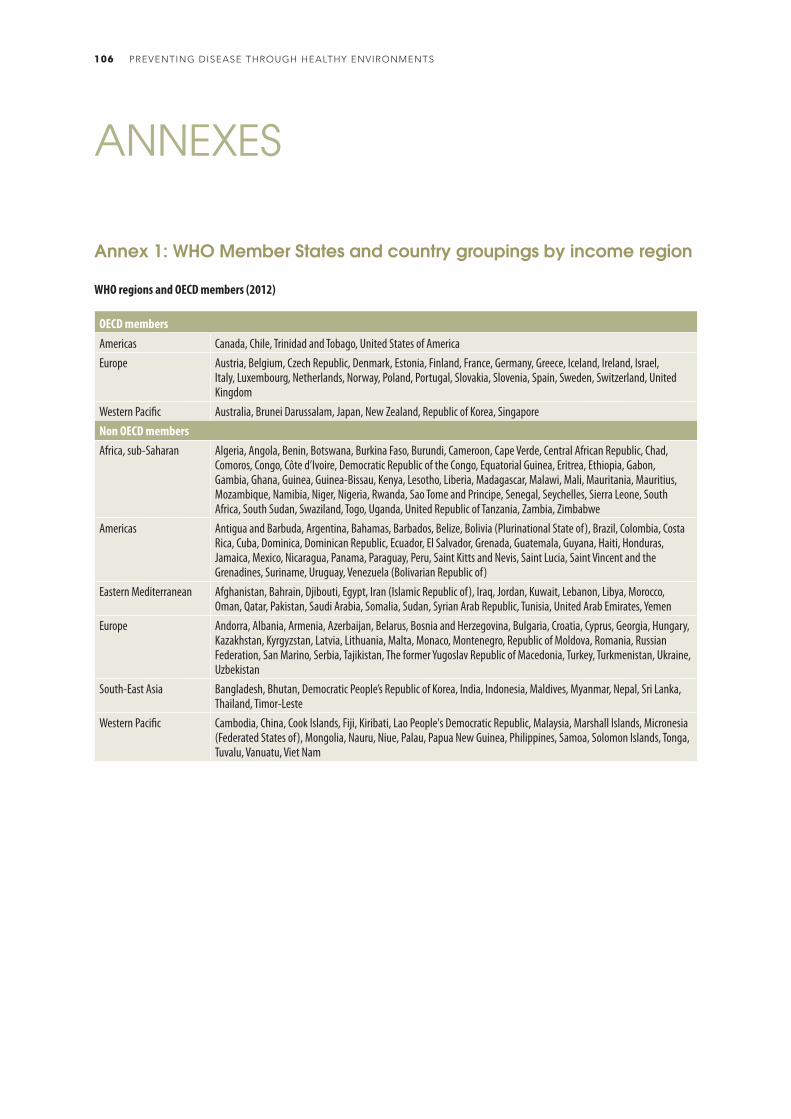
ANNEXES
OECD membersAmericas Canada, Chile, Trinidad and Tobago, United States of AmericaEurope Austria, Belgium, Czech Republic, Denmark, Estonia, Finland, France, Germany, Greece, Iceland, Ireland, Israel,
Italy, Luxembourg, Netherlands, Norway, Poland, Portugal, Slovakia, Slovenia, Spain, Sweden, Switzerland, United Kingdom
Western Pacific Australia, Brunei Darussalam, Japan, New Zealand, Republic of Korea, SingaporeNon OECD membersAfrica, sub-Saharan Algeria, Angola, Benin, Botswana, Burkina Faso, Burundi, Cameroon, Cape Verde, Central African Republic, Chad,
Comoros, Congo, Côte d’Ivoire, Democratic Republic of the Congo, Equatorial Guinea, Eritrea, Ethiopia, Gabon, Gambia, Ghana, Guinea, Guinea-Bissau, Kenya, Lesotho, Liberia, Madagascar, Malawi, Mali, Mauritania, Mauritius, Mozambique, Namibia, Niger, Nigeria, Rwanda, Sao Tome and Principe, Senegal, Seychelles, Sierra Leone, South Africa, South Sudan, Swaziland, Togo, Uganda, United Republic of Tanzania, Zambia, Zimbabwe
Americas Antigua and Barbuda, Argentina, Bahamas, Barbados, Belize, Bolivia (Plurinational State of), Brazil, Colombia, Costa Rica, Cuba, Dominica, Dominican Republic, Ecuador, El Salvador, Grenada, Guatemala, Guyana, Haiti, Honduras, Jamaica, Mexico, Nicaragua, Panama, Paraguay, Peru, Saint Kitts and Nevis, Saint Lucia, Saint Vincent and the Grenadines, Suriname, Uruguay, Venezuela (Bolivarian Republic of)
Eastern Mediterranean Afghanistan, Bahrain, Djibouti, Egypt, Iran (Islamic Republic of), Iraq, Jordan, Kuwait, Lebanon, Libya, Morocco, Oman, Qatar, Pakistan, Saudi Arabia, Somalia, Sudan, Syrian Arab Republic, Tunisia, United Arab Emirates, Yemen
Europe Andorra, Albania, Armenia, Azerbaijan, Belarus, Bosnia and Herzegovina, Bulgaria, Croatia, Cyprus, Georgia, Hungary, Kazakhstan, Kyrgyzstan, Latvia, Lithuania, Malta, Monaco, Montenegro, Republic of Moldova, Romania, Russian Federation, San Marino, Serbia, Tajikistan, The former Yugoslav Republic of Macedonia, Turkey, Turkmenistan, Ukraine, Uzbekistan
South-East Asia Bangladesh, Bhutan, Democratic People’s Republic of Korea, India, Indonesia, Maldives, Myanmar, Nepal, Sri Lanka, Thailand, Timor-Leste
Western Pacific Cambodia, China, Cook Islands, Fiji, Kiribati, Lao People's Democratic Republic, Malaysia, Marshall Islands, Micronesia (Federated States of), Mongolia, Nauru, Niue, Palau, Papua New Guinea, Philippines, Samoa, Solomon Islands, Tonga, Tuvalu, Vanuatu, Viet Nam
Annex 1: WHO Member States and country groupings by income region
WHO regions and OECD members (2012)
PREVENTING DISEASE THROUGH HEALTHY ENVIRONMENTS106
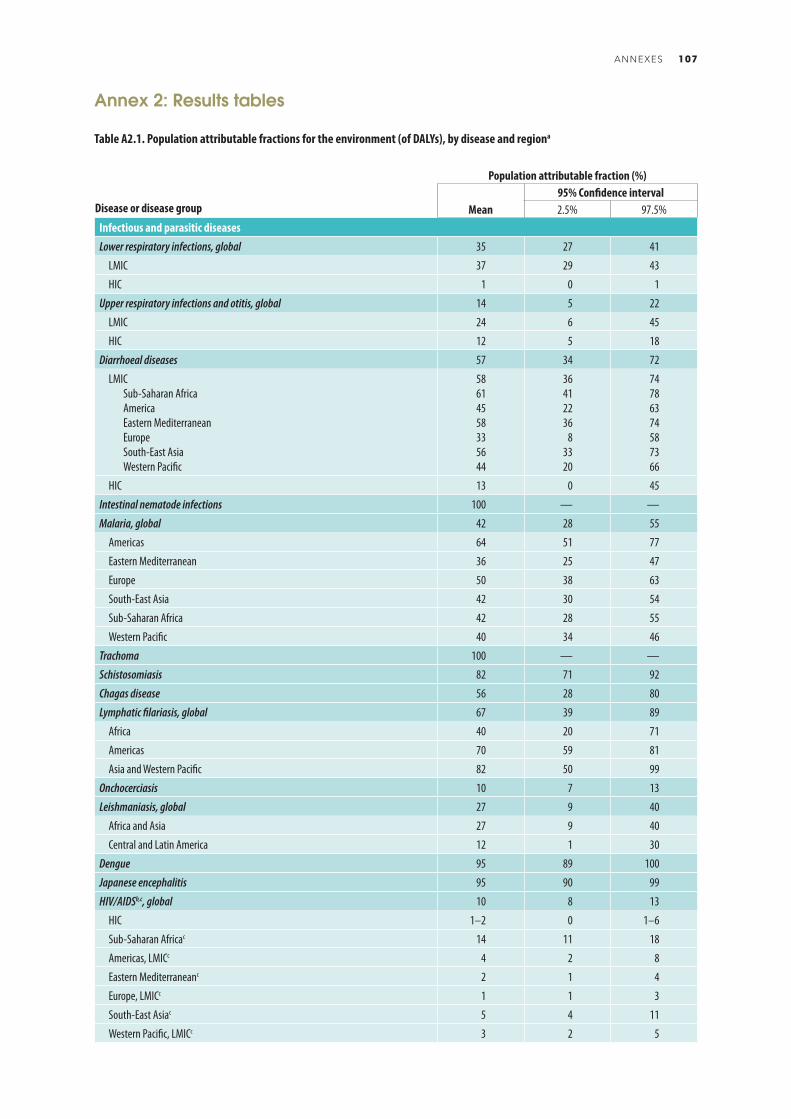
Population attributable fraction (%)
Disease or disease group Mean95% Confidence interval2.5% 97.5%
Infectious and parasitic diseasesLower respiratory infections, global 35 27 41
LMIC 37 29 43
HIC 1 0 1
Upper respiratory infections and otitis, global 14 5 22
LMIC 24 6 45
HIC 12 5 18
Diarrhoeal diseases 57 34 72
LMICSub-Saharan AfricaAmericaEastern MediterraneanEuropeSouth-East AsiaWestern Pacific
58614558335644
36412236
83320
74786374587366
HIC 13 0 45
Intestinal nematode infections 100 — —
Malaria, global 42 28 55
Americas 64 51 77
Eastern Mediterranean 36 25 47
Europe 50 38 63
South-East Asia 42 30 54
Sub-Saharan Africa 42 28 55
Western Pacific 40 34 46
Trachoma 100 — —
Schistosomiasis 82 71 92
Chagas disease 56 28 80
Lymphatic filariasis, global 67 39 89
Africa 40 20 71
Americas 70 59 81
Asia and Western Pacific 82 50 99
Onchocerciasis 10 7 13
Leishmaniasis, global 27 9 40
Africa and Asia 27 9 40
Central and Latin America 12 1 30
Dengue 95 89 100
Japanese encephalitis 95 90 99
HIV/AIDSb,c, global 10 8 13
HIC 1–2 0 1–6
Sub-Saharan Africac 14 11 18
Americas, LMICc 4 2 8
Eastern Mediterraneanc 2 1 4
Europe, LMICc 1 1 3
South-East Asiac 5 4 11
Western Pacific, LMICc 3 2 5
Table A2.1. Population attributable fractions for the environment (of DALYs), by disease and regiona
Annex 2: Results tables
ANNEXES 107
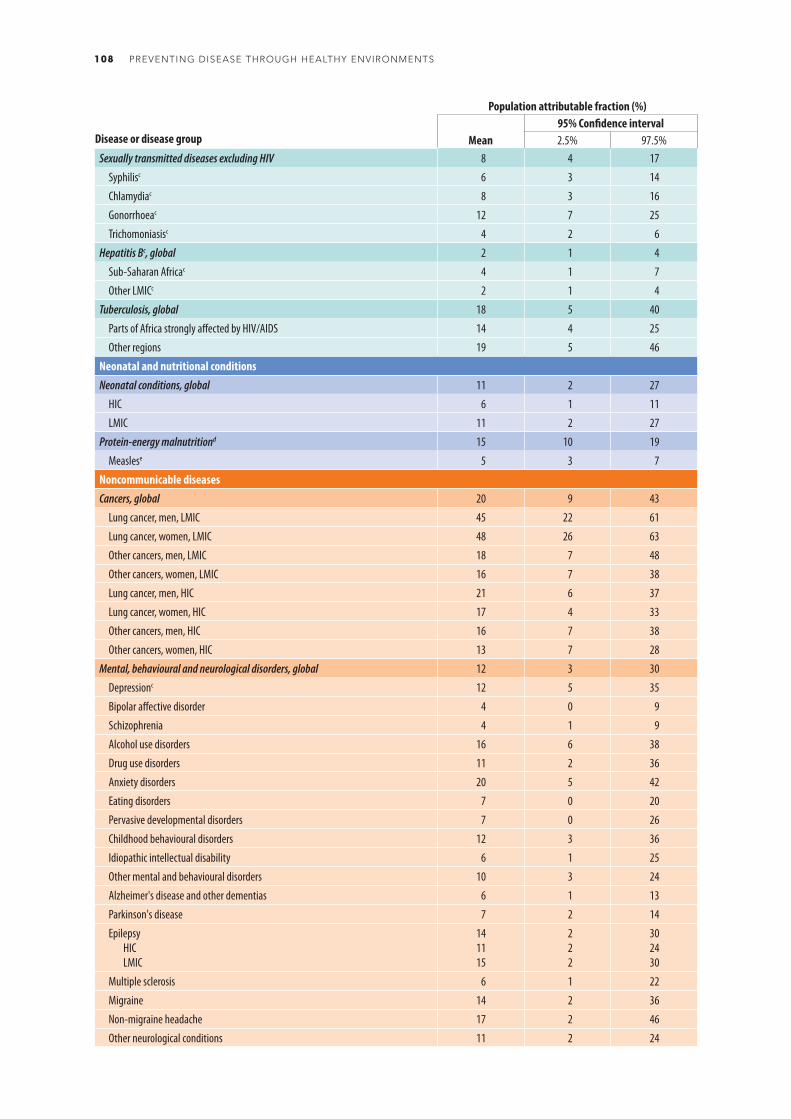
Population attributable fraction (%)
Disease or disease group Mean95% Confidence interval2.5% 97.5%
Sexually transmitted diseases excluding HIV 8 4 17
Syphilisc 6 3 14
Chlamydiac 8 3 16
Gonorrhoeac 12 7 25
Trichomoniasisc 4 2 6
Hepatitis Bc, global 2 1 4
Sub-Saharan Africac 4 1 7
Other LMICc 2 1 4
Tuberculosis, global 18 5 40
Parts of Africa strongly affected by HIV/AIDS 14 4 25
Other regions 19 5 46
Neonatal and nutritional conditionsNeonatal conditions, global 11 2 27
HIC 6 1 11
LMIC 11 2 27
Protein-energy malnutritiond 15 10 19
Measlese 5 3 7
Noncommunicable diseasesCancers, global 20 9 43
Lung cancer, men, LMIC 45 22 61
Lung cancer, women, LMIC 48 26 63
Other cancers, men, LMIC 18 7 48
Other cancers, women, LMIC 16 7 38
Lung cancer, men, HIC 21 6 37
Lung cancer, women, HIC 17 4 33
Other cancers, men, HIC 16 7 38
Other cancers, women, HIC 13 7 28
Mental, behavioural and neurological disorders, global 12 3 30
Depressionc 12 5 35
Bipolar affective disorder 4 0 9
Schizophrenia 4 1 9
Alcohol use disorders 16 6 38
Drug use disorders 11 2 36
Anxiety disorders 20 5 42
Eating disorders 7 0 20
Pervasive developmental disorders 7 0 26
Childhood behavioural disorders 12 3 36
Idiopathic intellectual disability 6 1 25
Other mental and behavioural disorders 10 3 24
Alzheimer's disease and other dementias 6 1 13
Parkinson's disease 7 2 14
EpilepsyHICLMIC
141115
222
302430
Multiple sclerosis 6 1 22
Migraine 14 2 36
Non-migraine headache 17 2 46
Other neurological conditions 11 2 24
PREVENTING DISEASE THROUGH HEALTHY ENVIRONMENTS108

Population attributable fraction (%)
Disease or disease group Mean95% Confidence interval2.5% 97.5%
Cataracts 24 14 33
Hearing loss 22 19 25
HIC 8 7 9
LMIC 24 21 28
Cardiovascular diseases 31 20 40
Rheumatic heart disease 2 1 4
Ischaemic heart disease, global 35 26 46
HIC 23 15 30
LMICAfricaAmericaEastern MediterraneanEuropeSouth-East AsiaWestern Pacific
39402837294640
30311927193630
50503749385851
Stroke, global 42 24 53
HIC 22 10 31
LMICAfricaAmericaEastern MediterraneanEuropeSouth-East AsiaWestern Pacific
46473042305047
27291523143127
57584255426159
Hypertensive heart disease 9 5 15
Chronic obstructive pulmonary disease, global 35 20 48
HIC 12 5 21
LMICAfricaAmericaEastern MediterraneanEuropeSouth-East AsiaWestern Pacific
38231729204340
2317
816
92624
52422734325754
Asthma 44 26 53
Musculoskeletal diseases, global 17 10 26
Rheumatoid arthritis 17 6 31
Osteoarthritis 20 11 29
Back and neck pain 27 17 41
Other musculoskeletal diseases 15 6 24
Congenital anomalies 5 1 10
Unintentional injuriesRoad traffic injuries, global 40 23 64
LMIC 42 25 65
Eastern Mediterranean, HIC 42 25 65
Europe, HIC 25 10 65
America and Western Pacific, HIC 17 0 50
Unintentional poisonings, global 73 53 90
Adults 68 50 87
Children 85 60 99
ANNEXES 109
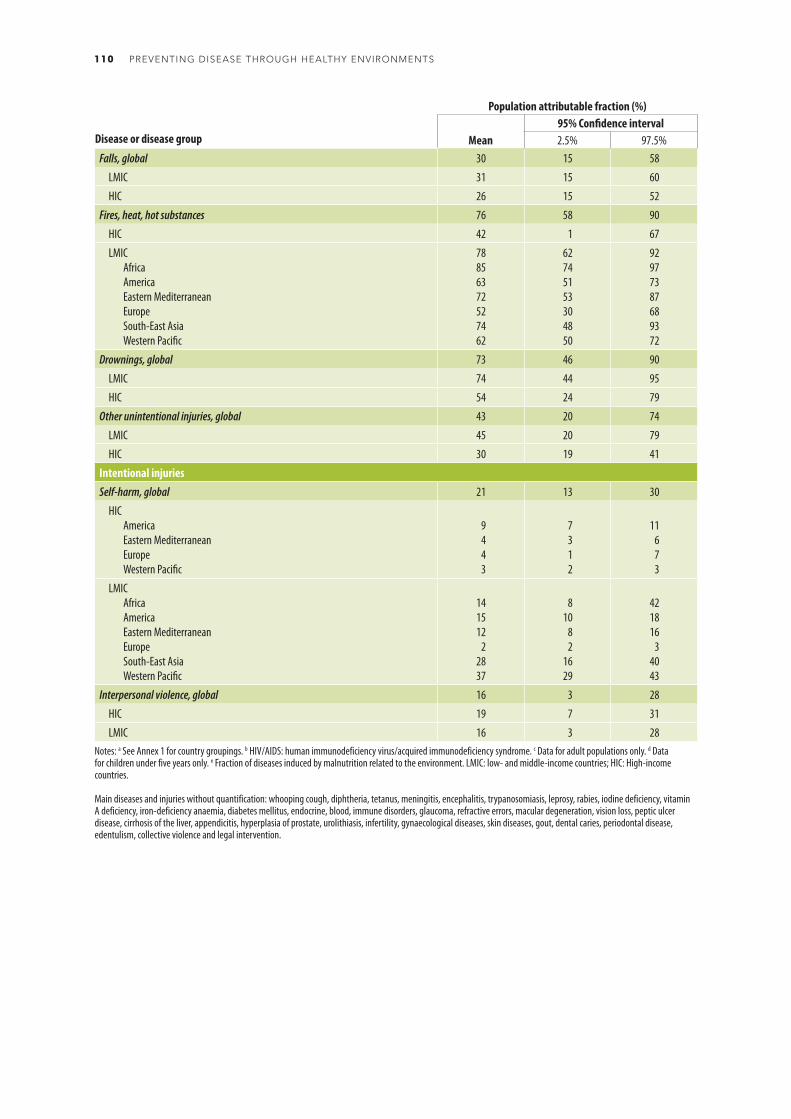
Population attributable fraction (%)
Disease or disease group Mean95% Confidence interval2.5% 97.5%
Falls, global 30 15 58
LMIC 31 15 60
HIC 26 15 52
Fires, heat, hot substances 76 58 90
HIC 42 1 67
LMICAfricaAmericaEastern MediterraneanEuropeSouth-East AsiaWestern Pacific
78856372527462
62745153304850
92977387689372
Drownings, global 73 46 90
LMIC 74 44 95
HIC 54 24 79
Other unintentional injuries, global 43 20 74
LMIC 45 20 79
HIC 30 19 41
Intentional injuriesSelf-harm, global 21 13 30
HICAmericaEastern MediterraneanEuropeWestern Pacific
9443
7312
11673
LMICAfricaAmericaEastern MediterraneanEuropeSouth-East AsiaWestern Pacific
141512
22837
810
82
1629
421816
34043
Interpersonal violence, global 16 3 28
HIC 19 7 31
LMIC 16 3 28Notes: a See Annex 1 for country groupings. b HIV/AIDS: human immunodeficiency virus/acquired immunodeficiency syndrome. c Data for adult populations only. d Data for children under five years only. e Fraction of diseases induced by malnutrition related to the environment. LMIC: low- and middle-income countries; HIC: High-income countries.
Main diseases and injuries without quantification: whooping cough, diphtheria, tetanus, meningitis, encephalitis, trypanosomiasis, leprosy, rabies, iodine deficiency, vitamin A deficiency, iron-deficiency anaemia, diabetes mellitus, endocrine, blood, immune disorders, glaucoma, refractive errors, macular degeneration, vision loss, peptic ulcer disease, cirrhosis of the liver, appendicitis, hyperplasia of prostate, urolithiasis, infertility, gynaecological diseases, skin diseases, gout, dental caries, periodontal disease, edentulism, collective violence and legal intervention.
PREVENTING DISEASE THROUGH HEALTHY ENVIRONMENTS110

Environmental risk factor
Disease or injury Wat
er, sa
nitat
ion an
d hyg
iene
Indo
or fu
el co
mbu
stion
Seco
nd-h
and t
obac
co sm
oke
Ambie
nt ai
r poll
ution
Noise
Chem
icalsa
Othe
r hou
sing r
isks
Recre
ation
al en
viron
men
t
Wat
er re
sour
ces m
anag
emen
t
Land
use a
nd bu
ilt en
viron
men
t
Othe
r com
mun
ity ris
ks
Radia
tion
Occu
patio
n
Clim
ate c
hang
e
Infectious and parasitic diseasesRespiratory infectionsDiarrhoeal diseasesIntestinal nematode infectionsMalariaTrachomaSchistosomiasisChagas diseaseLymphatic filariasisOnchocerciasisLeishmaniasisDengueJapanese encephalitisHIV/AIDSSTDsHepatitis B and CTuberculosisOther infectious diseasesNeonatal and nutritional diseasesNeonatal conditions Protein-energy malnutritionNoncommunicable diseasesCancers Neuropsychiatric disorders CataractsHearing lossCardiovascular diseasesChronic obstructive pulmonary diseaseAsthmaOther respiratory diseases
Chronic kidney diseases
Skin diseasesMusculoskeletal diseasesCongenital anomaliesInjuriesRoad traffic accidentsFallsDrowningsFiresPoisoningsOther unintentional injuriesViolenceSelf-harm
Notes: a Limited to industrial and agricultural chemicals and chemicals involved in acute poisonings.
Table A2.2. Indicative linkages between environmental risk factor and disease or injury
The environmental population attributable fractions are indicative values, based on CRA or expert opinion. The ranges of the population attributable fractions are: <5%; 5–25%; >25%.
ANNEXES 111

WorldTotal
WorldChildren
0–4 years
Africaa AmericasEastern
Mediterranean
EuropeSouth-East
Asia
Western Pacific
Sub-Saharan HIC OECD Non-OECD HIC OECD Non-OECD HIC OECD Non-OECDPopulation 7 044 272 076 651 316 807 903 366 628 369 808 057 586 970 922 601 534 755 479 378 896 425 104 643 1 833 358 645 203 762 708 1 640 986 822 Population
Total deaths 55 656 266 6 550 241 9 400 673 2 999 179 3 435 168 3 870 847 4 421 429 4 809 343 13 759 124 1 633 467 11 327 037 Total deaths
Total environmental deaths 12 624 495 1 709 860 2 176 353 320 135 526 754 854 396 538 490 877 254 3 821 244 187 434 3 322 435 Total environmental deaths
Burden attributable to the environment 22.7% 26% 23% 11% 15% 22% 12% 18% 28% 11% 29% Burden attributable to the environment
Infectious and parasitic diseases Infectious and parasitic diseasesRespiratory infections Respiratory infections
Lower respiratory infectionsb 566 361 566 361 298 263 102 8 272 77 553 73 4 364 145 735 48 31 951 Lower respiratory infectionsb
Upper respiratory infections and otitis 1 190 426 312 67 144 80 117 45 167 55 204 Upper respiratory infections and otitis
Diarrhoeal diseases 845 810 360 751 372 810 2 168 11 458 75 939 1 952 3084 363 904 327 14 167 Diarrhoeal diseases
Intestinal nematode infections 3 299 1 132 735 0 134 291 1 40 1 730 0 368 Intestinal nematode infections
Parasitic and vector diseases Parasitic and vector diseases
Malaria 258 702 199 623 234 733 6 469 4 251 26 4 17 806 3 1 405 Malaria
Trachoma 0 0 0 0 0 0 0 0 0 0 0 Trachoma
Schistosomiasis 17 871 875 15 003 2 504 1 559 2 0 0 3 798 Schistosomiasis
Chagas disease 4 371 2 0 40 4 192 0 2 0 0 0 137 Chagas disease
Lymphatic filariasis 1 0 0 0 1 0 0 0 0 0 0 Lymphatic filariasis
Onchocerciasis 0 0 0 0 0 0 0 0 0 0 0 Onchocerciasis
Leishmaniasis 12 952 2 190 3 842 0 92 1 613 3 82 6 964 0 355 Leishmaniasis
Dengue 27 249 3 392 1 863 1 2 946 877 126 374 14 907 1 6 154 Dengue
HIV/AIDSc 137 985 0 129 867 24 1 810 300 21 541 4 143 3 1 276 HIV/AIDSc
Sexually transmitted diseases excluding HIV 761 0 372 15 47 51 19 55 114 12 77 Sexually transmitted diseases excluding HIV
Acute hepatitis B 2 828 0 635 0 40 179 0 7 1 192 0 774 Acute hepatitis B
Tuberculosis 166 687 8 279 31 051 206 3 637 18 611 668 6 514 85 377 1 216 19 407 Tuberculosis
Other infectious diseases 160 234 28 906 55 256 2 966 8 448 17 449 2 843 721 59 823 1 865 10 862 Other infectious diseases
Neonatal and nutritional conditions Neonatal and nutritional conditionsNeonatal conditions 270 087 270 048 101 422 896 9 122 38 304 622 4 611 95 736 141 19 233 Neonatal conditions
Protein-energy malnutritiond 27 291 27 291 18 220 0 399 3 017 0 49 5 398 0 208 Protein-energy malnutritiond
Noncommunicable diseases Noncommunicable diseasesCancers Cancers
Trachea, bronchus, lung cancers 568 632 0 6 275 30 007 17 895 10 108 58 184 36 573 72 556 17 214 319 822 Trachea, bronchus, lung cancers
Other cancers 1 097 144 5 476 72 120 80 265 86 704 58 084 149 033 100 671 177 762 59 847 312 658 Other cancers
Mental, behavioural and neurological disorders
Mental, behavioural and neurological disorders
Unipolar depressive disorders 536 0 0 82 128 0 277 6 0 43 0 Unipolar depressive disorders
Bipolar disorder 30 0 0 7 4 0 17 0 0 2 0 Bipolar disorder
Schizophrenia 839 0 98 25 35 39 69 44 94 30 407 Schizophrenia
Alcohol use disorders 17 104 0 350 2 070 2 830 62 2 973 5 642 1 844 353 981 Alcohol use disorders
Drug use disorders 10 213 0 1 220 2 661 560 1 208 958 1 473 1 122 208 803 Drug use disorders
Anxiety disorders 13 0 0 7 3 0 2 0 0 1 0 Anxiety disorders
Eating disorders 636 0 86 94 77 45 111 50 52 34 87 Eating disorders
Pervasive developmental disorders 0 0 0 0 0 0 0 0 0 0 0 Pervasive developmental disorders
Childhood behavioural disorders 0 1 0 0 0 0 0 0 0 0 0 Childhood behavioural disorders
Idiopathic intellectual disability 106 0 0 33 21 0 37 7 0 7 0 Idiopathic intellectual disability
Alzheimer’s disease and other dementias 41 936 13 779 16 784 2 306 559 13 275 979 568 2 294 4 392 Alzheimer’s disease and other dementias
Parkinson’s disease 8 293 0 674 1 922 582 206 2 548 311 424 734 893 Parkinson’s disease
Epilepsy 30 031 2 866 13 013 272 1 381 2 255 1 081 968 8 084 169 2 808 Epilepsy
Table A2.3. Deaths attributable to the environment, by region, 2012
PREVENTING DISEASE THROUGH HEALTHY ENVIRONMENTS112

WorldTotal
WorldChildren
0–4 years
Africaa AmericasEastern
Mediterranean
EuropeSouth-East
Asia
Western Pacific
Sub-Saharan HIC OECD Non-OECD HIC OECD Non-OECD HIC OECD Non-OECDPopulation 7 044 272 076 651 316 807 903 366 628 369 808 057 586 970 922 601 534 755 479 378 896 425 104 643 1 833 358 645 203 762 708 1 640 986 822 Population
Total deaths 55 656 266 6 550 241 9 400 673 2 999 179 3 435 168 3 870 847 4 421 429 4 809 343 13 759 124 1 633 467 11 327 037 Total deaths
Total environmental deaths 12 624 495 1 709 860 2 176 353 320 135 526 754 854 396 538 490 877 254 3 821 244 187 434 3 322 435 Total environmental deaths
Burden attributable to the environment 22.7% 26% 23% 11% 15% 22% 12% 18% 28% 11% 29% Burden attributable to the environment
Infectious and parasitic diseases Infectious and parasitic diseasesRespiratory infections Respiratory infections
Lower respiratory infectionsb 566 361 566 361 298 263 102 8 272 77 553 73 4 364 145 735 48 31 951 Lower respiratory infectionsb
Upper respiratory infections and otitis 1 190 426 312 67 144 80 117 45 167 55 204 Upper respiratory infections and otitis
Diarrhoeal diseases 845 810 360 751 372 810 2 168 11 458 75 939 1 952 3084 363 904 327 14 167 Diarrhoeal diseases
Intestinal nematode infections 3 299 1 132 735 0 134 291 1 40 1 730 0 368 Intestinal nematode infections
Parasitic and vector diseases Parasitic and vector diseases
Malaria 258 702 199 623 234 733 6 469 4 251 26 4 17 806 3 1 405 Malaria
Trachoma 0 0 0 0 0 0 0 0 0 0 0 Trachoma
Schistosomiasis 17 871 875 15 003 2 504 1 559 2 0 0 3 798 Schistosomiasis
Chagas disease 4 371 2 0 40 4 192 0 2 0 0 0 137 Chagas disease
Lymphatic filariasis 1 0 0 0 1 0 0 0 0 0 0 Lymphatic filariasis
Onchocerciasis 0 0 0 0 0 0 0 0 0 0 0 Onchocerciasis
Leishmaniasis 12 952 2 190 3 842 0 92 1 613 3 82 6 964 0 355 Leishmaniasis
Dengue 27 249 3 392 1 863 1 2 946 877 126 374 14 907 1 6 154 Dengue
HIV/AIDSc 137 985 0 129 867 24 1 810 300 21 541 4 143 3 1 276 HIV/AIDSc
Sexually transmitted diseases excluding HIV 761 0 372 15 47 51 19 55 114 12 77 Sexually transmitted diseases excluding HIV
Acute hepatitis B 2 828 0 635 0 40 179 0 7 1 192 0 774 Acute hepatitis B
Tuberculosis 166 687 8 279 31 051 206 3 637 18 611 668 6 514 85 377 1 216 19 407 Tuberculosis
Other infectious diseases 160 234 28 906 55 256 2 966 8 448 17 449 2 843 721 59 823 1 865 10 862 Other infectious diseases
Neonatal and nutritional conditions Neonatal and nutritional conditionsNeonatal conditions 270 087 270 048 101 422 896 9 122 38 304 622 4 611 95 736 141 19 233 Neonatal conditions
Protein-energy malnutritiond 27 291 27 291 18 220 0 399 3 017 0 49 5 398 0 208 Protein-energy malnutritiond
Noncommunicable diseases Noncommunicable diseasesCancers Cancers
Trachea, bronchus, lung cancers 568 632 0 6 275 30 007 17 895 10 108 58 184 36 573 72 556 17 214 319 822 Trachea, bronchus, lung cancers
Other cancers 1 097 144 5 476 72 120 80 265 86 704 58 084 149 033 100 671 177 762 59 847 312 658 Other cancers
Mental, behavioural and neurological disorders
Mental, behavioural and neurological disorders
Unipolar depressive disorders 536 0 0 82 128 0 277 6 0 43 0 Unipolar depressive disorders
Bipolar disorder 30 0 0 7 4 0 17 0 0 2 0 Bipolar disorder
Schizophrenia 839 0 98 25 35 39 69 44 94 30 407 Schizophrenia
Alcohol use disorders 17 104 0 350 2 070 2 830 62 2 973 5 642 1 844 353 981 Alcohol use disorders
Drug use disorders 10 213 0 1 220 2 661 560 1 208 958 1 473 1 122 208 803 Drug use disorders
Anxiety disorders 13 0 0 7 3 0 2 0 0 1 0 Anxiety disorders
Eating disorders 636 0 86 94 77 45 111 50 52 34 87 Eating disorders
Pervasive developmental disorders 0 0 0 0 0 0 0 0 0 0 0 Pervasive developmental disorders
Childhood behavioural disorders 0 1 0 0 0 0 0 0 0 0 0 Childhood behavioural disorders
Idiopathic intellectual disability 106 0 0 33 21 0 37 7 0 7 0 Idiopathic intellectual disability
Alzheimer’s disease and other dementias 41 936 13 779 16 784 2 306 559 13 275 979 568 2 294 4 392 Alzheimer’s disease and other dementias
Parkinson’s disease 8 293 0 674 1 922 582 206 2 548 311 424 734 893 Parkinson’s disease
Epilepsy 30 031 2 866 13 013 272 1 381 2 255 1 081 968 8 084 169 2 808 Epilepsy
ANNEXES 113

WorldTotal
WorldChildren
0–4 years
Africaa AmericasEastern
Mediterranean
EuropeSouth-East
Asia
Western Pacific
Sub-Saharan HIC OECD Non-OECD HIC OECD Non-OECD HIC OECD Non-OECDMultiple sclerosis 1 141 0 74 279 74 52 356 96 76 19 114 Multiple sclerosis
Migraine 1 0 0 0 0 0 0 0 0 0 0 Migraine
Non-migraine headache 0 0 0 0 0 0 0 0 0 0 0 Non-migraine headache
Other mental, behavioural and neurological conditions 43 297 2 266 3 514 3 532 2 645 6 134 3 885 1 655 18 424 1 265 2 243 Other mental, behavioural and
neurological conditions
Sense organ diseases Sense organ diseases
Cataracts 0 0 0 0 0 0 0 0 0 0 0 Cataracts
Hearing loss 0 0 0 0 0 0 0 0 0 0 0 Hearing loss
Cardiovascular diseases Cardiovascular diseases
Rheumatic heart disease 6 934 0 634 30 272 856 192 374 3 481 30 1 064 Rheumatic heart disease
Hypertensive heart disease 93 652 0 8 256 3 141 12 757 9 174 7 486 6 272 27 758 935 17 872 Hypertensive heart disease
Ischaemic heart disease 2 273 811 0 123 389 73 791 102 528 169 272 128 693 370 319 670 993 30 024 604 802 Ischaemic heart disease
Stroke 2 476 553 0 197 662 22 750 73 131 126 762 76 700 199 052 657 284 34 225 1 088 988 Stroke
Other circulatory diseases 49 291 0 4 055 2 958 5 607 4 256 9 253 3 081 11 261 1 919 6 902 Other circulatory diseases
Respiratory diseases Respiratory diseases
Chronic obstructive pulmonary disease 1 193 590 0 33 881 21 040 18 940 38 261 20 578 20 058 600 908 4 383 435 540 Chronic obstructive pulmonary disease
Asthma 169 449 2 943 21 780 1 714 3 867 13 279 2 946 7 101 95 156 1 770 21 835 Asthma
Kidney diseases 27 143 0 2 609 1 073 3 045 2 854 2 027 614 11 374 775 2 771 Kidney diseases
Musculoskeletal diseases Musculoskeletal diseases
Rheumatoid arthritis 10 928 0 2 248 499 653 400 635 625 3 306 353 2 208 Rheumatoid arthritis
Osteoarthritis 829 0 0 179 228 0 344 15 0 63 0 Osteoarthritis
Back and neck pain 158 0 0 41 29 0 62 3 0 24 0 Back and neck pain
Other musculoskeletal disorders 20 666 0 2 193 1 666 2 323 698 2 627 1 099 5 706 943 3 412 Other musculoskeletal disorders
Congenital anomalies 27 770 22 471 7 536 692 2 443 3 719 670 1 392 7 517 191 3 610 Congenital anomalies
Injuries InjuriesUnintentional injuries Unintentional injuries
Road injury 497 079 21 091 85 188 6 483 48 482 55 165 7 034 15 052 141 743 2 494 135 436 Road injury
Poisonings 137 339 19 837 26 220 9 765 2 300 15 307 3 150 11 063 38 277 1 073 30 183 Poisonings
Falls 208 469 10 162 27 280 9 719 8 468 7 425 11 917 8 417 91 883 3 154 40 208 Falls
Fire, heat and hot substances 199 776 49 974 104 588 1 478 3 944 17 462 1 412 9 105 52 580 719 8 487 Fire, heat and hot substances
Drownings 268 166 48 565 56 906 2 650 13 081 21 269 2 996 16 132 96 311 4 443 54 377 Drownings
Other unintentional injuries 393 136 51 813 79 928 7 987 25 956 40 841 17 289 31 737 118 998 12 254 58 146 Other unintentional injuries
Intentional injuries Intentional injuries
Self-harm 164 394 0 8 789 4 465 5 251 3 437 2 216 2 070 88 025 1 518 48 623 Self-harm
Interpersonal violence 81 730 3 103 20 624 3 483 26 488 5 131 980 4 704 14 682 251 5 387 Interpersonal violenceNotes: a See Annex 1 for country grouping. b Lower respiratory infections in adults were not estimated. c HIV/AIDS: human immunodeficiency virus/acquired immunodeficiency syndrome. d Malnutrition and consequences.
PREVENTING DISEASE THROUGH HEALTHY ENVIRONMENTS114

WorldTotal
WorldChildren
0–4 years
Africaa AmericasEastern
Mediterranean
EuropeSouth-East
Asia
Western Pacific
Sub-Saharan HIC OECD Non-OECD HIC OECD Non-OECD HIC OECD Non-OECDMultiple sclerosis 1 141 0 74 279 74 52 356 96 76 19 114 Multiple sclerosis
Migraine 1 0 0 0 0 0 0 0 0 0 0 Migraine
Non-migraine headache 0 0 0 0 0 0 0 0 0 0 0 Non-migraine headache
Other mental, behavioural and neurological conditions 43 297 2 266 3 514 3 532 2 645 6 134 3 885 1 655 18 424 1 265 2 243 Other mental, behavioural and
neurological conditions
Sense organ diseases Sense organ diseases
Cataracts 0 0 0 0 0 0 0 0 0 0 0 Cataracts
Hearing loss 0 0 0 0 0 0 0 0 0 0 0 Hearing loss
Cardiovascular diseases Cardiovascular diseases
Rheumatic heart disease 6 934 0 634 30 272 856 192 374 3 481 30 1 064 Rheumatic heart disease
Hypertensive heart disease 93 652 0 8 256 3 141 12 757 9 174 7 486 6 272 27 758 935 17 872 Hypertensive heart disease
Ischaemic heart disease 2 273 811 0 123 389 73 791 102 528 169 272 128 693 370 319 670 993 30 024 604 802 Ischaemic heart disease
Stroke 2 476 553 0 197 662 22 750 73 131 126 762 76 700 199 052 657 284 34 225 1 088 988 Stroke
Other circulatory diseases 49 291 0 4 055 2 958 5 607 4 256 9 253 3 081 11 261 1 919 6 902 Other circulatory diseases
Respiratory diseases Respiratory diseases
Chronic obstructive pulmonary disease 1 193 590 0 33 881 21 040 18 940 38 261 20 578 20 058 600 908 4 383 435 540 Chronic obstructive pulmonary disease
Asthma 169 449 2 943 21 780 1 714 3 867 13 279 2 946 7 101 95 156 1 770 21 835 Asthma
Kidney diseases 27 143 0 2 609 1 073 3 045 2 854 2 027 614 11 374 775 2 771 Kidney diseases
Musculoskeletal diseases Musculoskeletal diseases
Rheumatoid arthritis 10 928 0 2 248 499 653 400 635 625 3 306 353 2 208 Rheumatoid arthritis
Osteoarthritis 829 0 0 179 228 0 344 15 0 63 0 Osteoarthritis
Back and neck pain 158 0 0 41 29 0 62 3 0 24 0 Back and neck pain
Other musculoskeletal disorders 20 666 0 2 193 1 666 2 323 698 2 627 1 099 5 706 943 3 412 Other musculoskeletal disorders
Congenital anomalies 27 770 22 471 7 536 692 2 443 3 719 670 1 392 7 517 191 3 610 Congenital anomalies
Injuries InjuriesUnintentional injuries Unintentional injuries
Road injury 497 079 21 091 85 188 6 483 48 482 55 165 7 034 15 052 141 743 2 494 135 436 Road injury
Poisonings 137 339 19 837 26 220 9 765 2 300 15 307 3 150 11 063 38 277 1 073 30 183 Poisonings
Falls 208 469 10 162 27 280 9 719 8 468 7 425 11 917 8 417 91 883 3 154 40 208 Falls
Fire, heat and hot substances 199 776 49 974 104 588 1 478 3 944 17 462 1 412 9 105 52 580 719 8 487 Fire, heat and hot substances
Drownings 268 166 48 565 56 906 2 650 13 081 21 269 2 996 16 132 96 311 4 443 54 377 Drownings
Other unintentional injuries 393 136 51 813 79 928 7 987 25 956 40 841 17 289 31 737 118 998 12 254 58 146 Other unintentional injuries
Intentional injuries Intentional injuries
Self-harm 164 394 0 8 789 4 465 5 251 3 437 2 216 2 070 88 025 1 518 48 623 Self-harm
Interpersonal violence 81 730 3 103 20 624 3 483 26 488 5 131 980 4 704 14 682 251 5 387 Interpersonal violenceNotes: a See Annex 1 for country grouping. b Lower respiratory infections in adults were not estimated. c HIV/AIDS: human immunodeficiency virus/acquired immunodeficiency syndrome. d Malnutrition and consequences.
ANNEXES 115
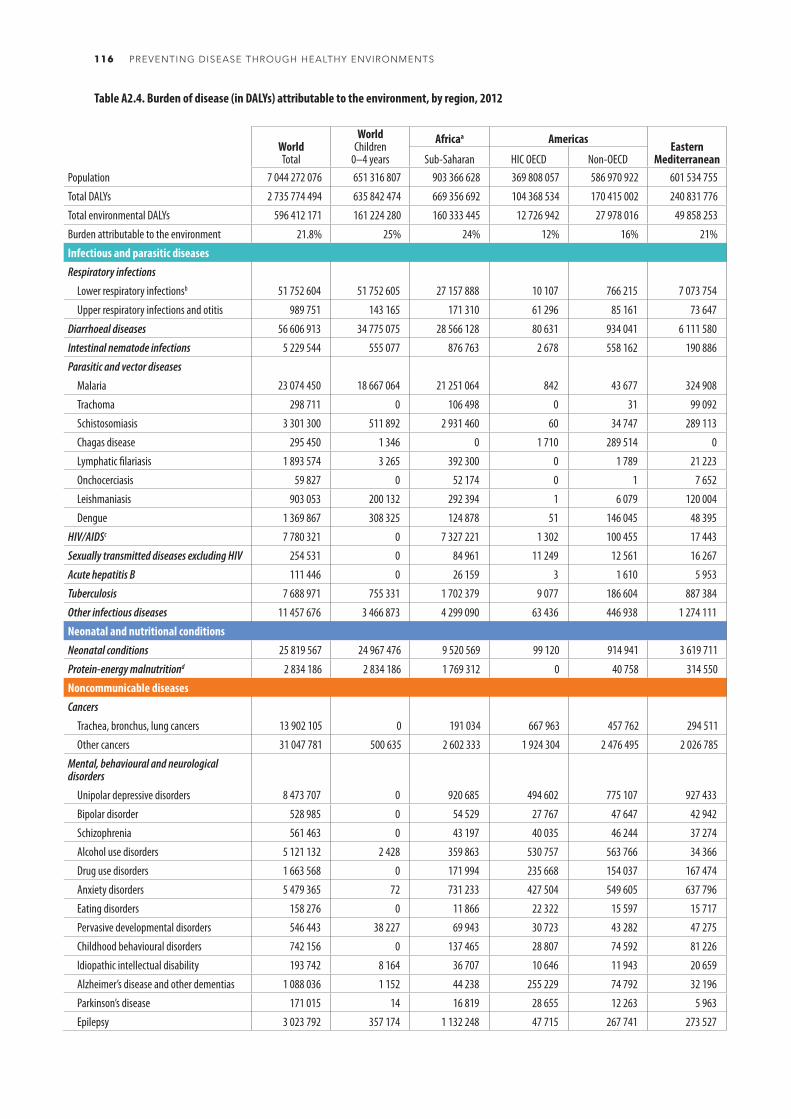
WorldTotal
WorldChildren
0–4 years
Africaa AmericasEastern
Mediterranean
EuropeSouth-East
Asia
Western Pacific
Sub-Saharan HIC OECD Non-OECD HIC OECD Non-OECD HIC OECD Non-OECDPopulation 7 044 272 076 651 316 807 903 366 628 369 808 057 586 970 922 601 534 755 479 378 896 425 104 643 1 833 358 645 203 762 708 1 640 986 822 Population
Total DALYs 2 735 774 494 635 842 474 669 356 692 104 368 534 170 415 002 240 831 776 137 262 179 177 124 905 739 598 145 50 642 692 446 174 570 Total deaths
Total environmental DALYs 596 412 171 161 224 280 160 333 445 12 726 942 27 978 016 49 858 253 18 202 832 30 532 811 176 691 631 6 471 334 113 616 908 Total environmental deaths
Burden attributable to the environment 21.8% 25% 24% 12% 16% 21% 13% 17% 24% 13% 25% Burden attributable to the environment
Infectious and parasitic diseases Infectious and parasitic diseasesRespiratory infections Respiratory infections
Lower respiratory infectionsb 51 752 604 51 752 605 27 157 888 10 107 766 215 7 073 754 8 166 399 686 13 369 591 5 169 2 962 029 Lower respiratory infectionsb
Upper respiratory infections and otitis 989 751 143 165 171 310 61 296 85 161 73 647 90 758 65 538 225 428 34 705 181 908 Upper respiratory infections and otitis
Diarrhoeal diseases 56 606 913 34 775 075 28 566 128 80 631 934 041 6 111 580 79 203 319 167 18 887 760 18 798 1 609 605 Diarrhoeal diseases
Intestinal nematode infections 5 229 544 555 077 876 763 2 678 558 162 190 886 11 12 400 1 614 719 1 285 1 972 642 Intestinal nematode infections
Parasitic and vector diseases Parasitic and vector diseases
Malaria 23 074 450 18 667 064 21 251 064 842 43 677 324 908 1 120 586 1 302 459 170 149 625 Malaria
Trachoma 298 711 0 106 498 0 31 99 092 0 0 7 405 0 85 684 Trachoma
Schistosomiasis 3 301 300 511 892 2 931 460 60 34 747 289 113 81 10 0 31 45 798 Schistosomiasis
Chagas disease 295 450 1 346 0 1 710 289 514 0 73 0 0 0 4 152 Chagas disease
Lymphatic filariasis 1 893 574 3 265 392 300 0 1 789 21 223 9 0 1 424 730 0 53 523 Lymphatic filariasis
Onchocerciasis 59 827 0 52 174 0 1 7 652 0 0 0 0 0 Onchocerciasis
Leishmaniasis 903 053 200 132 292 394 1 6 079 120 004 309 6 632 456 209 0 21 426 Leishmaniasis
Dengue 1 369 867 308 325 124 878 51 146 045 48 395 4 487 21 369 615 088 51 409 503 Dengue
HIV/AIDSc 7 780 321 0 7 327 221 1 302 100 455 17 443 1 262 27 298 235 687 138 69 518 HIV/AIDSc
Sexually transmitted diseases excluding HIV 254 531 0 84 961 11 249 12 561 16 267 13 895 18 457 43 049 5 530 48 560 Sexually transmitted diseases excluding HIV
Acute hepatitis B 111 446 0 26 159 3 1 610 5 953 8 380 51 856 6 25 471 Acute hepatitis B
Tuberculosis 7 688 971 755 331 1 702 379 9 077 186 604 887 384 25 449 359 302 3 552 501 36 766 929 509 Tuberculosis
Other infectious diseases 11 457 676 3 466 873 4 299 090 63 436 446 938 1 274 111 52 496 69 730 3 928 196 37 362 1 286 318 Other infectious diseases
Neonatal and nutritional conditions Neonatal and nutritional conditionsNeonatal conditions 25 819 567 24 967 476 9 520 569 99 120 914 941 3 619 711 72 737 461 205 9 137 636 19 022 1 974 627 Neonatal conditions
Protein-energy malnutritiond 2 834 186 2 834 186 1 769 312 0 40 758 314 550 0 6 900 665 296 0 37 369 Protein-energy malnutritiond
Noncommunicable diseases Noncommunicable diseasesCancers Cancers
Trachea, bronchus, lung cancers 13 902 105 0 191 034 667 963 457 762 294 511 1 332 363 1 025 478 2 117 211 338 474 7 477 309 Trachea, bronchus, lung cancers
Other cancers 31 047 781 500 635 2 602 333 1 924 304 2 476 495 2 026 785 3 197 395 2 769 716 6 111 023 1 249 847 8 689 884 Other cancers
Mental, behavioural and neurological disorders
Mental, behavioural and neurological disorders
Unipolar depressive disorders 8 473 707 0 920 685 494 602 775 107 927 433 277 6 0 43 0 Unipolar depressive disorders
Bipolar disorder 528 985 0 54 529 27 767 47 647 42 942 17 0 0 2 0 Bipolar disorder
Schizophrenia 561 463 0 43 197 40 035 46 244 37 274 69 44 94 30 407 Schizophrenia
Alcohol use disorders 5 121 132 2 428 359 863 530 757 563 766 34 366 2 973 5 642 1 844 353 981 Alcohol use disorders
Drug use disorders 1 663 568 0 171 994 235 668 154 037 167 474 958 1 473 1 122 208 803 Drug use disorders
Anxiety disorders 5 479 365 72 731 233 427 504 549 605 637 796 2 0 0 1 0 Anxiety disorders
Eating disorders 158 276 0 11 866 22 322 15 597 15 717 111 50 52 34 87 Eating disorders
Pervasive developmental disorders 546 443 38 227 69 943 30 723 43 282 47 275 0 0 0 0 0 Pervasive developmental disorders
Childhood behavioural disorders 742 156 0 137 465 28 807 74 592 81 226 0 0 0 0 0 Childhood behavioural disorders
Idiopathic intellectual disability 193 742 8 164 36 707 10 646 11 943 20 659 37 7 0 7 0 Idiopathic intellectual disability
Alzheimer’s disease and other dementias 1 088 036 1 152 44 238 255 229 74 792 32 196 13 275 979 568 2 294 4 392 Alzheimer’s disease and other dementias
Parkinson’s disease 171 015 14 16 819 28 655 12 263 5 963 2 548 311 424 734 893 Parkinson’s disease
Epilepsy 3 023 792 357 174 1 132 248 47 715 267 741 273 527 1 081 968 8 084 169 2 808 Epilepsy
Table A2.4. Burden of disease (in DALYs) attributable to the environment, by region, 2012
PREVENTING DISEASE THROUGH HEALTHY ENVIRONMENTS116
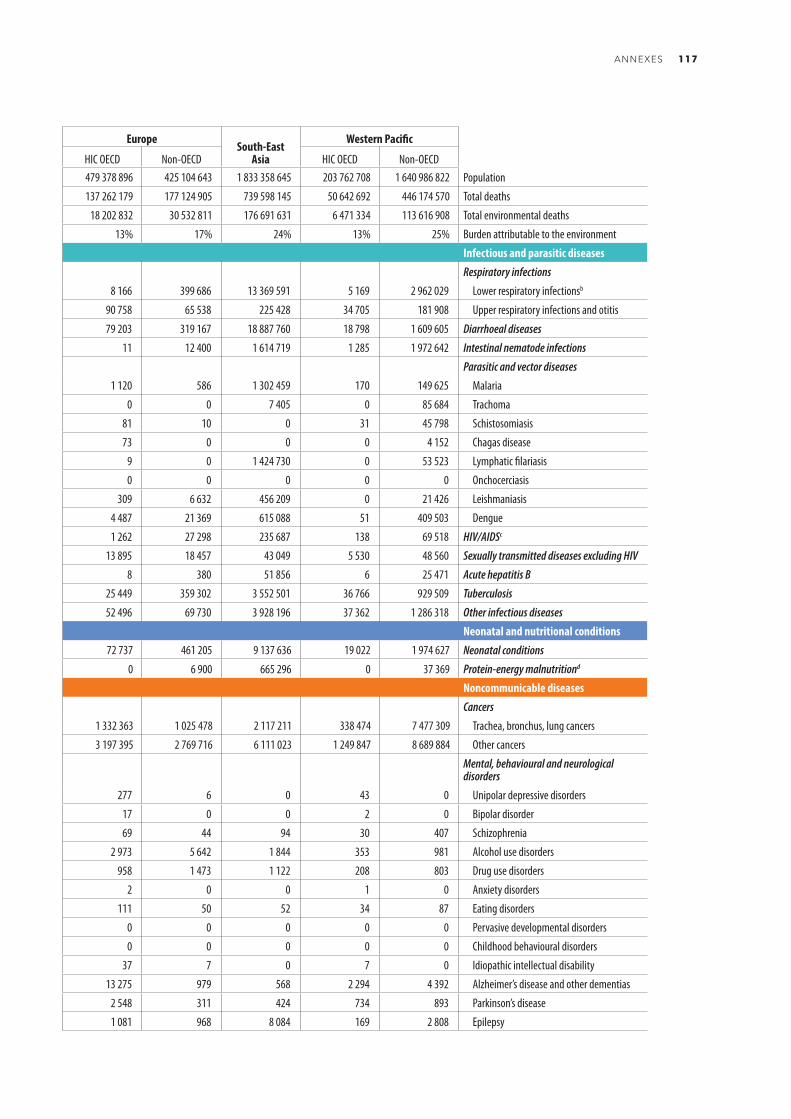
WorldTotal
WorldChildren
0–4 years
Africaa AmericasEastern
Mediterranean
EuropeSouth-East
Asia
Western Pacific
Sub-Saharan HIC OECD Non-OECD HIC OECD Non-OECD HIC OECD Non-OECDPopulation 7 044 272 076 651 316 807 903 366 628 369 808 057 586 970 922 601 534 755 479 378 896 425 104 643 1 833 358 645 203 762 708 1 640 986 822 Population
Total DALYs 2 735 774 494 635 842 474 669 356 692 104 368 534 170 415 002 240 831 776 137 262 179 177 124 905 739 598 145 50 642 692 446 174 570 Total deaths
Total environmental DALYs 596 412 171 161 224 280 160 333 445 12 726 942 27 978 016 49 858 253 18 202 832 30 532 811 176 691 631 6 471 334 113 616 908 Total environmental deaths
Burden attributable to the environment 21.8% 25% 24% 12% 16% 21% 13% 17% 24% 13% 25% Burden attributable to the environment
Infectious and parasitic diseases Infectious and parasitic diseasesRespiratory infections Respiratory infections
Lower respiratory infectionsb 51 752 604 51 752 605 27 157 888 10 107 766 215 7 073 754 8 166 399 686 13 369 591 5 169 2 962 029 Lower respiratory infectionsb
Upper respiratory infections and otitis 989 751 143 165 171 310 61 296 85 161 73 647 90 758 65 538 225 428 34 705 181 908 Upper respiratory infections and otitis
Diarrhoeal diseases 56 606 913 34 775 075 28 566 128 80 631 934 041 6 111 580 79 203 319 167 18 887 760 18 798 1 609 605 Diarrhoeal diseases
Intestinal nematode infections 5 229 544 555 077 876 763 2 678 558 162 190 886 11 12 400 1 614 719 1 285 1 972 642 Intestinal nematode infections
Parasitic and vector diseases Parasitic and vector diseases
Malaria 23 074 450 18 667 064 21 251 064 842 43 677 324 908 1 120 586 1 302 459 170 149 625 Malaria
Trachoma 298 711 0 106 498 0 31 99 092 0 0 7 405 0 85 684 Trachoma
Schistosomiasis 3 301 300 511 892 2 931 460 60 34 747 289 113 81 10 0 31 45 798 Schistosomiasis
Chagas disease 295 450 1 346 0 1 710 289 514 0 73 0 0 0 4 152 Chagas disease
Lymphatic filariasis 1 893 574 3 265 392 300 0 1 789 21 223 9 0 1 424 730 0 53 523 Lymphatic filariasis
Onchocerciasis 59 827 0 52 174 0 1 7 652 0 0 0 0 0 Onchocerciasis
Leishmaniasis 903 053 200 132 292 394 1 6 079 120 004 309 6 632 456 209 0 21 426 Leishmaniasis
Dengue 1 369 867 308 325 124 878 51 146 045 48 395 4 487 21 369 615 088 51 409 503 Dengue
HIV/AIDSc 7 780 321 0 7 327 221 1 302 100 455 17 443 1 262 27 298 235 687 138 69 518 HIV/AIDSc
Sexually transmitted diseases excluding HIV 254 531 0 84 961 11 249 12 561 16 267 13 895 18 457 43 049 5 530 48 560 Sexually transmitted diseases excluding HIV
Acute hepatitis B 111 446 0 26 159 3 1 610 5 953 8 380 51 856 6 25 471 Acute hepatitis B
Tuberculosis 7 688 971 755 331 1 702 379 9 077 186 604 887 384 25 449 359 302 3 552 501 36 766 929 509 Tuberculosis
Other infectious diseases 11 457 676 3 466 873 4 299 090 63 436 446 938 1 274 111 52 496 69 730 3 928 196 37 362 1 286 318 Other infectious diseases
Neonatal and nutritional conditions Neonatal and nutritional conditionsNeonatal conditions 25 819 567 24 967 476 9 520 569 99 120 914 941 3 619 711 72 737 461 205 9 137 636 19 022 1 974 627 Neonatal conditions
Protein-energy malnutritiond 2 834 186 2 834 186 1 769 312 0 40 758 314 550 0 6 900 665 296 0 37 369 Protein-energy malnutritiond
Noncommunicable diseases Noncommunicable diseasesCancers Cancers
Trachea, bronchus, lung cancers 13 902 105 0 191 034 667 963 457 762 294 511 1 332 363 1 025 478 2 117 211 338 474 7 477 309 Trachea, bronchus, lung cancers
Other cancers 31 047 781 500 635 2 602 333 1 924 304 2 476 495 2 026 785 3 197 395 2 769 716 6 111 023 1 249 847 8 689 884 Other cancers
Mental, behavioural and neurological disorders
Mental, behavioural and neurological disorders
Unipolar depressive disorders 8 473 707 0 920 685 494 602 775 107 927 433 277 6 0 43 0 Unipolar depressive disorders
Bipolar disorder 528 985 0 54 529 27 767 47 647 42 942 17 0 0 2 0 Bipolar disorder
Schizophrenia 561 463 0 43 197 40 035 46 244 37 274 69 44 94 30 407 Schizophrenia
Alcohol use disorders 5 121 132 2 428 359 863 530 757 563 766 34 366 2 973 5 642 1 844 353 981 Alcohol use disorders
Drug use disorders 1 663 568 0 171 994 235 668 154 037 167 474 958 1 473 1 122 208 803 Drug use disorders
Anxiety disorders 5 479 365 72 731 233 427 504 549 605 637 796 2 0 0 1 0 Anxiety disorders
Eating disorders 158 276 0 11 866 22 322 15 597 15 717 111 50 52 34 87 Eating disorders
Pervasive developmental disorders 546 443 38 227 69 943 30 723 43 282 47 275 0 0 0 0 0 Pervasive developmental disorders
Childhood behavioural disorders 742 156 0 137 465 28 807 74 592 81 226 0 0 0 0 0 Childhood behavioural disorders
Idiopathic intellectual disability 193 742 8 164 36 707 10 646 11 943 20 659 37 7 0 7 0 Idiopathic intellectual disability
Alzheimer’s disease and other dementias 1 088 036 1 152 44 238 255 229 74 792 32 196 13 275 979 568 2 294 4 392 Alzheimer’s disease and other dementias
Parkinson’s disease 171 015 14 16 819 28 655 12 263 5 963 2 548 311 424 734 893 Parkinson’s disease
Epilepsy 3 023 792 357 174 1 132 248 47 715 267 741 273 527 1 081 968 8 084 169 2 808 Epilepsy
ANNEXES 117

WorldTotal
WorldChildren
0–4 years
Africaa AmericasEastern
Mediterranean
EuropeSouth-East
Asia
Western Pacific
Sub-Saharan HIC OECD Non-OECD HIC OECD Non-OECD HIC OECD Non-OECDMultiple sclerosis 69 729 0 5 022 12 614 4 335 3 411 16 313 6 880 8 490 1 818 10 845 Multiple sclerosis
Migraine 2 585 608 0 242 564 112 481 232 561 204 878 220 135 197 035 921 492 72 762 381 700 Migraine
Non-migraine headache 310 613 0 29 863 19 899 25 336 24 207 25 473 20 949 78 068 9 246 77 571 Non-migraine headache
Other mental, behavioural and neurological conditions 1 985 121 206 216 217 336 128 161 143 041 250 543 140 231 97 321 822 753 47 120 138 617 Other mental, behavioural and
neurological conditions
Sense organ diseases Sense organ diseases
Cataracts 1 669 157 0 235 973 851 40 681 81 844 206 18 504 969 175 65 321 859 Cataracts
Hearing loss 4 787 242 0 600 608 49 085 367 151 293 391 67 242 189 427 1 826 465 27 238 1 366 634 Hearing loss
Cardiovascular diseases Cardiovascular diseases
Rheumatic heart disease 217 314 0 20 991 740 7 677 26 189 3 499 11 691 115 761 608 30 158 Rheumatic heart disease
Hypertensive heart disease 2 146 830 0 222 310 69 819 281 562 224 629 102 499 127 944 725 659 13 432 378 975 Hypertensive heart disease
Ischaemic heart disease 58 561 916 0 3 775 365 1 673 723 2 731 148 4 657 652 2 564 792 8 678 496 19 643 744 659 166 14 177 830 Ischaemic heart disease
Stroke 58 985 983 0 5 516 929 561 239 1 846 792 3 112 672 1 374 988 4 296 351 16 896 984 698 109 24 681 920 Stroke
Other circulatory diseases 1 355 822 0 133 919 65 941 152 420 132 648 165 048 87 443 392 457 32 889 193 057 Other circulatory diseases
Respiratory diseases Respiratory diseases
Chronic obstructive pulmonary disease 32 280 161 0 1 881 755 554 208 594 488 1 391 180 522 089 696 443 17 383 610 112 238 9 144 149 Chronic obstructive pulmonary disease
Asthma 11 055 150 452 706 2 042 595 555 583 967 688 994 522 657 864 473 718 3 968 056 250 972 1 144 152 Asthma
Kidney diseases 759 826 0 77 616 24 212 81 221 76 848 42 726 20 818 329 745 15 482 91 157 Kidney diseases
Musculoskeletal diseases Musculoskeletal diseases
Rheumatoid arthritis 934 393 0 114 159 90 901 76 488 42 201 129 468 69 606 187 764 55 970 167 837 Rheumatoid arthritis
Osteoarthritis 3 606 529 0 280 213 244 814 334 484 264 227 306 755 333 113 656 218 191 134 995 571 Osteoarthritis
Back and neck pain 14 627 733 0 1 565 782 572 840 1 018 584 1 033 471 1 068 823 877 639 3 399 336 432 705 4 658 552 Back and neck pain
Other musculoskeletal disorders 4 961 741 0 481 736 505 407 441 797 293 319 509 303 357 678 1 034 603 251 450 1 086 447 Other musculoskeletal disorders
Congenital anomalies 2 621 857 2 088 287 700 956 61 457 230 157 333 263 56 518 130 475 729 629 18 081 361 322 Congenital anomalies
Injuries InjuriesUnintentional injuries Unintentional injuries
Road injury 31 000 887 1 929 893 5 846 221 389 959 2 945 448 3 534 231 646 547 1 051 591 8 763 491 156 437 7 666 963 Road injury
Poisonings 7 824 627 1 800 107 1 920 884 478 601 151 625 973 111 117 056 510 733 2 169 242 41 509 1 461 868 Poisonings
Falls 12 671 696 942 880 1 938 627 434 312 602 330 764 211 1 150 743 820 416 4 019 023 338 818 2 603 216 Falls
Fire, heat and hot substances 13 665 389 4 544 990 7 684 642 81 183 259 870 1 197 214 78 917 432 183 3 398 261 33 385 499 735 Fire, heat and hot substances
Drownings 16 948 334 4 403 865 4 160 346 146 991 828 903 1 520 975 132 851 876 197 6 120 912 104 509 3 056 652 Drownings
Other unintentional injuries 23 133 586 4 722 549 5 604 214 363 301 1 600 105 2 759 063 615 412 1 754 678 6 553 038 367 115 3 516 659 Other unintentional injuries
Intentional injuries Intentional injuries
Self-harm 8 119 700 0 487 580 202 142 276 416 185 850 88 092 98 611 4 930 408 60 590 1 790 009 Self-harm
Interpersonal violence 5 101 921 283 108 1 368 538 212 219 1 595 507 341 689 68 028 254 521 881 375 18 517 361 529 Interpersonal violenceNotes: a See Annex 1 for country grouping. b Lower respiratory infections in adults were not estimated. c HIV/AIDS: human immunodeficiency virus/acquired immunodeficiency syndrome. d Malnutrition and consequences.
PREVENTING DISEASE THROUGH HEALTHY ENVIRONMENTS118

WorldTotal
WorldChildren
0–4 years
Africaa AmericasEastern
Mediterranean
EuropeSouth-East
Asia
Western Pacific
Sub-Saharan HIC OECD Non-OECD HIC OECD Non-OECD HIC OECD Non-OECDMultiple sclerosis 69 729 0 5 022 12 614 4 335 3 411 16 313 6 880 8 490 1 818 10 845 Multiple sclerosis
Migraine 2 585 608 0 242 564 112 481 232 561 204 878 220 135 197 035 921 492 72 762 381 700 Migraine
Non-migraine headache 310 613 0 29 863 19 899 25 336 24 207 25 473 20 949 78 068 9 246 77 571 Non-migraine headache
Other mental, behavioural and neurological conditions 1 985 121 206 216 217 336 128 161 143 041 250 543 140 231 97 321 822 753 47 120 138 617 Other mental, behavioural and
neurological conditions
Sense organ diseases Sense organ diseases
Cataracts 1 669 157 0 235 973 851 40 681 81 844 206 18 504 969 175 65 321 859 Cataracts
Hearing loss 4 787 242 0 600 608 49 085 367 151 293 391 67 242 189 427 1 826 465 27 238 1 366 634 Hearing loss
Cardiovascular diseases Cardiovascular diseases
Rheumatic heart disease 217 314 0 20 991 740 7 677 26 189 3 499 11 691 115 761 608 30 158 Rheumatic heart disease
Hypertensive heart disease 2 146 830 0 222 310 69 819 281 562 224 629 102 499 127 944 725 659 13 432 378 975 Hypertensive heart disease
Ischaemic heart disease 58 561 916 0 3 775 365 1 673 723 2 731 148 4 657 652 2 564 792 8 678 496 19 643 744 659 166 14 177 830 Ischaemic heart disease
Stroke 58 985 983 0 5 516 929 561 239 1 846 792 3 112 672 1 374 988 4 296 351 16 896 984 698 109 24 681 920 Stroke
Other circulatory diseases 1 355 822 0 133 919 65 941 152 420 132 648 165 048 87 443 392 457 32 889 193 057 Other circulatory diseases
Respiratory diseases Respiratory diseases
Chronic obstructive pulmonary disease 32 280 161 0 1 881 755 554 208 594 488 1 391 180 522 089 696 443 17 383 610 112 238 9 144 149 Chronic obstructive pulmonary disease
Asthma 11 055 150 452 706 2 042 595 555 583 967 688 994 522 657 864 473 718 3 968 056 250 972 1 144 152 Asthma
Kidney diseases 759 826 0 77 616 24 212 81 221 76 848 42 726 20 818 329 745 15 482 91 157 Kidney diseases
Musculoskeletal diseases Musculoskeletal diseases
Rheumatoid arthritis 934 393 0 114 159 90 901 76 488 42 201 129 468 69 606 187 764 55 970 167 837 Rheumatoid arthritis
Osteoarthritis 3 606 529 0 280 213 244 814 334 484 264 227 306 755 333 113 656 218 191 134 995 571 Osteoarthritis
Back and neck pain 14 627 733 0 1 565 782 572 840 1 018 584 1 033 471 1 068 823 877 639 3 399 336 432 705 4 658 552 Back and neck pain
Other musculoskeletal disorders 4 961 741 0 481 736 505 407 441 797 293 319 509 303 357 678 1 034 603 251 450 1 086 447 Other musculoskeletal disorders
Congenital anomalies 2 621 857 2 088 287 700 956 61 457 230 157 333 263 56 518 130 475 729 629 18 081 361 322 Congenital anomalies
Injuries InjuriesUnintentional injuries Unintentional injuries
Road injury 31 000 887 1 929 893 5 846 221 389 959 2 945 448 3 534 231 646 547 1 051 591 8 763 491 156 437 7 666 963 Road injury
Poisonings 7 824 627 1 800 107 1 920 884 478 601 151 625 973 111 117 056 510 733 2 169 242 41 509 1 461 868 Poisonings
Falls 12 671 696 942 880 1 938 627 434 312 602 330 764 211 1 150 743 820 416 4 019 023 338 818 2 603 216 Falls
Fire, heat and hot substances 13 665 389 4 544 990 7 684 642 81 183 259 870 1 197 214 78 917 432 183 3 398 261 33 385 499 735 Fire, heat and hot substances
Drownings 16 948 334 4 403 865 4 160 346 146 991 828 903 1 520 975 132 851 876 197 6 120 912 104 509 3 056 652 Drownings
Other unintentional injuries 23 133 586 4 722 549 5 604 214 363 301 1 600 105 2 759 063 615 412 1 754 678 6 553 038 367 115 3 516 659 Other unintentional injuries
Intentional injuries Intentional injuries
Self-harm 8 119 700 0 487 580 202 142 276 416 185 850 88 092 98 611 4 930 408 60 590 1 790 009 Self-harm
Interpersonal violence 5 101 921 283 108 1 368 538 212 219 1 595 507 341 689 68 028 254 521 881 375 18 517 361 529 Interpersonal violenceNotes: a See Annex 1 for country grouping. b Lower respiratory infections in adults were not estimated. c HIV/AIDS: human immunodeficiency virus/acquired immunodeficiency syndrome. d Malnutrition and consequences.
ANNEXES 119

Annex 3: Technical annex on methods
Annex 3.1. Calculation of population attributable fractions
A generalized population attributable fraction can be calculated for an exposure distributed continuously across the study population (Ezzati et al, 2003):
2. Methods
𝑃𝑃𝑃𝑃𝑃𝑃 = 1 − ∏(1 − 𝑃𝑃𝑃𝑃𝑃𝑃𝑟𝑟)𝑅𝑅
𝑟𝑟=1
𝑃𝑃𝐴𝐴 = 𝑃𝑃𝑃𝑃𝑃𝑃 × 𝐴𝐴
𝑃𝑃𝐴𝐴(𝐷𝐷𝑃𝑃𝐷𝐷𝐷𝐷𝐷𝐷) = 𝑃𝑃𝑃𝑃𝑃𝑃 × 𝐴𝐴(𝐷𝐷𝑃𝑃𝐷𝐷𝐷𝐷𝐷𝐷)
Annex 3
-
(Equation 1)
(Equation 1)
dxxPxRRm
x0
)()( dxxPxRRm
x0
)(')(
m
x
dxxPxRR0
)()(
PAF = =
Where:x = Exposure level.P(x) = Population distribution of exposure.P’(x) = Alternative (“counterfactual”) population distribution of exposure.RR(x) = Relative risk at exposure level x compared with the reference level.M = Maximum exposure level.
When the exposure becomes a categorical variable, the formula for the population attributable fraction gets simplified (Last, 2001):
PAF = Σ Pi RRi - Σ Pi' RRi
Σ Pi RRi
(Equation2)
PAF = Σ Pi RRi - 1
Σ Pi RRi
(Equation 3)
Where:PAF = Population attributable fraction.Pi = Proportion of the population in exposure category i.Pi’ = Proportion of the population in the alternative exposure category i.RRi = Relative risk at exposure category i compared with the reference level.
If the risk factor were to be completely removed, or if exposed populations were to be compared with unexposed populations, the burden of disease reduction can be calculated from a simplified form of the above formula:
PAF = Σ Pi RRi - Σ Pi' RRi
Σ Pi RRi
(Equation2)
PAF = Σ Pi RRi - 1
Σ Pi RRi
(Equation 3)
PREVENTING DISEASE THROUGH HEALTHY ENVIRONMENTS120
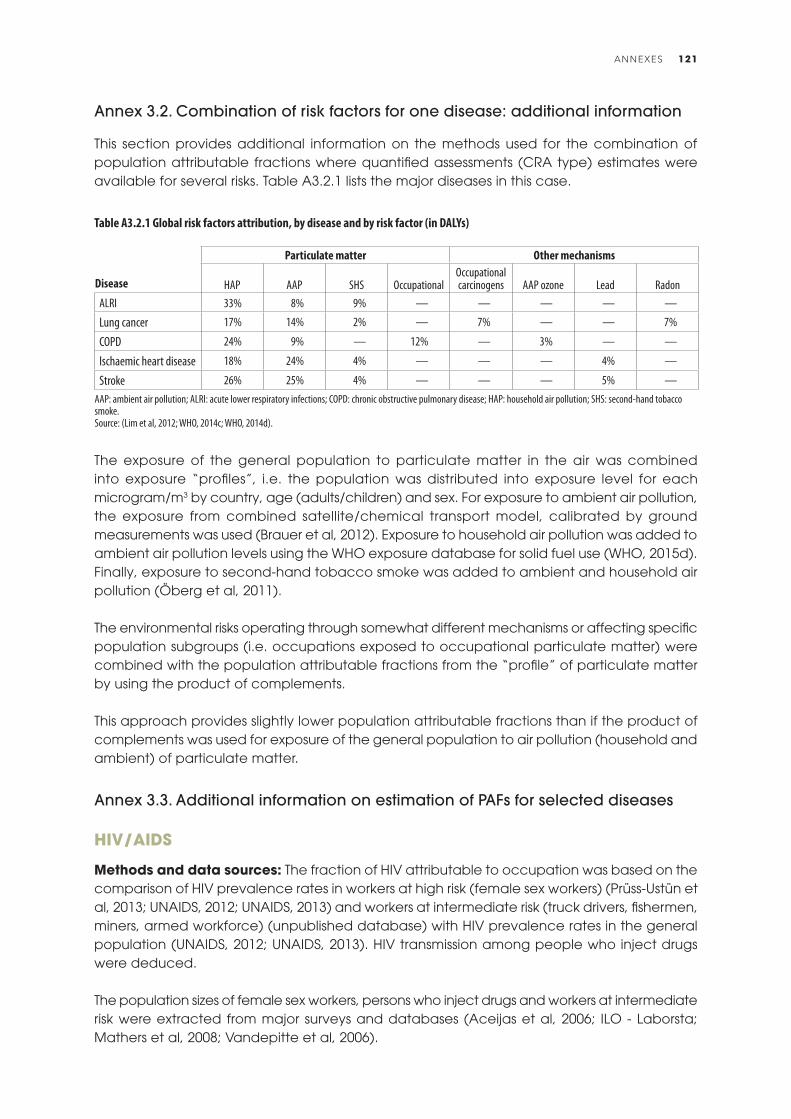
Annex 3.2. Combination of risk factors for one disease: additional information
This section provides additional information on the methods used for the combination of population attributable fractions where quantified assessments (CRA type) estimates were available for several risks. Table A3.2.1 lists the major diseases in this case.
The exposure of the general population to particulate matter in the air was combined into exposure “profiles”, i.e. the population was distributed into exposure level for each microgram/m3 by country, age (adults/children) and sex. For exposure to ambient air pollution, the exposure from combined satellite/chemical transport model, calibrated by ground measurements was used (Brauer et al, 2012). Exposure to household air pollution was added to ambient air pollution levels using the WHO exposure database for solid fuel use (WHO, 2015d). Finally, exposure to second-hand tobacco smoke was added to ambient and household air pollution (Öberg et al, 2011).
The environmental risks operating through somewhat different mechanisms or affecting specific population subgroups (i.e. occupations exposed to occupational particulate matter) were combined with the population attributable fractions from the “profile” of particulate matter by using the product of complements.
This approach provides slightly lower population attributable fractions than if the product of complements was used for exposure of the general population to air pollution (household and ambient) of particulate matter.
Annex 3.3. Additional information on estimation of PAFs for selected diseases
Hiv/AiDS
Methods and data sources: The fraction of HIV attributable to occupation was based on the comparison of HIV prevalence rates in workers at high risk (female sex workers) (Prüss-Ustün et al, 2013; UNAIDS, 2012; UNAIDS, 2013) and workers at intermediate risk (truck drivers, fishermen, miners, armed workforce) (unpublished database) with HIV prevalence rates in the general population (UNAIDS, 2012; UNAIDS, 2013). HIV transmission among people who inject drugs were deduced.
The population sizes of female sex workers, persons who inject drugs and workers at intermediate risk were extracted from major surveys and databases (Aceijas et al, 2006; ILO - Laborsta; Mathers et al, 2008; Vandepitte et al, 2006).
Disease
Particulate matter Other mechanisms
HAP AAP SHS OccupationalOccupational carcinogens AAP ozone Lead Radon
ALRI 33% 8% 9% — — — — —
Lung cancer 17% 14% 2% — 7% — — 7%
COPD 24% 9% — 12% — 3% — —
Ischaemic heart disease 18% 24% 4% — — — 4% —
Stroke 26% 25% 4% — — — 5% —AAP: ambient air pollution; ALRI: acute lower respiratory infections; COPD: chronic obstructive pulmonary disease; HAP: household air pollution; SHS: second-hand tobacco smoke.Source: (Lim et al, 2012; WHO, 2014c; WHO, 2014d).
Table A3.2.1 Global risk factors attribution, by disease and by risk factor (in DALYs)
ANNEXES 121

Estimates were performed by WHO region and income group (low- and high-income groups of the Americas, Eastern Mediterranean Europe, South-East Asia and the Western Pacific).
Limitations: The main uncertainties relate to:(a) Limited data availability on HIV prevalence in sex workers and workers at intermediate
risk.(b) The estimation of the sizes of the populations of workers in the specific occupations.(c) The approach used for addressing the overlap of intravenous drug use and occupational
exposures (essentially assuming that all transmission occurring in intravenous drug users is due to drug use).
(d) Migration of workers, and therefore possible bias in rate comparison.(e) Turnover in sex worker populations.(f) The failure to include male sex workers due to data scarcity.
Sexually transmitted diseases excluding Hiv/AiDS
Methods and data sources: The fraction of HIV attributable to occupation was based on the comparison of prevalence rates of syphilis, and of chlamydia trachomatis, Neisseria gonorrhoeae and Trichomonas vaginalis infections in workers at high risk (female sex workers) (Cwikel et al, 2008; WHO, 2014aa) and workers at intermediate risk (truck drivers, fishermen, miners, armed workforce) (unpublished database) with prevalence rates in the general population (WHO, 2012d). Only half of the excess cases in intermediate workers are assumed to be attributable to occupational causes.The population sizes of female sex workers and workers at intermediate risk were extracted from major surveys and databases (Aceijas et al, 2006; ILO - Laborsta; Vandepitte et al, 2006).Estimates were performed by WHO region and income group (low- and high-income groups of the Americas, Eastern Mediterranean Europe, South-East Asia and the Western Pacific).
Limitations: The main uncertainties relate to:(a) Limited data availability on prevalence of sexually transmitted infections in sex workers,
workers at intermediate risk, and also the general population for certain regions and infections.
(b) The estimation of the sizes of the populations of workers in the specific occupations.(c) Migration of workers, and therefore possible bias in rate comparison.(d) Turnover in sex worker populations.(e) The failure to include male sex workers due to data scarcity.
Hepatitis B
Methods and data sources: PubMed was systematically searched with the terms “hepatitis” or “HBsAg” in combination with “sex workers” or “occupation” or “high-risk” or “fishermen” or “truck drivers” or “police” or “military” or “armed”, between the beginning of 2000 and March 2015. We found 33 studies reporting HBsAg (hepatitis B surface antigen) in female commercial sex workers, covering all regions. For HBsAg in workers at intermediate risk, 10 studies were found, covering mainly truck drivers, but also fishermen, and the uniformed workforce. All regions were represented, except Europe and sub-Saharan Africa. The fraction of hepatitis B infections attributable to occupation was based on the differences between the median regional prevalence rates of HBsAg in those workers and the regional values for the general population, after matching age group and year (Ott et al, 2012).
PREVENTING DISEASE THROUGH HEALTHY ENVIRONMENTS122

The population sizes of female sex workers and workers at intermediate risk were extracted from major surveys and databases (Aceijas et al, 2006; ILO - Laborsta; Vandepitte et al, 2006).
Results were pooled by WHO region and income group (low- and high-income groups of the Americas, Eastern Mediterranean, Europe, South-East Asia and the Western Pacific).
Limitations: The main uncertainties relate to:(a) Limited data availability on prevalence of HBsAg in sex workers, workers at intermediate
risk.(b) Availability of comprehensive HBsAg prevalence in the general population disaggregated
by region, and only limited data availability at national level.(c) The overlap of female sex workers and people who inject drugs.(d) The estimation of the sizes of the populations of workers in the specific occupations.(e) Migration of workers, and therefore possible bias in rate comparison.(f) Turnover in sex worker populations.(g) The failure to include male sex workers due to data scarcity.
ANNEXES 123
REFERENCES
Abad-Franch, F., Palomeque, F. S., Aguilar, H. M. & Miles, M. A. (2005). Field ecology of sylvatic Rhodnius populations (Heteroptera, Triatominae): risk factors for palm tree infestation in western Ecuador. Trop Med Int Health, 10(12), 1258-1266. doi: 10.1111/j.1365-3156.2005.01511.x
Abhyankar, L. N., Jones, M. R., Guallar, E. & Navas-Acien, A. (2012). Arsenic exposure and hypertension: a systematic review. Environ Health Perspect, 120(4), 494-500. doi: 10.1289/ehp.1103988
Aceijas, C., Friedman, S. R., Cooper, H. L. F., Wiessing, L., Stimson, G. V. & Hickman, M. (2006). Estimates of injecting drug users at the national and local level in developing and transitional countries, and gender and age distribution. Sexually Transmitted Infections, 82 Suppl 3, iii10-17. doi: 10.1136/sti.2005.019471
Adjami, A. G., Toe, L., Bissan, Y., Bugri, S., Yameogo, L., Kone, M., et al. (2004). The current status of onchocerciasis in the forest/savanna transition zone of Cote d'Ivoire. Parasitology, 128(Pt 4), 407-414.
Agrafiotis, M., Vardakas, K. Z., Gkegkes, I. D., Kapaskelis, A. & Falagas, M. E. (2012). Ventilator-associated sinusitis in adults: systematic review and meta-analysis. Respir Med, 106(8), 1082-1095. doi: 10.1016/j.rmed.2012.03.009
Ahuja, R. B. & Bhattacharya, S. (2002). An analysis of 11,196 burn admissions and evaluation of conservative management techniques. Burns, 28(6), 555-561.
Aiello, A. E., Coulborn, R. M., Perez, V. & Larson, E. L. (2008). Effect of hand hygiene on infectious disease risk in the community setting: a meta-analysis. Am J Pub Health, 98(8), 1372-1381. doi: 10.2105/AJPH.2007.124610
Allen, M. T. & Levy, L. S. (2013). Parkinson's disease and pesticide exposure – a new assessment. Crit Rev Toxicol, 43(6), 515-534. doi: 10.3109/10408444.2013.798719
Alvis-Guzman, N., Alvis-Estrada, L. & Orozco-Africano, J. (2008). [The cost-effectiveness of installing natural gas as a sanitary alternative for rural communities on the Colombian Caribbean coast burning biomass fuels]. Revista De Salud Pública (Bogotá, Colombia), 10(4), 537-549.
Ambrose, A. F., Paul, G. & Hausdorff, J. M. (2013). Risk factors for falls among older adults: a review of the literature. Maturitas, 75(1), 51-61. doi: 10.1016/j.maturitas.2013.02.009
Anderson, H. R., Favarato, G. & Atkinson, R. W. (2013). Long-term exposure to air pollution and the incidence of asthma: meta-analysis of cohort studies. Air Quality Atmosphere and Health, 6(1), 47-56. doi: DOI 10.1007/s11869-011-0144-5
Andrea, H., Bultmann, U., van Amelsvoort, L. G. & Kant, Y. (2009). The incidence of anxiety and depression among employees – the role of psychosocial work characteristics. Depress Anxiety, 26(11), 1040-1048. doi: 10.1002/da.20516
Anglemyer, A., Horvath, T. & Rutherford, G. (2014). The accessibility of firearms and risk for suicide and homicide victimization among household members: a systematic review and meta-analysis. Ann Intern Med, 160(2), 101-110.
Ansari, S. A., Springthorpe, V. S. & Sattar, S. A. (1991). Survival and vehicular spread of human rotaviruses: possible relation to seasonality of outbreaks. Reviews of infectious diseases, 13(3), 448-461.
Antova, T., Pattenden, S., Brunekreef, B., Heinrich, J., Rudnai, P., Forastiere, F., et al. (2008). Exposure to indoor mould and children's respiratory health in the PATY study. J Epidemiol Community Health, 62(8), 708-714. doi: 10.1136/jech.2007.065896
Anyanwu, E. (1999). Evaluation of the laboratory and environmental factors that induce seizures in photosensitive epilepsy. Acta Neurol Belg, 99(2), 126-132.
AOA. (1993). Statement on ocular ultrviolet radiation hazards in sunlight. St Louis, MO: American Optometric Association: http://www.aoa.org/Documents/optometrists/ocular-ultraviolet.pdf (accessed 30 November 2015).
Appawu, M. A., Dadzie, S. K., Baffoe-Wilmot, A. & Wilson, M. D. (2001). Lymphatic filariasis in Ghana: entomological investigation of transmission dynamics and intensity in communities served by irrigation systems in the Upper East Region of Ghana. Trop Med Int Health, 6(7), 511-516.
Argalasova-Sobotova, L., Lekaviciute, J., Jeram, S., Sevcikova, L. & Jurkovicova, J. (2013). Environmental noise and cardiovascular disease in adults: research in Central, Eastern and South-Eastern Europe and Newly Independent States. Noise Health, 15(62), 22-31. doi: 10.4103/1463-1741.107149
Argaw, D., Mulugeta, A., Herrero, M., Nombela, N., Teklu, T., Tefera, T., Belew, Z., Alvar, J., Bern, C. (2013). Risk factors for visceral Leishmaniasis among residents and migrants in Kafta-Humera, Ethiopia. PLoS Negl Trop Dis, 7(11), e2543. doi: 10.1371/journal.pntd.0002543
Arroyave, W. D., Rabito, F. A., Carlson, J. C., Friedman, E. E. & Stinebaugh, S. J. (2014). Impermeable dust mite covers in the primary and tertiary prevention of allergic disease: a meta-analysis. Ann Allergy Asthma Immunol, 112(3), 237-248. doi: 10.1016/j.anai.2014.01.006
Ashford, R. W. (1996). Leishmaniasis reservoirs and their significance in control. Clin Dermatol, 14(5), 523-532.
Asindi, A. A., Ekanem, E. E., Ibia, E. O. & Nwangwa, M. A. (1993). Upsurge of malaria-related convulsions in a paediatric emergency room in Nigeria. Consequence of emergence of chloroquine-resistant Plasmodium falciparum. Trop Geogr Med, 45(3), 110-113.
Atkins, M. & Nolan, M. (2005). Sexual transmission of hepatitis B. Curr Opin Infect Dis, 18(1), 67-72.
Atreya, K. (2008). Health costs from short-term exposure to pesticides in Nepal. Soc Sci Med, 67(4), 511-519. doi: 10.1016/j.socscimed.2008.04.005
Auerbach, A. & Hernandez, M. L. (2012). The effect of environmental oxidative stress on airway inflammation. Current Opinion in Allergy and Clinical Immunology, 12(2), 133-139. doi: 10.1097/ACI.0b013e32835113d6
Ault, S. K. (1994). Environmental management: a re-emerging vector control strategy. Am J Trop Med Hyg, 50(6 Suppl), 35-49.
Axelrad, D. A., Bellinger, D. C., Ryan, L. M. & Woodruff, T. J. (2007). Dose-response relationship of prenatal mercury exposure and IQ: an integrative analysis of epidemiologic data. Environ Health Perspect, 115(4), 609-615. doi: 10.1289/ehp.9303
Ayres, J. G., Boyd, R., Cowie, H. & Hurley, J. F. (2011). Costs of occupational asthma in the UK. Thorax, 66(2), 128-133. doi: 10.1136/thx.2010.136762
Babu, G. R., Jotheeswaran, A. T., Mahapatra, T., Mahapatra, S., Kumar, A., Sr., Detels, R. & Pearce, N. (2014). Is hypertension associated with job strain? A meta-analysis of observational studies. Occup Environ Med, 71(3), 220-227. doi: 10.1136/oemed-2013-101396
Bain, R., Cronk, R., Bonjour, S., Onda, K., Wright, J., Yang, H., et al. (2014). Assessment of the level of exposure to fecally contaminated drinking water in developing countries. J Trop Med and Int Health.
PREVENTING DISEASE THROUGH HEALTHY ENVIRONMENTS124
Baker, M. G., Venugopal, K. & Howden-Chapman, P. (2011). Household crowding and tuberculosis. In Braubach, M., Jacobs, D. & Ormandy, D. (eds), Environmental burden of disease associated with inadequate housing. Copenhagen: WHO Regional Office for Europe.
Baltazar, M. T., Dinis-Oliveira, R. J., de Lourdes Bastos, M., Tsatsakis, A. M., Duarte, J. A. & Carvalho, F. (2014). Pesticides exposure as etiological factors of Parkinson's disease and other neurodegenerative diseases – a mechanistic approach. Toxicology Letters, 230(2), 85-103. doi: 10.1016/j.toxlet.2014.01.039
Baly, A., Toledo, M. E., Vanlerberghe, V., Ceballos, E., Reyes, A., Sanchez, I., et al. (2009). Cost-effectiveness of a community-based approach intertwined with a vertical Aedes control program. Am J Trop Med Hyg, 81(1), 88-93.
Baral, S., Beyrer, C., Muessig, K., Poteat, T., Wirtz, A. L., Decker, M. R., Sherman, S. G., Kerrigan, D. (2012). Burden of HIV among female sex workers in low-income and middle-income countries: a systematic review and meta-analysis. The Lancet Infectious Diseases, 12(7), 538-549. doi: 10.1016/S1473-3099(12)70066-X
Baraldo, S., Turato, G. & Saetta, M. (2012). Pathophysiology of the small airways in chronic obstructive pulmonary disease. Respiration, 84(2), 89-97. doi: 10.1159/000341382
Barclay, E. (2008). Is climate change affecting dengue in the Americas? Lancet, 371(9617), 973-974.
Bartlett, E. S. & Trasande, L. (2014). Economic impacts of environmentally attributable childhood health outcomes in the European Union. Eur J Public Health, 24(1), 21-26. doi: 10.1093/eurpub/ckt063
Bartram, J., Cronk, R., Montgomery, M., Gordon, B., Neira, M., Kelley, E. & Velleman, Y. (2015). Lack of toilets and safe water in health-care facilities. Bulletin of the World Health Organization, 93(4), 1.
Bauer, A., Diepgen, T. L. & Schmitt, J. (2011). Is occupational solar ultraviolet irradiation a relevant risk factor for basal cell carcinoma? A systematic review and meta-analysis of the epidemiological literature. Br J Dermatol, 165(3), 612-625. doi: 10.1111/j.1365-2133.2011.10425.x
Baumert, J., Schneider, B., Lukaschek, K., Emeny, R. T., Meisinger, C., Erazo, N., Dragano, N., Ladwig, K. H. (2014). Adverse conditions at the workplace are associated with increased suicide risk. J Psychiatr Res, 57, 90-95. doi: 10.1016/j.jpsychires.2014.06.007
Baumgartner, J., Schauer, J. J., Ezzati, M., Lu, L., Cheng, C., Patz, J. A. & Bautista, L. E. (2011). Indoor air pollution and blood pressure in adult women living in rural China. Environ Health Perspect, 119(10), 1390-1395. doi: 10.1289/ehp.1003371
Baur, X., Aasen, T. B., Burge, P. S., Heederik, D., Henneberger, P. K., Maestrelli, P., et al; Task Force on the Management of Work-related Asthma. (2012). The management of work-related asthma guidelines: a broader perspective. Eur Respir Rev, 21(124), 125-139. doi: 10.1183/09059180.00004711
Baur, X., Bakehe, P. & Vellguth, H. (2012). Bronchial asthma and COPD due to irritants in the workplace - an evidence-based approach. J Occ Med Toxicl l(London, England), 7(1), 19. doi: 10.1186/1745-6673-7-19
Baussano, I., Nunn, P., Williams, B., Pivetta, E., Bugiani, M. & Scano, F. (2011). Tuberculosis among Health Care Workers. Emerging Infectious Diseases, 17(3), 488-494. doi: 10.3201/eid1703.100947
Baussano, I., Williams, B. G., Nunn, P., Beggiato, M., Fedeli, U. & Scano, F. (2010). Tuberculosis incidence in prisons: a systematic review. PLoS Medicine, 7(12). doi: 10.1371/journal.pmed.1000381
Bayer, O., Camara, R., Zeissig, S. R., Ressing, M., Dietz, A., Locati, L. D., Ramroth, H., Singer, S. (2014). Occupation and cancer of the larynx: a systematic review and meta-analysis. Eur Arch Otorhinolaryngol. doi: 10.1007/s00405-014-3321-y
Been, J. V., Nurmatov, U. B., Cox, B., Nawrot, T. S., van Schayck, C. P. & Sheikh, A. (2014). Effect of smoke-free legislation on perinatal and child health: a systematic review and meta-analysis. Lancet, 383(9928), 1549-1560. doi: 10.1016/S0140-6736(14)60082-9
Begemann K., Feistkorn E., Friedemann M., Gessner M., Hillebrand J., Keipert R., Kolbusa, R., Hahn, A. (2011). Ärztliche Mitteilungen bei Vergiftungen 2010 [Medical notifications on poisonings 2010]: Ärztliche Mitteilungen bei Vergiftungen 2010.
Behroozy, A. & Keegel, T. G. (2014). Wet-work Exposure: A Main Risk Factor for Occupational Hand Dermatitis. Saf Health Work, 5(4), 175-180. doi: 10.1016/j.shaw.2014.08.001
Beljaev A. E. (2002). Determinants of malaria in the Middle East and North Africa. In Casman, E.A. & Dowlatabadi, H. (eds), The contextual determinants of malaria. Washington DC: Resources for the Future.
Beltran, A. J., Wu, J. & Laurent, O. (2014). Associations of meteorology with adverse pregnancy outcomes: a systematic review of preeclampsia, preterm birth and birth weight. Int J Environ Research and Pub Health, 11(1), 91-172. doi: 10.3390/ijerph110100091
Bergman, A., Heindel, H. J., Jobling, S., Kidd, K. A. & Zoeller, R. T. (2013). State of the science of endocrine disrupting chemicals - 2012. Geneva: WHO and UNEP.
Bernal-Pacheco, O. & Roman, G. C. (2007). Environmental vascular risk factors: new perspectives for stroke prevention. J Neurol Sci, 262(1-2), 60-70. doi: 10.1016/j.jns.2007.06.026
Berry, H. L., Bowen, K. & Kjellstrom, T. (2010). Climate change and mental health: a causal pathways framework. Int J Public Health, 55(2), 123-132. doi: 10.1007/s00038-009-0112-0
Bhatt, S., Gething, P. W., Brady, O. J., Messina, J. P., Farlow, A. W., Moyes, C. L., et al. (2013). The global distribution and burden of dengue. Nature, 496(7446), 504-507. doi: 10.1038/nature12060
Binazzi, A., Scarselli, A. & Marinaccio, A. (2013). The burden of mortality with costs in productivity loss from occupational cancer in Italy. Am J Ind Med, 56(11), 1272-1279. doi: 10.1002/ajim.22224
Black, R. E., Victora, C. G., Walker, S. P., Bhutta, Z. A., Christian, P., de Onis, M., et al; Maternal and Child Nutrition Study (2013). Maternal and child undernutrition and overweight in low-income and middle-income countries. Lancet, 382(9890), 427-451. doi: 10.1016/S0140-6736(13)60937-X
Blanc, P. D. (2012). Occupation and COPD: a brief review. J Asthma, 49(1), 2-4. doi: 10.3109/02770903.2011.611957
Blencowe, H., Cousens, S., Oestergaard, M. Z., Chou, D., Moller, A. B., Narwal, R., et al. (2012). National, regional, and worldwide estimates of preterm birth rates in the year 2010 with time trends since 1990 for selected countries: a systematic analysis and implications. Lancet, 379(9832), 2162-2172. doi: 10.1016/S0140-6736(12)60820-4
Blore, J. D., Sim, M. R., Forbes, A. B., Creamer, M. C. & Kelsall, H. L. (2015). Depression in Gulf War veterans: a systematic review and meta-analysis. Psychol Med, 1-16. doi: 10.1017/S0033291714001913
Boniol, M., Autier, P., Boyle, P. & Gandini, S. (2012). Cutaneous melanoma attributable to sunbed use: systematic review and meta-analysis. BMJ, 345, e4757. doi: 10.1136/bmj.e4757
Bonjour, S., Adair-Rohani, H., Wolf, J., Bruce, N. G., Mehta, S., Prüss-Ustün, A., et al. (2013). Solid fuel use for household cooking: country and regional estimates for 1980-2010. Environ Health Perspect, 121(7), 784-790. doi: 10.1289/ehp.1205987
Bos, R. (1988). The importance of peridomestic environmental management for the control of the vectors of Chagas' disease. Rev Argent Microbiol, 20(1 Suppl), 58-62.
Bos, R., Birley, M. H., Furu, P. & Engel, C. E. (2003). Health Opportunities in Development - A Course Manual on Developing Intersectoral Decision-making Skills in Support of Health Impact Assessment. Geneva: WHO.
Bos, R. & Mills, A. (1987). Financial and economic aspects of environmental management for vector control. Parasitology today (Personal ed.), 3(5), 160-163.
Bradley, S. M. (2011). Falls in older adults. Mt Sinai J Med, 78(4), 590-595. doi: 10.1002/msj.20280
REFERENCES 125
Brady, O. J., Gething, P. W., Bhatt, S., Messina, J. P., Brownstein, J. S., Hoen, A. G., et al. (2012). Refining the global spatial limits of dengue virus transmission by evidence-based consensus. PLoS Negl Trop Dis, 6(8), e1760. doi: 10.1371/journal.pntd.0001760
Brandt, S. J., Perez, L., Künzli, N., Lurmann, F. & McConnell, R. (2012). Costs of childhood asthma due to traffic-related pollution in two California communities. Eur Respir J, 40(2), 363-370. doi: 10.1183/09031936.00157811
Brauer, M., Amann, M., Burnett, R. T., Cohen, A., Dentener, F., Ezzati, M., et al. (2012). Exposure assessment for estimation of the global burden of disease attributable to outdoor air pollution. Environmental Science & Technology, 46(2), 652-660. doi: 10.1021/es2025752
Brent, D. A. (2001). Firearms and suicide. Ann N Y Acad Sci, 932, 225-239; discussion; 239-240.
Breysse, P. N., Diette, G. B., Matsui, E. C., Butz, A. M., Hansel, N. N. & McCormack, M. C. (2010). Indoor air pollution and asthma in children. Proceedings of the American Thoracic Society, 7(2), 102-106. doi: 10.1513/pats.200908-083RM
Brook, R. D., Rajagopalan, S., Pope, C. A., 3rd, Brook, J. R., Bhatnagar, A., Diez-Roux, A. V., et al.; American Heart Association Council on Epidemiology and Prevention, Council on the Kidney in Cardiovascular Disease, and Council of Nutrition, Physical Activity and Metabolism. (2010). Particulate matter air pollution and cardiovascular disease: An update to the scientific statement from the American Heart Association. Circulation, 121(21), 2331-2378. doi: 10.1161/CIR.0b013e3181dbece1
Brown, J. S., Bateson, T. F. & McDonnell, W. F. (2008). Effects of exposure to 0.06 ppm ozone on FEV1 in humans: a secondary analysis of existing data. Environ Health Perspect, 116(8), 1023-1026. doi: 10.1289/ehp.11396
Brownson, R. C., Haire-Joshu, D. & Luke, D. A. (2006). Shaping the context of health: a review of environmental and policy approaches in the prevention of chronic diseases. Annual Review of Public Health, 27, 341-370. doi: 10.1146/annurev.publhealth.27.021405.102137
Bucheton, B., Kheir, M. M., El-Safi, S. H., Hammad, A., Mergani, A., Mary, C., Abel, L., Dessein, A. (2002). The interplay between environmental and host factors during an outbreak of visceral leishmaniasis in eastern Sudan. Microbes Infect, 4(14), 1449-1457.
Burger, M., Catto, J. W., Dalbagni, G., Grossman, H. B., Herr, H., Karakiewicz, P., et al. (2013). Epidemiology and risk factors of urothelial bladder cancer. Eur Urol, 63(2), 234-241. doi: 10.1016/j.eururo.2012.07.033
Burke, H., Leonardi-Bee, J., Hashim, A., Pine-Abata, H., Chen, Y., Cook, D. G., Britton, J. R., McKeever, T. M. (2012). Prenatal and passive smoke exposure and incidence of asthma and wheeze: systematic review and meta-analysis. Pediatrics, 129(4), 735-744. doi: 10.1542/peds.2011-2196
Burkot, T. R., Durrheim, D. N., Melrose, W. D., Speare, R. & Ichimori, K. (2006). The argument for integrating vector control with multiple drug administration campaigns to ensure elimination of lymphatic filariasis. Filaria J, 5, 10. doi: 10.1186/1475-2883-5-10
Burnett, R. T., Pope, A., Ezzati, M., Olives, C., Lim, S. S., Mehta, S., et al. (2014). An intgrated risk function for estimating the global burden of disease attributable to ambient fine particulate matter exposure. Environmental Health Perspectives(Advance publication 7 February 2014).
Bush, R. K., Portnoy, J. M., Saxon, A., Terr, A. I. & Wood, R. A. (2006). The medical effects of mold exposure. J Allergy and Clinical Immunology, 117(2), 326-333.
Cairncross, S. & Kinnear, J. (1992). Elasticity of demand for water in Khartoum, Sudan. Soc Sci Med, 34(2), 183-189.
Cakmak, S., Dales, R. E. & Vidal, C. B. (2010). Air pollution and hospitalization for epilepsy in Chile. Environ Int, 36(6), 501-505. doi: 10.1016/j.envint.2010.03.008
Callinan, J. E., Clarke, A., Doherty, K. & Kelleher, C. (2010). Legislative smoking bans for reducing secondhand smoke exposure, smoking prevalence and tobacco consumption. Cochrane Database of Systematic Reviews (Online)(4), CD005992. doi: 10.1002/14651858.CD005992.pub2
Calvente, I., Fernandez, M. F., Villalba, J., Olea, N. & Nunez, M. I. (2010). Exposure to electromagnetic fields (non-ionizing radiation) and its relationship with childhood leukemia: a systematic review. Sci Total Environ, 408(16), 3062-3069. doi: 10.1016/j.scitotenv.2010.03.039
Calvert, G. M., Karnik, J., Mehler, L., Beckman, J., Morrissey, B., Sievert, J., et al. (2008). Acute pesticide poisoning among agricultural workers in the United States, 1998-2005. American Journal of Industrial Medicine, 51(12), 883-898. doi: 10.1002/ajim.20623
Camargo, M. C., Stayner, L. T., Straif, K., Reina, M., Al-Alem, U., Demers, P. A. & Landrigan, P. J. (2011). Occupational exposure to asbestos and ovarian cancer: a meta-analysis. Environ Health Perspect, 119(9), 1211-1217. doi: 10.1289/ehp.1003283
Camejo, M. I., Mata, G. & Diaz, M. (2003). [Prevalence of hepatitis B, hepatitis C and syphilis in female sex workers in Venezuela]. Rev Saude Publica, 37(3), 339-344.
Campbell, G. L., Hills, S. L., Fischer, M., Jacobson, J. A., Hoke, C. H., Hombach, J. M., et al. (2011). Estimated global incidence of Japanese encephalitis: a systematic review. Bulletin of the World Health Organization, 89(10), 766-774, 774A-774E. doi: 10.2471/BLT.10.085233
Campbell, O. M., Benova, L., Gon, G., Afsana, K. & Cumming, O. (2015). Getting the basic rights - the role of water, sanitation and hygiene in maternal and reproductive health: a conceptual framework. Trop Med Int Health, 20(3), 252-267. doi: 10.1111/tmi.12439
Campbell-Lendrum, D., Dujardin, J. P., Martinez, E., Feliciangeli, M. D., Perez, J. E., Silans, L. N. & Desjeux, P. (2001). Domestic and peridomestic transmission of American cutaneous leishmaniasis: changing epidemiological patterns present new control opportunities. Mem Inst Oswaldo Cruz, 96(2), 159-162.
Canadian Tuberculosis Committee (2007). Housing conditions that serve as risk factors for tuberculosis infection and disease. An Advisory Committee Statement (ACS). Canada communicable disease report - Relevé des maladies transmissibles au Canada, 33(ACS-9), 1-13.
Carek, P. J., Laibstain, S. E. & Carek, S. M. (2011). Exercise for the treatment of depression and anxiety. Int J Psychiatry Med, 41(1), 15-28.
Carpenter, D. O. & Bushkin-Bedient, S. (2013). Exposure to chemicals and radiation during childhood and risk for cancer later in life. J Adolesc Health, 52(5 Suppl), S21-29. doi: 10.1016/j.jadohealth.2013.01.027
Carpenter, D. O. & Nevin, R. (2010). Environmental causes of violence. Physiol Behav, 99(2), 260-268. doi: 10.1016/j.physbeh.2009.09.001
Cassidy, T., Inglis, G., Wiysonge, C. & Matzopoulos, R. (2014). A systematic review of the effects of poverty deconcentration and urban upgrading on youth violence. Health Place, 26, 78-87. doi: 10.1016/j.healthplace.2013.12.009
CDC (2000). Working to prevent and control injury in the United States: fact book for the yeat 2000. Atlanta: Centers for Disease Control.
CDC (2014a). Fire Deaths and Injuries: Prevention Tips. Available: http://www.cdc.gov/HomeandRecreationalSafety/Fire-Prevention/fireprevention.htm (accessed 2 December 2015).
CDC (2014b). Tips to prevent poisonings. Available: http://www.cdc.gov/homeandrecreationalsafety/poisoning/preventiontips.htm (accessed 2 December 2015).
Cerda, M., Morenoff, J. D., Hansen, B. B., Tessari Hicks, K. J., Duque, L. F., Restrepo, A. & Diez-Roux, A. V. (2012). Reducing violence by transforming neighborhoods: a natural experiment in Medellin, Colombia. Am J Epid, 175(10), 1045-1053. doi: 10.1093/aje/kwr428
Chaoui, H., Rhalem, N., Ouammi, L. & Soulaymani-Bencheikh, R. (2014). Rapport Général 2013 de toxicolovigilance. Toxicologie Maroc, 20(1), 11.
Chappell, D. & Di Martino, V. (2006). Violence at work (3 ed.). Geneva: International Labour Organization.
Chatham-Stephens, K., Caravanos, J., Ericson, B., Sunga-Amparo, J., Susilorini, B., Sharma, P., Landrigan, P. J., Fuller, R. (2013). Burden of disease from toxic waste sites in India, Indonesia, and the Philippines in 2010. Environ Health Perspect, 121(7), 791-796. doi: 10.1289/ehp.1206127
PREVENTING DISEASE THROUGH HEALTHY ENVIRONMENTS126

Checkley, W., Buckley, G., Gilman, R. H., Assis, A. M., Guerrant, R. L., Morris, S. S., et al. (2008). Multi-country analysis of the effects of diarrhoea on childhood stunting. International Journal of Epidemiology, 37(4), 816-830. doi: 10.1093/ije/dyn099
Chen Zee, E., Cornet, P., Lazimi, G., Rondet, C., Lochard, M., Magnier, A. M. & Ibanez, G. (2013). [Impact of endocrine disrupting chemicals on birth outcomes]. Gynecol Obstet Fertil, 41(10), 601-610. doi: 10.1016/j.gyobfe.2013.08.012
Cheng, X. & Su, H. (2010). Effects of climatic temperature stress on cardiovascular diseases. Eur J Intern Med, 21(3), 164-167. doi: 10.1016/j.ejim.2010.03.001
Chernin, E. (1987). The disappearance of bancroftian filariasis from Charleston, South Carolina. Am J Trop Med Hyg, 37(1), 111-114.
Chhetri, U. D., Ansari, I. & Shrestha, S. (2012). Pattern of pediatric poisoning and accident in Patan Hospital. Kathmandu Univ Med J (KUMJ), 10(39), 39-43.
Chikava, W. & Annegarn, H. J. (2013). Human and physical energy cycles in a subsistence village in South Africa. J Energy in Southern Africa, 24(2), 9.
Chimbari, M. J. (2012). Enhancing schistosomiasis control strategy for Zimbabwe: building on past experiences. J Parasitol Res, 2012, 353768. doi: 10.1155/2012/353768
Chomistek, A. K., Manson, J. E., Stefanick, M. L., Lu, B., Sands-Lincoln, M., Going, S. B., et al. (2013). Relationship of sedentary behavior and physical activity to incident cardiovascular disease: results from the Women's Health Initiative. J Am Coll Cardiol, 61(23), 2346-2354. doi: 10.1016/j.jacc.2013.03.031
Christoforidou, E. P., Riza, E., Kales, S. N., Hadjistavrou, K., Stoltidi, M., Kastania, A. N. & Linos, A. (2013). Bladder cancer and arsenic through drinking water: a systematic review of epidemiologic evidence. J Environ Sci Health A Tox Hazard Subst Environ Eng, 48(14), 1764-1775. doi: 10.1080/10934529.2013.823329
Church, T. S., Thomas, D. M., Tudor-Locke, C., Katzmarzyk, P. T., Earnest, C. P., Rodarte, R. Q., et al. (2011). Trends over 5 decades in U.S. occupation-related physical activity and their associations with obesity. PLoS ONE, 6(5), e19657. doi: 10.1371/journal.pone.0019657
Cohen, A. L., Hyde, T. B., Verani, J. & Watkins, M. (2012). Integrating pneumonia prevention and treatment interventions with immunization services in resource-poor countries. Bulletin of the World Health Organization, 90(4), 289-294. doi: 10.2471/BLT.11.094029
Cohen, J. M., Smith, D. L., Cotter, C., Ward, A., Yamey, G., Sabot, O. J. & Moonen, B. (2012). Malaria resurgence: a systematic review and assessment of its causes. Malar J, 11, 122. doi: 10.1186/1475-2875-11-122
Cohen, R. A., Patel, A. & Green, F. H. (2008). Lung disease caused by exposure to coal mine and silica dust. Semin Respir Crit Care Med, 29(6), 651-661. doi: 10.1055/s-0028-1101275
Colantonio, S., Bracken, M. B. & Beecker, J. (2014). The association of indoor tanning and melanoma in adults: systematic review and meta-analysis. J Am Acad Dermatol, 70(5), 847-857 e841-818. doi: 10.1016/j.jaad.2013.11.050
Commission of Social Determinants of Health. (2008). Closing the gap in a generation: health equity through action on the social determinants of health. Final Report of the Commission on Social Determinants of Health. Geneva: WHO.
Connorton, E., Perry, M. J., Hemenway, D. & Miller, M. (2012). Humanitarian relief workers and trauma-related mental illness. Epidemiologic reviews, 34(1), 145-155. doi: 10.1093/epirev/mxr026
Corrao, C. R., Del Cimmuto, A., Marzuillo, C., Paparo, E. & La Torre, G. (2013). Association between waste management and HBV among solid municipal waste workers: a systematic review and meta-analysis of observational studies. ScientificWorldJournal, 2013, 692083. doi: 10.1155/2013/692083
Corvalán, C., Duarte, E., Mujica, O., Ramalho, W. & Vazquez, E. (2015). Atlas de Desenvolvimento sustenável e Saúde, Brasil 1991 a 2010. Brasilia: WHO - Pan American Health Organization.
Coskeran, T., Denman, A., Phillips, P., Gillmore, G. & Tornberg, R. (2006). A new methodology for cost-effectiveness studies of domestic radon remediation programmes: quality-adjusted life-years gained within primary care trusts in central England. Sci Total Environ, 366(1), 32-46. doi: 10.1016/j.scitotenv.2005.12.020
Côté, P., van der Velde, G., Cassidy, J. D., Carroll, L. J., Hogg-Johnson, S., Holm, L. W., et al. and Bone and Joint Decade 2000-2010 Task Force on Neck Pain and Its Associated Disorders (2008). The burden and determinants of neck pain in workers: results of the Bone and Joint Decade 2000-2010 Task Force on Neck Pain and Its Associated Disorders. Spine (Phila Pa 1976), 33(4 Suppl), S60-74. doi: 10.1097/BRS.0b013e3181643ee4
Coura, J. R. (2013). Chagas disease: control, elimination and eradication. Is it possible? Mem Inst Oswaldo Cruz, 108(8), 962-967. doi: 10.1590/0074-0276130565
Coura, J. R. & Junqueira, A. C. (2012). Risks of endemicity, morbidity and perspectives regarding the control of Chagas disease in the Amazon Region. Mem Inst Oswaldo Cruz, 107(2), 145-154.
Coutinho, C. F., Souza-Santos, R., Teixeira, N. F., Georg, I., Gomes, T. F., Boia, M. N., et al. (2014). An entomoepidemiological investigation of Chagas disease in the state of Ceara, Northeast Region of Brazil. Cadernos De Saúde Pública / Ministério Da Saúde, Fundação Oswaldo Cruz, Escola Nacional De Saúde Pública, 30(4), 785-793.
Cox, B., Martens, E., Nemery, B., Vangronsveld, J. & Nawrot, T. S. (2013). Impact of a stepwise introduction of smoke-free legislation on the rate of preterm births: analysis of routinely collected birth data. BMJ, 346, f441. doi: 10.1136/bmj.f441
Cox, G. R., Owens, C., Robinson, J., Nicholas, A., Lockley, A., Williamson, M., et al. (2013). Interventions to reduce suicides at suicide hotspots: a systematic review. BMC Public Health, 13, 214. doi: 10.1186/1471-2458-13-214
Cox, J. St H., Mouchet, J. & Bradley, D. J. (2002). Determinants of malaria in sub-Saharan Africa. In Casman, E.A. & Dowlatabadi, H. (eds), The contextual determinants of malaria. Washington DC: Resources for the Future.
Crocker, D. D., Kinyota, S., Dumitru, G. G., Ligon, C. B., Herman, E. J., Ferdinands, J. M., et al. and Task Force on Community Preventive Services (2011). Effectiveness of home-based, multi-trigger, multicomponent interventions with an environmental focus for reducing asthma morbidity: a community guide systematic review. American Journal of Preventive Medicine, 41(2 Suppl 1), S5-32. doi: 10.1016/j.amepre.2011.05.012
Cullinan, P. & Newman Taylor, A. (2010). Occupational asthma. In Baxter, P., Aw, T.-C., Cockroft, A., Durrington, P. & Harrington, M. (eds), Hunter's diseases of occupations. Boca Raton, USA: CRC Press.
Curtis, C. F., Malecela-Lazaro, M., Reuben, R. & Maxwell, C. A. (2002). Use of floating layers of polystyrene beads to control populations of the filaria vector Culex quinquefasciatus. Annals of tropical medicine and parasitology, 96 Suppl 2, S97-104. doi: 10.1179/000349802125002446
Cwikel, J. G., Lazer, T., Press, F. & Lazer, S. (2008). Sexually transmissible infections among female sex workers: an international review with an emphasis on hard-to-access populations. Sex Health, 5(1), 9-16.
Daigle, M. S. (2005). Suicide prevention through means restriction: assessing the risk of substitution. A critical review and synthesis. Accid Anal Prev, 37(4), 625-632. doi: 10.1016/j.aap.2005.03.004
Dangour, A. D., Watson, L., Cumming, O., Boisson, S., Che, Y., Velleman, Y., et al. (2013). Interventions to improve water quality and supply, sanitation and hygiene practices, and their effects on the nutritional status of children. Cochrane Database of Systematic Reviews (Online), 8, CD009382. doi: 10.1002/14651858.CD009382.pub2
de Cock, M., Maas, Y. G. & van de Bor, M. (2012). Does perinatal exposure to endocrine disruptors induce autism spectrum and attention deficit hyperactivity disorders? Review. Acta Paediatr, 101(8), 811-818. doi: 10.1111/j.1651-2227.2012.02693.x
de Groene, G. J., Pal, T. M., Beach, J., Tarlo, S. M., Spreeuwers, D., Frings-Dresen, M. H., et al. (2011). Workplace interventions for treatment of occupational asthma. Cochrane Database of Systematic Reviews (Online)(5), CD006308. doi: 10.1002/14651858.CD006308.pub3
REFERENCES 127

de Nazelle, A., Nieuwenhuijsen, M. J., Anto, J. M., Brauer, M., Briggs, D., Braun-Fahrlander, C., et al. (2011). Improving health through policies that promote active travel: a review of evidence to support integrated health impact assessment. Environ Int, 37(4), 766-777. doi: 10.1016/j.envint.2011.02.003
Desjeux, P. (2001). The increase in risk factors for leishmaniasis worldwide. Trans R Soc Trop Med Hyg, 95(3), 239-243.
Dewey, K. G. & Mayers, D. R. (2011). Early child growth: how do nutrition and infection interact? Matern Child Nutr, 7 Suppl 3, 129-142. doi: 10.1111/j.1740-8709.2011.00357.x
Dick, S., Doust, E., Cowie, H., Ayres, J. G. & Turner, S. (2014). Associations between environmental exposures and asthma control and exacerbations in young children: a systematic review. BMJ Open, 4(2), e003827. doi: 10.1136/bmjopen-2013-003827
Diekman, S. T., Pope, D., Falk, H., Ballesteros, M. F., Dherani, M., Johnson, N. G., et al. (2014). WHO Indoor Air Quality Guidelines: Household Fuel Combustion. Review 10: Burns and poisoning. Geneva: WHO.
DiVall, S. A. (2013). The influence of endocrine disruptors on growth and development of children. Curr Opin Endocrinol Diabetes Obes, 20(1), 50-55. doi: 10.1097/MED.0b013e32835b7ee6
Doll L.S., Bonzo S.E., Mercy J.A., Sleet D.A. & Haas, E. N. (2007). Handbook of injury and and violence prevention. New York: Springer.
Dooyema, C. A., Neri, A., Lo, Y. C., Durant, J., Dargan, P. I., Swarthout, T., et al. (2012). Outbreak of fatal childhood lead poisoning related to artisanal gold mining in northwestern Nigeria, 2010. Environ Health Perspect, 120(4), 601-607. doi: 10.1289/ehp.1103965
Drechsel, P., Scott, C. A., Raschid-Sally, L., Redwood, M. & Bahri, A. (2010). Wastewater Irrigation and Health: assessing and mitigating risks in low-income countries. London, Ottawa: London: Earthscan/Colombo International Water Management Institute/Ottawa: IDRC.
Driscoll, T., Jacklyn, G., Orchard, J., Passmore, E., Vos, T., Freedman, G., et al. (2014). The global burden of occupationally related low back pain: estimates from the Global Burden of Disease 2010 study. Ann Rheum Dis, 73(6), 975-981. doi: 10.1136/annrheumdis-2013-204631
Dufour, A., Bartram, J., Bos, R. & Gannon, V. (2012). Animal waste, water quality and human health Geneva: WHO, USEPA, IWA.
Dunbar, A., Gotsis, W. & Frishman, W. (2013). Second-hand tobacco smoke and cardiovascular disease risk: an epidemiological review. Cardiol Rev, 21(2), 94-100. doi: 10.1097/CRD.0b013e31827362e4
Duse, M., Caminiti, S. & Zicari, A. M. (2007). Rhinosinusitis: prevention strategies. Pediatr Allergy Immunol, 18 Suppl 18, 71-74. doi: 10.1111/j.1399-3038.2007.00639.x
Ebisawa, I. (1998). Epidemiology and eradication of Schistosomiasis japonica in Japan. J Travel Med, 5(1), 33-35.
Eder, W., Ege, M. J. & von Mutius, E. (2006). The asthma epidemic. The New England Journal of Medicine, 355(21), 2226-2235. doi: 10.1056/NEJMra054308
Edward, K. L., Ousey, K., Warelow, P. & Lui, S. (2014). Nursing and aggression in the workplace: a systematic review. Br J Nurs, 23(12), 653-654, 656-659. doi: 10.12968/bjon.2014.23.12.653
Edwards, R. T., Neal, R. D., Linck, P., Bruce, N., Mullock, L., Nelhans, N., et al. (2011). Enhancing ventilation in homes of children with asthma: cost-effectiveness study alongside randomised controlled trial. Br J Gen Pract, 61(592), e733-741. doi: 10.3399/bjgp11X606645
Eisner, M. D. (2008). Passive smoking and adult asthma. Immunol Allergy Clin North Am, 28(3), 521-537, viii. doi: 10.1016/j.iac.2008.03.006
Eisner, M. D. (2010). Secondhand smoke at work. Current Opinion in Allergy and Clinical Immunology, 10(2), 121-126. doi: 10.1097/ACI.0b013e32833649b3
Ekong, E. B., Jaar, B. G. & Weaver, V. M. (2006). Lead-related nephrotoxicity: a review of the epidemiologic evidence. Kidney Int, 70(12), 2074-2084. doi: 10.1038/sj.ki.5001809
El Majidi, N., Bouchard, M., Gosselin, N. H. & Carrier, G. (2012). Relationship between prenatal exposure to polychlorinated biphenyls and birth weight: a systematic analysis of published epidemiological studies through a standardization of biomonitoring data. Regul Toxicol Pharmacol, 64(1), 161-176. doi: 10.1016/j.yrtph.2012.06.007
Elvik, R. (2001). Area-wide urban traffic calming schemes: a meta-analysis of safety effects. Accident Analysis and Prevention, 33, 10.
Elvik, R., Vaa, T., Hoye, A. & Sorenson, M. (2009). The Handbook of Road Safety Measures (2nd ed.). Bingley, UK: Emerald Group Publishing.
Emerson, P. M., Cairncross, S., Bailey, R. L. & Mabey, D. C. (2000). Review of the evidence base for the 'F' and 'E' components of the SAFE strategy for trachoma control. Tropical Medicine & International Health: TM & IH, 5(8), 515-527.
Emerson, P. M., Lindsay, S. W., Alexander, N., Bah, M., Dibba, S. M., Faal, H. B., et al. (2004). Role of flies and provision of latrines in trachoma control: cluster-randomised controlled trial. Lancet, 363(9415), 1093-1098. doi: 10.1016/S0140-6736(04)15891-1
Emerson, P. M., Lindsay, S. W., Walraven, G. E., Faal, H., Bøgh, C., Lowe, K. & Bailey, R. L. (1999). Effect of fly control on trachoma and diarrhoea. Lancet, 353(9162), 1401-1403. doi: 10.1016/S0140-6736(98)09158-2
Erlanger, T. E., Keiser, J., Caldas De Castro, M., Bos, R., Singer, B. H., Tanner, M. & Utzinger, J. (2005). Effect of water resource development and management on lymphatic filariasis, and estimates of populations at risk. Am J Trop Med Hyg, 73(3), 523-533.
Erlanger, T. E., Keiser, J. & Utzinger, J. (2008). Effect of dengue vector control interventions on entomological parameters in developing countries: a systematic review and meta-analysis. Med Vet Entomol, 22(3), 203-221. doi: 10.1111/j.1365-2915.2008.00740.x
Erlanger, T. E., Weiss, S., Keiser, J., Utzinger, J. & Wiedenmayer, K. (2009). Past, present, and future of Japanese encephalitis. Emerging Infectious Diseases, 15(1), 1-7. doi: 10.3201/eid1501.080311
Escobedo, A. A., Almirall, P., Robertson, L. J., Franco, R. M., Hanevik, K., Morch, K. & Cimerman, S. (2010). Giardiasis: the ever-present threat of a neglected disease. Infect Disord Drug Targets, 10(5), 329-348.
Espina, C., Porta, M., Schuz, J., Aguado, I. H., Percival, R. V., Dora, C., et al. (2013). Environmental and occupational interventions for primary prevention of cancer: a cross-sectorial policy framework. Environ Health Perspect, 121(4), 420-426. doi: 10.1289/ehp.1205897
Espina, C., Straif, K., Friis, S., Kogevinas, M., Saracci, R., Vainio, H. & Schuz, J. (2015). European Code against Cancer 4th Edition: Environment, occupation and cancer. Cancer Epidemiol. doi: 10.1016/j.canep.2015.03.017
Esrey, S. A., Potash, J. B., Roberts, L. & Shiff, C. (1991). Effects of improved water supply and sanitation on ascariasis, diarrhoea, dracunculiasis, hookworm infection, schistosomiasis, and trachoma. Bulletin of the World Health Organization, 69(5), 609-621.
EU-OSHA (2009). Combined exposure to noise and ototoxic substances. Luxemburg: European Agency for Safety and Health at Work.
European Transport Safety Council (2003). Cost effective EU transport safety measures. Brussels: ETSC.
Ewing, R. & Dumbaugh, E. (2009). The built environment and traffic safety: a review of empirical evidence. J Planning Literature, 23, 11.
Ezzati, M., Hoorn, S. V., Rodgers, A., Lopez, A. D., Mathers, C. D., Murray, C. J. & Comparative Risk Assessment Collaborating Group (2003). Estimates of global and regional potential health gains from reducing multiple major risk factors. Lancet, 362(9380), 271-280.
Ezzati, M., Lopez, A. D., Rodgers, A., Vander Hoorn, S. & Murray, C. J. L. (2002). Selected major risk factors and global and regional burden of disease. Lancet, 360(9343), 1347-1360.
Fang, S. C., Cassidy, A. & Christiani, D. C. (2010). A systematic review of occupational exposure to particulate matter and cardiovascular disease. International Journal of Environmental Research and Public Health, 7(4), 1773-1806. doi: 10.3390/ijerph7041773
PREVENTING DISEASE THROUGH HEALTHY ENVIRONMENTS128
FAO (2014). Nutrition-sensitive agriculture. Rome: FAO.
Fenton, M. (2012). Community design and policies for free-range children: creating environments that support routine physical activity. Child Obes, 8(1), 44-51. doi: 10.1089/chi.2011.0122
Ferguson, K. K., O'Neill, M. S. & Meeker, J. D. (2013). Environmental contaminant exposures and preterm birth: a comprehensive review. Journal of Toxicology and Environmental Health. Part B, Critical Reviews, 16(2), 69-113. doi: 10.1080/10937404.2013.775048
Fichet-Calvet, E., Jomaa, I., Zaafouri, B., Ashford, R. W., Ben-Ismail, R. & Delattre, P. (2000). The spatio-temporal distribution of a rodent reservoir host of cutaneous leishmaniasis. Journal of Applied Ecology, 37(4), 603-615. doi: DOI 10.1046/j.1365-2664.2000.00522.x
Fisk, W. J., Eliseeva, E. A. & Mendell, M. J. (2010). Association of residential dampness and mold with respiratory tract infections and bronchitis: a meta-analysis. Environ Health, 9, 72. doi: 10.1186/1476-069X-9-72
Folletti, I., Zock, J. P., Moscato, G. & Siracusa, A. (2014). Asthma and rhinitis in cleaning workers: a systematic review of epidemiological studies. J Asthma, 51(1), 18-28. doi: 10.3109/02770903.2013.833217
Forbi, J. C., Onyemauwa, N., Gyar, S. D., Oyeleye, A. O., Entonu, P. & Agwale, S. M. (2008). High prevalence of hepatitis B virus among female sex workers in Nigeria. Rev Inst Med Trop Sao Paulo, 50(4), 219-221.
Forjuoh, S. N. (2003). Traffic-related injury prevention interventions for low-income countries. Injury Control and Safety Promotion, 10(1-2), 109-118. doi: 10.1076/icsp.10.1.109.14115
Forsyth, A. J. (2008). Banning glassware from nightclubs in Glasgow (Scotland): observed impacts, compliance and patron's views. Alcohol Alcohol, 43(1), 111-117. doi: 10.1093/alcalc/agm142
Fowler, P. A., Bellingham, M., Sinclair, K. D., Evans, N. P., Pocar, P., Fischer, B., et al. (2012). Impact of endocrine-disrupting compounds (EDCs) on female reproductive health. Mol Cell Endocrinol, 355(2), 231-239. doi: 10.1016/j.mce.2011.10.021
Fransson, E. I., Heikkila, K., Nyberg, S. T., Zins, M., Westerlund, H., Westerholm, P., et al. (2012). Job strain as a risk factor for leisure-time physical inactivity: an individual-participant meta-analysis of up to 170,000 men and women: the IPD-Work Consortium. American Journal of Epidemiology, 176(12), 1078-1089. doi: 10.1093/aje/kws336
Fraser, N. (2008). Rapid analysis of HIV epidemiological and HIV response data about vulnerable populations in the Great Lakes Region of Africa. Washington, DC: World Bank.
Freeman, M. C., Stocks, M., Cumming, O., Jeandron, A., Higgins, J., Wolf, J., et al. (2014). Hygiene and health: systematic review of handwashing practices worldwide and update of health effects. J Trop Med and Int Health.
Freire, C. & Koifman, S. (2013). Pesticides, depression and suicide: a systematic review of the epidemiological evidence. Int J Hyg and Environ Health, 216(4), 445-460. doi: 10.1016/j.ijheh.2012.12.003
Friedman, D. I. & De ver Dye, T. (2009). Migraine and the environment. Headache, 49(6), 941-952. doi: 10.1111/j.1526-4610.2009.01443.x
Frumkin, H. (2002). Urban sprawl and public health. Public Health Rep, 117(3), 201-217.
Fuks, K. B., Weinmayr, G., Foraster, M., Dratva, J., Hampel, R., Houthuijs, D., et al. (2014). Arterial Blood Pressure and Long-Term Exposure to Traffic-Related Air Pollution: An Analysis in the European Study of Cohorts for Air Pollution Effects (ESCAPE). Environ Health Perspect. doi: 10.1289/ehp.1307725
Galimanis, A., Mono, M. L., Arnold, M., Nedeltchev, K. & Mattle, H. P. (2009). Lifestyle and stroke risk: a review. Curr Opin Neurol, 22(1), 60-68. doi: 10.1097/WCO.0b013e32831fda0e
Garcia Gomez, M., Urbanos Garrido, R., Castaneda Lopez, R. & Lopez Menduina, P. (2012). [Direct health care costs of lung and bladder cancer attributable to work. Spain, 2008]. Rev Esp Salud Publica, 86(2), 127-138. doi: 10.1590/S1135-57272012000200002
Gasana, J., Dillikar, D., Mendy, A., Forno, E. & Ramos Vieira, E. (2012). Motor vehicle air pollution and asthma in children: a meta-analysis. Environmental Research, 117, 36-45. doi: 10.1016/j.envres.2012.05.001
Gazzinelli, A., Correa-Oliveira, R., Yang, G. J., Boatin, B. A. & Kloos, H. (2012). A research agenda for helminth diseases of humans: social ecology, environmental determinants, and health systems. PLoS Negl Trop Dis, 6(4), e1603. doi: 10.1371/journal.pntd.0001603
GBD 2013 Mortality Causes of Death Collaborators (2015). Global, regional, and national age-sex specific all-cause and cause-specific mortality for 240 causes of death, 1990-2013: a systematic analysis for the Global Burden of Disease Study 2013. Lancet, 385(9963), 117-171. doi: 10.1016/S0140-6736(14)61682-2
Geere, J. A., Hunter, P. R. & Jagals, P. (2010). Domestic water carrying and its implications for health: a review and mixed methods pilot study in Limpopo Province, South Africa. Environmental Health, 9, 52. doi: 10.1186/1476-069X-9-52
Genuneit, J. (2012). Exposure to farming environments in childhood and asthma and wheeze in rural populations: a systematic review with meta-analysis. Pediatr Allergy Immunol, 23(6), 509-518. doi: 10.1111/j.1399-3038.2012.01312.x
Ghebreyesus, T. A., Haile, M., Witten, K. H., Getachew, A., Yohannes, A. M., Yohannes, M., et al. (1999). Incidence of malaria among children living near dams in northern Ethiopia: community based incidence survey. BMJ, 319(7211), 663-666.
Gillespie, L. (2004). Preventing falls in elderly people. BMJ, 328(7441), 653-654. doi: 10.1136/bmj.328.7441.653
Giustini, M., Ade, P., Taggi, F. & Funari, E. (2003). [Accidents in recreational waters]. Ann Ist Super Sanita, 39(1), 69-76.
Goldman, A., Eggen, B., Golding, B. & Murray, V. (2014). The health impacts of windstorms: a systematic literature review. Public Health, 128(1), 3-28. doi: 10.1016/j.puhe.2013.09.022
Gordon, B., Mackay, R. & Rehfuess, E. (2004). Inheriting the world: the atlas of children's health and the environment. Geneva: WHO.
Gorini, F., Chiappa, E., Gargani, L. & Picano, E. (2014). Potential effects of environmental chemical contamination in congenital heart disease. Pediatr Cardiol, 35(4), 559-568. doi: 10.1007/s00246-014-0870-1
Goswami, E., Craven, V., Dahlstrom, D. L., Alexander, D. & Mowat, F. (2013). Domestic asbestos exposure: a review of epidemiologic and exposure data. International Journal of Environmental Research and Public Health, 10(11), 5629-5670. doi: 10.3390/ijerph10115629
Gottesfeld, P., Murray, J., Chadha, S. S. & Rees, D. (2011). Preventing tuberculosis with silica dust controls. The International Journal of Tuberculosis and Lung Disease: The Official Journal of the International Union Against Tuberculosis and Lung Disease, 15(6), 713-714. doi: 10.5588/ijtld.10.0727
Gotzsche, P. C. & Johansen, H. K. (2008). House dust mite control measures for asthma: systematic review. Allergy, 63(6), 646-659. doi: 10.1111/j.1398-9995.2008.01690.x
Gould, E. (2009). Childhood lead poisoning: conservative estimates of the social and economic benefits of lead hazard control. Environ Health Perspect, 117(7), 1162-1167. doi: 10.1289/ehp.0800408
Gould, E. A., Higgs, S., Buckley, A. & Gritsun, T. S. (2006). Potential arbovirus emergence and implications for the United Kingdom. Emerging Infectious Diseases, 12(4), 549-555. doi: 10.3201/eid1204.051010
Govarts, E., Nieuwenhuijsen, M., Schoeters, G., Ballester, F., Bloemen, K., de Boer, M., et al. (2012). Birth weight and prenatal exposure to polychlorinated biphenyls (PCBs) and dichlorodiphenyldichloroethylene (DDE): a meta-analysis within 12 European Birth Cohorts. Environ Health Perspect, 120(2), 162-170. doi: 10.1289/ehp.1103767
Government of Kiribati & Secretariat of the Pacific Community (2008). Second generation surveillance of antenatal women, seafarers, policement and youth, Kiribati. Noumea.
REFERENCES 129
Goyal, V., Mattocks, K. M. & Sadler, A. G. (2012). High-risk behavior and sexually transmitted infections among U.S. active duty servicewomen and veterans. J Womens Health (Larchmt), 21(11), 1155-1169. doi: 10.1089/jwh.2012.3605
Grandjean, P. & Landrigan, P. J. (2014). Neurobehavioural effects of developmental toxicity. Lancet Neurol, 13(3), 330-338. doi: 10.1016/S1474-4422(13)70278-3
Grant, K., Goldizen, F. C., Sly, P. D., Brune, M. N., Neira, M., van den Berg, M. & Norman, R. E. (2013). Health consequences of exposure to e-waste: a systematic review. Lancet Glob Health, 1(6), e350-361. doi: 10.1016/S2214-109X(13)70101-3
Grasser, G., Van Dyck, D., Titze, S. & Stronegger, W. (2013). Objectively measured walkability and active transport and weight-related outcomes in adults: a systematic review. Int J Public Health, 58(4), 615-625. doi: 10.1007/s00038-012-0435-0
Gray, A., Read, S., McGale, P. & Darby, S. (2009). Lung cancer deaths from indoor radon and the cost effectiveness and potential of policies to reduce them. BMJ, 338, a3110. doi: 10.1136/bmj.a3110
Grimes, J. E., Croll, D., Harrison, W. E., Utzinger, J., Freeman, M. C. & Templeton, M. R. (2014). The Relationship between Water, Sanitation and Schistosomiasis: A Systematic Review and Meta-analysis. PLoS Negl Trop Dis, 8(12), e3296. doi: 10.1371/journal.pntd.0003296
Guerriero, C., Bianchi, F., Cairns, J. & Cori, L. (2011). Policies to clean up toxic industrial contaminated sites of Gela and Priolo: a cost-benefit analysis. Environ Health, 10, 68. doi: 10.1186/1476-069X-10-68
Guerriero, C. & Cairns, J. (2009). The potential monetary benefits of reclaiming hazardous waste sites in the Campania region: an economic evaluation. Environ Health, 8, 28. doi: 10.1186/1476-069X-8-28
Guha, N., Steenland, N. K., Merletti, F., Altieri, A., Cogliano, V. & Straif, K. (2010). Bladder cancer risk in painters: a meta-analysis. Occup Environ Med, 67(8), 568-573. doi: 10.1136/oem.2009.051565
Gunnell, D., Eddleston, M., Phillips, M. R. & Konradsen, F. (2007). The global distribution of fatal pesticide self-poisoning: systematic review. BMC Public Health, 7, 357. doi: 10.1186/1471-2458-7-357
Gunnell, D., Fernando, R., Hewagama, M., Priyangika, W. D., Konradsen, F. & Eddleston, M. (2007). The impact of pesticide regulations on suicide in Sri Lanka. Int J Epidemiol, 36(6), 1235-1242. doi: 10.1093/ije/dym164
Habermehl, H. (2007). Economic Evaluation of the Improved Household Cooking Stove Dissemination Programme in Uganda. Eschborn: German Development Cooperation (GTZ).
Haefliger, P., Mathieu-Nolf, M., Lociciro, S., Ndiaye, C., Coly, M., Diouf, A., et al. (2009). Mass lead intoxication from informal used lead-acid battery recycling in Dakar, Senegal. Environ Health Perspect, 117(10), 1535-1540. doi: 10.1289/ehp.0900696
Haller, L., Hutton, G. & Bartram, J. (2007). Estimating the costs and health benefits of water and sanitation improvements at global level. J Water and Health, 5(4), 467-480.
Halliez, M. C. & Buret, A. G. (2013). Extra-intestinal and long term consequences of Giardia duodenalis infections. World J Gastroenterol, 19(47), 8974-8985. doi: 10.3748/wjg.v19.i47.8974
Hammig, O. & Bauer, G. (2009). Work-life imbalance and mental health among male and female employees in Switzerland. Int J Public Health, 54(2), 88-95. doi: 10.1007/s00038-009-8031-7
Hanigan, I. C., Butler, C. D., Kokic, P. N. & Hutchinson, M. F. (2012). Suicide and drought in New South Wales, Australia, 1970-2007. Proc Natl Acad Sci U S A, 109(35), 13950-13955. doi: 10.1073/pnas.1112965109
Harding, A. H., Frost, G. A., Tan, E., Tsuchiya, A. & Mason, H. M. (2013). The cost of hypertension-related ill-health attributable to environmental noise. Noise Health, 15(67), 437-445. doi: 10.4103/1463-1741.121253
Hart, J. E., Eisen, E. A. & Laden, F. (2012). Occupational diesel exhaust exposure as a risk factor for chronic obstructive pulmonary disease. Curr Opin Pulm Med, 18(2), 151-154. doi: 10.1097/MCP.0b013e32834f0eaa
Harvey, A., Towner, E., Peden, M., Soori, H. & Bartolomeos, K. (2009). Injury prevention and the attainment of child and adolescent health. Bulletin of the World Health Organization, 87(5), 390-394.
Heath, G. W., Parra, D. C., Sarmiento, O. L., Andersen, L. B., Owen, N., Goenka, S., et al; Lancet Physical Activity Series Working Group(2012). Evidence-based intervention in physical activity: lessons from around the world. Lancet, 380(9838), 272-281. doi: 10.1016/S0140-6736(12)60816-2
Hedstrom, A. K., Olsson, T. & Alfredsson, L. (2015). The Role of Environment and Lifestyle in Determining the Risk of Multiple Sclerosis. Curr Top Behav Neurosci. doi: 10.1007/7854_2015_372
Heederik, D., Henneberger, P. K., Redlich, C. A. & ERS Task Force on Management of Work-related Asthma (2012). Primary prevention: exposure reduction, skin exposure and respiratory protection. Eur Respir Rev, 21(124), 112-124. doi: 10.1183/09059180.00005111
Hei, M. Y. & Yi, Z. W. (2014). Environmental factors for the development of fetal urinary malformations. World J Pediatr, 10(1), 17-23. doi: 10.1007/s12519-014-0449-1
Heinrich, J. (2011). Influence of indoor factors in dwellings on the development of childhood asthma. IntInt J Hyg and Environ Health, 214(1), 1-25. doi: 10.1016/j.ijheh.2010.08.009
Henneberger, P. K., Redlich, C. A., Callahan, D. B., Harber, P., Lemiere, C., Martin, J., et al (2011). An official American Thoracic Society statement: work-exacerbated asthma. Am J Resp and Critical Care Med, 184(3), 368-378. doi: 10.1164/rccm.812011ST
Henrotin, J. B., Besancenot, J. P., Bejot, Y. & Giroud, M. (2007). Short-term effects of ozone air pollution on ischaemic stroke occurrence: a case-crossover analysis from a 10-year population-based study in Dijon, France. Occup Environ Med, 64(7), 439-445. doi: 10.1136/oem.2006.029306
Henschel, S., Atkinson, R., Zeka, A., Le Tertre, A., Analitis, A., Katsouyanni, K., et al. (2012). Air pollution interventions and their impact on public health. Int J Public Health, 57(5), 757-768. doi: 10.1007/s00038-012-0369-6
Heymann, D. L. (2008). Control of Communicable Diseases Manual. Washington, DC: American Public Health Association.
Higashi, H., Barendregt, J. J., Kassebaum, N. J., Weiser, T. G., Bickler, S. W. & Vos, T. (2015). The burden of selected congenital anomalies amenable to surgery in low and middle-income regions: cleft lip and palate, congenital heart anomalies and neural tube defects. Arch Dis Child, 100(3), 233-238. doi: 10.1136/archdischild-2014-306175
Hirst, N., Gordon, L., Gies, P. & Green, A. C. (2009). Estimation of avoidable skin cancers and cost-savings to government associated with regulation of the solarium industry in Australia. Health Policy, 89(3), 303-311. doi: 10.1016/j.healthpol.2008.07.003
Holick, M. F. (2006). Resurrection of vitamin D deficiency and rickets. J Clin Invest, 116(8), 2062-2072. doi: 10.1172/JCI29449
Hong, O., Kerr, M. J., Poling, G. L. & Dhar, S. (2013). Understanding and preventing noise-induced hearing loss. Dis Mon, 59(4), 110-118. doi: 10.1016/j.disamonth.2013.01.002
Hong, Q. B., Yang, K., Huang, Y. X., Sun, L. P., Yang, G. J., Gao, Y., et al. (2011). Effectiveness of a comprehensive schistosomiasis japonica control program in Jiangsu province, China, from 2005 to 2008. Acta Tropica, 120 Suppl 1, S151-157. doi: 10.1016/j.actatropica.2010.11.006
Hoovestol, R. A. & Mikuls, T. R. (2011). Environmental exposures and rheumatoid arthritis risk. Curr Rheumatol Rep, 13(5), 431-439. doi: 10.1007/s11926-011-0203-9
Horsham, C., Auster, J., Sendall, M. C., Stoneham, M., Youl, P., Crane, P., et al. (2014). Interventions to decrease skin cancer risk in outdoor workers: update to a 2007 systematic review. BMC Res Notes, 7, 10. doi: 10.1186/1756-0500-7-10
Horwitz, I. B. & McCall, B. P. (2004). Quantification and risk analysis of occupational burns: Oregon workers' compensation claims, 1990 to 1997. J Burn Care Rehabil, 25(3), 328-336.
PREVENTING DISEASE THROUGH HEALTHY ENVIRONMENTS130
Hosgood, H. D. 3rd, Wei, H., Sapkota, A., Choudhury, I., Bruce, N., Smith, K. R., et al. (2011). Household coal use and lung cancer: systematic review and meta-analysis of case-control studies, with an emphasis on geographic variation. Int J Epidemiol, 40(3), 719-728. doi: 10.1093/ije/dyq259
Hsiang, S. M., Burke, M. & Miguel, E. (2013). Quantifying the influence of climate on human conflict. Science, 341(6151), 1235367. doi: 10.1126/science.1235367
Hu, G., Sarti, C., Jousilahti, P., Silventoinen, K., Barengo, N. C. & Tuomilehto, J. (2005). Leisure time, occupational, and commuting physical activity and the risk of stroke. Stroke, 36(9), 1994-1999. doi: 10.1161/01.STR.0000177868.89946.0c
Hu, V. H., Harding-Esch, E. M., Burton, M. J., Bailey, R. L., Kadimpeul, J. & Mabey, D. C. (2010). Epidemiology and control of trachoma: systematic review. Trop Med Int Health, 15(6), 673-691. doi: 10.1111/j.1365-3156.2010.02521.x
Hutton, G., Rehfuess, E., Tediosi, F. & Weiss, S. (2006). Evaluation of the Costs and Benefits of Household Energy and Health Interventions at Global and Regional Levels. Geneva: World Health Organization.
IARC (2012). Asbestos. Lyon: International Agency for Research on Cancer.
IARC (2014). World Cancer Report Lyon: International Agency for Research on Cancer.
IARC (2015). IARC Monographs on the evaluation of carcinogenic risks to humans - Complete list of agents evaluated and their classification. Available: http://monographs.iarc.fr/ENG/Classification/files/7093/crthgr02a.html (accessed 2 December 2015).
IHME (2014). GBD 2010, GBD Compare. Available: http://viz.healthmetricsandevaluation.org/gbd-compare/ (accessed 2 June 2015).
Ikeda, N., Irie, Y. & Shibuya, K. (2013). Determinants of reduced child stunting in Cambodia: analysis of pooled data from three demographic and health surveys. Bulletin of the World Health Organization, 91(5), 341-349. doi: 10.2471/BLT.12.113381
ILO (2009). Violence at work - a major workplace problem. Geneva: International Labour Organization.
ILO (2014). Global employment trends 2014: supporting data sets. Available: http://www.ilo.org/global/research/global-reports/global-employment-trends/2014/WCMS_234879/lang--en/index.htm (accessed 2 December 2015).
ILO Laborsta - Segregat. Available: http://laborsta.ilo.org/STP/guest (accessed 2 December 2015).
International Programme on Chemical Safety (2004). Guidelines on the prevention of toxic exposures. Geneva: WHO, UNEP, ILO.
IPCC (2012). Special Report on Managing the Risks of Extreme Events and Disasters to Advance Climate Change Adaptation (SREX). Cambridge, UK and New York, USA: Cambridge University Press.
IPCC (2013). Fifth assessment report: Climate change 2013 The physical science basis. New York: Cambridge University Press.
Iqbal, A., Shirin, T., Ahmed, T., Ahmed, S., Islam, N., Sobhan, A. & Siddique, A. K. (2007). Childhood mortality due to drowning in rural Matlab of Bangladesh: magnitude of the problem and proposed solutions. Journal of Health, Population, and Nutrition, 25(3), 370-376.
Jaakkola, J. J. & Knight, T. L. (2008). The role of exposure to phthalates from polyvinyl chloride products in the development of asthma and allergies: a systematic review and meta-analysis. Environ Health Perspect, 116(7), 845-853. doi: 10.1289/ehp.10846
Jaakkola, M. S. & Jaakkola, J. J. K. (2006). Impact of smoke-free workplace legislation on exposures and health: possibilities for prevention. The European Respiratory Journal: Official Journal of the European Society for Clinical Respiratory Physiology, 28(2), 397-408. doi: 10.1183/09031936.06.00001306
Jackson, S., Mathews, K. H., Pulanic, D., Falconer, R., Rudan, I., Campbell, H. & Nair, H. (2013). Risk factors for severe acute lower respiratory infections in children: a systematic review and meta-analysis. Croat Med J, 54(2), 110-121.
Jacquemin, B., Schikowski, T., Carsin, A. E., Hansell, A., Kramer, U., Sunyer, J., et al. (2012). The role of air pollution in adult-onset asthma: a review of the current evidence. Semin Respir Crit Care Med, 33(6), 606-619. doi: 10.1055/s-0032-1325191
Jaganath, D. & Mupere, E. (2012). Childhood tuberculosis and malnutrition. J Infectious Dis, 206(12), 1809-1815. doi: 10.1093/infdis/jis608
Janssen, I. (2012). Health care costs of physical inactivity in Canadian adults. Appl Physiol Nutr Metab, 37(4), 803-806. doi: 10.1139/h2012-061
Jaouadi, K., Haouas, N., Chaara, D., Boudabous, R., Gorcii, M., Kidar, A., et al. (2013). Phlebotomine (Diptera, Psychodidae) Bloodmeal Sources in Tunisian Cutaneous Leishmaniasis Foci: Could Sergentomyia minuta, Which Is Not an Exclusive Herpetophilic Species, be Implicated in the Transmission of Pathogens? Annals of the Entomological Society of America, 106(1), 79-85. doi: Doi 10.1603/An11186
Jaroszweski, D. & McNamara, T. (2014). The influence of rainfall on road accidents in urban areas: A weather radar approach. Travel Behaviour and Society, 1, 7.
Jarvholm, B. & Burdorf, A. (2015). Emerging evidence that the ban on asbestos use is reducing the occurrence of pleural mesothelioma in Sweden. Scand J Public Health. doi: 10.1177/1403494815596500
Jassal, M. S., Diette, G. B. & Dowdy, D. W. (2013). Cost-consequence analysis of multimodal interventions with environmental components for pediatric asthma in the state of Maryland. J Asthma, 50(6), 672-680. doi: 10.3109/02770903.2013.792351
Jenkins, L. (1996). Violence in the workplace. NIOSH.
Jerrett, M., Burnett, R. T., Pope, C. A., 3rd, Ito, K., Thurston, G., Krewski, D., et al. (2009). Long-term ozone exposure and mortality. The New England Journal of Medicine, 360(11), 1085-1095. doi: 10.1056/NEJMoa0803894
Jesslin, J., Adepu, R. & Churi, S. (2010). Assessment of prevalence and mortality incidences due to poisoning in a South Indian tertiary care teaching hospital. Indian J Pharm Sci, 72(5), 587-591. doi: 10.4103/0250-474X.78525
Jia, T.-W., Melville, S., Utzinger, J., King, C. H. & Zhou, X.-N. (2012). Soil-transmitted helminth reinfection after drug treatment: a systematic review and meta-analysis. PLoS neglected tropical diseases, 6(5). doi: 10.1371/journal.pntd.0001621
Jia, W. H. & Qin, H. D. (2012). Non-viral environmental risk factors for nasopharyngeal carcinoma: a systematic review. Seminars in Cancer Biology, 22(2), 117-126. doi: 10.1016/j.semcancer.2012.01.009
Jiang, T., Yu, J. T., Tian, Y. & Tan, L. (2013). Epidemiology and etiology of Alzheimer's disease: from genetic to non-genetic factors. Curr Alzheimer Res, 10(8), 852-867.
Jobin W. R. (1986). Long-term cost-effectiveness of environmental management for schistosomiasis control in water resources development Unpublished working paper PMO/PE/WP/86.13 prepared for the 6th annual meeting of the WHO/FAO/UNEP Panel of Experts on Environmental Management for vector Control. Geneva: World Health Organization.
Jones, L. L., Hassanien, A., Cook, D. G., Britton, J. & Leonardi-Bee, J. (2012). Parental smoking and the risk of middle ear disease in children: a systematic review and meta-analysis. Arch Pediatr Adolesc Med, 166(1), 18-27. doi: 10.1001/archpediatrics.2011.158
Joshi, A. B., Das, M. L., Akhter, S., Chowdhury, R., Mondal, D., Kumar, V., et al. (2009). Chemical and environmental vector control as a contribution to the elimination of visceral leishmaniasis on the Indian subcontinent: cluster randomized controlled trials in Bangladesh, India and Nepal. BMC Med, 7, 54. doi: 10.1186/1741-7015-7-54
Kales, S. N., Tsismenakis, A. J., Zhang, C. & Soteriades, E. S. (2009). Blood pressure in firefighters, police officers, and other emergency responders. Am J Hypertens, 22(1), 11-20. doi: 10.1038/ajh.2008.296
Karunamoorthi, K. (2011). Vector control: a cornerstone in the malaria elimination campaign. Clinical microbiology and infection: the official publication of the European Society of Clinical Microbiology and Infectious Diseases, 17(11), 1608-1616. doi: 10.1111/j.1469-0691.2011.03664.x
REFERENCES 131
Kasturiratne, A., Wickremasinghe, A. R., de Silva, N., Gunawardena, N. K., Pathmeswaran, A., Premaratna, R., et al. (2008). The global burden of snakebite: a literature analysis and modelling based on regional estimates of envenoming and deaths. PLoS Med, 5(11), e218. doi: 10.1371/journal.pmed.0050218
Kaur, S., Cohen, A., Dolor, R., Coffman, C. J. & Bastian, L. A. (2004). The impact of environmental tobacco smoke on women's risk of dying from heart disease: a meta-analysis. J Womens Health (Larchmt), 13(8), 888-897. doi: 10.1089/jwh.2004.13.888
Kaushal, N. & Rhodes, R. E. (2014). The home physical environment and its relationship with physical activity and sedentary behavior: A systematic review. Preventive Medicine, 67C, 221-237. doi: 10.1016/j.ypmed.2014.07.026
Kawakami, N., Araki, S., Kawashima, M., Masumoto, T. & Hayashi, T. (1997). Effects of work-related stress reduction on depressive symptoms among Japanese blue-collar workers. Scand J Work Environ Health, 23(1), 54-59.
Kay, B. H., Nam, V. S., Tien, T. V., Yen, N. T., Phong, T. V., Diep, V. T., et al. (2002). Control of aedes vectors of dengue in three provinces of Vietnam by use of Mesocyclops (Copepoda) and community-based methods validated by entomologic, clinical, and serological surveillance. Am J Trop Med Hyg, 66(1), 40-48.
Keiser, J., Maltese, M. F., Erlanger, T. E., Bos, R., Tanner, M., Singer, B. H. & Utzinger, J. (2005). Effect of irrigated rice agriculture on Japanese encephalitis, including challenges and opportunities for integrated vector management. Acta Tropica, 95(1), 40-57. doi: 10.1016/j.actatropica.2005.04.012
Keiser, J., Singer, B. H. & Utzinger, J. (2005). Reducing the burden of malaria in different eco-epidemiological settings with environmental management: a systematic review. The Lancet Infectious Diseases, 5(11), 695-708. doi: 10.1016/S1473-3099(05)70268-1
Kendrick, D., Young, B., Mason-Jones, A. J., Ilyas, N., Achana, F. A., Cooper, N. J., et al. (2013). Home safety education and provision of safety equipment for injury prevention (Review). Evid Based Child Health, 8(3), 761-939. doi: 10.1002/ebch.1911
Kerrigan, D., Wirtz, A. L., Baral, S., Decker, M. R., Murray, L., Poteat, T., et al. (2013). The Global HIV Epidemics among Sex Workers. Washington, DC: World Bank.
Keusch, G. T., Denno, D. M., Black, R. E., Duggan, C., Guerrant, R. L., Lavery, J. V., et al. (2014). Environmental enteric dysfunction: pathogenesis, diagnosis, and clinical consequences. Clinical Infectious Diseases: An Official Publication of the Infectious Diseases Society of America, 59 Suppl 4, S207-212. doi: 10.1093/cid/ciu485
Khalade, A., Jaakkola, M. S., Pukkala, E. & Jaakkola, J. J. (2010). Exposure to benzene at work and the risk of leukemia: a systematic review and meta-analysis. Environ Health, 9, 31. doi: 10.1186/1476-069X-9-31
Kheifets, L., Ahlbom, A., Crespi, C. M., Draper, G., Hagihara, J., Lowenthal, R. M., et al. (2010). Pooled analysis of recent studies on magnetic fields and childhood leukaemia. Br J Cancer, 103(7), 1128-1135. doi: 10.1038/sj.bjc.6605838
Kishi, R., Kobayashi, S., Ikeno, T., Araki, A., Miyashita, C., Itoh, S., et al. (2013). Ten years of progress in the Hokkaido birth cohort study on environment and children's health: cohort profile – updated 2013. Environ Health Prev Med, 18(6), 429-450. doi: 10.1007/s12199-013-0357-3
Kissling, E., Allison, E. H., Seeley, J. A., Russell, S., Bachmann, M., Musgrave, S. D. & Heck, S. (2005). Fisherfolk are among groups most at risk of HIV: cross-country analysis of prevalence and numbers infected. AIDS, 19(17), 1939-1946.
Kivimaki, M., Jokela, M., Nyberg, S. T., Singh-Manoux, A., Fransson, E. I., Alfredsson, L., et al.; for the IPD-Work Consortium (2015). Long working hours and risk of coronary heart disease and stroke: a systematic review and meta-analysis of published and unpublished data for 603 838 individuals. Lancet. doi: 10.1016/S0140-6736(15)60295-1
Kivimaki, M., Nyberg, S. T., Batty, G. D., Fransson, E. I., Heikkila, K., Alfredsson, L., et al.; for the IPD-Work Consortium (2012). Job strain as a risk factor for coronary heart disease: a collaborative meta-analysis of individual participant data. Lancet, 380(9852), 1491-1497. doi: 10.1016/S0140-6736(12)60994-5
Knipe, D. W., Metcalfe, C., Fernando, R., Pearson, M., Konradsen, F., Eddleston, M. & Gunnell, D. (2014). Suicide in Sri Lanka 1975-2012: age, period and cohort analysis of police and hospital data. BMC Public Health, 14, 839. doi: 10.1186/1471-2458-14-839
Ko, F. W. & Hui, D. S. (2012). Air pollution and chronic obstructive pulmonary disease. Respirology (Carlton, Vic.), 17(3), 395-401. doi: 10.1111/j.1440-1843.2011.02112.x
Kohl, H. W. 3rd, Craig, C. L., Lambert, E. V., Inoue, S., Alkandari, J. R., Leetongin, G., et al., for the Lancet Physical Activity Series Working Group (2012). The pandemic of physical inactivity: global action for public health. Lancet, 380(9838), 294-305. doi: 10.1016/S0140-6736(12)60898-8
Konradsen, F., Chimbari, M. & Furu, P. (2008). Mupfure irrigation project, Zimbabwe. HIA of a water resources development. In Fewtrell, L. (ed.), Health Impact Assessment of Water Resources Development. London: IWA Publishing.
Kotloff, K. L., Nataro, J. P., Blackwelder, W. C., Nasrin, D., Farag, T. H., Panchalingam, S., et al. (2013). Burden and aetiology of diarrhoeal disease in infants and young children in developing countries (the Global Enteric Multicenter Study, GEMS): a prospective, case-control study. Lancet, 382(9888), 209-222. doi: 10.1016/S0140-6736(13)60844-2
Kruse, M., Saetterstrom, B., Bonlokke, J., Bronnum-Hansen, H., Flachs, E. M. & Sorensen, J. (2012). Particulate emissions: health effects and labour market consequences. J Environ Public Health, 2012, 130502. doi: 10.1155/2012/130502
Kumar, A., Sharma, S. K., Padbidri, V. S., Thakare, J. P., Jain, D. C. & Datta, K. K. (2001). An outbreak of dengue fever in rural areas of northern India. J Commun Dis, 33(4), 274-281.
Kurmi, O. P., Arya, P. H., Lam, K. B., Sorahan, T. & Ayres, J. G. (2012). Lung cancer risk and solid fuel smoke exposure: a systematic review and meta-analysis. Eur Respir J, 40(5), 1228-1237. doi: 10.1183/09031936.00099511
Kurmi, O. P., Semple, S., Simkhada, P., Smith, W. C. & Ayres, J. G. (2010). COPD and chronic bronchitis risk of indoor air pollution from solid fuel: a systematic review and meta-analysis. Thorax, 65(3), 221-228. doi: 10.1136/thx.2009.124644
Kurmis, A. P. & Apps, S. A. (2007). Occupationally-acquired noise-induced hearing loss: a senseless workplace hazard. Int J Occup Med Environ Health, 20(2), 127-136. doi: 10.2478/v10001-007-0016-2
Kwak, L., Hagstromer, M., Jensen, I., Karlsson, M. L., Alipour, A. & Elinder, L. S. (2014). Promoting physical activity and healthy dietary behavior: the role of the occupational health services: a scoping review. Journal of Occupational and Environmental Medicine / American College of Occupational and Environmental Medicine, 56(1), 35-46. doi: 10.1097/JOM.0000000000000012
Kwena, Z. A., Bukusi, E. A., Ng'ayo, M. O., Buffardi, A. L., Nguti, R., Richardson, B., et al. (2010). Prevalence and risk factors for sexually transmitted infections in a high-risk occupational group: the case of fishermen along Lake Victoria in Kisumu, Kenya. Int J STD AIDS, 21(10), 708-713. doi: 10.1258/ijsa.2010.010160
Kyle, J. W., Hammitt, J. K., Lim, H. W., Geller, A. C., Hall-Jordan, L. H., Maibach, E. W., et al. (2008). Economic evaluation of the US Environmental Protection Agency’s SunWise program: sun protection education for young children. Pediatrics, 121(5), e1074-1084. doi: 10.1542/peds.2007-1400
Kysely, J., Pokorna, L., Kyncl, J. & Kriz, B. (2009). Excess cardiovascular mortality associated with cold spells in the Czech Republic. BMC Public Health, 9, 19. doi: 10.1186/1471-2458-9-19
Lai, P. S. & Christiani, D. C. (2013). Long-term respiratory health effects in textile workers. Curr Opin Pulm Med, 19(2), 152-157. doi: 10.1097/MCP.0b013e32835cee9a
Lake, I. R., Hooper, L., Abdelhamid, A., Bentham, G., Boxall, A. B., Draper, A., et al. (2012). Climate change and food security: health impacts in developed countries. Environ Health Perspect, 120(11), 1520-1526. doi: 10.1289/ehp.1104424
Laloe, V. (2002). Epidemiology and mortality of burns in a general hospital of Eastern Sri Lanka. Burns, 28(8), 778-781.
PREVENTING DISEASE THROUGH HEALTHY ENVIRONMENTS132

Lanphear, B. P., Hornung, R., Khoury, J., Yolton, K., Baghurst, P., Bellinger, D. C., et al. (2005). Low-level environmental lead exposure and children's intellectual function: an international pooled analysis. Environmental Health Perspectives, 113(7), 894-899.
Larouche, R., Saunders, T. J., Faulkner, G., Colley, R. & Tremblay, M. (2014). Associations between active school transport and physical activity, body composition, and cardiovascular fitness: a systematic review of 68 studies. J Phys Act Health, 11(1), 206-227. doi: 10.1123/jpah.2011-0345
Last, J. M. (2001). Re: "A dictionary of epidemiology, fourth edition, edited by John M. Last, Robert A. Spasoff and Susan G. Harris". American Journal of Epidemiology, 154(4), 389-389. doi: DOI 10.1093/aje/154.4.389
Lawn, J. E., Gravett, M. G., Nunes, T. M., Rubens, C. E., Stanton, C. & Group, G. R. (2010). Global report on preterm birth and stillbirth (1 of 7): definitions, description of the burden and opportunities to improve data. BMC Pregnancy Childbirth, 10 Suppl 1, S1. doi: 10.1186/1471-2393-10-S1-S1
Lee, I. M., Shiroma, E. J., Lobelo, F., Puska, P., Blair, S. N., Katzmarzyk, P. T. and Lancet Physical Activity Series Working Group (2012). Effect of physical inactivity on major non-communicable diseases worldwide: an analysis of burden of disease and life expectancy. Lancet, 380(9838), 219-229. doi: 10.1016/S0140-6736(12)61031-9
Leenaars, A., Cantor, C., Connolly, J., EchoHawk, M., Gailiene, D., He, Z. X., et al. (2000). Controlling the environment to prevent suicide: international perspectives. Can J Psychiatry, 45(7), 639-644.
Leonardi-Bee, J., Britton, J. & Venn, A. (2011). Secondhand smoke and adverse fetal outcomes in nonsmoking pregnant women: a meta-analysis. Pediatrics, 127(4), 734-741. doi: 10.1542/peds.2010-3041
Letasiova, S., Medve’ova, A., Sovcikova, A., Dusinska, M., Volkovova, K., Mosoiu, C. & Bartonova, A. (2012). Bladder cancer, a review of the environmental risk factors. Environ Health, 11 Suppl 1, S11. doi: 10.1186/1476-069X-11-S1-S11
Leung C.C., Lam, T.H, Ho, K.S., Yew, W.W., Tam, C.M., Chan, W.M., Law, W.S., Chan, C.K., Chang, K.C., Au, K.F. (2010). Passive smoking and tuberculosis. Archives of Internal Medicine, 170(3), 287-292. doi: 10.1001/archinternmed.2009.506
Levy, K., Hubbard, A. E. & Eisenberg, J. N. S. (2009). Seasonality of rotavirus disease in the tropics: a systematic review and meta-analysis. Int J Epidemiology, 38(6), 1487-1496. doi: 10.1093/ije/dyn260
Lienhardt, C. (2001). From exposure to disease: the role of environmental factors in susceptibility to and development of tuberculosis. Epidemiologic reviews, 23(2), 288-301.
Lighthall, D., Nunes, D. & Tyner, T. (2009). Environmental Health Evaluation of Rule 4901: Domestic Wood Burning. Fresno, California, USA: Central Valley Health Policy Institute; Central California Center for Health and Human Services; College of Health and Human Services; California State University, Fresno.
Lightwood, J. M., Coxson, P. G., Bibbins-Domingo, K., Williams, L. W. & Goldman, L. (2009). Coronary heart disease attributable to passive smoking: CHD Policy Model. American Journal of Preventive Medicine, 36(1), 13-20. doi: 10.1016/j.amepre.2008.09.030
Lim, S. S., Vos, T., Flaxman, A. D., Danaei, G., Shibuya, K., Adair-Rohani, H., et al. (2012). A comparative risk assessment of burden of disease and injury attributable to 67 risk factors and risk factor clusters in 21 regions, 1990-2010: a systematic analysis for the Global Burden of Disease Study 2010. Lancet, 380(9859), 2224-2260. doi: 10.1016/S0140-6736(12)61766-8
Lin, A., Arnold, B. F., Afreen, S., Goto, R., Huda, T. M., Haque, R., et al. (2013). Household environmental conditions are associated with enteropathy and impaired growth in rural Bangladesh. Am J Trop Med Hyg, 89(1), 130-137. doi: 10.4269/ajtmh.12-0629
Lin, D. D., Zeng, X. J., Chen, H. G., Hong, X. L., Tao, B., Li, Y. F., et al. (2009). [Cost-effectiveness and cost-benefit analysis on the integrated schistosomiasis control strategies with emphasis on infection source in Poyang Lake region]. Zhongguo Ji Sheng Chong Xue Yu Ji Sheng Chong Bing Za Zhi, 27(4), 297-302.
Lin, J. S., Eder, M., Weinmann, S., Zuber, S. P., Beil, T. L., Plaut, D. & Lutz, K. (2011). Behavioral Counseling to Prevent Skin Cancer: Systematic Evidence Review to Update the 2003 U.S. Preventive Services Task Force Recommendation. Rockville (MD): Agency for Healthcare Research and Quality (US).
Lind, L. & Lind, P. M. (2012). Can persistent organic pollutants and plastic-associated chemicals cause cardiovascular disease? J Intern Med, 271(6), 537-553. doi: 10.1111/j.1365-2796.2012.02536.x
Ling, S. H. & van Eeden, S. F. (2009). Particulate matter air pollution exposure: role in the development and exacerbation of chronic obstructive pulmonary disease. Int J Chron Obstruct Pulmon Dis, 4, 233-243.
Liu, Q., Tian, L. G., Xiao, S. H., Qi, Z., Steinmann, P., Mak, T. K., et al. (2008). Harnessing the wealth of Chinese scientific literature: schistosomiasis research and control in China. Emerg Themes Epidemiol, 5, 19. doi: 10.1186/1742-7622-5-19
Liu, Y., Chang, C. C., Marsh, G. M. & Wu, F. (2012). Population attributable risk of aflatoxin-related liver cancer: systematic review and meta-analysis. Eur J Cancer, 48(14), 2125-2136. doi: 10.1016/j.ejca.2012.02.009
Liu, Y., Mack, K. A. & Diekman, S. T. (2012). Smoke alarm giveaway and installation programs: an economic evaluation. Am J Preventive Med, 43(4), 385-391. doi: 10.1016/j.amepre.2012.06.021
Loane, M., Dolk, H., Kelly, A., Teljeur, C., Greenlees, R., Densem, J. & EUROCAT Working Group (2011). Paper 4: EUROCAT statistical monitoring: identification and investigation of ten year trends of congenital anomalies in Europe. Birth Defects Res A Clin Mol Teratol, 91 Suppl 1, S31-43. doi: 10.1002/bdra.20778
Lönnroth, K., Jaramillo, E., Williams, B. G., Dye, C. & Raviglione, M. (2009). Drivers of tuberculosis epidemics: the role of risk factors and social determinants. Social Science & Medicine (1982), 68(12), 2240-2246. doi: 10.1016/j.socscimed.2009.03.041
Lopez, R. P. & Hynes, H. P. (2006). Obesity, physical activity, and the urban environment: public health research needs. Environmental Health, 5, 25. doi: 10.1186/1476-069X-5-25
Lord, S. R., Menz, H. B. & Sherrington, C. (2006). Home environment risk factors for falls in older people and the efficacy of home modifications. Age Ageing, 35 Suppl 2, ii55-ii59. doi: 10.1093/ageing/afl088
Lozano, R., Naghavi, M., Foreman, K., Lim, S., Shibuya, K., Aboyans, V., et al. (2012). Global and regional mortality from 235 causes of death for 20 age groups in 1990 and 2010: a systematic analysis for the Global Burden of Disease Study 2010. Lancet, 380(9859), 2095-2128. doi: 10.1016/S0140-6736(12)61728-0
Lucas, R. M., McMichael, A. J., Armstrong, B. K. & Smith, W. T. (2008). Estimating the global disease burden due to ultraviolet radiation exposure. Int J Epidemiol, 37(3), 654-667. doi: 10.1093/ije/dyn017
MacDonald, C., Sternberg, A. & Hunter, P. R. (2007). A systematic review and meta-analysis of interventions used to reduce exposure to house dust and their effect on the development and severity of asthma. Environ Health Perspect, 115(12), 1691-1695. doi: 10.1289/ehp.10382
MacDonald, L. A., Waters, T. R., Napolitano, P. G., Goddard, D. E., Ryan, M. A., Nielsen, P. & Hudock, S. D. (2013). Clinical guidelines for occupational lifting in pregnancy: evidence summary and provisional recommendations. Am J Obstet Gynecol, 209(2), 80-88. doi: 10.1016/j.ajog.2013.02.047
MacDonald, M. R. (2013). Sexual Health and Responsibility Program (SHARP): preventing HIV, STIs, and unplanned pregnancies in the navy and marine corps. Public Health Rep, 128 Suppl 1, 81-88.
Mackay, D. F., Irfan, M. O., Haw, S. & Pell, J. P. (2010). Meta-analysis of the effect of comprehensive smoke-free legislation on acute coronary events. Heart, 96(19), 1525-1530. doi: 10.1136/hrt.2010.199026
Malla, M. B., Bruce, N., Bates, E. & Rehfuess, E. (2011). Applying Global Cost-Benefit Analysis Methods to Indoor Air Pollution Mitigation Interventions in Nepal, Kenya and Sudan: Insights and Challenges. Energy Policy, 39(12), 152-157.
REFERENCES 133
Mammen, G. & Faulkner, G. (2013). Physical activity and the prevention of depression: a systematic review of prospective studies. American Journal of Preventive Medicine, 45(5), 649-657. doi: 10.1016/j.amepre.2013.08.001
Manjunath, J. V., Thappa, D. M. & Jaisankar, T. J. (2002). Sexually transmitted diseases and sexual lifestyles of long-distance truck drivers: a clinico-epidemiologic study in south India. Int J STD AIDS, 13(9), 612-617. doi: 10.1258/09564620260216317
Marinho de Souza Mde, F., Macinko, J., Alencar, A. P., Malta, D. C. & de Morais Neto, O. L. (2007). Reductions in firearm-related mortality and hospitalizations in Brazil after gun control. Health Aff (Millwood), 26(2), 575-584. doi: 10.1377/hlthaff.26.2.575
Mathers, B. M., Degenhardt, L., Phillips, B., Wiessing, L., Hickman, M., Strathdee, S. A., et al. (2008). Global epidemiology of injecting drug use and HIV among people who inject drugs: a systematic review. Lancet, 372(9651), 1733-1745. doi: 10.1016/S0140-6736(08)61311-2
Matsui, E. C. (2013). Environmental control for asthma: recent evidence. Current Opinion in Allergy and Clinical Immunology, 13(4), 417-425. doi: 10.1097/ACI.0b013e328362b776
Matzopoulos, R. G., Thompson, M. L. & Myers, J. E. (2014). Firearm and nonfirearm homicide in 5 South African cities: a retrospective population-based study. Am J Pub Health, 104(3), 455-460. doi: 10.2105/AJPH.2013.310650
Maughan, D., Berry H. & Davison, P. (2014). What psychiatrists should know about environmental sustainability and what they should be doing about it. Int Psych, 11(2), 27-30.
McCracken, J. P., Smith, K. R., Diaz, A., Mittleman, M. A. & Schwartz, J. (2007). Chimney stove intervention to reduce long-term wood smoke exposure lowers blood pressure among Guatemalan women. Environ Health Perspect, 115(7), 996-1001. doi: 10.1289/ehp.9888
McGhee, S. M., Ho, L. M., Lapsley, H. M., Chau, J., Cheung, W. L., Ho, S. Y., et al. (2006). Cost of tobacco-related diseases, including passive smoking, in Hong Kong. Tob Control, 15(2), 125-130. doi: 10.1136/tc.2005.013292
McGwin, G., Lienert, J. & Kennedy, J. I. (2010). Formaldehyde exposure and asthma in children: a systematic review. Environ Health Perspect, 118(3), 313-317. doi: 10.1289/ehp.0901143
McLean, S. M., May, S., Klaber-Moffett, J., Sharp, D. M. & Gardiner, E. (2010). Risk factors for the onset of non-specific neck pain: a systematic review. J Epidemiol Community Health, 64(7), 565-572. doi: 10.1136/jech.2009.090720
Meeker, J. D. (2012). Exposure to environmental endocrine disruptors and child development. Arch Pediatr Adolesc Med, 166(10), 952-958.
Meyers, D. G., Neuberger, J. S. & He, J. (2009). Cardiovascular effect of bans on smoking in public places: a systematic review and meta-analysis. J Am Coll Cardiol, 54(14), 1249-1255. doi: 10.1016/j.jacc.2009.07.022
Meyrowitsch, D. W., Nguyen, D. T., Hoang, T. H., Nguyen, T. D. & Michael, E. (1998). A review of the present status of lymphatic filariasis in Vietnam. Acta Tropica, 70(3), 335-347.
Mielke, H. W. & Zahran, S. (2012). The urban rise and fall of air lead (Pb) and the latent surge and retreat of societal violence. Environ Int, 43, 48-55. doi: 10.1016/j.envint.2012.03.005
Misra, P., Srivastava, R., Krishnan, A., Sreenivaas, V. & Pandav, C. S. (2012). Indoor air pollution-related acute lower respiratory infections and low birthweight: a systematic review. J Trop Pediatr, 58(6), 457-466. doi: 10.1093/tropej/fms017
Modell, J. H. (2010). Prevention of needless deaths from drowning. South Med J, 103(7), 650-653. doi: 10.1097/SMJ.0b013e3181e10564
Mohan, D. (2008). Traffic safety and city structure: lessons for the future. Salud Pública México, 50 Suppl1, S93-S99.
Moncayo, A. & Silveira, A. C. (2009). Current epidemiological trends for Chagas disease in Latin America and future challenges in epidemiology, surveillance and health policy. Mem Inst Oswaldo Cruz, 104 Suppl 1, 17-30.
Monroy, C., Bustamante, D. M., Pineda, S., Rodas, A., Castro, X., Ayala, V., et al. (2009). House improvements and community participation in the control of Triatoma dimidiata re-infestation in Jutiapa, Guatemala. Cadernos De Saúde Pública / Ministério Da Saúde, Fundação Oswaldo Cruz, Escola Nacional De Saúde Pública, 25 Suppl 1, S168-178.
Moon, K., Guallar, E. & Navas-Acien, A. (2012). Arsenic exposure and cardiovascular disease: an updated systematic review. Curr Atheroscler Rep, 14(6), 542-555. doi: 10.1007/s11883-012-0280-x
Morency, P., Gauvin, L., Plante, C., Fournier, M. & Morency, C. (2012). Neighborhood social inequalities in road traffic injuries: the influence of traffic volume and road design. Am J Pub Health, 102(6), 1112-1119. doi: 10.2105/AJPH.2011.300528
Moscato, G., Pala, G., Boillat, M. A., Folletti, I., Gerth van Wijk, R., Olgiati-Des Gouttes, D., et al. (2011). EAACI position paper: prevention of work-related respiratory allergies among pre-apprentices or apprentices and young workers. Allergy, 66(9), 1164-1173. doi: 10.1111/j.1398-9995.2011.02615.x
Mowry, J. B., Spyker, D. A., Cantilena, L. R., Bailey, J. E. & Ford, M. (2014). Annual Report of the American Association of Poison Control Centers' National Poison Data System (NPDS): 30th Annual Report Abstracts. Clinical Toxicology, 52(12), 1032-1283.
Moyer, V. A. & U.S. Preventive Services Task Force (2012). Behavioral counseling to prevent skin cancer: U.S. Preventive Services Task Force recommendation statement. Ann Intern Med, 157(1), 59-65. doi: 10.7326/0003-4819-157-1-201207030-00442
Mudarri, D. & Fisk, W. J. (2007). Public health and economic impact of dampness and mold. Indoor Air, 17(3), 226-235. doi: 10.1111/j.1600-0668.2007.00474.x
Muir, D. A. (1988). Anopheline mosquitoes: vector reproduction, life cycle and biotope. In Wernersdorfer, W. H. & McGregor, I. (eds), Malaria. Principles and practices of malariology. New York: Churchill Livingstone.
Muller, D. & Desel, H. (2013). Common causes of poisoning: etiology, diagnosis and treatment. Dtsch Arztebl Int, 110(41), 690-699; quiz 700. doi: 10.3238/arztebl.2013.0690
Muntner, P., He, J., Vupputuri, S., Coresh, J. & Batuman, V. (2003). Blood lead and chronic kidney disease in the general United States population: results from NHANES III. Kidney Int, 63(3), 1044-1050. doi: 10.1046/j.1523-1755.2003.00812.x
Mutambudzi, M., Meyer, J. D., Warren, N. & Reisine, S. (2011). Effects of psychosocial characteristics of work on pregnancy outcomes: a critical review. Women Health, 51(3), 279-297. doi: 10.1080/03630242.2011.560242
Narang, I. & Bush, A. (2012). Early origins of chronic obstructive pulmonary disease. Semin Fetal Neonatal Med, 17(2), 112-118. doi: 10.1016/j.siny.2012.01.002
National Fire Protection Association (2014). An overview of the U.S. Fire Problem. Available: http://www.nfpa.org/~/media/files/research/fact-sheets/fireoverview.pdf?la=en (accessed 8 December 2015).
Navas-Acien, A., Guallar, E., Silbergeld, E. K. & Rothenberg, S. J. (2007). Lead exposure and cardiovascular disease - a systematic review. Environmental Health Perspectives, 115(3), 472-482. doi: 10.1289/ehp.9785
Ndrepepa, A. & Twardella, D. (2011). Relationship between noise annoyance from road traffic noise and cardiovascular diseases: a meta-analysis. Noise Health, 13(52), 251-259. doi: 10.4103/1463-1741.80163
Neria, Y., Nandi, A. & Galea, S. (2008). Post-traumatic stress disorder following disasters: a systematic review. Psychol Med, 38(4), 467-480. doi: 10.1017/S0033291707001353
Nevin, R., Jacobs, D. E., Berg, M. & Cohen, J. (2008). Monetary benefits of preventing childhood lead poisoning with lead-safe window replacement. Environ Research, 106(3), 410-419. doi: 10.1016/j.envres.2007.09.003
New Hampshire Occupational Health Surveillance Program. (2012). Poisoned at work: An evaluation of New Hampshire Poison Center data for occupational exposures from 2005 to 2011.
PREVENTING DISEASE THROUGH HEALTHY ENVIRONMENTS134

Ng, S. W., Howard, A. G., Wang, H. J., Su, C. & Zhang, B. (2014). The physical activity transition among adults in China: 1991-2011. Obes Rev, 15 Suppl 1, 27-36. doi: 10.1111/obr.12127
Ng, S. W. & Popkin, B. M. (2012). Time use and physical activity: a shift away from movement across the globe. Obes Rev, 13(8), 659-680. doi: 10.1111/j.1467-789X.2011.00982.x
Ngure, F. M., Reid, B. M., Humphrey, J. H., Mbuya, M. N., Pelto, G. & Stoltzfus, R. J. (2014). Water, sanitation, and hygiene (WASH), environmental enteropathy, nutrition, and early child development: making the links. Ann N Y Acad Sci, 1308, 118-128. doi: 10.1111/nyas.12330
Nguyen, K. H., Boulay, E. & Peng, J. (2011). Quality-of-life and cost-benefit analysis of a home environmental assessment program in Connecticut. J Asthma, 48(2), 147-155. doi: 10.3109/02770903.2010.535881
Niedhammer, I., Chastang, J. F., Sultan-Taieb, H., Vermeylen, G. & Parent-Thirion, A. (2013). Psychosocial work factors and sickness absence in 31 countries in Europe. Eur J Public Health, 23(4), 622-629. doi: 10.1093/eurpub/cks124
Niedhammer, I., Sultan-Taieb, H., Chastang, J. F., Vermeylen, G. & Parent-Thirion, A. (2014). Fractions of cardiovascular diseases and mental disorders attributable to psychosocial work factors in 31 countries in Europe. Int Arch Occup Environ Health, 87(4), 403-411. doi: 10.1007/s00420-013-0879-4
Nielsen, L. S., Baelum, J., Rasmussen, J., Dahl, S., Olsen, K. E., Albin, M., et al. (2014). Occupational asbestos exposure and lung cancer – a systematic review of the literature. Arch Environ Occup Health, 69(4), 191-206. doi: 10.1080/19338244.2013.863752
Nies, E. (2012). Ototoxic substances at the workplace: a brief update. Arhiv Za Higijenu Rada I Toksikologiju, 63(2), 147-152. doi: 10.2478/10004-1254-63-2012-2199
Nieuwenhuijsen, M. J., Dadvand, P., Grellier, J., Martinez, D. & Vrijheid, M. (2013). Environmental risk factors of pregnancy outcomes: a summary of recent meta-analyses of epidemiological studies. Environ Health, 12, 6. doi: 10.1186/1476-069X-12-6
NIOSH (2002). Health effects of occupational exposure to respirable crystalline silica. Cincinatti: National Institute for Occupational Safety & Health.
NIOSH (1994). Preventing drownings of commercial fishermen, Pub. No. 94-107: National Institute for Occupational Safety & Health - DHHS.
Norman, R. E., Ryan, A., Grant, K., Sitas, F. & Scott, J. G. (2014). Environmental contributors to childhood cancers. J Environ Immunology and Toxicology, 1(4), 12.
Norval, M., Lucas, R. M., Cullen, A. P., de Gruijl, F. R., Longstreth, J., Takizawa, Y. & van der Leun, J. C. (2011). The human health effects of ozone depletion and interactions with climate change. Photochem Photobiol Sci, 10(2), 199-225. doi: 10.1039/c0pp90044c
Novoa, A. M., Perez, K. & Borrell, C. (2009). [Evidence-based effectiveness of road safety interventions: a literature review]. Gac Sanit, 23(6), 553 e551-514. doi: 10.1016/j.gaceta.2009.04.006
Nurmagambetov, T. A., Barnett, S. B., Jacob, V., Chattopadhyay, S. K., Hopkins, D. P., Crocker, D. D., et al; Task Force on Community Preventive Services (2011). Economic value of home-based, multi-trigger, multicomponent interventions with an environmental focus for reducing asthma morbidity a community guide systematic review. Am J Prev Med, 41(2 Suppl 1), S33-47. doi: 10.1016/j.amepre.2011.05.011
Nurminen, M. & Karjalainen, A. (2001). Epidemiologic estimate of the proportion of fatalities related to occupational factors in Finland. Scand J Work Environ Health, 27(3), 161-213.
O Ferdinand, A., Sen, B., Rahurkar, S., Engler, S. & Menachemi, N. (2012). The relationship between built environments and physical activity: a systematic review. Am J Pub Health, 102(10), e7-e13. doi: 10.2105/AJPH.2012.300740
Öberg, M., Jaakkola, M. S., Woodward, A., Peruga, A. & Prüss-Ustün, A. (2011). Worldwide burden of disease from exposure to second-hand smoke: a retrospective analysis of data from 192 countries. Lancet, 377(9760), 139-146. doi: 10.1016/S0140-6736(10)61388-8
Ojima, T., Uehara, R., Watanabe, M., Tajimi, M., Oki, I. & Nakamura, Y. (2004). Population attributable fraction of smoking to low birth weight in Japan. Pediatr Int, 46(3), 264-267. doi: 10.1111/j.1442-200x.2004.01881.x
Ojo, O., Verbeek, J. H., Rasanen, K., Heikkinen, J., Isotalo, L. K., Mngoma, N. & Ruotsalainen, E. (2011). Interventions to reduce risky sexual behaviour for preventing HIV infection in workers in occupational settings. Cochrane Database of Systematic Reviews (Online)(12), CD005274. doi: 10.1002/14651858.CD005274.pub3
Olsson, A. R., Skogh, T., Axelson, O. & Wingren, G. (2004). Occupations and exposures in the work environment as determinants for rheumatoid arthritis. Occup Environ Med, 61(3), 233-238.
Ong, M. K. & Glantz, S. A. (2005). Free nicotine replacement therapy programs vs implementing smoke-free workplaces: a cost-effectiveness comparison. Am J Pub Health, 95(6), 969-975. doi: 10.2105/AJPH.2004.040667
Oomen J.M.V, de Wolf J. & Jobin, W. R. (1994). Health and Irrigation. ILRI Publication 45. Wageningen, the Netherlands: International Institute for Land Reclamation and Improvement.
Oono, I. P., Mackay, D. F. & Pell, J. P. (2011). Meta-analysis of the association between secondhand smoke exposure and stroke. J Pub Health (Oxford, England). doi: 10.1093/pubmed/fdr025
OSHA (2014). Occupational noise exposure. Available: https://www.osha.gov/SLTC/noisehearingconservation/index.html (accessed 2 December 2015).
Ota, E., Wariki, W. M., Mori, R., Hori, N. & Shibuya, K. (2011). Behavioral interventions to reduce the transmission of HIV infection among sex workers and their clients in high-income countries. Cochrane Database of Systematic Reviews (Online)(12), CD006045. doi: 10.1002/14651858.CD006045.pub3
Ott, J. J., Stevens, G. A., Groeger, J. & Wiersma, S. T. (2012). Global epidemiology of hepatitis B virus infection: new estimates of age-specific HBsAg seroprevalence and endemicity. Vaccine, 30(12), 2212-2219. doi: 10.1016/j.vaccine.2011.12.116
Page, L. A., Hajat, S. & Kovats, R. S. (2007). Relationship between daily suicide counts and temperature in England and Wales. Br J Psychiatry, 191, 106-112. doi: 10.1192/bjp.bp.106.031948
Page, R. L. II, Slejko, J. F. & Libby, A. M. (2012). A citywide smoking ban reduced maternal smoking and risk for preterm births: A Colorado natural experiment. J Women's Health, 21(6), 621-627. doi: 10.1089/jwh.2011.3305
Paget-Bailly, S., Cyr, D. & Luce, D. (2012). Occupational exposures and cancer of the larynx-systematic review and meta-analysis. Journal of Occupational and Environmental Medicine / American College of Occupational and Environmental Medicine, 54(1), 71-84. doi: 10.1097/JOM.0b013e31823c1343
Pak, V. M., Powers, M. & Liu, J. (2013). Occupational chemical exposures among cosmetologists: risk of reproductive disorders. Workplace Health Saf, 61(12), 522-528; quiz 529. doi: 10.3928/21650799-20131121-01
Palmer, K. T., Bonzini, M., Bonde, J. P., & on behalf of a multidisciplinary Guideline Development Group convened by, and in association with, the Health and Work Development Unit, a collaboration between the Royal College of Physicians and the Faculty of Occupational Medicine (2013). Pregnancy: occupational aspects of management: concise guidance. Clin Med, 13(1), 75-79.
Palmer, K. T., Bonzini, M., Harris, E. C., Linaker, C. & Bonde, J. P. (2013). Work activities and risk of prematurity, low birth weight and pre-eclampsia: an updated review with meta-analysis. Occup Environ Med, 70(4), 213-222. doi: 10.1136/oemed-2012-101032
Park, S., Kim, Y., Shin, H. R., Lee, B., Shin, A., Jung, K. W., et al. (2014). Population-attributable causes of cancer in Korea: obesity and physical inactivity. PLoS ONE, 9(4), e90871. doi: 10.1371/journal.pone.0090871
Parkin, D. M., Mesher, D. & Sasieni, P. (2011). 13. Cancers attributable to solar (ultraviolet) radiation exposure in the UK in 2010. Br J Cancer, 105 Suppl 2, S66-69. doi: 10.1038/bjc.2011.486
Pascolini, D. & Mariotti, S. P. (2012). Global estimates of visual impairment: 2010. Br J Ophthalmol, 96(5), 614-618. doi: 10.1136/bjophthalmol-2011-300539
REFERENCES 135

Patankar, A. M. & Trivedi, P. L. (2011). Monetary burden of health impacts of air pollution in Mumbai, India: implications for public health policy. Public Health, 125(3), 157-164. doi: 10.1016/j.puhe.2010.11.009
Patel, V., Ramasundarahettige, C., Vijayakumar, L., Thakur, J. S., Gajalakshmi, V., Gururaj, G., et al; Million Death Study Collaborators (2012). Suicide mortality in India: a nationally representative survey. Lancet, 379(9834), 2343-2351. doi: 10.1016/S0140-6736(12)60606-0
Patelarou, E. & Kelly, F. J. (2014). Indoor exposure and adverse birth outcomes related to fetal growth, miscarriage and prematurity-a systematic review. Int J Environ Research and Public Health, 11(6), 5904-5933. doi: 10.3390/ijerph110605904
Patrick, L. (2006). Lead toxicity, a review of the literature. Part 1: Exposure, evaluation, and treatment. Altern Med Rev, 11(1), 2-22.
Paynter, S., Ware, R. S., Weinstein, P., Williams, G. & Sly, P. D. (2010). Childhood pneumonia: a neglected, climate-sensitive disease? Lancet, 376(9755), 1804-1805. doi: 10.1016/S0140-6736(10)62141-1
Pearce, N., Ait-Khaled, N., Beasley, R., Mallol, J., Keil, U., Mitchell, E., & the ISAAC Phase Three Study Group (2007). Worldwide trends in the prevalence of asthma symptoms: phase III of the International Study of Asthma and Allergies in Childhood (ISAAC). Thorax, 62(9), 758-766. doi: 10.1136/thx.2006.070169
Pedersen, M., Giorgis-Allemand, L., Bernard, C., Aguilera, I., Andersen, A. M., Ballester, F., et al. (2013). Ambient air pollution and low birthweight: a European cohort study (ESCAPE). Lancet Respir Med, 1(9), 695-704. doi: 10.1016/S2213-2600(13)70192-9
Pejtersen, J. H., Burr, H., Hannerz, H., Fishta, A. & Eller, N. H. (2014). Update on Work-Related Psychosocial Factors and the Development of Ischaemic Heart Disease. A systematic review. Cardiol Rev. doi: 10.1097/CRD.0000000000000033
Peletz, R., Mahin, T., Elliott, M., Harris, M. S., Chan, K. S., Cohen, M. S., et al. (2013). Water, sanitation, and hygiene interventions to improve health among people living with HIV/AIDS: a systematic review. AIDS, 27(16), 2593-2601. doi: 10.1097/QAD.0b013e3283633a5f
Perez-Rios, M., Ruano-Ravina, A., Etminan, M. & Takkouche, B. (2010). A meta-analysis on wood dust exposure and risk of asthma. Allergy, 65(4), 467-473. doi: 10.1111/j.1398-9995.2009.02166.x
Perez, L., Sunyer, J. & Künzli, N. (2009). Estimating the health and economic benefits associated with reducing air pollution in the Barcelona metropolitan area (Spain). Gac Sanit, 23(4), 287-294. doi: 10.1016/j.gaceta.2008.07.002
Perez, L. G., Arredondo, E. M., McKenzie, T. L., Holguin, M., Elder, J. P. & Ayala, G. X. (2015). Neighborhood Social Cohesion and Depressive Symptoms Among Latinos: Does Use of Community Resources for Physical Activity Matter? J Phys Act Health. doi: 10.1123/jpah.2014-0261
Phillips, M. R., Yang, G., Zhang, Y., Wang, L., Ji, H. & Zhou, M. (2002). Risk factors for suicide in China: a national case-control psychological autopsy study. Lancet, 360(9347), 1728-1736. doi: 10.1016/S0140-6736(02)11681-3
Pinho, A. A., Chinaglia, M., Lippman, S. A., Reingold, A., Diaz, R. S., Sucupira, M. C., et al. (2011). Prevalence and factors associated with HSV-2 and hepatitis B infections among truck drivers crossing the southern Brazilian border. Sexually Transmitted Infections, 87(7), 553-559. doi: 10.1136/sextrans-2011-050186
Po, J. Y., FitzGerald, J. M. & Carlsten, C. (2011). Respiratory disease associated with solid biomass fuel exposure in rural women and children: systematic review and meta-analysis. Thorax, 66(3), 232-239. doi: 10.1136/thx.2010.147884
Polanska, K., Jurewicz, J. & Hanke, W. (2013). Review of current evidence on the impact of pesticides, polychlorinated biphenyls and selected metals on attention deficit / hyperactivity disorder in children. Int J Occup Med Environ Health, 26(1), 16-38. doi: 10.2478/s13382-013-0073-7
Polanska, K., Ligocka, D., Sobala, W. & Hanke, W. (2014). Phthalate exposure and child development: the Polish Mother and Child Cohort Study. Early Hum Dev, 90(9), 477-485. doi: 10.1016/j.earlhumdev.2014.06.006
Poole, J. A. (2012). Farming-associated environmental exposures and effect on atopic diseases. Ann Allergy Asthma Immunol, 109(2), 93-98. doi: 10.1016/j.anai.2011.12.014
Pope, D. P., Mishra, V., Thompson, L., Siddiqui, A. R., Rehfuess, E. A., Weber, M. & Bruce, N. G. (2010). Risk of low birth weight and stillbirth associated with indoor air pollution from solid fuel use in developing countries. Epidemiologic reviews, 32(1), 70-81. doi: 10.1093/epirev/mxq005
Poreba, R., Gac, P., Poreba, M. & Andrzejak, R. (2011). Environmental and occupational exposure to lead as a potential risk factor for cardiovascular disease. Environ Toxicol Pharmacol, 31(2), 267-277. doi: 10.1016/j.etap.2010.12.002
Porkka-Heiskanen, T., Zitting, K. M. & Wigren, H. K. (2013). Sleep, its regulation and possible mechanisms of sleep disturbances. Acta Physiol (Oxf), 208(4), 311-328. doi: 10.1111/apha.12134
Prendergast, A. & Kelly, P. (2012). Enteropathies in the developing world: neglected effects on global health. Am J Trop Med Hyg, 86(5), 756-763. doi: 10.4269/ajtmh.2012.11-0743
Prichard, R. K., Basanez, M. G., Boatin, B. A., McCarthy, J. S., Garcia, H. H., Yang, G. J., et al. (2012). A research agenda for helminth diseases of humans: intervention for control and elimination. PLoS Negl Trop Dis, 6(4), e1549. doi: 10.1371/journal.pntd.0001549
Proietti, E., Roosli, M., Frey, U. & Latzin, P. (2013). Air pollution during pregnancy and neonatal outcome: a review. J Aerosol Med Pulm Drug Deliv, 26(1), 9-23. doi: 10.1089/jamp.2011.0932
Prüss-Ustün, A., Kay D., Fewtrell L. & J., Bartram (2004). Unsafe water, sanitation and hygiene. In Ezzati M., Lopez A. D., Rodgers A. & Murray, C. J. L. (eds), Comparative quantification of health risks. Geneva: World Health Organization.
Prüss-Ustün, A., Bartram, J., Clasen, T., Colford, J. M., Jr., Cumming, O., Curtis, V., et al. (2014). Burden of disease from inadequate water, sanitation and hygiene in low- and middle-income settings: a retrospective analysis of data from 145 countries. Trop Med Int Health, 19(8), 894-905. doi: 10.1111/tmi.12329
Prüss-Ustün, A. & Corvalan, C. (2006). Preventing disease through healthy environments: Towards an estimate of the environmental burden of disease. Geneva: World Health Organization.
Prüss-Ustün, A. & Mathers, C. (2003). Introduction and methods. Assessing the environmental burden of disease at national and local levels. Geneva: World Health Organization.
Prüss-Ustün, A., Rapiti, E. & Hutin, Y. (2005). Estimation of the global burden of disease attributable to contaminated sharps injuries among health-care workers. Am J Ind Med, 48(6), 482-490.
Prüss-Ustün, A., Wolf, J., Driscoll, T., Degenhardt, L., Neira, M. & Calleja, J. M. (2013). HIV due to female sex work: regional and global estimates. PLoS ONE, 8(5), e63476. doi: 10.1371/journal.pone.0063476
Prüss, A., Kay, D., Fewtrell, L. & Bartram, J. (2002). Estimating the burden of disease from water, sanitation, and hygiene at a global level. Environ Health Perspectives, 110(5), 537-542.
Prüss, A. & Mariotti, S. P. (2000). Preventing trachoma through environmental sanitation: a review of the evidence base. Bulletin of the World Health Organization, 78(2), 258-266.
Purdue, M. P., Hutchings, S. J., Rushton, L. & Silverman, D. T. (2014). The proportion of cancer attributable to occupational exposures. Ann Epidemiol. doi: 10.1016/j.annepidem.2014.11.009
Qin, H. L., Zhao, X. C., Zhou, J. H., Qiu, J., Yang, Z. L., Jiang, Z. Q. & Zhu, B. Z. (2004). Effect of environment on extremely severe road traffic crashes: retrospective epidemic analysis during 2000-2001. Chin J Traumatol, 7(6), 323-329.
Quansah, R., Armah, F. A., Essumang, D. K., Luginaah, I., Clarke, E., Marfo, K., et al. (2015). Association of Arsenic with Adverse Pregnancy Outcomes-Infant Mortality: A Systematic Review and Meta-Analysis. Environ Health Perspect. doi: 10.1289/ehp.1307894
PREVENTING DISEASE THROUGH HEALTHY ENVIRONMENTS136

Quansah, R., Jaakkola, M. S., Hugg, T. T., Heikkinen, S. A. & Jaakkola, J. J. (2012). Residential dampness and molds and the risk of developing asthma: a systematic review and meta-analysis. PLoS ONE, 7(11), e47526. doi: 10.1371/journal.pone.0047526
Raheel, U., Faheem, M., Riaz, M. N., Kanwal, N., Javed, F., Zaidi, N. & Qadri, I. (2011). Dengue fever in the Indian Subcontinent: an overview. J Infect Dev Ctries, 5(4), 239-247.
Rahman, F., Bose, S., Linnan, M., Rahman, A., Mashreky, S., Haaland, B. & Finkelstein, E. (2012). Cost-effectiveness of an injury and drowning prevention program in Bangladesh. Pediatrics, 130(6), e1621-1628. doi: 10.1542/peds.2012-0757
Rao, D. & Phipatanakul, W. (2011). Impact of environmental controls on childhood asthma. Curr Allergy Asthma Rep, 11(5), 414-420. doi: 10.1007/s11882-011-0206-7
Rees, D. & Murray, J. (2007). Silica, silicosis and tuberculosis. The International Journal of Tuberculosis and Lung Disease: The Official Journal of the International Union Against Tuberculosis and Lung Disease, 11(5), 474-484.
Reh, D. D., Higgins, T. S. & Smith, T. L. (2012). Impact of tobacco smoke on chronic rhinosinusitis: a review of the literature. Int Forum Allergy Rhinol, 2(5), 362-369. doi: 10.1002/alr.21054
Reichard, A. A., Konda, S. & Jackson, L. L. (2015). Occupational burns treated in emergency departments. American Journal of Industrial Medicine, 58(3), 290-298. doi: 10.1002/ajim.22407
Reinau, D., Weiss, M., Meier, C. R., Diepgen, T. L. & Surber, C. (2013). Outdoor workers' sun-related knowledge, attitudes and protective behaviours: a systematic review of cross-sectional and interventional studies. Br J Dermatol, 168(5), 928-940. doi: 10.1111/bjd.12160
Renwick, M., Subedi, P. S. & Hutton, G. (2007). A Cost-Benefit Analysis of National and Regional Integrated Biogas and Sanitation Programs in Sub-Saharan Africa: Winrock International.
Retting, R. A., Ferguson, S. A. & McCartt, A. T. (2003). A review of evidence-based traffic engineering measures designed to reduce pedestrian-motor vehicle crashes. Am J Pub Health, 93(9), 1456-1463.
Reynolds, C. C., Harris, M. A., Teschke, K., Cripton, P. A. & Winters, M. (2009). The impact of transportation infrastructure on bicycling injuries and crashes: a review of the literature. Environ Health, 8, 47. doi: 10.1186/1476-069X-8-47
Richmond, S. A., Fukuchi, R. K., Ezzat, A., Schneider, K., Schneider, G. & Emery, C. A. (2013). Are joint injury, sport activity, physical activity, obesity, or occupational activities predictors for osteoarthritis? A systematic review. J Orthop Sports Phys Ther, 43(8), 515-B519. doi: 10.2519/jospt.2013.4796
Rigolle, C., Rommel, W., Neefs, H. & Verhaegen, H. (2013). How effective is the European legislation regarding cancer-related chemical agents? J Epidemiol Community Health, 67(7), 539-541. doi: 10.1136/jech-2012-201855
Robb, G., Sultana, S., Ameratunga, S. & Jackson, R. (2008). A systematic review of epidemiological studies investigating risk factors for work-related road traffic crashes and injuries. Inj Prev, 14(1), 51-58. doi: 10.1136/ip.2007.016766
Roberts, D., Masuoka, P. & Au A.Y. (2002). Determinants of malaria in the Americas. In Casman, E. A. & Dowlatabadi, H. (eds), The contextual determinants of malaria. Washington DC: Resources for the Future.
Rodriguez Andres, A. & Hempstead, K. (2011). Gun control and suicide: the impact of state firearm regulations in the United States, 1995-2004. Health Policy, 101(1), 95-103. doi: 10.1016/j.healthpol.2010.10.005
Rojanapithayakorn, W. & Hanenberg, R. (1996). The 100% condom program in Thailand. AIDS, 10(1), 1-7.
Rojas-De-Arias, A. (2001). Chagas disease prevention through improved housing using an ecosystem approach to health. Cadernos De Saúde Pública / Ministério Da Saúde, Fundação Oswaldo Cruz, Escola Nacional De Saúde Pública, 17 Suppl, 89-97.
Rosenthal, T. & Alter, A. (2012). Occupational stress and hypertension. J Am Soc Hypertens, 6(1), 2-22. doi: 10.1016/j.jash.2011.09.002
Ross, M. W., Essien, E. J., Ekong, E., James, T. M., Amos, C., Ogungbade, G. O. & Williams, M. L. (2006). The impact of a situationally focused individual human immunodeficiency virus/sexually transmitted disease risk-reduction intervention on risk behavior in a 1-year cohort of Nigerian military personnel. Mil Med, 171(10), 970-975.
Rosso, G. L., Zanelli, R., Bruno, S., Feola, M. & Bobbio, M. (2007). [Professional driving and safety, a target for occupational medicine]. La Medicina del lavoro, 98(5), 355-373.
Roy, A., Sheffield, P., Wong, K. & Trasande, L. (2011). The effects of outdoor air pollutants on the costs of pediatric asthma hospitalizations in the United States, 1999 to 2007. Med Care, 49(9), 810-817. doi: 10.1097/MLR.0b013e31820fbd9b
Rozendaal, J. A. (1997). Vector control. Methods for use by individuals and communities. Geneva: World Health Organization.
Rushton, L., Bagga, S., Bevan, R., Brown, T., Cherrie, J., Holmes, P., et al. (2012). The burden of occupational cancer in Great Britain. UK: Health and Safety Executive.
Ruxrungtham, K., Brown, T. & Phanuphak, P. (2004). HIV/AIDS in Asia. Lancet, 364(9428), 69-82. doi: 10.1016/S0140-6736(04)16593-8
Sabatinelli G. (2002). Determinants of malaria in the WHO European Region. In Casman, E. A. & Dowlatabadi, H. (eds), The contextual determinants of malaria. Washington DC: Resources for the Future.
Saetterstrom, B., Kruse, M., Bronnum-Hansen, H., Bonlokke, J. H., Flachs, E. M. & Sorensen, J. (2012). A method to assess the potential effects of air pollution mitigation on healthcare costs. J Environ Public Health, 2012, 935825. doi: 10.1155/2012/935825
Salihu, H. M., Myers, J. & August, E. M. (2012). Pregnancy in the workplace. Occup Med (Lond), 62(2), 88-97. doi: 10.1093/occmed/kqr198
Sallis, J. F., Floyd, M. F., Rodriguez, D. A. & Saelens, B. E. (2012). Role of built environments in physical activity, obesity, and cardiovascular disease. Circulation, 125(5), 729-737. doi: 10.1161/CIRCULATIONAHA.110.969022
Salvi, S. S. & Barnes, P. J. (2009). Chronic obstructive pulmonary disease in non-smokers. Lancet, 374(9691), 733-743. doi: 10.1016/S0140-6736(09)61303-9
Sandifer, P. A., Sutton-Grier, A. E. & Ward, B. P. (2015). Exploring connections among nature, biodiversity, ecosystem services, and human health and well-being: Opportunities to enhance health and biodiversity conservation Ecosystem Services, 12, 1-15.
Sansiritaweesook, G., Muangsom, N., Kanato, M. & Ratanasiri, A. (2013). Effectiveness of Community Participation in a Surveillance System Initiative to Prevent Drowning in Thailand. Asia Pac J Public Health. doi: 10.1177/1010539513502522
Santo Tomas, L. H. (2011). Emphysema and chronic obstructive pulmonary disease in coal miners. Curr Opin Pulm Med, 17(2), 123-125. doi: 10.1097/MCP.0b013e3283431674
Sauni, R., Uitti, J., Jauhiainen, M., Kreiss, K., Sigsgaard, T. & Verbeek, J. H. (2013). Remediating buildings damaged by dampness and mould for preventing or reducing respiratory tract symptoms, infections and asthma (Review). Evid Based Child Health, 8(3), 944-1000. doi: 10.1002/ebch.1914
Schaible, U. E. & Kaufmann, S. H. E. (2007). Malnutrition and Infection: Complex Mechanisms and Global Impacts. PLoS Med, 4(5). doi: 10.1371/journal.pmed.0040115
Schapira A. (2002). Determinants of malaria in Oceania and East Asia. In Casman, E. A. & Dowlatabadi, H. (eds), The contextual determinants of malaria. Washington DC: Resources for the Future.
Schmitt, J., Seidler, A., Diepgen, T. L. & Bauer, A. (2011). Occupational ultraviolet light exposure increases the risk for the development of cutaneous squamous cell carcinoma: a systematic review and meta-analysis. Br J Dermatol, 164(2), 291-307. doi: 10.1111/j.1365-2133.2010.10118.x
Schofield C. J. (1994). Triatominae: biology and control. West Sussex, UK: Eurocommunica Publications.
REFERENCES 137
Schram-Bijkerk, D., van Kempen, E. E. & Knol, A. B. (2013). The burden of disease related to indoor air in the Netherlands: do different methods lead to different results? Occup Environ Med, 70(2), 126-132. doi: 10.1136/oemed-2012-100707
Sciandra, M., Sanbonmatsu, L., Duncan, G. J., Gennetian, L. A., Katz, L. F., Kessler, R. C., et al. (2013). Long-term effects of the Moving to Opportunity residential mobility experiment on crime and delinquency. J Exp Criminol, 9(4). doi: 10.1007/s11292-013-9189-9
Searing, D. A. & Rabinovitch, N. (2011). Environmental pollution and lung effects in children. Current opinion in pediatrics, 23(3), 314-318. doi: 10.1097/MOP.0b013e3283461926
Seo, J. H., Leem, J. H., Ha, E. H., Kim, O. J., Kim, B. M., Lee, J. Y., et al. (2010). Population-attributable risk of low birthweight related to PM10 pollution in seven Korean cities. Paediatr Perinat Epidemiol, 24(2), 140-148. doi: 10.1111/j.1365-3016.2009.01085.x
Serrier, H., Sultan-Taieb, H., Luce, D. & Bejean, S. (2014). Estimating the social cost of respiratory cancer cases attributable to occupational exposures in France. Eur J Health Econ, 15(6), 661-673. doi: 10.1007/s10198-013-0528-6
Sethi D., Racioppi F. & Mitis F. (2007). Youth and road safety in Europe. The Regional Office for Europe: WHO.
Shahzad, A. & Malik, R. K. (2014). Workplace Violence: An Extensive Issue for Nurses in Pakistan-: A Qualitative Investigation. J Interpers Violence, 29(11), 2021-2034. doi: 10.1177/0886260513516005
Sharma, V. P. (2002). Determinants of malaria in South Asia. In Casman, E. A. & Dowlatabadi, H. (eds), The contextual determinants of malaria. Washington DC: Resources for the Future.
Shih, S. T., Carter, R., Sinclair, C., Mihalopoulos, C. & Vos, T. (2009). Economic evaluation of skin cancer prevention in Australia. Preventive Medicine, 49(5), 449-453. doi: 10.1016/j.ypmed.2009.09.008
Shiue, I. (2013). Urine phthalate concentrations are higher in people with stroke: United States National Health and Nutrition Examination Surveys (NHANES), 2001-2004. Eur J Neurol, 20(4), 728-731. doi: 10.1111/j.1468-1331.2012.03862.x
Sijbesma, C. & Christoffers, T. (2009). The value of hygiene promotion: cost-effectiveness analysis of interventions in developing countries. Health Policy and Planning, 24(6), 418-427. doi: 10.1093/heapol/czp036
Simons, E., To, T. & Dell, S. (2011). The population attributable fraction of asthma among Canadian children. Can J Public Health, 102(1), 35-41.
Singh, K. (2009). Laboratory-acquired infections. Clinical Infectious Diseases: An Official Publication of the Infectious Diseases Society of America, 49(1), 142-147. doi: 10.1086/599104
Singh, R. B., Hales, S., de Wet, N., Raj, R., Hearnden, M. & Weinstein, P. (2001). The influence of climate variation and change on diarrheal disease in the Pacific Islands. Environmental Health Perspectives, 109(2), 155-159.
Skogstad, M., Skorstad, M., Lie, A., Conradi, H. S., Heir, T. & Weisaeth, L. (2013). Work-related post-traumatic stress disorder. Occup Med (Lond), 63(3), 175-182. doi: 10.1093/occmed/kqt003
Slama, R., Darrow, L., Parker, J., Woodruff, T. J., Strickland, M., Nieuwenhuijsen, M., et al. (2008). Meeting report: atmospheric pollution and human reproduction. Environ Health Perspect, 116(6), 791-798. doi: 10.1289/ehp.11074
Smith-Sivertsen, T., Diaz, E., Pope, D., Lie, R. T., Diaz, A., McCracken, J., et al. (2009). Effect of reducing indoor air pollution on women's respiratory symptoms and lung function: the RESPIRE Randomized Trial, Guatemala. American Journal of Epidemiology, 170(2), 211-220. doi: 10.1093/aje/kwp100
Smith, K. R., Bruce, N., Balakrishnan, K., Adair-Rohani, H., Balmes, J., Chafe, Z., et al. (2014). Millions dead: how do we know and what does it mean? Methods used in the comparative risk assessment of household air pollution. Annual Review of Public Health, 35, 185-206. doi: 10.1146/annurev-publhealth-032013-182356
Smith, K. R., Corvalán, C. F. & Kjellström, T. (1999). How much global ill health is attributable to environmental factors? Epidemiology (Cambridge, Mass.), 10(5), 573-584.
Snijder, C. A., te Velde, E., Roeleveld, N. & Burdorf, A. (2012). Occupational exposure to chemical substances and time to pregnancy: a systematic review. Hum Reprod Update, 18(3), 284-300. doi: 10.1093/humupd/dms005
Soares, W. L. & Porto, M. F. (2012). Pesticide use and economic impacts on health. Rev Saude Publica, 46(2), 209-217.
Soyseth, V., Johnsen, H. L. & Kongerud, J. (2013). Respiratory hazards of metal smelting. Curr Opin Pulm Med, 19(2), 158-162. doi: 10.1097/MCP.0b013e32835ceeae
Stansfeld, S. & Candy, B. (2006). Psychosocial work environment and mental health – a meta-analytic review. Scand J Work Environ Health, 32(6), 443-462.
Steenland, K., Burnett, C., Lalich, N., Ward, E. & Hurrell, J. (2003). Dying for work: The magnitude of US mortality from selected causes of death associated with occupation. American Journal of Industrial Medicine, 43(5), 461-482. doi: 10.1002/ajim.10216
Steinmann, P., Keiser, J., Bos, R., Tanner, M. & Utzinger, J. (2006). Schistosomiasis and water resources development: systematic review, meta-analysis, and estimates of people at risk. The Lancet Infectious Diseases, 6(7), 411-425. doi: 10.1016/S1473-3099(06)70521-7
Stieb, D. M., Chen, L., Eshoul, M. & Judek, S. (2012). Ambient air pollution, birth weight and preterm birth: a systematic review and meta-analysis. Environmental research, 117, 100-111. doi: 10.1016/j.envres.2012.05.007
Stocks, J. & Sonnappa, S. (2013). Early life influences on the development of chronic obstructive pulmonary disease. Ther Adv Respir Dis, 7(3), 161-173. doi: 10.1177/1753465813479428
Stocks, M. E., Ogden, S., Haddad, D., Addiss, D. G., McGuire, C. & Freeman, M. C. (2014). Effect of water, sanitation, and hygiene on the prevention of trachoma: a systematic review and meta-analysis. PLoS Med, 11(2), e1001605. doi: 10.1371/journal.pmed.1001605
Strunz, E. C., Addiss, D. G., Stocks, M. E., Ogden, S., Utzinger, J. & Freeman, M. C. (2014). Water, sanitation, hygiene, and soil-transmitted helminth infection: a systematic review and meta-analysis. PLoS Med, 11(3), e1001620. doi: 10.1371/journal.pmed.1001620
Stuckler, D., Steele, S., Lurie, M. & Basu, S. (2013). Introduction: 'dying for gold': the effects of mineral mining on HIV, tuberculosis, silicosis, and occupational diseases in southern Africa. Int J Health Serv, 43(4), 639-649.
Sultan-Taieb, H., Chastang, J. F., Mansouri, M. & Niedhammer, I. (2013). The annual costs of cardiovascular diseases and mental disorders attributable to job strain in France. BMC Public Health, 13, 748. doi: 10.1186/1471-2458-13-748
Sumpter, C. & Chandramohan, D. (2013). Systematic review and meta-analysis of the associations between indoor air pollution and tuberculosis. Trop Med Int Health, 18(1), 101-108. doi: 10.1111/tmi.12013
Sun, Z. (2010). Cardiovascular responses to cold exposure. Front Biosci (Elite Ed), 2, 495-503.
Sunish, I. P., Rajendran, R., Mani, T. R., Munirathinam, A., Dash, A. P. & Tyagi, B. K. (2007). Vector control complements mass drug administration against bancroftian filariasis in Tirukoilur, India. Bulletin of the World Health Organization, 85(2), 138-145.
Sutter, E. E. & Ballard, R. C. (1983). Community participation in the control of trachoma in Gazankulu. Soc Sci Med, 17(22), 1813-1817.
Tagwireyi, D., Ball, D. E. & Nhachi, C. F. (2006). Differences and similarities in poisoning admissions between urban and rural health centers in Zimbabwe. Clinical Toxicology (Philadelphia, Pa.), 44(3), 233-241.
Takenoue, Y., Kaneko, T., Miyamae, T., Mori, M. & Yokota, S. (2012). Influence of outdoor NO2 exposure on asthma in childhood: meta-analysis. Pediatr Int, 54(6), 762-769. doi: 10.1111/j.1442-200X.2012.03674.x
PREVENTING DISEASE THROUGH HEALTHY ENVIRONMENTS138

Tan, W. C. (2011). Trends in chronic obstructive pulmonary disease in the Asia-Pacific regions. Curr Opin Pulm Med, 17(2), 56-61. doi: 10.1097/MCP.0b013e32834316cd
Tanner, C. M., Goldman, S. M., Ross, G. W. & Grate, S. J. (2014). The disease intersection of susceptibility and exposure: chemical exposures and neurodegenerative disease risk. Alzheimers Dement, 10(3 Suppl), S213-225. doi: 10.1016/j.jalz.2014.04.014
Tarantola, A., Goutard, F., Newton, P., de Lamballerie, X., Lortholary, O., Cappelle, J. & Buchy, P. (2014). Estimating the burden of Japanese encephalitis virus and other encephalitides in countries of the mekong region. PLoS Negl Trop Dis, 8(1), e2533. doi: 10.1371/journal.pntd.0002533
Taruscio, D., Arriola, L., Baldi, F., Barisic, I., Bermejo-Sanchez, E., Bianchi, F., et al. (2014). European recommendations for primary prevention of congenital anomalies: a joined effort of EUROCAT and EUROPLAN projects to facilitate inclusion of this topic in the National Rare Disease Plans. Public Health Genomics, 17(2), 115-123. doi: 10.1159/000360602
Tate, J. E., Burton, A. H., Boschi-Pinto, C., Steele, A. D., Duque, J., Parashar, U. D. & the WHO-coordinated Global Rotavirus Surveillance Network (2012). 2008 estimate of worldwide rotavirus-associated mortality in children younger than 5 years before the introduction of universal rotavirus vaccination programmes: a systematic review and meta-analysis. The Lancet Infectious Diseases, 12(2), 136-141. doi: 10.1016/S1473-3099(11)70253-5
Tennant, C. (2001). Work-related stress and depressive disorders. J Psychosom Res, 51(5), 697-704.
Thompson, D. C. & Rivara, F. P. (2000). Pool fencing for preventing drowning in children. Cochrane Database of Systematic Reviews (Online)(2), CD001047. doi: 10.1002/14651858.CD001047
Tinuoye, O., Pell, J. P. & Mackay, D. F. (2013). Meta-analysis of the association between secondhand smoke exposure and physician-diagnosed childhood asthma. Nicotine Tob Res, 15(9), 1475-1483. doi: 10.1093/ntr/ntt033
Tischer, C. G., Hohmann, C., Thiering, E., Herbarth, O., Muller, A., Henderson, J., et al. & ENRIECO consortium (2011). Meta-analysis of mould and dampness exposure on asthma and allergy in eight European birth cohorts: an ENRIECO initiative. Allergy, 66(12), 1570-1579. doi: 10.1111/j.1398-9995.2011.02712.x
To, T., Stanojevic, S., Moores, G., Gershon, A. S., Bateman, E. D., Cruz, A. A. & Boulet, L. P. (2012). Global asthma prevalence in adults: findings from the cross-sectional world health survey. BMC Public Health, 12, 204. doi: 10.1186/1471-2458-12-204
Tohme, R. A. & Holmberg, S. D. (2010). Is sexual contact a major mode of hepatitis C virus transmission? Hepatology, 52(4), 1497-1505. doi: 10.1002/hep.23808
Tomei, G., Fioravanti, M., Cerratti, D., Sancini, A., Tomao, E., Rosati, M. V., et al. (2010). Occupational exposure to noise and the cardiovascular system: a meta-analysis. Sci Total Environ, 408(4), 681-689. doi: 10.1016/j.scitotenv.2009.10.071
Toren, K. & Blanc, P. D. (2009). Asthma caused by occupational exposures is common - a systematic analysis of estimates of the population-attributable fraction. BMC Pulm Med, 9, 7. doi: 10.1186/1471-2466-9-7
Trevor, J., Antony, V. & Jindal, S. K. (2014). The effect of biomass fuel exposure on the prevalence of asthma in adults in India - review of current evidence. J Asthma, 51(2), 136-141. doi: 10.3109/02770903.2013.849269
Trung, H. D., Van Bortel, W., Sochantha, T., Keokenchanh, K., Quang, N. T., Cong, L. D. & Coosemans, M. (2004). Malaria transmission and major malaria vectors in different geographical areas of Southeast Asia. Trop Med Int Health, 9(2), 230-237.
Turner, M. C., Wigle, D. T. & Krewski, D. (2011). Residential pesticides and childhood leukemia: a systematic review and meta-analysis. Cien Saude Colet, 16(3), 1915-1931.
Tusting, L. S., Thwing, J., Sinclair, D., Fillinger, U., Gimnig, J., Bonner, K. E., et al. (2013). Mosquito larval source management for controlling malaria. Cochrane Database of Systematic Reviews (Online), 8, CD008923. doi: 10.1002/14651858.CD008923.pub2
Tutenges, S., Bogkjaer, T., Witte, M. & Hesse, M. (2013). Drunken environments: a survey of bartenders working in pubs, bars and nightclubs. International Journal of Environmental Research and Public Health, 10(10), 4896-4906. doi: 10.3390/ijerph10104896
UK Department of Local Communities and Local Governments (2010). Study on the provision of carbon monoxide detectors under the building regulations.
UNAIDS (2012). 2012 UNAIDS Report on the Global Aids Epidemic. Geneva: UNAIDS.
UNAIDS (2013). Global Report. UNAIDS report on the global AIDS epidemic 2013. Geneva: UNAIDS.
UNAIDS & WHO (2009). AIDS epidemic update. Geneva: UNAIDS.
UNICEF, WHO & World Bank (2013). 2012 Joint child malnutrition estimates - Levels and trends: UNICEF, WHO, World Bank.
US Bureau of Labor Statistics (2014). Fatal occupational injuries by industry and event or exposure, all U.S., 2013.
Utzinger, J., Tozan, Y. & Singer, B. H. (2001). Efficacy and cost-effectiveness of environmental management for malaria control. Tropical Medicine & International Health: TM & IH, 6(9), 677-687.
Uzoigwe, J. C., Prum, T., Bresnahan, E. & Garelnabi, M. (2013). The emerging role of outdoor and indoor air pollution in cardiovascular disease. N Am J Med Sci, 5(8), 445-453. doi: 10.4103/1947-2714.117290
van Kempen, E. & Babisch, W. (2012). The quantitative relationship between road traffic noise and hypertension: a meta-analysis. J Hypertens, 30(6), 1075-1086. doi: 10.1097/HJH.0b013e328352ac54
Van Maele-Fabry, G., Lantin, A. C., Hoet, P. & Lison, D. (2011). Residential exposure to pesticides and childhood leukaemia: a systematic review and meta-analysis. Environ Int, 37(1), 280-291. doi: 10.1016/j.envint.2010.08.016
Vandenplas, O., Dressel, H., Wilken, D., Jamart, J., Heederik, D., Maestrelli, P., et al. (2011). Management of occupational asthma: cessation or reduction of exposure? A systematic review of available evidence. Eur Respir J, 38(4), 804-811. doi: 10.1183/09031936.00177510
Vandepitte, J., Lyerla, R., Dallabetta, G., Crabbé, F., Alary, M. & Buvé, A. (2006). Estimates of the number of female sex workers in different regions of the world. Sexually Transmitted Infections, 82 Suppl 3, iii18-25. doi: 10.1136/sti.2006.020081
Verbeek, J. & Ivanov, I. (2013). Essential Occupational Safety and Health Interventions for Low- and Middle-income Countries: An Overview of the Evidence. Saf Health Work, 4(2), 77-83. doi: 10.1016/j.shaw.2013.04.004
Vested, A., Giwercman, A., Bonde, J. P. & Toft, G. (2014). Persistent organic pollutants and male reproductive health. Asian J Androl, 16(1), 71-80. doi: 10.4103/1008-682X.122345
Vilain, J., Galliot, A. M., Durand-Roger, J., Leboyer, M., Llorca, P. M., Schurhoff, F. & Szoke, A. (2013). [Environmental risk factors for schizophrenia: a review]. Encephale, 39(1), 19-28. doi: 10.1016/j.encep.2011.12.007
Virtanen, H. E. & Adamsson, A. (2012). Cryptorchidism and endocrine disrupting chemicals. Mol Cell Endocrinol, 355(2), 208-220. doi: 10.1016/j.mce.2011.11.015
Virtanen, M., Nyberg, S. T., Batty, G. D., Jokela, M., Heikkila, K., Fransson, E. I., et al. for the IPD-Work Consortium (2013). Perceived job insecurity as a risk factor for incident coronary heart disease: systematic review and meta-analysis. BMJ, 347, f4746. doi: 10.1136/bmj.f4746
Vrijheid, M., Martinez, D., Manzanares, S., Dadvand, P., Schembari, A., Rankin, J. & Nieuwenhuijsen, M. (2011). Ambient air pollution and risk of congenital anomalies: a systematic review and meta-analysis. Environ Health Perspect, 119(5), 598-606. doi: 10.1289/ehp.1002946
Vyas, M. V., Garg, A. X., Iansavichus, A. V., Costella, J., Donner, A., Laugsand, L. E., et al. (2012). Shift work and vascular events: systematic review and meta-analysis. BMJ, 345, e4800. doi: 10.1136/bmj.e4800
REFERENCES 139
Wang, D., Zheng, W., Wang, S. M., Wang, J. B., Wei, W. Q., Liang, H., et al. (2012). Estimation of cancer incidence and mortality attributable to overweight, obesity, and physical inactivity in China. Nutr Cancer, 64(1), 48-56. doi: 10.1080/01635581.2012.630166
Wang, J. L. (2006). Perceived work stress, imbalance between work and family/personal lives, and mental disorders. Soc Psychiatry Psychiatr Epidemiol, 41(7), 541-548. doi: 10.1007/s00127-006-0058-y
Wang, J. L., Lesage, A., Schmitz, N. & Drapeau, A. (2008). The relationship between work stress and mental disorders in men and women: findings from a population-based study. J Epidemiol Community Health, 62(1), 42-47. doi: 10.1136/jech.2006.050591
Wang, L. & Pinkerton, K. E. (2008). Detrimental effects of tobacco smoke exposure during development on postnatal lung function and asthma. Birth Defects Res C Embryo Today, 84(1), 54-60. doi: 10.1002/bdrc.20114
Wang, L. D., Guo, J. G., Wu, X. H., Chen, H. G., Wang, T. P., Zhu, S. P., et al. (2009). China's new strategy to block Schistosoma japonicum transmission: experiences and impact beyond schistosomiasis. Trop Med Int Health, 14(12), 1475-1483. doi: 10.1111/j.1365-3156.2009.02403.x
Warburg, A. & Faiman, R. (2011). Research priorities for the control of phlebotomine sand flies. J Vector Ecol, 36 Suppl 1, S10-16. doi: 10.1111/j.1948-7134.2011.00107.x
Wariki, W. M., Ota, E., Mori, R., Koyanagi, A., Hori, N. & Shibuya, K. (2012). Behavioral interventions to reduce the transmission of HIV infection among sex workers and their clients in low- and middle-income countries. Cochrane Database of Systematic Reviews (Online), 2, CD005272. doi: 10.1002/14651858.CD005272.pub3
Warrell, D. (2010). Guidelines for the management of snakebite. New Delhi: WHO Regional Office for South East Asia.
Waters, H. R., Hyder, A. A. & Phillips, T. L. (2004). Economic evaluation of interventions to reduce road traffic injuries – a review of the literature with applications to low and middle-income countries. Asia Pac J Public Health, 16(1), 23-31.
Watson, M., Holman, D. M., Fox, K. A., Guy, G. P., Jr., Seidenberg, A. B., Sampson, B. P., et al. (2013). Preventing skin cancer through reduction of indoor tanning: current evidence. American Journal of Preventive Medicine, 44(6), 682-689. doi: 10.1016/j.amepre.2013.02.015
Wehner, M. R., Chren, M. M., Nameth, D., Choudhry, A., Gaskins, M., Nead, K. T., et al. (2014). International prevalence of indoor tanning: a systematic review and meta-analysis. JAMA Dermatol, 150(4), 390-400. doi: 10.1001/jamadermatol.2013.6896
Wehner, M. R., Shive, M. L., Chren, M. M., Han, J., Qureshi, A. A. & Linos, E. (2012). Indoor tanning and non-melanoma skin cancer: systematic review and meta-analysis. BMJ, 345, e5909. doi: 10.1136/bmj.e5909
Welsh, B. & Farrington, D. (2008). Effects of improved street lighting on crime: Campbell Systematic Reviews.
Wendel-Vos, G. C., Schuit, A. J., Feskens, E. J., Boshuizen, H. C., Verschuren, W. M., Saris, W. H. & Kromhout, D. (2004). Physical activity and stroke. A meta-analysis of observational data. Int J Epidemiol, 33(4), 787-798. doi: 10.1093/ije/dyh168
West, S., Munoz, B., Lynch, M., Kayongoya, A., Chilangwa, Z., Mmbaga, B. B. & Taylor, H. R. (1995). Impact of face-washing on trachoma in Kongwa, Tanzania. Lancet, 345(8943), 155-158.
Wheeler, T. & von Braun, J. (2013). Climate change impacts on global food security. Science, 341(6145), 508-513. doi: 10.1126/science.1239402
WHO (1980). Environmental Management for Vector Control. Report of the WHO Expert Committee on Vector Biology and Control. Geneva: World Health Organization.
WHO (1982). Manual on environmental management for mosquito control: with special emphasis on malaria vectors. Geneva: World Health Organization.
WHO (1986). Report of the sixth meeting of the Joint WHO/FAO/UNEP Panel of Experts on Environmental Management for Vector Control (PEEM). Technical Discussion: Economic and financial aspects of environmental management, and its cost-effectiveness as a vector control measure. Geneva: World Health Organization.
WHO (1995). Vector control for malaria and other mosquito-borne diseases: report of a WHO study group. Available: http://www.who.int/malaria/publications/atoz/who_trs_857/en/index.html (accessed 3 December 2015).
WHO (1997). Health and environment in sustainable development. Geneva: World Health Organization.
WHO (2003a). Guidelines for safe recreational waters. Volume 1: Coastal and fresh waters. Available: http://www.who.int/water_sanitation_health/bathing/srwe1/en/index.html (accessed 3 December 2015).
WHO (2003b). Musculoskeletal conditions affect millions. Available: http://www.who.int/mediacentre/news/releases/2003/pr81/en/ (accessed 3 December 2015).
WHO (2004a). Comparative Quantification of Health Risks. Geneva: World Health Organization.
WHO (2004b). Handbook for the documentation of interpersonal violence prevention programmes. Geneva: World Health Organization.
WHO (2006a). Guidelines for safe recreational waters. Volume 2: Swimming pools and similar recreational-water environments. Available: http://www.who.int/water_sanitation_health/bathing/bathing2/en/index.html (accessed 3 December 2015).
WHO (2006b). Guidelines for the safe use of wastewater, excreta and greywater. Geneva: World Health Organization.
WHO (2006c). Guidelines for the safe use of wastewater, excreta and greywater in agriculture and aquaculture (Vols 1–4). Geneva: World Health Organization.
WHO (2007). Cancer control. Knowledge into Action. WHO guide for effective prgrammes. Geneva: World Health Organization.
WHO (2008a). A WHO Plan for Burn Prevention and Care.Geneva: World Health Organization.
WHO (2008b). World report on child injury prevention: Burns. Geneva: World Health Organization.
WHO (2009a). Global health risks: mortality and burden of diseases attributable to selected major risks. Geneva: World Health Organization.
WHO (2009b). Interventions on diet and physical activity: what works: summary report. Geneva: World Health Organization.
WHO (2009c). Water safety plan manual (WSP manual): Step-by-step risk management for drinking-water suppliers. Geneva: World Health Organization.
WHO (2010). Facts about injuries – Drowning. Geneva: World Health Organization.
WHO (2011a). Burn Prevention. Success stories, lessons learned. Geneva: World Health Organization.
WHO (2011b). Guidelines for drinking-water quality (4th ed.). Geneva: World Health Organization.
WHO (2011c). Health in the green economy. Health co-benefits of climate change mitigation - Transport sector. Geneva: World Health Organization.
WHO (2011d). An overview of the evidence on environmental and occupational determinants of cancer. Paper presented at the International Conference on Environmental and Occupational Determinants of Cancer, Asturias, Spain. Available: http://www.who.int/phe/news/events/international_conference/Background_science.pdf (accessed 3 December 2015).
WHO (2011e). Report of an Informal Consultation on Chagas Disease in the Western Pacific (Nagasaki, 29-30 June 2011). Manila: WHO Regional Office for the Western Pacific.
WHO (2012a). Depression. Fact sheet N°369. Geneva: World Health Organization.
WHO (2012b). Epilepsy. Fact sheet N°999. Geneva: World Health Organization.
WHO (2012c). Falls. Fact sheet No. 344: Geneva: World Health Organization.
PREVENTING DISEASE THROUGH HEALTHY ENVIRONMENTS140

WHO (2014m). Global Tuberculosis Report 2014. Geneva: World Health Organization.
WHO (2014n). Hepatitis B. Available: http://www.who.int/csr/disease/hepatitis/whocdscsrlyo20022/en/index3.html (accessed 3 December 2015).
WHO (2014o). Hepatitis B. Fact sheet No. 204. Geneva: World Health Organization.
WHO (2014p). Hepatitis C. Fact sheet No. 164. Geneva: World Health Organization.
WHO (2014q). Infection prevention and control of epidemic- and pandemic-prone acute respiratory infections in health care. Geneva: World Health Organization.
WHO (2014r). Japanese encephalitis. Fact sheet No. 386 Geneva: World Health Organization.
WHO (2014s). Leishmaniasis. Fact sheet No. 375. Geneva: World Health Organization.
WHO (2014t). Lymphatic filariasis. Fact sheet No. 102. Geneva: World Health Organization.
WHO (2014u). Mental health. Available: http://www.who.int/mental_health/neurology/en/ (accessed 3 December 2015).
WHO (2014v). Onchocerciasis. Fact sheet No. 374. Geneva: World Health Organization.
WHO (2014w). Physical inactivity. Fact sheet No. 385. Geneva: World Health Organization.
WHO (2014x). Pneumonia, Fact sheet No. 331. Geneva: World Health Organization.
WHO (2014y). Preventing suicide. A global imperative. Geneva: World Health Organization.
WHO (2014z). Quantitative risk assessment of the potential effects of climate change on health. Geneva: World Health Organization.
WHO (2014aa). Report on global sexually transmitted infection surveillance 2013. Geneva: World Health Organization.
WHO (2014bb). Schistosomiasis. Fact sheet No. 115. Geneva: World Health Organization.
WHO (2014cc). WHO's Ambient air pollution database - Update 2014. Summary of the AAP database. Geneva: World Health Organization.
WHO (2014dd). WHO Alliance for the Global Elimination of Blinding Trachoma by the year 2020. Progress report on elimination of trachoma, 2013. Wkly Epidemiol Rec, 89(39), 421-428.
WHO (2014ee). WHO Guidelines for Indoor Air Quality. Geneva: World Health Organization.
WHO (2015a). Chikungunya. Fact sheet No. 327. Available: http://www.who.int/mediacentre/factsheets/fs327/en/ (accessed 3 December 2015).
WHO. (2015b). Dengue and severe dengue. Fact sheet No. 117. Geneva: World Health Organization.
WHO (2015c). Environmental Health. Available: http://www.who.int/topics/environmental_health/en/ (accessed 3 December 2015).
WHO (2015d). The Global Health Observatory. Available: http://www.who.int/gho/en/ (accessed 3 December 2015).
WHO (2015e). Global status report on road safety 2015. Geneva: WHO.
WHO (2015f). Health in All Policies: Training manual. Geneva: World Health Organization.
WHO (2015g). ICD-10 - International Statistical Classification of Diseases and Related Health Problems. Available: http://apps.who.int/classifications/icd10/browse/2015/en (accessed 3 December 2015).
WHO (2012d). Global incidence and prevalence of selected curable sexually transmitted infections - 2008. Geneva: World Health Organization.
WHO (2012e). Global strategy for dengue prevention and control 2012-2020. Geneva: World Health Organization.
WHO (2012f). Handbook for integrated vector management. Geneva: World Health Organization.
WHO (2012g). Population-based approaches to childhood obesity prevention. Geneva: World Health Organization.
WHO (2012h). Soil-transmitted helminthiases: eliminating soil-transmitted helminthiases as a public health problem in children: progress report 2001-2010 and strategic plan 2011-2020. Geneva: World Health Organization.
WHO (2013a). Global status report on road safety 2013. Geneva: World Health Organization..
WHO (2013b). Larval source management. Geneva: World Health Organization.
WHO (2013c). Lymphatic fialriasis: managing morbidity and preventing disability: an aide-mémoire for national programme
managers. Geneva: World Health Organization.
WHO (2013d). Lymphatic filariasis: a handbook of practical entomology for national lymphatic filariasis elimination programmes. Geneva: World Health Organization.
WHO (2013e). Make walking safe. Geneva: World Health Organization.
WHO (2013f). Mental health and older adults. Fact sheet No. 381. Geneva: World Health Organization.
WHO (2013g). Pedestrian safety: a road safety manual for decision-makers and practitioners. Geneva: World Health Organization.
WHO (2013h). Progress towards eliminating onchocerciasis in the WHO Region of the Americas: verification by WHO of elimination of transmission in Colombia. Wkly Epidemiol Rec, 88(36), 381-385.
WHO (2013i). Sexually transmitted infections (STIs). Fact sheet No. 110. Geneva: World Health Organization.
WHO (2014a). African Programme for Onchocerciasis Control: progress report, 2013-2014. Wkly Epidemiol Rec, 89(49), 551-560.
WHO (2014b). Burden of disease from Ambient Air Pollution for 2012 Description of method Version 1.3. Geneva: World Health Organization.
WHO (2014c). Burden of disease from ambient air pollution for 2012. Summary of results. Geneva: World Health Organization.
WHO (2014d). Burden of disease from household air pollution for 2012. Summary of results. Geneva: World Health Organization.
WHO (2014e). Burns. Fact sheet No. 365. Geneva: World Health Organization.
WHO (2014f). Cataract. Available: http://www.who.int/blindness/causes/priority/en/index1.html (accessed 3 December 2015).
WHO. (2014g). Chagas disease (American trypanosomiasis). Fact sheet No. 340. Geneva: World Health Organization.
WHO (2014h). Deafness and hearing loss Fact Sheet No. 300. Geneva: World Health Organization..
WHO (2014i). Drowning. Fact sheet No. 347. Geneva: World Health Organization.
WHO (2014j). Elimination of onchocerciasis in the WHO Region of the Americas: Ecuador's progress towards verification of elimination. Wkly Epidemiol Rec, 89(37), 401-405.
WHO (2014k). Global report on drowning. Preventing a leading killer. Geneva: World Health Organization.
WHO (2014l). Global status report on noncommunicable diseases 2014. Geneva: World Health Organization.
REFERENCES 141

WHO (2015h). Manual on youth violence prevention. Geneva: World Health Organization.
WHO (2015i). Obesity and overweight Fact sheet No. 311. Geneva: World Health Organization.
WHO (2015j). Sanitation safety planning. Manual for safe use and disposal of wastewater, greywater and excreta. Geneva: World Health Organization.
WHO (2015k). Urban health. Available: http://www.who.int/topics/urban_health/en/ (accessed 3 December 2015).
WHO, CDC & ICBDSR 2014. Birth defects surveillance: atlas of selected congenital anomalies. Geneva: World Health Organization.
WHO & TDR (2009). Dengue. Guidelines for diagnosis, treatment, prevention and control. Geneva: World Health Organization.
WHO, UNAIDS & ILO (2010). Joint WHO‐ILO‐UNAIDS policy guidelines on improving health workers’ access to HIV and TB prevention, treatment, care and support services. WHO, UNAIDS, ILO.
WHO & UNICEF (2014). Progress on drinking water and sanitation - 2014 update. Geneva.
WHO & UNICEF (2015). Water, sanitation and hygiene in health care facilities: status in low and middle income countries and way forward. Geneva: World Health Organization.
WHO, UNODC & UNDP (2014). Global status report on violence prevention 2014. Geneva: World Health Organization.
WHO & World Bank (2004). World report on road traffic injury prevention. Geneva: World Health Organization.
WHO Office for Europe (2015). Urban health. Available: http://www.euro.who.int/en/health-topics/environment-and-health/urban-health (accessed 3 December 2015).
WHO Regional Office for Europe (2009). Night noise guidelines for Europe. Copenhagen: WHO Regional Office for Europe.
WHO Regional Office for Europe (2012). Environmental health inequalities in Europe. Copenhagen: WHO Regional Office for Europe.
WHO Regional Office for Europe & OECD (2015). Economic cost of the health impact of air pollution in Europe: Clean air, health and wealth. Copenhagen: WHO Regional Office for Europe.
Wilburn, S. Q. & Eijkemans, G. (2004). Preventing needlestick injuries among healthcare workers: a WHO-ICN collaboration. Int J Occup and Environ Health, 10(4), 451-456. doi: 10.1179/oeh.2004.10.4.451
Wilson, M. D., Cheke, R. A., Flasse, S. P., Grist, S., Osei-Ateweneboana, M. Y., Tetteh-Kumah, A., et al. (2002). Deforestation and the spatio-temporal distribution of savannah and forest members of the Simulium damnosum complex in southern Ghana and south-western Togo. Trans R Soc Trop Med Hyg, 96(6), 632-639.
Wolf, J., Prüss-Ustün, A., Cumming, O., Bartram, J., Bonjour, S., Cairncross, S., et al. (2014). Assessing the impact of drinking water and sanitation on diarrhoeal disease in low- and middle-income settings: systematic review and meta-regression. Trop Med Int Health, 19(8), 928-942. doi: 10.1111/tmi.12331
World Bank (2014). Country and lending groups. 2013. Available: http://data.worldbank.org/about/country-classifications/country-and-lending-groups (accessed 3 December 2015).
World Bank (2014). World Development Indicators: 2.19 Nutrition intake and supplements. Available: http://wdi.worldbank.org/table/2.19 (accessed 2 December 2015).
World Food Programme (2009). Climate change and hunger. Rome: World Food Programme.
Wright, L. S. & Phipatanakul, W. (2014). Environmental remediation in the treatment of allergy and asthma: latest updates. Curr Allergy Asthma Rep, 14(3), 419. doi: 10.1007/s11882-014-0419-7
Wu, F. & Khlangwiset, P. (2010). Health economic impacts and cost-effectiveness of aflatoxin-reduction strategies in Africa: case studies in biocontrol and post-harvest interventions. Food Addit Contam Part A Chem Anal Control Expo Risk Assess, 27(4), 496-509. doi: 10.1080/19440040903437865
Yadon, Z. E., Rodrigues, L. C., Davies, C. R. & Quigley, M. A. (2003). Indoor and peridomestic transmission of American cutaneous leishmaniasis in northwestern Argentina: a retrospective case-control study. Am J Trop Med Hyg, 68(5), 519-526.
Yamamoto, S. S., Phalkey, R. & Malik, A. A. (2014). A systematic review of air pollution as a risk factor for cardiovascular disease in South Asia: limited evidence from India and Pakistan. Int J Hyg Environ Health, 217(2-3), 133-144. doi: 10.1016/j.ijheh.2013.08.003
Yang, G. J., Utzinger, J., Lv, S., Qian, Y. J., Li, S. Z., Wang, Q., et al. (2010). The Regional Network for Asian Schistosomiasis and Other Helminth Zoonoses (RNAS(+)) target diseases in face of climate change. Adv Parasitol, 73, 101-135. doi: 10.1016/S0065-308X(10)73005-0
Yip, P. S., Caine, E., Yousuf, S., Chang, S. S., Wu, K. C. & Chen, Y. Y. (2012). Means restriction for suicide prevention. Lancet, 379(9834), 2393-2399. doi: 10.1016/S0140-6736(12)60521-2
Yip, P. S., Law, C. K., Fu, K. W., Law, Y. W., Wong, P. W. & Xu, Y. (2010). Restricting the means of suicide by charcoal burning. Br J Psychiatry, 196(3), 241-242. doi: 10.1192/bjp.bp.109.065185
Yu, Q., Zhao, G. M., Hong, X. L., Lutz, E. A. & Guo, J. G. (2013). Impact and cost-effectiveness of a comprehensive Schistosomiasis japonica control program in the Poyang Lake region of China. Int J EnvironResearch and Pub Health, 10(12), 6409-6421. doi: 10.3390/ijerph10126409
Yuan, Y. (2012). Methylmercury: a potential environmental risk factor contributing to epileptogenesis. Neurotoxicology, 33(1), 119-126. doi: 10.1016/j.neuro.2011.12.014
Zeledon, R. & Rojas, J. C. (2006). Environmental management for the control of Triatoma dimidiata (Latreille, 1811), (Hemiptera: Reduviidae) in Costa Rica: a pilot project. Mem Inst Oswaldo Cruz, 101(4), 379-386.
Zeledon, R., Rojas, J. C., Urbina, A., Cordero, M., Gamboa, S. H., Lorosa, E. S. & Alfaro, S. (2008). Ecological control of Triatoma dimidiata (Latreille, 1811): five years after a Costa Rican pilot project. Mem Inst Oswaldo Cruz, 103(6), 619-621.
Zhang, D., Aunan, K., Seip, H.M., Larssen, S., Liu, J. & Zhang, D. (2010). The assessment of health damage caused by air pollution and its implication for policy making in Taiyuan, Shanxi, China. Energy Policy, 38, 491-502. doi:10.1016/j.enpol.2009.09.039
Zhang, G., Wong, M., Yi, P., Xu, J., Li, B., Ding, G., et al. (2010). HIV-1 and STIs prevalence and risk factors of miners in mining districts of Yunnan, China. J Acquired Immune Deficiency Syndromes, 53 Suppl 1, S54-60. doi: 10.1097/QAI.0b013e3181c7d8d2
Zhang, J. & Chaaban, J. (2013). The economic cost of physical inactivity in China. Preventive Medicine, 56(1), 75-78. doi: 10.1016/j.ypmed.2012.11.010
Zhang, T., Yang, Y., Yu, F., Zhao, Y., Lin, F., Minhas, V., et al. (2014). Kaposi’s sarcoma associated herpesvirus infection among female sex workers and general population women in Shanghai, China: a cross-sectional study. BMC Infect Dis, 14, 58. doi: 10.1186/1471-2334-14-58
Zhang, X., Chow, E. P., Wilson, D. P., Sun, X., Zhao, R., Zhang, J., et al. (2013). Prevalence of HIV and syphilis infections among long-distance truck drivers in China: a data synthesis and meta-analysis. Int J Infect Dis, 17(1), e2-7. doi: 10.1016/j.ijid.2012.07.018
Zhang, Y. S., Ma, G. X., Yu, F. & Cao, D. (2013). [Health damage assessment due to PM2.5 exposure during haze pollution events in Beijing-Tianjin-Hebei region in January 2013]. Zhonghua Yi Xue Za Zhi, 93(34), 2707-2710.
Zhang, Z. L., Sun, J., Dong, J. Y., Tian, H. L., Xue, L., Qin, L. Q. & Tong, J. (2012). Residential radon and lung cancer risk: an updated meta- analysis of case-control studies. Asian Pac J Cancer Prev, 13(6), 2459-2465.
Zhao, F., Manchaiah, V. K., French, D. & Price, S. M. (2010). Music exposure and hearing disorders: an overview. Int J Audiol, 49(1), 54-64. doi: 10.3109/14992020903202520
PREVENTING DISEASE THROUGH HEALTHY ENVIRONMENTS142

Zhou, X. N., Wang, L. Y., Chen, M. G., Wang, T. P., Guo, J. G., Wu, X. H., et al. (2005a). An economic evaluation of the national schistosomiasis control programme in China from 1992 to 2000. Acta Tropica, 96(2-3), 255-265. doi: 10.1016/j.actatropica.2005.07.026
Zhou, X. N., Wang, L. Y., Chen, M. G., Wu, X. H., Jiang, Q. W., Chen, X. Y., et al. (2005b). The public health significance and control of schistosomiasis in China – then and now. Acta Tropica, 96(2-3), 97-105. doi: 10.1016/j.actatropica.2005.07.005
Zhou, Y. & Chen, R. (2013). Risk factors and intervention for chronic obstructive pulmonary disease in China. Respirology (Carlton, Vic.), 18 Suppl 3, 4-9. doi: 10.1111/resp.12190
Zhou, Y., Zou, Y., Li, X., Chen, S., Zhao, Z., He, F., et al. (2014). Lung function and incidence of chronic obstructive pulmonary disease after improved cooking fuels and kitchen ventilation: a 9-year prospective cohort study. PLoS Med, 11(3), e1001621. doi: 10.1371/journal.pmed.1001621
Zhou, Y. B., Yang, M. X., Yihuo, W. L., Liu, G. M., Wang, H. Y., Wei, J. G. & Jiang, Q. W. (2011). Effect of habitat fragmentation on the schistosome-transmitting snail Oncomelania hupensis in a mountainous area of China. Trans R Soc Trop Med Hyg, 105(4), 189-196. doi: 10.1016/j.trstmh.2010.12.006
Ziegelbauer, K., Speich, B., Mausezahl, D., Bos, R., Keiser, J. & Utzinger, J. (2012). Effect of sanitation on soil-transmitted helminth infection: systematic review and meta-analysis. PLoS Med, 9(1), e1001162. doi: 10.1371/journal.pmed.1001162
Zoni, A. C., Gonzalez, M. A. & Sjogren, H. W. (2013). Syphilis in the most at-risk populations in Latin America and the Caribbean: a systematic review. Int J Infect Dis, 17(2), e84-92. doi: 10.1016/j.ijid.2012.07.021
REFERENCES 143

ACKNOWLEDGEMENTS
We are very grateful to the experts who provided estimates of the attributable fractions for the diseases and risk factors, as well as to those who provided non-quantitative opinions (for the current and previous editions).
• P. Albajar-Viñas, World Health Organization, Geneva, Switzerland.• D. Argaw-Dagne, World Health Organization, Geneva, Switzerland.• S. Ault, Pan American Health Organization, Brasília, Brazil.• K. Balakrishan, Sri Ramachandra Medical College and Research Institute, Chennai, India.• J. Bartram, University of North Carolina, USA.• D. Bettcher, World Health Organization, Geneva, Switzerland.• L. Blanc, World Health Organization, Geneva, Switzerland.• R. Bos, World Health Organization, Geneva, Switzerland.• F. Branca, World Health Organization, Geneva, Switzerland.• C.M. Branche, Centers for Disease Control and Prevention, Atlanta, USA.• C. Brewster, International Life Saving Federation, San Diego, CA, USA.• N. Broutet, World Health Organization, Geneva, Switzerland.• N. Bruce, University of Liverpool, Liverpool, UK.• R. Butchart, World Health Organization, Geneva, Switzerland.• D. Campbell-Lendrum, World Health Organization, Geneva, Switzerland.• S. Chatterji, World Health Organization, Geneva, Switzerland.• A. Correa, Centers for Disease Control and Prevention, Atlanta, USA.• P. Côté, University of Ontario Institute of Technology, Oshawa, Ontario, Canada.• J.R. Coura, Instituto Oswaldo Cruz, Rio de Janeiro, Brazil.• P. Cuijpers, VU University, Amsterdam, The Netherlands.• R. Dales, University of Ottawa, The Ottawa Hospital, Ottawa, Canada.• G. de Girolamo, Servizio Salute Mentale, Bologna, Italy.• C. Dora, World Health Organization, Geneva, Switzerland.• C. Dowrick, University of Liverpool, Liverpool, UK.• D. Engels, World Health Organization, Geneva, Switzerland.• T. Farley, World Health Organization, Geneva, Switzerland.• D. Farrington, University of Cambridge, Cambridge, UK.• A. Fleischmann, World Health Organization, Geneva, Switzerland.• E. Fondjo, Organisation de Coordination pour la lutte contre les Endémies en Afrique,
Yaoundé, Cameroun.• S. Forjuoh, Health Science Center, Texas A and M University, Temple, USA.• P. Furu, Danish Bilharziasis Laboratory, Charlottenlund, Denmark.• A. Garba-Djirmay, World Health Organization, Geneva, Switzerland.• J.M. Garcia-Calleja, World Health Organization, Geneva, Switzerland.• A. Garg, University of Wisconsin-Milwaukee, Milwaukee, USA.• J. Guo, World Health Organization, Geneva, Switzerland.• O. Gureje, University College Hospital, Ibadan, Nigeria.• R. Jenkins, Institute of Psychiatry, King’s College, London, UK.• N. Jetté, University of Calgary, Calgary, Alberta, Canada.
PREVENTING DISEASE THROUGH HEALTHY ENVIRONMENTS144
• B. Jobin, Canadian Wildlife Service, Environment Canada, Québec, Canada.• B.H. Kay, Royal Brisbane Hospital, Brisbane, Australia.• J. Keiser, Swiss Tropical Institute, Basel, Switzerland.• R. Kessler, Harvard Medical School, Boston, MA, USA.• G. Killeen, Ifakara Health Research and Development Centre, Ifakara, Tanzania.• J. King, World Health Organization, Geneva, Switzerland.• T. Kjellstrom, Australian National University, Canberra, Australia.• O. Kobusingye, WHO Regional Office for Africa, Brazzaville, Congo.• M. Kramer, McGill University, Faculty of Medicine, Montreal, Canada.• L. Küey, Istanbul Bilgi University, Istanbul, Turkey.• F. Laihad, Ministry of Health, Jakarta, Indonesia.• D. Lavanchy, World Health Organization, Geneva, Switzerland.• A. Leenars, Ontario, Canada.• F. Liebers, Federal Institute for Occupational Safety and Health, Berlin, Germany.• S.W. Lindsay, University of Durham, Durham, UK.• K. Lönnroth, World Health Organization, Geneva, Switzerland.• A. Luttmann, Dortmund University of Technology, Dortmund, Germany.• L. Marrama, European Centre for Disease Prevention and Control, Stockholm, Sweden.• C. Mathers, World Health Organization, Geneva, Switzerland.• D. Meddings, World Health Organization, Geneva, Switzerland.• M. Merialdi, World Health Organization, Geneva, Switzerland.• A. Mnzava, World Health Organization, Geneva, Switzerland.• D. Mohan, Indian Institute of Technology, New Delhi, India.• J. Mercy, Centers for Disease Control and Prevention, Atlanta, USA.• A. Miller, Toronto, Canada.• D. Molyneux, Liverpool School of Hygiene and Tropical Medicine, Liverpool, UK.• A. Montresor, World Health Organization, Geneva, Switzerland.• M. Nathan, World Health Organization, Geneva, Switzerland.• F. Ndowa, World Health Organization, Geneva, Switzerland.• A.M. Oliveira-Filho, Universidade Federal do Rio de Janeiro, Rio de Janeiro, Brazil.• L. Onyon, World Health Organization, Geneva, Switzerland.• Y. Rubio-Palis, Instituto de Altos Estudios de Salud Pública “Dr. Arnoldo Gabaldon”, Maracay,
Venezuela.• K. Palmer, WHO Western Pacific Regional Office, Manila, Philippines.• K.T. Palmer, University of Southampton, Southampton General Hospital, Southampton, UK.• L.R. Panganiban, University of the Philippines-College of Medicine, Manila, Philippines.• M.D. Peck, University of Arizona College of Medicine, Phoenix, USA.• J. P. Peña-Rosas, World Health Organization, Geneva, Switzerland.• P. Pisani, WHO International Agency for Research on Cancer (IARC), Lyon, France.• J. Pronczuk, World Health Organization, Geneva, Switzerland.• F. Racioppi, WHO European Centre for Environment and Health, Rome, Italy.• F. Rahman, Institute of Child and Mother Health, Dhaka, Bangladesh.• S. Resnikoff, World Health Organization, Geneva, Switzerland.• E. Robert, Institut Européen des Génomutations, Lyon, France.• I. Romieu, Instituto Nacional de Salud Publica, Cuernavaca Morelos, Mexico.• J.A. Ruiz-Postigo, World Health Organization, Geneva, Switzerland.• H.P.S. Sachdev, Vasant Vihar, New Delhi, India.• V.P. Sharma, Malaria Research Centre, Delhi, India.• G.M. Shaw, March of Dimes Birth Defects Foundation, Berkeley, USA.• A.C. Silveira, Pan American Health Organization, Brasília, Brazil.• K. Smith, University of California, Berkeley, CA, USA.
ACKNOWLEDGEMENTS 145
• A. Solomon, World Health Organization, Geneva, Switzerland.• A. Spielman, Harvard School of Public Health, Boston, MA, USA.• K. Straif, WHO International Agency for Research on Cancer (IARC), Lyon, France.• S. Tarlo, University of Toronto, The Toronto Western Hospital, Toronto, Canada.• W.A. Temple, University of Otago, Dunedin, New Zealand.• J. Tempowski, World Health Organization, Geneva, Switzerland.• T. To, University of Toronto, Hospital for Sick Children, Toronto, Canada.• Y. Touré, World Health Organization, Geneva, Switzerland.• T. Ukety, World Health Organization, Geneva, Switzerland.• B. Üstün, World Health Organization, Geneva, Switzerland.• R. Velayudhan, World Health Organization, Geneva, Switzerland.• H. Wallace, University of Western Australia, Crawley, Western Australia, Australia.• M. Weber, World Health Organization, Copenhagen, Switzerland.• S. Wiktor, World Health Organization, Geneva, Switzerland.• B. Williams, World Health Organization, Geneva, Switzerland.• A. Woolf, Harvard Medical School, Boston, MA, USA.• T. Woodruff, Environmental Protection Agency, San Francisco, USA.• A. Woodward, University of Auckland, Auckland, New Zealand.• A. Wooler, Royal National Lifeboat Institution, Saltash, Cornwall, UK.• D. Zalk, International Occupational Hygiene Association, Derby, UK.• J. Zupan, World Health Organization, Geneva, Switzerland.
In addition, we are specifically grateful to all the input from the WHO Regional Offices, as well as the WHO Departments covering the various diseases. We would also like to express our thanks to: Tara Neville, Elaine Fletcher, Nada Osseiran, Meleckidzedeck Khayesi, Ruitai Shao, Nathalie Roebbel, Douglas Bettcher, Pedro Alonso Fernandez, Daniel Dagne, Emmanuel Temu, Samira Aboubaker, Heather Adair-Rohani, Sophie Gumy, Dan Chisholm, Carlos Dora, Bruce Gordon, Ivan Ivanov, Carolyn Vickers, Maggie Montgomery and Doohee You, World Health Organization, Geneva, Switzerland; Kristina Dushaj, Center for Bioethics, New York University, New York, NY, USA.
Partial financial support for this study was kindly provided by the Centers for Disease Control and Prevention’s National Institute for Occupational Safety and Health, USA, under Cooperative Agreement 5E11OH010676-02.
PREVENTING DISEASE THROUGH HEALTHY ENVIRONMENTS146

PHOTO CREDITS
Cover (left to right and top to bottom): iStock/Dirk Freder, Robert Bos, Robert Bos, WHO/SEARO/Nursila Dewi, iStock/Lisa_Rivali, WHO/WPRO/Chau Doan, WHO/Diego Rodriguez, Shutterstock/Mikhail Malyshev, Aderita SenaPage vii iStock/Susan ChiangPage xi iStock/TwilightShowPage xxiv iStock/Kevin Landwer-JohanPage 2 iStock/Daniel SteinPage 10 Jessica LewisPage 13 WHO/Diego RodriguezPage 15 Jessica LewisPage 16 WHO/SEARO/Budi ChandraPage 18 Robert BosPage 20 WHO/SEARO/Karen ReidyPage 22 Shutterstock/Riccardo MayerPage 24 WHO/Bachir ChaibouPage 26 WHO/TDR/Sinclair StammersPage 28 WHO/Diego RodriguezPage 31 WHO/TDR /Isaias MontillaPage 33 WHO/TDR /Sebastian OlielPage 34 Shutterstock/Hung Chung ChihPage 39 Shutterstock/sfam_photoPage 40 WHO/SEARO/David OrrPage 43 iStock/slovegrovePage 44 Shutterstock/Gail PalethorpePage 45 WHO/SEARO/Shehzad NooraniPage 47 iStock/lazyllamaPage 48 iStock/RobertoGennaroPage 52 Shutterstock/JamesboxPage 55 iStock/MickyWiswedelPage 57 iStock/aciloPage 60 Shutterstock/withGodPage 62 Shutterstock/Mikhail MalyshevPage 65 WHO/Mark KokicPage 69 WHO/SEARO/Nursila DewiPage 71 iStock/Christopher FutcherPage 73 Shutterstock/LiteChoicesPage 76 iStock/elenaleonovaPage 79 Aderita SenaPage 81 iStock/eyjafjallajokulPage 82 WHO/ Angeliki Antonia BalayannisPage 91 iStock/fotoVoyagerPage 94 iStock/titoslackPage 99 Carlos CorvalánPage 101 WHO/SEARO/PaydenPage 102 iStock/OGphotoBack cover: WHO/Diego Rodriguez
PHOTO CREDITS 147


ISBN 978 92 4 156519 6CONTACTPUBLIC HEALTH, ENVIRONMENTAL AND SOCIAL DETERMINANTSWORLD HEALTH ORGANIZATIONAVENUE APPIA 201211 GENEVA 27SWITZERLANDwww.who.int/phe
PREVENTING DISEASE THROUGH HEALTHY ENVIRONMENTS A global assessment of the burden of disease from environmental risks
The main message emerging from this new comprehensive global assessment is that premature death and disease can be prevented through healthier environments – and to a significant degree. Analysing the latest data on the environment-disease nexus and the devastating impact of environmental hazards and risks on global health, backed up by expert opinion, this report covers more than 130 diseases and injuries.
The analysis shows that 23% of global deaths (and 26% of deaths among children under five) are due to modifiable environmental factors – and therefore can be prevented. Stroke, ischaemic heart disease, diarrhoea and cancers head the list. People in low-income countries bear the greatest disease burden, with the exception of noncommunicable diseases.
The report’s unequivocal evidence should add impetus to coordinating global efforts to promote healthy environments – often through well-established, cost-effective interventions. This analysis will inform those who want to better understand the transformational spirit of the Sustainable Development Goals agreed by Heads of State in September 2015. The results of the analysis underscore the pressing importance of stronger intersectoral action to create healthier environments that will contribute to sustainably improving the lives of millions around the world.
PREVENTING DISEASE THROUGH HEALTHY ENVIRONMENTS A global assessment of the burden of disease from environmental risks