How healthy is a 'healthy economy'? Incompatibility between ...
13
RESEARCH Open Access How healthy is a ‘healthy economy’? Incompatibility between current pathways towards SDG3 and SDG8 Mariska Meurs, Lisa Seidelmann and Myria Koutsoumpa * Abstract Background: The interconnections between health and the economy are well known and well documented. The funding gap for realizing SDG3 for good health and well-being, however, remains vast. Simultaneously, economic growth, as expressed and measured in SDG8, continues to leave many people behind. In addition, international financial institutions, notably the International Monetary Fund (IMF), continue to influence the economic and social policies that countries adopt in ways that could undermine achievement of the SDGs. We examine the incoherence between the economic growth and health goals of the SDGs with reference to three East African countries, Malawi, Uganda, and Tanzania, where our organization has been working with partner organizations on SDG related policy analysis and advocacy work. Results: In all three study countries, some health indicators, notably infant and child mortality, show improvement, but other indicators are lagging behind. Underfunding of the health sector is a major cause for poor health of the population and inequities in access to health care. GDP increases (as a measure of economic growth) do not automatically translate to increases in the countries’ health spending. Health expenditure from domestic public resources remains much lower than the internationally recommended minimum of USD 86 per capita. To achieve this level of health spending from domestic resources only, GDP in these countries would require an unrealistic manifold increase. External aid is proving insufficient to close the funding gap. IMF policy advice and loan conditionality that focus on GDP growth and tight monetary and fiscal targets impair growth in health and social sector spending, while recommended taxation measures are generally regressive. Conclusions: The existence of the GDP-focused SDG8 can delay efforts towards the achievement of the SDG3 for health and well-being if governments choose to focus on GDP growth without taking sufficient measures to equally distribute wealth and invest in the social sectors, often under the influence of policies advised or conditions put in place by the IMF. Although the IMF has started to acknowledge the importance of social development, its policy advice still adheres to austerity and pro-cyclical economic development harming a country’s population health. To realize the SDGs everywhere, governments should abandon GDP growth as a policy objective and place more emphasis on SDG17 on global co-operation. Keywords: Malawi, Tanzania, Uganda, IMF, SDGs, Economic growth, GDP, Health expenditure © The Author(s). 2019 Open Access This article is distributed under the terms of the Creative Commons Attribution 4.0 International License (http://creativecommons.org/licenses/by/4.0/), which permits unrestricted use, distribution, and reproduction in any medium, provided you give appropriate credit to the original author(s) and the source, provide a link to the Creative Commons license, and indicate if changes were made. The Creative Commons Public Domain Dedication waiver (http://creativecommons.org/publicdomain/zero/1.0/) applies to the data made available in this article, unless otherwise stated. * Correspondence: [email protected] Wemos Foundation, Ellermanstraat 15-O, 114 AK, Amsterdam, the Netherlands Meurs et al. Globalization and Health (2019) 15:83 https://doi.org/10.1186/s12992-019-0532-4
-
Upload
khangminh22 -
Category
Documents
-
view
9 -
download
0
Transcript of How healthy is a 'healthy economy'? Incompatibility between ...
RESEARCH Open Access
How healthy is a ‘healthy economy’?Incompatibility between current pathwaystowards SDG3 and SDG8Mariska Meurs, Lisa Seidelmann and Myria Koutsoumpa*
Abstract
Background: The interconnections between health and the economy are well known and well documented. Thefunding gap for realizing SDG3 for good health and well-being, however, remains vast. Simultaneously, economicgrowth, as expressed and measured in SDG8, continues to leave many people behind. In addition, internationalfinancial institutions, notably the International Monetary Fund (IMF), continue to influence the economic and socialpolicies that countries adopt in ways that could undermine achievement of the SDGs. We examine the incoherencebetween the economic growth and health goals of the SDGs with reference to three East African countries, Malawi,Uganda, and Tanzania, where our organization has been working with partner organizations on SDG related policyanalysis and advocacy work.
Results: In all three study countries, some health indicators, notably infant and child mortality, show improvement,but other indicators are lagging behind. Underfunding of the health sector is a major cause for poor health of thepopulation and inequities in access to health care. GDP increases (as a measure of economic growth) do notautomatically translate to increases in the countries’ health spending. Health expenditure from domestic publicresources remains much lower than the internationally recommended minimum of USD 86 per capita. To achievethis level of health spending from domestic resources only, GDP in these countries would require an unrealisticmanifold increase. External aid is proving insufficient to close the funding gap. IMF policy advice and loanconditionality that focus on GDP growth and tight monetary and fiscal targets impair growth in health and socialsector spending, while recommended taxation measures are generally regressive.
Conclusions: The existence of the GDP-focused SDG8 can delay efforts towards the achievement of the SDG3 forhealth and well-being if governments choose to focus on GDP growth without taking sufficient measures toequally distribute wealth and invest in the social sectors, often under the influence of policies advised or conditionsput in place by the IMF. Although the IMF has started to acknowledge the importance of social development, itspolicy advice still adheres to austerity and pro-cyclical economic development harming a country’s populationhealth. To realize the SDGs everywhere, governments should abandon GDP growth as a policy objective and placemore emphasis on SDG17 on global co-operation.
Keywords: Malawi, Tanzania, Uganda, IMF, SDGs, Economic growth, GDP, Health expenditure
© The Author(s). 2019 Open Access This article is distributed under the terms of the Creative Commons Attribution 4.0International License (http://creativecommons.org/licenses/by/4.0/), which permits unrestricted use, distribution, andreproduction in any medium, provided you give appropriate credit to the original author(s) and the source, provide a link tothe Creative Commons license, and indicate if changes were made. The Creative Commons Public Domain Dedication waiver(http://creativecommons.org/publicdomain/zero/1.0/) applies to the data made available in this article, unless otherwise stated.
* Correspondence: [email protected] Foundation, Ellermanstraat 15-O, 114 AK, Amsterdam, theNetherlands
Meurs et al. Globalization and Health (2019) 15:83 https://doi.org/10.1186/s12992-019-0532-4

IntroductionThe Sustainable Development Goals (SDGs) of Agenda2030, in its comprehensive set of goals and indicators,recognize the many interlinkages that exist between vari-ous aspects of well-being. However, there is insufficientacknowledgement that some of the goals – or at least theways in which they are operationalized – contradict eachother. In this article we explore this incoherence in theSDGs by focusing on three East African countries(Malawi, Uganda, and Tanzania) in which we have beenworking to support their efforts to improve their healthoutcomes. We argue that the way in which economicgrowth is being pursued in these three countries, asoperationalized in SDG target 8.1, hampers progress onSDG3, to ‘ensure healthy lives and promote well-being forall at all ages’. At the same time, the lack of progress onSDG17, ‘to revitalize the global partnership for sustainabledevelopment’, impedes global equity and poverty eradica-tion in low-income countries (LICs) as evidence shows.
BackgroundAfter the era of the Millennium Development Goals(MDGs), the world’s leaders recognized that althoughprogress had been made in some areas, many objectiveshad not been accomplished. Agenda 2030 continues theunfinished agenda of the MDGs but is more ambitiousand comprehensive, acknowledging that more systemicpolicy changes are needed in both high- and low-incomecountries to successfully address ongoing health chal-lenges facing the world’s population. Alongside concretetargets on, for instance, poverty reduction and improvedhealth outcomes, Agenda 2030 places strong emphasison reducing inequities and the need for fairer economicarrangements at the global level.The call for such a comprehensive agenda is not new.
Already at the Conference on Primary Health Care inAlma Ata in 1978 political leaders called for a ‘NewInternational Economic Order’ and emphasized that theworld’s ‘sustained economic and social development’ isonly within reach if its people are healthy [1]. This wasalso a central message in the report of the World HealthOrganization’s (WHO) Commission on Social Determi-nants of Health, which attributed persistent poverty andinequities to a ‘toxic combination of poor social policiesand programmes, unfair economic arrangements andbad politics’ ([2 p. 1). The earlier WHO Commission forMacroeconomics and Health, released around the sametime as the MDGs, pointed out that investments inhealth represent a useful and successful poverty reduc-tion strategy, and that investments to improve popula-tion health would lead to better and stronger economicgrowth [3].More recently, in 2016, experts from the International
Labour Organization (ILO), the Organization for Economic
Cooperation and Development (OECD), and the WHOdrew attention to how the health sector should be consid-ered an economic resource-generating sector, not only bypromoting a healthy and more productive population, butalso by providing possibilities for paid employment [4]. Thegoal of this High-Level Commission on Health Employ-ment and Economic Growth (UNHEEG) was to stimulatecountries to create 40 million new jobs in their health andsocial sectors as a means for inclusive economic growth inthe SDG era. The Commission report estimated that forevery additional year of life expectancy a country createsthrough health improvements, it generates a 4% increase inGDP [4].What does it take, then, to move from acknowledge-
ment to action? The comprehensive nature of the Agenda2030 represents not only an opportunity but also a chal-lenge, as governments and multilateral organizations mayuse the extensive list of goals and targets as a ‘shoppinglist’, cherry-picking their favourites, or those easiest andless threatening to implement, rather than adhering to theAgenda in its intended holistic manner. The interlinkagesbetween the goals are not automatically translated into acomprehensive policy-making approach, with implicationsfor health improvement. Health remains an importantpart of the Agenda 2030, as reflected in the ‘health goal’SDG3 on healthy lives and well-being for all with itsexpansive targets focusing on main health threats such asinfections, non-communicable diseases, road accidents,and pollution, by fostering access to quality health serviceswithout inflicting financial hardship. While the accom-plishment of SDG3 is an end in itself, it is also an import-ant means to contribute to other SDGs, notably SDG8.The reverse question, however, is whether SDG8 un-equivocally contributes to SDG3.The objective of SDG8 is to promote sustained, inclu-
sive, and sustainable economic growth, full and product-ive employment, and decent work for all. Its first target(8.1) is to sustain per capita annual economic growth ata level of at least 7% of the GDP for the least developedcountries (LDCs), which include our three focus coun-tries [5]. The use of the GDP as an indicator is notsurprising, given that it is a widely-used indicator, ismeasured frequently, and allows inter-country compari-sons. Moreover, there is a broad consensus among coun-tries on the technical definition of the GDP. Byextension, since its establishment in the Bretton Woodsconference in 1944, the International Monetary Fund(IMF) has been using the GDP as its main tool in meas-uring a country’s economy, as can be seen in its promin-ence in the IMF’s indicators [6, 7].However, the pursuit of a GDP target in itself does not
ensure either sustainability or inclusivity. Although this isrecognised in different targets under SDG8, in practice,economic policies are often focused on a few macro-
Meurs et al. Globalization and Health (2019) 15:83 Page 2 of 13
economic indicators, such as consistent GDP growth, lowinflation, and a balanced budget. In many LICs and lower-middle income countries (L-MICs), this focus in theireconomic policy goals is often driven by policy advice fromthe IMF, or determined by conditions tied to IMF loans [8].It is well documented that the World Bank’s and IMF’sStructural Adjustment Programs (SAPs) in the 1980s and1990s applied a one-size-fits-all approach targeting reduc-tions in government spending and promoting deregulationand privatization [9–12]. In many countries, this led toreductions in public investments in health and education,the negative effects of which are still being felt [10]. Follow-ing extensive criticisms in the early 2000s, the IMF andWorld Bank started adopting more flexible adjustment ap-proaches that emphasized poverty reduction. As of 2010,IMF programs also include social protection floors, aimedat increasing spending on public services such as healthand education [13].In spite of the rhetoric that things have changed [14],
current policy conditionality under IMF loans still re-quires general fiscal austerity, posing unnecessarily tightlimits on public spending [15]. Targets for budget defi-cits and inflation remain low, in general arbitrarily set at3 and 5% respectively, although there remains no con-sensus on the necessity for such low rates. These lowtargets impede governments from being able to increasetheir social spending [16]. While the IMF now includes‘priority’ expenditures on social programs, like distincthealth programs or primary education, these pro-poorconditions are non-binding and non-compliance withthem does not undermine ongoing financial support bythe IMF. Research in 16 West African countries withIMF programs in the period 1995–2014, finds that lessthan half of social spending targets were met. In severalof these countries the IMF advised against increases ofsocial spending out of concern that these increaseswould not be sustainable. Moreover, health spending inthis sample of 16 countries was negatively correlatedwith the number of binding conditions included in theprogram [10]. Perhaps indicative of the dominatinginfluence of fiscal austerity, similar research in WestAfrican countries with IMF programs between 1985 and2014 found that even when social spending floors werenot met, budget balance conditions were consistentlyabided by and often far-exceeded [11].In this article, we discuss how the focus on SDG8.1, and
the way in which GDP growth is pursued with a focus onausterity, can impair or delay the realization of SDG3 forhealth and well-being for all. We express concerns on thechoice of GDP as an SDG indicator of inclusive and sus-tainable economic growth in general, and how it mayundermine the prioritization of social sectors, includinghealth, and hamper equity. We discuss alternative indica-tors for, as well as alternative paths towards, sustainable
development, and the need for drastic action at the globallevel to promote economic justice. Without this, it willnot be possible to realize the Agenda 2030.
MethodsTo examine whether SDG8 and SDG3 were compatible orcontradictory, we reviewed literature and data from a var-iety of sources. As part of the policy and context analyseson health financing and human resources for health inMalawi, Tanzania and Uganda, which is part of our organi-zation’s program of work, we have been reviewing literatureon the types of policy advice these countries receive fromthe IMF and their impact on health investments. Based onthis body of literature on economic policies, adjustmentand the impact of austerity measures, we analysed IMF pol-icy advice in these three countries on targets for budget def-icits, inflation rates, wage bill containment, and fiscal policy.The IMF country documents were retrieved from the IMFcountry specific webpages, and we analysed the relevantprogram documents and article IV consultation reports forMalawi, Tanzania and Uganda over the period 2016–2018.In addition, we searched for secondary literature on the im-pact of structural adjustment in these countries from thestart of their engagement with the IMF. We then accessedinformation specific to the health systems of our threefocus countries using the Global Health Expenditure Data-base from the WHO [17] for health expenditure data, theWHO Global Health Observatory [18], the World BankHealth Nutrition and Population Statistics database [19],and countries’ public health policy documents.
ResultsGaps in health and health resourcesIn spite of progress made since the start of the ‘MDG-era’, the health situation of many people in LICs and L-MICs remains worrisome. Improvements have beenmade in infant and child mortality, but maternal mortal-ity is conspicuously lagging behind. At the High LevelPolitical Forum (HLPF) in 2017, progress towards SDG3was reported on by the WHO, which noted that formany indicators the inequality between income groupsremains striking:
Social determinants greatly impact on child survivaland death as children from the poorest householdsare, on average, nearly twice as likely to die before theage of five as children from the richest households asshown by survey data from some 50 countries.([17] p. 3)
The report highlights the acceleration required toachieve the target for reducing maternal mortality: anannual reduction of at least 7.3%, which is more thantriple the rate attained between 1990 and 2015. One of
Meurs et al. Globalization and Health (2019) 15:83 Page 3 of 13
the main obstacles identified is the lack of skilled care,aggravated by the global shortage of health workers [20].Hence, the report emphasized the need to create morefiscal space for expanding health sector employment andhealth protection, identifying underfunding as a majorcause for low health status and inequities in access tohealth care.Meanwhile, the funding gap to realize SDG3 remains
huge. Additional resources needed to make progresstowards the SDG3 targets in low- and middle-incomecountries (LMICs) are estimated to range between USD274 billion and USD 371 billion per year by 2030 [21].This is a massive gap when compared to the availabledomestic resources and external funds for health. Aftertwo decades of growth, the level of official DevelopmentAssistance for Health (DAH) has levelled since 2011,and slightly decreased from 2017 to 2018, reaching atotal of USD 38.9 billion [22].
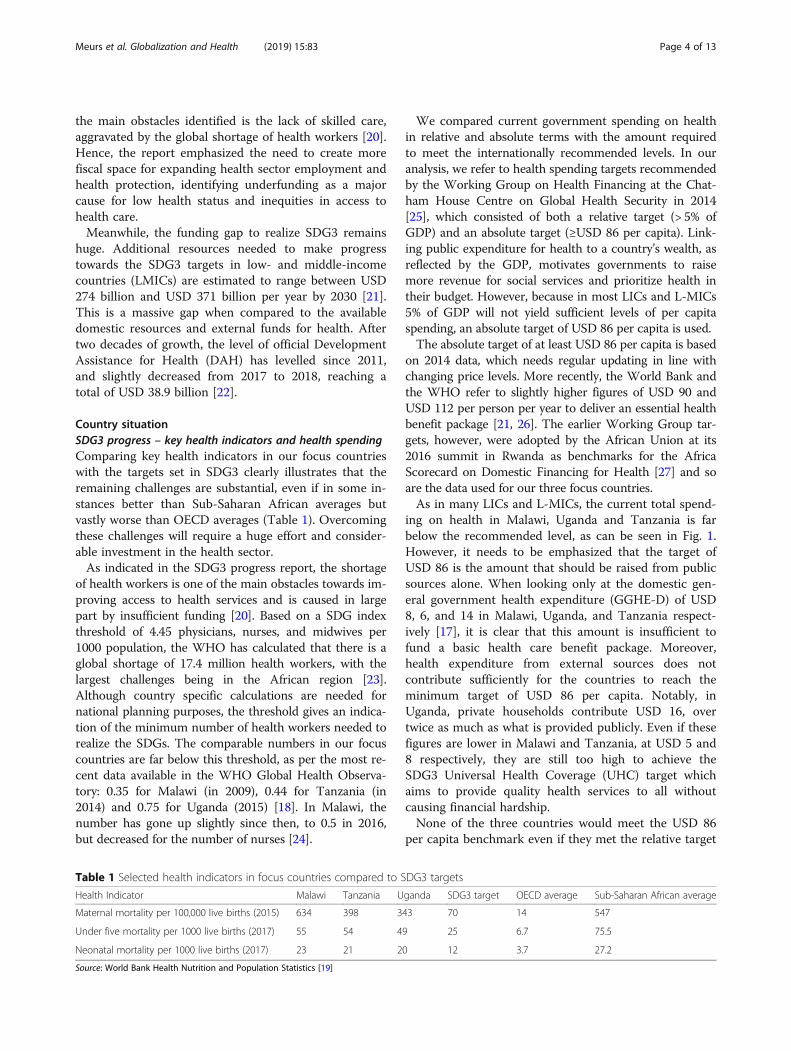
Country situationSDG3 progress – key health indicators and health spendingComparing key health indicators in our focus countrieswith the targets set in SDG3 clearly illustrates that theremaining challenges are substantial, even if in some in-stances better than Sub-Saharan African averages butvastly worse than OECD averages (Table 1). Overcomingthese challenges will require a huge effort and consider-able investment in the health sector.As indicated in the SDG3 progress report, the shortage
of health workers is one of the main obstacles towards im-proving access to health services and is caused in largepart by insufficient funding [20]. Based on a SDG indexthreshold of 4.45 physicians, nurses, and midwives per1000 population, the WHO has calculated that there is aglobal shortage of 17.4 million health workers, with thelargest challenges being in the African region [23].Although country specific calculations are needed fornational planning purposes, the threshold gives an indica-tion of the minimum number of health workers needed torealize the SDGs. The comparable numbers in our focuscountries are far below this threshold, as per the most re-cent data available in the WHO Global Health Observa-tory: 0.35 for Malawi (in 2009), 0.44 for Tanzania (in2014) and 0.75 for Uganda (2015) [18]. In Malawi, thenumber has gone up slightly since then, to 0.5 in 2016,but decreased for the number of nurses [24].
We compared current government spending on healthin relative and absolute terms with the amount requiredto meet the internationally recommended levels. In ouranalysis, we refer to health spending targets recommendedby the Working Group on Health Financing at the Chat-ham House Centre on Global Health Security in 2014[25], which consisted of both a relative target (> 5% ofGDP) and an absolute target (≥USD 86 per capita). Link-ing public expenditure for health to a country’s wealth, asreflected by the GDP, motivates governments to raisemore revenue for social services and prioritize health intheir budget. However, because in most LICs and L-MICs5% of GDP will not yield sufficient levels of per capitaspending, an absolute target of USD 86 per capita is used.The absolute target of at least USD 86 per capita is based
on 2014 data, which needs regular updating in line withchanging price levels. More recently, the World Bank andthe WHO refer to slightly higher figures of USD 90 andUSD 112 per person per year to deliver an essential healthbenefit package [21, 26]. The earlier Working Group tar-gets, however, were adopted by the African Union at its2016 summit in Rwanda as benchmarks for the AfricaScorecard on Domestic Financing for Health [27] and soare the data used for our three focus countries.As in many LICs and L-MICs, the current total spend-
ing on health in Malawi, Uganda and Tanzania is farbelow the recommended level, as can be seen in Fig. 1.However, it needs to be emphasized that the target ofUSD 86 is the amount that should be raised from publicsources alone. When looking only at the domestic gen-eral government health expenditure (GGHE-D) of USD8, 6, and 14 in Malawi, Uganda, and Tanzania respect-ively [17], it is clear that this amount is insufficient tofund a basic health care benefit package. Moreover,health expenditure from external sources does notcontribute sufficiently for the countries to reach theminimum target of USD 86 per capita. Notably, inUganda, private households contribute USD 16, overtwice as much as what is provided publicly. Even if thesefigures are lower in Malawi and Tanzania, at USD 5 and8 respectively, they are still too high to achieve theSDG3 Universal Health Coverage (UHC) target whichaims to provide quality health services to all withoutcausing financial hardship.None of the three countries would meet the USD 86
per capita benchmark even if they met the relative target
Table 1 Selected health indicators in focus countries compared to SDG3 targets
Health Indicator Malawi Tanzania Uganda SDG3 target OECD average Sub-Saharan African average
Maternal mortality per 100,000 live births (2015) 634 398 343 70 14 547
Under five mortality per 1000 live births (2017) 55 54 49 25 6.7 75.5
Neonatal mortality per 1000 live births (2017) 23 21 20 12 3.7 27.2
Source: World Bank Health Nutrition and Population Statistics [19]
Meurs et al. Globalization and Health (2019) 15:83 Page 4 of 13

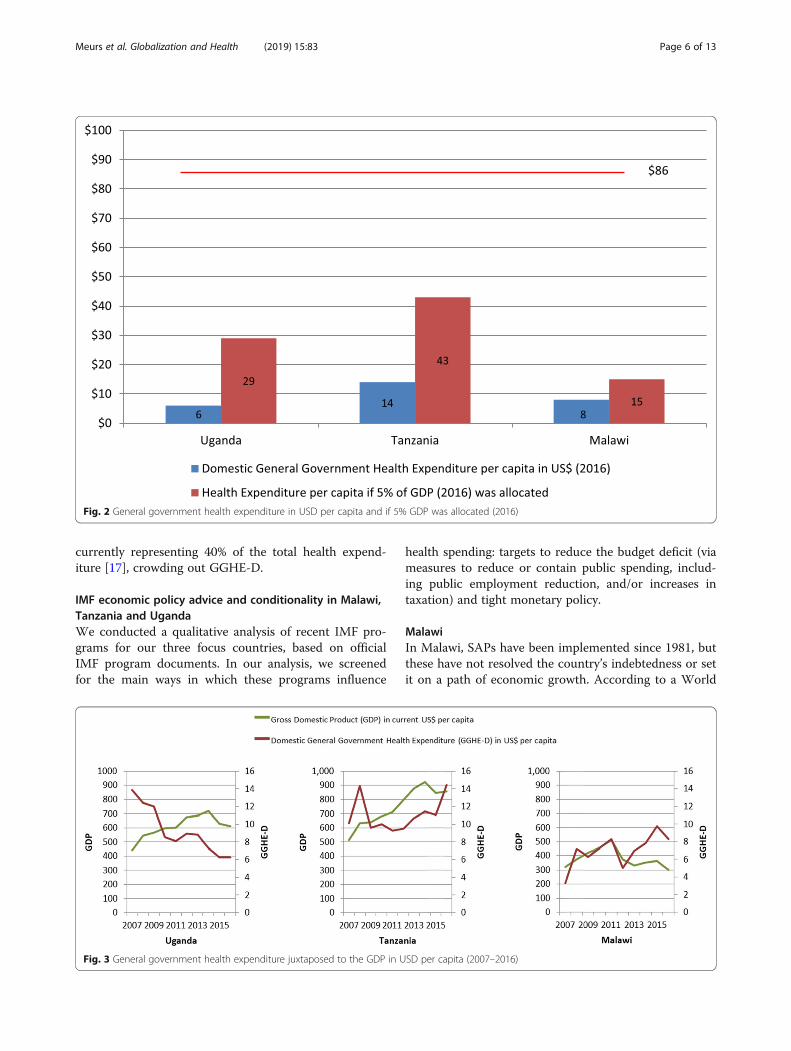
of allocating 5% of their GDP to health. As shown inFigs. 2, 5% of the GDP in 2016 would have translatedonly to USD 15, 29 and 43 per capita in Malawi, Ugandaand Tanzania, respectively.With their current levels of GDP, these countries’ cap-
acity to raise sufficient domestic resources for health is lim-ited. In Malawi, the health budget would need to increasefrom USD 177 million (2017/18 budget) to USD 1.5 billionto meet the recommended level of USD 86 per capita [28].For Uganda to reach the USD 86 for the estimated popula-tion in 2019 [29], the health budget would have to increasefrom the approved budget of USD 335 million for 2018/19[30, 31] to USD 3.5 billion. In Tanzania, an allocation of 5%of GDP to health would result in USD 43 per capita. Whilerepresenting the highest gain of the three countries investi-gated, this would still fall short of the USD 86 per capitathreshold. At the level of Tanzania’s population in 2017[32], to meet this target the budget would need to increasefrom its present commitment of USD 742 million for 2018/19 [33] to USD 4.9 billion.To achieve such levels of health budget only with do-
mestic resources would require massive increases in thecountries’ GDP. GDP per capita in 2016 (in currentUSD) was USD 301 for Malawi, USD 610 for Uganda,
and USD 857 for Tanzania [17]. To achieve the mini-mum spending of USD 86 per capita derived from 5%GDP allocation to health exclusively from domestic re-sources would require at least USD 1720 per capita. Thiswould equate to an almost 6-fold increase in Malawi, 3-fold in Uganda and double in Tanzania. Even at thebest-case LDC target of 7% annual per capita GDPgrowth in SDG8, this would take decades to achieve.Furthermore, this GDP growth would need to translate
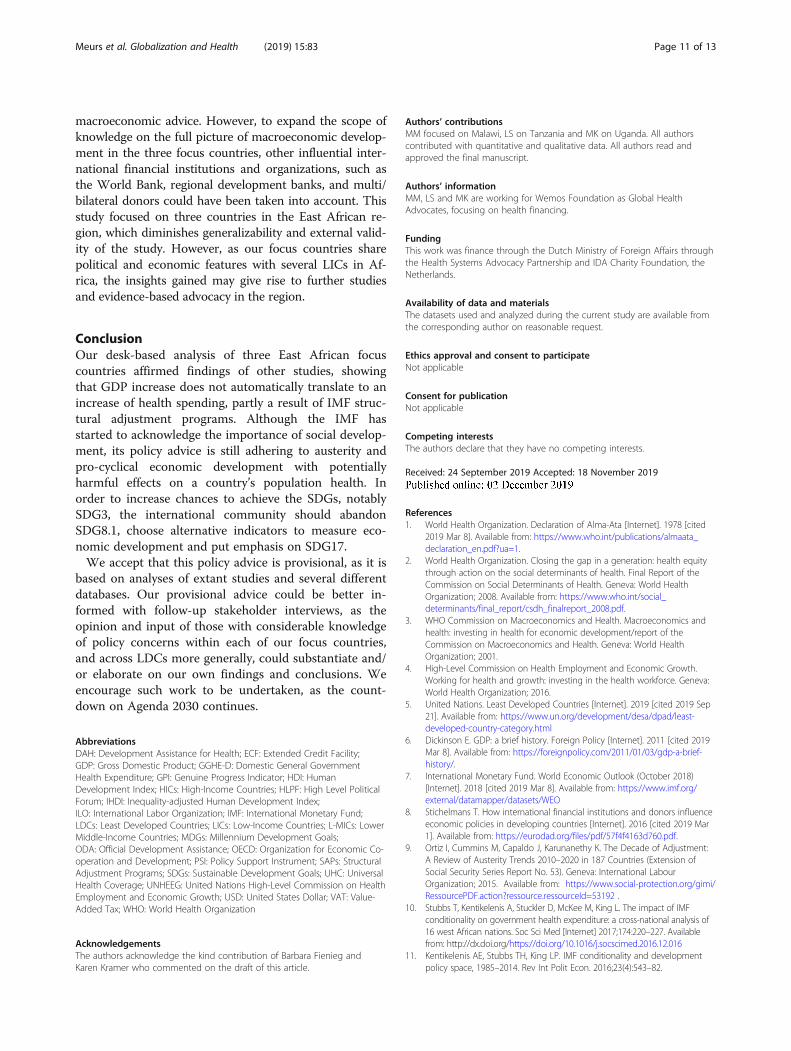
into higher allocations to health. Exploring data for thedecade 2007–2016 [17], we observed that in our focuscountries, general government health per capita expend-iture from domestic sources (GGHE-D per capita) hasbeen following different trajectories compared to GDPper capita trends (Fig. 3).The trends differ across the three countries. Tanzania
saw increases in both GDP and GGHE-D per capita. InMalawi, GDP per capita decreased slightly in the periodanalysed, however, the GGHE-D per capita increasedmore than twofold. Increased GGHE-D per capita inboth countries represents a health-positive, if still inad-equate, improvement. In contrast, Uganda saw increasesin its GDP per capita while GGHE-D per capita fell bymore than half. This may be attributed to external aid,
Fig. 1 Health expenditure in USD per capita by source (2016) compared to the international minimum target
Meurs et al. Globalization and Health (2019) 15:83 Page 5 of 13
currently representing 40% of the total health expend-iture [17], crowding out GGHE-D.
IMF economic policy advice and conditionality in Malawi,Tanzania and UgandaWe conducted a qualitative analysis of recent IMF pro-grams for our three focus countries, based on officialIMF program documents. In our analysis, we screenedfor the main ways in which these programs influence
health spending: targets to reduce the budget deficit (viameasures to reduce or contain public spending, includ-ing public employment reduction, and/or increases intaxation) and tight monetary policy.
MalawiIn Malawi, SAPs have been implemented since 1981, butthese have not resolved the country’s indebtedness or setit on a path of economic growth. According to a World
Fig. 3 General government health expenditure juxtaposed to the GDP in USD per capita (2007–2016)
Fig. 2 General government health expenditure in USD per capita and if 5% GDP was allocated (2016)
Meurs et al. Globalization and Health (2019) 15:83 Page 6 of 13

Bank analysis, real GDP per capita growth was only 1.5%between 1995 and 2015 with little impact on poverty;poverty remained stagnant at more than 50% and actu-ally increased in rural areas between 2011 and 2014 [34].Comparing to the period preceding adjustment, theeconomy has worsened on many accounts: per capita in-come decreased by 0.7% during the adjustment period,the average annual inflation rate more than doubled(from 8.4 to 22%) and while export slightly increased, itdid not become more diversified [35].An analysis of Malawi’s current program with the IMF
– a three year Extended Credit Facility (ECF) approvedin April 2018 – and its first review in November 2018,reveal that both fiscal tightening and inflation targetingare prominent parts of the program [36, 37]. Policy mea-sures to cut back expenditures include reducing thebudget for maize procurement and agricultural subsidies,reinforcing the implementation of the automatic fuelprice mechanism, increasing the level of fees for certainpublic services (not further specified), and restrictionson the wage bill (limiting wage increases to a maximumof the inflation rate and recruitments only in essentialcases). Malawi did not meet the condition on reducingits primary deficit, however, partly due to an additional5% wage increase for government employees in the bot-tom half of the wage scale and hiring of new medicalworkers. The November 2018 review emphasizes thatextra spending incurred in 2017/18 will be compensatedby ‘tightening the fiscal stance in 2018/19’ ([35] p. 9).The program states that budget cuts will target non-
essential expenditures and that social spending will bemaintained, but the general description does not allowassessment of the implications on household incomeacross the different income groups. The program aimsat protecting social spending through an increase inspending for health and education of 0.4% of GDP overthe program period. With current GDP, that wouldamount to USD 25.2 million over the three-year period,or USD 8.4 million on an annual basis, which is a smallamount when compared to the funding gap for health.Malawi has increased the level of government revenue asa percentage of GDP in recent years, from 14.5% in 2009to 17.3% in 2017 [32]. While both trends are in a poten-tially more health-positive direction, and the NovemberIMF review report notes that ‘social spending allocationsin the government budget will not be adjusted downwardto meet fiscal targets of the program’ ([35] p. 91), theyare far below the levels needed to achieve the recom-mended minimum health spending benchmarks.To increase government revenue while meeting fiscal tar-
gets, the IMF program advises extending the coverage ofValue Added Tax (VAT) and reversing the VAT exemptionon cooking oil and other ‘unnecessary exemptions’. Con-sumption taxes such as VAT are generally regressive and
disproportionately affect the poor. More progressively, theIMF program also recommends strengthening the capacityof the revenue authority, repealing the industrial rebatescheme, and discontinuing the granting of tax holidays.Tight monetary policy is a key objective stressed in the
ECF program; the government aims to lower inflation to5% in the medium term. Between the end of 2017 andAugust 2019, inflation rose from 7.1 to 9.3% and is ex-pected to increase further due to higher prices for maize,electricity and fuel. In response to inflationary pressures,the Reserve Bank of Malawi maintained its policy rate(the rate at which the central bank lends to other banks)at 16% and the government has expressed its commit-ment to adopt inflation-targeting over the medium-term.
UgandaUganda became a member of the IMF back in 1963 andin 1987 obtained an IMF loan under the Structural Ad-justment Facility, which was extended in the periods1989–1992 and 1992–1997 [12]. Based on the condition-ality of this loan, Uganda had to liberalize its economy.As a result, the fixed foreign exchange policy changed toa floating system, and in order to control inflation, theUganda Shilling was devaluated. In the period of SAPs,many public servants were discharged in order to reducethe government wage bill, trade unions were weakened,and the cooperative movement started to crumble [38].Regarding taxation policies, historically, most of the taxrevenue derived from customs and excise on inter-national trade. This changed in the early 1990s, whenthe IMF promoted reforms to reduce tariffs on inter-national trade and increase income tax collection, alongwith the introduction of the VAT.Uganda is currently under the Policy Support Instru-
ment (PSI), an IMF tool that enables LICs to receive ad-vice and support from the IMF without a borrowingarrangement. The PSI helps countries to design what theIMF considers to be effective economic programs, andthereby delivers a clear signal to donors, multilateral de-velopment banks, and international financial markets ofan IMF endorsement of the strength of a member coun-try’s policies and credibility [39].In a review by the IMF in 2017, the IMF complimen-
ted Uganda for bringing inflation down to 5%. Thisinflation-targeting framework was introduced in 2011and replaced the monetary-targeting framework. The re-view still recommended the Bank of Uganda to furthertighten monetary policy if drought-induced increases offood prizes drove up inflation [40]. Uganda’s GDP percapita has been growing steadily in the last decade [32].However, the Government captured only 14.6% of theGDP through taxation in 2018, a percentage that has in-creased by 3% since 2011 but which is still rather low[41].The IMF recognized that the 2% GDP health
Meurs et al. Globalization and Health (2019) 15:83 Page 7 of 13

spending is rather low, in fact lower than the East Afri-can Community average, but advised the authorities toconsider increasing social spending only once economicgrowth has recovered [40].
TanzaniaTanzania joined the IMF in 1962, and started transac-tions with the Fund in the 1980s. When Tanzaniaaccepted IMF’s financial support, the programs aimed atfiscal consolidation. These Stand-by Arrangements, orlater SAPs, aimed at reducing inflation and the fiscal def-icit, as well as tax reforms, wage bill ceilings, andstrengthening the private sector [42]. In more recentyears, the relationship between Tanzania and the IMFhas returned to consultations under the PSI, with con-tinued emphasis on fiscal consolidation. According tothe most recent letter of intent, Tanzania did not meetthe social spending target [43].Tax revenue collection is rather low at 13% of GDP
[43]. Tanzania aims at increasing the tax base throughan expansion of VAT [44]. Moreover, Tanzania decidedto lower income taxes for the wealthy, shifting the taxburden to the rest of the population [45]. The IMF wel-comes the new VAT Act but emphasizes that ‘moreneeds to be done’ regarding streamlining exemptionsand refund mechanisms and, similar to the Malawi pro-gram, suggests the country eliminate corporate incometax exemptions and holidays. It suggests as well thatTanzania introduces property taxes [46]. Although eco-nomic performance of Tanzania looks rather positivewith a steady annual GDP growth of 7% in the last twodecades, the IMF notices that recently the performancehas been mixed and considerable risks remain.The IMF welcomes Tanzania’s attempt to transition to
an interest rate based monetary framework, and Tanzania’sprogress towards this adheres to previous IMF recommen-dations. The IMF notes that further measures to increasepublic revenue are needed, such as expanding export op-portunities and adhering to fiscal consolidation over themedium to longer terms [43]. In the latest Financial SystemStability Assessment, it points to the possibility of privatiz-ing commercial state-owned enterprises to be listed on theDar es Salaam Stock Exchange Market [43].In the last PSI consultation in 2016 the IMF acknowl-
edged that higher fiscal deficits could be sustained forsome time if simultaneously the debt distress is kept low[46]; its formulated target, however, was lower thanusual at 3.25% of GDP (compared to formerly 4.2% ofGDP). Tanzania targeted a budget deficit of close to 4%of GDP in 2017/18, and capital spending was planned at10% of GDP. However, budgetary revenue projectionsled to concerns and development projects were delayed.The IMF still projected a shortfall and advised furtherexpenditure cuts. In 2018/19 an even lower budget
deficit of 2.5% of GDP was targeted [43]. In the 2016 PSIconsultation, Tanzania committed to improving socialservices in order to reduce poverty. However, fiscalconsolidation is recommended to reduce government’sfinancial needs, and the Fund explicitly invites Tanzaniato ‘revisit fiscal priorities to ensure that critical infra-structure projects, particularly in the energy sector, areimplemented’ ([44], p. 40).
DiscussionThe above findings clearly indicate that, in order toreach the levels of health investment required to realizethe SDG3, countries would need levels of GDP growththat they have never before witnessed. Even if this highlyunlikely event were to happen in a distinct future, ourcountry analyses underline the fact that GDP growth isstill no guarantee for an increase in government healthspending or poverty reduction. However, it is true thatLICs and L-MICs will need to expand their economicbase (and in ways that do not jeopardize SDGs related tothe physical environment, including climate change) andtake the political decision to invest those gains in socialspending, including health.As reported by the United Nations, GDP growth has
been volatile and far below the target of 7% set for theLDCs in SDG8.1. The average rate of growth in LDCs haseven decreased from 3.5% in the period 2000–2004 to2.3% in the period 2010–2016 [47]. In our analysis, overthe last 10 years, we saw GDP per capita increases inUganda and in Tanzania, while it has been volatile andnot growing in Malawi. Meanwhile, government healthspending per capita over this same period went up inMalawi and in Tanzania, but went down in Uganda. Aswell, Tanzania’s steady growth of 7% annually did not ini-tially lead to any increase of public health spending, whichonly started to match GDP growth in the last 2 years. Thisunderscores once more that an increase in GDP does notalways lead to higher government health spending.Under the influence of structural adjustment in the
past, our focus countries (as many others) have focusedtheir economic policies on lowering budget deficitsthrough reducing public expenditure. This continuingemphasis on fiscal austerity directly or indirectly leads toreduced (or insufficiently increased) investments inhealth. Under SAPs, health spending was cut in manycountries [48].Our analysis of the latest IMF programs and policy advice
in the three countries showed that fiscal consolidation wasstill a prominent part of all three. Adjustment measuresconsidered by Uganda in the years 2010–2013 were relatedto wage bill cuts/caps, consumption (VAT) tax increases,and pension reform, with the wage bill cuts/caps leading tosalary erosion among public healthcare providers [16].Tanzania has followed advice regarding the reduction of
Meurs et al. Globalization and Health (2019) 15:83 Page 8 of 13

subsidies for agricultural products, wage bill cuts/caps, andpension reforms [16]. In addition to these, the governmentalso decided to increase consumption taxes and electricityprices [9]. In the case of Malawi, the IMF program stronglyemphasized the need for tight fiscal policies, recommendingspending reductions on agricultural and fuel subsidies, andlimits on public sector wage increases. Our findings onwage bill cuts imply outcomes similar to those found instudies of IMF programs in Sierra Leone and Guinea, whichcalled for wage bill freezes or reductions during and afterthe Ebola crisis, and which led to serious reductions inhealth worker to population ratio in Sierra Leone, as well asin nearby Ghana and Senegal [10]. Consistent with ourfindings, research by Eurodad on conditions attached toIMF loans in 26 country programs approved in the years2016 or 2017 revealed that, contrary to what the IMF hasbeen propagating, the majority were geared towards fiscalconsolidation, including conditions to restrict spendingand/or increase taxes [15].With a view to increasing tax revenue, IMF advice fo-
cuses primarily on consumption taxes such as VAT (asin our three focus countries), which are generally regres-sive and hurt women and the poor disproportionately.Such taxes can contribute to or exacerbate existingpoverty rates and (health) inequities. Analysis by theCommitment to Equity Institute revealed that in severalof the twenty-nine countries they studied, including inTanzania and Uganda, ‘the extreme poverty headcountratio is higher after taxes and transfers than before’ andidentify consumption taxes as ‘the main culprits offiscally-induced impoverishment’ ([49] p. 4). In each ofthe three focus countries, recent IMF programs recom-mend an expansion of VAT. Furthermore, in Tanzaniathe government decided to lower income taxes for thewealthy and instead shifted the tax burden to the rest ofthe population [45]. More progressive tax advice doesappear in IMF programs, as we have noted, but whethersuch measures are adopted by governments or are suffi-cient to improve substantially public revenues andsubsequent increases in health and social protectionspending remains moot. Corporate tax rates in all threecountries, for example, have not increased over the pastdecade [50].Property taxes, as proposed by the IMF forTanzania, may be progressive if applied only to largeland-holdings of wealthier groups, but could also be re-gressive if affecting small-hold farmers or poorer urbandwellers.Since 2010, IMF programs started to include non-
binding social spending floors [13]. Although socialspending floors are a move in the right direction, thetargets would need to be set at a meaningful level tobring countries closer to achieving SDG3, which is notyet the case for our three focus countries. In Malawi thesocial spending target is too low to have any substantive
health impact. In Uganda, the IMF advised the govern-ment to increase much needed social spending but onlywhen economic growth recovered. In Tanzania the IMFadvised the government to increase investments in theinfrastructure sector while at the same time freezingtotal spending.Another similarity found in all three countries is their
adherence to the IMF’s advice of a floating exchangerate. In the case of currency devaluation this can driveup prices of imported goods important for health, in-cluding medical supplies and medication, and can rap-idly harm the entire health care service provision of acountry. Additionally, all three countries have adopted,or are in the process of adopting, an inflation-targetingframework, which is usually implemented through main-taining high interest rates. High interest rates can beharmful for the economy, by increasing the cost of bor-rowing for small and medium sized enterprises (reducingtheir expansion and employment creation) and for thegovernment (increasing their debt burden and therebyreducing their fiscal space). In spite of the fact that thereis no empirical consensus that inflation rates of up to20% are harmful for the economy, the IMF recommendssetting inflation targets at ‘lower single digits’ [51].Clearly, alternative policies are needed to make greater
progress towards not only SDG3, but other SDGs thathave indirect but important impacts on health. Forcountry level policies, experts have been proposing dif-ferent options for more accommodating macroeconomicpolicy to expand government expenditure. An empiricalstudy carried out in 2017 for the ILO on fiscal space forsocial protection in relation with the SDGs in 187 coun-tries [45] showed that a 2% increase of a country’s fiscaldeficit could result in vast increases in the resourcesavailable for public health. The authors suggest that.
it is important to carry out a rigorous assessment offiscal sustainability within a country, taking intoaccount not only economic aspects such as debtburden, revenue generation capacity and likely GDPgrowth trajectory but also the potential opportunitycost of foregoing social spending. ([43] p.49)
The second channel of a more accommodating macro-economic policy is via more expansionary monetary pol-icy. Low inflation, although still considered to be the besttool to ensure macroeconomic stability and growth, hasbecome a goal in itself pushed for by the IMF [45, 52].The views on what consists an ‘acceptable’ and ‘safe’ infla-tion level have been very diverse and conflicting, rangingfrom 3 to 40% [45, 52]. The most common tool to main-tain low inflation is by setting high interest rates. If thispolicy was loosened and interest rates lowered, it wouldbe less costly for both government and entrepreneurs to
Meurs et al. Globalization and Health (2019) 15:83 Page 9 of 13

borrow and thus make investments, including in the pub-lic health sector.These options need to be further explored at the coun-
try level. In addition, we question the use of a uniqueSDG target on GDP growth. It is known that both thereduction of poverty (SDG1) and a healthier populationcontribute to economic growth [2, 4], as does SDG4(quality education) [53] and SDG10 (reduced inequal-ities) [2, 54]. The inclusion of SDG target 8.1 risks bring-ing more health harm than good, as it suggests thatGDP growth is an end in itself. In doing so, it presentsgovernments with the option to put more emphasis onSDG8.1 following the conventional, but empiricallyunfounded, argument that GDP growth will inevitably‘trickle down’ and translate into a wealthier, healthier,and more inclusive society.We do not deny that in order to increase spending on
social sectors, including health, LICs and L-MICs willneed to increase their overall public revenue. Current eco-nomic policies being pursued by, and/or promoted viaIMF programs and policy advice, do not appear to resultin significant GDP growth, nor lead to a sufficient level ofinvestments in health, and DAH remains inadequate tomeet the shortfalls. The funding gap is not so large,though, when compared to the income that is lost everyyear due to tax avoidance and tax evasion, to debt repay-ments, and to unfair trade arrangements [55]. Some, butnot all, of these international challenges are targeted inSDG17 – a global partnership for sustainable develop-ment. SDG17 includes several targets aimed at increasingfinance for development, including a call on high-incomecountries (HICs) to implement official development assist-ance (ODA) commitments, support developing countriesto increase domestic resource mobilization, and reducethe level of debt service of developing countries. Progresson this SDG is conspicuously lagging behind. Commit-ments to increase ODA and improve its quality are notimplemented, developing countries’ debt service paymentsare rising as percentage of their GDP, and the rate of tax-ation relative to GDP has fallen for Sub-Saharan Africaand for the LDCs [56, 57] What is missing in this SDG, isa target for reducing tax avoidance and evasion, eventhough global losses due to tax avoidance are estimated atUSD 500 billion annually [58]. SDG16 does include a targeton reducing illicit financial flows, but the SDG progress re-ports do not mention monitoring of this indicator [59].Although SDG8.1 identifies its GDP growth goal for
LDCs only, its legitimation of GDP as the most appropri-ate economic metric can influence its continued adher-ence in LICs, L-MICs and HICs. This will be problematicfor health and development in the LDCs, since aggregate(global) GDP growth increases the already oversized car-bon footprint of HICs, and to lesser extent LICs and L-MICs, and stretches the economy beyond the planet’s
ecological ceiling [60]. Emphasis on the constant pursuitof GDP growth is also likely to prevent HICs from takingaction towards the realization of SDG17.Several alternative measurements to the GDP have been
developed over the years. The Human Development Index(HDI), first introduced in 1990, measures achievements inthree basic dimensions of human development—a long andhealthy life, access to education, and a decent standard ofliving [61]. Building on that, the Human Development Re-port 2010 introduced the inequality-adjusted HDI (IHDI)[62]. The same year, the Global Multidimensional PovertyIndex was developed. It is a measure of serious deprivationsin the dimensions of health, education, and living standardsthat combines the number of deprived and the intensity oftheir deprivation. While it measures the same dimensionsas the HDI, it has more indicators, which makes it morecomplicated to calculate but less susceptible to bias [62].GDP per capita and HDI have similar trajectories accordingto trend data for the focus countries of this study. However,in all three countries, there is a loss in the HDI figureswhen adjusted to inequality. The loss stands at approxi-mately 30% for Malawi, 28% for Uganda, and 25% forTanzania [61]. This fact is contradictory with the neoliberalsuggestion that constantly increasing economic growth willfinally eliminate inequalities, as once depicted by the iconicKuznets’ curve [60].These indicators are already widely used alongside, but
not replacing, the GDP. An alternative that could replaceGDP as a policy goal is the Genuine Progress Indicator(GPI). GPI has already been used by some states of theUnited States of America, with Costa Rica, Scotland, andSweden soon to follow. The GPI starts with a measure-ment of GDP but then takes into account positive non-monetary factors such as household and volunteer work,and subtracts negative factors such as pollution, resourcedepletion and crime. It also adjusts for inequality. If gov-ernments shifted towards pursuing a maximization ofthe GPI instead of the GDP, they would adopt policiesthat would facilitate inclusive and sustainable economicoutcomes, accelerate progress towards social well-beingand allow for a fairer distribution of wealth and healthacross the globe [63, 64]. As suggested by Raworth, eco-nomic impact assessments should be based on indicatorsof ecological overshoot and domestic social inclusion inorder to achieve ‘human prosperity in a flourishing webof life’ ([60] p. 60).
LimitationsAs we conducted a purposeful selection of the most recentIMF documents for analysis, our approach was not ex-haustive and might lack relevant literature that wouldhave given a deeper insight. In addition, we chose to focusprimarily on the IMF’s role in the countries’ policy-making acknowledging its prominent role in
Meurs et al. Globalization and Health (2019) 15:83 Page 10 of 13
macroeconomic advice. However, to expand the scope ofknowledge on the full picture of macroeconomic develop-ment in the three focus countries, other influential inter-national financial institutions and organizations, such asthe World Bank, regional development banks, and multi/bilateral donors could have been taken into account. Thisstudy focused on three countries in the East African re-gion, which diminishes generalizability and external valid-ity of the study. However, as our focus countries sharepolitical and economic features with several LICs in Af-rica, the insights gained may give rise to further studiesand evidence-based advocacy in the region.
ConclusionOur desk-based analysis of three East African focuscountries affirmed findings of other studies, showingthat GDP increase does not automatically translate to anincrease of health spending, partly a result of IMF struc-tural adjustment programs. Although the IMF hasstarted to acknowledge the importance of social develop-ment, its policy advice is still adhering to austerity andpro-cyclical economic development with potentiallyharmful effects on a country’s population health. Inorder to increase chances to achieve the SDGs, notablySDG3, the international community should abandonSDG8.1, choose alternative indicators to measure eco-nomic development and put emphasis on SDG17.We accept that this policy advice is provisional, as it is
based on analyses of extant studies and several differentdatabases. Our provisional advice could be better in-formed with follow-up stakeholder interviews, as theopinion and input of those with considerable knowledgeof policy concerns within each of our focus countries,and across LDCs more generally, could substantiate and/or elaborate on our own findings and conclusions. Weencourage such work to be undertaken, as the count-down on Agenda 2030 continues.
AbbreviationsDAH: Development Assistance for Health; ECF: Extended Credit Facility;GDP: Gross Domestic Product; GGHE-D: Domestic General GovernmentHealth Expenditure; GPI: Genuine Progress Indicator; HDI: HumanDevelopment Index; HICs: High-Income Countries; HLPF: High Level PoliticalForum; IHDI: Inequality-adjusted Human Development Index;ILO: International Labor Organization; IMF: International Monetary Fund;LDCs: Least Developed Countries; LICs: Low-Income Countries; L-MICs: LowerMiddle-Income Countries; MDGs: Millennium Development Goals;ODA: Official Development Assistance; OECD: Organization for Economic Co-operation and Development; PSI: Policy Support Instrument; SAPs: StructuralAdjustment Programs; SDGs: Sustainable Development Goals; UHC: UniversalHealth Coverage; UNHEEG: United Nations High-Level Commission on HealthEmployment and Economic Growth; USD: United States Dollar; VAT: Value-Added Tax; WHO: World Health Organization
AcknowledgementsThe authors acknowledge the kind contribution of Barbara Fienieg andKaren Kramer who commented on the draft of this article.
Authors’ contributionsMM focused on Malawi, LS on Tanzania and MK on Uganda. All authorscontributed with quantitative and qualitative data. All authors read andapproved the final manuscript.
Authors’ informationMM, LS and MK are working for Wemos Foundation as Global HealthAdvocates, focusing on health financing.
FundingThis work was finance through the Dutch Ministry of Foreign Affairs throughthe Health Systems Advocacy Partnership and IDA Charity Foundation, theNetherlands.
Availability of data and materialsThe datasets used and analyzed during the current study are available fromthe corresponding author on reasonable request.
Ethics approval and consent to participateNot applicable
Consent for publicationNot applicable
Competing interestsThe authors declare that they have no competing interests.
Received: 24 September 2019 Accepted: 18 November 2019
References1. World Health Organization. Declaration of Alma-Ata [Internet]. 1978 [cited
2019 Mar 8]. Available from: https://www.who.int/publications/almaata_declaration_en.pdf?ua=1.
2. World Health Organization. Closing the gap in a generation: health equitythrough action on the social determinants of health. Final Report of theCommission on Social Determinants of Health. Geneva: World HealthOrganization; 2008. Available from: https://www.who.int/social_determinants/final_report/csdh_finalreport_2008.pdf.
3. WHO Commission on Macroeconomics and Health. Macroeconomics andhealth: investing in health for economic development/report of theCommission on Macroeconomics and Health. Geneva: World HealthOrganization; 2001.
4. High-Level Commission on Health Employment and Economic Growth.Working for health and growth: investing in the health workforce. Geneva:World Health Organization; 2016.
5. United Nations. Least Developed Countries [Internet]. 2019 [cited 2019 Sep21]. Available from: https://www.un.org/development/desa/dpad/least-developed-country-category.html
6. Dickinson E. GDP: a brief history. Foreign Policy [Internet]. 2011 [cited 2019Mar 8]. Available from: https://foreignpolicy.com/2011/01/03/gdp-a-brief-history/.
7. International Monetary Fund. World Economic Outlook (October 2018)[Internet]. 2018 [cited 2019 Mar 8]. Available from: https://www.imf.org/external/datamapper/datasets/WEO
8. Stichelmans T. How international financial institutions and donors influenceeconomic policies in developing countries [Internet]. 2016 [cited 2019 Mar1]. Available from: https://eurodad.org/files/pdf/57f4f4163d760.pdf.
9. Ortiz I, Cummins M, Capaldo J, Karunanethy K. The Decade of Adjustment:A Review of Austerity Trends 2010–2020 in 187 Countries (Extension ofSocial Security Series Report No. 53). Geneva: International LabourOrganization; 2015. Available from: https://www.social-protection.org/gimi/RessourcePDF.action?ressource.ressourceId=53192 .
10. Stubbs T, Kentikelenis A, Stuckler D, McKee M, King L. The impact of IMFconditionality on government health expenditure: a cross-national analysis of16 west African nations. Soc Sci Med [Internet] 2017;174:220–227. Availablefrom: http://dx.doi.org/https://doi.org/10.1016/j.socscimed.2016.12.016
11. Kentikelenis AE, Stubbs TH, King LP. IMF conditionality and developmentpolicy space, 1985–2014. Rev Int Polit Econ. 2016;23(4):543–82.
Meurs et al. Globalization and Health (2019) 15:83 Page 11 of 13
12. Kingston KG. The impacts of the World Bank and IMF structural adjustmentProgrammes on Africa: the case study of Coted’voire, Senegal, Uganda andZimbabwe. Sacha J Policy Strateg Stud. 2011;1(2):110–30.
13. International Monetary Fund. Social Safeguards and Program Design inPRGT and PSI-Supported Programs. IMF Policy Paper. 2017.
14. International Monetary Fund. Transcript of the International Monetary andFinancial Committee Press Briefing october 13, 2018 [Internet]. 2018 [cited2019 Mar 8]. Available from: https://www.imf.org/en/News/Articles/2018/10/13/tr101318-transcript-on-the-october-2018-international-monetary-and-finance-committee-press-briefing.
15. Brunswijck G. Unhealthy conditions: IMF loan conditionality and its impacton health financing [Internet]. 2018 [cited 2019 Mar 8]. Available from:https://eurodad.org/.
16. Ortiz I, Cummins M. The Age of Austerity: A Review of Public Expendituresand Adjustment Measures in 181 Countries. Initiative for Policy Dialogueand the South Centre; 2013.
17. World Health Organization. Global Health Expenditure Database [Internet].2018 [cited 2019 Mar 8]. Available from: http://apps.who.int/nha/database/ViewData/Indicators/en
18. World Health Organization. Global Health Observatory (GHO) data[Internet]. 2019 [cited 2019 Sep 21]. Available from: https://www.who.int/gho/en/
19. The World Bank Group. Health Nutrition and Population Statistics [Internet].2018 [cited 2019 May 23]. Available from: http://databank.worldbank.org/data/reports.aspx?source=health-nutrition-and-population-statistics.
20. World Health Organization. 2017 HLPF Thematic Review of SDG3: Ensurehealthy lives and promote well-being for all at all ages [Internet]. 2017[cited 2019 Mar 8]. Available from: https://sustainabledevelopment.un.org/content/documents/14367SDG3format-rev_MD_OD.pdf.
21. Stenberg K, Hanssen O, Edejer TTT, Bertram M, Brindley C, Meshreky A,et al. Financing transformative health systems towards achievement ofthe health sustainable development goals: a model for projectedresource needs in 67 low-income and middle-income countries. LancetGlob Heal. 2017;5(9):e875–87.
22. Institute for Health Metrics and Evaluation (IHME). Financing Global Health2018: Countries and programs in transition [Internet]. Seattle, WA;2018 [cited 2019 Mar 8]. Available from: http://www.healthdata.org/sites/default/files/files/policy_report/FGH/2019/FGH_2018_full-report.pdf.
23. World Health Organization. Global strategy on human resources for health:workforce 2030. Geneva: World Health Organization; 2016. Available from:https://www.who.int/hrh/resources/globstrathrh-2030/en/.
24. Malawi Ministry of Health and Population. Malawi Human Resources forHealth Strategic Plan, 2018–2022. 2018.
25. Chatham House. Shared Responsibilities for Health: A Coherent GlobalFramework for Health Financing Final Report of the Centre on GlobalHealth Security Working Group on Health Financing. 2014;1–36.
26. World Bank Group. Towards Universal Health Coverage: Tackling the HealthFinancing Crisis to End Poverty [Internet]. 2018 [cited 2019 Sep 21].Available from: http://pubdocs.worldbank.org/en/265221524514363896/UHC-Flagship-onepager-FINAL.pdf
27. African Union. Africa scorecard on domestic financing for health, 2018. TheGlobal Fund, UN Foundation, World Health Organization; 2018. Availablefrom: http://aidswatchafrica.net/index.php/africa-scorecard-on-domestic-financing-for-health/document/75/12.
28. Wemos, Amami. Mind the funding gap: who is paying the health workers?.2018. Available from: http://www.wemosresources.org/health-financing/country-report-malawi-mind-the-funding-gap-who-is-paying-the-health-workers/.
29. Uganda Bureau of Statistics. Population Projections 2018 [Internet].Population & Censuses. 2019 [cited 2019 Mar 10]. Available from: https://www.ubos.org/explore-statistics/20/
30. Ministry of Finance Planning and Economic Development. National BudgetFramework Paper FY 2019/20-FY 2023/24. 2018.
31. Civil Society Budget Advocacy Group. What MPs should consider whendebating the health sector budget FY 2019/20: CSO Health Sector PositionPaper on the Uganda National Budget Framework Paper FY 2019/20. 2019.
32. World Bank. World Development Indicators | DataBank [Internet]. 2019[cited 2019 Mar 1]. Available from: https://databank.worldbank.org/data/home.aspx
33. Ministry of Finance and Planning, Policy Forum. The Citizen’s Budget: asimplified version of government budget for financial year 2017/2018
[Internet]. 2017 [cited 2019 Mar 8]. Available from: http://www.mof.go.tz/mofdocs/budget/Citizens Budget/CITIZENS BUDGET 2017_18 (Eng_Final).pdf.
34. Record R, Kumar P, Kandoole P. From Falling Behind to Catching Up:A Country Economic Memorandum for Malawi. Directions inDevelopment—Public Sector Governance. Washington D.C.: WorldBank; 2018.
35. Chirwa E. Structural Adjustment Programs and the Labour Market in Malawi.1999. Report No.: No. WC/06/99.
36. International Monetary Fund. Malawi Article IV consultation and three-yeararrangement under the Extended Credit Facility. 2018.
37. International Monetary Fund. Malawi; First Review under the Three-YearExtended Credit Facility Arrangement. 2018.
38. Muhumuza MK, Adengo J. Is IMF in Uganda’s economy a friend or just anecessary evil? Daily Monitor [Internet]. 2017 Jan 25 [cited 2019 Mar 1].Available from: https://www.monitor.co.ug/Business/Prosper/Is-IMF-in-Uganda-s-economy-a-friend-or-just-a-necessary-evil-/688616-3784082-yyauwn/index.html.
39. International Monetary Fund. Policy Support Instrument (PSI) [Internet].Factsheet. 2018 [cited 2019 Mar 10]. Available from: https://www.imf.org/en/About/Factsheets/Sheets/2016/08/02/21/21/Policy-Support-Instrument
40. International Monetary Fund. Uganda 2017 Article IV Consultation AndEighth Review Under The Policy Support Instrument-Press Release; StaffReport; And Statement By The Executive Director For Uganda. WashingtonD.C.; 2017.
41. Ministry of Planning Finance and Economic Development. Background Tothe Budget Fiscal Year 2018/19: Industrialization for job creation and sharedprosperity Kampala; 2018.
42. Nord R, Sobolev Y, Dunn D, Hajdenberg A, Hobdari N, Maziad S, et al.Tanzania: the story of an African transition. Washington DC: InternationalMonetary Fund; 2009.
43. International Monetary Fund. United Republic of Tanzania Seventh Reviewunder the Policy Support Instrument—Press Release; Staff Report.Washington D.C.; 2018.
44. The United Republic of Tanzania. Act Supplement No 10: The Value AddedTax Act. Gaz United Repub Tanzania [Internet]. 2014 Dec 19 [cited 2019 Mar8]. Available from: https://www.tra.go.tz/tax laws/THE VALUE ADDED TAXACT, 2014.pdf.
45. Ortiz I, Cummins M, Karunanethy K. Fiscal Space for Social Protection andthe SDGs: Options to Expand Social Investments in 187 Countries.(Extension of Social Security Series Report No. 48). Geneva: InternationalLabour Organization; 2017.
46. International Monetary Fund. United Republic of Tanzania Staff Reportfor the 2016 Article IV Consultation and Fourth Review under thePolicy Support Instrument—Press Release; Staff Report; and Statementby the Executive Director for the United Republic of Tanzania.Washington D.C.; 2016.
47. United Nations Economic and Social Council. Progress towards theSustainable Development Goals. Report of the Secretary-General. 2017.
48. Centre for Global Development. Does The IMF Constrain Health Spendingin Poor Countries ? Evidence and an Agenda for Action. 2007.
49. Lustig N. Fiscal policy, income redistribution and poverty reduction in low-and middle-income countries. In: Commitment to Equity HandbookEstimating the Impact of Fiscal Policy on Inequality and Poverty. BrookingsInstitution Press and CEQ Institute, Tulane University; 2018. Available from:https://www.un.org/development/desa/dspd/wp-content/uploads/sites/22/2018/06/4-1.pdf.
50. KPMG. Corporate tax rates table [Internet]. 2019 [cited 2019 Sep 21].Available from: https://home.kpmg/xx/en/home/services/tax/tax-tools-and-resources/tax-rates-online/corporate-tax-rates-table.html
51. Rowden R. IMF survey: Concern over IMF Impact on Health Spending. IMFNews [Internet]. 2009 Dec 11 [cited 2019 Mar 8]. Available from: https://www.imf.org/en/News/Articles/2015/09/28/04/53/sorea121109a.
52. Rowden R. International Monetary Fund sacrifices higher growth,employment, spending, and public Investment in Health Systems in orderto keep inflation unnecessarily low. Int J Health Serv. 2010;40(2):333–8.
53. Grant C. The Contribution of Education To Economic Growth [Internet].Institute of Development Studies. Brighton, UK; 2017. (K4D HelpdeskReport). Available from: https://opendocs.ids.ac.uk/opendocs/handle/123456789/13117
54. Ostry JD, Berg A, Tsangarides C. Redistribution, Inequality, and Growth. IMFStaff Discuss Notes [Internet]. 2014;14(02):1 [cited 2019 Mar 8]. Available
Meurs et al. Globalization and Health (2019) 15:83 Page 12 of 13
from: http://elibrary.imf.org/view/IMF006/21122-9781484352076/21122-9781484352076/21122-9781484352076.xml.
55. United Nations Conference on Trade and Development. Trade anddevelopment report 2017. Beyond Austerity: Towards a Global New Deal.New York and Geneva: United Nations; 2017.
56. United Nations Economic and Social Council. Progress towards theSustainable Development Goals: Report of the Secretary-General Summary[Internet]. 2018. Available from: https://unstats.un.org/sdgs/files/report/2018/secretary-general-sdg-report-2018%2D%2DEN.pdf
57. United Nations Economic and Social Council. Special edition: progresstowards the Sustainable Development Goals Report of the Secretary-General [Internet]. 2019 [cited 2019 Mar 8]. Available from: https://unstats.un.org/sdgs/files/report/2019/secretary-general-sdg-report-2019%2D%2DEN.pdf.
58. Cobham A, Janský P. Global distribution of revenue loss from tax avoidance:Re-estimation and country results, WIDER Working Paper 2017/55. Helsinki:UNU-WIDER; 2017
59. United Nations. Sustainable Development Goals Knowledge Platform[Internet]. 2019 [cited 2019 Sep 21]. Available from: https://sustainabledevelopment.un.org
60. Raworth K. Doughnut Economics: Seven Ways to Think Like a 21st CenturyEconomist. White River Junction, VT: Chelsea Green Publishing; 2017.
61. United Nations Development Programme. About Human Development[Internet]. 2018 [cited 2019 Mar 10]. Available from: http://hdr.undp.org/en/humandev/
62. United Nations Development Programme. Human Development Report2010. 20th Anniversary Edition. The Real Wealth of Nations: Pathways toHuman Development. New York, NY: United Nations DevelopmentProgramme; 2010. Available from: http://hdr.undp.org/sites/default/files/reports/270/hdr_2010_en_complete_reprint.pdf.
63. Hickel J. The Divide: A Brief Guide to Global Inequality and its Solutions.London: William Heinemann; 2017.
64. Talbarth J, Webb J. Genuine Progress Indicator [Internet]. Green Growth BestPractice Case Study Series. 2014 [cited 2019 Mar 8]. Available from: http://www.greengrowthknowledge.org/case-studies/genuine-progress-indicator.
Publisher’s NoteSpringer Nature remains neutral with regard to jurisdictional claims inpublished maps and institutional affiliations.
Meurs et al. Globalization and Health (2019) 15:83 Page 13 of 13