
Genome-wide expression analysis suggests unique disease-promoting and disease-preventing signatures...
13
ORIGINAL ARTICLE Genome-wide expression analysis suggests unique disease-promoting and disease-preventing signatures in Pemphigus vulgaris R Dey-Rao, K Seiffert-Sinha and AA Sinha To evaluate pathogenetic mechanisms underlying disease development and progression in the autoimmune skin disease Pemphigus vulgaris (PV), we examined global peripheral blood gene expression in patients and healthy controls. Our goals were to: (1) assign blood gene expression signatures to patients and controls; (2) identify differentially expressed genes (DEGs) and investigate functional pathways associated with these signatures; and (3) evaluate the distribution of DEGs across the genome to identify transcriptional ‘hot spots’. Unbiased hierarchical clustering clearly separated patients from human leukocyte antigen (HLA)-matched controls (MCRs; ‘disease’ signature), and active from remittent patients (‘activity’ signature). DEGs associated with these signatures are involved in immune response, cytoskeletal reorganization, mitogen-activated protein kinase (MAPK) signaling, oxidation-reduction and apoptosis. We further found that MCRs carrying the PV-associated HLA risk alleles cluster distinctly from unmatched controls (UMCR) revealing an HLA-associated ‘control’ signature. A subset of DEGs within the ‘control’ signature overlap with the ‘disease’ signature, but are inversely regulated in MCR when compared with either PV patients or UMCR, suggesting the existence of a ‘protection’ signature in healthy individuals carrying the PV HLA genetic risk elements. Finally, we identified 19 transcriptional ‘hot spots’ across the signatures, which may guide future studies aimed at pinpointing disease risk genes. Genes and Immunity advance online publication, 29 August 2013; doi:10.1038/gene.2013.44 Keywords: pemphigus vulgaris; gene expression; DNA microarray; HLA; disease signatures; autoimmune disease INTRODUCTION Pemphigus vulgaris (PV) is a prototypical organ-specific, poten- tially fatal autoimmune disease of the skin, with an incidence of an estimated 0.076–5 cases in 100 000 person-years 1 that is characterized by mucocutaneous blistering. Tissue damage is mediated by autoantibodies that target self-antigens, primarily desmoglein 3 and 1, that are expressed at the surface of keratinocytes, resulting in acantholysis (loss of cell–cell adhesion) by mechanisms not fully understood. 2–4 Although there is a general consensus that the disease is multifactorial, there is a major gap in our knowledge regarding how genetic and environmental elements alter gene expression and promote disease development. Despite the very strong linkage of PV to human leukocyte antigen (HLA) DRB1*0402 and DQB1*0503, additional questions remain, such as why the vast majority of individuals who carry the PV-associated HLA susceptibility alleles do not develop the disease. Furthermore, the molecular mechanisms driving the unpredictable transitions from periods of disease activity to remission and back are not known. Over the past several years, global genome-wide expression profiling has been useful to advance our understanding of disease mechanisms and genetic risk in a number of autoimmune diseases. 5–9 Although target damage in PV is within the skin, it is clear that patients exhibit systemic alterations in their peripheral immune system. 4,10 Thus, we undertook this study with the objectives to: (1) assign blood gene expression signatures to PV patients and HLA-matched (MCR) and -unmatched control (UMCR) subjects; (2) identify differentially expressed genes (DEGs) and investigate functional pathways and processes associated with patient and control signatures; and (3) evaluate the distribution of DEGs across the genome to identify chromosomal regions harboring transcriptional ‘hot spots’ that may be useful for locating disease susceptibility loci. Our data show that unsupervised hierarchical clustering achieved distinct separation of patient and control groups, producing three distinct expression patterns characterizing (1) ‘disease’ (PV patients vs genetically related HLA-MCRs), (2) ‘activity’ (active vs remittent PV patients) and (3) ‘control’ (HLA- matched vs HLA-UMCRs) signatures. Functional annotation of DEGs within these signatures implicated immune pathways, cytoskeletal reorganization, apoptosis and MAPK signaling path- ways in the pathogenesis of PV. Significantly, we uncovered the presence of a subset of PV-related DEGs within the PV HLA- related ‘control’ signature that overlapped with DEGs linked to the ‘disease’ signature, but that are inversely regulated (pre- dominantly downregulated) in MCRs when compared with either PV patients or UMCRs. We propose that this subset of genes constitute a ‘protection’ signature in genetically susceptible control individuals who have not yet developed the disease, which serve to hold disease development in check. Analysis of the distribution of DEGs associated with the four signatures described above identified 19 transcriptional ‘hot spots’ that highlight chromosomal regions, which may facilitate the search for PV susceptibility genes. Department of Dermatology, University at Buffalo, Buffalo, NY, USA. Correspondence: Dr AA Sinha, Department of Dermatology, University at Buffalo, 6082 Clinical and Translational Research Center, 875 Ellicott Street, Buffalo, NY 14203, USA. E-mail: [email protected] Received 26 March 2013; revised 2 July 2013; accepted 19 July 2013 Genes and Immunity (2013), 1–13 & 2013 Macmillan Publishers Limited All rights reserved 1466-4879/13 www.nature.com/gene
Transcript of Genome-wide expression analysis suggests unique disease-promoting and disease-preventing signatures...

ORIGINAL ARTICLE
Genome-wide expression analysis suggests unique
disease-promoting and disease-preventing signatures
in Pemphigus vulgarisR Dey-Rao, K Seiffert-Sinha and AA Sinha
To evaluate pathogenetic mechanisms underlying disease development and progression in the autoimmune skin disease
Pemphigus vulgaris (PV), we examined global peripheral blood gene expression in patients and healthy controls. Our goals were to:
(1) assign blood gene expression signatures to patients and controls; (2) identify differentially expressed genes (DEGs) and
investigate functional pathways associated with these signatures; and (3) evaluate the distribution of DEGs across the genome to
identify transcriptional ‘hot spots’. Unbiased hierarchical clustering clearly separated patients from human leukocyte antigen
(HLA)-matched controls (MCRs; ‘disease’ signature), and active from remittent patients (‘activity’ signature). DEGs associated with
these signatures are involved in immune response, cytoskeletal reorganization, mitogen-activated protein kinase (MAPK) signaling,
oxidation-reduction and apoptosis. We further found that MCRs carrying the PV-associated HLA risk alleles cluster distinctly from
unmatched controls (UMCR) revealing an HLA-associated ‘control’ signature. A subset of DEGs within the ‘control’ signature overlap
with the ‘disease’ signature, but are inversely regulated in MCR when compared with either PV patients or UMCR, suggesting the
existence of a ‘protection’ signature in healthy individuals carrying the PV HLA genetic risk elements. Finally, we identified 19
transcriptional ‘hot spots’ across the signatures, which may guide future studies aimed at pinpointing disease risk genes.
Genes and Immunity advance online publication, 29 August 2013; doi:10.1038/gene.2013.44
Keywords: pemphigus vulgaris; gene expression; DNA microarray; HLA; disease signatures; autoimmune disease
INTRODUCTION
Pemphigus vulgaris (PV) is a prototypical organ-specific, poten-tially fatal autoimmune disease of the skin, with an incidence of anestimated 0.076–5 cases in 100 000 person-years1 that ischaracterized by mucocutaneous blistering. Tissue damageis mediated by autoantibodies that target self-antigens, primarilydesmoglein 3 and 1, that are expressed at the surface ofkeratinocytes, resulting in acantholysis (loss of cell–cell adhesion)by mechanisms not fully understood.2–4 Although there is ageneral consensus that the disease is multifactorial, there isa major gap in our knowledge regarding how genetic andenvironmental elements alter gene expression and promotedisease development. Despite the very strong linkage of PV tohuman leukocyte antigen (HLA) DRB1*0402 and DQB1*0503,additional questions remain, such as why the vast majority ofindividuals who carry the PV-associated HLA susceptibility allelesdo not develop the disease. Furthermore, the molecularmechanisms driving the unpredictable transitions from periodsof disease activity to remission and back are not known.Over the past several years, global genome-wide expression
profiling has been useful to advance our understanding of diseasemechanisms and genetic risk in a number of autoimmunediseases.5–9 Although target damage in PV is within the skin, itis clear that patients exhibit systemic alterations in their peripheralimmune system.4,10 Thus, we undertook this study with theobjectives to: (1) assign blood gene expression signatures to PVpatients and HLA-matched (MCR) and -unmatched control (UMCR)
subjects; (2) identify differentially expressed genes (DEGs) andinvestigate functional pathways and processes associated withpatient and control signatures; and (3) evaluate the distribution ofDEGs across the genome to identify chromosomal regionsharboring transcriptional ‘hot spots’ that may be useful forlocating disease susceptibility loci.Our data show that unsupervised hierarchical clustering
achieved distinct separation of patient and control groups,producing three distinct expression patterns characterizing (1)‘disease’ (PV patients vs genetically related HLA-MCRs), (2)‘activity’ (active vs remittent PV patients) and (3) ‘control’ (HLA-matched vs HLA-UMCRs) signatures. Functional annotation ofDEGs within these signatures implicated immune pathways,cytoskeletal reorganization, apoptosis and MAPK signaling path-ways in the pathogenesis of PV. Significantly, we uncovered thepresence of a subset of PV-related DEGs within the PV HLA-related ‘control’ signature that overlapped with DEGs linked tothe ‘disease’ signature, but that are inversely regulated (pre-dominantly downregulated) in MCRs when compared with eitherPV patients or UMCRs. We propose that this subset of genesconstitute a ‘protection’ signature in genetically susceptiblecontrol individuals who have not yet developed the disease,which serve to hold disease development in check. Analysis of thedistribution of DEGs associated with the four signatures describedabove identified 19 transcriptional ‘hot spots’ that highlightchromosomal regions, which may facilitate the search for PVsusceptibility genes.
Department of Dermatology, University at Buffalo, Buffalo, NY, USA. Correspondence: Dr AA Sinha, Department of Dermatology, University at Buffalo, 6082 Clinical and
Translational Research Center, 875 Ellicott Street, Buffalo, NY 14203, USA.
E-mail: [email protected]
Received 26 March 2013; revised 2 July 2013; accepted 19 July 2013
Genes and Immunity (2013), 1–13
& 2013 Macmillan Publishers Limited All rights reserved 1466-4879/13
www.nature.com/gene

RESULTS
Unsupervised hierarchical clustering and principal componentsanalysis (PCA) achieved distinct classification of patient andcontrol groups
We performed unsupervised hierarchical clustering on log2transformed, background corrected and normalized expressionvalues from all patient (n¼ 21; 13 PV-active (PV-A), 8 PV-remittent(PV-R)) and control (n¼ 10; 4 HLA-MCRs and 6 HLA-UMCRs)
samples. Briefly, the most variably expressed genes across thearrays were selected for hierarchical clustering. This unbiasedmethod revealed that: (1) PV patients, regardless of diseaseactivity or therapy status, separated away from the geneticallyrelated HLA-MCR subjects (Figure 1a), producing a ‘disease’signature, driven by 1203 most variable probes. The 21 PVpatients were either off (OFF), on minimal (MIN) or more thanminimal (MORE MIN) therapy, as defined by consensus
Figure 1. Unsupervised hierarchical clustering separates PV patients and healthy controls and segregates them into three distinct signatures.(a–c) Dendograms of the three signatures: (a) PV patients, regardless of disease activity and state of therapy separate from geneticallymatched controls (MCRs; ‘disease’ signature); (b) active PV patients separate from remittent patients (‘activity’ signature); and (c) HLA-MCRscluster away from HLA-UMCRs (‘control’ signature). (d–f ) Principle components analysis displays clear spatial separation (expression levelclustering) of the three assigned signatures: (d) ‘disease’ signature; (e) ‘activity’ signature; and (e) ‘control’ signature. In the three-dimensionalplots, the three principle components PC#1, #2 and #3 of all samples and their respective variations are expressed on the x, y and z axis. Thetotal percentage of PCA mapping variability is 42.1% for d, 74.4% for e and 59.5% for f. Each data point represents a sample. The ellipsoidshighlight portioning of the different samples. Active PV (PV-A¼blue), remittent PV (PV-R¼green), HLA-MCR (¼ red), HLA-UMCR (¼purple).Therapy status: no (OFF¼pink), minimum (MIN¼ light blue) and more than minimum (MORE MIN’¼ yellow), as defined in ‘Materials andmethods’.
Genome-wide expression analysis in Pemphigus vulgaris
R Dey-Rao et al
2
Genes and Immunity (2013) 1 – 13 & 2013 Macmillan Publishers Limited

guidelines11 and in the ‘Materials and methods’ section.Importantly, patients did not cluster according to therapeuticgroupings (Figure 1a), indicating that treatment did not drive theclustering. (2) PV patients with active disease as defined byconsensus guidelines11 and in the Materials and methods section(see below) were distinct from the remittent patients (Figure 1b),delineating a disease ‘activity’ signature of 1572 most variableprobes. For this analysis, we narrowed our patient selection to 3PV-A and 3 PV-R patients that were off therapy (OFF) to eliminateany possible effects of on-going therapy on gene expressionrelated to lesional activity. (3) MCR separated from UMCR(Figure 1c) revealing a PV HLA-related ‘control’ signature drivenby 1915 most variable probes. Some of the top 10 GeneGOpathways and processes associated with the up-and down-regulated genes driving the difference in both the ‘disease’ and‘activity’ signatures by unbiased hierarchical clustering wereimmune and inflammatory response (involving interleukin-4 (IL-4), IL-13 and IL-17), cytokine production, wound healing, oxida-tion-reduction, apoptosis and leukocyte activation, among others(Table 1). The IL-4 pathway has been shown to be intricatelyinvolved in PV pathogenesis,12 whereas the IL-17 signalingpathway has been described relatively recently, and shown tohave a critical role in inflammation and pathogenesis of multipleautoimmune diseases.13,14 Unique to the ‘activity’ signature wasthe enrichment of genes involved in the antiviral interferon-related immune response. These processes and pathways areconsistent with the known or suspected pathophysiologicalchanges occurring in PV.4,10,15–18 Most of the top enrichedGeneGO pathways and processes were also shared in the PVHLA-related ‘control’ signature with the notable exceptions ofoxidation-reduction and apoptosis (Table 1). We note that oneclinically active patient (PV 201) did not cluster with the otheractive patients (Figure 1a). On review of the clinical intake record,this patient had an atopic diathesis with multiple allergies to dust,pollen and mold as well as atopic dermatitis, which might be areason for the grouping.Next, to identify outliers and evaluate whether significant batch
effects could be observed, PCA was performed on Log2
transformed normalized expression indices for 454 000 tran-scripts of all samples in the three signatures: (1) ‘disease’–allpatients and HLA-MCRs; (2) ‘activity’–active PV and remittent PVand (3) ‘control’–HLA-matched and -UMCRs. In this analysis, all PVpatients, regardless of disease activity, clearly separate away fromMCRs (Figure 1d), whereas active and remittent patients show theleast separation (Figures 1d and e). HLA-related MCRs were themost significantly clustered away from the UMCR individuals(Figure 1f). There were no distinctive outliers.Taken together, our data indicate that unbiased hierarchical
clustering and principle components analysis can assign expres-sion signatures associated with PV based on: the absence andpresence of disease in genetically susceptible individuals (‘disease’signature), variable disease phases (‘activity’ signature) and HLAassociation (‘control’ signature). In addition, we clearly demon-strate that the transcriptional grouping of patients is driven bydisease state, and not by therapy status or gender.
The ‘disease’ signature
DEGs were generated by comparing the groups that produced the‘disease’ signature by the unbiased approach (see above).Hierarchical clustering of the trimmed 902 DEGs with 706 upand 196 downregulated (Supplementary Table 1) separated thesamples into their corresponding phenotype (data not shown).The top 10 up- and downregulated genes in the list are shown inFigure 2a. For the full list of DEGs from the ‘disease’ signature seeSupplementary Table 2.Functional annotation and pathway analysis of the DEGs within
the ‘disease’ signature revealed a significant enrichment ofdysregulated pathways and processes involving regulation of actincytoskeleton, regulation of stress-activated protein kinases in theMAPK signaling pathway, clathrin-coated vesicle transport cycle,apoptosis, G-protein signaling pathways including p38MAPK, c-JunN-Terminal Kinase (JNK) and RhoA showing most genes upregulatedin PV patients as opposed to MCR (Figure 2b). We found a total of 67DEGs involved with apoptosis and cell death (mostly upregulated) inPV patients vs MCRs; Apoptotic pathways have been implicated in
Table 1. Potentially disease relevant GeneGo pathways and processes (within the top 10 significant pathways) associated with the up and
downregulated genes driving the differences in the ‘disease’, ‘activity’, and ‘control’ signatures by unsupervised hierarchical clustering
Enriched GeneGo pathwaysand processes shared
‘Disease’ signaturea ‘Activity’ signaturea ‘Control’ signaturea
Immune response IL-17 signaling pathwaysIL-13 signaling via JAK-STAT
IL-1 signaling pathwayOncostatin M signaling via MAPKin mouse cellsIL-17 signaling pathwaysAntiviral actions of interferons
IL-1 signaling pathwayHMGB1/TLR signaling pathway
Cytokine production Cytokine production by Th17 cells incystic fibrosis
Immune response_Th17-derivedcytokines
Cytokine production by Th17cells in cystic fibrosis
Wounding Wound healing Response to wounding Response to woundingOxidation reduction Response to oxidative stress Oxidation reduction —Apoptosis Anti-apoptosis mediated by external
signals via NF-kBAnti-apoptosis mediated by externalsignals via MAPK and JAK/STAT
Apoptosis and survival caspasecascade
—
Inflammation Immune response_Th17-derivedcytokinesIL-4 signalingInflammasome in inflammatoryresponse
IL-4 signalingIL-10 anti-inflammatory response
IL-4 signalingIL-10 anti-inflammatory response
Leukocyte Activation Cell adhesion_Platelet–endothelium–leucocyte interactionsRegulation of leukocyte activationCell adhesion_Leucocyte chemotaxis
Cell adhesion_LeucocytechemotaxisCell adhesion_Platelet–endothelium–leucocyteinteractions
Cell adhesion_LeucocytechemotaxisCell adhesion_Platelet-endothelium-leucocyteinteractions
Abbreviations: IL, interleukin; MAPK, mitogen-activated protein kinase; NF-kB, nuclear factor kB. aSignatures revealed by unsupervised hierarchical clustering
Genome-wide expression analysis in Pemphigus vulgaris
R Dey-Rao et al
3
& 2013 Macmillan Publishers Limited Genes and Immunity (2013) 1 – 13

the induction of acantholysis in a number of studies.15,16,19,20 Forty-two protein kinases and nine protein phosphatases weredysregulated. Many of these pathways and specific DEGs supportdocumented events in PV pathogenesis.15
Of note, we observe a 2.47-fold upregulation in PV patients ofATP2C1 (calcium-transporting ATPAse type 2C member 1), whichhas been associated with Haley–Haley disease21 and PV.22 Bothdiseases are characterized by a loss of cell–cell adhesion becauseof desmosomal dysfunction, which may be linked to the alteredintracellular calcium metabolism associated with the gene.22,23
Also, ADAM9 (fold change (FC)¼ 2.2), a membrane-anchoredmetalloprotease related to disintegrins has been shown tomediate proteolysis of the E-cadherin cell adhesion moleculesand DSG1,24,25 processes central to the development of non-mucosal blisters in PV.26
We observed additional enriched pathways and processes suchas neurotrophin signaling (IRS2, BRAF, FOXO3, PTPN11, IRAK3,NRAS, BDNF, MAP3K5, MAP3K1, GAB1, RIPK2, MAPK9, FOXO3B andFRS2), membrane fusion (SNAP29, PLDN, GNAI3, RABIF, NAPG,BNIP1, RABEP1, VTI1B, LRMP, VAMP3, SNAP23 and GCA) andsphingolipid metabolic process (ACER3, SGMS2, GLA, COL4A3BP,PPP2CA, SGMS1, NSMAF, CLN8 and SFTPB) that have notpreviously been associated with disease.
The ‘activity’ signature
In order to evaluate transcriptional changes directly associatedwith different phases of clinical activity, we next eliminatedcontrol subjects from the comparison. Although unsupervisedclustering showed that the therapeutic regimen did not affecthow patients clustered (see above and Figure 1a), to avoid anytherapeutic bias, we included only those six patients, three active(PV-A) and three remittent (PV-R), which were completely off
therapy (OFF) for further analysis. Hierarchical clustering of 252DEGs generated from this comparison separated the six samplesinto their corresponding phenotype (data not shown) with 203 upand 49 downregulated transcripts in active vs remittent patients(Supplementary Table 1). The top 10 DEGs are shown in Figure 3a.See Supplementary Table 3 for the full DEG list.More than 30 DEGs, mostly upregulated in active vs remittent
patients, are enriched for gene ontology pathways and processesrelated to immunity (innate and adaptive immune response) suchas the nucleotide-binding oligomerization domain-like receptorsignaling pathway along with cytokine production and interaction,inflammatory pathways, apoptosis, leukocyte and lymphocyteactivation, and are consistent with ‘activity’-associated functionalpathways and processes revealed by unsupervised clusteringanalysis. Activated immune response was the most highlyenriched process (Figure 3b), followed by oxidation reductionwith 19 DEGS (ME2, SORD, FADS1, NCF4, PYROXD1, SCD, UGDH,PDIA5, ALDH3B1, NDUFV3, SCCPDH, NPHP3, CYP4A11, PRUNE2,TP53I3, DHFR, PLOD1, H6PD and PNPO). Upregulation of pathwaysand processes such as cytokine–cytokine receptor interaction (10DEGs), inflammation pathway involving Jak-signal transducer andactivator of transcription (STAT) signaling (7 DEGs) and apoptosis(5 DEGs) was observed. In addition, we found an enrichment ofthe Ras-related G-protein, RACI signaling pathway, with threeDEGs (C3orf10, PAK1 and NCF2). Most DEGs in all the enrichedpathways and processes were upregulated in active patients whencompared with patients in remission (Figure 3b).We also note significant enrichment of six DEGs (IRAK1,
SLC11A1, NOD2, CARD9, SCARB1 and MGST1) associated withthe GO biological process; ‘response to molecule of bacterialorigin’ that is of interest because of the recent association of hostgene–microbiota interactions with blistering disease of the skin.27
Figure 2. Functional annotation and pathway analysis in the ‘disease ‘signature. We compared gene expression profiles from 21 PV patients(PV-A±PV-R) vs 4 matched controls (MCRs), generating a trimmed list of 902 DEGs (706 up and 196 downregulated). (a) Top 10 up anddownregulated genes. (b) Functional annotation and pathways analysis reveal significant enrichments in several patho-physiologic pathwaysand processes central to PV, with most transcripts upregulated in PV patients. Bars indicate fold up and downregulation of genes. A ‘positive’FC indicates an upregulation and a ‘negative’ FC indicates a downregulation of genes in PV patients (active and remittent) as compared withgenetically related HLA-MCR individuals.
Genome-wide expression analysis in Pemphigus vulgaris
R Dey-Rao et al
4
Genes and Immunity (2013) 1 – 13 & 2013 Macmillan Publishers Limited

The PV HLA-associated ‘control’ signature
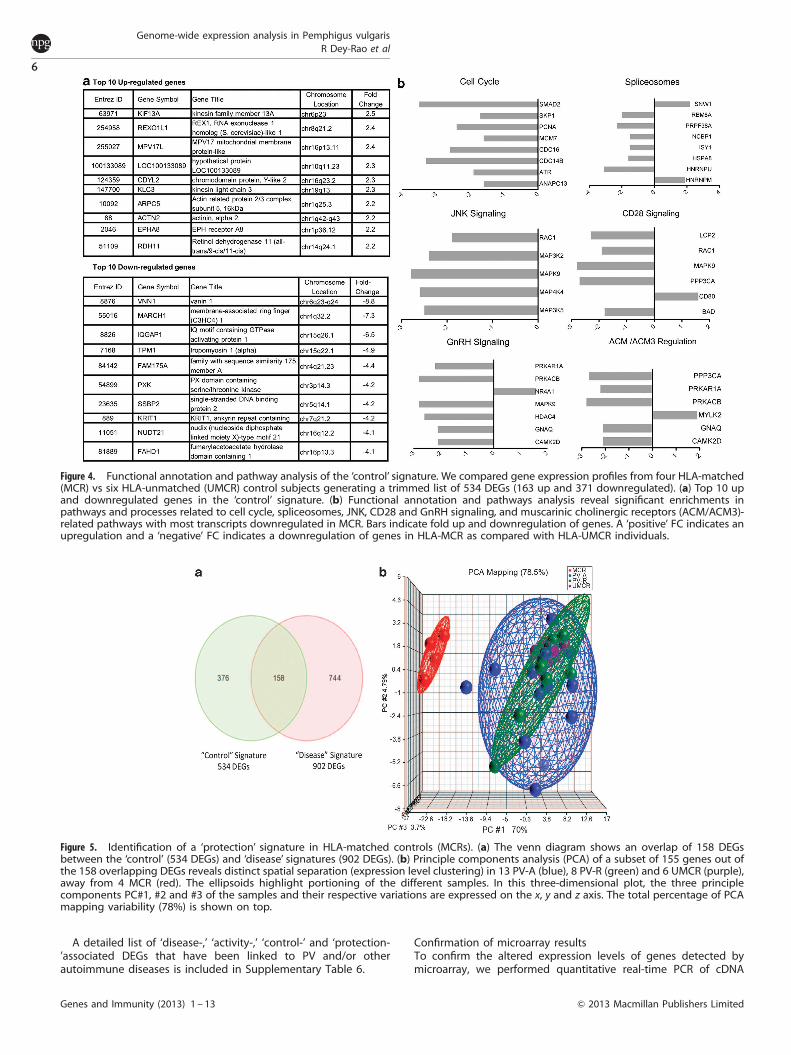
PV exhibits one of the strongest known HLA disease associations,where 495% PV patients type as HLA DRB1*0402 and DQB1*0503positive.4,10 However, a large percentage of healthy individuals whocarry these two alleles do not develop disease.10 To uncoverdifferences in transcriptional activity in healthy HLA-matchedindividuals (MCR, carrying the PV-associated DRB1*0402 and/orDQB1*0503 alleles) from healthy HLA-unmatched subjects (UMCR,carrying neither DRB1*0402 nor DQB1*0503), we eliminated alldiseased subjects from the next analysis. Hierarchical clustering of534 DEGs generated from this comparison separated the 10 samplesinto their corresponding phenotype (data not shown) with 163 upand 371 downregulated transcripts (Supplementary Table 1). The top10 DEGs are shown in Figure 4a. See Supplementary Table 4 for thefull DEG list with chromosomal locations.Functional annotation and pathway analysis along with
Pubmed literature searches revealed significant enrichment inthe cell cycle-related pathway, with all eight transcripts down-regulated in MCR. Pathways such as spliceosomes (eight DEGs),JNK (MAPKs 8–10) signaling pathway (five DEGs), CD28 (T-cell-specific surface glycoprotein CD28) signaling in immune response(six DEGs), GnRH (gonadotropin-releasing hormone) signaling inreproduction (seven DEGs) and muscarinic cholinergic receptor(ACM/ACM3)-regulated pathways (six DEGs) were also enriched inthe ‘control’ signature, with the majority of transcripts beingdownregulated in HLA-MCR subjects (Figure 4b).
The HLA-linked ‘protection’ signature
When analyzing DEGs associated with the ‘disease’ and ‘control’signatures, we observed an overlap of 158 genes between the twolists (Figure 5a). Remarkably, within the 158 DEGs, a subset of 155
was regulated in the opposite direction in HLA-MCRs whencompared with either UMCR or PV patients. PCA of the 155 genes,with spatial separation of all the variations in expression values ofthe 31 samples shows clustering of MCR away from all PV patients(active and remittent) and UMCR samples (Figure 5b). Hierarchicalclustering and heat map of the expression values of these 155genes in all 31 samples (13 PV-A, 8 PV-R, 6 UMCR and 4 MCR)clearly follows the same trend in regulation, with 132 genes beingdownregulated and 23 being upregulated in MCR when comparedwith all PV patients (PV-Aþ PV-R) as well as UMCR (Figure 6).Functional annotation and pathway analysis of this subset of 155shared DEGs revealed pathways, processes and networks such asG-protein signaling-associated RhoA (ARGEF3, EPHA8, GNAQ,PFAS), RAC1 (ARHGAP12, PFAS, LCP2), and JNK pathways(MAP3K5, MAP4K4, MAPK9, MAP3K2), apoptosis (MAP3K5, NSMAF,GNAQ, MAPK9, LEPROT, and SMAD2), cell cycle regulation (CD16),cytoskeleton remodeling (PFAS, SMAD2), immune response(PSMA2, ACTN2, ARPC5, MAPK9, LCP2), keratinocyte differentiation(MAP3K5, GNAQ, SMAD2) cell adhesion (EPHA8, MAP4K4) andinflammation (ATF1, MAPK9). Based on the discovery of thisunique subset of DEGs associated with the PV HLA-related‘control’ signature that exhibit overlapping, but inverse regulationin MCR when compared with either PV patients or UMCR, wepropose the existence of a potential ‘protection’ signature inindividuals who carry PV-associated HLA risk alleles but remaindisease free. For the full list of 155 DEGs with FCs in MCR vs PV-Aand PV-R as well as MCR vs UMCR see Supplementary Table 5.Interestingly, three DEGs (IL13RA1, OGFRL1 and CNPY3) over-lapped between the ‘protection’ and ‘activity’ signatures and weredownregulated in MCR vs all PV patients (PV-Aþ PV-R) as well asUMCR. Furthermore, these three DEGs were also downregulated inremittent PV patients vs active PV patients.
Figure 3. Functional annotation and pathway analysis of the ‘activity’ signature. We compared gene expression profiles from three active (PV-A) vs three remittent (PV-R) patients who were all off therapy, generating a trimmed list of 252 DEGs (203 up and 49 downregulated). (a) Top10 up and downregulated genes. (b) Functional annotation and pathways analysis reveal significant enrichments in pathways and processescentral to the disease related to immune and inflammatory response, with most transcripts upregulated in active patients. Bars indicate foldup- and downregulation of genes. A ‘positive’ FC indicates an upregulation and a ‘negative’ FC indicates a downregulation of genes in PV-Apatients as compared with PV-R patients.
Genome-wide expression analysis in Pemphigus vulgaris
R Dey-Rao et al
5
& 2013 Macmillan Publishers Limited Genes and Immunity (2013) 1 – 13
A detailed list of ‘disease-,’ ‘activity-,’ ‘control-’ and ‘protection-’associated DEGs that have been linked to PV and/or otherautoimmune diseases is included in Supplementary Table 6.
Confirmation of microarray resultsTo confirm the altered expression levels of genes detected bymicroarray, we performed quantitative real-time PCR of cDNA
Figure 4. Functional annotation and pathway analysis of the ‘control’ signature. We compared gene expression profiles from four HLA-matched(MCR) vs six HLA-unmatched (UMCR) control subjects generating a trimmed list of 534 DEGs (163 up and 371 downregulated). (a) Top 10 upand downregulated genes in the ‘control’ signature. (b) Functional annotation and pathways analysis reveal significant enrichments inpathways and processes related to cell cycle, spliceosomes, JNK, CD28 and GnRH signaling, and muscarinic cholinergic receptors (ACM/ACM3)-related pathways with most transcripts downregulated in MCR. Bars indicate fold up and downregulation of genes. A ‘positive’ FC indicates anupregulation and a ‘negative’ FC indicates a downregulation of genes in HLA-MCR as compared with HLA-UMCR individuals.
Figure 5. Identification of a ‘protection’ signature in HLA-matched controls (MCRs). (a) The venn diagram shows an overlap of 158 DEGsbetween the ‘control’ (534 DEGs) and ‘disease’ signatures (902 DEGs). (b) Principle components analysis (PCA) of a subset of 155 genes out ofthe 158 overlapping DEGs reveals distinct spatial separation (expression level clustering) in 13 PV-A (blue), 8 PV-R (green) and 6 UMCR (purple),away from 4 MCR (red). The ellipsoids highlight portioning of the different samples. In this three-dimensional plot, the three principlecomponents PC#1, #2 and #3 of the samples and their respective variations are expressed on the x, y and z axis. The total percentage of PCAmapping variability (78%) is shown on top.
Genome-wide expression analysis in Pemphigus vulgaris
R Dey-Rao et al
6
Genes and Immunity (2013) 1 – 13 & 2013 Macmillan Publishers Limited

derived from the total RNA of selective active and remittent PVpatients and HLA-matched and HLA-unmatched healthy controls(classified in the exact same manner as the initial set of test samples).
The trend of relative FCs in gene expression from quantitativereverse transcription PCR was consistent with our microarrayfindings (Supplementary Table 7). Although the extent of FCsvaried to a degree between the quantitative reverse transcriptionPCR and microarray results, the directionality of the differentialexpression patterns was the same in all cases, supporting thereliability of the microarray analysis. A representative example ofthe results for PTPN22 is shown in Supplementary Figure 1.
PV-associated DEGs overlap with previous microarray studies
We next compared DEGs associated with the ‘disease,’ ‘activity,’‘control’ and ‘protection’ signatures to previously publishedPV-related global gene expression signatures in patients andin vitro. The most comparable study was the microarray validationanalysis by Sarig et al., who reported 175 DEGs comparing ninenewly diagnosed (untreated) PV patients with nine age- andpopulation-MCR individuals. Thirteen DEGs (mostly upregulated)in the ‘disease’ and six DEGs (all upregulated) in the ‘activity’signatures reported in our study are common to the Sarig et al.study28 (Supplementary Table S8A and B). One DEG, GAS7(Growth-arrest specific 7), overlapped between the ‘protection’signature and the microarray analysis of the Sarig et al. studywhere it was upregulated in patients vs controls. In our study,GAS7 was also upregulated in PV patients as well as in UMCRwhen compared with MCR. We also found four dysregulatedgenes, CD33 (‘activity’ signature), DSC2 (‘activity’ signature), CTSB(‘disease’ signature) and USP34 (‘disease’ signature), which over-lapped with three earlier, in vitro microarray studies, which wereperformed by exposing either human or murine keratinocytes toPV patient serum.29–31
Mapping of DEGs to the genome
To better understand the distribution of PV-associated dysregu-lated genes across the genome, we leveraged our gene expressiondata to identify transcriptional ‘hot spots’ at which the DEGs mapwith statistically increased frequency than would be expected bychance using the ‘genome’ tool within the dCHIP software. Allsignificant gene stretches with X4DEGs at p1% false discoveryrate (FDR) level were designated as ‘hot spots’. Seven ‘hot spots’were found within the ‘disease’ signature: 2p16.1-p13.1, 4q13.2-q22.1, 9p11.2-q21.13, 11q14.3-q22, 14q21.3-q23.1, 15q14-q21.1and 22q11.1-q12.3. Six transcriptional ‘hot spots’ associated withthe ‘activity’ signature were found on chromosomes 1q21.1-q23.3,7q21.1, 11q12.2-q13.5, 19p13.3, 21q22.11-q22.3 and 22q12.2-13.2.Mapping of the 652 DEGs within the ‘control’ signature revealedfour significant dysregulated gene stretches on chromosomes3p14.3, 6p25.2-p21.1, 10q11.1-q11.23 and 16p13.3-p11.2(Supplementary Figure 2). No ‘hot spots’ were associated atp1% FDR level with the 155 DEGs of the ‘protection’ signature.However, when the criteria of inclusion were changed to p5%FDR, two significant gene stretches with X3DEGs were observedon chromosomes 3p14.3 and 14q21.2-q24.1. Although 60 DEGsacross the four PV-associated signatures map to chromosome X
Figure 6. Hierarchical clustering of ‘protection’ signature wasprocessed using the Euclidean distance algorithm in PartekGenomic Suite. In the heat map, red indicates upregulation whileblue indicates downregulation and gray indicates no change. Thesamples cluster into HLA-matched controls (MCR¼ red) and PVpatients and HLA-unmatched controls (PV-Aþ PV-RþUMCR¼ teal).Two distinct clusters of genes are observed: (1) a group of 132genes, which are downregulated in MCR when compared with PV-Aþ PV-RþUMCR and (2) a group of 23 genes upregulated in MCRwhen compared with PV-Aþ PV-RþUMCR. Expression value inten-sities are illustrated by the color of the scale with a range of � 4 toþ 4 on a log scale.
Genome-wide expression analysis in Pemphigus vulgaris
R Dey-Rao et al
7
& 2013 Macmillan Publishers Limited Genes and Immunity (2013) 1 – 13

(none mapped to chromosome Y), no transcriptional ‘hot spot’was found.Overall, 183 DEGs were included in the 19 ‘hot spots’ across the
four PV-related signatures (Table 2). Three of these, OSM (‘activity’signature), OLIG1 (‘activity’ signature) and USP34 (‘disease’signature), overlapped with previously reported PV-relatedDEGs.28,29 We also uncovered one dysregulated gene, GPD1L(Chr3p22.3) (‘disease’ signature), upregulated in PV patients vsHLA-MCRs, which did not map to any ‘hot spot’, but coincidedwith a recently reported potential non-HLA disease susceptibilitygene.28
DISCUSSION
The varied incidence of PV across populations, strong associationwith HLA class II subtypes and recent identification of putativedisease susceptibility genes provide strong support for a geneticbasis for PV.10,32–35 The heterogeneous nature of the diseasemakes it necessary to use multivariate techniques in an attempt tomake associations between clinical observations and underlyingmolecular and genetic perturbations. Unbiased analysis ofmicroarray data from peripheral blood of PV patients andcontrol subjects produced unique gene signatures in our study,thus revealing a method for molecular classification of patientsthrough ‘class prediction’ (categorizing samples by disease state).The ‘disease’ signature clearly distinguishes PV patients fromgenetically related HLA-MCRs, a contrast with the potential todelineate gene markers relevant to disease induction. The ‘activity’signature separates active from remittent stages of disease, andgenes within this signature may be important for understandingdisease progression and prognosis and for identifying biomarkersto monitor treatment success in reverting patients to a lesion-free state. The PV HLA-related ‘control’ signature distinguisheshealthy individuals that type as HLA DRB1*0402 and/orDQB1*0503 positive (HLA matched) from those that do not (HLA
unmatched). The unanticipated identification of a subset ofDEGs that overlaps between the ‘control’ and the ‘disease’signature, but based on opposite directionality of regulationseparates HLA-MCRs from both HLA-unmatched healthyindividuals as well as active and remittent PV patients–termedthe ‘protection’ signature here–represents an example of ‘classdiscovery’ whereby molecular methods reveal a previouslyunknown classification.Functional annotation and pathway analysis of the DEGs in the
PV-associated ‘disease’ and ‘activity’ transcriptional signaturesunderscore dysregulated genes and pathways significant togenetic susceptibility, induction, expression and progression ofthe disease. The G-protein signaling pathway, which includesRhoA, p38MAPK and JNK enriched in the ‘disease’ signature, isassociated with triggering apoptosis and acantholysis in keratino-cytes.36–40 The kinases in the MAPK pathway, relevant to adaptiveimmunity, respond to external stimuli (mitogens, stress and pro-inflammatory cytokines). Activation of signaling through bothprotein kinase C isoforms and MAPK has been proposed to initiateacantholytic changes by affecting changes in desmosomes as wellas reorganization in the cytoskeleton.15,29,37,38,41 The large number(42 DEGs) of generic/protein kinases and phosphatases found is ofsignificance because phosphorylation and dephosphorylationof key effector molecules and adhesion complexes by them andphosphatases have been suggested to have a major role inacantholysis.42 Alterations in the actin cytoskeleton constitute oneof the major processes proposed to be involved in PV-IgG-inducedkeratinocyte dissociation. The relevance of these changes inperipheral blood remains to be interpreted. Overall, thetranscriptional data within the ‘disease’ signature represent astep forward in delineating diagnostic markers relevant to PV andprovide insights into mechanisms relevant to diseasedevelopment. The large number of DEGs between patients andcontrols emphasizes the clinical heterogeneity and multifactorialnature of PV.
Table 2. Chromosomal locations of all 183 dysregulated genes mapping within 19 transcriptional ‘hot spots’ across PV-associated gene expression
signatures
Signatures Chromosomeregion
#Genes Gene symbol
‘Disease’ 2p16.1-p13.1 12 ANTXR1, MOBKL1B, MPHOSPH10, PELI1, MXD1, VPS54, PNO1, ELP1P, PPP3R1, USP34, MTIF2, PAPOLG4q13-q22.1 23 GRSF1, UBA6, YTHDC1, MOBKL1A, MTHFD2L, RUFY3, FGF5, HERC3, SLC4A4, G3BP2, GDEP, MRPL1,
NAA11, SCD5, THAP9, COQ2, HELQ, MRPS18C, ADH4, EIF4E, PDLIMS9p11.2-q21.13 19 LOC100240734, CHMP5, GNE, UBAP2, ELAVL2, PLAA, TOPORS, C9orf72, SMARCA2, KLF9, LOC572558,
TJP2, GNAQ, ZCCHC6, C9orf71, FXN, LOC203274, MGC21881, FAM108B111q14.3-q22 8 FAT3, CEP57, ENDOD1, FAM76B, FUT4, SLC36A4, KIAA1826, MTMR214q21-q23.1 11 MGAT2, PELI2, C14orf106, KLHL28, ATP5S, SDCCAG1, GMFB, MUDENG, MAX, JKAMP, SAV115q14-q21.1 10 NANOG, FAM98B, SNAP23, IVD, PDIA3, EIF2AK4, ZFP106, LRRC57, MYO5A, PLDN22q11.1-q12.3 10 FLJ39632, IL17RA /// LOC100506204, C22orf37,C22orf39, SNAP29, POM121L9P, GGT1, ADRBK2,
GAS2L1, LIMK2‘Activity’ 1q21.1-q23.3 8 PRKAB2, CTSS, ANKRD20A1 /// ANKRD20A2 /// ANKRD20A3 /// ANKRD20A4 /// ANKRD20B ///
LOC375010, ADAM15, SNX27, SEMA4A, CD1C, CD2447q22.1-7q22.1 4 AP1S1, PILRA, ZNF3, TRIM411q12.1-q13.5 11 MS4A6A, CATSPER1, FADS1, ASRGL1, DPP3, ALDH3B1, YIF1A, CLPB, KCNE3, C11orf30, PAK119p13.3 4 CFD, C19orf6, POLR2E, MIDN21q21.1-q22.3 9 C21orf45, OLIG1, KCNJ15, CSTB, NDUFV3, PDXK, SLC19A1, WDR4, C21orf5622q12.2-13.2 9 OSM, SIRPA, CSF2RB, MPST, NCF4, NPTXR, TST, NFAM1, RRP7A
‘Control’ 3p14.3 5 CCDC66, PXK, APPL1, ARHGEF3, PDHB6p25.2-p21.1 16 GLP1R, C6orf130, ENPP4, KIAA0240, TIGD1L, TRIM15, RPP21 /// TRIM39 /// TRIM39R, HIST1H2BK,
HIST1H2AG, MRS2, KIF13A, EEF1E1, CDYL, LYRM4, WRNIP1, CNPY310q11.23-q11 7 CSTF2T, SYT15, FAM21A /// FAM21B /// FAM21C /// FAM21D, NCOA4, LOC220980, ZNF488,
LOC10013308916p13.3-p11.2 15 LYRM1, FLJ21408, ACSM5, C16orf45, C16orf63, MPV17L, SHISA9, CARHSP1, C16orf91, FAHD1, HMOX2,
ZNF200, PRSS33, ZNF598, PIGQ‘Protection’ 3p14.3 3 ARHGEF3, APPL1, PXK
14q21.2-q24.1 7 C14orf106, ATP5S, SAV1, JKAMP, MAX, VTI1B, RDH11
Abbreviation: PV, Pemphigus vulgaris. DEGs in bold overlapped with previously reported PV-related transcripts.
Genome-wide expression analysis in Pemphigus vulgaris
R Dey-Rao et al
8
Genes and Immunity (2013) 1 – 13 & 2013 Macmillan Publishers Limited

In the ‘activity’ signature, we observed an overall upregulation oftranscripts associated with immune mechanisms, inflammatoryprocesses, G-protein signaling pathways, oxidation reduction andapoptosis that are emphasized in patients with heightened clinicalactivity as compared with those in a quiescent phase of disease.These data establish molecular classification of defined PV clinicalstates and suggests potential prognostic markers for disease flares.The observed enrichment of the NOD-like receptor signalingpathway with four DEGs (PYCARD, NOD2, IL18 and CARD9) reflectsan activated immune system in PV patients with active lesions. Theupregulation of 19 DEGs in the enriched oxidation-reductionprocess may indicate enhanced oxidative stress on-going at thesystemic level during phases of increased lesional activity.Interestingly, our group has recently found a statistically significantdecrease in total antioxidant capacity in serum from PV patients vscontrol individuals (manuscript in preparation). Finally, theobserved upregulation of transcripts in the RAC1-associatedG-protein signaling pathway reflects an involvement in cyto-skeleton remodeling and cell polarity,43–45 which are majorprocesses involved in PV-IgG-induced keratinocyte dissociation.Within the PV HLA ‘control’ signature, we found six dysregu-
lated genes in the muscarinic cholinergic receptors, ACM/ACM3-related pathways. The cholinergic system has been shown tomodulate intercellular adhesion by targeting cadherins andintegrins,46,47 and it has been reported that acantholysis inpemphigus can occur because of anti-acetylcholine receptorantibodies in keratinocyte monolayer.48–50 The significantenrichment of the KEGG pathway ‘spliceosomes’ with eightDEGs was noteworthy due to an autoimmune response againstessential components within the spliceosomes that is associatedwith rheumatoid arthritis and systemic lupus erythematous.51
Most interestingly, of the 158 overlapping DEGs found betweenthe ‘disease’ and ‘control’ signatures, a subset of 155 wereregulated in the opposite direction in MCR when compared witheither all PV patients or UMCR. Both PCA analysis and hierarchicalclustering revealed that this set of 155 genes distinguished MCRfrom all PV patients (PV-Aþ PV-R) as well as UMCR. We proposethat this set of 155 genes may constitute a ‘protection’ signaturerelevant to preventing the expression of PV in MCR individualsthat carry the highly disease-linked HLA risk alleles DRB1*0402 andDQB1*0503. The dysregulated pathways and processes enrichedamong this subset of 155 DEGs are related to G-protein signaling,immune response, apoptosis, cell cycle regulation, keratinocytedifferentiation, cell adhesion and inflammation, among otherswhich are central to PV pathogenesis.15,36,45,52–54
Within the ‘protection’ signature, several transcripts such asARHGEF3, IL13RA1, SMAD2, PTPN22 and CNPY3 have been shownto have a role in inflammatory and autoimmune diseases. Thesefive molecules are highlighted as examples of genes whoseupregulation may contribute to operational pathways in PV andother autoimmune diseases, and whose downregulation in MCRwhether compared with PV patients or UMCR may indicate aprotective mechanism in genetically susceptible but symptom-free individuals. Moreover, IL13RA1, OGFRL1 (opioid growth factorreceptor-like 1) and CNPY3 were found to overlap between the‘protection’ and ‘activity’ signatures and found to be down-regulated in MCR when compared with either all PV patients orUMCR as well as downregulated in remittent PV patients whencompared with active PV patients. This may suggest a role ofIL13RA1, OGFRL1 and CNPY3 in both disease protection and inprevention of lesional activity. Studies using larger cohorts ofpatients and healthy controls involving immunohistopathology,analysis of serum protein levels and mechanistic studiesare needed to validate our results and the existence of the‘protection’ pattern. For DEGs within the ‘disease,’ ‘activity,’‘control’ and ‘protection’ signatures with previously describedrelevance to PV and/or other autoimmune/inflammatory diseasessee Supplementary Table 6.
The case for disease relevance of specific genes and pathwaysmay be strengthened for genes that are dysregulated acrossanalyses. There are four DEGs which overlap all four signatures(IL13RA1, KIF13A, OGFRL1 and CNPY3) and are involved inimmune response, B-cell proliferation and IL-13/IL-4 signalingpathway in inflammation. Furthermore, genes that are dysregu-lated across studies may be particularly relevant for diseasepathogenesis. Thirteen DEGs (ACSL1, PTGS1, CA2, F5, PFKFB3,FAM198B, GADD45A, GAS7, GPR27, IL1R2, IRAK3, OLIG1 and PDK4)were found common between the ‘disease’ signature reportedhere and recent microarray-based transcriptional data by Sariget al.,28 and are involved in enriched pathways and networksassociated with apoptosis, inflammatory and innate immuneresponse, supporting their role in PV pathogenesis.15,17 Sixcommon DEGs were found between the ‘activity’ signaturereported here and the Sarig et al. study,28 namely, OSM, CES1,CKAP4, DSC2, SLC11A1 and OLIG1. These genes were upregulatedin active patients in both studies and are involved in pathwaysand networks associated with immune response, phagocytosis,cell adhesion and cell junctions.It has been demonstrated that genes that are highly
transcriptionally dysregulated are likely to be altered at the DNAlevel.55 It can be expected that in at least some casestranscriptional variance observed in disease represent thedownstream functional consequences of disease-associatedgenetic variations. Chen et al.55 proposed using gene expressiondata to influence the prioritization of target candidate genes forsingle-nucleotide polymorphism in genome-wide associationstudies. As such, we transposed our transcriptional data set ontothe physical genome map and identified 19 transcriptional ‘hotspots’ representing a total of 183 DEGs associated with the fourPV-related signatures described in this report. Functionalannotation and pathway analysis of the 183 ‘hot spots’-relatedDEGs revealed significant associations with PV-related pathways,processes and networks such as apoptosis, cytoskeletalremodeling, immune and inflammatory response, as well asmale sex differentiation. Three of these ‘hot spots’-related DEGs(OSM, OLIG1 and USP34) were identified in earlier microarrayanalyses in PV.28,29 In addition, GPD1L (glycerol-3-phosphatedehydrogenase 1-like; FC¼ 2.1) was the one DEG commonbetween our study (‘disease’ signature) and a suspected non-major histocompatibility complex susceptibility locus in PV.28
A defect in GPD1L has been associated with various forms ofinherited arrhythmia.56 None of the other recently reported35
putative non-major histocompatibility complex susceptibility lociin Israeli Jewish PV patients were found to be transcriptionallydysregulated in our study. Transcriptional ‘hot spots’ identified inthis study may house as yet unknown PV susceptibility loci. Thecandidates identified from this study may help to inform futureresearch to identify individuals predisposed to PV. For moreinformation on the DEGs with putative roles in either PV and/orother autoimmune/inflammatory diseases, see SupplementaryTable 6.In conclusion, the analyses presented here advance efforts to
better understand the molecular and genetic basis of autoimmu-nity in the skin. PV is a polygenic and multifactorial disease. Thereasons for a breach of immunological tolerance are not knownbut may involve environmental/infectious trigger factors inaddition to genetic factors and immune dysregulation. Currentknowledge suggests a working model for PV where self (or crossreaction foreign)-antigen is presented in the context of majorhistocompatibility complex class II molecules to CD4þ T cells,which then activate antigen-specific B cells to produce skin-specific autoantibodies. Autoantibodies target epidermal antigens(mainly desmoglein 3, and in some cases desmoglein 1) to causethe classic disease pathology (acantholysis, suprabasal split of theepidermis, blister formation and erosions) by mechanisms not yetfully understood. The genes and pathways revealed by genome-
Genome-wide expression analysis in Pemphigus vulgaris
R Dey-Rao et al
9
& 2013 Macmillan Publishers Limited Genes and Immunity (2013) 1 – 13

wide expression analysis lend support to the steps along thisputative disease pathway, revealing dysregulation in innate andadaptive immune processes, responses to viral and bacterialmolecules, leukocyte and B-cell activation, and cytokine/chemo-kine/stress pathway activation, and further illuminate additionalgenes and functional pathways with potential relevance to disease(Figure 7). The role of apoptosis in PV is unresolved to date, butrecent data indicate that apoptotic signaling pathways may beactivated in the skin after antibody binding.16 How thesephenomena relate to the dysregulation of apoptotic moleculesin the blood revealed by this study remains to be determined. Thediscovery of specific transcriptional profiles or ‘signatures’assigned to clearly defined patient and control subgroups hasclinical relevance to disease classification and provides insightsinto disease mechanisms and genetic susceptibility. Extendedmicroarray analysis in larger data sets and further defined clinicalsubgroups will be needed to validate the expression patternsdescribed in this report and identify actionable biomarkers andgenetic risk elements with direct utility, perhaps incorporatinglongitudinal study design. Most significantly, our finding that a setof disease-associated genes is downregulated in HLA-matchedindividuals as compared with either PV patients or UMCR subjectssuggests the novel and provocative hypothesis that this signatureserves a protective function in genetically susceptible individualsand may harbor targets that could be potentially manipulated tothwart, or even reverse, disease.
MATERIALS AND METHODS
Patient recruitment and tissue handling
The study was approved by the Institutional Review Boards of WeillMedical College of Cornell University/New York Hospital (IRB 0998-398)and Michigan State University (IRB 05–1034). Subjects diagnosed with PVbased on established clinical, histological and immunological criteria wererecruited through local patient support group meetings, and theDermatology outpatient clinics at New York Hospital and Michigan StateUniversity. Informed consent was obtained from all study subjects beforeblood was collected. In total, 31 samples of blood from 13 PV patients with
active disease (PV-A) showing the presence of non-transient mucosal orcutaneous lesions at the time of blood draw and 8 PV patients in remission(PV-R) with the absence of non-transient mucosal or cutaneous lesions atthe time of draw,11 4 healthy control individuals who carry the PV-associated HLA DRB1*0402 and/or DQB1*0503 risk alleles (‘matched’controls; MCR) and 6 healthy control individuals not associated with theHLA risk alleles (‘unmatched’ controls; UMCR) were used for geneexpression analysis. The 21 PV patients included in the analysis werefurther classified as being either off (OFF), on minimal (MIN) or more thanminimal (MORE MIN) therapy (Supplementary Table 9) according topreviously published consensus guidelines.11 Minimal therapy (MIN) isdefined as less than, or equal to, 10mg per day of prednisone (or theequivalent) and/or minimal adjuvant therapy for at least 2 months. ‘OFF’therapy is defined as being off all systemic therapy for at least 2 months.Demographic information, duration of disease and treatment history
were obtained from each subject at the time of sampling. The PV patientgroup consisted of 15 females and 6 males (2.5:1 ratio). The female/maleratio was maintained in the healthy control group with seven females andthree males (2.3:1 ratio). The average age of the PV patients was 48.9 years(±10.3) and that of the controls was 44.9 years (±11.7). There were 25Caucasians, 1 Asian, 2 African Americans and 3 individuals of Hispanicorigin included in the study. Full study subject information is provided inSupplementary Table 9.Ficoll gradients (Amersham Biosciences, Piscataway, NJ, USA) were used
to extract peripheral blood mononuclear cells from collected bloodsamples. Specimens were immediately frozen at � 80 1C immediately forsubsequent RNA extraction (see below).
HLA typing
HLA allele typing at DRB and DQB loci was completed at the Tissue Typinglaboratory of Michigan State University, by PCR amplification usingsequence-specific primers as described by Olerup and Zetterquist.57
Patients and controls were grouped into ‘HLA matched’ (either homo- orheterozygous expression of the PV-associated alleles DRB1*0402 and/orDQB1*0503)34 or ‘HLA unmatched’ (expressing any other HLA class II allelesthan DRB1*0402 and DQB1*0503; see Supplementary Table 9).
RNA extraction
Procedures for RNA extractions and cDNA synthesis were followed asdescribed before.5,58 Briefly, total RNA was isolated from peripheral blood
Figure 7. A schematic representation of the disease process in PV supported by some of the differentially expressed genes (DEGs) andpathways revealed by microarray analysis. DEGs from the ‘disease’ signature are listed in black, whereas DEGs from the ‘activity’ signature arelisted in red.
Genome-wide expression analysis in Pemphigus vulgaris
R Dey-Rao et al
10
Genes and Immunity (2013) 1 – 13 & 2013 Macmillan Publishers Limited

mononuclear cells using TRIzol reagent (Invitrogen Corporation, Carlsbad,CA, USA) following the manufacturer’s instructions. Purification of RNA wasachieved using an RNeasy Mini kit (Qiagen Inc., Valencia, CA, USA). RNAquality was checked by using an RNA Pico Chip with an Agilent 2100Bioanalyzer (Agilent Technologies Inc., Santa Clara, CA, USA) and quantifiedby fiber optic spectrophotometry by Nanodrop ND-1000 (ThermoScientific, Wilmington, DE, USA) yielding both an A260/A280 absorbanceratio greater than 2.0 and a 28s/18s rRNA ratio equal to or exceeding 1.8.Purified RNA was stored at � 80 1C up to 30 days before starting theamplification step. Sixteen micrograms of total RNA from each sample wasused to synthesize the cDNA template.
Microarray analysis
Fragmented biotinylated cDNA were hybridized to Human Genome U133Plus 2.0 microarray chips (Affymetrix Inc.) for 16 h at 45 1C. The chips werethen washed, stained and scanned according to manufacturer’s protocol(Affymetrix Inc.) on the Affymetrix Fluidics Station 750, and scanned by theAffymetrix GeneChip Scanner 3000. The HG-U133 Plus 2.0 gene chipcomprises 1 300 000 unique oligonucleotide features representing morethan 47 000 transcripts representing approximately 39 000 well-character-ized human genes
Microarray data analysis
The Human Genome U133 Plus 2.0 microarray platform was used togenerate gene expression profiles from blood samples obtained from atotal of 31 patients and controls. Initially, MAS5 statistical algorithm wasused for probe set summarization using the Affymetrix Expression Consolesoftware to assess the data quality of all 31 samples through a set ofquality control indicators. No outliers were identified. Gene expression datawere then imported to Partek Genomics Suite v6.6 (Partek, St Louis, MO,USA) as CEL files using default parameters. Robust multiarray averageanalysis was used to perform raw data preprocessing, which included log2transformation, quantile normalization, background correction and medianpolish probe set summarization. Average expression levels were distrib-uted similarly across all samples.
Unsupervised clustering of variable genes
Unsupervised hierarchical clustering was performed on the most variablelog2 transformed, background corrected and normalized expression valuesusing a flat include cut-off filter of Coefficient of variation (CV)X0.2 acrossall 31 samples. To study the effect of therapy status on unsupervisedclustering of variable genes in the PV-Aþ PV-RþMCR sample group, thehierarchical cluster was overlaid with known therapy status. We used PCAon the three signatures discovered by unsupervised hierarchical clusteringto check for outliers and to observe specific batch effects based on diseasestate (PV-active and remittent) and controls (matched and unmatched).Both these unsupervised methods do not consider known sampleattributes such as disease activity, state or therapy status while organizingthe data. We superimposed sample information using color coding.
DEGs and pathway analysis
In the three signatures (‘disease’, ‘activity’ and ‘control’) clearly separatedby unsupervised hierarchical clustering, DEGs were detected using one-way analysis of variance model, implemented in Partek Genomics Suitealong with Fisher’s Least Significant Difference contrast method used tocompare two groups of samples. FC cut-off was 4±2.0 for the ‘disease’signature, and 4±1.5 for ‘activity’ and ‘control’ signatures. The P-valuesgenerated by the comparisons were then corrected using a BenjaminiHochberg59 (step-up) false discovery rate of 1% and 2% for ‘disease’ and‘control’ signatures, respectively, or selected with an uncorrected P-valueof o0.05 for the ‘activity’ signature.Trimmed DEG lists (removing duplicates) with gene symbols were
matched to GO molecular functions, biological processes, cellularcomponents and KEGG pathways via DAVID (http://david.niaid.nih.gov),60
as well as GeneGO network objects, pathway maps, processes andnetworks via Metacore v6.9 tool (GeneGo Inc., Thomson Reuters, St Jospeh,MI, USA; http://www.genego.com).61 The statistical significance ofpathways, processes and networks was calculated using theHypergeometric test where the null hypothesis assumes that nodifference exists between the numbers of genes in a given pathway inthe target DEG list and the genome as a whole. A list of enrichedannotations and pathways with P-value less than 0.05 and including at
least two to five genes were included. We used a comparative enrichmentworkflow in MetaCore for the DEG list generated from comparing PV-Aþ PV-R vs MCR (‘disease’ signature) with MCR vs UMCR (‘control’signature) and compared all four signatures with each other as well.We analyzed each of DEG lists for chromosomal enrichments by
leveraging our gene expression data to identify regions of the chromo-somes with a statistically significant proportion of DEGs, to detecttranscriptional ‘hot spots’. The DEGs in each list generated were analyzedin the context of all genes on the array for its chromosomal locationenrichment using DNA-Chip Analyzer (dCHIP; www.dchip.org). Duplicateprobe sets were masked for gene mapping using the ‘genome’ tool.
Confirmation of microarray results using quantitative reversetranscription PCR
Total RNA from human (patients and controls) blood was made using thePAXgene Blood RNA Kit (Qiagen Inc.) according to manufacturer’srecommended protocol including DNase treatment. RNA was quantifiedby fiber optic spectrophotometry by Nanodrop ND-1000 (ThermoScientific, Wilmington, DE, USA) and an A260/A280 absorbance ratio X2.0was taken as inclusion criteria.We used an entirely new set of PV patients and healthy controls
(classified as PV-active, PV-remittent patients, as well as HLA-matched andHLA-unmatched healthy controls, in the same manner as in the initial testset of samples) for this analysis. cDNA was synthesized from 400 ng totalRNA using the Promega Kit (Promega Corp., Madison, WI, USA) andquantitative real-time PCR was subsequently carried out using the FastStartUniversal SYBR Green Master (ROX) from Roche (Roche Diagnostics,Mannheim, Germany) according to carefully standardized protocols.Intron-spanning primers were designed using Primer3 v4.0 (http://primer3.wi.mit.edu/) for the following selected DEGs: THAP1, PTPN22(‘protection’), TLR4, IL1R2 (‘disease’), PLEKHA1 (‘activity’) and VNN1(‘control’) based on published human gene sequences in the EnsembleGenome Browser (http://useast.ensembl.org/index.html). Amplicons weredesigned to be less than 150 bp in most cases. Reactions were run intriplicates from PV-Aþ PV-R (n¼ 4), MCR (n¼ 3) and UMCR (n¼ 2), and theexperiments repeated twice. The resulting reverse transcription-PCR cycletimes were normalized against the b-actin (ACTB) housekeeping gene andFCs in expression were calculated using the 2�DDCT method62 relative toone sample of the control taken as unity. The resulting relative FCs in geneexpression were compared with those obtained by microarray analysis.
CONFLICT OF INTEREST
The authors declare no conflict of interest.
ACKNOWLEDGEMENTS
We are grateful for resources provided by The Research Technology Support Facility
and the Genomics Core at Michigan State University. We thank Venice Cercado for
technical assistance in extracting RNA and performing the microarray studies. Finally,
we thank the study participants without whom this study would not have been
possible.
REFERENCES
1 Gupta VK, Kelbel TE, Nguyen D, Melonakos KC, Murrell DF, Xie Y et al. A globally
available internet-based patient survey of pemphigus vulgaris: epidemiology and
disease characteristics. Dermatol Clin 2011; 29: 393–404.
2 Langan SM, Smeeth L, Hubbard R, Fleming KM, Smith CJ, West J. Bullous
pemphigoid and pemphigus vulgaris--incidence and mortality in the UK: popu-
lation based cohort study. BMJ 2008; 337: a180.
3 Bystryn JC, Rudolph JL. Pemphigus. Lancet 2005; 366: 61–73.
4 Sinha AA. The genetics of pemphigus. Dermatol Clin 2011; 29: 381–391.
5 Coda AB, Qafalijaj Hysa V, Seiffert-Sinha K, Sinha AA. Peripheral blood gene
expression in alopecia areata reveals molecular pathways distinguishing herit-
ability, disease and severity. Genes Immunity 2010; 11: 531–541.
6 Kunz M. DNA microarray technology in dermatology. Semin Cutan Med Surg 2008;
27: 16–24.
7 Oertelt S, Selmi C, Invernizzi P, Podda M, Gershwin ME. Genes and goals:
an approach to microarray analysis in autoimmunity. Autoimmunity Rev 2005; 4:
414–422.
Genome-wide expression analysis in Pemphigus vulgaris
R Dey-Rao et al
11
& 2013 Macmillan Publishers Limited Genes and Immunity (2013) 1 – 13
8 Orban T, Kis J, Szereday L, Engelmann P, Farkas K, Jalahej H et al. Reduced CD4þ
T-cell-specific gene expression in human type 1 diabetes mellitus. J Autoimmun
2007; 28: 177–187.
9 Fossey SC, Vnencak-Jones CL, Olsen NJ, Sriram S, Garrison G, Deng X et al.
Identification of molecular biomarkers for multiple sclerosis. J Mol Diagn 2007; 9:
197–204.
10 Sinha AA, Lopez MT, McDevitt HO. Autoimmune diseases: the failure of self
tolerance. Science 1990; 248: 1380–1388.
11 Murrell DF, Dick S, Ahmed AR, Amagai M, Barnadas MA, Borradori L et al. Con-
sensus statement on definitions of disease, end points, and therapeutic response
for pemphigus. J Am Acad Dermatol 2008; 58: 1043–1046.
12 Rizzo C, Fotino M, Zhang Y, Chow S, Spizuoco A, Sinha AA. Direct characterization
of human T cells in pemphigus vulgaris reveals elevated autoantigen-specific
Th2 activity in association with active disease. Clin Exper Dermatol 2005; 30:
535–540.
13 Ouyang W, Kolls JK, Zheng Y. The biological functions of T helper 17 cell effector
cytokines in inflammation. Immunity 2008; 28: 454–467.
14 Paunovic V, Carroll HP, Vandenbroeck K, Gadina M. Signalling, inflammation and
arthritis: crossed signals: the role of interleukin (IL)-12, -17, -23 and -27 in auto-
immunity. Rheumatology (Oxford) 2008; 47: 771–776.
15 Grando SA, Bystryn JC, Chernyavsky AI, Frusic-Zlotkin M, Gniadecki R, Lotti R et al.
Apoptolysis: a novel mechanism of skin blistering in pemphigus vulgaris linking
the apoptotic pathways to basal cell shrinkage and suprabasal acantholysis. Exp
Dermatol 2009; 18: 764–770.
16 Bektas M, Jolly P, Rubenstein DS. Apoptotic pathways in pemphigus. Dermatol Res
Practice 2010; 2010: 456841.
17 Grando SA, Glukhenky BT, Drannik GN, Epshtein EV, Kostromin AP, Korostash TA.
Mediators of inflammation in blister fluids from patients with pemphigus vulgaris
and bullous pemphigoid. Arch Dermatol 1989; 125: 925–930.
18 Takahashi H, Kouno M, Nagao K, Wada N, Hata T, Nishimoto S et al. Desmoglein 3-
specific CD4þ T cells induce pemphigus vulgaris and interface dermatitis in
mice. J Clin Invest 2011; 121: 3677–3688.
19 Bystryn JC, Grando S. The cause of acantholysis in pemphigus: further support for
the ’basal cell shrinkage’ hypothesis. Br J Dermatol 2009; 161: 702.
20 Lotti R, Marconi A, Pincelli C. Apoptotic pathways in the pathogenesis
of pemphigus: targets for new therapies. Curr Pharm Biotechnol 2012; 13:
1877–1881.
21 Majore S, Biolcati G, Barboni L, Cannistraci C, Binni F, Crisi A et al. ATP2C1 gene
mutation analysis in Italian patients with Hailey-Hailey disease. J Invest Dermatol
2005; 125: 933–935.
22 Kalantari-Dehaghi M, Anhalt GJ, Camilleri MJ, Chernyavsky AI, Chun S, Felgner PL
et al. Pemphigus vulgaris autoantibody profiling by proteomic technique.
PLoS One 2013; 8: e57587.
23 Kitajima Y. Mechanisms of desmosome assembly and disassembly. Clin Exp
Dermatol 2002; 27: 684–690.
24 Steinhusen U, Weiske J, Badock V, Tauber R, Bommert K, Huber O. Cleavage and
shedding of E-cadherin after induction of apoptosis. J Biol Chem 2001; 276:
4972–4980.
25 Dusek RL, Getsios S, Chen F, Park JK, Amargo EV, Cryns VL et al. The differentia-
tion-dependent desmosomal cadherin desmoglein 1 is a novel caspase-3 target
that regulates apoptosis in keratinocytes. J Biol Chem 2006; 281: 3614–3624.
26 Amagai M. Pemphigus as a paradigm of autoimmunity and cell adhesion. Keio J
Med 2002; 51: 133–139.
27 Ellebrecht CT, Srinivas G, Bieber K, Banczyk D, Kinzel S, Kalies K et al. Microbial
diversity and cutaneous inflammation are predictive for the clinical course
of experimental epidermolysis bullosa acquisita. J Invest Dermatol 2013; 133
(Supplement 1): S21.
28 Sarig O, Bercovici S, Zoller L, Goldberg I, Indelman M, Nahum S et al. Population-
specific association between a polymorphic variant in ST18, encoding a pro-
apoptotic molecule, and pemphigus vulgaris. J Invest Dermatol 2012; 132:
1798–1805.
29 Lanza A, Cirillo N, Rossiello R, Rienzo M, Cutillo L, Casamassimi A et al. Evidence of
key role of Cdk2 overexpression in pemphigus vulgaris. J Biol Chem 2008; 283:
8736–8745.
30 Cirillo N, Lanza M, Rossiello L, Gombos F, Lanza A. Defining the involvement of
proteinases in pemphigus vulgaris: evidence of matrix metalloproteinase-9
overexpression in experimental models of disease. J Cell Physiol 2007; 212: 36–41.
31 Nguyen VT, Arredondo J, Chernyavsky AI, Kitajima Y, Pittelkow M, Grando SA.
Pemphigus vulgaris IgG and methylprednisolone exhibit reciprocal effects on
keratinocytes. J Biol Chem 2004; 279: 2135–2146.
32 Sinha AA, Brautbar C, Szafer F, Friedmann A, Tzfoni E, Todd JA et al. A newly
characterized HLA DQ beta allele associated with pemphigus vulgaris. Science
1988; 239: 1026–1029.
33 Tron F, Gilbert D, Mouquet H, Joly P, Drouot L, Makni S et al. Genetic factors in
pemphigus. J Autoimmun 2005; 24: 319–328.
34 Lee E, Lendas KA, Chow S, Pirani Y, Gordon D, Dionisio R et al. Disease relevant
HLA class II alleles isolated by genotypic, haplotypic, and sequence analysis in
North American Caucasians with pemphigus vulgaris. Hum Immunol 2006; 67:
125–139.
35 Sarig O, Vodo D, Rosser Sea. A GWAS analysis identifies non-HLA genes within the
MHC locus as associated with pemphigus vulgaris. J Invest Dermatol 2013;
133(Supplement 1): s34.
36 Waschke J, Spindler V, Bruggeman P, Zillikens D, Schmidt G, Drenckhahn D.
Inhibition of Rho A activity causes pemphigus skin blistering. J Cell Biol 2006; 175:
721–727.
37 Berkowitz P, Hu P, Warren S, Liu Z, Diaz LA, Rubenstein DS. p38MAPK inhibition
prevents disease in pemphigus vulgaris mice. Proc Natl Acad Sci USA 2006; 103:
12855–12860.
38 Jolly PS, Berkowitz P, Bektas M, Lee HE, Chua M, Diaz LA et al. p38MAPK signaling
and desmoglein-3 internalization are linked events in pemphigus acantholysis. J
Biol Chem 2010; 285: 8936–8941.
39 Marchenko S, Chernyavsky AI, Arredondo J, Gindi V, Grando SA. Antimitochondrial
autoantibodies in pemphigus vulgaris: a missing link in disease pathophysiology.
J Biol Chem 2010; 285: 3695–3704.
40 Spindler V, Drenckhahn D, Zillikens D, Waschke J. Pemphigus IgG causes skin
splitting in the presence of both desmoglein 1 and desmoglein 3. Am J Pathol
2007; 171: 906–916.
41 Williamson L, Raess NA, Caldelari R, Zakher A, de Bruin A, Posthaus H et al.
Pemphigus vulgaris identifies plakoglobin as key suppressor of c-Myc in the skin.
EMBO J 2006; 25: 3298–3309.
42 Chernyavsky AI, Arredondo J, Piser T, Karlsson E, Grando SA. Differential coupling
of M1 muscarinic and alpha7 nicotinic receptors to inhibition of pemphigus
acantholysis. J Biol Chem 2008; 283: 3401–3408.
43 Moon SY, Zheng Y. Rho GTPase-activating proteins in cell regulation. Trends Cell
Biol 2003; 13: 13–22.
44 Jaffe AB, Hall A. Rho GTPases: biochemistry and biology. Annu Rev Cell Dev Biol
2005; 21: 247–269.
45 Best A, Ahmed S, Kozma R, Lim L. The Ras-related GTPase Rac1 binds tubulin. J
Biol Chem 1996; 271: 3756–3762.
46 Fania L, Zampetti A, Guerriero G, Feliciani C. Alteration of cholinergic system in
keratinocites cells produces acantholysis: a possible use of cholinergic drugs in
Pemphigus Vulgaris. Anti-inflamm Anti-allergy Agents Med Chem 2012; 11:
238–242.
47 Chernyavsky AI, Nguyen VT, Arredondo J, Ndoye A, Zia S, Wess J et al. The M4
muscarinic receptor-selective effects on keratinocyte crawling locomotion. Life Sci
2003; 72: 2069–2073.
48 Grando SA. Pemphigus in the XXI century: new life to an old story. Autoimmunity
2006; 39: 521–530.
49 Nguyen VT, Ndoye A, Grando SA. Novel human alpha9 acetylcholine receptor
regulating keratinocyte adhesion is targeted by Pemphigus vulgaris auto-
immunity. Am J Pathol 2000; 157: 1377–1391.
50 Grando SA. Pemphigus autoimmunity: hypotheses and realities. Autoimmunity
2012; 45: 7–35.
51 Hassfeld W, Steiner G, Studnicka-Benke A, Skriner K, Graninger W, Fischer I et al.
Autoimmune response to the spliceosome. An immunologic link between rheu-
matoid arthritis, mixed connective tissue disease, and systemic lupus erythema-
tosus. Arthritis Rheum 1995; 38: 777–785.
52 Gliem M, Heupel WM, Spindler V, Harms GS, Waschke J. Actin reorganization
contributes to loss of cell adhesion in pemphigus vulgaris. Am J Physiol Cell Physiol
2010; 299: C606–C613.
53 Zhang L, Deng M, Parthasarathy R, Wang L, Mongan M, Molkentin JD et al. MEKK1
transduces activin signals in keratinocytes to induce actin stress fiber formation
and migration. Mol Cell Biol 2005; 25: 60–65.
54 Zanet J, Freije A, Ruiz M, Coulon V, Sanz JR, Chiesa J et al. A mitosis block links
active cell cycle with human epidermal differentiation and results in endor-
eplication. PLoS One 2010; 5: e15701.
55 Chen R, Morgan AA, Dudley J, Deshpande T, Li L, Kodama K et al. FitSNPs: highly
differentially expressed genes are more likely to have variants associated with
disease. Genome Biol 2008; 9: R170.
56 London B, Michalec M, Mehdi H, Zhu X, Kerchner L, Sanyal S et al. Mutation
in glycerol-3-phosphate dehydrogenase 1 like gene (GPD1-L) decreases cardiac
Naþ current and causes inherited arrhythmias. Circulation 2007; 116: 2260–2268.
57 Olerup O, Zetterquist H. HLA-DR typing by PCR amplification with sequence-
specific primers (PCR-SSP) in 2 hours: an alternative to serological DR typing in
clinical practice including donor-recipient matching in cadaveric transplantation.
Tissue Antigens 1992; 39: 225–235.
58 Coda AB, Icen M, Smith JR, Sinha AA. Global transcriptional analysis of psoriatic
skin and blood confirms known disease-associated pathways and highlights
novel genomic ‘hot spots’ for differentially expressed genes. Genomics 2012; 100:
18–26.
Genome-wide expression analysis in Pemphigus vulgaris
R Dey-Rao et al
12
Genes and Immunity (2013) 1 – 13 & 2013 Macmillan Publishers Limited

59 Benjamini Y. Controlling the False DIscovery Rate: a practical and powerful
approach to multiple testing. J R Stat Soc Series B 1995; 57: 289–300.
60 Huang da W, Sherman BT, Tan Q, Kir J, Liu D, Bryant D et al. DAVID Bioinformatics
Resources: expanded annotation database and novel algorithms to better
extract biology from large gene lists. Nucleic Acids Res 2007; 35: Web Server issue
W169–W175.
61 Shmelkov E, Tang Z, Aifantis I, Statnikov A. Assessing quality and completeness of
human transcriptional regulatory pathways on a genome-wide scale. Biol Direct
2011; 6: 15.
62 Livak KJ, Schmittgen TD. Analysis of relative gene expression data using
real-time quantitative PCR and the 2(-Delta Delta C(T)) Method. Methods 2001; 25:
402–408.
Supplementary Information accompanies this paper on Genes and Immunity website (http://www.nature.com/gene)
Genome-wide expression analysis in Pemphigus vulgaris
R Dey-Rao et al
13
& 2013 Macmillan Publishers Limited Genes and Immunity (2013) 1 – 13