
Vascular risk factors, incidence of MCI, and rates of progression to dementia
10
Vascular risk factors, incidence of MCI, and rates of progression to dementia V. Solfrizzi, MD, PhD; F. Panza, MD, PhD; A.M. Colacicco, PhD; A. D’Introno, PhD; C. Capurso, MD, PhD; F. Torres, MD; F. Grigoletto, ScD; S. Maggi, MD; A. Del Parigi, MD; E.M. Reiman, MD; R.J. Caselli, MD; E. Scafato, MD; G. Farchi, MSc; and A. Capurso, MD, for the Italian Longitudinal Study on Aging Working Group* Abstract—Objective: To estimate prevalence, incidence, and rate of progression of mild cognitive impairment (MCI) to dementia and correlated vascular risk factors with incident MCI and its progression to dementia. Methods: The authors evaluated 2,963 individuals from the population-based sample of 5,632 subjects 65 to 84 years old, at the first (1992 to 1993) and second survey (1995 to 1996) of the Italian Longitudinal Study on Aging (ILSA), with a 3.5-year follow-up. Dementia, Alzheimer disease (AD), vascular dementia (VaD), other types of dementia, and MCI were classified using current clinical criteria. Results: Among the 2,963 participants, 139 MCI patients were diagnosed at the first ILSA survey. During the 3.5-year follow-up, 113 new events of MCI were diagnosed with an estimated incidence rate of 21.5 per 1,000 person-years. We found a progression rate to dementia (all causes) of 3.8/100 person-years. Specific progression rates for AD, VaD, and other types of dementia were 2.3, 1.3, and 0.3/100 person-years. Furthermore, age was a risk factor for incident MCI (RR: 5.93, 95% CI: 3.17 to 11.10), while education was protective (RR: 0.06, 95% CI: 0.03 to 0.10), and serum total cholesterol evidenced a borderline nonsignificant trend for a protective effect. There was a nonsignificant trend for stroke as a risk factor of progression of MCI to dementia. Conclusions: In this population, among those who progressed to dementia, 60% progressed to AD and 33% to VaD. Vascular risk factors influence incident mild cognitive impairment and the rate of progression to dementia. NEUROLOGY 2004;63:1882–1891 Mild cognitive impairment (MCI) describes nonde- mented aged persons with mild memory or cognitive impairment that may be an early stage of Alzheimer disease (AD), but that otherwise cannot be accounted for by another specific medical or psychiatric condition. 1-3 The terms age-related cognitive decline (ARCD) 4 and aging-associated cognitive decline (AACD) 5 have been proposed for physiologic decline in cognitive functioning associated with the aging process. MCI is assumed to be pathology-based and therefore necessitating interventions, while ARCD and AACD are generally considered a phenomenon of normal aging, not requiring treatment. A 2001 consensus conference on MCI proposed three subsets of MCI including amnestic MCI (aMCI), multiple do- mains slightly impaired MCI (mdMCI), and single non-memory domain MCI. 6 MCI may be a prodromal phase of dementia, with estimated rates of conversion to dementia of 12% in 1 year, 1,6 20% over 3 years, 7 and 50% at 5 years. 1 The epidemiology of MCI, however, has not been thor- oughly investigated. Existing prevalence and inci- dence data are inconsistent because of different operational criteria, sampling, and assessment pro- cedures. 8 Furthermore, vascular risk factors, such as hypertension, smoking, cerebrovascular disease, dia- betes mellitus, and atrial fibrillation, are also associ- ated with late-life cognitive decline, 9-12 and so may influence the development of MCI and dementia. Be- cause such vascular risk factors may be modifiable, identification and subsequent management of these possible risk factors may be crucial for prevention of MCI and dementia. 13 We sought to estimate the prevalence and inci- dence of MCI, the rate of progression of MCI to de- mentia, and the role of vascular risk factors for incident MCI, and its progression to dementia. Methods. Participants. The subjects of this study were en- rolled in a larger study, the Italian Longitudinal Study on Aging (ILSA), promoted by the Italian National Research Council— *Members of the Italian Longitudinal Study on Aging Working Group are listed in the Appendix on page 1890. From the Department of Geriatrics (Drs. Solfrizzi, Panza, Colacicco, D’Introno, C. Capurso, Torres, and A. Capurso), Center for Aging Brain, Memory Unit, University of Bari, Italy; Department of Geriatrics (Dr. C. Capurso), University of Foggia, Italy; Institute of Hygiene (Dr. Grigoletto), University of Padua, Italy; National Research Council of Italy (Dr. Maggi), CNR, Center on Aging, Padua; National Institutes of Health, National Institute of Diabetes and Digestive and Kidney Diseases (Dr. Del Parigi), Phoenix, AZ; Department of Psychiatry (Dr. Reiman), University of Arizona, Tucson; Department of Neurology (Dr. Caselli), Mayo Clinic, Scottsdale, AZ; and Laboratory of Epidemiology and Biostatistics (Dr. Scafato and G. Farchi), Istituto Superiore di Sanità, Rome, Italy. Supported by Italian Longitudinal Study on Aging (ILSA) (Italian National Research Council—CNR–Targeted Project on Ageing—Grants 9400419PF40 and 95973PF40) and AFORIGE (“Associazione per la FOrmazione e la RIcerca in Geriatria”). F.P., A.M.C., and C.C. participate in the PhD: “Carcinogenesis, Ageing, and Immunoregulation,” supported by the European Union. Received April 19, 2004. Accepted in final form July 22, 2004. Address correspondence and reprint requests to Dr. Vincenzo Solfrizzi, Department of Geriatrics, Center for Aging Brain, Memory Unit, University of Bari Policlinico, Piazza Giulio Cesare, 11-70124 Bari, Italy; e-mail: [email protected] 1882 Copyright © 2004 by AAN Enterprises, Inc.
Transcript of Vascular risk factors, incidence of MCI, and rates of progression to dementia

Vascular risk factors, incidence of MCI,and rates of progression to dementia
V. Solfrizzi, MD, PhD; F. Panza, MD, PhD; A.M. Colacicco, PhD; A. D’Introno, PhD; C. Capurso, MD, PhD;F. Torres, MD; F. Grigoletto, ScD; S. Maggi, MD; A. Del Parigi, MD; E.M. Reiman, MD;
R.J. Caselli, MD; E. Scafato, MD; G. Farchi, MSc; and A. Capurso, MD,for the Italian Longitudinal Study on Aging Working Group*
Abstract—Objective: To estimate prevalence, incidence, and rate of progression of mild cognitive impairment (MCI) todementia and correlated vascular risk factors with incident MCI and its progression to dementia. Methods: The authorsevaluated 2,963 individuals from the population-based sample of 5,632 subjects 65 to 84 years old, at the first (1992 to1993) and second survey (1995 to 1996) of the Italian Longitudinal Study on Aging (ILSA), with a 3.5-year follow-up.Dementia, Alzheimer disease (AD), vascular dementia (VaD), other types of dementia, and MCI were classified usingcurrent clinical criteria. Results: Among the 2,963 participants, 139 MCI patients were diagnosed at the first ILSA survey.During the 3.5-year follow-up, 113 new events of MCI were diagnosed with an estimated incidence rate of 21.5 per 1,000person-years. We found a progression rate to dementia (all causes) of 3.8/100 person-years. Specific progression rates forAD, VaD, and other types of dementia were 2.3, 1.3, and 0.3/100 person-years. Furthermore, age was a risk factor forincident MCI (RR: 5.93, 95% CI: 3.17 to 11.10), while education was protective (RR: 0.06, 95% CI: 0.03 to 0.10), and serumtotal cholesterol evidenced a borderline nonsignificant trend for a protective effect. There was a nonsignificant trend forstroke as a risk factor of progression of MCI to dementia. Conclusions: In this population, among those who progressed todementia, 60% progressed to AD and 33% to VaD. Vascular risk factors influence incident mild cognitive impairment andthe rate of progression to dementia.
NEUROLOGY 2004;63:1882–1891
Mild cognitive impairment (MCI) describes nonde-mented aged persons with mild memory or cognitiveimpairment that may be an early stage of Alzheimerdisease (AD), but that otherwise cannot be accountedfor by another specific medical or psychiatriccondition.1-3 The terms age-related cognitive decline(ARCD)4 and aging-associated cognitive decline(AACD)5 have been proposed for physiologic declinein cognitive functioning associated with the agingprocess. MCI is assumed to be pathology-based andtherefore necessitating interventions, while ARCDand AACD are generally considered a phenomenonof normal aging, not requiring treatment. A 2001consensus conference on MCI proposed three subsetsof MCI including amnestic MCI (aMCI), multiple do-mains slightly impaired MCI (mdMCI), and singlenon-memory domain MCI.6
MCI may be a prodromal phase of dementia, withestimated rates of conversion to dementia of 12% in1 year,1,6 20% over 3 years,7 and 50% at 5 years.1 The
epidemiology of MCI, however, has not been thor-oughly investigated. Existing prevalence and inci-dence data are inconsistent because of differentoperational criteria, sampling, and assessment pro-cedures.8 Furthermore, vascular risk factors, such ashypertension, smoking, cerebrovascular disease, dia-betes mellitus, and atrial fibrillation, are also associ-ated with late-life cognitive decline,9-12 and so mayinfluence the development of MCI and dementia. Be-cause such vascular risk factors may be modifiable,identification and subsequent management of thesepossible risk factors may be crucial for prevention ofMCI and dementia.13
We sought to estimate the prevalence and inci-dence of MCI, the rate of progression of MCI to de-mentia, and the role of vascular risk factors forincident MCI, and its progression to dementia.
Methods. Participants. The subjects of this study were en-rolled in a larger study, the Italian Longitudinal Study on Aging(ILSA), promoted by the Italian National Research Council—
*Members of the Italian Longitudinal Study on Aging Working Group are listed in the Appendix on page 1890.From the Department of Geriatrics (Drs. Solfrizzi, Panza, Colacicco, D’Introno, C. Capurso, Torres, and A. Capurso), Center for Aging Brain, Memory Unit,University of Bari, Italy; Department of Geriatrics (Dr. C. Capurso), University of Foggia, Italy; Institute of Hygiene (Dr. Grigoletto), University of Padua,Italy; National Research Council of Italy (Dr. Maggi), CNR, Center on Aging, Padua; National Institutes of Health, National Institute of Diabetes andDigestive and Kidney Diseases (Dr. Del Parigi), Phoenix, AZ; Department of Psychiatry (Dr. Reiman), University of Arizona, Tucson; Department ofNeurology (Dr. Caselli), Mayo Clinic, Scottsdale, AZ; and Laboratory of Epidemiology and Biostatistics (Dr. Scafato and G. Farchi), Istituto Superiore diSanità, Rome, Italy.Supported by Italian Longitudinal Study on Aging (ILSA) (Italian National Research Council—CNR–Targeted Project on Ageing—Grants 9400419PF40 and95973PF40) and AFORIGE (“Associazione per la FOrmazione e la RIcerca in Geriatria”). F.P., A.M.C., and C.C. participate in the PhD: “Carcinogenesis,Ageing, and Immunoregulation,” supported by the European Union.Received April 19, 2004. Accepted in final form July 22, 2004.Address correspondence and reprint requests to Dr. Vincenzo Solfrizzi, Department of Geriatrics, Center for Aging Brain, Memory Unit, University of BariPoliclinico, Piazza Giulio Cesare, 11-70124 Bari, Italy; e-mail: [email protected]
1882 Copyright © 2004 by AAN Enterprises, Inc.

CNR–Targeted Project on Aging. The methods of ILSA data collec-tion have been described in detail elsewhere.14-16 A sample of 5,632subjects 65 to 84 years old, independent or institutionalized, wasrandomly selected from the electoral rolls of eight municipalities(Genoa, Segrate [Milan], Selvazzano-Rubano [Padua], Impruneta[Florence], Fermo [Ascoli-Piceno], Naples, Casamassima [Bari],and Catania) after stratification for age and sex. In each studycenter, 88 men and 88 women for each of four age classes (65 to69, 70 to 74, 75 to 79, and 80 to 84 years) were selected. Informedconsent was obtained from all subjects according to local institu-tional guidelines. Data were obtained from the first prevalencesurvey study between March 1992 and June 1993 (prevalence day:March 1, 1992), and from the second prevalence survey studybetween September 1995 and October 1996 (prevalence day: Sep-tember 1, 1995).
Clinical, demographic, and laboratory examination. Cases ofcoronary artery disease (myocardial infarction and angina pecto-ris) (CAD), hypertension, type two diabetes mellitus, and strokewere identified with a two-phase procedure.14 In Phase 1, eachsubject was administered a screening questionnaire, a series ofbrief screening tests to identify suspect cases for further investiga-tion, and clinical evaluation; in Phase 2, suspected cases wereconfirmed with a standardized clinical examination by a certifiedgeriatrician, neurologist, or internist. The screening questionnaireincluded information on demographic characteristics, weight andweight history, smoking habits, and current use of medications(including inspection of the drugs by the interviewer). Laboratorydeterminations (including blood glucose for possible diabetes mel-litus) and other diagnostic tests (including EKG for possible myo-cardial infarction and arrhythmia) were also performed. CADcases included patients who had survived a myocardial infarctionor had a confirmed diagnosis of angina pectoris. The diagnosis ofmyocardial infarction was based on the criteria of the ARICStudy17: those who screened positive after Phase 1 (Rose Question-naire,18 self reported diagnosis, or diagnostic computerized electro-cardiography) underwent a clinical evaluation by a trainedinternist or geriatrician, to determine the final diagnosis. In thissecond phase, a review of clinical records was performed. The finalconfirmation of the diagnosis was obtained by a diagnostic EKG, adocumented hospital discharge diagnosis, or a physician diagnosisof myocardial infarction. The criteria for diagnosis of angina pec-toris were adopted in part from the Cardiovascular HealthStudy.19 Phase 1 consisted of a self-reported diagnosis, a treat-ment with nitrates, beta-blockers, or calcium-channel blockers,coronary artery bypass surgery, or a positive Rose questionnaire.Phase 2 consisted of a review of clinical records (coronary arteriog-raphy showing � 70% obstruction of any coronary artery, or STdepression � 1 mm on exercise testing), with the final confirma-tion of the diagnosis by the participant’s physician and by theclinical evaluation of the ILSA internist or geriatrician. The crite-ria for diagnosis of type two diabetes mellitus were adopted fromthe WHO Expert Committee on Diabetes.20 The screening phaseconsisted of a self-reported diagnosis (diagnosis by a physician ormedical treatment), or of a fasting plasma glucose level �7.8mmol/L, on at least two separate days. Phase 2 consisted of reviewof clinical records with confirmation of the diagnosis. The diagno-sis of hypertension fulfilled the criteria of the 1988 Report of theJoint National Committee on Detection, Evaluation, and Treat-ment of High Blood Pressure21 and was based on a screeningphase with either a self-reported diagnosis or medical treatmentor a recorded mean diastolic value �90 mm Hg or a systolic value�140 mm Hg. The values used in the analyses were the mean ofthe last two of three sitting blood pressure measurements per-formed. Phase 2 consisted of a review of clinical records and afurther blood pressure measurement with confirmation of the di-agnosis. The screening phase (Phase 1) of suspected stroke wasbased on a comprehensive interview in order to identify any pre-vious diagnosis and possible stroke symptoms. Screening wascompleted by an abbreviated neurologic examination. In caseswith a positive questionnaire or neurologic abnormalities, a certi-fied neurologist or geriatrician performed a complete neurologicexamination and reviewed medical records. Stroke was definedaccording to the WHO criteria.22 Both first-ever and recurrentstrokes were considered, while transient ischemic attacks werenot included. Demographic variables were selected from a compre-hensive set of measures gathered at the time of the first preva-lence survey. Blood samples were obtained following a 13-hour
overnight fast; serum total cholesterol (TC) and high-density li-poprotein cholesterol (HDL-C) concentrations were determined asreported in detail elsewhere.23 Based on self-reports, smoking hab-its were categorized as “ever” or “never,” and the variable “pack-years cigarettes” (years smoked * usual number of cigarettessmoked per day/20 cigarettes per pack) was generated to repre-sent the total smoking exposure.
Neuropsychological and functional variables. Mini-MentalState Examination (MMSE)24 was used to evaluate global cogni-tive function (orientation, attention, immediate and delayed ver-bal memory, constructional praxis, and language). Episodicmemory was tested with the Babcock Story Recall Test (BSRT)(score ranging from 0 to 16).25,26 This test measures immediate anddelayed recall, using a 21-unit story. For the purpose of scoring,an event-weighted, hierarchical system was used, based upon thedegree of organization of the recollection provided by the subject.Selective attention was assessed by the Digit Cancellation Test(DCT) (score ranging from 0 to 60).25 This test has a basic formatwith three different matrices made up of 13 strings of 10 digits(zero to nine in random sequence), each line including up to fivetargets. Digits are required to be crossed out within a time limit(45 seconds/matrix).
Functional status was assessed with the Activities of DailyLiving scale (ADL) (scores ranging from 6 [all functions preserved]to 18 [all functions lost]), which determines the level of indepen-dence in six activities: bathing, dressing, toileting, transferringfrom bed to chair, continence, and feeding.27 Ability in home man-agement was assessed by the Instrumental Activities of DailyLiving scale (IADL) (scores ranging from 8 [all functions pre-served] to 31 [all functions lost]), which determines the level ofindependence in executing tasks such as using the telephone,shopping for personal items, preparing meals, doing light house-work (e.g., washing dishes), managing money or drugs, and soforth.28
Classification of dementia and MCI. Criteria for entry in thisstudy included absence of brain tumors, cerebrovascular malfor-mations, psychosis, epilepsy, multiple sclerosis, stage III syphilis,dementia, and any active neuropsychiatric condition producingdisability. Subjects were considered normal even if they were us-ing psychoactive medications but subjects taking neuroleptic med-ications were excluded.
The case finding strategy for the diagnosis of dementia con-sisted of a two-phase procedure as reported in detail elsewhere.15
All participants were administered an extensive risk factor inter-view and a screening test battery; those who screened positiveunderwent a clinical evaluation by a trained neurologist, andthose with a confirmed diagnosis of dementia were excluded. Themain screening criteria for cognitive impairment or dementiawere the MMSE with a cutoff score of 23, or a previous diagnosisreported by the respondent proxy. The MMSE has been previouslyvalidated in each of the eight study centers against the Diagnosticand Statistical Manual of Mental Disorders (DSM)–III-R29 clinicaldiagnosis of dementia; the cut-off point of 23 has a sensitivity of95% and a specificity of 90%.30 The structured clinical assessmentperformed by a neurologist consisted of a review of clinicalrecords, a neurologic examination, sections B and H of the Cam-bridge Mental Disorders Examination (CAMDEX),31 the PfefferFunctional activities questionnaire,32 and the Hamilton Depres-sion Rating Scale.33 The diagnosis was based on the DSM-III-Rcriteria for dementia syndrome,29 the National Institute of Neuro-logical and Communicative Disorders and Stroke–Alzheimer’sDisease and Related Disorders Association criteria for possibleand probable AD,34 and the ICD-10 criteria for vascular dementia(VaD) and other dementing diseases.35
Several recent studies have suggested that the subjectivememory impairment criterion for MCI is of questionable addi-tional predictive value for the conversion to dementia.36,37 Further-more, subjects classified as having MCI could have visual,auditory, or skeletal muscle disabilities impairing their ADLs, inthe absence of functionally disabling cognitive impairment.38 Fi-nally, in very early stages of cognitive impairment we may haveevidence of subtle but important changes in everyday functionalcompetence.37-39 Therefore, while we generally adhered to the diag-nostic criteria for MCI as defined by Petersen et al.,1,6 we did notrequire subjective memory impairment, and we allowed for thepresence of noncognitive disabilities and comorbid illnesses. Weretroactively applied these criteria to the data collected in this
November (2 of 2) 2004 NEUROLOGY 63 1883

study between 1992 and 1995: 1) no dementia; 2) normal generalcognitive functioning as assessed by MMSE using age and educa-tion based norms (this cutoff was calculated by subtracting 1.5 SDfrom the mean age- and education-adjusted MMSE scores afterexcluding subjects with prevalent dementia). Elderly subjectswith MMSE adjusted scores greater than this cutoff were consid-ered normal in terms of general cognitive functioning; 3) objectiveevidence of memory impairment as assessed by a total BRST score(immediate plus delayed recall) in the lowest 10th percentile ofthe distribution of age- and education-adjusted scores after exclu-sion of prevalent dementia at entry; and 4) independence in thebasic activities of daily living, as measured by ADL. Therefore, ourinclusion criteria to assess the functional status of MCI subjectsincluded the following: 1) subjects with no functional impairment(ADL � 6); 2) subjects who were slightly impaired (ADL � 7 or 8)but with no IADL impairment; 3) subjects with visual, auditory, orskeletal muscle (i.e., stroke) disabilities compromising ADL, butnot cognitive skills; 4) subjects with ADL impaired by comorbidillnesses (presence of two or more diseases).
Statistical analysis. MCI prevalence, incidence, and rate ofprogression to dementia estimates. The prevalence estimates ofMCI were based on baseline data collected in 1992 to 1993. Apoststratification adjustment by age, sex, and educational levelwas used to make the sample consistent with the populationrepresented.
Age groups were defined based on the age at entry in theprevalence study. To determine the incidence rate of MCI, theonset of memory loss was defined according to the caregiver’sreport. Subjects at risk were followed up for approximately 3.5years. Elderly subjects were excluded from the denominator ofMCI prevalence rates (n � 1,439) because of one of the followingreasons: 1) they were classified as MCI at entry (n � 139); 2) theyscored �1.5 SD of the average MMSE age- and education-adjustedscores but were not demented (n � 96); 3) they exhibited objectivememory impairment (within the first decile of age- and education-adjusted categories of BSRT) associated with dependence in ADL(i.e., ADL score was �6 and IADL �8 or IADL score was �8 [anyfunction impaired] and ADL score was � 8) (n � 41); and 4) theycould not be classified because of missing data (n � 1,163) (1,001subjects did not perform neuropsychological tests, and 162 sub-jects did not complete the study protocol). Incidence rates werecomputed using the person-years method, according to age group,sex, and educational level. Progression of MCI to dementia, AD,VaD, and other types of dementia was determined by comparingfollow-up with baseline data.
Risk factors predicting MCI and rate of progression to demen-tia. Differences between incident MCI patients and normal sub-jects were assessed by a �2 test for frequencies and a two-tailedt-test for unpaired data, except for pack-years cigarettes (Mann-Whitney test). Considering the relatively few events that wereobserved over a 3.5-year follow-up and the outcomes (MCI and allcauses of dementia) being discrete counts, we chose the Poissonregression method to assess risk factors for these pathologies. Thetime scale, such as age, was divided into bands and was includedin the regression model in such a way that the observation timefor each subject was split between the bands.40
Risk and protective factor estimates were evaluated by Poissonregression models because of the small number of events of inter-est compared to the large number of subjects who were screened.In particular, considering the extremely small number of patients,exact confidence intervals for the Poisson model were evaluatedby the Proc-LogXact procedure of the SAS Institute (Cary, NC).Age (coded 0 for 65- to 74-year-old and 1 for 75- to 84-year-oldsubjects), educational level (coded 0 for �3 years and 1 for �3years) (3 years of education was the first quartile of the incidenceMCI sample and the median value of the progression to dementiasample), sex (coded 0 for female and 1 for male), pack-years ciga-rettes (coded 0 for pack-years cigarettes � 0 [never smoking], and1 for pack-years cigarettes �0.5) were assessed as categoricalvariables while TC and HDL-C serum levels were categorized inquartiles. According to Mickey and Greenland we used the p value�0.25 to select candidate variables for the multivariate model.41
The univariate Poisson models were used to describe the rela-tionships between new events of MCI for normal subjects and newevents of dementia for MCI subjects and several possible riskfactors. These relationships were controlled for covariates thatcould be either effect modifiers or confounders. This has been
performed in a hierarchical way, starting with the highest-orderinteraction terms, deleting no significant terms, and combiningparameters that do not differ significantly. Finally, confoundingeffects without the use of statistical testing were evaluated, fol-lowed by consideration for validity and precision. The threshold ofsignificance was set at p � 0.05.
Results. MCI prevalence estimates. Sociodemographicand clinical characteristics (mean � SD or %) of normalsubjects and MCI patients are shown in table 1. Out of the5,632 elderly subjects enrolled in the cohort in 1992, 4,521agreed to participate. The figure shows sample size andattrition according to the criteria for MCI, diagnosed in139 of 2,963 (3.2%) subjects. Differences in age (73.4 � 5.6vs 75.2 � 5.7, p � 0.01 evaluated by separate variance ttest) and sex (Pearson �2 � 34.16, p � 0.01) were observedbetween participants and nonparticipants (2,963 partici-pants: 1,589 [56.4%] men and 1,374 [48.8%] women; 2,669nonparticipants: 1,227 [43.6%] men and 1,442 [51.2%]women). The prevalence of MCI increased with class of age(Mantel-Haenszel estimate, OR 3.27, 95% CI 2.80 to 3.81),was lower in the more educated (Mantel-Haenszel esti-mate, OR 0.04, 95% CI 0.02 to 0.07), and not different
Table 1 Demographic and clinical characteristics [mean � SD orn (%)] of normal subjects and mild cognitive impairment (MCI)patients, Italian Longitudinal Study on Aging, 1st prevalencesurvey, 1992–1993
Variable
Normalsubjects,
n � 1,445*MCI,
n � 121† p
Age, y 71.8 � 5.0 80.7 � 2.5 0.001‡
Education, y 7.1 � 4.7 2.2 � 1.3 0.001‡
Women 815 (56.4) 61 (50.4) 0.25§
Mini-Mental StateExamination
26.4 � 3.6 21.5 � 4.3 0.001‡
Babcock Story RecallTest
9.9 � 4.2 6.5 � 4.5 0.001‡
Activities of daily living 6.7 � 1.6 7.4 � 2.5 0.001‡
Instrumental activitiesof daily living
9.1 � 4.6 11.7 � 5.5 0.001‡
Hypertension 997 (69.0) 82 (67.8) 0.90§
Coronary artery disease 249 (12.2) 16 (13.2) 0.35§
Stroke 82 (5.7) 11 (9.1) 0.20§
Type two diabetesmellitus
140 (9.7) 15 (12.4) 0.75§
Pack-years cigarettes 17.6 � 26.6 12.2 � 25.6 0.001�
(25th, 50th, 75thpercentiles)
(0, 0, 2.3) (0, 0, 11.4)
Total cholesterol, mg/dL(mmol/L)
221.1 � 40.9(5.7 � 1.1)
204.8 � 45.4(5.3 � 1.2)
0.001‡
HDL cholesterol, mg/dL(mmol/L)
49.0 � 11.2(1.3 � 0.3)
1.3 � 0.3(48.4 � 10.6)
0.60‡
* Normal subjects who underwent the laboratory assessment.† MCI patients who underwent the laboratory assessment.‡ Student’s t-test for unpaired data.§ Pearson’s chi-squared.� Mann-Whitney U test.
HDL � high-density lipoprotein.
1884 NEUROLOGY 63 November (2 of 2) 2004

between women and men (Mantel-Haenszel estimate, OR0.84, 95% CI 0.60 to 1.19) (table 2). Also, the total preva-lence rate increased according to age by educational level(Mantel-Haenszel estimate, OR 2.76, 95% CI 2.32 to 3.28,for �3 educational level; Mantel-Haenszel estimate, OR4.64, 95% CI 2.85 to 3.56, for �3 educational level), but nodifferences by sex were observed (see table 2).
MCI incidence estimates. Differences in age (subjectsincluded in the denominator for incidence rate: 71.9 � 5.0vs excluded subjects: 75.1 � 5.7; p � 0.01 evaluated byseparate variance t test), sex (subjects included in the de-nominator for incidence rate: 663 women and 861 men vsexcluded subjects: 710 women and 729 men; Pearson �2 �
10.14, p � 0.01), education (subjects included in the de-nominator for incidence rate: 7.0 � 4.7 years vs excludedsubjects: 5.4 � 4.3 years; p � 0.01 evaluated by separatevariance t test), and MMSE score (age- and education-adjusted MMSE score for subjects included in the denomi-nator for incidence rate 26.51 � 2.15 vs excluded subjects25.25 � 2.15, p � 0.01, evaluated by separate variance ttest) were reported between the 1,524 subjects included inthe denominator for incidence rate and the 1,439 subjectsexcluded. As reported in Methods, a sample of 1,524 sub-jects was used to determine the incidence of MCI, out ofthe 2,963 subjects who were included in the prevalencestudy. During the 3.5-year follow-up, 113 new events ofMCI were diagnosed with an estimated incidence rate of21.5 per 1,000 person-years. The incidence rates increasedwith age, age by sex, and age by educational level (table 3).In particular, the global incidence rates showed that men(19.1/1,000 person-years) did not exhibit a lower risk ofMCI than women (24.5/1,000 person-years) (RR 0.76, 95%CI 0.5 to 1.1), nor was there a lower risk for men by age (65to 69 years: RR 0.65, 95% CI 0.14 to 2.89; 70 to 74 years:RR 0.41, 95% CI 0.15 to 1.13; 75 to 79 years: RR 0.72, 95%CI 0.44 to 1.16; 80 to 84 years: RR 1.39, 95% CI 0.61 to3.14). Furthermore, subjects with �3 years of education(4.6/1,000) exhibited a lower risk of MCI than those with alower educational level (80.9/1,000 person-years) (RR 27.1,95% CI 14.2 to 51.7). This difference was also observed insingle age classes (75 to 79 years: RR 51.3, 95% CI 16.1 to163.4; 80 to 84 years: RR 4.7, 95% CI 2.1 to 10.5) (see table 3).
Rate of progression of prevalent MCI to dementia. Age-specific rates of progression to dementia, AD, VaD, andother types of dementia are summarized in table 4. Therewas no effect of age on these progression rates (dementia:RR 0.6, 95% CI 0.2 to 1.9; AD: RR 0.6, 95% CI 0.2 to 2.6;VaD: RR 0.5, 95% CI 0.1 to 2.9). Furthermore, at follow-upout of the 124 cases of MCI who did not progress to demen-tia, 24 cases still met criteria for MCI, 6 cases furtherdeclined but they were not classified as demented, 23 died,27 cases improved, 1 case moved, and 43 cases refusedsecond examination.
Risk factors predicting incident MCI and rate of progres-sion of MCI to dementia. In order to evaluate risk factorspredicting incident MCI, 79 subjects were excluded (8 newevents of MCI and 1 new event of dementia) because theyrefused blood sampling. This subgroup was older than thesample for risk factors evaluation of incident MCI (1,445subjects): 73.2 � 5.0 years vs 71.8 � 5.0 years, separatevariance t test 2.5, p � 0.016. Results of univariate andmultivariate Poisson regression analysis are reported in
Figure. Attrition of the study population at the differentphases of the survey, Italian Longitudinal Study on Ag-ing, first prevalence survey, 1992–1993. MMSE � Mini-Mental State Examination; BSRT � Babcock Story RecallTest; ADL � Activities of Daily Living scale; MCI � mildcognitive impairment.
Table 2 Prevalence rates (95% CI) of mild cognitive impairment, according to age classes, sex, and educational level, ItalianLongitudinal Study on Aging, 1st survey, 1992–1993
Age class, y
Sex Educational level
Total rate, n � 2,963Men, n � 1,590 Women, n � 1,373 �3 y, n � 876 �3 y, n � 2,087
65–69 0.0 0.0 0.0 0.0 0.0
70–74 0.0 0.0 0.0 0.0 0.0
75–79 4.8 (2.6–7.0) 6.6 (4.0–9.3) 15.4 (10.9–19.8) 0.0 5.9 (4.1–7.6)
80–84 16.2 (12.2–20.3) 18.0 (13.3–22.8) 34.9 (28.7–41.2) 4.3 (2.0–6.6) 17.2 (14.0–20.4)
Total 2.6 (1.9–3.2) 3.7 (2.9–4.6) 10.3 (8.5–12.2) 0.4 (0.2–0.6) 3.2 (2.6–3.7)
November (2 of 2) 2004 NEUROLOGY 63 1885
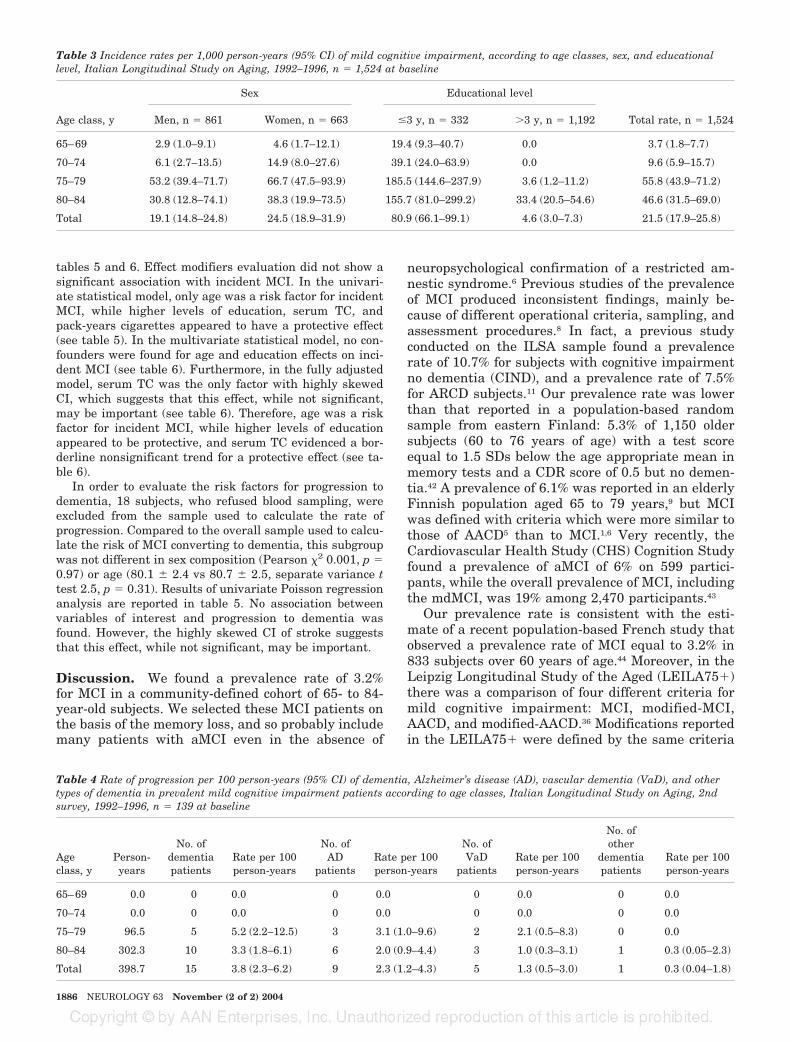
tables 5 and 6. Effect modifiers evaluation did not show asignificant association with incident MCI. In the univari-ate statistical model, only age was a risk factor for incidentMCI, while higher levels of education, serum TC, andpack-years cigarettes appeared to have a protective effect(see table 5). In the multivariate statistical model, no con-founders were found for age and education effects on inci-dent MCI (see table 6). Furthermore, in the fully adjustedmodel, serum TC was the only factor with highly skewedCI, which suggests that this effect, while not significant,may be important (see table 6). Therefore, age was a riskfactor for incident MCI, while higher levels of educationappeared to be protective, and serum TC evidenced a bor-derline nonsignificant trend for a protective effect (see ta-ble 6).
In order to evaluate the risk factors for progression todementia, 18 subjects, who refused blood sampling, wereexcluded from the sample used to calculate the rate ofprogression. Compared to the overall sample used to calcu-late the risk of MCI converting to dementia, this subgroupwas not different in sex composition (Pearson �2 0.001, p �0.97) or age (80.1 � 2.4 vs 80.7 � 2.5, separate variance ttest 2.5, p � 0.31). Results of univariate Poisson regressionanalysis are reported in table 5. No association betweenvariables of interest and progression to dementia wasfound. However, the highly skewed CI of stroke suggeststhat this effect, while not significant, may be important.
Discussion. We found a prevalence rate of 3.2%for MCI in a community-defined cohort of 65- to 84-year-old subjects. We selected these MCI patients onthe basis of the memory loss, and so probably includemany patients with aMCI even in the absence of
neuropsychological confirmation of a restricted am-nestic syndrome.6 Previous studies of the prevalenceof MCI produced inconsistent findings, mainly be-cause of different operational criteria, sampling, andassessment procedures.8 In fact, a previous studyconducted on the ILSA sample found a prevalencerate of 10.7% for subjects with cognitive impairmentno dementia (CIND), and a prevalence rate of 7.5%for ARCD subjects.11 Our prevalence rate was lowerthan that reported in a population-based randomsample from eastern Finland: 5.3% of 1,150 oldersubjects (60 to 76 years of age) with a test scoreequal to 1.5 SDs below the age appropriate mean inmemory tests and a CDR score of 0.5 but no demen-tia.42 A prevalence of 6.1% was reported in an elderlyFinnish population aged 65 to 79 years,9 but MCIwas defined with criteria which were more similar tothose of AACD5 than to MCI.1,6 Very recently, theCardiovascular Health Study (CHS) Cognition Studyfound a prevalence of aMCI of 6% on 599 partici-pants, while the overall prevalence of MCI, includingthe mdMCI, was 19% among 2,470 participants.43
Our prevalence rate is consistent with the esti-mate of a recent population-based French study thatobserved a prevalence rate of MCI equal to 3.2% in833 subjects over 60 years of age.44 Moreover, in theLeipzig Longitudinal Study of the Aged (LEILA75�)there was a comparison of four different criteria formild cognitive impairment: MCI, modified-MCI,AACD, and modified-AACD.36 Modifications reportedin the LEILA75� were defined by the same criteria
Table 3 Incidence rates per 1,000 person-years (95% CI) of mild cognitive impairment, according to age classes, sex, and educationallevel, Italian Longitudinal Study on Aging, 1992–1996, n � 1,524 at baseline
Age class, y
Sex Educational level
Total rate, n � 1,524Men, n � 861 Women, n � 663 �3 y, n � 332 �3 y, n � 1,192
65–69 2.9 (1.0–9.1) 4.6 (1.7–12.1) 19.4 (9.3–40.7) 0.0 3.7 (1.8–7.7)
70–74 6.1 (2.7–13.5) 14.9 (8.0–27.6) 39.1 (24.0–63.9) 0.0 9.6 (5.9–15.7)
75–79 53.2 (39.4–71.7) 66.7 (47.5–93.9) 185.5 (144.6–237.9) 3.6 (1.2–11.2) 55.8 (43.9–71.2)
80–84 30.8 (12.8–74.1) 38.3 (19.9–73.5) 155.7 (81.0–299.2) 33.4 (20.5–54.6) 46.6 (31.5–69.0)
Total 19.1 (14.8–24.8) 24.5 (18.9–31.9) 80.9 (66.1–99.1) 4.6 (3.0–7.3) 21.5 (17.9–25.8)
Table 4 Rate of progression per 100 person-years (95% CI) of dementia, Alzheimer’s disease (AD), vascular dementia (VaD), and othertypes of dementia in prevalent mild cognitive impairment patients according to age classes, Italian Longitudinal Study on Aging, 2ndsurvey, 1992–1996, n � 139 at baseline
Ageclass, y
Person-years
No. ofdementiapatients
Rate per 100person-years
No. ofAD
patientsRate per 100person-years
No. ofVaD
patientsRate per 100person-years
No. ofother
dementiapatients
Rate per 100person-years
65–69 0.0 0 0.0 0 0.0 0 0.0 0 0.0
70–74 0.0 0 0.0 0 0.0 0 0.0 0 0.0
75–79 96.5 5 5.2 (2.2–12.5) 3 3.1 (1.0–9.6) 2 2.1 (0.5–8.3) 0 0.0
80–84 302.3 10 3.3 (1.8–6.1) 6 2.0 (0.9–4.4) 3 1.0 (0.3–3.1) 1 0.3 (0.05–2.3)
Total 398.7 15 3.8 (2.3–6.2) 9 2.3 (1.2–4.3) 5 1.3 (0.5–3.0) 1 0.3 (0.04–1.8)
1886 NEUROLOGY 63 November (2 of 2) 2004

as the original concepts of MCI and AACD,1,5,6 withthe exception of the subjective memory impairmentcriterion. Prevalence rates of MCI and modified-MCIwere 3.1% and 5.1%, and therefore consistent withour results. Finally, the Canadian Study of Healthand Aging eliminated the subjective memory impair-ment criterion and intact IADL as in our study, andreported a prevalence estimate of MCI (3.02%, 95%CI 2.40 to 3.64) that was very similar to ours.37
Education, age, and sex are not consistently re-lated to the prevalence of MCI in the literature.8 Inthe present study, we did not find any case of MCI in65- to 69-year-old or 70- to 74-year-old people. How-ever, in subjects older than 75 years of age, the prev-alence rate of MCI increased dramatically andreached 17.2% in those 80 to 84 years of age. Onlyone study found a general decline of prevalence withage,45 while others did not find an influence of age onthe prevalence of MCI or AACD.46 Higher prevalencerates for a low level of education47 as well as theopposite pattern have been previously reported.42 Inour study, educational level had an effect on the
prevalence of MCI. With three or more years of for-mal education there was no prevalent case of MCI inall age bands, except for 80- to 84-year-old subjects.Our results are consistent with those from easternFinland, showing a decreasing trend in prevalencerates of MCI from 0 to 5 years of formal education(13.3%) to 9 or more years (3.0%).42 In addition, likeGerman and Finnish studies on AACD andMCI,36,42,45 we found no sex differences in the preva-lence of MCI. However, higher prevalence rates formen45,46 and women11 have also been reported.
At present, we are aware of only two incidencestudies that applied MCI criteria.36,48 In our study,the incidence rate was 21.5/1,000 person-years,therefore higher than the incidence rate for MCI andMCI-modified (i.e., 8.5 and 12.2/1,000 person-years)found in the LEILA75� study.36 In the PAQUIDstudy, a French population-based cohort of 3,777 el-derly people aged 65 years and older, the global inci-dence rate of MCI was 9.9/1,000 person-years.48 Wefound that the incidence rate was age-related, withno incident MCI patients in the age bands 65 to 69
Table 5 Vascular risk factors for incident mild cognitive impairment (MCI) and progression of MCI patients to dementia, ItalianLongitudinal Study on Aging, 2nd survey, 1992–1996
Variable Category
MCI, n � 1,445
Category
Dementia, n � 121
Newevents
Totalsubjects RR 95% CI
Newevents
Totalsubjects RR
Exact 95%CI
Age, y 65–74 11 677 8.16 4.02–15.61 65–74 5 30 0.59 0.18–2.25
75–84 94 768 75–84 9 91
Education, y �3 89 312 0.05 0.03–0.06 �3 4 29 0.79 0.23–3.44
�3 16 1,133 �3 10 92
Sex Women 51 630 0.82 0.55–1.22 Women 9 61 0.56 0.15–1.88
Men 54 815 Men 5 60
Hypertension No 31 524 1.44 0.91–2.35 No 3 39 1.74 0.46–9.74
Yes 74 921 Yes 11 82
Coronary artery disease No 83 1,269 1.42 0.86–2.27 No 11 105 1.71 0.32–6.78
Yes 22 176 Yes 3 16
Stroke No 95 1,273 1.75 0.81–3.36 No 10 110 4.00 0.92–13.87
Yes 10 67 Yes 4 11
Type two diabetes No 90 1,196 1.43 0.75–2.53 No 13 106 0.54 0.01–3.62mellitus Yes 15 144 Yes 1 15
Pack-years cigarettes �2.3 67 722 0.57 0.37–0.86 Never smoking 11 76 0.46 0.08–1.74
�2.3 38 723 Ever smoking 3 45
Total cholesterol,mg/dL (mmol/L)
�193 (�5.0) 41 365 1 — �175 (�4.5) 4 30 1 —
194–219 (5.0–5.7) 23 355 0.58 0.33–0.98 176–199 (4.6–5.2) 3 30 0.75 0.11–4.43
21 369 0.51 0.28–0.88 200–229 (5.2–6.0) 4 31 0.97 0.18–5.20
220–246 (5.7–6.4) 20 356 0.50 0.28–0.87 �230 (�6.0) 3 30 0.75 0.11–4.43
�247 (�6.4)
HDL cholesterol,mg/dL (mmol/L)
�42 (�1.1) 26 373 1 — �39 (�1.0) 3 28 1 —
43–48 (1.1–1.2) 21 322 0.94 0.50–1.73 40–47 (1.0–1.2) 5 34 1.37 0.27–8.84
49–54 (1.3–1.4) 26 385 0.97 0.54–1.74 48–53 (1.2–1.4) 5 28 1.67 0.32–10.73
�55 (�1.4) 32 365 1.26 0.73–2.20 �54 (�1.4) 1 31 0.30 0.01–3.75
November (2 of 2) 2004 NEUROLOGY 63 1887

and 70 to 74 with more than 3 years of formal educa-tion. Furthermore, there is a greater than 50-folddifference in incident MCI in the age class 75 to 79between the two educational groups. This enormouseffect of education on prevalent MCI and incidentMCI may be due to the fact that uneducated elderlypeople (�3 years of formal education) simply do notperform well on psychometric tests. However, educa-tion may have a little effect on incidence of MCIsince there is a decline from previous function, al-though having low education and being close to thecutoffs may increase the risk of being classified asincident. Furthermore, missing subjects to follow-upwere cognitively more impaired than participants,underestimating MCI incidence. Women did not ex-hibit a higher risk of MCI than men. In theLEILA75� study, although the incidence of AACDand AACD-modified increased with age, incidencerates for MCI and MCI-modified did not.36 In the
PAQUID study MCI incidence estimates did not in-crease with age. The global incidence rate washigher in subjects with a high educational level, withwomen tending to be at a higher risk than men,independent of the age band.48 In the present study,the global incidence rate for MCI was higher thanthe incidence rate for dementia in the same ILSAsample (13.3/1,000 person-years).49
In our study, we found a progression rate to de-mentia of 3.8/100 person-years. The breakdown inAD, VaD, and other types of dementia was 2.3, 1.3,and 0.3/100 person-years. Age did not affect theserates, although this might have been due to thesmall number of patients who progressed to demen-tia. In various studies, using different MCI criteriain clinical settings, the rate of progression to demen-tia or AD was between 10% and 15% per year.1,7,50 Onthe contrary, our results are in agreement with otherpopulation-based studies.44,51 These low conversion
Table 6 Vascular risk factors for incident mild cognitive impairment (MCI), Italian Longitudinal Study on Aging, 2nd survey,1992–1996
Models
Incident MCI
Age EducationPack-yearscigarettes TC CAD Hypertension
RR 95% CI RR 95% CI RR 95% CI RR 95% CI RR 95% CI RR 95% CI
Model 1: age � education 6.19 3.31–11.57 0.05 0.03–0.09
Model 2: age � education �pack-years cigarettes
6.19 3.31–11.57 0.05 0.03–0.09 1.04 0.70–1.56
Model 3: age � education �hypertension
6.21 3.33–11.61 0.06 0.03–0.09 1.21 0.77–1.89
Model 4: age � education �TC
5.52 3.17–11.11 0.06 0.03–0.10 0.69 0.47–1.02
Model 5: age � education �CAD
6.19 3.32–11.57 0.05 0.03–0.09 1.46 0.92–2.29
Model 6: age � education �pack-years cigarettes � TC
5.93 3.17–11.11 0.06 0.03–0.10 0.98 0.65–1.47 0.69 0.46–1.02
Model 7: age � education �pack-years cigarettes �CAD
6.20 3.32–11.57 0.05 0.03–0.09 0.99 0.66–1.50 1.45 0.92–2.31
Model 8: age � education �pack-years cigarettes �hypertension
6.22 3.33–11.62 0.05 0.03–0.09 1.05 0.70–1.57 1.21 0.77–1.90
Model 9: age � education �TC � CAD
5.92 3.17–11.09 0.06 0.03–0.09 0.69 0.46–1.02 1.46 0.93–2.31
Model 10: age � education �TC � hypertension
5.94 3.17–11.12 0.06 0.03–0.10 0.68 0.46–1.01 1.25 0.79–1.95
Model 11: age � education �CAD � hypertension
6.21 3.33–11.61 0.05 0.03–0.09 1.43 0.90–2.26 1.17 0.74–1.83
Model 12: age � education �pack-years cigarettes � TC� CAD
5.87 4.72–11.09 0.06 0.03–0.10 0.93 0.61–1.40 0.68 0.45–1.01 1.48 0.93–2.35
Model 13: age � education �pack-years cigarettes �CAD � hypertension
6.21 3.33–11.61 0.05 0.03–0.09 1.17 0.74–1.83
Model 14: age � education �pack-years cigarettes � TC� hypertension
6.22 3.48–11.8 0.05 0.02–0.12 1.00 0.67–1.51 1.43 0.90–2.27 1.17 0.74–1.83
Model 15: age � education �TC � CAD � hypertension
5.93 3.17–11.10 0.05 0.03–0.9 0.68 0.46–1.00 1.43 0.91–2.27 1.21 0.77–1.90
Model 16: age � education �pack-years cigarettes �CAD � TC � hypertension
5.93 3.17–11.10 0.06 0.03–0.10 0.94 0.62–1.42 0.67 0.45–1.00 1.45 0.31–2.91 1.20 0.76–1.89
TC � total cholesterol; CAD � coronary artery disease.
1888 NEUROLOGY 63 November (2 of 2) 2004

rates may be due to the loss to follow-up, to thelowest 10% of memory impairment that may be toorestrictive as criterion, or, alternatively, caregiversmay have antedated the onset of memory problems.Furthermore, the exclusion of the subjective memoryimpairment and the intact ADL criteria, reducingthe number of criteria to be met, may have increasedthe prevalence, and may have also influenced therate of progression of the present study. Finally, thevery low educational status of many prevalent casesof MCI may have led to an artifactual overestimateof prevalence that was clarified by the longitudinalcourse of these poorly educated but otherwisehealthy individuals who do not progress to dementiaremaining stable. These rates were lower than thoseof the PAQUID study for AD (8.3/100 person-years),but higher than those for other types of dementia(0.75/100 person-years including VaD).48 In thepresent study, the progression rate to dementia andAD of MCI was about threefold greater than theincidence rate of dementia and AD in the same ILSAsample, while the progression rate to VaD was aboutfourfold greater.41 It is possible that our less strin-gent MCI criteria, not restricted to specifically aMCI,by including functionally slightly impaired subjects(but without cognitive dysfunction), subjects withADL impaired by comorbid illnesses,37-39 or by ex-cluding the subjective memory impairment criterionthat appears to be questionable in the prediction ofdementia,36,37 might have influenced the progressionrate of MCI to VaD. Furthermore, the use of ICD-10criteria, which are quite inclusive, as compared forexample with National Institute of Neurologic Disor-ders and Stroke–Association Internationale pour laRecherche en l’Enseignement en Neurosciences crite-ria,52 may explain in part the relatively high inci-dence of VaD. Petersen et al. hypothesized thatmultiple-domain MCI is likely to progress to VaD,whereas aMCI is likely to progress to AD.4 In thepresent study, 33% of prevalent MCI patients pro-gressed to VaD, confirming the data of a recentstudy.53
Other studies have identified vascular risk factorsfor MCI,9-12 but ours is the first study in which riskfactors associated with progression of MCI to demen-tia were evaluated. The univariate statistical resultssuggested age, CAD, and hypertension as risk fac-tors for MCI, while higher levels of education, serumTC, and pack-years cigarettes appeared to have aprotective effect. In the multivariate analysis, onlyage was a risk factor for incident MCI, while higherlevels of education and serum TC appeared to have aprotective effect. On the contrary, it has been re-ported that midlife elevated TC serum levels (�6.5mmol/L) increased the risk for MCI (OR: 1.9), withsystolic blood pressure showing a similar trend.9 Inanother study, elevated midlife blood pressure in-creased the risk for MCI.10 We did not confirm ele-vated TC and hypertension as risk factors forincident MCI. This discrepancy can be explained bythe fact that both TC and blood pressure are midlife
determinations (with average follow-up of 21 and 25years).9 In fact, midlife diastolic blood pressure in-creased the risk for MCI only when a history ofsymptomatic cerebrovascular disease was excluded.10
Furthermore, in a recent study we found lower TCserum levels in AD,54 consistent with prior cross-sectional and prospective studies.55,56 Additionally, ina cross-sectional evaluation in the same ILSA sam-ple, age and myocardial infarction were positivelyassociated with ARCD, while age, congestive heartfailure, and stroke were associated with CIND,11
supporting the role of age and CAD as risk factorsfor cognitive decline. In the CHS Cognition Study,the development of MCI was associated with mea-surements of cognition and depression, racial andconstitutional factors, and cerebrovascular disease.12
In the present study, stroke was the only vascularrisk factor of some interest associated with the pro-gression of MCI to dementia. Probably, a follow-upperiod longer than 3.5 years would reveal that othervascular factors might influence the progression ofMCI to dementia. In a recent study, the risk of post-stroke dementia (PSD) was high (28.5% in a 3-yearfollow-up, with most patients during the first 6months after stroke), with about one-third of pa-tients meeting the criteria for AD and two-thirdsmeeting the criteria for VaD. Using a multivariateanalysis, independent predictors of PSD were age,severity of deficit at admission, diabetes mellitus,silent infarcts, and pre-existing cognitive decline.57
Some limitations of our study should be consid-ered: the prevalence and incidence rates were basedon relatively few MCI patients, given the population-based design of the study. The primary problem withthe diagnosis of MCI in population-based studies re-cently published involves the retrofitting of crite-ria36,37; this may be troublesome in low educationsituations. Furthermore, the incident MCI rateswere underestimated because it could not determinethe correct censored interval period for those sub-jects who were classified as incident demented atsecond survey, as these subjects had been throughan MCI state before becoming demented between thetwo examinations. Then they were considered in ourestimates as not having developed MCI before hav-ing dementia, although they most probably had. Inthe present study, MCI was diagnosed not only byneuropsychological categories, but also by assessingthe functional status, a criterion that has not beenwell defined in previous studies.38 We made thischoice because of the large number of elderly sub-jects affected by comorbid pathologies potentially in-fluencing cognitive status and physical activities.39
Our criteria place in question the category of normalADL/IADL criterion in MCI, suggesting that the di-agnosis of MCI should include subtle functionalchanges in everyday life activities.38 Actually, thevalidity of our approach was supported, for the mostpart, by the results of the multivariate analysis im-plemented in this study, and by the results of theCanadian Study of Health and Aging and LEILA75�
November (2 of 2) 2004 NEUROLOGY 63 1889

study, in which subjective memory impairment andintact IADL were found to be unnecessary require-ments for a case definition of MCI in population-based samples.36,37 Furthermore, we evaluatedvascular risk factors in relation to the progression ofMCI to dementia, although other variables, such asAPOE, subclinical infarcts in imaging, parkinsoniansigns, occupational status, or leisure activities, notavailable in the present study, may play a role inpredicting dementia.
AcknowledgmentThe authors thank Dr. Ronald C. Petersen (Department of Neurol-ogy, Mayo Clinic, Rochester, MN) for discussion, Maria Mann forediting the manuscript, and Drs. Giovanni Castellaneta and Ama-lia Terralavoro, Pfizer Inc., for assistance with bibliographicsources.
AppendixThe ILSA Working Group: A. Di Carlo, MD, M. Baldereschi, MD, NationalResearch Council of Italy (CNR-CSFET), ILSA Study, Florence; S. Maggi,MD, National Research Council of Italy (CNR), Center on Aging, Padua; L.Battistin, MD, M. Bressan, MD, G. Enzi, MD, University of Padua; F.Grigoletto, ScD, E. Perissinotto, ScD, Institute of Hygiene, University ofPadua; G. Bortolan, ScD, CNR, Padua; N. Canal, MD, M. Franceschi, MD,San Raffaele Institute, Milan; G. Scarlato, MD, L. Candelise, MD, E. Sca-pini, MD, University of Milan; C. Loeb, MD, C. Gandolfo, MD, CNR, Genoa;L. Amaducci, MD, D. Inzitari, MD, University of Florence; A. Ghetti, MD,R. Vergassola, MD, USL 10, Florence; S. Bonaiuto, MD, A. Vesprini, MD, F.Fini, MD, INRCA, Fermo; F. Rengo, MD, F. Covelluzi, MD, University ofNaples; A. Capurso, MD, V. Solfrizzi, MD, PhD, F. Panza, MD, PhD, V.Lepore, MD, P. Livrea, MD, University of Bari; L. Motta, MD, G. Carnazzo,MD, University of Catania; S. Mariotti, MSc, S. Brescianini, MSc, IstitutoSuperiore di Sanità, Rome; P. Carbonin, MD, Università Cattolica del SacroCuore, Rome.
References1. Petersen RC, Smith GE, Waring SC, Ivnik RJ, Tangalos EG, Kokmen
E. Mild cognitive impairment: clinical characterization and outcome.Arch Neurol 1999;56:303–308.
2. Hogan DB, McKeith IG. Of MCI and dementia: improving diagnosisand treatment. Neurology 2001;56:1131–1132.
3. Petersen RC, Stevens JC, Ganguli M, Tangalos EG, Cummings JL,DeKosky ST. Practice parameter: early detection of dementia: mildcognitive impairment (an evidence-based review). Report of the QualityStandards Subcommittee of the American Academy of Neurology. Neu-rology 2001;56:1133–1142.
4. American Psychiatric Association Committee on Nomenclature and Sta-tistics, 1994. Diagnostic and statistical manual of mental disorders. 4thed. (DSM-IV). Washington, DC: American Psychiatric Association,1994.
5. Levy R. Aging-associated cognitive decline. Working Party of the Inter-national Psychogeriatric Association in collaboration with the WorldHealth Organization. Int Psychogeriatr 1994;6:63–68.
6. Petersen RC, Doody R, Kurz A, et al. Current concepts in mild cognitivedecline. Arch Neurol 2001;58:1985–1992.
7. Wolf H, Grunwald M, Ecke GM, et al. The prognosis of mild cognitiveimpairment in the elderly. J Neural Transm Suppl 1998;54:31–50.
8. Bischkopf J, Busse A, Angermeyer MC. Mild cognitive impairment–areview of prevalence, incidence and outcome according to current ap-proaches. Acta Psychiatr Scand 2002;106:403–414.
9. Kivipelto M, Helkala EL, Hanninen T, et al. Midlife vascular risk fac-tors and late-life mild cognitive impairment. A population-based study.Neurology 2001;56:1683–1689.
10. DeCarli C, Miller BL, Swan GE, Reed T, Wolf PA, Carmelli D. Cerebro-vascular and brain morphologic correlates of mild cognitive impairmentin the National Heart, Lung, and Blood Institute Twin Study. ArchNeurol 2001;58:643–647.
11. Di Carlo A, Baldereschi M, Amaducci L, et al. Cognitive impairmentwithout dementia in older people: prevalence, vascular risk factors,impact on disability. The Italian Longitudinal Study on Aging. J AmGeriatr Soc 2000;48:775–782.
12. Lopez OL, Jagust WJ, Dulberg C, et al. Risk factors for mild cognitiveimpairment in the Cardiovascular Health Study Cognition Study: part2. Arch Neurol 2003;60:1394–1399.
13. Solfrizzi V, Panza F, Capurso A. The role of diet in cognitive decline.J Neural Transm 2003;110:95–110.
14. The Italian Longitudinal Study on Aging Working Group. Prevalence ofchronic diseases in older Italians: comparing self-reported and clinical
diagnoses. The Italian Longitudinal Study on Aging Working Group.Int J Epidemiol 1997;26:995–1002.
15. Solfrizzi V, Panza F, Torres F, et al. High monounsaturated fatty acidsintake protects against age-related cognitive decline. Neurology 1999;52:1563–1569.
16. Solfrizzi V, Panza F, Torres F, et al. Selective attention skills in differ-entiating between Alzheimer’s disease and normal aging. J GeriatrPsychiatry Neurol 2002;15:99–109.
17. The ARIC investigators. The Atherosclerosis Risk in Communities(ARIC) Study: design and objectives. Am J Epidemiol 1989;129: 687–702.
18. Rose GA, Blackburn H, Gillum RF. Cardiovascular Survey Methods.Monograph series No. 56. Geneva: World Health Organization, 1982.
19. Fried LP, Borhani NO, Enright P, et al. The Cardiovascular HealthStudy: design and rationale. Ann Epidemiol 1991;1:263–276.
20. National Diabetes Data Group. Classification and diagnosis of diabetesmellitus and other categories of glucose intolerance. Diabetes 1979;28:1039–1057.
21. The 1988 Report of the Joint National Committee on Detection, Evalu-ation, and Treatment of High Blood Pressure. Arch Intern Med 1988;148:1023–1038.
22. Hitano S. Experience from a multicentre stroke register: a preliminaryreport. Bull World Health Organ 1976;54:541–553.
23. Solfrizzi V, Panza F, Colacicco AM, et al. Relation of lipoprotein(a) ascoronary risk factor to type 2 diabetes mellitus and low-density lipopro-tein cholesterol in patients � or �65 years of age (The Italian Longitu-dinal Study on Aging). Am J Cardiol 2002;89:825–829.
24. Folstein MF, Folstein SE, McHugh PR. Mini-Mental State: a practicalmethod for grading the cognitive state of patients for the clinician.J Psychiatr Res 1975;12:189–198.
25. Spinnler H, Tognoni G. Standardizzazione e taratura italiana di testneuropsicologici. Ital J Neurol Sci 1987;6(suppl 8):12–120.
26. Barigazzi R, Della Sala S, Laiacona M, Spinnler H, Valenti V. Esplora-zione testistica della memoria di prosa. Ric Psicol 1987;1:50–80.
27. Katz S, Akpom CA. A measure of primary sociobiological functions. IntJ Health Serv 1976;6:493–507.
28. Lawton MP, Brody EM. Assessment of older people: self maintaining andinstrumental activities of daily living. Gerontologist 1969;9:179–186.
29. American Psychiatric Association Committee on Nomenclature andStatistics. Diagnostic and statistical manual of mental disorders. 3rded. revised (DSM-III-R). Washington, DC: American Psychiatric Associ-ation, 1987:103–107.
30. Baldereschi M, Zucchetto M, Grigoletto F, et al., for the ILSA WorkingGroup. Sensitivity, specificity, and predictivity of an Italian version ofthe Mini-Mental State Examination. Ital J Neurol Sci 1993;7(suppl14):59. Abstract.
31. Roth M, Tym E, Mountjoy CQ, et al. CAMDEX: a standardised instru-ment for the diagnosis of mental disorders in the elderly with specialreference to the early detection of dementia. Br J Psychiatry 1986;149:698–709.
32. Pfeffer RI, Kurosaki TT, Harrah CH Jr., Chance JM, Filos S. Measure-ment of functional activities in older adults in the community. J Geron-tol 1982;37:323–329.
33. Hamilton M. A rating scale for depression. J Neurol Neurosurg Psychi-atry 1960;23:56–62.
34. McKhann G, Drachman D, Folstein M, Katzman R, Price D, StadlanEM. Clinical diagnosis of Alzheimer’s disease: report of the NINCDS-ADRDA Work Group under the auspices of the Department of Healthand Human Services Task Force on Alzheimer’s disease. Neurology1984;34:939–944.
35. World Health Organization. International statistical classification ofdiseases and related health problems, 10th revision (ICD-10). ChapterV, categories F00-F99. Mental, behavioural, and developmental disor-ders, clinical description and diagnostic guidelines. Geneva: WorldHealth Organization, 1992.
36. Busse A, Bischkopf J, Riedel-Heller SG, Angermeyer MC. Mild cogni-tive impairment: prevalence and incidence according to different diag-nostic criteria. Results of the Leipzig Longitudinal Study of the Aged(LEILA75�). Br J Psychiatry 2003;182:449–454.
37. Fisk JD, Merry HR, Rockwood K. Variations in case definition affectprevalence but not outcomes of mild cognitive impairment. Neurology2003;61:1179–1184.
38. Nygard L. Instrumental activities of daily living: a stepping-stone to-wards Alzheimer’s disease diagnosis in subjects with mild cognitiveimpairment? Acta Neurol Scand Suppl 2003;179:42–46.
39. Boeve B, McCormick J, Smith G, et al. Mild cognitive impairment inthe oldest old. Neurology 2003;60:477–480.
40. Clayton D, Hills M. Statistical models in epidemiology. Oxford: OxfordUniversity Press, 1993;53–62.
41. Mickey J, Greenland S. A study of the impact of confounder-selectioncriteria on effect estimation. Am J Epidemiol 1989;129:125–137.
42. Hanninen T, Hallikainen M, Tuomainen S, Vanhanen M, Soininen H.Prevalence of mild cognitive impairment: a population-based study inelderly subjects. Acta Neurol Scand 2002;106:148–154.
43. Lopez OL, Jagust WJ, DeKosky ST, et al. Prevalence and classification
1890 NEUROLOGY 63 November (2 of 2) 2004

of mild cognitive impairment in the Cardiovascular Health Study Cog-nition Study. Arch Neurol 2003;60:1385–1389.
44. Ritchie K, Artero S, Touchon J. Classification criteria for mild cognitiveimpairment: a population-based validation study. Neurology 2001;56:37–42.
45. Koivisto K, Reinikainen KJ, Hanninen T, et al. Prevalence of age-associated memory impairment in a randomly selected population fromeastern Finland. Neurology 1995;45:741–747.
46. Hanninen T, Koivisto K, Reinikainen KJ, et al. Prevalence of ageing-associated cognitive decline in an elderly population. Age Ageing 1996;25:201–205.
47. Reischies FM, Geiselmann B, Gessner R, et al. Demenz bei Hochbet-agten. Ergebnisse Berliner Altersstudieb [Dementia in the very elderlyResults of the Berlin Aging Study]. Nervernarzt 1997;68:719–729.
48. Larrieu S, Letenneur L, Orgogozo JM, et al. Incidence and outcome ofmild cognitive impairment in a population-based prospective cohort.Neurology 2002;59:1594–1599.
49. Di Carlo A, Baldereschi M, Amaducci L, et al. Incidence of dementia,Alzheimer’s disease, and vascular dementia in Italy. The ILSA Study.J Am Geriatr Soc 2002;50:41–48.
50. Bowen J, Teri L, Kukull W, McCormick W, McCurry SM, Larson EB.Progression to dementia in patients with isolated memory loss. Lancet1997;349:763–765.
51. Hanninen T, Hallikainen M, Koivisto K, et al. A follow-up study ofage-associated memory impairment: neuropsychological predictors ofdementia. J Am Geriatr Soc 1995;43:1007–1015.
52. Wetterling T, Kanitz RD, Borgis KJ. Comparison of different diagnosticcriteria for vascular dementia (ADDTC, DSM-IV, ICD-10, NINDS-AIREN). Stroke 1996;27:30–36.
53. Meyer JS, Xu G, Thornby J, Chowdhury MH, Quach M. Is mild cogni-tive impairment prodromal for vascular dementia like Alzheimer’s dis-ease? Stroke 2002;33:1981–1985.
54. Solfrizzi V, Panza F, D’Introno A, et al. Lipoprotein(a), apolipoprotein Egenotype, and risk of Alzheimer’s disease. J Neurol Neurosurg Psychia-try 2002;72:732–736.
55. Kuusisto J, Koivisto K, Mykkanen L, et al. Association between fea-tures of the insulin resistance syndrome and Alzheimer’s disease inde-pendently of apolipoprotein E4 phenotype: cross sectional populationbased study. BMJ 1997;315:1045–1049.
56. Romas SN, Tang MX, Berglund L, Mayeux R. APOE genotype, plasmalipids, lipoproteins, and AD in community elderly. Neurology 1999;53:517–521.
57. Henon H, Durieu I, Guerouaou D, Lebert F, Pasquier F, Leys D. Post-stroke dementia: incidence and relationship to prestroke cognitive de-cline. Neurology 2001;57:1216–1212.
ACCESS www.neurology.org NOWFOR FULL-TEXT ARTICLES
Neurology online is now available to all subscribers. Our online version features extensive search capability by title keywords, article key words, and author names. Subscribers can search full-text article Neurology archives to 1999 andcan access link references with PubMed. The one-time activation requires only your subscriber number, whichappears on your mailing label. If this label is not available to you, call 1-800-638-3030 (United States) or 1-301-714-2300 (outside United States) to obtain this number.
November (2 of 2) 2004 NEUROLOGY 63 1891