Do Joint Audits Improve Audit Quality? Evidence from Voluntary Joint Audits
35
Do Joint Audits Improve Audit Quality? Evidence from Voluntary Joint Audits MIKKO ZERNI ∗ , ELINA HAAPAMA ¨ KI ∗ , TUUKKA JA ¨ RVINEN ∗ and LASSE NIEMI ∗∗ ∗ Department of Accounting and Finance, University of Vaasa, PO Box 700, FI-65101, Finland; ∗∗ Department of Accounting, Aalto University School of Economics, Finland ABSTRACT This study examines whether the decision to voluntarily (i.e. without a statutory obligation) employ two audit firms to conduct a joint audit is related to audit quality. We use separate samples and empirical designs for public and privately held companies in Sweden, where a sufficient number of companies have a joint audit on a voluntary basis. Our empirical findings suggest that companies opting to employ joint audits have a higher degree of earnings conservatism, lower abnormal accruals, better credit ratings and lower perceived risk of becoming insolvent within the next year than other firms. These findings are robust to the use of a propensity score matching technique to control for the differences in client characteristics between firms that employ joint audits and those that use single Big 4 auditors (i.e. auditor self-selection). We also find evidence that the choice of a joint audit is associated with substantial increases in the fees paid by the client firm, suggesting a higher perceived level of quality. Collectively, our analyses support the view that voluntary joint audits are positively associated with audit quality in a relatively low litigious setting both for public and private firms. 1. Introduction In recent years, there has been increased concern regarding auditor independence, a necessity for audit quality. Calls for more regulation and governance to improve auditor independence have been made, with the ultimate goal of restoring trust in the quality of financial statement audits (Eilifsen and Willekens, 2008). A recent European Accounting Review iFirst Article, 1–35, 2012 Correspondence Address: Mikko Zerni, Department of Accounting and Finance, University of Vaasa, PO Box 700, FI-65101, Finland. Email: ZERMP@uwasa.fi Paper accepted by Laurence van Lent. European Accounting Review iFirst Article, 1–35, 2012 0963-8180 Print/1468-4497 Online/12/000001–35 # 2012 European Accounting Association http://dx.doi.org/10.1080/09638180.2012.678599 Published by Routledge Journals, Taylor & Francis Ltd on behalf of the EAA.
-
Upload
independent -
Category
Documents
-
view
0 -
download
0
Transcript of Do Joint Audits Improve Audit Quality? Evidence from Voluntary Joint Audits

Do Joint Audits Improve AuditQuality? Evidence from VoluntaryJoint Audits
MIKKO ZERNI∗, ELINA HAAPAMAKI∗, TUUKKA JARVINEN∗
and LASSE NIEMI∗∗
∗Department of Accounting and Finance, University of Vaasa, PO Box 700, FI-65101, Finland;∗ ∗Department of Accounting, Aalto University School of Economics, Finland
ABSTRACT This study examines whether the decision to voluntarily (i.e. without astatutory obligation) employ two audit firms to conduct a joint audit is related to auditquality. We use separate samples and empirical designs for public and privately heldcompanies in Sweden, where a sufficient number of companies have a joint audit on avoluntary basis. Our empirical findings suggest that companies opting to employ jointaudits have a higher degree of earnings conservatism, lower abnormal accruals, bettercredit ratings and lower perceived risk of becoming insolvent within the next year thanother firms. These findings are robust to the use of a propensity score matching techniqueto control for the differences in client characteristics between firms that employ jointaudits and those that use single Big 4 auditors (i.e. auditor self-selection). We also findevidence that the choice of a joint audit is associated with substantial increases in the feespaid by the client firm, suggesting a higher perceived level of quality. Collectively, ouranalyses support the view that voluntary joint audits are positively associated with auditquality in a relatively low litigious setting both for public and private firms.
1. Introduction
In recent years, there has been increased concern regarding auditor independence,
a necessity for audit quality. Calls for more regulation and governance to improve
auditor independence have been made, with the ultimate goal of restoring trust in
the quality of financial statement audits (Eilifsen and Willekens, 2008). A recent
European Accounting Review
iFirst Article, 1–35, 2012
Correspondence Address: Mikko Zerni, Department of Accounting and Finance, University of Vaasa,
PO Box 700, FI-65101, Finland. Email: [email protected]
Paper accepted by Laurence van Lent.
European Accounting Review
iFirst Article, 1–35, 2012
0963-8180 Print/1468-4497 Online/12/000001–35 # 2012 European Accounting Associationhttp://dx.doi.org/10.1080/09638180.2012.678599Published by Routledge Journals, Taylor & Francis Ltd on behalf of the EAA.

example is the Green Paper ‘Audit Policy: Lessons from the Crisis’ of the Euro-
pean Commission, which is aimed at stimulating discussion on how to improve
audit regulation to increase audit quality (and audit market competition).1 The
Green Paper proposes several regulatory actions as possible remedies for the
alleged lack of market trust in auditor independence, such as joint audits,
auditor rotation, audit committees, and restrictions on the services that auditors
are allowed to provide to their clients. The focus of this study is on joint audits.
In the Green Paper, in some letters commenting on it, and in the financial press,
the idea of adopting joint audits has been raised as a potential way to enhance
audit quality and to stimulate audit market competition (see, for instance,
Andre et al., 2009, pp. 5-6; European Commission, 2010, pp. 15–16; Financial
Times, 2007; Herbinet, 2007a; Kauppalehti, 2011a, 2011b; Mazars, 2010). In a
joint audit, two different audit firms jointly form an opinion of a client’s financial
statements. Both audit firms are also jointly liable for the issued audit opinion.
Proponents of joint audits argue that joint audits have the potential to safeguard
auditor independence. For example, the audit firm Mazars conjectures that ‘[joint
audits are] an advanced form of governance of an audit enhancing in particular
independence and the auditors’ ability to stand their own ground in the event
of a difference of view with the audited entity’ (Mazars, 2010, Response to Euro-
pean Commission’s Green Paper, ‘Audit Policy: Lessons from the Crisis’, p. 31).
Opponents of mandating joint audits argue that joint audits increase the cost of
auditing with little effect on audit quality. The issue of adopting joint audits is
highly controversial. For instance, in their response letters to the Green Paper,
each of the Big 4 audit firms opposed mandatory joint audits while smaller
audit firms were generally in favour of such a requirement.
This study contributes to the audit literature by investigating the timely topic of
joint audits, addressing in particular the alleged benefits and costs associated with
joint audits.2 More specifically, we examine whether joint audits are associated
with audit quality and/or audit fees in a voluntary setting, which is fundamentally
different from previous studies related to a mandatory setting (e.g. Andre et al.,
2009; Francis et al., 2009; Gonthier-Besacier and Schatt, 2007; Piot, 2007;
Thinggaard and Kiertzner 2008). Our study relates to Sweden, where a sufficient
number of companies have a joint audit on a voluntary basis. The use of a volun-
tary setting is beneficial because it allows for the determination of the potential
effects of joint audits per se on audit quality and fees. Our study also contributes
to the recent stream of audit studies examining the effects of country-level insti-
tutional factors on auditing (e.g. Choi et al., 2008, 2009; Francis and Wang,
2008), as we study the potential effect of a voluntary joint audit on audit
quality in a relatively low litigious setting (Choi et al., 2008; Wingate, 1997).
The results from the empirical tests for public and privately held companies
separately suggest that companies employing voluntary joint audits have a
higher degree of earnings conservatism, lower abnormal accruals, better credit
ratings and lower risk forecasts of becoming insolvent within the next year
than other firms.3 For private firms, with a sufficiently large initial sample
2 M. Zerni et al.

(over 65,000 unique firms), we are able to address auditor self-selection by using
a propensity score matching technique and find that our results are robust in this
respect. We attribute the observed better credit ratings and more favourable risk
forecasts among privately held companies to a higher (perceived) assurance and/or insurance value of joint audits. Analyses of audit fees among the sample of
publicly listed firms show that joint audits are associated with considerably
higher fees. We interpret this fee premium for joint audits as an indication of
additional value for clients arising from the voluntary decision to hire two audi-
tors instead of one. Collectively, the empirical findings of our study support the
view that joint audits are positively associated with audit quality.
The structure of the paper is as follows. The next section reviews the relevant
literature and develops the hypotheses. Section 3 describes the data and the
matching procedure used for the sample of privately held firms. Section 4
describes the tests of earnings conservatism and reports the results. Sections 5
and 6 describe the tests used for abnormal accruals and credit risk, respectively.
Section 7 reports our results for audit fee tests, and Section 8 concludes the study.
2. Literature Review and Hypotheses Development
2.1. Joint Audits and Actual Audit Quality
Francis et al. (2009) examine auditor-pair choices and their effects on audit
quality in France, where joint audits are mandatory, and report evidence consist-
ent with an agency-driven demand to employ higher quality auditor pairs.4 They
also find that client firms employing higher quality auditor pairs have smaller
abnormal income-increasing accruals than the firms that do not use Big 4 auditors
(i.e. those that use two non-Big 4 auditors) and that this effect is strongest when
client firms use two Big 4 auditors.
At least three arguments suggest that joint audits would contribute positively to
audit quality, thereby giving credibility to financial statements. First, by appoint-
ing two different audit firms, the client firm allows audit firms to rotate, safe-
guarding auditor independence, but also retains the remaining auditor’s
knowledge and understanding of the client’s business operations, thereby avoid-
ing the potential downside of auditor rotation of a discontinuity in competence
(Carcello and Nagy, 2004). Second, the threat to auditor independence due to
economic bonding is likely to be a less significant issue with the joint audit
approach than it is with the single auditor approach. This is simply because, in
joint audits, the audit fees and lucrative consulting fees are distributed between
two different audit firms (i.e. there are lower fees at stake).5 Consequently, the
two different audit firms may take a stronger stand against pressure from the man-
agers and/or controlling owners and report their opinions on the clients’ accounts
more independently (Mazars, 2010; Zerni et al., 2010). Finally, it is ex ante less
likely that both Big 4 firms (or one Big 4 firm and one non-Big 4 firm) would sim-
ultaneously acquiesce to client pressure and not report the discovered breach(s)
Do Joint Audits Improve Audit Quality? 3

than that a single (Big 4) audit firm would do so. In essence, non-reporting of the
discovered breach(s) and willing to sign-off on financial statements that signifi-
cantly depart from GAAP would require three-party collusion.6 In a game-theor-
etic sense (Kargupta et al., 2007), the expected penalties of being caught for
substandard reporting are more likely to exceed its expected benefits for at
least one of the auditors in a joint audit setting compared with auditors in
single auditor engagements, increasing the likelihood of truthful reporting.
Opponents of mandatory joint audits present two main arguments that joint
audits do not increase audit quality. First, joint audits may suffer from a potential
‘free-rider problem’. This problem may occur if one of the auditors attempts to
‘shirk’ and rely on the other auditor’s effort during the audit. Second, it may
be difficult for two competitive audit firms to cooperate closely while conducting
the audit, resulting in insufficient information exchange. Competition between
auditors aiming to acquire a larger share of the business in the upcoming years
may hinder cooperation and even compromise audit quality because of insuffi-
cient information exchange. Moreover, accounting standards containing con-
siderable discretion can make cooperation difficult and lead to conflicts
(Neveling 2007). Thinggaard and Kiertzner (2008) report that after the abolition
of the mandatory two-auditor system in Denmark in 2004, 15 of the 63 (23.8%)
companies investigated retained two auditors in the next year.
In sum, the existing theories and models on audit production (e.g. Simunic,
1980) and quality (DeAngelo, 1981a, 1981b) examine single audit firm settings
and therefore are not applicable to settings in which two separate firms share
the work and legal liability of an audit. In addition, the few existing empirical
studies on joint audits relate to a mandatory setting. Thus, whether joint audits
improve earnings quality as compared with audits conducted by single audit
firms is an empirical question. Given the absence of convincing theories and
the above-discussed opposing views on the impacts of joint audits on audit
quality, we state our first hypothesis in null form:
H1: Joint audits are not significantly associated with audit quality.
2.2. Joint Audits and Perceived Audit Quality
According to financial theory, a higher credibility of financial information
reduces the cost of capital by reducing investors’ information risk (Botosan,
1997; Coles and Lowenstein, 1988; Jensen and Meckling, 1976; Lambert
et al., 2007). Datta et al. (1999) report evidence that firms lower their interest
rates by developing their reputations. The appointment of a high-quality, high-
reputation auditor(s) may thus help more efficiently to resolve contracting pro-
blems by reducing information risk about borrowers (Jensen and Meckling,
1976; Watts and Zimmerman, 1986). The increased credibility of the firms’ finan-
cial reporting would justify lenders and credit rating agencies considering auditor
choice when pricing debt contracts (Pittman and Fortin, 2004). Given that the
4 M. Zerni et al.

appointment of two separate audit firms instead of one signals ‘good news’ to the
market (Teoh and Wong, 1993; Titman and Trueman, 1986) about the client
firm’s financial reporting quality, we would expect joint audits to be associated
with lower perceived credit risk.
There are at least two complementary explanations as to why joint audits may
be perceived as of higher quality/value compared with single auditor audits.
First, as noted before, lenders and other users of financial statements consider
the probability that both auditors simultaneously acquiesce to client pressure to
be lower than the probability that either of them do so alone (i.e. higher assurance
value). The second explanation, the ‘insurance hypothesis’ (e.g. Wallace 1980),
predicts that audits are expected to add value by providing a type of implicit
insurance to investors. In the case of audit failure, investors can sue auditors to
recover their losses if an investment or credit loss results from misstated financial
statements. The auditor is deemed to be a ‘deep pocket’ because the audit firm
carries malpractice insurance and is often the only solvent defendant in a
lawsuit.7 Moreover, the larger the audit firm, the larger the insurance value or
‘bond of wealth’ from which to recover losses and, hence, the higher the value
of an audit (Dye, 1993). In the case of joint audits, the two audit firms together
by definition have deeper pockets (i.e. higher insurance value) than either of
them do alone.8 The deeper pockets of the two audit firms should be reflected
in a lower credit risk for investors providing funding for the audit client.
Consistent with the above viewpoints, Zerni et al. (2010) document both stat-
istically and economically significant equity discounts due to the entrenchment
problem9 for the clients of non-Big 4 auditors (i.e. the largest discount) and
Big 4 auditors (i.e. the second largest discount) but do not find a statistically sig-
nificant discount for the firms that employ joint audits. These findings are consist-
ent with the above explanations of the higher assurance and/or insurance value of
joint audits compared with single auditor audits. Our next two hypotheses add to
Zerni et al.’s (2010) findings by examining whether joint audits are associated
with a lower level of perceived credit risk and thus facilitate access to debt
capital. Formally, these hypotheses can be stated as follows:
H2a: Joint audits are associated with better credit ratings.
H2b: Joint audits are associated with more favourable risk forecasts of
insolvency.
3. Data Description
3.1. Public Company Sample
For listed Swedish companies, we obtain data from the Worldscope database and
combine those data with hand-collected data on auditor names, audit fees, and non-
audit fees from the annual reports available on the companies’ homepages. This
results in an initial sample of 1667 firm-year observations. Joint audits are
Do Joint Audits Improve Audit Quality? 5

identified directly from the issued audit reports, which in the case of joint audits are
signed by two engagement partners representing different audit firms. We elimin-
ate 91 observations by excluding the firms in the finance sector (SIC codes 6000-
6500) because of their distinct characteristics and because these firms are required
to employ joint audits by law. The number of (joint audit) observations varies
between different tests due to use of different subsamples, and limitations
arising from calculations of dependent and explanatory variables.
A professional association for authorised public accountants, approved public
accountants, and other highly qualified professionals in the accountancy sector in
Sweden (FAR) recommends the design in Figure 1 for the audit-fee-related foot-
note in the annual report.
The design recommended in the footnote reflects the Swedish tradition of fre-
quently employing joint audits. Among all Swedish non-financial publicly listed
firms the proportion of voluntary joint audits has been roughly 10%. For joint
audits, we aggregate the audit fees into single amounts because both audit
firms are jointly liable for the issued audit opinion.
3.2. Propensity Score Matched Private Company Sample
For privately held clients, we obtain most of the data from UC AB, a leading
Swedish business and credit information agency owned by the major Swedish
Figure 1. Recommended scheme for reporting audit and non-audit fees in footnotes forSwedish companies.
6 M. Zerni et al.

banks.10 In addition, we use data on firms where individual auditors are employed
to identify joint audits among remaining firms. These data are retrieved from
Revisorsnamnden (The Supervisory Board of Public Accountants), a governmen-
tal authority under the Ministry of Justice that handles all matters related to char-
tered accountants. Because only a few client firms hired joint audit pairs
composed of two non-Big 4 companies, we excluded these observations to sim-
plify our empirical models, reducing the number of interaction variables needed.
After excluding the finance sector and the observations with missing values
needed for our matching model, we identified 973 joint audit observations
from 191 different firms. For each of the above 973 treatment observations we
attempt to find as closely matched pair as possible through a propensity score
matching technique. Despite the number of joint audit observations varying
across different matched pair tests, the proportion of joint audits in each test is
always exactly 50% (please, refer also Note 15).
3.2.1. Matching procedure and propensity score matching model
A sufficiently large initial sample size of privately held firms (over 65,000 unique
firms)11 allows us to employ a propensity score matching technique12 to control for
the differences in client characteristics between the treatment group (i.e. the firms
employing joint audits) and the control group of single Big 4 auditor clients (Lawr-
ence et al., 2011; Lennox et al., 2012; Rosenbaum and Rubin, 1983). Propensity
score matching models match observations on the basis of the probability of under-
going treatment, which in our case is the probability of employing a joint audit.
Before estimating the matching model, we exclude all of the single audits con-
ducted by the non-Big 4 audit firms to further increase the comparability of the treat-
ment and control groups. We then match, without replacement, each Big 4 auditor
client with a joint audit client that had the closest predicted value (according to the
estimated logit model) within a maximum distance of 1%.13 Although the ‘greedy’
matching process reduces the number of observations available for subsequent ana-
lyses, it ensures that the scored distributions are close to identical between the treat-
ment and control groups (i.e. the firms employing joint audits and the Big 4 clients).
We use the following logit model to estimate the probability of employing joint
audits on the basis of prior auditor selection studies (e.g. DeFond, 1992; Francis
and Wilson, 1988; Johnson and Lys, 1990; Lennox, 2005) (firm and time sub-
scripts omitted):
PROB(JAUDIT) = a + b1SIZE + b2DTA + b3CONTROL
+ b4GROUP + b5LOGAGE + b6CASH + b7LOSS
+ b8CA CL + b9ROA + fixed effects
(1)
where the dependent variable JAUDIT is an indicator variable for the joint audit
decision. Explanatory variables are defined as follows: SIZE is the natural logar-
ithm of total assets; DTA is the ratio of debt to total assets; CONTROL is an
Do Joint Audits Improve Audit Quality? 7

indicator variable for the presence of a controlling shareholder with at least a 25%
stake of voting power; GROUP is an indicator variable for group affiliation;
LOGAGE is the natural logarithm of the client age in years; CASH is the ratio
of cash and cash equivalents to total assets; LOSS is an indicator variable for
accounting losses; CA_CL is the ratio of current assets to current liabilities;
and ROA is the return on assets. We also add indicator variables for the economic
sectors and different years.14
Using the 1% upper bound for the difference between propensity scores, we
were able to find a match for 597 joint audit observations from 135 different
firms between 2001 and 2007 resulting in a matched sample of 1194 firm-
years. However, because of missing values for variables used in our empirical
models, the final sample sizes in our tests are reduced to between 1160 and
848 firm-year observations.15
3.2.2. Results of estimating the propensity score matching model
Table 1 presents the results of the estimation model (1). As can be seen from
column (1) of Table 1, all of our chosen explanatory variables are significant pre-
dictors of the joint audit decision. The estimated magnitudes of the coefficients
indicate that client size, company age, group affiliation and the presence of a con-
trolling shareholder appear to be the most focal positive determinants of joint
audit selection. The return on assets, the leverage and the ratio of current
assets to total assets are all estimated to be significantly negative, but the magni-
tudes of their coefficients are considerably smaller compared with the above-
mentioned four variables. Finally, we find that accounting losses and liquidity
have positive impacts on the likelihood of employing a joint audit.
The estimated results reported in column (2) of Table 1 indicate that the match-
ing procedure balances the differences regarding all dimensions used in the pro-
pensity matching approach. The likelihood ratio test cannot reject the global
null hypothesis that all of the coefficients are zero (p-value ¼ 0.935). Hence,
given ‘perfect’ matching, the remaining differences between the two groups of
firms should reflect only the treatment effect, and a simple univariate t-test of
the differences in means should be sufficient to estimate the treatment effects
(Dehejia and Wahba, 2002; Heckman et al., 1997; Zhao, 2004). However, we
still use multivariate regressions to control for any potential remaining differences
in client characteristics between the treatment and control groups.
4. Multivariate Analysis: Earnings Conservatism
4.1. Earnings Conservatism Model Specification for Publicly Listed
Companies
Our first test uses the earnings conservatism framework of Basu (1997) to deter-
mine whether there are differences in timely loss recognition between the clients
of dual and single auditors. In this framework, positive annual stock returns are
8 M. Zerni et al.

used to indicate ‘good news’ whereas negative annual stock returns are assumed
to reflect ‘bad news’ in the current fiscal year. The premise of earnings conserva-
tism is that losses are recognised more quickly than gains, which are usually
deferred until they are realised. Accordingly, earnings conservatism exists if
the contemporaneous accounting earnings recognise bad news more quickly
than good news. Conservative earnings reduce the level of information asymme-
try and make earnings more useful for contracting purposes (e.g. LaFond and
Watts, 2008; Watts, 2003). By estimating the following model that builds on
Basu (1997), we test whether a firm’s choice of auditor affects the degree of con-
servatism:
EARN = b0 + b1R + b2DR + b3DR × R + b4JOINT + b5JOINT
× R + b6JOINT × DR + b7JOINT × DR × R + b8BIG + b9BIG
× R + b10BIG × DR + b11BIG × DR × R + b12LMV + b13P/B
+ b14DTA + fixed effects + 1
(2)
Table 1. Logit model for the joint audit decision used in the matching process.
JOINT JOINT
Matching Process After Matching
Variable Coef. Prob. Coef. Prob.
SIZE 0.4351 ∗∗∗ 0.0000 –0.2808 0.5240DTA –0.5430 ∗∗∗ 0.0000 0.0049 0.9832CONTROL 0.7860 ∗∗∗ 0.0000 –0.1904 0.1213GROUP 0.5941 ∗∗∗ 0.0000 –0.0240 0.8574LOGAGE 0.3213 ∗∗∗ 0.0000 0.0446 0.5067CASH 1.1899 ∗∗∗ 0.0000 0.1465 0.5670LOSS 0.2599 ∗∗∗ 0.0020 0.1012 0.5108CA_CL –0.0105 ∗∗∗ 0.0004 0.0016 0.6726ROA –0.3716 ∗∗∗ 0.0354 –0.0111 0.9723Intercept –12.495 ∗∗∗ 0.0000 –0.2808 0.5040Annual fixed effects? Yes NoEconomic sector fixed effects? Yes NoLikelihood ratio, x2 2,209.52 ∗∗∗ 3.62Nagelkerke R2 25.2% 0.4 %–2 Log Likelihood 9,463.78 ∗∗∗ 1,655.24N (# joint audits) 45,846 (973) 1,194 (597)
Notes:SIZE is the natural logarithm of total assets in thousands of Swedish kronor; DTA is the ratio of debt tototal assets; CONTROL is a dummy variable with a value of one if the firm has a controllingshareholder, otherwise zero; GROUP is a dummy variable with a value of one if the firm is affiliatedwith a group of companies, otherwise zero; LOGAGE is the natural logarithm of firm age in years;CASH is the ratio of cash and cash equivalents to total assets; LOSS is a dummy variable with a valueof one if earnings are negative, otherwise zero; CA_CL is the ratio of current assets to currentliabilities; ROA is the interest-adjusted return on opening total assets.
Do Joint Audits Improve Audit Quality? 9

where R is the buy-and-hold annual stock return (including dividends) and DR is
a dummy variable with a value of one if the return is negative, otherwise zero. We
add controls for firm size (LMV), leverage (DTA), and growth (P/B). However,
we omit the interactions with LMV, P/B and DTA to avoid multicollinearity pro-
blems. We include the year and industry-fixed effects and estimate the parameters
by adjusting the standard errors with respect to heteroscedasticity and within-firm
clustering (Rogers, 1993).
The standard Basu (1997) model includes the first four parameters in equation
(2). In the Basu framework, a positive sign on the coefficient on the interaction
variable DR ∗ R (b3) implies that accounting earnings recognise bad news
(timely loss recognition) more quickly than good news.16 The primary coeffi-
cients of interest are the interaction variables JOINT ∗ DR ∗ R (b7) and BIG ∗
DR ∗ R (b11), which measure the incremental effects of the decisions to
employ a joint audit or a single Big 4 audit firm on earnings conservatism relative
to clients of single non-Big 4 audit firms, respectively.
4.2. Specification of an Earnings Conservatism Model for Privately Held
Companies
Because private companies do not have stock returns, we rely on Ball and Shiva-
kumar’s (2005) metrics to examine the timeliness of loss recognition among pri-
vately held clients. Ball and Shivakumar’s (2005) approach builds on Dechow
et al.’s (1998) work and exploits the likelihood that timely loss recognition
occurs through accounting accruals. In particular, this approach hypothesises that
economic losses are more likely to be recognised on a timely basis in the form
of unrealised (i.e. non-cash) accrued charges against income whereas economic
gains are more likely to be recognised when they are realised (Ball and Shivakumar
2005). Following Ball and Shivakumar (2005), we estimate the following piece-
wise-linear model to examine whether a privately held client firm’s choice of
auditor affects the timely loss recognition through accounting accruals:
ACCR = b0 + b1DCFO + b2CFO + b3DCFO × CFO + b4JOINT
+ b5JOINT × CFO + b6JOINT × DCFO + b7JOINT × DCFO
× CFO + fixed effects + 1
(3)
where cash flow from operations (CFO) is measured as the earnings before excep-
tional and extraordinary items less accruals. We define accruals (ACCR) as the
change in current assets (less the change in cash and cash equivalents) from the
prior year minus the change in current liabilities (less the change in short-term
debt and the current portion of long-term debt) minus depreciation. We standardise
both the accruals and the cash from the operations by the beginning-of-period total
assets. DCFO is a dummy variable taking the value 1 if the cash flow (CFO) is
negative and zero otherwise. Similar to Dechow et al. (1998) and Ball and
10 M. Zerni et al.

Shivakumar (2005), we predict a negative coefficient for cash flows (b2). Losses
are hypothesised to be recognised faster via accruals than gains; hence, we
predict a positive incremental coefficient (b3) for negative cash flows. As in
Basu’s (1997) model, the primary coefficient of interest is the coefficient on the
interaction variable JOINT ∗ DCFO ∗ CFO (b7), which measures the incremental
effect of the choice of a joint audit on earnings conservatism relative to the single
Big 4 auditors.
4.3. Results for the Earnings Conservatism Tests
Table 2 reports the descriptive statistics for the variables used in our analyses of
earnings conservatism. Panel A reports the descriptive statistics for the sample of
public firms whereas panel B reports the descriptive statistics for the privately
held companies. Recall that no joint audits were conducted by two non-Big 4
firms in our analyses.17
Table 2. Descriptive statistics for the earnings conservatism tests.
Panel A: Public firm sample (N ¼ 1,257)
Variable Mean Std. Min 25 % Median 75 % Max
EARN –0.067 0.249 –0.509 –0.202 0.030 0.107 0.303R 0.141 0.597 –0.878 –0.241 0.104 0.423 2.750DR 0.411 0.492 0 0 0 1 1JOINT 0.103 0.303 0 0 0 0 1BIG a 0.898 0.301 0 1 1 1 1LMV 13.88 2.01 8.97 12.45 13.63 15.15 20.47P/B 2.99 3.75 0.21 1.29 2.12 3.42 72.74DTA 0.174 0.161 0 0.018 0.146 0.288 0.747
Panel B: Private firm sample (N ¼ 1,160)
ACCR –0.048 0.156 –0.718 –0.092 –0.020 0.079 0.706CFO 0.091 0.269 –0.954 –0.002 0.061 0.171 2.071DCFO 0.27 0.443 0 0 0 1 1JOINT 0.50 0.500 0 0 0.50 1 1
Notes:a Conditional on the firm employing a single-audit firm. EARN is defined as the earnings per share beforeextraordinary items scaled by the stock price at the beginning of the period; R is the annual raw stockreturn; DR is a dummy variable with the value of one if the annual raw stock return is negative, otherwisezero; JOINT is a dummy variable with a value of one if the client firm employs a joint audit, otherwisezero; BIG is a dummy variable with a value of one if the client firm employs a single Big 4 audit firm,otherwise zero; LMV is the natural logarithm of the market value of equity in thousands of Swedishkronor; P/B is the price-to-book ratio; DTA is the ratio of debt to total assets; and ACCR is the amount ofaccounting accruals divided by the opening total assets. Accruals are defined as the change in currentassets (less the change in cash and cash equivalents) from the prior year minus the change in currentliabilities (less the change in short-term debt and current portion of long-term debt) minus depreciation;CFO is measured as the earnings before exceptional and extraordinary items less accruals; and DCFO isa dummy variable with a value of one if cash flow (CFO) is negative, otherwise zero.
Do Joint Audits Improve Audit Quality? 11
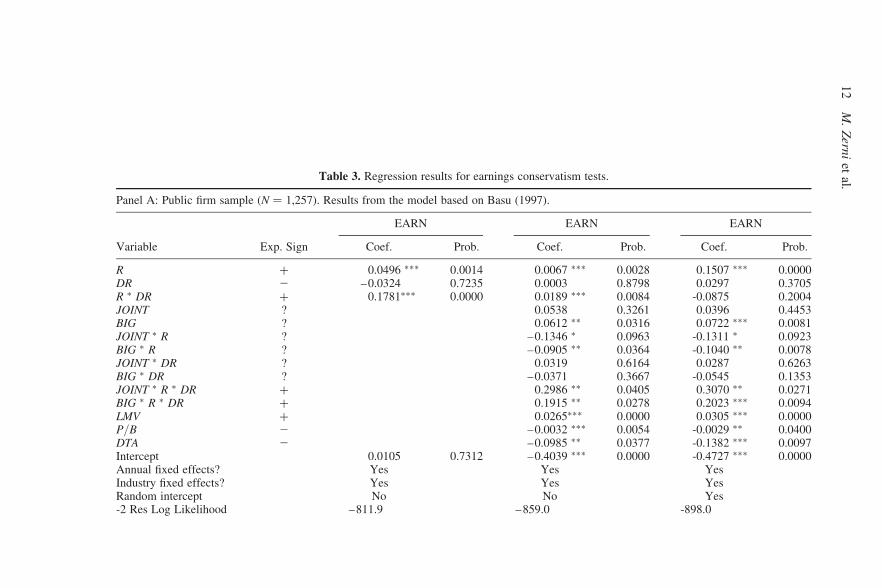
Table 3. Regression results for earnings conservatism tests.
Panel A: Public firm sample (N ¼ 1,257). Results from the model based on Basu (1997).
EARN EARN EARN
Variable Exp. Sign Coef. Prob. Coef. Prob. Coef. Prob.
R + 0.0496 ∗∗∗ 0.0014 0.0067 ∗∗∗ 0.0028 0.1507 ∗∗∗ 0.0000DR 2 –0.0324 0.7235 0.0003 0.8798 0.0297 0.3705R ∗ DR + 0.1781∗∗∗ 0.0000 0.0189 ∗∗∗ 0.0084 -0.0875 0.2004JOINT ? 0.0538 0.3261 0.0396 0.4453BIG ? 0.0612 ∗∗ 0.0316 0.0722 ∗∗∗ 0.0081JOINT ∗ R ? –0.1346 ∗ 0.0963 -0.1311 ∗ 0.0923BIG ∗ R ? –0.0905 ∗∗ 0.0364 -0.1040 ∗∗ 0.0078JOINT ∗ DR ? 0.0319 0.6164 0.0287 0.6263BIG ∗ DR ? –0.0371 0.3667 -0.0545 0.1353JOINT ∗ R ∗ DR + 0.2986 ∗∗ 0.0405 0.3070 ∗∗ 0.0271BIG ∗ R ∗ DR + 0.1915 ∗∗ 0.0278 0.2023 ∗∗∗ 0.0094LMV + 0.0265∗∗∗ 0.0000 0.0305 ∗∗∗ 0.0000P/B 2 –0.0032 ∗∗∗ 0.0054 -0.0029 ∗∗ 0.0400DTA 2 –0.0985 ∗∗ 0.0377 -0.1382 ∗∗∗ 0.0097Intercept 0.0105 0.7312 –0.4039 ∗∗∗ 0.0000 -0.4727 ∗∗∗ 0.0000Annual fixed effects? Yes Yes YesIndustry fixed effects? Yes Yes YesRandom intercept No No Yes-2 Res Log Likelihood –811.9 –859.0 -898.0
12
M.
Zern
iet
al.
Panel B: Private firm sample (N ¼ 1,160). Results from the model based on Ball and Shivakumar (2005).
ACCR ACCR
Variable Exp. Sign Coef. Prob. Coef. Prob.
CFO 2 –0.4944 ∗∗∗ 0.0000 –0.5122 ∗∗∗ 0.0000DCFO ? 0.0147 0.1462 0.0304 ∗ 0.0859DCFO ∗ CFO + 0.2024 ∗∗∗ 0.0061 0.0681 0.5621JOINT ? 0.0100 0.4838JOINT ∗ CFO ? 0.0376 0.6839JOINT ∗ DCFO ? –0.0282 0.1715JOINT ∗ DCFO ∗ CFO + 0.2780 ∗ 0.0534Intercept 0.0048 0.8546 –0.0027 0.9165Annual fixed effects? Yes YesIndustry fixed effects? Yes Yes-2 Res Log Likelihood –1,493.7 1,526.7
Notes:The dependent variable EARN is defined as the earnings per share before extraordinary items scaled by the stock price at the beginning of the period. R is the annualraw stock return; DR is a dummy variable with a value of one if the annual raw stock return is negative, otherwise zero; JOINT is a dummy variable with a value ofone if the client firm employs a joint audit, otherwise zero; and BIG is a dummy variable with a value of one if the client firm employs a single Big 4 audit firm,otherwise zero. LMV is the natural logarithm of the market value of equity in thousands of Swedish kronor; P/B is the price-to-book ratio; and DTA is the ratio of debtto total assets. The dependent variable ACCR is the amount of accounting accruals divided by the opening total assets. Accruals are defined as the change in currentassets (less the change in cash and cash equivalents) from the prior year, minus the change in current liabilities (less the change in short-term debt and current portionof long-term debt), minus depreciation. CFO is measured as the earnings before exceptional and extraordinary items less accruals; DCFO is a dummy variable with avalue of one if cash flow (CFO) is negative, otherwise zero. Statistical significances are calculated by adjusting the standard errors for heteroskedasticity (White1980) and firm-level clustering (Petersen 2009). Asterisks ∗∗∗, ∗∗, and ∗ denote two-tailed statistical significance at the 1%, 5%, and 10% levels, respectively.
Do
Join
tA
ud
itsIm
pro
veA
ud
itQ
ua
lity?1
3

Our public firm sample includes a total of 129 joint audit observations from 28
unique firms (not tabulated). Panel A reveals that Big 4 firms dominate the
Swedish public company audit market, with a combined market share of single
auditor clients of 90%. The mean (median) annual raw stock return is 14.1%
(10.4%); furthermore, in approximately 41% of firm-years, the stock return is
negative, allowing for an examination of the asymmetric recognition of economic
gains and losses.
For privately held companies, the mean (median) amount of accruals is –0.048
(–0.020), with a range from –0.718 to 0.706. Furthermore, the mean (median)
operating cash flow is 0.091 (0.061), and the cash flow is negative in approxi-
mately 27% of observations.18 We conclude that there is a sufficient number of
observations with ‘bad news’ to capture the expected timely recognition of
losses in both of the earnings conservatism models.
Panel A of Table 3 reports the results for the Basu (1997) sample of public
companies whereas panel B reports the results for Ball and Shivakumar’s
(2005) measure of earnings conservatism.
As column 1 of Table 3 indicates, the standard Basu (1997) model appears to
work relatively well with the Swedish data. The estimated coefficient of the inter-
action DR ∗ R is positive and highly significant, which suggests more timely loss
recognition.
Column 2 reports our extension of the Basu model, which is defined in equation
(2). In column 3, we allow a firm-specific random intercept to control for the het-
erogeneity in firm characteristics that may affect the risk-return relationship. In
columns (2) and (3), the three-way interaction term ‘R∗DR∗JOINT’ (‘R∗DR∗BIG’)
tests the incremental earnings conservatism of the joint auditor (single Big 4
auditor) clients relative to the non-Big 4 auditors’ clients. The coefficient of the
interaction term ‘R∗DR∗JOINT’ is positive and significant at the 5% level. More-
over, the coefficient of ‘R∗DR∗BIG’ is positive and significant, although the mag-
nitude is lower. Collectively, these findings suggest that the clients of dual auditors
have the most conservative earnings while clients of single non-Big 4 auditors have
the least conservative earnings. In terms of earnings conservatism, the clients of
single Big 4 auditors appear to fall between these two classes.19
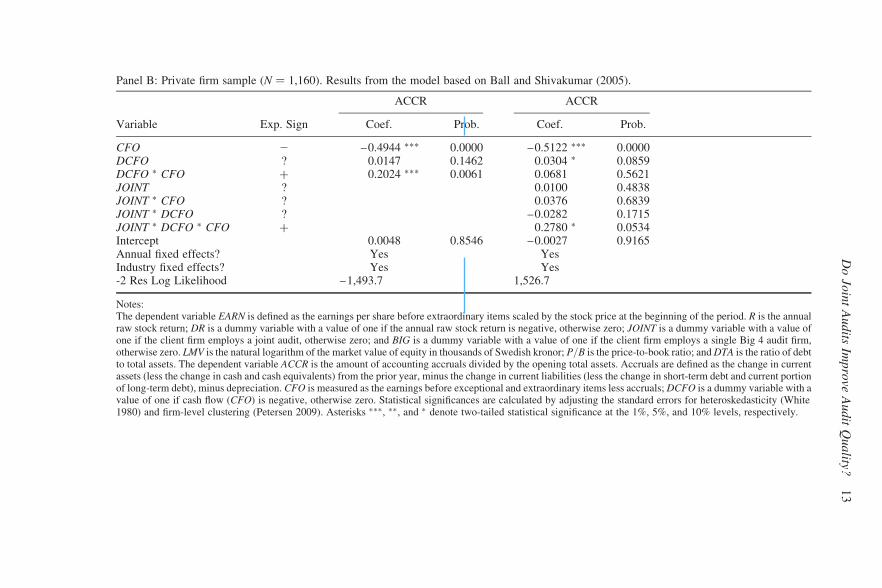
Panel B of Table 3 presents the results from the regression identified in
equation (3). As can be seen from column 1 of panel B, the estimated coefficient
on the interaction DCFO ∗ CFO is positive and significant at the 1% level. Thus,
the negative relationship between accruals and cash flow is less pronounced
during losses than during gains. In other words, the empirical evidence supports
the view that relative to gains, economic losses are recognised more quickly via
accruals.
Column 2 reports our extension of the model, which allows the asymmetric
recognition of unrealised gains and losses to vary between clients of single Big
4 firms and clients that employ joint audits. We find that the test variable JOIN-
T∗DCFO∗CFO is estimated to be significantly positive, which suggests that, on
average, the clients of dual auditors have more conservative earnings than their
14 M. Zerni et al.

propensity-score-matched counterparts. Overall, the results of the accruals-based
test, like those based on the Basu (1997) model, suggest that the client firms that
employ joint audits make more conservative reports than the clients of single
auditors. Joint liability essentially means that both auditors bear the (\,potentially)
incremental audit risk arising from the likelihood that the other auditor fails to
adequately perform its share of the audit work. One explanation for the increased
conservatism may thus relate to each auditor’s responses to information asymme-
try regarding the other auditor’s actions. In other words, each auditor responds to
the potential ‘free-rider problem’ by enforcing more conservative accounting
choices.
5. Multivariate Analysis: Abnormal Accruals
5.1. Abnormal Accruals Test Specifications
Our second set of tests employs abnormal working capital accruals as a proxy for
audit quality. For both the public and private samples, we define working capital
accruals (WA) as the change in the current assets (less the change in cash and cash
equivalents) from the prior year minus the change in current liabilities (less the
change in short-term debt and the current portion of long-term debt). We then
specify the abnormal working capital accruals (ABWA) as the actual accruals
minus the ‘expected’ accruals. To project the expected level of accruals, we
turn to an expectation model similar to that used by DeFond and Park (2001)
and Francis et al. (2009). In this approach, the level of expected accruals is
based on each firm’s prior-year linear relationship between sales and working
capital accruals.20 We calculate the expected accruals in the following manner:
Expected accruals = SALESt × (WAt−1/SALESt−1) (4)
We eliminated observations with extreme abnormal accruals values. In par-
ticular, observations were deleted if the absolute value of the abnormal
working capital accruals scaled by the lagged total assets was above 0.99
(0.71), which is approximately equivalent to deleting the top and bottom 2.5%
of the distribution for public (private) clients. Our multivariate models then
regress (absolute) abnormal accruals on our research variables and control vari-
ables based on prior studies in the field (e.g. Teoh et al., 1998; Becker et al.,
1998). Again, for reasons of data availability, we specify slightly different
models for public and private firms. For public firms, we estimate the following
model:
|ABWA| = a + b1SIZE + b2P/B + b3SALESG + b4OCF + b5LOSS
+ b6DTA + b7LAGWA + b8OVAR + b9JOINT + b10BIG
+ fixed effects + 1
(5a)
Do Joint Audits Improve Audit Quality? 15

where the dependent variable ABWA is the difference between the actual and
expected amounts of working capital accruals derived from model (4). Our vari-
ables of interest are JOINT and BIG, which are dichotomous variables that
respectively denote joint audits and single Big 4 audits. Our control variables
are based on prior studies that have addressed audit quality issues through
accruals-based measures. Large firms tend to have more stable revenue and
income streams. Larger firms also have more negotiating power in the event of
financial difficulties. Hence, we include the natural logarithm of total assets in
thousands of Swedish kronor (SIZE) to control for the expected negative relation-
ship between firm size and the magnitude of abnormal accruals. Matsumoto
(2002) shows that firms with growth prospects are more likely to be concerned
about missing their earnings benchmarks. For that reason, we include the
price-to-book ratio (P/B) and the growth in sales over the previous year
(SALESG) to control for the cross-sectional differences in growth prospects.
Kothari et al. (2005) argue that the estimated discretionary accruals are positively
correlated with firm performance. Thus, we measure firm performance using the
operating cash flow to total assets (OCF) variable. LOSS is a dummy variable
with a value of one if the client firm has negative earnings, otherwise zero. We
add the ratio of debt to total assets (DTA) because firms with high levels of
debt may struggle to avoid violating their debt covenants and may consequently
have greater incentives to manage their earnings (Becker et al., 1998; DeFond
and Jiambalvo 1994). We also include one-year lagged working capital accruals
to control for the reversal of accruals (LAGWA). However, the lagged value of the
accruals will likely capture the time-invariant factors omitted from DeFond and
Park’s (2001) expectation model for working capital accruals, which predicts that
the coefficient on LAGWA would be positive. We add the standard deviation of
sales over the years t–3 to t (OVAR) to control for potential errors in estimating
abnormal accruals that relate to the cross-firm differences in operating variability
(Hribar and Nichols, 2007).
Our model for private firms is similar to that for public firms (equation (5a)),
except that we have only one test variable (JOINT) and three additional control
variables. Specifically, we estimate the following model for our matched
sample of private firms:
|ABWA| = a + b1SIZE + b2LOGAGE + b3SALESG + b4OCF
+ b5LOSS + b6DTA + b7LAGWA + b8OVAR
+ b9TENURE + b10CASH + b11JOINT + fixed effects + 1
(5b)
where we include the following three additional controls. First, because older
firms are less likely to go bankrupt or violate their debt contracts, we add the
natural logarithm of firm age in years (LOGAGE) to the model (5b). Second,
TENURE denotes auditor tenure in years. Prior research has suggested that the
length of an auditor–client relationship may affect the auditor’s independence
16 M. Zerni et al.

and knowledge of its client (Johnson et al., 2002; Myers et al., 2003). To capture
this effect, we add a variable representing auditor tenure in years (TENURE) to
the model. Third, we add the ratio of cash to cash equivalents (CASH) into
equation (5b) to control for the cross-sectional differences in liquidity. The
other variables are as defined above.
5.2 Results for the Abnormal Working Capital Accruals Tests
Panel A of Table 4 reports the descriptive statistics for the variables used in the
tests for abnormal accruals among the publicly listed companies. The mean
(median) amount of absolute abnormal accruals among the sample of public com-
panies is 0.127 (0.069). A simple univariate t-test for the differences in means
suggests that the client firms employing joint audits have a lower level of absolute
abnormal accruals (untabulated). However, because these firms differ in many
other aspects (e.g. size), the unconditional descriptive evidence is limited.
Panel B reports the corresponding statistics for the privately held clients. Given
‘perfect’ matching as reported in Table 1, the remaining differences between the
two groups of firms should only reflect the treatment effect, and a simple univariate
t-test of the differences in means would be sufficient to estimate the treatment
effects (Dehejia and Wahba, 2002; Heckman et al., 1997; Zhao, 2004). According
to a t-test for the differences in means in the level of absolute abnormal accruals
(untabulated), the client firms that employ joint audits have a lower level of abnor-
mal accruals on average (p-value , 0.0001). Thus, the univariate evidence sup-
ports the view that joint audits are more effective at constraining earnings
management through the manipulation of accounting accruals than single Big 4
audit firms.
Panel A of Table 5 reports the results from our abnormal accruals models for
public firms (equation (5a)). The likelihood ratio test statistics for all of the
models indicate significance at the 1% level. As before, all the significance
levels of individual coefficients are reported as two-tailed p-values.
With respect to the absolute value of abnormal working capital accruals among
the public companies in column (1), we find that none of the auditor choice vari-
ables are significant in any of the tests. However, the opportunistic, income-
increasing application of GAAP is widely considered to more likely signal pro-
blems with auditor independence than the conservative application of GAAP.
Hence, we split the full sample into two sub-samples containing income-increas-
ing and income-decreasing abnormal accruals (i.e. ABWA . 0 and ABWA , 0)
and then estimate Model (3) separately for both sub-samples. The results of
these analyses are presented in Columns (2) and (3) of panel A. In column 2,
for the income-increasing abnormal accruals, the estimated coefficient of the
joint audit indicator is negative and significant at the 10% level (p-value ¼
0.0658). A negative sign indicates that the abnormal accruals of dual-auditor
clients are smaller on average (i.e. less income-increasing) than the accruals of
Do Joint Audits Improve Audit Quality? 17

single-auditor clients. For income-decreasing abnormal accruals, both auditor
choice variables are estimated to be insignificant.21
In sum, the results of the above analyses suggest that the employment of a joint
audit by public companies is associated with smaller income-increasing abnormal
working capital accruals and that the earnings of these companies are therefore
less likely to be affected by opportunistic firm insider discretion that overstates
earnings. These findings are also in good agreement with the results obtained
from tests for earnings conservatism.
Table 4. Descriptive statistics for variables used in abnormal accruals analyses.
Panel A: Public firm sample (N ¼ 858).
Variable Mean Std. Min 25 % Median 75 % Max
|ABWA| 0.127 0.155 0 0.027 0.069 0.166 0.984ABWA 0.020 0.199 –0.741 –0.060 0.009 0.080 0.984SIZE 13.98 2.03 8.89 12.51 13.66 15.15 19.35P/B 2.87 2.93 0.34 1.40 2.18 3.51 51.43SALESG 0.062 0.307 –0.962 –0.049 0.046 0.184 1.53OCF 0.047 0.160 –0.756 –0.001 0.077 0.130 0.445LOSS 0.156 0.363 0 0 0 0 1DTA 0.169 0.154 0 0.022 0.140 0.277 0.747OVAR 1.358 3.715 0.001 0.065 0.182 0.727 33.269JOINT 0.084 0.277 0 0 0 0 1BIG a 0.916 0.278 0 1 1 1 1
Panel B: Private firm sample (N ¼ 906)
|ABWA| 0.126 0.157 0.001 0.010 0.064 0.194 0.700ABWA –0.001 0.207 –0.674 –0.060 0.001 0.069 0.700SIZE 9.31 2.87 3.52 7.30 9.10 11.31 17.43LOGAGE 3.17 0.87 0.69 2.56 3.09 3.81 4.72SALESG 0.023 0.300 –0.984 –0.006 0.005 0.094 2.111OCF 0.086 0.233 –1.003 0.001 0.063 0.171 2.032LOSS 0.275 0.446 0 0 0 1 1DTA 0.687 0.278 0 0.510 0.773 0.910 1OVAR 0.286 1.071 0.000 0.002 0.013 0.089 10.646JOINT 0.500 0.500 0 0 0.500 1 1TENURE 6.01 4.06 1 2 5 9 17CASH 0.165 0.240 0.001 0.005 0.042 0.244 0.873
Notes:a Conditional on the firm employing a single-audit firm. ABWA is the amount of abnormal workingcapital accruals; SIZE is the natural logarithm of total assets in thousands of Swedish kronor; OCF isthe operating cash flow divided by the initial total assets; LOSS is an indicator variable for accountinglosses; SALESG is the growth in sales over the prior year; P/B is the price-to-book ratio; DTA is theratio of debt to total assets; OVAR is the standard deviation of sales in billions Swedish kronor over theyears t–3 to t; JOINT is a dummy variable with a value of one if the client firm employs a joint audit,otherwise zero; BIG is a dummy variable with a value of one if the client firm employs a single Big 4audit firm, otherwise zero; LOGAGE is the natural logarithm of firm age in years; and TENURE isaudit firm tenure in years. For joint audit observations we designate the value of the audit firm withlonger tenure; CASH is the ratio of cash and cash equivalents to total assets.
18 M. Zerni et al.

Table 5. Regression analysis of abnormal accruals.
Panel A: Public firm sample.
|ABWA| ABWA if ABWA ≥0 ABWA if ABWA ,0
VariableExp.Sign Coef. Prob. Coef. Prob. Coef. Prob.
SIZE 2 –0.0199 ∗∗∗ 0.0001 –0.0118 ∗ 0.0652 0.0165 ∗∗∗ 0.0023P/B + 0.0022 0.4857 –0.0035 ∗∗ 0.0335 0.0051 0.2130SALESG + 0.0904 ∗∗∗ 0.0002 0.1397 ∗∗∗ 0.0000 0.0245 0.5114OCF 2 –0.1825 ∗∗∗ 0.0060 –0.2411 ∗∗∗ 0.0061 –0.0279 0.6888LOSS + 0.0025 0.1798 0.0094 0.7133 0.0505 ∗∗ 0.0129DTA +/ 2 –0.1141 ∗∗∗ 0.0022 –0.1068 ∗∗∗ 0.0152 –0.0860 ∗∗ 0.0250LAGWA 2 –0.0039 0.9495 –0.5460 ∗∗∗ 0.0000 0.4064 ∗∗∗ 0.0000OVAR + 0.0043 ∗∗∗ 0.0028 0.0001 0.7285 0.0047 ∗∗∗ 0.0012JOINT ? –0.0258 0.3081 –0.0630 ∗ 0.0658 0.0158 0.6007BIG 2 –0.005 0.8374 –0.0203 0.4283 0.0091 0.7331Intercept 0.4535 0.0000 0.3101 ∗∗∗ 0.0001 0.3349 ∗∗∗ 0.0000Annual fixed effects? Yes Yes YesIndustry fixed effects? Yes Yes Yes-2 Res Log Likelihood –736.3 –345.8 –436.0N (# Joint audits) 858 (72) 465 (38) 393 (34)
Panel B: Private firm sample.
|ABWA| ABWA if ABWA ≥0 ABWA if ABWA ,0
VariableExp.Sign Coef. Prob. Coef. Prob. Coef. Prob.
SIZE 2 –0.0099 ∗∗∗ 0.0000 –0.0101 ∗∗∗ 0.0000 –0.0106 ∗∗∗ 0.0003LOGAGE +/ 2 0.0117 ∗∗ 0.0401 0.0091 0.2180 0.0136 0.1092SALESG + 0.0438 0.1363 0.2217 ∗∗∗ 0.0000 –0.0297 0.4662OCF 2 0.0798 ∗∗∗ 0.0077 0.1440 ∗∗∗ 0.0002 0.0463 0.2342LOSS + 0.0343 ∗∗∗ 0.0083 0.0487 ∗∗∗ 0.0039 0.0342 ∗ 0.0773DTA +/ 2 0.0202 0.2478 0.0433 ∗∗ 0.0256 –0.0006 0.9838LAGWA 2 0.0844 ∗∗∗ 0.0035 0.1286 ∗∗∗ 0.0028 0.0355 0.4010OVAR + –0.0018 0.5308 –0.0012 0.7260 0.0079 0.2802TENURE +/ 2 –0.0025 ∗∗ 0.0476 –0.0024 0.1127 –0.0028 0.1666CASH +/ 2 0.0433 ∗ 0.0710 0.0057 0.8309 0.0628 ∗ 0.0700JOINT ? –0.0784 ∗∗∗ 0.0000 –0.0685 ∗∗∗ 0.0000 –0.0846 ∗∗∗ 0.0000Intercept 0.2900 ∗∗∗ 0.0000 0.2623 ∗∗∗ 0.0000 0.3164 ∗∗∗ 0.0000Annual fixed effects? Yes Yes YesIndustry fixed effects? Yes Yes Yes–2 Res Log Likelihood –833.8 –501.0 –330.7N (# Joint audits) 906 (453) 472 434
Notes:The dependent variable ABWA is the amount of abnormal working capital accruals; SIZE is the naturallogarithm of total assets in thousands of Swedish kronor; P/B is the price-to-book ratio; SALESG is thegrowth in sales over the prior year; OCF is the operating cash flow divided by beginning total assets;LOSS is a dummy variable with a value of one if the earnings are negative otherwise zero; DTA is theratio of debt to total assets; LAGWA is the amount of total working capital accrual in year t–1; OVARis the standard deviation of sales in billions of Swedish kronor over the years t–3 to t; JOINT is adummy variable with a value of one if the client firm employs a joint audit, otherwise zero; BIG is adummy variable with a value of one if the client firm employs a single Big 4 audit firm, otherwise zero;LOGAGE is the natural logarithm of firm age in years; TENURE is audit firm tenure in years. For thejoint audit observations, we designate the value of the audit firm with longer tenure. CASH is the ratioof cash and cash equivalents to total assets. Statistical significance based on two-tailed tests at the 1%,5%, and 10% levels are denoted by ∗∗∗, ∗∗, and ∗, respectively.
Do Joint Audits Improve Audit Quality? 19

Panel B of Table 5 presents the results for estimating equation (5b) among the
sample of privately held clients. As in Panel A, we report the results for the absolute
abnormal accruals in column (1) whereas columns (2) and (3) report the results for
the income-increasing and income-decreasing abnormal accruals, respectively.
As seen in column (1), we find that the estimated coefficient on the joint audit
indicator is highly significant and negative. The estimated negative relationship
holds for both the income-increasing and income-decreasing observations,
suggesting that the employment of joint audits among private companies is
associated with smaller abnormal working capital accruals. Note that the inherent
limitation of the matching approach is a diminished ability to draw inferences
from the control variables. However, according to the estimated results in
panel B, abnormal accruals increase with sales growth, accounting losses and
lagged level of accruals, while decreasing with client size. The estimated positive
coefficient on the lagged value of accruals suggests that they capture the time-
invariant factors omitted from our expectation model for working capital
accruals. Overall, the results from the analyses of both the public and private
client companies suggest that joint audits decrease earnings manipulations
through accounting accruals, resulting in a higher actual audit quality.
6. Multivariate Analysis: Perceived Audit Quality
6.1. Empirical Test for Perceived Audit Quality
Our next analyses are designed to test whether the decision to employ a joint audit
affects the credit raters’ perception of the quality of audits. Given that we do not have
credit ratings or risk forecasts available for public firms, we cannot conduct these
tests for the public firm sample. However, we refer to the results of Zerni et al.
(2010) for evidence that joint audits for publicly-listed firms are perceived to be
of higher quality. Hence, these analyses are only conducted among privately-held
firms. We use credit ratings and forecasts of insolvency risk as our proxies for
perceived audit quality. We estimate the following two equations to test hypotheses
2a and 2b, i.e. whether the employment of a joint audit affects a client company’s
perceived credit risk and hence the cost and access to debt capital:
RATE = a + b1SIZE + b2ROA + b3CONTROL + b4LOSS + b5LOGAGE
+ b6CASH + b7DTA + b8JOINT + fixed effects + 1
(6a)
RISKFORE = a + b1SIZE + b2ROA + b3CONTROL + b4LOSS
+ b5LOGAGE + b6CASH + b7DTA + b8JOINT + fixed effects + 1(6b)
where RATE is UC AB’s risk rating for the client firm on a scale ranging from 1 to
5, with higher values indicating lower credit risks (model 6a is estimated as an
20 M. Zerni et al.

ordered logit model). RISKFORE represents UC AB’s risk forecast for client firm
insolvency in percentages ranging from 0.01 to 99%, with higher values indicat-
ing higher risk.22 The other variables are as previously defined.
6.2. Results for the Perceived Audit Quality Tests
Panel A of Table 6 presents the descriptive statistics for the variables used in the
tests for perceived audit quality. The sample that we use in these tests consists of
424 joint audit observations (92 unique firms) and their propensity-score-
matched pairs of firms audited by a single Big 4 auditor (control group), or in
total 848 observations. Descriptive statistics in Table 6 indicate that most of
the firms included in the sample have low levels of perceived credit risk. In par-
ticular, the mean (median) risk rating is 4.58% (5%) while the mean (median) risk
forecast of insolvency is 0.74% (0.2%), indicating a normal-to-low (low) per-
ceived credit risk. In our sample, the risk forecast for the probability that a
company will become insolvent within the next 12 months ranges from 0.1 to
32% (i.e. from a very low to a very high level of credit risk). A simple univariate
t-test for the differences in means (untabulated) suggests that the credit ratings are
better on average (p-value , 0.01) and risk forecasts are lower (p-value ¼
0.039) for clients employing joint audits compared with the control group.
Hence, the univariate evidence supports hypotheses 2a and 2b (i.e. that joint
audits reduce perceived credit risk and thus facilitate the firm’s access to credit
capital).
Panel B of Table 6 reports the results for the multivariate regressions that test
hypotheses 2a and 2b. Column (1) reports the regression results for equation
(6b) with risk forecast as the dependent variable, and column (2) reports the
results for the ordered logit model defined in equation (6a). All of the control
variables with the exception of the indicator variable for the presence of a
controlling shareholder (CONTROL) are estimated as significant with
expected signs. Specifically, the client firm’s size, age, liquidity and
profitability are estimated to be significantly positively (negatively) related to
the risk ratings (\,forecasts) issued by the credit rating agency. Moreover,
high financial leverage and accounting losses are associated with worse credit
ratings but are not estimated to have any significant effects on the risk forecasts
of insolvency.
Results regarding our test variable (JOINT) provide support to our hypoth-
eses 2a and 2b that joint audits enhance the outsiders’ perception of audit
quality. More specifically, JOINT is estimated to have a positive (negative)
effect on credit ratings (risk forecasts). Economically, the estimated coefficient
on the joint audit indicator in column (1) suggests that the credit rating
agency’s assessment of the probability that a company becomes insolvent
within the next 12 months is, on average, 10 basis points lower for joint
audit clients than for their propensity-score-matched counterparts of single
Big 4 auditor clients. We conclude that even after using propensity score
Do Joint Audits Improve Audit Quality? 21

Table 6. Tests of perceived audit quality
Panel A: Descriptive statistics for the perceived audit quality tests among private firms
(N ¼ 848)
Variable Mean Std. Min 25%tile Median 75%tile Max
RISKFORE 0.742 2.140 0.010 0.100 0.2000 0.680 32.00
RATE 4.58 0.77 1 4 5 5 5
SIZE 9.35 2.83 3.05 7.38 9.12 11.27 17.43
ROA 0.042 0.192 –0.752 –0.005 0.040 0.113 0.763
CONTROL 0.798 0.401 0 1 1 1 1
DTA 0.676 0.279 0 0.491 0.769 0.901 0.992
LOGAGE 3.12 0.92 0.69 2.48 3.04 3.78 4.72
LOSS 0.271 0.445 0 0 0 1 1
CASH 0.169 0.245 0.001 0.006 0.044 0.258 0.873
JOINT 0.500 0.500 0 0 0.500 1 1
Panel B: Multivariate results for the perceived audit quality tests among private firms (N ¼ 848)
RISKFORE RATE
Variable Exp. sign Coef. Prob. Exp. sign Coef. Prob.
JOINT – –0.1049 ∗∗ 0.0284 + 0.3505 ∗∗ 0.0463
SIZE – –0.0663 ∗∗∗ 0.0000 + 0.3195 ∗∗∗ 0.0000
ROA – –0.4798 ∗∗∗ 0.0011 + 1.3266 ∗∗∗ 0.0013
LOSS + 0.1659 ∗∗∗ 0.0083 – –0.5534 ∗∗∗ 0.0062
CONTROL – –0.0627 0.3662 + 0.0116 0.9565
DTA + 0.1514 ∗ 0.0685 – –0.6903 ∗∗ 0.0378
LOGAGE – –0.2138 ∗∗∗ 0.0000 + 0.8756 ∗∗∗ 0.0000
CASH – –0.5700 ∗∗∗ 0.0000 + 3.1958 ∗∗∗ 0.0000
Intercept1 2.4317 ∗∗∗ 0.0000 –7.2488 ∗∗∗ 0.0000
Intercept2 –5.6949 ∗∗∗ 0.0000
Intercept3 –3.7144 ∗∗∗ 0.0000
Intercept4 –2.4844 ∗∗∗ 0.0000
Annual fixed
effects
Yes Yes
Likelihood ratio,
x2
302.67 0.0000
Nagelkerke R2 36.8 %
-2 Log Likelihood 1,767.9 1,135.91
Notes:RISKFORE is the risk forecast issued for the client firm by the credit rating agency; RATE is the riskrating issued for the client firm by the credit rating agency; SIZE is the natural logarithm of total assetsin thousands of Swedish kronor; ROA is the interest adjusted return on the opening total assets;CONTROL is a dummy variable with a value of one if the firm has a controlling shareholder,otherwise zero; DTA is the ratio of debt to total assets; LOGAGE is the natural logarithm of firmage in years; LOSS is a dummy variable with a value of one if the earnings are negative, otherwisezero; CASH is the ratio of cash and cash equivalents to total assets; JOINT is a dummy variablewith a value of one if the client firm employs a joint audit, otherwise zero.
22 M. Zerni et al.

matching to control for potential endogeneity due to omitted client character-
istics, the evidence supports our hypotheses 2a and 2b that joint audits lower
outsiders’ perceived credit risk and thus facilitate the firm’s access to credit
capital.
7. Multivariate Analysis: Audit Fees
7.1. Audit Fees as a Proxy for Perceived Audit Quality
As a test of differences in perceived audit quality between joint audits and single
auditor audits among listed firms, we examine whether joint audits are associated
with higher audit fees. In a voluntary setting, an observed willingness to pay for
higher fees can be interpreted to indicate a higher perceived or experienced
quality of services (Moizer, 1997; Riley, 2001). In particular, clients may be
willing to pay more for joint audits if they perceive the market-assessed level
of quality associated with joint audits to be higher (cf. Yardley et al., 1992). In
other words, the client’s motivation to pay a premium may arise from the need
for a mechanism that signals ‘good news’ to the market (Teoh and Wong,
1993; Titman and Trueman, 1986). Voluntary joint audits may represent such
a mechanism.
We control for the relevant audit fee determinants identified in prior studies (e.g.
Choi et al., 2010; Craswell and Francis, 1999; Francis et al., 2005; Hay et al., 2006;
Niemi, 2004; Simunic, 1980; Zerni, 2012). We estimate the following model
by using the maximum likelihood principle from our unbalanced panel data:23
AFEES = a + b1SIZE + b2SQEMP + b3QR + b4ROA + b5DTA + b6INVREC
+ b7LOGNAS + b8LOSS + b9JOINT + b10BIG + fixed effects + 1
(7)
where the dependent variable AFEES is measured as the natural logarithm of the
audit fees; SQEMP represents the square root of the number of employees; QR
is the quick ratio; INVREC is the sum of the inventories and receivables divided
by total assets; and LOGNAS represents the natural logarithm of non-audit fees
in Swedish kronor that are paid to the incumbent auditor. The other variables are
as previously defined.
7.2. Results for the Tests of Audit Fees
Table 7 reports the descriptive statistics for the variables used in the analyses of
audit fees. The public company sample that we used in the audit fee tests includes
a total of 109 joint audits from 25 unique firms (untabulated).24 The average
(median) audit fee is 5.1 million (1.18 million) SEK while the mean (median)
ratio of non-audit fees to audit fees is 65.9% (46.7%). The Big 4 firms dominate
Do Joint Audits Improve Audit Quality? 23

the Swedish public company audit market as indicated by their 90.6% market
share of single auditor clients.
Table 7 also indicates that the audit fees paid to dual auditors are far from
equal, suggesting that one of the auditors tends to be mainly responsible for con-
ducting the actual audit planning and tests. However, the second auditor’s share
of the non-audit fee revenue is closer to that of the first auditor.25 Some clients
even purchase all their consulting services from the second auditor. Univariate
test statistics for differences in means (untabulated) indicate that the clients of
dual auditors pay significantly higher audit fees than the clients of single auditors
(p-value , 0.000).
Table 7. Descriptive statistics for variables used in audit fee tests (N ¼ 1,162).
Panel A: Public firm sample.
Variable Mean Std. Min 25% Median 75% Max
JOINT 0.094 0.292 0 0 0 0 1BIGa 0.906 0.292 0 1 1 1 1AFEE (MSEK) 5.09 11.79 0.03 0.50 1.18 3.70 130.00NAS (MSEK) 3.21 9.91 0 0.18 0.57 2.00 121.00FEERATIO 0.659 0.762 0 0.246 0.467 0.810 10.175SIZE 13.97 2.05 8.89 12.48 13.63 15.20 19.35SQEMP 48.71 64.07 1 13.82 25.37 52.53 465.82LOSS 0.163 0.369 0 0 0 0 1INVREC 0.355 0.188 0.001 0.213 0.356 0.485 0.931DTA 0.175 0.158 0 0.020 0.151 0.288 0.747ROA (%) –1.78 23.87 –133.36 –3.02 4.85 9.33 40.42QR 1.82 2.51 0.08 0.82 1.14 1.77 37.33
Panel B: Descriptive statistics on the distribution of fees among listed joint audit clients.
Variable Mean Std. Min 25% Median 75% Max
SHARE AFEES 0.228 0.138 0.032 0.095 0.213 0.337 0.495SHARE NAS 0.325 0.319 0 0.033 0.232 0.500 1
Notes:a Conditional on the firm employing a single-audit firm. JOINT is a dummy variable with a value ofone if the client firm employs a joint audit, otherwise zero; BIG is a dummy variable with a value ofone if the client firm employs a single Big 4 audit firm, otherwise zero; AFEE (MSEK) is the audit feesin millions of Swedish kronor paid to incumbent auditor(s); NAS (MSEK) is the non-audit fees inmillions of Swedish kronor paid to the incumbent auditor; FEERATIO is the ratio of non-audit fees toaudit fees. Regarding joint audits, we calculate the ratio on the basis of the fees paid to the incumbentauditor that receives a larger share of the audit fees; SIZE is the natural logarithm of the total assets inthousands of Swedish kronor; SQEMP is the square root of the number of employees; LOSS is adummy variable with a value of one if the earnings are negative, otherwise zero; INVREC is the sum ofthe inventories and receivables divided by total assets; DTA is the ratio of debt to total assets; ROA (%)is the interest-adjusted return on the opening total assets; QR is the quick ratio; SHARE AFEES is thesecond auditor’s share of the total audit fees; and SHARE NAS is the second auditor’s share of the totalnon-audit fees.
24 M. Zerni et al.

Table 8 reports the results obtained by regressing audit fees on a set of control
variables and the research variables identified in equation (7). Column (1) reports
the results obtained when using an indicator variable for the joint audits
while column (2) reports results for the firm-fixed effect-extension of Model
(equation (7)).26
As shown in Table 8, our empirical fee model is well specified, explaining a
considerable portion of the variation in fees (with an adjusted R-squared value
of roughly 90%). In both model specifications, most of the estimated coefficients
Table 8. Regression analysis of audit fees.
AFEES AFEES
Variable Exp. Sign Coef. Prob. Coef. Prob.
Experimental variablesJOINT ? 0.5703 ∗∗∗ 0.0062 0.9926 ∗∗ 0.0156BIG + 0.4466 ∗∗∗ 0.0011 0.5823 0.1528Control variablesSIZE + 0.5579 ∗∗∗ 0.0000 0.3290 ∗∗∗ 0.0000SQEMP + 0.0030 ∗∗∗ 0.0014 0.0030 0.2255QR 2 –0.0510 ∗∗∗ 0.0000 –0.0313 ∗∗∗ 0.0016ROA 2 –0.1200 0.3651 –0.0570 0.6740DTA + 0.0183 0.9294 –0.0075 0.9626INVREC + 0.5957 ∗∗ 0.0119 0.6864 ∗∗∗ 0.0036LOGNAS + 0.0344 ∗∗ 0.0272 0.0423 ∗ 0.0733LOSS + –0.1058 0.2449 0.1042 0.1495Intercept 5.4361 ∗∗∗ 0.0000 8.7188 ∗∗∗ 0.0000Annual fixed effects? Yes YesIndustry fixed effects? Yes NoFirm fixed effects? No YesaAdjusted R2 87.8 % 93.5 %–2 Res Log Likelihood 1904.6 1286.4N (# joint audits) 1,162 (109) 1,162 (109)
Notes:a Maximum likelihood methods do not compute the sums of squares. However, by calculating theresidual and total sums of squares, we can report the adjusted R-square statistics to facilitate thecomparability between related studies. The dependent variable AFEES is the natural logarithm ofaudit fees in Swedish kronor paid to the incumbent auditor(s); JOINT is a dummy variable with avalue of one if the client employs two or more audit firms to conduct a joint audit, otherwise zero;BIG is a dummy variable with a value of one if the auditor is a member of the Big 4 auditors,otherwise zero; SIZE is the natural logarithm of the total assets in thousands of Swedish kronor;SQEMP is the square root of the number of employees; QR is the quick ratio; ROA is the interest-adjusted return on the opening total assets; DTA is the ratio of debt to total assets; INVREC is thesum of the inventories and receivables divided by total assets; LOGNAS is the natural logarithm ofnon-audit fees in Swedish kronor paid to the incumbent auditor(s); LOSS is a dummy variable witha value of one if the earnings are negative, otherwise zero. Statistical significance based on two-tailed tests at the 1%, 5%, and 10% levels are denoted by ∗∗∗, ∗∗, and ∗, respectively. Furthermore,statistical significances are calculated by adjusting the standard errors for firm level clustering(Petersen 2009) and heteroskedasticity (White 1980). For simplicity, results for the fixed effectsare not reported.
Do Joint Audits Improve Audit Quality? 25

of control variables have the expected signs and are statistically significant. The
estimated coefficient of the joint audit indicator (JOINT) is positive and highly
significant (p-value , 0.01). Thus, the estimated results suggest that joint
audits are associated with significantly higher audit fees relative to single
auditor audits. Moreover, the Big 4 indicator (BIG) is estimated to be positive
and significant, suggesting that a Big 4 audit fee premium exists among the
clients of single auditors. However, the magnitude of the coefficient of the vari-
able JOINT is significantly larger than that of the variable BIG. The null hypoth-
esis in the LR-test for the equality of the parameter estimates is rejected at a level
lower than 0.001. The estimated results in column (1) suggest the following three-
level hierarchy of perceived audit quality: joint audits, single Big 4 audits and
single non-Big 4 audits. The magnitude of the economic effect of auditor
choice on audit fees is relatively large. Specifically, the estimated coefficients
in column (1) suggest that the clients of joint auditors pay on average 13.2%
(76.9%) cent higher audit fees than the clients of a single Big 4 (non-Big 4)
auditor.
In column (2), we attempt to control for unobservable firm heterogeneity by
including firm-fixed effects into the audit fee model.27 During our audit fee
sample period 2000–2006, 17 firms changed their status from single-firm audit
to joint audit or vice versa, allowing the use of fixed effect extensions. After con-
trolling for the unobservable, time-invariant, firm-specific characteristics, our
results are broadly consistent with the results reported in Column 1. Estimated
results show that the largest fee premium is attributable to joint audits. Consistent
with our main tests, the findings from our audit fee tests hence provide support for
the perceived higher quality of joint audits as compared with single auditor
audits.28
8. Conclusions
This study investigates whether a voluntary joint audit is related to actual and per-
ceived audit quality and the pricing of audit engagements in a relatively low liti-
gious setting, Sweden, where a sufficient number of client firms have voluntarily
(i.e. without a statutory obligation) opted to employ two audit firms to conduct a
joint audit, which allows studying this issue.
Our empirical findings indicate that the employment of a joint audit is associ-
ated with a higher degree of earnings conservatism for both public and private
firms. Joint liability essentially means that both auditors bear the (potentially)
incremental audit risk arising from the likelihood that the other auditor fails to
perform its share of the audit work. Hence, the increased conservatism may at
least partially be attributed to each auditor’s response to the information asymme-
try about the other auditor’s actions (i.e. the potential ‘free-rider problem’).
Moreover, it is less likely that the two audit firms simultaneously acquiesce to
client pressure in client-auditor negotiations on accounting choices, resulting in
a higher degree of auditor independence and ultimately audit quality. Consistent
26 M. Zerni et al.

with our findings on earnings conservatism, we also find evidence for both public
and private firms, suggesting that employing joint audits is associated with lower
income-increasing abnormal accruals and implying higher audit quality.
For private firms, we test and find evidence supporting the view that employing
two audit firms enhances the financial statement user’s perception of audit quality
proxied by credit ratings and risk forecasts of insolvency. This finding is consist-
ent with both the enhanced independence of joint audits and the insurance
hypothesis of auditing predicting that joint audits provide a better ‘insurance
value’ for providers of funding as two audit firms have ‘deeper pockets’ in the
event of an audit failure than either of them alone.
However, the decision to employ joint audits does not come without additional
costs. More specifically, our tests of audit pricing among publicly listed compa-
nies suggest a three-level audit-fee hierarchy. The largest, second largest and
smallest fees are paid by clients employing joint audits, single Big 4 auditors,
and single non-Big 4 auditors, respectively. Given free market choice and econ-
omically rational actors, we can assume that joint audit decisions generate the
highest value for this particular segment of client firms.29 Therefore, the fee
premium may be considered an indication of the client firm’s willingness to
pay more for a higher actual and perceived audit quality and to enable a
greater faith in the auditing product.
An inherent limitation of the empirical approach is that the matching process
fails to consider all of the relevant pre-treatment attributes. However, our propen-
sity score matching procedure successfully balances the differences with respect
to all of the dimensions used in the matching process. We also employ a set of
control variables to capture any potential remaining differences between the
treatment and control groups. Nevertheless, we cannot completely rule out the
possibility that the differences in our proxies for audit quality stem from uncon-
trolled differences in client characteristics rather than auditor characteristics.
Another limitation regarding our tests on the association between joint audits
and credit ratings is that it is impossible to disentangle the effects of perceptions
of audit quality from the effects of the higher insurance value of joint audits on
credit ratings with archival data.
The empirical evidence presented by the current study should be of interest to
those debating the benefits and costs associated with joint audits in the EU and
other countries. Our study adds to prior studies that have examined joint audits
under mandatory regimes (e.g. Andre et al., 2009; Francis et al., 2009;
Gonthier-Besacier and Schatt, 2007; Piot, 2007; Thinggaard and Kiertzner,
2008). Research settings under mandatory joint audit regimes are hampered by
the difficulties of capturing the potential effects of joint audits per se. In our
setting of voluntary joint audits, all institutional factors are fixed, including the
auditors’ exposure to legal liability. This setting helps to disentangle the potential
effects of joint audits per se on audit quality and fees. Overall, the results of this
study suggest that in the Swedish audit market, the decision to voluntarily appoint
two audit firms instead of one results in higher-quality audits but that this
Do Joint Audits Improve Audit Quality? 27
benefit is accompanied by increased audit costs. Future research on different
jurisdictions and/or using alternative methodologies is needed to shed more
light on the question of whether joint audits improve audit quality and at
what cost.
Acknowledgements
We appreciate the comments received from Ann Vanstraelen (the associate
editor), two anonymous reviewers, Jean C. Bedard, Kris Hardies, Henry Jarva,
Robert Knechel and Petri Sahlstrom. We would also like to thank the participants
at the Third Workshop on Audit Quality in Lake Como, Italy (2010), the 34th
European Accounting Association Annual Congress in Rome, Italy (2011), the
17th Annual International Symposium on Audit Research in Quebec, Canada
(2011) and a research seminar at the University of Vaasa, Finland (2010).
Elina Haapamaki gratefully acknowledges the financial support received from
the Jenny and Antti Wihuri Foundation, the Marcus Wallenberg Foundation,
the Foundation for Economic Education and Nordea Bank Foundation. Mikko
Zerni also gratefully acknowledges the financial support received from the
Finnish Cultural Foundation, the Finnish Foundation for Economic Education,
and the Marcus Wallenberg Foundation. This research is part of the research
project of the Academy of Finland, Grant Numbers 140000 and 126630. Any
remaining errors are our own.
Notes
1Several recent high-profile reports in the US, UK and European Union have raised similar con-
cerns. See for the US: United States General Accounting Office (2003, 2008), Advisory Com-
mittee on the Auditing Profession (2008), Center for Audit Quality (AICPA) (2008), The
American Assembly (2005) and US Chamber of Commerce (2006, 2007). For the UK:
Oxera Consulting (2006), Audit and Assurance Faculty (ICAEW) (2005) and Office of Fair
Trading (2004). For the European Union: London Economics (2006), Oxera Consulting
(2007) and Commission of the European Communities - Directorate General for Internal
Market and Services (2008) (cf. Sirois and Simunic, 2010).2An easier and more cost-effective solution could be to mandate joint audits for only some
specific class of client firms (e.g. financial intermediaries and very large companies). For
instance, joint audits in Sweden are mandated only in the finance sector. As another safeguard
to protect the (perceived) integrity of the audit process, the second auditor for the finance sector
firms is appointed by the Swedish Financial Supervisory Authority (Finansinspektionen) and
not by the client firms themselves. These regulations may be interpreted as meaning that the
legislature in Sweden has taken the perspective that joint audits would provide more indepen-
dent and higher quality assurance on the fairness of the client firms’ financial statements. The
current credit crisis has further amplified discussion regarding the effectiveness of corporate
governance devices. Effective monitoring mechanisms are of crucial importance, especially
with respect to the finance sector, in which corporate governance failure can lead to major nega-
tive market-wide externalities such as the drying up of liquidity in the financial markets.3It is important to note that in our analyses, there are no pairings of non-Big 4 firms.
28 M. Zerni et al.

4In general, the research on the effects of joint audits on audit quality and fees is scarce because
joint audits are unusual. In Europe, the only country currently requiring mandatory joint audits
is France, which has done so since 1966 (though Denmark also did so from 1930 until 2004).
Other countries with a joint audit requirement include Algeria, Morocco, the Ivory Coast,
Tunisia, Congo, Saudi Arabia and Kuwait. The main argument for abolishing the joint audit
requirement in Denmark was that it was a burden on Danish companies (Hasselager et al.,
1997). Consistent with this view, Thinggaard and Kiertzner (2008) report that after the abolition
of two-auditor system in 2004, 15 of the 63 (23.8%) companies investigated retained two audi-
tors in the next year. However, it is noteworthy that more than one-fifth of the companies still
decided to retain two audit firms. Exploring the determinants of this decision after regime
change would potentially provide some interesting insights into audit demand. An interesting
concurrent working paper by Holm and Thinggaard (2011) addresses these issues, among
others.5Interestingly, the descriptive statistics presented in Panel B of Table 7 for publicly-listed client
companies actually show that some of the clients that employ joint audits purchase all of their
non-audit services from the auditor that has a smaller share of the audit fee revenues. In this
regard, note that neither the Swedish law nor the Swedish Code of Corporate Governance
impose any specific guidance regarding the extent and type of consulting services that would
not be within acceptable limits. Nevertheless, in some rare occasions the provision of advisory
services might cause an auditor to resign from an audit engagement.6We wish to thank an anonymous reviewer for making this point.7FAR SRS (the professional institute for authorised public accountants, approved public accoun-
tants and other highly qualified professionals in the accountancy sector in Sweden) offers group
insurance to all of its members. The minimum coverage per claim is approximately E900,000.8Even though lawsuits against auditors are rare in Sweden, the legal liability risk exists. Specifi-
cally, there are out-of-court settlements and court cases. For an example of a court decision
awarding damages to investors (banks) that purchased shares in a company (granted credit)
on the basis of inaccurate accounts certified by the statutory auditor, see: NJA 1994:63 (NJA
1996:224). There is no legal liability cap in Sweden, and third parties can sue the auditor
within ten years from the time that the damage occurred. A statutory audit is considered to
be in the interest of not only the company but also the public. As a result, any third party
may recover damages from the statutory auditor upon providing proof for the elements of
the liability claim, which usually focuses on fault, damages and causation.9Entrenchment problems arise from the possibility that large shareholders opt to use their power
to expropriate minority shareholders by taking actions and investment decisions serving their
own interests leading to suboptimal outcomes for outside shareholders (see for instance, Claes-
sens et al., 2000; La Porta et al., 1999). Separation of control (voting rights) from ownership
(cash-flow rights) further exacerbates the agency problem because the controlling shareholder
will not bear the full cost resulting from his/her decisions.10Note that the low number of publicly listed Swedish companies does not allow us to employ
propensity score-based matching for the subsample of public firms. This is simply because suf-
ficiently close peer firms are not available to enable a successful matching process.11The initial sample of observations includes all of the auditors and their clients, appointed either
as an audit partner in-charge or as a deputy auditor for at least one publicly listed company from
2001 to 2008. For more details, we refer the reader to Knechel et al. (2012), who employ a
similar data set from the same source.12Propensity score matching aims to simultaneously isolate a wide set of client characteristics
from the treatment effects. The major advantages of the propensity score matching method
(or any other peer-based matching approach) are that it does not rely on a specific functional
form and does not require appropriate exogenous instrumental variables (exclusion restrictions
in the first stage, a difficult condition to meet for models predicting auditor choice) (Lawrence
et al., 2011; Lennox et al., 2012; Li and Prabhala, 2007).
Do Joint Audits Improve Audit Quality? 29

13Inferences remain qualitatively similar if the replacement is matched. Distance is the difference
between the predicted probabilities of choosing the treatment according to the estimated logit
model between matched pairs (Dehejia and Wahba, 2002; Lawrence et al., 2011).14In untabulated results, we estimate and match the propensity scores within each economic sector
rather than using indicator variables using the following industry sectors: manufacturing, retail,
services, hotel and restaurants, transport, real estate and other/miscellaneous. Results from
these analyses yield similar inferences to those reported in all relevant aspects. Note that
because of the relatively low number of unique firms employing joint audits, we cannot use
more precise industry categories.15Note that in each test, missing information for one observation leads to the exclusion of two
observations: the treatment observation and its propensity-score-matched counterpart.16Note that critiques of the Basu (1997) earnings conservatism model also exist (see, for example,
Dietrich et al., 2007; Gigler and Hemmer, 2001; Givoly et al., 2007; Jarva, 2010).17For the sake of brevity, we do not report the correlation matrices.18Approximately 27% of the joint audit observations have negative operative cash flow, compared
with 26% for the propensity-score-matched clients of the single Big 4 auditors.19However, while the differences in estimated parameters appear to be economically significant,
the LR-test statistic for equality of the parameters R∗DR∗JOINT and R∗DR∗BIG cannot be stat-
istically rejected. Furthermore, VIF values for some of the interaction effects are high because
of the common underlying variable R. However, all these values are below 11. According to
Belsley et al. (2005), collinearity is a potential problem in a regression when the condition
number is above 20 and a severe problem if it is above 30.20The problem with using the Jones (1991) model and its extensions is that there are limited
numbers of Swedish firms in specific industries, resulting in substantially fewer observations
and less precise parameter estimates. Small industry samples have been cited as one reason
why the Jones model does not perform well on non-US data (Meuwissen et al. 2007). The
DeFond and Park (2001) model is not curtailed by the number of within-industry observations
and has been employed in several other recent audit research papers (e.g. Carey and Simnett,
2006; Francis and Wang, 2008; Francis et al., 2009; Maijoor and Vanstraelen, 2006).21We have also tested whether the level of abnormal accruals or our other proxies for audit
quality are significantly different for the joint audits conducted by two Big 4 audit firms com-
pared with a pairing of Big 4 and non-Big 4 audit firms (untabulated). More specifically, we
allowed the coefficient on our test variables to vary between joint audits conducted by two
Big 4 audit firms. The results of estimating these model specifications show that the additional
variable(s) is (are) not significant throughout the estimations while the inferences from the
joint audit indicator (JOINT) and its interactions remain unchanged. Hence, the empirical
evidence suggests that joint audits per se are better in terms of audit quality than the audits
conducted by a single Big 4 or a single non-Big 4 auditor. However, because of the relatively
small number of unique firms employing joint audits, especially in the public firm sample,
these additional tests may suffer from low statistical power. Note that to avoid severe multi-
collinearity problems, we cannot conduct a similar model extension regarding Basu’s earnings
conservatism tests reported in panel A of Table 3. In particular, in these analyses the variance
inflation factors (VIF) would be over 30 because of the common underlying variable stock
return (R).22The UC AB stated, ‘Risk Forecast states how great the probability is that a company will
become insolvent within the next year, i.e., it states with great precision the risk that the
company will be unable to fulfill its payment obligations’. In forming the rating (risk forecast)
for a limited liability company, UC AB considers the following aspects, among others: account-
ing information, key ratios, payment complaints, board information and ownership structure.
For more details about the credit ratings and risk forecasts, see https://www.uc.se/en/source.
php/1084640/UC%20Riskf%F6retag%20-%20Description%20eng.pdf.
30 M. Zerni et al.

23Maximum likelihood methods do not compute the sums of squares. However, by calculating the
residual and total sums of squares, we can report the adjusted R-square statistics to facilitate
comparability between related studies.24Although privately-held Swedish clients are required to report information about their audit fees
in the notes of their financial statements, there is no database from which this information can be
readily extracted. To economise the data collection process, we rely on our sample of publicly
listed companies when examining the effect of joint audit selection on audit fees.25The audit firm that receives the largest amount of revenue through audit fees is designated as the
first auditor.26We also estimate the model by including a random firm intercept instead of firm-fixed effects
(assuming that the random intercept is normally distributed and treating its non-zero mean and
variance as parameters). The results that we obtain from this analysis are qualitatively similar to
those reported in Table 8. However, the LR-test statistics strongly support the use of a firm-fixed
effect extension over random effects (x2 ¼ 240.5, p-value , 0.0001).27However, it should be noted that with respect to largely time-invariant variables, the use of firm-
fixed effects in regressions may remove true (cross-sectional) variation and thereby fail to detect
a relationship in the data even when it exists (e.g. Zhou 2001).28To confirm that the results are not caused by a few outlying observations, we either trimmed or
winsorised all of the continuous variables at the 1% and 99% levels and re-estimated all of our
models. In these analyses, the empirical findings remain qualitatively similar to the main results
reported in this study.29We wish to thank an anonymous Reviewer for noting this implication.
References
Advisory Committee on the Auditing Profession (2008) Final report of the advisory committee on the
auditing profession to the U.S. Department of the Treasury. Washington, DC.
Andre, P., Broye, G., Pong, C. and Schatt, A. (2009) Audit fees, big four premium and institutional
settings: The devil is in the details!. http://ssrn.com/abstract=1554842.
Audit and Assurance Faculty (2005) Shareholder involvement – competition and choice, Audit
Quality Forum: 20. London, UK: The Institute of Chartered Accountants in England & Wales.
Ball, R. and Shivakumar, L. (2005) Earnings quality in UK private firms: comparative loss recognition
timeliness, Journal of Accounting and Economics, 39(1), pp. 83–128.
Basu, S. (1997) The conservatism principle and the asymmetric timeliness of earnings, Journal of
Accounting and Economics, 24(1), pp. 3–37.
Becker, C., DeFond, M., Jiambalvo, J. and Subramanyam, K. R. (1998) The effect of audit quality on
earnings management, Contemporary Accounting Research, 15(1), pp. 1–24.
Belsley, D. A., Kuh, E. and Welsch, R. E. (1980) Regression Diagnostics: Identifying Influential Data
and Sources of Collinearity Wiley.
Belsley, D. A., Kuh, E. and Welsch, R. E. (2005) Author Index, in Regression Diagnostics: Identifying
Influential Data and Sources of Collinearity. John Wiley & Sons, Inc., Hoboken, NJ, USA. doi:
10.1002/0471725153.indauth
Botosan, C. A. (1997) Disclosure level and the cost of equity capital, The Accounting Review, 72
(July), pp. 323–349.
Carcello, J. V. and Nagy, A. L. (2004) Audit firm tenure and fraudulent financial reporting, Auditing:
A Journal of Practice & Theory, 23(September), pp. 55–69.
Carey, P. and Simnett, R. (2006) Auditor partner tenure and audit quality, The Accounting Review,
81(3), pp. 653–676.
Center for Audit Quality (2008) Comment Letter to the Advisory Committee on the Auditing Pro-
fession: 41. Washington, DC: Affiliated with the American Institute of CPAs.
Do Joint Audits Improve Audit Quality? 31

Choi, J. H., Kim, J. B., Liu, X. and Simunic, D. (2008) Audit pricing, legal liability regimes, and Big 4
premiums: theory and cross-country evidence, Contemporary Accounting Research, 25(1), pp.
55–99.
Choi, J. H., Kim, J. B., Liu, X. and Simunic, D. (2009) Cross-listing audit fee premiums: theory and
evidence, The Accounting Review, 84(5), pp. 1429–1463.
Choi, J.-H., Kim, F., Kim, J-B. and Zang, Y. (2010) Audit office size, audit quality and audit pricing,
Auditing: A Journal of Practice and Theory, 29(1), pp. 73–97.
Claessens, S., Djankov, S. and Lang, L. H.P. (2000) The separation of ownership and control in East
Asian corporations, Journal of Financial Economics, 58(1-2), pp. 81–112.
Coles, J. L. and Lowenstein, U. (1988) Equilibrium pricing and portfolio composition in the presence
of uncertain parameters, Journal of Financial Economics, December, pp. 279–303.
Commission of the European Communities – Directorate General for Internal Market and Services
(2008) Commission Recommendation Concerning the Limitation of the Civil Liability of Statu-
tory Auditors and Audit Firms: 78. Brussels, Belgium: European Commission.
Craswell, A. and Francis, J. R. (1999) Pricing initial audit engagements: a test of competing theories,
The Accounting Review, 74(2), pp. 201–216.
Datta, S., Iskandardatta, M. and Patel, A. (1999) Bank monitoring and the pricing of corporate public
debt, Journal of Financial Economics, 51, pp. 435–449.
DeAngelo, L. E. (1981a) Auditor independence, ‘low balling’ and disclosure regulation, Journal of
Accounting & Economics, 3(2), pp. 113–127.
DeAngelo, L. E. (1981b) Auditor size and audit quality, Journal of Accounting and Economics, 3(3),
pp. 183–200.
Dechow, P., Kothari, S. and Watts, R. (1998) The relation between earnings and cash flows, Journal of
Accounting & Economics, 25, pp. 133–168.
DeFond, M. L. (1992) The associations between changes in client firm agency cost and auditor switch-
ing, Auditing: A Journal of Practice and Theory, 11(1), pp. 16–31.
DeFond, M. L. and Jiambalvo, J. (1994) Dept covenant violation and manipulation of accruals,
Journal of Accounting and Economics, 17(1-2), pp. 145–176.
DeFond, M. L. and Park, C. W. (2001) The reversal of abnormal accruals and the market valuation of
earnings surprises, The Accounting Review, 76(3), pp. 375–404.
Dehejia, R. and Wahba, S. (2002) Propensity score-matching methods for nonexperimental causal
studies, The Review of Economics and Statistics, 84(1), pp. 151–161.
Dietrich, J. R., Muller, K. A. and Riedl, E. J. (2007) Asymmetric timeliness tests of accounting con-
servatism, Review of Accounting Studies, 12(1), pp. 95–124.
Dye, R. (1993) Auditing standards, legal liability, and auditor wealth, The Journal of Political
Economy, 5, pp. 877–914.
Eilifsen, A. and Willekens, M. (2008) In the name of trust; some thoughts about trust, audit quality and
audit regulation in Europe, in: R. Quick, S. Turley and M. Willekens (Eds) Auditing, Trust &
Governance – Developing Regulation in Europe (London, UK: Routledge).
European Commission (2010) Audit policy: lessons from the crisis, Green Paper.
Financial Times (2007) The small numbers causing a big stir, Financial Times, 6 September
2007.
Francis, J. R. (2004) What do we know about audit quality? The British Accounting Review, 36(4), pp.
345–368.
Francis, J. R. and Wang, D. (2008) The joint effect of investor protection and Big 4 audits on earnings
quality around the world, Contemporary Accounting Research, 25(1), pp. 157–191.
Francis, J. R. and Wilson, E. R. (1988) Auditor changes: a joint test of theories relating to agency costs
and auditor differentiation, The Accounting Review, 63(4), pp. 663–682.
Francis, J. F., Reichelt, K. and Wang, D. (2005) The pricing of national and city-specific
reputations for industry expertise in the US audit market, The Accounting Review, 80(1),
pp. 113–136.
32 M. Zerni et al.

Francis, J. R., Richard, C. and Vanstraelen, A. (2009) Assessing France’s joint audit requirement: are
two heads better than one? Auditing: A Journal of Practice and Theory, 28(2), pp. 35–63.
Gigler, F. B. and Hemmer, T. (2001) Conservatism, optimal disclosure policy and the timeliness of
financial reports, The Accounting Review, 76(4), pp. 471–493.
Givoly, D., Hayn, C. and Natarajan, A. (2007) Measuring reporting conservatism, The Accounting
Review, 82(1), pp. 65–106.
Gonthier-Besacier, N. and Schatt, A. (2007) Determinants of audit fees for French quoted firms, Man-
agerial Auditing Journal, 22(2), pp. 139–160.
Grossman, S. J. and Stiglitz, J. E. (1976) Information and competitive price systems, The American
Economic Review, 66(2), pp. 246–253.
Hasselager, O., Johansen, A. R. and Ring, N. A. (1997) Revisorlovgivningen med kommentarer, 2nd
edn (Forlaget FSR).
Hay, D., Knechel, W. R. and Wong., N. (2006) Audit fees: a meta-analysis of the effect of supply and
demand attributes, Contemporary Accounting Research, 23(1), pp. 141–191.
Heckman, J., Ichimura, H. and Todd., P. (1997) Matching as an econometric evaluation estimator:
Evidence from evaluating a job training programme, The Review of Economic Studies, 64(4),
pp. 605–654.
Herbinet, D. (2007a) Two’s company, Accountancy, (March), pp. 80–81.
Herbinet, D. (2007b) Competitive audit market would foster innovation. Letter to the editor, Financial
Times Asia Edition, 23 (May): 12.
Holm, C. and Thinggaard, F. (2011) Joint audits – benefit or burden? Working paper.
Hribar, P. and Nichols., C. (2007) The use of unsigned earnings quality measures in tests of earnings
management, Journal of Accounting Research, 45(5), pp. 1017–1053.
Jarva, H. (2010) Asymmetry in cash flows and accounting conservatism. Available at: http://ssrn.com/
abstract=1270122.
Jensen, M. and Meckling, W. (1976) Theory of the firm: managerial behaviour, agency costs, and
ownership structure, Journal of Financial Economics, 3 (September): 303–360.
Johnson, B. W. and Lys, T. (1990) The market for audit services, Journal of Accounting and Econ-
omics, 12(1-3), pp. 281–308.
Johnson, E., Khurana, I. K. and Reynolds, K. J. (2002) Audit-Firm Tenure and the Quality of Financial
Reports, Contemporary Accounting Research, 19(4), pp. 637–660.
Jones, J. (1991) Earnings management during import relief investigations, Journal of Accounting
Research, 29(2), pp. 193–228.
Kargupta, H., Das, K. and Liu, K. (2007) A game theoretic approach toward multiparty privacy-pre-
serving distributed data mining, LNCS, 4702:523. [doi:10.1007/978- 3-540-74976-9.]
Kauppalehti (2011a) EU-komissio valmistelee kahden tilintarkastajan pakkoa, 7.6.2011.
Kauppalehti (2011b) Kaksi tilintarkastajaa hyodyttaisi yrityksia, 31.8.2011.
Knechel, W. R., Niemi, L. and Zerni, M. (2012) Empirical evidence on the implicit determinants of
compensation in big four audit partnerships, Working paper.
Kothari, S. P., Leone, A. and Wasley, C. (2005) Performance matched discretionary accrual measures,
Journal of Accounting and Economics, 39(1), pp. 163–197.
LaFond, R. and Watts, R. L. (2008) The information role of conservatism, The Accounting Review,
8(2), pp. 447–478.
La Porta, R., Lopez-De-Silanes, F., Schleifer, A. and Vishny, R. (1999) Corporate ownership around
the world, Journal of Finance, 54(2), pp. 471–517.
Lambert, R. A., Leuz, C. and Verrecchia, R. E. (2007) Accounting information, disclosure, and the
cost of capital, Journal of Accounting Research, 45(2), pp. 385–420.
Lawrence, A., Minutti-Meza, M. and Zhang, P. (2011) Can big 4 versus non-big 4 differences
in audit-quality proxies be attributed to client characteristics? Accounting Review, 86(1),
pp. 259–286.
Lennox, L. (2005) Management ownership and audit firm size, Contemporary Accounting Research,
22, pp. 205–227.
Do Joint Audits Improve Audit Quality? 33

Lennox, C., Francis, J. and Wang, Z. (2012) Selection models in accounting research, The Accounting
Review, 87(2), forthcoming.
Li, K. and Prabhala, N. (2007) Self-selection models in corporate finance, in: B.E. Eckso (Eds)
Handbook of Corporate Finance: Empirical Corporate Finance (Handbooks in Finance
Series) (Amsterdam, The Netherlands: Elsevier Science B.V.).
London Economics (2006) Study on the economic impact of auditors’ liability regimes Final report to
EC-DG Internal Market and Services (MARKT/2005/24/F). Available at: http://ec.europa.eu/
internal_market/auditing/docs/liability/auditors-final-report_en.pdf.
Maijoor, S. and Vanstraelen, A. (2006) Earnings management within Europe: the effects of member
state audit environment, audit firm quality and international capital markets, Accounting and
Business Research, 36(1), pp. 33–52.
Matsumoto, D. A. (2002) Management’s incentives to avoid negative earnings surprises, The Account-
ing Review, 77(3), pp. 483–514.
Mazars (2010) Contribution to the Green Paper published by the EU Commission. Available at: http://
www.mazars.fr/mazarspage/download/54034/1299441/version/2/file/GreenPaper_EN.pdf
Meuwissen, R., Moers, F., Peek, E. and Vanstraelen, A. (2007) An evaluation of abnormal accruals
measurement models in an international context. Available at: http://papers.ssrn.com/ sol3/
papers.cfmabstract_id=442681.
Moizer, P. (1997) Auditor reputation: the international empirical evidence, International Journal of
Auditing, 1(1), pp. 61–74.
Myers, J. N., Myers, L. A. and Omer, T. C. (2003) Exploring the term of the auditor-client relationship
and the quality of earnings: A case for mandatory auditor rotation? The Accounting Review,
78(3), pp. 779–799.
Neveling, N. (2007) French CFO attacks joint audit, Accountancy Age, 8 November, p. 4.
Niemi, L. (2004) Auditor size and audit pricing: evidence from small audit firms, European Account-
ing Review, 13(3), pp. 541–560.
NJA (1994) s. 336, The Swedish Supreme Court (Hogsta Domstolen). Avalaible at: https://lagen.nu/
dom/nja/1994s336
NJA (1996) s. 224, The Swedish Supreme Court (Hogsta Domstolen). Available at: https://lagen.nu/
dom/nja/1996s224
Office of Fair Trading (2004) An Assessment of the Implications for Competition of a Cap on Auditors’
Liability (London, UK: Office of Fair Trading).
Oxera Consulting (2006) Competition and Choice in the UK Audit Market: 152. (Oxford, UK: Report
Prepared for Department of Trade and Industry and Financial Reporting Council). Available at:
http://www.bis.gov.uk/files/file28529.pdf.
Oxera Consulting (2007) Ownership Rules of Audit Firms and their Consequences for Audit Market
Concentration: 230. (Oxford, UK: Report Prepared for the European Commission: Directorate
General for Internal Market and Services). Available at: http://ec.europa.eu/internal_market/
auditing/docs/market/oxera_report_en.pdf.
Piot, C. (2007) Auditor concentration in a joint-auditing environment: the French market 1997-2003,
Managerial Auditing Journal, 22(2), pp. 161–176.
Pittman, J. A. and Fortin, S. (2004) Auditor choice and the cost of debt capital in newly public firms,
Journal of Accounting and Economics, 37, pp. 113–136.
Petersen, M. A. (2009) Estimating standard errors in finance panel data sets: comparing approaches,
Review of Financial Studies, 22(1), pp. 435–480.
Riley, J. G. (2001) Silver signals: twenty-five years of screening and signalling, Journal of Economic
Literature, 39 (June), pp. 432–478.
Rogers, W. H. (1993) Regression standard errors in clustered samples, Stata Technical Bulletin, 13,
pp. 19–23.
Rosenbaum, P. and Rubin, D. (1983) The central role of the propensity score in observational studies
for causal effects, Biometrika, 70(1), pp. 41–55.
34 M. Zerni et al.

Simunic, D. A. (1980) The pricing of audit services: theory and evidence, Journal of Accounting
Research, 18(1), pp. 161–190.
Sirois, L-P. and Simunic, D. (2010) Auditor size and audit quality revisited: the importance of audit
technology, http://ssrn.com/abstract=1694613.
Teoh, S. and Wong, T. J. (1993) Perceived auditor quality and the earnings response coefficient, The
Accounting Review, 68(2), pp. 346–366.
Teoh, S., Welch, I. and Wong, T. J. (1998) Earnings management and the long-run market perform-
ance of initial public offerings, Journal of Finance, 53(6), pp. 1935–1974.
The American Assembly (2005) The Future of the Accounting Profession: Auditor Concentration: 36
(New York: The American Assembly).
Thinggaard, F. and Kiertzner, L. (2008) Determinants of audit fees: evidence from a small capital
market with a joint audit requirement, International Journal of Auditing, 12(2), pp. 141–158.
Titman, S. and Trueman, B. (1986) Information quality and the valuation of new issues, Journal of
Accounting and Economics, 8(2), pp. 159–172.
US Chamber of Commerce (2006) Auditing: A Profession at Risk: 20 (Washington, DC: US Chamber
of Commerce).
US Chamber of Commerce (2007) Commission on the Regulation of the U.S. Capital Markets in the
21st Century: 176 (Washington, DC: US Chamber of Commerce).
United States General Accounting Office (2003) Public Accounting Firms: Mandated Study on Con-
solidation and Competition, Report: 139, (Washington, DC: Report to the Senate Committee on
Banking, Housing, and Urban Affairs and the House Committee on Financial Services). Avail-
able at: http://www.iasplus.com/resource/gao0307.pdf.
United States General Accounting Office (2008) Public Accounting Firms: Continued Concentration
in Audit Market for Large Public Companies Does Not Call for Immediate Action, Report: 115
(Washington, DC: Report to Congressional Addressees). Available at: http://www.gao.gov/new.
items/d08163.pdf.
Yardley, J., Kauffman, N., Cairney, T. and Albrecht, W. (1992) Supplier behavior in the U.S. audit
market, Journal of Accounting Literature, 11, pp. 151–184.
Verrecchia, R. E. (1982) Information acquisition in a noisy rational expectations economy, Econome-
trica, 50(6), pp. 1415–1430.
Wallace, W. (1980) The Economic Role of Audit in Free and Regulated Markets. Aid to Education
Program (Touche Ross & co).
Watts, R. (2003) Conservatism in accounting part 1: explanations and implications, Accounting Hor-
izons, 17(4), pp. 207–221.
Watts, R. L. and Zimmerman, J. L. (1986) Positive Accounting Theory (Englewood Cliffs, NJ: Pre-
ntice Hall).
Whisenant, S., Sankaraguruswamy, S. and Raghunandan, S. (2003) Evidence on the joint determi-
nation of audit and non-audit fees, Journal of Accounting Research, 41(4), pp. 721–744.
White, H. (1980) A heteroskedasticity-consistent covariance matrix estimator and a direct test for het-
eroskedasticity, Econometrica, 48(4), pp. 817–838.
Wingate, M. (1997) An examination of cultural influence on audit environment, Research in Account-
ing Regulation, 11 (Supplement), pp. 129–148.
Zerni, M. (2012) Audit partner specialization and audit fees: some evidence from Sweden, Contem-
porary Accounting Research. 29(1), pp. 312–340.
Zerni, M., Kallunki, J-P. and Nilsson, H. (2010) The entrenchment problem, corporate governance
mechanisms, and firm value, Contemporary Accounting Research, 27(4), pp. 1169–1206.
Zhao, Z. (2004) Using matching to estimate treatment effects: data requirements, matching metrics,
and Monte Carlo evidence, Review of Economics and Statistics, 86(1), pp. 91–107.
Zhou, X. (2001) Understanding the determination of managerial ownership and its relationship to firm
performance, Journal of Financial Economics, 62(3), pp. 559–571.
Do Joint Audits Improve Audit Quality? 35