Visual grading of 2D and 3D functional MRI compared with image-based descriptive measures
Upload
independentCategory
view
1download
0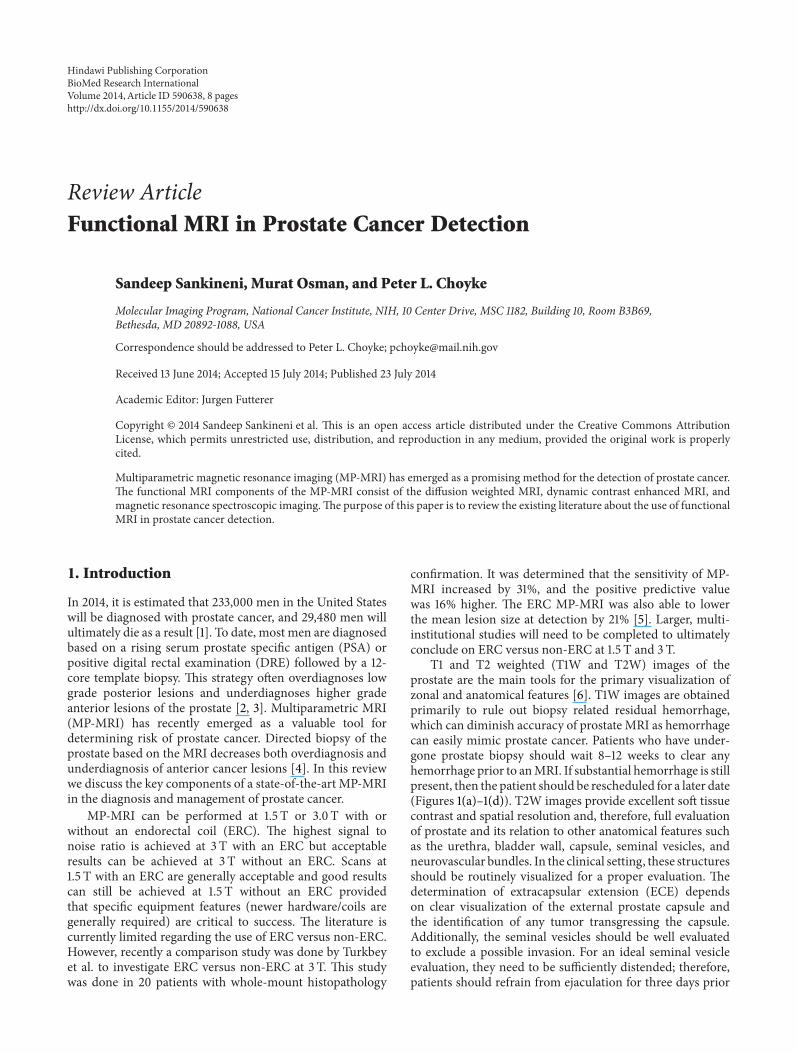
Review ArticleFunctional MRI in Prostate Cancer Detection
Sandeep Sankineni, Murat Osman, and Peter L. Choyke
Molecular Imaging Program, National Cancer Institute, NIH, 10 Center Drive, MSC 1182, Building 10, Room B3B69,Bethesda, MD 20892-1088, USA
Correspondence should be addressed to Peter L. Choyke; [email protected]
Received 13 June 2014; Accepted 15 July 2014; Published 23 July 2014
Academic Editor: Jurgen Futterer
Copyright © 2014 Sandeep Sankineni et al. This is an open access article distributed under the Creative Commons AttributionLicense, which permits unrestricted use, distribution, and reproduction in any medium, provided the original work is properlycited.
Multiparametric magnetic resonance imaging (MP-MRI) has emerged as a promising method for the detection of prostate cancer.The functional MRI components of the MP-MRI consist of the diffusion weighted MRI, dynamic contrast enhanced MRI, andmagnetic resonance spectroscopic imaging.The purpose of this paper is to review the existing literature about the use of functionalMRI in prostate cancer detection.
1. Introduction
In 2014, it is estimated that 233,000 men in the United Stateswill be diagnosed with prostate cancer, and 29,480 men willultimately die as a result [1]. To date, most men are diagnosedbased on a rising serum prostate specific antigen (PSA) orpositive digital rectal examination (DRE) followed by a 12-core template biopsy. This strategy often overdiagnoses lowgrade posterior lesions and underdiagnoses higher gradeanterior lesions of the prostate [2, 3]. Multiparametric MRI(MP-MRI) has recently emerged as a valuable tool fordetermining risk of prostate cancer. Directed biopsy of theprostate based on the MRI decreases both overdiagnosis andunderdiagnosis of anterior cancer lesions [4]. In this reviewwe discuss the key components of a state-of-the-art MP-MRIin the diagnosis and management of prostate cancer.
MP-MRI can be performed at 1.5 T or 3.0 T with orwithout an endorectal coil (ERC). The highest signal tonoise ratio is achieved at 3 T with an ERC but acceptableresults can be achieved at 3 T without an ERC. Scans at1.5 T with an ERC are generally acceptable and good resultscan still be achieved at 1.5 T without an ERC providedthat specific equipment features (newer hardware/coils aregenerally required) are critical to success. The literature iscurrently limited regarding the use of ERC versus non-ERC.However, recently a comparison study was done by Turkbeyet al. to investigate ERC versus non-ERC at 3 T. This studywas done in 20 patients with whole-mount histopathology
confirmation. It was determined that the sensitivity of MP-MRI increased by 31%, and the positive predictive valuewas 16% higher. The ERC MP-MRI was also able to lowerthe mean lesion size at detection by 21% [5]. Larger, multi-institutional studies will need to be completed to ultimatelyconclude on ERC versus non-ERC at 1.5 T and 3 T.
T1 and T2 weighted (T1W and T2W) images of theprostate are the main tools for the primary visualization ofzonal and anatomical features [6]. T1W images are obtainedprimarily to rule out biopsy related residual hemorrhage,which can diminish accuracy of prostate MRI as hemorrhagecan easily mimic prostate cancer. Patients who have under-gone prostate biopsy should wait 8–12 weeks to clear anyhemorrhage prior to anMRI. If substantial hemorrhage is stillpresent, then the patient should be rescheduled for a later date(Figures 1(a)–1(d)). T2W images provide excellent soft tissuecontrast and spatial resolution and, therefore, full evaluationof prostate and its relation to other anatomical features suchas the urethra, bladder wall, capsule, seminal vesicles, andneurovascular bundles. In the clinical setting, these structuresshould be routinely visualized for a proper evaluation. Thedetermination of extracapsular extension (ECE) dependson clear visualization of the external prostate capsule andthe identification of any tumor transgressing the capsule.Additionally, the seminal vesicles should be well evaluatedto exclude a possible invasion. For an ideal seminal vesicleevaluation, they need to be sufficiently distended; therefore,patients should refrain from ejaculation for three days prior
Hindawi Publishing CorporationBioMed Research InternationalVolume 2014, Article ID 590638, 8 pageshttp://dx.doi.org/10.1155/2014/590638

2 BioMed Research International
(a) (b)
(c) (d)
(e)
Figure 1: A 57-year-old patient, with PSA of 5.80, Gleason 4 + 5 on multiple cores, undergoing postbiopsy staging MP-MRI. Axial T1weighted MRI shows biopsy related residual hemorrhage in right midperipheral zone (arrow) (a). Axial T2 weighted MRI shows a largeleft midperipheral zone lesion (b). Axial diffusion weighted MRI showing a large lesion extending throughout the left midperipheral zone(arrow) (c). High “𝑏” value DWI (𝑏 = 2000) showing strong enhancement of the left midperipheral zone lesion (arrow) (d). Axial dynamiccontrast enhanced imaging showing early enhancement in the left midperipheral zone (arrow) (e).
to the MRI, which is helpful in this regard.Thus, T1WMRI iscritical for hemorrhage and T2WMRI is critical in providinganatomic detail as well as suggesting the location and extentof cancer which is generally seen as low signal foci on theT2WMRI (Figure 2(a)).
2. Diffusion Weighted Imaging
Diffusion weighted magnetic resonance imaging (DWMRI)reflects the diffusion of water protons within tissue. Signaldecreases on DW MRI in proportion to the restriction of
motion of water. This reflects cellular density, and otherobstructions to the free flow of water such as extracellularmatrix [7]. DW-MRI is acquired by sequentially applyingmultiple magnetic field gradients, known as “𝑏” values, tocalculate apparent diffusion coefficient (ADC) values andconstruct ADC maps [8]. Lower diffusion coefficients (e.g.,cancer) are seen as low signal intensity focus on ADCmaps but as high signal intensity focus on high 𝑏 valueimages (Figures 1(e) and 2(b)). Normal glandular prostatetissue allows unrestricted free water movement and dis-plays isointense regions on ADC maps [9]. Since cancersexpress increased cellular density, water diffusion within the
BioMed Research International 3
(a) (b)
(c) (d)
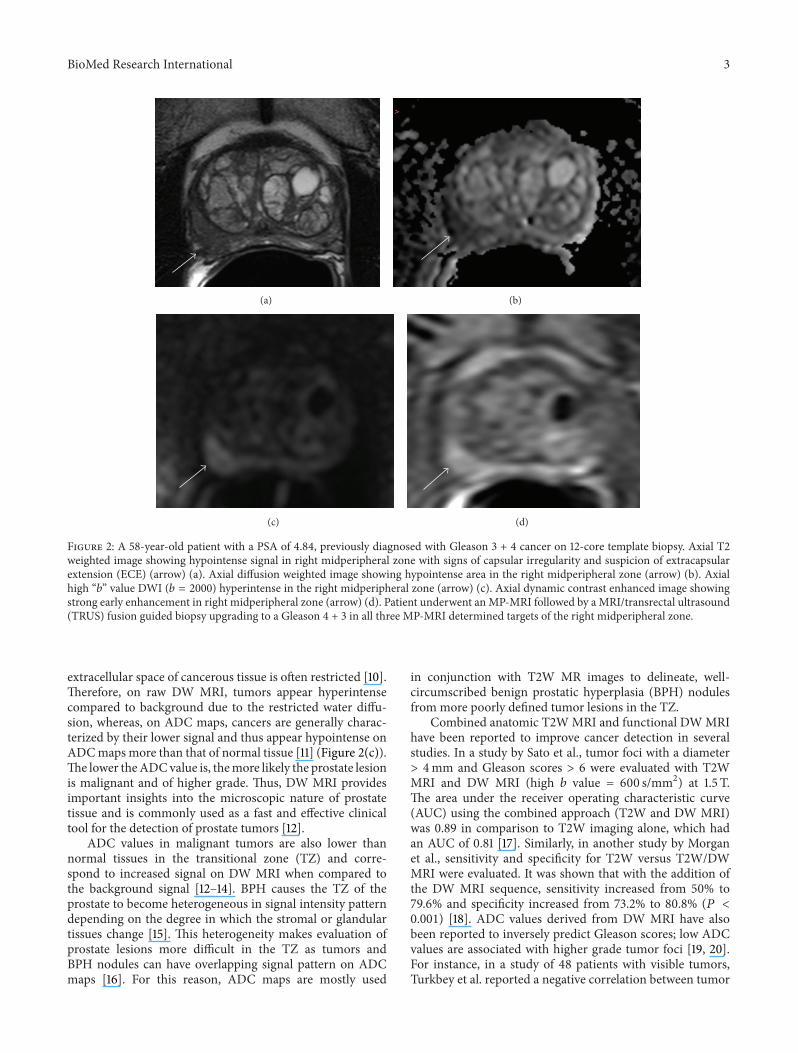
Figure 2: A 58-year-old patient with a PSA of 4.84, previously diagnosed with Gleason 3 + 4 cancer on 12-core template biopsy. Axial T2weighted image showing hypointense signal in right midperipheral zone with signs of capsular irregularity and suspicion of extracapsularextension (ECE) (arrow) (a). Axial diffusion weighted image showing hypointense area in the right midperipheral zone (arrow) (b). Axialhigh “𝑏” value DWI (𝑏 = 2000) hyperintense in the right midperipheral zone (arrow) (c). Axial dynamic contrast enhanced image showingstrong early enhancement in right midperipheral zone (arrow) (d). Patient underwent anMP-MRI followed by a MRI/transrectal ultrasound(TRUS) fusion guided biopsy upgrading to a Gleason 4 + 3 in all three MP-MRI determined targets of the right midperipheral zone.
extracellular space of cancerous tissue is often restricted [10].Therefore, on raw DW MRI, tumors appear hyperintensecompared to background due to the restricted water diffu-sion, whereas, on ADC maps, cancers are generally charac-terized by their lower signal and thus appear hypointense onADCmaps more than that of normal tissue [11] (Figure 2(c)).The lower theADCvalue is, themore likely the prostate lesionis malignant and of higher grade. Thus, DW MRI providesimportant insights into the microscopic nature of prostatetissue and is commonly used as a fast and effective clinicaltool for the detection of prostate tumors [12].
ADC values in malignant tumors are also lower thannormal tissues in the transitional zone (TZ) and corre-spond to increased signal on DW MRI when compared tothe background signal [12–14]. BPH causes the TZ of theprostate to become heterogeneous in signal intensity patterndepending on the degree in which the stromal or glandulartissues change [15]. This heterogeneity makes evaluation ofprostate lesions more difficult in the TZ as tumors andBPH nodules can have overlapping signal pattern on ADCmaps [16]. For this reason, ADC maps are mostly used
in conjunction with T2W MR images to delineate, well-circumscribed benign prostatic hyperplasia (BPH) nodulesfrom more poorly defined tumor lesions in the TZ.
Combined anatomic T2WMRI and functional DWMRIhave been reported to improve cancer detection in severalstudies. In a study by Sato et al., tumor foci with a diameter> 4mm and Gleason scores > 6 were evaluated with T2WMRI and DW MRI (high 𝑏 value = 600 s/mm2) at 1.5 T.The area under the receiver operating characteristic curve(AUC) using the combined approach (T2W and DW MRI)was 0.89 in comparison to T2W imaging alone, which hadan AUC of 0.81 [17]. Similarly, in another study by Morganet al., sensitivity and specificity for T2W versus T2W/DWMRI were evaluated. It was shown that with the addition ofthe DW MRI sequence, sensitivity increased from 50% to79.6% and specificity increased from 73.2% to 80.8% (𝑃 <0.001) [18]. ADC values derived from DW MRI have alsobeen reported to inversely predict Gleason scores; low ADCvalues are associated with higher grade tumor foci [19, 20].For instance, in a study of 48 patients with visible tumors,Turkbey et al. reported a negative correlation between tumor

4 BioMed Research International
ADC values and their corresponding Gleason scores [19]. Inanother study by Hambrock et al., prostate lesions with thehighest restriction determined onADCmapswere associatedwith higher grade tumors [21].
The addition of DW MRI to standard imaging protocolshas improved diagnostic accuracy of MRI and is relativelyquick to obtain. Recently, higher 𝑏 values (>1000 s/mm2) havebeen suggested to offer higher tumor visibility and detection.Rosenkrantz et al. compared 𝑏 values of 1000 s/mm2 and2000 s/mm2 in 29 patients and compared tumor to peripheralzone (PZ) contrast with both b values. They found that a 𝑏value of 2000 s/mm2 resulted in improved tumor sensitivity(𝑃 < 0.001) and contrast (𝑃 = 0.067) since normalor benign PZ tissue showed very low signal on high 𝑏value images whereas neoplastic tissue remained bright [22].However, high 𝑏 value DW MRI produced noisier imageswith lower SNR values [23]. Lower “high 𝑏” value imagingproduces higher signal and so intermediate 𝑏 values of 1400–1500 s/mm2 have been suggested as reasonable alternatives.The high signal requirements are particularly problematic fornonendorectal coil imaging, although good high 𝑏 value canbe achieved without the ERC. Rectal bowel gas can causedistortions onDWMRI that can interfere with the diagnosticvalue of this sequence [24].
In addition to standard ADC values, other measuresof ADC distribution have been evaluated such as diffusionkurtosis (DK). Kurtosis is useful as an indicator of the“peakedness” of a distribution. Metens et al. evaluated ADCvalues using diffusion kurtosis and found that ADC values ofcancer foci were significantly lower than that of benign PZ.Specifically, ADC values were significantly (𝑃 < 0.001) lowerin prostate cancer lesions (0.79 ± 0.14 𝜇m2/ms) compared tobenign PZ (1.23 ± 0.19 𝜇m2/ms) [25]. Unlike standard DWimaging models which assume water displacement is similarto that of free diffusion, the DK model quantifies the degreeto which water diffusion is non-Gaussian and thus has theability to better reflect the complex structure of the tissue.
With regard to prostate cancer staging, DW MRI islimited in depicting extracapsular extension due to its lowerspatial resolution.However, DWMRI has been reported to beeffective for the detection of seminal vesicle invasion (SVI)[26]. A study by Kim et al. showed that the area under thereceiver operation characteristic curve (AUC) was greater(0.897) for a dual T2W and DWMRI approach as opposed toT2W images (0.779) alone for detection of SVI [27]. Furtherstudies are being done to evaluate the role of DW MRI forstructures surrounding the prostate gland such as urinarybladder carcinomas [28]. DW MRI has potential to supportother clinical and laboratory biomarkers and has importantclinical implications in predicting tumor aggressiveness,selecting appropriate therapies, and improving the accuracyof biopsies for detected tumors.
3. Dynamic Contrast Enhanced MRI
Dynamic contrast enhanced (DCE) MRI has the ability totrack the enhancement of tissue and therefore provide a
measure of angiogenesis, on which tumor growth is depen-dent [29]. DCE is performed by acquiring fast T1W images,prior to, during, and after contrast injection. DCE-MRIdetects the arrival and uptake of gadolinium based contrastagents before they wash out and is related to tumor vascular-ity and permeability.TheMR contrast agent (i.e., gadoliniumchelate) must be given as a bolus by an intravenous routeoften with an automated injector, making it relatively more“invasive” and requiring more resources than other MP-MRIsequences (T2W and DWI).
In DCE MRI, tumors are highlighted by their strongenhancement compared to the normal background tis-sue (Figure 2(d)). Tumor enhancement appears earlier andwashes outmore quickly in comparison to normal tissue.Thisreflects the process of angiogenesis—whereby new vessels areformed with higher vascular permeability to deliver morenutrients to the growing tumor, thus aiding in its growth [30–33]. DCE has high sensitivity, reported to be in the rangeof 74–96%, which is useful for the preliminary detection oftumors [33]. It is widely used for staging and in monitoringtherapeutic response of prostate cancer. A study by Hara etal. found the sensitivity and specificity of DCE to be 73% and88%, respectively, among a group of 50 patients [34]. Anotherstudy by Ocak et al. determined that a combination of T2WMRI with DCE MRI increased cancer detection sensitivityin the PZ by 16% over T2W MRI alone. However, this highsensitivity can also lead to an increased false positive rate, andin this study the specificity of detection in the PZ droppedfrom 98% to 92% [35]. In the transitional zone, BPH nodulesstrongly enhance but do not wash out as quickly as prostatetumors [36, 37]. Therefore, outside of well-defined BPHnodules, DCE MRI can be helpful in defining TZ cancers aswell.
There are several methods of analyzing DCE data whichincrease in complexity and the need for specific software.Generally speaking there are three methods for interpretingthese images: qualitative, semiquantitative, and quantitative.Qualitative evaluation, the easiest and the most popularapproach, involves the visual detection of focal early, strongenhancement with early washout—compared with that ofnormal tissue [38]. Naturally, while thismethod is simple, it isalso subject to observer bias and often requires considerableexperience. Semiquantitative analysis is an assessment of thetime-signal curve and includes measurement of AUC, timeto peak enhancement, and initial slope. Dynamic curves areclassified as persistent (Type 1), plateau (Type 2), and declineafter initial slope (Type 3). The latter, Type 3, is frequentlyassociated with prostate cancer—although a combination ofcurve types is actually the most common. In quantitativeevaluation, pharmacokinetic modeling is performed usingtwo compartmentmodels that determine𝐾trans (forward vol-ume transfer constant) and 𝑘ep (reverse reflux rate constantbetween extracellular space and plasma) rate constants [34].As a result of the variability in evaluation methods the valueof DCE is still in debate. DCE MRI has limited value in localstaging; however it was reported by Turkbey et al. that theaccuracy of DCE for the detection of capsular extension, SVI,and neurovascular bundle involvement was 84%, 97%, and97%, respectively [39].

BioMed Research International 5
(a) (b)
(c) (d)
32.2
26.2
20.3
14.3
8.3
2.3
35.4
28.5
21.4
14.3
7.2
0.1
1.01.62.22.83.44.01.01.62.22.83.44.0
(e)
A
P
LR
(f)
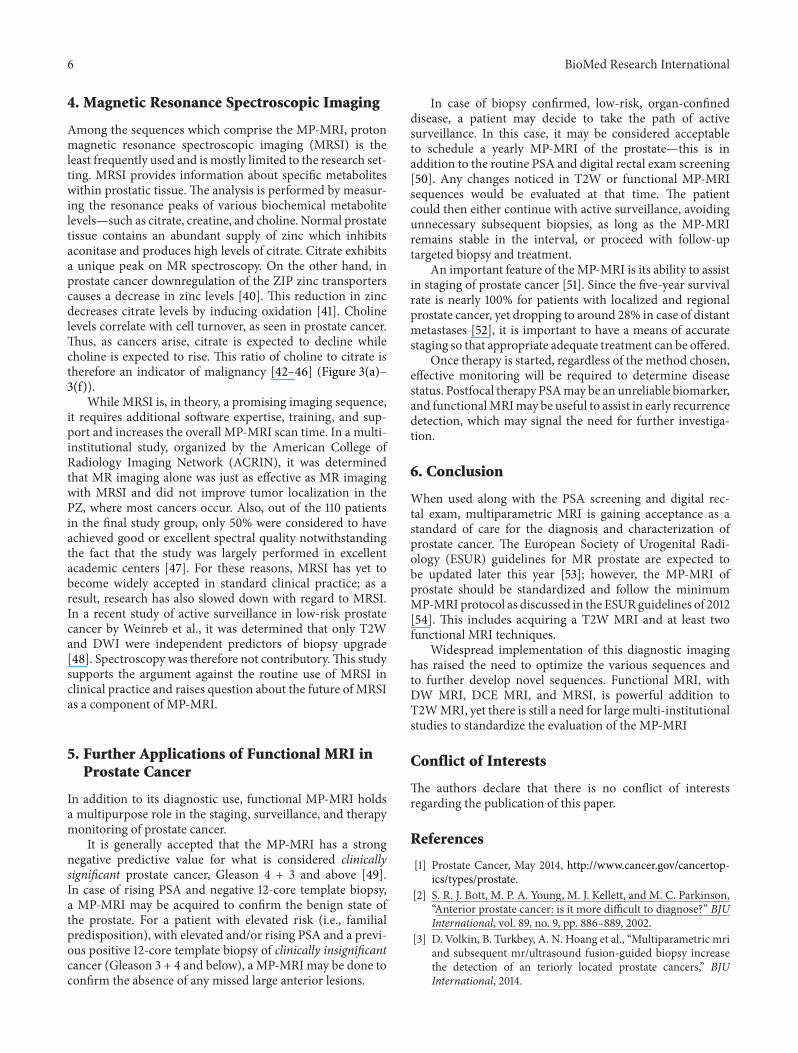
Figure 3: A 53-year-old patient with a PSA of 13.59, previously diagnosed with Gleason 3 + 3 cancer on 12-core template biopsy. Axial T2weighted image shows a large hypointense signal in leftmidperipheral zone with capsular bulge (arrow) (a). Axial diffusion weighted imagingshowing left hypointense signal in left midperipheral zone (arrow) (b). Axial high “𝑏” value DWMRI (𝑏 = 2000) with hyperintense signal inleft midperipheral zone (arrow) (c). Axial dynamic contrast enhanced imaging showing strong early enhancement in the left midperipheralzone (arrow) (d). Magnetic resonance spectroscopic imaging showing an increased choline : citrate ratio in the left mid peripheral zone(outlined in red). Normal choline : citrate ratio is seen in the contralateral peripheral zone (outlined in blue) (e). Patient underwent a MP-MRI followed by MRI/TRUS fusion guided biopsy, at which time the patient was upgraded to a Gleason 4 + 4. Prostatectomy was thenperformed and whole-mount pathology confirms Gleason 4 + 4 in 30% of the left lobe (f).
6 BioMed Research International
4. Magnetic Resonance Spectroscopic Imaging
Among the sequences which comprise the MP-MRI, protonmagnetic resonance spectroscopic imaging (MRSI) is theleast frequently used and ismostly limited to the research set-ting. MRSI provides information about specific metaboliteswithin prostatic tissue. The analysis is performed by measur-ing the resonance peaks of various biochemical metabolitelevels—such as citrate, creatine, and choline. Normal prostatetissue contains an abundant supply of zinc which inhibitsaconitase and produces high levels of citrate. Citrate exhibitsa unique peak on MR spectroscopy. On the other hand, inprostate cancer downregulation of the ZIP zinc transporterscauses a decrease in zinc levels [40]. This reduction in zincdecreases citrate levels by inducing oxidation [41]. Cholinelevels correlate with cell turnover, as seen in prostate cancer.Thus, as cancers arise, citrate is expected to decline whilecholine is expected to rise. This ratio of choline to citrate istherefore an indicator of malignancy [42–46] (Figure 3(a)–3(f)).
While MRSI is, in theory, a promising imaging sequence,it requires additional software expertise, training, and sup-port and increases the overall MP-MRI scan time. In a multi-institutional study, organized by the American College ofRadiology Imaging Network (ACRIN), it was determinedthat MR imaging alone was just as effective as MR imagingwith MRSI and did not improve tumor localization in thePZ, where most cancers occur. Also, out of the 110 patientsin the final study group, only 50% were considered to haveachieved good or excellent spectral quality notwithstandingthe fact that the study was largely performed in excellentacademic centers [47]. For these reasons, MRSI has yet tobecome widely accepted in standard clinical practice; as aresult, research has also slowed down with regard to MRSI.In a recent study of active surveillance in low-risk prostatecancer by Weinreb et al., it was determined that only T2Wand DWI were independent predictors of biopsy upgrade[48]. Spectroscopy was therefore not contributory.This studysupports the argument against the routine use of MRSI inclinical practice and raises question about the future of MRSIas a component of MP-MRI.
5. Further Applications of Functional MRI inProstate Cancer
In addition to its diagnostic use, functional MP-MRI holdsa multipurpose role in the staging, surveillance, and therapymonitoring of prostate cancer.
It is generally accepted that the MP-MRI has a strongnegative predictive value for what is considered clinicallysignificant prostate cancer, Gleason 4 + 3 and above [49].In case of rising PSA and negative 12-core template biopsy,a MP-MRI may be acquired to confirm the benign state ofthe prostate. For a patient with elevated risk (i.e., familialpredisposition), with elevated and/or rising PSA and a previ-ous positive 12-core template biopsy of clinically insignificantcancer (Gleason 3 + 4 and below), a MP-MRI may be done toconfirm the absence of any missed large anterior lesions.
In case of biopsy confirmed, low-risk, organ-confineddisease, a patient may decide to take the path of activesurveillance. In this case, it may be considered acceptableto schedule a yearly MP-MRI of the prostate—this is inaddition to the routine PSA and digital rectal exam screening[50]. Any changes noticed in T2W or functional MP-MRIsequences would be evaluated at that time. The patientcould then either continue with active surveillance, avoidingunnecessary subsequent biopsies, as long as the MP-MRIremains stable in the interval, or proceed with follow-uptargeted biopsy and treatment.
An important feature of theMP-MRI is its ability to assistin staging of prostate cancer [51]. Since the five-year survivalrate is nearly 100% for patients with localized and regionalprostate cancer, yet dropping to around 28% in case of distantmetastases [52], it is important to have a means of accuratestaging so that appropriate adequate treatment can be offered.
Once therapy is started, regardless of the method chosen,effective monitoring will be required to determine diseasestatus. Postfocal therapy PSAmay be an unreliable biomarker,and functionalMRImay be useful to assist in early recurrencedetection, which may signal the need for further investiga-tion.
6. Conclusion
When used along with the PSA screening and digital rec-tal exam, multiparametric MRI is gaining acceptance as astandard of care for the diagnosis and characterization ofprostate cancer. The European Society of Urogenital Radi-ology (ESUR) guidelines for MR prostate are expected tobe updated later this year [53]; however, the MP-MRI ofprostate should be standardized and follow the minimumMP-MRI protocol as discussed in the ESURguidelines of 2012[54]. This includes acquiring a T2W MRI and at least twofunctional MRI techniques.
Widespread implementation of this diagnostic imaginghas raised the need to optimize the various sequences andto further develop novel sequences. Functional MRI, withDW MRI, DCE MRI, and MRSI, is powerful addition toT2WMRI, yet there is still a need for largemulti-institutionalstudies to standardize the evaluation of the MP-MRI
Conflict of Interests
The authors declare that there is no conflict of interestsregarding the publication of this paper.
References
[1] Prostate Cancer, May 2014, http://www.cancer.gov/cancertop-ics/types/prostate.
[2] S. R. J. Bott, M. P. A. Young, M. J. Kellett, and M. C. Parkinson,“Anterior prostate cancer: is it more difficult to diagnose?” BJUInternational, vol. 89, no. 9, pp. 886–889, 2002.
[3] D. Volkin, B. Turkbey, A. N. Hoang et al., “Multiparametric mriand subsequent mr/ultrasound fusion-guided biopsy increasethe detection of an teriorly located prostate cancers,” BJUInternational, 2014.

BioMed Research International 7
[4] A. Ouzzane, P. Puech, L. Lemaitre et al., “Combined multi-parametricMRI and targeted biopsies improve anterior prostatecancer detection, staging, and grading,” Urology, vol. 78, no. 6,pp. 1356–1362, 2011.
[5] B. Turkbey, M. J. Merino, E. C. Gallardo et al., “Comparisonof endorectal coil and nonendorectal coil t2w and diffusion-weightedmri at 3 tesla for localizing prostate cancer: correlationwith whole-mount histopathology,” Journal of Magnetic Reso-nance Imaging, vol. 39, no. 6, pp. 1443–1448, 2014.
[6] B. Turkbey, P. S. Albert, K. Kurdziel, and P. L. Choyke, “Imaginglocalized prostate cancer: current approaches and new develop-ments,” American Journal of Roentgenology, vol. 192, no. 6, pp.1471–1480, 2009.
[7] D. Koh and D. J. Collins, “Diffusion-weightedMRI in the body:applications and challenges in oncology,”The American Journalof Roentgenology, vol. 188, no. 6, pp. 1622–1635, 2007.
[8] B. Issa, “In vivo measurement of the apparent diffusion coef-ficient in normal and malignant prostatic tissues using echo-planar imaging,” Journal ofMagnetic Resonance Imaging, vol. 16,no. 2, pp. 196–200, 2002.
[9] A. Prando, “Diffusion-weighted MRI of peripheral zoneprostate cancer: comparison of tumor apparent diffusion coef-ficient with Gleason score and percentage of tumor on corebiopsy,” International Braz J Urol, vol. 36, no. 4, pp. 504–517,2010.
[10] V. Baliyan, C. J. Das, S. Sharma, and A. K. Gupta, “Diffusion-weighted imaging in urinary tract lesions,” Clinical Radiology,vol. 69, no. 8, pp. 773–782, 2014.
[11] B. Zelhof, M. Pickles, G. Liney et al., “Correlation of diffusion-weighted magnetic resonance data with cellularity in prostatecancer,” BJU International, vol. 103, no. 7, pp. 883–888, 2009.
[12] P. Gibbs, D. J. Tozer, G. P. Liney, and L. W. Turnbull, “Compari-son of quantitative T2mapping and diffusion-weighted imagingin the normal and pathologic prostate,” Magnetic Resonance inMedicine, vol. 46, no. 6, pp. 1054–1058, 2001.
[13] C. K. Kim, B. K. Park, J. J. Han, T. W. Kang, and H. M.Lee, “Diffusion-weighted imaging of the prostate at 3 T fordifferentiation of malignant and benign tissue in transitionand peripheral zones: preliminary results,” Journal of ComputerAssisted Tomography, vol. 31, no. 3, pp. 449–454, 2007.
[14] C. Sato, S. Naganawa, T. Nakamura et al., “Differentiation ofnoncancerous tissue and cancer lesion by apparent diffusioncoefficient values in transition and peripheral zones of theprostate,” Journal of Magnetic Resonance Imaging, vol. 21, no. 3,pp. 258–262, 2005.
[15] Y. Homma, K. Kawabe, T. Tsukamoto et al., “Estimate criteriafor diagnosis and severity in benign prostatic hyperplasia,”International Journal of Urology, vol. 3, no. 4, pp. 261–266, 1996.
[16] C. K. Kim, B. K. Park, H. M. Lee, and G. Y. Kwon, “Valueof diffusion-weighted imaging for the prediction of prostatecancer location at 3T using a phased-array coil: preliminaryresults,” Investigative Radiology, vol. 42, no. 12, pp. 842–847,2007.
[17] M. A. Haider, T. H. van der Kwast, J. Tanguay et al., “CombinedT2-weighted and diffusion-weighted MRI for localization ofprostate cancer,” The American Journal of Roentgenology, vol.189, no. 2, pp. 323–328, 2007.
[18] V. A. Morgan, S. Kyriazi, S. E. Ashley, and N. M. Desouza,“Evaluation of the potential of diffusion-weighted imaging inprostate cancer detection,” Acta Radiologica, vol. 48, no. 6, pp.695–703, 2007.
[19] B. Turkbey, V. P. Shah, Y. Pang et al., “Is apparent diffusioncoefficient associated with clinical risk scores for prostatecancers that are visible on 3-TMR images?” Radiology, vol. 258,no. 2, pp. 488–495, 2011.
[20] T.Hambrock,D.M. Somford,H. J.Huisman et al., “Relationshipbetween apparent diffusion coefficients at 3.0-Tmr imaging andgleason grade in peripheral zone prostate cancer,” Radiology,vol. 259, no. 2, pp. 453–461, 2011.
[21] T. Hambrock, C. Hoeks, C. Hulsbergen-van de Kaa et al.,“Prospective assessment of prostate cancer aggressiveness using3-T diffusion-weighted magnetic resonance imaging-guidedbiopsies versus a systematic 10-core transrectal ultrasoundprostate biopsy cohort,” EuropeanUrology, vol. 61, no. 1, pp. 177–184, 2012.
[22] A. B. Rosenkrantz, N. Hindman, R. P. Lim et al., “Diffusion-weighted imaging of the prostate: comparison of b1000 andb2000 image sets for index lesion detection,” Journal ofMagneticResonance Imaging, vol. 38, no. 3, pp. 694–700, 2013.
[23] M. C. Maas, J. J. Futterer, and T. W. J. Scheenen, “Quantita-tive evaluation of computed high b value diffusion-weightedmagnetic resonance imaging of the prostate,” InvestigativeRadiology, vol. 48, no. 11, pp. 779–786, 2013.
[24] Folkman J., “What is the evidence that tumors are angio -genesisdependent?” Journal of the National Cancer Institute, vol. 82, no.1, pp. 4–6, 1990.
[25] T. Metens, D. Miranda, J. Absil, and C. Matos, “What is theoptimal b value in diffusion-weighted MR imaging to depictprostate cancer at 3T?” European Radiology, vol. 22, no. 3, pp.703–709, 2012.
[26] S. Shiteng, C. Xiaoxi, L. Wu et al., “Non-Gaussian water diffu-sion kurtosis imaging of prostate cancer,” Magnetic ResonanceImaging, 2014.
[27] C. K. Kim, D. Choi, B. K. Park, G. Y. Kwon, and H. K. Lim,“Diffusion-weighted MR imaging for the evaluation of seminalvesicle invasion in prostate cancer: initial results,” Journal ofMagnetic Resonance Imaging, vol. 28, no. 4, pp. 963–969, 2008.
[28] J. Ren, Y. Huan, H. Wang et al., “Seminal vesicle invasion inprostate cancer: prediction with combined T2-weighted anddiffusion-weighted MR imaging,” European Radiology, vol. 19,no. 10, pp. 2481–2486, 2009.
[29] M. Takeuchi, S. Sasaki, and M. Ito, “Urinary Bladder Cancer:Diffusion-weighted MR ImagingAccuracy for Diagnosing TStage and Estimating Histologic Grade 1,” Radiology, pp. 112–121, 2009.
[30] C. M. Zechmann, E. C. Woenne, G. Brix et al., “Impact ofstroma on the growth, microcirculation, and metabolism ofexperimental prostate tumors,” Neoplasia, vol. 9, no. 1, pp. 57–67, 2007.
[31] B. Nicholson, G. Schaefer, and D. Theodorescu, “Angiogenesisin prostate cancer: biology and therapeutic opportunities,”Cancer and Metastasis Reviews, vol. 20, no. 3-4, pp. 297–319,2001.
[32] L. Wang, Y. Mazaheri, J. Zhang, N. M. Ishill, K. Kuroiwa, andH. Hricak, “Assessment of biologic aggressiveness of prostatecancer: correlation of MR signal intensity with gleason gradeafter radical prostatectomy,” Radiology, vol. 246, no. 1, pp. 168–176, 2008.
[33] A. Oto, C. Yang, A. Kayhan et al., “Diffusion-weighted anddynamic contrast-enhancedMRI of prostate cancer: correlationof quantitative MR parameters with gleason score and tumorangiogenesis,” American Journal of Roentgenology, vol. 197, no.6, pp. 1382–1390, 2011.

8 BioMed Research International
[34] N. Hara, M. Okuizumi, H. Koike, M. Kawaguchi, and V.Bilim, “Dynamic contrast-enhanced magnetic resonance imag-ing (DCE-MRI) is a useful modality for the precise detectionand staging of early prostate cancer,” Prostate, vol. 62, no. 2, pp.140–147, 2005.
[35] I. Ocak, M. Bernardo, G. Metzger et al., “Dynamic contrast-enhancedMRI of prostate cancer at 3 T: a study of pharmacoki-netic parameters,” American Journal of Roentgenology, vol. 189,no. 4, p. 849, 2007.
[36] N. B. Delongchamps, M. Rouanne, T. Flam et al., “Multi-parametric magnetic resonance imaging for the detection andlocalization of prostate cancer: combination of T2-weighted,dynamic contrast-enhanced and diffusion-weighted imaging,”BJU International, vol. 107, no. 9, pp. 1411–1418, 2011.
[37] K. Bouchelouche, B. Turkbey, P. Choyke, and J. Capala, “Imag-ing prostate cancer: An update on positron emission tomogra-phy andmagnetic resonance imaging,”Current Urology Reports,vol. 11, no. 3, pp. 180–190, 2010.
[38] G. Brown,D.A.Macvicar, V.Ayton, and J. E.Husband, “The roleof intravenous contrast enhancement in magnetic resonanceimaging of prostatic carcinoma,” Clinical Radiology, vol. 50, no.9, pp. 601–606, 1995.
[39] B. Turkbey and P. L. Choyke, “Multiparametric MRI andprostate cancer diagnosis and risk stratification,” Current Opin-ion in Urology, vol. 22, no. 4, pp. 310–315, 2012.
[40] K. Ogura, S. Maekawa, K. Okubo et al., “Dynamic endorectalmagnetic resonance imaging for local staging and detection ofneurovascular bundle involvement of prostate cancer: correla-tionwith histopathologic results,”Urology, vol. 57, no. 4, pp. 721–726, 2001.
[41] M. M. Desouki, J. Geradts, B. Milon, R. B. Franklin, and L.C. Costello, “hZip2 and hZip3 zinc transporters are downregulated in human prostate adenocarcinomatous glands,”Molecular Cancer, vol. 6, article 37, 2007.
[42] L. C. Costello, R. B. Franklin, and P. Feng, “Mitochondrialfunction, zinc, and intermediary metabolism relationships innormal prostate and prostate cancer,”Mitochondrion, vol. 5, no.3, pp. 143–153, 2005.
[43] Y. Mazaheri, A. Shukla-Dave, H. Hricak et al., “Prostate cancer:identification with combined diffusion-weighted MR imagingand 3D 1HMR spectroscopic imaging—correlation with patho-logic findings,” Radiology, vol. 246, no. 2, pp. 480–488, 2008.
[44] J. A. Jung, F.V.Coakley,D. B.Vigneron et al., “Prostate depictionat endorectal MR spectroscopic imaging: investigation of astandardized evaluation system,” Radiology, vol. 233, no. 3, pp.701–708, 2004.
[45] T.W. J. Scheenen, S.W.T. P. J.Heijmink, S. A. Roell et al., “Three-dimensional proton MR spectroscopy of human prostate at 3Twithout endorectal coil: feasibility,” Radiology, vol. 245, no. 2,pp. 507–516, 2007.
[46] K. L. Zakian, K. Sircar, H. Hricak et al., “Correlation ofproton MR spectroscopic imaging with gleason score basedon step-section pathologic analysis after radical prostatectomy,”Radiology, vol. 234, no. 3, pp. 804–814, 2005.
[47] T. Kobus, T. Hambrock, C. A. Hulsbergen-van de Kaa et al.,“In vivo assessment of prostate cancer aggressiveness usingmagnetic resonance spectroscopic imaging at 3 T with anendorectal coil,” European Urology, vol. 60, no. 5, pp. 1074–1080,2011.
[48] J. C. Weinreb, J. D. Blume, F. V. Coakley et al., “Prostate cancer:sextant localization at MR imaging and MR spectroscopic
imaging before prostatectomy—results of ACRIN prospectivemulti-institutional clinicopathologic study,” Radiology, vol. 251,no. 1, pp. 122–133, 2009.
[49] R. R. Flavell, A. C. Westphalen, C. Liang et al., “Abnormal find-ings on multiparametric prostate magnetic resonance imagingpredict subsequent biopsy upgrade in patients with low riskprostate cancer managed with active surveillance,” AbdominalImaging. In press.
[50] N. K. Yerram, D. Volkin, B. Turkbey et al., “Low suspicionlesions on multiparametric magnetic resonance imaging pre-dict for the absence of high-risk prostate cancer,” BJU Interna-tional, vol. 110, no. 11, pp. E783–E788, 2012.
[51] S. Rais-Bahrami, B. Turkbey, A. R. Rastinehad et al., “Naturalhistory of small index lesions suspicious for prostate cancer onmultiparametric MRI: recommendations for interval imagingfollow-up,”Diagnostic and Interventional Radiology, vol. 20, no.4, pp. 293–298, 2014, Yerram, 2012, Low suspicion lesions onmultiparametric magnetic resonance imaging predict for theabsence of high-risk prostate cancer.
[52] F. N. Soylu, S. Eggener, and A. Oto, “Local staging of prostatecancer with MRI,”Diagnostic and Interventional Radiology, vol.18, no. 4, pp. 365–373, 2012.
[53] Cancer of the Prostate—SEER Stat Fact Sheets, June 2014,http://seer.cancer.gov/statfacts/html/prost.html.
[54] J. G. Bomers and J. O. Barentsz, “Standardization of multipara-metric prostate MR imaging using PI-RADS,” BioMed ResearchInternational, vol. 2014, Article ID 431680, 9 pages, 2014.
Copyright © 2022 FDOKUMEN