Parkinson's Disease and pathological gambling: Results from a functional MRI study
27
Brief Reports Rapid Screening of ATP13A2 Variant with High-Resolution Melting Analysis , Manabu Funayama, PhD, 1,2 Hiroyuki Tomiyama, MD, PhD, 1 Ruey-Meei Wu, MD, PhD, 3 Kotaro Ogaki, MD, 1 Hiroyo Yoshino, BS, 2 Yoshikuni Mizuno, MD, 2 and Nobutaka Hattori, MD, PhD 1,2 * 1 Department of Neurology, Juntendo University School of Medicine, Tokyo, Japan; 2 Research Institute for Diseases of Old Age, Graduate School of Medicine, Juntendo University, Tokyo, Japan; 3 Department of Neurology, National Taiwan University Hospital, College of Medicine, National Taiwan University, Taipei, Taiwan Abstract: Several genetic and environmental factors are involved in the pathogenesis of Parkinson’s disease (PD). Recently, a novel variant of ATP13A2 (p.A746T) responsi- ble for PARK9 was reported as a risk factor for PD in the Han-Chinese population. To investigate the role of this variant in Japanese PD patients, we examined 917 Japa- nese PD patients (871 index cases) and 190 controls by high-resolution melting curve analysis. We detected heter- ozygous p.A746T variant in a single patient with sporadic PD and a single control subject. These results suggest that ATP13A2 p.A746T variant is unlikely to play a role as a common risk factor or a pathogenic mutation for PD at least in Japanese. Our data on Japanese differ from those reported recently on Han-Chinese. Further studies are needed to confirm conclusions on roles of ATP13A2 variant in Asians or other populations. Ó 2010 Movement Disorder Society Key words: Parkinson’s disease; gene risk factor; PARK9; lightscanner INTRODUCTION Parkinson’s disease (PD) is the second most com- mon neurodegenerative disorder pathologically charac- terized by selective dopaminergic neurodegeneration and the presence of Lewy bodies in the midbrain. Clin- ical features of typical PD are resting tremor, rigidity, bradykinesia, and postural instability. PD is thought to be caused by interaction with multiple genetic and environmental factors; however, the exact etiology of PD remains elusive. To elucidate the mechanisms of nigral degeneration, monogenic forms of PD provide good information to identify the cause of not only monogenic but also sporadic forms of this disease. Case-control studies using genetic analyses are impor- tant in identification of susceptibility genes for PD such as SNCA, LRRK2, and GBA. 1–5 In particular, Asian population-specific variants such as LRRK2 p.G2385R and p.R1628P showed strong association with susceptibility to the pathogenesis of PD. 6,7 Inter- estingly, the LRRK2 p.G2385R variant has been associ- ated with PD in Asian population including Japanese and Chinese; 3,6 however, LRRK2 p.R1628P variant has not been found in Japanese population so far, suggest- ing some differences in ethnic background based on human migration history among Asians. 7 Furthermore, a novel ATP13A2 p.A746T variant was reported recently as a risk factor for PD in the Han-Chinese population. 8 Based on the above background, we inves- tigated the role of ATP13A2 p.A746T variant in Japa- nese PD patients by examining 917 Japanese PD patients (871 index cases) and 190 normal controls by high-resolution melting curve analysis. PATIENTS AND METHODS Subjects The study subjects were 917 Japanese PD patients (871 index cases) and 190 normal controls. Of these, 61.2% (533/871) were sporadic PD and 38.8% (338/ 871) had at least one first and/or second-degree relative with parkinsonism. Many had been screened for PD- associated genes and reported previously (screening rates in each gene were as follows; parkin: 73.4%, PINK1: 79.5%, DJ-1: 37.3%, SNCA multiplication: *Correspondence to: Nobutaka Hattori, Department of Neurology, Juntendo University School of Medicine, 2-1-1 Hongo, Bunkyo-ku, Tokyo 113-8421, Japan. E-mail: [email protected] Potential conflict of interest: Nothing to report. Received 31 August 2009; Revised 20 November 2009; Accepted 22 February 2010 Published online in Wiley Online Library (wileyonlinelibrary. com). DOI: 10.1002/mds.23106 2434 Movement Disorders Vol. 25, No. 14, 2010, pp. 2434–2460 Ó 2010 Movement Disorder Society
Transcript of Parkinson's Disease and pathological gambling: Results from a functional MRI study

Brief Reports
Rapid Screening of ATP13A2Variant with High-Resolution
Melting Analysis,
Manabu Funayama, PhD,1,2
Hiroyuki Tomiyama, MD, PhD,1
Ruey-Meei Wu, MD, PhD,3 Kotaro Ogaki, MD,1
Hiroyo Yoshino, BS,2 Yoshikuni Mizuno, MD,2
and Nobutaka Hattori, MD, PhD1,2*
1Department of Neurology, Juntendo University School ofMedicine, Tokyo, Japan; 2Research Institute for Diseases ofOld Age, Graduate School of Medicine, Juntendo University,Tokyo, Japan; 3Department of Neurology, National Taiwan
University Hospital, College of Medicine, NationalTaiwan University, Taipei, Taiwan
Abstract: Several genetic and environmental factors areinvolved in the pathogenesis of Parkinson’s disease (PD).Recently, a novel variant of ATP13A2 (p.A746T) responsi-ble for PARK9 was reported as a risk factor for PD in theHan-Chinese population. To investigate the role of thisvariant in Japanese PD patients, we examined 917 Japa-nese PD patients (871 index cases) and 190 controls byhigh-resolution melting curve analysis. We detected heter-ozygous p.A746T variant in a single patient with sporadicPD and a single control subject. These results suggest thatATP13A2 p.A746T variant is unlikely to play a role as acommon risk factor or a pathogenic mutation for PD atleast in Japanese. Our data on Japanese differ from thosereported recently on Han-Chinese. Further studies areneeded to confirm conclusions on roles of ATP13A2variant in Asians or other populations. � 2010 MovementDisorder Society
Key words: Parkinson’s disease; gene risk factor; PARK9;lightscanner
INTRODUCTION
Parkinson’s disease (PD) is the second most com-
mon neurodegenerative disorder pathologically charac-
terized by selective dopaminergic neurodegeneration
and the presence of Lewy bodies in the midbrain. Clin-
ical features of typical PD are resting tremor, rigidity,
bradykinesia, and postural instability. PD is thought to
be caused by interaction with multiple genetic and
environmental factors; however, the exact etiology of
PD remains elusive. To elucidate the mechanisms of
nigral degeneration, monogenic forms of PD provide
good information to identify the cause of not only
monogenic but also sporadic forms of this disease.
Case-control studies using genetic analyses are impor-
tant in identification of susceptibility genes for PD
such as SNCA, LRRK2, and GBA.1–5 In particular,
Asian population-specific variants such as LRRK2p.G2385R and p.R1628P showed strong association
with susceptibility to the pathogenesis of PD.6,7 Inter-
estingly, the LRRK2 p.G2385R variant has been associ-
ated with PD in Asian population including Japanese
and Chinese;3,6 however, LRRK2 p.R1628P variant has
not been found in Japanese population so far, suggest-
ing some differences in ethnic background based on
human migration history among Asians.7 Furthermore,
a novel ATP13A2 p.A746T variant was reported
recently as a risk factor for PD in the Han-Chinese
population.8 Based on the above background, we inves-
tigated the role of ATP13A2 p.A746T variant in Japa-
nese PD patients by examining 917 Japanese PD
patients (871 index cases) and 190 normal controls by
high-resolution melting curve analysis.
PATIENTS AND METHODS
Subjects
The study subjects were 917 Japanese PD patients
(871 index cases) and 190 normal controls. Of these,
61.2% (533/871) were sporadic PD and 38.8% (338/
871) had at least one first and/or second-degree relative
with parkinsonism. Many had been screened for PD-
associated genes and reported previously (screening
rates in each gene were as follows; parkin: 73.4%,
PINK1: 79.5%, DJ-1: 37.3%, SNCA multiplication:
*Correspondence to: Nobutaka Hattori, Department of Neurology,Juntendo University School of Medicine, 2-1-1 Hongo, Bunkyo-ku,Tokyo 113-8421, Japan. E-mail: [email protected]
Potential conflict of interest: Nothing to report.Received 31 August 2009; Revised 20 November 2009; Accepted
22 February 2010Published online in Wiley Online Library (wileyonlinelibrary.
com). DOI: 10.1002/mds.23106
2434
Movement DisordersVol. 25, No. 14, 2010, pp. 2434–2460� 2010 Movement Disorder Society

52.5%, and LRRK2 exon 41: 61.0%).9–14 Furthermore,
25 out of 917 patients were screened for all exons of
ATP13A2 in our previous study.14 Patients with patho-
genic mutation(s) were not included in this study. Di-
agnosis of PD was adopted by the participating neurol-
ogists based on established criteria.15 Clinical and de-
mographic data were obtained for 894 patients. The
mean age at onset (AAO) was 50.6 6 14.9 years
(6SD, range, 7–88 years). Moreover, 407 out of 917
(44.4%) patients had early-onset PD (onset <50 years).
The study included 446 men and 471 women (female:-
male ratio, 1.06:1). The mean age of the control group
at sampling was 58.2 6 16.5 years (6SD, range, 23–
98 years). The study was approved by the ethics com-
mittee of Juntendo University School of Medicine. All
subjects gave informed and written consent form.
Genetic Analyses
PCR was performed in a 10 lL volume using 10 ng
of genomic DNA, 1 lL of LCGreen Plus (Idaho Tech-
nology, Salt Lake City, ID), 5 lL of AmpliTaq Gold
PCR Master Mix (Applied Biosystems, Foster City,
CA), and 5 pmol of each forward and reverse primer.
Mineral oil (15 lL per reaction) was added before
starting the PCR. The amplification conditions were as
follows: preincubation at 958C for 9 minutes, 40 cycles
of denaturation at 958C for 20 seconds, annealing and
extension at 658C for 20 seconds, and final step for
heteroduplex formation at 948C for 30 seconds fol-
lowed by 208C hold. PCR primers were designed by
ExonPrimer (http://ihg2.helmholtz-muenchen.de/ihg/
ExonPrimer.html), and the sequences of the primers
for ATP13A2 p.A746T detection were as follows:
forward; CGCAGACAACGCCAGTTATCC, reverse;
GGGCCCCTACATGCCATTG. Following PCR, high-
resolution melting analysis was performed using Light-
Scanner (Idaho Technology). Fluorescence was col-
lected from 85 to 958C at a ramp rate of 0.18C/s. Melt-
ing curve analysis was performed by the method pro-
vided with LightScanner Call-It software (version 1.5,
Idaho Technology). Samples determined to be variants
were sequenced directly using the method reported pre-
viously by our group.14 We used DNA of one patient
carrying p.A746T variant (identified in a previous
report) as a positive control.8
Haplotype analysis was performed in p.A746T car-
riers using eight microsatellite markers (MSs) and four
single nucleotide polymorphisms (SNPs). MSs and
SNPs were genotyped by PCR using fluorescence-la-
beled primers or direct-sequencing, 3130 Genetic Ana-
lyzer, and GeneMapper software (Applied Biosystems).
Sequences of the primers and conditions of PCR are
available upon request to the corresponding author.
Statistics Analysis
All data are expressed as mean 6 SD. The Fisher’s
exact test was used to calculate the difference in the
allele frequencies. In all statistical analyses, a P value
of 0.05 or less was considered statistically significant.
RESULTS
Genotyping was completed showing a high genotyp-
ing success rate (98.6%) in high-resolution melting.
Heterozygous p.A746T (c.2236G>A) variant was
detected in one patient with sporadic PD (1/533,
0.19%) and one control subject (1/190, 0.53%) by
high-resolution melting analysis and direct sequencing
(Fig. 1 and Table 1). There was no statistical differ-
ence in the frequency of p.A746T variant between
patients with sporadic PD and control subjects (P 50.46). None of the patients with family history of PD
FIG. 1. Genotyping of ATP13A2 p.A746T variant by LightScannerand direct sequencing. The difference between heterozygous p.A746Tvariant (red) and the reference (black) in shifted melting curve andDfluorescence was shown (A). Chromatograms showing wild type andheterozygous p.A746T variant (B). [Color figure can be viewed in theonline issue, which is available at wileyonlinelibrary.com.]
2435ATP13A2 VARIANT IN JAPANESE PD
Movement Disorders, Vol. 25, No. 14, 2010

had p.A746T variant (0/338, 0%). Furthermore, there
was no difference in the frequency between the entire
PD patients and the control subjects (P 5 0.31).
Whereas the frequency in Japanese patients (1/917,
0.11%) was lower than that in Han-Chinese patients
(3/182, 1.65%) (Table 1).8
Haplotype analysis of PARK9 locus revealed that
patients carrying the p.A746T variant shared at least
one allele of MSs and SNPs (Table 2). The patient
with p.A746T variant initially showed left-hand resting
tremor at age 46. Subsequently, he developed resting
tremor in the right hand, bradykinesia, rigidity, and
mild parkinsonian gait without retropulsion (Hoehn
and Yahr stage II). He is still doing well with 2 mg of
trihexyphenidyl a day 10 years after the onset of the
disease. His brain MRI was normal at another hospital
and cardiac MIBG uptake was markedly diminished
(Heart/Mediastinum ratio 1.17 at early image and 1.14
at delayed image; our normal range is above 1.45 for
both imaging). He was taking 2.5 mg of selegiline
when the MIBG scintigraphy was done.
DISCUSSION
In this study, we used high-resolution melting analy-
sis for genotyping. This method is a rapid, sensitive,
and cost-effective technique for detection of mutation
without direct sequencing.16 Indeed, genotyping
p.A746T variant by high-resolution melting analysis
was faster, low cost, and associated with a low error
rate. Thus, as reported previously, high-resolution melt-
ing analysis is useful for primary screening of muta-
tions or SNPs.16,17
Based on this sound method, we detected ATP13A2p.A746T variant in only one Japanese patient with spo-
radic PD. The frequency was significantly different
from that of the previous report in early-onset PD of
Han-Chinese population (P 5 0.016).8 These results
suggest that ATP13A2 p.A746T is a rare variant in Jap-
anese population compared with Han-Chinese popula-
tion. This is similar to the result of LRRK2 p.R1628P
variant in Han-Chinese and Japanese population.7
Based on these findings, both ATP13A2 p.A746T and
LRRK2 p.R1628P variants may be more recent muta-
tions than LRRK2 p.G2385R variant, which is a com-
mon variant among Asian population including Han-
Chinese and Japanese.3,6,7 Moreover, the results of
haplotype analysis suggest that carriers have inherited
the p.A746T variant from a common ancestral founder.
However, because we could not determine the haplo-
type phase, further analyses are needed to verify the
founder effect in Asia.
Lin et al.8 did not detect p.A746T variant in any of
their 589 control subjects. In comparison, we detected
one Japanese control subject carrying heterozygous
p.A746T variant, but the frequency was not signifi-
cantly different compared to PD patients. Thus,
although we could not exclude the possibility that our
normal subject with p.A746T variant will develop PD
in future, our study provided no evidence that
ATP13A2 p.A746T enhances the susceptibility to PD
in Japanese. In addition, our analysis did not identify
any patient with ATP13A2 p.A746T and familial par-
kinsonism despite the large sample size, suggesting
that this variant plays no major roles in familial par-
kinsonism, at least in Japanese. This might be based
on the rarity of the p.A746T variant, ethnic differences,
and/or human migration history. Also, this finding
could be due to phenotypic differences between previ-
ously reported atypical parkinsonism patients with
TABLE 1. Comparison of p.A746T frequency amongJapanese and Han-Chinese population
p.A746T
WT Hetero Frequency (%)
Japanese SPD 532 1 0.19FPD 384 0 0.00Total 916 1 0.11Cont 189 1 0.53
Han-Chinese PDa 179 3 1.65
SPD, sporadic PD; FPD, familial PD; Cont, Normal control; WT,wild type; Hetero, heterozygous; Frequency, heterozygous frequency.
aData from Ref. 8.
TABLE 2. Haplotype analysis of PARK9 locus
Marker PD (JPN) PD (CHN) Cont (JPN)
D1S2644 220/232 232/234 232/232D1S2826 134/134 134/134 126/134D1S1592 236/240 240/240 244/244D1S3669 189/189 185/189 193/201rs2076603 (ex17) C/T C/T C/Cc.2236G>A (ex20, p.A746T) G/A G/A G/Ars9435662 (ex24) C/T C/T C/Crs3738815 (ex25) G/A G/A A/Ars3170740 (ex29) G/A G/A G/GD1S436 205/205 205/211 205/211D1S2672 155/155 147/157 155/157D1S507 187/189 195/201 193/198D1S228 119/123 123/123 119/123
Genotypes of p.A746T carriers; Japanese [PD (JPN)] and Chinese[PD (CHN)]8 patients and Japanese normal control [Cont (JPN)]were shown.
2436 M. FUNAYAMA ET AL.
Movement Disorders, Vol. 25, No. 14, 2010

pathogenic ATP13A2 mutations and patients with typi-
cal parkinsonism.14,18,19
In conclusion, based on the present large study,
ATP13A2 p.A746T variant is not a common risk factor
or pathogenic mutation for PD at least in Japanese.
However, the role of ATP13A2 variant in PD is worth
discussing. Therefore, further analyses should be per-
formed to draw definite conclusions about the role of
ATP13A2 variant in Asians and other populations. Our
study indicates that for genotyping or mutation detec-
tion, high-resolution melting analysis is a rapid and
cost-effective method when the targets are limited.
Acknowledgments: This work was supported by High-Tech Research Center Project, Grant-in-Aid for ScientificResearch (to NH, 17390256, and to HT, 21591098),Grant-in-Aid for Scientific Research on Priority Areas (toNH, 08071510), and Grant-in-Aid for Young Scientists (toMF, 20790625) from the Japanese Ministry of Education,Culture, Sports, Science and Technology. We are gratefulto the patients, their families, and all participants. Wethank Mr. Taka-aki Yanase for the excellent technical as-sistance.
Financial Disclosure: Ruey-Meei Wu, Kotaro Ogaki, Hir-oyo Yoshino, Yoshikuni Mizuno: none. Manabu Funayama:Grant: Japanese Ministry of Education, Culture, Sports, Sci-ence and Technology, Grant-in-Aid for Young Scientists(20790625); Hiroyuki Tomiyama: Grant: Japanese Ministryof Education, Culture, Sports, Science and Technology,Grant-in-Aid for Scientific Research (21591098), JapaneseMinistry of Health, Labor and Welfare, Grant-in-Aid of theResearch Committee of Muro disease (Kii ALS/PDC)(21210301); Nobutaka Hattori: Grant: Japanese Ministry ofEducation, Culture, Sports, Science and Technology, Grant-in-Aid for Scientific Research (09005213), and Grant-in-Aidfor Scientific Research on Priority Areas (08071510), Japa-nese Ministry of Health, Labour and Welfare, Health andLabour Sciences Research Grants (H19-021 and H20-015).
Author Roles: Manabu Funayama was involved in con-ception, organization, and execution of the research project;design, execution, review and critique of the data construc-tion; writing of the first draft, review and critique of themanuscript. Hiroyuki Tomiyama was involved in conceptionand organization of the research project; design, review andcritique of the data construction; review and critique of themanuscript. Ruey-Meei Wu was involved in execution,review and critique of the data construction; review and cri-tique of the manuscript. Kotaro Ogaki was involved in execu-tion of the data construction; writing of the first draft of themanuscript. Hiroyo Yoshino was involved in execution,review and critique of the data construction; review and cri-tique of the manuscript. Yoshikuni Mizuno was involved inexecution of the data construction; review and critique of themanuscript. Nobutaka Hattori was involved in organizationof the research project, review and critique of the data con-struction; review and critique of the manuscript.
REFERENCES
1. Mueller JC, Fuchs J, Hofer A, et al. Multiple regions of alpha-synuclein are associated with Parkinson’s disease. Ann Neurol2005;57:535–541.
2. Mizuta I, Satake W, Nakabayashi Y, et al. Multiple candidate geneanalysis identifies alpha-synuclein as a susceptibility gene for spo-radic Parkinson’s disease. Hum Mol Genet 2006;15:1151–1158.
3. Di Fonzo A, Wu-Chou YH, Lu CS, et al. A common missensevariant in the LRRK2 gene, Gly2385Arg, associated with Parkin-son’s disease risk in Taiwan. Neurogenetics 2006;7:133–138.
4. Aharon-Peretz J, Rosenbaum H, Gershoni-Baruch R. Mutationsin the glucocerebrosidase gene and Parkinson’s disease in Ashke-nazi Jews. N Engl J Med 2004;351:1972–1977.
5. Nichols WC, Pankratz N, Marek DK, et al. Mutations in GBAare associated with familial Parkinson disease susceptibility andage at onset. Neurology 2009;72:310–316.
6. Funayama M, Li Y, Tomiyama H, Yoshino H, et al. Leucine-rich repeat kinase 2 G2385R variant is a risk factor for Parkinsondisease in Asian population. Neuroreport 2007;18:273–275.
7. Ross OA, Wu YR, Lee MC, et al. Analysis of Lrrk2 R1628P asa risk factor for Parkinson’s disease. Ann Neurol 2008;64:88–92.
8. Lin CH, Tan EK, Chen ML, et al. Novel ATP13A2 variant asso-ciated with Parkinson disease in Taiwan and Singapore. Neurol-ogy 2008;71:1727–1732.
9. Kitada T, Asakawa S, Hattori N, et al. Mutations in the parkingene cause autosomal recessive juvenile parkinsonism. Nature1998;392:605–608.
10. Kumazawa R, Tomiyama H, Li Y, et al. Mutation analysis of thePINK1 gene in 391 patients with Parkinson disease. Arch Neurol2008;65:802–808.
11. Tomiyama H, Li Y, Yoshino H, et al. Mutation analysis for DJ-1in sporadic and familial parkinsonism: screening strategy in par-kinsonism. Neurosci Lett 2009;455:159–161.
12. Nishioka K, Hayashi S, Farrer MJ, et al. Clinical heterogeneityof alpha-synuclein gene duplication in Parkinson’s disease. AnnNeurol 2006;59:298–309.
13. Tomiyama H, Li Y, Funayama M, et al. Clinicogenetic study ofmutations in LRRK2 exon 41 in Parkinson’s disease patientsfrom 18 countries. Mov Disord 2006;21:1102–1108.
14. Ning YP, Kanai K, Tomiyama H, et al. PARK9-linked parkin-sonism in eastern Asia: mutation detection in ATP13A2 and clin-ical phenotype. Neurology 2008;70:1491–1493.
15. Hughes AJ, Daniel SE, Kilford L, Lees AJ. Accuracy of clinical di-agnosis of idiopathic Parkinson’s disease: a clinico-pathological studyof 100 cases. J Neurol Neurosurg Psychiatry 1992;55:181–184.
16. Zhou L, Wang L, Palais R, Pryor R, Wittwer CT. High-resolu-tion DNA melting analysis for simultaneous mutation scanningand genotyping in solution. Clin Chem 2005;51:1770–1777.
17. Van Der Stoep N, Van Paridon CD, Janssens T, et al. Diagnosticguidelines for high-resolution melting curve (HRM) analysis: aninterlaboratory validation of BRCA1 mutation scanning using the96-well LightScanner. Hum Mutat 2009;30:899–909.
18. Ramirez A, Heimbach A, Grundemann J, et al. Hereditary parkinson-ism with dementia is caused by mutations in ATP13A2, encoding alysosomal type 5 P-type ATPase. Nat Genet 2006;38: 1184–1191.
19. Di Fonzo A, Chien HF, Socal M, et al. ATP13A2 missensemutations in juvenile parkinsonism and young onset Parkinsondisease. Neurology 2007;68:1557–1562.
2437ATP13A2 VARIANT IN JAPANESE PD
Movement Disorders, Vol. 25, No. 14, 2010
Long-Term Stability of Effects ofSubthalamic Stimulation inParkinson’s Disease: Indian
Experience
Asha Kishore, MD, DM,1* Ravimohan Rao, MS, MCh,1
Syam Krishnan, MD, DM,1 Dilip Panikar, MS, MCh,1
Gangadhara Sarma, MA,1
Mathuranath Pavagada Sivasanakaran, MD, DM,2
and Sankara Sarma, PhD3
1Comprehensive Care Centre for Movement Disorders, SreeChitra Tirunal Institute for Medical Sciences and
Technology, Trivandrum, Kerala, India; 2Cognition andBehavioral Neurology Centre, Sree Chitra Tirunal Institutefor Medical Sciences and Technology, Trivandrum, Kerala,India; 3Achutha Menon Centre for Health Sciences Studies,
Sree Chitra Tirunal Institute for Medical Sciences andTechnology, Trivandrum, Kerala, India
Abstract: Reports of long-term effects of subthalamic(STN) stimulation for Parkinson’s disease (PD) are few,mostly open-label evaluations and from Western centers.We used single-blind and open-label motor, cognitive andquality of life (QOL) evaluations to study the effects ofbilateral STN stimulation in 45 patients over 5 years. Ourpatients showed a stable and substantial reduction in thecardinal signs of PD, motor fluctuations, and dyskinesiasbut less so for axial signs. The reduction in medicationsand the intensity of electrical stimulation needed alsoremained stable during follow up. Although the totalQOL and its parkinsonism and social components showedsustained benefits till 5 years, the gains in emotional andsystemic subsets were short lasting. Global scores formood and cognition did not show significant worsening.Benefits of STN stimulation on the cardinal signs, motorcomplications, and QOL of advanced PD were substantialand sustained till 5 years. The initial benefits in axialmotor signs and emotional and psychological aspects ofQOL did not show similar stability. In general, the proce-dure had insignificant impact on cognition and mood.This is the first report of STN stimulation in Asianpatients with PD. � 2010 Movement Disorder Society
Key words: subthalamic nucleus; deep brain stimulation;motor fluctuations; Asia; Parkinson’s disease
Two recent randomized, multicentre studies demon-
strated that subthalamic (STN) stimulation is superior
to best medical treatment in managing motor compli-
cations of Parkinson’s disease (PD) and improving
the quality of life (QOL) of patients during a 6-month
period.1,2 Although several open-label studies have
reported similar short-term effects,3 its stability
beyond 3 years has been established by only few
reports and these emerged from Western centres.4–10
Concurrent QOL changes in the same cohort were not
reported in them. With the exception of a single, dou-
ble-blind study in 10 patients,5 all were open-label
assessments. We report results of a prospective study
examining the stability of effects of STN stimulation
in PD under single-blind and open-label conditions
over a 5-year period.
PATIENTS AND METHODS
Forty-five consecutive patients who received bilat-
eral STN stimulation for PD at our centre from 1999
to 2004 participated in the study. All subjects gave
written informed consent and the study was approved
by the Ethics Committee of the hospital.
Assessments
All subjects were assessed in open-label conditions
using Unified Parkinson’s Disease Rating Scale11
(UPDRS I–IV) 1 week before surgery (baseline) and at
yearly intervals for 5 years. ‘‘drug off’’ and ‘‘drug on’’
assessments were made in defined conditions.12 The
baseline dose of levodopa (L-dopa) was used in all
assessments. After surgery, all patients were evaluated
in ‘‘stimulation on—drug off,’’ ‘‘stimulation on—drug
on,’’ ‘‘stimulation-off (for 2 hours)—drug off,’’ and
‘‘stimulation off—drug on’’ in the same day. All
UPDRS III assessments were recorded on video.
UPDRS II was used to assess patient’s ADL in ‘‘drug
off’’ and ‘‘drug on’’ in the 1 week before the surgery.
The same was assessed after surgery, the only differ-
ence being that they were in stimulation on state con-
tinuously after surgery. Therefore, it is mentioned
under scores during ‘‘stimulation on drug off/drug on.’’
Blinded Ratings
At the end of study, ratings were done on videos
presented at random order by a second movement dis-
order neurologist who was not part of the team during
the entire study period. Blinded ratings (excluding ri-
gidity) of videos at baseline (‘‘drug off’’ and ‘‘drug
*Correspondence to: Dr. Asha Kishore, Professor of Neurology,Comprehensive Care Centre for Movement Disorders, Sree ChitraTirunal Institute for Medical Sciences and Technology, Trivandrum,Kerala 695011, India. E-mail: [email protected]
Potential conflict of interest: Nothing to report.Received 18 February 2010; Revised 6 April 2010; Accepted 30
April 2010Published online in Wiley Online Library (wileyonlinelibrary.
com). DOI: 10.1002/mds.23269
Movement Disorders, Vol. 25, No. 14, 2010
2438 A. KISHORE ET AL.

on’’) and in postoperative visits in ‘‘stimulation on—
drug off’’ and ‘‘stimulation on—drug on’’ states were
done The assessment condition and year of evaluation
were not revealed to the blinded neurologist.
Neuropsychological Evaluation
All patients were interviewed by a neuropsychologist
in the drug on at base line and stimulation on—drug
on after surgery. We used Beck Depression Inventory
(BDI),13 Hospital Anxiety and Depression Scale
(HADS), and Addenbrooke’s Cognitive Examination
(ACE).14,15 Executive functions were tested using Digit
Span, Verbal Fluency (VF) test, Trail Making tests
part A and B, and Wisconsin Card Sorting tests.
Praxis was measured using Object Assembly and
Block Design, and semantic category fluency and a
12-item line drawing test were used to test language.
Wechsler Memory Scale (revised) was used to test
immediate and delayed memory.
Visuospatial orientation was assessed using Benton’s
Judgment of Line Orientation test and Visual Object
and Space Perception Battery.
Quality of Life
QOL was assessed by the PD Quality of Life
(PDQL).16,17 It covers domains of parkinsonism, social,
emotional, and systemic aspects. An increment in
scores indicates improvement.
Surgery
All patients underwent bilateral stereotactic implan-
tation of quadriploar DBS electrode placement in one
session (model 3387 in 9 cases and model 3389 in 36;
Medtronic, MN, USA). STN was located by MRI (1.5
T MR Scanner, Signa, General Electric, MW, USA),
5-channel microelectrode recordings (Lead point 4,
Medtronic, MN) with Bengun microelectrode array and
macro stimulation in selected tracks. Postoperative
MRI was done in all to look for surgical complica-
tions.
Statistical Analyses
The primary outcome measures were changes in
blinded scores of UPDRS III. The secondary outcome
measures were changes in UPDRS I, II, IV, Hoehn and
Yahr staging, Schwab and England scores, neuropsy-
chological tests, L-dopa equivalent dose of drugs
(LEDD), and stimulation settings. Repeated measures
analysis of variance was used to see the effect of time.
Post hoc comparisons were made using paired Stu-
dent’s t-test or Wilcoxson signed-rank test. Bonferroni
correction was applied and a P value less than 0.005
was considered as significant. Statistical analysis was
performed using statistical package for social science
software (version 15.0, SPSS, Chicago, IL, USA) for
Windows.
RESULTS
Patient Characteristics
Of the 45 patients, 18 were women and 27 men.
The mean age at onset of symptoms was 44.1 6 11.4
years, mean age at surgery was 55.4 6 10.9 (range
27–69 years) and mean duration of illness was 11.1 65.7 years. All 45 patients were available for 1-year
assessment. Four patients died between 1 and 3 years
from unrelated events. Five could not participate after
1st year because of long distance travel involved. At
the time of analysis, the remaining 36 had completed
3 years and 29 of them had reached 5-year follow-up.
One committed suicide at 4 years. There was no drop
out between 3 and 5 years.
I. Single-Blind Evaluation of UPDRS III at 3 Years
Stimulation On-Drug Off
UPDRS-III motor score improved from baseline by
43% (48% including rigidity scores from open-label
assessment), tremor by 90%, rigidity by 68%, bradyki-
nesia by 38%, and gait by 43% (Table 1). When com-
pared with baseline, there was no improvement in pos-
tural stability or speech. There was a trend for worsen-
ing of speech between 1 and 3 years. The inter-rater
(blinded and unblinded rater) agreement on UPDRS III
items was excellent (intraclass correlation coefficient
5 0.95).
Stimulation On-Drug On
UPDRS-III and its sub scores did not improve from
baseline. At 3 years, postural stability was worse than
at 1 year.
II. Single-Blind Evaluation of UPDRS III at 5 Years
Stimulation On-Drug Off
Total UPDRS-III improved from baseline by 39%
(45% including rigidity), tremor by 85%, rigidity by
66%, and bradykinesia by 38% but not postural stabil-
ity or gait (Table 1). Total UPDRS III showed a
decline between 1 and 5 years.
2439STABILITY OF EFFECTS OF STN STIMULATION
Movement Disorders, Vol. 25, No. 14, 2010

Stimulation On-Drug On
At 5 years, there was no improvement from baseline.
There was a worsening of postural stability compared
with 1 year.
III. Open-Label Evaluations at 3 Years
Stimulation On-Drug Off
At 3 years, UPDRS I was unchanged (Tables 1 and
2). UPDRS II improved by 39% and remained stable.
Hoehn and Yahr stage was 29% improved but less
than at 1 year. Schwab and England score improved by
81% with no significant decline after 1st year.
Stimulator On-Drug On
At 3 years, none of the scores showed improve-
ment from baseline except Schwab and England
scale. Hoehn and Yahr stage declined between 1 and
3 years.
IV. Open-Label Evaluations at 5 Years
Stimulation On-Drug Off
UPDRS II (37%) and Schwab and England scores
(79%) were still improved and stable when compared
with baseline (Tables 1 and 2). UPDRS I and Hoehn
and Yahr stage declined from 1 to 5 years.
Stimulation On-Drug On
UPDRS I or II did not improve from baseline on.
The Hoehn and Yahr stage was worse than at baseline
and 3 years.
Effect of Chronic Stimulation on Motor
Fluctuations and Dyskinesias at 3 and 5 Years
Scores for dyskinesias (UPDRS IV A) improved
from baseline by 72% and motor fluctuations (UPDRS
IV B) by 52% at 3 years and by 66% and 45%, respec-
tively, at 5 years (Table 2). There was no significant
decline in either score over 5 years.
QOL Scores at 3 and 5 Years
At 3 years, the total QOL score improved from baseline
by 23%, including its parkinsonism (28%), systemic
(19%), emotional (16%), and social (25%) components and
remained stable from 1 to 3 years (Table 3). At 5 years,
total QOL score (20%) and its parkinsonism (20%) and
social (27%) components were improved when compared
with baseline but not the systemic and emotional subsets.
At 5 years, total QOL, parkinsonism, and systemic compo-
nents showed a decline when compared with 1st year.
TABLE 1. UPDRS scores with stimulation on in ‘‘drug off’’ and ‘‘drug on’’ states
Subscales
Baseline 1 yr 3 yr 5 yrBaseline vs. 3 yr Baseline vs. 5 yr 1 vs. 3 yr 1 vs. 5 yrN 5 45 N 5 45 N 5 36 N 5 29
Mean 6 SD Mean 6 SD Mean 6 SD Mean 6 SD P value P value P value P value
Drug offUPDRS-III motor(0–08) 36.4 (11.4) 17.9 6 8.9 20.7 6 10.7 22.1 6 8.7 <0.0001 <0.0001 0.03 0.002Tremor (0–28) 4.0 6 3.9 0.6 6 1.2 0.40 6 0.8 0.62 6 0.9 <0.0001 <0.0001 0.9 0.7Rigiditya (0–20) 10.5 6 4.1 3.5 6 3.3 3.3 6 2.4 3.5 6 2.5 <0.0001 <0.0001 0.5 0.7Bradykinesia (0–32) 16.2 6 5.2 8.6 6 5.1 9.9 6 5.4 9.71 6 5.2 <0.0001 <0.0001 0.1 0.1Postural stability (0–4) 2.1 6 0.8 1.4 6 0.8 1.7 6 0.8 1.8 6 0.7 0.2 0.5 0.01 0.04Gait (0–4) 2.3 6 1.1 1.1 6 0.8 1.3 6 0.9 1.4 6 0.7 <0.0001 0.03 0.03 0.02Speech (0–4) 1.6 6 0.6 1.1 6 0.9 1.7 6 1.1 1.6 6 0.8 0.7 0.1 0.009 0.1UPDRS IIa (0–52) 25.4 6 6.9 13.2 6 5.9 14.4 6 6.7 15.8 6 5.9 <0.0001 <0.0001 0.06 0.004UPDRS Ia (0–16) 2.0 6 2.01 1.9 6 2.1 2.4 6 2.3 3.1 6 2.3 0.7 0.07 0.2 0.002
Drug onUPDRS III motor 16.2 6 8.3 13.9 6 8.1 14.7 6 8.9 16.5 6 7 0.5 0.7 0.4 0.01Tremor 0.4 6 0.9 0.2 6 0.7 0.2 6 0.6 0.1 6 0.2 0.06 0.07 0.3 0.1Rigiditya 3.4 6 3.1 1.7 6 1.9 1.8 6 3.1 1.8 6 2.1 0.006 0.007 0.3 0.7Bradykinesia 8.5 6 5.2 3.2 6 3.1 6.9 6 4.6 8.3 6 4.1 0.05 0.4 0.9 0.04Postural stability 1.2 6 0.7 1.1 6 0.9 1.6 6 0.9 1.7 6 0.9 0.04 0.1 0.001 0.001Gait 1.0 6 0.9 0.7 6 0.6 0.8 6 0.6 0.8 6 0.9 0.6 0.8 0.1 0.7Speech 1.0 6 0.8 1.0 6 1.0 1.2 6 0.9 1.1 6 0.7 0.2 0.1 0.2 0.2UPDRS IIa 9.5 6 8.1 5.9 6 5.1 7.3 6 6.3 7.1 6 4.4 0.1 0.3 0.03 0.02UPDRS Ia 1.3 6 1.9 1.3 6 1.9 1.2 6 1.8 2.1 6 2.0 0.8 0.09 0.8 0.1
aOpen label scores, P < 0.005 is significant.
2440 A. KISHORE ET AL.
Movement Disorders, Vol. 25, No. 14, 2010

Progression of Disease (Stimulation Off—Drug Off)
at 3 and 5 Years
There was a significant deterioration only in brady-
kinesia scores (open-label pre- and post-operative
scores used) (Table 4).
L-dopa Response at 3 and 5 Years
There was no significant worsening of L-dopa
response when compared with baseline. Gait was less
L-dopa responsive than at 1st year (Table 4).
Medications and Electrical Stimulation Parameters
at 3 and 5 Years
LEDD could be reduced by 40% at 3 years and
48% at 5 years, and there were no significant
changes in dose of drugs or stimulation parameters
beyond 1st year (Table 2). Stimulators were replaced
during first 5 years in 6 patients. The indications
were hardware failure in 2 and end of battery life
in 4.
Neuropsychological Evaluation at 3 and 5 Years
Mood and Anxiety. There were no significant changes
in global mood or anxiety scores when compared with base-
line (Table 5). Twenty-six patients were depressed at base-
line. At the last follow-up of 36 cases, mood had improved
in 11, unchanged in 13, and worsened in 12.
Global Cognition. There was no significant change
in the ACE scores from baseline or between 1 and 5
years. At baseline, ACE scores (adjusted for levels of
education) were 1 standard deviation below normal in
12 patients. At 5 years, 5 of them were clinically
demented.
Attention and Executive Functions. None of the
tests showed a significant change following surgery. At
baseline, only 1 patient had verbal fluency 1 SD below
normal. By 5 years, 9 additional patients had reduced
verbal fluency (6 were identified in 1-year visit). Apathy
(measured from UPDRS I) was present in 12 at baseline.
At 3 years, apathy worsened in 2 and was newly detected
in 6. At 5 years, apathy was worse in 4 and developed
new in 2 additional patients. Most of the complications
were related to hardware or surgery (Table 6).
TABLE 2. Effect of subthalamic stimulation on UPDRS I, II, IV, and other scales
SubscaleBaseline 1 yr 3 yr 5 yr
Base linevs. 3 yr
Baselinevs. 5 yr 1 vs. 3 yr 1 vs. 5 yr
N 5 45 N 5 45 N 5 36 N 5 29 P value P value P value P value
Dyskinesias(UPDRS IVA) (0–13)
4.4 6 2.3 1.2 6 1.5 1.2 6 1.2 1.5 6 1.3 <0.0001 <0.0001 0.1 0.03
Fluctuations(UPDRS IVB)(0–7)
4.0 6 1.3 2.3 6 1.4 1.9 6 1.2 2.2 6 1.6 <0.0001 <0.0001 0.1 0.5
Schwab and EnglandOFF (0–100%)
43.3 6 21.3 74.2 6 17.9 78.6 6 12.9 77.7 6 14.1 <0.0001 <0.0001 0.6 0.5
Schwab and EnglandON (0–100%)
70.3 6 22.3 86 6 10.3 85.2 6 12.1 82.8 6 12.3 <0.001 0.01 0.6 0.1
Hoehn and Yahr OFF 3.7 6 0.9 2.6 6 0.6 2.8 6 0.5 2.9 6 0.6 0.002 0.3 0.001 0.001Hoehn and Yahr ON 2.3 6 0.5 2.4 6 0.6 2.6 6 0.6 2.7 6 0.5 0.001 0.007 0.001 0.009LEDD (mg) 669.8 6 359.7 415.3 6 365.6 397.1 6 267.7 346.5 6 202.6 <0.0001 <0.0001 0.1 0.2Amplitude of
current (V)NA 3.0 6 0.6 3.1 6 0.5 3.3 6 0.5 NA NA 0.8 0.1
Frequency (Hz) NA 140.6 6 20 143.1 6 21.6 150.3 6 24.6 NA NA 0.5 0.07Pulse width (lsec) NA 64 6 9.8 66.8 6 12.7 70.9 6 14.7 NA NA 0.3 0.2
Data are mean 6 SD, P < 0.005 is statistically significant. Comparisons are with corresponding baseline values.
TABLE 3. Effect of subthalamic stimulation on quality of life scores
PDQL score
Baseline 1 yr 3 yr 5 yrBase vs. 3 yr Base vs. 5 yr 1 vs. 3 yr 1 vs. 5 yrN 5 45 N 5 45 N 5 36 N 5 29
Mean 6 SD Mean 6 SD Mean 6 SD Mean 6 SD Mean 6 SD P value P value P value
Total (37–185) 93.9 6 22 123.2 6 20.4 115.2 6 26.4 112.8 6 21.8 <0.0001 0.001 0.01 0.004Parkinsonism (14–70) 34.5 6 8.9 46.7 6 7.9 44.1 6 10.3 41.6 6 8.9 <0.0001 0.003 0.04 0.007Systemic (7–35) 18.3 6 5.2 23.5 6 4.1 21.7 6 5.4 20.7 6 3.8 <0.0001 0.07 0.01 0.002Emotional (9–45) 25.8 6 7.5 31.8 6 6.3 30.0 6 7.8 29.4 6 6.7 0.001 0.04 0.03 0.02Social (7–35) 15.8 6 4.9 21.5 6 4.6 19.7 6 5.4 20.1 6 5.1 <0.0001 0.001 0.05 0.05
P < 0.005 is statistically significant. Comparisons are with corresponding baseline values.
2441STABILITY OF EFFECTS OF STN STIMULATION
Movement Disorders, Vol. 25, No. 14, 2010

DISCUSSION
Our study revealed strong and sustained beneficial
effects of STN stimulation on motor fluctuations, dys-
kinesias, ADL, and QOL in patients with advanced
PD. Patients could be maintained on a 40% lower dose
of drugs and stable stimulation settings up to 5 years
and in the majority, no battery replacement was needed
during this period. Tremor, rigidity, and bradykinesia
could be controlled to a large extent by stimulation
alone. These indicate that STN stimulation is a robust
technique that can counter the impact of striatal dopa-
mine deficiency and the pre- and post-synaptic altera-
tions that underlie motor complications, without induc-
ing tolerance. We observed that the initial improve-
ment in speech, postural stability, and gait declined
after 3 years, and there was a trend for gait and pos-
tural instability to be less responsive to L-dopa at 5
years, indicating additional nondopaminergic pathol-
ogy. These symptoms of PD need additional strategies
of long-term management. We did not find much wor-
sening of parkinsonian signs except bradykinesias after
a 2 hours discontinuation of stimulation. This could
result from persisting effects of stimulation and not
necessarily from any neuroprotective effect.8
Earlier reports of STN stimulation on cognition
show variable results.18–27 We did not find any signifi-
cant decline in any of the cognitive spheres in our
cohort. Five patients developed dementia by 5 years,
all of whom had mild baseline impairment in neuro-
psychological tests. We also found new-onset reduction
in verbal fluency, majority of which were mild, clini-
cally insignificant, detected at the first follow-up
assessment itself and with no further worsening. We
believe this may be the microlesioning effect of elec-
trode passage. In contrast, apathy appeared at variable
TABLE 4. UPDRS scores in stimulation off and ‘‘drug off’’ or ‘‘drug on’’
Subscales
Baseline 1 yr 3 yr 5 yrN 5 45 N 5 40 N 5 36 N 5 29 Base vs. 3 yr
P valueBase vs. 5 yr
P value1 vs. 3 yrP value
1 vs. 5 yrP valueMean 6 SD Mean 6 SD Mean 6 SD Mean 6 SD
Stimulation off-drug offUPDRS-III motor 48.1 6 13.6 46.6 6 16.8 53.5 6 19.4 58.4 6 21.5 0.05 0.2 0.07 0.02Tremor 4.7 6 4.1 4.2 6 4.1 5.1 6 4.5 6.8 6 5.4 0.6 0.8 0.4 0.3Rigidity 10.5 6 4.1 9.9 6 4.9 11.9 6 4.9 12.5 6 4.9 0.01 0.1 0.1 0.4Bradykinesia 16.4 6 5.7 15.9 6 6.3 20.6 6 7.4 21.1 6 9.4 0.004 0.007 0.001 0.006Postural instability 2.5 6 0.9 1.9 6 0.9 2.2 6 0.9 2.4 6 1.1 0.2 0.5 0.02 0.01Gait 2.5 6 0.9 2.2 6 0.9 2.5 6 0.9 2.3 6 0.9 0.8 0.5 0.07 0.1Speech 1.6 6 1.1 1.4 6 1.0 1.7 6 1.1 1.6 6 1.1 0.3 0.3 0.02 0.01
Stimulation off-drug onUPDRS III motor (total) 16.9 6 8.3 19.3 6 13.9 21.9 6 15.5 27.3 6 18.9 0.08 0.01 0.3 0.05Tremor 0.5 6 1.1 0.9 6 1.9 1.2 6 2.4 1.2 6 3.5 0.03 0.4 0.9 0.2Rigidity 3.5 6 3.1 4.1 6 3.9 4.7 6 4.7 5.8 6 4.4 0.1 0.06 0.5 0.5Bradykinesia 16.1 6 4.9 11.9 6 5.7 10.0 6 7.1 12.2 6 6.3 0.01 0.02 0.03 0.02Postural stability 0.9 6 0.9 1.0 6 0.9 1.1 6 0.8 1.2 6 0.9 0.02 0.01 0.2 0.03Gait 1.4 6 0.8 1.5 6 0.8 1.7 6 0.8 1.6 6 1.2 0.4 0.05 0.002 0.01Speech 1.0 6 1.1 0.9 6 1.1 1.4 6 1.3 1.3 6 1.1 0.1 0.4 0.02 0.01
Data are mean 6 SD, comparisons are with corresponding baseline values. P < 0.005 is statistically significant.
TABLE 5. Comparison of cognitive and mood scores
Scores
Baseline 1 yr 3 yr 5 yrN 5 45 N 5 43 N 5 36 N 5 27 Base vs. 3 yr
P valueBase vs. 5 yr
P value1 vs. 3 yrP value
1 vs. 5 yrP valueMean 6 SD Mean 6 SD Mean 6 SD Mean 6 SD
BDI 14.0 6 9.3 11.6 6 7.9 12.8 6 10.2 12.3 6 7.6 0.5 0.1 0.5 0.2HADS-D 6.1 6 3.7 5.1 6 4.3 6.7 6 4.1 6.8 6 3.7 0.2 0.5 0.8 0.3HADS-A 8.6 6 4.1 8.9 6 4.2 9.3 6 4.9 10.2 6 3.7 0.4 0.3 0.5 0.3MMSE 27.7 6 3.2 27.1 6 4.0 27.0 6 3.3 26.6 6 3.1 0.4 0.6 0.8 0.6ACE 75.6 6 15.1 76.8 6 18.1 80.3 6 14.5 78.9 6 16.3 0.02 0.5 0.4 0.6VF-letter 8.9 6 4.3 8.1 6 4.9 7.9 6 4.8 8.4 6 5.5 0.3 0.1 0.9 0.5VF-category 11.4 6 4.7 9.1 6 4.7 9.5 6 4.5 10.7 6 5.7 0.2 0.8 0.4 0.3
Data are mean 6 SD, P < 0.005 is statistically significant. Comparisons are with corresponding baseline values.
2442 A. KISHORE ET AL.
Movement Disorders, Vol. 25, No. 14, 2010

intervals from surgery and progression of pathology
could be also contribute to it. Long-term studies using
a matched, medically treated arm would be necessary
to assess whether the cognitive changes following
stimulation are the result of damage from electrode
passage, spread of current to cognitive circuits, natural
progression of PD, or from reduction in dopaminergic
medications.
We found variable effects of STN stimulation on
mood, as in previous reports.26–28 In the majority of
patients, depression scores remained unchanged. The
worsening of mood despite adequate treatment in some
patients may be multifactorial in origin and further
studies are needed to understand them.27
We observed that even though the total QOL scores,
parkinsonian symptoms and social functioning showed
persistent benefits until 5 years, similar effects on emo-
tional functions and systemic symptoms were lost by 3
years. Lack of sustained benefit on axial symptoms,
worsening of mood, lack of effect on issues such as
occupation, relationships, and leisure activities or grad-
ual changes in perceptions of health related well being
could all underlie the self-reported loss of initial bene-
fits in QOL.29–32
In India, only few of the deserving PD patients
receive STN stimulation due to the high cost that has
to be met out of pocket and the limited number of cen-
ters that perform the surgery. Our study is the first
report of STN stimulation for PD in Asian patients.
The QOL changes perceived in this patient population,
and their motor and cognitive outcomes compare well
with reports from the West.
Acknowledgments: This study was supported by in-houseresearch funds from Sree Chitra Tirunal Institute for MedicalSciences and Technology, Kerala. We thank all out patientsand their families for their participation.
Financial Disclosures: None.
Author Roles: Asha Kishore: concept, organization, andexecution of project; data extraction and synthesis and writ-ing the first draft of paper. Ravimohan Rao: organization,design, and execution of project; review and critique ofmanuscript. Dilip Panikar: organization, design, and execu-tion of project; review and critique of manuscript. SyamKrishnan: execution of project; review and critique of manu-script. Gangadhara Sarma: execution of project; review andcritique. Mathuranath Pavagada Sankaran: organization andexecution of project; review and critique of manuscript. San-kara Sarma: design, statistical analysis, and review and cri-tique of manuscript.
REFERENCES
1. Deuschl G, Schade-Brittinger CS, Krack P, et al. A randomizedtrial of deep-brain stimulation for Parkinson’s disease. N Engl JMed 2006;355:896–908.
2. Weaver FM, Follett K, Stern M, et al. Bilateral deep brain stimu-lation vs best medical therapy for patients with advanced Parkin-son disease: a randomized controlled trial. JAMA 2009;301:63–73.
3. Kleiner-Fisman G, Herzog J, Fisman DN, et al. Subthalamic nu-cleus deep brain stimulation: summary and meta-analysis of out-comes. Mov Disord 2006;21 (suppl 14):S290–S304.
4. Krack P, Batir A, Van Blercom N, et al. Five-year follow up ofbilateral stimulation of the subthalamic nucleus in advanced Par-kinson’s disease. N Engl J Med 2003;349:1925–1934.
5. Rodriguez-Oroz MC, Zamarbide I, Guridi J, Palmero MR, ObesoJA. Efficacy of deep brain stimulation of the subthalamic nucleusin Parkinson’s disease 4 years after surgery: double blind andopen label evaluation. J Neurol Neurosurg Psychiatry 2004;75:1382–1385.
6. Rodriguez-Oroz MC, Obeso JA, Lang AE, et al. Bilateral deepbrain stimulation in Parkinson’s disease: a multicentre study with4 years follow-up. Brain 2005;128:2240–2249.
7. Ostergaard K, Sundae NA. Evolution of Parkinson’s disease dur-ing 4 years of bilateral deep brain stimulation of the subthalamicnucleus. Mov Disord 2005;21:624–631.
8. Piboolnurak P, Lang AE, Lozano AM, et al. Levodopa responsein long-term bilateral subthalamic stimulation for Parkinson’sdisease. Mov Disord 2007;22:990–997.
9. Schupbach WMM, Chastan N, Welter ML, et al. Stimulation ofthe subthalamic nucleus in Parkinson’s disease: a 5 year followup. J Neurol Neurosurg Psychiatry 2005;76:1640–1644.
10. Simonin C, Tir M, Devos D, et al. Reduced levodopa-induced com-plications after 5 years of subthalamic stimulation in Parkinson’sdisease: a second honey moon. J Neurol 2009;256:1736–1741.
11. Fahn S, Elton RL, andmembers of the UPDRS development com-mittee. Unified Parkinson’s rating scale. In: Fahn S, Marsden CD,Calne DB, Goldstein M, editors. Recent developments in Parkin-son’s disease. Florham Park (NJ): MacMillan; 1987. p153–164.
12. Langston JW, Widner H, Goetz C, et al. Core assessment programfor intracerebral transplantation (CAPIT). Mov Disord 1992;7:2–13.
13. Beck AT, Ward CH, Mendelson M, Mock J, Rraugh J. An inventoryfor measuring depression. Arch Gen Psychiatry 1961;4:561–571.
14. Mathuranath PS, Nestor PJ, Berrios GE, Rakowicz W, Hodges JR.A brief cognitive test battery to differentiate Alzeimer’s diseaseand frontotemporal dementia. Neurology 2000;55:1613–1620.
TABLE 6. Complications of subthalamic stimulation
Procedure related complicationsIntra operative confusion and delirium occurred in 4 patientsIntraoperative seizures in 2 (both small pneumocephalus)Asymptomatic streaks of hemorrhage along electrode tracks in the
post-operative MRI scan—2Fluid collection at battery implantation site necessitating
reimplantation—1Device relatedHardware failure of battery—2Lead repositioning—2Fall and lead breakage—1
Stimulation relatedWeight gain—29Eye lid apraxia—2Transient hypomania—1Impulse control disorder—1New-onset severe depression—1New-onset apathy—8New-onset reduced verbal fluency—9Suicide—1Dementia—5
2443STABILITY OF EFFECTS OF STN STIMULATION
Movement Disorders, Vol. 25, No. 14, 2010

15. Mathuranath PS, Cherian JP, Mathew R, George A, AlexanderA, Sarma S. Mini mental state examination and the Adden-brooke’s cognitive examination: effect of education and normsfor a multicultural population. Neurol India 2007;55:106–110.
16. de Boer AGEM, Wijker W, Speelman JD, Dehaes JCJM. Qualityof life in patients with Parkinson’s disease: development of aquestionnaire. J Neurol Neurosurg Psychiatry 1996;61:70–74.
17. Marinus J, Ramaker C, van Hilten JJ, Stiggelbout AM. Healthrelated quality of life in Parkinson’s disease: a systematic reviewof disease specific instrument. J Neurol Neurosurg Psychiatry2002;72:241–248.
18. Contarino MF, Daniele A, Sibilia AH, et al. Cognitive outcome5 years after bilateral chronic stimulation of subthalamic nucleusin patients with Parkinson’s disease. J Neurol Neurosurg Psychia-try 2007;78:248–252.
19. Funkiewiez A, Ardouin C, Caputo E, et al. Long-term effects ofbilateral subthalamic nucleus stimulation on cognitive function,mood and behavior in Parkinson’s disease. J Neurol NeurosugPsychiatry 2004;75:834–839.
20. Pilion B, Ardouin C, Damier P, et al. Neuropsychologicalchanges between ‘‘off’’ and ‘‘on’’ STN or GPI stimulation in Par-kinson’s disease. Neurology 2000;55:411–418.
21. Witt K, Daniels C, Reiff J, et al. Neuropsychological and psychi-atric changes after deep brain stimulation for Parkinson’s disease:a randomized, multicentre study. Lancet Neurol 2008;7:605–614.
22. Ardouin C, Pillon B, Peiffer E, et al. Bilateral subthalamic orpallidal stimulation for Parkinson’s disease affects neither mem-ory nor executive functions: a consecutive series of 62 patients.Ann Neurol 1999;46:217–223.
23. Saint-Cyr J, Trepanier LL, Kumar R, Lozano AM, Lang AE.Neuropsychological consequences of chronic bilateral stimulationof the subthalamic nucleus in Parkinson’s disease. Brain 2000;123:2091–2108.
24. Kalbe E, Voges J, Weber T, et al. Frontal FDG-PET activity cor-related with cognitive outcome after STN-DBS in Parkinson dis-ease. Neurology 2009;72:42–49.
25. Smeding HM, Speelman JD, Hulzenga HM, Schuurman PR,Schmand B. Predictors of cognitive and psychosocial outcomeafter STN DBS in Parkinson’s disease. J Neurol Neurosurg Psy-chiatry (in press).
26. Zangaglia R, Pacchetti C, Pasotti C, et al. Deep brain stimulationand cognitive functions in Parkinson’s disease: a three-year con-trolled study. Mov Disord 2009;24:1621–1628.
27. Voon V, Kubu C, Krack P, Houeto JL, Troster AI. Deep brainstimulation: neuropsychological and neuropsychiatric issues. MovDisord 2006;21:S305–S326.
28. Berney A, Vingerhoets FJ, Perrin A, et al. Effect on mood ofsubthalamic DBS for Parkinson’s disease. A consecutive seriesof 24 patients. Neurology 2002;59:1427–1429.
29. Mushmovic D, Post B, Speelman JD, Schmand B, de Haan RJ.Determinants of disability and quality of life in mild to moderateParkinson disease. Neurology 2008;70:2241–2247.
30. Ferrara JM, Diamond A, Hunter C, Davidson A, Almaguer M,Jankovic J. Impact of STN-DBS on life and health satisfaction inpatients with Parkinson’s disease. J Neurol Neurosur Psychiatry(in press).
31. Volkmann J, Albanese A, Kulisevsky J, et al. Long-termeffects of pallidal or subthalamic deep brain stimulation onquality of life in Parkinson’s disease. Mov Disord 2009;24:1154–1161.
32. Drapier S, Raoul S, Drapier D, et al. Only physical aspects ofquality of life are significantly improved by bilateral subthala-mic stimulation in Parkinson’s disease. J Neurol 2005;252:583–588.
Diagnostic Accuracy of theMagnetic Resonance ParkinsonismIndex and the Midbrain-to-Pontine
Area Ratio to DifferentiateProgressive Supranuclear Palsy
from Parkinson’s Disease and theParkinson Variant of Multiple
System Atrophy
Anna Hussl, MD,1 Philipp Mahlknecht, MD,1
Christoph Scherfler, MD,1 Regina Esterhammer, MD,2
Michael Schocke, MD,2 Werner Poewe, MD,1
and Klaus Seppi MD1*
1Department of Neurology, Innsbruck Medical University,Innsbruck, Austria; 2Department of Radiology I, Innsbruck
Medical University, Innsbruck, Austria
Abstract: Using magnetic resonance (MR) planimetry,both the midbrain-to-pontine area ratio (m/p-ratio) andthe MR parkinsonism index (MRPI) have been shownto assist in the differential diagnosis of progressivesupranuclear palsy (PSP) from Parkinson’s disease (PD)and the Parkinson variant of multiple system atrophy(MSA-P). The aim of this study was to determine thediagnostic accuracy of the MRPI compared with the m/p-ratio in a large cohort of 123 patients with neurode-generative parkinsonism including patients with PSP,PD, and MSA-P. Patients with PSP had significanthigher MRPI values and significant smaller m/p-ratioscompared with the other groups with overlapping indi-vidual values. Overall predictive accuracy was similarfor the m/p-ratio (87.0%) and the MRPI (80.5%) witha predictive accuracy for PSP from MSA-P beingsignificantly better for the MRPI (87.5%) comparedwith the m/p-ratio (75%) as well as a predictive accu-racy for PSP from PD being significantly better for them/p-ratio (87.6%) compared with the MRPI (77.3%).Both the m/p-ratio and the MRPI may assist theclinical differential diagnosis in neurodegenerativeparkinsonism. � 2010 Movement Disorder Society
*Correspondence to: Dr. Klaus Seppi, Department of Neurology,Innsbruck Medical University, Anichstrasse 35, A-6020 Innsbruck,Austria. E-mail: [email protected]
Potential conflict of interest: Nothing to report.Received 23 April 2010; Revised 18 June 2010; Accepted 23 June
2010Published online 28 September 2010 in Wiley Online Library
(wileyonlinelibrary.com). DOI: 10.1002/mds.23351
2444 A. HUSSL ET AL.
Movement Disorders, Vol. 25, No. 14, 2010

Key words: MR planimetry; progressive supranuclearpalsy; multiple system atrophy; Parkinson’s disease; parkin-sonism; MR parkinsonism index; midbrain-to-pontine arearatio
Recent findings suggest that magnetic resonance
(MR) planimetry represents a simple method for the
differential diagnosis of neurodegenerative parkinson-
ism. As specific brain structures are known to be
atrophic in different neurodegenerative parkinsonian
disorders, several groups have applied quantitative
measurements including diameters and areas of various
brain structures on structural MRI for their differential
diagnosis.1–6 Atrophy of midbrain and superior cerebel-
lar peduncle (SCP) were associated with progressive
supranuclear palsy (PSP), and atrophy of pons and
middle cerebellar peduncle (MCP) with the Parkinson
variant of multiple system atrophy (MSA-P), respec-
tively.1–6 As the single measurement of these brain
structures has failed to separate PSP from MSA-P and
Parkinson’s disease (PD) on an individual basis, the
midbrain-to-pontine area ratio (m/p-ratio) and the MR
parkinsonism index (MRPI)—calculated by multiplying
the pontine-to-midbrain area (p/m) ratio by the MCP-
to-SCP width ratio (MCP/SCP)—were introduced. Cal-
culation of the m/p-ratio has been demonstrated to dis-
criminate completely between PSP patients and
patients with PD, MSA-P, or healthy controls,3
whereas there were overlapping individual values in
another study.1 Indeed, the MRPI was significantly
larger in patients with PSP than in patients with PD,
with MSA-P, and control participants (cutoff value
‡13.58), without any overlap between the PSP and the
other groups.1 The objective of this study was to test
the diagnostic accuracy of the MRPI compared with
the m/p-ratio in a large sample of patients with neuro-
degenerative parkinsonism, which after the MRI exam-
ination were followed clinically at least for 2 years to
increase the reliability of the clinical diagnosis of the
patients.
PATIENTS AND METHODS
Magnetic Resonance Imaging Protocol and Image
Analysis
We have assessed the MRPI in 123 patients with
neurodegenerative parkinsonism (75 patients with PD,
26 with probable MSA-P, and 22 with probable PSP)
using a 1.5 Tesla MR Scanner (Magnetom Symphony;
Siemens, Erlangen, Germany). At the MRI examina-
tion, 8 of the MSA-P patients and 7 of the PSP
patients fulfilled the criteria for possible MSA-P and
possible PSP, respectively. All of them converted to
probable MSA-P and PSP within the 2 years of clinical
follow-up. The MRI protocol included conventional
MRI sequences with a sagittal T1-weighted FLASH
3D sequence (TR 9.7 milliseconds, TE 4 milliseconds,
slice thickness 1.2 millimeter, matrix 256 3 256, field
of view 230 millimeter) and a dual-echo fast spinecho
sequence (TR 3500 milliseconds, TE 22 and 90 milli-
seconds, slice thickness 4 millimeconds, matrix of 256
3 256, FoV 220 milliseconds), which was performed
twice providing 2 3 15 slices that were interleaved
without any gap. Conventional MRI sequences were
visually assessed to exclude symptomatic parkinson-
ism.2 For calculation of the MRPI, measurements of
diameters (MCP and SCP) and areas (pontine and mid-
brain) were performed on a multiplanar reconstruction
program (JVision, Tiani/AGFA, Austria) using the
native 3D T1-weighted images as previously sug-
gested.1 Furthermore, we measured the time it took for
the assessment of the m/p-ratio and the MRPI in 10 of
all patients. The study was approved by the local
Ethics Committee of the Medical University Innsbruck.
Statistical Analysis
Parametric, nonparametric, or the chi-square tests
were used for group comparisons depending on the
scale type of the variables. Between-group comparisons
between PSP and non-PSP (all PD and MSA-P
patients) were performed with the unpaired t-test for
the m/p-ratio, for the MRPI, age at MRI and disease
duration at MRI; with the Mann-Whitney U test for
the Hoehn and Yahr scale and with the chi-square test
for gender distribution, the presence of an abnormal
m/p-ratio and the presence of an abnormal MRPI.
Between-group comparisons between PSP, PD, and
MSA-P were performed with an one-way ANOVA
with post hoc Bonferroni correction for the m/p-ratio,
for the MRPI, age at MRI and disease duration at
MRI; with the Kruskal–Wallis one-way analysis of var-
iance followed by a Mann-Whitney U test corrected
for multiple comparisons (P < 0.05/3 5 0.017) for the
Hoehn and Yahr scale and with the chi-square test cor-
rected for multiple comparisons (P < 0.05/3 5 0.017),
for gender distribution, and the presence of an abnor-
mal m/p-ratio or MRPI. In a next step, we performed a
receiver operating characteristic curve (ROC) analysis
for the MRPI and the m/p-ratio to determine the cutoff
value that separates best between PSP patients and
non-PSP patients. Maximal discrimination is reached at
Movement Disorders, Vol. 25, No. 14, 2010
2445DIAGNOSTIC ACCURACY OF THE MRPI AND THE M/P-RATIO

TABLE
1.Dem
ograph
ic,clinical,an
dplan
imetricinfratentorial
MRIda
taof
patients
withPSP
,PD,an
dMSA
-Pin
this
stud
y
PSP
PD
MSA-P
PSPvs.
non-PSP
PSP
vs.PD*
PSPvs.
MSA-P*
MSA-P
vs.PD*
n22
75
26
Gender
distributiona(m
/f)
11/11
46/29
13/13
ns
ns
ns
ns
Ageat
MRIb
mean6
SD
68.736
9.08
64.836
9.74
64.676
6.60
ns
ns
ns
ns
Disease
durationbat
MRImean6
SD
2.886
1.94
7.496
6.89
4.096
1.79
P<
0.001
P<
0.01
ns
P<
0.05
HoehnandYahrscalec
(range)
III–IV
II–III
III–IV
P<
0.005
P<
0.001
ns
P<
0.001
m/p-ratio
mean6
SD
(95%
CI)
0.186
0.03(0.17–0.19)
0.236
0.04(0.22–0.24)
0.276
0.09(0.24–0.31)
P<
0.001
P<
0.001
P<
0.001
P<
0.001
MRPImean6
SD
(95%
CI)
18.636
5.32(16.28–20.99)
12.736
2.76(12.10–13.37)
9.396
3.46(7.10–10.79)
P<
0.001
P<
0.001
P<
0.001
P<
0.001
Abnorm
alm/p-ratio
a(%
)[<
0.18]
14(63.6%)
4(5.3%)
4(15.4%)
P<
0.001
P<
0.001
P<
0.001
na
Sensitivity
63.6%
63.6%
63.6%
na
Specificity
92.1%
94.7%
84.6%
na
PPV
63.6%
77.8%
77.8%
na
NPV
92.1%
89.9%
84.6%
na
Predictiveaccuracy
87.0%
87.6%
75.0%
na
Likelihoodratio
8.1
12.0
4.1
na
Abnorm
alMRPIa(%
)[‡14.38]
18(81.8%)
18(24.0%)
2(7.7%)
P<
0.001
P<
0.001
P<
0.001
na
Sensitivity
81.8%
81.8%
81.8%
na
Specificity
80.2%
76.0%
92.3%
na
PPV
47.4%
50.0%
90.0%
na
NPV
95.3%
93.4%
85.7%
na
Predictiveaccuracy
80.5%
77.3%
87.5%
na
Likelihoodratio
4.1
3.4
10.6
na
*Posthoc,
Bonferronicorrected(P
<0.05/3
50.017).
aChi-squaretest.
bParam
etrictests[unpairedt-test;univariate
one-way
analysisofvariance
(ANOVA)].
cNonparam
etrictests(M
ann–Whitney
Utest;Kruskal–Wallisone-way
analysisofvariance).
PSP,progressivesupranuclearpalsy;PD,Parkinson’s
disease;MSA-P,Parkinsonvariantofmultiple
system
atrophy;ns,notsignificant;na,
notapplicable;SD,standarddeviation,PPV,
positivepredictivevalue;
NPV,negativepredictivevalue;
m/p-ratio,midbrain-to-pontineratio;MRPI,MRparkinsonism
index.
2446 A. HUSSL ET AL.
Movement Disorders, Vol. 25, No. 14, 2010

the cutoff level that has the highest sum of sensitivity
and specificity. This optimal cutoff level (with an area
under the curve of 0.86) for the MRPI to discriminate
between PSP and non-PSP was 14.38 implying that a
MRPI of ‡14.38 (i.e., abnormal MRPI) is indicative of
a diagnosis of PSP and a MRPI <14.38 is indicative
of a diagnosis of non-PSP. The optimal cutoff level
(with an area under the curve of 0.86) for the m/p-ratio
to discriminate between PSP and non-PSP was 0.18
implying that a m/p-ratio �0.18 is indicative of a diag-
nosis of PSP and a m/p-ratio of >0.18 (i.e., normal
m/p-ratio) is indicative of a diagnosis of non-PSP.
Diagnostic accuracy was calculated for the best dis-
criminating MRPI value and m/p-ratio obtained by the
ROC analysis. Sensitivity is the proportion of true pos-
itives, i.e., PSP patients with the abnormal finding/all
with PSP. Specificity is the proportion of true nega-
tives, i.e., patients not having PSP without having the
abnormal finding/all patients not having PSP. The posi-
tive predictive value is the likelihood of a person with
the abnormal finding to have PSP (PSP patients with
the positive test result/all with positive tests). The neg-
ative predictive values are the likelihood of a person
without the abnormal finding not to have PSP (i.e.,
patients not having PSP with the negative test result/all
with negative tests). The predictive accuracy refers to
the proportion of the true positives and true negatives
(i.e., patients with the true test result/all patients). The
likelihood ratio is how much the odds of PSP increase
when the abnormal finding is given. The McNemar’s
test for paired data was used to compare overall pre-
dictive accuracy of MRPI and m/p-ratio for the differ-
entiation of PSP from non-PSP patients. Statistical
analysis was performed with SPSS v. 17.0 for Win-
dows (SPSS, Chicago, IL) and Graph Pad Prism 5.0
for Windows.
RESULTS
Patient characteristics and main findings are sum-
marized in the Table 1 and the Figure 1. PSP patients
had significant higher MRPI values and significant
smaller m/p-ratios compared with the other groups as
demonstrated in the Figure 1 and the Table 1. Diagnos-
tic accuracy is given in the Table 1. Overall predictive
accuracy for PSP from non-PSP was similar for the
MRPI and the m/p-ratio. Although predictive accuracy
for PSP from MSA-P was significant better (P 5 0.03)
for the MRPI than for the m/p-ratio, predictive accu-
racy for PSP from PD was significant better (P 50.04) for the m/p-ratio compared with the MRPI.
Accordingly, the likelihood ratio for the discrimination
of PSP from MSA-P was 12 for the m/p-ratio com-
pared with 3.4 for the MRPI, whereas the likelihood
ratio for the discrimination of PSP from PD was 10.6
for the MRPI compared with 4.1 for the m/p-ratio. It
took significant longer (P < 0.001) time to assess the
MRPI (mean: 2 minutes and 41 seconds; standard devi-
ation SD: 9.1 seconds) compared with the m/p-ratio
(mean: 1 minutes and 7 seconds; SD: 6.1 seconds).
DISCUSSION
Our study confirms that both the m/p-ratio and the
MRPI may represent helpful tools for the differential
FIG. 1. Scatter blot demonstrating the m/p-ratio and MRPI values in patients with PSP, MSA-P, and PD. The PSP fields (i.e., the gray fields)include the abnormal MRPI values (i.e., ‡14.38) and the abnormal m/p-ratios (i.e., �0.18), which both are indicative of a diagnosis of PSP.
2447DIAGNOSTIC ACCURACY OF THE MRPI AND THE M/P-RATIO
Movement Disorders, Vol. 25, No. 14, 2010

diagnosis of PSP. Indeed, in terms of infratentorial
changes, differentiation of PSP and MSA from each
other and from PD is based on studies showing that PSP
patients have relatively greater midbrain atrophy and at-
rophy of the SCP, whereas conversely MSA-patients
have relatively greater pontine and atrophy of the
MCP.1–6 However, we were not able to discriminate
completely between patients with PSP and those with
MSA-P3 or even between patients with PSP and both
those with MSA-P and PD as suggested previously.1
Overall predictive accuracy for PSP compared with
the non-PSP patients was not significant different
between the MRPI and the m/p-ratio. On the other
hand, predictive accuracy for PSP from MSA-P was
better for the MRPI than for the m/p-ratio, whereas
predictive accuracy for PSP from PD was better for
the m/p-ratio compared with the MRPI. The better dis-
crimination of PSP patients from those with MSA-P
with the MRPI compared with the m/p-ratio most prob-
ably derives from the combined assessment of four
brain structures involved in these two neurodegenera-
tive parkinsonian syndromes, where atrophy of the
midbrain and SCPs suggests PSP, whereas atrophy of
the pons and MCPs suggests MSA-P.1,3,5–8 These brain
structures are usually not involved in patients with
PD.1,3 This might explain why discrimination of PSP
patients from those with PD decreases by combining
the assessment of these four infratentorial brain struc-
tures through the MRPI compared with the m/p-ratio.
Using the MRPI compared with the m/p-ratio, the seg-
mentation procedure includes more brain structures.
Therefore, the determination of the MRPI is much
more time consuming than the determination of the
m/p-ratio.
Patients in this study were diagnosed clinically
and misdiagnoses cannot be excluded in the absence
of postmortem verification. However, all the diagno-ses of our patients were based on stringent diagnos-
tic criteria9–13 and patients were followed for atleast 2 years enhancing the reliability of the clinical
diagnosis of our patients. In summary, both the
m/p-ratio and the MRPI, as simple and reasonableadditional aids within the routine MR analysis,
may assist the clinical differential diagnosis in par-kinsonism.
Financial Disclosures: Klaus Seppi has received honora-
ria for speaking and consulting from: Novartis, Boehringer
Ingelheim, Lundbeck, Schwarz Pharma, UCB Pharma, and
GlaxoSmithKline. Werner Poewe served as consultant for
Boehringer Ingelheim, Esai Ltd., Novartis, Sovay, and
Teva. He was in the advisory panel for Boehringer Ingel-
heim, Esai Ltd., Genzyme, Novartis, Schering Plough,
Sovay, Teva, and Valeant. He received research support
from Boehringer Ingelheim and Astra Zeneca. He serves as
review editor for the Journal of Neurology and as a mem-
ber of the editorial advisory board for the European Jour-nal of Neurology.
Author Roles: Anna Hussl was involved in conception,
design, organization, execution of the study, and writing of
the draft. Philipp Mahlknecht was involved in conception,
design, organization, execution of the study, writing of the
draft, and review and critique of the manuscript. Christoph
Scherfler was involved in organization and execution of the
study and review and critique of the manuscript. Regina
Esterhammer was involved in conception, design, and organi-
zation of the study, review and critique of the manuscript,
and the statistical analysis. Michael Schocke was involved in
conception, design, organization, and execution of the study,
review and critique of the manuscript, and the statistical anal-
ysis. Werner Poewe was involved in conception, design, and
organization of the study, review and critique of the manu-
script, and the statistical analysis. Klaus Seppi was involved
in conception, design, organization, and execution of the
study, writing of the draft, design and execution of the statis-
tical analysis, review and critique of the manuscript, and
supervision.
REFERENCES
1. Quattrone A, Nicoletti G, Messina D, et al. MR imaging indexfor differentiation of progressive supranuclear palsy from Parkin-son disease and the Parkinson variant of multiple system atrophy.Radiology 2008;246:214–221.
2. Seppi K, Poewe W. Brain magnetic resonance imaging techni-ques in the diagnosis of parkinsonian syndromes. NeuroimagingClin N Am 2010;20:29–55.
3. Oba H, Yagishita A, Terada H, et al. New and reliable MRI di-agnosis for progressive supranuclear palsy. Neurology 2005;64:2050–2055.
4. Warmuth-Metz M, Naumann M, Csoti I, Solymosi L. Measurement ofthe midbrain diameter on routine magnetic resonance imaging: a sim-ple and accurate method of differentiating between Parkinson diseaseand progressive supranuclear palsy. Arch Neurol 2001;58:1076–1079.
5. Nicoletti G, Fera F, Condino F, et al. MR imaging of middle cer-ebellar peduncle width: differentiation of multiple system atrophyfrom Parkinson disease. Radiology 2006;239:825–830.
6. Paviour DC, Price SL, Stevens JM, Lees AJ, Fox NC. Quantita-tive MRI measurement of superior cerebellar peduncle in pro-gressive supranuclear palsy. Neurology 2005;64:675–679.
7. Aiba I, Hashizume Y, Yoshida M, et al. Relationship betweenbrainstem MRI and pathologic findings in progressive supranuclearpalsy: study in autopsy cases. J Neurol Sci 1997;152:210–217.
8. Groschel K, Kastrup A, Litvan I. Penguins and hummingbirds: midbrainatrophy in progressive supranuclear palsy. Neurology 2006;66:949–950.
9. Litvan I, Bhatia KP, Burn DJ, et al. Movement disorders societyscientific issues committee report: SIC task force appraisal ofclinical diagnostic criteria for parkinsonian disorders. Mov Dis-ord 2003;18:467–486.
10. Hughes AJ, Daniel SE, Kilford L, Lees AJ. Accuracy of clinical di-agnosis of idiopathic Parkinson’s disease: a clinico-pathologicalstudy of 100 cases. J Neurol Neurosurg Psychiatry 1992;55:181–184.
11. Litvan I, Agid Y, Jankovic J, et al. Accuracy of clinical criteriafor the diagnosis of progressive supranuclear palsy (Steele-Richardson-Olszewski syndrome). Neurology 1996;46:922–930.
2448 A. HUSSL ET AL.
Movement Disorders, Vol. 25, No. 14, 2010

12. Gibb WR, Lees AJ. The relevance of the Lewy body to thepathogenesis of idiopathic Parkinson’s disease. J Neurol Neuro-surg Psychiatry 1988;51:745–752.
13. Gilman S, Low PA, Quinn N, et al. Consensus statement on the di-agnosis of multiple system atrophy. J Neurol Sci 1999;163:94–98.
Parkinson’s Disease andPathological Gambling: Resultsfrom a Functional MRI Study
Daniela Frosini, MD,1 Ilaria Pesaresi, MD,2
Mirco Cosottini, MD,1 Gina Belmonte, PhD,3
Carlo Rossi, MD,1 Liliana Dell’Osso, MD,4
Luigi Murri, MD,1 Ubaldo Bonuccelli, MD,1
and Roberto Ceravolo, MD1*
1Department of Neuroscience, University of Pisa, Pisa, Italy;2Department of Radiology, University of Pisa, Pisa, Italy;3Department of Medical Physics, University of Pisa, Pisa,
Italy; 4Department of Psychiatry, Neurobiology,Pharmacology and Biotechnology, University of Pisa,
Pisa, Italy
Abstract: Seven patients with a diagnosis of Parkinson’sdisease (PD) and pathological gambling (PG) and 7 PDpatients without PG were investigated by functional MRIand a block-design experiment with gambling-related vis-ual cues alternating with neutral stimuli and rest periods.Compared with PD/non-PG, in PD/PG patients, severalareas of increased cue-related blood oxygen level depend-ent (BOLD)-response were observed including bilateralanterior cingulate cortex, medial and superior frontalgyri, and precuneus, right inferior parietal lobule, andventral striatum. The over activation of cingulate cortexand ventral striatum in PD/PG patients after the cravingtask is similar to that reported in addicted patients,whereas the activation of the parietal structures is prob-ably related to the attentional network. � 2010 MovementDisorder Society
Key words: Parkinson’s disease; fMRI; pathological gam-bling
Pathological gambling1 (PG) represents an emerging
psychiatric complication in idiopathic Parkinson’s dis-
ease (PD). Different risk factors for PG in PD patients
have been described, such as younger age at the onset
of PD, longer duration, male gender, family or perso-
nal history of psychiatric disorders, and dopamine ago-
nists (DAs).2–4
Functional imaging can be helpful in understanding
these phenomena and predisposing factors. So far, a
few functional imaging studies by means of single-
photon emission computed tomography (SPECT)5 and/
or positron emission tomography (PET)6 have been
performed in PG occurring in PD, overall resulting in
a dysfunction of reward system. However, some data
suggest the existence of similarities between PG and
drug addictions.7 In this study, we studied PD subjects
with PG by functional MRI (fMRI) during a gambling-
related video presentation to investigate the activation
pattern associated with a craving-inducing task.
PATIENTS AND METHODS
Seven patients with a diagnosis of PD according to
Gelb criteria8 and active PG (Diagnostic and Statistical
Manual of Mental, Fourth Edition)1 (PD/PG), which
had appeared in all patients after exposure to DAs
(mean duration 13.2 6 4.3 months), were enrolled; 7
patients with a diagnosis of PD without PG (PD/non-
PG) were also enrolled. Medical history was collected,
and neurological examination and neuropsychological
assessment were performed. Patients with dementia,
severe dyskinesia, and sight impairment were
excluded. Moreover, none of the patients had no other
active axis I disorders1 and active hallucinations or
delusions. The Minnesota Impulsivity Disorder Inter-
view scale was performed in all patients enrolled in
the study to establish the occurrence of any impulsive
disorders in PD/PG patients and in the control group.
None of the patients fulfilled criteria for alcohol or
substance abuse or dependence. An informed consent
was obtained from each patient according to the decla-
ration of Helsinki. The study was approved by the
local ethic committee. Each scan was performed at the
same time of the day and in the same experimental
conditions.
The PD/non-PG and PD/PG patients did not differ in
age (58.3 6 8.6 vs. 57.5 6 11.1 years), disease dura-
tion (6.8 6 4.2 vs. 5.7 6 2.0 years), disease severity
as assessed by UPDRS III (18.0 6 6.3 vs. 15.5 6 1.3),
cognitive performance as evaluated by MMSE (mean
value 29.6, range 29–30 vs. mean value 29, range 27–
30), or drug treatment [PD/non-PG: four pramipexole,
Daniela Frosini and Ilaria Pesaresi contributed equally to thiswork.
*Correspondence to: Dr. Roberto Ceravolo, Department of Neuro-science, University of Pisa, Via Roma, 67, 56126 Pisa, Italy.E-mail: [email protected]
Potential conflict of interest: Nothing to report.Received 12 May 2010; Revised 28 June 2010; Accepted 7 July
2010Published online in Wiley Online Library (wileyonlinelibrary.
com). DOI: 10.1002/mds.23369
2449GAMBLING IN PARKINSON’S DISEASE: FMRI EVIDENCES
Movement Disorders, Vol. 25, No. 14, 2010

three ropinirole; DAs dose expressed as levodopa (L-
dopa) equivalent dose (LEDD)9: 325 6 50 mg/day; cu-
mulative dopaminergic therapy calculated as the sum
of the L-dopa and DAs converted into LEDD9: 462 6228.7; PD/PG: four pramipexole, three ropinirole; DAs
dose expressed as LEDD: 408.3 6 156.3; cumulative
dopaminergic therapy: 520 6 219.1]. MRI scan was
performed after overnight drug washout (off-therapy
condition form at least 12 hours).
Two PD/PG patients presented another ICD than PG
(one compulsive eating and one hypersexuality). The
favorite games were card games for two, slot machine
for one, and scratch cards for the remaining four. All
the subjects were able to play scratch cards, and a for-
mal diagnosis of PG was allowed also by taking into
account only this game for the whole sampling of PD/
PG patients.
Stimulation Protocol
The stimulation protocol consisted of a block-design
experiment with gambling-related visual cues alternat-
ing with neutral stimuli (NS) and rest periods. The vis-
ual stimuli were projected on a screen placed in front
of the scanner bore and delivered to the patient
through a mirror embedded within the head coil. Gam-
bling-related visual cues were represented by videos
showing a scratch card with 24 covered numbers
aligned in four rows. The first row was scratched
slowly disclosing the six winning numbers. The
patients were simply asked to look at the card, without
an active interaction, whereas the remaining numbers
were slowly unveiled. If one of these numbers matched
one of the six winning numbers, the patient got a vir-
tual variable monetary reward (range: 1 to one million
euros). The stimulation protocol included four scratch
card videos (30 seconds each) alternating with four
neutral videos (30 seconds each) and four rest periods
(15 seconds each). The NS were videos of ordinary
objects containing numbers (calendar, telephone, calcu-
lator, and abstract picture) split into 24 pieces that pro-
gressively appeared on the screen. During the rest pe-
riod, a fixed red cross was projected on the center of
the screen.At the end of the MRI examination, to eval-
uate the attention of the subject during the task, we
asked the patients to relate the number of winning
plays. The sensations evoked by the visual cues were
clinically investigated in all subjects by pre- and post-
task interviews. In particular, the gambling urge was
evaluated through a visual analog scale (0–10) with 10
indicating an extreme urge to play. The gambling urge
was then evaluated by comparing the pre- and post-
task scores.
FMRI Data Acquisition and Processing
FMRI data were acquired with a 1.5-T scanner
(Magnetom Symphony, Siemens). The fMRI data were
obtained by a T�2-weighted gradient recalled echo-pla-
nar imaging (EPI) sequence (TR 2500 millisecond, TE
60 millisecond, delay in TR 20 millisecond, FA 908,image matrix 64 3 64, and in-plane field of view 220
3 220 mm2) with 20 interleaved slices (slice thickness
5 mm) parallel to the anterior–posterior commissural
plane, repeated over 120 volumes for a total scanning
time of 5 min.
For each patient, additional anatomical T1-weightedimages were acquired [three-dimensional (3D) MP-
RAGE sequence]. We acquired MR examinations with
a Siemens MR equipment that automatically eliminates
the first two volumes of acquisition, then we discarded
two additional volumes to avoid T1-effect interference.FMRI data analysis was performed by BrainVoyager
QX (1.9 version). Each functional dataset underwent a
preliminary processing including slice scan time cor-
rection, 3D motion correction, high pass temporal fil-
tering and spatial smoothing. All patients showed
movement-related displacement of <3 mm/38. Proc-
essed functional dataset were coregistered to 3D T1-weighted anatomical images and normalized to the
standard Talairach template10 through linear spatial
transformations. The statistical analysis was performed
by a multistudy general linear model approach. The
design matrix included two predictors for each subject,
which were obtained by convolving the temporal func-
tion of visual stimuli presentation [cue stimuli (CS)
and NS] with the standard hemodynamic response
function.11 We calculated the contrast maps (CS–NS)
both within and between groups. The resulting color-
coded statistical maps were displayed at a statistical
threshold corrected for multiple comparisons (FDR <0.001 for within-group maps and FDR < 0.01 for
between-groups maps), with a cluster extent threshold
of four voxels. We only excluded extracerebral voxels
by masking EPI images (signal intensity range 40–180)
before the statistical analysis.
RESULTS
By the analog visual scale PD/PG patients had a sig-
nificantly higher level of gaming urge after viewing the
scratch card videos (mean 6 standard deviation
increase: PD/PG 7.10 6 1.8 vs. PD/non-PG 1.3 6 0.9).
Movement Disorders, Vol. 25, No. 14, 2010
2450 D. FROSINI ET AL.

Within-group contrast maps (CS–NS), separately per-
formed in PD/PG and in PD/non-PG patients, exhibited
brain activity in some overlapping areas, including
bilateral medial frontal gyrus, superior frontal gyrus,
precentral gyrus, and inferior parietal lobule (Table
1a/b; Fig. 1). When PD/PG were compared with PD/
non-PG patients, a significantly increased cue-related
BOLD response was detected bilaterally in the anterior
FIG. 1. Within-group contrast maps during viewing gambling scenarios with respect to NS (FDR < 0.001) in PD patients with and without PG.[Color figure can be viewed in the online issue, which is available at wileyonlinelibrary.com.]
TABLE 1. Within-groups and between-groups contrast maps. Anatomical location, Talairach coordinates of the center ofgravity, maximum statistical value, and spatial extent (voxels) of significant clusters
Anatomical location
Center of gravity Talairachcoordinates
Brodmann area N voxel T-maxX Y Z
A PD/PG1 Inferior parietal lobule (R) 41 254 36 BA 40 6955 82 Precuneus (L 1 R) 2 263 38 BA 7 6497 7.93 Anterior cingulate, caudate head (R) 10 22 23 – 202 5.34 Medial frontal gyrus, superior frontal gyrus (L 1 R) 24 3 53 BA 6 2759 6.25 Cingulate gyrus (L) 25 234 30 BA 31.23 577 5.36 Lentiform nucleus (L) 216 26 7 – 115 5.17 Middle frontal gyrus L 227 23 58 BA 6 302 5.58 Inferior parietal lobule (L) 236 257 35 BA 39.40 2395 6.29 Precentral gyrus (L) 246 210 46 BA 6 841 6.2
B PD/non-PG1 Precentral gyrus (R) 61 21 13 BA 6 532 5.62 Inferior parietal lobule (R) 50 258 42 BA 40.39 303 5.73 Superior parietal lobule (R) 39 268 42 BA 7 344 5.94 Cuneus (R 1 L) 4 274 11 BA 17.18.23 849 5.65 Medial frontal gyrus, superior frontal gyrus (R 1 L) 1 7 52 BA 6 3861 6.96 Precuneus (L) 225 257 34 BA 7 487 6.27 Superior parietal lobule (L) 235 265 46 BA 7 1246 6.68 Precentral gyrus (L) 244 215 56 BA 6 1409 6.2
C PD/PG higher than PD/non-PG1 Inferior parietal lobule (R) 38 253 37 BA 40 1430 5.72 Precuneus (R) 12 258 33 BA 7 1163 63 Medial frontal gyrus, superior frontal gyrus (R) 9 49 31 BA 9 1104 64 Lentiform nucleus (L) 219 8 211 BA 34 242 5.45 Anterior cingulate, medial frontal gyrus (L) 28 42 7 BA 32.10 321 4.76 Precuneus (L) 213 267 42 BA 7 502 5.37 Medial frontal gyrus, superior frontal gyrus (L) 218 25 54 BA 6 204 4.98 Anterior cingulate, caudate head (R) 13 24 23 – 2329 5.39 Anterior cingulate, caudate head (L) 27 15 21 BA 25 810 5.110 Ventral-striatum (L) 211 24 23 – 1371 5.9
2451GAMBLING IN PARKINSON’S DISEASE: FMRI EVIDENCES
Movement Disorders, Vol. 25, No. 14, 2010
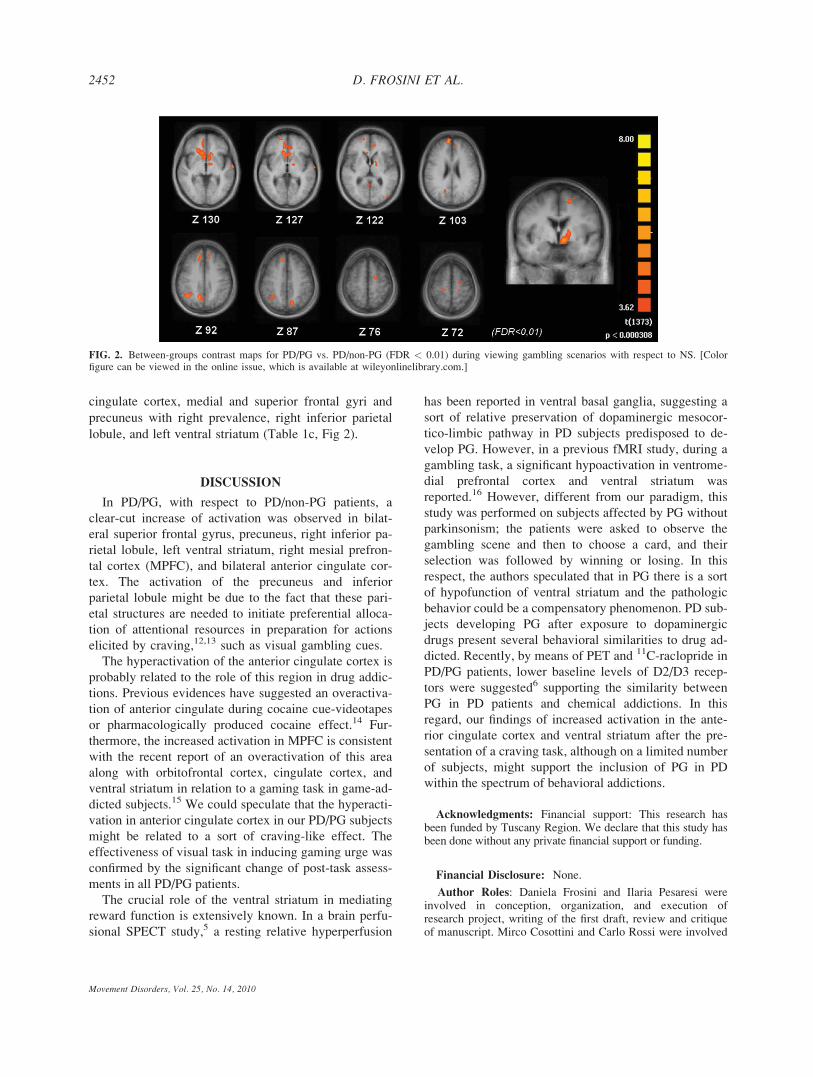
cingulate cortex, medial and superior frontal gyri and
precuneus with right prevalence, right inferior parietal
lobule, and left ventral striatum (Table 1c, Fig 2).
DISCUSSION
In PD/PG, with respect to PD/non-PG patients, a
clear-cut increase of activation was observed in bilat-
eral superior frontal gyrus, precuneus, right inferior pa-
rietal lobule, left ventral striatum, right mesial prefron-
tal cortex (MPFC), and bilateral anterior cingulate cor-
tex. The activation of the precuneus and inferior
parietal lobule might be due to the fact that these pari-
etal structures are needed to initiate preferential alloca-
tion of attentional resources in preparation for actions
elicited by craving,12,13 such as visual gambling cues.
The hyperactivation of the anterior cingulate cortex is
probably related to the role of this region in drug addic-
tions. Previous evidences have suggested an overactiva-
tion of anterior cingulate during cocaine cue-videotapes
or pharmacologically produced cocaine effect.14 Fur-
thermore, the increased activation in MPFC is consistent
with the recent report of an overactivation of this area
along with orbitofrontal cortex, cingulate cortex, and
ventral striatum in relation to a gaming task in game-ad-
dicted subjects.15 We could speculate that the hyperacti-
vation in anterior cingulate cortex in our PD/PG subjects
might be related to a sort of craving-like effect. The
effectiveness of visual task in inducing gaming urge was
confirmed by the significant change of post-task assess-
ments in all PD/PG patients.
The crucial role of the ventral striatum in mediating
reward function is extensively known. In a brain perfu-
sional SPECT study,5 a resting relative hyperperfusion
has been reported in ventral basal ganglia, suggesting a
sort of relative preservation of dopaminergic mesocor-
tico-limbic pathway in PD subjects predisposed to de-
velop PG. However, in a previous fMRI study, during a
gambling task, a significant hypoactivation in ventrome-
dial prefrontal cortex and ventral striatum was
reported.16 However, different from our paradigm, this
study was performed on subjects affected by PG without
parkinsonism; the patients were asked to observe the
gambling scene and then to choose a card, and their
selection was followed by winning or losing. In this
respect, the authors speculated that in PG there is a sort
of hypofunction of ventral striatum and the pathologic
behavior could be a compensatory phenomenon. PD sub-
jects developing PG after exposure to dopaminergic
drugs present several behavioral similarities to drug ad-
dicted. Recently, by means of PET and 11C-raclopride in
PD/PG patients, lower baseline levels of D2/D3 recep-
tors were suggested6 supporting the similarity between
PG in PD patients and chemical addictions. In this
regard, our findings of increased activation in the ante-
rior cingulate cortex and ventral striatum after the pre-
sentation of a craving task, although on a limited number
of subjects, might support the inclusion of PG in PD
within the spectrum of behavioral addictions.
Acknowledgments: Financial support: This research hasbeen funded by Tuscany Region. We declare that this study hasbeen done without any private financial support or funding.
Financial Disclosure: None.
Author Roles: Daniela Frosini and Ilaria Pesaresi wereinvolved in conception, organization, and execution ofresearch project, writing of the first draft, review and critiqueof manuscript. Mirco Cosottini and Carlo Rossi were involved
FIG. 2. Between-groups contrast maps for PD/PG vs. PD/non-PG (FDR < 0.01) during viewing gambling scenarios with respect to NS. [Colorfigure can be viewed in the online issue, which is available at wileyonlinelibrary.com.]
2452 D. FROSINI ET AL.
Movement Disorders, Vol. 25, No. 14, 2010

in organization, and execution of research project, review andcritique of manuscript. Gina Belmonte was involved in execu-tion of research project, review and critique of manuscript.Liliana Dell’Osso, Luigi Murri, and Ubaldo Bonuccelli wereinvolved in organization of research project, review and cri-tique of manuscript. Roberto Ceravolo was involved in con-ception and organization of research project, writing of thefirst draft, review and critique of manuscript.
REFERENCES
1. American Psychiatric Association. Diagnostic and statistical man-ual of mental, fourth edition. Washington, DC: American Psychi-atric Press; 1994.
2. Voon V, Thomsen T, Miyasaki JM, et al. Factors associated withdopaminergic drug-related pathological gambling in Parkinsondisease. Arch Neurol 2007;64:212–216.
3. Gallagher DA, O’Sullivan SS, Evans AH, Lees AJ, Schrag A.Pathological gambling in Parkinson’s disease: risk factors anddifferences from dopamine dysregulation. An analysis of pub-lished case series. Mov Disord 2007;22:1757–1763.
4. Antonini A, Tolosa E, Mizuno Y, Yamamoto M, Poewe WH. Areassessment of risks and benefits of dopamine agonists in Par-kinson’s disease. Lancet Neurol 2009;8:929–937.
5. Cilia R, Siri C, Marotta G, et al. Functional abnormalities under-lying pathological gambling in Parkinson disease. Arch Neurol2008;65:1604–1611.
6. Steeves TD, Miyasaki J, Zurowski M, et al. Increased striatal do-pamine release in Parkinsonian patients with pathologicalgambling: a [11C] raclopride PET study. Brain 2009;132:1376–1385.
7. Potenza MN. Should addictive disorders include non-substance-related conditions? Addiction 2006;101(Suppl 1):142–151.
8. Gelb DJ, Oliver E, Gilman S. Diagnostic criteria for Parkinsondisease. Arch Neurol 1999;56:33–39.
9. Grosset K, Needleman F, Macphee G, Grosset D. Switchingfrom ergot to nonergot dopamine agonists in Parkinson’s disease:a clinical series and five-drug dose conversion table. Mov Disord2004;19:1370–1374.
10. Talairach J, Tournoux P. Co-planar stereotaxic atlas of thehuman brain: 3-D proportional system: an approach to cerebralimaging. New York: Thieme Medical Publishers; 1988.
11. Friston KJ, Holmes AP, Poline JB, et al. Analysis of fMRI time-series revisited. Neuroimage 1995;2:45–53.
12. Crockford DN, Goodyear B, Edwards J, Quickfall J, el-GuebalyN. Cue-induced brain activity in pathological gamblers. Biol Psy-chiatry 2005;58:787–795
13. Park MS, Sohn JH, Suk JA, Kim SH, Sohn S, Sparacio R. Brainsubstrates of craving to alcohol cues in subjects with alcohol usedisorder. Alcohol Alcohol 2007;42:417–422.
14. Wexler BE, Gottschalk CH, Fulbright RK, et al. Functional mag-netic resonance imaging of cocaine craving. Am J Psychiatry2001;158:86–95
15. Ko CH, Liu GC, Hsiao S, et al. Brain activities associated withgaming urge of online gaming addiction. J Psychiatr Res 2009;43:739–747.
16. Reuter J, Raedler T, Rose M, Hand I, Glascher J, Buchel C.Pathological gambling is linked to reduced activation of the mes-olimbic reward system. Nat Neurosci 2005;8:147–148.
Adult Cases of CongenitalMuscular Torticollis SuccessfullyTreated with Botulinum Toxin
Manon Bouchard, MD, FRCPC,1*Sylvain Chouinard, MD, FRCPC,2
and Oksana Suchowersky, MD, FRCPC1,3
1Department of Clinical Neurosciences,University of Calgary, Calgary, Alberta, Canada;
2Department of Medicine, University of Montreal, Montreal,Canada; 3Department of Medical Genetics, University of
Calgary, Calgary, Alberta, Canada
Abstract: Congenital muscular torticollis (CMT) is themost common cause of torticollis in childhood. This condi-tion is usually recognized and successfully treated ininfancy, but may persist in adulthood, particularly if nottreated. In adult patients, CMT can be differentiatedfrom idiopathic cervical dystonia by the frequent associa-tion with facial asymmetry, presence of a cord-like sterno-cleiodmastoid muscle (SCM), absence of head tremor,lack of sensory trick, and head tilt since infancy. Wedescribe 3 patients with persistent CMT, who were suc-cessfully treated with botulinum toxin injections with longlasting benefit. � 2010 Movement Disorder Society
Key words: congenital muscular torticollis; torticollis;cervical dystonia; botulinum toxin; treatment
Congenital muscular torticollis (CMT) is the third
most common congenital musculoskeletal anomaly af-
ter dislocation of the hip and clubfoot with a preva-
lence between 0.3% and 2% of live births.1,2 The exact
pathophysiological mechanism of CMT is unknown
but involves shortening and fibrosis of the sternocleiod-
mastoid muscle (SCM) resulting in head tilt toward the
affected side and head rotation towards the unaffected
side.3 This condition is usually recognized and success-
fully treated in infancy, but cases may persist in adult-
hood, particularly if not treated. If the torticollis is not
corrected early, facial asymmetry develops in a major-
ity of patients. While there is abundant literature
*Correspondence to: Manon Bouchard, 3350 Hospital Drive NW,Movement Disorders Clinic, Calgary, AB T2N4Z5, Canada.E-mail: [email protected] conflict of interest: Nothing to report.Received 7 April 2010; Revised 11 May 2010; Accepted 5 July
2010Published online in Wiley Online Library (wileyonlinelibrary.
com). DOI: 10.1002/mds.23371
2453CONGENITAL MUSCULAR TORTICOLLIS
Movement Disorders, Vol. 25, No. 14, 2010

addressing the management of CMT in childhood, the
best treatment for adult-persistent CMT is uncertain.
CASE REPORTS
Case 1
A 39-year-old woman sought medical attention 3.5
years after a car accident which resulted in severe
headaches, neck stiffness, and pain in the shoulders
and low back. Over time, the pain subsided but neck
stiffness persisted. The patient noticed prominence of
the left SCM, limitation in neck movements, and ele-
vation of her left shoulder. In retrospect, the patient
admitted that she noted similar but less prominent
problems prior to the accident. She had also been
known to have abnormal head posture as a child. Past
medical history was unremarkable.
On examination, the left shoulder was elevated, and
the left SCM was cord-like and prominent. There was
limitation in voluntary cervical movements and facial
asymmetry, with the left eye and ear being lower than
the right, and the left eye being smaller (Fig. 1). A di-
agnosis of CMT and associated facial asymmetry with
posttraumatic deterioration was made.
The patient was treated using 25 units of onabotuli-
num toxin A (BoNT-A, Botox) placed just behind the
left SCM, in the levator scapulae muscle. The muscle
was not injected directly because it was thick and cord-
like. The injections were very effective in improving
neck tightness, pain, and cervical range of motion with-
out any side effects. The patient has been receiving regu-
lar injections at the same dose for over 4 years.
Case 2
A 37-year-old woman diagnosed at birth with CMT
was unsuccessfully treated with physiotherapy as a
child and later noticed progressive asymmetry of her
face with development of pain and discomfort in the
posterior neck and right shoulder. Past medical history
was unremarkable.
On examination, the right SCM appeared tight, cord-
like, and fibrotic with abnormal head tilt to the right
and left rotation. Hypertrophy and spasm of the right
trapezius and levator scapulae muscles was noted.
Range of cervical movements was limited. Facial
asymmetry was present, the right side appearing drawn
downwards and atrophied compared to the left side
(Fig. 1).
In this patient, 45 units of BoNT-A (Botox) were
injected in the right trapezius and 10 units in the right
levator scapulae, just behind the fibrotic SCM. The
injections resulted in decreased tightness and better
cervical mobility, lasting for 3 weeks. The patient was
reinjected with an increased dose of 80 units, then 100
units hoping to get a more sustained response.
Case 3
A 15-year-old woman was diagnosed with CMT at 2
months of age and treated with physical therapy for 4
months with minimal improvement. The patient had no
further treatment for CMT until seen by a neurologist
for syncope (most likely vasovagal) and referred to a
movement disorders clinic. Past medical history also
included casting in early childhood for a deviated right
foot. On examination, the patient had a head tilt to the
right with atrophy of the right SCM and tenderness on
palpation of the right splenius capitis. She had no fa-
cial asymmetry.
Initially, the patient was injected with 100 units of
BoNT-A (Botox) in the right splenius capitis and 75
units in the right trapezius (for pain) with complete re-
solution of the abnormal head posture and pain after
the second injection. Over the years, the pattern of
injection changed to 150 units in the right splenius
capitis, 50 units in the right trapezius, and 25 units in
the right SCM. She has received regular BoNT-A treat-
ments for 8 years, with sustained benefit.
DISCUSSION
The word torticollis is derived from a latin root
meaning twisted neck. Most cases of torticollis are
related to dystonia (primary or secondary) in adults
and CMT in infants. A variety of other neurological
pathologies can result in torticollis, such as posterior
FIG. 1. Facial asymmetry was present on the left face for Patient 1(left) and on the right face for Patient 2 (right). [Color figure can beviewed in the online issue, which is available at wileyonlinelibrary.com.]
2454 M. BOUCHARD ET AL.
Movement Disorders, Vol. 25, No. 14, 2010
fossa or cervical spine tumors, syringomyelia, and
obstetrical brachial plexus palsies. Torticollis may also
result from anomalies of upper cervical spine or cra-
niocervical junction such as Arnold-Chiari malforma-
tion, rotatory cervical instability, C1–C2 subluxation,
hemiatlas, scoliosis, and Klippel-Feil syndrome. Cer-
tain infectious processes have been reported to cause
abnormal head posture such as parapharyngeal abcess,
Grisel’s syndrome, or spondylodiscitis. Other causes
include ocular conditions (eye muscle weakness or
nystagmus), hearing deficit, Sandifer syndrome,
trauma, and radiation therapy.1,2,4,5
CMT is a common finding in the newborn period
with a reported prevalence up to 2%.2 The pathophysi-
ology of this condition is still unclear. The most popu-
lar hypothesis involves the occurrence of compartment
syndrome either from venous compression of the neck
at birth or from injury to the muscle in utero. This hy-
pothesis is supported by histological specimens show-
ing edema, degeneration of muscle fibers, and diffuse
fibrosis of the SCM, consistent with vascular compro-
mise.2 Other causes that have been suggested to
explain the shortening of the SCM include intrauterine
crowding and malposition, fibrosis from peripartum
bleed, and primary myopathy of the SCM.2 Magnetic
resonance imaging of the neck shows muscle atrophy
and interstitial fibrosis in about one third of cases.2
If CMT is not corrected early, mild to severe facial
asymmetry develops in 88% to 100% of subjects, usu-
ally starting after 5 years of age.4,6–8 Facial abnormal-
ities can include posterior recession of both the zy-
goma and the forehead, posterior and inferior displace-
ment of the ear, inferior displacement of the orbit with
reduced palpebral aperture, and mandibular shortening
on one side resulting in dental malocclusion.4,9 The
craniofacial structures involved in the asymmetry are
those to which either the SCM or the investing layer
of deep cervical fascia are attached, suggesting that
fascial contraction is responsible for craniofacial distor-
sion.9 Another possible explanation for the facial
asymmetry would be positional moulding of open cra-
nial sutures arising from the head tilt.9
Up to 95% of CMT resolve completely within the
first year of life either spontaneously, with physiotherapy
or gentle controlled passive manual stretching exer-
cises.10 It has been recommended that children who do
not respond to physiotherapy should be considered can-
didates for BoNT-A injections as adjunctive therapy to
reduce pain and muscle spasm and improve long-term
outcome.7,11,12 Surgery is usually recommended to
improve cervical range of motion and prevent or reverse
facial asymmetry in children with persistent limitation
of cervical movements after 6 months of manual stretch-
ing or when they are older than one year of age.10,11
Although CMT is the most common cause of torti-
collis in infancy, very few cases persist in adulthood
because of successful early treatment. In adults, CMT
must be differentiated from the more common idio-
pathic cervical dystonia. Apart from facial asymmetry
and history of head tilt since infancy, other features
evident in CMT and usually absent in idiopathic cervi-
cal dystonia include presence of a cord-like SCM, ab-
sence of head tremor, lack of sensory trick, and the
constant nature of the abnormal head posture.7
Treatment for CMT persisting in adulthood is not
clear. We found a single case series in the literature
describing 6 adult patients with persisting CMT, who
were treated with BoNT-A injections. Two of the 6
patients had moderate improvement in range of
motion, and the remaining patients did not have signifi-
cant improvement.7 All our patients reported good
improvement in neck pain, tightness, and cervical mo-
bility with BoNT-A injections. Since two of our
patients had spasm or tenderness in neck muscles other
than the SCM, we hypothesize the effectiveness of
BoNT-A in CMT may be explained by improvement
in associated musculoskeletal factors. In case 1, this
was likely aggravated by the motor vehicle accident.
We feel confident that our patients had CMT (and not
idiopathic cervical dystonia) despite not having con-
firmed the diagnosis with cervical MRI or needle EMG
given the presence of head tilt since infancy, cord-like
SCM (2 patients), and facial asymmetry (2 patients).
Although surgical treatment has been shown to be
most effective in childhood,4 adult cases not responsive
to botulinum toxin can also benefit from surgery. In a
recent study, 14 adult patients with neglected CMT
had surgical bipolar sectioning of the SCM and 86%
had excellent or good results with regards to cervical
range of motion. Two of the patients even had some
improvement of the facial asymmetry.3 Another group
reported improvement in neck movements in all adult
patients following open SCM tenotomy, but no
improvement in facial asymmetry.13
CONCLUSIONS
Although typically successfully treated in childhood,
CMT can persist in adulthood and must be differenti-
ated from idiopathic cervical dystonia or other causes
of torticollis. In CMT patients presenting in adulthood,
botulinum toxin injections should be tried before con-
sidering surgical treatment.
2455CONGENITAL MUSCULAR TORTICOLLIS
Movement Disorders, Vol. 25, No. 14, 2010

Financial Disclosures: Manon Bouchard: Speaker
for Allergan. Oksana Suchowerky: Advisory board for
Teva and Allergan. Sylvain Chouinard: Advisory board
or consultant for Teva, Novartis, Allergan, Merz, Bio-
vail.
Author Roles: Bouchard: manuscript: writing of the
first draft. Chouinard: manuscript: review and critique.
Suchowersky: manuscript: review and critique.
REFERENCES
1. Peyrou P, Moulies D. Torticollis in children: diagnosticapproach. Arch Pediatr 2007;14:1264–1270.
2. Do TT. Congenital muscular torticollis: current concepts andreview of treatment. Curr Opin Pediatr 2006;18:26–29.
3. Omidi-Kashani F, Hasankhani EG, Sharifi R, Mazlumi M. Is sur-gery recommended in adults with neglected congenital musculartorticollis? A prospective study. BMC Musculoskelet Disord2008;9:158.
4. Hollier L, Kim J, Grayson BH, McCarthy JG. Congenital muscu-lar torticollis and the associated craniofacial changes. PlastReconstr Surg 2000;105:827–835.
5. Ballock RT, Song KM. The prevalence of nonmuscular causes oftorticollis in children. J Pediatr Orthop 1996;16:500–504.
6. Cheng JC, Tang SP, Chen TM, Wong MW, Wong EM. The clin-ical presentation and outcome of treatment of congenital muscu-lar torticollis in infants—a study of 1,086 cases. J Pediatr Surg2000;35:1091–1096.
7. Collins A, Jankovic J. Botulinum toxin injection for congenitalmuscular torticollis presenting in children and adults. Neurology2006;67:1083–1085.
8. Yu CC, Wong FH, Lo LJ, Chen YR. Craniofacial deformity inpatients with uncorrected congenital muscular torticollis: anassessment from three-dimensional computed tomography imag-ing. Plast Reconstr Surg 2004;113:24–33.
9. Chate RA. Facial scoliosis from sternocleidomastoid torticollis:long-term postoperative evaluation. Br J Oral Maxillofac Surg2005;43:428–434.
10. Cheng JC, Wong MW, Tang SP, Chen TM, Shum SL, WongEM. Clinical determinants of the outcome of manual stretchingin the treatment of congenital muscular torticollis in infants. Aprospective study of eight hundred and twenty-one cases. J BoneJoint Surg (Am) 2001;83:679–687.
11. Oleszek JL, Chang N, Apkon SD, Wilson PE. Botulinum toxintype A in the treatment of children with congenital muscular tor-ticollis. Am J Phys Med Rehabil 2005;84:813–816.
12. De Chalain TMB, Park S. Torticollis associated with positional pla-giocephaly: a growing epidemic. J Craniofac Surg 2005;16:411–418.
13. Ippolito E, Tudisco C. Idiopathic muscular torticollis in adults:results of open sternocleidomastoid tenotomy. Arch OrthopTrauma Surg 1986;105(I):49–54.
Fatigue in Parkinson’s Disease:Prevalence and Associated Factors
Antoine G. Beiske, MD, PhD,1*Jon Havard Loge, MD, PhD,2,3
Marianne J. Hjermstad, PhD,4,5
and Elisabeth Svensson, PhD6
1Department of Neurology, Akershus University Hospital,Norway; 2Department of Oncology, National Resource
Centre for Late Effects, Oslo University Hospital Montebello,Norway; 3Department of Behavioural Sciences in Medicine,University of Oslo, Norway; 4Department of Oncology,Regional Centre for Excellence in Palliative Care, Oslo
University Hospital, Ulleval, Norway;5Department of Cancer Research and Molecular Medicine,Faculty of Medicine, Norwegian University of Science andTechnology, Norway; 6Department of Adult Mental Health,Division of Mental Health, Norwegian Institute of Public
Health, Norway
Abstract: The purpose of this study was to examine theprevalence of fatigue in Parkinson’s disease (PD) patientsand compare this to the general population. Factors asso-ciated with fatigue were investigated by linear regression.Fatigue was assessed by the fatigue questionnaire. Themean age of the 176 PD patients (41% women) was 69years (range 35–90), and the mean UPDRSIII was 22.3(SD 11.7). Fatigue levels (means) were significantly higherin PD patients compared with the general population;however, effect sizes were moderate for women for physi-cal and total fatigue indicating clinically significant differ-ences here only. Only female PD patients had morechronic fatigue than the general population. Fatigue wasrelated to characteristics of PD but also to sleep disturb-ance, depression, and gender. This population-based studydemonstrates that fatigue is a common symptom in PDpatients, but compared with the general population, clini-cally significant differences were only found for femalePD patients. � 2010 Movement Disorder Society
Key words: fatigue; Parkinson; prevalence; Norway;chronic fatigue; associated factors; population based
*Correspondence to: A.G. Beiske, Department of Neurology, Aker-shus University Hospital, N-1478 Lørenskog, Norway.E-mai: [email protected] conflict of interest: Nothing to report.Received 4 March 2010; Revised 13 April 2010; Accepted 5 July
2010Published online in Wiley Online Library (wileyonlinelibrary.
com). DOI: 10.1002/mds.23372
Movement Disorders, Vol. 25, No. 14, 2010
2456 A.G. BEISKE ET AL.
Fatigue is a common symptom in most chronic disor-
ders; in the past two decades, several studies have exam-
ined fatigue in Parkinson’s disease (PD) patients
(reviewed in Ref. 1). Previous studies have reported
prevalence of fatigue from 37 to 58%,2–7 but the samples
have often been small and hospital-based convenience
samples. The wide range is probably due to varying defi-
nitions of fatigue and different measurement methods.8
There is no universally accepted definition of fatigue.
In this study, three dimensions of fatigue: physical, men-
tal, and chronic fatigue are investigated. Physical fatigue
is the subjective feeling of being exhausted and lacking
energy, whereas mental fatigue measures the subjective
feelings of having impaired concentration, reduced mem-
ory, and speech difficulties. Chronic fatigue is defined as
having elevated levels of fatigue lasting for a minimum of
6 months.9 The concept of chronic fatigue is particularly
useful in patient populations with relatively stable dis-
eases because it helps to separate acute and transient fa-
tigue from fatigue that is stable over time.
Fatigue is a common phenomenon in the general
population, amongst the elderly and ill, thus it is im-
portant to compare levels of fatigue in a PD population
with the general population. To our knowledge, the
only population-based study investigating this found a
significant higher prevalence of fatigue than in the gen-
eral population.2
Previous studies have examined fatigue and its associ-
ated factors in PD patients (reviewed in Ref. 1), many
focusing on depression. However, there is still a need for
studies investigating the relationship of fatigue to other
characteristics of PD, such as onset of motor symptoms
and its correlation with other comorbidities.1
The purpose of this study was to examine physical,
mental, and chronic fatigue in PD patients in compari-
son with the general population. Associated factors
with fatigue in PD patients were also investigated.
MATERIAL AND METHODS
Material
All PD patients living in the eastern part of Aker-
shus county, Norway (320,000 inhabitants) were
defined as the target population. Detailed information
about the inclusion has been published previously (see
Ref. 10). In total, 176 eligible patients were included
consecutively until the end of the inclusion period,
yielding a response rate of 87% (176 of 202).
Methods
Medical variables were collected in a structured
interview and a clinical examination. Staging of dis-
ease was performed in accordance with present stand-
ards [Modified Hoehn and Yahr Staging,11 Unified Par-
kinson’s Disease Rating Scale (UPDRS)12]. Cognitive
functioning was assessed by the mini-mental state ex-
amination.13 All patients suffering from motor fluctua-
tions were examined during the on-period.
Patients were asked to fill in a self-report question-
naire, which assessed demographic status, fatigue [the
fatigue questionnaire (FQ)14], sleep disturbances [Par-
kinson’s Disease Sleep Scale (PDSS)15], and symptoms
of anxiety and depression (MH-Short Form-3616,17).
The patients were also asked whether they had any so-
matic comorbidity.
Fatigue was assessed by the Norwegian version of
the FQ.18 The FQ is a self-report questionnaire, devel-
oped to measure physical (7 items) and mental fatigue
(4 items). The sum score of responses to all 11 items
is designated as total fatigue, with minimum/maximum
scores of 0/33. All items in the FQ were also scored
on a dichotomized scale based on the four response
categories (0 5 better or no more than usual and 1 5worse or much worse than usual), defining chronic
fatigue as scores of ‡4, with symptoms lasting for
6 months or longer. The FQ has demonstrated good
face and discriminant validity and good and stable psy-
chometric properties across populations.14 Reference
data on fatigue levels from the Norwegian general pop-
ulation exists.18
The study was approved by the Regional Committee
for Medical Research Ethics. Informed consent was
obtained from all respondents.
STATISTICAL METHODS
Descriptive statistics for fatigue, clinical, and demo-
graphic variables were calculated. The effect size,
Cohen’s d, was calculated (using http://www.uccs.edu/
�faculty/lbecker/) and deemed small if under 0.5, me-
dium if between 0.5 and 0.8, and large if over 0.8.19
A stepwise linear regression was conducted to assess
factors associated with fatigue; block one including de-
mographic factors (age and gender), block two adding
disease characteristics (disease duration and UPDRS),
and block three adding other possible explanatory fac-
tors (sleep disturbance, symptoms of anxiety and
depression, and comorbidity). A significance level of
0.05 was chosen.
Analyses were performed using STATA version 8.
RESULTS
Of the 176 patients examined with a mean age of 60
years (SD 8.8, range 35–90), 41% were women. The
2457FATIGUE IN PARKINSON’S PATIENTS
Movement Disorders, Vol. 25, No. 14, 2010

mean UPDRSIII was 22.3 (SD 11.3), and the mean
disease duration was 7.5 years (SD 5.3). The mean
mental health SF-36 score was 72.3 (SD 18.8), and the
mean PDSS score was 102.8 (SD 23.3). Comorbidities
reported by the PD patients were: cardiovascular dis-
eases: 18%, diabetes mellitus type II: 6%, and other
comorbidities (including cancer, respiratory problems,
and musculoskeletal problems): 16%. All patients were
on antiparkinsonian drugs. In addition, 8.5% were on
antidepressants/anticonvulsant treatment.10
The levels of physical, mental, and total fatigue are
shown in Table 1, together with the comparative levels
for the Norwegian general population aged 60 to 80
years.18 All levels of fatigue were significantly higher
in the PD patients compared with the general popula-
tion when comparing differences in means. However,
statistically significant differences are less important if
they occur in a scale with large range of values and a
large SD. The magnitude of the score differences were
moderate (Cohen’s d >0.5, <0.8) for women on physi-
cal and total fatigue, the remainder were small (<0.5).
The prevalence of chronic fatigue was 33% for
women and 22% for men, overall 28% (Table 1). The
corresponding figures from the general population aged
60 to 80 years are 22, 17, and 19%, respectively.18
There was a significantly higher proportion of women
with chronic fatigue (P < 0.05) in the PD population
compared with the general population over 60 years.
The factors associated with total fatigue are shown
in Table 2. Gender, UPDRS score, symptoms of anxi-
ety and depression (MH-SF36), and sleep disturbances
(PDSS) were all predicting total fatigue (Adjusted R2
for the final model 0.28).
DISCUSSION
Compared to the general population, the prevalence
of chronic fatigue is 50% higher among women and
30% higher among men, but yielding statistical signifi-
cance for women only. However, this does not make
fatigue a less important problem in PD patients, as it
just points to fatigue being an important problem in
the general population as well, with mechanisms that
may be common across disorders.3
Fatigue is a subjective problem, thus the patients’
own perception of what they are experiencing is of pri-
mary interest. There is no ‘‘gold standard’’ for fatigue
assessment and objective assessment methods are not
available. Thus, it is possible that different measure-
ments could yield different prevalence estimates and
measure different aspects of fatigue. This is illustrated
by a comparison of the Fatigue Severity Scale and the
Functional Assessment of Chronic Illness Therapy-Fa-
tigue Scale, concluding that they do not appear to mea-
sure identical aspects of fatigue.20 The dimensionality
of fatigue in general is not clearly established. How-
ever, mental and physical fatigue seems to be included
in most fatigue instruments and they are repeatedly
demonstrated as two separate dimensions of fatigue.21
Strengths of this study are that it is population
based, and that the results from the PD patients are
compared with general population scores. In Norway,
the prevalence of PD is about 111 per 100.000 inhabi-
tants,22 suggesting about 355 patients in our recruit-
ment area. Thus, our initial population of 345 was
probably close to all cases in the catchment area. The
normative data for fatigue are from the general popula-
tion, thus, the findings are generalizable to the Norwe-
gian population. A limitation of the generalizability is
that the study does not address fatigue in PD patients
with dementia or in patients otherwise unable to utilize
self-report instruments for data collection.
Our results are somewhat in agreement with previous
studies examining associated factors with fatigue by dif-
ferent questionnaires, such as for depression and degree
of the disease (UPDRS).3,4,23 However, for two factors,
our study are not in accordance with previous studies,
TABLE 1. Total fatigue, physical fatigue, mental fatigue, and chronic fatigue cases by genderin Parkinson patients and the general population over 60 years of agea
Women Men
Fatigue PD (n 5 72)
Generalpopulation17
(n 5 263) Cohen’s dPD
(n 5 104)
Generalpopulation17
(n 5 238) Cohen’s d
Physical 11.1 (3.9) 9.0 (3.5) 0.57 9.9 (3.2) 8.4 (3.2) 0.47Mental 5.1 (1.8) 4.4 (1.4) 0.43 5.0 (1.7) 4.5 (1.2) 0.33Total 16.4 (5.0) 13.4 (4.2) 0.65 14.9 (5.0) 12.9 (3.8) 0.45Chronic fatigue 33.3* 21.7 22.1 16.8
aData expressed as mean (SD). Chronic fatigue cases expressed as percent of columns total.*Significant P < 0.05.
2458 A.G. BEISKE ET AL.
Movement Disorders, Vol. 25, No. 14, 2010

namely sleep and gender.2,4,24 Sleep disturbance, as meas-
ured by a PD-specific scale, was significantly associated
with fatigue, as also found by Okuma et al.25 The PDSS
systematically addresses and quantifies the different
aspects of sleep disturbance in PD,15 probably capturing
the importance of disease-specific sleep disturbance asso-
ciated with fatigue not captured by general sleep quality
questionnaires. Few studies have reported the relationship
to gender.1 Here, an association between gender and fa-
tigue in PD patients was found. Women in general do
report higher levels of fatigue in the general population.18
These issues need to be further investigated.
The treatment of fatigue is still a challenge, and a li-
mitation of this study is that there was only informa-
tion about antidepressant/anticonvulsant therapy. How-
ever, documented treatment alternatives are scarce.
Levodopa is shown to reduce both central and periph-
eral fatigue26 and a randomized, controlled study found
methylphenidate to be effective.27 As sleep dysfunction
and symptoms of depression are associated with higher
levels of fatigue, it is important to treat these symp-
toms. Treatment of depression may, for example, lead
to improvement in both mental and physical dimen-
sions of fatigue.28 The benefits of exercise as treatment
for fatigue in medical conditions may extend to PD
patients as well.29 However, sufficient exercise to
make a difference for fatigue may be difficult to obtain
for patients with severe motor dysfunction.
Acknowledgments: We give special thanks to ProfessorKjell Magne Tveit at the Department of Oncology, Oslo Uni-versity Hospital, Ulleval and Vibeke Schou Jensen at OsloUniversity Hospital, Ulleval, Norway and Anne Rønningenfor their support of the study. We also wish to acknowledgethe patients who participated in the study. The work was sup-ported by a grant from Oslo University Hospital, Uleval,Norway, which made the carrying out of the study possible.
Financial Disclosures: None.
Author Roles: A.G. Beiske: research project: conception,organization, and execution; statistical analysis: review andcritique; manuscript: writing of the first draft, review and cri-tique. J.H. Loge: research project: conception; statistical anal-ysis: design, review and critique; manuscript: review and cri-tique. M.J. Hjermstad: statistical analysis: design, review andcritique; manuscript: review and critique. E. Svensson: statis-tical analysis: design and execution; manuscript: writing ofthe first draft, review and critique.
REFERENCES
1. Friedman JH, Brown RG, Comella C, et al. Fatigue in Parkin-son’s disease: a review. Mov Disord 2007;22:297–308.
2. Karlsen K, Larsen JP, Tandberg E, Jorgensen K. Fatigue inpatients with Parkinson’s disease. Mov Disord 1999;14:237–241.
3. Hagell P, Brundin L. Towards an understanding of fatigue in Par-kinson disease. J Neurol Neurosurg Psychiatry 2009;80:489–492.
4. Shulman LM, Taback RL, Bean J, Weiner WJ. Comorbidity ofthe nonmotor symptoms of Parkinson’s disease. Mov Disord2001;16:507–510.
5. Alves G, Wentzel-Larsen T, Larsen JP. Is fatigue an independentand persistent symptom in patients with Parkinson disease? Neu-rology 2004;63:1908–1911.
6. Schifitto G, Friedman JH, Oakes D, et al. Fatigue in levodopa-na-ive subjects with Parkinson disease. Neurology 2008;71:481–485.
7. Barone P, Antonini A, Colosimo C, et al. The PRIAMO study: amulticenter assessment of nonmotor symptoms and their impacton quality of life in Parkinson’s disease. Mov Disord2009;24:1641–1649.
8. Friedman JH, Alves G, Hagell P, et al. Fatigue rating scales cri-tique and recommendations by the Movement Disorders Societytask force on rating scales for Parkinson’s disease. Mov Disord2010;25:805–822.
9. Fukuda K, Straus SE, Hickie I, Sharpe MC, Dobbins JG, Komar-off A. The chronic fatigue syndrome: a comprehensive approachto its definition and study. International Chronic Fatigue Syn-drome Study Group. Ann Intern Med 1994;121:953–959.
10. Beiske AG, Loge JH, Ronningen A, Svensson E. Pain in Parkin-son’s disease: prevalence and characteristics. Pain 2009;141:173–177.
11. Hoehn MM, Yahr MD. Parkinsonism: onset, progression andmortality. Neurology 1967;17:427–442.
12. Fahn S, Elton RL. Members of the UPDRS Development Com-mittee: unified Parkinson’s disease rating scale. In: Fahn S, Mars-den CD, Calne DB, Lieberman A, editors. Recent developmentsin Parkinson’s disease. Florham Park: MacMillan Health Care In-formation; 1987. p 153–163.
13. Folstein MF, Folstein SE, McHugh PR. ‘‘Mini-mental state’’. Apractical method for grading the cognitive state of patients forthe clinician. J Psychiatr Res 1975;12:189–198.
14. Chalder T, Berelowitz G, Pawlikowska T, et al. Development ofa fatigue scale. J Psychosom Res 1993;37:147–153.
15. Chaudhuri KR, Pal S, DiMarco A, et al. The Parkinson’s diseasesleep scale: a new instrument for assessing sleep and nocturnaldisability in Parkinson’s disease. J Neurol Neurosurg Psychiatry2002;73:629–635.
16. McHorney CA, Ware JE, Jr, Raczek AE. The MOS 36-ItemShort-Form Health Survey (SF-36): II. Psychometric and clinicaltests of validity in measuring physical and mental health con-structs. Med Care 1993;31:247–263.
17. Ware JE, Jr, Gandek B, the IQOLA project group. The SF-361
Health Survey: development and use in mental health researchand the IQOLA Project. Int J Mental Health 1994;23:49–73.
TABLE 2. Demographic and clinical factors associated withtotal fatigue in 176 Norwegian PD patients
Variable
Block one Block two Block three
Beta P-value Beta P-value Beta P-value
Age (yr) 0.015 0.36 20.019 0.63 0.006 0.87Gender 1.46 0.049 1.9 0.007 1.41 0.04Disease duration (yr) 0.096 0.157 0.07 0.27UPDRS 0.119 <0.001 0.07 0.02Mental health (SF-36) 20.07 <0.001Sleep disturbance
(PDSS)20.05 0.002
ComorbiditiesCardiovascular 20.92 0.29Diabetes mellitus 21.76 0.048Other 0.31 0.81
Movement Disorders, Vol. 25, No. 14, 2010
2459FATIGUE IN PARKINSON’S PATIENTS

18. Loge JH, Ekeberg O, Kaasa S. Fatigue in the general Norwegianpopulation: normative data and associations. J Psychosom Res1998;45(1 Spec No):53–65.
19. Cohen J. A power primer. Psychol Bull 1992;112:155–159.20. Hagell P, Hoglund A, Reimer J, et al. Measuring fatigue in
Parkinson’s disease: a psychometric study of two brief genericfatigue questionnaires. J Pain Symptom Manage 2006;32:420–432.
21. Lou JS, Kearns G, Oken B, Sexton G, Nutt J. Exacerbated physi-cal fatigue and mental fatigue in Parkinson’s disease. Mov Dis-ord 2001;16:190–196.
22. Tandberg E, Larsen JP, Nessler EG, Riise T, Aarli JA. The epi-demiology of Parkinson’s disease in the county of Rogaland,Norway. Mov Disord 1995;10:541–549.
23. Herlofson K, Larsen JP. Measuring fatigue in patients with Par-kinson’s disease—the Fatigue Severity Scale. Eur J Neurol2002;9:595–600.
24. Havlikova E, van Dijk JP, Rosenberger J, et al. Fatigue in Par-kinson’s disease is not related to excessive sleepiness or qualityof sleep. J Neurol Sci 2008;270:107–113.
25. Okuma Y, Kamei S, Morita A, et al. Fatigue in Japanese patientswith Parkinson’s disease: a study using Parkinson fatigue scale.Mov Disord 2009;24:1977–1983.
26. Lou JS, Kearns G, Benice T, Oken B, Sexton G, Nutt J. Levodopaimproves physical fatigue in Parkinson’s disease: a double-blind, pla-cebo-controlled, crossover study. Mov Disord 2003;18: 1108–1114.
27. Mendonca DA, Menezes K, Jog MS. Methylphenidate improvesfatigue scores in Parkinson disease: a randomized controlled trial.Mov Disord 2007;22:2070–2076.
28. Havlikova E, Rosenberger J, Nagyova I, et al. Clinical and psy-chosocial factors associated with fatigue in patients with Parkin-son’s disease. Parkinsonism Relat Disord 2008;14:187–192.
29. Friedman JH, Chou KL. Sleep and fatigue in Parkinson’s disease.Parkinsonism Relat Disord 2004;10(Suppl 1):S27–S35.
2460 A.G. BEISKE ET AL.
Movement Disorders, Vol. 25, No. 14, 2010