Birmingham Alcohol, Drugs, Gambling and Addiction Research
196
Birmingham Alcohol, Drugs, Gambling and Addiction Research Collaborative Group for the study of Alcohol, Drugs, Gambling & Addiction in Clinical and Community Settings School of Psychology, University of Birmingham & Birmingham & Solihull Mental Health NHS Foundation Trust Birmingham Untreated Heavy Drinkers Project Final Report November 2009 Commissioned by THE DEPARTMENT OF HEALTH Authors: Alison Rolfe, Jim Orford and Oonagh Martin
-
Upload
khangminh22 -
Category
Documents
-
view
0 -
download
0
Transcript of Birmingham Alcohol, Drugs, Gambling and Addiction Research

Birmingham Alcohol, Drugs, Gambling and Addiction
Research
Collaborative Group for the study of Alcohol, Drugs, Gambling & Addiction in Clinical and Community Settings
School of Psychology, University of Birmingham & Birmingham & Solihull Mental Health NHS Foundation Trust
Birmingham Untreated Heavy Drinkers Project
Final Report November 2009
Commissioned by THE DEPARTMENT OF HEALTH
Authors: Alison Rolfe, Jim Orford and Oonagh Martin

The Birmingham Untreated Heavy Drinkers Project
Final Report
Research Team 2008-2009
Professor Jim Orford Head of Project
Dr Alison Rolfe Research Fellow
Oonagh Martin Research Assistant
Julie O’Connell Project Secretary
Steering Committee
Dr Alex Copello
Professor Christine Godfrey
Dr Christine Griffin
Mr Clive Henn
Dr John Kemm
Dr Duncan Raistrick
Ms Alison Tingle
Previous members of the research team
Sue Dalton Research Fellow – Waves 1 to 4
Elizabeth Hartney Research Associate, Wave 1
Wave One interviewers: Maria Ferrins-Brown, Cicely Kerr, Jennifer Maslin
Wave Two interviewers: James Cawley, Maria Ferrins-Brown, Mya Krishnan, Mani Mehdikhani
Wave Three interviewers: Kerry Gutridge, Antonia Rich, Clare Rose
Wave Four interviewers: Catherine Painter, Heather Webb, Nicola Jones-Morris
Wave Five interviewers: Sophie Chappell, Felicity Hughes, Victoria Thursfield
Wave Six interviewers: Brinder Bains, Nicky Knights, Oonagh Martin
Acknowledgements
The researchers would like to thank everyone who has helped and worked on this project over the
past two years. Special thanks go to the participants, without whose contribution and commitment
this study would not have been possible.
Disclaimer
This work is commissioned and funded by the Department of Health. The views expressed in this
publication are those of the authors and not necessarily those of the Department of Health.
2

CONTENTS
EXECUTIVE SUMMARY………………………………………………………….……………..12
Key messages……………………………………………………………………………………....13
Note on terminology………………………………………………………………………………..16
PART ONE: INTRODUCTION …………………………………………………………………...17
1.1 Recruiting the sample………………………………………………………………………….17
1.2 Research methods……………………………………………………………………………...21
1.3 Minimizing attrition……………………………………………………………………………21
1.4 Comparing the final sample with the initial sample…………………………………………...23
PART TWO: CONTINUITY AND CHANGE IN HEAVY DRINKING OVER TIME………….27
2.1 Change in drinking volume over time, by volume groups………………………………...27
2.2 Mean change in drinking volume over time……………………………………………….29
2.3 Change over time at an individual level…………………………………………………...30
2.4 Frequency of heavy drinking………………………………………………………………31
2.5 Dependence on alcohol…………………………………………………………………….33
2.6 Readiness to Change……………………………………………………………………….35
2.7 Drink types………………………………………………………………………………...37
2.8 Knowledge of recommended daily and weekly drinking limits…………………………...41
2.9 Analysis of change over time using advanced statistical techniques……………………...42
PART THREE: HEALTH………………………………………………………………………….48
3.1. Health, drinking and change over time…………………..………………………………...48
3.2. Mortality…………………………………………………………………………………...51
3.3. Use of GP services…………………………………………………………………………52
3.4. Use of other primary care services………………………………………………………...55
3.5. Inpatient admissions……………………………………………………………………….57
3.6. Use of A&E and outpatient services……………………………………………………….60
PART FOUR: RISKY AND HARMFUL BEHAVIOURS………………………………………..64
4.1. Smoking……………………………………………………………………………………64
4.2. Drug use……………………………………………………………………………………65
4.3. Gambling…………………………………………………………………………………..69
4.4. Risky behaviours…………………………………………………………………………..71
4.5. Intoxicated behaviours……………………………………………………………………..73
4.6. Qualitative accounts of violence and abuse………………………………………………..77
3

4.7. Contacts with criminal justice system……………………………………………………..78
PART FIVE: EXPLANATIONS FOR HEAVY DRINKING……………………………………..80
5.1. What do we know about the chronic heavy drinkers? …………………………………….80
5.2 Reasons for heavy drinking: qualitative analysis………………………………………….81
5.2.1 Environmental factors…………………………………………………………….82
5.2.2 Individual / cognitive factors……………………………………………………...83
5.2.3 Social factors……………………………………………………………………...83
5.2.4 Pub and community……………………………………………………………….85
5.3 Case studies of chronic heavy drinkers……………………………………………………88
PART SIX: PATHWAYS TO REDUCING DRINKING…………………………………………92
6.1. Seeking help with a drinking problem……………………………………………………..92
6.2. Receiving treatment………………………………………………………………………..94
6.3. Reasons for reducing to abstinence or low risk drinking………………………………….95
6.4. Life events and change in drinking………………………………………………………...99
6.5. Seeking change with or without professional help……………………………………….102
6.6. Case studies of those who have reduced drinking………………………………………..105
PART SEVEN: STORIES OF CHANGE OVER TIME: A QUALITATIVE APPROACH…….108
PART EIGHT: INTERVIEWS WITH RELATIVES OF PARTICIPANTS……………………..119
CONCLUSIONS………………………………………………………………………………….124
REFERENCES……………………………………………………………………………………127
PUBLICATIONS LIST…………………………………………………………………………...129
APPENDICES
Appendix A: Details of recruitment………………………………………………………………131
Appendix B: Additional tables and figures……………………………………………………….136
Appendix C: Details of interview content and measures used……………………………………186
4

TABLES & FIGURES
Tables
Table 1: Numbers interviewed and retained at each wave…………………………………………22
Table 2: Total number of research interviews attended by those interviewed at wave six………...22
Table 3: Areas of significant difference at Wave One, between those participants interviewed at Wave Six (n=259) and those NOT interviewed at Wave Six (n=241)…………………………..25
Table 4: Change in consumption group, based on unit consumption in the week before interview 1997-2007…………………………………………………………………………………………..29
Table 5: Comparison of LDQ scores from Raistrick et al. (1994) with the BUHD sample………..34
Table 6: Stage of change by unit level consumption groups for the sample in 2007………………37
Table 7. Baseline and linear change on four key drinking variables for each of four clusters of participants based on multilevel mixture modelling…………………………………………….….45
Table 8: Mean SF-36 scores 1997 and 2007 - comparison to general population…………………49
Table 9: Known deaths amongst the BUHD sample……………………………………………….51
Table 10: Frequency (and percentage) reporting whether their GP had recommended treatment and whether they had agreed to go for treatment, amongst those who received a comment about their drinking (2003-2007)……….………………………………………………………………...55
Table 11: Mean number of nights spent in hospital as an inpatient in the year before interview and comparison to the general population (aged 16+) 1997-2007……………………………………...59
Table 12: Reason for hospital inpatient stay (frequency) 2003-2007………………………………59
Table 13: Comparison of sample and general population* (aged 16+) attendance at outpatients and/or A&E departments in the last three months before interview 2001-2007…………………...62
Table 14: Numbers and percentage of sample smoking at least 1 and at least 20 cigars or cigarettes per day and mean number smoked 1997 -2007 (n = 259)……………………………….64
Table 15: Frequency (and percentage) who reported engaging in different numbers of gambling activities in the year before their interview in 2001 and 2007 (n=259)……………………………71
Table 16: Proportion of sample receiving help or advice for a drink problem, and changes in their drinking, 1999-2007…………..………………………………………………………………93
Table 17: Mean unit levels of drinking, by gender, in the week before interview in 2001 and 2003 and LDQ scores in 2001 and 2003 for the self-directed change group and the professional help group…..…………………………………………………………………………………………..104
Table 18: Relationship of participating family members to their heavy drinking relatives………119
Table 19: Coping questionnaire (CQ) scores of close family members of untreated heavy drinkers compared to those of identified problem substance users………………………………………...120
Table 20: The benefits and drawbacks of heavy drinkers’ drinking, according to heavy drinkers and family…………………………………………………………………………………………121
Figures
Figure 1: Bus advertisement ………………………………………………………………………19
Figure 2: Newspaper advertisement……………………………………………………………….19
5

Figure 3: Percentage of participants allocated to drinking volume groups based on units consumed in week before interview – 1997-2007……………………………………………………………..27
Figure 4: Mean unit consumption by gender, 1997-2007………………………………………….28
Figure 5: Units consumed in week before wave six interview (n=259) …………………………...29
Figure 6: Change in weekly units between 1997 and 2007 (n=259) ………………………………30
Figure 7: Mean number of ‘heavy’ drinking days per week by gender 1997-2007………………..31
Figure 8: Mean number of ‘very heavy’ drinking days per week by gender 1997-2007…………..31
Figure 9: Leeds Dependence Questionnaire (LDZ) score 1997-2007 (n=259).................................33
Figure 10: Percentage of sample allocated to the three stages of change groups 1997-2007 (n=259) ………………………………………………………………………………...35
Figure 11: Men’s predominant drink type 1997-2007……………………………………………...37
Figure 12: Women’s predominant drink type 1997-2007………………………………………….38
Figure 13: Predominant type of drink consumed in the week before interview, 2007, heavy drinking men (n=132) ………………………………………………………………………39
Figure 14: Predominant type of drink consumed in the week before interview, heavy drinking women, 2007 (n=55) ……………………………………………………………………………….39
Figure 15: Estimates of DoH recommended daily units for men, 2003-2007……………………..40
Figure 16: Estimates of DoH recommended daily units for women, 2003-2007…………………..41
Figure 17: Baseline units last week plotted against baseline very heavy drinking days last year for four participant clusters (clustering on deviation from general trend) …………………………45
Figure 18: Baseline units last week plotted against change in units for four participant clusters (clustering on deviation from general trend) ………………………………………………………46
Figure 19: Total SF-36 scores by socio-economic group at wave six (n=259) ……………………51
Figure 20: Frequency of contacts with GP 1997-2007……………………………………………..51
Figure 21: Mean number of contacts with GP in the last year. Comparison of BUHD sample with general population, 1999-2007……………………………………………………………………..52
Figure 22: Number of participants receiving a comment about their drinking from their GP in the year before interview 1999-2007 (n=259) …………………………………………………………53
Figure 23: Percentage of sample using different primary care services (n=259) …………………55
Figure 24: Percentage of men and women in contact with a practice nurse in the last year 1997-2007 (n=259) ………………………………………………………………………………………55
Figure 25: Mean contacts with practice nurse: BUHD sample (n=259) compared to general population…………………………………………………………………………………………..55
Figure 26: Mean weekly unit consumption in the year before interview, amongst those that had contact with a practice nurse, by gender (1997-2007) ……………………………………………..56
Figure 27: Percentage attending hospital as an inpatient at least once in year before interview (n=259). Comparison to general population 1997-2007…………………………………………...56
Figure 28: Percentage of sample (n=259) attending hospital as inpatients in the year before interview, by gender (1997-2007) …………………………………………………………………57
Figure 29: Comparison of mean alcohol unit consumption between those that used hospital inpatient services and those that did not 1997-2007………………………………………………..58
6

Figure 30: Percentage of sample that attended A&E at least once in the year before interview 1997-2007 (n=259) ………………………………………………………...………………………60
Figure 31: Percentage of sample attending outpatients at least once in the year before interview 1997-2007 (n=259) ………………………………………………………………………………...61
Figure 32: % of sample using at least one illicit drug in the year before interview, 1997-2007…...64
Figure 33: % of sample using Class B drugs on at least one occasion in the year before interview, 1997-2007 (n=259) ………………………………………………………………………………...65
Figure 34: % of sample using magic mushrooms, ecstasy and LSD on at least one occasion in the year before interview 1997-2007 (n=259) …………………………………………………………66
Figure 35: % of sample using cocaine and opiates on at least one occasion in the year before interview 1997-2007 (n=259) ……………………………………………………………………...66
Figure 36: Percentage of sample spending money on gambling activities in previous interview 2001 and 2007 (n-259) …………………………………………………………………………….69
Figure 37: Percentage of sample engaging in at least one risky behaviour in the year before interview 1997-2007 9n=259) .……………………………………………………………………70
Figure 38: Mean number of times each risk taken amongst those reporting each behaviour after drinking 2003-2007………………………………………………………………………………...71
Figure 39: Mean weekly unit consumption amongst those reporting at least one risky behaviour and those reporting no risky behaviour (n=259) …………………………………………………..72
Figure 40: Percentage of sample engaging in at least one intoxicated behaviour in the year before interview 1997-2007 (n=259) ……………………………………………………………………...73
Figure 41: % of sample engaging in different risky behaviours in the year before interview 1997-2007 (n=259) …………………………………………………………………………...........74
Figure 42: Mean number of intoxicated behaviours amongst those reporting each behaviour 1999-2007…………………………………………………………………………………………75
Figure 43: Mean weekly consumption amongst those reporting at least one intoxicated behaviour and those reporting no intoxicated behaviour (n=259) ……………………………………………76
Figure 44: Numbers of participants appearing in criminal courts in the previous year……………78
Figure 45: Comparison of mean ‘very heavy’ drinking days in the last year between ‘help-seekers’ and others, 1999-2007………………………………………………………………92
Figure 46: Numbers accessing different treatment types for help with a drink problem 99-07……93
Appendix A
Table A1: Proportions of men and women by age group, employment status and ethnic group…136
Table A2: Proportions of participants recruited by each strategy type…………………………...137
Figure A1: Geographical distribution of participants by postal code district……………………134
Table A3: Demographic characteristics of participants recruited at Wave One…………………135
Appendix B
Table B1: Unit consumption for the seven days prior to interview 1997-2007…………………136
7

Table B2: Frequency (percentage) of participants allocated to drinking volume groups, based on units consumed in week before interview 1997-2007………………………………….137
Table B3: Number of days drinking alcohol at or above 7 units for women and 10 units for men in previous 7 days 1997-2007………………………………………………………………..138
Table B4: Number of days drinking alcohol at or above 14 units for women and 20 units for men in previous 7 days 1997-2007………………………………………………………………..139
Table B5: Number of days drinking alcohol at or above 7 units for women and 10 units for men in previous year 1997-2007………………………………………………………………….139
Table B6: Number of days drinking alcohol at or above 14 units for women and 20 units for men in previous year 1997-2007………………………………………………………………….140
Table B7: Frequency (and percentage) of ‘heavy’ and ‘very heavy’ drinking days in week prior to interview 1997-2007 (n = 259) …………………………………………………………..141
Table B8: Frequency (and percentage) of ‘heavy’ and ‘very heavy’ drinking days in year prior to interview 1997-2007 (n = 259) …………………………………………………………..142
Table B9: Leeds Dependence Questionnaire Scores 1997-2007………………………………….143
Table B10: Leeds Dependency Questionnaire – sub-group comparisons 2007 (n = 259)………..144
Table B11: Sample allocation to readiness to change stage 1997-2007………………………..…145
Table B12: Readiness to Change - sub-group comparisons 2007 (n = 233)……………………...146
Table B13: Strength of alcoholic drink predominantly consumed…………………………….…147
Table B14: Mean number of cigars or cigarettes smoked amongst sample – sub-group comparisons 2007 (n = 259) …………………………………………………………………...…148
Table B15: Frequency and percentage - relationship status at interview 1997 – 2007 (n = 259). …………………………………………………………………………...149
Table B16: Mean unit consumption in the week before interview by relationship status 1997 – 2007 (n = 259) ……………………………………………………………………..150
Table B17: Total number of other people living in participants’ household 1997 – 2007 (n = 259) ……………………………………………………………………………151
Table B18: Number of other adults and children living in participants’ household 1999 – 2007 (n = 259) …………………………………………………………………………....152
Table B19: Household types……………………………………………………………………....153
Table B20: Frequencies and percentages of participants living with and without children………154
Table B21: Type of accommodation……………………………………………………………...154
Table B22: Type of housing………………………………………………………………………155
8

Table B23: Number of bedrooms in accommodation…………………………………………….155
Table B24: Sample SF-36 factor mean scores, 1997 – 2007 by age in 1997 (general health and function) and general population means* ……………………………………………………156
Table B25: Sample SF-36 factor mean scores, 1997 - 2007 by age in 1997 (roles, pain and energy) and general population means*…………………………………………157
Table B26: SF-36 Total scores – sub-group comparisons 2007 (n = 259)………………………..158
Table B27: Total mean SF-36 scores by age group in 1997. Waves one to six…………………..159
Table B28: Frequency (and percentage) of time spent talking about drinking with GP, amongst those that discussed the subject (2003-2007) …………………………………………...160
Table B29: Frequency (and percentage) reporting different depths of discussion about their weekly consumption with their GP, amongst those that discussed the subject (2003-2007)..160
Table B30: Numbers seeking help to address their drinking and mean number of times services accessed by help seekers 1999 - 2007……………………………………………………………161
Table B31: Number of waves at which services had been accessed in the previous two years, amongst those participants who had accessed services (n=33) …………………………………162
Table B32: Frequency (and percentage) of sample using different numbers of drugs in the year before interview 1997-2007 (n=259) ……………………………………………………………162
Table B33: Percentage of drug use for the sample (n = 259) in waves two to six, compared to the general population in 2006/2007………………………………………………………………….163
Table B34: Frequency and percentage of sample reporting intoxicated behaviours on at least one occasion in the year before interview by gender 1997-2007 (n=259) ……………………………164
TableB35: Frequency and percentage of sample engaging in different numbers of intoxicated behaviour types on at least one occasion in the year before interview 1997-2007 (n=259)……...165
Table B36: Frequency, range and mean number of times behaviour reported amongst those reporting intoxicated behaviours in the year before interview 1999-2007………………………166
Table B37: Mean number of times intoxicated behaviour reported amongst sample in the year before interview 1999-2007………………………………………………………………………167
Table B38: Mean weekly unit consumption amongst those reporting at least one intoxicated behaviour and those reporting no intoxicated behaviour (n = 259) ………………………………168
Table B39: Frequency (and percentage within variable group) who have engaged in different intoxicated behaviours in the last year – sub-group comparisons 2007 (n = 259) ………………169
Table B40: Mean unit consumption of perpetrators and victims of violence/aggression and those that did not mention this issue in their final interview 1997-2007………………………………..170
Table B41: Mean ‘heavy’ drinking days of perpetrators and victims of violence/aggression and those that did not mention this issue in their final interview 1997-2007…………………………170
9
Table B42: Mean ‘very heavy’ drinking days of perpetrators and victims of violence/aggression and those that did not mention this issue in their final interview 1997-2007……………………171
Table B43: Frequency (and percentage) of sample that have appeared in court in the year before interview and reasons for court appearance 1997-2007 (n=259) and mean weekly unit consumption amongst those that appeared in court………………………………………………172
Table B44: Frequency of sample in contact with the probation service and frequency that have appeared in court on at least one occasion in the year before interview 1997-2007 (n=259)……………………………………………………………………………………………173
Table B45: Frequency of men and women who reported being a victim of different crimes in the year before interview 1997-2007 (n=259) ………………………………………………………174
Table B46: Mean number of contacts with a GP at the surgery and at home. Comparison of sample (n=259) to general population, 1999-2007………………………………………………………175
Table B47: Total number of GP contacts, at the surgery, at home and for pregnancy or contraception 1999-2007 (n=259) ………………………………………………………………176
Table B48: Frequency (and percentage) of contacts with GP at the surgery in the year before interview waves two to six (n=259) ……………………………………………………………176
Table B49: Frequency (and percentage) of comment type from the GP in the year before interview waves two to six (n=259) ……………………………………………………………177
Table B50: Frequency (and percentage) of different reasons for last contact with GP when drinking was discussed. Waves 3 to 6 (n=259) …………………………………………………178
Table B51: Frequency (amongst those that discussed drinking with their GP) that reported attending for different bodily system problems 2003-2007………………………………………179
Table B52: Frequency (and percentage) of sample that accessed inpatient, A&E and outpatient services in the year before interview 1997-2007 (n=259) ……………………………………..…180
Table B53: Mean unit consumption comparison between those that used inpatient, A&E and outpatient services and those that did not 1997-2007…………………………………………..…180
Table B54: Frequency (and percentage) of sample that accessed inpatient, A&E and outpatient services in the year before interview 1997-2007, age comparison (n=259)………………………181
Table B55: Frequency (and percentage) of sample that accessed A&E and/or outpatient services in the twelve months before interview and mean number of contacts 1997-2007 (n=259)………………… ……………………………………………………………………...…181
Table B56: Frequency (and percentage) of contacts with primary care services 1997-2007 (n=259) …………………………………………………………………………………………...182
Table B57: Mean number of contacts with a practice nurse amongst the whole BUHD sample and amongst those that reported at least one contact (n=259) 1999-2007, comparison to general population figures…………………………………………………………………………………183
10

Table B58: Mean number of contacts with other primary care services amongst those that reported at least one contact 1999-2007…………………………………………………………183
Table B59: Mean weekly unit consumption amongst those that reported at least one contact with each primary care service 1999-2007………………………………………………………184
Table B60: Frequency (and percentage) of estimates of recommended sensible drinking levels by gender 2003-2007 (n=259) ……………………………………………………………185
Appendix C
Table C1: Areas covered in each interview…………………………………………………….…187
11

EXECUTIVE SUMMARY The Birmingham Untreated Heavy Drinkers (BUHD) research project set out in 1997 to explore the
natural history of untreated heavy drinking over a ten-year period. Heavy drinking is known to
increase the risk of adverse consequences to health, work, family and social relationships,
particularly if maintained over a long period (Royal College of Physicians, 2001). ‘Heavy’
drinking, in this report, refers to men drinking at least 50 units per week, and women drinking at
least 35 units a week. This definition, used throughout this report, is based on levels considered
potentially harmful by the Royal College of Psychiatrists (1979). In 1996, 6% of males and 2% of
females were consuming alcohol above these weekly levels (ONS, 2001). Over the last decade,
survey data suggest that these levels have risen to 8% of males and 5% of females (ONS, 2008).
Most of these people will never come into contact with alcohol treatment services and previous
research suggests that up to three quarters of those who recover from an alcohol use disorder1 do so
without treatment (Watson and Sher, 1998).
A limited number of longitudinal studies of untreated heavy drinkers has been conducted. Many
follow-up studies of heavy drinkers compare clinical samples, looking at treatment outcomes (see
Finney and Moos, 1991, 1992). Whilst these studies are clearly very useful in terms of clinical
effectiveness, results from studies of treated populations cannot be generalized to untreated
individuals who make up the majority of heavy drinkers (Vaillant and Milofsky, 1984; Fein and
Landman, 2005). It is also unusual for longitudinal studies of alcohol consumption to examine
stability and change in alcohol consumption over more than one or two years, and at more than two
measurement points (Kerr et al., 2002; McAweeney et al., 2005). Much of the variation that may
occur over time is thereby missed. The BUHD project provides a rare opportunity to follow the
levels and patterns of drinking of heavy drinkers over time, and to chart the extent of both ‘natural
recovery’ from heavy drinking and entry into treatment.
Five hundred participants, aged 25-54, three quarters men, one quarter women, were originally
recruited to the BUHD study in 1997 from the West Midlands community. As many as possible of
the sample was interviewed at two-yearly intervals for the following decade. At the final interview
in 2007, 259 participants out of the original sample of 500 were re-interviewed, 229 of whom had
been interviewed on all six occasions. Interviews used mixed quantitative and qualitative methods,
in order to both examine levels and patterns of drinking, and also what participants said about their
drinking and their lives.
1 The term ‘alcohol use disorders’ is a broad term used by Watson and Sher to refer to ‘a range of problematic drinking statuses that have been studied by researchers of natural recovery’.
12

The BUHD sample differs from the samples of many large studies in that the majority of
participants in the present study are high volume drinkers, with a large number of days of heavy
drinking, but with relatively low levels of alcohol dependence. As such, the participants in this
study are not predominantly the group of heavily dependent drinkers who present to services.
Instead, they are a heterogeneous and largely hidden group of heavy drinkers, drinking at a level
that impacts upon their health, and using hospital services much more than the general population,
but who are potentially amenable to treatment and change.
KEY MESSAGES
1. The BUHD study is based on a heterogeneous sample of heavy drinkers - The study
set out to recruit heavy drinkers from the community, and sampling aimed to include
people from all walks of life. As a result, this is a very heterogeneous group, in terms of
drinking, but also on a range of social indicators. The sample includes a sub-group of
professional people who are mainly wine drinkers, a subgroup of socially excluded very
heavy drinkers, and another subgroup of socially stable longstanding regular steady
drinkers.
2. The BUHD study is unusual in being based on a non-clinical sample of chronic heavy
drinkers with relatively low levels of alcohol dependence - This is a sample
predominantly of chronic heavy drinkers, who drink heavily on a regular basis (rather than
being more intermittent ‘binge drinkers’). At the same time, however, sample members
have, on average, low dependence scores. Most believe they are not particularly dependent,
are in control of their drinking, and often that they are average drinkers for their group. On
the whole, therefore, the sample consists of people who are rather different in their
drinking compared to clinical groups.
3. The course of heavy drinking is highly varied. Whilst the average level of
consumption has declined, the sample includes those who made significant reductions,
and a significant minority who continued to drink heavily throughout the ten year
study - Some are able to make reductions to light drinking or abstinence which is
maintained over several years. Others fluctuate or make some reductions. However, 44%
of the sample were still drinking at harmful levels at the ten year mark. Furthermore, over a
quarter of the sample were drinking heavily at every interview. These chronic heavy
drinkers had higher levels of alcohol dependence and were heavier smokers than other
sample members. They were also much more likely to drink alone and at home.
13

4. There is evidence of a consistent link between heavy drinking and poorer health - The
sample has been shown to have consistently poorer health, compared to the general
population. They have also been shown to have consistently high levels of tobacco
smoking and drug taking (although, like drinking, both have declined). There is also some
evidence of relatively high rates of gambling, and of less healthy lifestyles than the general
population.
5. There is evidence of a range of harms to self and others relating to heavy drinking -
The BUHD study supports previous research evidence indicating some of the harms
commonly associated with continued heavy drinking, including: fights and aggression,
drinking and driving, and other risks to self and others.
6. Heavy drinkers use hospital services at a consistently higher rate than the general
population - The sample has been consistently found to use hospital services (A&E,
inpatients and outpatients) at a rate around twice that of the general population. A&E
attendance was associated with heavier levels of alcohol consumption, and there is some
evidence of a link between involvement in fights and arguments, and A&E attendance.
7. Heavy drinkers infrequently discuss their drinking with their GP and other health
professionals - Sample members visited their GPs at a similar rate to the average for the
population. Most contacts with health professionals appear not to have involved a
discussion about drinking, and GPs were only likely to suggest referral to treatment
services for the very heavy drinkers in the sample. Members of the sample are sometimes
reluctant to talk about drinking, and are also often resist to health education messages
about drinking.
8. Few heavy drinkers receive professional help for their drinking - Between 8–10% of
the sample had sought help for their drinking at some point over the decade. Those who
sought help tended to drink heavily more frequently than other sample members. Thirty-
four members of the sample went on to receive treatment for alcohol-related problems
over the ten-year period. The most common form of treatment was through a non-
residential alcohol agency. Those who sought and received treatment tended to be amongst
the younger sample members and to be amongst the heaviest drinkers. However, most of
the reductions in drinking in the sample occurred without apparent professional assistance,
and are mostly attributed to life events and circumstances, including adverse health events.
9. Heavy drinking is socially embedded - Although motives for drinking and perceived
benefits of their drinking were varied, most considered their drinking to be well embedded
14

within family and social settings and other activities which are in general approving or
accepting of relatively heavy drinking. The pub constituted for many participants a very
significant setting in their lives, and provided, for many, a real feeling of community.
Those who reduced without professional help used a range of strategies, but many of these
involved collaboration with friends and family.
10. Most heavy drinkers recognise the desirability of reducing their drinking - From the
beginning, the majority of the BUHD sample were contemplating change in their drinking
(based on the ‘Readiness to Change’ measure). This suggests that are aware of the
desirability of modifying their drinking in some way. At the end of the study, more
participants were taking action to change their drinking than at the start. This was
particularly true of those participants who were in the 45-54 age group at the start of the
study, who were in a relationship, and in professional occupations. Most say that they do
make some efforts at harm minimisation, for example by reducing quantity of
consumption, even though this might fall well short of a reduction to ‘sensible’ drinking.
Knowledge of alcohol units appears to have improved over the ten years of the study.
Overall, the messages from the study are (i) the need for awareness raising and training amongst
health professionals about the need to routinely discuss alcohol use and on the use of brief
interventions, and (ii) the need to expand services and self-help programmes for people who are
drinking at hazardous or harmful levels, but who do not consider themselves to be ‘alcoholic’ or in
need of formal professional help. Such provision should consider cutting down on drinking not
only an issue for the individual, but also for the social network in which the individual lives and
drinks.
15

Note on terminology
The following terms are used throughout the report:
1. ‘Heavy drinkers’ – In order to be included in the research study as a ‘heavy drinker’,
participants had to be drinking at least 50 units per week (men) and at least 35 units per
week (women), and to have done so for at least half the weeks in the previous year. This
also equates to ‘harmful drinking’ (see point 4 below).
2. The term ‘drinking within sensible limits’ is used to refer to men drinking up to 21 units
per week, and women drinking up to 14 units per week.
3. The term ‘hazardous drinking’ is used to refer to men drinking 21-49 units per week, and
women drinking 14-34 units per week.
4. The term ‘harmful drinking’ is used to refer to men drinking 50-99 units per week, and
women drinking 35-69 units per week.
5. The term ‘very harmful drinking’ is used to refer to men drinking at least 100 units per
week, and women drinking at least 70 units per week.
6. ‘Heavy drinking days’ = men drinking at least 10 units in one day; women drinking at
least 7 units in one day.
7. ‘Very heavy drinking days’ = men drinking at least 20 units in one day: women drinking
at least 14 units in one day.
16

PART ONE - INTRODUCTION
This final report from the BUHD project describes some of the main changes over time in
participants’ drinking. Accounting for change over time is a complex task, because there is
considerable individual variation both in how people were drinking at the start of the study, and in
how this has changed over this ten-year period. In order to try to cover diverse lives and drinking
trajectories, this study has adopted a mixed methods approach, and this is reflected in this report,
which draws both on statistical analysis, and on what participants say about their lives and their
drinking (using qualitative analysis).
The report begins with a description of how the sample was recruited and retained over time. Part 2
covers some of the main trends and patterns in drinking, using quantitative data to describe change
in drinking volume and frequency over time. This section of the report also describes a range of
other drinking related measures, including dependence, readiness to change, drinking types, and
participants’ knowledge of recommended daily and weekly drinking limits. Parts 3 and 4 focus on
health, risk, and harmful behaviours. Part 3 describes changes in health and use of health services
over time, whilst Part 4 focuses on risky behaviours and potentially harmful behaviours (including
smoking, drug use, aggressive behaviours, and contact with the criminal justice system). In Parts 5
to 8 a slightly different approach is adopted. Here, a mixture of quantitative and qualitative data is
used to explore key reasons for heavy drinking (Part 5), pathways to reducing drinking (Part 6), the
types of narratives told by participants of the last ten years (Part 7), and the views of relatives of
heavy drinkers. Case studies are also interspersed through the report, in order to illustrate some of
the key points. Where case studies are used, names and some details have been changed, in order to
protect the anonymity of participants.
1.1. Recruiting the sample
At the start of the study, the research team set out to recruit 500 people from the West Midlands
region to the study. Recruitment took place throughout 1996 and 1997. In order to take part,
participants had to be:
• Aged between 25 and 55
• Drinking at least 35 units per week if female and 50 units per week if male, for at least 27
weeks in the previous year
• Untreated for their drinking in the past ten years2.
2Treatment was defined as an alcohol-specific or psychosocial intervention, carried out in the last ten years, which in the client’s view was carried out by a qualified professional within a formal setting, or self help group, aimed specifically at reducing the client’s alcohol consumption long-term. (Hartney et al., 1997).
17

In addition, all participants either lived or worked in the West Midlands region of England
(population 2,556,5923). The majority lived in the City of Birmingham, the second largest city in
the UK, with a population of just under 1 million.
During the recruitment and initial interviewing phase, the composition of the growing sample was
monitored and compared against pre-set targets, established in order to try to ensure the sample was
representative of the West Midlands community, as far as possible. Participants were selected to
ensure a range in terms of age, social class and ethnicity. In recognition of the greater number of
heavy drinking males in the population, the original research proposal set a desired ratio of 3:1
males to females for the composition of the sample.
A range of recruitment strategies was employed in the piloting process, (see Orford et al,,1998).
These strategies were subsequently continued if successful, with the addition of other strategies, in
order to reach a varied sample of untreated heavy drinkers. The most successful methods of
recruitment were ‘snowballing’ (word of mouth) and bus advertisements, which were both
effective in attracting otherwise under-represented groups: females; individuals from minority
ethnic groups; and people from professional, managerial and technical socio-economic groups. The
increasing ‘snowball’ effect was attributed to interviewed participants telling their friends and
rising awareness of the study within communities. Bus advertisements reached large numbers from
all parts of the community. Despite the substantial financial outlay, this was an extremely cost
effective recruitment method. Newspaper advertisements were effective in recruiting participants in
terms of time, but less cost effective than bus advertising. The most effective newspaper
advertisements were colour, full back page advertisements, with ‘Drink like a fish’ graphics, used
on television guides and supplements, (see Figure 1, and Orford et al., 1998). Other methods such
as mail shots, leaflets/postcards, posters and shop advertisements were more time intensive, but
useful in attracting participants from different areas, ensuring a diverse geographical spread (see
Figure A1, Appendix A).
Recruitment efforts employed over the final few months of the process were directed towards
attracting volunteers from minority ethnic groups. Translation of recruitment material into Asian
languages, targeting areas known to be more highly populated by Asian residents and the setting up
of a recruitment stall at an Indian celebratory event did not prove to be fruitful and direct
networking with Asian community groups was found to be more effective. Despite efforts to recruit
a representative number of Asian participants, the pre-set target was not achieved. However, a
3 Office for Population Censuses and Surveys 2001Census figures
18

variety of minority ethnic groups were represented in the study and the overall proportion of non-
white participants was 9%, slightly lower than the pre-set target of 11%.
Over 1000 people volunteered to take part in the study and were screened to ensure they fulfilled
the three inclusion criteria. 800 individuals were deemed suitable and were booked to attend an
interview. After excluding those that failed to attend interviews or failed to meet the criteria for
inclusion at the time of the first interview, a sample of 500 remained and successfully completed
the first interview.
19

Figure 1: Bus advertisement Figure 2: Newspaper advertisement
20

1.2. Research methods
Interviews were carried out at two-year intervals, in 1997, 1999, 2001, 2003, 2005 and 2007.
Interviews comprised, in approximately equal proportions, structured sections of forced choice
questions, paper and pencil exercises, and qualitative focused interview sections4. Structured
sections of the interview were conducted using a computer-assisted method. Each interview took
around 2 hours, and was conducted at a venue convenient for the participant. Most interviews took
place at the university, with a minority taking place in participants’ homes or in other locations5.
Only minor changes were made to the interview format between each interview ‘wave’, to enable
comparison over time. Ethical approval was given by the Ethical Committee of the School of
Psychology at the University of Birmingham, and informed consent was sought and received from
all participants prior to each interview.
1.3 Minimising attrition
One of the key challenges in conducting a longitudinal study is to keep in touch with participants
over time and to continue to engage them in the study. Over the ten year study period, strenuous
efforts were made to re-interview as many of the original sample of 500 participants as possible.
Every two years, all participants were contacted, other than those who had formally withdrawn,
been excluded or were known to have died. Various practices were employed in an attempt to both
minimise attrition and relocate those who were lost to earlier follow-up interviews. These included:
• Use of a ‘warm-up’ letter in the year prior to interview
• Stressing, at interview, the importance and value of the participant’s contribution
• Having one person with primary responsibility for contacting participants, to ensure a good
ongoing rapport
• Flexibility in interviewing - conducting interviews in a place and at a time convenient to the
participant
• Re-imbursement of expenses for time and travel
• Obtaining alternative ‘contact’ names and addresses at interview along with permission to ask
the contact for the participant’s whereabouts, and using these if the research team was unable to
locate the person at the last known address
• Use of a range of contact methods and repeated attempts to make contact. This included phone
contact attempts at different times of the day, evening and weekend, contact by letter and
contact by letter sent to a designated contact person.
• Considerable efforts were made in 1996-1997 to relocate these ‘lost’ participants, through
using the national electronic version of the electoral register to find participants who had 4 Details of interview content can be found in Appendix B. 5 A small minority of interviews took place in other locations such as cafes or workplaces, at the participant’s request.
21

moved address. These participants (around 30 individuals) were then contacted by post, asking
them if they would like to re-join the study. This work resulted in one sole interview with an
individual who had not been interviewed since 1997.
Over the course of the study, 41 participants formally withdrew from the research, 5 were excluded
and 18 were discovered to have died. At wave six interview, 259 participants were re-interviewed,
representing 52% of the original sample of 500 (see Table 1 below). The remaining 177
participants were either living abroad or could not be contacted, and were considered ‘lost’ to the
research team.
Table 1: Numbers interviewed and retained at each wave
Wave of study
Numbers interviewed
Percentage of original
sample re-interviewed
Percentage of previous
wave re-interviewed
Wave 1 500 100% n/a
Wave 2 403 81% 81%
Wave 3 350 70% 87%
Wave 4 321 64% 92%
Wave 5 280 56% 87%
Wave 6 259 52% 92.5%
Of the 259 participants interviewed at wave six, 229 had been interviewed at all six waves of the
research study. The other 30 participants had been interviewed between two and five times over the
decade, (see Table 2 below).
Table 2: Total number of research interviews attended by those interviewed at wave six
No. of interviews attended, 1997-2007
No. of participants
Six interviews 229
Five interviews 17
Four interviews 10
Three interviews 2
Two interviews 1
22

1.4 Comparing the final sample with the initial sample
In the present study, there were 241 people who took part but were not present at the final
interview, and 259 who did complete the study. One important question in any longitudinal study is
whether those who do not complete the study differ in important ways from those who are still
participating at the end. If there are big differences between these two groups, it could be argued
that those who completed the study were not representative of the original sample. For example, it
is likely that those living the most chaotic lives, who may be homeless or involved in crime, would
be less traceable over a ten-year period.
Furthermore, amongst those who have not completed the study are participants who have died over
the course of the decade. Eighteen participants (15 men and 3 women) are known to have died
since 1997. Further details of those known to have died are given in Section 3, below. The exact
mortality rate for the sample is, however, uncertain, since some participants have become
untraceable. The UK Death Index has been used in order to try to trace deaths and to ascertain the
cause of deaths. This has enabled the team to ascertain the official cause of death but has not led to
any further deaths being confirmed.
Comparative analysis was carried out to investigate whether the final sample (n=259) differed from
the group of participants who did not complete the study (n=241). This analysis was conducted
using data gathered at the first interview on a range of variables. The results of this analysis
revealed some areas where the retained sample and the ‘lost’ sample were very similar, but other
areas where they differed significantly from each other.
There was no significant difference between the two groups on a number of demographic
variables6, including the following: age, gender, ethnicity, employment status, educational level
and marital status. Furthermore, there were no significant differences between the two groups on
some variables related to health, health-related behaviours, risky behaviours and drinking,
including: health (measured by the SF-36), cannabis use, age at which they started drinking;
alcohol dependence (as measured by the Leeds Dependence Questionnaire), number of days heavy
drinking in the week prior to interview (defined as days drinking over 10 units for men, and over 7
units for women), frequency of risky behaviours after drinking, driving whilst intoxicated, and
aggressive behaviour after drinking.
6 As measured at the Wave One interview.
23

There were, however, significant differences between the two groups on a number of variables.
First, a higher than expected proportion of the retained sample were in managerial/technical and
skilled non-manual occupations7, whilst those ‘lost’ from the sample contained higher than
expected numbers of people in professional occupations and in all grades of manual occupations
(skilled, semi-skilled and unskilled) [χ²(5, 491) = 11.1, P< 0.05]. However, the retained sample also
differed significantly from those who were ‘lost’ along the way on a number of variables associated
with heavy drinking, use of other substances, and frequency of accidents and intoxicated
behaviours. More specifically, compared to those ‘lost’ from the study, the final sample consumed
less alcohol (in units in the previous week) at the first interview, and also had fewer days drinking
very heavily (20+ units for men, and 14+ units for women) in the week before the first interview.
However, and perhaps rather surprisingly, they were significantly less likely to be categorised as in
the ‘action’ stage of ‘Readiness to Change’ their drinking. They were also less heavy smokers at
the first interview, and were less likely to have used Class A drugs during the previous year. The
final sample of 259 were also, in 1997, less likely than those who later ‘lost’ to the study to have
appeared in court in the last year, to have been in a fight or ejected from a licensed premises whilst
intoxicated, or to have engaged in aggressive behaviour or to have had an argument with someone
bigger than themselves, after drinking. They were also less likely than the ‘lost’ participants to
have attended an Accident & Emergency department in the previous year (see Table 3 for details).
Thus, it would appear that those who were ‘lost’ to the study over time tended to be heavier
drinkers, and to be, on average, more likely to use some other substances (including tobacco and
Class A drugs), more likely to get into fights and arguments, to have accidents, and to appear in
court. In reading this report, therefore, it is important to consider the impact this may have upon the
findings. In particular, it is possible that some of the more optimistic findings from the study may
reflect the fact that very heavy drinkers, whose drinking is particularly associated with social
harms, were more likely to be lost from the research project over time. However, it is extremely
challenging to retain some very heavy drinkers with less stable lives in a longitudinal study, despite
the use of multiple strategies to retain and relocate these individuals. Furthermore, whilst this
attrition bias needs to be kept in mind when considering these findings, this does not invalidate the
findings of the study, since the sample still contains a large number of heavy drinkers and some
very heavy drinkers, and it has been possible to record continuity and change in the behaviour of
these 259 individuals over the course of a decade in their lives.
7 Based on 1997 occupational status
24

Table 3: Areas of significant difference at Wave One, between those participants interviewed at Wave Six (n=259) and those NOT interviewed at Wave Six (n=241)
Variables Mean (SD) at W1 for participants interviewed at W6
Mean (SD) at W1 for participants NOT interviewed at W6
Test statistic Level of significance
Units of alcohol consumed in week prior to interview
79.9 (49.0) 90.4 (59.0) T(467.8)=2.13 P=0.033
Number of days very heavy drinking in the previous week (20+ units for men / 14+ units for women)
1.43 (1.69) 1.79 (2.0) T(463.8)=2.11 P=0.035
Frequency of A&E visits in the last year
0.23 (0.42) 0.32 (0.47) T(482.8)=2.3 P=0.022
Number of cigarettes smoked in an average week
11.9 (12.1) 16.8 (13.4) T(372)=3.64 P<0.0005
Frequency of use of Class A drugs in the last year
0.69 1.07 T(497)=2.45 P=0.015
Readiness to Change 1.80 (0.59) 1.94 (0.64) T(497)=2.50 P=0.013
Number of court appearances in the last year
0.08 (0.28) 0.14 (0.35) T(457.3)=1.99 P=0.047
Number of times got into arguments with people bigger than oneself, after drinking
0.57 (0.84) 0.80 (0.92) T(480)=2.97 P=0.003
Number of ‘intoxicated behaviours’ in the last year8
1.61 (1.43) 1.93 (1.57) T (496)=2.34) P=0.02
Number of fights in last year
0.23 (0.42) 0.34 (0.47) T(479.3)=2.72 P=0.007
Number of times ejected from a licensed premises in last year
0.14 (0.35) 0.21 (0.40) T(468.9)=2.06 P=0.04
Frequency of contacts with DSS in last year
0.27 (0.45) 0.38 (0.48) T(486.3)=2.47 P=0.014
8
25

PART ONE SUMMARY
• The Birmingham Untreated Heavy Drinkers research project ran from 1997-2007
• 500 participants were recruited at the start of the study from the West Midlands community
• Efforts were made to ensure that the original sample was representative of the population of the West Midlands on a range of demographic features
• As many as possible of the sample was interviewed at two-yearly intervals
• Interviews lasted around two hours and used a mixture of quantitative and qualitative methods
• At the final interview, 259 participants out of the original sample of 500 were re-interviewed
• The final sample of 259 was significantly different from those who did not complete the study on a number of measures. These included being less likely to be very heavy drinkers, to use Class A drugs, to have accidents and fights, and to have appeared in court over the past year. They were also more likely to be in managerial, technical and skilled non-manual occupations. Nonetheless, it is still considered very valuable to examine continuity and change over time for the sample of 259 individuals who were followed for a decade in their lives.
26

PART TWO: CONTINUITY AND CHANGE IN HEAVY DRINKING OVER TIME
One of the central questions for this study is, ‘what happens to the alcohol consumption of heavy
drinkers over time?’, and this question is the focus for this section. There are a number of different
ways of measuring continuity and change in heavy drinking. The main ones used in this study are
drinking volume and frequency of heavy drinking days.
Drinking volume is based on alcohol consumption in the week before interview, measured using
the Time Line Follow Back procedure (Sobell and Sobell, 1992)9. Frequency of heavy drinking
was based on two main measures10:
• Number of days drinking 7 or more units (women) and 10 or more units (men) during the last
week – this is labelled as ‘heavy’ drinking days last week
• Number of days drinking 14 or more units (women) and 20 or more units (men) in the last
week – this is labelled as ‘very heavy’ drinking days last week
On all of these measures, the sample has shown a mean decrease in heavy drinking over time.
2.1 Change in drinking volume over time, by volume groups
Over the course of the study, there was an increase in the number of participants who were
abstinent or drinking at ‘sensible’ levels, and a decrease in numbers drinking at hazardous, harmful
or very harmful levels11.
Of those who completed the study (n=259) just 1% had been abstinent in the week before their first
interview12. With the exception of a small decrease at wave five, numbers reporting abstinence in
the week before each interview rose consistently over the ten year study period to 11% (28
participants) in 2007 (see figure 3 below and Table B3, Appendix B).
9 See Appendix B for details of this measure 10 Data were also collected on the number of days of ‘heavy drinking’ and of ‘very heavy drinking’ in the past year. Analysis revealed very similar findings to those reported for the measure of heavy and very heavy drinking days in the past week, so only one set of results is reported here: that for days of heavy and very heavy drinking in the past week. 11 This analysis is based on the following drinking groups: Abstinent = 0 units; ‘Sensible’ drinking = 1-21 units (men) & 1-14 units (women); Hazardous drinking = 22-49 units (men) & 15-34 units (women); Heavy drinking = 50-99 units (men) & 35-69 units (women); Very heavy drinking = 100+ units (men) & 70+ units (women). 12 As the project inclusion criteria specified heavy drinking for at least 27 weeks of the year prior to the first interview, one can assume that for the majority of time, participants drinking would have been heavy/very heavy in 1997, but they also reported weeks of abstinence or sensible/hazardous drinking too.
27

Figure 3: Percentage of participants allocated to drinking volume groups based on units consumed in week before interview 1997-
2007
1520253035404550556065
Perc
enta
ge
10
AbstinentSensibleHazardousHarmfulV
05
1997 1999 2001 2003 2005 2007
Wave of study
ery harmful
w the threshold for harmful drinking. There
se over the course of the study in the numbers of participants drinking at
harmful or very harmful levels. Those in the harmful drinking category decreased by 26%, whilst
those in the ‘very harmful’ category decreased by 15%. However, across all waves of the study, the
‘harm of
participants were drinking at levels con ery harmful’.
Based on units consu nterv l cipants decreased
their drinking at each wave of the study (see Table 4 below). Of these, six reduced to abstinence
and this had been st a year. Two individuals reported abstinence in the week
before the intervie the study. One of thes ustained ence throughout and
the other fluctuate eriods of abstinence and infrequent but very heavy binges
that lasted for da the samp orted drinking at a potentially
harmful level (heav king), at every wave of the study and two thirds moved in
and out of the diff ver time.
The percentage of participants falling within the range of both the ‘sensible’ and ‘hazardous’
groups (in the week before interview), rose by 16% across the duration of the study. Thus, there
se over time in participants drinking belowas an increa
was a concomitant decrea
ful drinking’ group remained the largest consumption group. At the final interview, 44%
sidered ‘harmful’ or ‘v
med in the week prior to each i iew, a tota of nine parti
sustained for at lea
w at every wave of e s abstin
d between very long p
ys or weeks. Over a quarter of le rep
y or very heavy drin
erent drinking categories o
28

Table 4: Change in consumption group, based on unit consumption in the week before interview 1997-2007
Change in consumption group
Number
(n = 259)
Percentage
Abstinent throughout 2 1 %
Sensible throughout 0 0 %
Hazardous throughout 3 1 %
Harmful / very harmful throughout 71 27 %
Decrease at each wave 9 4 %
Increase at each wave 0 0 %
Fluctuating between groups 174 67 %
2.2
Turning now be seen to
men and women’s
drinking (see 88.5
n, consumption
eclined from 59.0 (SD = 42.1) to 36.3 (SD = 38.9) (see Figure 4 below).
Mean change in drinking volume over time
to focus on mean levels of drinking for the sample, unit consumption can
have decreased at each wave of the study, and this decline was evident in both
Table B1 Appendix B). For men, mean weekly unit consumption declined from
units per week (SD = 49.2) in 1997 down to 56.1 (SD = 53.5) in 2007. For wome
d
Figure 4: Mean unit consumption by gender 1997-2007
0102030405060708090
100
Mea
n u
nit c
ons
um
ptio
n
MenWomen
1997
1999
2001
2003
2005
2007
Wave of study
29

Further analysis13 was carried out to explore whether these changes over time were statistically
significant. This showed that, for men, there was a significant mean decrease in drinking over the
whole study period (Wilks’ Lambda=0.72, F(5,179)=14.1, p<0.001). Pair wise comparisons also
revealed significant decreases in men’s unit consumption between 1997 and 1999 (t = 2.42, DF =
183, p<0.05), and also between 2005 and 2007 (t = 3.39, DF = 183, p<0.005). In other words, unit
consumption amongst the men in the sample decreased significantly between the first and second
interviews, and again between the penultimate and final interview. For women, the overall decrease
in consumption between waves one and six also reached statistical significance (Wilks’ Lambda =
0.69, F (5, 70) = 6.2, p<0.001). However, the decreases in mean consumption between consecutive
waves of the study did not reach statistically significant levels, instead showing a more gradual
decline over time.
2.3 Change over time at an individual level
Whilst the above analysis shows a general trend towards less heavy drinking in the sample as a
whole, there is also considerable variation in the drinking pattern of different individuals within the
sample. At wave one, individual scores for units consumed in the week before interview ranged
between 0 and 328 units. Similarly, at the final wave of the study, scores ranged from 0 to 301 units
in the week before interview, with a few sample members drinking at very high levels (see Figure 5
below).
Figure 5: Units consumed in week before wave six interview (n=259)
0
0
1-20
21-4
041
-60
61-8
081
-100
101-
120
121-
140
141-
160
161-
180
181-
200
201-
220
221-
240
241-
260
261-
280
281-
301
Last weeks' units at wave six
5101520253035
Freq
uenc
Furthermore, as Figure 6 shows, there is considerable diversity within the sample in terms of the
degree and direction of change in drinking between waves one and six. Whilst there is a clustering
4045505560
y
13 Using a mixed between-within ANOVA and pair wise comparisons.
30

around a reduction of 1 to 25 units over the course of the study, one participant reduced by 328
units, whilst another increased by 140.5 over this time period.
Figure 6: Change in weekly un(n = 25
its between 1997 and 2007 9)
0
10
20
30
40
50
60
70
80
-301
to -3
28-2
76 to
-300
-251
to -2
75-2
26 to
-250
-201
to -2
25-1
76 to
-200
-151
to -1
75-1
26 to
-150
-101
to -1
25-7
6 to
-100
-51
to -7
5-2
6 to
-50
-1 to
-25
0 to
25
26 to
50
51 to
75
76 to
100
101
to 1
2512
6 to
150
Freq
uenc
y
e first and second interviews (1997 and 1999) (t
4.44, DF = 258, p<0.001) and again between the penultimate and final interviews (2005 and
2007) (t = 3.7, DF = 258, p<0.001). This reduction in the frequency of heavy drinking days at the
Unit consumption in last week
2.4 Frequency of heavy drinking
The mean number of heavy drinking days14 in the last week decreased at each wave of the study -
from 3.7 in 1997 to 2.3 in 2007 (see Table B3, Appendix B). The only exception was the period
between the second and third interviews (1999 and 2001), when it rose slightly, though not
significantly. Further analysis15 showed that this overall decrease over time was significant (Wilks’
Lambda = 0.73, F (5, 254) = 18.8, p< 0.001). Looking specifically at changes between individual
waves, there were significant decreases between th
=
start and end of the study mirrors a similar decrease at these stages in the volume of alcohol
consumed by participants (see section 2.2 above).
14 Defined as at least 7 units a day for women, and at least 10 for men. 15 Using a repeated measures ANOVA
31

Figure 7: Mean number of 'heavy' drinking days per week by gender 1997-2007
00.5
11.5
22.5
3
1997 1999 2001 2003 2005 2007
Wave of study
Mea
n 'h
eavy
' drin
ki
3.54
ng d
ays
Men Women
A similar pattern was found for the mean number of ‘very heavy’ drinking days16 in the last week,
which showed a decline from 1.4 in 1997 to 0.7 in 2007 (see Table B4 Appendix B). Again, this
was a statistically significant result (Wilks’ Lambda = 0.83, F (5, 254) = 10.22, p<0.001). As with
the measure for ‘heavy drinking days’, further analysis17 revealed a significant decrease in ‘very
heavy’ drinking days per week between 1997 and 1999, and again at the end of the study (t = 2.57,
DF = 258, p<0.05) (see Figure 8 below). Whilst the frequency of ‘very heavy’ drinking days has
clearly declined over the duration of the study, this decrease is more marked for male participants.
As can be seen in Figure 8, there is little reported difference between men and women in frequency
of very heavy drinking days at the final interview.
Figure 8: Mean number of 'very heavy' drinking days in the last week by gender 1997-2007
00.20.40.60.8
11.21.41.6
rinki
ng
1997 1999 2001 2003 2005 2007
Wave of study
Mea
n 'v
ery
heav
y' d
days Men
Women
ginning of study i f participants reported drinking at a ‘heavy’ level on at
e day during e week prior to the interview. This fe of participants in 2007. A
At the be the n 1997, 96% o
least on th ll to 70%
16 Defined as at least 14 units in a day for women, and at least 20 units for men. 17 Using pair wise comparisons
32
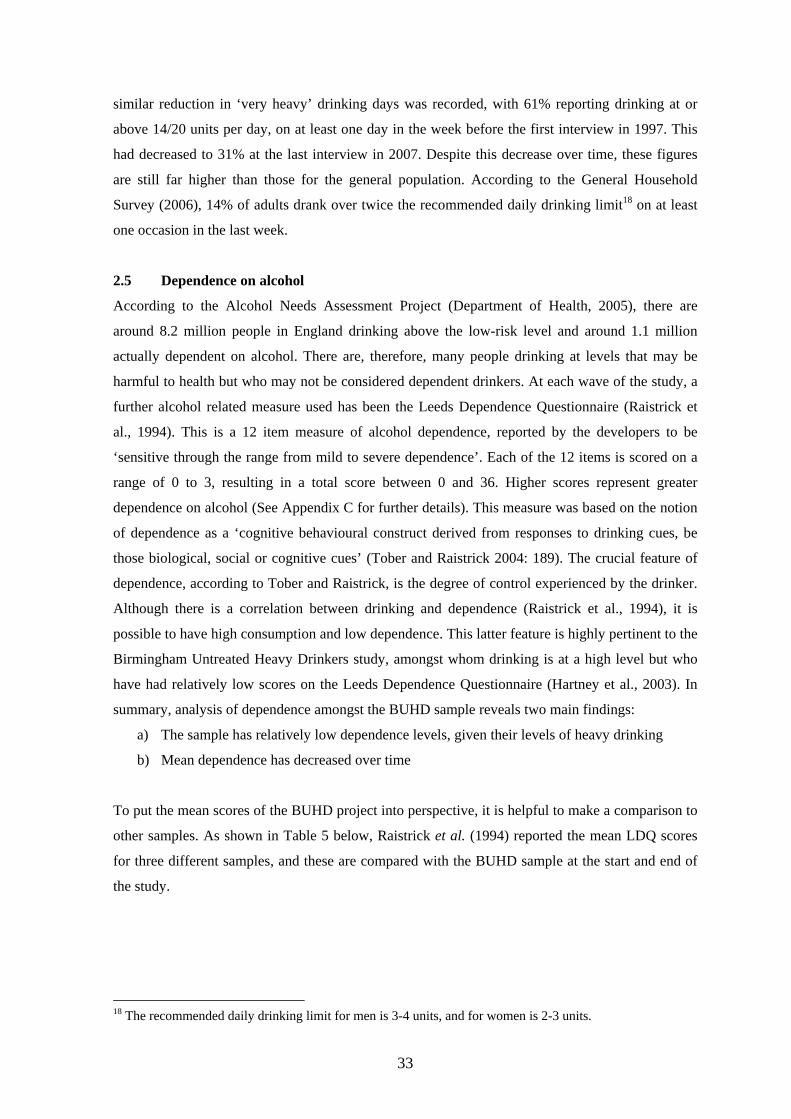
similar reduction in y hea g days was recorded, with 61% reporting drinking at or
bove 14/20 units per day, on at least one day in the week be
to 31 the l in 2007. Despite t se over time, these figures
igher those neral population. According to the General Household
urvey (2006), 14% of adults drank over twice the recommended daily drinking limit18 on at least
ne occasion in the last week.
measure used has been the Leeds Dependence Questionnaire (Raistrick et
l., 1994). This is a 12 item measure of alcohol dependence, reported by the developers to be
‘sensitive through the range from mild to severe dependence’. Each of the 12 items is scored on a
range of 0 to 3, resulting in a total score between 0 and 36. Higher scores represent greater
dependence on alcohol (See Appendix C for further details). This measure was based on the notion
of dependence as a ‘cognitive behavioural construct derived from responses to drinking cues, be
those biological, social or cognitive cues’ (Tober and Raistrick 2004: 189). The crucial feature of
dependence, according to Tober and Raistrick, is the degree of control experienced by the drinker.
Although there is a correlation between drinking and dependence (Raistrick et al., 1994), it is
possible to have high consumption and low dependence. This latter feature is highly pertinent to the
Birmingham Untreated Heavy Drinkers study, amongst whom drinking is at a high level but who
have had relatively low scores on the Leeds Dependence Questionnaire (Hartney et al., 2003). In
summary, analysis of dependence amongst the BUHD sample reveals two main findings:
a) The sample has relatively low dependence levels, given their levels of heavy dri
mples, and these are compared with the BUHD sample at the start and end of
.
‘ver vy’ drinkin
a fore the first interview in 1997. This
had decreased % at ast interview his decrea
are still far h than for the ge
S
o
2.5 Dependence on alcohol
According to the Alcohol Needs Assessment Project (Department of Health, 2005), there are
around 8.2 million people in England drinking above the low-risk level and around 1.1 million
actually dependent on alcohol. There are, therefore, many people drinking at levels that may be
harmful to health but who may not be considered dependent drinkers. At each wave of the study, a
further alcohol related
a
nking
b) Mean dependence has decreased over time
To put the mean scores of the BUHD project into perspective, it is helpful to make a comparison to
other samples. As shown in Table 5 below, Raistrick et al. (1994) reported the mean LDQ scores
for three different sa
the study
18 The recommended daily drinking limit for men is 3-4 units, and for women is 2-3 units.
33

Table 5: Comparison of LDQ scores from Raistrick et al. (1994) with the BUHD sample
Sample N Weekly units mean (SD) LDQ score mean (SD)
Clinical 47 122.9 (125.8) 16.3 (8.9)
Student 64 31.4 (23.6) 7.0 (4.4)
GP 14 13.9 (11.2) 3.1 (3.2)
BUHD (1997) 259 80.0 (49.1) 7.4 (5.5)
BUHD (2007) 259 50.4 (50.4) 4.6 (4.7)
By 2007, the mean LDQ score for the Birmingham sample was lower than that for a sample of
students reported by Raistrick et al. (1994). This is the case despite the fact that mean alcohol
consumption amongst the Birmingham sample in 2007 was still considerably higher than for the
student sample. This suggests that, although the sample is still drinking, on average, at levels
considered a high risk to health, they are not, on average, highly alcohol dependent. There has also
been a steady mean decrease in dependence scores for the BUHD sample over time, from 7.4 in
1997 to 4.6 in 200719.
Figure 9: Leeds Dependence Questionnaire (LDQ) Score 1997-2007 by gender (n = 259)
19 The exception to this general trend was between 2003 and 2005 (see Rolfe, Orford and Chappell, 2006), during which time men’s dependence scores increased slightly and women’s remained the same.
01
2
Me
3
456
78
an L
DQ
sco
re
MaleFemale
1997 1999 2001 2003 2005 2007
Waves of study
34

Further analysis revealed that this mean decrease over time was statistically significant20 [Wilks’
Lambda = 0.74, F (5, 254) = 17.83, p<0.001]. Looking specifically at changes between individual
waves showed significant decreases at three time points: between 1997 and 1999 (t = 3.13, DF =
258, p< 0.005); 2001 and 2003 (t = 4.58, DF = 258, p< 0.001) and 2005 and 2007 (t = 3.15, DF =
258, p< 0.005).
Further analysis was conducted to explore whether particular groups within the wave six BUHD
sample were likely to have high levels of dependence. This revealed no differences for men and
women, nor for different age groups. However, those participants who were not in a relationship
had, on average, significantly higher dependence scores (mean = 5.9) than those who were in a
relationship (mean = 3.8; t = 3.53, DF = 257, p < 0.001). Mean dependence scores also varied
significantly according to socio-economic group (F = 4.66, DF = 6, 252, p < 0.001). The unskilled
group’s mean LDQ score was higher than that of the professional, intermediate and skilled non-
anual groups’ scores, suggesting greater dependence amongst those in the lowest socio-economic
d to change their
rinking behaviour. Contemplators are considering the need for change and experiencing the
ssociated conflict and dissonance and those in the action stage have already made a commitment
r taken some action to change their drinking (see Appendix B for further details).
t the beginning of the study, 29% of the sample were assigned to the ‘pre-contemplation’ group,
uggesting that they were not ready to consider changing their drinking at that point (see Table B11
ppendix B and Figure 10 below). This number dropped to 19% of the sample at the following
interviews.
T fter the i view, rs e e
about changing their drinkin re taking step so.
m
group.
2.6 Readiness to Change
Participants’ motivation to change their drinking was measured using the Readiness to Change
Questionnaire (Rollnick et al., 1992). This allocates participants to one of three ‘stages of change’
considered to be the key stages through which an individual passes when trying to address
addictive behaviour. These stages are pre-contemplation, contemplation and action. Pre-
contemplation describes the stage at which individuals are not considering a nee
d
a
o
A
s
A
interview and then increased and remained between 21% and 24% for the final four
his means that a n ritial inte over three quarte of the sample wer ither thinking
g or we s to do
20 A one-way repeated measures ANOVA was condu mpare the sa res on the L
ependence Questionnaire (LDQ) at each of the six waves of the project. Paired samples t-tests were then onducted to investigate when the significant changes in LDQ scores took place.
cted to co mple’s sco eeds Dc
35

At the beginning of the study in 1997, 61% of the sample were ‘contemplating’ drinking change
and this percentage consistently decreased at each subsequent wave of the study, until 2007, at
which time just 42% were contemplating change. It follows that those moving away from the
‘contemplation’ stage’ began to make changes, as there is an overall upward trend in those taking
‘action’ across the study. Over the duration of the study, there has been an increase in the
proportion of the sample taking ‘action’ to change their drinking, from 10% in 1997 to 34% in
2007.
Figure 10: Percentage of sample allocated to the three stages of change groups 1997 - 2007
(n = 259)
50
60
70
e
0
10
20
1997 1999 2001 2003 2005 2007
30
40
Wave of study
Perc
enta
g Pre-contemplationContemplationAction
plation’ of change.
nsurprisingly, the largest category amongst those abstaining at wave six was the ‘action’ stage.
For those drinking at sensible levels, equal num ers of participants were allocated to the ‘pre-
contemplation’ and ‘action’ stages, with fewer contemplating the need to change.
At the end of the study, 63 members of the sample were in the ‘pre-contemplation’ stage, 109 were
‘contemplating’ change and 87 were taking ‘action’ to change. Analysis of stage of change by
individuals’ unit level consumption showed that of the 108 participants drinking at harmful levels,
65 were ‘contemplating’ change (see Table 6 below). Similarly, amongst those deemed to be
drinking at hazardous levels, the largest category was for ‘contem
U
b
36

Table 6: Stage of change by unit level consumption groups for the sample in 2007
Stage of change
Abstinent (0 units)
Sensible (1-14/1-21 units)
Hazardous (15-34/22-49 units)
Harmful (35+/50+ units)
n = 29
n = 43 n = 79 n = 108
Pre-contemplation 6 (2%)
16 (6%) 18 (7%) 23 (9%)
Contemplation 2 (1%)
11 (4%) 31 (12%) 65 (25%)
Action 21 (8%)
16 (6%) 30 (12%) 20 (8%)
Those aged between 45 and 54 were most likely to be contemplating change (54% of age group)
and were also most likely to be taking steps to change (33% of age group). There were minimal
differences in motivation to change between those in a relationship and those not in a relationship.
More than half (51%) of those not in a relationship at wave 6 were contemplating change,
compared with 44% of those in a relationship. However, a smaller proportion of those not in a
relationship were allocated to the action group (23%), compared with 34% of those in a
relationship. In terms of socio-economic group, results showed that the higher the socio-economic
roup, the greater the proportion allocated to the action stage of change21. Just 15% of those from
h wave of the study, participants were asked, not just about the amount they had drunk, but
also about the types of drink they had consumed in the previous week22. At every wave of the
study, the predominant drink for men was beer or lager, with 72% of men reporting this to be their
main choice of drink at wave one, reducing to 58% at wave six (see Table B13, Appendix B and
g
the unskilled group were taking steps to change their drinking at wave six, compared with 50% of
those in professional occupations. However, the unskilled group also contained the highest
proportion of individuals (54%) contemplating change, compared to just 17% of the professional
group. In terms of gender, a higher proportion of women (34%) were taking action to change,
compared with 28% of men. Chi-Square analyses revealed no significant differences within any of
the sub-groups.
In summary, those contemplating change were most likely to be between 45-54 years old, in a
relationship, and to be in unskilled occupations. Those taking action to change were also most
likely to be aged 45-54 and in a relationship, but were also likely to be in professional occupations.
2.7 Drink types
At eac
21 The only exception to this was the ‘intermediate’ socio-economic group. 22 Based on the Time line Follow Back of drinking in the week before interview.
37

Figure 11 below). For the first half of the study, the second most predominant drink for men was
cider, but by the second half of the decade, wine had become more popular.
Figure 11: Men's predominant drink type 1997-2007
020406080
100
199
SpiritsWine
7 99 01 003
2005
2007
19 20 2
Wave of study
Perc
ent
men
age
of
CiderBeer/lager
For the women, wine was the predominant drink of choice at every wave except wave two (see
Table B13, Appendix B and Figure 12 below). From 1999 onwards, the proportion of women
reporting wine to be their main drink of choice rose from 25% to 49% in 2007. From 2001, the
percentage of women reporting spirits as their predominant drink of choice rose from 11% and
peaked at 28% in 2005, before falling again.
38

Figure 12: Women's predominant drink type, 1997-2007
100
n
0
20
40
60
1997
1999
2001
2003
2005
2007
Perc
enta
ge o
f wom
80
Wave of study
eSpiritsWineCiderBeer/lager
Another aspect of the analysis focused on the types of drink most commonly consumed by
participants according to their alcohol consumption group. At the first set of interviews, just over
60% of individuals drinking at a ‘heavy’ level were predominantly beer/lager drinkers. 15% that
were mainly wine drinkers and 7% mainly drank spirits. Amongst the very heavy drinkers,
beer/lager was still the most popular drink of choice, but almost a quarter of this group (24%)
reported drinking mainly cider and 11% mainly drank spirits (see Table B13, Appendix B).
Analysis of the predominant drink type by gender, using data from 20
articipants currently drinking heavily (i.e. over 50 units for men, and over 3 units for women),
also reveals some interesting patterns. Whilst the pe of the heavy drinker is of someone
mainly cider or spirits, the heavy drinking women in the BUHD sample mainly
07 interviews with
5p
stereoty
who consumes
consumed wine, whilst heavy drinking men were predominantly beer drinkers (see Figures 13 and
14).
39

6.82%
Gender: Male
Spirits
Wine Cider
Beer/lager
Predominant type of drink W6
12.12%
10.61% 70.46%
Figure 13: Predominant type of drink consumed in the week before interview, 2007
heavy drinking men (n=132)
14.55%
58.18%
9.09%
18.18%
Gender: Female
SpiritsWineCiderBeer/lager
Predominant type of drink W6
Figure 14: Predominant type of drink consumed in the week before interview, heavy drinking women,
2007 (n=55)
g so. However, at wave six, the sensible group were less likely to report this as
e predominant strength (just 9% of the volume group) and the ‘very heavy’ drinkers were more
In addition to the types of drinks consumed, participants were also asked to report the strength of
alcohol consumed. At both waves one and six, the group most likely to report drinking
predominantly low strength alcohol (0.5-4.5%) was the ‘sensible’ drinkers, with the ‘very heavy’
drinkers being the least likely to report this as their predominant drink strength (see Table B13,
Appendix B). At wave one, a similar pattern applied to the 4.6-6.0% drinks, with 33% of the
sensible group reporting this as the strength of their predominant drink and just 16% of the ‘very
heavy’ drinkers doin
th
likely to report this as the predominant strength (39%). This suggests that over the course of the
study, the sensible drinkers were (perhaps unsurprisingly) more likely to drink lower strength
drinks whereas the ‘very heavy’ drinkers were more likely to drink stronger types. At both waves
40

one and six, none of the sensible drinkers consumed alcohol labelled as between 6.1-10% strength
(namely strong lagers and ciders). However, at both waves, over a quarter of the ‘very heavy’
drinkers mainly drank these high strength drinks. Analysis also revealed an increase in the
proportion of every group reporting their predominant drink strength as between 10.1-13%,
reflecting the increase in wine as the predominant drink of choice.
2.8 Knowledge of recommended daily and weekly drinking limits
According to the ONS Omnibus survey (2007), 85% of adults had heard of measuring alcohol
consumption in units in 2007, compared with 79 per cent ten years earlier. At waves four, five and
six (2003 to 2007), all participants were asked to state what they thought the daily and weekly
recommended sensible drinking levels were23 for both men and women24.
In 2003, over half of the sample stated that did not know the Department of Health daily
commended guidelines for unit consumption. However, by 2007, less than a quarter said they did
ot know (see figures 15 and 16 below). Similarly, at wave four (in 2003), just over 30% of the
ample correctly estimated the recommended daily unit level, whilst by 2007, around half25 made
orrect estimates. Amongst those who gave an estimate but did not guess correctly, a greater
roportion overestimated than underestimated the recommended daily unit level, at every interview
ave (see Table B59, Appendix B).
re
n
s
c
p
w
Figure 15: Estimates of DoH recommended daily units for men, 2003-2007
0102030405060
2003 2005 2007
Wave of study
Perc
enta
ge
Not known
UnderestimateCorrectestimateOverestimate
23 The Department of Health recommends daily (not weekly) limits for alcohol consumption. Nonetheless, in
is study both daily and weekly limits were used, in order for participants to be able to compare their own thweekly drinking (measured by the Time Line Follow Back procedure) with recommended weekly limits. 24 All participants were asked about the daily recommended daily limits for both men and women, regardless of the participant’s gender. 25 47% correctly estimated the men’s level and 53% correctly estimated the women’s recommended limit.
41

Figure 16: Estimates of DOH recommended daily units for women 2003-2007
20
40
60
Perc
enta
ge
NotknownUnderestimate
02003 2005 2007
Wave of study
CorrectestimateOver
2.9 Analysis of change over time using advanced statistical techniques
We have always known that the numerical part of the final data set would offer opportunities for
further statistical analysis using more sophisticated methods which take advantage of repeated
measures and multiple variables. To that end we have sought expert statistical advice and been
fortunate enough to engage the interest of Drs Roger Holder and Shakir Hussain of the Department
of Primary Care and General Practice in the University of Birmingham. They have indicated that
the data set lends itself well to a number of advanced statistical methods. The latter include
structural equation modelling (SEM) which is a well respected method, often to be found in papers
published in the leading Alcohol and Addiction journals. At the moment two methods have been
explored, as follows.
Cluster Analyses
This is a set of techniques which consider the similarities and differences between the participants
based on their scores on a number of key variables. It then suggests a number of categories, or
clusters, into which participants can be placed according to certain statistical criteria. Two ways of
clustering the participants have been explored to date. Each is based on scores on five key drinking
variables and how participants’ scores on those variables changed over time. The five variables
estimate
These results suggest that there has been an increase over time in the proportion of the sample who
have heard of unit counting, that the proportion that know how many units are recommended as a
sensible amount to consume in any one day or week is far smaller, and that there may be a
tendency amongst heavy drinkers to overestimate the recommended limits.
42

are: units of alcohol consumed in the last week; number of heavy drinking days (days drinking a
east 10 units for men or at least 7 for women) in the last w
t
eek; days drinking very heavily (at least
1 units for men and 14 for w men t week; estimate of n ays h
e last 12 months; and estim of number of days v avy drinki the last 12 ths.
rst method (clustering on int nd linear and quadratic trends) requires at least 3
for each participant. T nalysis is therefore based on 326 of the 500 initial
That method has suggested three cluste e largest g 48%) had relatively high
owed latively tle change. The second group (29%) had lower wave 1
the lowest of all for hea y and very heavy days in the last week) and showed
change subsequently. The third group ( ) also had verage initial values and
greatest change of all on three of the key les (unit eek and nd very
in the last year). d group also showed a relatively large quadratic
ent.
ond cluster analysis method is newer and has only recently been described in the
e (Hussain t al, 2008 . Known as ultilevel mixture modelling, it of
ling which examines b th variation between participants and variation within the
btained by individual participants at different waves, as a basis for clustering participants
n deviations from genera ds). An tage of thi hod is tha use the
ll participants however w inte p ysis is
erefore based on 499 participants (a key variable was missing for one participant who only
attended one interview). This method has also suggested four clusters which show an
understandable order from cluster 1 (low initial values on key drinking variables and the greatest
change) to cluster 4 (higher initial values and very little change). Table 7 shows the intercept and
linear change values for the four clusters for four of the drinking variables (the very heavy drinking
days in the last week variable was excluded from this analysis because it added little additional
variance). As illustrations, figures 17 and 18 show how members of the four clusters are
distributed in 2-dimentional space according to two pairs of statistics. Figure 17 shows the plot of
baseline (wave 1) units in the last week against baseline very heavy drinking days in the last year.
Figure 18 shows baseline units plotted against change in units over time.
l
2 o ) in the las umber of d eavy drinking in
th ate ery he ng in mon
i) The fi( ercepts a
data points his a
participants. rs. Th roup (
wave 1 values and sh re lit
values (and v
considerable 23% low a
showed the variab s last w heavy a
heavy days drinking The thir
change compon
(ii) The sec
statistical literatur e ) m is a form
multilevel model o
scores o
(clustering o l tren a
rviews a partici
dvan s t
ant attended. This anal
me t nit ca
data from a many or fe
th
43

Regression Analyses
The second method that has been explored so far, rather than attempting to assign participants to
clusters, has used the more conventional method of examining associations between variables.
Separate analyses have been carried out regressing each of the Wave 1 key drinking variables and
change for each of the key drinking variables between wave 1 and the participant’s final interview
(omitting in the final analysis the very heavy drinking days in the last week variable because it
added little extra variance). The variables used in these regression analyses have been the
following: wave 1 values for the same key drinking variables; change on each of the key drinking
variables; sex; age; socioeconomic status (four categories); economic activity (three categories);
marital status (three categories); relationship status (three categories); predominant type of
alcoholic drink consumed (four categories); wave 1 scores for health (SF36), readiness to change
(RTC), alcoholic dependence (Leeds Dependence Questionnaire LDC); and change from wave 1 to
the participant’s final interview on each of SF36, RTC and LDC.
In summary these analyses have so far suggested two conclusions. The first is the importance of
socioeconomic status as a correlate of wave 1 scores on key drinking variables. With a inor
exception, each baseline drinking variable shows a regular increase in mean score from
socioeconomic status group 1 (professional and managerial occupations) to socioeconomic status
group 4 (semi-skilled and unskilled manual occupations). In each case the difference between SES
groups 1 and 4 is statistically significant, or in one case very close to significance. In the case of
units of alcohol consumed in the last week there is, in addition, a complicated interaction between
socioeconomic status group and sex, with women in SES groups 2 (intermediate and routine non-
manual occupations) and 4 (semi-skilled and unskilled manual) consuming relatively fewer units
than men compared to women in the other SES groups.
The second conclusion to be drawn from the regression analyses, so far, is the significant
relationship between change over time for each of the key drinking variables and change over time
in dependence (LDC) scores. This relationship is statistically significant for each of the four
drinking variables, indicating that changes in alcohol dependence over time are generally in step
with changes over time in drinking. In only one case (the regression of change in units in the last
week) was change in health (SF36) significant. The direction of that relationship was such that
reductions in drinking over time were correlated with worsening of health over time. Although that
may appear counter-intuitive, it may be interpreted as indicating that decline in health was a
principal factor motivating reduction in drinking. More detailed analysis will help to test that
interpretation. In none of the regression equations was baseline RTC or change in RTC significant.
m
44

Table 7. Baseline and linear change on four key drinking variables for each of four cluof participants based on multilevel mixture modelling
sters .
Cluster 4 Cluster 3 Cluster 2 Cluster 1
N 44 187 196 72
Units of alcohol consumla
ed st week
Change
186 -7.6
102 -5.8
100 -44.0
93 -54.4
Baseline Dla
ays heavy drinking st 7 days
5.7
5.0
3.2
4.1 Baseline Change
-0.16 -0.24 -0.26 -2.81
Days heavy drinking last 12 months
Baseline Change
299 not
260 -9.6
158
-13.8
219
-154.8 significant
Days very heavy drinking last 12
months Baseline Chan
264
115
54
34 ge not
significant
- 8.5
- 6.5
- 21.3
45

Figure 17: Baseline units last week plotted against baseline very heavy drinking days last year for four participant clusters (clustering on deviation from general trend)
4003002001000
40 12
cluster
0
300
200
100
0
Very heavy drinking days
34
unit
s at
bas
elin
e
46

Figure 18: Baseline units last week plotted against change in units for four participant clusters (clustering on deviation from general trend)
4003002001000-100-200
400
300
12
CLUS2
Units at baseline - units at end
Unit
s at
bas
elin
e
200
100
0
34
PART TWO SUMMARY
Over the ten years of the study, there has been a significant decrease in both the volume and frequency of drinking, for both men and women.
Dependence levels amongst the BUHD sample have been relatively low, considering their levels of drinking, and have decreased significantly over time
By the end of the study, more participants were taking action to change their drinking. This was particularly true of participants who were in the 45-54 age group, in a relationship, and in professional occupations.
Most male heavy drinkers were predominantly beer drinkers, whilst most heavy drinking women in the sample preferred wine over other drinks.
Knowledge of Department of Health recommended drinking limits has increased over time. However, at the end of the study there was still a tendency to overestimate daily sensible drinking limits.
47

PART THREE: HEALTH
The association between high alcohol consumption, morbidity and mortality is well established,
with the World Health Organisation reporting alcohol as one of the ten leading causes of injury and
death in developed nations (World Health Report, 2002). The Alcohol Harm Reduction Strategy
for England (Cabinet Office, 2004) calculates the cost of alcohol misuse to the health service to be
£1.7bn per annum, including over 30,000 hospital admissions per year for alcohol dependence
syndrome, and up to 22,000 premature deaths per year.
ealth amongst the Birmingham sample has been found to be poorer than for the wider population.
ticeable differences are for mental health and emotional role limitations, where
han
tter
hysical function amongst the Birmingham sample in 199726.
Health has therefore been an important area for investigation on the BUHD project. At each wave
of the BUHD study, the SF-36 (Ware and Sherbourne, 1992) has been used as a measure of health
amongst the sample. This measure allows an assessment of the different dimensions of health,
through questions relating to eight different areas: general health; physical function; mental
function; social function; physical role; emotional role; pain; and energy and vitality. In addition,
data have been collected on use of various health services, including primary care, Accident and
Emergency, and hospital inpatients and outpatients services. This section explores changes in
health over time amongst the sample, along with changes in use of health services.
3.1 Health, drinking, and change over time
H
Some of the most no
the sample has been found to have much lower scores than for the general population (Rolfe et al.,
2006). As can be seen in Table 8 below, the mean SF-36 scores for each dimension are poorer t
the general population (aged 25-74) at both waves one and six, with the exception of be
p
26 Although this then decreased over time and fell below the general population figure by the end of the study.
48

Table 8: Me SF-36 sco 1997 and - comparison to general population
Health dimension SF-36 scores mean (SD)
an res 2007
1997 over)*
2007 Gen. Pop (aged 16 and
General health 64.9 (21.9) 71.3 60.4 (23.4) Physical fun on 90.6 (14.3) 85.1 cti 83.3 (22.9) Mental func 65.3 (21.0) tion 71.1 (20.8) 77.0 Social funct 83.5 (23.5) ion 82.2 (24.9) 87.9 Physical rol 77.1 (36.0e ) 73.4 (39.6) 80.9 Emotional role 67.8 (40.0) 75.9 (36.7) 87.4 Pain 75.7 (26.7) 80.4 72.4 (21.1) Energy & vitality 55.5 (20.4) 63.9 54.4 (22.8) *Omnibus Survey (Bowling et al. 1999)
is als me evide of an asso ion b or health. Health
s were atively c lated with el of consumption at both Waves 1 and 6,
meaning that higher levels of alcohol consumption were associated with poorer health28. Further
analysis of all 8 SF-36 sub-scores revealed significant negative correlations on several, although
l, of th sub-scor t Wave 1, re wer en level of alcohol
mption and physical function, m healt
were found between level of alcohol consump physical function, and physical role 30.
nalysis using Wave 6 data revealed no gender or age differences were found in health scores.
eve ere in a relationship had significantly higher mean scores for health
=613) than those not in a relationship (M=505; t = -4.80, DF = 157, p < 0.001). Similarly, mean
ng
oorer health amongst those in the lower socio-economic groups, see Figure 19 below.
27
There o so nce ciat etween heavy drinking and po
score neg orre lev alcohol
not al ese es. A the e negative correlations betwe
consu ental h and pain29. At Wave 6, negative correlations
tion and
limitations
A
How r, participants who w
(M
SF-36 scores varied significantly according to socio-economic group, (F = 4.49, DF = 6, 252, p <
0.001). The unskilled (V) group’s mean SF-36 score was significantly poorer (p < 0.05) than that of
the intermediate (II) and skilled non-manual (III NM) groups’ scores. Furthermore, the skilled
manual group’s score was significantly lower than the intermediate group’s score, suggesti
p
27 The sample used in the Bowling et al. survey used the sample from the Health Survey for England. The sample included adults with an age spread from 16 to over 75. 28 Correlations between units consumed in previous week and SF36 general health score: Wave 1, r=-0.216, p<0.0005; Wave 6, r=-0.155, p=0.012 29 Wave 1: physical function x alcohol consumption – r=-0.136, p=0.002; mental health x alcohol consumption – r=-0.098, p=0.029, pain x alcohol consumption – r=-0.130, p=0.004. 30 Wave 6: physical function x alcohol consumption – r=-0.179, p=0.004; physical role x alcohol consumption – r=-0.18, p=0.004.
49

0
100
200
300
400
500
600
700
Tota
l SF-
36 s
core
I IIIII
NM
III M IV V
Unco
ded
Socio-economic group
Figure 19: Total SF-36 scores by socio-economic group at wave six (n = 259)
Analysis of change in health over time shows that there has been a significant decline in the general
ealth o ix (Wilks’ Lambda = 0.947, F (5, 254) = 2.83, p <
.05), and this is matched by a significant decline in ‘physical function’ (Wilks’ Lambda = 0.884, F
over time, possibly with ageing. There were no significant changes in the
ther five areas of health over the ten year study period, and the data suggest that the poorer health
significant decline over time in general and physical health in the BUHD
sample may be due to the effects of alcohol cons ption, but could also be due to the effects of
geing. The findings relating to mental health need to considered in the light of the fact that general
h f the sample between waves one and s
0
(5, 254) = 6.64, p < 0.001). It is not, however, clear whether this is related to alcohol consumption,
since scores on all SF-36 sub-scales decrease with age amongst the general population (Bowling et
al., 1999). However, despite BUHD participants having much poorer ‘mental function’ than the
general population, scores for mental health did increase significantly for the BUHD sample over
time (Wilks’ Lambda = 0.903, F (5, 254) = 5.47, p < 0.001). This suggests an improvement in self-
reported mental health
o
scores apply to all age groups over all waves of the study (see Tables B26 and B27, Appendix B)31.
This findings need to be considered in comparison with data for the general population (Bowling et
al., 1999). These show that younger age groups score, on average, more highly than older age
groups on SF-36 measures of general and physical health. The only exceptions to this are measures
of emotional and mental health ‘(emotional role’ and ‘mental functioning’), where there is little
difference found in mean scores between different age groups amongst the general population.
Thus, the finding of a
um
a
31 The only exceptions to this pattern of poorer health scores is as follows: (i) In 1997, physical functioning within the 45-54 age group is better than that of the general population, (ii) For pain, the sample’s mean score was better than the general population in each age group at three of the six waves, indicating fewer problems with pain amongst the sample.
50

population scores for these measures do not usually decline over time, unlike those for physical
health. Nonetheless, the fact that emotional role and mental functioning in the BUHD sample
significantly improved over time does suggest better mental health at the end of the study.
3.2. Mortality
Eighteen participants (15 men and 3 women) are known to have died since 1997. Table 9 shows the
details of deaths currently known. The mean age of death amongst those known to have died is
49.5 years and, as can be seen, many of these deaths appear likely to have been alcohol-related.
Table 9: Known deaths amongst the BUHD sample
Year of death
Gender Age at last interview
Weekly units Cause of death at last interview
2002 M 50 131.5 Intracerebral haemorrhage & hypertension
2007 M 54 66 Unknown at present
2002 M 58 118 Haemorrhagic cerebrovascular accident
2 0/01 M 50 422 Hepatorenal syndrome and alcoholic liver disease 00
2006 M 60 56 Unknown at present
2007 F 42 39.5 Official cause unknown at present (unofficially reportebe alcohol and diabetes related).
d to
2000 F 28 38 Metastatic cancer
2004 M 36 51 Bronchopneumonia; diabetes mellitus
2002 M 58 38.5 Metastatic adenocarcinoma, pulmonary embolism, ARDSrenal failure, diabetes
,
2000 M 36 51 Alcohol-related pneumonia
2002 M 46 94 Bleeding oesophageal varices & alcoholic liver disease
1998 M 51 93 Respiratory arrest & encephalitis
1999 M 52 129 Suicide
2004 M 61 214 Pancreatitis
200 M 47 0 ver failure an cirrhosis 1 Li d liver
200 M 59 50.5 arcinomatosi oma of lungs ral vascular disease
3 C s, carcin , periphe
2005 F 59 99 Heart attack
2000 M 45 90 Cirrhosis of the liver and infection
51

3.3
In addition to measuring what people feel w
mu Da number of contacts with General Practitioners
ere collected from wave two onwards and showed an increase from 1999 to 2005 in numbers of
ont e Figure 20 below, and Table B48, Appendix B).
Use of GP services
about their state of health, data were collected on ho
ch participants’ used health services. ta on e th
w
GP c acts, then a slight decrease in 2007 (se
850
900
950
1000
1050
1100
Tota
l num
ber o
f co
ntac
ts
1999 2001 2003 2005 2007
Wave of study
Figure 20: Frequency of contacts with GP 1999-2007 (n=259)
Home visitsSurgery visits
At each wave of the study, between 77 and 81% of the sample had contact with their GP on at least
one occasion during the year before interview (see Table B48, Appendix B). On average, men had
contact with their GP a mean of between 3.01 and 3.95 times per year at each wave of the study
and women had contact a mean of between 4.39 and 5.45 times per year (see Table B48, Appendix
B). As shown in Figure 21, comparison with data from the General Household Survey, (ONS,
2006) shows that there is nothing to suggest that the BUHD sample are heavy users of GP services
when compared to the general population and at several waves of the study they were found to visit
their GP less than the general population.
52

Figure 21: Mean number of contacts with GP in the last year. Comparison of BUHD sample with general population* 1999-2007
0
1
2
3
4
5
6
1999 2001 2003 2005 2007
Wave of study
Mea
n nu
mbe
r of v
isits
BUHD femaleBUHD maleGen. pop.femaleGen. pop. male
* General Household Survey, 200632.
It is estimated that, nationally, each GP sees 364 heavy drinkers a year (Cabinet Office, 2004: 41-
2), and GPs may be considered to be in an ideal position to identify heavy drinkers and to conduct a
brief intervention. In the BUHD study, participants who reported having contact with their GP were
asked whether any comments had been made about their drinking. These data, therefore, provide
useful information on the extent to which GPs are both aware of, and are active in making referrals
for problem drinking.
Despite the fact that between 73% and 85% of the sample was drinking at hazardous, harmful or
very harmful levels at every wave of the study, only a small proportion of these received comments
about their drinking from their GP (see Table B27, Appendix B and figure 22 below). Analysis of
Wave Six data shows that those who received a comment from their GP about their drinking were,
inkers33 than those who did not receive a comment (t(55.76)=-
.23, p=0.030). The number of participants advised to reduce their alcohol consumption remained
on average, significantly heavier dr
2
fairly stable across the study, with between 43 and 47 participants being advised to cut down at
each interview wave.
32 The General Household Survey sample includes adults aged 16 and over. 33 Based on units consumed in the week before interview
53

Figure 22: Number of participants receiving a comment about their drinking from their GP in the
year before interview 1999-2007 (n=259)
253035404550
Freq
uenc
y
05
101520
1999 2001 2003 2005 2007
Wave of study
Advised to reduceNo need to changePromoted drinkingOther comment
From wave 4 onwards, participants were asked whether they had spent any time discussing their
drinking with their GP. Of the 199 individuals who saw their GP on at least one occasion during
the year prior to the wave four interview, 26% discussed their drinking. At the wave five interview,
208 participants had seen their GP and a slightly higher proportion - 29% - discussed their alcohol
consumption. At the final interview, 203 individuals reported contact with their GP and of these,
27% discussed drinking.
r three waves, digestive problems and
ental/psychological issues were amongst the top three reasons for having contact with the GP and
subsequently prompting a conversation about alcohol use (see Table B49, Appendix B).
These same participants were asked the extent to which their discussions about drinking with their
GP included details of their weekly unit consumption. Over a quarter of those that discussed their
drinking with their GP reported not having been asked to describe their weekly consumption
patterns34 (see Table B28, Appendix B). Between 22 and 34 individuals were asked to give a brief
description of their unit consumption and the smallest proportion (between 9 and 14 participants)
were encouraged to give a detailed summary of their drinking. These individuals were also asked about which bodily system problem triggered the visit to their
GP at which their drinking was discussed. At each of the late
m
These data also provide a useful source of information on referral for treatment. It should be noted
that, in the BUHD study, there are two sources of information on referral to treatment. The first,
presented here, describes referrals made as the result of a GP instigated discussion of the person’s
34 This was the case at each of the last 3 interview waves
54

drinking. The second, presented in sections 6.1 and 6.2 below, describes access to advice and
treatment which is actively sought out by participants. Amongst those that reported discussing their
drinking with their GP, less than a quarter were recommended any treatment, and only a small
minority agreed to go for treatment (see Table 10 below). Thus, of the 259 participants that
comp of
these agre between
level of alcohol consum n35 and GP referra vices36 ),
suggesting that GPs may only be referring to treatment services in the case of very king.
T Frequency a eporting w r GP had recommended tr and whethe ey had agre go for trea ngst those wh ceived a c bout their d king (2003-2
2003 Frequency (%)
(n=51)
2005 Frequency (%)
(n=58)
2007 Frequency (%)
(n=55)
leted the study, less than 5% were recommended treatment by their GP and less than 3%
ed to access treatment. Using Wave Six data, a positive correlation was found
ptio instigated l to treatment ser (r=0.152; p<0.01
heavy drin
able 10: (and percent ge) r hether theieatment r th ed to tment, amo o re
omment a rin 007)
GP recommended treatment? No Yes – with someone at surgery Yes – with a specialist
39 (76%)
1 (2%) 11 (22%)
49 (84%)
2 (3%) 7 (12%)
42 (76%)
2 (4%) 11 (20%)
Agreed to Yes No 5 (10%) 5 (9%)
3%)
6 (11%)
go for treatment? 7 (14%)
4 (7%) 7 (1
3.4 Use of o ary care services
addition to contact with their GP, participants were also asked whether they had seen other
ther prim
In
primary care staff in the year before interview. These included surgery practice nurses and
counsellors37, health visitors, Community Psychiatric Nurses, alternative health practitioners (paid
for by the local surgery) and any other health worker. Analysis showed that the numbers accessing
a practice nurse increased considerably over the ten year period (from 7% in 1997 to 49% of
participants in 2007 (see Table B55, Appendix B and Figure 23 below). However, participants still
had, on average, fewer contacts with their practice nurse than members of the general population.
Figures for primary care health professionals other than practice nurses showed that these were
used by only a small minority of participants. At most waves of the study, those participants who
had contact with the practice nurses were consuming alcohol at higher levels than those who did
not see their practice nurse (see Figure 23 below).
35 Based on units consumed in the last week 36 It should be noted that this includes referrals as a direct result of a GP initiated discussion of the patient’s drinking. It does not include the incidence of participants actively seeking treatment for their drinking. The latter is covered in Sections 6.1 and 6.2 37 These two categories were asked about from Wave one onwards. The other health professionals were added to the list and asked about from Wave Two onwards.
55

Figure 23: Percentage of sample using different primary care services (n=259)
80
60
01020304050
1997 1999 2001 2003 2005 2007
Wave of study
Perc
enta
ge
70Other health worker
Alternative practitioner
CPN
Counsellor
Practice nurse
Figure 24: Percentage of men and women in contact with a practice nurse in the last year 1997-2007
(n=259)
40506070
rcen
tage
0102030
1997 1999 2001 2003 2005 2007
Wave of study
Pe
MaleFemale
Figure 25: Mean contacts with practice nurse: BUHD sample (n=259) compared to general population*
0
0.5
1
1.5
2
1999 2001 2003 2005 2007
Wave of study
Mea
n no
. of c
onta
cts
BUHDcohort(n=259)Generalpopulation
* General population figures from the General Household Survey, 2006 (adults aged 16+)
56

Figure 26: Mean weekly unit consumption in the year before
interview, amongst those that had contact with a practice nurse, by gender (1997-2007)
0102030405060708090
100
1999 2001 2003 2005 2007
Wave of study
Mea
n un
it co
nsum
ptio
n
Contact w ithnurse - male
No contact w ithnurse - male
Contact w ithnurse - female
No contact w ithnurse - female
3.5 Inpatient admissions
Household Survey for 2005 (ONS 2006) shows that 7.9% of adults in the general
e stages of the BUHD study was
around twice that of the general population (see Figure 27 below).
The General
population have had an inpatient stay in the previous year. Whilst the number of participants
reporting at least one inpatient stay in the previous fluctuated over the course of the study38 (see
Table B52, Appendix B), the proportion of the sample using hospital inpatient services was greater
than the general population at every interview wave, and at som
Figure 27: Percentage attending hospital as an inpatient at lea nce in y before i rview
(n=259). Comp ison to general population 97-
5
10
% o
f sam
st o ear ntear
19 2007
15pl
20
e
BUHD to
01997 1999 2001 2003 2005 2007
Wave of study
tal
Gen. pop. (16-64yrs)
38 From 46 (18%) at wave one to 31 (12%) at wave four. Numbers then increased at wave five before reducing again to 36 (14%) at wave six.
57

Women were more likely to use inpatient services than men at almost every wave of interviews
(see Figure 28 below). However, this difference was found to be statistically significant only at
wave two (chi square = 8.14, df = 1, p< 0.005). There were no significant differences in inpatient
service use between participants from different age groups (see Table B53, Appendix B), with the
exception of wave five, when more individuals than expected from the older age group (45-55
years at wave one) accessed inpatient services in the previous year (chi square = 12.94, df = 2, p<
0.005).
Figure 28: Percentage of sample (n=259) attending hospital as inpatients in the year
before interview, by gender (1997-2007)
0
5
10
15
1997 1999 2001 2003 2005 2007
% o
f sam
ple
20
25
30
MaleFemale
Wave of study
might also be expected that those participants having inpatient stays were heavier drinkers than
s, but analysis showed a mixed picture here. At the beginning of the
on amongst those who were not hospital inpatients fell
e
owever, the inpatient
It
those who had no inpatient stay
study, in 1997, there was very little difference in mean unit consumption between these two groups.
However, whereas the alcohol consumpti
consistently at each wave of the study, the pattern for those that were admitted to hospital as
inpatients fluctuated across the study (see Table B52, Appendix B and Figure 29 below). At wav
two, the inpatients consumed significantly less alcohol in the week before interview than those that
were not admitted to hospital (t = 2.81, df = 257, p< 0.005). At wave five, h
group drank significantly more (t = -2.03, df = 47, p< 0.05).
58

Figure 29: Comparison of mean alcohol unit consumption between those that used hospital
inpatient services and those that did not 1997-2007
0
20
1997
1999
2001
2003
2005
2007
Wave of study
Mea
n un
it co 40
60
80
100
nsum
ptio
n
AccessedinpatientservicesDid not accessinpatientservices
Data were also collected (from wave two onwards) on the number of nights participants spent in
hospital, amongst those who were admitted as an inpatient. Results showed that, with the exception
of wave three, the BUHD sample spent more mean nights in hospital as inpatients than would be
expected in the general population, particularly at wave 6 (see Table 11 below). Participants were
lso asked about the reason for their inpatient stay from wave four onwards and analysis showed
n was the most common reason, with injury being the least likely reason at
a
that having an operatio
each of the later three waves (see Table 12 below).
Table 11: Mean number of nights spent in hospital as an inpatient in the year before interview and comparison to the general population (aged 16+) 1997-2007
n Range of nights
Mean nights in hospital (SD)
Gen. pop.* Mean nights in
hospital Wave 2 34 1-56 7.06 (9.87) 6.0 Wave 3 30 1-56 5.90 (10.07) 7.5 Wave 4 24 1-35 7.96 (9.04) 5.5 Wave 5 28 1-42 7.54 (8.94) 6.5 Wave 6 29 1-75 11.59 (18.82) no new data
* Livin
Table 12: Reason for hospital inpatie quency) 2003
llness O Injury
g in Britain 1998 to 2006
nt stay (fre -2007
I peration
Wave 4 8 20 3 Wave 5 17 17 5 Wave 6 14 15 7
59

This analysis is further supported by qualitative data from 16 participants who talked about their
experiences of being a hospital inpatient, as part of the qualitative interviews at wave four of the
study. Of the 16, only 3 participants said they were asked about drinking. Two of these were asked
as part of routine questions over smoking, drinking and drugs, and one was advised to cut down his
drinking as a result. A third participant, who was admitted to hospital with cirrhosis of the liver,
was told by his consultant that if he did not reduce his alcohol intake, he would be dead within
ree months. The 13 participants who received no comment or question about their drinking often
vy drinking, it appears that this might not
lways be welcomed by participants, unless their illness was clearly drinking related.
is also
howed a significant correlation at Wave 6 between the number of days binge drinking (defined as
drinking at least 10 units (men) or 7 units (women) during the past week), and number of times
attending A&E in the last year (r=0.126, p=0.021, 1-tailed). There was an even stronger correlation
at Wave 6 between very heavy binge drinking (defined as the number of days drinking at least 12
units (men) or 14 units (women) during the past week), and number of times attending A&E in the
last year (r=0.26, p<0.0005). This provides some cautious support for the proposed association
th
did not know whether staff were aware of their drinking, although several commented that they had
decided not to tell hospital staff. Two participants, however, kept alcohol in their bedside lockers,
and were sure that staff were aware of this, but no comments were made to them about drinking.
However, the participants considered this lack of questioning and advice about their drinking to be
appropriate, given that very few were in hospital for drink-related reasons. For example, one
participant said that ‘people were treated on an individual basis, as patients and not as a
drunkard’. Another participant remarked that, even if comments had been made about his drinking,
he would not have accepted what they would say to him, as he was more likely to take advice from
his friends rather than clinical staff. Thus, whilst an inpatient stay might be considered to present an
opportunity for professional interventions concerning hea
a
3.6 Use of Accident and Emergency and Outpatients services
Over the course of the study, the number of participants that accessed Accident and Emergency
(A&E) services in the year before interview fluctuated between 16% and 24% of the sample, (see
Table B51, Appendix B), with more men than women generally using A&E39 (see Figure 30
below). Those using A&E services continued, on average, to drink at a heavy level at every wave
of the study, consuming a mean of between 57.6 and 92.9 units in the week before interview (see
Table B52, Appendix B). However, this difference only reached statistically significant levels at
Wave 1 (t(190.3)=-2.812, p<0.005) and Wave 6 (r=0.18, p<0.01). Correlational analys
s
39 With the exception of Wave Two
60

between heavy drinking and disproportionate use of A&E found elsewhere (Cryer, Jenkins, Cook
et al. 1999).
0
5
10
15
20
25%
of s
ampl
e
1997 1999 2001 2003 2005 2007
Wave of study
Figure 30: Percentage of sample that attended A&E at least once in the year before interview
1997-2007 (n=259)
MaleFemale
umbers of participants engaging in fights in the later stages of the study.
Data on numbers accessing outpatient services were also collected from 2001 onwards. Again
sults showed a fluctuation in use of these services over the latter four waves of the study, with
Analysis of data from Waves 1-4 also found a positive association between getting into fights, and
frequency of A&E attendance40. Whilst this was not found at Waves 5 and 6, it is possible that this
reflects the relatively low n
re
between 32% and 38% reporting at least one visit to an outpatients department (see Table B51,
Appendix B and Figure 31 below). Mean unit consumption amongst this group fluctuated but
remained heavy throughout the study (between 57.4 and 66.0 units in the week before interview)
(see Table B52, Appendix B). However, again, there was no significant difference in mean unit
consumption between those that accessed outpatients and those that did not. Perhaps
unsurprisingly, the older age group (45-55 years old in 1997) accessed outpatients more frequently
than the other two age groups at waves four to six (see Table B53, Appendix B).
40 Wave 1: r=0.212, p<0.01; Wave 2: r=0.146, p<0.05; Wave 3: r=0.123, p<0.05; Wave 4: r=0.109, p<0.05
61

0
10
20
30
40
50
& o
f sam
ple
2001 2003 2005 2007
Wave of study
Figure 31: Percentage of sample attending outpatients at least once in the year before
interview 1997-2007 (n=259)
MaleFemale
Participants in the BUHD sample were almost twice as likely as the general population to have
used A&E and/or outpatients services in the previous three months (see Table 13 below). However,
further analysis revealed that the mean number of visits for the sample in the three months before
interview fell consistently from 0.59 in 2001 to 0.39 in 200741.
Table 13: Comparison of sample and general population* (aged 16+) attendance at outpatients and/or A&E departments in the last three months before interview 2001-2007
General population % n (% of sample) Sample mean visits (SD)
M F All
M F All
2001 13.5 % 15 % 14.5 % ) 21 (28%) 69 (27%) 0.59 (1.51) 48 (26%2003 13.5 % 15.5 % 14.5 % 45 (25%) 21 (28%) 66 (25%) 0.41 (0.87) 2005 13.0 % 15.0 % 13.5 % 37 (20%) 21 (28%) 58 (22%) 0.37 (1.03) 2007 12.5 % 15.0 % 13.5 % 44 (24%) 16 (21%) 60 (23%) 0.39 (1.02)
* General Household survey 2006 (ONS, 2008)
Qualitative interviews at wave four on experiences of hospital services showed that attendance at
A&E mainly due to accidents, the only exceptions being three individuals who were suffering from
abdominal pain. Around half of accidents were reported to have happened when the person was
intoxicated. Drink-related injuries were sustained through falls, being the victim of an assault, or
being involved in a fight. Participants were evenly divided between those who were unhappy about
their treatment and about the attitude of staff, and those who were very satisfied with their
treatment. Some felt they had been treated differently because staff knew they had been drinking.
They felt they had been left to wait longer than other patients, whilst others believed they had been
41 Data for the previous twelve months can be found in Table B51, Appendix B.
62

treated less sympathetically. For example, a woman who was injured after being involved in a fight
outside a pub was dissatisfied with her treatment. She stated:
Basically, their attitude was ‘You’ve had a drink, so what do you expect us to do about it?’
and they didn’t ask us about how it had happened or what had happened. They just said,
we’d been drinking they didn’t really care.
icated,
“you’ve been drinking”....Basically, because
In contrast, another woman, who had been physically assaulted by her partner whilst intox
was very satisfied with her treatment in A&E. She remarked:
Although I had to wait a long time they were pretty good there. They x-rayed my eye and
everything, but there was some talk of losing my eye, which was very, very scary. I can’t
really fault them. It was Saturday night. There were lots of people in there who had been
fighting... It’s pretty horrific there with all the drunk things but I can’t fault their treatment.
Thus, participants’ accounts of using hospital services and of responses to incidents of intoxication
were very mixed.
PART THREE SUMMARY
The general health of the sample (as measured by the SF-36 measure) was worse than that of the general population throughout the study.
General health has also declined over the ten year period, although this is also the case for the general population.
A correlation was found between poor general health and high levels of alcohol consumption.
Mental health scores amongst the BUHD sample are particularly poor in comparison with the general population, although these have shown some improvement over time.
BUHD participants visited their GP no more often than members of the general population.
At each wave of the study, less than a third of those who had seen their GP in the previous year had received a comment from their doctor about their drinking. Of those who then discussed their drinking, less than a quarter were offered a referral for treatment by their GP. Of this small minority who were recommended treatment, only around half at each interview wave took up this offer and agreed to treatment. As a result, only a small minority of those visiting their GPs entered treatment.
Using Wave Six data, a positive correlation was found between level of alcohol consumption and GPs recommending referral to treatment services, suggesting that GPs may currently be recommending referral to treatment services only in the case of very heavy drinking.
Participants did, however, use hospital services (A&E, inpatients and outpatients) at a rate around twice that of the general population. A&E attendance was associated with heavier levels of alcohol consumption, although this only reached statistically significant levels at waves 1 and 6. A positive correlation was found between binge drinking and use of A& E services. Data from interview waves 1-4 also shows that involvement in fights was linked with frequency of A&E attendance.
Most participants who had been inpatients had not discussed their drinking whilst in hospital. However, they generally approved of this and considered being questioned about their drinking to be inappropriate in this context.
63

PART FOUR: RISKY AND HARMFUL BEHAVIOURS There are a number of risky and harmful behaviours that are associated with heavy drinking.
harm to themselves), and ‘intoxicated’ behaviours (defined
moking and drinking alcohol are known to be strongly related. At the beginning of the study,
lmost half the sample (n=259) was smoking at least 1 cigarette per day and the mean number of
igarettes smoked amongst the sample was 8.4 (see Table 14 below). By the final wave the
reduced from 126 to 108 (42% of the sample) and the mean number of
According to the Department of Health et al. (2007), ‘people who become drunk are much more
likely to be involved in an accident or assault, be charged with a criminal offence, contract a
sexually transmitted disease and, for women, are more likely to have an unplanned pregnancy’.
Given this background, ‘risky’ behaviours has been one area of investigation on the BUHD project.
At each wave, therefore, the Birmingham study has asked participants about involvement in ‘risky’
behaviours (defined as likely to cause
as likely to cause harm to others). Participants have also been asked about health-related
behaviours such as smoking and drug use.
4.1. Smoking
S
a
c
numbers smoking had
cigarettes smoked had also reduced (to 6.9). This reduction in the number of cigarettes smoked was
found to be significant [Wilks’ Lambda = 0.943, F(5, 254) = 3.097, p< 0.05]. The number of
participants smoking at least 20 cigarettes per day also decreased over time, from 56 (22%) in 1997
to 42 (16%) in 2007.
Table 14: Numbers and percentage of sample smoking at least 1 and at least 20 cigars or
cigarettes per day and mean number smoked 1997 -2007 (n = 259) Wave of study
Number (%) smoking at least 1 cigar/ette per day
Number (%) smoking at least 20 cigar/ettes per day
Cigar/ettes per day Mean (SD)
1997 126 (48.6%) 56 (21.6%) 8.41 (11.6) 1999 124 (47.9%) 54 (20.9%) 8.00 (11.2) 2001 128 (49.4%) 56 (21.7%) 8.28 (11.8) 2003 122 (47.1%) 57 (22.1%) 8.08 (11.6) 2005 113 (43.6%) 39 (15.2%) 7.35 (11.8) 2007 108 (41.7%) 42 (16.3%) 6.86 (11.1)
This decrease in smoking needs to be seen in the context of wider social changes in relation to
smoking. The proportion of the general population who smoke has also decreased over this time
period42 (ONS, 2006). Nonetheless, at nearly 42%, the proportion of the Birmingham sample
smoking in 2007 was much higher than the proportion in the general population. Smokers were
found to have higher levels of alcohol consumption, with analysis of the wave six data showing a
42 From 28% in 1998/99, to 24% in 2005
64

moderately strong positive correlation between smoking and units of alcohol consumed in the past
week (r = 0.37, p <0.01).
One additional factor in the relationship between drinking and smoking is the ban on smoking in
public places. This came into force almost at the end of the BUHD study, on July 1st 2007.
Participants were asked about the impact of this change during the final set of interviews. Since the
law was brought in halfway through the interviewing year, 160 participants were interviewed prior
to the change in the smoking law and 99 subsequent to its introduction. Analysis of these two
groups revealed no significant difference in the mean number of cigarettes smoked. Asked if the
new law on smoking in public places would have any effect on their drinking, 170 participants said
it would have no effect, 52 that it would have a small effect, 17 that it would have a moderate
effect, and 20 said that it would have a large effect43. Overall then, around one third believed the
smoking ban would have some effect on their drinking.
4.2. Drug use
The 2006/2007 British Crime Survey (BCS) estimates that 10.5% of the general population and
9.1% of the West Midlands population aged 16-59 have used one or more illicit drug in the last
year (Murphy & Roe, 2007). At every wave of the project, drug use for the sample was
considerably higher than for the general population. However, with the exception of a small
increase at wave five, the percentage of those that had used at least one illicit substance in the year
before the interview fell consistently, from 55% in 1997 to 27% in 2007 (see Figure 32 below).
Analysis indicated a significant change over time, (Chi-square = 112.4, df = 5, p< 0.001). This
decrease over time is in line with the reduction in drug use that is seen with increasing age.
Figure 32: % of sample using at least one illicit drug in year before interview 1997-2007
50
60
0
10
P
20
30
erce
nta 40ge
1997 1999 2001 2003 2005 2007
Wa
ve of study
43 Further (qualitative) data are available on the nature of this anticipated effect and may be analysed at a later date.
65

At each wave f the study, the most commonly was cannab half of the sample
(51%) used t on at least one occasion in the or to the start study in 1997 (see
Figure 33 below). The numbers using cannabis de consistently over the course of the study,
falling to less than one quarter of the sample (22% year prior to the last interview in 2007. A
milar consistent decline over time in the use of the other two clas drugs (nitrites and
mphetamines) was evident, with the exception of a fluctuation at wave five (see Figure 33 and
o used drug is. Over
his year pri of the
creased
) in the
si s B
a
Table B32, Appendix B).
Figure 33: % of sample using Class B drugs on at least one occasion in the year before interview 1997-2007
(n=259)
5060
010
1997 1999 2001 2003 2005 2007
Wave of study
P
2030
e
40
rcen
tage Cannabis
NitritesAmphetamines
ed using this substance in the year before their final interview in 2007 (see
igure 33 below), thus falling below the 1% level used by the general population.
At waves one and two, the second most commonly used drug was amphetamines, followed by
nitrites at wave one and magic mushrooms at wave two. However, this pattern changed and the
second and third most commonly used drugs were cocaine and ecstasy respectively from Wave
Three onwards (see Table 32, Appendix B). This pattern mirrors changes in substance use in the
general population. As reported in the BCS (2006), in 1998 amphetamine was the stimulant drug of
choice but its usage has steadily decreased as cocaine has become increasingly popular. Although
12% of the sample were using magic mushrooms at the beginning of the study, none of the
participants report
F
66

Figure 34: % of sample using Magic Mushrooms, Ecstasy and LSD on at least one occasion in the year before interview 1997-
2007 (n=259)
02468
101214
1997 1999 2001 2003 2005 2007
Wave of study
Perc
enta
ge Magic mushroomsEcstasyLSD
Opiates, cocaine and crack cocaine, whilst only used by a minority, were also used considerably
more than in the general population44. With the exception of magic mushrooms at wave six, the use
of all drugs amongst the sample is considerably higher than the general population at every wave of
the study. Further analysis revealed an increase in the number of opiate users and an increase in the
mean number of times opiates were used in the year before interview, from 2.5 times in 2001 to
123.8 times in 2007. In other words, those who used opiates were doing so on a more frequent
basis.
Figure 35: % of sample using cocaine and opiates on at least one occasion in the year before interview 1997-2007 (n=259)
0
2
4
6
8
10
12
14
1997 1999 2001 2003 2005
Perc
enta
ge
2007
Wave of study
CocaineCrackOpiates
substance use
between the different sub groups at wave six. Wit
Further analysis was conducted to determine whether there were any differences in
h the exception of cannabis, those in the highest
Separate data on cocaine and crack cocaine use were not available at waves one and two of the study, so
Figure 32 shows the percentage of the sample using both cocaine or crack cocaine from waves three to six. 44
67

socio-economic group did not use any other substances. Cannabis was used across the gender, age
ase study : P808 male aged 36 – Substance use
and socio-economic groups. It was also used by those in a relationship and those not in a
relationship. However, those not in a relationship used cannabis almost twice as many times as
those in a relationship (though this difference did not reach statistical significance). Just one person
used LSD in the year before the wave six interview and, surprisingly, he was from the highest age
bracket (65-74). The majority of those using cocaine were aged 35-44, from all socio-economic
groups and were predominantly male, indicating a significant gender difference at this wave of the
study (t = 2.56, df = 15.4, p<0.05). Seventy-five percent of crack users and all of the opiate users
were aged 35-44 and 75% of individuals using crack and/or opiates were from the lower socio-
economic groups.
45C
Ten years ago was a happy and successful time for Chris, ‘I was in a signed band, I was a fully professional musician, we was appearing on TV and radio …it was a good time’. He lived in a house with the other band members and recalls that his was a culture of excessive drinking. Three years after the beginning of the study, Chris’ band got signed to a big record label and made a lot of money from an album deal. However, the singer of the band went off to pursue a solo career. This was a big blow to the rest of them as this had been their only dream for 13 years, ‘none of us had back up plans so we found ourselves approaching thirty with no careers just the instruments we could play’. One week later, Chris joined another band, which he remained in for two years. His drinking remained high (over 100 units per week) and on occasions they would be paid in alcohol instead of money. However, when he was 31, the band ended and Chris split up with his girlfriend, at which point he decided to go to the USA for a while, ‘at the time it felt like running away but I’m so glad I did it, the feeling of freedom I had when I was doing that at that time, you can’t put a price on it’. In 2005, Chris’s sister was diagnosed with cancer and he returned home. His worry about her began to exacerbate an underlying mental health condition. During this period, his drinking increased significantly and he began to fear that he was causing himself liver damage. It was at this time that he fell into bad company and accepted an offer of heroin, thinking it was less damaging for the body than alcohol, ‘so I thought I’d try it and now obviously I realise that was an error because it’s been torturous trying to get off the stuff’. Three years after his musical success, Chris had developed a heroin dependency. Prior to this period, he had been a very sociable person and had enjoyed an active social life with his friends but soon began to isolate himself with the drug, ‘I usually wanted to go home and do it on my own and get high on my own and so I look back and think what a lonely thing to wanna do, but at the time it’s all I wanted to do’. He suggests that it may have been a form of self punishment as he recalls being made to feel guilty for raising his own problems when his sister was so ill, ‘my mum kept undermining all my problems cos my sister had cancer …choosing Heroin was maybe a way of hurting myself in a way …best way of self destructing, I was thinking I’d rather die than my sister’. Chris continued to use heroin for approximately one year until his father had an epileptic fit. The paramedics that attended the scene suggested that his father had been two minutes away from death and Chris felt bad that he had been high when his dad was potentially dying and made a decision to 45 Case studies are used in this report to illustrate particular themes. They are based on qualitative interviews conducted with participants at the final wave of interviews for the study, in 2007. Names and some details have been changed in order to protect the anonymity of participants.
68

change, thinking ‘I need to get off this so that I’m back in the real world, feeling again, you know feeling proper feelings’. Following this incident, he tried to come off the drug at home on his own, without any medication, ‘four days of what I call absolute hell’. He remained clean from the drug for a month but couldn’t handle his feelings without it and relapsed, ‘I just felt so empty’. Two months later, he accessed a drug counselling service and has been on methadone since this time. Due to the side effects of the methadone, Chris only feels able to drink a small amount of alcohol and is currently consuming below the recommended maximum sensible drinking level. Chris holds some resentment towards his family for some of his childhood experiences, as he had to live through his parents’ numerous break ups and ongoing arguments. Even now, they continue to have a volatile relationship which his mum asks him to hide from his sister and he also carries the burden of his sister’s problems that she asks h to keep from their parents, ‘Why am I such a imstrong person that I can bear all this and be quiet’. Chris has had a few relationships over the past ten years but since using heroin, he has not been able to sustain a relationship and doesn’t expect to until he is more stable. Looking back over his lifetime, alcohol seems to have served different purposes. In his early twenties, he was dabbling in hallucinogenic drugs, which brought on feelings that he couldn’t manage and alcohol seemed to dissipate, ‘I took LSD quite frequently for maybe two years roughly and ended up thinking I was going insane and I discovered alcohol took that feeling away so it served as a saviour there, in my mind, not in my body obviously’. He also started going out a lot more and ‘I discovered that socialising was good fun in pubs’. However, it continued to serve as a way of dealing with unwanted feelings, ‘I discovered that alcohol, whenever I got anxious sort of thing, alcohol helped me calm down’. Over the next ten years, Chris hopes that he will be able to meet someone and lead a more stable life, possibly having kids and finding a job he likes, ‘so the next ten years, get more positive about working, settle down, maybe family’. In terms of his drinking, he would like it to stabilise to a few pints a night like his father, ‘I’d like it to go back to the way I was, the old Chris, that went out and only found himself with a hangover once a month and really drank three to four pints a night …and was generally happy with life’.
4.3. Gambling Another form of risky behaviour that has given cause for concern, particularly in recent years, is
gambling. Data on participants’ gambling behaviour were collected at waves 3, 4 and 6, using
questions adapted from the 1999 British Gambling Prevalence Survey. A large proportion of the
sample (227, or 88%) had engaged in at least one gambling activity in the year before their wave
three interview, and the percentage of the sample engaging in gambling was greater than for the
general population (Sproston, Erens and Orford, 2000), with the exception of the use of scratch
cards. The number participating in some form of gambling fell to 206 participants (80%) by the
wave six interviews, at which point the use of scratch cards remained below general population
figures and the numbers spending money on football pools and private betting had also fallen
below general population figures.
69

The most popular gambling activity at both waves three and six was the national lottery, followed
by betting on the horses (see Figure 36 below). In 2001 (wave three), 78% of the sample had
played the national lottery on at least one occasion in the previous year. However, in 2007, this
number had fallen to 67%, which is roughly equal to the general population figure of 65%. Further
analysis46 revealed a significant reduction from 2001 to 2007, in the numbers engaging in the
following gambling activities: the national lottery, scratch cards, football pools, private betting and
dog racing47. With the exception of dog racing, these are all activities which have shown a
reduction nationally, according to the results of the Second British Gambling Prevalence Survey
conducted in 2006-07 (Wardle et al., 2007).
0
10
20
30
40
50
60
Perc
enta
ge
70
80
Nat
Oth
er
crat
c
ruit
m
Priv Ot
ctivity
Figure 36: Percentage of sample spending money on gambling acitivities in previous interview 2001 and 2007 (n=259)
20012007
. lot
tery
Lot
tery
h ca
rds
Pool
s
Bing
o
achi
neat
e be
ts
Hors
es
Dogs
her b
ets
Casi
no
S F
Type of gambling a
Of the sample, 72 (28%) had used only one form of gambling in the year before their wave three
interview and 79 (31%) had used only form before their wave six interview (see Table 15 below).
This compares with 30% in the general population. However, 72 participants (28%) reported
engaging in four or more different gambling activities at wave three and 42 (17%) reported this
usage at wave six in comparison to 11% in the general population. Nonetheless, despite a
onsiderable number of the sample spending money on numerous different gambling activities, the c
mean number of gambling types used was 2.5 at wave three and this reduced significantly to 1.9 at
wave six, (t = 6.73, df = 258, p<0.001).
46 Using the Wilcoxon signed-ranks test 47 The national lottery (Z = -4.42, p<0.001); scratch cards (Z = -2.03, p< 0.05); football pools (Z = -5.05, p < 0.001); private betting (Z = -5.40, p< 0.001); and dog racing (Z = -3.28, p< 0.05).
70

Table 15: Frequency (and percentage) who reported engaging in different numbers of
gambling activities in the year before their interview in 2001 and 2007 (n=259) Number of different gambling activities
Wave three Frequency (%)
Wave six Frequency (%)
0 32 (12%) 53 (21%) 1 72 (28%) 79 (31%) 2 51 (20%) 54 (21%) 3 32 (12%) 31 (12%) 4 26 (10%) 19 (7%) 5 18 (7%) 10 (4%) 6 18 (7%) 9 (3%) 7 2 (1%) 2 (1%) 8 3 (1%) 2 (1%) 9 4 (2%) 0 10 1 (<1%) 0
Further analysis showed that there were no differences in gambling behaviour between individuals
t socio-economic groups. Analysis of gambling by age groups revealed that the onlfrom differen y
activity to show an age difference was the use of fruit or slot machines, with more individuals than
expected from the 25-44 age groups (chi square = 13.36, df = 4, p <0.05). More men than women
used fruit/slot machines (chi square = 6.46, df = 1, p<0.05), and ‘other betting’ (i.e. betting other
than horses and dogs) (chi square = 8.65, df = 1, p< 0.005).
4.4. Risky behaviours
At the beginning of the study, in 1997, 78% of the sample (n=259) reported engaging in at least
one risky behaviour after drinking in the year before their first interview. This number reduced
significantly at subsequent waves of the study [Wilks’ Lambda = 0.600, F (4, 255) = 42.56,
p<0.001] (see Figure 36 below)48.
Figure 37: % of sample engaging in at least one risky behaviour in the year before interview 1997-
2007 (n=259)
7864
47 47 42
0
10
20
30
40
50
60
70
80
90
1997 1999 2003 2005 2007
Wave of study
Perc
enta
ge
48 Further paired sampled t-tests revealed significant reductions between waves one, two and four, but the decrease between waves five and six did not reach statistical significance. Wave three data on risky behaviours was found to contain errors, so has not been included in the analysis.
71

The most common type of risky behaviour after drinking at every wave was ‘walking alone in less
safe areas’ (see Figure 38 below). During the latter half of the study, the number of men reporting
walking alone in less safe areas remained fairly constant between 33 and 36% of the sample and
e mean number of times they did this after drinking also remained fairly constant between 29 and
32 times in the year before interview. For women, the numbers engaging in this risky behaviour
after drinking fell from 29% in 2003 to 17% in 2007. However, the number of times these
individuals reported walking alone in less safe areas fluctuated between 6 and 31 times in the year
before interview.
The second most common risky behaviour after drinking at wave four was having unprotected sex,
but the numbers doing so fell at subsequent waves. At wave four, 12% of men engaged in
unprotected sex with someone other than a regular partner and did so a mean of 19 times in the
year before their interview. However, by wave six, just 5% of men reported this behaviour, a mean
of 3 times. Contrastingly, 5% of women reported unprotected sex at wave four and just 1% at wave
six and the mean number of times was very low at just 1 to 2 times in the last year at each of the
tter three waves.
th
la
Figure 38: Mean number of times each risk taken amongst those reporting each behaviour after drinking 2003-2007
Other risks not normallytaken
Had tatoos/piercings
Argued with bouncers /bigger people
200720052003Taken drugs not
normally taken
Had unpro
Shared a needle
tected sex
0 5 10 15 20 25 30 35
Gone off with peoplepreviously unknown
Walked alone in lesssafe areas
Mean times risk taken
72

Analysis of results also showed that the mean alcohol consumption (measured in units consumed in
taking
sks at every wave of the study (see Figure 39 below). The difference between these two groups
the week before interview) of those engaging in risky behaviour was higher than those not
ri
was significant at waves two (t=-3.02, df = 232, p<0.005); four t = -3.47, df = 212, p< 0.005); five
(t = -3.75, df = 201, p< 0.001); and six (t = -2.86, df = 257, p< 0.001). Furthermore, whereas the
mean weekly unit consumption of those not engaging in risky behaviour fell from 72 units in 1997
to 43 units in 2007, the decrease in mean weekly unit consumption in the risk taking group was
smaller, from 82 units in 1997 to 61 units in 2007.
Risk taking was more common amongst those aged between 35 and 45 and those not in a
relationship for all risk behaviours. Individuals from the skilled manual group were more likely to
argue with bigger people or bouncers than those from other socio-economic groups.
Figure 39: Mean weekly unit consumption amongst those reporting at least one risky behaviour and
those reporting no risky behaviour (n=259)
90
0102030
cons
4050
Mea
n un
it um
pt
607080
ion
Reported risky
1997 1999 2003 2005 2007
Wave of study
behaviourNo reported riskybehaviour
4.5. Intoxicated behaviours Alcohol consumption has been found to be associated with violence in both direct and indirect
ways (Graham et al., 1998, cited in Finney, 2004). Previous research has also found that there is a
sharp increase in the risk of being involved in assaults (either as a perpetrator or victim) when
drinking more than 8-10 units (Shepher et al., 1994; Shepherd and Brickley, 1996, cited in Finney,
004). Given that a substantial proportion of the BUHD sample are known to drink at or above this
level on a regular basis, it seems likely that they may have a higher than average frequency of
involvement in violent incidents. This was measured through asking participants about their
involvement in a range of ‘intoxicated behaviours’. These behaviours, defined as those likely to
cause harm to others, are listed as follows: Been inappropriately aggressive, been in a violent
2
73

argument/fight, damaged property, neglected a child, been asked to leave a licensed premises, and
any other behaviour later regretted.
At the beginning of the study, in 1997, 64% of the sample (n=259) reported engaging in at least
one ‘intoxicated behaviour’ in the year before their first interview. This number consistently
reduced significantly49 at subsequent waves of the study and fell to 35% in the year before their
nal interview (see Figure 40 below). fi
Figure 40: Percentage of sample engaging in at least one intoxicated behaviour in the year before interview
1997-2007 (n=259)
0
10
20
30
40
50
60
70
1997 1999 2001 2003 2005 2007
Wave of study
Perc
enta
ge
Further analysis revealed that the most common type of intoxicated behaviour was being
-nine percent of the sample reported
f men
(see Table B33, Appendix B). It is unclear why this is the case, although it
is possible that interpretations of whether aggression is ‘inappropriate’ may vary between men and
wom . behaviour was ‘other regrets’. This
incl d ing things that were later regretted. In 1997, 43% of the
’, but this fell considerably over the study to 16% in 2007.
‘inappropriately aggressive’ (see Figure 41 below). Thirty
having been inappropriately aggressive after drinking at wave one interview. This fell to 23% of
the sample by the wave six interview in 2007. It is also worth noting that, at waves one and six, the
proportion of women reporting inappropriate aggression was greater than the proportion o
reporting this behaviour
en The second most commonly reported intoxicated
ude embarrassing behaviour and say
sample reported ‘other regrets
49 Wilks’ Lambda = 0.761, F (5, 254) = 15.97, p<0.001
74

Figure 41: % of sample engaging in different risky behaviours in the year before interview 1997-2007 (n=259)
30
InappropriatelyaggressiveIn a fight
Damagedproperty
50
0
10
1997 1999 2001 2003 2005 2007
Wave of study
Pe
20rcen
tage
40
Neglected child
Ejected from pub
Other regret
he third most commonly reported intoxicated behaviour was being in a violent argument or fight. T
At wave one, almost a quarter (23%) of the sample reported being in a fight on at least one
occasion in the year before their interview. This number almost halved (to 12%) over the course of
the study. Again, at waves one, two and six, the proportion of women reporting being in a violent
argument or fight was greater than the proportion of men. However, it should be noted that these
data do not distinguish between perpetrators and victims, and the relatively large number of women
involved in arguments and fights could be indicative of higher rates of domestic violence
experienced by women (see Rolfe et al., 2006). Amongst those that have been in a fight, the mean
number of fights rose from 2.3 in 1999 to 5.8 in 2005 and then declined to 3.0 at wave six. Four
men and one woman admitted to neglecting a child between waves one and three but none did so in
the latter half of the study.
75

Figure 42: Mean number of intoxicated behaviours amongst those reporting each behaviour 1999-2007*
0 2 4 6 8 10
Inappropriately aggressive
In a violent argument / fight
Type
of i
ntox
ic
Mean times behaviour reported
Damaged proat perty
Ejected from licensed premises
Other regretsed
beh
avio
ur
20072005200320011999
*Due to
the small numbers ‘neglecting a child’, this variable has not been included in figure 42).
ing and involvement in behaviours likely to
ause harm to others.
With a similar pattern to those engaging in risky behaviours, analysis of results also showed that
the mean alcohol consumption (measured in units consumed in the week before interview) of those
engaging in intoxicated behaviours was higher than those not doing so. This was the case at every
wave of the study (see Figure 43 below). The difference between these two groups was significant
at waves three (t=-2.01, df = 257, p<0.05); four (t = -2.94, df = 257, p< 0.005); five (t = -2.43, df =
257, p< 0.05); and six (t = -3.09, df = 128, p< 0.005). Furthermore, whereas the mean weekly unit
consumption of those not engaging in intoxicated behaviour fell from 75 units in 1997 to 42 units
in 2007, the decrease in mean weekly unit consumption in the intoxicated behaviour group was
smaller, from 83 units in 1997 to 65 units in 2007 (see Table B37, Appendix B). This confirms the
suspected association between levels of heavy drink
c
76

0102030405060708090
Mea
n un
it co
nsum
ptio
n
199
199
2001
200
200
200
no intoxicated behaviour (n=259)
Figure 43: Mean weekly unit consumption amongst those reporting at least one intoxicated behaviour and those reporting
Reported intoxicatedbehaviourNo reported intoxicatedbehaviour
7 9 3 5 7
Wave of study
Further analysis was conducted to determine whether there were any differences in intoxicated
, p< 0.05) and ‘other regrets’ (chi square = 12.70, df = 6, p< 0.05).
Results
manual
reportin
in a rela 0.01).
disclosed that they had been victims of violence and abuse from a partner.
Eleven
study. T
putting
jaw, bro cracked my ribs’. Eleven of these participants were female
nd a further two were male. In addition, one man and one woman talked about the effects of
behaviours between the different sub groups at wave six (see Table B38, Appendix B). There was a
significant difference between the socio-economic groups in relation to violent arguments / fights
(chi square = 14.13, df = 6
showed that there were a higher than expected number of individuals from the skilled
group reporting ‘fights’ and a higher than expected number from the professional group
g ‘other regrets’. Analysis also indicates a higher than expected number of individuals not
tionship, reporting ‘fights’ whilst intoxicated (chi square = 7.65, df = 1, p<
4.6. Qualitative accounts of violence and abuse
At wave six of the study, all participants were asked to talk about their life over the previous
decade. Many of the stories highlighted the effects of violence, aggression and harassment from the
perspective of both perpetrators and victims. Participants were not specifically asked to talk about
experiences of violence during these interviews. Nonetheless, content analysis50 revealed that 42
participants talked about the following issues in qualitative interviews: violent/violence; abuse;
evil; bullied; harassed/harassment and aggressive/aggression.
Thirteen participants
of these cases were in the past ten years and a further two prior to the beginning of the
his ranged from emotional abuse, ‘he was a very possessive person …he was always like
you down, knocking your self esteem and stuff like that’, to severe physical harm, ‘broken
ken wrist, he broke my arm …
a 50 This involves searching documents for these key terms using a computerised search facility.
77

childhood abuse and the link to their drinking, ‘I drank to just escape some of the things that had
gone on with my family and myself…that was the reason for drinking I think…a hundred percent’.
A smaller number disclosed that they had been the perpetrators of violence towards a partner (n=2)
or towards another person (n=3) in the last decade and a further four acknowledged a past history
of violence and aggression, ‘I’d either sort things out with a joke or a punch, that was me’.
Although some participants did not report physically harming another person, five individuals did
acknowledge that they had behaved aggressively when intoxicated, for example towards a priest
talking about religion or towards a football fan from an opposing team, ‘I reacted, which is what I
o at times when I’ve had a drink’. The association of alcohol use with aggression/violence was
hilst participants tend to report relatively high rates of involvement in behaviours that could be
court appearances at each interview
ave. Similarly, although rates of contact with the probation service were relatively high at the
ts at wave one and 8 at wave two), this decreased markedly over
d
further highlighted by some individuals who had witnessed incidents in pubs, clubs, hostels and the
home, ‘it was so unhappy being there, and watching my Mum being abused and all the alcohol’.
In addition to alcohol-fuelled behaviour, those on the receiving end of bullying and harassment
identified this as a significant factor in their own drinking. Four individuals talked about being
bullied at school, within their neighbourhood and at work, ‘work started to become a really grim
place to be….so instead of going out for a drink socially after work…you’d go home and sink a
bottle of wine on your own…try to forget how awful the day had been’. A further four disclosed
harassment by an ex-partner and by neighbours, ‘one of them hit me on the head with a hammer
and after that my windows were going through every night, the door was getting kicked off, I had to
sell the house, to get out’. These qualitative data suggest that the participants perceive alcohol to
play a large part in fuelling violence and aggression, but that being the victim of violence is also
given as a reason for heavy drinking.
4.7. Contact with the criminal justice system
W
considered risky or potentially harmful to themselves and others, very few of the final sample
(n=259) reported court appearances for criminal offences. At each wave of the study, between 4
and 6 participants appeared in court (see Figure 44 and Table B42 Appendix B). This represents a
maximum of just over 2% of the sample reporting making such
w
start of the study (9 participan
time, and at waves three to six there were no more than 3 participants having contact with the
probation service in the year before interview (see Table B43, Appendix B). It should be noted that
this figure may be affected by sample attrition, since participants at Wave One who had court
appearances in the previous year were more likely to be ‘lost’ to the study (see Section One on
78

attrition). Nonetheless, it does suggest that some people may drink heavily, at levels likely to be
harmful to their own health, but without coming into contact with the criminal justice system.
Figure 44: Numbers of participants appearing in criminal courts in previous year
01234
Freq
uenc
y 56
1997 2001 2005
Violent offence
Non-violentoffence
Year
PART FOUR: SUMMARY
Smoking amongst the BUHD sample has reduced in line with reductions in the general population. Nonetheless, it has been much higher than amongst the general population throughout the BUHD project.
One third of participants thought the ban on smoking in public places would have some effect on their drinking.
The use of illicit drugs decreased over time, but was considerably higher than amongst the general population. This is particularly true of cannabis use, which was used by half the sample at the start of the study, and a quarter by the end.
Levels of gambling were higher than those for the general population when this data was first collected in 2003. However, this has decreased over time.
The most common forms of risky behaviours following drinking were walking alone in less safe areas, and having unprotected sex. The incidence of risky behaviours was higher amongst the heavier drinkers. Single people aged between 35 and 45 were most likely to engage in risky behaviours.
At the start of the study, over a third of the sample had engaged in a form of behaviour likely to be harmful to others (‘intoxicated behaviours’). This had reduced to just under a quarter by the end of the study. The commonest form of such behaviour was being ‘inappropriately aggressive’. The findings support previous research which shows an association between heavy drinking, and aggressive or violent behaviours. These kinds of behaviours were more prevalent amongst those members of the sample drinking more heavily. Getting into fights was most common amongst single men from skilled manual occupations.
Some participants in qualitative interviews talked about having experienced domestic violence. These participants perceived drinking to be both a catalyst for violence and as a maintenance factor in heavy drinking.
Despite these findings, few participants had court appearances for criminal offences.
79

PART FIVE: EXPLANATIONS FOR HEAVY DRINKING The reasons for heavy drinking are complex and diverse. In this section, some of the main reasons
given by participants for their own heavy drinking are highlighted, focussing particularly on social
and psychological factors that maintain their drinking. It begins by considering some of the main
ifferences, identified through quantitative analysis, between those who have been drinking heavily
ugh the presentation of three quite different types of experience and drinking
ajectories.
nalysis was conducted to examine whether this group of chronic heavy drinkers (n=60) differed
any way from the rest of the sample (n=169). Analysis revealed no significant differences
etween the two groups in terms of demographic variables such as gender, age, household income
r employment status. There was also no difference between the two groups for drug use, health
easured by the SF36), and for the number of risky and harmful behaviours they engaged in when
toxicated.
nalysis did, however, reveal significant differences on a number of measures, mainly relating to
e volume and pattern of drinking. The chronic heavy drinkers, perhaps unsurprisingly, were
d
at every interview wave on the project, and the rest of the sample. Following this, qualitative
analysis is presented from waves 4 and 5. First, qualitative findings from wave five interviews are
presented. This focuses specifically on the role that drinking plays in the lives of participants who
were drinking heavily at the time. Next, analysis of wave four interviews on ‘pub and community’
are presented, in order to explore the relationship between drinking and social life. The final part of
the section consists of three case studies51, which are based on wave six qualitative interviews,
during which participants were encouraged to reflect on the last ten years of their lives (1997-
2007)52. These case studies have been selected in order to illustrate some of the diversity within the
sample, thro
tr
5.1 What do we know about the chronic heavy drinkers?
Those who were heavy drinkers at the final interview form a significant minority (42%) of the
sample. Some of these will have been fluctuating in their drinking over the course of the study, and
may have been drinking at lower levels at some waves. However, over a quarter (26%) of those
who took part in every interview (n=229) were drinking above the ‘heavy drinking’ threshold at
every interview. Broken down by gender, 28% of men and 23% of women who took part in every
interview have been heavy drinkers at each interview.
A
in
b
o
(m
in
A
th
Names and some other features of these case studies have been altered, in order to protect the anonymity of e participants. See Appendix C for further details of the interview guide.
51
th52
80

found to drink significantly more53 (M=100.1, SD= 56) than the others (M=33.9, SD=36.3; t=-8.5,
F=77.4, p<0.005). They were also found to have many more very heavy drinking days in the last
ear (M=105.8, SD=112.8) than the rest of the sample (M=35.8, SD=75; t=-4.5, DF=78.3,
st (M=5.0, SD=8.9; t=-3.8, DF=77.8, p<0.005). There were also significant differences between
group naming their home as the main place where they
l factors and benefits, and social
D
y
p<0.005).
Again, perhaps unsurprisingly, the continuous heavy drinkers have much higher scores for
dependence (M=7.7, SD=6) than the other sample members (M=3.8, SD=3.8; t=4.7, DF=76.2,
p<0.005). They also smoke more than twice as many cigarettes per week (M=12.1, SD=13.6) as the
re
the two groups in terms of who they drank with, and where they consumed alcohol. Analysis of
drinking company54 showed a significant difference between the two groups, with a much higher
than expected proportion of the continuous heavy drinkers drinking alone, and fewer than expected
drinking in groups [χ² (2, 229) = 16.7, p<0.005]. Similarly, there was a significant difference
between the two groups in terms of the drinking venue [χ² (2, 229) = 7.3, p<0.05], with more than
expected of the chronic heavy drinkers
consume alcohol. Analysis of the types of drinks mainly consumed by the two groups showed that
the chronic heavy drinkers drank proportionately more beer, lager and cider, and less wine and
spirits than the rest of the sample, but this difference did not quite reach statistically significant
levels.
5.2 Reasons for heavy drinking: qualitative analysis
Participants gave a wide range of reasons why they choose to drink. These can be placed in three
main categories: events and social circumstances, individua
reasons. Within these broad categories there are a number of themes, as summarised below:
Environmental factors
• Early environment
• Response to current circumstances: stress reduction
• Response to negative life events
Individual / cognitive factors
• Boredom
• Habit
• Gastronomic pleasure
Social factors
• Social pressure
53 Based on units consumed in the previous week 54 i.e. Who they usually drink with, based on the predominant company in the past week.
81

• Pub as social life
• Drinking culture
• Drinking as ‘social glue’
th current circumstances, particularly
terrible
to be for relaxation. P364 said of
ts; P265 had problems with an ex-partner, and said: ‘I’m trying to
his partner: ‘It is positive because it helps
5.2.1 Environmental factors
A number of participants talked about growing up in an environment where alcohol was freely
available. For example, P163 talked about being given whisky when he was teething. P580
reported enjoying the taste of alcohol as a child, and P288 said: ‘my father was a drinker…we were
just brought up with drink. We’re from the Irish side of the family and the Irish are known for
being big drinkers. All the family does it.’
For some participants, drinking served as a way of coping wi
being viewed as a stress reducer, or a ‘release’. For example, P50 described alcohol as a ‘major
support’ when dealing with stress at home. For other participants, this stress originated at work;
P259 said: ‘I do need a drink mainly to unwind from work. If I couldn’t have a drink, I’d be in
trouble I think because I’m under immense pressure at work…’ Alcohol was sometimes seen as a
coping mechanism for dealing with stress, as in the case of P785: ‘When I’ve gone through
times not knowing when the next bill’s going to be paid…if I had a couple of drinks then I’d think,
well I’ll sort it tomorrow. And I’ve always got through. It takes away that terrible thinking, you
know, oh god, I’m not coping’. Others described it as a crutch; for example, P162 said: ‘I suppose
drinking really has become like a best friend to me, you know. It helps me in some ways but then
again it bites me back in other ways’. P052 continued: ‘Alcohol can be a crutch and a friends
substitute’. One of the most popular reasons for drinking seems
drinking: ‘I can relax and enjoy what I’m doing a lot more’. P447 continued: ‘I think it’s the only
thing that relaxes me’. For some participants, having a drink after work is an important signal that
the working day is over, and can also improve their humour.
Some participants talked about drinking in response to life events, for example the breakdown of
relationships, or bereavemen
drown it out, you know what I mean’. Often they acknowledged that this drinking was excessive,
for example P572 commented that, in response to her divorce: ‘I was drinking far too much. Sort of
behind closed doors, when the kids was in bed. But it was just as if, it was a shut down for me’.
However, alcohol is sometimes used to numb the pain of certain situations, for example P815 could
no longer see his children following separation from
numb the pain of not being with the kids, that crucifies me, the negative is that if I need something
like chemicals then I must have a problem and that plays on my mind’. Fortunately for some
82

participants this increase in drinking was only temporary. As P193 said: ‘It ain’t right at the end of
the day, is it? You’ve got to face up to things at the end of it, haven’t you? You’re always sober
eventually’.
5.2.2 Individual / cognitive factors
A number of participants stated that they simply drank out of boredom. P235 described a typical
evening: ‘When it comes to about ten o’clock, I think, right, what shall I do now. And rather than
go out the house, and do something, and mix with people I don’t want to mix with, I think, right,
what shall I do now? And that’s when I drink’. Another participant (P407), who was virtually
housebound due to illness, said of his drinking: ‘I think it’s too much, I know it’s too much. But
there ain’t nothing else to do… That’s why I just sit here and drink’. Other people admitted they
drink purely to get drunk; for example, P691 explained: ‘I have a drink when I want a drink…I like
getting drunk…When I’ve had a drink and I’m nearly there, you know, getting drunk then I feel
relaxed, right and calm and can have more of a laugh’.
Some participants attributed their current drinking to habit; this could be due to going out the same
evenings each week, or automatically opening a bottle of wine when getting home from work.
P266 admitted: ‘It’s no longer a treat, because it’s become the norm’. Another participant (P481)
said: ‘Half the time, I don’t know why. When I come in from work at night before I’ve got my coat
off I’ve poured myself a glass of wine’. Many of the heavy drinkers acknowledged a feeling of
dependence on alcohol; P141 remembered: ‘At one stage I used to keep a small bottle of scotch in
the car, and I was actually waking up thinking about [drink]’. P315 talked about an incident that
happened the morning of his interview, which led to him having a drink, and said: ‘If I had, like, a
choice, I wouldn’t have drunk this morning’. P234 summed up: ‘I can’t really do without drinking,
at the end of the day… It’s part of my life, basically’.
Eating and drinking go hand in hand for a number of the heavy drinkers. P347 described opening a
bottle of wine when cooking: ‘It follows on. Seems to be a logical extension’. Another participant
(P529) said: ‘I couldn’t imagine having Sunday dinner without a glass of wine’. Quite a few
participants said that enjoying the taste was their main reason for drinking. P580 said: ‘I love the
taste of alcohol. I tell you, if wine didn’t have alcohol in it, I’d drink it anyway. I love the taste of
booze’.
5.2.3 Social factors
There were several types of reasons given for drinking which were related specifically to its role in
social life. Three participants described themselves as feeling under social pressure to drink; for
example, P302 said:
83

‘Occasionally feel that you need to have a drink…at a funeral a couple of weeks back…at
what stick I would get because of this social circle I did have the alcohol, I only had a
dopting the drinking habits of people close to them; for example, P141 used to work for somebody
d get to know what’s going on’. However, not all participants would class these people as close
a slight distance… You’ve got to set a level of tolerance, because you can’t expect
e you might have a little bit of conversation;
refuge …it’s like an essential part of English culture, it’s rooted in my past’. P160 talked about
ish drinking culture: ‘We lived in a very strong Irish community and growing up, when you sort of
the wake afterwards there were a lot of old school friends came and we were drinking and
I knew I had to go to work in the afternoon and I got an option of ordering a soft drink or
ordering a soft drink or alcohol and I nearly went for the soft drink but because I knew
couple of pints and was the first to leave which was good’.
A few other participants described matching their friends drink-for-drink in social situations, or
a
who was a heavy drinker, and said: ‘I just followed the same pattern, you know, really’.
The majority of participants mentioned the social role of drinking, and for some people this played
a very important part in their lives, often revolving around the local pub. For example, P013 talked
out his current lifestyle: ab
‘Because of the life I lead now, being unemployed and that, if I don’t drink, I don’t go out.
Say for instance I never had a drink now for 10 days, I’d be 10 nights sitting in the
house…and because I don’t have a partner, I’ve nobody to go with to the theatre or go out
for meals…you can only go one place on your own and that’s to the pub’.
P036 described how he has been going to his local pub for over 20 years: ‘I’m well liked there, I’m
well known’. Similarly, P181 said: ‘It’s the best place to go and meet somebody and unwind…talk a
bit of sanity to certain people or whoever’s there…get out of the house’. In some cases, participants
drink by themselves in the pub. As P073 said: ‘It doesn’t matter to me too much if I go down the
pub and there’s nobody there… I can sit there for an hour or so….. I can take it either way but I
don’t like it going too over the top too many people around’. In other cases, participants drink with
a group of ‘regulars’. P721 said: ‘I enjoy the socialising. I enjoy the meeting people and chatting
an
friends. P087 said:
‘It’s a very loose circle of friends, you know. You don’t really get close to many of them in
the local pub environment…But you can still regard them as friends; you just keep them at
everybody to fit your ideals’.
Some participants elaborated on the importance of drinking as part of a culture. For example, P006
said: ‘Pubs can be a nice warm safe environment wher
a
Ir
84

started getting into your late teens, 15, 16…the pub was very much part of the community…..I
cipant (P730) who went to Medical School
drinking improves their confidence. For example, P483 finds that a drink makes
wever, this is not always a positive
ing, as P052 reported: ‘Feels as though I am enjoying life more and that I am more likeable to
ther people…that ain’t the real me, so I am living a lie’. Many participants considered drink to
nhance their friendships. For example, P460 said: ‘If I didn’t drink so much or at all it would
robably have a negative effect on my relationship with my friends, purely and simply because I
ouldn’t see them so much and they would think I have gone mad’. Some of the heavy drinkers
ported that most of their family and acquaintances were also drinkers, for example, P351 said:
know drinks, apart from my wife’. However, they were not always complimentary
bout other people’s drinking, and P783 talked about the effect that his father’s alcoholism had on
is own drinking: ‘That’s why I always watch my drinking, I always have a day when I don’t
rink…. I’ve seen what it can do to people, so I’m a bit more cautious’.
s can be seen, there are many different reasons given by heavy drinkers for their drinking. One
oint worthy of note is the way in which, for many people, alcohol consumption is closely
onnected with socialising and with friendship. Therefore, any change in drinking is likely, for
any, to have marked implications for social and cultural life.
.2.4 Pub and Community
ecause those participants – the majority – who drank regularly in public houses might be
onsidered to be particularly knowledgeable about pubs and the part they play in community life,
ne of the qualitative topics at wave four was devoted to exploring that topic. Ten such topics were
ddressed at wave four, of which ‘community’ was the one explored with the largest number of
articipants (n = 79, 64 men, 15 women). That topic was addressed as a high priority, taking
recedence over most other topics in the first 3 months of the year (from January to March 2003).
ub-topics were: the participant’s definition of community; whether she/he felt part of the local
ommunity and if so in what way; the places where the participant usually drank, and his or her
kes and dislikes about those places; ways in which drinking places served social or economic
didn’t have my first drink until I was 18 but I felt like I’d arrived. This was what it was all about.
This was our culture. This was how we are’. One parti
also talked about the drinking culture at University, describing it as a ‘way of life’ for medical
students.
Alcohol was considered to play an important role in social situations for many participants. For
example, P002 stated: ‘It’s the glue that makes somebody bother to phone you up’. Several others
commented that
him feel better before doing poetry readings in pubs and another (P902) remarked: ‘I’m one of
those people who needs a drink to start talking to strangers’. Ho
th
o
e
p
w
re
‘Everybody I
a
h
d
A
p
c
m
5
B
c
o
a
p
p
S
c
li
85

community functions for the participant and/or the local community; how drinking places were
hereas the role of the modern pub within its wider, local community emerged as debatable and
pportunity for joint, preferred
ctivities. For many there was also the sense of a common history of time spent together and joint
otional connection.
ommunities are in fact often viewed
s groupings of smaller sub-communities of people with shared interests, in the sense that pub users
may choose to congregate with those other peop e
actions required to perform one’s preferred identity as a particular drinking person. There is also a
negative aspect to this; many participants spoke of actively avoiding certain pubs as whole places
or sub-groups of other pub users if they did not share preferences for different activities or norms
of behaviour. Sometimes it was possible, by selecting times and spaces to share use of the same
linked to their local communities55.
Qualitative analysis of these data suggested that the pub constituted for many participants a very
significant setting in their lives. The clearest conclusion that we draw from these interviews is that
the pub was often viewed as more than just a setting for drinking, and, can in and of itself provide,
for many, a real feeling of community.
W
uncertain, there was more unequivocal support for the idea of the pub itself constituting a micro-
community. Many participants were well integrated into friendship groups who met in the pub and
a variety of needs were fulfilled including social companionship, the sharing of information on a
variety of subjects, the sharing of fun and games, jokes and laughter and, for many, emotional
support at times of need. Important elements were the freedom from constraints that apply
elsewhere (at work, in the home, with people whose interests one does not share), plus the relaxed,
convivial atmosphere that can be achieved in a pub, and the o
a
experiences that constitute a sense of shared em
At the same time it was evident that pubs were seen as places that served a variety of interests and
needs, and most drinkers were carefully selecting those fellow pub-goers with whom they already
had friendships, who shared common interests or who were seen as being like-minded people. It
was often the case that drinkers were deliberately avoiding other pub-goers who did not share their
interests, and particularly avoiding those who were seen as trouble-makers. It was not clear,
therefore, that drinkers generally felt common membership and a sense of belonging with the pub
as a place. More common was a sense of membership in more select friendship groups.
The present analysis provides a good example of how pubs as c
a
le in a particular pub setting who facilitate th
55 A full report of this analysis is also available. See Orford et al. (2008).
86

pub with groups with whom a drinker did not identify, whereas in other cases a place was avoided
ity friendship networks, including their
ital role in the passing and sharing of information. Others were of a quite contrary view – that
to what some saw as a decline in community more generally. Some
participants er by e degeneration of the local comm pub
merely a reflection of co e, a g orat
community
doubt rent vie ressed reflec the di
com n whic ts live d their o rban, p
f, for e . It wa se that negati attrib the fa
usly favoured pubs were now serving new clientele – diners for example be the
ore, tha the plural, offering a w ge of , are s an ever
portant function in an increasingly diverse society, providing important compensations for what
re seen by many as the increasing stresses and loss of traditional extended family and
eighbourhood supports that were once characteristic of communities and of which the ‘local’ was
part.
altogether as being personally uncongenial.
Participants were more ambivalent about the role of the local pub as a contributor to a broader
positive sense of local or neighbourhood community. Some were well able to describe how the
pubs they knew contributed to the cohesiveness of commun
v
there had been a decline in the ability of pubs to serve those positive local community functions. In
ome cases this was linked s
went furth implying that th
mmunity declin
unity
to the deteri
was not
ion of but also a f ctor contributin
.
It is un edly the case that the diffe ws exp are partly a tion of fferent
types of munity i h participan d or di drinking – urban r subu oor or
well-of xample s also the ca some ve views were uted to ct that
previo . It may case,
theref t pubs, in ide ran social niches erving more
im
a
n
a
87

5.3 Case studies of chronic heavy drinkers
Case study: P483 – male aged 36, drinking tied to social identity When George joined the study, he was in his mid twenties and ‘on the sick’ with a back injury. He was starting to get involved in music and gigs, and helped out with his mate’s band. Before that he was ‘just sort of hanging around pubs… I was fairly bored’. At the time, he was drinking over 50 units per week and has continued to drink at what he considers to be his moderate level of between 50 and 75 units per week for the last ten years. Several years ago, George went to investigate a music venue for his friend and was ‘amazed’ to meet ‘like minded people…creative types’. He began doing ‘open mike nights…with groups of poets’ in pubs and ‘making people laugh’ and felt this was a ‘positive change’. He got to know people in the pubs around Birmingham and his popularity increased. He spent a lot of time ‘just meeting people’ and became ‘a bit of a celebrity’ in the pubs he frequented, suggesting that some people described him as a ‘bit of a genius’. People began to recognise him from gigs and approach him in the street. George says that socialising around the pubs of Birmingham made him feel part of the community, ‘everybody sort of knows who everybody else is … see each other in the pub and just say hello…a close knit community’. When he was young, George was quite shy and insecure but has grown in confidence over the years. He suggested that in the past he was misunderstood, ‘probably didn’t understand me…couldn’t probably work me out’ and felt that since he has met other creative people in the pub who have watched him perform, this has helped him to become more sure of himself. A few years ago he obtained a regular slot for six months covering for someone introducing bands and he felt that he learnt a lot from this, whilst making steady progress with his poetry and music. In the last two years, George has attended A&E on one occasion due to a dislocated shoulder which happened when he tripped over a raised piece of pavement after he had been drinking. A health professional asked him how much he had had to drink for the purposes of administering analgesia medication, but there was no discussion of drinking in general. When asked about his drinking career, George said that where he came from ‘drinking was just something you done on a Saturday… just something to do…but now I’m not just going out drinking for the hell of it…there is a purpose to my drinking now’. He feels that drinking in pubs is associated with the three important things in his life: poetry, socialising and music. He also thinks it is a good way of networking in order to gain work and make contacts, ‘sometimes it just happens by accident…I met someone in the pub…wanted me to do a gig’. George suggested that drinking has performed a mainly social role throughout his drinking career and that he does not enjoy drinking at home, ‘it doesn’t appeal to me’. He says that he enjoys going out to drink but ‘sometimes you just need to stay at home and detox …replenish yourself’. He has 2 or 3 days a week where he stays at home and listens to music and this has been the case for the past few years. He has also changed the pubs where he drinks over the past ten years, and often travels out of the district where he lives to visit pubs he enjoys - where they have music gi s g and poetry, for example, ‘there’s something going on there’. George likes pubs where he is likely to bump into acquaintances and people that he knows, but also uses pubs as a way to relax ‘to think about nothing’ and to find material for his poetry. When asked about the next ten years, P said that he would like to be successful and make money from being a poet, but that he was still learning his craft. He would also like to do more with music – to explore all aspects of his creativity. He has no plans to change anything about his drinking, just to ‘take it as it comes’.
88

Case study: P046 – female aged 38, no fun without drink Ten years ago, Wendy ‘was having a good time’. She had boyfriends but no one serious, was working at a job that she didn’t particularly care about and ‘my social life was huge’. At the time, she was drinking ¾ of a bottle of vodka nearly every night, ‘every single night I’d be drunk and hardly ever had a day off’. This partying lifestyle was sustained from the age of about 22 for 11 years, until she met her current partner and settled into a stable relationship. Although she would have a couple of days of not drinking each week, she still continued to consume large volumes of alcohol at home, around 100 units per week. Over the decade, Wendy has had many different jobs as employee and manager. Despite changes in roles and responsibilities, she does not consider her employment to have made any difference to her drinking behaviour, ‘even when I was a pub manager I used to just drink later when the pub was closed’. Over the years, drinking has served many purposes. Wendy did not start drinking until she was 22. She recognised that ‘I’ve never been a confident person … always been quite shy’. Thus, drinking at this time gave her the confidence to go out and mix with others, it ‘made me a social animal’. Furthermore, it helped her when she has had difficulties sleeping, ‘I’ve always been like an insomniac so I’ve got into the habit of just drinking so much vodka that I go to sleep’. However as time passed, the drinking no longer helped her to sleep and she found that she would spend night afte ght s lly stopped having the effect I started doing it for’. r ni itting up drinking, ‘it actua Alth h W identify many functions that drinking served in her life, many seemed oug endy was able toto c e aro ence and positive self-regard. She acknowledged that childhood entr und her lack of confidexperiences ve been a significant factor, in particular, ‘my emotional relationship with my may hamother … I think that’s had a massive impact on how I feel about myself and therefore heavy drinking is j th anything’. Wendy recognised that at first, ust saying well I don’t care I’m not worheavy drinking helped to block out unhappiness and reflected her self-perception, ‘when I think about what I’m doing to my body and doing to myself, I didn’t care about myself either, so it was just reinforcing what I thought my mum thought of me anyway’. The most significant turning point for Wendy happened in 2005, when she conceived the baby she had been planning. This had an immediate effect on her drinking, ‘I didn’t have a problem stopping the drinking it just stopped because I was pregnant and I knew there was a baby inside me’. Overall, the impact of having a baby meant that she ‘calmed down, completely calmed down’. Had she not conceived, Wendy thinks that she would not have made the changes herself and remembers saying, ‘my plan was to have a baby and that would save my life, it’ll save me from an early grave from drinking’. Her GP has made no comments about her drinking but her partner/family regularly comment about the volume. Once her baby was born, Wendy did return to drinking at the weekends. ‘I still love having a drink but I just have to limit it to just once or twice a week …you can’t be a good parent and be drunk, you just can’t’. Despite being ‘happier than I’ve ever been’, she still feels that there are occasions when she needs to drink. She continues to see drinking as playing a necessary role in her social life and ability to have fun, ‘I can’t do that if I don’t have a drink’. Recently though, her drinking has become a source of conflict and reduced to 35 units. Wendy has recently returned to education and is hoping to gain employment in this area. In terms of her drinking, she suggests that it would be unrealistic to think about abstaining in the future, ‘there’s no point in me saying I’m going to stop drinking completely cos in my mind that’s not me … I’ve got to be true to myself’. Wendy is clear that her drinking would always come second to the needs of her child however, ‘it’ll always be a weakness cos I always think of it, I just control it now’
89

Case study: P453 – male aged 62, very heavy drinking but successful and happy. Ten years ago was a good time for Fred. He was living in a million pound house, had a very successful business, had just bought property abroad and was financially in a position to spend time with his family. So 1997, ‘generally yeah it was good and got better’. Not only was he content with his home and job, but also with his family, ‘having Chloe (daughter), who would be five at that time, just gave us a lot of pleasure’. Fred sets his story against a working class background and a childhood of deprivation and neglect. At the age of ten, he was moved across Birmingham as part of the slum clearance and recalls spending his first year in a new school sat at a large table with lots of books, just reading. This is prominent in Fred’s mind as he believes ‘the reading was a big part of enabling me to be successful’. Over th he is talented in the field e past decade, Fred’s daughter has been a central part of his life. Sof sport rea. Focusing on family s and Fred is very involved in helping her to be successful in this alife has been extremely important to Fred because he has some regret of not doing the same in his first marriage, from which he has two older children. ‘I missed them growing up completely … I was just too busy, I was just trying to make a living or make a success of life, or financially a success of life’. Over the decade, his relationship with his first wife has remained strong although, he describes it as having changed ‘more to a friendship’. In 2006, Fred sold his 32-year old business. This was a big change for him as work had been such a huge part of his life and he suggests that ‘there would have been a massive void, but because I’d got another business to go into, that prevented that’. Over the decade, being involved in business has brought Fred a lot of enjoyment. However, he has also made losses at times and recalls a low point when he lost £250,000, ‘but it wasn’t the end of the world … it was a blip’. Another low point that he identified was three years ago when ‘mother died, but we weren’t ever very close’. Over the past ten years, Fred considers his drinking pattern to have remained the same, although since selling his business, he has not been attending corporate events and so his consumption may have decreased. Aside from business meetings and social events such as dinner parties, Fred does not drink during the day. Fred rarely feels that he drinks too much and knows when to stop, ‘I automatically get to a position where I do not want to drink any more … I just can’t drink any more, I don’t want any more’. He consumes around 90 – 100 units per week at present and has drunk over 70 units per week since his 30s. However, as he has not experienced negative affects, he does not consider his drinking to be excessive, ‘never thought my drinking is a problem to me or anyone else and it doesn’t seem to have had any adverse affects at all on me or my life’. Over the past 2 years, Fred has not received any comments from his GP or any other health professional about his drinking. Over his lifetime, Fred considers the role of drinking in his life to be ‘a social thing’. Not only does he consider it to be relaxing but also beneficial when meeting new people, ‘there’s lots of things I’m not very confident about but certainly having a drink helps’. Over the last decade, drinking has been a dominant part of his business dealings and overall, he thinks that ‘drinking has been a positive for me rather than a negative’ With family at the forefront of his mind, Fred thinks that his major interest over the next ten years will be his daughter and recognises that ‘when she flies the nest there will be a big big void’. He perceives that otherwise there will be ‘no major changes’ because ‘I’ve already got pretty well all I’ve wanted’. Fred plans to travel a little more and spend time in his property abroad. In terms of his drinking, he has no plans for any change ‘I don’t think it’ll increase and I don’t think it’ll decrease, I think it’ll probably stay pretty consistent’.
90

PART FIVE: SUMMARY
Around a quarter of participants (28% of men and 23% of women) who took part in every interview have been heavy drinkers at each interview.
These chronic heavy drinkers have higher levels of dependence on alcohol and are heavier smokers than the rest of the sample. They are much more likely to drink alone and at home than other members of the sample.
Participants gave very diverse reasons for heavy drinking. These can be categorised as (i) environmental factors (early environment, response to current circumstances, stress reduction, and response to negative life events); (ii) Individual / cognitive factors (boredom, habit, gastronomic pleasure), and (iii) Social factors (social pressure, pub as social life, drinking culture, and drinking as ‘social glue’
Qualitative analysis suggested that the pub constituted for many participants a very significant setting in their lives. The pub was often viewed as more than just a setting for drinking, and, could in and of itself provide, for many, a real feeling of community.
91

PART SIX: PATHWAYS TO REDUCING DRINKING
In this section, the main focus is on how drinking reduction was achieved, by those participants
who did cut down on drinking during the period of the research project. In the first part,
quantitative analysis is presented, showing how many participants sought and received advice or
treatment for a drinking problem over the course of the study. These data complement those in
Section 3.3., where referral to treatment that is instigated by GPs is described. The difference
between these two sections is that the current section examines advice and treatment that is actively
ought by the participant, rather than being the outcome of a GP intervention.
6.1
From w
concern ber of participants (20-25
elp between waves one and two were significantly heavier drinkers (M
115.7, SD = 80.7) than those who had not sought help57 (M = 77.0, SD = 44.4; t = -2.12, df = 20,
s
This section also includes findings from qualitative analysis based on participants’ accounts of how
and why they reduced their drinking. This includes a section based on interviews at wave five with
participants who were abstinent or drinking at very low levels, and a further section based on wave
four interviews on the relationship between life events and reducing drinking. Following this,
further analysis is presented from wave four, comparing the accounts of those who reduced their
drinking with and without professional help. This part of the report concludes with two case
studies, representing contrasting experiences of reducing drinking.
Seeking help with a drink problem
ave two onwards, participants were asked about whether they had sought any help or advice
ing their drinking over the previous two years. A small num
participants; 8-10%) reported having sought help at each interview wave of the study (see Table
B29, Appendix B). This group was drinking, on average, between 74.4 units to 115.7 units per
week56. Those who sought h
=
p< 0.05). However, there was no significant difference between the levels of drinking amongst
these two groups at later waves of the study. A further difference between the ‘help-seeking’ group
and other sample members is that the ‘help-seekers’ were found to have more days of very heavy
drinking than other sample members58 (see Figure 45 below).
56 Th ge of unit levels relates to the mean at die ran fferent waves of the study.
0.05) and again at the final interview, between those who had sought help between waves five and six (mean = 103.6, SD = 111.4) and those who had not (mean = 49.5, SD = 89.4; t = -2.11, df = 21, p< 0.05).
57 There was also a significant difference in the mean number of ‘heavy’ drinking days in the previous year between those that sought help between waves two and three (mean = 230.3, SD = 107.8) and those that did not (mean = 162.7, SD = 122.8; t = -2.65, df = 257, p< 0.01). 58 This was defined as number of days drinking over 20 units in one day for men, and 14 units for women, over the past year. A significant difference was found between those that sought help between waves three and four (mean = 120.3 , SD = 113.9) and those that did not (mean = 54.2 (SD = 87.9; -2.65, df = 23, p<
92

020406080
100120140
Freq
uenc
y of
'ver
y he
avy'
drin
king
day
s in
last
yea
r
Figure 45: Comparison of mean 'very heavy' drinking days in the last year between 'help-seekers' and others, 1999-2007
Soughthelp andadvice
Did notseek help
1999 2001 2003 2005 2007
Wave of study
or advice
(%)
previous wave interview (SD)
)
drinking since last interview
Seeking help to change drinking did not always translate into receiving treatment. At wave two, 20
participants sought help with their drinking and all of these individuals received help from different
agencies. At subsequent waves however, far fewer participants who sought help then went on to
receive support from an agency. For example, at wave five, 23 individuals sought help but only 8
actually received any help or advice (see Table 16 below).
Table 16: Proportion of sample receiving help or advice for a drink problem, and changes in their drinking, 1999-2007
Received help for drinking
Frequency
Mean unit consumption in
week before interview (SD)
Unit consumption
- Range
Mean unit consumption in
week before
Unit consumption
- Range
Number (%that hadreduced
Wav ) e two 20 (8%) 81.1 (41.9) 0-172 116.0 (81.1) 0-328 12 (60%
Wave three 13 (5%) 75.9 (74.4) 0-217 69.7 (57.1) 0-240 8 (62%)
Wave four 9 (3%) 69.6 (110.7) 0-329 110.4 (123.3) 0-360 6 (67%)
Wave five 8 (3%) 66.9 (77.6) 0-206 52.9 (60.3) 0-162 2 (25%)
Wave six 12 (5%) 63.1 (91.9) 0-271 90.2 (112.6) 0-408 4 (33%)
93

6.2 Receiving treatment
Over the duration of the study, 34 individuals accessed treatment or support for their drinking.
Seventeen participants reported accessing treatment in one two year period, ten in two periods; five
3 two year periods, and 2 participants accessed treatment services in between each wave (see
).
in
Table B30, Appendix B
At each wave, the majority of those who accessed treatment, did so with one agency. However,
some individuals also accessed multiple treatment services. At wave two, the most common
treatment type accessed was a self help group, but at subsequent waves the most popular type of
support was a non-residential alcohol agency (see Table B29, Appendix B and Figure 46). Of the
34 individuals who accessed treatment over the course of the study, eight saw a primary care
counsellor or nurse and four spent time in a residential rehabilitation unit. Two individuals
accessed residential rehab on two occasions and were both abstinent at wave six of the study.
Figure 46: Numbers accessing different treatment types for help with a drink problem 99-07
15202530
Freq
uenc
y
05
1999 2001 2003 2005 2007
10
Wave of study
Other
Self help group
Primary carecounsellor / nurseNights in hospital
Residential rehab
Non-residential alcoholagency
Analysis was conducted59 to compare those who received treatment at some point in the ten years
(n = 34; 24 male and 10 female) with those who had not (n = 225). This showed that those in the
‘treatment’ group were drinking at a significantly higher level at wave one (mean = 114.1, SD =
72.4) than those who had not received treatment to date (mean = 74.8, SD = 42.4; t = -3.1, df = 37,
59 Independent t-tests were carried out at each wave separately, in order to determine whether there was a significant difference in the volume of alcohol consumed by those in the ‘treatment’ and ‘non-treatment’ groups at each interviewing wave.
94

p< 0.00
consum
.3 Reasons for reducing to abstinence or low risk drinking
abstinence or low drinking, and how this is maintained, was obtained
utlook and behaviour over time. As
722 commented, ‘It was the impact of having all those things so close together’. There were,
n was to spend more time with children or
randchildren. For these, there was sometimes also a sense of having missed out on seeing these
5). At subsequent waves, however, there was no significant difference in alcohol
ption between those in the ‘treatment’ and ‘non-treatment’ groups.
Those in the ‘treatment’ group tended to be younger, with 44% in the youngest age group (25-34),
35% in the middle age group (35-44) and 21% in the highest age category (45-55). The majority of
those seeking treatment (38%) fell into the semi-skilled socio-economic group at the start of the
study, but individuals seeking help came from all socio-economic groups. Fifty-three percent of the
treatment group fell into the ‘very heavy’ drinking category at wave one of the study60.
At waves two, three and four, between 60% and 67% of those who had had accessed a treatment
service in the previous two years reduced their weekly alcohol consumption over this time. At
wave five, a quarter reported a reduced intake and at wave six a third said they drank less than they
did two years before.
6
Detail on the reasons for
through qualitative interviews at wave five (in 2005). These interviews were conducted with a
subgroup of participants who had either become abstinent or had reduced their drinking to within
sensible limits, and had maintained this for at least six months. Ten participants were interviewed
about their experience of becoming abstinent and a further 17 were interviewed about cutting down
to within sensible limits. All these participants gave multiple reasons for the decision to cut down,
which generally formed part of a longer narrative of change in o
P
however, five main types of reason given for the decision to reduce or stop drinking.
1. Family and relationships
2. ‘Getting older’
3. Wanting a life change
4. Health
5. Practicalities and changed circumstances
There are some points of overlap between the first three categories, and they can be grouped
together under a broader (core) category of ‘settling down’. First, several participants referred to
reasons relating to close relationships, such as with partners and other family members. For several
participants, a key reason for stopping or cutting dow
g
60 A further 44% were included in the ‘heavy’ drinking volume group and one person was in the abstinent group, who was likely to have been an intermittent heavy drinker
95

children in their earlier years. For others, it was about the practicalities of parenthood. For example,
P506 remarked that, after the birth of her child, she stopped drinking because of having too much
to do and little money: ‘I wasn’t anti drinking or against anything like that. It’s just life’. Others
decreased after realising that it could negatively affect children. For example, P735 stated, ‘my
daughter’s getting hurt by it. She’s coming to an age now when she understands so that’s why I
said, I b
others,
importa
related
experien own, or being isolated from family members because of
ehaving intolerably’. As P664 commented, his partner ‘just turned around one day and said,
u just become interested in different things. You haven’t got the energy and it just loses
its appeal… You can’t be in your mid-thirties and still go clubbing every week. You just
nt to. Your sleep is more important.
d a change of social life. There was some overlap between this
ategory and that of ‘getting older’, since this wish for a different kind of life was often expressed
t abstinence or a major
duction in drinking is decided upon due to a major health event, and this was the case with five
etter do something because I don’t want her to reject me’. For this participant and several
the experience of having themselves been the child of a parent who drank heavily was an
nt factor, since they did not want their child to have similar bad experiences. Other family-
reasons included having a partner who had stopped drinking and was disapproving, or the
ce of relationships breaking d
‘b
‘look, you know, this had got to stop’. She’d obviously had enough. And what she was saying did
actually make sense to me’.
The second category of reasons for stopping or reducing drinking relates to ‘getting older’. This
overlaps with family-related reasons, such as having children and wanting to see them grow up, but
also includes changed priorities, having friends who are cutting down on their drinking, and having
a change of friendship group due to ‘growing out’ of a previous set of friends. For example, P746
described how she and her friends simply became ‘bored’ of going out drinking:
‘Yo
look ridiculous… You just can’t do it. You just don’t wa
Having a nice time in the park with the kinds is more important’.
Some participants talked about the decision to reduce or stop drinking in terms of wanting
something different from life. Typically, these participants had come to feel that they were wasting
their lives drinking, and no longer wanted to be the person they were when drinking. These kinds
of explanations often came from participants who drank as part of a social circle, and the decision
to change drinking often require
c
by those who spoke of moving away from a youthful lifestyle. However, it forms a distinct
category in itself, since it is concerned with people’s perceptions of themselves and who they want
to be. For example, P722, commented, ‘I think I wanted change. I think I wanted something
different for me. I think it was a downward spiral of drink and deception’.
Another set of reasons related to health. A common perception is tha
re
96

participants, three of whom developed liver disease, one who had poorly controlled diabetes and
one who suffered a stroke. In addition, one participant stopped drinking partly because of a non
drinking-related illness which made her lose her desire for alcohol, and several others cited the
physical effects of heavy drinking as one of the main reasons for deciding to stop. Other
participants saw friends becoming ill due to the long-term effects of drinking and decided they had
to do something to ensure that this did not happen to them.
A few participants discussed their decision in practical terms, either as being linked to a desire not
to drink and drive, financial reasons, a change of job, or moving to a different area. For example,
P664 considered his decrease to be mainly due to financial problems: ‘We were just getting the
are things, you know, buying the gas, electric, milk, you know, just the bare essentials’. Another
here was considerable variety in the process through which people went in order to reduce or stop
rinking, and to maintain this over time. Almost all of this sub-sample of 27 participants reduced or
topped drinking without professional help. Only one attended a residential unit and AA, and in
is case the participant was using other drugs in addition to alcohol. One other participant used
A as a source of support and one other had recently been attending an alcohol agency for
ounselling. Other participants all relied on informal support or stated they could ‘do it alone’. For
xample, P446, who described his drinking as having been ‘very heavy’, and who was seriously ill
ue to drinking, stated, ‘I thought, well, I’m not going to be away from my own home for three
ere
two ma
lked about the process as a very indi l process and spoke of having ng will’, so that
they would not need ‘help’. For example, P66 ether he co ed going ol
gencies to help h cut down, replied, o, I wanted to d
n given for not going for treatment was that these participants did not feel they were
evere enough cases to require treat ent. For example, one participant, who had consumed 25 pints
his peak f he i d t ot n tmen e ‘ r an
lea al just li that’. S arly, P664 (referred to above) rema , ‘I didn’t
some people’. Thus, there was a sense for the participants
they di not s se ‘a y ei not w ee nal
elp, or did not fall into the kind of category of drinker who would be seen as meriting treatment.
b
participant, who had suffered a stroke, stated that the need to continue to drive was a major
motivator in his decision to reduce his drinking, since his mobility problems made driving a virtual
necessity. However, these kinds of practical problems were commented upon by a minority of
participants.
T
d
s
th
A
c
e
d
months when I can do exactly the same in my own home as what you do in a clinic’. There w
in ways of talking about this decision not to go for treatment: firstly, participants often
ta vidua a ‘stro
4, asked wh nsider to any alcoh
a im ‘No, n o it for myself. No, no’. A second
type of reaso
s m
per day at o avy drink ng, state hat he did n eed trea t becaus I was neve
alchy. I could
think I was that bad really, compared to
ve it one ke imil rked
that since d ee them lves as ddicts’, the ther did ant to s k professio
h
97

Most, however, drew on the support of others to achieve this change. For two participants, religious
bing and partying. As P726 commented, ‘I get emails and texts
aying that you are not the bubbly outgoing person that you used to be, and I’m thinking, ‘I have
or the abstinent participants, the decision to choose abstinence rather than low drinking was
ainly because of feeling that drinking is ‘all or nothing’ for them, and that it is best to avoid
rinking altogether. Abstinence was often seen as a positive choice, and only one participant stated
oval of his partner, but all others were
, not only to their health
do tomorrow and if I do have too much to drink tonight, because sometimes it can just be a
faith was a major factor in both the decision to cut down, and in being able to maintain abstinence.
The majority of participants, however, received most support in their decision to become abstinent
from their family. In order to sustain change, however, most found they had to change their
friendship groups, since many friendships had been based around drinking and pub culture. For
example, P272 commented, ‘I basically cut out people who really weren’t helping me and I tried to
hone in on people who were positive’. Another remarked, ‘I no longer fitted into that social circle’
(P722). For some, there was considerable pressure to continue drinking, or to return to their
previous lifestyle of drinking, club
s
done this for a while, and you are still on this treadmill, going round, and when are you going to
get off?’’ The main ways of resisting such pressure were to feel the gains of a new lifestyle,
involving spending more time with family, getting physically fit, or finding new hobbies, interests
and social groups. For many this also involved changing where they spent their leisure time, since
most did not want to spend time in pubs anymore. This was difficult for some of those whose social
lives had always involved pubs and drinking. For example, P611 decided to change the pub in
which he drank, because in his regular pub he was known as a heavy drinker (‘the drunk in the
corner’). He did not want to stop drinking in pubs altogether, because he was concerned that he
would not have a social life, but felt able to reduce to two pints per day by drinking in a different
pub.
F
m
d
that he would drink at a low level if it was not for the disappr
happy with their decision to be abstinent and saw many benefits from this
but in their ability to get the most from life. As P001 stated, ‘It’s life-giving, you know. You start to
live again’. Those who chose to cut down rather than stop were more likely to describe this as a
‘natural process’ and not an active decision. For example, P289 commented,
‘It wasn’t a conscious decision. I didn’t say, ‘right, that’s it, I’m not drinking anymore’. I’d
just think, I don’t want to go out tonight. I can’t bear it and I’ve got work. I’ve got a lot to
couple of glasses of wine now and I feel crap in the morning’.
These kinds of remarks, that it was a gradual process, and did not involve particular strategies or
conscious decisions, were common, particularly amongst those who reduced drinking rather than
deciding on abstinence.
98

Many participants also commented on the reduction in drinking being so beneficial that they did
ot want to return to their previous drinking level. For example, severan l commented that they had
vents and their pattern of drinking. The events included illness, becoming a parent,
l context of the event, and whether the
ecrease in drinking. These life events were connected with close relationships,
mployment or education, and the reduction in drinking was in response to their responsibilities for
d, ‘unconsciously, all the time, I daren’t have a lot to drink
travelled to places they would not previously have visited, that they had more money, and that they
appreciated feeling physically better than before. As P723 remarked, ‘it all changes your outlook
on life and once you have changed it is difficult to go backwards’.
6.4 Life events and change in drinking
Qualitative interviews were conducted at wave four (in 2003) with a subset of 34 participants who
had experienced a significant life event during the previous two years61. The purpose of these
interviews was to gain greater insight into the participants’ understanding of the relationship
between these e
becoming a carer of an elderly or ill parent, bereavement, starting a new job, and getting married.
Participants responded in diverse ways to the change. Seventeen decreased their consumption, nine
increased drinking, and eight did not alter their drinking. This response seemed to depend on the
nature of the life event, the participant’s perception of the event, their understandings of the
nctions and meanings of their drinking, the sociafu
individual was already in a process of personal change. Analysis of interviews with those who had
reduced their drinking led to reasons for decreasing being categorised in three ways: ‘having to’,
‘needing to’ and ‘being able to’ cut down their drinking.
‘Having to’ cut down
Under the category of ‘having to’, caring responsibilities for others were a clear factor in leading
participants to cut down. Events that required the participant to stabilise life in some way, such as
being a carer of an elderly parent, or becoming a parent, appear to have been more likely to lead to
a sustained major d
e
others or for their career. This category can be further sub-divided into having to cut down because
of external events, such as illness of others, and having to cut down because of an internal decision
to achieve a goal, such as starting a new job or course. Amongst those who cut down due to
external events, four (two male and two female) described themselves as having to reduce their
drinking because of caring responsibilities for elderly, ill parents. They drank less in order to be
confident that they could be relied upon to cope in an emergency. For example, P572, a woman
with two elderly, frail parents commente
because, at any time, the phone could ring’.
61 Further details of this analysis can be found in Rolfe et al., 2005.
99
In general, these participants did not describe specific strategies to cut down. Rather, they felt they
ad to cut back if they were to achieve other goals, and that cuh tting back was made more possible
p myself drinking’. He did this by avoiding
rinking. Most cases coming into this category were of serious health problems. In two cases,
tomach cancer or liver damage. Despite an eventual diagnosis of gastritis, he considered this
ll’. He commented, ‘You need that scare to do it… You don’t pack it in
nd
gh blood
time he was drinking an average of 130 units of alcohol per week. He
by their change in lifestyle and routine. For example, P090, who started an Open University course,
remarked, ‘you can’t study if you’ve had a drink, so I had no choice really’. Another participant, a
lone parent with four children, tried to get back into the job market and, after a great deal of effort
and training, managed to gain employment as a driver. He commented, ‘all the time I was thinking
about getting a job driving, I knew in my own mind I’d got to stop drinking, cut down drinking’. He
was especially aware of the possible ramifications of drinking, when driving on an early morning
shift, and again this made him think, ‘I’ve just got to sto
the pub, but generally felt that it had not ‘bothered’ him. It can clearly be argued that these
participants did not have to decrease drinking, since they could have prioritised drinking over their
goal. Nonetheless, their own explanations of the situation were that they had no choice if they were
to achieve their aim. For those who described their decreased drinking in terms of ‘having to’ cut
down, this did not involve a conscious effort or particular strategies. In effect, they felt they were
no longer in a position to drink as much, and that decreased drinking was a side effect of changed
ircumstances. c
‘Needing to’ cut down
Six participants described reducing their alcohol consumption because of the direct impact of their
drinking on their lives and well being, leading them to feel they ‘needed to’ cut down their
d
participants described having reached ‘rock bottom’. This had been triggered by an event, leading
to a process of self-reflection and a re-evaluation of their drinking. Both then decided on
abstinence. For example, P016 developed gastric problems and his GP suggested this could be
s
illness to be a ‘wake up ca
until you’ve had that scare and reached rock bottom’. He reduced his drinking from 150 units a
week to abstinence, and had remained so for thirteen months at the time of interview. Four other
participants had health problems that led them to make major reductions in their drinking,
including tachycardia, high blood pressure, suspected liver damage, mild cardiac damage a
abdominal pain. In each case, they believed they needed to reduce their drinking, but this was
because they were told this was necessary by a doctor. For example, P007 developed hi
pressure, possible liver damage and mild cardiac problems, and was advised to reduce his alcohol
intake by his GP. At the
stated,
100

‘Someone who was in my position would have to be pretty stupid not to think about the
amount of alcohol they were drinking’, particularly whisky, or not to cut back…. When
they tell you these things it is reasonably sensible to do something about it’.
owever, in these cases, after an initial major decrease, the participants subsequently re-evaluated
e need to drink less, leading to the view that the doctor’s advice had been exaggerated or
sufficiently supported by evidence. Each described having weighed up the available evidence for
nd against the need to decrease drinking. They responded more to advice to decrease (rather than
stop) drinking, and to specific evidence of the impact of alcohol on their personal health status
ather than general warnings about the health effects of alcohol). Having been through this
rocess, and in some cases, having received test results, they decided that the evidence that they
hould cut down was not conclusive, and that they did not need to do cut down. For example, P007
creased his drinking towards its previous level, and explained this as follows:
’At the end of the day, only I can make the decision…On this occasion I have listened to
what people have to say, I’ve asked questions from professional people and I have worked
it out for myself…I did a risk assessment on myself’.
imilarly, P073 reduced his drinking from 220 to 42 units per week as a result of advice from his
P and from a consultant, when he was having investigations for abdominal pain. The results of a
can on his liver, however, did not provide conclusive results, and he decided there was no
vidence of liver damage. He then increased his drinking, though not as high as previously,
rinking an average of 116.5 units per week. He switched from drinking pints of beer to shandies,
ut continued to drink the same volume. The experience of having cut down so far left him feeling
bit annoyed …that I had spent months cutting down on drink, which I enjoy, and there was no
eason for it, because it was nothing to do with the liver, which I had said all along’. He was
articularly annoyed to have missed out on nights at the local pub, ‘because it is my social life’.
h not quite to the same level as
ts framed their drinking change in terms of no longer wanting or needing
e a by-product of positive change in a different area
of their life, such as successful m new relationship or a change of job. These
events were generally said to have more settled state of mind. Others reduced their
drinking due to a negative event, such as bereavement, bankruptcy or being the victim of a crime,
leading to a change in priorities an nk.
H
th
in
a
to
(r
p
s
in
S
G
s
e
d
b
‘a
r
p
These participants subsequently increased their drinking, thoug
before the warning.
‘Being able to cut down’
A further seven participan
to drink. In many cases this was considered to b
edical treatment, a
led to a happier,
d decreased desire to dri
101

Some of these participants said th alcohol to relieve depression and stress.
Alleviation of depression or stress drinking possible. For example, P030
found that changing to a different e a major difference to symptoms
of depression. He explained, ‘I no in the morning that I used to
ave. I start the day with a smile now’. This had resulted in a loss of motivation to drink, as he had
an affair, which was a source of considerable stress. When this ended and
he began another relationship, she felt much happier and calmer. She considered this to be the
er being able to reduce her drinking.
haven’t, but looking back I must have been
under an awful lot of stress …drinking the amount I was drinking then was certainly
helping me to sleep at night’.
rather different perspective was provided by a female participant (P412), who was able to cut
own following the death of her father. She accounted for this in terms of the nature of her father’s
ust have subconsciously affected her
hilst she had not previously felt sufficiently worried about her own
ad lost a lot of her desire to drink, because of
minds me of my dad and vice
r to sometimes avoid situations that were likely to trigger thoughts about her
her life and the things that gave her
Seeking change with and without professional help
At wave four of the study in 2003, in-depth qualitative analysis was conducted to explore the
experiences of those participants who were taking action to reduce their drinking. At this stage of
the study, the Readiness to Change questionnaire was used to identify 36 participants who were
ey had previously used
then made a reduction in
anti-depressant medication mad
longer have the feeling of doom
h
often used alcohol as a way of masking his feelings. He also had less time for drinking, as he was
more motivated to do other things, such as a course in computing. In another case, a female
participant (P189) was able to reduce her drinking once her personal life stabilised. She had
previously been having
s
main reason for h
In other cases, a seemingly negative event was considered to have been the key trigger to decreased
drinking. One man (P432) described reducing his consumption when his business went into
liquidation and he began working as a gardener. This meant that he had less money for alcohol, but
he considered it more significant that his new employment was more satisfying and much less
stressful. He commented,
‘I didn’t realise at the time but a lot of that may well have been comfort drinking, and
looking back, I mean, you never think you’re living under stress. I suppose stress is a bit
like depression, if you think you’ve got it, you
A
d
illness, which was alcohol-related. She considered that this m
desire to drink and smoke. W
health to consciously change her behaviour, she h
thinking ‘that’s what killed him in the first place… drink just re
versa’. This had led he
bereavement. Her father’s death had also led her to re-evaluate
pleasure.
6.5
102

taking action to change their drinking. These participants were asked to discuss this process in
dep T ged their drinking ‘naturally’ without professional intervention
(the e p’), whilst a further 16 had received some kind of professional help
(the ro
Ana i oup differed from the self-directed change group in
the e eling ‘in control’ prior to seeking help. The feelings of many in
the professional help group prior to seeking help were exemplified by P359 who felt, ‘My drinking
l’. These feelings contrasted sharply with members of
e self-directed change group who felt self-sufficient in their ability to control their drinking. As
under our control’.
, and because I’ve got an eleven year old son and I want to
ee him grow up and be part of his life’ (P127, Professional Help Group).
th. wenty of the 36 had chan
‘s lf-directed change grou
‘p fessional help group’).
lys s revealed that the professional help gr
ext nt to which they reported fe
was getting out of hand, totally out of contro
th
P615 stated, ‘I don’t think we needed it (help). It was
The professional help group also described having many more drinking related problems than did
the self-directed change group. P465, for example, had sought professional help because the
interaction between his manic depression and drinking left him feeling ‘physically and mentally at
rock bottom’. Neither group however was changing drinking because of health reasons per se, but
due to the impact of their drinking on their social roles. For example: ‘I try and spend more time
with the kids, you know. I know the drink side does interfere with that really... Also you know it’s
not really fair on my wife. She’s very good supportively to me, and I’m not really reciprocating’
(P141, Self-Directed Change group). Similarly, another male participant described how he wanted
to stop drinking, ‘because of my health
s
The professional help group also differed from the self-directed change group in terms of their
psychological dependence on drinking, as measured by the Leeds Dependence Questionnaire, and
differed in their unit level of drinking at the previous wave three interview in 2001 (see Table 17
below). The professional help group was found to be more dependent on drinking, and consumed
more units of alcohol in 2001. However, this gap had diminished substantially by 2003.
103

Table 17: Mean unit levels of drinking, by gender, in the week before interview in 2001 and 2003 and LDQ scores in 2001 and 2003 for the self-directed change group and the professional help group.
2001 2003 Units LDQ score Units LDQ score
Men Women All Men Women All Professional Help Group
n=
12
4
16
12
4
16
mean (sd.)
93 (86)
51 (34)
11.13 (9.6)
58 (91)
19 (16)
5.80 (6.8)
Self-Directed Change Group
n=
13
7
20
13
7
20
mean (sd.)
41 (35)
31 (24)
4.95 (3.7)
41(39)
24 (18)
4.20 (3.0)
One possible explanation for why the professional help group seemingly delayed seeking help for
their drinking lies in their apparent alienation from sources of collaboration to change their
drinking. The self-directed change group, who seemed to change at an earlier stage, described
changing in collaboration with others, friends and partners, who had concurrently wanted to make
a change to their own drinking. The following extract provides an example: ‘We’re very close, we
go out every time together...so everything’s down to a group decision with us.....we’re all married
and between the ages of 45 and 50 now, so that’s got a lot to do with it....the group decision made
it easier, us all deciding’ (P615).
The professional help group, on the other hand, described feeling alienated from collaboration prior
ut professional help. Those who sought professional help tended to feel more ‘out
f control’, and perceived themselves as less able to draw on the collaboration and support of
to seeking help. The possibility that such alienation is one reason that change is delayed was
supported by findings from a third group of people (n=24), again identified using the Readiness to
Change questionnaire, who were ‘contemplating’ changing their drinking. These ‘contemplators’
predicated the success of future change on the availability of collaborators. For example, P771
thought that his ability to change his drinking in the future depended on the ability of his partner as
well as himself to ‘make a joint decision to try and reduce’. In summary, those taking action to
reduce their drinking can be considered to fall into two broad groups, according to whether they did
so with or witho
o
others.
104

6.6 Case studies of those who have reduced drinking
Case study: P358 – female aged 63, abstinence following liver disease. Ten years ago, May was working as a shop manageress with up to thirty staff. She lived alone in a flat above the shop and had been in a relationship for almost a year, ‘when we first met, we just sparked off each other you know it was just brilliant’. Over the following 7 years, this relationship proved to be disastrous, as her partner became violent. He had introduced her to vodka and she recalled that as the violence escalated, so too did her drinking, it became of ‘prime importance, sustenance, confidence, it kept me going when I wanted to just lie in bed and pull the covers over my head …it meant everything to me. I lost my self esteem, I lost my teeth …broken jaw, broken wrist, he broke my arm …cracked my ribs’. This relationship not only impacted on her self esteem but also on her social life. Over the years, because no one liked her partner, May became isolated, ‘and the only friend I had then was basically Paul (partner)’. Later, when her partner was violent to her at her place of work, this led to the loss of her job. So, May moved home and found a job working for the minimum wage, remaining in the relationship with Paul. Eventually, in 2004, she decided that she had had enough, ‘it took me a long while to firmly decide no, that was it, that was enough, I was never going to be harmed again’. Throughout this difficult time, May was also trying to cope with the deteriorating health of her mother and was forced to let her go into a nursing home. Over the decade, May also isolated herself from her children, ‘I kept them at a distance, especially when I was drinking, way at arms length’. However, just over two years ago, her health began to deteriorate and because of their concern for her well being, they persuaded her to move nearer to them, which she has found extremely difficult, ‘ I loathe where I live, I loathe being here because … you can’t walk out the door, everybody knows who you are’. Shortly after moving, her mother had a stroke and died and May felt that she had to take on a new role that she wasn’t ready for, ‘I moved up into her shoes and they expect the same high standards that my mother would, but I’m not the same person, I’m not my mother’. Due to her unhappiness, May continued to drink heavily and her health continued to deteriorate. She now has diagnoses of emphysema, osteoporosis, depression, fatty liver and a heart condition and has fallen three times in the past year, resulting in inpatient hospital stays. The condition of greatest concern to the medical practitioners was the severe liver damage from excessive alcohol use. May acknowledged that she drank for days without eating. Drink has played a significant part in the last decade, particularly during the years she was experiencing violence, ‘the more it happened the more I drank’. Although she was drinking a lot at the beginning of the decade, this escalated over the years from around 200 to over 300 units per week. Once near her family, her alcohol use continued to remain high because of her unhappiness. Following each admission to hospital, May abstained from drinking for a few weeks and since her most recent visit, has continued to abstain for 6 weeks. Looking back over her lifetime, May recalls that she grew up around drink as her family were publicans. Over the years, she has used alcohol to get through difficult times and the role of drink was to ‘blot out things I didn’t want to think about …it gave me the confidence in a way to get up and get on with it’. Despite feeling that she is not so uptight, she does find it hard to cope without alcohol, ‘I do miss the drink very much …it was my answer that solved everything’. However, she feels that her personality is returning and has begun to assume her parental role again, ‘now we’re a family, we are a family, I’m mum again, they know I’m not drinking and they know I’m mum again’. Furthermore, she has taken on her responsibility as a grand mother and been trusted with her grand children’s care, ‘and they love me and I love them …that’s another reason why I don’t want to drink, I couldn’t bear to lose that’. Despite a difficult decade, May’s hope for the next ten years is to ‘enjoy them. I would like to stop off alcohol, I would like to go on a damn good holiday, I would like to make friends or join in a couple of societies …I would like to have a bit more get up and go about me’.
105

Case study: P752 – male aged 46. Abstinence following a spiritual experience. Ten a t ye rs ago, Jim had just started teaching in a college part-time. He used to buy a few cans alunchtim e e to drink during the afternoon and smoked cannabis most days. Towards the weekends hwou aine. He felt ld drink even more, and do different drugs, mainly opiates, sometimes cocresigned to this lifestyle, but ‘totally unaware that I wasn’t really doing anything with my life. Totally unaware that at one stage my wife was considering divorcing me’. Jim and his wife had been married for about a year then, and had two children, but he didn’t find time to spend with the children. He was drinking around 64 units per week and ‘I wouldn’t have said I was unhappy, drinking, because I wasn’t. I really enjoyed it’. He couldn’t see any problem with it, although it had started to impact on his ability to work. Jim recalled that his father was ‘always drunk, all his life… you have this whole thing in the family where drinking and stuff is acceptable. You know, like father like son’. In his childhood, ‘there were a lot of fights and arguments … because of alcohol’, which ultimately led to his parents divorcing. Jim recalls that as soon as he was old enough, he would escape from witnessing the abuse of his mother and go out drinking himself. His drinking continued into adulthood and escalated. His brother had an accident when drunk and was left with a permanent disability, but is still drinking heavily, and considered to be alcohol dependent. One day, eight years ago, Jim went to church with his wife. He hated it, and was verbally aggressive to the people there. A minister prayed and said that anyone who prayed with him would be saved. He prayed and ‘absolutely nothing happened’. He was furious and went outside, looked up at the sky and swore at God. The preacher then came out and called him back in, asking if he had accepted the Lord as his saviour. He went back in as the preacher had offered to pray for him, and ‘boof, that was it. Everything went black. I thought ‘what’s going on here?’ I just thought, I’m nowhere near myself … I’m not in my own body. I was aware that I actually had a spirit’. Jim felt God put his arm around him, and realised that God was real. ‘I just realised he was real and as soon as I realised that, this heat filled me up from my toes right the way through my head. Whoosh! And obviously it was the Holy Spirit coming upon me’. He didn’t change overnight, but gradually decreased and stopped using both alcohol and drugs over a period of 2-3 months and has been abstinent ever since. His main source of support in this process was Bible School and has now become a Bible Teacher himself. He was then able to go to college and took a teaching qualification. He didn’t have a day off work in 12 months. ‘Things did change because I’d got the Lord in my life, and because I was able to overcome addictions, because I was definitely addicted’. Jim knows that any time he gets an urge to smoke or use substances he just goes and prays and the urge will leave him. He occasionally thinks ‘oh, I could do with a glass of wine, but that soon passes’. He knows he has to be abstinent because he couldn’t be a moderate drinker. Two years ago, Jim started studying for a religious diploma and began training to be a pastor. He now works as a minister for his church. In the past year, he has officiated at two funerals and a wedding. The first funeral was his father, who died after a long illness with cancer. He then officiated at the wedding of his mother who married her long-term partner. Finally, he buried an old friend, who had been a very heavy drinker, and who committed suicide. This was very difficult for Jim to do, but he felt it was important to do it for the friend’s family. Over the next decade, he has made his mind up that there won’t be any more alcohol in his life. ‘I’ve made my mind up to make a stand against that’. Jim can’t make firm plans for the future, because ‘you never know where you’re going to be called next’, since God may call on him to work somewhere else, even in another country, and ‘you don’t have much choice in these matters’. For this reason he chooses instead, ‘to do what I can do where I am’.
106

PART SIX SUMMARY
Between 8–10% of the sample had actively sought help for their drinking at some point over the previous decade.
Those who sought help tended to drink heavily more frequently than other sample members.
Thirty-four members of the sample received treatment for alcohol-related problems over the ten-year period. The most common form of treatment was through a non-residential alcohol agency.
Those who sought and received treatment tended to be amongst the younger sample members. They also tended to be in the ‘very harmful drinking’ category at Wave One of the study.
The main reasons given for wanting to stop or reduce drinking were: settling down (responsibilities for family, new relationships, or ‘getting older’); wanting a life change; health; practicalities and changed circumstances.
Participants who cut down without professional help tended to comment that they did not need professional help, due to ‘strong will power’, or because they did not perceive themselves to have a sufficiently serious problem to require professional help.
107

PART SEVEN: STORIES OF CHANGE OVER TIME
project, qualitative interviews were conducted with each participant, in At the final wave of the
which they were asked to tell ‘the story’ of the last decade, during which time they had taken part
in the research project62. Several types of stories were found to be commonly told by participants,
including the following:
Main story types:
Success stories
Tragic stories
‘Settling down’ stories
‘Stable content’ stories
Stories of ‘still searching’
Stories of surviving adversity
Stories of overcoming adversity
In the following section, some of the most common of these story types are described in more
detail, namely: ‘tragic stories’, ‘success stories’, and ‘settling down’ stories63. Together, these
represent some of the extremes of negative and positive experiences of this ten year period,
mongst this sample.
re defined as stories in
n years – in which things may have been
‘better and ‘better’. The success stories are about self
ves. Occasional
ded bereavements, relationship endings, redundancies and health
and often turn these events into positive learning
heir drinking over the decade and almost 75% are in long-term
a
Success stories
Thirty participants told success stories at their final interview. These we
which feature improvement more or less throughout the te
at a bad point 10 years ago, but have got
awareness and self development. Individuals in this group enjoy happy, fulfilled li
negative decade events have inclu
scares but in general, the group cope well
experiences or triggers for change. Employment and relationships seem to be major factors in this
group. Over 75% have reduced t
stable relationships.
62 See Appendix C for details of the interview guide. 63 Analysis was carried out using a form of narrative analysis (see Lieblich et al., 1988). Space precludes full discussion of all story types in the current report.
108

Features of participants telling ‘success stories’ (in 2007)
Gender: 24 male & 6 female
Relationship status: 22 in a relationship & 8 single
Drinking trajectory: 23 reduced, 1 increased, 4 stable and 2 unclear
Mentioned divorce: 7
Employment status: 24 employed, 4 retired and 2 unemployed
Mean age: 44.7 (range 34 – 65)
Mean unit consumption: 36.7 (range 0 – 132)
Several themes emerged from analysis of these accounts, as follows:
ous; high achiever
hese are described in further detail below.
continue to progress. All are able to recognise
miting factors in their lives that may hinder their progress. These factors include unrealistic
iends, partners and alcohol and they seem happy to leave these behind. For this group,
wareness of ageing (516, 591, 762)
, there is a general awareness of the ageing process and slowing down. All three
Ambiti
Awareness of ageing
Maturing; becoming responsible
Creative, self discovery, self development
Saved by ‘knights in shining armour’
New paths alleviate stress
Active lifestyle change
T
Ambitious, high achiever (734, 370, 747, 793, 91164)
For this group, new jobs have been a catalyst for progress. They are all motivated, driven hard
workers and there is a general feeling of becoming more organised, structured and responsible than
at previous points in their lives. They all aspire to be high achievers, whether through work status
or material gain and are confident that they will
li
ambitions, fr
drinking has been and largely continues to play a social role. Previous heavy drinking was very
much influenced by work culture or community culture. Four of the five in this sub-category have
reduced their drinking in order to progress, and the one that has increased his drinking has moved
into a work culture of heavy drinking.
A
For this group
talked of an increased attention to health and a desire to lead healthier lifestyles. All three show an
64 Numbers in brackets indicate participant identification numbers
109

interest in hobbies or outdoor social activities and have more time for themselves or others. There
is a sense of becoming more responsible, calming down, taking personal responsibility and
becoming less assuming. Two of the three in th group have experienced bereavements and the
ienced a health scare, which may have been the trigger for increased age and health
general feel of maturing, growing up and becoming more
sponsible/taking more control of their lives. For some there is a sense of growing personal
be a growing sense of social responsibility. There is a
ve away from these risks. All seem to have stable employment and
ave made steady work progress. The role of drinking in this group is mainly associated with
discovery, self development (234, 215, 347, 483)
his group all seem to have experienced turning points which have led them on a journey of self
ated to realise their
otential and move forward. All four have either acquired new skills or had their skills recognised
drinking for three of the four was as a means of escaping
ifficulties, pain, boredom/isolation). The current role of drinking is social and for enjoyment,
rought happiness and contentment. Both are women and have become happier
nd calmer within themselves. The stories include ideas of moving away and creating a better
is
third has exper
awareness. All three have reduced their drinking. Drinking has been associated with socialising,
reward and pleasure.
Maturing, becoming responsible (657, 189, 083, 497, 798, 584)
For this group, there is a
re
responsibility and for others there appears to
feeling of settling down, though not in the traditional 2.4 children way. This is about becoming
more content with themselves and more relaxed and calm. Half of this group mentioned an
awareness of risk factors, such as substance use, drink driving and offending and seem to be
making a conscious effort to mo
h
having fun, enjoyment and socialising. However, over the decade, drinking has become less of a
priority and less desirable. Four of the six have reduced their drinking, one has remained stable and
the other’s drinking trajectory is unclear.
Creative, self
T
enquiry, self-awareness and self-development. These journeys have led to personal growth,
strength, confidence and a taking control of their lives. They have been motiv
p
and are all creative types in various ways (practical, musical, inventing, poetry). There is an
increasing sense of pride, happiness and fulfilment in all four stories and two mention enjoying a
feeling of belonging. The role of
(d
relaxation and creativity. Two of this group have reduced their drinking, one has remained stable
and the other has a fluctuating drinking pattern.
Saved by ‘knights in shining armour’ (064, 472)
Two stories fit into this group and have in common the idea that they have been rescued from an
undesirable life by a man. These new relationships have given a new lease of life and triggered
changes that have b
a
110

quality of life. Previously, both drank in order to deal with their circumstances, whether that be to
, the general feeling is one of positivity, balance and making the most out of life. Previous
rinking roles include stress/pain relief and work culture drinking, however, now, they all describe
ness. Individuals in this group are unhappy, lonely and unfulfilled, with little sense of
urpose. This group have generally not experienced any positive events or high points in the last
fit in, relieve stress or escape from unhappiness. For both, the role of drinking is now social,
enjoyable and contributes to relaxation. One woman’s drinking has reduced, whilst the other
remains stable.
New paths alleviate stress (007, 738, 145)
In this group, these individuals have all chosen to take a new path relating to a change in
employment circumstances. These changes have brought about a reduction in stress and thus
feelings of being more relaxed and easy going, calmer/more tolerant and contented. There is a
sense of stability in these stories and financial security/freedom. Despite a hint of health concerns
in two
d
enjoying drinking and see it as serving a social purpose. All three in this group have reduced their
drinking.
Active lifestyle change (146, 002, 802, 284, 523)
This group have all made active decisions to change their lifestyle, either as a means of getting out
of a rut or to fulfil a need (e.g. for meaning, companionship, wealth etc). Four of the five in this
group have moved in order to establish their new lifestyle and make a fresh start. In all five stories,
there is a sense of achievement and reward for taking personal responsibility for the positive
changes they’ve made. Health is mentioned in four of the five stories, either as a health scare, or a
general desire to lead a healthier lifestyle. All five in this group are in relationships and have all
reduced their drinking.
‘Tragic stories’
Twenty-two participants told tragic stories. These are characterised by loss, isolation, deterioration
and hopeless
p
decade. Relationship breakdowns, loss of mothers (50%) and incapacity to work (mainly due to
mental health difficulties) are major factors in this group. Only two people in this group are in a
long term relationship, one of whom is unhappy in this relationship. The majority are single due to
relationship breakdowns and the others have not had a relationship at all in the past decade.
111

Features of participants telling ‘tragic stories’ (in 2007)
Gender: 20 male & 2 female
Relationship status: 20 single & 2 in a relationship
Drinking trajectory: 2 remained stable and high, 4 increased, 5 reduced and 11 fluctuated
Mentioned divorce: 9 divorced & a further 3 long-term relationship breakdowns, 10 did not
mention divorce
Employment status: 15 unemployed, 6 employed & 1 retired
Mean age: 50.2 (range 33 – 66)
Mean unit consumption: 86 (range 0 – 294.5)
There are a number of themes running through these tragic stories, as follows:
Primary themes: loss; social isolation; coping with mental health problems; life as unfair.
Secondary themes: hopelessness; low self opinion; physical illness; routine.
These are described in further detail below.
oss
his is possibly the most common theme within the tragic stories. The losses relate to two areas:
mployment and relationships. The employment losses are extremely prevalent, either through
redundancy or an inability to work due to deteriorating physical or mental health. Some
articipants in this group talked about the loss/lack of a role or purpose in their lives. The
lationship losses include the breakdown of intimate relationships, the loss of contact with
hildren and the death of parents (mainly mothers) or friends. Around a quarter of this group
identify their own drinking as being a major factor in losses.
ocial isolation
his is a common theme running through these stories. For many, their situations, (often as a result
of losses) have left them feeling socially isolated and sometimes socially excluded. This has led to
n overwhelming sense of loneliness, being stuck on their own and for some, feelings of alienation.
encompassing, often resulting in social isolation and incapacity to work. Although some do not
L
T
e
p
re
c
S
T
a
One or two have withdrawn themselves due to feelings of not coping with life.
Coping with mental health issues
Mental health issues can be identified in almost every story in this group. The participants talk of
feeling stressed/under pressure, depressed and sometimes suicidal, anxious, paranoid, grieving.
One mentions post traumatic stress disorder and another has a diagnosis of schizophrenia. There is
a general sense of deteriorating mental health and for some, mental health issues are all
112

mention specific mental health issues, they talk of a deep sense of unhappiness, emptiness and
hollowness and many lack the motivation to make any changes and report a sense of helplessness.
to feelings of emptiness,
security, helplessness, being trapped and having no purpose or role in life. For some, these
e to
eteriorate and death may come early and may even be welcomed.
L
A general sense of low self worth runs through these stories, though is not so evident in those that
consider life itself to be unfair. Individuals in the tragic stories group talk about low self-esteem,
self-blame and guilt, self loathing, regret and failure. For a few individuals, there is little insight
i ion and they present flattened affect.
Physical illness
A ltitude of mental health issues within the group, many individuals also suffer from
physical health problems including: gout, stomach ulcers, epilepsy, IBS, thyroid problems, arthritis,
cancer, liver disease, burst spleen, diabetes and heart attacks. Many of these illnesses are related to
heavy drinking.
he role of drinking within tragic stories
Around half of this group have been drinking heavily on a regular/daily basis since their teens.
Whereas the role of drinking in the success stories was mainly to do with socialising, pleasure and
Life is unfair
Some of this group put emphasis on being treated unfairly. These feelings range from being hard
done by at work to feeling abused, harassed or victimised. The stories for which this features as the
main theme give a sense of not being in control of what happens to them, being a victim. There are
slight undertones of self pity. Individuals that have experienced these feelings of injustice or
victimisation are resentful and some even bitter.
Hopelessness
In addition to one of the primary themes listed above, in almost every story there is an element of
hopelessness and pessimism for the future. This feeling is often linked
in
feelings have resulted in careless/reckless behaviour with an expectation that life will continu
d
ow self opinion
nto emot
s well as a mu
Routine
Although this does not apply to all stories in this group, some individuals seem to have developed a
daily structure or routine around their drinking, which may replace the lack of any other external
structure due to lack of employment or relationships. This routine is very rigid for some.
T
113

relaxation, these purposes are only mentioned a handful of times in the tragic stories. Individuals in
this group acknowledge that they drink either to deal with negative feelings, in order to function or
because they have nothing else in their lives. Examples are shown below:
• Drinking to function: dependency, necessity, crutch, habit, part of life
• Drinking to fill a gap: something to do, for company, to fill a void
• Drinking to cope with feelings: take the edge off, block out, self-medicating, ease guilt,
reduce anxiety and depression, for confidence, to anaesthetise, blank out
The mean unit consumption in this group was 86 per week, which constitutes heavy, harmful
drinking four times higher than the recommended sensible guidelines for men.
‘Settling down’ stories
Twenty-three participants told stories in which the predominant theme was of ‘settling down’.
g on
r
n age at which this
no longer appropriate cause of responsibilities (relationship, parenthood, career) and therefore
top doing it. Often found in eir thi s old
The settling down stories are generally about adjusting fro ee, social
cused lifestyle, typically ncluding marriage and children. With the exception of one,
s in this group happily e settling dow sition and accept the inevitable
increasing responsibilities of fam d work life. Ther general sense of ing and
g. All but two individua this group are in fu e employment and those that are
not, have given up work to look after children. 96% of the married or in long term
and only 2 have previously been divorced. Lifestyle change has naturally led to a
decline in drinking over the course of the study. Although 2 people reported that their drinking had
e stable, there were no reports of ncreas in con within he gro
n’ stories (n 2007)
These were similar to the success stories, but are characterised by a story of change and takin
sponsibilities. Classically, this is someone who has had quite a hedonistic and wild past (fore
example, partying / clubbing in their youth, drug-taking etc). They then reach a
is be
s participants in th rties, but are sometime er.
m a carefr and active lifestyle to
a family fo i
individual make th n tran
ily an e is a matur
progressin ls in ll tim
group are either
relationships
remain d i es sumption t up.
Features of participants telling ‘settling dow
Gender: 15 male & 8 female
Relationship status: 20 married, 2 in a long term relationships & 1 single
Drinking trajectory: 22 reduced and 1 remained stable
Mentioned divorce: 2 had been divorced
Employment status: 21 employed & 2 not available for work (housewife/mother)
Mean age: 39.3 (range 34 – 49)
Mean unit consumption: 33.5 (range 0 - 88)
114

There were several main themes within this group, the majority of which run throughout all of the
settling down stories, as follows:
Hedonistic lifestyle
Settling down
Responsibilities & priorities
Maturation
Contentment
Loss or worry (as a secondary theme)
Hedonistic lifestyle
have
ments or responsibilities. Some are living the ‘student life’; others adhere to
e ‘work hard, play hard’ attitude and for a few, socialising and heavy drinking is part of their
. life in the police force or in a band). All have active, (sometimes hectic) social lives
b me does
ot ring true for just one ndividual in the group w e stuck in a rut at the start of the
whose pub drink part of an established routine since the death of his father,
purely pleasure seekin P904).
wn
stories have a settling down element, which is ess that is triggered me or all
ployment security; getting married and getting
regnant or having children. Some make an active choice to make the transition to family life and
r others it is a lifestyle that they simply adapt to as life events occur and changes are
The settling down stories generally begin at a point in the individuals’ lives when they
relatively few commit
th
culture, (e.g
with friends or colleagues and drink heavily and regularly, at pubs or clubs. Some of those not in
relationships enjoy the single life or engage in flirting, flings and risky ehaviour. This the
n i ho seems to b
last decade, and, ing is
rather than g, (see
Settling do
All of these a proc by so
of the following: buying a home; establishing em
p
fo
accommodated. With the exception of one (P904), it is a process that is happily accepted and
adjusted to and one that is being undertaken by those around them too.
Responsibilities and priorities
Amongst this group, increases in responsibilities and obligations are mentioned frequently. These
are mostly to do with family responsibilities but in order to support the family, work and finances
are also important and promotions or work progress attract greater commitments. Individuals tend
to naturally move towards stability and security and within the group, the priority is clearly family
focused, (again with the exception of one – P904).
Maturation
115

Although the majority of individuals do not consider themselves to have changed as a person over
the last decade, many acknowledge that they have undergone a period of maturation. They talk of
growing up, becoming more responsible and realistic, growing in confidence and esteem, becoming
more socially aware and less selfish, more sensible and sensitive and developing personally. This
aturity occurs in preparation for, or as a result of parenthood.
o excess was considered part of
the m
due to p
As with the success stories, the most common roles attributed to drinking was for social and
enjo couple talked about the
asso t mily and work
or some, alcohol had become part of their life, either because it was a factor in their work culture
).
alcohol to ease stress, slow down or occasionally as an escape,
ough there was not a sense of reliance on drinking. Others suggested that drinking helped to give
them social confidence or to fit in.
m
Contentment
For the majority of this group, the settling down process has led to increased satisfaction. Although
most were happy before their family commitments, the lifestyle change has led to feelings of
contentment and pride; raised self esteem and a positive outlook. It is a lifestyle they have
embraced and one that proves rewarding.
Loss or worry
Although the general feeling of these stories is in the most part positive, individuals have
experienced difficulties. These include the death of a parent; the death of a child; redundancies;
relationship breakdowns and debt concerns. These issues have mainly occurred prior to the settling
down period and have been accepted by individuals and dealt with constructively enabling them to
move forward with their lives.
The role of drinking in settling down stories
This group started drinking between the ages of 14 and 18. Several talked about coming from
heavy drinking backgrounds/cultures where consuming alcohol t
nor . Two individuals mentioned being given alcohol by their parents. Others began drinking
eer pressure or to fit in.
yment purposes, (including having fun and liking the taste). A
cia ion of drinking with enhancing meals and celebrating. However, as fa
responsibilities increased, individuals increasingly found that alcohol helped them to relax, chill out
and unwind.
F
or because it had become a habitual part of daily life (though not problematic
A handful of individuals used
th
116

The mean unit consumption per week for this group was 33.5, which, although significantly more
than the recommended sensible guidelines for both men and women, does not constitute heavy,
harmful drinking. The mean unit consumption for women was 19, just 5 units over the
commended sensible level. For men, the mean unit consumption was 42, twice the recommended
e
oup not to
he story types outlined above represent a sub-section of stories told at the final interview stage by
ccess
er the
nd it is important to note that ‘treatment stories’ do not form the focus of this section of the report.
ing
g analysis, to be written up at a later
ate.
aving said this, there may be particular reasons why these three particular groups of participants
o not include ‘treatment stories’ in their narratives of the last decade, and this relates to the role of
rinking in their lives. Those telling ‘success stories’ appear able to decrease their drinking without
se of formal treatment services, because of having a strong sense of purpose and well-defined
oals (the desire for career success, for example). Similarly, those telling ‘settling down stories’
ppear able to decrease drinking without professional help, since these participants tend to be
mongst the younger age groups, and to associate drinking with a youthful social life. Once their
hange, they report being able to re-assess the role of drinking in their lives and
cut down in order to take on new responsibilities. For the third group, those telling ‘tragic
re
sensible level. These differences may reflect differences in childcare responsibilities. The on
person who did not reduce his consumption over the decade was the one person in the gr
have had children.
Discussion
T
participants, and represent some particular extremes of story types: those characterised by su
or tragedy, or by maturation and ‘settling down’. The main purpose of the present section has been
to explore what sense particular sub-groups of participants have made of their experiences ov
past decade. One notable absence from these stories is reference to experiences of formal treatment,
a
References to experiences of treatment were disappointingly rare amongst the BUHD sample, and
where they do occur, they are more likely to be found within the sub-type, ‘stories of overcom
adversity’. This group of stories is the subject of continuin
d
H
d
d
u
g
a
a
life circumstances c
to
stories’, the opposite is the case. Here, drinking appears to provide structure and meaning to lives
that are otherwise characterised by loss and social isolation. A notable feature of this group is the
extent of mental health difficulties and relationship breakdown. This group would appear to be
most in need to accessing treatment services, but are perhaps unlikely to identify this themselves,
since they perceive alcohol as being one of the few sources of structure, support and socialising in
their lives.
117

Whilst further analysis of these stories, and of the other story types, is needed, this preliminary
analysis highlights how the possibility of change in drinking is associated, for these participants,
with the meanings given to drinking, and how these relate to other sources of motivation and
meaning in the participants’ lives, be it a career and material success, or (more commonly) social
etworks, relationships and family responsibilities. n
SECTION SEVEN SUMMARY
Participants’ stories of the last decade show considerable diversity. Some of the main story types are: success stories, tragedies, and settling down stories
Around 1 in 9 participants told success stories. These were stories characterised by success and personal happiness. These participants tended to be in paid employment, to have decreased drinking over the past ten years, and to be in a long-term relationship.
Around 1 in 12 participants told tragic stories. Individuals in this group were unhappy, lonely and unfulfilled, with little sense of purpose. Relationship breakdowns, loss of mothers (50%) and incapacity to work (mainly due to mental health difficulties) were major factors in this group. Mean unit consumption was much higher in this group than the other two, and tended to fluctuate over the decade.
Around 1 in 11 participants told stories of ‘settling down’. These were characterised by moving from a hedonistic lifestyle at the start of the decade, to a more settled lifestyle by the end of the decade, and the taking on of responsibilities. Nearly all these participants were in long-term relationships, and had reduced their drinking.
118

PART EIGHT: INTERVIEWS WITH RELATIVES OF PARTICIPANTS
In addition to interviews with participants, a sub-sample of participants’ close relatives was also
interviewed at waves 1, 2 & 3. Each heavy drinking participant was asked at the conclusion of the
wave one interview whether he or she was willing to nominate a close family member who knew
the participant sufficiently well to be able to provide a further perspective on his or her heavy
drinking. Ninety-five (19%) did so. Whilst the relatively low proportion of family members who
took part, along with sample attrition over time, means that these findings need to be treated with
some caution, they do appear to offer some potentially valuable insights into the experiences of
mily members of heavy drinkers.
able 18: Relationship of participating family members to their heavy drinking relatives
fa
The majority of family members nominated were female partners/wives of male participants, and
only a small minority were men. Hence family members were approached selectively in order to
maximise diversity in terms of relationship between family member and heavy drinker. Sixty-five
nominated family members were approached in order to achieve the desired total of 50 interviews
(a 77% response rate). The composition of the sample in terms of the relationships of family
members to heavy drinkers is shown in Table 18. Ages ranged from 16 to 71 with a mean of 35.9
years (4 were teenagers, 15 in their twenties, 12 thirties, 12 forties, 5 fifties, 1 sixties and 1
seventies). They had known their heavy drinking relatives for an average of 15.8 years (range from
1 to 43 years). Thirty-six of the 50 were currently living with their heavy drinking relatives and had
done so for an average of 13.0 years (range from 9 months to 40 years).
T
Wives 15
Female partners (incl. 1 lesbian) 13
Male partners (incl. 1 gay) 6
Daughters 6
Son 1
Sisters 3
Brothers 3
Mothers 2
Father-in-law 1
Total 50
119
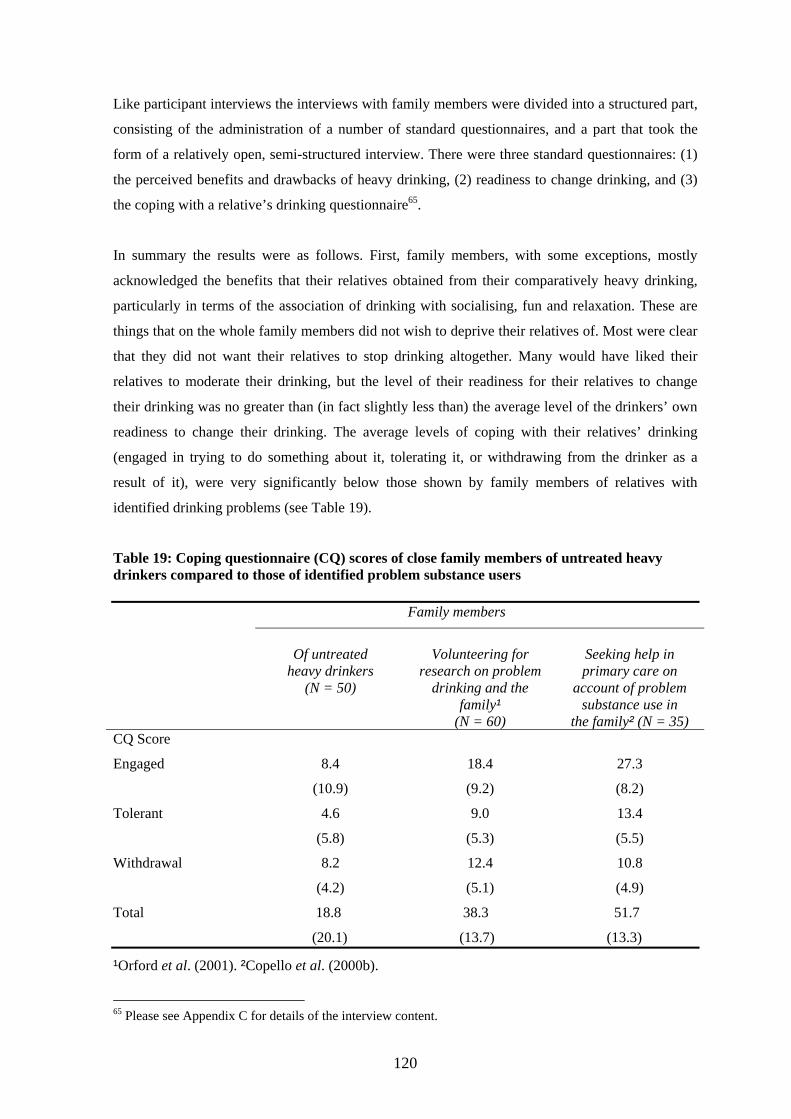
Like participant interviews the interviews with family members were divided into a structured part,
consisting of the administration of a number of standard questionnaires, and a part that took the
form of a relatively open, semi-structured interview. There were three standard questionnaires: (1)
the perceived benefits and drawbacks of heavy drinking, (2) readiness to change drinking, and (3)
the coping with a relative’s drinking questionnaire65.
In summary the results were as follows. First, family members, with some exceptions, mostly
acknowledged the benefits that their relatives obtained from their comparatively heavy drinking,
particularly in terms of the association of drinking with socialising, fun and relaxation. These are
things that on the whole family members did not wish to deprive their relatives of. Most were clear
that they did not want their relatives to stop drinking altogether. Many would have liked their
relatives to moderate their drinking, but the level of their readiness for their relatives to change
their drinking was no greater than (in fact slightly less than) the average level of the drinkers’ own
readiness to change their drinking. The average levels of coping with their relatives’ drinking
(engaged in trying to do something about it, tolerating it, or withdrawing from the drinker as a
sult of it), were very significantly below those shown by family members of relatives with re
identified drinking problems (see Table 19).
Table 19: Coping questionnaire (CQ) scores of close family members of untreated heavy drinkers compared to those of identified problem substance users Family members
Of untreated
heavy drinkers Volunteering for
research on problem Sepri
(N = 50) drinking and the
eking help in mary care on
account of problem family¹
(N = 60) substance use in
the family² (N = 35) CQ Score
Engaged
8.4
(10.9)
18.4
(9.2)
27.3
(8.2)
Tolerant 4.6
(5.8)
9.0
(5.3)
13.4
(5.5)
Withdrawal 8.2
(4.2)
12.4
(5.1)
10.8
(4.9)
Total 18.8 38.3 51.7
(20.1) (13.7) (13.3)
¹Orford et al. (2001). ²Copello et al. (2000b).
Appendix C for details of the interview content. 65 Please see
120

At the s on
drinking than did the latter themselves, reflected in their significantly lower benefits-drawbacks
characte atives to
coping
coping sis
became
convincingl ugh it might be by the
relative an unmitigated disaster. Perhaps of greatest interest is the fact that the
drinker
Memb
ame time, there was other evidence in the present results suggesting a more mixed view
the part of family members. On average they recognised less benefit from the heavy drinkers’
balance score, and particularly their lower average benefits score (see Table 20). What
rised the sample most of all was its diversity of response. Readiness for their rel
change drinking spanned the whole spectrum from those who, on their relatives’ behalf, were
extremely ‘contemplative’ of their relatives changing their drinking. Similarly, responses to the
questionnaire, although on average low, included many who had been adopting ways of
familiar to those who work with families and family members in clinical settings. Analy
of the open-ended accounts given by family members clarified the statistical findings since it
clear that the range of positions adopted was very wide indeed. There were those who
y put the view that their relatives’ drinking, very heavy tho
project’s definition, constituted an unmixed benefit. Others, equally convincingly, described their
s’ drinking as
majority of accounts lay somewhere in between these two extremes.
Table 20: The benefits and drawbacks of heavy drinkers’ drinking, according to heavy
s and family
ers
Benefits score Drawbacks score Benefits minus drawbacks
mean (s.d.) mean (s.d.) mean (s.d.)
Heavy drinkers 17.4 9.7 +7.7
) (7.1) (6.1) (8.7)
members
(N = 50
Family 12.8 8.3 +4.5
(N = 50) (6.4) (7.2) (9.3)
t (related) 3.86 1.10 2.36
p<0.001 n.s. p<0.05
readines s
precontemplative for their relatives, to those who perceived relatively many drawbacks, did more
Significant correlations between variables in the perceived benefits/drawbacks, coping and
s to change domains were consistent with the idea of a spectrum of family member
ranging from those who perceived no or few drawbacks, did little coping, and were
121

coping, and wished their relatives to change their drinking. On the whole there was little support
dea that family members’ posifor the i tions on this spectrum could be predicted from a knowledge
correlat
relative volume correlated with family members’ ‘readiness to change’, but neither
ly
member n was, however, small in size and only
relationship b eavy drinking and the position towards that drinking
e
relative’ ere is a clearly stated wish for the relative
However, the qualitative
analysis also drew attenti
of an af ting factors, which might be thought of as elements of
include
(iii) the gnition of the considerable benefits which
drinking
drinking s:
rt at either wave two or 3;
of the extent of their relatives’ or their own drinking. A measure of relatives’ drinking quantity
ed negatively with family members’ benefits-drawbacks balance, and a measure of
s’ drinking
correlation was more than moderate in size. Of interest is the finding that total coping score
correlated, not with measures of relatives’ drinking but only, negatively, with a measure of fami
s’ own drinking volume. The latter correlatio
marginally significant. This set of findings indicates that there is unlikely to be a simple
etween the extent of a person’s h
adopted by close family members.
Some insight into this complexity is offered by the qualitative analysis. This showed that som
family members reach a position where they recognise that the benefits/drawbacks balance of a
s drinking has tipped towards the drawbacks, th
to moderate drinking, and coping efforts towards that end are adopted.
on to factors which may moderate the relationship between heavy-
drinking related harm, and the adoption of a clear position advocating drinking change on the part
fected family member. These modera
family members’ experiences which stand in the way of a clear recognition of the need for change,
(i) mitigating factors (i.e. ‘my family member’s drinking is not a problem because …’), (ii)
recognition that there are important others who support their relatives’ continued heavy drinking,
wish not to be unreasonably intolerant, (iv) a reco
relatives are thought to derive from their drinking, and (v) sometimes the family member’s own
which may itself be heavy.
We attempted to follow up those family members again at wave two and for a third time at wave
three. Maintaining contact with family members was even more difficult than keeping contact with
participants. Attrition occurred for a number of reason
loss of contact with the heavy drinking participant (in which case no attempt was made to
re-interview the family member);
divorce or separation or otherwise loss of contact between the heavy drinker and family
member;
family members declining to take pa
the death of the family member (2 cases).
122

Nevertheless, the reduced sample of 25 family members interviewed on three separate occasions at
member
In summ
PART E
two-yearly intervals provided a rare opportunity to understand heavy drinking from family
s’ perspectives.
ary the findings of the family member follow-ups were as follows.
IGHT: SUMMARY
A wide range of positions towards their relatives’ heavy drinking continued to be evident over
time. Whilst sample attrition over time means that these findings need to be treated with some
caution, they do appear to offer some potentially valuable insights into the experiences of family
members of heavy drinkers.
The downsides to relatives’ drinking were widely recognised and a minority continued to see the
drinking as very problematic. The benefits of relatives’ heavy drinking were also widely
recognised. A minority consistently saw their relatives’ heavy drinking as benign, and a number of
others came to see drinking positively as it reduced over time. The largest group continued to be
ambivalent.
Family members as a group became more positive about the drinking over time than did their
heavy d inclined than their relatives to desire change. Acceptance rinking relatives, and became less
that drinking was already less than it once was, and sometimes family members’ own heavy
drinking to preserve a positive view. , were amongst the factors operating to allow family members
Close fa what position to take in mily members are often caught in a complex set of dilemmas about
relation to their relatives’ heavy drinking. For a number of understandable reasons, they take a
more or less benign view of their relatives’ heavy drinking.
123

CONCLUSIONS
o
follow a of heavy drinkers over an extended time period, and to analyse the
this gro
develop y for England
detailed source of information for those wanting to mstances
services
in the in
research is mple as possible. This is particularly important given
least sta ost health problems. Despite strenuous efforts by the research
this latt y on a range of measures of
cannot be traced by the research team will have died over the intervening years. Thus,
many longitudinal studies, the findings need to be considered to represent a particular sub-
ection of the population of heavy drinkers – those who have sufficiently steady lives and
otivation to take part in interviews at two-yearly intervals over the course of ten years.
Levels and patterns of drinking over time have been very diverse in this sample. Amongst the more
king at hazardous or harmful
vels over an extended period of their lives are able to reduce their drinking and maintain this
maturing and taking on responsibilities. Many of those who reduced their drinking did so without
The Birmingham Untreated Heavy Drinkers research project has provided a rare opportunity t
relatively large group
degree of continuity and change in drinking, related behaviours, and life circumstances amongst
up. Over this ten-year period, concerns over the individual and social effects of heavy
drinking have also increased in the UK. These have been the impetus behind a range of policy
ments, most notably the development of the Alcohol Harm Reduction Strateg
(Cabinet Office, 2004). In this light, it is hoped that this research project will provide a rich and
further consider the motivations, circu
and needs of the many chronic heavy drinkers who do not reach the attention of alcohol treatment
.
The findings should be interpreted with some caution, for sampling-related reasons. As discussed
troductory sections of this report, one of the real challenges when carrying out longitudinal
to retain as many of the original sa
that those who are more likely to be ‘lost’ over time are also those most likely to be leading the
ble lives, or to have the m
team, 48% of the original sample did not take part in the final interview in 2007. Whilst the
research team is proud to have retained over 50% of the sample, any discussion of the findings
needs to take into account the fact that those who did complete the study differed on certain
variables from those who did not take part in the final interview. In particular, analysis shows that
er group tended to drink more heavily and to score more highl
drinking-related ‘social harms’ than the final retained sample. It is also extremely likely that some
of those who
as with
s
m
optimistic results are the finding that some people who have been drin
le
reduction over time. They often made changes in their drinking in response to changes in
circumstances and relationships. The qualitative ‘narratives’ told by participants at the end of the
research project also suggest that participants view the main reasons for changing their drinking as
being related to their intimate and caring relationships, to moving to a different life stage, or to
124
professional help and support. This was particularly the case for older participants, who were in
professional occupations and in relationships. The minority of participants who did receive
professional treatment tended to be in the younger age group, to have been drinking at particularly
igh levels at the start of the study, and to have been more alcohol dependent than other sample
use, and relatively poor physical and mental health. Furthermore, there was a significant
ecline in the general and physical health of the sample over the ten years. This could be due to
ipants also reported a number of incidents of behaviours likely to be harmful to themselves or
others. Violent incidents after drinking are known to be associated with age and drinking pattern,
ith young binge drinkers (aged 18-24 years old) particularly likely to engage in crime or violent
cts after drinking (Matthews and Richardson, 2005). The BUHD sample, being aged 25-55 at the
tart of the study, might be expected not to have such high rates of aggressive or violent behaviour
s young people, and indeed, involvement in acts of aggression or violence decreased over time
mongst the BUHD sample. Nonetheless, even at the end of the study, when the sample was aged
5-65, almost a quarter of the sample reported being inappropriately aggressive after drinking
uring the past year, whilst 1 in 9 had been involved in at least one violent argument or fight.
hilst it is not possible to state with any certainty how this compares to the level of such incidents
mongst the non-heavy drinking population, the frequency of violent arguments and fights appears
be relatively high, given the age of the sample, and is likely to be linked to hospital attendance.
f most concern is a sub-group of participants - 28% of men and 23% of women - who continued
eavy drinkers are most likely to drink at home, often alone. However, drinking is also often an
important a pect of the s and pleasure of their daily lives, erceived
benefits of drinking may therefore be considered by is group utweigh drawba This
resistant to professional intervention. Since use of hospital services
h
members.
Nonetheless, despite the evidence that some people are able to make significant changes in their
drinking over time, 44% of men and 42% of women were still drinking heavily at ten-year follow
up. Sample members have also continued, on average, to have relatively high rates of smoking,
illicit drug
d
alcohol-related harm, and if so, could have implications for interventions. This finding needs to be
interpreted with a degree of caution, since some decline in general and physical health over time is
to be expected in the general population. Nonetheless, we do know that, compared to the general
population, the sample has poorer self-reported physical health for all age groups, and poorer
mental health for those in early to middle adulthood.
Partic
to
w
a
s
a
a
3
d
W
a
to
O
to drink at harmful levels at every interview stage throughout the ten year period. These chronic
h
s ocial fabric, structure and the p
th to o the cks.
group may also be particularly
125

is much higher on e general population, this ma icate o otentia t of
ntion up.
ngs rel to use o alth ser and to ment for alcohol-
lated problems ticula the study d th ment services
problems. This seems to support evidence of the Alcohol Needs Assessment
Research Project (ANARP, 2005), that heavy d ers acc eatmen e BUH ple
ho xpe e relati oor hea but vis r GP a nd the same rate
as the general population. A gst tho avy dri rs who e their less th third
eir drinking. GPs were more likely to make a comment about drinking to those sample
members wh ngs heavie kers. Th lso app o suppo e findi f the
NARP study (2005), which found ‘extremely low levels of formal identification, treatment and
of patients with alcohol use disorders by GPs’ (p.3). Of the small group of BUHD
participants who did discuss their drinking with thei less th quarter ffered ent.
thors of the ANARP study also refer to qualitative research which suggests two main
reasons for n a and pa nt prefer not to eferred. From the
study poss e to comment directly on the fir the ANARP
authors, since the focus here was on the patients rather than GPs experiences and views. However,
mal t services may be (understandably) easi r the
more extreme he nkers, since a correlation wa und in t UHD stu between level of
lcohol consumption and being offered treatment. On the second factor, there is some evidence of
eople declining the offer of a referral, with around half of those offered a treatment referral
eclining the offer (see Table 10). However, many heavy drinkers in the BUHD sample were not
ffered treatment.
nother potential point of intervention is secondary health care settings. This is particularly worth
ighlighting since the BUHD sample use both inpatient and Accident & Emergency services at
uch higher rates than the general population. Only a small minority had discussed their drinking
ith hospital staff, and this may suggest a need for screening and brief intervention work in
ospital departments. Recent research by Crawford and colleagues (2004) found that screening and
ferral by A&E staff reduced future A&E attendances by heavy drinkers, so more brief
interventions
his report has p a summary of some findi rojec it
s. Interested are evious
ts and to academic papers to supplement this overview. Furthermore, as indicated in
ection 2, this work is ongoing and further work will be carried out using: statistical modelling;
than am gst th y ind ne p l poin
interve for this gro
There are also a number of findi ating f he vices treat
re . In par r, has foun at few participants entered treat
for alcohol-related
few rink ess tr t. Th D sam
members do, wever, e rienc vely p lth, it thei t arou
mon se he nke do se GP, an a
discuss th
o were amo t the r drin is a ears t rt th ngs o
A
referral
r GP, an a are o treatm
The au
on-referral: difficulties in ccess; tie ence be r
BUHD , it is not ibl st reason given by
our data suggest that access to for reatment er fo
avy dri s fo he B dy
a
p
d
o
A
h
m
w
h
re
centred in A&E, in addition to primary care, may also be indicated.
T resented o maf the in ng from t ps he t. However,
can only provide an overview of the main finding
project repor
readers directed to pr
s
126

examination of clusters of participan
onetheless, it is hoped t
ts; and alitat anal of cipan narra s.
hat the report has been successful in indicating some of the main trends
icu in highlighting the im tance the social
ontext and life events in both maintaining and creating the possibilities for change in heavy
EFERENCES
and Lamp , D.L. 999) S rt Form 6 (SF-3 Healthnormative data should be used? Comparisons between the
norms provided by the Omnibus Survey in Britain, the Health Survey For England and the Survey. Journal o blic M cine, Vol. 21, No. 3, pp -270.
abinet Office (2004) Alcohol Harm Reduction Strategy for England. London: Cabinet Office. edia/ ineto /strat boffc 0alcoholh
qu ive ysis parti ts’ tive
N
seen in the Birmingham sample, and part larly por of
c
drinking.
R
Bowling, A., Bond, M., Jenkinson, C.Survey questionnaire: which
ing (1 ho 3 6)
Oxford Healthy Life f Pu edi . 255
Chttp://www.cabinetoffice.gov.uk/m cab ffice egy/assets/ca e%2ar.pdf Accessed on 25/11/08
Cochrane, R. & Bal, S. (1990) The DrinkingWest Midlands: A Community Surv
Hab iney. tish Jo nal of A iction 5, 759- 9.
ochrane, R. & Howell, M. (1995) Drinking Patterns of Black and White Men in the West Psych c Epid iology 0, 139
rawford, M.J., Patton, R., Touquet, R. Drummond, C., Byford, S., Barrett, B., Reece, B., Brown, A. and Henry, J.A. (2004) Screening and referral for brief intervention of alcohol-misusing
ency department: a pragmatic randomised controlled trial. The .
awson, D.A., Grant, B.F., Stinson, F.S. and Chou, P.S. (2006) Maturing out of alcohol dependence: the impact of transitional life events. Journal of Studies on Alcohol., 2006 Mar; 67 (2): 195-203.
epartment of Health (2005) The 2004 National Alcohol Needs Assessment for England. London: Department of Health
epartment of Health, Home Office, Department for Education and Skills and Department for Culture, Media and Sport (2007) Safe. Sensible. Social. The next steps in the National Alcohol Strategy. London: Department of Health.
ein, G. and Landman, B. (2005) Treated and treatment-naïve alcoholics come from different populations, Alcohol, 35, pp.19-26.
search. London: Home Office
Finney, J.W. & Moos, R.H. (1991) The long-term course of treated alcoholism: I. Mortality, relapse and remission rates and comparisons with community controls. J. Stud. Alcohol, 52 (1), pp. 44-54
Finn , J H. (1992) The long-term course of treated alcoholism: II. Predictors and c ar functioning and mortality. J. Stud. Alcohol, 53 (2), pp. 142-153
its of Sikh, Hindu, MuslimBri
and White Men , 8
the ur dd 76
CMidlands. Social Psychiatry and iatri em , 3 -140.
C
patients in an emergLancet, 364: 1334-39
Cryer, C., Jenkins, L.M., Cook, A.C., Ditchburn, J.S., Harrias, C.K., Davis, A.R. and Peters, T.J. (1999). The use of acute and preventative medical services by a general population relationship to alcohol consumption. Addiction, 94, 1523 – 1532.
Curran, P.J., Muthén, B.O., & Harford, T.C. (1998). The influence of changes in marital status on developmental trajectories of alcohol use in young adults. Journal of Studies on Alcohol, 59, 647-658.
D
D
D
F
Finney, A.(2004) Violence in the nigh-time economy: Key findings from the re
ey .W. & Moos, R.orrelates of 10-ye
127

Hartney ng Treatment as a Recruitment Criterion. Unpublished Internal Working Paper, Birmingham Untreated Heavy Drinkers research project, University of Birmingham.
ussain S., Mohamed M.A., Holder, R., Almasri, A., and Shukur G, 2008, Performance Evaluation Based on the Robust Mahalanobis Distance and Multilevel Modeling Using Two New Strategies, Communications in Statistics – Simulation and Computation, 37, 1966-1980
err, W.C., Fillmore, K.M. and Bostrom, A. (2002) Stability of alcohol consumption over time:
Leonard, K.E. and Rothbard, J.C. (1999) Alcohol and the marriage effect. Journal of Studies on
Lieblich, A.,
Mc .I. and Wong, M.M. (2005) Individual and partner predictors of recovery from alcohol-use disorder over a nine-year interval: findings from a community sample of alcohol married men. J. Stud. Alcohol, 66, (2), pp. 220-229.
atthews, S. and Richardson, A. (2005) Findings from the 2003 Offending, Crime and Justice
. and Roe, S. (2007). Drug misuse declared: Findings from the 2006/07 British Crime Home Office Statistical Bulletin 18/07
r National Statistics (2001) Living in Britain: Results from the 2000 General Household Survey. London. Stationery Office.
r National Statistics (2006) General Household Survey, 2005. London: Stationary Office
tistics (2007) National Statistics Omnibus Survey. London: Stationary Office
for National Statistics (2008) General Household Survey 2006. London: Stationary Office.
ffice for National Statistics (2008) General Household Survey (2006): Smoking and drinking Stationery
lation Censuses and Surveys. Census 2001. Available at: atistics.gov.uk/census2001 dex.html
et al. 1997. Defini
H
Kevidence from three longitudinal surveys from the US. J. Stud. Alcohol, 63, pp. 325-333.
Alcohol Supplement, 1999 Mar: 139-46.
Tuval-Mashiach, R. & Zilber, T. (1998) Narrative Research: reading, analysis and interpretation. London: Sage.
Aweeney, M.J., Zucker, R.A., Fitzgerald, H.E., Puttler, L
MSurvey – Alcohol-related crime and disorder. London: Home Office.
Murphy, RSurvey.
Office fo
Office fo
Office for National Sta
Office
Oamong adults 2006. London. Office.
Office for Popuhttp://www.st /in Accessed February 2nd 2009
n, S., Hartney, E., Ferrins-Brown, M., Kerr, C. and Maslin, J. (1998) The gham Untreated Heavy Drinkers Project: Final Report on Wave 1 to the
artment of Health, TA1 – TA6.
olfe, A., Dalton, S., Painter, C. & Webb, H. (2008) Pub and Community: the views of Heavy Drinke Journal of Community and Applied Social
ns, B., White, C. d Mitchell, L. (2003) Gambling and Problems itain. Hove: Brunner-R dge.
., Bradshaw, J., Tober, G., Weiner, llison, J., & Healey, C. (1994) Development of ds Dependency Questionnaire (LDQ): A Questionnaire to measure and alcohol and
ontext of a treatment and evaluation package. Addiction, Vol 89,
Dalton, S. and Orford, J. (2005) On road to Damascus: qualitative research on life s and decreased drinking. Contemporary Drug Problems. Winter 2005.
olfe, A., Orford, J. and Chappell (2006) - The Birmingham Untreated Heavy Drinkers Project: Final Report on Wave 5 to the Department of Health.
Orford, J., DaltoBirminDep
Orford, J., RBirmingham Untreated Psychology, 19: 68-82.
rs.
Orford, J., Sproston, K., Ere anGambling in Br outle
Raistrick, D J., ALeeopiate dependence in the cpp563-572.
Rolfe, A., the event
R
128

Rolfe, A., Dalton, S.,Krishnan, M., Orford, J., Mehdikhani, M., Cawley J. and Ferrins-Brown M. (2006) Alcohol, Gender, Aggression and Violence: findings from the Birmingham Untreated Heavy Drinkers Project. Journal of Substance Use, 11 (5): 343 – 358.
ollnick, S., Heather, N., Gold, R. and Hall, W. (1992) Development of a short readiness to change questionnaire for use if brief, opportunistic interventions among excessive drinkers. British Journal of Addictions, 87, 743-754
oe, S. and Man, L. (2006) Drug Misuse Declared: Findings from the 2005/06 British Crime
oyal College of Psychiatrists (1979) Alcohol and Alcoholism. A report by the Special Committee of the Royal College of Psychiatrists. London. Tavistock Publications.
al of College of Physicians (2001) Alcohol: can the NHS afford it? London: RCP.
eline Follow-Back: a technique for assessing self-reported alcohol consumption, in Liteen, R. and Allen, J. Measuring Alcohol Consumption. Humana Press.
Sproston, K. Erens, B. & Orford, J. (2000) Gambling Behaviour in Britain: Results from the British Gambling Prevalence Survey, London: National Centre for Social Research.
Vaillant, G.E. and Milofsky, E.S. (1984) Natural History of Male Alcoholism: paths to recovery, in Goodwin, D.W., Teilmann Van Dusen, K., Mednick, S.A. Longitudinal Research in Alcoholism, Kluwer-Nijhoff Publishing. Lancaster / The Hague.
Wardle, H., Sproston, K., Orford, J., Erens, B., Griffiths, M., Constantine, R. & Piggot, S. (2007) British Gambling Prevalence Survey 2007. London: National Centre for Social Research.
Ware and Sherbourne, (1992) The MOS 36 Item Short Form Health Survey (SF36). Medical Care, Vol. 30: 473-483.
Watson, A.L. and Sher, K.J. (1998) Resolution of alcohol problems without treatment: methodological issues and future directions of natural recovery research. Clinical Psychology: Science and Practice, 5(1), pp. 1-18
World Health Organisation (1946) Constitution. WHO: Geneva.
World Health Report (2002) Reducing Risks, Promoting Healthy Life. WHO: Geneva.
PUBLICATIONS FROM THE RESEARCH GROUP TO DATE
Articles in peer reviewed journals and edited collections, & PhD theses
Dalton, S.I. (2001). ‘Social norms associated with drinking: their nature and influence upon untreated heavy drinking’, Unpublished PhD thesis, University of Birmingham.
Dalton, S. and Orford, J. (2004). ‘Hospital inpatient admissions and past heavy drinking’. Journal of Substance Use, 9, 296-303.
Dalton, S., Orford, J. (2001). ‘Implications for prevention drawn from the Birmingham Untreated Heavy Drinkers Project’. Journal of Substance Use, 6, 61-69.
Ferrins-Brown, M., Dalton, S., Hartney, E., Kerr, C., Maslin, J., Orford, J. (1999). ‘Have a sip of this : the impact of family on the drinking patters of untreated heavy drinkers living in the West Midlands, UK’. Contemporary Drug Problems, 26, 413-437.
Hartney, E. (1999). ‘The weltanschauung of untreated heavy drinkers: a reassessment of control, dependence and change’, Unpublished PhD thesis, University of Birmingham.
Hartney, E., Orford, J., Dalton, S., Ferrins-Brown, M., Kerr, C. and Maslin, J. (2003). ‘Untreated heavy drinkers: a qualitative and quantitative study of dependence and readiness to change’. Addiction Research and Theory, 11, 317-337.
R
RSurvey England and Wales. London: Home Office.
R
Roy
Sobell, L. and Sobell, M. (1992) Tim
129

Kerr C., Masl
130
in J., Orford J., Dalton S., Ferrins-Brown M., and Hartney E. (2000). ‘Falling on deaf ears? Responses to he h a messa from the Birmingham Untreated Heavy Drinkers Cohort Researching Health Promotion. Routledge: London, 231-253.
Orford, J., Dalton, S., Hartney , M., Kerr, C. and Maslin, J. (2002). ‘How is excessive dri g maintai ? Untreated h y drinkers’ experience of the personal benefits and drawback th r ng’, Ad on Research and Theory, 10, 347-372.
Orford, J., Dalton, S., Har ey , M., Kerr, C. and Maslin, J. (2002). ‘The close relatives of untreated av rin s: persp on heavy drinking and its effects’. Addiction Research and Theory, 10, 439
Orford, J. and Dalton, S. (2005) ‘A four-year follow-up of close family members of Birmingham Untreated He n ’. April 2005, 13(2): 155-170.
Orford, J., Rolfe, A., Dalton, S., Painter, C. and Webb, H. (2008) Pub and Community: the views of Birmingham U a H D ke Jo l of Community and Applied Social Psychology. In P .
Rolfe, A., Dalton, S.,Krishnan, M., Orford, J., Mehd J. and Ferrins-Brown M. (2006) Alcohol n re n d lence: findings from the Birmingham Untreated Heavy Drinkers Project. Journal of Substance Use, 11 (5): 343 – 358.
Rolfe, A., Dalton, S. and fo J. 0 n road to Damascus: qualitative research on life events and decreased drinking. Contemporary Drug Problems. Winter 2005.
Rolfe, A., Orford, J. and Da Women, alcohol an ininity: a discourse analysis of women heavy drinkers’ accounts. Jo al gy. In press.
Webb, H., Rolfe, A., Orf J in C hange or specialist help? Understand t t ys nging inking in heavy drinkers’, Addiction Research and Theory, 15 (1) -9
Reports on waves 1 - 6
Wave 1: Orford J., Dalto ., t E rr err, C., and Maslin J. (1998) The Birmingh Untreate kers P ct: Final Report on Wave 1 to the Department of Health
J rrins-Brown, M., Krishnan, M. and Mehdikhani, M. (2000). The ingham Untreated Heavy Drinkers Project: Final Report on Wave 2 to the Department of Health.
Orford, J., Gutridge, K., Rich, A., and Rose, C. (2002). The Birmingham Untreated Heavy n Project: Final Report on Wave 3 to the Department of Health.
d, J., Webb, H. and Rolfe, A. (2004) The Birmingham Untreated Heavy Drinkers Pro ec a p n ve 4 ent of Health.
e, A., Orford, J. and C pe 006) s Project: Final Report on Wa t e D ar
e 6: Rolfe, A d, J. M , (2 )Project: Final Report on Wa t e Depar
alt educ tion ges ’ in: J. Watson and S. Platt (eds)
, E., Ferrins-Brownnkin ned eav
s of
, E.
eir d
Ferrins-Brown,
inki dicti
tnhe y d ker ectives
-463.
avy Dri kers Addiction Research and Theory,
ntreress
ted eavy rin rs. urna
ikhani, M., CawleyVio, Ge der, Agg ssio an
Or rd, (20 5) O the
lton, S. d femurn of Health Psycholo
ord, ing
., Pahe pa
ter, hwa
. and to cha
Dalton, S. (2007) ‘Self-directed c dr
: 85 5.
n S Hard H
ney, eavy
. FeDrin
ins-Brown M., Krojeam
B
j
., O
Wave 2: Dalton S., Orford, J., Cawley
Wave 3: Dalton. S.,
Wave 4: Dalton, S., Orfor
Wave 5: Rolf
Wav
, ., Feirm
Dri kers
t: Fin l Re
ort o
hap
Wa
ll, S. (2
to the Departm
The Birmingham Untreated Heavy Drinkerve 5
artin
o th
O.
ep
008
tment of Health.
The Birmingham Untreated Heavy Drinkers rfor & ve 6 o th tment of Health.
131
A: DET S OF CRUITM PRO RES
(OPCS 1 ) were used to identif percen s of m and females in the West
ands p io rdi ge grou 3 d 45-54), ethnic origin (white; black;
her) and curr nt ma ctivity (em loyed a nactive). In recognition of
of vy g male e po h
ed of 3:1 m to fem for the c ple. Consequently, percentages
e ta pplied t figu 75 m females to compute
age cur main ity.
position ups de d from census data were combined with data
o en in West lands d mor group as
Bal ( ) and Coc e and H ll (1995). Data were not available on
rn om ifferen c gro the targets were set at the 3:1 ratio,
an expec n th wer l of female ticipan m min ethnic groups would be
t t s were no t for o-econom oups, ere ap imated on the basis of a
e II, manual, III manual, IV and V and also some
n m t emaining groups: armed forces, government scheme, retired and other
e vity also dir o in s wi of the
Midl rea a ssibl order to mise bias of potential participants. The pre-set
t figu t po of the f mpl ed in Table
APPEND
Census data
Midl
Asian and ot
the greater n
desir
derived from
targets by
Com
on num
reported b
the drinkin
with
recruited.
Exac
relatively
representatio
inactive. Rec
West
targe
A1.
IX AIL RE ENT CEDU
991 y tage ales
opulat n acco
e
ng to a
in a
p (25-34;
ployed; unem
5-44 an
p nd i
umber hea
ales
drinkin
ales
s in th
omposition of
pulation, t
the sam
e original research proposal set a
ratio
the c
and
nsus da
rent
were a
activ
o total res of 3 ales and 125
percentages for ethnic gro rive the
bers
y Cochrane and
f m the Mid
1990
rinking
hran
e than twice a week in each ethnic
owe
g patte
tatio
s of w
at lo
en of d
evels
t ethni
par
ups, so
ts fro ority
arget
ev
t se soci ic gr
III non-
but w prox
n spread across groups I,
fro
ruitm
he r
nt acti was ected t clude a de a geographical spread
and
res
s a
and
s po
com
e, in
ion
mini
inal sahe sit e of 500 participants are display

Table A1: Proportions of
132
group, employment status and ethnic group
, target = 375) Women
(n = 128, target = 125) Total
(n = 500)
men and women by age
Men (n = 372
N % n % n % Age grou entr dp at y to stu y 25-34 R uited 157 42.2 62 48.4 219 43.8 ecr
Ta .4 55 44.0 218 43.6 rget 159 42 35-44 Recruited 120 32.3 34 26.6 154 30.8
Ta .6 55 44.0 174 24.8 rget 126 33 45-55 Recruited 95 25.5 32 25.0 127 25.4
Ta 90 24.0 15 12.0 108 21.6 rget Employment status Employed
Recruited 214 57.5 73 57.0 287 57.4 Ta 0 77.4 97 77.6 387 77.4 rget 29
Unemployed Recruited 117 31.5 25 19.5 142 28.4
Ta 38 10.1 13 10.4 51 10.2 rget Inactive
Recruited 41 11.0 30 23.5 71 14.2 Ta 47 12.5 15 12.0 62 12.4 rget
Ethnic group White
Recruited 342 91.9 112 87.5 454 91.0 Target 334 89.1 111 88.8 445 89.0
Black Recruited 8 2.2 12 9.4 20 4.0
Target 8 2.1 3 2.4 11 2.2 Asian
Recruited 18 4.8 1 0.8 19 4.0 Target 29 7.7 10 8.0 39 7.8
Other Recruited 4 1.1 3 2.3 7 1.0
Target 4 1.1 1 0.8 5 1.0

133
Table A2: Proportions of recruited by eac tr y type
Str gy Males (3 Fem 1 To (500)
participants h s ateg
ate 72) ales ( 28) tal n % n % n %
Newspa o pe spas lem
37 10 52 10 pers (lents
cal newspa rs & new per upp
15 12
Advelicences &
rtise t c n ag , oo
55 1 69 14 menvillag
s (plae st
ed inres)
ews ents ff 5 14 11
Bus aplaced on
dvertisemthe
entsack
(‘ k ’ b of s
63 90 18 Drin buse
Like a )
Fish advert 17 27 21
Leaflets (hmarkets, ca
anr b
ded t i re s, s, o le
24 6 29 6 ouot sa
n city cens)
t , pub fair 5 4
Letters, m
ainly o d 43 1 55 11 delivered d or to oor 2 12 9
Posterssurge
(ries,
display n , s s, alwork s
7 2 2 2 9 2 ed i site
pubsetc.)
hop dent
Snow
ba (w o ut 80 2 22 lling ord f mo h) 1 32 25 112
Postcardsand ret
(Frrn, di
ee c fo y pu st ou )
35 10 14 10 49 10 postributed
ards to
r eastlets
com letion
Businesscard,
cards (smal er xe bac f ibuted durin ent)
5 1 1 1 6 1 l advg recr
t affiuitm
d to k odistr
Other means (e 23 6 .g. early newspaper articles) 6 5 29 6
Geog
Figure A1 shows the distri
West Midlands Metropolit
of pa
parti
districts repre
raphical distribution
recru the h hout the
an County Area. This info ation was used in order to achieve a balance
rti t m and to avoid potential bias. Figure A1 shows that
cipants w recruited from areas throughout th egion, with the st jority of postal code
ed
bution of participants ited fro
rm
e r
m postal code areas t roug
cipan s fro deprived and affluent areas
ere
sent
va ma
.

Figure A1: Geographical distribution of participants by post
134
al code district
Key No participants 10+ participants <10 participants
Notes
CV (Coventry); DY (Dudley); WR (Worcestershire)
whole area.
and surrounding areas, including: Solihull; Sutton
est Bromwich; Alvechurch; Bromsgrove and Redditch, which have
ing levels of deprivatio nd opulation.
1. WV (Wolverha
indicate numbers of participants for the
2. Areas B
Coldfield; Smethwick; W
vary
mpton); WS (Walsall);
are within Birmingham city
n a density of p

T
135
able A r ri ed at Wave One
Variable
Frequency
3: Demographic cha acte stics of participants recruit
Gender Male F ale
210 em
3
Age group at25-34 35-44 45-54
wave one
2 14 107
Socio-economic group at Professional InterSkillSkillSemUnskNot c
wave one
mediate ed non-m ual edi-sk
7 4
15 1
annual d
mailled ed
illeod
2
2 2
Relationship Single Relationship - living Co-hSeparated Wid
status at wave one
apart abitin d
ow
4 110
g/marrie
ed
8
0
1
UnitAbstinent Heavy Very heavy
consumption av e
14 18
at w e on 1

APPENDIX B: ADDITIONAL FIGURES AND TABLES
able B1: nit consumption for the seven days o i erview 1997-
19 200 03 5
T U prior t nt 2007
1997 99 1 20 200 2007 Al ll F M M
F l M F A M F ll A M All M F All F All
Number 25 9 7 18 184
75 9 184 75 25 184 5 259 184 75 259 184 75 259 4 75 259
Mean 5 80. 5 0.5 47 8 3.7 8 56. 588.
59.0 0 77.9 2.2 7 77.6 .1 68. 73.7 4 65.0 68.8 42. 61.3 1 36.3 0.4
SD 2 49. 4 0.1 32. 0 35.0 6 .0 53. 549.
42.1 1 63.3 6.9 6 66.1 8 60. 65.7 60.0 2.4 38 57.6 5 38.9 0.4
Minimum 0 19 0 0 0 0 0 0 0 0 0 0 0 0 0 0
0 0
Maximum 328 319 328 338 308 338 360 173 360 415 156 415 408 189 408 301 228 301
136

Table B2: Frequency (percentage) of participants allocated to 2007
drinking volume groups, based on units consumed in week before interview 1997-
1997 1999 2001 2003 2005 2007
n = M
184F 75 2
M 4
F 75
All 5
M 18
All 9
M 84
F 75
All 259
All 59
M 184
F 75
All 259 18 2 9 4
F 75
All 259
M 184
F 75 25 1
Abstinent (0)
2 (1%)
0 2 3 (4%)
18 (7%)
16(9%)
0 20 8 (11%)
28 (11%)
(1%)
12 (7%)
2 (3%)
14 (5%)
15(8%)
7 (9%)
23 (9%)
16 (9%)
4 (5%)
2(8%) (11%)
Sensible
14/21)
3 (2%)
0 3 (1%
16 8 )
24
13 %)
10 3%)
23 (9%)
14 (8%
7 (9
21 17 18 )
35 %)
32 7%)
12 (16%)
44 (17%)
(1 to
)
(9%) (11% (9%) (7 (1 ) %) (8%) (9%) (24% (14 (1
Hazardous 15/22 - 34/49
22 (12%)
12 (16%)
34 (13%)
36 (20%)
21 (28%)
57 (22%)
42 (23%)
13 (44%)
55 (21%)
46 (25%)
20 (27%)
66 (26%)
46 (25%)
14 (19%)
60 (23%)
51 (28%)
23 (31%)
74 (29%)
Heavy 35/50 – 69/99
100 (54%)
49 (65%)
149 (58%)
73 (40%)
29 (39%)
102 (39%)
68 (37%)
33 (44%)
101 (39%)
65 (35%)
29 (39%)
94 (36%)
66 (36%)
24 (32%)
90 (35%)
54 (29%)
28 (37%)
82 32%)
Very heavy 70/100+
57 (31%)
14 (19%)
71 (27%)
47 (26%)
15 (20%)
62 (24%)
46 (25%)
16 (21%)
62 (24%)
43 (23%)
12 (16%)
55 (21%)
39 (21%)
15 (20%)
54 (20%)
27 (15%)
4 (5%)
31 (12%)
137

Table B3: Number of days drinking alcohol at or above 7 units for women and 10 units for men in previous 7 days 1997-2007
1997 1999 2001 2003 2005 2007 M
F All F All M M F All M F All M F All M F All
Number 184
75 259 184 75 259 184 75 259 184 75 259 184 75 259 184 75 259
Mean 3.8
2.4 7 3 2.7 3.3 2. 2.7 2.9 2.9 2.5 2.8 2.5 1.9 2.3 3. .2 3.1 7 3.1 3.0
SD 2.0
1.9 2.0 2.2 2.3 2.5 2.2 2.5 2.4 2.4 2.4 2.4 2.5 2.4 2.4 2.1 2.4 2.3
Minimum 0
0 0 0 0 0 0
0 0 0
0 0 0
0 0 0
0 0
Maximum 7
7 7 7 7 7 7 7 7 7 7 7 7 7 7 7 7 7
138

Table B4: Number of days drinking alcohol at or above 14 units for women and 20 units for men in previous 7 days 1997-2007
1997 1999 2001 2003 2005 2007 M
F All F All M F All M F All M F All M M F All
Number 184 75 259 184 75 259 184 75 259 184 75 259 184 75 259 184 75 259
Mean 1.5
4 1 0 1 1.1 1.0 1.0 1.0 0.8 1.7 0.7 1.1 1. 1.4 .1 1.3 1.4 1. 1.3 .2 0.9
SD 1.8
1 1.7 1.7 8 2 1.6 1.9 6 1.8 1.8 1.7 1.8 1.7 1.5 1 .5 1.8 1. .0 1.9 1.
Minimum 0
0 0 0 0 0 0 0 0 0 0 0 0
0 0 0
0 0
Maximum 7
7 7 7 7 7 7 7 7 7 7 7 7 7 7 7 7 7
Table B5: Number of days drinking alcohol at or above 7 units for women and 10 units for men in previous year 1997-2007
1997 1999 2001 2003 2005 2007 M
F All M F All M F All M F All M F All M F All
Number 184
75 259 184 75 259 184 75 259 184 75 259 184 75 259 184 75 259
Mean 194.7
180.7 190.7 166.4 147.8 161.0 175.3 154.4 169.2 153.4 143.6 150.6 146.6 140.2 144.8 134.1 117.7 129.3
SD 104.8
99.4 103.3 118.6 126.8 121.1 124.8 117.4 122.9 121.1 119.6 120.5 124.0 133.8 126.7 126.4 128.7 127.0
Minimum 0
0 0 0
0 0 0
0 0 0
0 0 0
0 0 0
0 0
Maximum 365
365 365 365 365 365 365 365 365 365 365 365 365 365 365 365 365 365
139

Table B6: Number of days drinking alcohol at or above 14 units for women and 20 units for men in previous year 1997-2007
199 1 2003 2005 2007 7 1999 200 M
F A Al All F All M F All M F All ll M F l M F M
Number 184
75 259 75 259 75 259 184 75 259 184 75 259 184 184 75 259 184
Mean 82.3
78. 81.0 8.5 71.9 64.0 74.2 49.3 59.8 55.4 58.2 56.2 55.3 50.0 53.7 0 73.3 6 78.4 64.1
SD 95.3
79.2 90.8 97.1 95.4 83.5 98.1 86.0 92.0 89.8 92.3 90.4 92.4 92.0 92.1 95.0 103.3 94.2
Minimum 0
0 0
0 0 0 0
0 0 0
0 0 0
0 0 0 0
0
Maximum 365
360 36 8 365 365 365 365 365 361 365 365 365 365 5 365 35 365 365 365
140

Table B7: Frequency (and percentage) of ‘heavy’ and ‘very heavy’ drinking days in week prior to interview 1997-2007 (n = 259)
9 2001 05 Frequency (%)
2007 Frequency (%)
1997 Frequency (%)
199Frequency (%) Frequency (%)
2003 Frequency (%)
20
Number of days
‘Heavy’ days
y ’
‘
heavy’ days
Heavy’ ys
‘Veh
’ days
‘Very avy’ ays
’
‘Very heavy’ day
‘Heavy’ days
‘Very heavy’ days
‘Verheavydays
Heavy’ days
‘Very ‘da
ry eavy’ days
‘Heavyhed
‘Heavydays
s 0
14 (5.4) (38.6)
4 132 (51.0)
7.0) (51.0)
48 (18.5 145 (56.0)
155 (59.8)
79 (30.5) 179 (69.1)
100 7 (18.1) 44 (1 132 ) 58 (22.4)
1
20 (7.7) .3) 32 44 (17.0) 15.4) 5 46 (17.8 (18.5) 48 (18.5 51 (19.7) 43 (16.6) 63 (24 (12.4) 40 ( 5 (21.2) ) 48 42 (16.2) )
2
45 (17.4) .3) 4 34 (13.1 5.8) 3 42 (16.2 (10.4) 3 ) 23 (8.9) 33 (12.7) 15 (5.8) 50 (19 1 (15.8) ) 41 (1 0 (11.6) ) 27 7 (14.3
3 53 (20.5 16 (6.2) 33 (12.7) 16 (6.2) 30 (11.6) 10 (3.9) 31 (12.0) 12 (4.6) 37 (14.3) 9 (3.5) 27 (10.4 7 (2.7) 4 45 (17.4) 13 (5.0) 31 (12.0) 15 (5.8) 25 (9.7) 7 (2.7) 20 (7.7) 6 (2.3) 20 (7.7) 6 (2.3) 21 (8.1) 1 (0.4) 5 22 (8.5) 5 (1.9) 30 (11.6) 6 (2.3) 18 (6.9) 8 (3.1) 20 (7.7) 5 (1.9) 14 (5.4) 4 (1.5) 9 (3.5) 1 (0.4) 6 26 (10.0) 5 (1.9) 10(3.9) 3 (1.2) 16 (6.2) 5 (1.9) 14 (5.4) 6 (2.3) 12 (4.6) 4 (1.5) 9 (3.5) 2 (0.8) 7 34 (13.1) 7 (2.7) 35 (13.5) 9 (3.5) 45 (17.4) 12 (4.6) 38 (14.7) 10 (3.9) 39 (15.1) 10 (3.9) 30 (11.6) 11 (4.2)
141

Table B8: Frequ
1997 Frequency (%)
1999 Frequency (%)
2001 Frequency (%)
2003 Frequency (%)
2005 Frequency (%)
2007 Frequency (%)
ency (and percentage) of ‘heavy’ and ‘very heavy’ drinking days in year prior to interview 1997-2007 (n = 259)
Number of days
‘Heavy’ days
‘Very heavy’ days
‘Heavy’ days
‘Veryheavy’ days
‘Heavy’ days
heavy’
s
’ days
‘Veryheavy’ da
‘Heavy’ days
‘Very heavy’ days
‘Heavy’ days
‘Very heavy’ days
‘Very
day
‘Heavy
ys 0
14 (5.4) 100 (38.6)
47 (18.1) 132 (51.0
4 (17.0) .5) 14(56
58 (22.4) 155 (59.8)
79 (30.5) 179 (69.1) )
4 132 48 (18 5 (51.0) .0)
1
20 (7.7) 63 (24.3) 32 (12.4) 44 (17. 40 (15.4) .2) .8) 48 (18 42 (16.2) 48 (18.5) 51 (19.7) 43 (16.6) 0) 55 (21 46 (17 . ) 5
2
45 (17.4) 50 (19.3) 41 (15.8) .8) .6) .2) 27 (10. 37 (14.3) 23 (8.9) 33 (12.7) 15 (5.8) 34 (13.1) 41 (15 30 (11 42 (16 4)
3
53 (20.5 16 (6.2) 33 (12.7) 16 (6.2 30 (11.6) 9) .0) 12 (4. 37 (14.3) 9 (3.5) 27 (10.4 7 (2.7) ) 10 (3. 31 (12 6)
4
45 (17.4) 13 (5.0) 31 (12.0) ) 6 (2. 20 (7.7) 6 (2.3) 21 (8.1) 1 (0.4) 15 (5.8) 25 (9.7) 7 (2.7 20 (7.7) 3 )
5
22 (8.5) 5 (1.9) 30 (11.6) ) 5 (1 14 (5.4) 4 (1.5) 9 (3.5) 1 (0.4) 6 (2.3) 18 (6.9 8 (3.1) 20 (7.7) .9)
6
26 (10.0) 5 (1.9) 10(3.9) 3 6.2) 6 (2 12 (4.6) 4 (1.5) 9 (3.5) 2 (0.8) (1.2) 16 ( 5 (1.9) 14 (5.4) .3)
7
34 (13.1) 7 (2.7) 35 (13.5) 9 ( (17.4) 6) .7) 10 (3.9) 39 (15.1) 10 (3.9) 30 (11.6) 11 (4.2) 3.5) 45 12 (4. 38 (14
142

Table B9: Leeds Dependence Questionnaire Scores 1997-2007
2005 2007 1997 1999 2001 2003 M
F All M All Al F M F M F l M All M F All F All
Number 184
75 259 1 9 2 5 484 75 25 184 75 59 184 7 259 184 75 259 18 75 259
Mean 7.8
6.5 6.2 4.2 4.2 4.9 7.4 6.8 6.0 6.9 6.5 5.2 5.4 5.0 5.7 5.3 3.9 4.6
SD 5.7 4.9 5.5 5.6 4.8 5.5 5.8 4.7 5.6 4.8 3.7 4.8 5.2 3.9 4.9 5.0 3.6 4.7
Minimum 0 0 0
0
0 0 0 0 0 0 0
0 0 0 0 0 0 0
Ma 26 23 22 27 17 27 26 17 26 ximum 26 27 19 27 30 22 30 22 14
143

Table B10: Leeds Dependency Questionnaire – sub-group comparisons 2007 (n = 259)
n Me SD Stati Variable
an stics
Age 25-34 105
80 74
4
4.8 5.5
sdiffer35-44
5-55 4
4.7 .7
4.2
3.9 No ignifican tence
In a relationship? No
es96
163 5 5.33
4.09 t = 3
p < 0.00.9
3.8 .53
1 Y Soc ial Economic Group Pro ssnt mkilled non-manual
n llo o
13 84 46 59 23 32 2
3.03.49 3.41 5.31 5.48 7
2.83 3.42 3.28 5.79 5.53 5.44 4.95
F = p < 0.00
fe ional er ediate I
SSkilled manual Semi-skilled U ski ed
t c ded
4.66 1
0
.75 4.50 N
Ge rnde Ma
e le184 75
4. 5.05 3.60
t = 1.55Not significant
le ma
86 3.87
7 F
144

Table B11: Sample allocation to readiness to change stage 1997-2007
1999 2003 200
Stage of change 1997 2001 2005 7
n = 259 259 259 259 259 259 Pre-contemplation 48 (19%) 55 (21%76 (29%)
60 (23%) ) 61 (24%) 63 (24%)
Contemplation 148 (57%)
128 (49%)
109 (42%
157 (61%)
137 (53%)
125 (48%) )
Action 26 63 (24%) 76 (29%) ) 87 (34%(10%)
62 (24%) 73 (28% )
145

Table B12: Readiness to Change - sub-group comparisons 2007 (n = 233)
Variable n Pre
Frewithin
-contemplatio
quency (% age grou
mplation
cy (% group)
n
% up)
n Conte Actio
p)
Frequenwithin age
Frequency (within age gro
Age at entry
25-34
-44
-55
5
5%)
15%
34%
)
)
33
32
22 (
10 26 (2 46 (44%) (31%)
35 80 12 ( ) 36 (45%
45
74 25 ( ) 27 (30%
(40%)
36%)
In a relationship? ency ( (%) Freque ) Frequ %) Frequency ncy (%
No
s
7
146
23 (26%
23%)
%)
64 44%)
20 (
49 (Ye
8
33 (
44 (51
(
23%)
34%)
Social Economic Group Frequency (%) Frequency (%) Frequenc (%) y
Professional
ntermediate
killed non-manual
killed manual
emi-skilled
nskilled
ot coded
12
76
40
56
21
26
2
4 (33%)
17 (22%)
7 (18%)
12 (21%)
7 (33%)
8 (31%)
1 (50%)
2 (17%)
37 (49%)
18 (45%)
26 (46%)
10 (48%)
14 (54%)
1 (50%)
6 (50%)
22 (29%)
15 (38%)
18 (32%)
4 (19%)
4 (15%)
0
I
S
S
S
U
N
Gender (% within gender) (% within gender) (% within gender)
Male
emale
166
67
39 (24%)
17 (25%)
81 (49%)
27 (40%)
46 (28%)
23 (34%) F
146

Table B13: Strength of alcoholic drink predominantly consumed
0.1 – 4.5% 4.6 – 6.0% 6.1 – 10% 10.1 – 13% 13.1 – 20% 20.1 – 40% 40.1% + Wave one: Sensible Hazardous Heavy Very heavy
2 (67%)
13 (38%) 78 (52%) 26 (37%)
1 (337 (21
17 (111 (16%)
) 0%) 7%)
6 (123155 (7%
%) )
1 (1%)
5 (111 (9 (13%)
0 %)
0
%) %)
1%)
0
2 (6%15 (11 (29
0 8%) %)
)
0 1 (33 (2%
0 5%) 7%)
0
1 (1
Wave six: Sensible Hazardous Heavy
19 (43%) 29 (39%) 33 (40%)
6%)
4 (9%
7 (10%21 (26%) 12 (
) 5 (6%)
%)
14 (322 (16 (23 (1
0 %)
(2%) 3%)
7 (18 (15 (6%2 (7
0 0 Very heavy 5 (1
))
39%)
0
6 (8%
8 (26
2%)
30%) 0%) 0%)
2 (321 (
6%) 1%)
) %)
00
147

Table B14: Mean number of cigars or cigarettes smoked amongst sample – sub-group comparisons 2007 (n = 259)
Variable
n Mean SD
Age 25-34 35-44 45-55
105 80 74
6.8 7.3 6.4
10.4 12.2 11.1
In a relationship? No Yes
96 163
9.6 5.3
12.4 10.0
Social Economic Group
Professional Intermediate
Skilled non-manual Skilled manual
Semi-skilled Unskilled Not coded
13 84 46 59 23 32 2
1.5 3.1 6.7
12.1 6.8
10.2 0
5.5 6.9
10.6 15.3 10.0 10.1
Gender Male
Female 184 75
6.6 7.6
11.2 11.0
148

Table B15: Frequency and percentage - relationship status at interview 1997 – 2007 (n = 259)
Relationship status Wave one
Frequency (%)
Wave two
Frequency (%)
Wave three
Frequency (%)
Wave four
Frequency (%)
Wave five
Frequency (%)
Wave six
Frequency (%) Married/cohabiting
93 (36%)
102 (39%)
121 (47%)
119 (46%)
115 (44%)
129 (50%)
In a non-cohabiting relationship:
- Single
- Separated/divorced
- Widowed
56 (22%)
34 (13%)
0
61 (24%)
19 (7%)
1 (<1%)
37 (14%)
24 (9%)
2 (1%)
41 (16%)
17 (7%)
0
39 (15%)
16 (6%)
1 (<1%)
34 (13%)
10 (4%)
0
Not in a relationship:
- Single
- Separated/divorced
- Widowed
48 (19%)
27 (10%)
1 (<1%)
53 (21%)
23 (9%)
0
53 (21%)
22 (9%)
0
63 (24%)
19 (7%)
0
61 (24%)
27 (10%)
0
68 (26%)
16 (6%)
2 (1%)
149

Table B16: Mean unit consumption in the week before interview by relationship status 1997 – 2007 (n = 259)
Relationship status Wave one
Mean units (SD)
Wave two
Mean units (SD)
Wave three
Mean units (SD)
Wave four
Mean units (SD)
Wave five
Mean units (SD)
Wave six
Mean units (SD) Married/cohabiting
75.7 (45.8)
66.0 (59.4)
62.1 (52.1)
57.4 (54.1)
48.7 (41.6)
41.0 (36.3)
In a non-cohabiting relationship:
- Single
- Separated/divorced
- Widowed
68.2 (37.0)
77.2 (56.8)
no data
69.0 (60.3)
64.2 (62.1)
0.0 (n/a)
76.6 (78.2)
75.4 (64.2)
83.0 (100.4)
75.3 (77.8)
62.4 (38.6)
no data
77.2 (69.6)
55.6 (23.5)
1.0 (n/a)
48.4 (39.7)
61.4 (79.4)
no data
Not in a relationship:
- Single
- Separated/divorced
- Widowed
102.0 (61.1)
84.5 (38.0)
59.5 (n/a)
81.3 (60.3)
72.5 (40.8)
no data
75.0 (65.1)
68.7 (47.1)
no data
73.4 (64.2)
64.7 (50.5)
no data
74.6 (76.4)
67.4 (52.5)
no data
68.1 (67.1)
47.5 (54.1)
51.0 (4.2)
150

Table B17: Total number of other people living in participants’ household 1997 – 2007 (n = 259)
Total number of other people in
household
Wave one
Frequency (%)
Wave two
Frequency (%)
Wave three
Frequency (%)
Wave four
Frequency (%)
Wave five
Frequency (%)
Wave six
Frequency (%)
0 85 (33%) 86 (33%) 75 (29%) 82 (32%) 80 (31%) 83 (32%)
1 67 (26%) 60 (23%) 86 (33%) 81 (31%) 80 (31%) 86 (33%)
2 47 (18%) 49 (19%) 45 (17%) 45 (17%) 48 (19%) 37 (14%)
3 39 (15%) 39 (15%) 31 (12%) 30 (12%) 34 (13%) 36 (14%)
4 16 (6%) 17 (7%) 15 (6%) 16 (6%) 14 (5%) 13 (5%)
5 2 (1%) 7 (3%) 3 (1%) 1 (<1%) 2 (1%) 3 (1%)
6 1 (<1%) 3 (1%) 3 (1%)
7 2 (1%) 1 (<1%) 1 (<1%) 1 (<1%)
8 1 (<1%) 1 (<1%)
151

Table B18: Number of other adults and children living in participants’ household 1999 – 2007 (n = 259)
Number of others in household
Wave two
Frequency (%)
Adults/children
Wave three
Frequency (%)
Adults/children
Wave four
Frequency (%)
Adults/children
Wave five
Frequency (%)
Adults/children
Wave six
Frequency (%)
Adults/children
0 92 (36) 185 (71) 87 (34) 183 (71) 93 (36) 183 (71) 92 (26) 189 (73) 93 (36) 196 (56)
1 111 (43) 35 (14) 134 (52) 37 (14) 131 (51) 37 (14) 118 (46) 36 (14) 125 (48) 25 (10)
2 35 (14) 22 (9) 28 (11) 19 (7) 25 (10) 22 (9) 35 (14) 24 (9) 27 (10) 27 (10)
3 15 (6) 12 (5) 7 (3) 12 (5) 7 (3) 11 (4) 11 (4) 9 (4) 9 (4) 10 (4)
4 5 (2) 4 (2) 3 (1) 5 (2) 3 (1) 4 (2) 3 (1) 4 (2)
5 1 (<1) 3 (1) 1 (<1) 1 (<1)
6 1 (<1) 1 (<1) 1 (<1)
7 1 (<1)
152

Table B19: Household types
1999 2001 2003 2005 2007 Household type Freq. (%)
Mean units (SD)
Freq. (%)
Mean units (SD)
Freq. (%)
Mean units (SD)
Freq. (%)
Mean units (SD)
Freq. (%)
Mean units (SD)
1 adult, single
51 (20)
79.3 (59.1)
45 (17)
69.4 (65.4)
51 (20)
77.0 (64.0)
52 (20)
69.9 (57.9)
56 (22)
75.4 (74.0)
1 adult, in relationship 33
(13)
75.7 (74.2)
26 (10)
105.0 (96.0)
30 (12)
71.2 (63.9)
28 (11)
76.5 (71.4)
25 (10)
57.9 (63.9)
2 adults, no children
58 (22)
79.4 (68.0)
83 (32)
67.0 (58.6)
76 (29)
65.5 (69.7)
74 (29)
60.9 (59.0)
85 (33)
40.7 (34.6)
2 adults, plus children
52 (20)
62.9 (52.5)
57 (22)
61.3 (45.8)
55 (21)
54.1 (43.7)
45 (17)
44.3 (41.4)
43 (17)
39.2 (32.9)
3+ adults, no children
42 (16)
51.3 (37.7)
27 (10)
60.0 (34.5)
26 (10)
69.7 (60.3)
35 (14)
69.8 (68.8)
30 (12)
49.4 (38.1)
3+ adults, plus children 15
(6)
72.8 (50.4)
9 (4)
47.2 (48.9)
10 (4)
50.0 (45.4)
14 (5)
50.6 (37.2)
10 (4)
42.4 (36.1)
Single parent
8 (3)
58.3 (26.3)
12 (5)
71.3 (39.4)
11 (4)
46.6 (27.3)
11 (4)
39.9 (22.7)
10 (4)
32.0 (20.2)
153
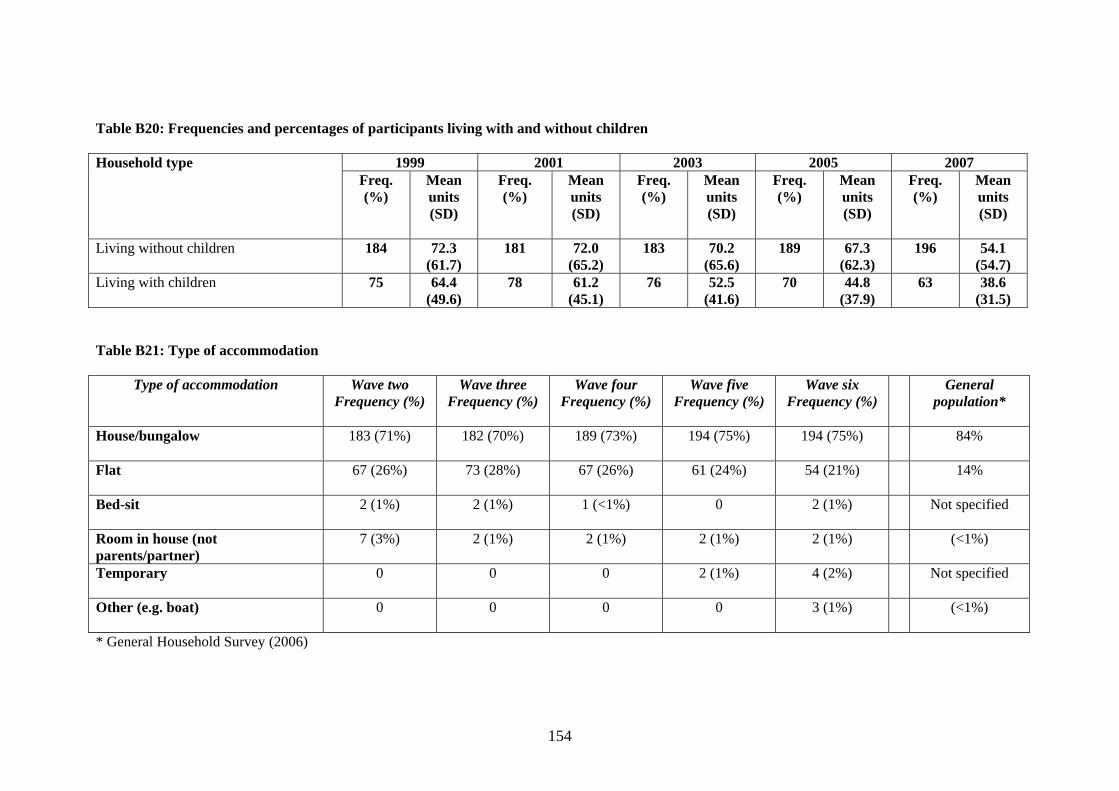
Table B20: Frequencies and percentages of participants living with and without children
1999 2001 2003 2005 2007 Household type Freq. (%)
Mean units (SD)
Freq. (%)
Mean units (SD)
Freq. (%)
Mean units (SD)
Freq. (%)
Mean units (SD)
Freq. (%)
Mean units (SD)
Living without children 184 72.3 (61.7)
181 72.0 (65.2)
183 70.2 (65.6)
189 67.3 (62.3)
196 54.1 (54.7)
Living with children 75 64.4 (49.6)
78 61.2 (45.1)
76 52.5 (41.6)
70 44.8 (37.9)
63 38.6 (31.5)
Table B21: Type of accommodation
Type of accommodation Wave two Frequency (%)
Wave three Frequency (%)
Wave four Frequency (%)
Wave five Frequency (%)
Wave six Frequency (%)
General population*
House/bungalow
183 (71%) 182 (70%) 189 (73%) 194 (75%) 194 (75%) 84%
Flat
67 (26%) 73 (28%) 67 (26%) 61 (24%) 54 (21%) 14%
Bed-sit
2 (1%) 2 (1%) 1 (<1%) 0 2 (1%) Not specified
Room in house (not parents/partner)
7 (3%) 2 (1%) 2 (1%) 2 (1%) 2 (1%) (<1%)
Temporary
0 0 0 2 (1%) 4 (2%) Not specified
Other (e.g. boat) 0
0 0 0 3 (1%) (<1%)
* General Household Survey (2006)
154

Table B22: Type of housing
Housing tenure Wave two Frequency (%)
Wave three Frequency (%)
Wave four Frequency (%)
Wave five Frequency (%)
Wave six Frequency (%)
General population*
Owned outright
41 (16%) 44 (17%) 48 (19%) 49 (19%) 55 (21%) 33%
Owned with mortgage
119 (46% 117 (45%) 115 (44%) 114 (44%) 112 (43%) 39%
Rented from council or housing association
67 (26%) 69 (27%) 67 (26%) 63 (24%) 56 (22%) 17%
Rented privately
30 (12%) 29 (11%) 29 (11%) 31 (12%) 32 (12%) 8%
Temporary accommodation
2 (1%) 2 (1%) 4 (2%) Not specified
* General Household Survey (2006) Table B23: Number of bedrooms in accommodation
Number of bedrooms
Wave two Frequency (%)
Wave three Frequency (%)
Wave four Frequency (%)
Wave five Frequency (%)
Wave six Frequency (%)
0 2 (1%) 3 (1%) 5 (2%) 3 (1%) 2 (1%) 1 37 (14%) 37 (14%) 41 (16%) 38 (15%) 40 (15%) 2 75 (29%) 71 (27%) 62 (24%) 62 (24%) 58 (22%) 3 105 (41%) 111 (43%) 115 (44%) 114 (44%) 110 (43%) 4 25 (10%) 24 (9%) 23 (9%) 24 (9%) 35 (14%) 5 9 (4%) 7 (3%) 8 (3%) 12 (5%) 10 (4%) 6 5 (2%) 4 (2%) 2 (1%) 3 (1%) 2 (1%) 7 1 (<1%) 2 (1%) 2 (1%) 1 (<1%) 9 1 (<1%) 1 (<1%) 1 (<1%) 1 (<1%) 1 (<1%)
155

Table B24: Sample SF-36 factor mean scores, 1997 – 2007 by age in 1997 (general health and function) and general population means*
SF Factor
Age in 1997
n
1997
mean (SD)
1999
mean (SD)
2001
mean (SD)
2003
mean (SD)
2005
mean (SD)
2007
mean (SD)
General Population
mean*
General health
25-34 105 62.9 (20.3) 62.7 (20.9) 71.8 (82.9) 63.5 (21.7) 62.4 (21.3) 59.8 (22.5) 79.4
35-44 80 66.0 (22.1) 66.0 (22.8) 62.0 (23.0) 61. (23.3) 62.6 (24.9) 60.8 (23.4) 75.5
45-55 74 66.6 (23.8) 62.3 (24.6) 63.1 (25.4) 62.5 (23.5) 59.2 (25.1) 60.8 (25.1) 71.3
Physical function
25-34 105 92.9 (12.0) 89.8 (12.4) 91.4 (13.0) 89.9 (13.9) 87.9 (18.6) 88.2 (18.7) 94.5
35-44 80 89.3 (15.4) 87.0 (18.2) 85.2 (19.6) 85.1 (20.4) 85.4 (19.7) 84.3 (21.3 93.3
45-55 74 88.6 (15.7) 83.7 (19.9) 84.5 (20.4) 84.2 (21.5) 80.9 (22.4) 75.3 (27.8) 87.2
Mental function
25-34 105 65.0 (17.7) 66.6 (17.7) 69.7 (17.3) 68.7 (19.3) 67.8 (18.8) 69.4 (19.0) 77.2
35-44 80 62.9 (23.3) 63.1 (22.8) 66.4 (22.8) 67.7 (21.2) 68.1 (21.2) 70.4 (22.4) 76.0
45-55 74 68.3 (22.4) 66.1 (20.0) 67.5 (20.5) 71.4 (19.9) 68.9 (22.2) 74.2 (21.2) 75.6
Social function
25-34 105 82.2 (22.83) 82.8 (22.1) 85.7 (20.6) 82.6 (23.8) 79.9 (25.1) 81.1 (25.1) 91.1
35-44 80 83.9 (24.3) 80.9 (24.7) 80.4 (27.6) 83.7 (24.9) 81.3 (24.9) 81.5 (28.0) 90.5
45-55 74 85.0 (23.8) 80.3 (27.1) 82.4 (25.3) 82.0 (25.8) 76.5 (27.6) 84.4 (21.2) 87.7
* Omnibus Survey (Bowling et al. 1999)
156
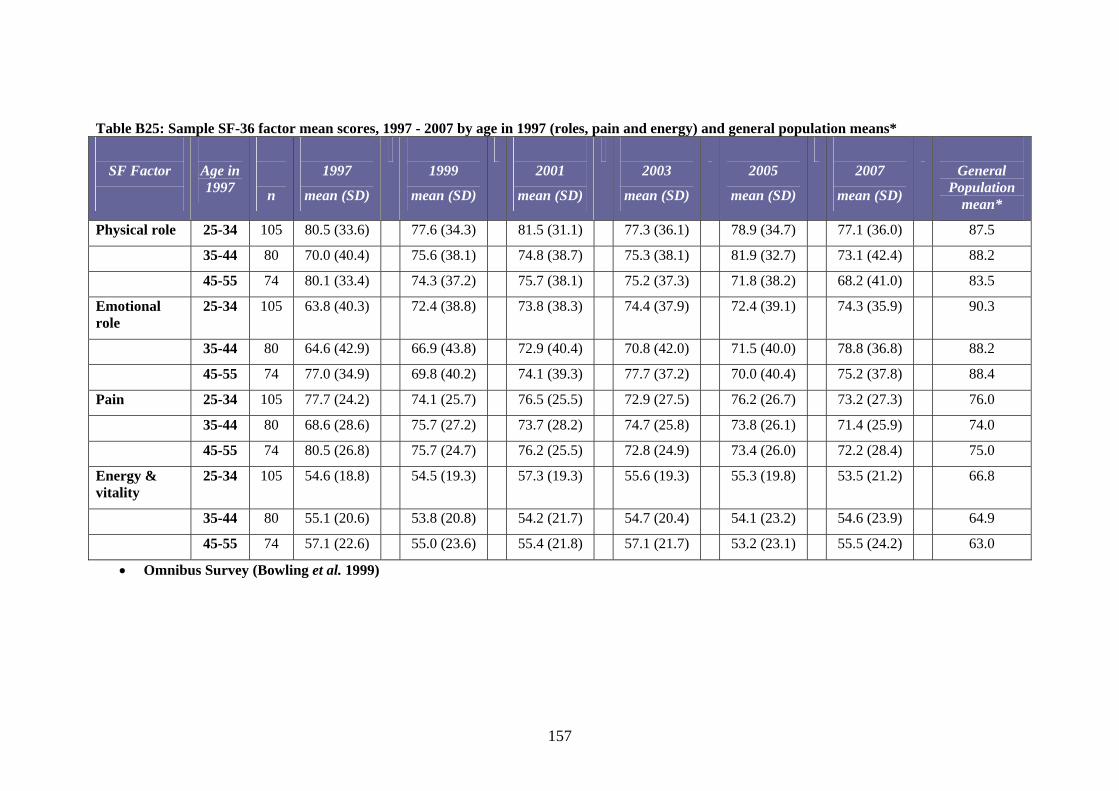
Table B25: Sample SF-36 factor mean scores, 1997 - 2007 by age in 1997 (roles, pain and energy) and general population means*
SF Factor
Age in 1997
n
1997
mean (SD)
1999
mean (SD)
2001
mean (SD)
2003
mean (SD)
2005
mean (SD)
2007
mean (SD)
General Population
mean*
Physical role 25-34 105 80.5 (33.6) 77.6 (34.3) 81.5 (31.1) 77.3 (36.1) 78.9 (34.7) 77.1 (36.0) 87.5
35-44 80 70.0 (40.4) 75.6 (38.1) 74.8 (38.7) 75.3 (38.1) 81.9 (32.7) 73.1 (42.4) 88.2
45-55 74 80.1 (33.4) 74.3 (37.2) 75.7 (38.1) 75.2 (37.3) 71.8 (38.2) 68.2 (41.0) 83.5
Emotional role
25-34 105 63.8 (40.3) 72.4 (38.8) 73.8 (38.3) 74.4 (37.9) 72.4 (39.1) 74.3 (35.9) 90.3
35-44 80 64.6 (42.9) 66.9 (43.8) 72.9 (40.4) 70.8 (42.0) 71.5 (40.0) 78.8 (36.8) 88.2
45-55 74 77.0 (34.9) 69.8 (40.2) 74.1 (39.3) 77.7 (37.2) 70.0 (40.4) 75.2 (37.8) 88.4
Pain 25-34 105 77.7 (24.2) 74.1 (25.7) 76.5 (25.5) 72.9 (27.5) 76.2 (26.7) 73.2 (27.3) 76.0
35-44 80 68.6 (28.6) 75.7 (27.2) 73.7 (28.2) 74.7 (25.8) 73.8 (26.1) 71.4 (25.9) 74.0
45-55 74 80.5 (26.8) 75.7 (24.7) 76.2 (25.5) 72.8 (24.9) 73.4 (26.0) 72.2 (28.4) 75.0
Energy & vitality
25-34 105 54.6 (18.8) 54.5 (19.3) 57.3 (19.3) 55.6 (19.3) 55.3 (19.8) 53.5 (21.2) 66.8
35-44 80 55.1 (20.6) 53.8 (20.8) 54.2 (21.7) 54.7 (20.4) 54.1 (23.2) 54.6 (23.9) 64.9
45-55 74 57.1 (22.6) 55.0 (23.6) 55.4 (21.8) 57.1 (21.7) 53.2 (23.1) 55.5 (24.2) 63.0
• Omnibus Survey (Bowling et al. 1999)
157

Table B26: SF-36 Total scores – sub-group comparisons 2007 (n = 259) Variable
n Mean SD Statistics
Age at entry 25-34 35-44 45-54
105 80 74
577 575 566
157.0 172.1 183.8
No significant differences
In a relationship? No Yes
96 163
505 613
190.7 141.0
t = -4.80 p < 0.001
Social Economic Group Professional Intermediate Skilled non-manual Skilled manual Semi-skilled Unskilled Not coded
13 84 46 59 23 32 2
619 616 619 528 542 489 417
113.4 151.8 133.7 184.7 151.0 202.4 233.4
F = 4.389 p < 0.001
Gender Male Female
184 75
573 574
168.2 172.3
No significant differences
158

Table B27: Total mean SF-36 scores by age group in 1997. Waves one to six. Age in 1997
25-34 mean (SD)
35-44 mean (SD)
45-55 mean (SD)
Total mean (SD)
n 105
80 74 259
Wave one
580 (117) 560 (164) 603 (158) 580 (145)
Wave two
580 (134) 569 (158) 567 (164) 573 (150)
Wave three
608 (150) 570 (184) 579 (152) 588 (162)
Wave four
585 (146) 573 (169) 583 (158) 581 (157)
Wave five
581 (146) 579 (167) 554 (167) 572 (159)
Wave six
577 (157) 575 (172) 566 (184) 573 (169)
159

Table B28 Frequency (and percentage) of time spent talking about drinking with GP, amongst those that discussed the subject (2003-2007)
Number of minutes discussed drinking with GP
2003 Frequency (%)
(n=51)
2005 Frequency (%)
(n=58)
2007 Frequency (%)
(n=55) Range of minutes 1-30 1-25 1-30
1-5 39 (76%) 45 (78%) 42 (76%) 6-10 6 (12%) 10 (17%) 6 (11%) 10+ 6 (12%) 3 (5%) 7 (13%)
Table B29: Frequency (and percentage) reporting different depths of discussion about their weekly consumption with their GP, amongst those that discussed the subject (2003-2007)
Depth of discussion about alcohol with GP
2003 Frequency (%)
(n=51)
2005 Frequency (%)
(n=58)
2007 Frequency (%)
(n=55) No description of weekly drinking
15 (29%) 15 (26%) 19 (35%)
Very brief summary of weekly consumption
25 (49%) 34 (59%) 22 (40%)
Detailed summary of weekly consumption
11 (22%) 9 (15%) 14 (25%)
160

Table B30: Numbers seeking help to address their drinking and mean number of times services accessed by help seekers 1999 - 2007 Type of help sought
Wave two
Freq/mean
Wave three
Freq/mean
Wave four
Freq/mean
Wave five
Freq/mean
Wave six
Freq/mean Non-residential alcohol agency
6
7.2
8
24.9
6
12.8
6
37.8
9
8.2
Residential rehab
1
1.0
0
n/a
1
1.0
3
101.6
1
2.0
Nights in hospital
2
2.5
0
n/a
3
2.3
0
n/a
0
n/a
Primary care counsellor or
3
2.0
2
6.5
0
n/a
0
n/a
3
3.7
nurse
Self help group
7
14.7
4
13.0
2
13.0
2
54.0
4
20.3
Other
5
6.4
3
84.0
3
52.7
1
730.0
0
n/a
Total 24
17
15
12
17
161
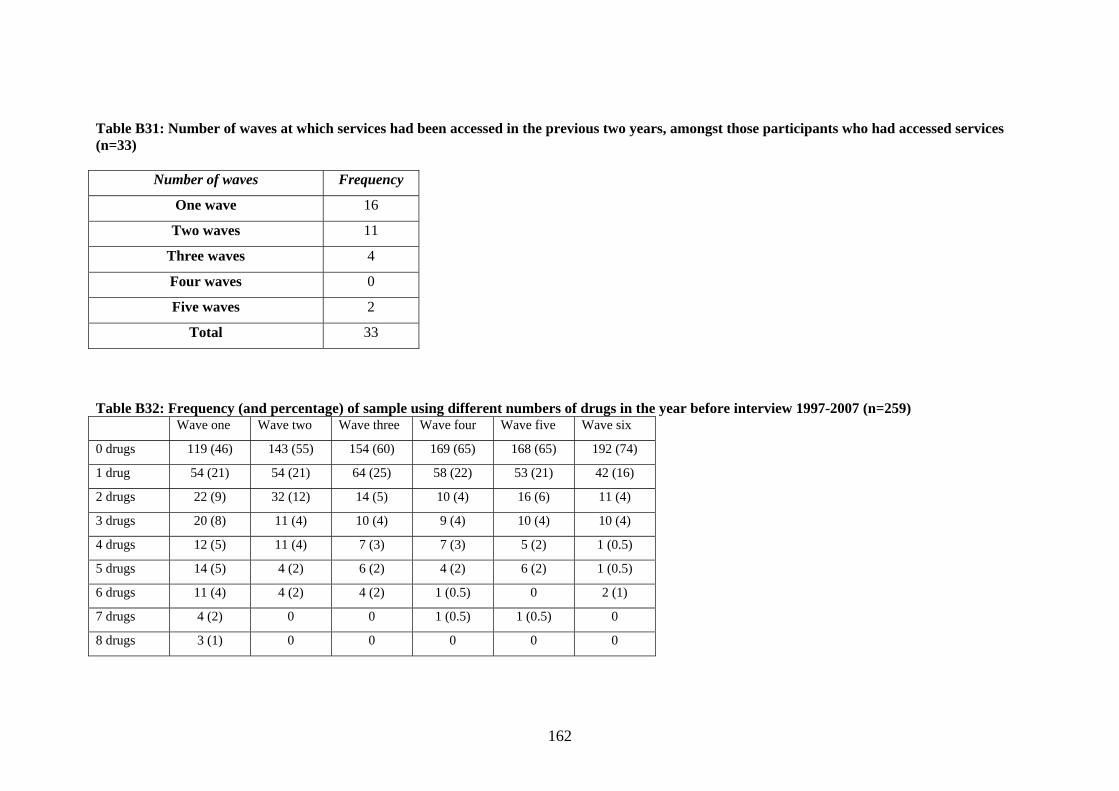
Table B31: Number of waves at which services had been accessed in the previous two years, amongst those participants who had accessed services (n=33)
Number of waves Frequency
One wave 16
Two waves 11
Three waves 4
Four waves 0
Five waves 2
Total 33
Table B32: Frequency (and percentage) of sample using different numbers of drugs in the year before interview 1997-2007 (n=259) Wave one Wave two Wave three Wave four Wave five Wave six
0 drugs 119 (46) 143 (55) 154 (60) 169 (65) 168 (65) 192 (74)
1 drug 54 (21) 54 (21) 64 (25) 58 (22) 53 (21) 42 (16)
2 drugs 22 (9) 32 (12) 14 (5) 10 (4) 16 (6) 11 (4)
3 drugs 20 (8) 11 (4) 10 (4) 9 (4) 10 (4) 10 (4)
4 drugs 12 (5) 11 (4) 7 (3) 7 (3) 5 (2) 1 (0.5)
5 drugs 14 (5) 4 (2) 6 (2) 4 (2) 6 (2) 1 (0.5)
6 drugs 11 (4) 4 (2) 4 (2) 1 (0.5) 0 2 (1)
7 drugs 4 (2) 0 0 1 (0.5) 1 (0.5) 0
8 drugs 3 (1) 0 0 0 0 0
162

Table B33: Percentage of drug use for the sample (n = 259) in waves two to six, compared to the general population in 2006/2007 Wave
two Wave three
Wave four
Wave five
Wave six
Gen pop.
06/07* Missing cases: 6 13 12 15 0 n/a
Cannabis 39% 37% 32% 29% 22% 8.2% Nitrites 8% 6% 4% 5% 2% 1.4% Magic Mushrooms 13% 3% 2% 2% 0% 0.6% Amphetamines 15% 7% 5% 6% 3% 1.3% Ecstasy 8% 9% 6% 7% 4% 1.8% LSD 2% 2% <1% 1% <1% 0.2% Cocaine 9% 13% 9% 9% 8% 2.6% Crack Cocaine ** 2% 4% 3% 3% 0.2% Heroin/other opiates <1% 1% 1% 2% 2% 0.2% Other illegal drug 5% <1% <1% 1% 0% - * Based on British Crime Survey figures 2006/2007, which uses a sample aged 16-59 years old. **At wave two, participants were only asked if they had taken Cocaine and/or Crack Cocaine (these were not separate questions), so their responses have been included under Cocaine.
163

Table B34: Frequency and percentage of sample reporting intoxicated behaviours on at least one occasion in the year before interview by gender 1997-2007 (n=259)
Type of behaviour when intoxicated
1997
Frequency (%)
1999
Frequency (%)
2001
Frequency (%)
2003
Frequency (%)
2005
Frequency (%)
2007
Frequency (%)
M
F All M F All M F All M F All M F All M F All
Aggressive
64 (35)
32 (43)
96 (37)
74 (40)
27 (36)
101 (39)
60 (33)
22 (30)
82 (32)
52 (28)
18 (24)
70 (27)
57 (31)
21 (28)
78 (30)
38 (21)
21 (28)
59 (23)
In a fight
42 (23)
18 (24)
60 (23)
41 (22)
18 (24)
59 (23)
31 (17)
12 (16)
43 (17)
25 (14)
8 (11)
33 (13)
25 (14)
7 (9) 32 (12)
21 (11)
9 (12)
30 (12)
Damage property
23 (13)
8 (11)
31 (12)
16 (9)
3 (4) 19 (7)
13 (7)
2 (3) 15 (6)
16 (9)
1 (1) 17 (7)
12 (7)
3 (4) 15 (6)
2 (1) 0 2 (1)
Neglect child
2 (1) 1
(1)
3 (1) 1 (1) 0 1 (<1)
1 (<1)
0 1 (<1)
0 0 0 0 0 0 0 0 0
Ejected from pub
28 (15)
8
(11)
36 (14)
19 (10)
3 (4) 22 (9)
21 (11)
5 (7) 26 (10)
18 (10)
7 (9) 25 (10)
22 (12)
3 (4) 25 (10)
10 (5)
3 (4) 13 (5)
Other regret
81 (44)
31 (41)
112 (43)
63 (34)
20 (27)
83 (32)
49 (27)
20 (27)
69 (27)
50 (27)
21 (28)
71 (27)
50 (27)
18 (24)
68 (26)
32 (17)
10 (13)
42 (16)
164

TableB35: Frequency and percentage of sample engaging in different numbers of intoxicated behaviour types on at least one occasion in the year before interview 1997-2007 (n=259)
Number of different intoxicated behaviours
1997
Frequency (%)
1999
Frequency (%)
2001
Frequency (%)
2003
Frequency (%)
2005
Frequency (%)
2007
Frequency (%)
0 93 (36) 109 (42) 124 (48) 134 (52) 140 (54) 167 (65)
1 69 (27) 67 (26) 73 (28) 68 (26) 56 (22) 55 (21)
2 46 (18) 49 (19) 34 (13) 33 (13) 41 (16) 23 (9)
3 30 (12) 18 (7) 18 (7) 15 (6) 10 (4) 11 (4)
4 18 (7) 14 (5) 9 (4) 8 (3) 10 (4) 3 (1)
5 3 (1) 2 (1) 1 (<1) 1 (<1) 2 (1) 0
165

Table B36: Frequency, range and mean number of times behaviour reported amongst those reporting intoxicated behaviours in the year before
interview 1999-2007 1999 2001
2003
2005
2007
Type of behaviour when intoxicated
n Range Mean times (SD)
n Range Mean times (SD)
n Range Mean times (SD)
n Range Mean times (SD)
n Range Mean times (SD)
Aggressive
101 1-50 4.67 (6.52)
82 1-60 6.37 (10.48)
70 1-100 6.20 (13.47)
78 1-52 4.19 (8.46)
59 1-20 3.44 (3.95)
In a fight
59 1-19 2.25 (2.72)
43 1-19 2.81 (3.34)
33 1-50 5.58 (11.41)
32 1-75 5.88 (15.49)
30 1-12 2.97 (3.20)
Damage property
19 1-10 2.68 (2.50)
15 1-15 3.40 (4.32)
17 1-25 3.53 (6.02)
15 1-30 3.47 (7.40)
2 1-2 1.50 (0.71)
Neglect child
1 200 200.0 (n/a)
1 50 50.0 (n/a)
0 0 0
Ejected from pub
22 1-6 1.91 (1.54)
26 1-12 2.38 (2.95)
25 1-20 2.80 (4.10)
25 1-5 1.44 (0.92)
13 1-2 1.15 (0.38)
Other regret
83 1-50 5.07 (6.65)
69 1-20 4.10 (4.29)
71 1-40 4.18 (6.73)
68 1-50 4.57 (7.54)
42 1-100 8.29 (22.14)
166

Table B37: Mean number of times intoxicated behaviour reported amongst sample in the year before interview 1999-2007 1999
Mean times (SD)
2001 Mean times (SD)
2003 Mean times (SD)
2005 Mean times (SD)
2007 Mean times (SD)
Aggressive
1.82 (4.66) 2.02 (6.58) 1.68 (7.49) 1.26 (5.01) 0.78 (2.36)
In a fight
0.51 (1.60) 0.47 (1.71) 0.71 (4.43) 0.73 (5.71) 0.34 (1.44)
Damage property
0.20 (0.96) 0.20 (1.28) 0.23 (1.74) 0.20 (1.90) 0.01 (0.14)
Neglect child
0.77 (12.43) 0.19 (3.11)
Ejected from pub
0.16 (0.69) 0.24 (1.17) 0.27 (1.50) 0.14 (0.51) 0.06 (0.27)
Other regret
1.63 (4.44) 1.09 (2.85) 1.15 (3.98) 1.20 (4.34) 1.34 (9.34)
167

Table B38: Mean weekly unit consumption amongst those reporting at least one intoxicated behaviour and those reporting no intoxicated behaviour (n = 259)
Wave one
Wave two
Wave three
Wave four
Wave five
Wave six
n
Mean units (SD)
n
Mean units (SD)
n
Mean units (SD)
n
Mean units (SD)
n
Mean units (SD)
n
Mean units (SD)
Reported at least one intoxicated behaviour
166
82.7
(54.9)
150
75.4
(62.7)
135
75.9
(61.7)
125
76.2
(61.1)
119
70.6
(57.6)
62
65.0
(64.5) No reported intoxicated behaviours
93
75.1
(36.1)
109
62.7
(51.5)
124
61.0
(57.3)
134
54.6
(57.2)
140
53.3
(56.6)
167
42.3
(38.6)
168

Table B39: Frequency (and percentage within variable group) who have engaged in different intoxicated behaviours in the last year – sub-group comparisons 2007 (n = 259)
Variable n Aggressive
Frequency (%)
In a fight
Frequency (%)
Damaged property
Frequency (%)
Neglected child
Frequency
(%)
Ejected from pub
Frequency (%)
Other regrets
Frequency (%)
Age 25-34 35-44 45-54
105 80 74
30 (29) 19 (24) 10 (14)
12 (11) 12 (15)
6 (8)
1 (1) 0
1 (1)
0 0 0
7 (7) 4 (5) 2 (3)
20 (19) 15 (19) 7 (10)
In a relationship? No Yes
96 163
26 (27) 33 (20)
18 (19) 12 (7)
1 (1) 1 (1)
0 0
5 (5) 8 (5)
16 (17) 26 (16)
Social Economic Group Professional Intermediate Skilled non-manual Skilled manual Semi-skilled Unskilled Not coded
13 84 46 59 23 32 2
4 (31) 16 (19) 11 (24) 14 (24) 6 (26) 7 (22) 1 (50)
0 7 (8) 3 (7)
14 (24) 4 (17) 2 (6)
0
0 0
1 (2) 0
1 (4) 0 0
0 0 0 0 0 0 0
0 3 (4) 1 (2) 5 (9)
0 4 (13)
0
6 (46) 15 (18) 8 (17) 9 (15) 1 (4) 3 (9)
0
169

Table B40: Mean unit consumption of perpetrators and victims of violence/aggression and those that did not mention this issue in their final interview 1997-2007
1997 1999 2001 2003 2005 2007 No mention of violence & aggression
77.6 (45.3) 67.0 (51.0 66.4 (56.0) 63.5 (57.5) 59.8 (55.1) 49.5 (47.1)
Perpetrator of violence or aggression
103.4 (70.8) 90.5 (92.7) 110.6 (104.3) 117.6 (96.1) 101.6 (93.4) 63.7 (78.1)
Victim of violence, aggression or harassment
89.2 (68.9) 78.7 (76.5) 74.8 (59.5) 55.5 (46.8) 50.5 (44.4) 53.6 (65.4)
Table B41: Mean ‘heavy’ drinking days of perpetrators and victims of violence/aggression and those that did not mention this issue in their final interview 1997-2007
1997 1999 2001 2003 2005 2007 No mention of violence & aggression
186.4 (102.1) 154.0 (119.3) 166.9 (122.2) 147.3 (121.5) 138.6 (126.9) 124.9 (125.4)
Perpetrator of violence or aggression
236.9 (112.1) 212.4 (117.8) 220.4 (115.1) 191.8 (111.1) 216.5 (119.2) 177.6 (131.7)
Victim of violence, aggression or harassment
188.2 (106.2) 181.6 (135.5) 167.8 (140.1) 163.6 (119.8) 164.8 (130.3) 147.5 (144.7)
170

Table B42: Mean ‘very heavy’ drinking days of perpetrators and victims of violence/aggression and those that did not mention this issue in their
final interview 1997-2007 1997 1999 2001 2003 2005 2007 No mention of violence & aggression
78.3 (86.6) 63.9 (85.9) 70.0 (94.6) 53.5 (87.6) 49.1 (83.4) 46.7 (83.2)
Perpetrator of violence or aggression
121.3 (128.2) 149.1 (142.1) 147.6 (125.1) 133.4 (110.1) 165.7 (128.2) 101.1 (127.6)
Victim of violence, aggression or harassment
96.3 (103.8) 94.6 (114.7) 76.6 (101.7) 79.2 (108.6) 67.6 (96.9) 92.5 (130.9)
171

Table B43: Frequency (and percentage) of sample that have appeared in court in the year before interview and reasons for court appearance 1997-2007 (n=259) and mean weekly unit consumption amongst those that appeared in court
Type of court
1997 Frequency ( of (% of sample)
1999 Frequency (%)
2001 Frequency (%)
2003 Frequency (%)
2005 Frequency (%)
2007 Frequency (%)
Magistrates 14 (5) 17 (7) 6 (2) 6 (2) 8 (3) 10 (4) County 4 (2) 4 (2) 2 (2) 0 4 (2) 4 (2) Crown 0 1 (<1) 3 (1) 1 (<1) 0 0 High 1 (<1) 1 (<1) 0 0 0 0
Reason for court appearance
1997 Frequency (%)
1999 Frequency
(%)
2001 Frequency
(%)
2003 Frequency
(%)
2005 Frequency
(%)
2007 Frequency
(%) Family/matrimonial 8 (3) 5 (2) 1 (<1) 0 5 (2) 1 (<1) Civil 5 (2) 6 (2) 2 (1) 1 (<1) 0 3 (1) Criminal non-violent 5 (2) 4 (2) 4 (2) 1 (<1) 1 (<1) 4 (2) Criminal violent 1 (<1) 2 (1) 2 (1) 3 (1) 3 (1) 2 (1) Driving offence 3 (1) 7 (3) 2 (1) 2 (1) 3 (1) 4 (2) Mean unit consumption in week before interview amongst those that appeared in court
71.5
63.4
92.6
52.2
93.0
72.7
172

Table B44: Frequency of sample in contact with the probation service and frequency that have appeared in court on at least one occasion in the year before interview 1997-2007 (n=259)
Number in contact with probation
Number appeared in court at least once in last year
1997 9 (3%) 22 (8.5%)
1999 8 (3%) 21 (8.1%)
2001 3 (1%) 12 (4.6%)
2003 1 (<1%) 8 (3.1%)
2005 1 (<1%) 11 (4.2%)
2007 2 (<1%) 13 (5.0%)
173

Table B45: Frequency of men and women who reported being a victim of different crimes in the year before interview 1997-2007 (n=259)
1997 Frequency (% of
gender)
1999 Frequency (%of
gender)
2001 Frequency (%of
gender)
2003 Frequency (%of
gender)
2005 Frequency (%of
gender)
2007 Frequency (%of
gender) Type of crime
Male Female Male Female Male Female Male Female Male Female Male Female
Vandalism 4 (2) 2 (3) 4 (2) 0 3 (2) 3 (4) 4 (2) 3 (4) 2 (1) 0 5 (3) 1 (1) Theft/burglary 28 (15) 14 (19) 30 (16) 8 (11) 27 (15) 7 (9) 22 (12) 8 (11) 11 (6) 7 (9) 13 (7) 5 (7) Assault 12 (7) 4 (5) 15 (8) 4 (5) 9 (5) 6 (8) 8 (4) 5 (7) 5 (3) 3 (4) 11 (6) 2 (3) Car accident 2 (1) 1 (1) 1 (1) 0 2 (1) 0 1 (1) 1 (1) Other 4 (2) 1 (1) 3 (2) 1 (1) 4 (2) 1 (1) 1 (1) 1 (1) 1 (1) 2 (3) Total number of victims of crime (% of sample)
50 (27%)
22 (29%)
40 (22%)
12 (16%)
44 (24%)
17 (23%)
39 (21%)
18 (24%)
18 (10%)
11 (15%)
30 (16%)
10 (13%)
General pop* 35% 31% 28% 27% 24% 22%
174

Table B46: Mean number of contacts with a GP at the surgery and at home. Comparison of sample (n=259) to general population* 1999-2007 Surgery Visits
Mean (SD) Home visits Mean (SD)
General pop* Mean visits per year
Wave two: Male Female All
3.22 (3.81) 4.56 (6.66) 3.61 (4.83)
0.07 (0.31) 0.23 (1.16) 0.12 (0.68)
3.5 5.5 4.5
Wave three: Male Female All
3.01 (4.08) 5.45 (7.53) 3.72 (5.41)
0.11 (0.57) 0.24 (1.04) 0.15 (0.74)
4 5
4.5 Wave four: Male Female All
3.70 (5.44) 4.65 (6.47) 3.97 (5.76)
0.04 (0.27) 0.04 (0.26) 0.04 (0.27)
4
5.5 4.5
Wave five: Male Female All
3.95 (8.68) 4.39 (4.65) 4.07 (7.73)
0.02 (0.13) 0.07 (0.48) 0.03 (0.28)
3.5 5.5 4.5
Wave six: Male Female All
3.58 (5.90) 5.16 (7.02) 4.04 (6.27)
0.03 (0.21) 0.04 (0.35) 0.03 (0.25)
3 5
4.5 * GHS 2006
175
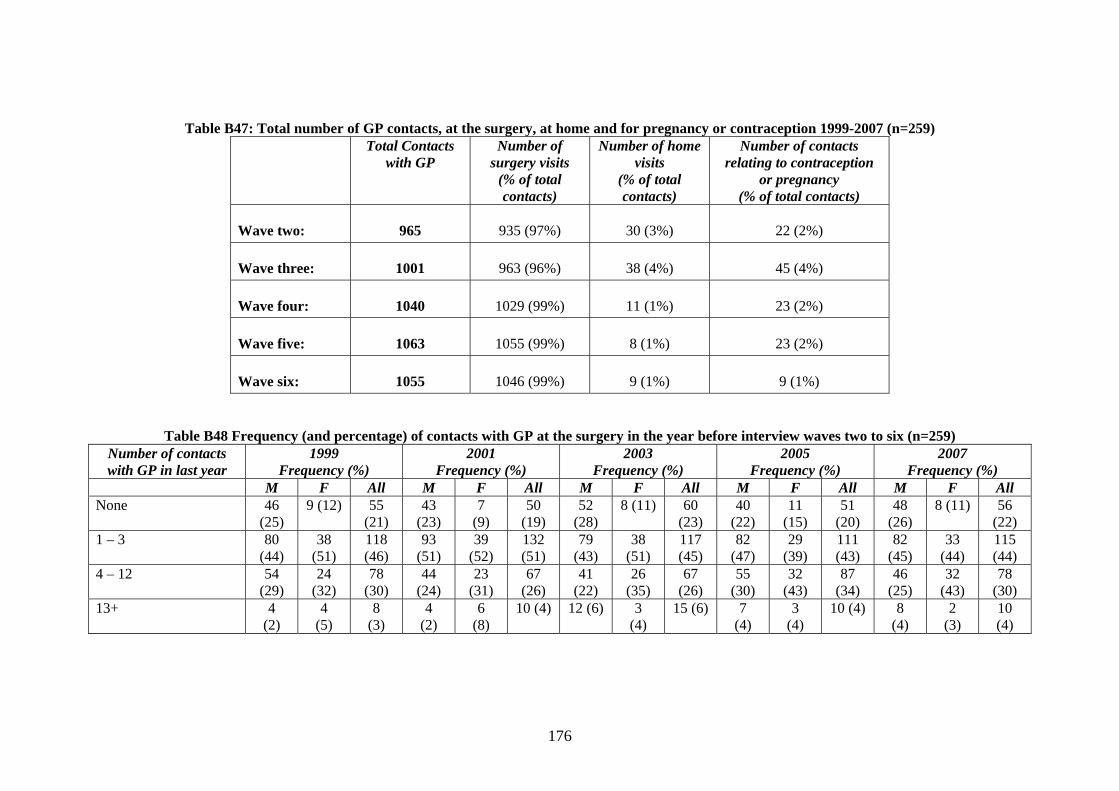
Table B47: Total number of GP contacts, at the surgery, at home and for pregnancy or contraception 1999-2007 (n=259) Total Contacts
with GP Number of
surgery visits (% of total contacts)
Number of home visits
(% of total contacts)
Number of contacts relating to contraception
or pregnancy (% of total contacts)
Wave two:
965
935 (97%)
30 (3%)
22 (2%)
Wave three:
1001
963 (96%)
38 (4%)
45 (4%)
Wave four:
1040
1029 (99%)
11 (1%)
23 (2%)
Wave five:
1063
1055 (99%)
8 (1%)
23 (2%)
Wave six:
1055
1046 (99%)
9 (1%)
9 (1%)
Table B48 Frequency (and percentage) of contacts with GP at the surgery in the year before interview waves two to six (n=259) Number of contacts with GP in last year
1999 Frequency (%)
2001 Frequency (%)
2003 Frequency (%)
2005 Frequency (%)
2007 Frequency (%)
M F All M F All M F All M F All M F All None 46
(25) 9 (12) 55
(21) 43
(23) 7
(9) 50
(19) 52
(28) 8 (11) 60
(23) 40
(22) 11
(15) 51
(20) 48
(26) 8 (11) 56
(22) 1 – 3 80
(44) 38
(51) 118 (46)
93 (51)
39 (52)
132 (51)
79 (43)
38 (51)
117 (45)
82 (47)
29 (39)
111 (43)
82 (45)
33 (44)
115 (44)
4 – 12 54 (29)
24 (32)
78 (30)
44 (24)
23 (31)
67 (26)
41 (22)
26 (35)
67 (26)
55 (30)
32 (43)
87 (34)
46 (25)
32 (43)
78 (30)
13+
4 (2)
4 (5)
8 (3)
4 (2)
6 (8)
10 (4) 12 (6) 3 (4)
15 (6) 7 (4)
3 (4)
10 (4) 8 (4)
2 (3)
10 (4)
176

Table B49: Frequency (and percentage) of comment type from the GP in the year before interview waves two to six (n=259)
Comment type 1999 Frequency (%)
2001 Frequency (%)
2003 Frequency (%)
2005 Frequency (%)
2007 Frequency (%)
M F All M F All M F All M F All M F All To reduce drinking 36
(20) 10
(13) 46
(18) 33
(18) 10
(13) 43
(17) 38
(21) 9 (12) 47
(18) 39
(21) 6 (8) 45
(17) 38
(21) 8 (11) 46
(18) No need to change 6
(3) 1
(1) 7
(3) 0 3
(4) 3
(1) 2
(1) 1
(1) 3
(1) 5 (3) 1 (1) 6 (2) 0 1 (1) 1 (<1)
To promote drinking 1 (1)
0 1 (<1)
Other comment
6 (3) 2 (3) 8 (3) 5 (3) 2 (3) 7 (3) 6 (3) 3 (4) 9 (4)
177

Table B50: Frequency (and percentage) of different reasons for last contact with GP when drinking was discussed. Waves 3 to 6 (n=259)
Reason for GP contact 2001 Frequency (%)
2003 Frequency (%)
2005 Frequency (%)
2007 Frequency (%)
M F All M F All M F All M F All Drinking not discussed with GP
49 (27)
9 (12)
58 (22)
143 (78)
65 (87)
208 (80)
135 (73)
66 (88)
201 (78)
142 (77)
63 (84)
205 (79)
New chronic condition 43 (23)
19 (25)
62 (24)
4 (2)
0 4 (2)
2 (1)
0 2 (1)
3 (2)
0 3 (1)
Ongoing chronic condition
16 (9)
4 (5)
20 (8)
18 (9)
4 (5)
22 (9)
19 (10)
1 (1)
20 (8)
18 (10)
6 (8)
24 (9)
Acute condition 7 (4)
3 (4)
10 (4)
7 (4) 2 (3) 9 (4) 4 (2) 3 (4) 7 (3) 2 (1) 1 (1) 3 (1)
Injury 0 0 0 3 (2)
1 (1)
4 (2)
1 (1)
1 (1)
2 (1)
1 (1)
1 (1)
2 (1)
Minor illness 0 2 (3)
2 (1)
0 0 0 3 ( 2)
1 (1)
4 (2)
4 (2)
0 4 (2)
Repeat prescription 69 (38)
38 (51)
107 (41)
6 (3)
0 6 (2)
5 (3)
1 (1)
6 (2)
8 (4)
2 (3)
10 (4)
Check-up/medical 0 0 0 2 (1)
2 (3)
4 (2)
14 (8)
2 (3)
16 (6)
6 (3)
2 (3)
8 (3)
New patient 0 0 0 1 (1) 1 (1) 2 (1) 1 (1) 0 1 (<1)
0 0 0
178
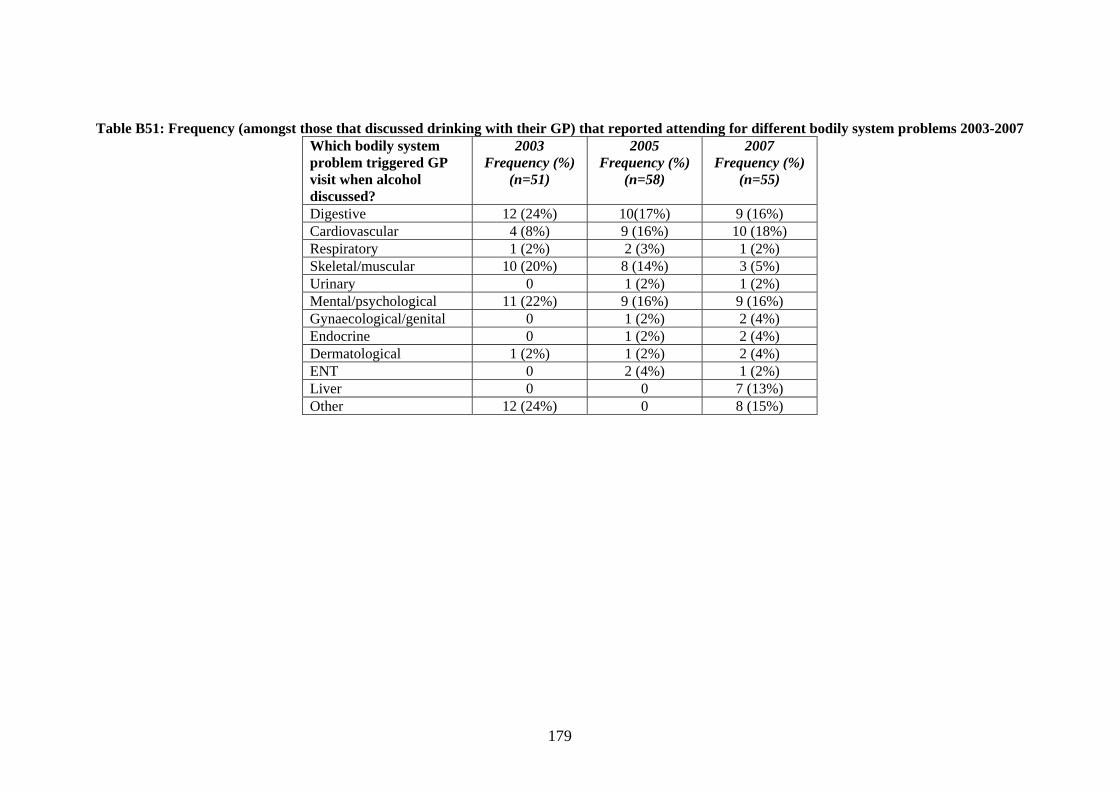
Table B51: Frequency (amongst those that discussed drinking with their GP) that reported attending for different bodily system problems 2003-2007 Which bodily system problem triggered GP visit when alcohol discussed?
2003 Frequency (%)
(n=51)
2005 Frequency (%)
(n=58)
2007 Frequency (%)
(n=55)
Digestive 12 (24%) 10(17%) 9 (16%) Cardiovascular 4 (8%) 9 (16%) 10 (18%) Respiratory 1 (2%) 2 (3%) 1 (2%) Skeletal/muscular 10 (20%) 8 (14%) 3 (5%) Urinary 0 1 (2%) 1 (2%) Mental/psychological 11 (22%) 9 (16%) 9 (16%) Gynaecological/genital 0 1 (2%) 2 (4%) Endocrine 0 1 (2%) 2 (4%) Dermatological 1 (2%) 1 (2%) 2 (4%) ENT 0 2 (4%) 1 (2%) Liver 0 0 7 (13%) Other 12 (24%) 0 8 (15%)
179

180
Table B52: Frequency (and percentage) of sample that accessed inpatient, A&E and outpatient services in the year before interview 1997-2007 (n=259)
1997 Frequency (%)
1999 Frequency (%)
2001 Frequency (%)
2003 Frequency (%)
2005 Frequency (%)
2007 Frequency (%)
M F All M F All M F All M F All M F All M F All Inpatient visits
30
(16) 16
(21) 46
(18) 19
(10) 18
(24) 37
(14) 22
(12) 12
(16) 34
(13) 18
(10) 13
(17) 31
(12) 30
(16) 9
(12) 39
(15) 25
(14) 11
(15) 36
(14) A & E visits 45
(25) 14
(19) 59
(23) 45
(25) 16
(21) 61
(24) 37
(20) 14
(19) 51
(20) 32
(17) 9
(12) 41
(16) 32
(17) 15
(20) 47
(18) 37
(20) 12
(16) 49
(19) Outpatient visits No data available No data available 61
(33) 35
(47) 96
(37) 63
(34) 36
(48) 99
(38) 56
(30) 28
(37) 84
(32) 66
(36) 26
(35) 92
(36)
Table B53: Mean unit consumption comparison between those that used inpatient, A&E and outpatient services and those that did not 1997-2007 1997
Mean unit consumption (SD)
1999 Mean unit
consumption (SD)
2001 Mean unit
consumption (SD)
2003 Mean unit
consumption (SD)
2005 Mean unit
consumption (SD)
2007 Mean unit
consumption (SD) Yes No Yes No Yes No Yes No Yes No Yes No
Inpatient visits
79.6 (55.5)
80.1 (47.7)
45.3 (47.6)
74.1 (4.0) 62.6 (57.6)
69.7 (60.4)
75.6 (86.7)
63.6 (55.5)
80.9 (67.3)
57.8 (55.1)
41.9 (49.3)
51.7 (50.6)
A & E visits
92.9 (61.7)
76.2 (44.1)
64.2 (55.3)
71.8 (59.5)
57.6 (46.3)
71.5 (62.7)
78.8 (77.2)
62.4 (56.1)
65.2 (64.1)
60.4 (56.1)
62.7 (68.0)
47.5 (45.1)
Outpatient visits
No data available No data available 61.4 (51.6)
73.1 (64.2)
66.0 (56.2)
64.4 (62.4)
62.5 (59.6)
60.6 (56.7)
57.4 (63.8)
46.5 (41.0)

181
Table B54: Frequency (and percentage) of sample that accessed inpatient, A&E and outpatient services in the year before interview 1997-2007, age comparison (n=259)
Department type and age group
n 1997 Frequency (%)
1999 Frequency (%)
2001 Frequency (%)
2003 Frequency (%)
2005 Frequency (%)
2007 Frequency (%)
Inpatients 25-34 35-44 45-55
105 80 74
21 (20) 14 (18) 11 (15)
13 (12) 14 (18) 10 (14)
13 (12) 11 (14) 10 (14)
10 (10) 9 (11)
12 (16)
8 (8)
11 (14) 20 (27)
14 (13) 8 (10)
14 (19) A & E 25-34 35-44 45-55
105 80 74
28 (27) 20 (25) 11 (15)
32 (31) 20 (25) 9 (12)
20 (19) 16 (20) 15 (20)
19 (18) 14 (18) 8 (11)
17 (16) 17 (21) 13 (18)
21 (20) 14 (18) 14 (19)
Outpatients 25-34 35-44 45-55
105 80 74
36 (34) 34 (43) 26 (35)
30 (29) 32 (40) 37 (50)
27 (26) 25 (31) 32 (43)
30 (29) 22 (28) 40 (54)
Table B55: Frequency (and percentage) of sample that accessed A&E and/or outpatient services in the twelve months before interview and mean number of contacts 1997-2007 (n=259)
Frequency (% of sample) Sample mean visits (SD)
M F All Wave 3 77 (42%) 41 (55%) 118 (46%) 1.61 (4.07) Wave 4 79 (43%) 37 (49%) 116 (45%) 1.36 (2.46) Wave 5 74 (40%) 34 (45%) 108 (42%) 1.30 (3.33) Wave 6 83 (45%) 31 (41%) 114 (44%) 1.56 (3.54)

182
Table B56: Frequency (and percentage) of contacts with primary care services 1997-2007 (n=259)
1997 1999 2001 2003 2005 2007 M
F All M F All M F All M F All M F All M F All
Practice nurse
7 (4)
12 (16)
19 (7)
39 (21)
33 (44)
72 (28)
68 (37)
42 (56)
110 (43)
64 (35)
38 (51)
102 (39)
83 (45)
44 (59)
127 (49)
85 (46)
41 (55)
126 (49)
Practice counsellor 0 4 (5)
4 (2)
1 (1)
4 (5)
5 (2)
6 (3)
3 (4)
9 (4)
6 (3)
1 (1)
7 (3)
5 (3)
4 (5)
9 (4)
6 (3)
3 (4)
9 (4)
Other counsellor 3 (2)
3 (4)
6 (2)
7 (4)
5 (7)
12 (5)
2 (1)
1 (1)
3 (1)
2 (1)
1 (1)
3 (1)
3 (2)
1 (1)
4 (2)
2 (1)
0 2 (1)
Health Visitor 1 (1)
2 (3)
3 (1)
1 (1)
2 (3)
3 (1)
1 (1)
2 (3)
3 (1)
1 (1)
2 (3)
3 (1)
1 (1)
2 (3)
3 (1)
CPN 2 (1)
3 (4)
5 (2)
6 (3)
1 (1)
7 (3)
6 (3)
2 (3)
8 (3)
4 (2)
0 4 (2)
8 (4)
0 8 (3)
Alternative medicine practitioner
15 (8)
11 (15)
26 (10)
5 (3)
3 (4)
8 (3)
7 (4)
3 (4)
10 (4)
2 (1)
4 (5)
6 (2)
2 (1)
1 (1)
3 (1)
Other health professional
31 (17)
23 (31)
54 (21)
6 (3)
6 (8)
12 (5)
11 (6)
6 (8)
17 (7)
5 (3)
5 (7)
10 (4)
5 (3)
3 (4)
8 (3)

183
Table B57: Mean number of contacts with a practice nurse amongst the whole BUHD sample and amongst those that reported at least one contact (n=259) 1999-2007, comparison to general population figures
1999 Mean number of
contacts (SD)
2001 Mean number of
contacts (SD)
2003 Mean number of
contacts (SD)
2005 Mean number of
contacts (SD)
2007 Mean number of
contacts (SD)
BUHD sam Participants that had contact with practice nurse at leasGeneral population
Practice cou Other counsellor
Health Visit CPN Alternative medicinpractitioner Other healthprofessional
M F All M F All M F All M F All M F All ple (n=259) 0.5
(1.4) 0.9
(1.7) 0.6
(1.5) 0.8
(1.6) 1.2
(1.9) 0.9
(1.7) 0.9
(2.1) 1.3
(2.6) 1.0
(2.3) 1.0
(1.8) 1.4
(1.7) 1.1
(1.7) 1.4
(3.9) 1.5
(2.5) 1.4
(3.6)
t once
2.3 (2.4)
2.1 (2.1)
2.2 (2.3)
2.1 (2.1)
2.1 (2.2)
2.1 (2.1)
2.5 (2.9)
2.5 (3.2)
2.5 (3.0)
2.1 (2.1)
2.3 (1.6)
2.2 (1.9)
3.0 (5.4)
2.8 (2.9)
2.9 (4.7)
1.0 1.5 1.5 1.5 1.5 1.5 1.5 2.0 1.5 1.5 2.0 1.5 1.5 2.0 1.5
Table B58: Mean number of contacts with other primary care services amongst those that reported at least one contact 1999-2007
1999 2001 2003 2005 2007 M F All M F All M F All M F All M F All nsellor 4.0
(n/a) 2.0
(0.1) 2.4
(1.1) 2.0
(2.0) 2.7
(2.9) 2.2
(2.2) 4.2
(4.7) 2.0
(n/a) 3.9
(4.4) 1.6
(0.5) 3.3
(1.7) 2.3
(1.4) 6.3
(5.3) 2.0
(1.7) 4.9
(4.8) 6.4
(9.0) 11.8
(22.5) 8.7
(15.4) 14. 0 (15.6)
110.0 (n/a)
46.0 (56.5)
1.0 (0) 1.0 (n/a)
1.0 (0) 5.3 (5.9)
1.0 (n/a)
4.3 (5.3)
6.0 (5.7)
0 6.0 (5.7)
or 1.0 (n/a)
3.5 (3.5)
2.7 (2.9)
5.0 (n/a)
4.0 (2.8)
4.3 (2.1)
4.0 (n/a)
7.0 (4.2)
6.0 (3.5)
1.0 (n/a)
110 (1.4)
7.7 (5.9)
3.0 (n/a)
2.5 (2.1)
2.7 (1.5)
12.0 (n/a)
4.3 (4.9)
6.3 (5.6)
3.7 (4.4)
3.0 (n/a)
3.6 (4.0)
1.5 (0.8)
13.5 (17.7)
4.5 (8.7)
7.5 (12.3)
0 7.5 (12.3)
20.4 (34.8)
0 20.4 (34.8)
e 6.1 (10.5)
6.1 (4.6)
6.1 (8.4)
3.8 (2.0)
2.0 (1.7)
3.1 (2.0)
6.7 (8.0)
13.0 (12.5)
8.6 (9.3)
1.5 (0.7)
2.8 (2.4)
2.3 (2.0)
6.0 (5.7)
3.0 (n/a)
5.0 (4.4)
2.3 (1.5)
2.3 (1.6)
2.3 (1.5)
2.0 (1.3)
5.3 (3.7)
3.7 (3.1)
2.6 (2.3)
5.7 (5.2)
3.7 (3.8)
3.2 (1.8)
3.0 (1.9)
3.1 (1.7)
2.6 (2.1)
7.3 (7.1)
4.4 (4.8)

184
Table B59: Mean weekly unit consumption amongst those that reported at least one contact with each primary care service 1999-2007
1999 2001 2003 2005 2007
Practice nur Practice cou Other counsellor Health Visit CPN Alternative medicinpractitioner Other healthprofessional
M
F All M F All M F All M F All M F All
se 75.1 (56.9)
56.0 (58.3)
66.4 (58.0)
89.3 (75.0)
42.7 (28.9)
71.5 (65.5)
80.7 (78.5)
45.3 (36.6)
67.5 (68.1)
78.5 (71.9)
44.6 (37.9)
66.7 (64.2)
56.0 (56.6)
43.7 (46.4)
52.0 (53.6)
nsellor 112.0 (n/a)
61.5 (38.6)
71.6 (40.3)
70.5 (73.4)
57.8 (13.8)
66.3 (58.8)
107.3 (120.6)
68.0 (n/a)
101.7 (111.1)
69.6 (82.0)
55.6 (12.3)
63.4 (58.9)
80.3 (53.4)
56.7 (63.7)
72.4 (54.2)
70.4 (24.4)
43.6 (12.3)
59.3 (23.9)
108.8 (143.2)
39.0 (n/a)
85.5 (109.0)
82.0 (39.6)
40.5 (n/a)
68.2 (36.9)
85.0 (40.2)
6.0 (N/A)
65.3 (51.4)
141.0 (81.3)
0 141.0 (81.3)
or 64.0 (n/a)
102.5 (109.6)
89.7 (80.6)
62.0 (n/a)
71.0 (45.3)
68.0 (32.4)
43.0 (n/a)
19.0 (8.5)
27.0 (15.1)
240.0 (N/A)
7.0 (1.4)
84.7 (134.5)
0 9.5 (7.8)
6.3 (7.8)
88.0 (n/a)
41.3 (52.9)
53.0 (49.1)
87.7 (79.0)
42.0 (n/a)
81.1 (74.1)
43.2 (41.2)
12.5 (17.7)
35.5 (38.2)
64.3 (74.8)
0 64.3 (74.8)
61.3 (85.9)
0 61.3 (85.9)
e 52.0
(40.2) 44.1
(49.4) 48.7
(43.6) 85.6
(68.2) 60.2
(47.3) 76.1
(58.9) 51.8
(36.1) 23.2
(26.5) 43.2
(34.9) 15.0
(21.2) 15.4
(16.8) 15.3
(16.1) 40.3
(12.4) 22.0 (n/a)
34.2 (13.7)
66.8 (43.0)
52.6 (41.5)
60.8 (42.5)
98.3 (67.8)
65.5 (54.9)
81.9 (61.2)
74.6 (61.5)
14.8 (15.8)
53.5 (57.5)
82.1 (67.8)
25.1 (21.8)
53.6 (56.2)
71.6 (35.6)
32.7 (20.8)
57.0 (35.4)

185
Table B60: Frequency (and percentage) of estimates of recommended sensible drinking levels by gender 2003-2007 (n=259)
2003 Frequency (%)
2005 Frequency (%)
2007 Frequency (%)
M F All M F All M F All Daily unit for men Not known Under estimate Correct estimate Over estimate
90 (49) 14 (8) 60 (33) 20 (11)
41 (55) 1 (1)
20 (27) 13 (17)
131 (51) 15 (6) 80 (31) 33 (13)
73 (40) 11 (6) 83 (45) 17 (9)
38 (51) 2 (3)
21 (28) 14 (19)
111 (43) 13 (5)
104 (40) 31 (12)
34 (19) 22 (12) 89 (48) 39 (21)
26 (35) 3 (4)
33 (44) 13 (17)
60 (23) 25 (10)
122 (47) 52 (20)
Daily units for women Not known Under estimate Correct estimate Over estimate
100 (54)
2 (1) 63 (34) 19 (10)
39 (52) 1 (1)
25 (33) 10 (13)
139 (54)
3 (1) 88 (34) 29 (11)
79 (43) 12 (7) 80 (44) 13 (7)
37 (49) 1 (1)
27 (36) 10 (13)
116 (45) 13 (5)
107 (41) 23 (9)
38 (21) 13 (7)
100 (54) 33 (18)
25 (33) 2 (3)
38 (51) 10 (13)
63 (24) 15 (6)
138 (53) 43 (17)
Weekly units for men Not known Under estimate Correct estimate Over estimate
66 (36) 36 (20) 36 (20) 46 (25
31 (41) 8 (11) 21 (28) 15 (20)
97 (38) 44 (17) 57 (22) 61 (24)
56 (30) 30 (16) 38 (21) 60 (33)
32 (43) 6 (8)
22 (29) 15 (20)
88 (34) 36 (14) 60 (23) 75 (29)
28 (15) 41 (22) 42 (23) 73 (40)
18 (24) 6 (8)
30 (40) 21 (28)
46 (18) 47 (18) 72 (28) 94 (36)
Weekly units for women Not known Under estimate Correct estimate Over estimate
74 (40) 25 (14) 37 (20) 48 (26)
25 (33) 9 (12) 31 (41) 10 (13)
99 (38) 34 (13) 68 (26) 58 (22)
62 (34) 30 (16) 42 (23) 50 (27)
29 (39) 7 (9)
28 (37) 11 (15)
91 (35) 37 (14) 70 (27) 61 (24)
31 (17) 35 (19) 53 (29) 65 (35)
18 (24) 8 (11) 33 (44) 16 (21)
49 (19) 43 (17) 86 (33) 81 (31)

186
APPENDIX C: INTERVIEW CONTENT
Interviews were carried out at each interview wave by three psychology graduates, trained in both
quantitative and qualitative interview skills. Interviewers were supervised by the project manager.
Interviews lasted around two hours, and were composed of the following three elements:
1. Structured, computer-administered questionnaire
2. Paper and pencil exercises (e.g. Changes chart, Timeline Follow Back)
3. Qualitative interview

187
Table C1: Areas covered in each interview
W1 W2 W3 W4 W5 W6
Age, gender, DOB * * * * * * Educational qualifications * * * * * * Employment * * * * * * Socio-economic status * * * * * * Language, ethnicity, religious practice * Use of primary care services * * * * * * Gambling * * Eating and drinking * Exercise * Smoking * * * * * * Health (SF-36), medication * * * * * * Use of hospital services * * * * * * Use of social care services (*) * * * * * Help seeking * * * * * GP visits and comments on drinking * * * * * * Self esteem * * * Relationship status and changes * * * * * * Household status * * * * * * Weight and height * * * * * * Drinking (volume, place and company) last week (TLFB)
* * * * * *
No. of heavy drinking days last year * * * * * * Changes chart (*) * * * * * Brief Important People Interview * Important Activities Interview * Impact of last interview * * * * * Impact of change in smoking & licensing laws * Leeds Dependence Questionnaire * * * * * * Readiness to Change Questionnaire * * * * * * Work and alcohol (employed Ps only) * * * * * * Drug use * * * * * * Risky & intoxicated behaviours * * * * * * Aggression and violence * * * (*) * Criminal justice system contact (*) * * * * * Estimation of population average drinking * * Benefits and drawbacks (*) * * * * * Family member interviews * * * Qualitative interview (range of topics) * * * * * *

188
FURTHER DETAILS OF STANDARD MEASURES
Three standard measures were used to collect data during the drinking participant interviews: the
SF-36, LDQ and RTCQ.
1. Short Form 36 general health questionnaire (SF-36), Ware and Sherbourne (1992)
A 36 item questionnaire developed by Ware and Sherbourne in 1992 as a measure of general health
suitable for use with non-clinical samples. The measure provides factor scores for eight different
aspects of health (general health perception; social functioning; mental health; emotional role
limitations; physical function; physical role limitations; bodily pain; energy and vitality).
Interpretation of scores
• Higher scores represent better health (0 = poor health through to 100 for good health)
• General population data used in this report was taken from the Omnibus Survey (Bowling et al.
1999).
2. Leeds Dependence Questionnaire (LDQ), Raistrick et al. (1994)
A 12 item measure of alcohol dependence, reported by the developers to be ‘sensitive through the
range from mild to severe dependence’. Also, the measure was designed to be sensitive to change
over time.
Interpretation of scores
Each of the 12 items are scored on a range of 0 to 3, resulting in a total score between 0 and 36.
Higher scores represent greater dependence on alcohol.
Data available for comparison (Raistrick et al, 1994).
Clinical sample (drinker referrals to Leeds addiction Unit, n = 47) mean 16.3 (SD 8.9)
Students (consumed alcohol in previous week, n = 64) mean 7.0 (SD 4.4)
General Practice (random selection of patients,
drunk alcohol in previous week, n = 14) mean 3.1 (SD 3.2)
3. Readiness to Change questionnaire (RTCQ), Heather and Rollnick (1993)
A ten item questionnaire based upon the ‘transtheoretical’ or ‘stages of change’ model of Prochaska
and Diclemente (1983). The measure is intended to assess via the item responses the respondents
current stage of change position, which may be either precontemplative, contemplative or action.

189
Interpretation of scores
· The ten items are scored on a scale of -2 through to +2. Specific item scores are summed to
provide a score for each stage of change, the stage with the greatest score is assessed as the
stage at which the participant is currently positioned.
· Stages are interpreted as:-
precontemplation - stage at which individuals lack awareness of any need to change
contemplation - stage at which individuals are considering a need for change and
experiencing the associated conflict and dissonance.
Action - Individuals have already made a commitment to change and
taken some action to change their addictive behaviour
Content of the family member interviews
There were three standard questionnaires:
1) the perceived benefits and drawbacks of heavy drinking: the questions were exactly the same as
those asked of participants, except that family members were asked, from their own perspectives, to
rate benefits and drawbacks accruing to the heavy drinking relative from the latter’s heavy drinking
(it was made clear that we were not interested in the benefits and drawbacks accruing to the family
member her/himself, nor the latter’s opinion about the heavy drinker’s likely perceptions, but rather
the family member’s perceptions of what the benefits and drawbacks were for the heavy drinkers);
2) readiness to change drinking: again, items are identical to those used in the participant version of
the RTCQ, except that item wording was modified slightly in order to obtain the family member’s
perception of the desirability of change e.g. the item, ‘I don’t think I drink too much’ was modified
for family members to read, ‘I don’t think he[or she] drinks too much’;
3) the coping with a relative’s drinking questionnaire: this is a thirty-item questionnaire designed to
assess the ways in which family members have recently being trying to cope with a close relative’s
excessive drinking (Orford et al 2005) from which a total score and 3 sub-scale scores (engaged,
tolerant and withdrawal coping, respectively) can be derived. In the semi-structured interview the
family member was asked: to describe the nature and history of the relationship with the heavy
drinker he or she was related to, and to describe the history and nature of the heavy drinker’s
drinking, including the family member’s views on the causes of the heavy drinking; to describe the
effects of their relative’s heavy drinking on the interviewee; how the latter had been reacting to the
heavy drinking in the last 12 months; and his or her views on the desirability or undesirability of the
heavy drinker changing his or her drinking.

BUHD Participants qualitative Interview Topics Wave One (n = 500) General* (stage 1) 49 Career and Family (stage 1) 5 Benefits and Drawbacks of drinking 50 Readiness to Change 49 Support and Opposition 48 Family 37 Career 62 Health Education (stage 2) 49 Dependency 46 Norms 47 Gender 49 No qualitative interview 9 Total 500 Wave Two (n = 403) Mixed 32 Health care utilization 73 Aggression and alcohol 52 Work and alcohol 50 Social Inclusion/exclusion 50 Health Promotion 37 Current Family 44 Changes (in life and drinking) 50 Domestic Violence (as aggression stage 3) 7 No interview 8 Total 403 Wave Three (n = 350) Unemployment and drinking 19 Change in drinking and help seeking 30 P’s perception of the effects on family 22 Relationships 18 Responses to health consultations 21 Binge drinking 21 Drugs and alcohol 26 Women’s drinking 23 Masculinity 11 Not available for employment and drinking 23 Drinking places Most least admired women drinkers 15 Most least admired men drinkers 27 Maintaining change 13 Evaluating help 2 Changes in women’s drinking over time 22 Description of a binge 3
190
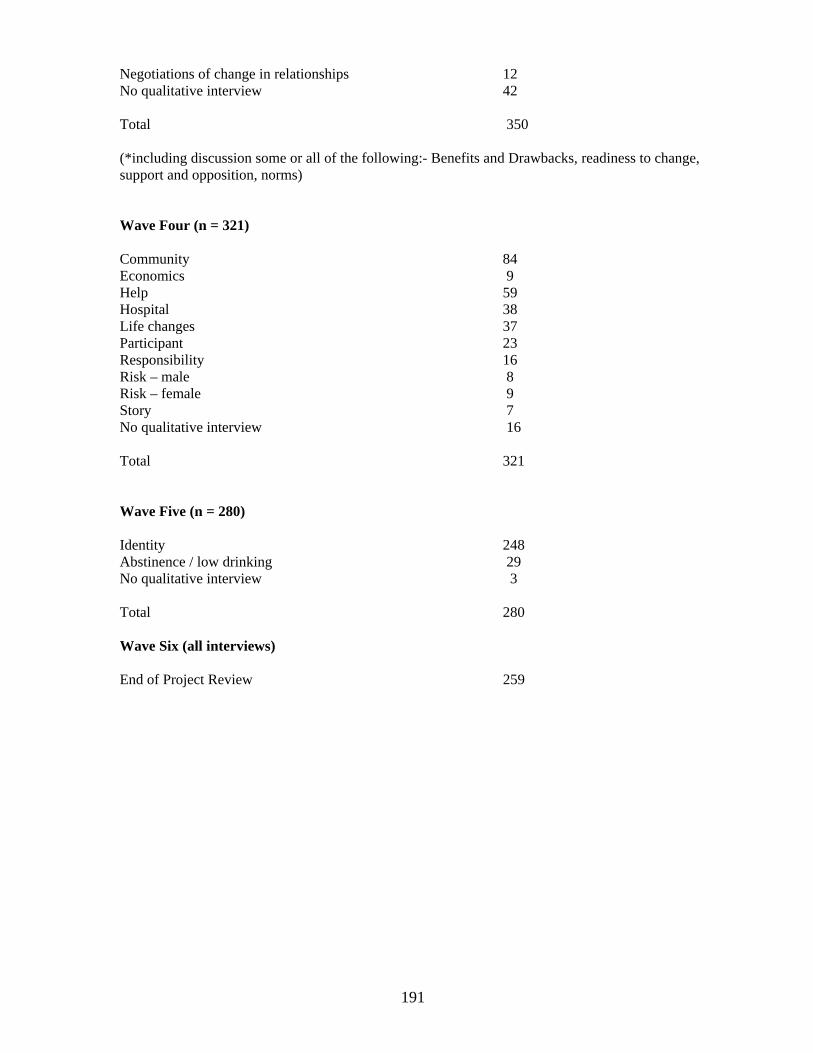
191
Negotiations of change in relationships 12 No qualitative interview 42 Total 350 (*including discussion some or all of the following:- Benefits and Drawbacks, readiness to change, support and opposition, norms) Wave Four (n = 321) Community 84 Economics 9 Help 59 Hospital 38 Life changes 37 Participant 23 Responsibility 16 Risk – male 8 Risk – female 9 Story 7 No qualitative interview 16 Total 321 Wave Five (n = 280) Identity 248 Abstinence / low drinking 29 No qualitative interview 3 Total 280 Wave Six (all interviews) End of Project Review 259

192
UWave Six Qualitative Interview guide
Explain to the participant that you would like them to reflect on how things have been over the past decade, both in their life and in their participation in the study. The questions about the last decade of their life will be used as a starting point for wider reflection on the past decade within the broader context of their life as a whole.
Part 1: Review of the decade and life
The aim of this section is to encourage the participant to think about how things have stayed the same and changed over the time they have been in the study. The purpose of this is partly to find out about people’s motivations for taking part (and particularly if they were already thinking of cutting down), and also to get them to tell their stories of what has changed over this time.
Guide questions:
⋅ Thinking back to when you first joined the study ten years ago, can you remember what was happening in your life around that time?
⋅ Can you remember what led you to take part in the study?
⋅ In what ways is your life today different from how it was ten years ago? In what ways has your life stayed the same? (Link this with the wider context of their life – e.g. Through asking questions such as: ‘has it always been like that?’ Was it like that when you were younger / before you were married / before you were a parent?’)
⋅ In what ways are you different from how you were ten years ago? In what ways have you stayed the same? (example of probe for wider context: ‘have you always been like that throughout your adult life?’)
⋅ What have been some of the main things that have happened over the past decade? (highs and lows) Have these things affected your drinking at all? If so, how? (example of probe for wider context: are there other really significant things that have happened in your life that have impacted on you or on your drinking?)
⋅ How do you see the next ten years? What do you expect to happen? What do you expect to happen with your drinking?
Further contextual questions
⋅ Thinking about your drinking over time, how would you summarise the part that drinking has played in your life?
⋅ How has this changed over time?
⋅ What is your overall perception of how big a part drinking has played in your life? (Dominant / ‘take it or leave it’ / better off without it?)
Part 2: Review of the study
The main aim of this section is to discuss the participant’s thoughts and feelings about the study, and particularly about how drinking has been talked about. It is hoped that this will both allow the collection of data about the experience of participating in the study, and also enable the interviewer to construct a good ending to the final interview, through reflecting on this experience.
Guide questions:
⋅ What’s it been like taking part in the study?
⋅ What’s it been like talking about drinking? Is this something you do in other contexts (if so, who with)? Or is this the only place you talk about drinking?

193
⋅ Has the project changed the way you think about things at all? If so, how?
⋅ Has it changed the way you think about drinking at all?
⋅ Has it changed how you talk about drinking at all? If so, how?
⋅ What’s been the most significant thing that’s been talked about? Is there anything that has stayed with you?
⋅ What haven’t you had an opportunity to talk about? Are there other things you wish you’d been asked?

194
Date
Drinks (amount & type)
Strength
Where
Who
Units
Total Units
Time of earliest drink(24 hr clock)
% of solitary drinking
Typical week? (more/less)
% of early drinking (before 11 am.)
% of alone drinking
Units in a typical week
Number of days drinking continuously
% of only drinker
Interview - day of week
Time Line Follow Back Exercise Participant no._____________

195
Changes Chart - 2007 Wave Six Participant No ______
Very High ( )
High ( )
Moderate ( )
Low ( )
Very Low ( )
Abstinent
Age & Date (month)
Events & Changes
NB Work status W Smoking S Religion R Help seeking HS Life events L

−196−