Transient hypertension concurrent with forepaw stimulation enhances functional MRI responsiveness in...
11
Transient hypertension concurrent with forepaw stimulation enhances functional MRI responsiveness in infarct and peri-infarct regions Ursula I Tuor 1,2,3 , Rong Wang 1,2 , Zonghang Zhao 3 , Tadeusz Foniok 1 , David Rushforth 1 , Jaclyn I Wamsteeker 1 and Min Qiao 1 1 MR Technology, Institute for Biodiagnostics (West), National Research Council, Calgary, Alberta, Canada; 2 Experimental Imaging Center and Hotchkiss Brain Institute, University of Calgary, Calgary, Alberta, Canada; 3 Department of Clinical Neurosciences, University of Calgary, Calgary, Alberta, Canada Although functional magnetic resonance imaging (fMRI) is gaining use as a tool to assess cerebral recovery following various insults, the effects of potential confounders such as hypertension are poorly defined. We hypothesized that after stroke, transient hypertension during an fMRI study could produce a detected activation unrelated to neuronal activity within the infarct. Thus, the effect of norepinephrine induced increases in blood pressure (BP) on the fMRI response to forepaw stimulation were investigated in controls or 1 week after transient middle cerebral artery occlusion in rats. Images were smoothed spatially and voxels correlating to either forepaw stimulation or the change in BP time courses were analyzed. Transient hypertension increased the signal intensity and numbers of voxels correlating to the BP time courses within and adjacent to the ischemic infarct and these exceeded the response in the contralateral hemisphere or in controls. With left paw stimulation at normotension, there was a loss of activation in right sensory-motor cortex—a region with necrosis and disruption of cerebral vessels. As BP increased left paw stimulation also resulted in the detection of activation in the infarcted sensory–motor cortex and peri-infarct regions. Thus, BP changes synchronous with tasks in fMRI studies can result in MR signal changes consistent with a loss of cerebral blood flow (CBF) autoregulation rather than neuronal activation in necrotic brain. After stroke, the use of stressful tasks associated with BP changes in fMRI studies should be limited or the BP change should be considered as a potential source of MR signal changes. Journal of Cerebral Blood Flow & Metabolism (2007) 27, 1819–1829; doi:10.1038/sj.jcbfm.9600472; published online 21 March 2007 Keywords: blood pressure; cerebral ischemia; functional magnetic resonance imaging; peri-infarct; sensory-motor Introduction Functional magnetic resonance imaging (fMRI) is proving to be a major technique for understanding the recovery of brain function after cerebral injury, in part owing to its ability to acquire high-resolution structural and functional activation maps in the same imaging session. Brain activation maps are acquired using fMRI by detecting local increases in MR signal intensity associated with local decreases in the concentration of deoxyhemoglobin—the blood-oxygen level dependent (BOLD)-MR signal intensity. The reductions in deoxyhemoglobin are associated with the increases in cerebral blood flow (CBF) evoked by the alterations in neuronal activity. Although fMRI has been useful in providing insights into brain plasticity and its reorganization during recovery from an injury such as stroke (Baron et al, 2004; Hodics and Cohen, 2005; Ward, 2005), it is possible that after neuronal or vessel injury, altera- tions in flow-metabolism coupling to increased neuronal activity or other factors can confound the interpretation of the fMRI results. We demonstrated recently that if substantial alterations in arterial blood pressure (BP) accom- pany the task being assessed with fMRI, then there would be an enhancement of the activation response and at least a portion of this enhancement was considered to be related to direct effects of BP changes on CBF or the BOLD response (Wang et al, Received 21 April 2006; revised and accepted 18 January 2007; published online 21 March 2007 Correspondence: Dr UI Tuor, Institute for Biodiagnostics (West), National Research Council of Canada, B153, 3330 Hospital Dr N.W., Calgary, Alberta T2N 4N1, Canada. E-mail: [email protected] This work was supported by grant MOP15635 from the Canadian Institutes of Health Research. Journal of Cerebral Blood Flow & Metabolism (2007) 27, 1819–1829 & 2007 ISCBFM All rights reserved 0271-678X/07 $30.00 www.jcbfm.com
Transcript of Transient hypertension concurrent with forepaw stimulation enhances functional MRI responsiveness in...
Transient hypertension concurrent with forepawstimulation enhances functional MRIresponsiveness in infarct and peri-infarct regions
Ursula I Tuor1,2,3, Rong Wang1,2, Zonghang Zhao3, Tadeusz Foniok1, David Rushforth1,Jaclyn I Wamsteeker1 and Min Qiao1
1MR Technology, Institute for Biodiagnostics (West), National Research Council, Calgary, Alberta, Canada;2Experimental Imaging Center and Hotchkiss Brain Institute, University of Calgary, Calgary, Alberta, Canada;3Department of Clinical Neurosciences, University of Calgary, Calgary, Alberta, Canada
Although functional magnetic resonance imaging (fMRI) is gaining use as a tool to assess cerebralrecovery following various insults, the effects of potential confounders such as hypertension arepoorly defined. We hypothesized that after stroke, transient hypertension during an fMRI studycould produce a detected activation unrelated to neuronal activity within the infarct. Thus, the effectof norepinephrine induced increases in blood pressure (BP) on the fMRI response to forepawstimulation were investigated in controls or 1 week after transient middle cerebral artery occlusionin rats. Images were smoothed spatially and voxels correlating to either forepaw stimulation or thechange in BP time courses were analyzed. Transient hypertension increased the signal intensity andnumbers of voxels correlating to the BP time courses within and adjacent to the ischemic infarctand these exceeded the response in the contralateral hemisphere or in controls. With left pawstimulation at normotension, there was a loss of activation in right sensory-motor cortex—a regionwith necrosis and disruption of cerebral vessels. As BP increased left paw stimulation also resultedin the detection of activation in the infarcted sensory–motor cortex and peri-infarct regions. Thus,BP changes synchronous with tasks in fMRI studies can result in MR signal changes consistent witha loss of cerebral blood flow (CBF) autoregulation rather than neuronal activation in necrotic brain.After stroke, the use of stressful tasks associated with BP changes in fMRI studies should be limitedor the BP change should be considered as a potential source of MR signal changes.Journal of Cerebral Blood Flow & Metabolism (2007) 27, 1819–1829; doi:10.1038/sj.jcbfm.9600472; published online 21March 2007
Keywords: blood pressure; cerebral ischemia; functional magnetic resonance imaging; peri-infarct; sensory-motor
Introduction
Functional magnetic resonance imaging (fMRI) isproving to be a major technique for understandingthe recovery of brain function after cerebral injury,in part owing to its ability to acquire high-resolutionstructural and functional activation maps in thesame imaging session. Brain activation maps areacquired using fMRI by detecting local increases inMR signal intensity associated with local decreasesin the concentration of deoxyhemoglobin—the
blood-oxygen level dependent (BOLD)-MR signalintensity. The reductions in deoxyhemoglobin areassociated with the increases in cerebral blood flow(CBF) evoked by the alterations in neuronal activity.Although fMRI has been useful in providing insightsinto brain plasticity and its reorganization duringrecovery from an injury such as stroke (Baron et al,2004; Hodics and Cohen, 2005; Ward, 2005), it ispossible that after neuronal or vessel injury, altera-tions in flow-metabolism coupling to increasedneuronal activity or other factors can confound theinterpretation of the fMRI results.
We demonstrated recently that if substantialalterations in arterial blood pressure (BP) accom-pany the task being assessed with fMRI, then therewould be an enhancement of the activation responseand at least a portion of this enhancement wasconsidered to be related to direct effects of BPchanges on CBF or the BOLD response (Wang et al,
Received 21 April 2006; revised and accepted 18 January 2007;published online 21 March 2007
Correspondence: Dr UI Tuor, Institute for Biodiagnostics (West),National Research Council of Canada, B153, 3330 Hospital DrN.W., Calgary, Alberta T2N 4N1, Canada.E-mail: [email protected]
This work was supported by grant MOP15635 from the Canadian
Institutes of Health Research.
Journal of Cerebral Blood Flow & Metabolism (2007) 27, 1819–1829& 2007 ISCBFM All rights reserved 0271-678X/07 $30.00
www.jcbfm.com
2006). Although not clear how activation would beinfluenced by BP changes in injured brain, it islikely that brain recovering from an injury such asan ischemic stroke, will be even more susceptible tohypertension. The efficiency of the CBF autoregula-tory response is impaired after tissue injury (Czos-nyka et al, 2003; Dawson et al, 2003; Novak et al,2004; Paulson et al, 1990) and in such a setting, areduced cardiac baroreceptor sensitivity resulting ina greater increase in BP variability is also possible(Eames et al, 2002; Robinson et al, 1997). Thus, BPvariations are likely to accompany fMRI studies instroke patients, particularly if the tasks are known tobe capable of eliciting hypertensive responses (e.g.,cold, pain, exercise, or stress associated with mentaltasks) (Allen et al, 1992; Carter et al, 2005; Critchleyet al, 2000; Williamson et al, 2003). It is thereforeimperative to understand in some detail the effectof hypertension on the fMRI activation response,both within infarcted brain and surrounding tissue.
Thus the aim of this study was to investigatesystematically the potential effect of an unstable BPduring fMRI studies on the activation detectedsubacutely after stroke. We hypothesized that afterstroke, a simultaneous transient hypertension ac-companying a task performed in an fMRI studywould enhance the pattern of activation in regionsboth within and adjacent to injured brain. The effectof various magnitudes of transient hypertension onthe fMRI response to forepaw stimulation wasinvestigated in rats 1 week after middle cerebralartery (MCA) occlusion. The results show that afterstroke, moderate transient BP increases during anfMRI study can result in the detection of an apparentcerebral activation response in damaged brainunrelated to alterations in neuronal activity.
Materials and methods
All care and use of animals was approved in accordancewith the Canadian Council for Animal Care Guidelines,and the protocol was reviewed and approved by bothNational Research Council (NRC) and University ofCalgary animal care committees. Male Wistar rats (310 to335 g, Charles River, Saint-Constant, Quebec, Canada)were randomized to a control group (sham surgery, n = 5)or a stroke group (MCA occlusion, n = 10).
Animal Model of Focal Cerebral Ischemia
Animals were anesthetized by nose cone (3% isoflurane/27% oxygen/70% nitrogen) and prepared for asepticsurgery. The tail artery was cannulated for monitoringBP, heart rate, and obtaining arterial blood samples forblood gas determination during the surgery. Both the leftand right common carotid arteries were isolated withloops of 3–0 suture and the MCA was exposed proximal toits crossing of the rhinal fissure. For sham animals,surgery was the same except clip placement was omitted.Rats subjected to transient ischemia, underwent 60 mins
of occlusion of the MCA with a microaneurysm clip (No. 1Codman) along with concurrent tightening of the ligatureon both common carotid arteries. After 60 mins, the animalwas reanesthetized, the MCA clip was removed and theligature was removed from around both carotid arteries.Cortical perfusion was measured using laser Dopplerflowmetry before and after the clip was placed andremoved. Normothermia (rectal temperature near 37.51C)was maintained throughout the surgery and for at least 1 hafter ischemia using a heating lamp. Postsurgical analgesiawas provided by administration of butorphenol (2 mg/kg,intramuscular every 4 to 6 h as required).
Standard and Functional MR Imaging
Two days after focal ischemia, animals were anesthetizedwith isoflurane and scanned using a 9.4T/21 cm boreMR system with a Bruker console. T2-weighted imageswere acquired using a multislice, 21 multiecho spin echosequence (TR (repetition time) = 2500 ms, TE (echotime) = 10 ms between echos, field of view = 3� 3 cm, slicethickness = 1.5 mm) to assess ischemic damage and ensurethe presence of a cortical infarct in the right hemisphere.Infarct volume was measured from these T2-weightedimages using software (Marevisi) developed locally withinthe Institute for Biodiagnostics. Data are presented asmean7s.d.
Animals were allowed to recover for approximately 1week (6 to 7 days) after ischemia. This time was selectedto allow recovery from the acute stroke injury and modelsome of the earliest times assessed with fMRI after strokein patients (Binkofski and Seitz, 2004; Jaillard et al, 2005;Tombari et al, 2004). At this time, animals were preparedfor functional MR imaging using methods similar to thosedescribed previously [check why this format] (Wang et al,2006). Briefly, under isoflurane anesthesia, the femoralveins and artery were cannulated for administering drugsand fluids, measuring BP and obtaining arterial bloodsamples. Rats were intubated and then mechanicallyventilated to maintain normal PaO2 and PaCO2. Surgicalsites were infiltrated with bupivicaine. Rectal bodytemperature was maintained at 371C70.51C with acirculating water blanket. The rat was moved to an MRcradle where the head was immobilized using ear pinsand an incisor bar. Anesthesia was then converted toa-chloralose (initial dose of 80 mg/kg intravenous, main-tained with 20 mg/kg, intravenous every 45 mins). Elec-trical stimulation of each forepaw was produced using twosubdural silver needle electrodes in either paw and aGrass stimulator. Pancuronium (2 mg/kg, intravenous) wasadministered to provide muscle relaxation.
Functional MR images were collected using a24� 18 mm elliptical surface coil positioned over thehead. Five transverse slices (thickness = 1.5 mm) fromforebrain containing the sensory–motor cortex wereselected from scout images. After shimming, images forfMRI scans were acquired using a gradient echo sequencegated to the ventilation (TR = 85 ms, TE = 10 ms, 201 flipangle, 128� 128 image matrix, field of view = 3� 3 cm)with a duration of approximately 11 secs/image. Three
Hypertension and functional MRI following strokeUI Tuor et al
1820
Journal of Cerebral Blood Flow & Metabolism (2007) 27, 1819–1829
types of MR scans consisting of 32 images were acquiredduring right paw stimulation, left paw stimulation,hypertension, or a combination of stimulation plushypertension. The electrical stimulation scan consistedof acquiring 32 images during two periods of electricalstimulation of the right or left forepaw during acquisitionof images 7 to 13 and 20 to 24, a stimulation paradigm ofsuitably short duration to elicit repeated and reproducibleresponses at 9.4 T. Stimulus amplitude was set at 3 to6 mA according to the strength needed to produce a smalltwitch of the forepaw. A hypertension scan acquired siximages under baseline conditions and, at the end of thesixth image, norepinephrine (NE, 0.15 to 1.2 mg/kg in-travenous) was infused to produce a transient BP increasethat normally reached a maximum in 10 to 20 secs andthen returned to baseline within 40 to 150 secs. Theelectrical stimulation plus hypertension scan was acombination of the previous two, combining both stimula-tion of the right or left forepaw and various levels oftransient hypertension. The BP increase was initiated afterimage six to model an increase in BP accompanying thefirst stimulation. Within each animal, a total of 12 to 16scans were acquired, which initially involved electricalstimulation of the left or right forepaw. Then there werescans with different ranges of BP increases accompaniedby left paw, right paw, or no stimulation. The order ofthe magnitude of BP changes was varied between animals.The responses were assigned into one of six hypertensiveranges—baseline, 1 to 15, 15 to 30, 31 to 45, 46 to 60, and> 60 mm Hg.
Histology
At the end of functional imaging experiment, animalswere deeply anesthetized (pentobarbital, 120 mg/kg, in-travenous) and then perfused through the ascending aortawith heparinized saline and 0.1 mol/L ice-cold phosphate-buffered saline. Brains were then removed and fixedovernight in 10% formalin and embedded in paraffin.Coronal sections (7 mm) were cut on a microtome andmounted onto glass slides. Sections were dewaxed,rehydrated, and stained for hematoxylin and eosin orimmunohistochemically for glial fibrillary acidic protein(GFAP) or laminin to assess injury responses within thetissue, astrocytes, and vessels, respectively. For GFAPimmunostaining, sections were incubated first withblocking solution and then overnight with rabbit anti-ratGFAP antibody (1:5,000), then for 1 h with biotin-SPconjugated goat anti-rabbit immunoglobulin G (1:400) andthen for 30 min with streptavidin–horseradish peroxidase(1:400). For laminin staining, sections were boiled in10 mmol/L Tris-HCl for 20 mins, and then incubated withblocking solution for 1 h, rabbit anti-rat laminin antibody(1:50, Dako, Denmark) for 2 h, Cy3-goat-anti-rabbit im-munoglobulin G for 30 mins, and fluorescein isothiocya-nate-racinus communis agglutinin I (1:20) for 3 mins.
Image Analysis
Regions of interest were defined using the T2-weightedimages at 2 days after ischemia and a rat brain atlas
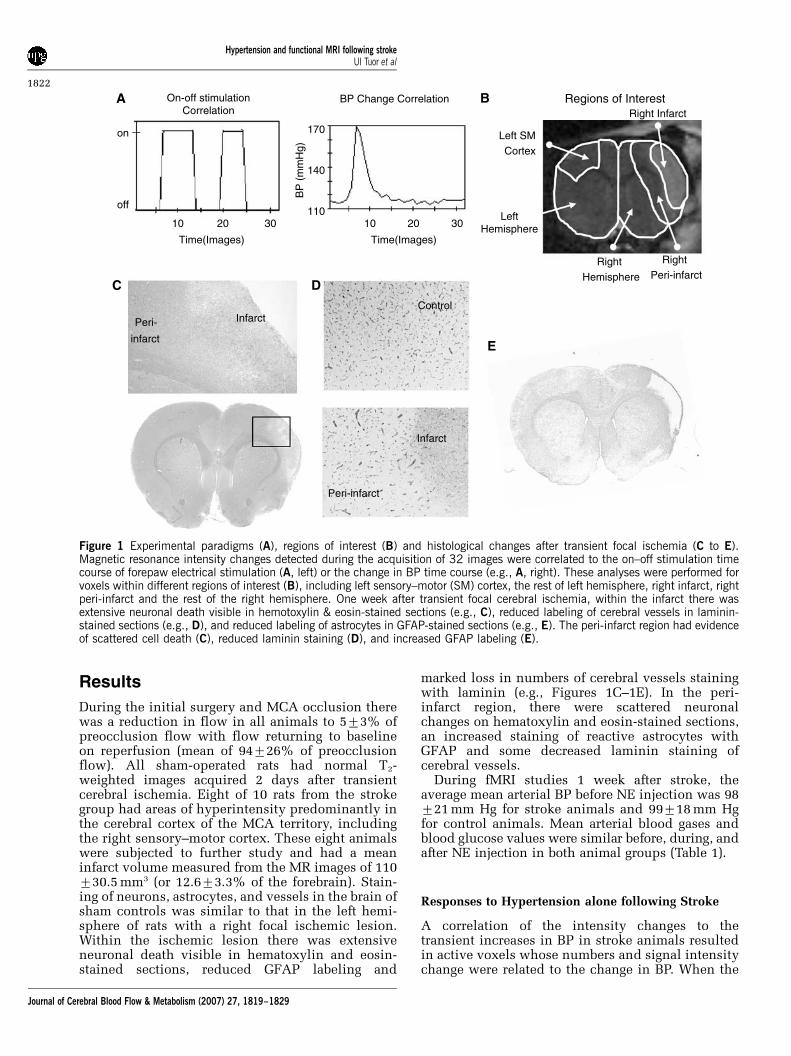
(Paxinos and Watson, 1986). The infarct region wasdelineated as the area with increased intensity (valuesgreater than mean71 s.d.) compared with the correspond-ing region in the contralateral hemisphere (Allegriniand Sauer, 1992; Neumann et al, 2000). The peri-infarctregion was delineated as a 1.5 mm wide region surround-ing the infarct. Left and right sensory–motor cortexregions were drawn as templates on each of three forebrainslices where the templates were determined from a ratbrain atlas and the response to forepaw stimulationobserved in normal animals (e.g., Figure 1B). Anotherregion of interest was the remaining left or right hemi-sphere, which included the hemisphere other than leftsensory–motor cortex or right infarct/perinfarct regions,respectively.
Image analysis for the fMRI scans was performed usinglocal software developed by the Institute for Biodiagnos-tics (EvIdent) (Jarmasz and Somorjai, 2002). Images werefirst normalized by subtracting the median intensity valueand then smoothed using a spatial median filter (3� 3blocks). Motion was minimal owing to restraint of thehead. Influence of the hemodynamic response wasconsidered minor compared with the 10 secs needed toacquire each scan. The voxel intensity changes werecorrelated either to the on–off stimulation time course orthe known measured BP time course changes for that scan(e.g., Figure 1A). A Pearson’s correlation analysis witha threshold of P < 0.0005 (selected as approximmately1/number of voxels to correct for multiple tests (Bullmoreand Suckling, 2001)) determined the ‘active’ voxelscorrelating to the time course of interest and these voxelswere displayed in orange to red with increasinglystringent P-values. In addition, a model-free analysis ofthe data was performed using EvIdent that involved anunsupervised fuzzy cluster analysis of the intensitychanges and this produced clusters of voxels with self-similar time courses.
The ‘voxel activation’ response was the number ofvoxels correlating to the time course expressed as apercentage of the number of voxels in each analyzedregion of interest. The average time course of the voxelswith P < 0.0005 were also displayed for each region andwere used to measure the peak signal intensity changewithin the first 100 secs. The responses for each regionwere grouped into BP ranges according to the maximumBP change, which occurred during that scan.
Quantitative assessment of the response in scansinvestigating the response to hypertension focused onthe response of voxels correlating to the change in BP timecourse, whereas scans that involved forepaw stimulationfocused on the response of voxels correlating to thestimulation time course. All data are presented as themean7s.d. Differences between means in the different BPranges were compared with baseline using a one-wayanalysis of variance and a Bonferroni multiple comparisonof means or a Mann–Whitney rank sum test for non-normal data (SigmaStat, Systat Software Inc., San Jose,CA, USA). Differences between the data in the strokegroup and that in sham controls were also compared usinga Student’s t-test. Differences were considered significantat P < 0.05.
Hypertension and functional MRI following strokeUI Tuor et al
1821
Journal of Cerebral Blood Flow & Metabolism (2007) 27, 1819–1829
Results
During the initial surgery and MCA occlusion therewas a reduction in flow in all animals to 573% ofpreocclusion flow with flow returning to baselineon reperfusion (mean of 94726% of preocclusionflow). All sham-operated rats had normal T2-weighted images acquired 2 days after transientcerebral ischemia. Eight of 10 rats from the strokegroup had areas of hyperintensity predominantly inthe cerebral cortex of the MCA territory, includingthe right sensory–motor cortex. These eight animalswere subjected to further study and had a meaninfarct volume measured from the MR images of 110730.5 mm3 (or 12.673.3% of the forebrain). Stain-ing of neurons, astrocytes, and vessels in the brain ofsham controls was similar to that in the left hemi-sphere of rats with a right focal ischemic lesion.Within the ischemic lesion there was extensiveneuronal death visible in hematoxylin and eosin-stained sections, reduced GFAP labeling and
marked loss in numbers of cerebral vessels stainingwith laminin (e.g., Figures 1C–1E). In the peri-infarct region, there were scattered neuronalchanges on hematoxylin and eosin-stained sections,an increased staining of reactive astrocytes withGFAP and some decreased laminin staining ofcerebral vessels.
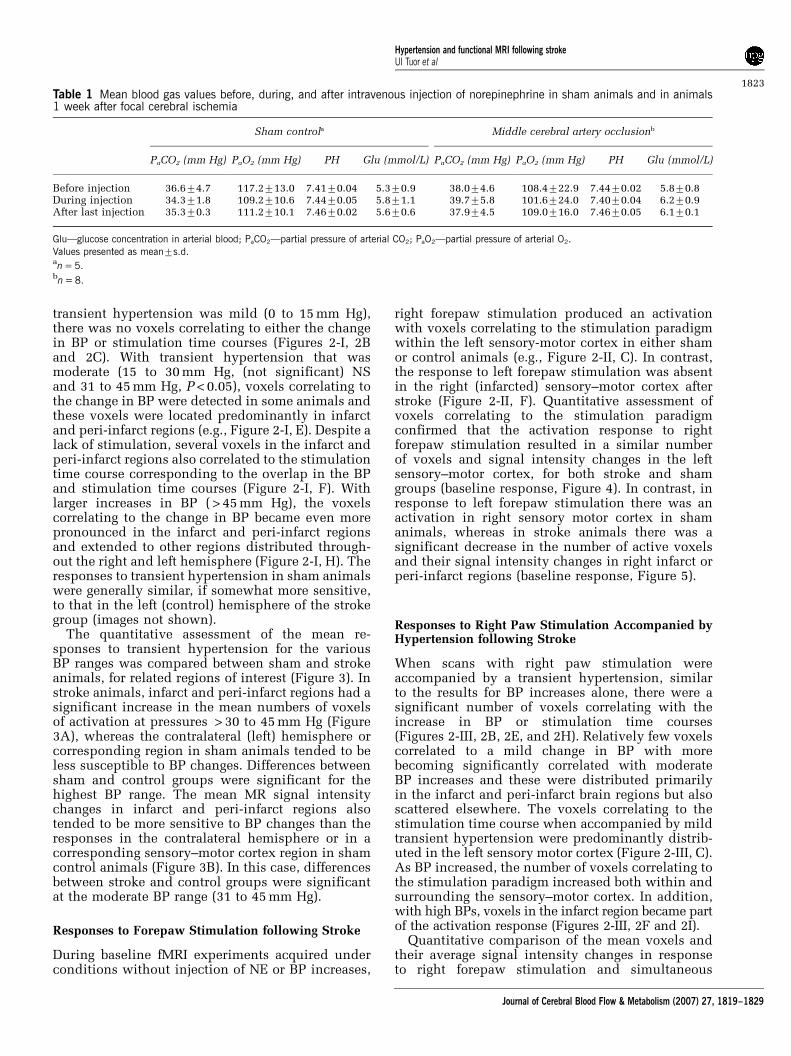
During fMRI studies 1 week after stroke, theaverage mean arterial BP before NE injection was 98721 mm Hg for stroke animals and 99718 mm Hgfor control animals. Mean arterial blood gases andblood glucose values were similar before, during, andafter NE injection in both animal groups (Table 1).
Responses to Hypertension alone following Stroke
A correlation of the intensity changes to thetransient increases in BP in stroke animals resultedin active voxels whose numbers and signal intensitychange were related to the change in BP. When the
on
10 20
170
140
110 30
Time(Images)
10 20 30
Time(Images)
BP
(m
mH
g)
On-off stimulation Correlation
off
BP Change CorrelationA
C D
Infarct
Control
Peri-infarct
E
InfarctPeri-
infarct
B Regions of Interest
Left SM Cortex
Left Hemisphere
Right Hemisphere
Right Infarct
Right Peri-infarct
Figure 1 Experimental paradigms (A), regions of interest (B) and histological changes after transient focal ischemia (C to E).Magnetic resonance intensity changes detected during the acquisition of 32 images were correlated to the on–off stimulation timecourse of forepaw electrical stimulation (A, left) or the change in BP time course (e.g., A, right). These analyses were performed forvoxels within different regions of interest (B), including left sensory–motor (SM) cortex, the rest of left hemisphere, right infarct, rightperi-infarct and the rest of the right hemisphere. One week after transient focal cerebral ischemia, within the infarct there wasextensive neuronal death visible in hemotoxylin & eosin-stained sections (e.g., C), reduced labeling of cerebral vessels in laminin-stained sections (e.g., D), and reduced labeling of astrocytes in GFAP-stained sections (e.g., E). The peri-infarct region had evidenceof scattered cell death (C), reduced laminin staining (D), and increased GFAP labeling (E).
Hypertension and functional MRI following strokeUI Tuor et al
1822
Journal of Cerebral Blood Flow & Metabolism (2007) 27, 1819–1829
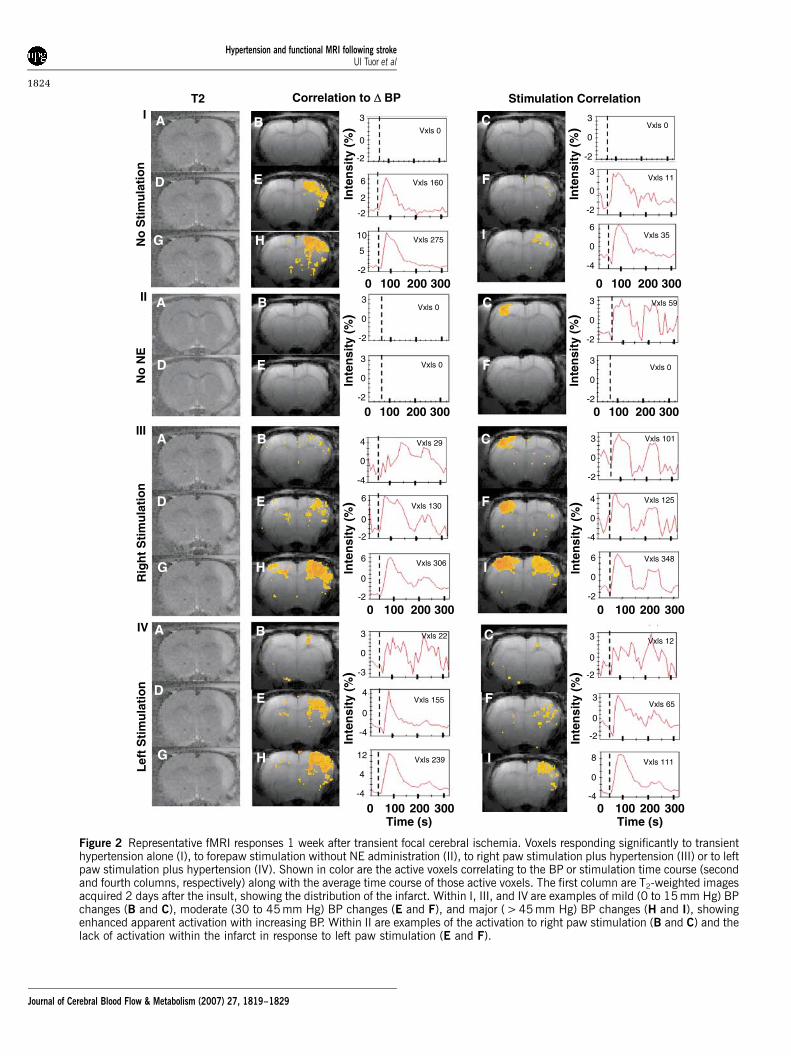
transient hypertension was mild (0 to 15 mm Hg),there was no voxels correlating to either the changein BP or stimulation time courses (Figures 2-I, 2Band 2C). With transient hypertension that wasmoderate (15 to 30 mm Hg, (not significant) NSand 31 to 45 mm Hg, P < 0.05), voxels correlating tothe change in BP were detected in some animals andthese voxels were located predominantly in infarctand peri-infarct regions (e.g., Figure 2-I, E). Despite alack of stimulation, several voxels in the infarct andperi-infarct regions also correlated to the stimulationtime course corresponding to the overlap in the BPand stimulation time courses (Figure 2-I, F). Withlarger increases in BP ( > 45 mm Hg), the voxelscorrelating to the change in BP became even morepronounced in the infarct and peri-infarct regionsand extended to other regions distributed through-out the right and left hemisphere (Figure 2-I, H). Theresponses to transient hypertension in sham animalswere generally similar, if somewhat more sensitive,to that in the left (control) hemisphere of the strokegroup (images not shown).
The quantitative assessment of the mean re-sponses to transient hypertension for the variousBP ranges was compared between sham and strokeanimals, for related regions of interest (Figure 3). Instroke animals, infarct and peri-infarct regions had asignificant increase in the mean numbers of voxelsof activation at pressures > 30 to 45 mm Hg (Figure3A), whereas the contralateral (left) hemisphere orcorresponding region in sham animals tended to beless susceptible to BP changes. Differences betweensham and control groups were significant for thehighest BP range. The mean MR signal intensitychanges in infarct and peri-infarct regions alsotended to be more sensitive to BP changes than theresponses in the contralateral hemisphere or in acorresponding sensory–motor cortex region in shamcontrol animals (Figure 3B). In this case, differencesbetween stroke and control groups were significantat the moderate BP range (31 to 45 mm Hg).
Responses to Forepaw Stimulation following Stroke
During baseline fMRI experiments acquired underconditions without injection of NE or BP increases,
right forepaw stimulation produced an activationwith voxels correlating to the stimulation paradigmwithin the left sensory-motor cortex in either shamor control animals (e.g., Figure 2-II, C). In contrast,the response to left forepaw stimulation was absentin the right (infarcted) sensory–motor cortex afterstroke (Figure 2-II, F). Quantitative assessment ofvoxels correlating to the stimulation paradigmconfirmed that the activation response to rightforepaw stimulation resulted in a similar numberof voxels and signal intensity changes in the leftsensory–motor cortex, for both stroke and shamgroups (baseline response, Figure 4). In contrast, inresponse to left forepaw stimulation there was anactivation in right sensory motor cortex in shamanimals, whereas in stroke animals there was asignificant decrease in the number of active voxelsand their signal intensity changes in right infarct orperi-infarct regions (baseline response, Figure 5).
Responses to Right Paw Stimulation Accompanied byHypertension following Stroke
When scans with right paw stimulation wereaccompanied by a transient hypertension, similarto the results for BP increases alone, there were asignificant number of voxels correlating with theincrease in BP or stimulation time courses(Figures 2-III, 2B, 2E, and 2H). Relatively few voxelscorrelated to a mild change in BP with morebecoming significantly correlated with moderateBP increases and these were distributed primarilyin the infarct and peri-infarct brain regions but alsoscattered elsewhere. The voxels correlating to thestimulation time course when accompanied by mildtransient hypertension were predominantly distrib-uted in the left sensory motor cortex (Figure 2-III, C).As BP increased, the number of voxels correlating tothe stimulation paradigm increased both within andsurrounding the sensory–motor cortex. In addition,with high BPs, voxels in the infarct region became partof the activation response (Figures 2-III, 2F and 2I).
Quantitative comparison of the mean voxels andtheir average signal intensity changes in responseto right forepaw stimulation and simultaneous
Table 1 Mean blood gas values before, during, and after intravenous injection of norepinephrine in sham animals and in animals1 week after focal cerebral ischemia
Sham controla Middle cerebral artery occlusionb
PaCO2 (mm Hg) PaO2 (mm Hg) PH Glu (mmol/L) PaCO2 (mm Hg) PaO2 (mm Hg) PH Glu (mmol/L)
Before injection 36.674.7 117.2713.0 7.4170.04 5.370.9 38.074.6 108.4722.9 7.4470.02 5.870.8During injection 34.371.8 109.2710.6 7.4470.05 5.871.1 39.775.8 101.6724.0 7.4070.04 6.270.9After last injection 35.370.3 111.2710.1 7.4670.02 5.670.6 37.974.5 109.0716.0 7.4670.05 6.170.1
Glu—glucose concentration in arterial blood; PaCO2—partial pressure of arterial CO2; PaO2—partial pressure of arterial O2.Values presented as mean7s.d.an = 5.bn = 8.
Hypertension and functional MRI following strokeUI Tuor et al
1823
Journal of Cerebral Blood Flow & Metabolism (2007) 27, 1819–1829
D
G
AN
o S
tim
ula
tio
nB
E
H
Inte
nsi
ty (
%)
Inte
nsi
ty (
%)
Inte
nsi
ty (
%)
Inte
nsi
ty (
%)
Inte
nsi
ty (
%)
Inte
nsi
ty (
%)
Inte
nsi
ty (
%)
Inte
nsi
ty (
%)
10
5
-2
Vxls 275
0 100 200 300
6
2
-2
Vxls 160
3
0
-2
Vxls 0
I
C
F
I
Vxls 03
0
-2
Vxls 113
0
-2
6
0
-4
Vxls 35
III
T2 Correlation to ∆∆ BP
Rig
ht
Sti
mu
lati
on
Lef
t S
tim
ula
tio
n
I
II
IV
D
G
A
D
G
A
E
H
B
E
H
B
12
4
-4
Time (s) Time (s)
Vxls 239
Vxls 1554
0
-4
3
0
-3
Vxls 22
6
0
-2
Vxls 130
Vxls 294
0
-4
Vxls 3066
0
-2
Stimulation Correlation
C
F
C
F
I
I
4
0
-4
Vxls 125
Vxls 1013
0
-2
Vxls 123
0
-2
Vxls 653
0
-2
Vxls 1118
0
-4
D
A B
E
3
0
-2
3
0
-2
Vxls 0
Vxls 0
C
F
3
0
-2
Vxls 03
0
-2
Vxls 59
6
0
-2
Vxls 348
No
NE
0 100 200 300
0 100 200 3000 100 200 300
0 100 200 300 0 100 200 300
0 100 200 3000 100 200 300
Figure 2 Representative fMRI responses 1 week after transient focal cerebral ischemia. Voxels responding significantly to transienthypertension alone (I), to forepaw stimulation without NE administration (II), to right paw stimulation plus hypertension (III) or to leftpaw stimulation plus hypertension (IV). Shown in color are the active voxels correlating to the BP or stimulation time course (secondand fourth columns, respectively) along with the average time course of those active voxels. The first column are T2-weighted imagesacquired 2 days after the insult, showing the distribution of the infarct. Within I, III, and IV are examples of mild (0 to 15 mm Hg) BPchanges (B and C), moderate (30 to 45 mm Hg) BP changes (E and F), and major ( > 45 mm Hg) BP changes (H and I), showingenhanced apparent activation with increasing BP. Within II are examples of the activation to right paw stimulation (B and C) and thelack of activation within the infarct in response to left paw stimulation (E and F).
Hypertension and functional MRI following strokeUI Tuor et al
1824
Journal of Cerebral Blood Flow & Metabolism (2007) 27, 1819–1829
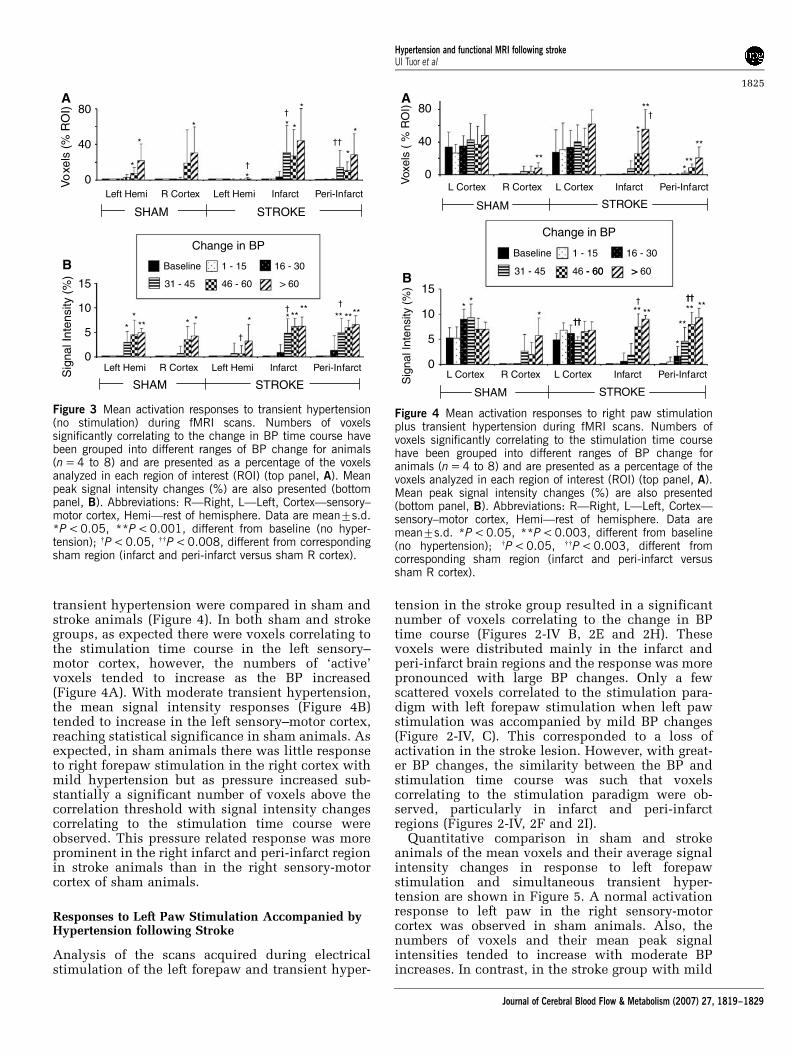
transient hypertension were compared in sham andstroke animals (Figure 4). In both sham and strokegroups, as expected there were voxels correlating tothe stimulation time course in the left sensory–motor cortex, however, the numbers of ‘active’voxels tended to increase as the BP increased(Figure 4A). With moderate transient hypertension,the mean signal intensity responses (Figure 4B)tended to increase in the left sensory–motor cortex,reaching statistical significance in sham animals. Asexpected, in sham animals there was little responseto right forepaw stimulation in the right cortex withmild hypertension but as pressure increased sub-stantially a significant number of voxels above thecorrelation threshold with signal intensity changescorrelating to the stimulation time course wereobserved. This pressure related response was moreprominent in the right infarct and peri-infarct regionin stroke animals than in the right sensory-motorcortex of sham animals.
Responses to Left Paw Stimulation Accompanied byHypertension following Stroke
Analysis of the scans acquired during electricalstimulation of the left forepaw and transient hyper-
tension in the stroke group resulted in a significantnumber of voxels correlating to the change in BPtime course (Figures 2-IV B, 2E and 2H). Thesevoxels were distributed mainly in the infarct andperi-infarct brain regions and the response was morepronounced with large BP changes. Only a fewscattered voxels correlated to the stimulation para-digm with left forepaw stimulation when left pawstimulation was accompanied by mild BP changes(Figure 2-IV, C). This corresponded to a loss ofactivation in the stroke lesion. However, with great-er BP changes, the similarity between the BP andstimulation time course was such that voxelscorrelating to the stimulation paradigm were ob-served, particularly in infarct and peri-infarctregions (Figures 2-IV, 2F and 2I).
Quantitative comparison in sham and strokeanimals of the mean voxels and their average signalintensity changes in response to left forepawstimulation and simultaneous transient hyper-tension are shown in Figure 5. A normal activationresponse to left paw in the right sensory-motorcortex was observed in sham animals. Also, thenumbers of voxels and their mean peak signalintensities tended to increase with moderate BPincreases. In contrast, in the stroke group with mild
15
10
5
0Left Hemi R Cortex Left Hemi Infarct Peri-Infarct
* * ***
B
††
†* * * **
SHAM STROKE
Sig
nal I
nten
sity
(%
)
Change in BP
Baseline 1 - 15 16 - 30
31 - 45 46 - 60 > 60
Left Hemi R Cortex Left Hemi Infarct Peri-Infarct
*
*
*
*
*A
*
†
†
*
*
*
SHAM STROKE
Vo
xels
(% R
OI) 80
40
0
******
††
**
Figure 3 Mean activation responses to transient hypertension(no stimulation) during fMRI scans. Numbers of voxelssignificantly correlating to the change in BP time course havebeen grouped into different ranges of BP change for animals(n = 4 to 8) and are presented as a percentage of the voxelsanalyzed in each region of interest (ROI) (top panel, A). Meanpeak signal intensity changes (%) are also presented (bottompanel, B). Abbreviations: R—Right, L—Left, Cortex—sensory–motor cortex, Hemi—rest of hemisphere. Data are mean7s.d.*P < 0.05, **P < 0.001, different from baseline (no hyper-tension); wP < 0.05, wwP < 0.008, different from correspondingsham region (infarct and peri-infarct versus sham R cortex).
L Cortex R Cortex L Cortex Infarct Peri-Infarct
**
**†
*
**
A
SHAM STROKE
*
Vox
els
(%
RO
I)
15
10
5
0L Cortex R Cortex L Cortex Infarct Peri-Infarct
* ** **
*
**†
**
B
SHAM STROKE
**
Sig
nal I
nten
sity
(%
)
Change in BP
Baseline 1 - 15 16 - 30
31 - 45 46 - 60 > 60- 60 >
80
40
0
††††
††††
**
**
Figure 4 Mean activation responses to right paw stimulationplus transient hypertension during fMRI scans. Numbers ofvoxels significantly correlating to the stimulation time coursehave been grouped into different ranges of BP change foranimals (n = 4 to 8) and are presented as a percentage of thevoxels analyzed in each region of interest (ROI) (top panel, A).Mean peak signal intensity changes (%) are also presented(bottom panel, B). Abbreviations: R—Right, L—Left, Cortex—sensory–motor cortex, Hemi—rest of hemisphere. Data aremean7s.d. *P < 0.05, **P < 0.003, different from baseline(no hypertension); wP < 0.05, wwP < 0.003, different fromcorresponding sham region (infarct and peri-infarct versussham R cortex).
Hypertension and functional MRI following strokeUI Tuor et al
1825
Journal of Cerebral Blood Flow & Metabolism (2007) 27, 1819–1829
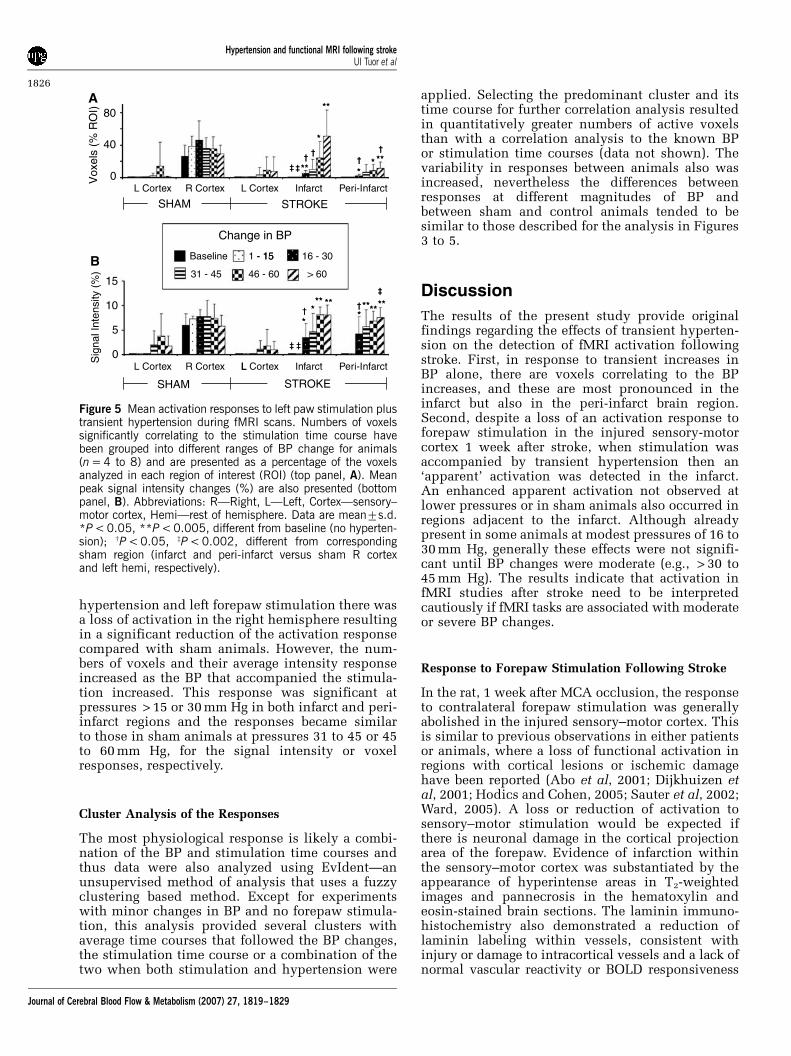
hypertension and left forepaw stimulation there wasa loss of activation in the right hemisphere resultingin a significant reduction of the activation responsecompared with sham animals. However, the num-bers of voxels and their average intensity responseincreased as the BP that accompanied the stimula-tion increased. This response was significant atpressures > 15 or 30 mm Hg in both infarct and peri-infarct regions and the responses became similarto those in sham animals at pressures 31 to 45 or 45to 60 mm Hg, for the signal intensity or voxelresponses, respectively.
Cluster Analysis of the Responses
The most physiological response is likely a combi-nation of the BP and stimulation time courses andthus data were also analyzed using EvIdent—anunsupervised method of analysis that uses a fuzzyclustering based method. Except for experimentswith minor changes in BP and no forepaw stimula-tion, this analysis provided several clusters withaverage time courses that followed the BP changes,the stimulation time course or a combination of thetwo when both stimulation and hypertension were
applied. Selecting the predominant cluster and itstime course for further correlation analysis resultedin quantitatively greater numbers of active voxelsthan with a correlation analysis to the known BPor stimulation time courses (data not shown). Thevariability in responses between animals also wasincreased, nevertheless the differences betweenresponses at different magnitudes of BP andbetween sham and control animals tended to besimilar to those described for the analysis in Figures3 to 5.
Discussion
The results of the present study provide originalfindings regarding the effects of transient hyperten-sion on the detection of fMRI activation followingstroke. First, in response to transient increases inBP alone, there are voxels correlating to the BPincreases, and these are most pronounced in theinfarct but also in the peri-infarct brain region.Second, despite a loss of an activation response toforepaw stimulation in the injured sensory-motorcortex 1 week after stroke, when stimulation wasaccompanied by transient hypertension then an‘apparent’ activation was detected in the infarct.An enhanced apparent activation not observed atlower pressures or in sham animals also occurred inregions adjacent to the infarct. Although alreadypresent in some animals at modest pressures of 16 to30 mm Hg, generally these effects were not signifi-cant until BP changes were moderate (e.g., > 30 to45 mm Hg). The results indicate that activation infMRI studies after stroke need to be interpretedcautiously if fMRI tasks are associated with moderateor severe BP changes.
Response to Forepaw Stimulation Following Stroke
In the rat, 1 week after MCA occlusion, the responseto contralateral forepaw stimulation was generallyabolished in the injured sensory–motor cortex. Thisis similar to previous observations in either patientsor animals, where a loss of functional activation inregions with cortical lesions or ischemic damagehave been reported (Abo et al, 2001; Dijkhuizen etal, 2001; Hodics and Cohen, 2005; Sauter et al, 2002;Ward, 2005). A loss or reduction of activation tosensory–motor stimulation would be expected ifthere is neuronal damage in the cortical projectionarea of the forepaw. Evidence of infarction withinthe sensory–motor cortex was substantiated by theappearance of hyperintense areas in T2-weightedimages and pannecrosis in the hematoxylin andeosin-stained brain sections. The laminin immuno-histochemistry also demonstrated a reduction oflaminin labeling within vessels, consistent withinjury or damage to intracortical vessels and a lack ofnormal vascular reactivity or BOLD responsiveness
15
10
5
0
*
†† *
*
SHAM STROKE
Sig
nal I
nten
sity
(%
)
L Cortex Infarct Peri-Infarct
*
**
**
†
SHAM STROKE
Vox
els
(% R
OI)
†
L Cortex R Cortex L Cortex Infarct Peri-Infarct
Change in BP
Baseline 1 - 15 16 - 30
31 - 45 46 - 60 > 60
†
‡†
‡
‡ ‡
‡
****
** ** *******
B
*
†† *
*
SHAM STROKE
80
40
0L Cortex R Cortex
*
**
**
†
SHAM STROKE
†
A
L
- 15
†
‡†
‡
‡ ‡
‡
****
** ** *******
Figure 5 Mean activation responses to left paw stimulation plustransient hypertension during fMRI scans. Numbers of voxelssignificantly correlating to the stimulation time course havebeen grouped into different ranges of BP change for animals(n = 4 to 8) and are presented as a percentage of the voxelsanalyzed in each region of interest (ROI) (top panel, A). Meanpeak signal intensity changes (%) are also presented (bottompanel, B). Abbreviations: R—Right, L—Left, Cortex—sensory–motor cortex, Hemi—rest of hemisphere. Data are mean7s.d.*P < 0.05, **P < 0.005, different from baseline (no hyperten-sion); wP < 0.05, zP < 0.002, different from correspondingsham region (infarct and peri-infarct versus sham R cortexand left hemi, respectively).
Hypertension and functional MRI following strokeUI Tuor et al
1826
Journal of Cerebral Blood Flow & Metabolism (2007) 27, 1819–1829
to neuronal activation. A continued coupling of flowto metabolism would be surprising considering theappearance of the vessels, neurons and supportingcells within the infarct one week after focal cerebralischemia.
Response to Hypertension Following Stroke
Blood pressure in this study was increased usingNE, an a-adrenergic agonist at a rate of 1.5 to 5 mmHg/sec, which is generally less abrupt than thepressure changes achieved in dynamic autoregula-tory studies using transcranial doppler that showinitiation of the autoregulatory response within 1 to2 secs and completion of the response within 6 to7 secs (Aaslid et al, 1991). Thus, uninjured cerebralvessels are expected to respond with a normalautoregulatory response to the pressure changesobserved. Note that NE is considered to haveminimal direct effects on cerebral circulation, oxy-gen consumption or glucose utilization, particularlyif the blood–brain barrier is undamaged becauseNE normally does not cross the blood–brain barrier(Hardebo and Owman, 1980; Moller et al, 2004; Tuoret al, 1986). Considering also that cerebral bloodflow in normal rat brain has been reported to beunaffected by BP changes until BP levels are greaterthan 145 mm Hg(Narasimhan et al, 1996; Schalleret al, 2002), the enhancement of activation re-sponses with substantial BP changes ( > 45 mm Hg)are likely related to flow induced increases in BPabove the upper limit of autoregulation. A pressuredependence on the activation response has beenreported previously (Wang et al, 2006), and althoughnot directly comparable because images in theprevious study were not smoothed before analysis,the number of voxels of activation in the injuredhemisphere appear to be enhanced. Indeed, in theinfarct region, there was an earlier BP-relatedincrease (already at levels of 31 to 45 mm Hg) inthe apparent activation response than in the non-injured hemisphere. Furthermore, the apparentactivation response observed also exceeded theresponse in sham animals when BP increased by31 to 45 mm Hg.
Considering the damage 1 week after cerebralischemia, the enhanced apparent activation duringhypertension in the damaged infarct region isunrelated to a centrally mediated change in neuro-nal activity related to BP control (e.g., (Harper et al,2000; King et al, 1999)). Instead, such enhanced BP-dependent effects are readily attributed to increasesin perfusion related to a loss of myogenic reactivity(Cipolla and Curry, 2002) and an impaired CBFautoregulation of the injured brain to changes inperfusion pressure (Czosnyka et al, 2003; Dawsonet al, 2003; Golding et al, 1999; Olsen, 1986; Paulsonet al, 1990). Indeed, acutely and subacutely after anischemic insult, the autoregulatory response to achange in BP is less efficient resulting in changes in
CBF or a less effective dynamic autoregulatoryresponse. Note that such responsiveness may besomewhat different in subjects with chronic hyper-tension where the upper limit of autoregulation hasbeen reported to be increased (Paulson et al, 1990),although there is some evidence for an increasedextent of CBF responsiveness even in hypertensives(Gamalo et al, 2005).
Also important is the observation that in regionsadjacent to the infarct there are BOLD activationresponses correlating to BP increases alone. Auto-regulatory failure in regions exceeding the border ofthe infarct have been reported previously, particu-larly at acute and subacute times after stroke(Dawson et al, 2003; Eames et al, 2002; MacGregoret al, 2000). For example, corresponding well withthe present responses to hypertension at 1 weekafter ischemia, is the observation of an impairmentof CBF autoregulation to BP decreases in the peri-infarct region at 24 h after MCA occlusion. Theextension of autoregulatory impairment into adja-cent cortex, which also experienced hypoperfusion,is not entirely unexpected considering the scatteredneuronal necrosis and gliosis we generally observedand reports by others of various cellular changes inthe peri-infarct region (Boscia et al, 2006; Shimizuet al, 2005). Note however that regions surroundingthe infarct appear rather normal in standard MRimages making it difficult to predict using noninva-sive imaging, which regions would have the greatestaltered responsiveness. This may be more relevantfor the acute and subacute stages after stroke,because recently after chronic recovery, an fMRIstudy in stroke patients reported the presence ofbaseline derangements of T2* in peri-infarct regions(Cramer et al, 2006). Within these regions surround-ing the infarct there was also a smaller than normalfMRI activation. Whether BOLD responses to hyper-tension in these chronically recovered regionswould be similar to those observed presently withsubacute recovery deserves further study.
Response to Forepaw Stimulation and Hypertension
There is scant information available on the influ-ence of BP increases on the BOLD response tofunctional stimulation after stroke. In normal rats,we recently observed a tendency for the signalintensity response to stimulation to increase as thetransient hypertension increased (Qiao et al, 2006).This enhancement in an apparent activation becamesignificant for pressure ranges greater than 30 mmHg. Although somewhat variable, a similar tendencywas observed in the present smaller series of shamcontrols, an example being the enhanced responsein left sensory-motor cortex in response to right-pawstimulation. Furthermore, this BP-dependent in-crease in the detection of apparent cerebral activa-tion to left forepaw stimulation was already evidentwith modest BP increases (e.g., > 15 mm Hg). This is
Hypertension and functional MRI following strokeUI Tuor et al
1827
Journal of Cerebral Blood Flow & Metabolism (2007) 27, 1819–1829

an apparent detection of an fMRI ‘activation’ as thistissue in the infarct region is necrotic and had a totalloss of activation under baseline conditions. Suchan enhancement, which is unrelated to neuronalactivation considering the damage in this region,can also occur in peri-infarct regions and is likelyassociated with the signal intensity changes withhypertension being combined with those in re-sponse to stimulation (Qiao et al, 2006). Althougha neuronal activation related to BP control cannot beentirely excluded in the peri-infarct regions, theyare not traditionally considered to be involved inthe central regulation of BP and thus also appeardirectly susceptible to hypertension inducedchanges in CBF. Note also that in clinical studies,these regions would be indistinguishable fromnormal appearing brain on standard MR images.
These results have several implications for fMRIstudies and their application to assessing general-ized recovery from brain injury. Mild changes in BP( < 15 mm Hg) accompanying an fMRI study can beexpected to have rather small effects on the activa-tion detected, particularly if the stimulation and BPtime courses are rather distinct. Although the exactlevels of hypertension that are important will likelyvary depending on species, severity of injury andthe recovery period, the current results indicate thatshould changes in BP and fMRI paradigms overlapclosely when the autoregulatory response is com-promised, then an apparent activation unrelated tochanges in neuronal activity may occur in injured orrecovering brain, even with milder changes inpressure ( > 15 mm Hg). In our case, these becamesubstantial at BP > 30 mm Hg. Considering thatmental or motor tasks used in some fMRI studiescan be stressful or induce BP changes on the orderof 10 to 30 mm Hg, it would be prudent to measureBP during such fMRI studies (Allen et al, 1992;Carter et al, 2005; Critchley et al, 2000; Manucket al, 1992; Waldstein et al, 2004; Williamson et al,2003). This is particularly pertinent in strokerecovery studies, since subjects with cerebrovascu-lar disease or stroke have been shown to haveincreased BP reactivity (e.g., BP increases of morethan 40 mm Hg) to mental stresses such as angerrecall or the Stoop test (Manuck et al, 1992;Waldstein et al, 2004). Ideally in fMRI studiesinvestigating recovery of brain injury, fMRI experi-ments should be designed to use tasks withmild effects on BP or alternatively they should intheir analysis consider BP changes as potentialcontributors to the activation detected in infarctand peri-infarct regions.
Acknowledgements
The authors gratefully acknowledge the technicalassistance of Susan Sea, Hamidah Meghani, KellyMcAllister, Shauna Crowley, and David Kirk.
References
Aaslid R, Newell DW, Stooss R, Sorteberg W, LindegaardK-F (1991) Assessment of cerebral autoregulationdynamics from simultaneous arterial and venoustranscranial Doppler recordings in humans. Stroke22:1148–54
Abo M, Chen Z, Lai LJ, Reese T, Bjelke B (2001) Functionalrecovery after brain lesion–contralateral neuromodula-tion: an fMRI study. Neuroreport 12:1543–7
Allegrini PR, Sauer D (1992) Application of magneticresonance imaging to the measurement of neurodegen-eration in rat brain: MRI data correlate strongly withhistology and enzymatic analysis. Magn Reson Imaging10:773–8
Allen MT, Shelley KS, Boquet-AJ J (1992) A comparison ofcardiovascular and autonomic adjustments to threetypes of cold stimulation tasks. Int J Psychophysiol 13:59–69
Baron JC, Cohen LG, Cramer SC, Dobkin BH, Johansen-Berg H, Loubinoux I et al (2004) Neuroimaging instroke recovery: a position paper from the FirstInternational Workshop on Neuroimaging and StrokeRecovery. Cerebrovasc Dis 18:260–7
Binkofski F, Seitz RJ (2004) Modulation of the BOLD-response in early recovery from sensorimotor stroke.Neurology 63:1223–9
Boscia F, Gala R, Pignataro G, de Bartolomeis A, Cicale M,Ambesi-Impiombato A et al (2006) Permanent focalbrain ischemia induces isoform-dependent changes inthe pattern of Na(+)/Ca(2+) exchanger gene expressionin the ischemic core, periinfarct area, and intact brainregions. J Cereb Blood Flow Metab 26:502–17
Bullmore ET, Suckling J (2001) Functional magneticresonance imaging. Int Rev Psychiatry 13:24–33
Carter JR, Kupiers NT, Ray CA (2005) Neurovascularresponses to mental stress. J Physiol 564:321–7
Cipolla MJ, Curry AB (2002) Middle cerebral arteryfunction after stroke: the threshold duration of reperfu-sion for myogenic activity. Stroke 33:2094–9
Cramer SC, Shah R, Juranek J, Crafton KR, Le V (2006)Activity in the peri-infarct rim in relation to recoveryfrom stroke. Stroke 37:111–5
Critchley HD, Corfield DR, Chandler MP, Mathias CJ,Dolan RJ (2000) Cerebral correlates of autonomiccardiovascular arousal: a functional neuroimaginginvestigation in humans. J Physiol 523:259–70
Czosnyka M, Smielewski P, Czosnyka Z, Piechnik S,Steiner LA, Schmidt E et al (2003) Continuous assess-ment of cerebral autoregulation: clinical and laboratoryexperience. Acta Neurochir Suppl 86:581–5
Dawson SL, Panerai RB, Potter JF (2003) Serial changes instatic and dynamic cerebral autoregulation after acuteischaemic stroke. Cerebrovasc Dis 16:69–75
Dijkhuizen RM, Ren J, Mandeville JB, Wu O, Ozdag FM,Moskowitz MA et al (2001) Functional magneticresonance imaging of reorganization in rat brain afterstroke. Proc Natl Acad Sci USA 98:12766–71
Eames PJ, Blake MJ, Dawson SL, Panerai RB, Potter JF(2002) Dynamic cerebral autoregulation and beat to beatblood pressure control are impaired in acute ischaemicstroke. J Neurol Neurosurg Psychiatry 72:467–72
Gamalo MA, Ombao H, Jennings JR (2005) Comparingextent of activation: a robust permutation approach.Neuroimage 24:715–22
Golding EM, Robertson CS, Bryan-RM J (1999) Theconsequences of traumatic brain injury on cerebral
Hypertension and functional MRI following strokeUI Tuor et al
1828
Journal of Cerebral Blood Flow & Metabolism (2007) 27, 1819–1829
blood flow and autoregulation: a review. Clin ExpHypertens 21:299–332
Hardebo JE, Owman C (1980) Barrier mechanisms forneurotransmitter monoamines and their precursors atthe blood–brain interface. Ann Neurol 8:1–31
Harper RM, Bandler R, Spriggs D, Alger JR (2000)Lateralized and widespread brain activation duringtransient blood pressure elevation revealed by magneticresonance imaging. J Comp Neurol 417:195–204
Hodics T, Cohen LG (2005) Functional neuroimagingin motor recovery after stroke. Top Stroke Rehabil 12:15–21
Jaillard A, Martin CD, Garambois K, Lebas JF, Hommel M(2005) Vicarious function within the human primarymotor cortex? A longitudinal fMRI stroke study. Brain128:1122–38
Jarmasz M, Somorjai RL (2002) Exploring regions ofinterest with cluster analysis (EROICA) using a spectralpeak statistic for selecting and testing the significanceof fMRI activation time-series. Artif Intell Med 25:45–67
King AB, Menon RS, Hachinski V, Cechetto DF (1999)Human forebrain activation by visceral stimuli. J CompNeurol 413:572–82
MacGregor DG, Carswell HV, Graham DI, McCulloch J,Macrae IM (2000) Impaired cerebral autoregulation 24 hafter induction of transient unilateral focal ischaemiain the rat. Eur J Neurosci 12:58–66
Manuck SB, Olsson G, Hjemdahl P, Rehnqvist N (1992)Does cardiovascular reactivity to mental stress haveprognostic value in postinfarction patients? A pilotstudy. Psychosom Med 54:102–8
Moller K, Qvist T, Tofteng F, Sahl C, Sonderkaer S,Dethloff T et al (2004) Cerebral blood flow andmetabolism during infusion of norepinephrine andpropofol in patients with bacterial meningitis. Stroke35:1333–9
Narasimhan P, Swanson RA, Sagar SM, Sharp FR (1996)Astrocyte survival and HSP70 heat shock proteininduction following heat shock and acidosis. Glia17:147–59
Neumann HT, Kastrup A, de-Crespigny A, Yenari MA,Ringer T, Sun GH et al (2000) Serial MRI after transientfocal cerebral ischemia in rats: dynamics of tissueinjury, blood–brain barrier damage, and edema forma-tion. Stroke 31:1965–72
Novak V, Yang AC, Lepicovsky L, Goldberger AL, LipsitzLA, Peng CK (2004) Multimodal pressure-flow methodto assess dynamics of cerebral autoregulation in strokeand hypertension. Biomed Eng Online 3:39
Olsen TS (1986) Regional cerebral blood flow afterocclusion of the middle cerebral artery. Acta NeurolScand 73:321–37
Paulson OB, Strandgaard S, Edvinsson L (1990) Cerebralautoregulation. Cerebrovasc Brain Metab Rev 2:161–92
Paxinos G, Watson C (1986) The rat brain in sterotaxiccoordinates. New York: Academic Press
Qiao M, Rushforth D, Wang R, Shaw RA, Tomanek B,Dunn J, Tuor UI (2006) Blood-oxygen-level-dependentmagnetic resonance signal and cerebral oxygenationresponses to brain activation are enhanced by con-current transient hypertension in rats. J Cereb BloodFlow Metab. (advance online publication, 27 December2006)
Robinson TG, James M, Youde J, Panerai R, Potter J (1997)Cardiac baroreceptor sensitivity is impaired after acutestroke. Stroke 28:1671–6
Sauter A, Reese T, Porszasz R, Baumann D, Rausch M,Rudin M (2002) Recovery of function in cytoprotectedcerebral cortex in rat stroke model assessed by func-tional MRI. Magn Reson Med 47:759–65
Schaller C, Nakase H, Kotani A, Nishioka T, Meyer B,Sakaki T (2002) Impairment of autoregulation follo-wingcortical venous occlusion in the rat. Neurol Res24:210–4
Shimizu T, Imai H, Seki K, Tomizawa S, Nakamura M,Honda F et al (2005) Cyclophilin C-associated proteinand cyclophilin C mRNA are upregulated in penumbralneurons and microglia after focal cerebral ischemia.J Cereb Blood Flow Metab 25:325–37
Tombari D, Loubinoux I, Pariente J, Gerdelat A, AlbucherJF, Tardy J et al (2004) A longitudinal fMRI study: inrecovering and then in clinically stable sub-corticalstroke patients. Neuroimage 23:827–39
Tuor UI, Edvinsson L, McCulloch J (1986) Catecholaminesand the relationship between cerebral blood flow andglucose use. Am J Physiol 251:H824–33
Waldstein SR, Siegel EL, Lefkowitz D, Maier KJ, Brown JR,Obuchowski AM et al (2004) Stress-induced bloodpressure reactivity and silent cerebrovascular disease.Stroke 35:1294–8
Wang R, Foniok T, Wamsteeker JI, Qiao M, Tomanek B,Vivanco RA et al (2006) Transient blood pressurechanges affect the functional magnetic resonance imag-ing detection of cerebral activation. Neuroimage 31:1–11
Ward NS (2005) Neural plasticity and recovery of func-tion. Prog Brain Res 150:527–35
Williamson JW, McColl R, Mathews D (2003) Evidence forcentral command activation of the human insularcortex during exercise. J Appl Physiol 94:1726–34
Hypertension and functional MRI following strokeUI Tuor et al
1829
Journal of Cerebral Blood Flow & Metabolism (2007) 27, 1819–1829