Visual grading of 2D and 3D functional MRI compared with image-based descriptive measures
31
Linköping University Post Print Visual Grading of 2D and 3D fMRI compared to image based descriptive measures Mattias Ragnehed, Olof Dahlqvist Leinhard, Johan Pihlsgård, Staffan Wirell, Hannibal Sökjer, Patrik Fägerstam, Bo Jiang, Örjan Smedby, Maria Engström and Peter Lundberg N.B.: When citing this work, cite the original article. The original publication is available at www.springerlink.com: Mattias Ragnehed, Olof Dahlqvist Leinhard, Johan Pihlsgård, Staffan Wirell, Hannibal Sökjer, Patrik Fägerstam, Bo Jiang, Örjan Smedby, Maria Engström and Peter Lundberg, Visual Grading of 2D and 3D fMRI compared to image based descriptive measures, 2010, European Radiology, (20), 3, 714-724. http://dx.doi.org/10.1007/s00330-009-1578-0 Copyright: Springer Science Business Media http://www.springerlink.com/ Postprint available at: Linköping University Electronic Press http://urn.kb.se/resolve?urn=urn:nbn:se:liu:diva-17994
Transcript of Visual grading of 2D and 3D functional MRI compared with image-based descriptive measures

Linköping University Post Print
Visual Grading of 2D and 3D fMRI compared
to image based descriptive measures
Mattias Ragnehed, Olof Dahlqvist Leinhard, Johan Pihlsgård,
Staffan Wirell, Hannibal Sökjer, Patrik Fägerstam, Bo Jiang, Örjan Smedby,
Maria Engström and Peter Lundberg
N.B.: When citing this work, cite the original article.
The original publication is available at www.springerlink.com:
Mattias Ragnehed, Olof Dahlqvist Leinhard, Johan Pihlsgård, Staffan Wirell, Hannibal
Sökjer, Patrik Fägerstam, Bo Jiang, Örjan Smedby, Maria Engström and Peter Lundberg,
Visual Grading of 2D and 3D fMRI compared to image based descriptive measures, 2010,
European Radiology, (20), 3, 714-724.
http://dx.doi.org/10.1007/s00330-009-1578-0
Copyright: Springer Science Business Media
http://www.springerlink.com/
Postprint available at: Linköping University Electronic Press
http://urn.kb.se/resolve?urn=urn:nbn:se:liu:diva-17994

Visual Grading of 2D and 3D functional MRI com-
pared to image based descriptive measures
MATTIAS RAGNEHED (1,2,*), OLOF DAHLQVIST LEINHARD (2,3), JOHAN PIHLSGÅRD (2,3), STAFFAN
WIRELL (1,4), HANNIBAL SÖKJER (4), PATRIK FÄGERSTAM (4), BO JIANG (2), ÖRJAN SMEDBY (1,2),
MARIA ENGSTRÖM (1,2), PETER LUNDBERG (2,3)
1. Division of Radiological Sciences, Radiology, IMH, Linköping University, Linköping, Sweden
2. Center for Medical Image Science and Visualization, CMIV, Linköping University, Linköping, Sweden
3. Division of Radiological Sciences, Radiation Physics, IMH, Linköping University, Linköping, Sweden
4. Department of Radiology, Linköping University Hospital, Linköping, Sweden
*. Corresponding author:
Mattias RagnehedDepartment of Medical and Health SciencesDivision of Radiological Sciences /Radiology,Faculty of Health SciencesLinköping UniversitySE-581 85 LINKÖPINGSWEDEN
email: [email protected]: +46 13 222707fax: +46 13 222792

Abstract
A prerequisite for successful clinical use of functional Magnetic Resonance Imaging (fMRI)
is the selection of an appropriate imaging sequence. In this paper, 2D and 3D fMRI sequences
were compared using different image quality assessment methods. Descriptive image meas-
ures, such as activation volume and temporal signal-to-noise ratio (TSNR), were compared
with results from Visual Grading Characteristics (VGC) analysis of the fMRI results. It was
found that significant differences in activation volume and TSNR were not directly reflected
by differences in VGC scores. The results suggest that better performance on descriptive im-
age measures is not always an indicator of improved diagnostic quality of the fMRI results. In
conclusion, in addition to descriptive image measures, it is important to include measures of
diagnostic quality when comparing different fMRI data acquisition methods.
Keywords: functional MRI, visual grading, clinical fmri, EPI, PRESTO, SENSE

Introduction
Functional magnetic resonance imaging (fMRI) has become an important method for the in-
vestigation of human brain function, both for research and for clinical purposes. The most
common clinical use of fMRI is pre-surgical mapping of eloquent cortical areas. Pre-operative
fMRI is then applied in order to spare healthy tissue while removing as much damaged tissue
as possible. Damage to healthy tissue during surgery could introduce new clinical deficits, or
constrict post-operative rehabilitation. Functional areas identified by motor, sensory and lan-
guage tasks have been shown to correspond well with intra-operative mapping results and also
with classically defined anatomical regions responsible for these functions. Incorporating pre-
operative fMRI also reduces the need for intra-operative functional mapping by providing
functional information beforehand. For a review of clinical applications see Matthews et al.
[1]].
Most functional MRI (fMRI) studies rely on the Blood Oxygenation Level Dependent
(BOLD) contrast [2], where signal changes induced by metabolic and hemodynamic changes
following periods of neuronal activity are measured by T2*-weighted imaging sequences.
Two-dimensional Gradient Echo - Echo Planar Imaging (2D GRE-EPI) is the most widely
used acquisition sequence for BOLD-weighted images. By the use of 2D GRE-EPI, full brain
coverage with reasonable spatial resolution (~3×3×3 mm³) can be obtained within 2 seconds,
which enables a robust and accurate mapping of motor or sensory cortex in about 3 minutes if
a block design is utilized.
The main drawbacks of 2D GRE-EPI are geometrical distortions, signal drop out and high
acoustic noise levels [3]. Due to the geometrical distortions it is difficult to make a correct re-
gistration with anatomical images. Consequently, detailed neuro-anatomical identification of
activated areas is sometimes not feasible. In areas close to brain-air interfaces, for instance
around the internal auditory canals, there are often encountered a complete signal loss due to
magnetic field heterogeneity, rendering it impossible to map any functional activity in those
areas.
Parallel imaging techniques, which simultaneously acquire MRI data from two or more re-
ceiver coils, can be used to increase temporal or spatial resolution. EPI imaging artefacts, such
as geometrical distortions and signal drop-outs, can also be reduced by using parallel imaging
[3]. Combining parallel imaging with 3D image acquisition, such as PRESTO, enables whole

brain data acquisition in less than 1 second. However, parallel imaging generally reduce the
image signal to noise ratio (SNR). Fortunately, fMRI experiments are usually limited by tem-
poral SNR (physiological noise), not image SNR, leading to a limited penalty for reduced im-
age SNR [4].
Factors limiting detection of activations in fMRI are temporal SNR (TSNR), the number of
acquisitions (N), and task induced BOLD amplitude. The statistical significance of task in-
duced signal change is proportional to
N×TSNR×PSC (1)
where Percent Signal Change (PSC) is the task induced signal change in percent (equation ad-
opted from Murphy et al.) [5]. From equation (1) it is clear that performance of the imaging
sequences can be characterized by TSNR, effective TSNR (eTSNR = N×TSNR ) and PSC
extracted from functionally defined regions of interest (ROIs).
The PRESTO-SENSE sequence was introduced to fMRI by Golay et al. [6]. They showed
that, at 1.5 T, the addition of SENSE (reduction factor R =2) to the PRESTO sequence en-
abled full brain coverage at moderate resolution in only one second. Despite the fact that both
image SNR and temporal stability was reduced there was only moderate loss of statistical de-
tection power. This was thought to be explained by the increased sampling rate. In another
study at 1.5 T by Preibisch et al., [7] SENSE was utilized to increase either the image resolu-
tion or the acquisition speed of a 2D-EPI sequence. They also evaluated the effect of different
reduction factors (R = 1, 2 and 3). In general, SENSE reduced geometrical image distortions
and blurring, but at R = 3 the image SNR and statistical power was markedly reduced. Neg-
gers et al. [8] used PRESTO with SENSE in two directions (R = 2×1.8) to achieve full brain
coverage in 0.5 seconds on a 3 T scanner. They reported increased temporal stability; in-
creased ability to detect activated voxels; and reduced vein-activation overlap compared with
2D-EPI. They hypothesized that the increased activation detection ability of the PRESTO-
SENSE sequence was caused by the increased sampling rate.
A most important question when it comes to the clinical use of fMRI is whether there is any
difference in diagnostic quality of the functional mapping from the different imaging se-
quences. Previous studies have investigated various signal characteristics to assess the useful-
ness of different imaging techniques, but to our knowledge there are no studies comparing the
diagnostic quality of fMRI results obtained using different data collection techniques. It is im-
portant to realize that high scores on descriptive image measures, like SNR or fMRI activation

volume, are not necessarily indicators of high diagnostic quality of the results. For diagnostic
purposes, correct localization of the activation is certainly more important than a large activa-
tion volume.
In this study, the signal properties of different imaging sequences, as well as the diagnostic
quality of fMRI results from data acquired with the different imaging sequences, were evalu-
ated. A Visual Grading approach was used to obtain a measure of the diagnostic quality of the
fMRI results from the different imaging sequences.
The procedures used for the Visual Grading were selected to resemble the routines for evalu-
ation of clinical fMRI results and the activation paradigms were selected to match paradigms
commonly used in clinical practice. Motor and language tasks were chosen as mapping of
primary motor and language areas are considered to be robust enough for clinical applications
[9]. In addition, the paradigms were chosen to be easily executed and undemanding for the
subjects.
The aim of the study was to quantify the performance of different fMRI data collection meth-
ods by extraction of important descriptive image measures (PSC, TSNR and eTSNR), and
also to quantify the clinical value of fMRI results from the different acquisition methods by
employing Visual Grading of fMRI results. The Visual Grading result was compared to the
descriptive image measures in order to assess the differences between the performance meas-
ures.

Materials and Methods
Participants
Ten healthy volunteers participated in the study; all subjects were right-handed, native
Swedish speakers and they had no history of neurological or psychiatric disease. One subject
had to be excluded from the data analysis due to failure to perform all tasks correctly. The
subjects remaining were 4 male and 5 female, the age range was 23 – 54 years (median 26
years). The study was approved by the local ethics committee and all subjects gave their in-
formed written consent.
Behavioural Paradigms
Two different tasks, by previous experience known to produce activations in distinct parts of
the brain, were used: (1) a right hand motor task known to produce reproducible activations in
the sensory-motor cortex and (2) a listening task primarily resulting in activations in the tem-
poral lobe. The motor and the listening paradigms both utilized a block design.
The motor paradigm started with one instance of the control block followed by of 4 cycles of
the activation and control blocks. The block duration was 20 seconds for both activation and
control blocks, resulting in total paradigm duration of 180 seconds (3 min). During the activa-
tion block the subject performed self-paced finger tapping using their right hand. During the
control block the subject was instructed to rest.
The listening paradigm consisted of 4 cycles of the control and activation blocks. The block
duration was 30 seconds for both the activation and control blocks, resulting in total paradigm
duration of 240 seconds (4 min). During the activation blocks the subjects listened to a recor-
ded story read in Swedish. During the control blocks the subjects listened to the same story,
although in reverse. The sound level was adjusted such that the subjects could clearly hear the
story while functional data was acquired.
Imaging
Images were collected on a 1.5 T Philips Achieva MR-system. Four different imaging se-
quences were used to collect the functional data, two 2D sequences, EPI and EPI-SENSE, and
two 3D sequences, PRESTO, and PRESTO-SENSE. Some parameters were common for all

sequences, TE: 40 ms, imaging matrix: 80×80 and voxel size: 3×3×3 mm³. 24 axial slices
were acquired for the motor task and 31 for the listening task. When parameters were differ-
ent for the motor task and listening task they are given as ‘motor / listening’.
EPI: TR 2.0 / 2.6 seconds, flip angle (FA) 90, N = 87 / 90, dummy acquisitions 3 / 2.
EPI-SENSE: TR 2.0 / 2.6 seconds, FA 90, N = 87 / 90, dummy acquisitions 3 / 2, R = 2.9 in
left-right direction.
PRESTO: TR 2.6 / 3.4 seconds, FA 10, N = 69 / 72, dummy acquisitions 1 / 1.
PRESTO-SENSE: TR 0.87 / 1.12 seconds, FA 10, N = 207/ 214, dummy acquisitions 1 / 1,
R = 2.9 in left-right direction.
In addition T1-weighted inversion recovery images coplanar with the functional images were
collected for anatomical reference.
fMRI Analysis
All image analysis was performed in Matlab r2007b (The MathWorks, Natick, Massachusetts,
USA) using the software packages SPM5 (r1111) (http://www.fil.ion.ucl.ac.uk/spm/), Mars-
bar 0.41 [10], WFU_PickAtlas 2.4 [11,12] and some custom-written functions. SPM5 was
used for pre-processing and statistical analysis of the time-series data. In the pre-processing
step, all functional images were corrected for subject motion and normalized (via the segment
button) to match the EPI template image in MNI space [13]. The normalized images were
smoothed using an isotropic 3D Gaussian filter with 5 mm FWHM for the motor data, and 8
mm FWHM for the listening data. A temporal basis set, consisting of the canonical hemody-
namic response function (hrf) plus temporal and dispersion derivatives, was used to model the
hemodynamic response. Temporal low frequency signal fluctuations were removed by using a
high pass filter with a cut-off period of 128 s. Individual acquisition specific statistical maps
for motor and listening paradigms were obtained using a t-test with only the canonical hrf in-
cluded in the contrast. Acquisition specific group activations maps as well as group activation
maps pooled over both subjects and imaging methods were created in SPM5 using a second
level ANOVA of the individual statistical results.
ROI Construction
ROIs for the motor and listening data were created using the following procedure; 1. an ROI
based on anatomical regions was constructed using the WFU_PickAtlas. For the motor task

the anatomical ROI consisted of the left pre- and post-central gyrus. For the listening task the
anatomical ROI consisted of the left inferior- middle- and superior temporal gyrus. 2. a
second level ANOVA analysis, constrained by the anatomical ROI, including all subjects and
acquisition sequences was performed to capture the common activation pattern. 3. The results
were thresholded at p = 0.05 using false discovery rate (FDR) correction [14] to generate the
sensory-motor and temporal lobe ROIs.
Performance Measures
To quantify the performance of the imaging sequences a number of measures were computed
from the results of the GLM analysis and also directly from the (motion corrected and normal-
ized) image data. The measures used to assess the performance of the different image acquisi-
tion methods were TSNR eTSNR, PSC and number of activated voxels (#voxels). All the ana-
lyses were ROI based. The PSC was calculated using data from a spherical ROI (radius 10
mm) centred on the peak statistic value from the individual data sets. The TSNR, eTSNR and
#voxels were calculated using data extracted from the functionally defined sensory-motor and
temporal lobe ROIs.
The #voxels was determined for each subject and task as the number of voxels declared signi-
ficant by an ROI analysis, p<0.01 (uncorrected). Since the family-wise error (FWE) correc-
tion is based on an estimate of the smoothness of the data, uncorrected thresholds were used
to avoid bias by acquisition dependent variations of smoothness values.
The TSNR was calculated as the average of the voxel time-series divided by the standard de-
viation of the voxel time-series,
TSNR=mean y / std y (2)
where y is the voxel time-series. TSNR was calculated for each voxel separately using the
motion corrected and normalized images. TSNR values relevant for GLM analysis were ob-
tained by removing low frequency fluctuations and signal fluctuations induced by the task pri-
or to TSNR calculation. Low frequency fluctuations were removed by high-pass filtering us-
ing the same filter that was used in the GLM analysis. Task-related signals were removed by
regressing out the portion of the signal explained by the temporal basis set. The TSNR values
reported are the average TSNR value within the functional ROIs. The TSNR value was multi-
plied by N to get the eTSNR.
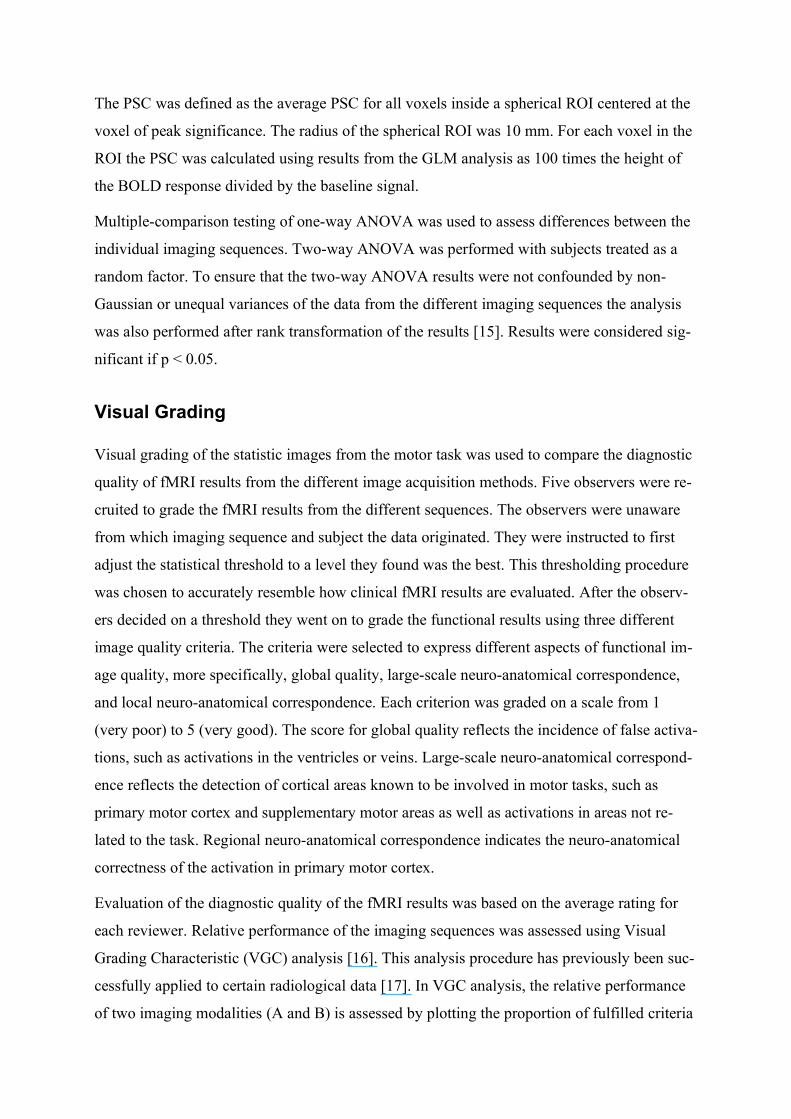
The PSC was defined as the average PSC for all voxels inside a spherical ROI centered at the
voxel of peak significance. The radius of the spherical ROI was 10 mm. For each voxel in the
ROI the PSC was calculated using results from the GLM analysis as 100 times the height of
the BOLD response divided by the baseline signal.
Multiple-comparison testing of one-way ANOVA was used to assess differences between the
individual imaging sequences. Two-way ANOVA was performed with subjects treated as a
random factor. To ensure that the two-way ANOVA results were not confounded by non-
Gaussian or unequal variances of the data from the different imaging sequences the analysis
was also performed after rank transformation of the results [15]. Results were considered sig-
nificant if p < 0.05.
Visual Grading
Visual grading of the statistic images from the motor task was used to compare the diagnostic
quality of fMRI results from the different image acquisition methods. Five observers were re-
cruited to grade the fMRI results from the different sequences. The observers were unaware
from which imaging sequence and subject the data originated. They were instructed to first
adjust the statistical threshold to a level they found was the best. This thresholding procedure
was chosen to accurately resemble how clinical fMRI results are evaluated. After the observ-
ers decided on a threshold they went on to grade the functional results using three different
image quality criteria. The criteria were selected to express different aspects of functional im-
age quality, more specifically, global quality, large-scale neuro-anatomical correspondence,
and local neuro-anatomical correspondence. Each criterion was graded on a scale from 1
(very poor) to 5 (very good). The score for global quality reflects the incidence of false activa-
tions, such as activations in the ventricles or veins. Large-scale neuro-anatomical correspond-
ence reflects the detection of cortical areas known to be involved in motor tasks, such as
primary motor cortex and supplementary motor areas as well as activations in areas not re-
lated to the task. Regional neuro-anatomical correspondence indicates the neuro-anatomical
correctness of the activation in primary motor cortex.
Evaluation of the diagnostic quality of the fMRI results was based on the average rating for
each reviewer. Relative performance of the imaging sequences was assessed using Visual
Grading Characteristic (VGC) analysis [16]. This analysis procedure has previously been suc-
cessfully applied to certain radiological data [17]. In VGC analysis, the relative performance
of two imaging modalities (A and B) is assessed by plotting the proportion of fulfilled criteria

of A versus B. If the area under the resulting line is 0.5 (diagonal) the two methods were rated
equally good and if the area is larger than 0.5 (above the diagonal) then method A performed
better than B.
Intraclass correlation coefficient (ICC) [18] was used to measure conformity of the different
reviewers’ grades.

Results
Activations
The GLM analysis revealed activations in expected cortical areas for all subjects and imaging
sequences. Pre-central and post-central gyri were consistently activated by the motor task.
The listening task resulted in activations mainly in the middle temporal gyrus, superior tem-
poral gyrus and angular gyrus but also in the inferior frontal gyrus, and middle frontal gyrus,
areas all known to be related to language functions. The locations of the most significant
voxel from each data set are marked in Figure 1, demonstrating that the location of the activa-
tion focus did not vary much between subjects and sequences. In fact all activation foci fall
within the functionally defined ROIs.
A second level ANOVA was used to create activation maps pooled over all imaging se-
quences and to assess differences between the imaging sequences for each task. No significant
differences between the results from the different imaging sequences were found for any of
the tasks (p = 0.05 FDR corrected). A group level statistical map and two line profiles for
each imaging sequence is shown in Figures 2 (motor) and 3 (listening). The statistical maps
from the different imaging sequences are in general very similar. The most important differ-
ences are that the EPI sequences appear to have their activation focus closer to the surface of
the brain, which is made clear by the line profiles in Figure 2 and 3, and that the PRESTO-se-
quences fMRI results appear smoother than the EPI results.
Figure 1, peak locations
Figure 2, Statistical maps motor
Figure 3, Statistical maps listening
ROIs
Group activation maps (pooled over subjects and imaging sequences) were used to define the
ROIs used for the quantitative performance measures. The resulting motor ROI was a cluster
of 4036 voxels (32.3 ml) covering the pre-central and post-central gyrus. Its centre was at [-

42, -20, 53] mm in MNI space and the peak significance in this cluster was at [-38, -26, 64]
mm in MNI space, which is in the pre-central gyrus.
The resulting listening ROI was a cluster of 2975 voxels (23.7 ml) with its center of mass at [-
53, -49, 10] mm in MNI space. This cluster covers the posterior part of the middle- and super-
ior temporal gyrus and part of the supramarginal and angular gyrus.
The resulting ROIs are visualized in Figure 4.
Figure 4, ROIs
Descriptive Measures
The descriptive measures, PSC, TSNR, eTSNR and #voxels are summarized in Figure 5. Sig-
nificant differences between individual sequences were assessed by one-way ANOVA analys-
is (p<0.05) and significant results are indicated in Figure 5. Influence of imaging sequence
(EPI or PRESTO) and acceleration (SENSE or not) on the quantitative measures was evalu-
ated using two-way ANOVA. Similar results were achieved for both the motor and listening
tasks. The two-way ANOVA results are summarized in Table 1. Performing the same two-
way ANOVA after rank transformation resulted in identical significant results, thus confirm-
ing the validity of the two-way ANOVA results.
Figure 5, Bar plots
Table 1, two-way ANOVA summary
PSC For the motor task, the PSC was about 1.1%, and for the listening task it was about
0.5%, independent of imaging sequence. ANOVA confirmed that PSC was not affected by the
choice of imaging sequence.
TSNR: TSNR was higher for the 2D-EPI sequences than for the PRESTO sequences. Addi-
tion of SENSE resulted in decreased TSNR for both 2D-EPI and PRESTO. Accordingly both
the sequence and acceleration factors were significant in the two-way ANOVA analyses.
There was no interaction effect.
eTSNR: eTSNR was significantly higher for the EPI sequences than for the PRESTO se-
quences. Adding SENSE improved the eTSNR for the PRESTO sequence, but not for the EPI
sequence. These results were confirmed by the ANOVA analyses. In addition, the two-way

ANOVA showed significant interaction between sequence and acceleration, which is ex-
plained by the improved scores on eTSNR when applying SENSE to the PRESTO sequences.
#voxels: the activation volume was highest for the EPI sequences for both tasks. SENSE ac-
celeration increased the #voxels for the PRESTO sequence, but not for the EPI sequence. The
ANOVA analyses confirmed these results by a significant sequence effect and a significant
interaction effect for both tasks.
Visual Grading
VGC analysis of the average ratings (over criteria and reviewers) showed that the EPI se-
quence was rated highest, while the three remaining sequences (EPI-SENSE, PRESTO, and
PRESTO-SENSE) obtained similar, but lower, scores, see Figure 6. The ICC coefficient for
the average ratings was 0.34, indicating relatively large inter-observer variability of the rat-
ings. In Figure 7 each reviewer’s average rating per sequence is shown, highlighting the vari-
ability of the ratings. Interestingly, the statistic thresholds selected by the reviewers, see Fig-
ure 8, showed much less variability, the ICC coefficient was 0.54.
Median values of each observer’s rating of the different rating criteria are listed in Table 2.
Using Friedman’s test some statistically significant results were found. The global quality cri-
terion received lower grades than the large-scale neuro-anatomical correspondence. There
were also significant differences between the ratings of the different observers; on the large-
scale criterion observer 2 gave lower scores than all the other observers, on the local-scale cri-
terion: observers 2, 3 and 5 gave lower ratings than observer 4 and for the global quality cri-
terion observers 2 and 3 gave lower ratings than observers 1, 4 and 5.
As seen in Figure 8 the observer’s threshold selection follows a common pattern; the EPI se-
quences resulted in higher thresholds than the PRESTO sequences and addition of SENSE
consistently resulted in higher thresholds. There was also a consistent difference in threshold
selection between the observers. All these observations were confirmed to be statistically sig-
nificant (p < 0.05) by two-way ANOVA.
Figure 6,
Figure 7,

Figure 8
Table 2

Discussion
SENSE acceleration can be used to increase the acquisition speed, the spatial resolution, or
both. Here, SENSE acceleration was used to increase the acquisition rate in order to increase
the fMRI activation detection power. If, instead, the SENSE acceleration had been used to in-
crease the spatial resolution of the acquired images, the results may had been different.
However, in a study by Preibisch et al. [7], no difference in sensitivity to activation was ob-
served when using SENSE to increase acquisition rate or spatial resolution of 2D GRE-EPI.
Therfore, we assume that our results would have been similar if increased spatial resolution
had been used instead of increased acquisition rate.
The procedures used for the Visual Grading were selected to resemble the routines for evalu-
ation of clinical fMRI results. To this end it is important that the observers are allowed to in-
dividually adjust the activation threshold since different observers have different preferences.
The activation paradigms were selected to match paradigms commonly used in clinical prac-
tice. A further objective was to use tasks that were easily executed and easy to comprehend.
Motor and language paradigms were selected, since mapping of primary motor cortex and
Broca’s and Wernicke’s areas are well accepted in clinical practice. The choice to use finger
tapping and listening was made to fulfil the request for simple execution and comprehension.
One concern regarding the listening task could be that scanner noise levels, which are known
to vary with imaging sequence, may have influenced the activation results. The scanner noise
levels were not measured but the sound level of the input stimuli was adjusted such that the
subjects could perceive the story without effort. When asked about the contents of the story,
the subjects could always answer correctly which indicated that the background noise did not
influence the perception of the stimuli.
Activation Results
Significant activation at relevant locations was found for all imaging sequences in all subjects
for both tasks. The group level analyses found no statistically significant differences between
the activation results for the different imaging sequences. Only minor differences are perceiv-
able in the non-thresholded activation maps, shown in Figure 2 and 3, where it appears that
the 2D EPI sequences activation focus is closer to the surface of the brain than for the 3D
PRESTO sequences. This could be caused by a larger vein sensitivity of the EPI sequences,

since draining veins are present on the surface of the brain. Larger vein-activation overlap for
2D EPI than for 3D PRESTO was also observed in an earlier study [8]. However, this phe-
nomenon did not affect the location of the most significant voxel for each individual (see Fig-
ure 1), which showed no difference in peak locations. Therefore, it is not possible to verify
that this effect was due to vein activations.
In addition, the PRESTO results gave a smoother impression than the EPI results. This prob-
ably reflects the limited tissue contrast available in the PRESTO images.
Descriptive Image Measures
PSC was neither affected by the choice of imaging sequence, nor SENSE acceleration. Con-
sequently the imaging sequences ability to capture task induced signal variations was only
dictated by the TSNR and the sampling rate. The TSNR was highest for the 2D EPI se-
quences, and SENSE acceleration reduced the TSNR for both the EPI and PRESTO se-
quences. When taking acquisition rate into account, i.e. evaluating eTSNR, it was observed
that the performance of the PRESTO-SENSE sequence was higher than for the PRESTO-se-
quence. The #voxels measure closely followed the eTSNR values, which was expected given
the relation between statistical significance and image data properties in equation (2). Further-
more, the EPI sequences resulted in larger activation volumes than the PRESTO sequences,
and PRESTO-SENSE resulted in larger activation volume than PRESTO. These results are in
concordance with previously published studies comparing EPI and PRESTO-SENSE at 1.5 T
[6,7]. Altogether, the results confirmed that SENSE acceleration degrades image TSNR, al-
though the degradation was more than accounted for by the increased acquisition rate.
Visual Grading
To our knowledge this is the first work adopting a Visual Grading approach to compare ima-
ging methods for fMRI. Using Visual Grading properties that are important for diagnostic
purposes, such as correct functional localization and visual impression, were highlighted.
These properties are not necessarily reflected by the descriptive image measures. Each re-
viewer was instructed to freely select an appropriate statistical threshold for each given data-
set, and then rate the quality of the fMRI results according to certain criteria. The rating criter-
ia were chosen to reflect (1) overall quality, and (2) the neuro-anatomical correspondence of
the overall activations, as well as (3) sensory-motor cortex activations. The average rating of

the three criteria (quality, global and regional activations) was chosen as a measure of dia-
gnostic quality of the fMRI results.
The analysis of the Visual Grading scores revealed that the reviewers selected similar statist-
ical thresholds for the statistical maps (ICC = 0.53). Best performance according to the VGC
analysis was achieved by the EPI sequence. No significant difference could be found between
the other sequences. Large inter-observer variability was found for the average rating (ICC =
0.34), which according to literature is considered to reflect a fair concordance between ob-
servers [19].
The fairly large inter-observer variability may have several causes. First, the reviewers had
somewhat different backgrounds and different levels of fMRI experience, which might have
influenced their rating. In addition, the rating scale could have been more distinctly defined
and a training data set might have been beneficial. Nevertheless, the inter-observer concord-
ance is high enough to conclude that Visual Grading of fMRI results provides important in-
formation.
Combining the Results
The EPI sequence had the highest performance measures using quantitative measures, most
importantly TSNR and #voxels, and also using VGC. Thus, at least for clinical fMRI, the EPI
sequence would be the preferred sequence based on the present results. Furthermore, the de-
scriptive image measures suggest that both EPI sequences performed better than the PRESTO
sequences, and that the PRESTO-SENSE sequence performed better than PRESTO. However,
using VGC analysis, no performance differences were found between the EPI-SENSE,
PRESTO and PRESTO-SENSE sequences. In addition, the quantitative measures showed a
clear performance benefit of EPI-SENSE compared to the PRESTO sequences and also an
improvement of the performance when applying SENSE to the PRESTO sequence. Interest-
ingly, these effects were not observed using the VGC analysis, indicating that improved per-
formance on descriptive image measures do not directly translate into improved diagnostic
quality of the fMRI results.
Considering that there was no significant difference in the group statistic maps of the imaging
sequences, the VGC results are not very surprising. The main differences between the results
of the two sequences appeared to be the significance level of the statistic results: the
PRESTO-SENSE sequence acheived higher statistic scores due to the higher sampling rate.

This was translated into higher #voxels count when a fixed threshold was used. The reviewers
set the threshold for each data set individually, resulting in lower thresholds for the PRESTO
than for the PRESTO-SENSE sequence (see Figure 8)and thus similar activation volumes
were considered in the rating.
The inter-observer variability was quite large for the visual grading results. A possible con-
tributor to the variability was a lack of strict enough definition of the rating scale for the qual-
ity, allowing each reviewer to adopt a slightly different grading approach. Another possible
contribution comes from the fact that the observers were not equally familiar with fMRI res-
ults, which could impact the ability to give consistent ratings. These problems could probably
be reduced in future studies, by providing more distinct grading instructions, and by using
more strict inclusion criteria for the reviewers in combination with a larger training data set.

Conclusions
In this study we have shown that the 2D EPI sequence acheived higher performance measures
than 2D EPI-SENSE, 3D PRESTO and 3D PRESTO-SENSE on both descriptive measures
(eTSNR and #voxels) and diagnostic quality measures (VGC analysis). Furthermore, the de-
scriptive measures indicated that both EPI sequences performed better than the PRESTO se-
quences. The PRESTO-SENSE sequence also performed better than PRESTO on the descript-
ive measures. The improved performance of PRESTO-SENSE over PRESTO confirms the
hypothesis that increased sampling rate can improve the detection of activated voxels.
In contrast, using VGC analysis no performance differences were found between the EPI-
SENSE, PRESTO and PRESTO-SENSE sequences. This could be due to insufficiently well
defined rating criteria allowing each reviewer to adopt a slightly different individual ap-
proach. It could also reflect the fact that there are, apart from different levels of statistical sig-
nificance, only minor differences in the activation patterns obtained using the different image
sequences. By setting appropriate thresholds the differences caused by different levels of stat-
istical significance were largely extinguished.
Fair inter-observer conformance was found for the results of the Visual Grading, and the res-
ults of the VGC analysis were in certain aspects similar to the results obtained from the quant-
itative measures. However, there were some important differences between the VGC analysis
and the descriptive measures indicating the importance of including neuro-anatomical corres-
pondence when comparing fMRI data acquisition methods.
In conclusion, it was shown that, among the sequences evaluated, the EPI sequence was the
best choice for clinical fMRI. Further it was shown that high scores on descriptive image
measures, such as eTSNR and #voxels, do not necessarily imply high diagnostic quality.
Thus, when comparing fMRI acquisition techniques, methods such as Visual Grading are im-
portant as it highlights properties, such as correct localisation of activation, which are not re-
flected by descriptive image measures.

Bibliography
[1]. Matthews PM, Honey GD, Bullmore ET (2006) Applications of fmri in translational
medicine and clinical practice. Nat Rev Neurosci 7:732-744. doi:10.1038/nrn1929
[2]. Ogawa S, Lee T, Kay A, Tank D (1990) Brain magnetic-resonance-imaging with con-
trast dependent on blood oxygenation. Pnas 87:9868-9872.
[3]. de Zwart J, van Gelderen P, Golay X, Ikonomidou V, Duyn J (2006) Accelerated paral-
lel imaging for functional imaging of the human brain. NMR Biomed 19:342-351.
doi:10.1002/nbm.1043
[4]. Krüger G, Glover G (2001) Physiological noise in oxygenation-sensitive magnetic res-
onance imaging. Magn Reson Med 46:631-637. doi:10.1002/mrm
[5]. Murphy K, Bodurka J, Bandettini PA (2007) How long to scan? the relationship
between fmri temporal signal to noise ratio and necessary scan duration. NeuroImage
34:565-574. doi:10.1016/j.neuroimage.2006.09.032
[6]. Golay X, Pruessmann K, Weiger M, Crelier G, Folkers P, Kollias S, et al. (2000)
Presto-sense: an ultrafast whole-brain fmri technique. Magn Reson Med 43:779-786.
doi:10.1002/1522-2594(200006)43:6<779::AID-MRM1>3.0.CO;2-4
[7]. Preibisch C, Pilatus U, Bunke R, Hoogenraad F, Zanella F, Lanfermann H (2003)
Functional mri using sensitivity-encoded echo planar imaging (sense-epi). Neuroimage
19:412-421. doi:10.1016/S1053-8119(03)00080-6
[8]. Neggers S, Hermans E, Ramsey N (2008) Enhanced sensitivity with fast three-dimen-
sional blood-oxygen-level-dependent functional mri: comparison of sense-presto and
2d-epi at 3 t. NMR Biomed 21:663-676. doi:10.1002/nbm.1235
[9]. Stippich C (2007) Presurgical functional magnetic resonance imaging (fmri). Clinical
Neuroradiology 17:69-87. doi:10.1007/s00062-007-7008-2
[10]. Brett M, Anton J, Valabrègue R, Poline J (2002) Region of interest analysis using an
spm toolbox. 8th International Conference on Functional Mapping of the Human Brain
16:
[11]. Maldjian J, Laurienti P, Kraft R, Burdette J (2003) An automated method for neuroana-
tomic and cytoarchitectonic atlas-based interrogation of fmri data sets. Neuroimage
19:1233-1239. doi:10.1016/S1053-8119(03)00169-1

[12]. Maldjian J, Laurienti P, Burdette J (2004) Precentral gyrus discrepancy in electronic
versions of the talairach atlas. Neuroimage 21:450-455.
doi:10.1016/j.neuroimage.2003.09.032
[13]. Mazziotta J, Toga A, Evans A, Fox P, Lancaster J (1995) A probabilistic atlas of the
human brain: theory and rationale for its development. the international consortium for
brain mapping (icbm). Neuroimage 2:89-101. doi:10.1006/nimg.1995.1012
[14]. Genovese C, Lazar N, Nichols T (2002) Thresholding of statistical maps in functional
neuroimaging using the false discovery rate. Neuroimage 15:870-8.
doi:10.1006/nimg.2001.1037
[15]. Conover W (Wiley: New York, 1999). Practical nonparametric statistics. 3:
[16]. Båth M, Månsson LG (2007) Visual grading characteristics (vgc) analysis: a non-para-
metric rank-invariant statistical method for image quality evaluation. Br J Radiol
80:169-176. doi:10.1259/bjr/35012658
[17]. Vikgren J, Johnsson A, Flinck A, Kheddache S, Milde H, Båth M (2008) High-resolu-
tion computed tomography with 16-row mdct: a comparison regarding visibility and
motion artifacts of dose-modulated thin slices and "step and shoot" images. Acta Radiol
49:755-760. doi:10.1080/02841850802078128
[18]. Shrout P, Fleiss J (1979) Intraclass correlations: uses in assessing rater reliability. Psy-
chol Bull 86:420-8.
[19]. Shrout P (1998) Measurement reliability and agreement in psychiatry. Stat Methods
Med Res 7:301-17.

Figures
Figure 1. The location of the peak statistic value is shown for the motor and listening tasks for all imaging se-
quences. There are no noticeable differences in the locations of the peak statistic value for the different imaging
sequences.

Figure 2. Group analysis statistical maps for the motor task, shown without thresholding, and horisontal line pro-
files for all sequences. The arrows in the activation maps indicate the location of the most significant voxel. The
statistical maps from the different imaging sequences were almost similar, which was confirmed by the absence
of significant differences between sequences in the ANOVA. Only minor differences could be perceived. (1) The
PRESTO images appeared smoother than the EPI images. (2) the EPI images appeared to have their activation
focus closer to the surface of the brain, Line profiles were drawn through the location corresponing to the activa-
tion peak of PRESTO-SENSE in slice z = 52 and the activation peak of EPI in slice z = 64. The line profiles
made it clearer that the EPI sequences had activation foci close to the surface of the brain, indicated by arrows in
the line plots. This might be a result of a pronounced vein sensitivity for the EPI sequences.

Figure 3. Group analysis statistical maps for the listening task, shown without thresholding, and horisontal line
profiles for all sequences. The arrows in the activation maps indicate the location of the most significant voxel.
Again, the statistical maps from the different imaging sequences were almost similar, which was confirmed by
the absence of significant differences between sequences in the ANOVA. Only minor differences could be per-
ceived. (1) Once again the PRESTO images appeared smoother than the EPI images. (2) the EPI images ap-
peared to have their activation focus closer to the surface of the brain. Line profiles were drawn through the loca-
tion corresponing to the activation peak of PRESTO-SENSE in slice z = 0 and the activation peak of EPI in slice
z = 16. The line profiles made it clearer that the EPI sequences had activation foci close to the surface of the
brain, indicated by arrows in the line plots. This might be a result of a pronounced vein sensitivity for the EPI se-
quences.

Figure 4. The functionally defined
ROIs for the motor (light gray) and
listening (dark gray) task. The ROIs
were anatomically restricted to pre-
vent spatial overlap. The motor ROI
covers superior parts of pre and post
central gyrus. The listening task ROI
covers posterior parts of the middle
temporal gyrus and superior temporal
gyrus as well as part of angular gyrus.
Figure 5. Bar plots of important descriptive measures. The whiskers indicate standard errors and the line annota-
tions above the bars indicate significant differences. The results for the motor and listening task show very simil-
ar patterns. Notably, there were no significant differences in PSC, showing that all imaging sequences were
equally sensitive to BOLD changes.

Figure 6. VGC-curves for the different imaging sequences. The EPI sequence was used as reference. The closer
the VGC-curve is to the lower right corner the worse the corresponding image sequence was rated. There was
virtually no difference in the performance of the EPI-SENSE, PRESTO and PRESTO-SENSE sequences, and
the EPI sequence was clearly rated highest.

Figure 7. Each observer’s average rating on the different image sequences is shown, together with the average of
the observers’ ratings. The ICC for the average ratings was 0.34 indicating a quite large variability, which is also
reflected in the Figure. It is also evident that there is a common pattern among the observers.

Figure 8. Observers selection of 'best threshold' (t-values) for all subjects and image sequences. It appeared that
the threshold selection followed a common pattern; higher thresholds were selected for the EPI sequences than
for the PRESTO sequences, and addition of SENSE lead to higher thresholds. Two-way ANOVA showed that
there were significant differences of the threshold levels between observers; observer 2 selected lower thresholds
than all other observers and observer 3 and 5 selected lower thresholds than observer 1 and 4. The two-way AN-
OVA also confirmed that the EPI thresholds were higher than the PRESTO thresholds and that higher thresholds
were selected when SENSE was used.

Tables
Table 1
#voxels PSC TSNR eTSNR
Motor Audio Motor Audio Motor Audio Motor Audio
Sequence 0.0245 0.0042 0.3195 0.7246 0.0000 0.0000 0.0000 0.0001
Acceleration 0.2779 0.7961 0.0811 0.4867 0.0003 0.0060 0.0017 0.1683
Interaction 0.0372 0.0669 0.1581 0.7330 0.1296 0.4553 0.0000 0.0009
Table 1. Summary of p-values from the two-way ANOVA of the quantitative performance measures. Significant
results are indicated by bold numbers. The pattern of significant results for the motor and listening tasks are very
similar, indicating that the results were independent of the anatomical region being analysed.

Table 2.
Large Local Global
E ES P PS E ES P PS E ES P PS
1 5 4 5 4 5 4 2 3 4 4 3 3
2 4 3 4 3 4 3 3 4 2 3 3 3
3 4 4 4 4 4 3 4 4 3 2 2 3
4 4 3 3 4 5 4 4 4 4 4 3 4
5 4 4 4 4 3 3 3 4 4 4 4 4Table 2. Median values of each observer’s rating of the different critera for each sequence(E: EPI, ES: EPI-
SENSE, P: PRESTO, PS: PRESTO-SENSE). Significant differences (p < 0.05) between observers and criteria
were assess using Friedman test. The significant differences found between observers were; Large: observer 2
gave lower scores than all the other observers, Local: observers 2, 3 and 5 all gave lower ratings than observer 4,
Global: observers 2 and 3 gave lower ratings than observers 1, 4 and 5. In addition the Global criterion was
graded lower than the Large-scale criteria.