COMPARATIVE ANALYSIS OF CONCENTRATE GRADING ...
10
doi: 10.5277/msc162305 Mining Science, vol. 23, 2016, 55−64 Mining Science (previously Prace Naukowe Instytutu Gornictwa Politechniki Wroclawskiej), ISSN 0370-0798 in Polish) www.miningscience.pwr.edu.pl ISSN 2300-9586 (print) ISSN 2084-4735 (online) Received May 23, 2016; reviewed; accepted August 8, 2016 COMPARATIVE ANALYSIS OF CONCENTRATE GRADING AND REVENUE IN POLISH COPPER MINES Jerzy MALEWSKI * Department of Geoengineering, Mining and Geology, Wroclaw University of Science and Technology, Poland Abstract: The paper presents results of a comparative analysis of revenues of the Lubin, Polkowice- Sieroszowice and Rudna mines (KGHM Polska Miedź S.A). The criterion used for comparison is the Net Smelter Revenue formula (NSR) based on heuristic model of functional relationships between the con- centration of metals in ore and copper concentrates, the operational efficiency, and the prices of concen- trates and metals in the global markets. The calculations have been performed for the data coming from the mining practice. The NSR calculations show that the Lubin mine is nearly 2 times less profitable than the Rudna mine, yet if we compare Cu+Ag+Au grading to the best (Rudna) mine, that difference is only 1.6-fold. However, it must be noted here that the Rudna and Polkowice mines are much deeper than the Lubin mine, therefore the total profit from the mine are not as different as the NSR value. Keywords: NSR, copper grading, revenue, optimisation INTRODUCTION The Net Smelter Revenue (NSR) method is commonly used to analyse the economic impact of the concentration grade of enriched minerals on mine rev- enue in the light of processing costs and metal market prices (Wills 2006, Strzelska-Smakowska, Paulo 1995). The method involves calculating profits achievable from the sale of the main product of the mine, i.e. the Cu concen- trate, after deduction of the TC/RCs charges. This is an important piece of in- formation for the mine, which may be a criterion for optimising extraction and beneficiation of ore according to the quality of the concentrates. _________ * Corresponding author: [email protected] (J. Malewski)
-
Upload
khangminh22 -
Category
Documents
-
view
0 -
download
0
Transcript of COMPARATIVE ANALYSIS OF CONCENTRATE GRADING ...
doi: 10.5277/msc162305
Mining Science, vol. 23, 2016, 55−64
Mining Science (previously Prace Naukowe Instytutu Gornictwa
Politechniki Wroclawskiej), ISSN 0370-0798 in Polish)
www.miningscience.pwr.edu.pl ISSN 2300-9586 (print)
ISSN 2084-4735 (online)
Received May 23, 2016; reviewed; accepted August 8, 2016
COMPARATIVE ANALYSIS OF CONCENTRATE GRADING
AND REVENUE IN POLISH COPPER MINES
Jerzy MALEWSKI*
Department of Geoengineering, Mining and Geology, Wroclaw University of Science and Technology,
Poland
Abstract: The paper presents results of a comparative analysis of revenues of the Lubin, Polkowice-
Sieroszowice and Rudna mines (KGHM Polska Miedź S.A). The criterion used for comparison is the Net
Smelter Revenue formula (NSR) based on heuristic model of functional relationships between the con-
centration of metals in ore and copper concentrates, the operational efficiency, and the prices of concen-
trates and metals in the global markets. The calculations have been performed for the data coming from
the mining practice. The NSR calculations show that the Lubin mine is nearly 2 times less profitable than
the Rudna mine, yet if we compare Cu+Ag+Au grading to the best (Rudna) mine, that difference is only
1.6-fold. However, it must be noted here that the Rudna and Polkowice mines are much deeper than the
Lubin mine, therefore the total profit from the mine are not as different as the NSR value.
Keywords: NSR, copper grading, revenue, optimisation
INTRODUCTION
The Net Smelter Revenue (NSR) method is commonly used to analyse the
economic impact of the concentration grade of enriched minerals on mine rev-
enue in the light of processing costs and metal market prices (Wills 2006,
Strzelska-Smakowska, Paulo 1995). The method involves calculating profits
achievable from the sale of the main product of the mine, i.e. the Cu concen-
trate, after deduction of the TC/RCs charges. This is an important piece of in-
formation for the mine, which may be a criterion for optimising extraction and
beneficiation of ore according to the quality of the concentrates.
_________
* Corresponding author: [email protected] (J. Malewski)
Jerzy MALEWSKI 56
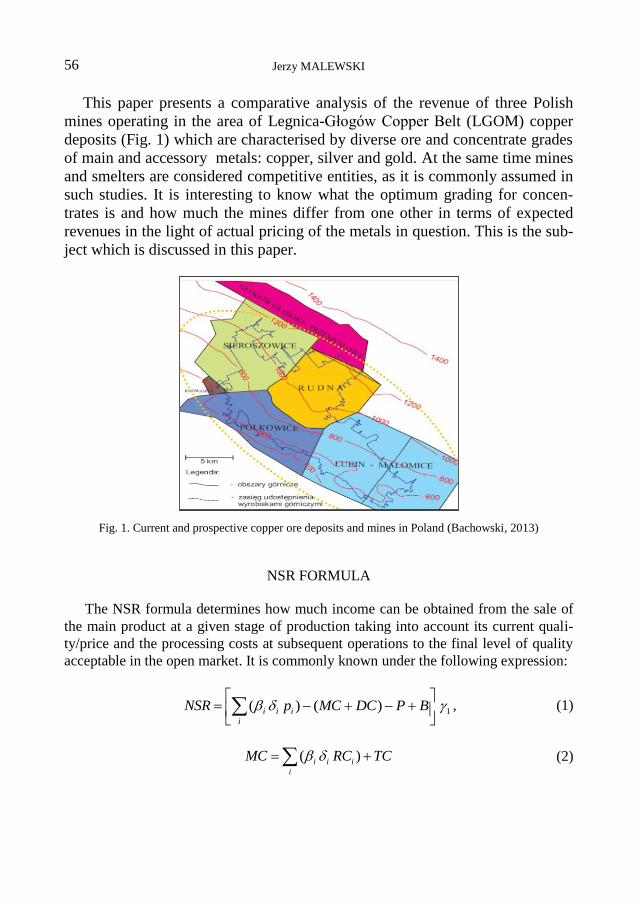
This paper presents a comparative analysis of the revenue of three Polish
mines operating in the area of Legnica-Głogów Copper Belt (LGOM) copper
deposits (Fig. 1) which are characterised by diverse ore and concentrate grades
of main and accessory metals: copper, silver and gold. At the same time mines
and smelters are considered competitive entities, as it is commonly assumed in
such studies. It is interesting to know what the optimum grading for concen-
trates is and how much the mines differ from one other in terms of expected
revenues in the light of actual pricing of the metals in question. This is the sub-
ject which is discussed in this paper.
Fig. 1. Current and prospective copper ore deposits and mines in Poland (Bachowski, 2013)
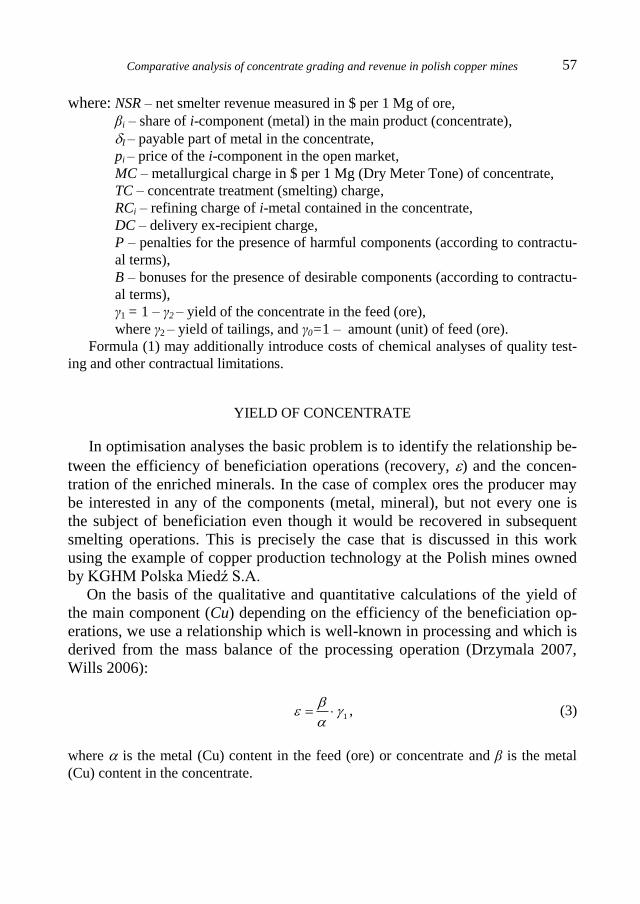
NSR FORMULA
The NSR formula determines how much income can be obtained from the sale of
the main product at a given stage of production taking into account its current quali-
ty/price and the processing costs at subsequent operations to the final level of quality
acceptable in the open market. It is commonly known under the following expression:
1( ) ( )i i i
i
NSR p MC DC P B
, (1)
( )i i i
i
MC RC TC (2)
Comparative analysis of concentrate grading and revenue in polish copper mines
57
where: NSR – net smelter revenue measured in $ per 1 Mg of ore,
βi – share of i-component (metal) in the main product (concentrate),
I – payable part of metal in the concentrate,
pi – price of the i-component in the open market,
MC – metallurgical charge in $ per 1 Mg (Dry Meter Tone) of concentrate,
TC – concentrate treatment (smelting) charge,
RCi – refining charge of i-metal contained in the concentrate,
DC – delivery ex-recipient charge,
P – penalties for the presence of harmful components (according to contractu-
al terms),
B – bonuses for the presence of desirable components (according to contractu-
al terms),
γ1 = 1 – γ2 – yield of the concentrate in the feed (ore),
where γ2 – yield of tailings, and γ0=1 – amount (unit) of feed (ore).
Formula (1) may additionally introduce costs of chemical analyses of quality test-
ing and other contractual limitations.
YIELD OF CONCENTRATE
In optimisation analyses the basic problem is to identify the relationship be-
tween the efficiency of beneficiation operations (recovery, ) and the concen-
tration of the enriched minerals. In the case of complex ores the producer may
be interested in any of the components (metal, mineral), but not every one is
the subject of beneficiation even though it would be recovered in subsequent
smelting operations. This is precisely the case that is discussed in this work
using the example of copper production technology at the Polish mines owned
by KGHM Polska Miedź S.A.
On the basis of the qualitative and quantitative calculations of the yield of
the main component (Cu) depending on the efficiency of the beneficiation op-
erations, we use a relationship which is well-known in processing and which is
derived from the mass balance of the processing operation (Drzymala 2007,
Wills 2006):
1
, (3)
where is the metal (Cu) content in the feed (ore) or concentrate and β is the metal
(Cu) content in the concentrate.
Jerzy MALEWSKI 58
(a) (b)
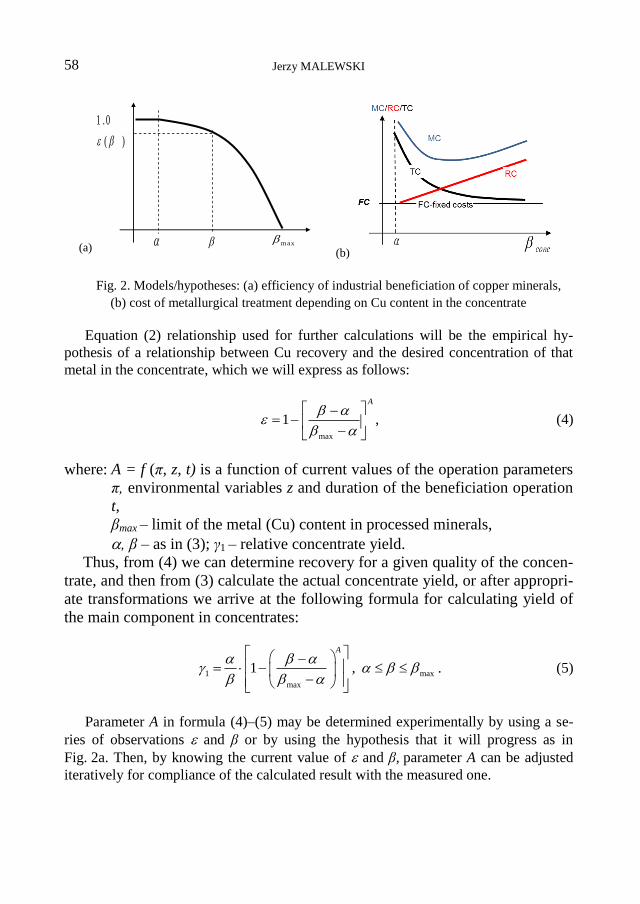
Fig. 2. Models/hypotheses: (a) efficiency of industrial beneficiation of copper minerals,
(b) cost of metallurgical treatment depending on Cu content in the concentrate
Equation (2) relationship used for further calculations will be the empirical hy-
pothesis of a relationship between Cu recovery and the desired concentration of that
metal in the concentrate, which we will express as follows:
max
1
A
, (4)
where: A = f (π, z, t) is a function of current values of the operation parameters
π, environmental variables z and duration of the beneficiation operation
t,
βmax – limit of the metal (Cu) content in processed minerals,
, β – as in (3); γ1 – relative concentrate yield.
Thus, from (4) we can determine recovery for a given quality of the concen-
trate, and then from (3) calculate the actual concentrate yield, or after appropri-
ate transformations we arrive at the following formula for calculating yield of
the main component in concentrates:
1 max
max
1 ,
A
. (5)
Parameter A in formula (4)–(5) may be determined experimentally by using a se-
ries of observations and β or by using the hypothesis that it will progress as in
Fig. 2a. Then, by knowing the current value of and β, parameter A can be adjusted
iteratively for compliance of the calculated result with the measured one.
)(
0.1
max
Comparative analysis of concentrate grading and revenue in polish copper mines
59
PAYMENT AND DEDUCTIONS
The payable part of a metal in formula (1) is always less than 100% of its amount
in the concentrate**
. Typical deduction formulas are as follows (Soderstrom 2008):
1%Cu
Cu
Cu
, Cu – % in DMT (dry metric tonne of concentrate), (6)
30Ag
Ag
Ag
, Ag – g/DMT (grams/dry metric tonne of concentrate), (7)
1Au
Au
Au
, Au – g/DMT (grams/dry metric tonne of concentrate). (8)
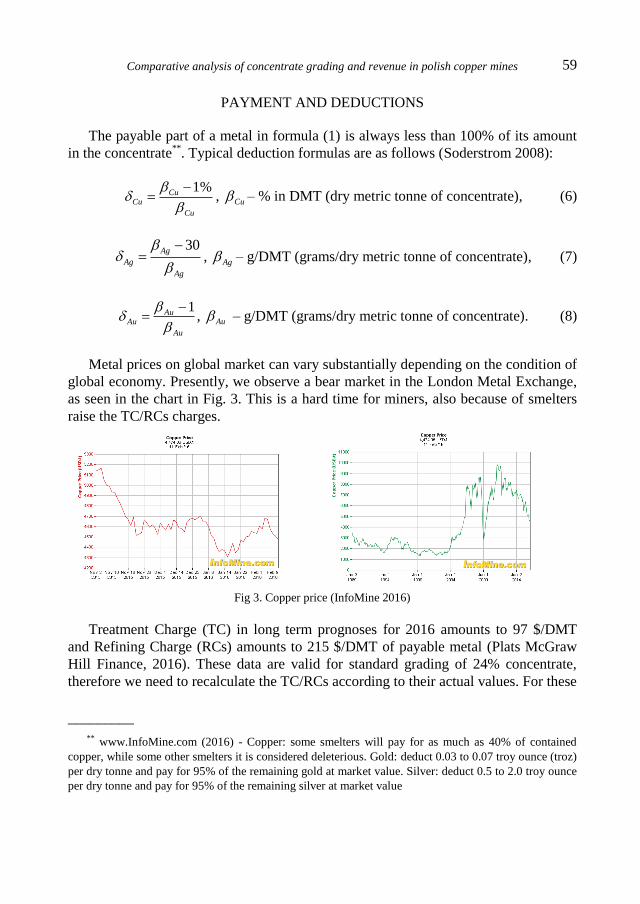
Metal prices on global market can vary substantially depending on the condition of
global economy. Presently, we observe a bear market in the London Metal Exchange,
as seen in the chart in Fig. 3. This is a hard time for miners, also because of smelters
raise the TC/RCs charges.
Fig 3. Copper price (InfoMine 2016)
Treatment Charge (TC) in long term prognoses for 2016 amounts to 97 $/DMT
and Refining Charge (RCs) amounts to 215 $/DMT of payable metal (Plats McGraw
Hill Finance, 2016). These data are valid for standard grading of 24% concentrate,
therefore we need to recalculate the TC/RCs according to their actual values. For these
_________
** www.InfoMine.com (2016) - Copper: some smelters will pay for as much as 40% of contained
copper, while some other smelters it is considered deleterious. Gold: deduct 0.03 to 0.07 troy ounce (troz)
per dry tonne and pay for 95% of the remaining gold at market value. Silver: deduct 0.5 to 2.0 troy ounce
per dry tonne and pay for 95% of the remaining silver at market value
Jerzy MALEWSKI 60
reasons we will use a hypothetical model as presented in Fig. 2b, which can be ex-
pressed by the following general formula:
* * *; :
k
RC TCC D
RC TC
, (9)
where: β, β*– actual and observed grade of concentrate, respectively,
C = VC*/TC
* – constant, representing relative variable treatment (or refining)
costs,
D = FC/TC* – constant, representing relative fixed treatment (or refining)
costs,
TC*, RC
* – observed treatment or refining costs
k – curve form factor determined experimentally by iteration in a way similar
to how it was described in the case of formulas (4-5).
Note: If β = β* then TC = TC
* (or RC = RC
*) because from formula (5) we get
C + D = 1. In both cases C = 2/3 and D = 1/3 were assumed for calculation, but k = 2
for TCCu and k = 1 for RCs.
The metallurgical costs, however, depend on the presence of components harmful
to the refining technology or the environment. Therefore, formula (1) introduces op-
tionally the penalty component (P ) for the presence of undesirable components in the
concentrate. For the purpose of the present calculations, these components have been
ignored.
For precious metals RCs is 0.6 $/troz or 0.01926 $/DMT of payable silver, and
8 $/troz or 0.25680 $/DMT of payable gold.
COMPARATIVE REVENUE PERFORMANCE
We will now perform calculations to optimise the quality (copper content) of the
concentrate and/or accessory metals using the previously derived relationships. We
will use the industrial data of metals content in the operations streams throughout the
copper production cycle. The input data for calculations are presented in Table 1.
The RCs values are following βi actual grade of i-metal by formula (6)–(8). How-
ever, we also need to know how the grade of silver and gold in Cu concentrate change
following grade of Cu in ore and concentrate. There are two ways to know it: use CF
values as constant or use the Cu/Cu* relationship in the ore and concentrate. Here, we
are going to use the second approach.
The content of main and accessory metals will be estimated in a simplified manner
from the relationship:
Comparative analysis of concentrate grading and revenue in polish copper mines
61
* *
i CuCu
i Cu
b
. (10)
Thus, βi ≈ bCuβi* is a current grade βi of i-component proportionally to the relative
change of copper grade of the concentrate.
The same approach is applied to calculate the i-component of ore for the purposes
of calculation of the current ore value, i.g. αi ≈ aCuαi*.
Treating the data in Table 1 as empirical (αi*, βi*), we will calculate the relative
yield of the concentrate γ1. Taking the empirical αCu*, βCu*, εCu* and assuming the
metal content in the mineral to be βmax* = 65%, and also applying the iterative method,
we will assess the parameters of the function (3) that crosses the empirical point as
shown in Fig. 4. Knowing the relationship as described above and comparing it to (4)
we will calculate the yields γCu = f(aCuβCu) for the current values of copper grading in
the concentrate and in the ore.
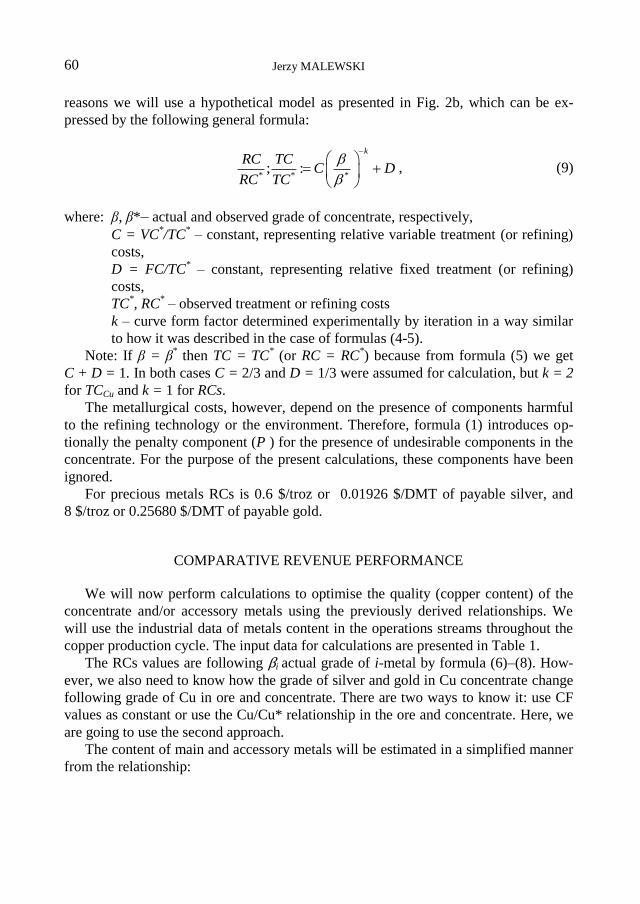
Table 1. Data adopted for calculations. Component grades
of the main product of operations. LME prices as of 9 Feb 2016
ConcFactor Metal Mine Concentrator
Market
9 Feb 2016
CF
Cu grade of product (lb = 0.4536kg;
troz = 31.1035g)
LUBIN
18.9 Cu* 0.90% 17.00% 2.07 $/lb
13.4 Ag* 0.00692% 0.093% 15.4 $/troz
8.2 Au* 0.000001% 0.000010% 1192.9 $/troz
POLKOWICE-SIEROSZOWICE
15.0 Cu* 1.67% 25.76% 2.07 $/lb
12.8 Ag* 0.00350% 0.047% 15.4 $/troz
13.4 Au* 0.000004% 0.000050% 1192.9 $/troz
RUDNA
15.2 Cu* 1.78% 25.00% 2.07 $/lb
13.1 Ag* 0.004925% 0.065% 15.4 $/troz
10.5 Au* 0.000001% 0.000010% 1192.9 $/troz
Once we have the 1/TC/RC – dependence models (Fig. 2) and the estimated pa-
rameters, we can simulate revenue limits from production of concentrates for the
mine. Figures 5 – 6 show the results of such calculations for a practical scope of metal
grading in ore and concentrate. The NSR values are presented with reference to the
values of metals in the concentrate in two variants: (a) without accessory metals, and
Jerzy MALEWSKI 62
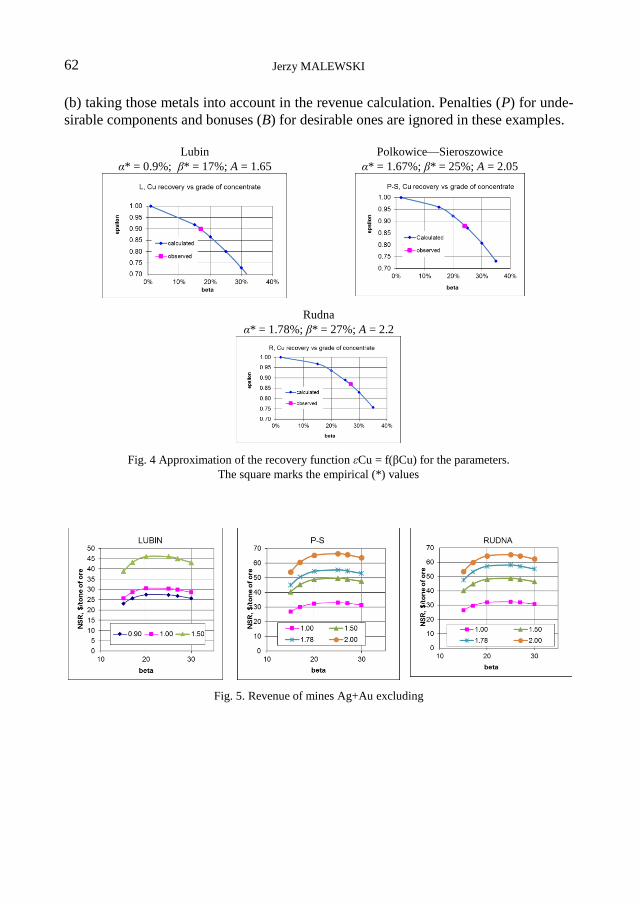
(b) taking those metals into account in the revenue calculation. Penalties (P) for unde-
sirable components and bonuses (B) for desirable ones are ignored in these examples.
Lubin
α* = 0.9%; β* = 17%; A = 1.65
Polkowice—Sieroszowice
α* = 1.67%; β* = 25%; A = 2.05
Rudna
α* = 1.78%; β* = 27%; A = 2.2
Fig. 4 Approximation of the recovery function εCu = f(βCu) for the parameters.
The square marks the empirical (*) values
Fig. 5. Revenue of mines Ag+Au excluding
Comparative analysis of concentrate grading and revenue in polish copper mines
63
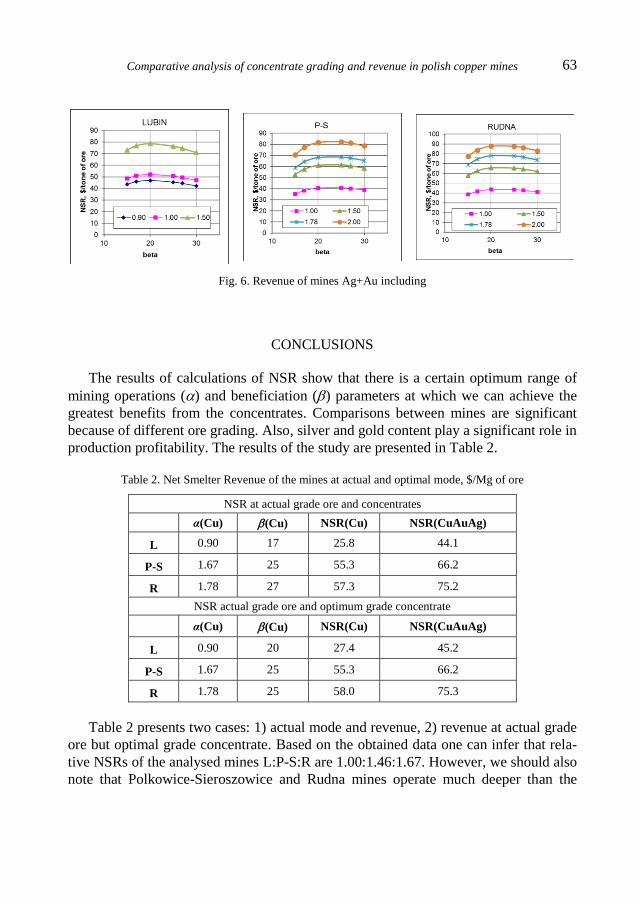
Fig. 6. Revenue of mines Ag+Au including
CONCLUSIONS
The results of calculations of NSR show that there is a certain optimum range of
mining operations () and beneficiation () parameters at which we can achieve the
greatest benefits from the concentrates. Comparisons between mines are significant
because of different ore grading. Also, silver and gold content play a significant role in
production profitability. The results of the study are presented in Table 2.
Table 2. Net Smelter Revenue of the mines at actual and optimal mode, $/Mg of ore
NSR at actual grade ore and concentrates
α(Cu) (Cu) NSR(Cu) NSR(CuAuAg)
L 0.90 17 25.8 44.1
P-S 1.67 25 55.3 66.2
R 1.78 27 57.3 75.2
NSR actual grade ore and optimum grade concentrate
α(Cu) (Cu) NSR(Cu) NSR(CuAuAg)
L 0.90 20 27.4 45.2
P-S 1.67 25 55.3 66.2
R 1.78 25 58.0 75.3
Table 2 presents two cases: 1) actual mode and revenue, 2) revenue at actual grade
ore but optimal grade concentrate. Based on the obtained data one can infer that rela-
tive NSRs of the analysed mines L:P-S:R are 1.00:1.46:1.67. However, we should also
note that Polkowice-Sieroszowice and Rudna mines operate much deeper than the
Jerzy MALEWSKI 64
Lubin mine, therefore the running costs of the mines under comparison are not so
much different, i.e. 1:1.36:1.58 (Malewski, 2016).
REFERENCES
BACHOWSKI C., (2013), Koncesje wydobywcze po roku 2013, KGHM Polska Miedź SA.
DRZYMALA J. (2007), Mineral processing: Foundations of theory and practice of mineralurgy, Oficyna
Wydawnicza Politechniki Wrocławskiej, Wrocław.
KRZEMINSKA M. (2012), Ekonomika produkcji miedzi ze złóż LGOM w pracach naukowo-badawczych
i publikacjach krajowych, Prace Naukowe Instytutu Górnictwa Politechniki Wrocławskiej. Studia i
Materiały, Vol. 135, nr 42, 55-65.
MALEWSKI J., KRZEMINSKA M. (2012), Dependence of mine revenue on the grade of copper con-
centrate, Physicochemical Problems of Mineral Processing vol. 48(2), 559−568.
MALEWSKI J. (2016), Production quality, value and revenue in polish copper mines, WMESS’16 Con-
ference, Praque.
MONOGRAFIA KGHM Polska Miedź S.A. (2007), Praca zbiorowa (pod red. A. Piestrzyńskiego), Lubin.
STRZELSKA-SMAKOWSKA B., PAULO A. (1995), Optimization of ore concentrates by revenue
method (in Polish), I Międzynarodowa Konferencja Przeróbki Kopalin, Oficyna Wydawnicza Jaxa,
Kraków, 63-75.
SODERSTROM U. ( 2008), Copper smelter revenue stream, Capital Markets Day November 2008.
WILLS B.A. (2006), Mineral processing technology, Elsevier Sci & Techn Books.