Correlation between Anatomical Grading and Acoustic–Elastic ...
18
Article Correlation between Anatomical Grading and Acoustic–Elastic Properties of Resonant Spruce Wood Used for Musical Instruments Florin Dinulică 1 , Mariana Domnica Stanciu 2,3, * and Adriana Savin 4 Citation: Dinulic˘ a, F.; Stanciu, M.D.; Savin, A. Correlation between Anatomical Grading and Acoustic–Elastic Properties of Resonant Spruce Wood Used for Musical Instruments. Forests 2021, 12, 1122. https://doi.org/10.3390/ f12081122 Academic Editors: Michele Brunetti, Michela Nocetti and Alexander Petutschnigg Received: 22 July 2021 Accepted: 20 August 2021 Published: 22 August 2021 Publisher’s Note: MDPI stays neutral with regard to jurisdictional claims in published maps and institutional affil- iations. Copyright: © 2021 by the authors. Licensee MDPI, Basel, Switzerland. This article is an open access article distributed under the terms and conditions of the Creative Commons Attribution (CC BY) license (https:// creativecommons.org/licenses/by/ 4.0/). 1 Department of Forest Engineering, Forest Management Planning and Terrestrial Measurements, Transilvania University of Brasov, 500123 Brasov, Romania; [email protected] 2 Department of Mechanical Engineering, Transilvania University of Brasov, B-dul Eroilor 29, 500360 Brasov, Romania 3 Russian Academy of Natural Sciences Sivtsev Vrazhek, 29/16, Moscow 119002, Russia 4 Institute of Research and Development for Technical Physics, B-dul Mangeron 47, 700050 Iasi, Romania; [email protected] * Correspondence: [email protected] Abstract: This paper deals with the acoustic and elastic properties of resonant wood, classified into four classes, according to the classification of wood quality by the manufacturers of musical instruments. Traditionally, the quality grades of resonant wood are determined on the basis of the visual inspections of the macroscopic characteristics of the wood (annual ring width, regularity, proportion of early and late wood, absence of defects, etc.). Therefore, in this research, we studied whether there are correlations between the acoustic and elastic properties and the anatomical char- acteristics of wood used for the construction of violins. The results regarding the identification of the anatomical properties of resonant spruce, the wood color, and the acoustic/elastic properties, determined by ultrasonic measurements, were statistically analyzed to highlight the connection between the determined properties. From the statistical analysis, it can be seen that the only variables with the power to separate the quality classes are (in descending order of importance) the speed of sound propagation in the radial direction, Poisson’s ratio in the longitudinal–radial direction, and the speed of propagation of sounds in the longitudinal direction. Keywords: anatomical patterns; resonant spruce; acoustic properties; elastic properties; Discriminant Function Analysis; Principal Components Analysis 1. Introduction Numerous studies concerning the acoustical behavior of violins refer to the similarities and differences in the tonal qualities, produced by good and bad, and old and new instru- ments, depending on various factors [1–4]. Wood with anatomical and acoustic properties used in the construction of stringed musical instruments is also known as resonant wood, tonewood, or music wood. The acoustical characteristics of wood species are criteria for the selection of the most appropriate raw material for making violins [4–6]. The behavior of wood in the acoustic field is conditioned by its elastic properties, which are characterized by the longitudinal modulus of elasticity, the shear modulus, and Poisson’s ratio, according to the three planes of the anisotropy of wood (longitudinal, radial, tangential). The size of these constants is critical in the selection of resonant wood. Numerous studies have shown the existence of close correlations between the physical properties of the resonant wood structure and the elastic ones [7–9]. In the past, luthiers did not have the knowledge and techniques necessary for deter- mining the acoustic and elastic properties of wood as they do today, with the recognition of resonant wood being based on the macroscopic analysis of the structure of softwood. Thus, the need for the material to have narrow and regular rings was established; the contribution Forests 2021, 12, 1122. https://doi.org/10.3390/f12081122 https://www.mdpi.com/journal/forests
-
Upload
khangminh22 -
Category
Documents
-
view
7 -
download
0
Transcript of Correlation between Anatomical Grading and Acoustic–Elastic ...

Article
Correlation between Anatomical Grading and Acoustic–ElasticProperties of Resonant Spruce Wood Used for MusicalInstruments
Florin Dinulică 1 , Mariana Domnica Stanciu 2,3,* and Adriana Savin 4
�����������������
Citation: Dinulica, F.; Stanciu, M.D.;
Savin, A. Correlation between
Anatomical Grading and
Acoustic–Elastic Properties of
Resonant Spruce Wood Used for
Musical Instruments. Forests 2021, 12,
1122. https://doi.org/10.3390/
f12081122
Academic Editors: Michele Brunetti,
Michela Nocetti and
Alexander Petutschnigg
Received: 22 July 2021
Accepted: 20 August 2021
Published: 22 August 2021
Publisher’s Note: MDPI stays neutral
with regard to jurisdictional claims in
published maps and institutional affil-
iations.
Copyright: © 2021 by the authors.
Licensee MDPI, Basel, Switzerland.
This article is an open access article
distributed under the terms and
conditions of the Creative Commons
Attribution (CC BY) license (https://
creativecommons.org/licenses/by/
4.0/).
1 Department of Forest Engineering, Forest Management Planning and Terrestrial Measurements, TransilvaniaUniversity of Brasov, 500123 Brasov, Romania; [email protected]
2 Department of Mechanical Engineering, Transilvania University of Brasov, B-dul Eroilor 29,500360 Brasov, Romania
3 Russian Academy of Natural Sciences Sivtsev Vrazhek, 29/16, Moscow 119002, Russia4 Institute of Research and Development for Technical Physics, B-dul Mangeron 47, 700050 Iasi, Romania;
[email protected]* Correspondence: [email protected]
Abstract: This paper deals with the acoustic and elastic properties of resonant wood, classifiedinto four classes, according to the classification of wood quality by the manufacturers of musicalinstruments. Traditionally, the quality grades of resonant wood are determined on the basis of thevisual inspections of the macroscopic characteristics of the wood (annual ring width, regularity,proportion of early and late wood, absence of defects, etc.). Therefore, in this research, we studiedwhether there are correlations between the acoustic and elastic properties and the anatomical char-acteristics of wood used for the construction of violins. The results regarding the identification ofthe anatomical properties of resonant spruce, the wood color, and the acoustic/elastic properties,determined by ultrasonic measurements, were statistically analyzed to highlight the connectionbetween the determined properties. From the statistical analysis, it can be seen that the only variableswith the power to separate the quality classes are (in descending order of importance) the speed ofsound propagation in the radial direction, Poisson’s ratio in the longitudinal–radial direction, andthe speed of propagation of sounds in the longitudinal direction.
Keywords: anatomical patterns; resonant spruce; acoustic properties; elastic properties; DiscriminantFunction Analysis; Principal Components Analysis
1. Introduction
Numerous studies concerning the acoustical behavior of violins refer to the similaritiesand differences in the tonal qualities, produced by good and bad, and old and new instru-ments, depending on various factors [1–4]. Wood with anatomical and acoustic propertiesused in the construction of stringed musical instruments is also known as resonant wood,tonewood, or music wood. The acoustical characteristics of wood species are criteria forthe selection of the most appropriate raw material for making violins [4–6]. The behavior ofwood in the acoustic field is conditioned by its elastic properties, which are characterizedby the longitudinal modulus of elasticity, the shear modulus, and Poisson’s ratio, accordingto the three planes of the anisotropy of wood (longitudinal, radial, tangential). The size ofthese constants is critical in the selection of resonant wood. Numerous studies have shownthe existence of close correlations between the physical properties of the resonant woodstructure and the elastic ones [7–9].
In the past, luthiers did not have the knowledge and techniques necessary for deter-mining the acoustic and elastic properties of wood as they do today, with the recognition ofresonant wood being based on the macroscopic analysis of the structure of softwood. Thus,the need for the material to have narrow and regular rings was established; the contribution
Forests 2021, 12, 1122. https://doi.org/10.3390/f12081122 https://www.mdpi.com/journal/forests

Forests 2021, 12, 1122 2 of 18
of a few late wood to this is modest [10–13]. The relevance of the annual ring structure asan acoustic marker remains debatable. Some have opined that the vibrational properties ofwood are determined on the scale of the cell wall rather than on the macroscopic scale ofthe growth rings [12–14]. In the stringed instruments industry, musical instruments areclassified according to the anatomical quality of the wood used in their construction, withthis aspect being revealed in the final price of the instrument [15–17]. The classification ofquality raw materials for the manufacture of stringed instruments is discussed in detailelsewhere [16–18]. Resonant wood is divided into four quality grades: A, high anatomicalquality; B, average quality; C, low anatomical quality; D, common wood, without defects.The main anatomical parameters of resonant wood are the total ring width, the proportionof late wood within the annual ring, the width difference between two consecutive growthrings, and the regularity of the ring widths. The longitudinal and transverse propagationspeeds in the wood, in the three directions, and the elastic characteristics, complete theicon of resonant wood [18–20]. Knowing this, as well as the density of the wood, one canestimate a number of acoustic parameters of resonant wood [17–21]. Wegst, 2006, noted thatthe Young and shear moduli parallel and perpendicular to the wood fibers are importantparameters for musical plate vibration in the structure of chordophone instruments [20].Therefore, the static and dynamic moduli of tonewood related to anatomical parametersinfluence the acoustic quality of wood. The vibration of flat orthotropic plates, such asviolin plates, involves the flexural plate modes, which are two-dimensional, while thefrequency depends on several elastic parameters of anisotropic media, as noted by [21–23].In regard to the orthotropic anisotropy of wood, the following ratios should be takeninto consideration: the ratio of Young’s moduli EL/ER:EL/ET; the ratio of shear moduliGLR/GRT:GLT/GRT; and Poisson’s ratios [20–24], where L, R, and T are the main directionsin wood (L, longitudinal (along fibers); R, radial; and T, tangential) and LR, RT, and LT arethe planes formed according to the main directions, as can be seen in Figure 1b. In additionto the values for the elastic and physical properties, research has shown that the value ofthe specific modulus in the radial direction (ER/ρ; GLR/ρ) [25].
Forests 2021, 12, x FOR PEER REVIEW 3 of 18
2. Materials and Methods
2.1. Materials
The samples of Norway spruce (Picea Abies L. Karst)), 40 mm in size and oriented
towards the symmetry planes, were delivered by Gliga Musical Instruments, Reghin, Ro-
mania (https://gliga.ro/ (accessed on 20 January 2021)). The samples were cut from the
same batch of tonewood raw material from which the violin boards were cut. The raw
material had been sorted since the primary cutting of the spruce logs according to the
quality class of the violins, taking into account the anatomical characteristics of the spruce
wood (Figure 1a). Before entering the violin manufacturing flow, the wooden parts were
dried naturally for at least 3 years (for school violins) and up to 10 years for maestro vio-
lins. From the stage of the radial cutting of the logs, the semi-finished products were se-
lected according to their quality class, paired for future violin boards, and stored for nat-
ural drying [11–14]. To measure the acoustic properties in the three main directions of the
wood, the samples were accurately cut perpendicular to the principal direction (longitu-
dinal L, radial R, tangential T) along which the ultrasonic waves propagate (Figure 1b).
This is a mandatory requirement when determining acoustic parameters using the ultra-
sound method. Being extracted from the semi-finished products prepared for the entry on
the technological flow of the violins, the moisture content of the wood was checked and
found to be around 6–8%. Being a high quality wood and carefully selected from the pri-
mary processing phase, the number of samples analyzed was relatively small compared
to the number of samples used for other determinations. The physical characteristics of
the resonant spruce samples are portrayed in Table 1.
(a) (b)
Figure 1. Types of samples analyzed: (a) correspondence between the quality class of the wood depending on the anatom-
ical characteristics and the quality classes of the violins; (b) the main sections of wood (L: longitudinal; R: radial; T: tan-
gential).
Table 1. The physical features of the spruce wood samples.
Physical Features Grade/Average Value/STDV
A STDV B STDV C STDV D STDV
Longitudinal 40.508 0.187 40.304 0.706 40.116 0.120 39.957 0.157
Radial 40.326 0.137 40.291 0.159 40.136 0.099 40.259 0.112
Figure 1. Types of samples analyzed: (a) correspondence between the quality class of the wood depending on the anatomicalcharacteristics and the quality classes of the violins; (b) the main sections of wood (L: longitudinal; R: radial; T: tangential).

Forests 2021, 12, 1122 3 of 18
In previous research, the propagation of waves in isotropic and anisotropic materialsand the determination of the elastic properties of wood have been widely discussed.However, the data concerning the resonant spruce in the Carpathian Mountains is poor,although some of the largest factories in southeastern Europe in terms of the production ofstringed instruments are located in Romania. The novelty of the study lies in its analysis ofthe sensitivity of the acoustic and elastic properties of wood according to the anatomicalclassification of the resonant wood harvested from the Carpathian Mountains, unlikeother studies that have targeted resonant wood from other forest basins without makingrigorous distinctions between the anatomical quality classes used by manufacturers. Thestatistical correlations between the anatomical features of wood and the elastic and acousticproperties of spruce provide rich information about the weights of predictive variables, thegroup membership, and if the groups differ with regard to the mean of a variable. Unlikethe data from the literature, in this study, the acoustic and elastic properties of spruce woodwere determined for all three main directions, meaning that a complete characterization ofthe resonant wood can be made from an elastic and acoustic point of view.
The aim of this paper was to identify the acoustic properties of the material that bestdepict the quality classes defined by anatomical criteria within the resonant spruce. For thispurpose, the structure of the annual rings was introduced in digital format and statisticallycorrelated with the following acoustic parameters determined by ultrasonic means: soundvelocity in resonant spruce, Young’s moduli, shear moduli, and Poisson coefficients.
2. Materials and Methods2.1. Materials
The samples of Norway spruce (Picea abies L. Karst)), 40 mm in size and orientedtowards the symmetry planes, were delivered by Gliga Musical Instruments, Reghin,Romania (https://gliga.ro/ (accessed on 20 January 2021)). The samples were cut fromthe same batch of tonewood raw material from which the violin boards were cut. Theraw material had been sorted since the primary cutting of the spruce logs according to thequality class of the violins, taking into account the anatomical characteristics of the sprucewood (Figure 1a). Before entering the violin manufacturing flow, the wooden parts weredried naturally for at least 3 years (for school violins) and up to 10 years for maestro violins.From the stage of the radial cutting of the logs, the semi-finished products were selectedaccording to their quality class, paired for future violin boards, and stored for naturaldrying [11–14]. To measure the acoustic properties in the three main directions of the wood,the samples were accurately cut perpendicular to the principal direction (longitudinal L,radial R, tangential T) along which the ultrasonic waves propagate (Figure 1b). This isa mandatory requirement when determining acoustic parameters using the ultrasoundmethod. Being extracted from the semi-finished products prepared for the entry on thetechnological flow of the violins, the moisture content of the wood was checked and foundto be around 6–8%. Being a high quality wood and carefully selected from the primaryprocessing phase, the number of samples analyzed was relatively small compared to thenumber of samples used for other determinations. The physical characteristics of theresonant spruce samples are portrayed in Table 1.
Forests 2021, 12, 1122 4 of 18
Table 1. The physical features of the spruce wood samples.
Physical FeaturesGrade/Average Value/STDV
A STDV B STDV C STDV D STDV
The sizes (mm)Longitudinal 40.508 0.187 40.304 0.706 40.116 0.120 39.957 0.157
Radial 40.326 0.137 40.291 0.159 40.136 0.099 40.259 0.112Tangential 40.324 0.110 40.020 0.091 40.126 0.135 40.146 0.116Mass (g) 28.85 1.817 24.760 0.554 28.831 1.359 25.44 0.635
Density ρ (kg/m3) 438 2.035 381 4.291 446 8.695 394 3.663No. of annualrings/sample 56 0.158 29 0.223 23 0.374 14 0.347
2.2. Methods2.2.1. Wood Anatomical Data Acquisition
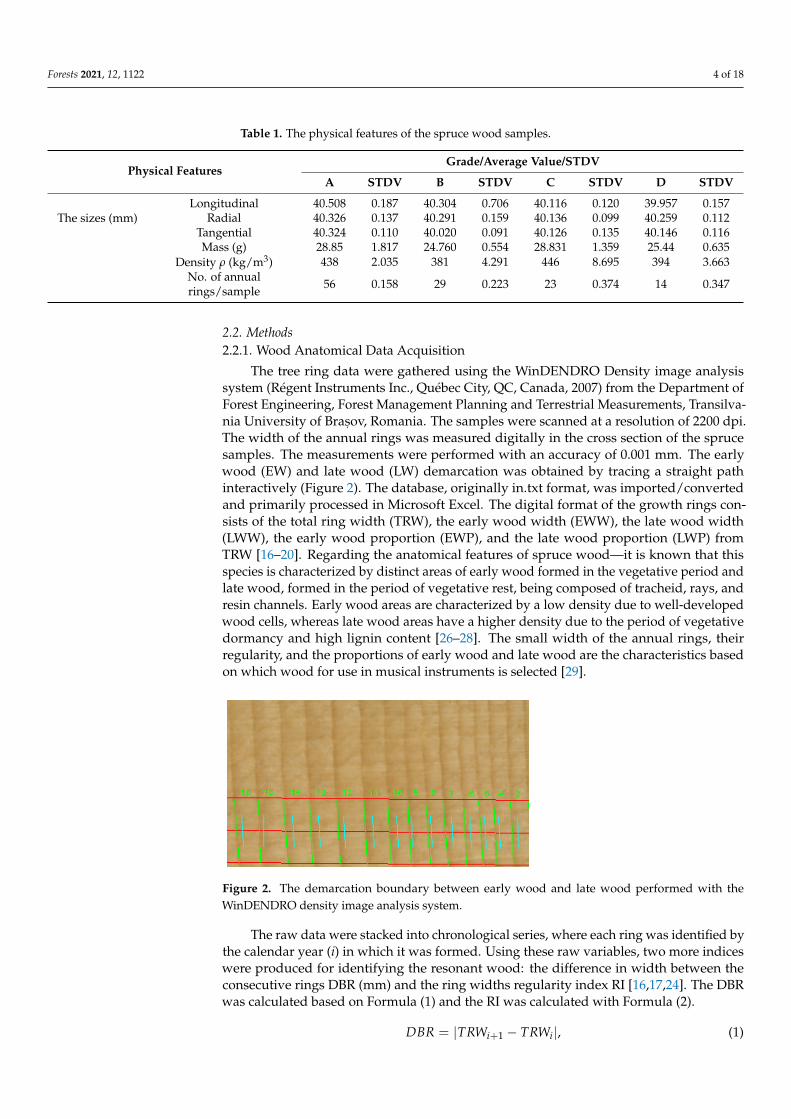
The tree ring data were gathered using the WinDENDRO Density image analysissystem (Régent Instruments Inc., Québec City, QC, Canada, 2007) from the Department ofForest Engineering, Forest Management Planning and Terrestrial Measurements, Transilva-nia University of Bras, ov, Romania. The samples were scanned at a resolution of 2200 dpi.The width of the annual rings was measured digitally in the cross section of the sprucesamples. The measurements were performed with an accuracy of 0.001 mm. The earlywood (EW) and late wood (LW) demarcation was obtained by tracing a straight pathinteractively (Figure 2). The database, originally in.txt format, was imported/convertedand primarily processed in Microsoft Excel. The digital format of the growth rings con-sists of the total ring width (TRW), the early wood width (EWW), the late wood width(LWW), the early wood proportion (EWP), and the late wood proportion (LWP) fromTRW [16–20]. Regarding the anatomical features of spruce wood—it is known that thisspecies is characterized by distinct areas of early wood formed in the vegetative period andlate wood, formed in the period of vegetative rest, being composed of tracheid, rays, andresin channels. Early wood areas are characterized by a low density due to well-developedwood cells, whereas late wood areas have a higher density due to the period of vegetativedormancy and high lignin content [26–28]. The small width of the annual rings, theirregularity, and the proportions of early wood and late wood are the characteristics basedon which wood for use in musical instruments is selected [29].
Forests 2021, 12, x FOR PEER REVIEW 4 of 18
The sizes (mm)
Radial 40.326 0.137 40.291 0.159 40.136 0.099 40.259 0.112
Tangential 40.324 0.110 40.020 0.091 40.126 0.135 40.146 0.116
Mass (g) 28.85 1.817 24.760 0.554 28.831 1.359 25.44 0.635 Density ρ (kg/m3) 438 2.035 381 4.291 446 8.695 394 3.663
No. of annual rings/sample
56 0.158 29 0.223 23 0.374 14 0.347
2.2. Methods 2.2.1. Wood Anatomical Data Acquisition
The tree ring data were gathered using the WinDENDRO Density image analysis system (Régent Instruments Inc., Québec City, QC, Canada, 2007) from the Department of Forest Engineering, Forest Management Planning and Terrestrial Measurements, Transilvania University of Brașov, Romania. The samples were scanned at a resolution of 2200 dpi. The width of the annual rings was measured digitally in the cross section of the spruce samples. The measurements were performed with an accuracy of 0.001 mm. The early wood (EW) and late wood (LW) demarcation was obtained by tracing a straight path interactively (Figure 2). The database, originally in.txt format, was imported/converted and primarily processed in Microsoft Excel. The digital format of the growth rings consists of the total ring width (TRW), the early wood width (EWW), the late wood width (LWW), the early wood proportion (EWP), and the late wood proportion (LWP) from TRW [16,17,18,19,20]. Regarding the anatomical features of spruce wood—it is known that this species is characterized by distinct areas of early wood formed in the vegetative period and late wood, formed in the period of vegetative rest, being composed of tracheid, rays, and resin channels. Early wood areas are characterized by a low density due to well-developed wood cells, whereas late wood areas have a higher density due to the period of vegetative dormancy and high lignin content [26,27,28]. The small width of the annual rings, their regularity, and the proportions of early wood and late wood are the characteristics based on which wood for use in musical instruments is selected [29].
Figure 2. The demarcation boundary between early wood and late wood performed with the WinDENDRO density image analysis system.
The raw data were stacked into chronological series, where each ring was identified by the calendar year (i) in which it was formed. Using these raw variables, two more indices were produced for identifying the resonant wood: the difference in width between the consecutive rings DBR (mm) and the ring widths regularity index RI [16,17,24]. The DBR was calculated based on Formula (1) and the RI was calculated with Formula (2). = | − |, (1) = ( ) ( )( ) , = 1 … , (2)
where n is the number of rings that make up the time series.
Figure 2. The demarcation boundary between early wood and late wood performed with theWinDENDRO density image analysis system.
The raw data were stacked into chronological series, where each ring was identified bythe calendar year (i) in which it was formed. Using these raw variables, two more indiceswere produced for identifying the resonant wood: the difference in width between theconsecutive rings DBR (mm) and the ring widths regularity index RI [16,17,24]. The DBRwas calculated based on Formula (1) and the RI was calculated with Formula (2).
DBR = |TRWi+1 − TRWi|, (1)

Forests 2021, 12, 1122 5 of 18
RI =max(TRWi)−min(TRWi)
max(TRWi), i = 1 . . . n , (2)
where n is the number of rings that make up the time series.Out of the different ways of expressing the regularity of the annual rings [11–13],
the calculation method that best reflected the anatomic quality of the resonant wood waschosen. This method renders regularity as a ratio between the amplitude of variation(maximum value–minimum value) and the maximum value, a method of expression thatis also used by [16].
2.2.2. Color Measurements of Wood Samples
The purpose of the wood color measurements was to check for correlations betweenwood color and acoustic/elastic properties for each resonant wood quality class. Thecolor measurements were performed on longitudinal radial sections of samples, due tothe utilization in violin plates. It is known that the wood color is affected by the physicalfeatures, as the angle of the light falling on the fibers and surface roughness [16–20]. Inthis sense, due to the wood grading for the manufacture of musical instruments, in A, B,C, and D groups, the color measurements of wood, in terms of the color brightness orwhiteness (L*, %), the color redness/greenness (a*) and the color yellowness/blueness(b*) were performed using the Chroma Meter CR-400 (Konica Minolta, Tokyo, Japan)device [16,24,25].
2.2.3. Ultrasound Screening of Resonant Spruce Samples
Basically, ultrasound (US) nondestructive evaluation consists of applying physicalelastic waves to the sample tested (1) and analyzing the interaction between the materialsamples and the field [26,29,30] (Figure 3a). To increase the reliability and assure thequality of the measurement, ultrafine force presses the US sensors (2) with a constantvalue. The two buffer rods of US sensors used in emission and reception are both iden-tical, (2a, 2b) being made of the 7075-T6 aluminum–magnesium alloy with the densityof 2.7 × 10³ kg/m3, the Young’s modulus of 7 × 10¹⁰ N/m2, the Poisson coefficient of0.34, and a point curvature radius of 2 mm. The US sensors were connected to a 5073PR Pulse Receiver–Panametrics equipment (3, 4). The visualization of the signal and themeasurement of the time of propagation were carried out with the LeCroy Wave Runner64Xi digital oscilloscope (5) with a sampling frequency of 10 G S/s. The samples (1) weremarked to identify the position of the US transducer center of the measurement pointscorresponding to two opposite faces (Figure 3) and to plot the map of the US velocitydistribution on each pair of inspected faces [31–34]. Ultrasonic measurement was per-formed on an 8 × 8 mm2 grid at the intersection points of the grid to include as manyannual growth rings as possible in order to increase the accuracy of the determinations.The total sum of the measurement points for each section amounted to 10 measurements.No measurements were made in the areas outside the grid (towards the edge) so as not tointroduce measurement errors. The tests were carried out on 6 samples from each qualityclass, resulting in a total of 24 specimens and a total of 720 ultrasound measurements(60 per each sections from each quality class). The measurements were performed at atemperature of 24 ◦C and a humidity of 65%.

Forests 2021, 12, 1122 6 of 18Forests 2021, 12, x FOR PEER REVIEW 6 of 18
(a) (b)
Figure 3. Experimental set-up. (a) The principles of ultrasound measurements. Legend: 1, sample; 2, US sensors (emis-
sion/reception transducers); 3, Pulse Receiver–Panametrics equipment; 4, conditioner; 5, digital oscilloscope. (b) Ultrasonic
velocity in wood [12,13].
The theoretical considerations of propagation wave in orthotropic solids as wood are
based on generalized Hook’s law, which describes the proportionality between the stress
tensor and the strain deformation tensor (see relation 3) (Figure 3b).
𝜎𝑖𝑗 = 𝐶𝑖𝑗𝑘𝑙 ∗ 휀𝑘𝑙, (3)
where [𝜎𝑖𝑗] is the stress tensor acting in direction i with its normal in direction j; [𝐶𝑖𝑗𝑘𝑙]
is the elasticity tensor; [휀𝑘𝑙] is the strain tensor of small deformation [12,13,35]. If the Kel-
vin–Christoffel tensor is introduced, we can write the relation between the elasticity ten-
sor 𝐶𝑖𝑗𝑘𝑙 and the propagation vectors of ultrasound waves as 𝑛𝑗 , 𝑛𝑙 [12,13]:
𝑖𝑘 = 𝐶𝑖𝑗𝑘𝑙 ∗ 𝑛𝑗 ∗ 𝑛𝑙 , (4)
and
(𝑖𝑘
− 𝛿𝑖𝑘 ∗ 𝜌 ∗ 𝑣𝑝ℎ𝑎𝑠𝑒2 )𝑃𝑚 = 0, (5)
where 𝛿𝑖𝑘 is Kronecker tensor (if 𝑖 = 𝑘, then 𝛿𝑖𝑘 = 1 and if 𝑖 ≠ 𝑘, then 𝛿𝑖𝑘 = 0); 𝑃𝑚 is
the component of the unit vector in the direction of displacement (polarization); 𝜌 is the–
density; 𝑣𝑝ℎ𝑎𝑠𝑒2 is the phase velocity [12,13]. The eigenvalues and the eigenvectors of the
Christoffel equation can be written as a cubic polynomial in phase velocity squared (6)
[12,13]:
[
𝐿𝐿 − 𝜌𝑉2 𝐿𝑅 𝐿𝑇
𝑅𝐿 𝑅𝑅 − 𝜌𝑉2 𝑅𝑇
𝑇𝐿 𝑇𝑅 𝑇𝑇 − 𝜌𝑉2
] [
𝑝𝐿
𝑝𝑅
𝑝𝑇
] = 0, (6)
For unique solutions, the condition of Equation (6) is [𝑃𝑚] = 0, then we obtain (7):
[
𝐿𝐿 − 𝜌𝑉2 𝐿𝑅 𝐿𝑇
𝑅𝐿 𝑅𝑅 − 𝜌𝑉2 𝑅𝑇
𝑇𝐿 𝑇𝑅 𝑇𝑇 − 𝜌𝑉2
] = 0. (7)
If we assume that the wood is an orthotropic material, then for wave propagation
along the symmetry axes (L, R, T) Equation (7) becomes (8) [12,13]:
[
𝐿𝐿 − 𝜌𝑉2 0 0
0 𝑅𝑅 − 𝜌𝑉2 0
0 0 𝑇𝑇 − 𝜌𝑉2
] = 0. (8)
Figure 3. Experimental set-up. (a) The principles of ultrasound measurements. Legend: 1, sample; 2, US sensors (emis-sion/reception transducers); 3, Pulse Receiver–Panametrics equipment; 4, conditioner; 5, digital oscilloscope. (b) Ultrasonicvelocity in wood.
The theoretical considerations of propagation wave in orthotropic solids as wood arebased on generalized Hook’s law, which describes the proportionality between the stresstensor and the strain deformation tensor (see relation 3) (Figure 3b).
σij = Cijkl ∗ εkl , (3)
where[σij]
is the stress tensor acting in direction i with its normal in direction j; [Cijkl ] isthe elasticity tensor; [εkl ] is the strain tensor of small deformation [12,13,35]. If the Kelvin–Christoffel tensor Γ is introduced, we can write the relation between the elasticity tensorCijkl and the propagation vectors of ultrasound waves as nj, nl [12,13]:
Γik = Cijkl ∗ nj ∗ nl , (4)
and(Γik − δik ∗ ρ ∗ v2
phase)Pm = 0, (5)
where δik is Kronecker tensor (if i = k, then δik = 1 and if i 6= k, then δik = 0); Pmis the component of the unit vector in the direction of displacement (polarization); ρ isthe–density; v2
phase is the phase velocity [12,13]. The eigenvalues and the eigenvectors ofthe Christoffel equation can be written as a cubic polynomial in phase velocity squared(6) [12,13]: ΓLL − ρV2 ΓLR ΓLT
ΓRL ΓRR − ρV2 ΓRTΓTL ΓTR ΓTT − ρV2
pLpRpT
= 0, (6)
For unique solutions, the condition of Equation (6) is [Pm] = 0, then we obtain (7): ΓLL − ρV2 ΓLR ΓLTΓRL ΓRR − ρV2 ΓRTΓTL ΓTR ΓTT − ρV2
= 0. (7)
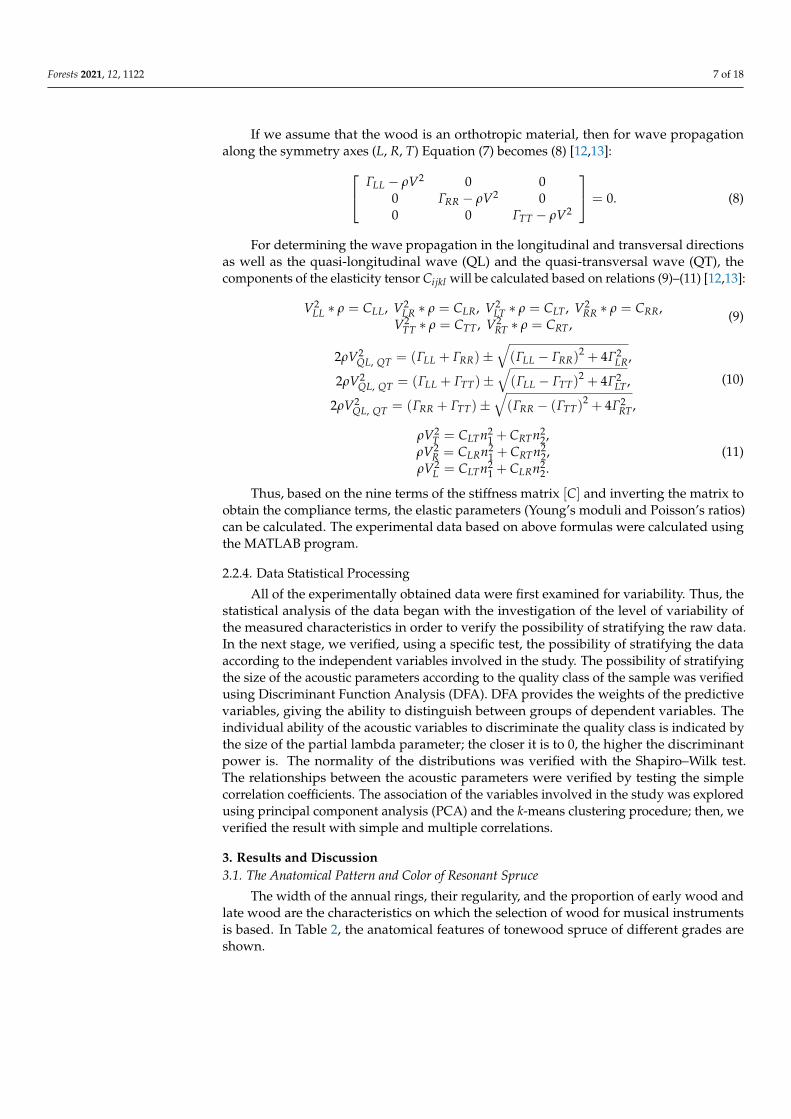
Forests 2021, 12, 1122 7 of 18
If we assume that the wood is an orthotropic material, then for wave propagationalong the symmetry axes (L, R, T) Equation (7) becomes (8) [12,13]: ΓLL − ρV2 0 0
0 ΓRR − ρV2 00 0 ΓTT − ρV2
= 0. (8)
For determining the wave propagation in the longitudinal and transversal directionsas well as the quasi-longitudinal wave (QL) and the quasi-transversal wave (QT), thecomponents of the elasticity tensor Cijkl will be calculated based on relations (9)–(11) [12,13]:
V2LL ∗ ρ = CLL, V2
LR ∗ ρ = CLR, V2LT ∗ ρ = CLT , V2
RR ∗ ρ = CRR,V2
TT ∗ ρ = CTT , V2RT ∗ ρ = CRT ,
(9)
2ρV2QL, QT = (ΓLL + ΓRR)±
√(ΓLL − ΓRR)
2 + 4Γ2LR,
2ρV2QL, QT = (ΓLL + ΓTT)±
√(ΓLL − ΓTT)
2 + 4Γ2LT ,
2ρV2QL, QT = (ΓRR + ΓTT)±
√(ΓRR − (ΓTT)
2 + 4Γ2RT ,
(10)
ρV2T = CLTn2
1 + CRTn22,
ρV2R = CLRn2
1 + CRTn22,
ρV2L = CLTn2
1 + CLRn22.
(11)
Thus, based on the nine terms of the stiffness matrix [C] and inverting the matrix toobtain the compliance terms, the elastic parameters (Young’s moduli and Poisson’s ratios)can be calculated. The experimental data based on above formulas were calculated usingthe MATLAB program.
2.2.4. Data Statistical Processing
All of the experimentally obtained data were first examined for variability. Thus, thestatistical analysis of the data began with the investigation of the level of variability ofthe measured characteristics in order to verify the possibility of stratifying the raw data.In the next stage, we verified, using a specific test, the possibility of stratifying the dataaccording to the independent variables involved in the study. The possibility of stratifyingthe size of the acoustic parameters according to the quality class of the sample was verifiedusing Discriminant Function Analysis (DFA). DFA provides the weights of the predictivevariables, giving the ability to distinguish between groups of dependent variables. Theindividual ability of the acoustic variables to discriminate the quality class is indicated bythe size of the partial lambda parameter; the closer it is to 0, the higher the discriminantpower is. The normality of the distributions was verified with the Shapiro–Wilk test.The relationships between the acoustic parameters were verified by testing the simplecorrelation coefficients. The association of the variables involved in the study was exploredusing principal component analysis (PCA) and the k-means clustering procedure; then, weverified the result with simple and multiple correlations.
3. Results and Discussion3.1. The Anatomical Pattern and Color of Resonant Spruce
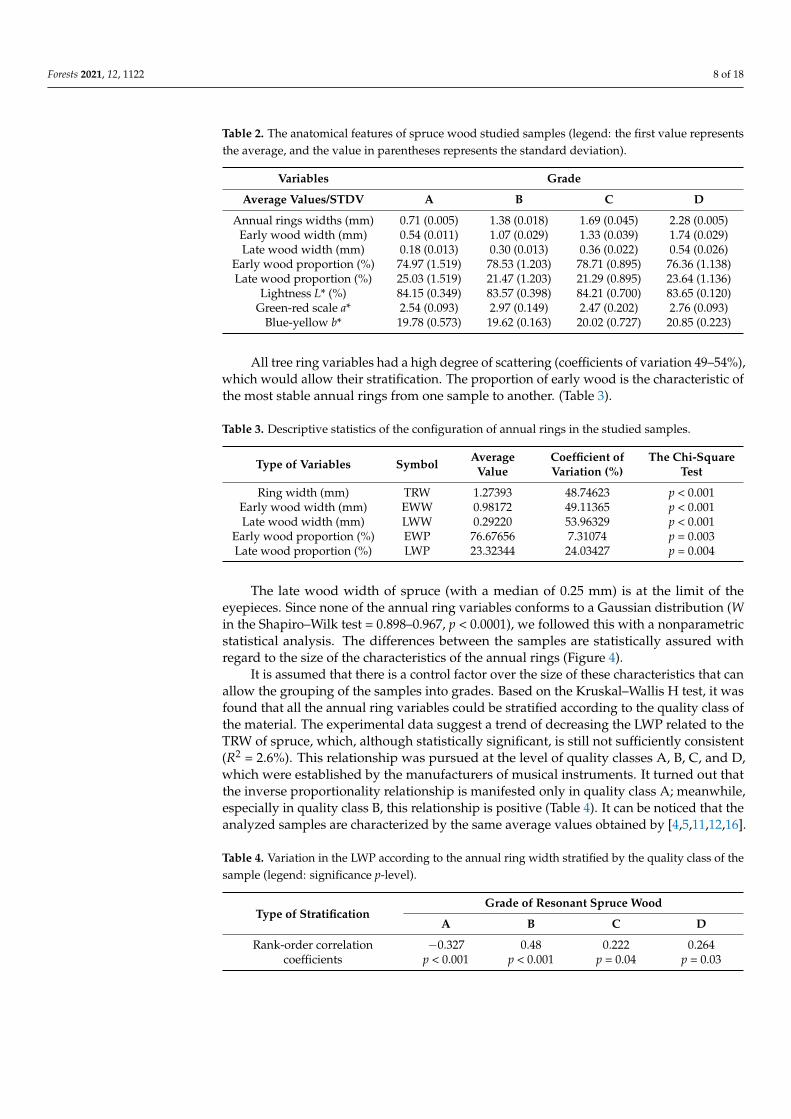
The width of the annual rings, their regularity, and the proportion of early wood andlate wood are the characteristics on which the selection of wood for musical instrumentsis based. In Table 2, the anatomical features of tonewood spruce of different grades areshown.
Forests 2021, 12, 1122 8 of 18
Table 2. The anatomical features of spruce wood studied samples (legend: the first value representsthe average, and the value in parentheses represents the standard deviation).
Variables Grade
Average Values/STDV A B C D
Annual rings widths (mm) 0.71 (0.005) 1.38 (0.018) 1.69 (0.045) 2.28 (0.005)Early wood width (mm) 0.54 (0.011) 1.07 (0.029) 1.33 (0.039) 1.74 (0.029)Late wood width (mm) 0.18 (0.013) 0.30 (0.013) 0.36 (0.022) 0.54 (0.026)
Early wood proportion (%) 74.97 (1.519) 78.53 (1.203) 78.71 (0.895) 76.36 (1.138)Late wood proportion (%) 25.03 (1.519) 21.47 (1.203) 21.29 (0.895) 23.64 (1.136)
Lightness L* (%) 84.15 (0.349) 83.57 (0.398) 84.21 (0.700) 83.65 (0.120)Green-red scale a* 2.54 (0.093) 2.97 (0.149) 2.47 (0.202) 2.76 (0.093)
Blue-yellow b* 19.78 (0.573) 19.62 (0.163) 20.02 (0.727) 20.85 (0.223)
All tree ring variables had a high degree of scattering (coefficients of variation 49–54%),which would allow their stratification. The proportion of early wood is the characteristic ofthe most stable annual rings from one sample to another. (Table 3).
Table 3. Descriptive statistics of the configuration of annual rings in the studied samples.
Type of Variables Symbol AverageValue
Coefficient ofVariation (%)
The Chi-SquareTest
Ring width (mm) TRW 1.27393 48.74623 p < 0.001Early wood width (mm) EWW 0.98172 49.11365 p < 0.001Late wood width (mm) LWW 0.29220 53.96329 p < 0.001
Early wood proportion (%) EWP 76.67656 7.31074 p = 0.003Late wood proportion (%) LWP 23.32344 24.03427 p = 0.004
The late wood width of spruce (with a median of 0.25 mm) is at the limit of theeyepieces. Since none of the annual ring variables conforms to a Gaussian distribution (Win the Shapiro–Wilk test = 0.898–0.967, p < 0.0001), we followed this with a nonparametricstatistical analysis. The differences between the samples are statistically assured withregard to the size of the characteristics of the annual rings (Figure 4).
It is assumed that there is a control factor over the size of these characteristics that canallow the grouping of the samples into grades. Based on the Kruskal–Wallis H test, it wasfound that all the annual ring variables could be stratified according to the quality class ofthe material. The experimental data suggest a trend of decreasing the LWP related to theTRW of spruce, which, although statistically significant, is still not sufficiently consistent(R2 = 2.6%). This relationship was pursued at the level of quality classes A, B, C, and D,which were established by the manufacturers of musical instruments. It turned out thatthe inverse proportionality relationship is manifested only in quality class A; meanwhile,especially in quality class B, this relationship is positive (Table 4). It can be noticed that theanalyzed samples are characterized by the same average values obtained by [4,5,11,12,16].
Table 4. Variation in the LWP according to the annual ring width stratified by the quality class of thesample (legend: significance p-level).
Type of StratificationGrade of Resonant Spruce Wood
A B C D
Rank-order correlationcoefficients
−0.327p < 0.001
0.48p < 0.001
0.222p = 0.04
0.264p = 0.03

Forests 2021, 12, 1122 9 of 18
Forests 2021, 12, x FOR PEER REVIEW 9 of 18
The correlations between the anatomical features and the qualitative classification of
resonant spruce are shown in Figure 4. The tonewood density can also be stratified ac-
cording to the quality class of the sample. The spruce wood from quality classes A and C
is heavier by about 60 kg/m3 than wood from classes B and D (Figure 5).
(a) (b)
(c) (d)
Figure 4. Variation in the anatomical parameters according to the wood grade: (a) the early wood width EWT; (b) the late
wood width LWT; (c) the early wood proportion EWP; (d) the late wood proportion LWP.
Figure 5. The stratification of the density of spruce wood according to the specimen grade.
Figure 4. Variation in the anatomical parameters according to the wood grade: (a) the early wood width EWT; (b) the latewood width LWT; (c) the early wood proportion EWP; (d) the late wood proportion LWP.
The correlations between the anatomical features and the qualitative classificationof resonant spruce are shown in Figure 4. The tonewood density can also be stratifiedaccording to the quality class of the sample. The spruce wood from quality classes A and Cis heavier by about 60 kg/m3 than wood from classes B and D (Figure 5).
Forests 2021, 12, x FOR PEER REVIEW 9 of 18
The correlations between the anatomical features and the qualitative classification of
resonant spruce are shown in Figure 4. The tonewood density can also be stratified ac-
cording to the quality class of the sample. The spruce wood from quality classes A and C
is heavier by about 60 kg/m3 than wood from classes B and D (Figure 5).
(a) (b)
(c) (d)
Figure 4. Variation in the anatomical parameters according to the wood grade: (a) the early wood width EWT; (b) the late
wood width LWT; (c) the early wood proportion EWP; (d) the late wood proportion LWP.
Figure 5. The stratification of the density of spruce wood according to the specimen grade. Figure 5. The stratification of the density of spruce wood according to the specimen grade.

Forests 2021, 12, 1122 10 of 18
Despite the differences in the anatomical patterns of the annual rings of spruce, thecolor of the wood, especially the brightness (degree of white, L*), had an unexpectedly lowlevel of variability in the spruce samples examined. The distributions had different shapesfrom one color variable to another, with only the yellowness b* being distributed accordingto the normal law, as can be seen in Figure 6.
Forests 2021, 12, x FOR PEER REVIEW 10 of 18
Despite the differences in the anatomical patterns of the annual rings of spruce, the
color of the wood, especially the brightness (degree of white, L*), had an unexpectedly
low level of variability in the spruce samples examined. The distributions had different
shapes from one color variable to another, with only the yellowness b* being distributed
according to the normal law, as can be seen in Figure 6.
(a) (b)
(c) (d)
Figure 6. Distribution of the color components for resonant wood: (a) color brightness; (b) color redness; (c) color yellow-
ness; (d) color spectrum of spruce samples measured, according to quality class.
The differences between the samples are ensured statistically at a significant level.
Brightness L* and redness a* are moderate significant, while yellowness b* is very signifi-
cant, for fact for which the data were stratified according to the quality class. The bright-
ness is a multimodal distributed and negatively skewed variable (Figure 6a). These modes
suggest the color segregation in the examined samples. The redness is an exponentially
decayed distributed variable; the mode is in the first class of values (2.3–2.5). Most values
are concentrated towards the lower limit of the range of variation (Figure 6b). The size of
the yellowness is a Gaussian variable, with the mode in the range of 19.4–19.9 (Figure 6c).
In Figure 6d, the distribution of wood color according to quality class can be observed.
Thus, the color of the spruce wood is distributed according to the quality class of the sam-
ples. However, the color differences between the quality classes are not so strong as to be
perceptible by the human optical analyzer [16,18,25]. Spruce wood of A grade has a higher
brightness than that of other grades and a lower degree of redness and yellowness. Addi-
tionally, for A wood grade, color variables have the smallest amplitudes of variation (Fig-
ure 6d). In the case of spruce wood from classes B and D, the content of redness is higher;
Figure 6. Distribution of the color components for resonant wood: (a) color brightness; (b) color redness; (c) color yellowness;(d) color spectrum of spruce samples measured, according to quality class.
The differences between the samples are ensured statistically at a significant level.Brightness L* and redness a* are moderate significant, while yellowness b* is very significant,for fact for which the data were stratified according to the quality class. The brightnessis a multimodal distributed and negatively skewed variable (Figure 6a). These modessuggest the color segregation in the examined samples. The redness is an exponentiallydecayed distributed variable; the mode is in the first class of values (2.3–2.5). Most valuesare concentrated towards the lower limit of the range of variation (Figure 6b). The size ofthe yellowness is a Gaussian variable, with the mode in the range of 19.4–19.9 (Figure 6c).In Figure 6d, the distribution of wood color according to quality class can be observed.Thus, the color of the spruce wood is distributed according to the quality class of thesamples. However, the color differences between the quality classes are not so strong asto be perceptible by the human optical analyzer [16,18,25]. Spruce wood of A grade has ahigher brightness than that of other grades and a lower degree of redness and yellowness.Additionally, for A wood grade, color variables have the smallest amplitudes of variation(Figure 6d). In the case of spruce wood from classes B and D, the content of redness is

Forests 2021, 12, 1122 11 of 18
higher; for class D, the highest content of wood that is yellow in color is observed. Woodgrade C has the lowest redness content.
3.2. Acoustic and Elastic Parameters of Resonant Spruce3.2.1. Discriminant Function Analysis (DFA)
In general, when studying the acoustic/vibrational properties of wood used in theconstruction of musical instruments, the most important quantities to be determined arethe density, the speed of sound propagation in wood (most references report the valuesfor the longitudinal propagation speed), and the module of longitudinal elasticity in thelongitudinal and radial directions, as these quantities are the bases of the other acousticquantities (acoustic radiation, acoustic impedance, acoustic radiation ratio, etc.). The resultsregarding the acoustic and elastic properties of tonewood are presented in Table 5. It canbe noticed that the ratios of acoustic velocities (for A grade) are in good agreement withthose found in other studies, such as [12–15,21–24,35–40]. For resonant spruce, Bucur,2006 [15], obtained the ratios: VLL/VRR = 2.8, VLL/VTT = 3.5 and VRR/VTT = 0.8. Fromthe experimental data, it can be noticed that a higher anisotropy was recorded for A andB grades. Related to the specific longitudinal modulus of elasticity, Carlier et al., 2014,2018 [22,23], reported a wide range of density ρ (0.32 to 0.55 g/cm3), a specific modulus ofelasticity in the longitudinal direction EL/ρ of 18 to 35 GPa, a longitudinal damping factortan δL of 0.006 to 0.100, a ring width Rw of 0.77 to 2.52 mm, and a late wood percentageLw % of 13 to 26%. This data is similar to those presented in Table 5. Additionally, there isa tendency to decrease the value of the specific module in relation to the decrease in thequality class with the increase in the width of the annual rings. In the radial direction, Vialaet al., 2020 [21], found that the values of the specific elastic modulus vary between 1.46 and2.78 GPag−1 cm3 compared to the values obtained in current study, which vary between2.43 and 2.98 GPag−1 cm3 (Table 4). Additionally, in the longitudinal radial section thevalues of the specific shear modulus range from 1.86 to 2.51 GPag−1 cm3 and are very closeto those reported by [21–23,36–40]. We note that these references used different methods todetermine the elastic parameters in comparison with the authors of this study. ApplyingDFA—it was found that the resonant spruce wood is homogeneous in terms of density,the sound velocity in the wood, and the Poisson coefficient in the LT direction, which isreflected by the extremely small coefficients of variation (CV), as can be seen in Table 6.The elastic moduli (E and G) show a moderate level of variability. The υRT coefficientrecorded the highest value of variability. The dispersion degree of the average of theYoung’s modulus values is higher in the tangential direction than either radially (R) oralong the fiber (L), and it can be seen that the anisotropy is more accentuated in the RTsection.
From the DFA, it can be seen (Table 6) that the only variables, out of the acousticparameters, with the power to separate the quality classes are (in descending order ofimportance) the speed of sound propagation in the radial direction VRR, Poisson’s ratioυLR, and the speed of the propagation of sounds in the longitudinal direction VLL. Thelongitudinal elasticity modulus EL (Table 6) also has a low contribution to the discrimina-tion of quality classes. The other parameters are not stratified according to the grade of thesamples. In the next stage, for the variables with the capacity to discriminate the qualityclasses (A, B, C, and D), the stratification according to their values in relation to thesegrades took place. The samples from class A show much more homogeneous elastic andacoustic characteristics than those from classes B, C, and D. Thus, the degree of spreadingof the values of the measured parameters increases with the decrease in the quality class.With the exception of GRT and υRT, the elastic and acoustic variables involved in this studyhave non-Gaussian distributions (Shapiro–Wilk W = 0.84–0.91, p ≤ 0.05), which is whynonparametric statistics were chosen when testing the significance (Figure 7).

Forests 2021, 12, 1122 12 of 18
Table 5. The acoustic and elastic parameters.
Type of Variables Symbol Grade of Resonant Spruce WoodAverage Values
A B C D
Density (kg/m3)ρ
STDV438
2.035381
4.291446
8.695394
3.663
Sound velocity in wood (m/s)VLL 5005.74 4856.55 4688.94 4283.40VRR 1703.27 1594.62 1660.39 1687.40VTT 1374.57 1227.63 1296.72 1409.18
Young’s elasticity modulus(MPa)
EL 10,250.58 9421.53 9595.21 7011.00ER 1193.65 993.40 1153.88 1221.37ET 797.77 564.87 707.97 839.00
Specific longitudinal modulusof elasticity
(GPa* g−1* cm3)
EL/ρ 25.09 23.09 22.93 17.08ER/ρ 2.92 2.43 2.76 2.98ET/ρ 3.36 3.01 3.10 3.43
Shear Modulus (MPa)GRT 781.05 599.95 711.80 670.03GLR 1007.50 759.28 899.97 1030.85GLT 937.12 735.15 898.57 845.08
Specific shear modulus ofelasticity (GPa* g−1* cm3)
GRT/ρ 1.91 1.47 1.70 1.63GLR/ρ 2.47 1.86 2.15 2.51GLT/ρ 2.29 1.80 2.15 2.06
Poisson CoefficientυLT 0.46 0.47 0.46 0.44υLR 0.43 0.44 0.43 0.40υRT −0.38 −0.29 −0.33 −0.59
Table 6. The results of the multifactorial discriminant analysis of the acoustic and elastic parametersin relation to the music spruce wood grade.
Variables Wilks’Lambda
PartialLambda F-Remove Significance
p-Level Tolerance
VLL (m/s) 0.1502 0.5900 3.7060 0.0337 0.0278VRR (m/s) 0.1886 0.4700 6.0140 0.0060 0.0378
υLR 0.1829 0.4846 5.6714 0.0076 0.0108EL (MPa) 0.1147 0.7726 1.5692 0.2357 0.6033ρ (kg/m3) 0.0842 0.9499 0.2636 0.8505 0.7790VTT (m/s) 0.0682 0.7691 1.5004 0.2549 0.2098ER (MPa) 0.0847 0.9556 0.2320 0.8726 0.0802ET (MPa) 0.0738 0.8327 1.0045 0.4179 0.0920
υLT 0.0765 0.8635 0.7902 0.5179 0.0891υRT 0.0744 0.8399 0.9528 0.4402 0.7053
GRT (MPa) 0.0876 0.9883 0.0591 0.9804 0.5677GLR(MPa) 0.0774 0.8737 0.7226 0.5539 0.1163GLT(MPa) 0.0879 0.9917 0.0417 0.9881 0.5541

Forests 2021, 12, 1122 13 of 18
1
(a) (b)
(c) (d)
Figure 7. Multiple correlations between some acoustic and elastic parameters: (a) ultrasound velocity in L, R, and Tdirections; (b) longitudinal elasticity moduli in L, R, and T directions; (c) shear moduli G; (d) Poisson coefficients.
The statistically significant relationships (p ≤ 0.05) found are of moderate to strongintensity. The wood density is statistically inconsistent with any of the measured param-eters. The acoustic sound velocity in the transverse direction in the wood (radial andtangential) correlates better with the other determined parameters than the sound velocityin the longitudinal direction of the spruce wood sample (Figure 7a). The closest links arebetween the shear moduli in the three directions of anisotropy and between them withthe velocities in the radial and tangential directions of wood (Figure 7c). The highestcorrelation coefficient is between υLR and υLT: Spearman R = +0.962, p < 0.0001 (Figure 7d).Thus, it is worth mentioning that the characteristics of the annual rings are associated withthe acoustic parameters in the radial direction, not those in the longitudinal direction. Theregularity of the rings and their components are the characteristics of the rings with thegreatest acoustic relevance; up to an average annual ring width of 2–2.5 mm, the size of theacoustic parameters increases with the width of the rings. Between the four quality classesfor the anatomical structure of resonant spruce wood, the differences are sensitive, withtheir variability increasing with the decrease in the quality class (from A to D).
3.2.2. Principal Component Analysis (PCA)
The PCA maximizes the correlations of the object scores with each of the quantifiedvariables for the number of components. Therefore, in the factorial analysis five main

Forests 2021, 12, 1122 14 of 18
components were extracted, the first two together explaining 58% of the total variance. Thefirst main component is defined by the Young’s modulus in the radial direction ER and bythe sound velocity in the tangential direction of spruce wood VTT; the second componentis defined by the sound velocity in the longitudinal direction of spruce wood VLL and thequality class (Figure 8).
Forests 2021, 12, x FOR PEER REVIEW 14 of 18
The PCA maximizes the correlations of the object scores with each of the quantified
variables for the number of components. Therefore, in the factorial analysis five main com-
ponents were extracted, the first two together explaining 58% of the total variance. The
first main component is defined by the Young’s modulus in the radial direction ER and by
the sound velocity in the tangential direction of spruce wood VTT; the second component
is defined by the sound velocity in the longitudinal direction of spruce wood VLL and the
quality class (Figure 8).
Figure 8. The physical, acoustic, and elastic parameters in the 1,2 plane of the PCA. Legend: grade,
the quality class of resonant spruce wood; RI, the ring width regularity index; TRW, the annual ring
width; b*, color yellowness; WD, wood density; EL, Young’s modulus along the wood fibers; υRT and
υLT, Poisson coefficients; VLL, sound velocity in the longitudinal direction of the wood (along the
grain); a*, redness color; L*, brightness color; LWP, late wood proportion; GLT and GLR, shear moduli;
VTT, sound velocity in the tangential direction of wood; ER, Young’s modulus in the radial direction
of wood.
The other parameters GLR, VTT, ER, and GLT vary in tandem with the proportion of late
wood and the color brightness and redness. The density of wood is diametrically opposed
to all these variables. It was observed that the quality class of the wood, defined according
to anatomical patterns, is well represented by the Poisson coefficient υLT—with which it
varies in the same direction—as well as by the average annual ring width TRW and the
quality class (A, B, C, and D), with which it varies in the opposite direction. Additionally,
it resulted that TRW, the ring widths regularity index RI, the quality class, and the color
yellowness are closely related to each other. The density of wood is far from all the other
measured physical and acoustic characteristics.
3.2.3. Correlations between Elastic–Acoustic Properties and Anatomical Features of Res-
onant Spruce
The links between the physical characteristics and the acoustic/elastic characteristics
of the examined spruce wood are generally of low to moderate strength, as can be seen in
Figure 8. The physical, acoustic, and elastic parameters in the 1,2 plane of the PCA. Legend: grade,the quality class of resonant spruce wood; RI, the ring width regularity index; TRW, the annual ringwidth; b*, color yellowness; WD, wood density; EL, Young’s modulus along the wood fibers; υRT andυLT, Poisson coefficients; VLL, sound velocity in the longitudinal direction of the wood (along thegrain); a*, redness color; L*, brightness color; LWP, late wood proportion; GLT and GLR, shear moduli;VTT, sound velocity in the tangential direction of wood; ER, Young’s modulus in the radial directionof wood.
The other parameters GLR, VTT, ER, and GLT vary in tandem with the proportion of latewood and the color brightness and redness. The density of wood is diametrically opposedto all these variables. It was observed that the quality class of the wood, defined accordingto anatomical patterns, is well represented by the Poisson coefficient υLT—with which itvaries in the same direction—as well as by the average annual ring width TRW and thequality class (A, B, C, and D), with which it varies in the opposite direction. Additionally,it resulted that TRW, the ring widths regularity index RI, the quality class, and the coloryellowness are closely related to each other. The density of wood is far from all the othermeasured physical and acoustic characteristics.
3.2.3. Correlations between Elastic–Acoustic Properties and Anatomical Features ofResonant Spruce
The links between the physical characteristics and the acoustic/elastic characteristicsof the examined spruce wood are generally of low to moderate strength, as can be seenin Table 7. The physical characteristics of wood, especially its structure, are most closelyrelated to the sound speed along the wood fibers. Thus, in Figure 9 it can be observed thatthe sound speed along the wood fiber VLL decreases with the increase in the width of the

Forests 2021, 12, 1122 15 of 18
annual rings, with these delimiting the anatomical models of the wood and, implicitly, thequality classes. However, the sound velocity in the radial direction (VRR) is independentof the variables of the structure and color of wood. The sound velocity in the tangentialdirection (VTT) increases slightly and insignificantly with the width of the rings and itscomponents (early wood and late wood).
Table 7. Coefficient matrix of Spearman simple correlation between acoustic parameters and thephysical and structural characteristics of the material (legend: values marked with bold are significantat p < 0.05).
VariablesSimple Correlation Coefficients
TRW RI LWW LWP L* a* b*
ρ (kg/m3) 0.396 0.399 0.402 −0.293 −0.021 −0.160 0.421VLL (m/s) −0.708 −0.639 −0.708 0.229 0.259 −0.021 −0.350VRR (m/s) 0.057 −0.012 0.075 0.253 0.021 −0.253 0.058VTT (m/s) 0.289 0.217 0.258 0.214 0.150 −0.238 0.117EL (MPa) −0.287 −0.273 −0.339 0.125 0.336 −0.440 0.070ER (MPa) −0.184 −0.239 −0.166 0.123 −0.093 0.216 −0.245ET (MPa) −0.065 −0.147 −0.088 0.162 −0.007 0.186 −0.234
GLT (MPa) −0.230 −0.259 −0.186 0.247 0.059 −0.153 −0.110GLR (MPa) 0.244 0.171 0.248 0.292 0.057 −0.351 0.199GRT (MPa) −0.117 −0.127 −0.062 0.210 0.011 −0.084 −0.094
The size of the elasticity modulus in the longitudinal direction (EL) decreases with theredness of the wood color. This relationship is due to the influence that the size of the latewood would have on the color of the wood. In fact, the redness color has nothing to dowith the late wood width (Spearman R = −0.086, p = 0.69) or with the proportion of latewood (R = −0.148, p = 0.49). The wood density’s relationship with the yellowness could beexplained by the surprising positive contribution of the early wood thickness to the wooddensity (R = +0.421, p = 0.04). Additionally, the regularity of the annual rings is directlyproportional to the width of the rings (R = +0.994, p < 0.001) due to the restrictive way thequality classes are formed. From the analysis performed by [12–16,19–23], it is evident thatthe absolute width is not as important an index of wood in terms of the sound produced asthe regularity in the radial direction.
Forests 2021, 12, x FOR PEER REVIEW 16 of 18
Figure 9. The regression between the sound velocity in the longitudinal direction and the annual
ring width.
4. Conclusions
This paper aimed to determine the acoustic and elastic characteristics of resonant
spruce wood and correlate them with the anatomical patterns of tonewood, which was
classified into four quality classes, according to its use by violin manufacturers. The sta-
tistical correlations between the different anatomical parameters of the wood and the
acoustic/elastic parameters highlighted the fact that:
• The anisotropy of spruce wood is the largest in the tangential direction, with the
modulus of longitudinal elasticity in the tangential direction registering the largest
dispersion.
• The speed of sound propagation in radial direction VRR, Poisson’s ratio υLR, the speed
of propagation of sounds in the longitudinal direction VLL, and the longitudinal elas-
ticity modulus EL are the most important properties that differentiate the quality clas-
ses of resonant spruce.
• VLL is the variable that best expresses the links between the acoustic–elastic properties
and the physical properties of the material; it defines the second main component
(Figure 9) and correlates much better than VRR with the physical properties of wood
(see new Table 7). Instead, VRR is best able to distinguish the quality classes of violins
(Table 6).
• Among the parameters analyzed, the best correlation was obtained between the
speed of sound in the radial and tangential directions and the other physical and
elastic parameters.
• Regarding the correlation between the color of the wood and the elastic properties, it
was observed that the modulus of elasticity in the longitudinal direction (EL) de-
creases with the redness of the wood color.
The presented research highlights the fact that the extreme scarcity of this raw mate-
rial that has the features of regularity in the structure of the annual rings, a lack of defects,
and acoustic/elastic properties that are correlated with desirable physical ones makes it
very valuable for violin producers. As a result, the quality of resonant wood is reflected
by the prices applied to the finished product (violin).
Author Contributions: Conceptualization, M.D.S., F.D., and A.S.; methodology, F.D. and A.S.; soft-
ware, F.D., M.D.S., and A.S.; validation, F.D. and M.D.S.; formal analysis, F.D.; investigation, F.D.
Figure 9. The regression between the sound velocity in the longitudinal direction and the annualring width.
Forests 2021, 12, 1122 16 of 18
4. Conclusions
This paper aimed to determine the acoustic and elastic characteristics of resonantspruce wood and correlate them with the anatomical patterns of tonewood, which wasclassified into four quality classes, according to its use by violin manufacturers. Thestatistical correlations between the different anatomical parameters of the wood and theacoustic/elastic parameters highlighted the fact that:
• The anisotropy of spruce wood is the largest in the tangential direction, with themodulus of longitudinal elasticity in the tangential direction registering the largestdispersion.
• The speed of sound propagation in radial direction VRR, Poisson’s ratio υLR, thespeed of propagation of sounds in the longitudinal direction VLL, and the longitudinalelasticity modulus EL are the most important properties that differentiate the qualityclasses of resonant spruce.
• VLL is the variable that best expresses the links between the acoustic–elastic propertiesand the physical properties of the material; it defines the second main component(Figure 9) and correlates much better than VRR with the physical properties of wood(see new Table 7). Instead, VRR is best able to distinguish the quality classes of violins(Table 6).
• Among the parameters analyzed, the best correlation was obtained between the speedof sound in the radial and tangential directions and the other physical and elasticparameters.
• Regarding the correlation between the color of the wood and the elastic properties, itwas observed that the modulus of elasticity in the longitudinal direction (EL) decreaseswith the redness of the wood color.
The presented research highlights the fact that the extreme scarcity of this raw materialthat has the features of regularity in the structure of the annual rings, a lack of defects, andacoustic/elastic properties that are correlated with desirable physical ones makes it veryvaluable for violin producers. As a result, the quality of resonant wood is reflected by theprices applied to the finished product (violin).
Author Contributions: Conceptualization, M.D.S., F.D. and A.S.; methodology, F.D. and A.S.; soft-ware, F.D., M.D.S. and A.S.; validation, F.D. and M.D.S.; formal analysis, F.D.; investigation, F.D. andA.S.; resources, M.D.S. and A.S.; data curation, M.D.S.; writing—original draft preparation, M.D.S.;writing—review and editing, F.D. and A.S.; visualization, M.D.S. and F.D.; supervision, A.S. and F.D.;project administration, M.D.S. and A.S. All authors have read and agreed to the published version ofthe manuscript.
Funding: This research was funded by a grant from the Ministry of Research, Innovation andDigitization, CNCS/CCCDI, UEFISCDI, PN-III-P2-2.1-PED-2019-2148, project number. 568PED/2020MINOVIS, Innovative models of violins acoustically and aesthetically comparable to heritage violins,within PNCDI III.
Data Availability Statement: DDetails regarding where data supporting reported results can befound on https://minovis.unitbv.ro/ (accessed on 18 August 2021).
Acknowledgments: We are grateful to the technical staff of Gliga Musical Instruments, Reghin, aRomanian manufacturer of musical string instruments, for supplying the specimens, as partner inthe project 568PED/2020 MINOVIS.
Conflicts of Interest: The authors declare no conflict of interest.
References1. Bremaud, I.; Gril, J.; Thibaut, B. Anisotropy of wood vibrational properties: Dependence on grain angle and review of literature
data. Wood Sci. Technol. 2011, 45, 735–754. [CrossRef]2. Brémaud, I. What Do We Know on “Resonance Wood” Properties? Selective Review and Ongoing Research; Societé Française
d’Acoustique: Nantes, France, 2012; pp. 2760–2764.

Forests 2021, 12, 1122 17 of 18
3. Brémaud, I. Acoustical properties of wood in string instruments soundboards and tuned idiophones: Biological and culturaldiversity. J. Acoust. Soc. Am. 2012, 131, 807–818. [CrossRef] [PubMed]
4. Spycher, M.; Schwarze, F.W.M.R.; Steiger, R. Assessment of resonance wood quality by comparing its physical and histologicalproperties. Wood Sci. Technol. 2008, 42, 325–342. [CrossRef]
5. Hilde, C.; Woodward, R.; Avramidis, S.; Hartley, I.D. The Acoustic Properties of Water Submerged Lodgepole Pine (Pinus contorta)and Spruce (Picea spp.) Wood and Their Suitability for Use as Musical Instruments. Materials 2014, 7, 5688–5699. [CrossRef]
6. Buksnowitz, C.; Teischinger, A.; Müller, U.; Pahler, A.; Evans, R. Resonance wood [Picea abies (L.) Karst.]: Evaluation andprediction of violin makers’ quality-grading. J. Acoust. Soc. Am. 2007, 121, 2384–2395. [CrossRef] [PubMed]
7. Manzo, G.; Tippner, J.; Zatloukal, P. Relationships between the Macrostructure Features and Acoustic Parameters of ResonanceSpruce for Piano Soundboards. Appl. Sci. 2021, 11, 1749. [CrossRef]
8. Sproßmann, R.; Zauer, M.; Wagenführ, A. Characterization of acoustic and mechanical properties of common tropical woodsused in classical guitars. Results Phys. 2017, 7, 1737–1742. [CrossRef]
9. Šilinskas, B.; Varnagiryte-Kabašinskiene, I.; Aleinikovas, M.; Beniušiene, L.; Aleinikoviene, J.; Škema, M. Scots Pine and NorwaySpruce Wood Properties at Sites with Different Stand Densities. Forests 2020, 11, 587. [CrossRef]
10. Rocaboy, F.; Bucur, V. About the physical properties of wood of twentieth century violins. J. Acoust. Soc. Am. 1990, 1, 21–28.11. Albu, C.T. Research on the Characteristics of Resonance SpruceWood from Gurghiu River Basin in Conjunction with the
Requirements of the Musical Instruments Industry. Ph.D. Thesis, Transilvania University of Brasov, Brasov, Romania, 2010.12. Bucur, V.; Archer, R.R. Elastic constants for wood by an ultrasonic method. Wood Sci. Technol. 1984, 18, 255–265. [CrossRef]13. Bucur, V. Acoustics of Wood, 2nd ed.; Springer: Berlin/Heidelberg, Germany, 2006; pp. 173–196.14. Bissinger, G. Structural Acoustics of Good and Bad Violins. J. Acoust. Soc. Am. 2008, 124, 1764–1773. [CrossRef]15. Bucur, V. Chapter 3—Mechanical Characterization of Materials for String Instruments: 93–132 and Chapter 8—Ageing of musical
instruments—About the old and new instruments. In Handbook of Materials for String Musical Instruments; Springer: Cham,Switzerland, 2016; pp. 325–372.
16. Dinulică, F.; Albu, C.T.; Vasilescu, M.M.; Stanciu, M.D. Bark features for identifying resonance spruce standing timber. Forests2019, 10, 799. [CrossRef]
17. Stanciu, M.D.; Cosereanu, C.; Dinulică, F.; Bucur, V. Effect of wood species on vibration modes of violins plates. Eur. J. Wood Prod.2020, 78, 785–799. [CrossRef]
18. Gliga, V.G.; Stanciu, M.D.; Nastac, S.M.; Campean, M. Modal Analysis of Violin Bodies with Back Plates Made of Different WoodSpecies. BioResources 2020, 15, 7687–7713. [CrossRef]
19. Dinulică, F.; Bucur, V.; Albu, C.T.; Vasilescu, M.M.; Curtu, A.L.; Nicolescu, N.V. Relevant phenotypic descriptors of the resonanceNorway spruce standing trees for the acoustical quality of wood for musical instruments. Eur. J. For. Res. 2021, 140, 105–125.[CrossRef]
20. Wegst, U.G.K. Wood for sound. Am. J. Bot. 2006, 93, 1439–1448. [CrossRef]21. Viala, R.; Placet, V.; Cogan, S. Simultaneous non-destructive identification of multiple elastic and damping properties of spruce
tonewood to improve grading. J. Cult. Herit. 2020, 42, 108–116. [CrossRef]22. Carlier, C.; Brémaud, I.; Gril, J. Violin Making “Tonewood”: Comparing Makers’ Empirical Expertise with Wood Structural/Visual and
Acoustical Properties; International Symposium on Musical Acoustics ISMA2014; ISMA: Le Mans, France, 2014; pp. 325–330.23. Carlier, C.; Alkadri, A.; Gril, J.; Brémaud, I. Revisiting the notion of “resonance wood”choice: A decompartementalised approach
from violin makers’opinion and perception to characterization of material properties’ variability. In Wooden Musical Instruments.Different Forms of Knowledge: Book of End of WoodMusick COST ActionFP1302; Perez, M., Marconi, E., Eds.; Hal Documentation;2018; p. hal-02051004. Available online: https://hal.archives-ouvertes.fr/hal-02086598 (accessed on 15 August 2021).
24. Halachan, P.; Babiak, M.; Spišiak, D.; Chubinsky, A.N.; Tambi, A.A.; Chauzov, K.V. Physico-acoustic characteristics of spruce andlarche wood. Wood Res. 2017, 62, 235–242.
25. Stanciu, M.D.; S, ova, D.; Savin, A.; Ilias, , N.; Gorbacheva, G. Physical and Mechanical Properties of Ammonia-Treated Black LocustWood. Polymers 2020, 12, 377. [CrossRef]
26. Nishino, Y.; Janin, G.; Yainada, Y.; Kitano, D. Relations between the colorimetric values and densities of sapwood. J. Wood. Sci.2000, 46, 267–272. [CrossRef]
27. Gonçalves, R.; Trinca, A.J. Comparison of elastic constants of wood determined by ultrasonic wave propagation and staticcompression testing. Wood Fiber Sci. 2011, 43, 64–75.
28. Kollmann, F.F.P.; Cotte, W.A. Principles of Wood Science and Technology; Springer: Berlin/Heidelberg, Germany; New York, NY,USA, 1968.
29. Lanvermann, C.; Hass, P.; Wittel, F.K.; Niemz, P. Mechanical properties of norway spruce: Intra-ring variation and genericbehavior of earlywood and latewood until failure. BioResources 2014, 9, 105–119. [CrossRef]
30. Schmerr, L.W., Jr. Fundamentals of Ultrasonic Nondestructive Evaluation—A Modeling Approach; Plenum Press: New York, NY, USA,1998.
31. Grimberg, R.; Savin, A.; Steigmann, R.; Stanciu, M.D.; Grum, J. Determination of Elastic Properties of CFRP Using Lamb WavesResonant Spectroscopy. In Proceedings of the 2nd International Symposium on NDT in Aerospace, Hamburg, Germany, 22–24November 2010.

Forests 2021, 12, 1122 18 of 18
32. Alleyne, D.N.; Cawley, P. A two dimensional Fourier transform method for the measurement of propagating multimode signals.J. Acoust. Soc. Am. 1991, 89, 1159–1168. [CrossRef]
33. Šturm, R.; Grimberg, R.; Savin, A.; Grum, J. Destructive and nondestructive evaluations of the effect of moisture absorption onthe mechanical properties of polyester-based composites. Compos. Part B Eng. 2015, 71, 10–16. [CrossRef]
34. Nowak, T.; Hamrol-Bielecka, K.; Jasienko, J. Non-destructive testing of wood–correlation of ultrasonic and stress wave test resultsin glued laminated timber members. Annals of Warsaw University of Life Sciences-SGGW. For. Wood Technol. 2015, 92, 317–324.
35. Fang, Y.; Lin, L.; Feng, H.; Lu, Z.; Emms, G.W. Review of the use of air-coupled ultrasonic technologies for nondestructive testingof wood and wood products. Comput. Electron. Agric. 2017, 137, 79–87. [CrossRef]
36. Fedyukov, V.; Saldaeva, E.; Chernova, M. Different ways of elastic modulus comparative study to predict resonant properties ofstanding spruce wood. Wood Res. 2017, 62, 607–614.
37. Mania, P.; Fabisiak, E.; Skrodzka, E. Investigation of Modal Behaviour of Resonance Spruce Wood Samples (Picea abies L.). Arch.Acoust. 2017, 42, 23–28. [CrossRef]
38. Mania, P.; Gasiorek, M. Acoustic Properties of Resonant Spruce Wood Modified Using Oil-Heat Treatment (OHT). Materials 2020,13, 1962. [CrossRef]
39. Bachtiar, E.V.; Sanabria, S.J.; Mittig, J.P.; Niemz, P. Moisture-dependent elastic characteristics of walnut and cherry wood bymeans of mechanical and ultrasonic test incorporating three different ultrasound data evaluation techniques. Wood Sci. Technol.2017, 51, 47–67. [CrossRef]
40. Krajnc, L.; Farrelly, N.; Harte, A.M. The effect of thinning on mechanical properties of Douglas fir, Norway spruce, and Sitkaspruce. Ann. For. Sci. 2019, 76, 25–37. [CrossRef]