GRADING-SYSTEM-OF-K -12
11
GRADING SYSTEM OF K-12 PROGRAM OF DEPARTMENT OF EDUCATION Assessment and Rating of Learning Outcomes The assessment process is holistic, with emphasis on the formative or developmental purpose of quality assuring student learning. It is also standards-based as it seeks to ensure that teachers will teach to the standards and students will aim to meet or even to exceed the standards. The students attainment of standards in terms of content and performances therefore, a critical evidence of learning. The assessment shall be done at four levels and shall be weighted as follows: Level of Assessment Percentage Weight Knowledge 15% Process or Skills 25% Understanding(s) 30% Products/Performances 30% Total 100% The levels are defined as follows:
-
Upload
independent -
Category
Documents
-
view
3 -
download
0
Transcript of GRADING-SYSTEM-OF-K -12
GRADING SYSTEM OF K-12 PROGRAM OF DEPARTMENT OF EDUCATION
Assessment and Rating of Learning Outcomes
The assessment process is holistic, with emphasis on the
formative or developmental purpose of quality assuring student
learning. It is also standards-based as it seeks to ensure that
teachers will teach to the standards and students will aim to
meet or even to exceed the standards. The students attainment of
standards in terms of content and performances therefore, a
critical evidence of learning.
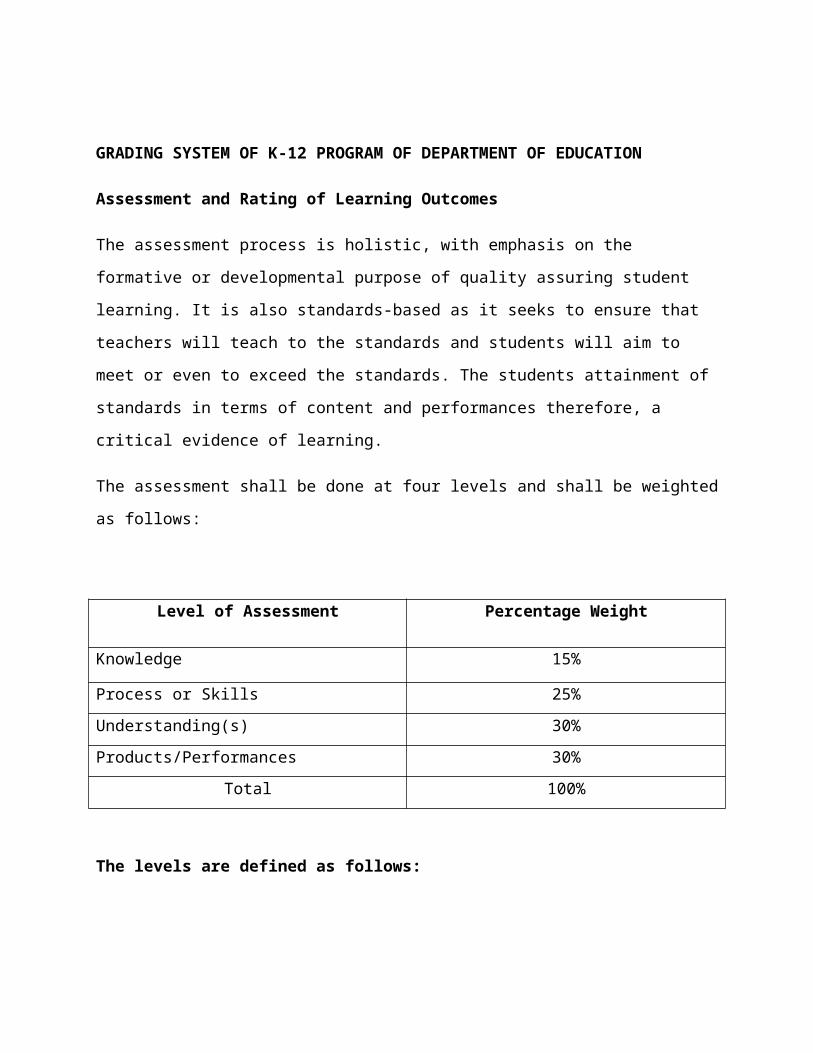
The assessment shall be done at four levels and shall be weighted
as follows:
Level of Assessment Percentage Weight
Knowledge 15%
Process or Skills 25%Understanding(s) 30%Products/Performances 30%
Total 100%
The levels are defined as follows:

1. ““Knowledge” refers to the substantive content of the
curriculum, the facts and information that the students
acquires.
2. ““Process” refers to cognitive operations that the student
performs on facts and information for the purpose of
constructing meanings and understandings.
3. ““Understandings” refers to enduring big ideas, principles
and generalizations inherent to the discipline, which may be
assessed using facets of understanding.
4. ““Products/Performances” refers to real-life application of
understanding as evidenced by the student’s performance of
authentic tasks.
Levels of Proficiency
At the end of the quarter, the performance of students shall be
described in the report card, based on the following levels of
proficiency:
Beginning – The student at this level struggles with his/her
understanding; prerequisite and fundamental knowledge and or
skills have not been acquired or developed adequately to aid
understanding.
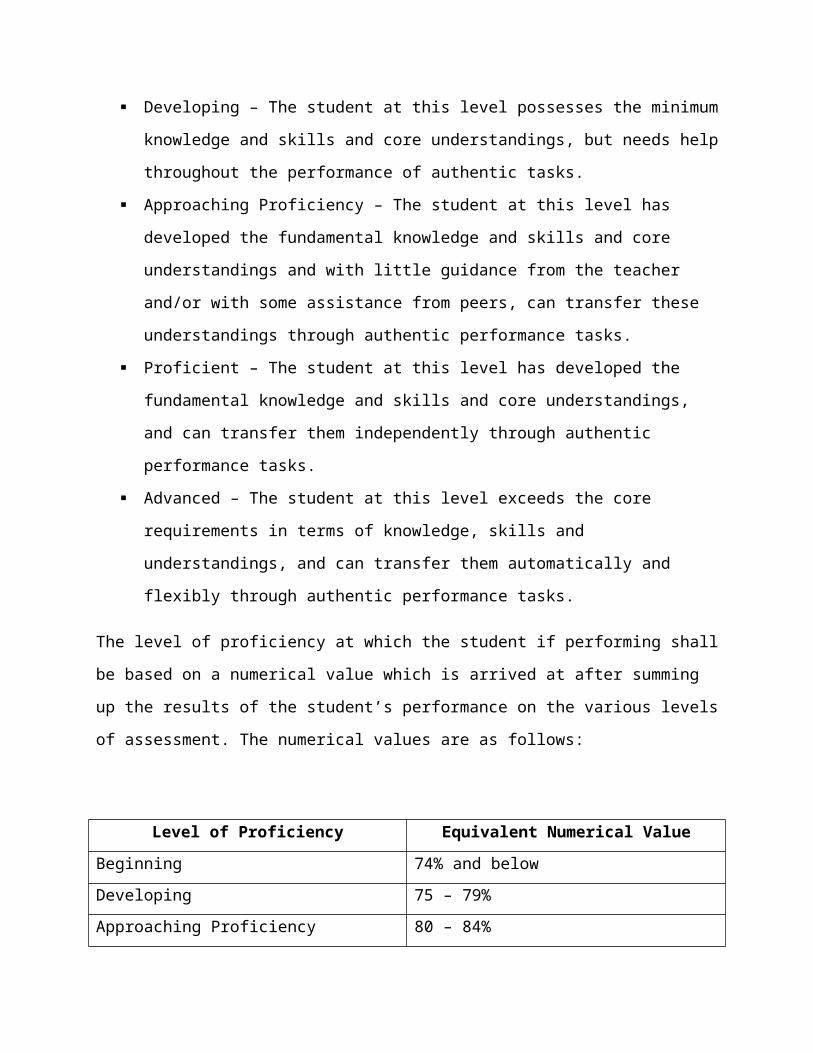
Developing – The student at this level possesses the minimum
knowledge and skills and core understandings, but needs help
throughout the performance of authentic tasks.
Approaching Proficiency – The student at this level has
developed the fundamental knowledge and skills and core
understandings and with little guidance from the teacher
and/or with some assistance from peers, can transfer these
understandings through authentic performance tasks.
Proficient – The student at this level has developed the
fundamental knowledge and skills and core understandings,
and can transfer them independently through authentic
performance tasks.
Advanced – The student at this level exceeds the core
requirements in terms of knowledge, skills and
understandings, and can transfer them automatically and
flexibly through authentic performance tasks.
The level of proficiency at which the student if performing shall
be based on a numerical value which is arrived at after summing
up the results of the student’s performance on the various levels
of assessment. The numerical values are as follows:
Level of Proficiency Equivalent Numerical ValueBeginning 74% and belowDeveloping 75 – 79%Approaching Proficiency 80 – 84%

Proficient 85 – 89%Advanced 90% and above
What shall appear in the report card is not the numerical value,
but the equivalent level of proficiency, abbreviated as follows:
B for Beginning;
D for Developing;
AP for Approaching Proficiency;
P for Proficient; and
A for Advanced
At the end of the four quarters, the Final Grade for each
learning area shall be reported as the average of the four
quarterly ratings, expressed in terms of the levels of
proficiency. The general average shall be the average of the
final grades of the different learning areas, also expressed in
terms of levels of proficiency with the numerical equivalent in
parenthesis.
Promotion and retention of students shall be by subject. Students
whose proficiency level is Beginning (B) at the end of the
quarter or grading period shall be required to undergo
remediation after class hours so that they can immediately catch
up as they move to the next grading period. If by the end of the

school year, the students are still at the Beginning level, then
they required to take summer classes.
As a matter of policy every learning deficiency should be bridged
even for those students whose level of proficiency is above the
beginning level.
Honor students shall be drawn among those performed at the
Advanced Level. Subsequent guidelines shall be issued as basis
for ranking of honors.
The total time daily does not include off-school learning
experiences that teachers may require outside of school hours for
the production of products and performances as evidence of
transfer of learning.
Revised Basic Education Curricullum
The following grading system precisely equates rubric, point,
letter, and percentage grades using the following equation:
Rubric Base and Quality Points = (Percentage – 55) x 0.1
PERFORMANCE
DESCRIPTION
QUALITY
POINTS
LETTER
GRADE
PERCENTAGE
EQUIVALENT
PERCENTAGE
RANGEExcellent 4.00
3.67AA-
9592(91.7)
93.33 –
100.090.00 –
93.32

Above Average
to Average3.333
2.67
B+BB-
88(88.3)8582
86.67 –
89.9983.33 –
86.6680.00 –
83.32Satisfactory to
Below Average2.332.001.67
C+CC-
7875
72(71.7)
76.67 –
79.9973.33 –
76.6670.00 –
73.32
Minimum Pass1.00 D 65 60.00 –
69.99Failure 0.00 F 55 50.00 – 59.99
Percentage grades over 100 are averaged as 100
Percentage grades under 50 are averaged as 50
Rationale
Grades are typically given in a 5-step, or more, letter scale (A,
B, C, D, and F) but translated into a final 41- or 401-step
quality point score (0 – 4.0/0) for averaging. Schools typically
set letter grades and their point equivalents. Many faculty,
however, use a 101-step percentage point score (0 – 100) some or
all of the time for assigning or averaging grades before
determining a final letter or point grade. To the consternation

of some students, faculty members are typically free to use their
own percentage system with most opting for what can be called
traditional 7- or 10-point grading scales.
Since the final arbiter of a student’s academic achievement is
generally his or her point score, one could argue the most
appropriate percentage system is one that most accurately mimics
point scores. One could multiply each quality point by 25 to
create a percentage system but that, of course, represents no
academic challenge. Multiplying points by 10 and assigning them
to the top of the percentage system (from 60 – 100)puts one
closer to the mark but a direct translation would mean an A could
only be achieved by the near impossible feat of averaging 100.
Therefore, devising a percentage system that works down from 100
instead of up from 60 is best.
When counting quality points by 10ths, there are 10 steps between
full grades. Therefore, when counting down from 100, assigning 10
percentage points to each full grade range are logical.
Because 0 is its own step on the grading scale, there is an extra
point for the entire grading range that can either be assigned to
the A range or the F range. Assigning it to the A range (90 –
100) translates better to quality points when minus/whole/plus
grades are used, and is the typical convention.
Dividing full grades into minus, whole, and plus grades is more
precise and, so, should be specified in a grading system. Its
inclusion, however, does not require instructors or institutions

to give plus or minus grades for either assignments or final
grades. In particular, one could imagine an instructor–who
prefers full grades–returning assignments with full grades but
then submitting an averaged minus/whole/plus final grade.
Many institutions do not use A+, D+, D-, F+, and/or F- grades. In
such cases, those ranges can be added to the respective whole or
full grade. Conversely, those grades can easily be created
following the conventions used for B and C grades.
Dividing full grades by 3 creates minus/whole/plus grades, but it
also leaves an extra point that must be assigned to a range.
Assigning it to the whole range better mirrors quality points,
and is logical.
Calculating each percentage point in 100ths better mirrors
quality points when using minus/whole/plus grades, is more
accurate, and makes the differences between the placements of
extra points marginal. While this does move 73, 83, and 93 from
their typical positions as whole grades to minus grades, in an
era of grade inflation that can be seen as an advantage.
In combining grades that originate as letters with other letter
grades and percentage scores, it is necessary to assign each
grade a number. Using a percentage equivalent score rather than a
point score is sometimes simplest because grades originating as
percentages do not need to be converted for averaging.Dividing
full, minus, whole, or plus grade ranges by 2 and rounding the
result to a whole or 10th place number creates percentage

equivalent grades that can be equated to point and letter grades.
The result is an exact mapping of quality point scores from 55 –
95 percentage points using the formula: Rubric Base and Quality
Points = (Percentage Equivalent – 55) x 0.1.
As in quality points, with this system if an F is averaged with
an A the result is a C. This becomes problematic, however, when a
missing letter grade assignment is combined with a missing
percentage grade assignment. Each would receive an F but one
could be averaged as a 55 while the other could be averaged as 0.
Therefore, if both letter and percentage grades are used,
percentage grades less than 50 should be averaged as 50 (5 points
below the F percentage equivalent). Conversely, to maintain
parity, the maximum percentage grade should be 100 (5 points
above the A percentage equivalent). An exception to the lower
limit could be made in the case of cheating, so there is a simple
and tangible penalty beyond that suffered for missing or poor
work.
If a five-step rubric is created with 0 to 4 possible points, it
can be directly equated to quality points and, hence,
percentages. If the total value of a rubric equals forty points,
for instance, ten areas with 0, 1, 2, 3, or 4 points, or five
areas worth 0, 2, 6, or 8 points, then the total can be directly
equated to percentages by adding 55.

Finally, the suggested overall performance descriptions are
designed to straddle traditional definitions and inflated
realities.