Effect of Chromate Stress on Escherichia coli K-12
11
JOURNAL OF BACTERIOLOGY, May 2006, p. 3371–3381 Vol. 188, No. 9 0021-9193/06/$08.000 doi:10.1128/JB.188.9.3371–3381.2006 Copyright © 2006, American Society for Microbiology. All Rights Reserved. Effect of Chromate Stress on Escherichia coli K-12 D. F. Ackerley, 1,2 Y. Barak, 1 S. V. Lynch, 1 J. Curtin, 3 and A. Matin 1 * Department of Microbiology and Immunology, Sherman Fairchild Science Building, Stanford University School of Medicine, 299 Campus Drive, Stanford, California 94305 1 ; School of Biological Sciences, Victoria University of Wellington, PO Box 600, Wellington, New Zealand 2 ; and Centers for Disease Control and Prevention, Atlanta, Georgia 30333 3 Received 15 December 2005/Accepted 19 February 2006 The nature of the stress experienced by Escherichia coli K-12 exposed to chromate, and mechanisms that may enable cells to withstand this stress, were examined. Cells that had been preadapted by overnight growth in the presence of chromate were less stressed than nonadapted controls. Within 3 h of chromate exposure, the latter ceased growth and exhibited extreme filamentous morphology; by 5 h there was partial recovery with resto- ration of relatively normal cell morphology. In contrast, preadapted cells were less drastically affected in their morphology and growth. Cellular oxidative stress, as monitored by use of an H 2 O 2 -responsive fluorescent dye, was most severe in the nonadapted cells at 3 h postinoculation, lower in the partially recovered cells at 5 h postinoculation, and lower still in the preadapted cells. Chromate exposure depleted cellular levels of reduced glutathione and other free thiols to a greater extent in nonadapted than preadapted cells. In both cell types, the SOS response was activated, and levels of proteins such as SodB and CysK, which can counter oxidative stress, were increased. Some mutants missing antioxidant proteins (SodB, CysK, YieF, or KatE) were more sensitive to chromate. Thus, oxidative stress plays a major role in chromate toxicity in vivo, and cellular defense against this toxicity involves activation of antioxidant mechanisms. As bacterial chromate bioreme- diation is limited by the toxicity of chromate, minimizing oxidative stress during bacterial chromate reduction and bolstering the capacity of these organisms to deal with this stress will improve their effectiveness in chromate bioremediation. Chromate [Cr(VI)] is a widespread environmental pollutant, as it is a by-product of numerous industrial processes and nuclear weapons production (5). Because chromate is soluble, environmental contamination is difficult to contain. This solu- bility also promotes the active transport of chromate across biological membranes (7), and once internalized by cells, Cr(VI) exhibits a variety of toxic, mutagenic, and carcinogenic effects (34, 44). In contrast, most cells are impermeable to Cr(III), which is insoluble under typical environmental conditions (30); as measured by the Ames test, it is therefore some 1,000-fold less mutagenic than Cr(VI) (19). Thus, strategies for decon- tamination of environmental chromate focus on reducing it to Cr(III). Chemical methods for this are prohibitively expensive for large-scale environmental application and frequently have damaging consequences of their own (7), and so bacterial bioremediation is of considerable interest as an environmen- tally friendly and affordable solution to chromate pollution. Several bacteria, including Escherichia coli, Shewanella onei- densis, and numerous species of Pseudomonas and Bacillus, can reduce Cr(VI) to Cr(III) (17, 39); nonetheless, an effective bacterial system for in situ reduction has not yet been devel- oped. One reason is that chromate is also toxic to the reme- diating bacteria (17). Our in vitro studies have strongly impli- cated oxidative stress generated by chromate as a major cause of this toxicity (1, 2, 3). A wide range of bacterial enzymes and other cellular constituents reduce Cr(VI) by one-electron re- duction, generating the highly reactive radical Cr(V), which redox cycles (2, 13, 16, 33). In this process, Cr(V) is oxidized back to Cr(VI), giving its electron to molecular oxygen and generating reactive oxygen species (ROS). Repetition of this process produces large quantities of ROS, subjecting the cells to severe oxidative stress. Our proposed strategy to improve bacterial capacity to remediate chromate is therefore based on minimizing ROS production during chromate reduction. This approach envisages enhancing the efficacy of enzymes which catalyze primarily a one-step transformation of Cr(VI) to Cr(III), avoiding generation of Cr(V) (1, 2; Y. Barak, D. F. Ackerley, B. Lal, and A. Matin, unpublished data). However, the prooxidant effect of chromate in bacteria has not been demonstrated in vivo, and since countering it is cen- tral to our strategy for improving bacterial chromate remedia- tion, we have now examined the effects of chromate at the cellular level in E. coli. We observed that chromate exposure induced aberrant cell morphology and other effects and that these effects were markedly altered in cells that had been preadapted to chromate. As these effects were the result of physiological changes, they afforded a good experimental sys- tem to gain insight into these changes and determine the role of the potential prooxidant effect of chromate in vivo. MATERIALS AND METHODS Bacterial strains and growth conditions. The E. coli K-12 strains that were used in this study are listed in Table 1. For growth of these strains as unchal- lenged, challenged nonadapted, and challenged preadapted cultures, a single colony was inoculated into 5 ml Luria broth (LB) and grown with aeration at 37°C for 8 to 10 h (to an A 660 of at least 2.5). Fifty-microliter aliquots of this culture were then used to inoculate three fresh cultures in 20-ml test tubes: one containing 5 ml of unamended LB, one containing 5 ml of LB plus 250 M K 2 CrO 4 , and one containing 10 ml of LB plus 250 MK 2 CrO 4 . Following 14 h of overnight growth (with aeration at 37°C) the A 660 of each culture was mea- sured. Typically, the A 660 of the 5-ml chromate-amended overnight culture was * Corresponding author. Mailing address: Department of Microbi- ology and Immunology, Sherman Fairchild Science Building, Stanford University School of Medicine, 299 Campus Drive, Stanford, CA 94305. Phone: (650) 725-4745. Fax: (650) 725-6757. E-mail: a.matin@stanford .edu. 3371 on December 6, 2014 by guest http://jb.asm.org/ Downloaded from
-
Upload
independent -
Category
Documents
-
view
2 -
download
0
Transcript of Effect of Chromate Stress on Escherichia coli K-12

JOURNAL OF BACTERIOLOGY, May 2006, p. 3371–3381 Vol. 188, No. 90021-9193/06/$08.00�0 doi:10.1128/JB.188.9.3371–3381.2006Copyright © 2006, American Society for Microbiology. All Rights Reserved.
Effect of Chromate Stress on Escherichia coli K-12D. F. Ackerley,1,2 Y. Barak,1 S. V. Lynch,1 J. Curtin,3 and A. Matin1*
Department of Microbiology and Immunology, Sherman Fairchild Science Building, Stanford University School of Medicine,299 Campus Drive, Stanford, California 943051; School of Biological Sciences, Victoria University of Wellington, PO Box 600,
Wellington, New Zealand2; and Centers for Disease Control and Prevention, Atlanta, Georgia 303333
Received 15 December 2005/Accepted 19 February 2006
The nature of the stress experienced by Escherichia coli K-12 exposed to chromate, and mechanisms that mayenable cells to withstand this stress, were examined. Cells that had been preadapted by overnight growth in thepresence of chromate were less stressed than nonadapted controls. Within 3 h of chromate exposure, the latterceased growth and exhibited extreme filamentous morphology; by 5 h there was partial recovery with resto-ration of relatively normal cell morphology. In contrast, preadapted cells were less drastically affected in theirmorphology and growth. Cellular oxidative stress, as monitored by use of an H2O2-responsive fluorescent dye,was most severe in the nonadapted cells at 3 h postinoculation, lower in the partially recovered cells at 5 hpostinoculation, and lower still in the preadapted cells. Chromate exposure depleted cellular levels of reducedglutathione and other free thiols to a greater extent in nonadapted than preadapted cells. In both cell types,the SOS response was activated, and levels of proteins such as SodB and CysK, which can counter oxidativestress, were increased. Some mutants missing antioxidant proteins (SodB, CysK, YieF, or KatE) were moresensitive to chromate. Thus, oxidative stress plays a major role in chromate toxicity in vivo, and cellulardefense against this toxicity involves activation of antioxidant mechanisms. As bacterial chromate bioreme-diation is limited by the toxicity of chromate, minimizing oxidative stress during bacterial chromate reductionand bolstering the capacity of these organisms to deal with this stress will improve their effectiveness inchromate bioremediation.
Chromate [Cr(VI)] is a widespread environmental pollutant,as it is a by-product of numerous industrial processes andnuclear weapons production (5). Because chromate is soluble,environmental contamination is difficult to contain. This solu-bility also promotes the active transport of chromate acrossbiological membranes (7), and once internalized by cells, Cr(VI)exhibits a variety of toxic, mutagenic, and carcinogenic effects(34, 44). In contrast, most cells are impermeable to Cr(III),which is insoluble under typical environmental conditions (30);as measured by the Ames test, it is therefore some 1,000-foldless mutagenic than Cr(VI) (19). Thus, strategies for decon-tamination of environmental chromate focus on reducing it toCr(III). Chemical methods for this are prohibitively expensivefor large-scale environmental application and frequently havedamaging consequences of their own (7), and so bacterialbioremediation is of considerable interest as an environmen-tally friendly and affordable solution to chromate pollution.
Several bacteria, including Escherichia coli, Shewanella onei-densis, and numerous species of Pseudomonas and Bacillus, canreduce Cr(VI) to Cr(III) (17, 39); nonetheless, an effectivebacterial system for in situ reduction has not yet been devel-oped. One reason is that chromate is also toxic to the reme-diating bacteria (17). Our in vitro studies have strongly impli-cated oxidative stress generated by chromate as a major causeof this toxicity (1, 2, 3). A wide range of bacterial enzymes andother cellular constituents reduce Cr(VI) by one-electron re-duction, generating the highly reactive radical Cr(V), which
redox cycles (2, 13, 16, 33). In this process, Cr(V) is oxidizedback to Cr(VI), giving its electron to molecular oxygen andgenerating reactive oxygen species (ROS). Repetition of thisprocess produces large quantities of ROS, subjecting the cellsto severe oxidative stress. Our proposed strategy to improvebacterial capacity to remediate chromate is therefore based onminimizing ROS production during chromate reduction. Thisapproach envisages enhancing the efficacy of enzymes whichcatalyze primarily a one-step transformation of Cr(VI) toCr(III), avoiding generation of Cr(V) (1, 2; Y. Barak, D. F.Ackerley, B. Lal, and A. Matin, unpublished data).
However, the prooxidant effect of chromate in bacteria hasnot been demonstrated in vivo, and since countering it is cen-tral to our strategy for improving bacterial chromate remedia-tion, we have now examined the effects of chromate at thecellular level in E. coli. We observed that chromate exposureinduced aberrant cell morphology and other effects and thatthese effects were markedly altered in cells that had beenpreadapted to chromate. As these effects were the result ofphysiological changes, they afforded a good experimental sys-tem to gain insight into these changes and determine the roleof the potential prooxidant effect of chromate in vivo.
MATERIALS AND METHODS
Bacterial strains and growth conditions. The E. coli K-12 strains that wereused in this study are listed in Table 1. For growth of these strains as unchal-lenged, challenged nonadapted, and challenged preadapted cultures, a singlecolony was inoculated into 5 ml Luria broth (LB) and grown with aeration at37°C for 8 to 10 h (to an A660 of at least 2.5). Fifty-microliter aliquots of thisculture were then used to inoculate three fresh cultures in 20-ml test tubes: onecontaining 5 ml of unamended LB, one containing 5 ml of LB plus 250 �MK2CrO4, and one containing 10 ml of LB plus 250 �M K2CrO4. Following 14 hof overnight growth (with aeration at 37°C) the A660 of each culture was mea-sured. Typically, the A660 of the 5-ml chromate-amended overnight culture was
* Corresponding author. Mailing address: Department of Microbi-ology and Immunology, Sherman Fairchild Science Building, StanfordUniversity School of Medicine, 299 Campus Drive, Stanford, CA 94305.Phone: (650) 725-4745. Fax: (650) 725-6757. E-mail: [email protected].
3371
on Decem
ber 6, 2014 by guesthttp://jb.asm
.org/D
ownloaded from
between 2.0 and 2.5: if so, this was used as the inoculum for the challengedpreadapted culture; if not, the 10-ml chromate-amended overnight culture wasused, provided its A660 was between 2.0 and 2.5. The overnight culture grown inunamended LB was used to inoculate both the unchallenged and the challengednonadapted cultures. Unchallenged, challenged nonadapted, and challengedpreadapted cultures were grown from a starting A660 of 0.1 in 20 ml LB con-taining 250 �M K2CrO4 as appropriate, at 37°C with aeration, in 50-ml unbaffledflasks.
Assays. For shaken-flask growth assays, A660 was measured using a Shimadzutemperature-controlled UV/visible spectrophotometer, with cultures diluted 1/10in LB to measure A660s of �1. MIC50 (defined as the lowest concentration ofchromate required to reduce cell growth in a microtiter plate well by 50%relative to the unexposed control) assays were conducted in the innermost 60wells of 96-well plates, the outer wells being filled with 250 �l H2O to minimizeevaporation. Triplicate 10-well series of 200-�l LB aliquots containing increasingconcentrations of K2CrO4 were inoculated to a starting A660 of 0.1 for eachstrain. An increasing series of 0 to 450 �M chromate with 50 �M increments wasused for all strains except those from the Keio collection, which were moreresistant; with the Keio strains, 0, 100, 200, 250, 300, 350, 400, 500, 600, and 700�M concentrations were used. Plates were grown with shaking at 37°C for 8 h,after which the H2O in one of the outer wells was replaced with 200 �l LB as ablank, and the A660 for each well was read in a BioTek microplate S330 platereader.
Reduced glutathione and total cell thiol measurements were made using aglutathione assay kit (Calbiochem, San Diego, CA). Protein concentrations weremeasured with a Bio-Rad Dc protein assay kit using bovine serum albumin as thestandard. Whole-cell chromate reduction assays were performed as previouslydescribed (2) except that they were normalized against protein concentrationrather than A660. Cells from each culture were resuspended to a final proteinconcentration of 7.5 mg · ml�1 in LB containing 400 �M K2CrO4 (equivalent toa final A660 of around 8.0 for the unchallenged cells) and incubated with aerationat 37°C for 1 h, with residual chromate being measured by the diphenyl carbazidemethod (2) every 10 min. �-Galactosidase activity was measured as previouslydescribed (20) except that activity was normalized against cellular protein con-centration rather than A660, with 1 Miller Unit (MU) defined as �A574/min/mgprotein. Thin-layer chromatography ppGpp assays were conducted as describedpreviously (40).
2D-PAGE. Two-dimensional polyacrylamide gel electrophoresis (2D-PAGE)was performed according to the method of O’Farrell (27) by Kendrick Labs,Inc. (Madison, WI). Samples (5.0 ml/culture A660) were collected from unchal-lenged, challenged nonadapted, and challenged preadapted cultures of E. coli
strain AMS6 at 3 h and 5 h postinoculation. Cells were pelleted by centrifugation,and protein samples were prepared by addition of 300 �l osmotic lysis buffer(Kendrick Labs, Inc.) containing 10� protease inhibitor and nuclease stock. Onehundred microliters of sodium dodecyl sulfate (SDS) boiling buffer minus �-mer-captoethanol was added to each sample, and samples were boiled for 5 min, afterwhich protein concentrations were estimated using a bicinchoninic acid assay(Pierce Chemical Co., Rockford, IL). Samples were then lyophilized, redissolvedto 6 mg · ml�1 protein in SDS boiling buffer, and heated in a boiling water bathfor 3 min prior to loading. Isoelectric focusing was carried out in 3.5-mm-inner-diameter glass tubes using 2% (wt/vol) pH 4 to 8 ampholines (Gallard-Schlesinger Industries, Inc., Garden City, NY) for 20,000 V · h. Fifty nanogramsof an isoelectric focusing internal standard, tropomyosin, was added to eachsample prior to loading, giving two polypeptide spots with similar pIs; the lowerspot, with a molecular weight of 33,000 and pI 5.2, is marked with an arrow oneach 2D gel image. After reaching equilibrium in SDS sample buffer (10%[wt/vol] glycerol, 50 mM dithiothreitol, 2.3% [wt/vol] SDS, and 62.5 mM Tris, pH6.8), each tube gel was sealed to the top of a stacking gel overlaying a 10%(wt/vol) acrylamide slab gel (0.75 mm thick). SDS slab gel electrophoresis wascarried out for 5 h at 25 mA/gel. Molecular mass standards were added to theagarose that sealed the tube gel to the slab gel, and these standards appear ashorizontal lines on the Coomassie blue-stained 10% acrylamide slab gels. Gelswere dried between sheets of cellophane paper with the acid edge to the left.
Analysis of spots on 2D-PAGE gels. Gel analysis was performed by KendrickLabs, Inc. (Madison, WI). Duplicate gels were obtained as described above, andone gel from each pair was scanned with a laser densitometer (model PDSI;Molecular Dynamics Inc., Sunnyvale, CA). The scanner was checked for linearityprior to scanning with a calibrated neutral-density filter set (Melles Griot, Irvine,CA). The images were analyzed using Nonlinear Technology Progenesis software(version 2003.03) such that all major spots and all changing spots were outlined,quantified, and matched on all the gels. The general method of computerizedanalysis for these pairs included automatic spot finding and quantification, au-tomatic background subtraction (Progenesis algorithm), and automatic spotmatching in conjunction with detailed manual checking of the spot-finding and-matching functions. The spot intensities on each gel were expressed as a per-centage of the total density of all spots on the gel and averaged between dupli-cate gels. These values were then compared for equivalent spots on different gels,with threefold or greater differences in intensity regarded as significant up- ordown-regulation of individual proteins. Twenty clearly delineated spots whoseintensity was significantly altered were excised and sent to the Protein ChemistryCore Facility of Columbia University for matrix-assisted laser desorption ioniza-tion mass spectrometry (MALDI-MS) fingerprinting; of these, 18 were success-
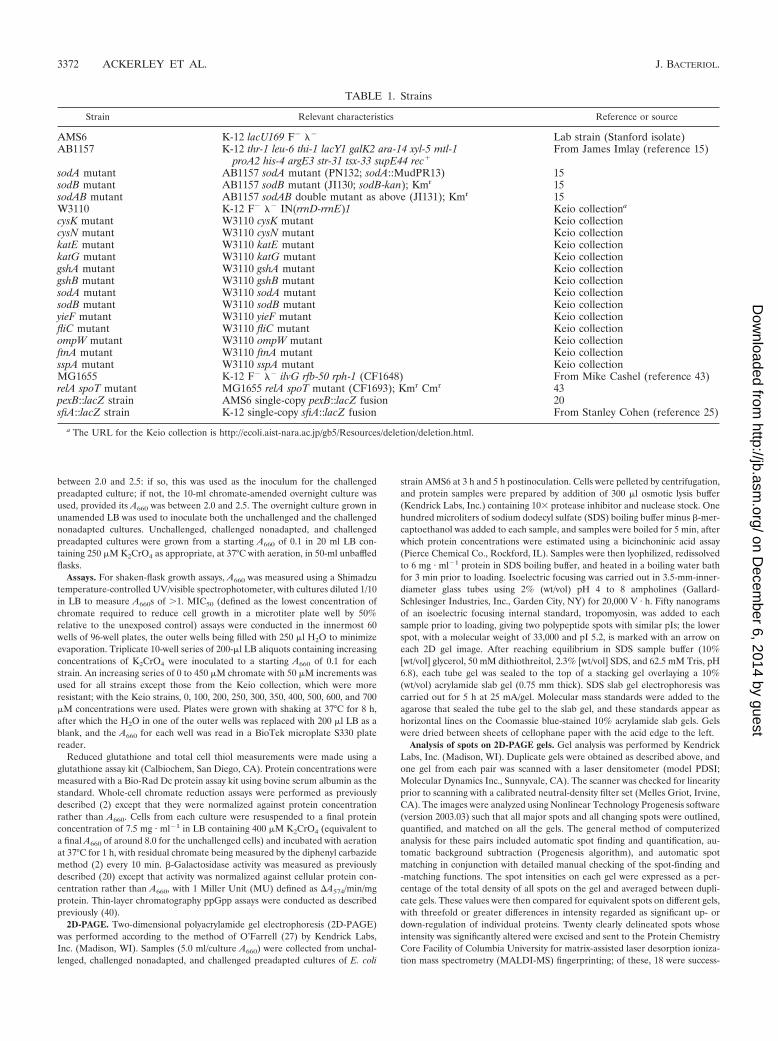
TABLE 1. Strains
Strain Relevant characteristics Reference or source
AMS6 K-12 lacU169 F� �� Lab strain (Stanford isolate)AB1157 K-12 thr-1 leu-6 thi-1 lacY1 galK2 ara-14 xyl-5 mtl-1
proA2 his-4 argE3 str-31 tsx-33 supE44 rec�From James Imlay (reference 15)
sodA mutant AB1157 sodA mutant (PN132; sodA::MudPR13) 15sodB mutant AB1157 sodB mutant (JI130; sodB-kan); Kmr 15sodAB mutant AB1157 sodAB double mutant as above (JI131); Kmr 15W3110 K-12 F� �� IN(rrnD-rrnE)1 Keio collectiona
cysK mutant W3110 cysK mutant Keio collectioncysN mutant W3110 cysN mutant Keio collectionkatE mutant W3110 katE mutant Keio collectionkatG mutant W3110 katG mutant Keio collectiongshA mutant W3110 gshA mutant Keio collectiongshB mutant W3110 gshB mutant Keio collectionsodA mutant W3110 sodA mutant Keio collectionsodB mutant W3110 sodB mutant Keio collectionyieF mutant W3110 yieF mutant Keio collectionfliC mutant W3110 fliC mutant Keio collectionompW mutant W3110 ompW mutant Keio collectionftnA mutant W3110 ftnA mutant Keio collectionsspA mutant W3110 sspA mutant Keio collectionMG1655 K-12 F� �� ilvG rfb-50 rph-1 (CF1648) From Mike Cashel (reference 43)relA spoT mutant MG1655 relA spoT mutant (CF1693); Kmr Cmr 43pexB::lacZ strain AMS6 single-copy pexB::lacZ fusion 20sfiA::lacZ strain K-12 single-copy sfiA::lacZ fusion From Stanley Cohen (reference 25)
a The URL for the Keio collection is http://ecoli.aist-nara.ac.jp/gb5/Resources/deletion/deletion.html.
3372 ACKERLEY ET AL. J. BACTERIOL.
on Decem
ber 6, 2014 by guesthttp://jb.asm
.org/D
ownloaded from

fully identified. For each of these, the measured molecular mass and pI wereconsistent with those calculated from sequence data (NCBI databases; http://www4.ncbi.nlm.nih.gov/entrez/query.fcgi) using PeptideMass (http://us.expasy.org/tools/peptide-mass.html). Protein functions were annotated for Tables 2 and 3 withassistance from EcoCyc databases (http://ecocyc.org/).
Scanning electron microscopy. Samples (5 ml) were collected from unchal-lenged, challenged nonadapted, and challenged preadapted cultures at 3 h and 5 hpostinoculation and fixed by addition of 5 ml of 2% glutaraldehyde in 10 mMTris-HCl (pH 7.5). The cells were centrifuged at 4,000 � g for 15 min and resus-pended in 5 ml of 10 mM phosphate-buffered saline (PBS; pH 7.0). Aliquots of 1 mlof each resuspended sample were passed through a 0.1-�m membrane filter (Nucle-pore, CA) and the filters dehydrated through a series of aqueous ethanol (30 to100%) for durations of 10 to 15 min. Specimen filters were subsequently immersedin hexamethyldisilazane (Polysciences Inc., PA) and allowed to dry overnight atroom temperature. Samples were mounted on aluminum stubs with quick-dryingsilver paint (Ted Pella Inc., CA), coated in gold (Polaron SC7640 Sputter Coater;Thermo VG Scientific, United Kingdom), and viewed and photographed with aPhilips XL30 ESEM scanning electron microscope.
Fluorescence microscopy. Samples (0.5 ml/culture A660) were collected fromunchallenged, challenged nonadapted, and challenged preadapted cultures at 3 h
and 5 h postinoculation, pelleted by centrifugation, washed once in PBS,resuspended in LB containing 30 �M 2, 7-dihydrodichlorofluorescein diac-etate (H2DCFDA), and incubated in the dark with rotation for 10 min at 37°C.Each sample was then pelleted by centrifugation, washed once in PBS, repel-leted, and resuspended in 50 �l PBS. Five microliters was spotted onto a glassmicroscope slide and allowed to air dry in the dark. Five microliters of Vecta-shield (Vector Inc., CA) fluorescence antiquenching mounting medium wasspotted on top of the air-dried sample and covered with a glass coverslip.Samples were visualized at 1,000� magnification on an Olympus BX60 uprightfluorescence microscope, and black-and-white images were captured with aHamamatsu Orca100 charge-coupled device through a green filter and pseudo-colored with identical settings for each image using Image Pro Plus 5.0.
RESULTS
Chromate has a marked effect on cell morphology andgrowth kinetics. Unless otherwise stated, the K2CrO4 concen-tration used was 250 �M. In chromate-amended LB medium,
TABLE 2. Changes in protein expression: challenged nonadapted versus unchallenged cells
Growth timeand spot no. Proteina Gene Expression changeb Known or suspected function
3 h1 Flagellin fliC 11-fold down Flagellar subunit2 ADP-L-glycero-D-manno-heptose-6-epimerase hldD 4.1-fold down Lipopolysaccharide biosynthesis
5 h3 Superoxide dismutase (ferric; chain B) sodB ��� Decomposition of O2 · �
4 Sulfate adenylyl transferase cysN 6.3-fold up Cysteine biosynthesis5 Cysteine synthase A cysK 4.1-fold up Cysteine biosynthesis1 Flagellin fliC — Flagellar subunit2 ADP-L-glycero-D-manno-heptose-6-epimerase hldD 3.8-fold down Lipopolysaccharide biosynthesis6 Cytoplasmic ferritin ftnA 3.8-fold down Iron storage7 Putative formate acetyl transferase yfiD 3.3-fold down Unknown
a The proteins in spots 3, 4, and 5 were up-regulated by chromate challenge; all other proteins in the table were down-regulated by chromate.b ��� indicates a spot detected only on the challenged nonadapted gel; — indicates a spot detected only on the unchallenged gel.
TABLE 3. Changes in protein expression: challenged preadapted versus challenged nonadapted cells
Growth timeand spot no. Proteina Gene Expression changeb Known or suspected function
3 h8 Alkane sulfonate monooxygenase ssuD ��� Conversion of alkane sulfonates to aldehyde plus sulfite;
induced by sulfur limitation9 Stringent starvation protein A sspA ��� Starvation/stress response; indirect �ve regulator of s
(by �ve regulation H-NS)10 Pyruvate dehydrogenase aceF 4.9-fold up Intermediary metabolism11 Glycyl-tRNA synthetase (�-chain) glyS 3.4-fold up Protein synthesis12 Trehalose-6-phosphate hydrolase treC 3.3-fold up Trehalose degradation; down-regulated by osmotic stress13 Outer membrane protein W ompW — Colicin receptor; putative general stress response protein14 Uncharacterized; glycolate operon glcG — Unknown; suspected antioxidant protein15 Carbamoyl-phosphate synthase A carA 6.1-fold down Carbamoyl phosphate (precursor of arginine and
pyrimidines) synthesis16 Periplasmic dipeptide transport protein dppA 4.8-fold down Dipeptide transport; starvation stress
5 h1 Flagellin fliC ��� Flagellar subunit8 Alkane sulfonate monooxygenase ssuD ��� Conversion of alkane sulfonates to aldehyde plus sulfite;
induced by sulfur limitation17 Malate synthase A aceB 5.4-fold up Intermediary metabolism13 Outer membrane protein W ompW — Colicin receptor; putative general stress response protein18 Outer membrane protein A ompA 3.8-fold down Colicin receptor; down-regulated by starvation
a The proteins in spots 8, 9, 10, 11, and 12 for cells grown for 3 h and spots 1, 8, and 17 for cells grown for 5 h were up-regulated by preadaptation. All other proteinsin the table were down-regulated by preadaptation.
b ��� indicates a spot detected only on the challenged preadapted gel; — indicates a spot detected only on the challenged nonadapted gel.
VOL. 188, 2006 EFFECT OF CHROMATE STRESS ON E. COLI 3373
on Decem
ber 6, 2014 by guesthttp://jb.asm
.org/D
ownloaded from
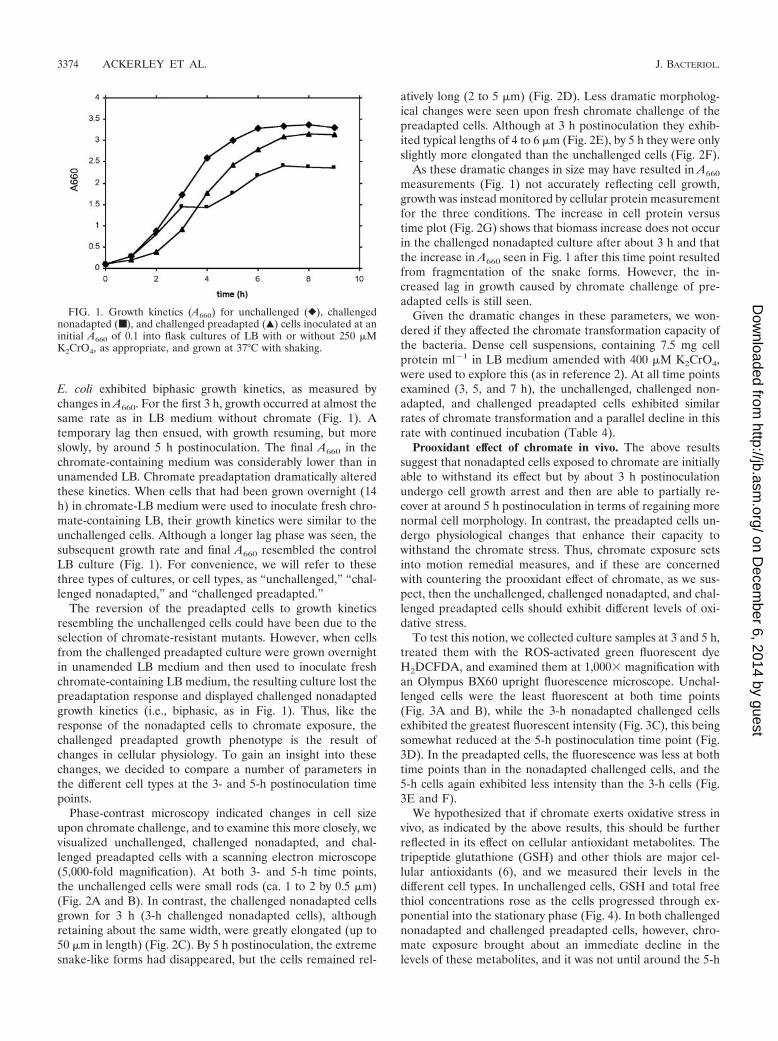
E. coli exhibited biphasic growth kinetics, as measured bychanges in A660. For the first 3 h, growth occurred at almost thesame rate as in LB medium without chromate (Fig. 1). Atemporary lag then ensued, with growth resuming, but moreslowly, by around 5 h postinoculation. The final A660 in thechromate-containing medium was considerably lower than inunamended LB. Chromate preadaptation dramatically alteredthese kinetics. When cells that had been grown overnight (14h) in chromate-LB medium were used to inoculate fresh chro-mate-containing LB, their growth kinetics were similar to theunchallenged cells. Although a longer lag phase was seen, thesubsequent growth rate and final A660 resembled the controlLB culture (Fig. 1). For convenience, we will refer to thesethree types of cultures, or cell types, as “unchallenged,” “chal-lenged nonadapted,” and “challenged preadapted.”
The reversion of the preadapted cells to growth kineticsresembling the unchallenged cells could have been due to theselection of chromate-resistant mutants. However, when cellsfrom the challenged preadapted culture were grown overnightin unamended LB medium and then used to inoculate freshchromate-containing LB medium, the resulting culture lost thepreadaptation response and displayed challenged nonadaptedgrowth kinetics (i.e., biphasic, as in Fig. 1). Thus, like theresponse of the nonadapted cells to chromate exposure, thechallenged preadapted growth phenotype is the result ofchanges in cellular physiology. To gain an insight into thesechanges, we decided to compare a number of parameters inthe different cell types at the 3- and 5-h postinoculation timepoints.
Phase-contrast microscopy indicated changes in cell sizeupon chromate challenge, and to examine this more closely, wevisualized unchallenged, challenged nonadapted, and chal-lenged preadapted cells with a scanning electron microscope(5,000-fold magnification). At both 3- and 5-h time points,the unchallenged cells were small rods (ca. 1 to 2 by 0.5 �m)(Fig. 2A and B). In contrast, the challenged nonadapted cellsgrown for 3 h (3-h challenged nonadapted cells), althoughretaining about the same width, were greatly elongated (up to50 �m in length) (Fig. 2C). By 5 h postinoculation, the extremesnake-like forms had disappeared, but the cells remained rel-
atively long (2 to 5 �m) (Fig. 2D). Less dramatic morpholog-ical changes were seen upon fresh chromate challenge of thepreadapted cells. Although at 3 h postinoculation they exhib-ited typical lengths of 4 to 6 �m (Fig. 2E), by 5 h they were onlyslightly more elongated than the unchallenged cells (Fig. 2F).
As these dramatic changes in size may have resulted in A660
measurements (Fig. 1) not accurately reflecting cell growth,growth was instead monitored by cellular protein measurementfor the three conditions. The increase in cell protein versustime plot (Fig. 2G) shows that biomass increase does not occurin the challenged nonadapted culture after about 3 h and thatthe increase in A660 seen in Fig. 1 after this time point resultedfrom fragmentation of the snake forms. However, the in-creased lag in growth caused by chromate challenge of pre-adapted cells is still seen.
Given the dramatic changes in these parameters, we won-dered if they affected the chromate transformation capacity ofthe bacteria. Dense cell suspensions, containing 7.5 mg cellprotein ml�1 in LB medium amended with 400 �M K2CrO4,were used to explore this (as in reference 2). At all time pointsexamined (3, 5, and 7 h), the unchallenged, challenged non-adapted, and challenged preadapted cells exhibited similarrates of chromate transformation and a parallel decline in thisrate with continued incubation (Table 4).
Prooxidant effect of chromate in vivo. The above resultssuggest that nonadapted cells exposed to chromate are initiallyable to withstand its effect but by about 3 h postinoculationundergo cell growth arrest and then are able to partially re-cover at around 5 h postinoculation in terms of regaining morenormal cell morphology. In contrast, the preadapted cells un-dergo physiological changes that enhance their capacity towithstand the chromate stress. Thus, chromate exposure setsinto motion remedial measures, and if these are concernedwith countering the prooxidant effect of chromate, as we sus-pect, then the unchallenged, challenged nonadapted, and chal-lenged preadapted cells should exhibit different levels of oxi-dative stress.
To test this notion, we collected culture samples at 3 and 5 h,treated them with the ROS-activated green fluorescent dyeH2DCFDA, and examined them at 1,000� magnification withan Olympus BX60 upright fluorescence microscope. Unchal-lenged cells were the least fluorescent at both time points(Fig. 3A and B), while the 3-h nonadapted challenged cellsexhibited the greatest fluorescent intensity (Fig. 3C), this beingsomewhat reduced at the 5-h postinoculation time point (Fig.3D). In the preadapted cells, the fluorescence was less at bothtime points than in the nonadapted challenged cells, and the5-h cells again exhibited less intensity than the 3-h cells (Fig.3E and F).
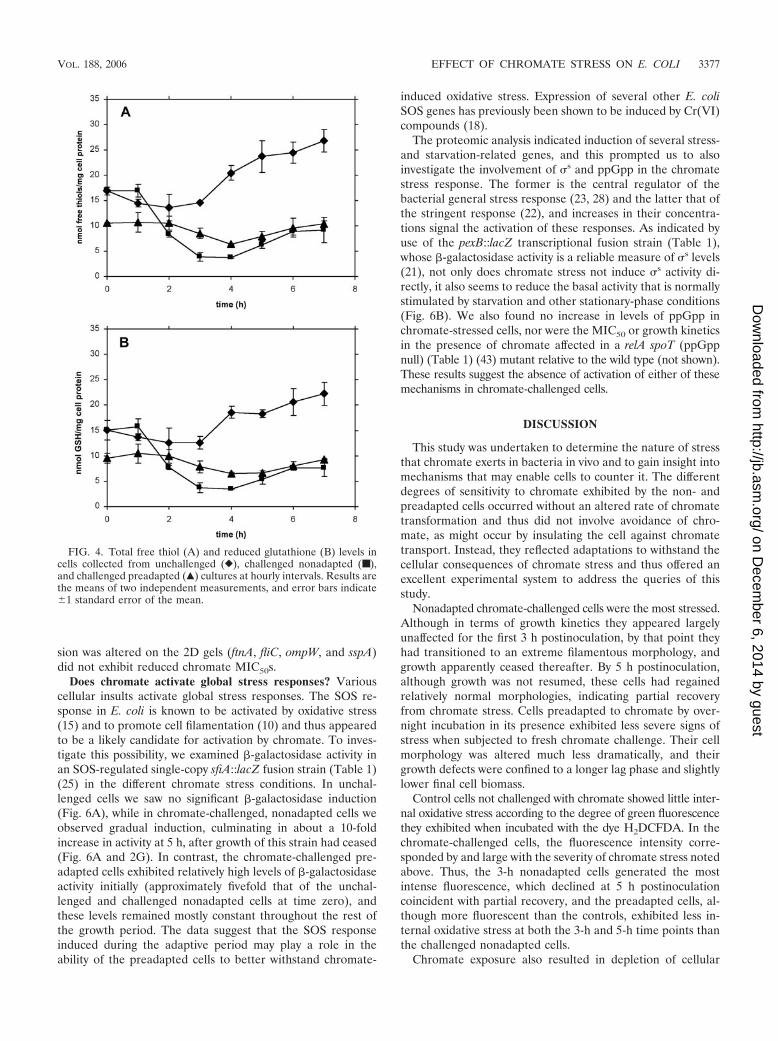
We hypothesized that if chromate exerts oxidative stress invivo, as indicated by the above results, this should be furtherreflected in its effect on cellular antioxidant metabolites. Thetripeptide glutathione (GSH) and other thiols are major cel-lular antioxidants (6), and we measured their levels in thedifferent cell types. In unchallenged cells, GSH and total freethiol concentrations rose as the cells progressed through ex-ponential into the stationary phase (Fig. 4). In both challengednonadapted and challenged preadapted cells, however, chro-mate exposure brought about an immediate decline in thelevels of these metabolites, and it was not until around the 5-h
FIG. 1. Growth kinetics (A660) for unchallenged (}), challengednonadapted (■), and challenged preadapted (Œ) cells inoculated at aninitial A660 of 0.1 into flask cultures of LB with or without 250 �MK2CrO4, as appropriate, and grown at 37°C with shaking.
3374 ACKERLEY ET AL. J. BACTERIOL.
on Decem
ber 6, 2014 by guesthttp://jb.asm
.org/D
ownloaded from

time point that these levels began to recover (Fig. 4). Further-more, consistent with the fluorescence microscopy results in-dicating heightened levels of oxidative stress in the challengednonadapted cells (Fig. 3), free thiol and GSH levels declinedmore sharply, and to a greater extent, in nonadapted than inpreadapted cells (Fig. 4).
To gain further insight into the physiological effects of chro-mate exposure, we compared the 2D gel pattern of differentcell types at the 3-h (Fig. 5A) and 5-h (Fig. 5B) time points.The identities of selected protein spots were also determined,as described in Materials and Methods, and are summarized inTable 2 for challenged nonadapted versus unchallenged cellsand Table 3 for challenged preadapted versus challenged non-adapted cells.
FIG. 2. Representative scanning electron micrographs (5,000� magnification) of cells from unchallenged (A, 3 h postinoculation; B, 5 hpostinoculation), challenged nonadapted (C, 3 h postinoculation; D, 5 h postinoculation), and challenged preadapted (E, 3 h postinoculation; F,5 h postinoculation) cultures. In all figures, the scale bar indicates 5 �m. (G) Cellular protein concentration (mg · ml�1) of samples collected fromunchallenged (}), challenged nonadapted (■), and challenged preadapted (Œ) cultures at hourly intervals.
TABLE 4. Chromate reduction ratesa
Cell growthtime
Time postresus-pension (min)
Residual chromate in medium (�M)
Unchallenged Nonadapted Preadapted
3 h 0 400 400 40030 304 309 30660 263 264 255
5 h 0 400 400 40030 325 318 32160 282 276 280
7 h 0 400 400 40030 334 337 32860 301 296 290
a Duplicate independent experiments were conducted. All errors (1 standarddeviation) were within � 4%.
VOL. 188, 2006 EFFECT OF CHROMATE STRESS ON E. COLI 3375
on Decem
ber 6, 2014 by guesthttp://jb.asm
.org/D
ownloaded from

Chromate challenge in nonadapted cells caused down-regu-lation of two proteins at the 3-h time point (Table 2), neitherof which appears to be related to oxidative stress. However, atthe 5-h time point this condition resulted in the synthesis orup-regulation of three proteins with potential antioxidant roles,Fe-superoxide dismutase (SodB, decomposition of O2 · �), sul-fate adenylyl transferase, and cysteine synthase (CysN and CysK,respectively, which by contributing to cysteine biosynthesis canaugment cellular thiol pools). Each of these enzymes is typicallyup-regulated in bacteria subjected to oxidative stress (9, 26, 29). Itshould also be noted that up-regulation of these proteins at the5-h time point coincides with the partial recovery from chromatestress as reflected by restoration of relatively normal cell mor-phology (Fig. 2D), reduced cellular oxidative stress as monitoredby H2DCFDA-mediated fluorescence (Fig. 3D), and partial re-plenishment of cellular thiols (Fig. 4). Four proteins were down-regulated at this time point (Table 2).
Consistent with an active role in cell recovery from chromatestress, CysN and CysK were further up-regulated in chromate-challenged preadapted cells relative to the nonadapted cells,although not beyond our threefold significance criteria (up-regulated 2.24- and 1.86-fold, respectively, at 3 h and 1.35- and1.15-fold at 5 h). An additional protein, alkane sulfonatemonooxygenase, which may have a role in thiol biosynthesis, asit provides a source of sulfur (11), was also induced in chro-mate-preadapted cells at both the 3-h and 5-h time points(Table 3). Other proteins up- or down-regulated in both typesof cells included flagellar synthesis, intermediary metabolism,and various stress-responsive proteins.
The above results provide in vivo evidence of chromate-
mediated oxidative stress and suggest that the cell attempts tocounter it by inducing antioxidant proteins. It can thus bepredicted that mutants missing antioxidant proteins will showgreater sensitivity to chromate. We tested this premise by com-paring the MIC50s for chromate between a range of isogenicsingle-gene knockout mutants and the wild type grown inshaken microtiter plate wells, as described in Materials andMethods. Several of the oxidative stress mutants examineddisplayed a lowered MIC50 for chromate relative to their iso-genic wild type (Table 5). This was seen for the katE catalasemutant; the chromate reductase and putative H2O2-quenchingquinone reductase yieF mutant (1, 12); and two mutants lack-ing enzymes up-regulated by chromate in the 2D gel analysis,the cysK and sodB mutants (Fig. 5 and Tables 2 and 3). Incontrast, the katG catalase mutant, the cysN mutant, the sodA(manganese) superoxide dismutase mutant, and interestingly,given the results presented in Fig. 4B, the glutathione biosyn-thesis mutants gshA and gshB did not have reduced chromateMIC50s. The sodA mutant MIC50 in fact appeared to be slightlyincreased, but in different E. coli K-12 mutants (strain AB1157;Table 1), we did not observe this. Wild-type AB1157 and itsisogenic sodA and sodB mutants all displayed an MIC50 forchromate of 250 �M, but the isogenic sodAB double mutantexhibited an MIC50 of 150 �M. The latter results suggest aprotective role for both SodA and SodB and also emphasizethat there is likely to be some functional redundancy betweendifferent antioxidant enzymes, buffering the effect of individualknockout mutations on MIC50s.
Mutants lacking some of the other proteins whose expres-
FIG. 3. Representative fluorescent micrographs (1,000� magnification) of cells from unchallenged (A, 3 h postinoculation; B, 5 h postinocu-lation), challenged nonadapted (C, 3 h postinoculation; D, 5 h postinoculation), and challenged preadapted (E, 3 h postinoculation; F, 5 hpostinoculation) cultures treated with the H2O2-activated green fluorescent dye H2DCFDA as described in Materials and Methods. The increasedgreen fluorescence observed in the chromate-challenged cultures is indicative of heightened oxidative stress.
3376 ACKERLEY ET AL. J. BACTERIOL.
on Decem
ber 6, 2014 by guesthttp://jb.asm
.org/D
ownloaded from
sion was altered on the 2D gels (ftnA, fliC, ompW, and sspA)did not exhibit reduced chromate MIC50s.
Does chromate activate global stress responses? Variouscellular insults activate global stress responses. The SOS re-sponse in E. coli is known to be activated by oxidative stress(15) and to promote cell filamentation (10) and thus appearedto be a likely candidate for activation by chromate. To inves-tigate this possibility, we examined �-galactosidase activity inan SOS-regulated single-copy sfiA::lacZ fusion strain (Table 1)(25) in the different chromate stress conditions. In unchal-lenged cells we saw no significant �-galactosidase induction(Fig. 6A), while in chromate-challenged, nonadapted cells weobserved gradual induction, culminating in about a 10-foldincrease in activity at 5 h, after growth of this strain had ceased(Fig. 6A and 2G). In contrast, the chromate-challenged pre-adapted cells exhibited relatively high levels of �-galactosidaseactivity initially (approximately fivefold that of the unchal-lenged and challenged nonadapted cells at time zero), andthese levels remained mostly constant throughout the rest ofthe growth period. The data suggest that the SOS responseinduced during the adaptive period may play a role in theability of the preadapted cells to better withstand chromate-
induced oxidative stress. Expression of several other E. coliSOS genes has previously been shown to be induced by Cr(VI)compounds (18).
The proteomic analysis indicated induction of several stress-and starvation-related genes, and this prompted us to alsoinvestigate the involvement of s and ppGpp in the chromatestress response. The former is the central regulator of thebacterial general stress response (23, 28) and the latter that ofthe stringent response (22), and increases in their concentra-tions signal the activation of these responses. As indicated byuse of the pexB::lacZ transcriptional fusion strain (Table 1),whose �-galactosidase activity is a reliable measure of s levels(21), not only does chromate stress not induce s activity di-rectly, it also seems to reduce the basal activity that is normallystimulated by starvation and other stationary-phase conditions(Fig. 6B). We also found no increase in levels of ppGpp inchromate-stressed cells, nor were the MIC50 or growth kineticsin the presence of chromate affected in a relA spoT (ppGppnull) (Table 1) (43) mutant relative to the wild type (not shown).These results suggest the absence of activation of either of thesemechanisms in chromate-challenged cells.
DISCUSSION
This study was undertaken to determine the nature of stressthat chromate exerts in bacteria in vivo and to gain insight intomechanisms that may enable cells to counter it. The differentdegrees of sensitivity to chromate exhibited by the non- andpreadapted cells occurred without an altered rate of chromatetransformation and thus did not involve avoidance of chro-mate, as might occur by insulating the cell against chromatetransport. Instead, they reflected adaptations to withstand thecellular consequences of chromate stress and thus offered anexcellent experimental system to address the queries of thisstudy.
Nonadapted chromate-challenged cells were the most stressed.Although in terms of growth kinetics they appeared largelyunaffected for the first 3 h postinoculation, by that point theyhad transitioned to an extreme filamentous morphology, andgrowth apparently ceased thereafter. By 5 h postinoculation,although growth was not resumed, these cells had regainedrelatively normal morphologies, indicating partial recoveryfrom chromate stress. Cells preadapted to chromate by over-night incubation in its presence exhibited less severe signs ofstress when subjected to fresh chromate challenge. Their cellmorphology was altered much less dramatically, and theirgrowth defects were confined to a longer lag phase and slightlylower final cell biomass.
Control cells not challenged with chromate showed little inter-nal oxidative stress according to the degree of green fluorescencethey exhibited when incubated with the dye H2DCFDA. In thechromate-challenged cells, the fluorescence intensity corre-sponded by and large with the severity of chromate stress notedabove. Thus, the 3-h nonadapted cells generated the mostintense fluorescence, which declined at 5 h postinoculationcoincident with partial recovery, and the preadapted cells, al-though more fluorescent than the controls, exhibited less in-ternal oxidative stress at both the 3-h and 5-h time points thanthe challenged nonadapted cells.
Chromate exposure also resulted in depletion of cellular
FIG. 4. Total free thiol (A) and reduced glutathione (B) levels incells collected from unchallenged (}), challenged nonadapted (■),and challenged preadapted (Œ) cultures at hourly intervals. Results arethe means of two independent measurements, and error bars indicate�1 standard error of the mean.
VOL. 188, 2006 EFFECT OF CHROMATE STRESS ON E. COLI 3377
on Decem
ber 6, 2014 by guesthttp://jb.asm
.org/D
ownloaded from
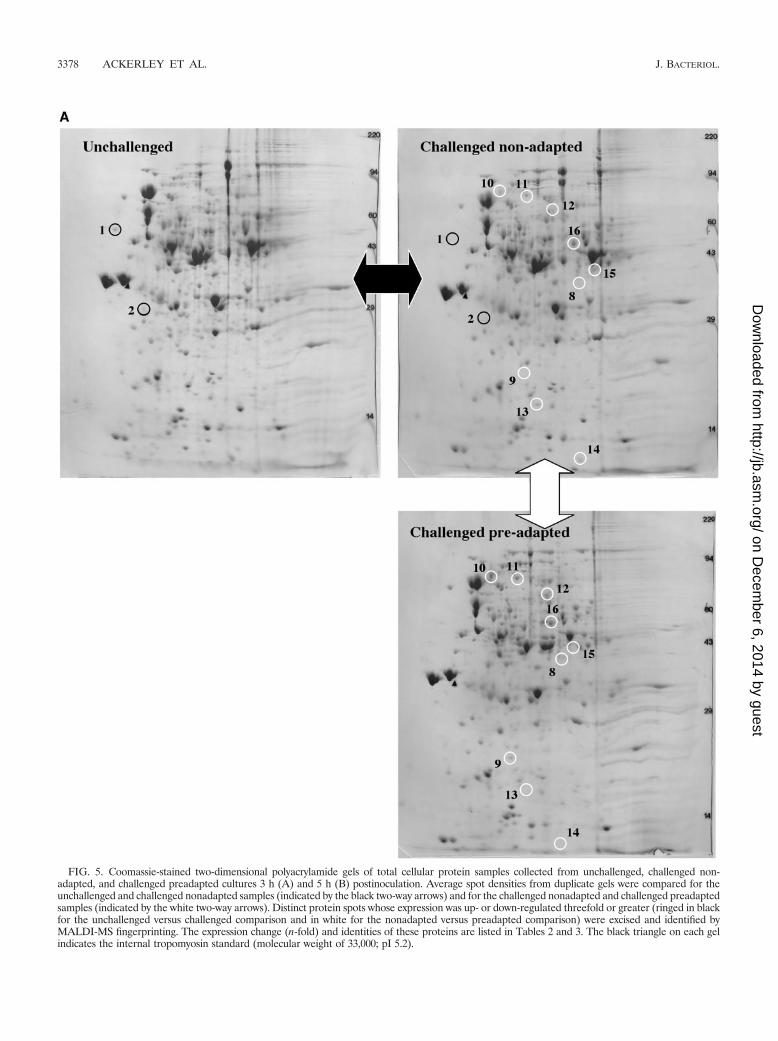
FIG. 5. Coomassie-stained two-dimensional polyacrylamide gels of total cellular protein samples collected from unchallenged, challenged non-adapted, and challenged preadapted cultures 3 h (A) and 5 h (B) postinoculation. Average spot densities from duplicate gels were compared for theunchallenged and challenged nonadapted samples (indicated by the black two-way arrows) and for the challenged nonadapted and challenged preadaptedsamples (indicated by the white two-way arrows). Distinct protein spots whose expression was up- or down-regulated threefold or greater (ringed in blackfor the unchallenged versus challenged comparison and in white for the nonadapted versus preadapted comparison) were excised and identified byMALDI-MS fingerprinting. The expression change (n-fold) and identities of these proteins are listed in Tables 2 and 3. The black triangle on each gelindicates the internal tropomyosin standard (molecular weight of 33,000; pI 5.2).
3378 ACKERLEY ET AL. J. BACTERIOL.
on Decem
ber 6, 2014 by guesthttp://jb.asm
.org/D
ownloaded from

GSH and other free thiols, with levels declining more rapidly,and to a greater extent, in nonadapted than preadapted cells.Levels of these metabolites began to be replenished coincidentwith reduction in internal oxidative stress and cellular recoveryas noted above. These events also coincided with the inductionof proteins likely to be involved in countering the oxidative
stress: SodB, CysN, and CysK (the latter enzyme having alsobeen found to provide E. coli with resistance to the heavy metalprooxidant tellurite [36]). Mutants missing some antioxidantdefense proteins, such as those encoded by sodB, cysK, andkatE, exhibited increased sensitivity to chromate. And the SOSresponse, which protects against oxidative stress, was activated
FIG. 5—Continued.
VOL. 188, 2006 EFFECT OF CHROMATE STRESS ON E. COLI 3379
on Decem
ber 6, 2014 by guesthttp://jb.asm
.org/D
ownloaded from

in preadapted cells. Taken together, the bulk of the data dem-onstrate that the prooxidant properties of chromate play amajor role in its toxicity in vivo and that cellular defenseagainst this toxicity involves activation of antioxidant mecha-nisms.
Although antioxidant capabilities of reduced glutathione arewell established, the gshA and gshB glutathione biosynthesismutants were not impaired in chromate MIC50. The reason forthis is not known but may be related to the fact that GSH canreact directly with chromate to form redox-cycling Cr(V) (32),can increase the incidence of Cr(VI)-induced DNA strandbreaks (35), and can lead to formation of glutathione-Cr(III)-DNA adducts (37). Thus, in the context of chromate challenge,whether GSH is of net benefit or liability to a cell is difficult toevaluate, with its usual ability to guard cellular constituentsagainst oxidative stress in conflict with its direct interactionswith chromium. Indeed, the lower initial levels of GSH in cellswhich had been preadapted to chromate (Fig. 4B) may actuallyhave contributed to the lower levels of oxidative stress ob-served in these cells. Consistent with this, Woods et al. (42)showed that when rat kidney cells were challenged with chro-mate, cells which had been grown on media enabling them tosustain eightfold normal intracellular GSH levels generatedhigher levels of ROS, and were less viable, than regular cells.Given these complexities, further work is required to establishany protective role for glutathione in defending against chro-mate stress.
The expression of several stress-responsive proteins was al-tered in chromate-preadapted cells (Table 3). These includedTreC (trehalose-6-phosphate hydrolase, affected by osmoticstress [8]); OmpA, OmpW, AceF, and DppA (outer membraneproteins A and W, pyruvate dehydrogenase, and periplasmicdipeptide transport protein, respectively, affected by pH, star-vation, and other stresses [24, 31, 38, 41]); and SspA (stringentstarvation protein A, a starvation, salt, and putative globalstress response regulator [14]). Although a coherent patternfor the expression of these diverse stress-responsive proteinswas hard to discern, we investigated several candidate stress
response systems to see if they might play some part in thechromate preadaptation phenotype. However, apart from thefact that the SOS response is likely induced by chromate, noevidence indicated the activation of these other global stressresponses.
Activation of the SOS response can provide resistance tofuture oxidative challenges (4), and this, together with thediminished initial levels of GSH present in chromate-pre-adapted cells, may provide an explanation for the increasedtolerance of these cells to subsequent chromate challenge. It isclear that chromate challenge places a substantial oxidativeburden upon both nonadapted and preadapted cells and there-fore that enhancing bacterial ability to minimize ROS gener-ation during chromate reduction, and to deal with oxidativestress, will improve the ability to remediate chromate. Apartfrom the obligatory two-electron chromate reducers we havepreviously proposed (1, 2), the present work identifies otherantioxidant proteins as possible targets of improvement in thisregard.
ACKNOWLEDGMENTS
We are grateful to David Alexander for assistance with fluorescencemicroscopy; Derek Wells for assistance with the ppGpp assays; Clau-dio Gonzalez, James Imlay, Mike Cashel, and Stanley Cohen for pro-
FIG. 6. �-Galactosidase activity determined during the growth ofsfiA::lacZ (A) and pexB::lacZ (B) single-copy fusion strains in unchal-lenged (}), challenged nonadapted (■), and challenged preadapted(Œ) cultures. Results are the means of three experimental replicates,and error bars indicate �1 standard error of the mean. The zero timevalues were omitted from panel B, as the very high activity in theunchallenged overnight culture was off scale (these values were thefollowing: unchallenged and challenged nonadapted, 209 � 15 MU;and challenged preadapted, 136 � 19 MU).
TABLE 5. MIC50s of E. coli W3110 mutants defective in known genesof antioxidant defense or encoding proteins whose expression was
altered on the 2D gels pictured in Fig. 5A and B
Strain ChromateMIC50 (�M)
Wild type ......................................................................................... 400cysK mutanta,b ................................................................................. 300cysN mutanta,b................................................................................. 400sodA mutantb .................................................................................. 450sodB mutanta,b ................................................................................ 350katE mutantb ................................................................................... 300katG mutantb .................................................................................. 400gshA mutantb................................................................................... 400gshB mutantb ................................................................................... 400yieF mutantb .................................................................................... 300fliC mutanta..................................................................................... 400ompW mutanta ................................................................................ 450ftnA mutanta.................................................................................... 400sspA mutanta ................................................................................... 400
a The proteins encoded by the missing gene had altered expression profiles on2D gels.
b These are oxidative stress mutants.
3380 ACKERLEY ET AL. J. BACTERIOL.
on Decem
ber 6, 2014 by guesthttp://jb.asm
.org/D
ownloaded from

viding strains; and Chris Miller for stimulating discussion and usefuladvice.
This work was supported by grants DE-FG03-97ER-624940, DE-FG02-96ER20228, and DE-FG02-05ER64122 from the Natural andAccelerated Bioremediation Program of the U.S. Department of En-ergy (to A.M.). D.F.A., Y.B., and S.V.L. were supported, in part, byFRST New Zealand Postdoctoral Fellowship STAX0101, a Lady DavisPostdoctoral Fellowship, and a Stanford Medical School Dean’s Fel-lowship, respectively.
REFERENCES
1. Ackerley, D. F., C. F. Gonzalez, C. H. Park, R. Blake, M. Keyhan, and A.Matin. 2004. Chromate-reducing properties of soluble flavoproteins fromPseudomonas putida and Escherichia coli. Appl. Environ. Microbiol. 70:873–882.
2. Ackerley, D. F., C. F. Gonzalez, M. Keyhan, R. Blake, and A. Matin. 2004.Mechanism of chromate reduction by the Escherichia coli protein, NfsA, andthe role of different chromate reductases in minimizing oxidative stressduring chromate reduction. Environ. Microbiol. 6:851–860.
3. Ackerley, D. F., C. F. Gonzalez, M. Keyhan, R. Blake, and A. Matin. 2005.Biomolecular strategy to decrease chromate toxicity to remediating bacteria,p. 259–268. In M. de Conceicao Cunha and C. A. Brebbia (ed.), Waterresources management III. WIT Press, Wessex, England.
4. Asad, N. R., L. M. Asad, A. B. Silva, I. Felzenszwalb, and A. C. Leitao. 1998.Hydrogen peroxide effects in Escherichia coli cells. Acta Biochim. Pol. 45:677–690.
5. Barceloux, D. G. 1999. Chromium. J. Toxicol. Clin. Toxicol. 37:173–194.6. Carmel-Harel, O., and G. Storz. 2000. Roles of the glutathione- and thiore-
doxin-dependent reduction systems in the Escherichia coli and Saccharomycescerevisiae responses to oxidative stress. Annu. Rev. Microbiol. 54:439–461.
7. Cervantes, C., J. Campos-Garcia, S. Devars, F. Gutierrez-Corona, H. Loza-Tavera, J. C. Torres-Guzman, and R. Moreno-Sanchez. 2001. Interactions ofchromium with microorganisms and plants. FEMS Microbiol. Rev. 25:335–347.
8. Cheung, K. J., V. Badarinarayana, D. W. Selinger, D. Janse, and G. M.Church. 2003. A microarray-based antibiotic screen identifies a regulatoryrole for supercoiling in the osmotic stress response of Escherichia coli. Ge-nome Res. 13:206–215.
9. Das, A., R. Silaghi-Dumitrescu, L. G. Ljungdahl, and D. M. Kurtz, Jr. 2005.Cytochrome bd oxidase, oxidative stress, and dioxygen tolerance of thestrictly anaerobic bacterium Moorella thermoacetica. J. Bacteriol. 187:2020–2029.
10. Drapeau, G. R., F. Gariepy, and M. Boule. 1984. Regulation and SOSinduction of division inhibition in Escherichia coli K12. Mol. Gen. Genet.193:453–458.
11. Eichhorn, E., J. R. van der Ploeg, and T. Leisinger. 1999. Characterizationof a two-component alkanesulfonate monooxygenase from Escherichia coli.J. Biol. Chem. 274:26639–26646.
12. Gonzalez, C. F., D. F. Ackerley, S. V. Lynch, and A. Matin. 2005. ChrR, asoluble quinone reductase of Pseudomonas putida that defends againstH2O2. J. Biol. Chem. 280:22590–22595.
13. Goodgame, D. M., and A. M. Joy. 1986. Relatively long-lived chromium(V)species are produced by the action of glutathione on carcinogenic chro-mium(VI). J. Inorg. Biochem. 26:219–224.
14. Hansen, A. M., Y. Qiu, N. Yeh, F. R. Blattner, T. Durfee, and D. J. Jin. 2005.SspA is required for acid resistance in stationary phase by downregulation ofH-NS in Escherichia coli. Mol. Microbiol. 56:719–734.
15. Imlay, J. A., and S. Linn. 1987. Mutagenesis and stress responses induced inEscherichia coli by hydrogen peroxide. J. Bacteriol. 169:2967–2976.
16. Kadiiska, M. B., Q. H. Xiang, and R. P. Mason. 1994. In vivo free radicalgeneration by chromium(VI): an electron resonance spin trapping investi-gation. Chem. Res. Toxicol. 7:800–805.
17. Keyhan, M., D. F. Ackerley, and A. Matin. 2003. Targets of improvement inbacterial chromate bioremediation, section E-06, p. 143–151. In M. Pelleiand A. Porta (ed.), Remediation of contaminated sediments. Batelle Press,Columbus, Ohio.
18. Llagostera, M., S. Garrido, R. Guerrero, and J. Barbe. 1986. Induction ofSOS genes of Escherichia coli by chromium compounds. Environ. Mutagen.8:571–577.
19. Lofroth, G., and B. N. Ames. 1978. Mutagenicity of inorganic compounds inSalmonella typhimurium: arsenic, chromium and selenium. Mutat. Res. 53:65–66.
20. Lomovskaya, O., K. Lewis, and A. Matin. 1995. EmrR is a negative regulatorof the Escherichia coli multidrug resistance pump EmrAB. J. Bacteriol.177:2328–2344.
21. Lynch, S. V., E. L. Brodie, and A. Matin. 2004. Role and regulation of s ingeneral resistance conferred by low-shear simulated microgravity in Esche-richia coli. J. Bacteriol. 186:8207–8212.
22. Magnusson, L. U., A. Farewell, and T. Nystrom. 2005. ppGpp: a globalregulator in Escherichia coli. Trends Microbiol. 13:236–242.
23. Matin, A. 2001. Stress response in bacteria, p. 3034–3046. In G. Bitton (ed.),Encyclopedia of environmental microbiology, vol. 6. John Wiley and Sons,New York, N.Y.
24. Maurer, L. M., E. Yohannes, S. S. Bondurant, M. Radmacher, and J. L.Slonczewski. 2005. pH regulates genes for flagellar motility, catabolism, andoxidative stress in Escherichia coli K-12. J. Bacteriol. 187:304–319.
25. Miller, C., L. E. Thomsen, C. Gaggero, R. Mosseri, H. Ingmer, and S. N.Cohen. 2004. SOS response induction by beta-lactams and bacterial defenseagainst antibiotic lethality. Science 305:1629–1631.
26. Niederhoffer, E. C., C. M. Naranjo, K. L. Bradley, and J. A. Fee. 1990.Control of Escherichia coli superoxide dismutase (sodA and sodB) genes bythe ferric uptake regulation (fur) locus. J. Bacteriol. 172:1930–1938.
27. O’Farrell, P. H. 1975. High resolution two-dimensional electrophoresis ofproteins. J. Biol. Chem. 250:4007–4021.
28. Peterson, C. N., M. J. Mandel, and T. J. Silhavy. 2005. Escherichia colistarvation diets: essential nutrients weigh in distinctly. J. Bacteriol. 187:7549–7553.
29. Pinto, R., Q. X. Tang, W. J. Britton, T. S. Leyh, and J. A. Triccas. 2004. TheMycobacterium tuberculosis cysD and cysNC genes form a stress-inducedoperon that encodes a tri-functional sulfate-activating complex. Microbiol-ogy 150:1681–1686.
30. Richard, F. C., and A. C. M. Bourg. 1991. Aqueous geochemistry of chro-mium: a review. Water Res. 25:807–816.
31. Sainz, T., J. Perez, J. Villaseca, U. Hernandez, C. Eslava, G. Mendoza, andC. Wacher. 2005. Survival to different acid challenges and outer membraneprotein profiles of pathogenic Escherichia coli strains isolated from pozol, aMexican typical maize fermented food. Int. J. Food Microbiol. 105:357–367.(First published 16 September 2005; doi:10.1016/j.ijfoodmicro.2005.04.017.)
32. Shi, X. L., and N. S. Dalal. 1988. On the mechanism of the chromatereduction by glutathione: ESR evidence for the glutathionyl radical and anisolable Cr(V) intermediate. Biochem. Biophys. Res. Commun. 156:137–142.
33. Shi, X. L., and N. S. Dalal. 1990. NADPH-dependent flavoenzymes catalyzeone electron reduction of metal ions and molecular oxygen and generatehydroxyl radicals. FEBS Lett. 276:189–191.
34. Singh, J., D. L. Carlisle, D. E. Pritchard, and S. R. Patierno. 1998. Chro-mium-induced genotoxicity and apoptosis: relationship to chromium carci-nogenesis. Oncol. Rep. 5:1307–1318.
35. Sugiyama, M., A. Ando, A. Furuno, N. B. Furlong, T. Hidaka, and R. Ogura.1987. Effects of vitamin E, vitamin B2 and selenite on DNA single strandbreaks induced by sodium chromate(VI). Cancer Lett. 38:1–7.
36. Vasquez, C. C., C. P. Saavedra, C. A. Loyola, M. A. Araya, and S. Pichuantes.2001. The product of the cysK gene of Bacillus stearothermophilus V mediatespotassium tellurite resistance in Escherichia coli. Curr. Microbiol. 43:418–423.
37. Voitkun, V., A. Zhitkovich, and M. Costa. 1998. Cr(III)-mediated crosslinksof glutathione or amino acids to the DNA phosphate backbone are muta-genic in human cells. Nucleic Acids Res. 26:2024–2030.
38. Wang, Y. 2002. The function of OmpA in Escherichia coli. Biochem. Biophys.Res. Commun. 292:396–401.
39. Wang, Y. T. 2000. Microbial reduction of chromate, p. 225-235. In D. R.Lovley (ed.), Environmental microbe-metal interactions. ASM Press, Wash-ington, D.C.
40. Wells, D. H., and S. R. Long. 2002. The Sinorhizobium meliloti stringentresponse affects multiple aspects of symbiosis. Mol. Microbiol. 43:1115–1127.
41. Wick, L. M., M. Quadroni, and T. Egli. 2001. Short- and long-term changesin proteome composition and kinetic properties in a culture of Escherichiacoli during transition from glucose-excess to glucose-limited growth condi-tions in continuous culture and vice versa. Environ. Microbiol. 3:588–599.
42. Woods, J. S., T. J. Kavanagh, J. Corral, A. W. Reese, D. Diaz, and M. E.Ellis. 1999. The role of glutathione in chronic adaptation to oxidativestress: studies in a normal rat kidney epithelial (NRK52E) cell model ofsustained upregulation of glutathione biosynthesis. Toxicol. Appl. Phar-macol. 160:207–216.
43. Xiao, H., M. Kalman, K. Ikehara, S. Zemel, G. Glaser, and M. Cashel. 1991.Residual guanosine 3,5-bispyrophosphate synthetic activity of relA nullmutants can be eliminated by spoT null mutations. J. Biol. Chem. 266:5980–5990.
44. Ye, J., S. Wang, S. S. Leonard, Y. Sun, L. Butterworth, J. Antonini, M. Ding,Y. Rojanasakul, V. Vallyathan, V. Castranova, and X. Shi. 1999. Role ofreactive oxygen species and p53 in chromium(VI)-induced apoptosis. J. Biol.Chem. 274:34974–34980.
VOL. 188, 2006 EFFECT OF CHROMATE STRESS ON E. COLI 3381
on Decem
ber 6, 2014 by guesthttp://jb.asm
.org/D
ownloaded from