Extra-intestinal pathogenic Escherichia coli in the UK
286
Page | 0 Extra-intestinal pathogenic Escherichia coli in the UK The importance in bacteraemia versus urinary tract infection, colonisation of widespread clones and specific virulence factors Holly Ciesielczuk Submitted in partial fulfilment of the requirements of the Degree of Doctor of Philosophy
-
Upload
khangminh22 -
Category
Documents
-
view
1 -
download
0
Transcript of Extra-intestinal pathogenic Escherichia coli in the UK

Page | 0
Extra-intestinal pathogenic Escherichia coli in the UKThe importance in bacteraemia versus urinary tract infection, colonisation of widespread clones and specific virulence factors
Holly Ciesielczuk
Submitted in partial fulfilment of the requirements of the Degree of Doctor of Philosophy

Page | 1
I, Holly Ciesielczuk, confirm that the research included within this thesis is my own work or that where it has been carried out in collaboration with, or supported by others, that this is duly acknowledged below and my contribution indicated. Previously published material is also acknowledged below.
I attest that I have exercised reasonable care to ensure that the work is original, and does not to the best of my knowledge break any UK law, infringe any third party’s copyright or other Intellectual Property Right, or contain any confidential material.
I accept that the College has the right to use plagiarism detection software to check the electronic version of the thesis.
I confirm that this thesis has not been previously submitted for the award of a degree by this or any other university.
The copyright of this thesis rests with the author and no quotation from it or information derived from it may be published without the prior written consent of the author.
Signature:
Date:

Page | 2
Acknowledgements
Firstly I would like to thank my supervisors Dr David Wareham, Prof. Neil Woodford, Dr Michel Doumith and Dr Russell Hope for their continued support, advice and guidance, which have been invaluable throughout my studies. Secondly, I’d like to thank Public Health England for funding my PhD and allowing me to conduct this study. I would also like to thank the British Society for Antimicrobial Chemotherapy for allowing me to use their isolates and, in particular, Rosy Reynolds, for her advice and review of manuscripts and abstracts.
Special thanks to everyone in the Gastrointestinal Bacteria Reference Unit, at Public Health England, for making me feel so welcome and being patient while I completed my serogrouping. In particular, thanks to Marie Chattaway and Danielle Hall for running the EAEC PCRs for me.
Finally, I’d like to thank all my friends and family who have supported me throughout all the highs and lows over the last few years. Especially Dr Jonathon Betts and Dr Lynnette Phee, my Queen Mary family; Tom Stevens for lending me his proof-reading skills; and Damion Cotterell and Victoria Maddox for their well needed love and care.

Page | 3
Abstract
Extra-intestinal pathogenic Escherichia coli (ExPEC) are a significant cause of urinary tract infections and bacteraemia in the UK and around the world. These E. coli primarily belong to phylogenetic groups B2 and D, with the clones ST131, ST127, ST95, ST73 and ST69 responsible for the majority of these infections.In the UK, studies of ExPEC have focused on isolates from the North of England, ST131 strains and ExPEC that possess extended-spectrum beta-lactamase (ESBL) enzymes. Therefore, very little is understood about the UK ExPEC population as a whole, the breadth of virulence factors contributing to these infections and the differences between urinary and bloodstream-derived ExPEC.
In this study ST131 was more frequently detected in bloodstream isolates and ST95 was most prevalent in urinary isolates. Comparative virulence of the major clones in the Galleria mellonella infection model revealed ST131 isolates to effect the highest mortality, although serogroup O6, which is linked with ST73, was also associated with high mortality, potentially explaining the success of ST73-O6 in bacteraemia. Analysis of virulence factors identified pap, afa/dra and kpsMTII as importantdeterminants in isolates causing urosepsis and those of ST131, while fyuA and fimH were distinctly lacking, demonstrating their role as colonisation factors rather than virulence factors.
Although these findings are important, with appropriate treatment of urinary tract infections they can become redundant, as ExPEC would be eradicated before causing a severe infection such as bacteraemia or urosepsis. In urinary isolates, resistance to trimethoprim approached 50% and ampicillin resistance was >70%, while ST131 isolates as a whole demonstrated ciprofloxacin and trimethoprim resistance >50%. Together these indicate that empirical UTI guidelines need to be revisited, to prevent recurrence of infection and ascension to the kidneys and bloodstream. In addition, data from this study can be used to develop a point-of-care test to detect ST131, to guide appropriate treatment, without the delay associated with referring a urine specimen for microbiological investigation.

Page | 4
Contents
Statement of Originality 1
Acknowledgements 2
Abstract 3
Abbreviations 10
Publications and presentations 14
List of tables 15
List of figures 16
1. Introduction 18
1.1 Escherichia coli 18
1.1.1 Laboratory identification 18
1.2 Intestinal pathogenic Escherichia coli 20
1.3 Extra-intestinal pathogenic Escherichia coli 21
1.3.1 Virulence determinants 22
1.3.1.1 Adhesins 22
1.3.1.2 Toxins 25
1.3.1.3 Siderophores 27
1.3.1.4 Capsule 28
1.3.1.5 Miscellaneous 29
1.3.1.6 Galleria mellonella model 31
1.4 Urinary tract infection 31
1.4.1 Asymptomatic bacteruria 33
1.4.2 Uncomplicated cystitis 33
1.4.3 Complicated cystitis and pyelonephritis 34
1.4.4 Bacterial aetiology 36

Page | 5
1.4.5 Clinical and laboratory diagnosis 36
1.5 Bacteraemia 37
1.5.1 Signs and symptoms 37
1.5.2 Incidence and prevalence 38
1.5.3 Clinical and laboratory diagnosis 39
1.6 Treatment and prevention 40
1.6.1 Urinary tract infections 40
1.6.2 Bacteraemia 41
1.6.3 Vaccines 42
1.7 Antibiotic resistance 43
1.7.1 Antibiotic resistance by age and sex 43
1.7.2 Antibiotic resistance in urinary tract infections 44
1.7.3 Antibiotic resistance in bacteraemia 44
1.8 Typing 47
1.8.1 Serotyping 47
1.8.2 Multi-locus enzyme electrophoresis 48
1.8.3 Phylogenetic grouping 48
1.8.4 Multi-locus sequence typing 49
1.8.5 Pulsed-field gel electrophoresis 50
1.9 Lineages of extra-intestinal pathogenic Escherichia coli 51
1.9.1 Major lineages 51
1.9.2 ST127 51
1.9.3 ST73 52
1.9.4 ST95 52
1.9.5 ST69 52
1.9.6 ST131 53

Page | 6
1.10 Present day situation 53
2. Hypothesis and project aims 55
3. Materials and Methods 57
3.1 Study definitions 57
3.2 Escherichia coli isolates 59
3.2.1 Local collection 59
3.2.2 BSAC collection 59
3.2.3 Identification 60
3.3 DNA extraction 60
3.4 Polymerase chain reaction (PCR) 60
3.5 Gel electrophoresis 61
3.6 PCR product purification 61
3.7 Sanger DNA sequencing 62
3.8 Statistics 62
3.9 Ethics 63
4. The UK ExPEC population 64
4.1 Introduction 64
4.2 Methods 66
4.2.1 Isolates 66
4.2.2 Phylogenetic grouping 67
4.2.3 Sequence type PCR 67
4.2.4 Multi-locus sequence typing 68
4.2.5 Serotyping 68
4.2.6 Enteroaggregative E. coli PCR 70
4.2.7 Pulsed-field gel electrophoresis 70
4.2.8 Statistics 72

Page | 7
4.3 Results 73
4.4 Discussion points 92
5. ExPEC antibiotic resistance 93
5.1 Introduction 93
5.2 Methods 95
5.2.1 Antibiotic susceptibility testing 95
5.2.1.1 Local Antibiotic susceptibility testing 95
5.2.1.2 Minimum inhibitory concentration 95
5.2.2 CTX-M group detection and identification 96
5.2.3 TEM and SHV detection 96
5.2.4 OXA detection 97
5.2.5 AmpC β-lactamase detection and identification 97
5.2.6 Aminoglycoside modifying enzymes 97
5.2.7 Plasmid-mediated quinolone resistance (PMQR) determinants 98
5.2.8 PCR product cloning 99
5.2.8.1 CMY gene cloning 99
5.2.8.2 M13 PCR 100
5.2.9 Statistics 100
5.3 Results 101
5.4 Discussion points 116
6. The UK ST131-O25b clone 118
6.1 Introduction 118
6.2 Methods 120
6.2.1 ST131 identification 120
6.2.2 ST131-O25b (pabB) real-time PCR 121
6.2.3 Serogroup O25b PCR 121

Page | 8
6.2.4 fimH PCR 121
6.2.5 Pulsed-field gel electrophoresis 123
6.2.6 Plasmid extraction 123
6.2.6.1 Crude extraction 123
6.2.6.2 Clean extraction 124
6.2.6.3 Plasmid transformation 124
6.2.7 Rep typing 125
6.2.8 S1 nuclease pulsed-field gel electrophoresis 125
6.3 Results 127
6.4 Discussion points 134
7. ExPEC virulence determinants 135
7.1 Introduction 135
7.2 Methods 137
7.2.1 Escherichia coli genotyping combined array 137
7.2.1.1 Genotyping DNA extraction 137
7.2.1.2 Genotyping PCR 138
7.2.1.3 Genotyping hybridization 139
7.2.1.4 Genotyping analysis 139
7.2.2 E. coli isolates 140
7.2.3 Virulence determinant PCRs 140
7.2.4 Cyclomodulin PCRs 141
7.2.5 Pathogenicity islands 141
7.2.6 Rifamycin resistance PCR 142
7.2.7 Statistics 142
7.3 Results 144
7.4 Discussion points 157
Page | 9
8. ExPEC virulence in Galleria mellonella 158
8.1 Introduction 158
8.2 Methods 161
8.2.1 Isolates for analysis 161
8.2.2 G. mellonella infection model 162
8.2.2.1 Inoculum preparation 162
8.2.2.2 Inoculum test 162
8.2.2.3 Virulence assay 163
8.2.2.4 Melanisation assay 163
8.2.2.5 Lactate dehydrogenase assay 164
8.2.3 Statistics 165
8.3 Results 166
8.4 Discussion points 174
9. General discussion and concluding remarks 175
Bibliography 208
Appendices 245
Appendix A: Ethics approval and registration 245
Appendix B: Materials and reagents 247
Appendix C: PCR primers 253
Appendix D: Microarray targets 269
Appendix E: Microarray & VF PCR isolates 275
Appendix F: Virulence isolates 283

Page | 10
Abbreviations
ABC ATP-binding cassette
ABU Asymptomatic bacteruria
AIEC Adherent invasive E. coli
AME Aminoglycoside modifying enzyme
AMK Amikacin
AMP Ampicillin
AMRHAI Antimicrobial Resistance and Healthcare Associated Infections reference unit
APEC Avian-pathogenic E. coli
ATCC American Type Culture Collection
ATP Adenosine triphosphate
AUG Augmentin (amoxicillin-clavulanate)
AZT Aztreonam
BFP Bundle forming pilus
BLC Blood culture
BSAC British Society for Antimicrobial Chemotherapy
CAI Community associated infection
CAZ Ceftazidime
CFU Colony forming units
CHL Chloramphenicol
CIP Ciprofloxacin
CPR Cefpirome
CSF Cerebral spinal fluid
CTX Cefotaxime
COMP Complicated urinary tract infection
DAEC Diffusely adherent E. coli
DD Disc diffusion

Page | 11
DEC Diarrhoeagenic E. coli
DHFR Dihydrofolate reductase
DNA Deoxyribonucleic acid
EAEC Enteroaggregative E. coli
EAST1 Enteroaggregative E. coli heat-stable enterotoxin 1
EHEC Enterohaemorrhagic E. coli
EIEC Enteroinvasive E. coli
EPEC Enteropathogenic E. coli
ERP Ertapenem
ESBL Extended spectrum beta lactamase
ETEC Enterotoxigenic E. coli
ExPEC Extra-intestinal pathogenic E. coli
FOX Cefoxitin
FQ Fluoroquinolone
GEN Gentamicin
GIT Gastrointestinal tract
GP General Practitioner
GU Genitourinary tract
HAI Hospital associated infection
HNM H-antigen Non-motile
HPA Health Protection Agency
HUS Haemolytic uremic syndrome
IM Imipenem
LEE Locus of enterocyte effacement
MALDI-Tof Matrix assisted laser desorption/ionisation – time of flight
MEM Meropenem
MIC Minimum inhibitory concentration
MIN Minocycline

Page | 12
MLEE Multi locus enzyme electrophoresis
MLST Multi locus sequence typing
MS Mass spectroscopy
NCTC National Collection of Type Cultures
NIT Nitrofurantoin
NM Non-motile
NMEC Neonatal meningitis-causing E. coli
NT Non typeable
OD Optical density
ORF Open Reading Frame
PABA Para-aminobenzoic acid
PAI Pathogenicity island
PCR Polymerase chain reaction
PFGE Pulsed-field gel electrophoresis
PHE Public Health England (formerly HPA)
PMQR Plasmid mediated quinolone resistance
PTZ Tazocin (piperacillin-tazobactam)
RLH Royal London Hospital
RNA Ribonucleic acid
rRNA Ribosomal RNA
SNP Single nucleotide polymorphism
SPATE Serine protease autotransporter of Enterobacteriaceae
ST Sequence type
STEC Shiga toxin-producing E. coli
SXT Co-trimoxazole (trimethoprim-sulfamethoxazole)
T3SS Type III secretion system
TEM Temocillin
TIG Tigecycline
Page | 13
Tm Melting temperature
TOB Tobramycin
TRIM Trimethoprim
UC Uncomplicated urinary tract infection
UPEC Uropathogenic E. coli
UTI Urinary tract infection
VF Virulence factor
Page | 14
Publications and Presentations
H. Ciesielczuk, J. Betts, L. Phee, M. Doumith, R. Hope, N. Woodford & D. W. Wareham. Comparative virulence of urinary and bloodstream isolates of extra-intestinal pathogenic Escherichia coli in a Galleria mellonella model. Virulence (2014): Accepted
M. Doumith, M. Day, H. Ciesielczuk, R. Hope, A. Underwood, R. Reynolds, J. Wain, D. M. Livermore & N. Woodford. Rapid identification of major Escherichia coli sequence types causing urinary tract and bloodstream infections. Journal of Clinical Microbiology (2014): epub ahead of print
M. Chattaway, C. Jenkins, H. Ciesielczuk, M. Day, V. DoNascimento, M. Day, I. Rodríguez, A. van Essen-Zandbergen, A. Schink, G. Wu, J. Threlfall, N. Woodford & J. Wain on behalf of the SAFEFOODERA_ESBL Consortium. Evidence of evolving extraintestinal enteroaggregative Escherichia coli ST38 clone. Emerging Infectious Diseases (2014): 20 (11)
H. Ciesielczuk, M. Hornsey, V. Choi, N. Woodford & D. W. Wareham. Development and evaluation of a multiplex PCR for eight plasmid-mediated quinolone resistance determinants. Journal of Medical Microbiology (2013): 62 (Pt 12); 1823-1827
H. Ciesielczuk, M. Doumith, R. Hope. N. Woodford & D. W. Wareham. Characterisation of the ST131-O25b clone in London and the UK. Presented at the ESCMID Conference on Escherichia coli: an old friend with new tidings (2013)
H. Ciesielczuk, M. Doumith, R. Hope. N. Woodford & D. W. Wareham. Escherichia coli urosepsis: Determined by virulence determinants or antibiotic resistance? Presented at the 53rd ICAAC (2013)
H. Ciesielczuk, M. Doumith, R. Hope. N. Woodford & D. W. Wareham. Molecular epidemiology and antimicrobial resistance of community acquired Escherichia coli infections in East London, UK. Presentedat the 52nd ICAAC (2012).

Page | 15
List of tables
1 Biochemical tests differentiating Escherichia coli from closely related genera 2 Recommended antibiotic treatment for Escherichia coli urinary tract infections 3 Recommended antibiotic treatment for Escherichia coli bacteraemia 4 UK non-susceptibility rates for the antibiotics used to eradicate Escherichia coli causing
urinary tract infection and bacteraemia 5 Multiplex PCR profiles for the four principal Escherichia coli phylogenetic groups 6 The five major ExPEC lineages and their corresponding serogroups 7 Patient demographics for the urinary isolates 8 Patient demographics for the bloodstream isolates 9 Distributions of the major ExPEC lineages in bloodstream isolates according to country of
origin10 Distributions of the major ExPEC lineages in bloodstream isolates according to region of
origin in England 11 The most common serogroups according to each of the ExPEC collections 12 Serogroups detected in each of the major ExPEC lineages in order of frequency 13 Patient and strain characteristics for the thirty-four paired urosepsis isolates 14 Percentage non-susceptibility in ExPEC isolates from community associated infections and
hospital associated infections 15 Percentage non-susceptibility according to phylogenetic group 16 Beta-lactamases detected in cephalosporin-resistant isolates according to specimen type 17 Plasmid-mediated quinolone resistance determinants detected in ciprofloxacin-resistant
isolates according to specimen type 18 Percentage non-susceptibility of non-clonal versus clonal ST131 isolates, including
percentage resistance in CTX-M positive versus CTX-M negative strains 19 Proportion of virulence factors according to infection type 20 Virulence and resistance scores for the 34 paired urosepsis isolates 21 Virulence and resistance scores according to patient demographics and strain characteristics 22 Virulence factors detected in the ST131 isolates according to sub-clone 23 Patient and strain characteristics for the forty ExPEC isolates analysed using the G.
mellonella infection model 24 Larvae survival 24 hours post-inoculation with 5 x 10⁴, 105 and 106 colony forming units 25 G. mellonella mortality and relative risk ratios associated with individual patient and strain
variables26 G. mellonella mortality and relative risk ratios associated with individual virulence factors,
pathogenicity islands and scores 27 Algorithm for identification of UK ExPEC strains belonging to the three ST131 sub-clones 28 Virulence profiles identified in UK isolates of five major ExPEC clones
19414245
6770737582
83
868789108
111113114
130
147151153155161
166168
169
188195
Page | 16
List of figures
1 Mobile genetic elements and virulence factors possessed by extra-intestinal pathogenic Escherichia coli
2 Diagram demonstrating the pathophysiology of developing a urinary tract infection and subsequent bacteraemia
3 Age range of patients comprising the urinary and bloodstream isolates 4 Source of bacteraemia for both Local and BSAC collections 5 Phylogroup distributions within the urinary (diagonal lines) and bloodstream (spots) isolates 6 Phylogroup distributions according to patient sex and ExPEC collection 7 Phylogroup distribution according to UTI type 8 Phylogroup distributions according to source of bacteraemia 9 Sequence type distributions according to ExPEC collection and specimen type 10 Sequence type distributions in urinary isolates according to patient age 11 Sequence type distributions in bloodstream isolates according to patient age 12 Map displaying the countries and English regions from which the BSAC bacteraemia resistance
surveillance study (2011) isolates were collected, as defined by Public Health England13 Serogroups identified in either urinary or bloodstream isolates or both 14 Dendrogram showing Xbal PFGE profiles for the 34 paired ExPEC isolates representing the
principal phylogroups and lineages 15 Dendrogram showing Xbal PFGE profiles for a selection of ExPEC isolates representing various
sequence types and phylogroups, including the unusual phylogroup 16 Gel electrophoresis of PMQR control strains and pooled control DNA 17 Percentage non-susceptibility to 22 antibiotics, as determined by MICs, for all ExPEC isolates 18 Temocillin MIC distributions for all urinary and bacteraemia isolates 19 Percentage non-susceptibility of local urinary isolates, according to disc diffusion and MIC,
overlaid with the European E. coli non-susceptibility rates as reported by EUCAST 20 Percentage non-susceptibility according to the type of urinary tract infection 21 Percentage non-susceptibility of local bloodstream isolates (n=48), according to MicroScan and
MIC, overlaid with the European E. coli non-susceptibility rates as reported by EUCAST 22 Percentage non-susceptibility according to source of bacteraemia 23 Percentage non-susceptibility according to country of origin 24 Percentage non-susceptibility according to region of England 25 Percentage non-susceptibility for the five major ExPEC lineages 26 Sub-division of ST131 according to laboratory tests 27 E. coli fimH target region for allele-specific polymorphisms 28 Sub-clades of E. coli ST131 isolates as defined by clonal specific single nucleotide
polymorphisms, serogroup, CTX-M expression and ciprofloxacin resistance29 IncF plasmids identified in ST131 strains expressing CTX-M-15 enzymes 30 Alleles of the fimH target sequence according to ciprofloxacin susceptibility 31 PFGE dendrogram of XbaI-digested clonal ST131 strains 32 Schematic of the microarray including hybridisation and labelling steps 33 External morphology of the underside of G. mellonella larvae
22
32
74767777787980818184
8590
91
99101103104
105106
107109110112120122127
129131133137163

Page | 17
34 Percentage larvae survival, melanin production and LDH production for each of the 40 ExPEC isolates
35 The ExPEC variables significantly associated with larvae mortality
167
171

Page | 18
1. Introduction
1.1 Escherichia coli
Escherichia coli is a Gram-negative, facultative anaerobic bacillus and the type species of the genus
Escherichia, within the Enterobacteriaceae family (Colman et al. 1993). The E. coli Genome Project
measured the genome at 4,639,221 base pairs in length, with a GC content of 51%. Initial comparative
gene analysis, using multiple gene and peptide databases, suggested that 60% of the genome was E.
coli- or Enterobacteriaceae-specific (Blattner et al. 1997). However, a later study reported only 40% of
the E. coli genome to be conserved, with the remaining 60% conferring the pathotype, virulence and
resistance (Welch et al. 2002). First described by the German physician Theodor Escherich in 1885, E.
coli was isolated from the faeces of healthy newborns and named Bacterium coli commune after its
shape and natural habitat. However, it was not until 1954 that the name Escherichia coli was recognised
(Cowan, 1954). Subsequent isolation from urinary tract infections (UTI) suggested ascension of bacteria
from the colon to the bladder. Despite this finding, E. coli was long considered the major commensal of
intestinal flora and of low virulence, before becoming established as a human pathogen (Crichton and
Old 1985; Sussman, 1985).
As in humans, E. coli is also an intestinal commensal and a pathogen of animals (Bettelheim, 1997). In
companion animals E. coli is a frequent cause of UTIs (Ewers et al. 2010; Johnson et al. 2008b), while in
farm and food animals E. coli causes colibacillosis, post-weaning diarrhoea, mastitis and septicaemia
(Ghanbarpour and Oswald, 2010; Johnson et al. 2009b; Ruan and Zhang, 2013).
1.1.1 Laboratory Identification
E. coli produce round, flat, opaque colonies on non-selective media (e.g. blood agar). Some strains also
produce a zone of haemolysis due to haemolysin production. On selective media such as MacConkey

Page | 19
agar and cysteine lactose electrolyte-deficient (CLED) agar, E. coli ferment the lactose, producing pink
and yellow colonies respectively. Although 10% of E. coli are lactose non-fermenters, including most
diarrhoeal pathotypes, a positive indole reaction distinguishes these E. coli from other
Enterobacteriaceae (Nataro and Kaper, 1998). A summary of the biochemical tests used to distinguish E.
coli from other genera can be found in table 1.
Chromogenic agars are now routinely employed for isolation and identification of urinary tract
pathogens, including E. coli, to speed up identification. These agars contain either β-glucuronidase or β-
galactosidase, producing blue or pink E. coli colonies, depending on the manufacturer. CHROMagar is as
sensitive (98-100%) as traditional selective agars employed for E. coli identification (Scarparo et al.
2002).
In clinical microbiology laboratories a combination of solid-culture, semi-automated biochemical
analysers, PCR and/or matrix-assisted laser desorption ionisation time of flight (MALDI-Tof) mass
spectroscopy (MS) may be employed to identify E. coli (Harris and Hartley 2003; Menozzi et al. 2006;
Persson et al. 2007) in all specimen types. These systems are time-efficient, improving the time to
bacterial identification and, in some instances, associated antibiotic resistance profile.
Table 1 Biochemical tests differentiating Escherichia coli from closely related genera
Organism Lactose ONPG Indole Urease Hydrogen sulphide
E. coli + + + - -Shigella species - - - - -
Salmonella species - - - - +K. pneumoniae + + - + -
E. aerogenes + + - - -S. marcescens - + - - -
Adapted from Medical Microbiology, 2nd edition (Mims, 1998; Boadi et al. 2010; Guentzel, 1996; Hale
and Keusch, 1996; Rosa et al. 1980)

Page | 20
1.2 Intestinal pathogenic Escherichia coli
E. coli are broadly categorised into intestinal and extra-intestinal. The seven intestinal pathogenic E. coli
variants (or pathotypes) include enterohaemorrhagic E. coli (EHEC), a subset of shiga-toxin-producing E.
coli (STEC) also known as verotoxin-producing E. coli (VTEC); enteropathogenic E. coli (EPEC);
enterotoxigenic E. coli (ETEC); enteroinvasive E. coli (EIEC); enteroaggregative E. coli (EAEC); diffusely-
adherent E. coli (DAEC) and adherent-invasive E. coli (AIEC).
These pathotypes cause diarrhoeal disease by invasion (EIEC); toxins (STEC, ETEC); or
rearrangement of the intestinal epithelial cytoskeleton (EPEC), mediated by pathotype-specific virulence
factors (e.g. shiga toxin (Stx) 1 or 2, STEC).
The prevalence of each pathotype varies according to geographical region and patient
population (Croxen et al. 2013; Nataro and Kaper, 1998). In the UK bloody diarrhoea caused by E. coli is
associated with food-borne outbreaks of EHEC O157:H7 and O26, although frontline laboratories tend to
limit their detection to the former. Incidence is higher in the summer months, when faecal shedding of
EHEC O157:H7 in cattle is at its highest, and infection is frequently more severe in children, occasionally
leading to haemorrhagic colitis and haemolytic uraemic syndrome (HUS) if not diagnosed and treated
promptly (Croxen, et al. 2013; Gormley et al. 2011; Jenkins et al. 2008; Money et al. 2010). DAEC is
thought to account for approximately 10%-11% of cases of diarrhoea in UK children (Knutton et al.
2001), while EPEC strains account for approximately 4% of suspected VTEC isolates referred to Public
Health England’s (PHE) Gastrointestinal Bacterial Reference Unit (GBRU). Similarly to EHEC, EPEC was
isolated mostly (86%) from children <15 years with bloody diarrhoea (Sakkejha et al. 2013). Travellers’
diarrhoea has traditionally been associated with ETEC (Hill and Ryan, 2008), but in the UK EAEC and EIEC
have been implicated in a significant proportion of cases (Perry et al. 2010). In addition to diarrhoeal
disease, EAEC has been associated with UTIs and Clonal group A strains (uropathogenic clone associated
with trimethoprim-sulfamethoxazole resistance), that suggest EAEC possesses extra-intestinal traits

Page | 21
(Olesen et al. 2012; Wallace-Gadsden et al 2007). AIEC strains also possess extra-intestinal traits,
including serotypes and virulence factors. Unlike the other diarrhoeal pathotypes AIEC is associated with
persistent infection of Crohn’s disease patients, rather than self-limiting diarrhoeal disease of healthy
patients (Martinez-Medina et al. 2009).
1.3 Extra-intestinal Pathogenic Escherichia coli
Extra-intestinal pathogenic E. coli (ExPEC) primarily cause UTIs and bacteraemia, but also neonatal
meningitis, osteomyelitis and intra-abdominal infections, among others. They have also been
characterised by phylogenetic group (predominantly groups B2 and D) and the presence of specific
virulence factors: P-fimbriae, type 1 fimbriae, haemolysin, yersiniabactin, aerobactin, type II capsule,
serum resistance proteins and the virulence-associated pathogenicity island malX (Johnson and Stell,
2000; Johnson et al. 2012b; Russo and Johnson, 2000; Smith et al. 2007; Venier et al. 2007).
The uropathogenic E. coli (UPEC) type strain, CFT073, was originally isolated from the blood and
urine of a woman with pyelonephritis from Maryland, USA in 1997 (Kao et al. 1997). Full genome
sequencing of CFT073 identified these virulence factors on virulence-associated DNA fragments,
including pathogenicity islands (PAI), plasmids, prophages and insertion sequences (Parham et al. 2005a;
Welch et al. 2002; Guyer et al. 1998). Since this initial study, resistance determinants such as CTX-M-15
and aac(6’)-Ib-cr have been identified on these mobile genetic elements, along with these virulence
factors (Huang et al. 2012; Woodford et al. 2004).
Other ExPEC pathotypes, in addition to UPEC, include neonatal meningitis-causing E. coli (NMEC)
and avian pathogenic E. coli (APEC), which share genomic similarities and sequence types with human
strains (Mora et al. 2009; Wiles et al. 2008). The prevalence of virulence and resistance determinants
varies among these pathotypes and among commensal E. coli, although commensals are reported to
possess fewer determinants (Obata-Yasuoka et al. 2002).

Page | 22
Different types of E. coli virulence factors are displayed in figure 1. Isolates in this study were
investigated for a variety of virulence factors described by Johnson and Stell (2000), as detailed below
(Johnson & Stell, 2000).
Figure 1 Mobile genetic elements and virulence factors possessed by extra-intestinal pathogenic
Escherichia coli
1.3.1 Virulence determinants
1.3.1.1 Adhesins
E. coli adhesins can be broadly categorised as fimbrial (type I, P, S, F1C, G) or afimbrial (AFA, Dr, Hra, Tsh,
Iha, M and CS31A). As their name infers, these virulence factors perform the important primary stage of
infection: attachment to host cells or tissues. This binding facilitates the establishment of a bacterial
community and/or biofilm, in order to initiate infection.
Of the fimbrial adhesins, type 1 fimbriae are by far the most common, typically identified in
Flagella Fimbriae (pap, fimH)
Capsule (K1)
Plasmids/PAI (pks)
Siderophores (fyuA, iutA)
Serum resistance proteins (iss, traT)
Afimbrial adhesins (Dr, AFA)
Toxins (hlyA, sat)
Page | 23
88%-100% of E. coli strains, plus other members of the Enterobacteriaceae family, with a higher
proclivity in virulent strains (Blum et al. 1991; Cooke et al. 2010; Duguid and Campbell, 1969; Johnson,
1991; Johnson et al. 2005b; Moreno et al. 2005). Key factors in adhesion, these fimbriae also aid
establishment of intracellular reservoirs within bladder cells, which act as a source for recurrent UTI
(Anderson et al. 2003).
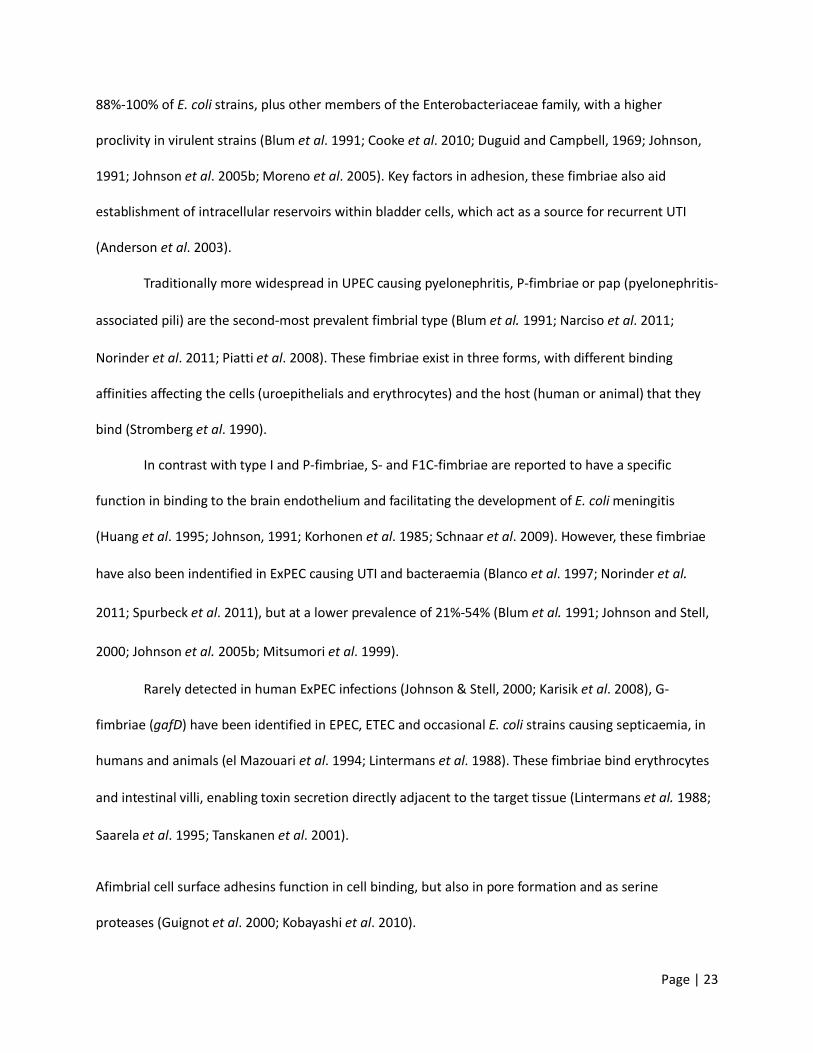
Traditionally more widespread in UPEC causing pyelonephritis, P-fimbriae or pap (pyelonephritis-
associated pili) are the second-most prevalent fimbrial type (Blum et al. 1991; Narciso et al. 2011;
Norinder et al. 2011; Piatti et al. 2008). These fimbriae exist in three forms, with different binding
affinities affecting the cells (uroepithelials and erythrocytes) and the host (human or animal) that they
bind (Stromberg et al. 1990).
In contrast with type I and P-fimbriae, S- and F1C-fimbriae are reported to have a specific
function in binding to the brain endothelium and facilitating the development of E. coli meningitis
(Huang et al. 1995; Johnson, 1991; Korhonen et al. 1985; Schnaar et al. 2009). However, these fimbriae
have also been indentified in ExPEC causing UTI and bacteraemia (Blanco et al. 1997; Norinder et al.
2011; Spurbeck et al. 2011), but at a lower prevalence of 21%-54% (Blum et al. 1991; Johnson and Stell,
2000; Johnson et al. 2005b; Mitsumori et al. 1999).
Rarely detected in human ExPEC infections (Johnson & Stell, 2000; Karisik et al. 2008), G-
fimbriae (gafD) have been identified in EPEC, ETEC and occasional E. coli strains causing septicaemia, in
humans and animals (el Mazouari et al. 1994; Lintermans et al. 1988). These fimbriae bind erythrocytes
and intestinal villi, enabling toxin secretion directly adjacent to the target tissue (Lintermans et al. 1988;
Saarela et al. 1995; Tanskanen et al. 2001).
Afimbrial cell surface adhesins function in cell binding, but also in pore formation and as serine
proteases (Guignot et al. 2000; Kobayashi et al. 2010).

Page | 24
One of the more prevalent afimbrial adhesins is the heat-resistant agglutinin (Hra), also known
as Hek, which has been identified in human and animal ExPEC. Identified in 28%-55% of human ExPEC
strains, this adhesin is encoded on the J96 II PAI, but is not an absolute requirement for colonisation.
However, its PAI location and association with other PAIs leads to the hra gene often being detected
alongside the virulence factors type I fimbriae (fimH), haemolysin A (hlyA), cytotoxic necrotising factor 1
(cnf1), P-fimbriae (pap), uropathogenic specific protein (usp), the siderophore iroN and the pks island
(Bhargava et al. 2009; Bidet et al. 2005; Johnson et al. 2008a; Lutwyche et al. 1994; Srinivasan et al.
2003).
The AFA/Dr family of adhesins bind different epitopes of collagen and blood group antigens in
the attachment process (Labigne-Roussel et al. 1984; Nowicki et al. 1990). Unlike fimbrial adhesins this
family of proteins has been identified in <20% ExPEC strains (Lopes et al. 2005; Venier et al. 2007), as
well as DAEC and commensal E. coli isolates (Obata-Yasuoka et al. 2002).
More prevalent (40%) in ExPEC than the AFA/Dr adhesins (Johnson et al. 2008a), the iron-
regulated gene A (IrgA) homologue adhesin (Iha), which was originally identified by deletion mutants of
an adhesion-conferring operon, has been associated with virulent E. coli strains (Johnson et al. 2005a),
including EHEC O157:H7 and the UPEC type strain CFT073 (Tarr et al. 2000). Iha appears to be
upregulated in iron-depleted environments, acting as a siderophore receptor (Hagan and Mobley, 2007;
Leveille et al. 2006).
Identified by transposon mutagenesis, the E. coli temperature-sensitive haemagglutinin (Tsh) so
named due to its optimal expression at 26⁰C, rather than the conventional 37⁰C, has also been identified
in multiple pathotypes, including ExPEC (7%-9%) and APEC (33%). With a broad binding specificity
(erythrocytes, haemoglobin, fibronectin and collagen), this adhesin also functions as a serine protease
autotransporter of Enterobacteriaceae (SPATE) protein in strains causing cystitis, pyelonephritis,
bacteraemia and neonatal meningitis (Heimer et al. 2004; Mora et al. 2009; Provence and Curtiss, 1994).

Page | 25
Co-localised with G-fimbriae (Rhen et al. 1986), the M adhesin is similarly rarely detected in
ExPEC strains (Johnson et al. 2005b), suggesting it functions more as a colonisation factor than a
virulence factor (Johnson & Stell, 2000; Karisik et al. 2008).
Another adhesin, identified predominantly in bovine E. coli, is the coli-surface-associated
antigen, CS31A (Korth et al. 1991), which also appears to be rarely detected in human ExPEC. However,
this virulence factor is encoded on a highly transmissible plasmid (Jallat et al. 1994). Given that several E.
coli virulence factors appear to be expressed by both animal and human ExPEC strains, it would be
interesting to determine if the prevalence of this adhesin in human ExPEC has changed in recent years.
1.3.1.2 Toxins
Once attachment to host cells has been initiated, E. coli secrete or inject toxins that serve to damage
host cells, facilitate invasion or destroy host tissues; completing the second stage of infection.
Haemolysin A (HlyA) is perhaps the principal toxin of most ExPEC strains, identified in 29%-52%
of isolates (Cooke et al. 2010; Johnson & Stell, 2000; Mahjoub-Messai et al. 2011; Moreno et al. 2005).
HlyA lyses erythrocytes allowing the producing strain to obtain iron for growth and survival in the
absence of siderophores (Beutin, 1991; Blanco et al. 1997; Cavalieri et al. 1984; Mitsumori et al. 1999;
Norinder et al. 2011). Encoded on a number of ExPEC PAIs, hlyA is often detected in combination with
pap, hra and cnf1 (Guyer et al. 1998; Bidet et al. 2005; Blanco et al. 1997). APEC haemolysins, hlyE and
hlyF, meanwhile, are encoded on plasmids and are also occasionally identified in human ExPEC strains
(del Castillo et al. 1997; Reingold et al. 1999).
Secreted autotransporter toxin (Sat) is another dominant ExPEC toxin, which had been identified
in 39%-94% of investigated strains (Johnson et al 2008a; Mahjoub-Messai et al 2011; Pitout et al. 2005),
although this toxin has rarely been screened for, likely due to its recent discovery (Guyer et al. 2000).
Encoded on the 536 III PAI, this toxin interferes with the cytoskeleton of epithelial cells and acts as a

Page | 26
serine protease, with homology to two diarrhoeagenic SPATE proteins, as determined by comparison of
deletion mutants and wildtype strains in cytotoxicity assays (Dobrindt et al. 2002; Guyer et al. 2000).
Vacuolating autotransporter toxin (Vat) is another SPATE protein, with homology to the tsh and
vat of APEC. In addition, it has also rarely been screened for, but a few studies demonstrated high
prevalence in phylogenetic group B2 and ExPEC strains causing bacteraemia and UTIs (Johnson et al.
2008a; Parham et al. 2005b).
EAEC and Shigella flexneri encode the SPATE ‘Protein involved in Intestinal Colonisation’ (Pic),
which lyses mucin as part of diarrheal disease and mediates serum resistance and weak
haemagglutination during extra-intestinal infection (Henderson et al. 1999; Olesen et al. 2012). However,
Pic has also been identified in ExPEC strains causing cystitis and pyelonephritis, but these studies suggest
that Pic is not required for extra-intestinal virulence despite its function (Heimer et al. 2004).
Another EAEC virulence factor is the heat-stable enterotoxin, EAST1 (Savarino et al. 1993).
Identified in 6%-88% of diarrhoeagenic strains, EAST1 has also been detected in 16%-43% of ExPEC
strains causing UTIs and bacteraemia (Girardeau et al. 2003; Lopes et al. 2005; Paiva de and Dubreuil,
2001).
Cyclomodulins are a group of toxins that interfere with the cytoskeleton of Host epithelials to mediate
tissue invasion and damage. Colibactin is the most frequently detected cyclomodulin in human ExPEC
strains (Dubois et al. 2010; Johnson et al. 2008a; Johnson & Stell, 2000), inducing megalocytosis: the
enlargement of the cytoplasm and nucleus of cells (Nougayrede et al. 2006). This genotoxin is encoded
on the pks island, along with clbA, which is reported to facilitate colibactin production and synthesis of
the siderophore yersiniabactin (FyuA), together ensuring the virulence of ExPEC (Martin et al. 2013).
Cytotoxic necrotising factor 1 (Cnf1) functions similarly to AB-type toxins, generating
multinucleated cells that develop into necrotic lesions (Caprioli et al. 1983; Johnson, 1991). Encoded on

Page | 27
the J96 II PAI (Blum et al. 1995), cnf1 has been detected in 15%-54% of human ExPEC strains causing UTI
and bacteraemia (Cooke et al. 2010; Johnson et al. 2005b; Mahjoub-Messai et al. 2011; Venier et al.
2007).
Cycle inhibiting factor (Cif) is common in EPEC and EHEC, but has rarely been detected in ExPEC
strains (Dubois et al. 2010; Marches et al. 2003). Cif is another cyclomodulin with cysteine protease,
transglutaminase and acetyltransferase activity that induces cell cycle arrest (Jubelin et al. 2009; Samba-
Louaka et al. 2009; Taieb et al. 2006). Cytolethal distending toxin B (CdtB) is also rarely detected in
human ExPEC. As with the other cyclomodulins, this toxin induces cell cycle arrest and production of
large mononucleated cells (Johnson and Stell, 2000; Mahjoub-Messai et al. 2011; Taieb et al. 2006; Toth
et al. 2003).
1.3.1.3 Siderophores
Unlike the adhesins and toxins of E. coli, there are only four siderophores that have been routinely
screened for in human ExPEC. Siderophores are used to chelate iron from the host for various cell
processes during infection (Johnson, 1991).
Yersiniabactin (FyuA) is perhaps the most well known and also the primary siderophore of ExPEC,
identified in ≤98% ExPEC strains (Johnson et al. 2005b; Johnson and Stell, 2000; Mahjoub-Messai et al.
2011; Moreno et al. 2005). Encoded on the ‘high pathogenicity island’ (Riley et al. 2006; Schubert et al.
1998), FyuA has been implicated in bacteraemia-associated mortality and has been proposed to be one
of, if not the, most important ExPEC virulence factor (Martin et al. 2013; Mora-Rillo et al. 2013).
Aerobactin (IutA) is another highly efficient siderophore of ExPEC that has been identified in
Salmonella and Shigella species (Johnson, 1991). Encoded on the colV plasmid or the chromosome (de, V
et al. 1986; Johnson, 1991), IutA has been reported in 41%-68% of ExPEC causing UTI and bacteraemia,
but slightly less frequently than FyuA (Johnson et al. 2005b; Johnson and Stell, 2000;Mahjoub-Messai et

Page | 28
al. 2011; Moreno et al. 2005).
Both the iron-responsive element (IreA) and iron-regulated locus (IroN) are less frequently
reported in ExPEC than IutA and FyuA (Girardeau et al. 1991; Johnson et al. 2005b; Mahjoub-Messai et
al. 2011). However, these siderophores, identified by transposon mutagenesis, have only recently been
discovered (Russo et al. 2001). Both IreA and IroN have been associated with APEC virulence (Jeong et
al. 2012; Kariyawasam et al. 2006), but IreA has also been linked to antibiotic resistance (Johnson et al.
2012b; Pitout et al. 2005).
1.3.1.4 Capsule
E. coli produces more than 80 different capsule types, or K antigens, which are composed of acidic
polysaccharides. Capsules are reported to facilitate invasion of tissues and evasion of the host immune
system (Ananias and Yano, 2008; Huang et al. 1999; Orskov and Orskov, 1992). E. coli capsules were
previously categorised into three groups (I-III), based on thermostability during serotyping, biochemical
and genetic characteristics. However, a new capsule classification scheme has since been described
which includes four capsular groups (1-4) composed of O-antigens and/or K antigens. Not all strains of E.
coli express K antigens, but the majority of ExPEC isolates are capsulated, supporting the notion of
capsules as an important virulence factor (Orskov & Orskov, 1992; Whitfield and Roberts, 1999).
The K1 capsule has dominated ExPEC infections, including neonatal meningitis and APEC, often
being the most frequently reported capsule type in strains causing UTIs and bacteraemia (Johnson et al.
2005b; Johnson and Stell, 2000; Kariyawasam et al. 2006; Mahjoub-Messai et a.l 2011; Mora et al. 2009;
Obata-Yasuoka et al. 2002). As with K1, K5 is also commonly identified in E. coli causing neonatal
meningitis and bacteraemia (Johnson and Stell, 2000; Karisik et al. 2008).
Specific K-antigens are often associated with particular O-antigens, including K15, which has
Page | 29
been identified in O6 strains (Johnson et al. 2008b). Other capsular types traditionally associated with
ExPEC infections included K2, K3, K8, K12, K13, K15, K52 and K53 (McCabe et al. 1978).
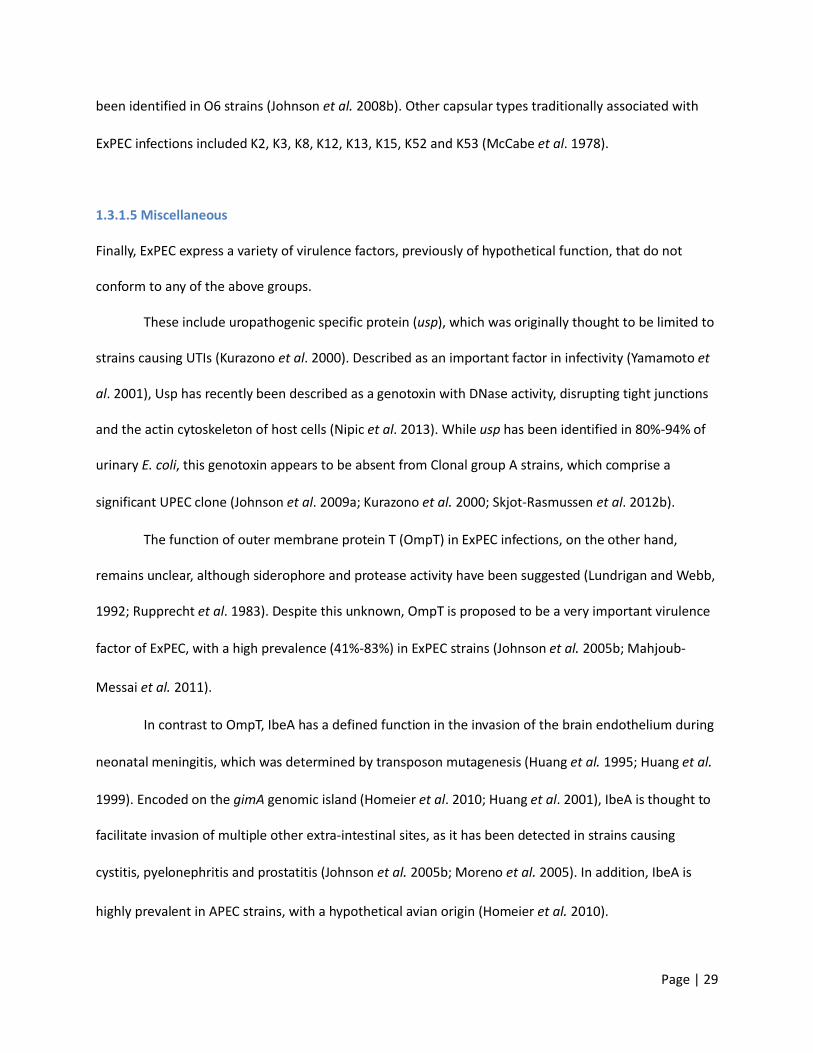
1.3.1.5 Miscellaneous
Finally, ExPEC express a variety of virulence factors, previously of hypothetical function, that do not
conform to any of the above groups.
These include uropathogenic specific protein (usp), which was originally thought to be limited to
strains causing UTIs (Kurazono et al. 2000). Described as an important factor in infectivity (Yamamoto et
al. 2001), Usp has recently been described as a genotoxin with DNase activity, disrupting tight junctions
and the actin cytoskeleton of host cells (Nipic et al. 2013). While usp has been identified in 80%-94% of
urinary E. coli, this genotoxin appears to be absent from Clonal group A strains, which comprise a
significant UPEC clone (Johnson et al. 2009a; Kurazono et al. 2000; Skjot-Rasmussen et al. 2012b).
The function of outer membrane protein T (OmpT) in ExPEC infections, on the other hand,
remains unclear, although siderophore and protease activity have been suggested (Lundrigan and Webb,
1992; Rupprecht et al. 1983). Despite this unknown, OmpT is proposed to be a very important virulence
factor of ExPEC, with a high prevalence (41%-83%) in ExPEC strains (Johnson et al. 2005b; Mahjoub-
Messai et al. 2011).
In contrast to OmpT, IbeA has a defined function in the invasion of the brain endothelium during
neonatal meningitis, which was determined by transposon mutagenesis (Huang et al. 1995; Huang et al.
1999). Encoded on the gimA genomic island (Homeier et al. 2010; Huang et al. 2001), IbeA is thought to
facilitate invasion of multiple other extra-intestinal sites, as it has been detected in strains causing
cystitis, pyelonephritis and prostatitis (Johnson et al. 2005b; Moreno et al. 2005). In addition, IbeA is
highly prevalent in APEC strains, with a hypothetical avian origin (Homeier et al. 2010).

Page | 30
The outer membrane protein TraT confers surface exclusion (preventing cells with the same
plasmid type from conjugating), has a minor role in serum resistance and is thought to prevent
opsonisation, thereby inhibiting phagocytosis (Achtman et al. 1977; Binns et al. 1982; Kanukollu et al.
1985; Waters and Crosa, 1991). Encoded chromosomally on colV plasmids along with iutA (Waters and
Crosa, 1991), traT is highly prevalent (65%-74%) among ExPEC strains causing bacteraemia and UTI
(Cooke et al. 2010; Johnson et al. 2005b).
As with TraT, the increased serum survival (Iss) protein has been detected on colV plasmids, with
roles in serum resistance and surface exclusion (Binns et al. 1982; Waters and Crosa, 1991). Despite co-
localisation on colV plasmids, iss is less prevalent than traT in isolates causing bacteraemia (23% vs.
68%), UTI (17% vs. 65%) and in APEC strains, probably due to the location of the traT gene in the plasmid
transfer region of the plasmid (Johnson et al. 2005b; Olesen et al. 2012; Skjot-Rasmussen et al. 2012b;
Waters and Crosa, 1991).
The fourth virulence factor encoded on colV plasmids is the bacteriocin colicin V, which is
thought to function as an adhesin and cause cell lysis by disrupting the cell membrane (Waters and
Crosa, 1991). Like iss, colicin V is also less frequently detected than the other plasmid-encoded virulence
factors in human ExPEC strains, suggesting colicin V is more important in APEC virulence, but not human
ExPEC virulence; that these virulence factors may also be chromosomally encoded; or a mobile element
within the plasmid is being transmitted that encodes traT and iutA more frequently than iss and colicin V
(Johnson and Stell, 2000; Mora et al. 2009; Wang et al. 2010).
Finally, the enzyme encoded by malX functions in the metabolism of maltose and glucose (Reidl
and Boos, 1991), but has no role in ExPEC virulence. However, it is located on the CFT073 II PAI, which is
frequently identified in virulent ExPEC strains (Ostblom et al. 2011; Parham et al. 2005a). Therefore,
malX is considered a marker of virulence, with high detection rates (60%-87%) in urinary and
bacteraemia strains (Johnson et al. 2005b; Johnson and Stell, 2000; Moreno et al. 2005).

Page | 31
While new E. coli virulence factors continue to be discovered, data from this study is limited to the
determinants described above, which are included in the updated PCR protocol of Johnson and Stell
(2000) (Johnson and Stell, 2000).
1.3.1.6 Galleria mellonella model
Previous studies have used various cell lines (Stromberg et al. 1990; Guignot et al. 2000; Nipic et al.
2013) and mouse models to characterise various ExPEC virulence factors (Johnson et al. 2005a; Anderson
et al. 2003), but more recently a new animal model has been proposed. Galleria mellonella larvae have
been used to study the pathogenesis, virulence and antibiotic susceptibility of various bacteria including
Klebsiella, Acinetobacter, Stenotrophomonas species and EPEC (Leuko and Raivio, 2012; Wand et al.
2013; Hornsey et al. 2013; Betts et al. 2014). In 2014 this model was validated for studying the virulence
of ExPEC (Williamson et al, 2014) and was used in this study to analyse 40 clinical ExPEC strains. This is
detailed in chapter 8.
1.4 Urinary Tract Infection
It is well established in the medical community that UTIs are one of the most common community- and
hospital-associated infections, affecting most women at least once in their lifetime. Approximately, 12%-
20% of men will also suffer a UTI, while in children UTI prevalence ranges from <1% to 8% depending on
age (Newcastle asymptomatic bacteruria research group, 1975; Foxman, 2002; Jakovljevic et al. 2013;
Lipsky, 1989).
The commensal flora of the periurethral area is comprised of a range of bacteria, most of which
are intestinal in origin: Enterobacteriaceae, Gardnerella vaginalis, Lactobacillus, Staphylococcus,
Streptococcus, Enterococcus, Corynebacterium, Bacteroides, Fusobacterium and Veillonella species; with
E. coli accounting for 1%-12% (Hooton and Stamm, 1996). However, any of these bacteria may gain entry

Page | 32
into the bladder, via the urethra, through instrumentation or sexual activity. Host and bacterial factors
(e.g. pH change, antibiotics, fimbriae) then determine whether bacteria are removed by micturition
shortly after causing a temporary, asymptomatic bacteruria; or if they colonise the bladder epithelium,
establishing a bladder infection termed cystitis or a lower UTI. Conditions that enable bacteria to ascend
the ureters (e.g. ureteric reflux, pregnancy) result in a kidney infection, also known as pyelonephritis or
an upper UTI (Mobley et al. 1990). This pathophysiology (Figure 2) lends to women developing a UTI
more frequently than men, due to their shorter urethras and proximity of faecal commensals and
pathogens, which can be transmitted easily from the perineal region to the urethral opening. Hormonal
changes in women also increase susceptibility to infection at early and later stages of life (Hooton and
Stamm, 1996). In men however, the urethral meatus is further from the perineal region, the skin is drier
and the urethra is longer, making colonisation and ascension to the bladder less likely (Lipsky, 1989).
Figure 2 Diagram demonstrating the pathophysiology of developing a urinary tract infection and
subsequent bacteraemia
Kidney infection +/-bacteraemia
Infection eradicated
Intestinal colonisation
Periurethral colonisation
Asymptomatic bacteruria
Bladder infection
Intracellular bladder colonies
Infection eradicated

Page | 33
1.4.1 Asymptomatic bacteruria
Asymptomatic bacteruria (ABU) is the presence of bacteria in urine in the absence of symptoms.
Transient bacteruria occurs at a low frequency in children, but is common in pregnant women and the
elderly. Signs of infection may include pyuria and/or a positive dipstick test. Therefore, culture is the gold
standard for confirming ABU (Nicolle et al. 2005; Rubin et al. 1992).
Approximately 2%-15% of pregnant women develop ABU and/or symptomatic UTI due to
changes in the position of their bladder and ureters, which results in increased urine retention and urine
reflux. This results in a 20- to 30-fold increased risk of developing pyelonephritis, with potentially serious
consequences for the mother and the baby (e.g. premature labour, low birth weight). Therefore all
pregnant women are screened and, if warranted, treated in the early stages of pregnancy for ABU (Ipe et
al. 2013; Nicolle et al. 2005).
Elderly patients are predisposed to ABU due to anatomical obstruction (e.g. prostatitis),
hormonal changes and poor hygiene. However, antibiotic treatment is discouraged, as most cases will
resolve naturally or go undiagnosed. In addition, antibiotic treatment in the elderly may not clear the
infection; may cause the infection to become symptomatic; can lead to the infecting isolate developing
resistance; may select for a resistant strain; or the patient may suffer adverse side effects (Fraser et al.
2012; Nicolle et al. 2005; O'Sullivan et al. 2013; Werner et al. 2011).
1.4.2 Uncomplicated cystitis
Uncomplicated cystitis refers to symptomatic bladder infection in healthy patients lacking any
complications or abnormalities. Symptoms in women include dysuria (pain on urination), frequency,
urgency and lower abdominal pain. Men may also suffer with slow-stream micturition and dribbling,
while in children symptoms are often non-specific. Therefore, malaise, incontinence, vomiting,
abdominal pain and nocturnal incontinence in the absence of systemic signs, such as fever, may be

Page | 34
suggestive of infection. In catheterised patients new costovertebral tenderness, new onset of delirium,
rigors and a fever greater than 37.9°C are indicative of a symptomatic UTI (Newcastle asymptomatic
bacteruria research group, 1975; Kudinha et al. 2013b; SIGN 2006; Lipsky, 1989).
Uncomplicated cystitis is typically reported (86%) in sexually active, non-pregnant women
between the ages of 18 and 84 years, with a mean age of 40 years (Bean et al. 2008; Lipsky, 1989). Men
usually present when aged 58 to 63 years, although UTIs attributed to instrumentation, such as
catheters, have been diagnosed in men <60 years. Despite gender differences in age of presentation,
cystitis is reported to increase with age, irrespective of sex (Cornia et al. 2006; De Backer et al. 2008;
Kahlmeter, 2003; Koeijers et al. 2010; McNulty et al. 2004; Lipsky, 1989).
Recent studies suggested 7%-8% of children (<18 years) were diagnosed with a UTI, compared to
an early study reporting a prevalence of 2%, with young girls tending to suffer more frequently than
young boys. However, UTIs in young boys peak in those aged <3 months and are often attributed to
congenital genitourinary disorders, frequent incomplete emptying of the bladder, greater risk of faecal
contamination than their older counterparts and being uncircumcised. Renal scarring, a major
complication of UTI in children, has been observed more frequently in girls (Shaikh et al. 2008;
Newcastle asymptomatic bacteruria research group, 1975; Jakovljevic et al. 2013; Lipsky, 1999; McNulty
et al. 2004).
1.4.3 Complicated cystitis and pyelonephritis
Complicated cystitis refers to a lower UTI in the presence of comorbidity, or a structural or functional
abnormality that increases the patient’s susceptibility to UTI. These include catheterisation or other
instrumentation, diabetes, neurogenic bladder, immunocompromising conditions (e.g. lupus, HIV),
recurrent UTI, infection with a multi-drug-resistant isolate, prostatitis and urogenital surgery.
Pyelonephritis is also considered a complicated UTI, which is caused by an ascending infection or
Page | 35
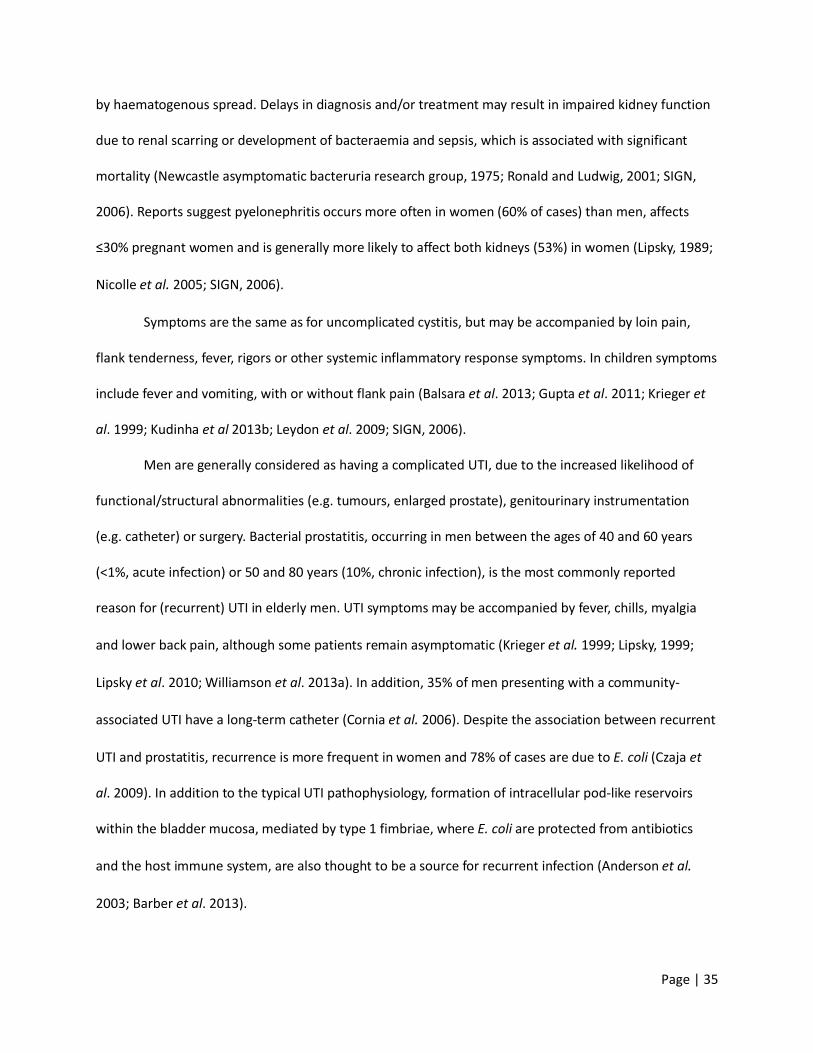
by haematogenous spread. Delays in diagnosis and/or treatment may result in impaired kidney function
due to renal scarring or development of bacteraemia and sepsis, which is associated with significant
mortality (Newcastle asymptomatic bacteruria research group, 1975; Ronald and Ludwig, 2001; SIGN,
2006). Reports suggest pyelonephritis occurs more often in women (60% of cases) than men, affects
≤30% pregnant women and is generally more likely to affect both kidneys (53%) in women (Lipsky, 1989;
Nicolle et al. 2005; SIGN, 2006).
Symptoms are the same as for uncomplicated cystitis, but may be accompanied by loin pain,
flank tenderness, fever, rigors or other systemic inflammatory response symptoms. In children symptoms
include fever and vomiting, with or without flank pain (Balsara et al. 2013; Gupta et al. 2011; Krieger et
al. 1999; Kudinha et al 2013b; Leydon et al. 2009; SIGN, 2006).
Men are generally considered as having a complicated UTI, due to the increased likelihood of
functional/structural abnormalities (e.g. tumours, enlarged prostate), genitourinary instrumentation
(e.g. catheter) or surgery. Bacterial prostatitis, occurring in men between the ages of 40 and 60 years
(<1%, acute infection) or 50 and 80 years (10%, chronic infection), is the most commonly reported
reason for (recurrent) UTI in elderly men. UTI symptoms may be accompanied by fever, chills, myalgia
and lower back pain, although some patients remain asymptomatic (Krieger et al. 1999; Lipsky, 1999;
Lipsky et al. 2010; Williamson et al. 2013a). In addition, 35% of men presenting with a community-
associated UTI have a long-term catheter (Cornia et al. 2006). Despite the association between recurrent
UTI and prostatitis, recurrence is more frequent in women and 78% of cases are due to E. coli (Czaja et
al. 2009). In addition to the typical UTI pathophysiology, formation of intracellular pod-like reservoirs
within the bladder mucosa, mediated by type 1 fimbriae, where E. coli are protected from antibiotics
and the host immune system, are also thought to be a source for recurrent infection (Anderson et al.
2003; Barber et al. 2013).

Page | 36
1.4.4 Bacterial aetiology
E. coli is the most common cause of UTI (Newcastle asymptomatic bacteruria research group, 1975;
Kahlmeter, 2003; Lipsky, 1999; Schito et al. 2009). Other bacteria isolated from women and young girls
include Klebsiella pneumoniae, Proteus mirabilis and Staphylococcus saprophyticus, with S. saprophyticus
more common in those aged 18 to 49 years (Newcastle asymptomatic bacteruria research group, 1975;
De Backer et al. 2008). UTI aetiology in pregnant women is similar to non-pregnant women, although a
higher prevalence (26%) of Streptococcus agalactiae in women with gestational diabetes has been
reported (Ipe et al. 2013).
In men, UTI aetiology is varied. E. coli remains the dominant pathogen in community-associated
UTIs, but other species causing the remainder of infections vary with age. For example, Pseudomonas
species are more frequently detected in >70 years, Enterococcus species predominate in men aged 18 to
50 years, whilst other Gram-negative bacteria (e.g. Serratia, Proteus, Klebsiella and Enterobacter species)
occur more frequently in men aged 51 to 70 years (Jakovljevic et al. 2013; Koeijers et al. 2010; Lipsky,
1999)
1.4.5 Clinical and laboratory diagnosis
Most UTIs are diagnosed clinically by a GP and empirical antibiotics are prescribed according to local
guidelines and resistance rates. Only with treatment failure, pregnancy or a complicated infection are
urine specimens routinely referred for microbiological investigation. However, this referral practice varies
according to, and within, GP practices (Fahey et al. 2003; Hillier et al. 2006; McNulty et al. 2003; Olesen
and Oestergaard, 1995). Therefore, resistance data derived from these specimens is often biased
(Hryniewicz et al. 2001).
Indicators of UTI include the presence of leucocyte esterase and/or nitrites (Chien et al. 2007),
plus erythrocytes, leucocytes (≥103 cells/L), cellular casts or epithelial cells, which also predict kidney

Page | 37
damage and the degree of specimen contamination during collection (Health Protection Agency, 2012b;
Lipsky, 1989). With quantitative culture,≥103 or ≥105 bacterial colony-forming units (CFU) per millilitre
(ml) of urine is indicative of UTI in men and women, respectively, with lower counts considered to
indicate probable contamination (Kass, 1957; Lipsky, 1999; Lipsky, 1989). Cultures of catheter bag urine
are more difficult to interpret, due to permanent colonisation of the catheter. However, ≥105CFU/ml may
be considered significant, in conjunction with a new symptomatic episode, from a well-collected
specimen (Health Protection Agency, 2012b; Hooton et al. 2010).
1.5 Bacteraemia
Presence of bacteria in the blood, or bacteraemia, is classified as primary (bacteria directly enter the
bloodstream) or secondary (enter from a primary infected focus) (Mims, 1998). Bacteraemia may be
transient, intermittent or continuous following tooth extraction, pneumococcal pneumonia or
endocarditis, for example. Primary bacteraemia is more common in hospitalised patients with a
weakened immune system or undergoing invasive procedures, while secondary bacteraemia is typically a
community-associated infection (Health Protection Agency, 2012a).
1.5.1 Signs and symptoms
Fever (>38°C or <36°C) is the most common symptom of bacteraemia and may be accompanied by
hypotension, tachycardia, tachypnea, confusion, rigors, oliguria, lactic acidosis, leukocytosis, leukopenia
and thrombocytopenia. Examples of source-specific symptoms include pneumonia (chest source) or
dysuria (urinary source). Catheter-associated bacteraemia is also difficult to diagnose, but signs include
isolation of the same organism from blood cultures and catheter/tip culture; sepsis resolution on
removal of the catheter; and quantitative culture comparison between catheter-drawn and alternative
line/vein blood cultures.

Page | 38
Pregnant women often present with a fever and a raised C-reactive protein. Complications
include septic shock (4%), caesarean section (29%), pre-term labour (29%), neonatal/foetal death (10%)
and neonatal infection (5%). Foetal mortality was highest if diagnosis occurred in the second trimester
(40%) and lowest in the third trimester (1%) (Surgers et al. 2012).
1.5.2 Incidence and prevalence
Bacteraemia occurs primarily in patients >65 years, in men and in those with co-morbidities (Health
Protection Agency, 2011; Sogaard et al. 2011), followed by children <5 years (Eykyn et al. 1990), with a
rate of 0.3% in pregnant women (Surgers et al. 2012).
E. coli is the leading cause, accounting for 47% of reports in Europe, with a significant increase in
isolates resistant to third-generation cephalosporins. In addition, the urinary tract is the most common
source (45%) of bacteraemia (de Kraker et al. 2012; Health Protection Agency and Health, 2012;
Laupland et al. 2008). Staphylococcus aureus (29%) is also common, followed by Streptococcus
pneumoniae, Enterococcus faecalis and Enterococcus faecium (de Kraker et al. 2012; Lawes et al. 2012).
In the developing world, E. coli and S. aureus commonly cause bacteraemia, but Salmonella typhi (India,
Nepal, Laos), Cryptococcus neoformans, Mycobacterium species (both Thailand), Streptococcus
pneumoniae and Haemophilus influenza (both Indian sub-continent) are also frequent causes of
bacteraemia (Deen et al. 2012).
In the UK, reports of E. coli bacteraemia have increased yearly. Between 2009 and 2013
reporting of E. coli bacteraemia was voluntary, with rates increasing from 27.2% to 31.5% of all reported
bacteraemias. In June 2011 reporting became mandatory, with approximately 18,000 cases reported for
that year. This increased to 32,000 cases in 2012 and 33,000 in 2013, compared to the 25,000 voluntarily
reported in 2009 (Health Protection Agency, 2013; Health Protection Agency, 2014; Public Health
England, 2014b). This rise in E. coli bacteraemia has been linked to antibiotic pressure and

Page | 39
immunosuppression facilitating E. coli success and evasion of the host’s immune system (Health
Protection Agency, 2011; Schlackow et al. 2012).
An Oxford (UK) study reported a 28-day mortality of 17%, far higher than a Danish study
reporting a 30-day mortality of 6%, but similar to the 30-day mortality of 20% reported by a Dutch
group. Inappropriate empirical therapy was hypothesised as the main reason for high mortality in
Oxford, supported by the Dutch study, which reported lower mortality rates if appropriate empirical
therapy was administered within 24 hours of admission (Frakking et al. 2013; Schlackow et al. 2012;
Sogaard et al. 2011). An NHS trust in Essex (UK) reported higher 30-day mortality rates for both
community-associated (25%) and hospital-associated (35%) cases of bacteraemia, which covered all
bacterial causes. E. coli specific 30-day mortality was reported for community-associated bacteraemia
only at 15.5%; with age, PITT score (system based on mental status, fever, hypotension, mechanical
ventilation and history of heart attack), Charlson comorbidity index (score based on age and presence of
specific diseases) and undefined source of infection significantly associated with 30-day mortality.
Despite the prevalence of E. coli in causing bacteraemia, mortality attributed to E. coli was lower than
that for S. aureus (17.1%) and S. pneumoniae (20%) bacteraemias (Hounsom et al. 2011; Melzer and
Welch, 2013).
1.5.3 Clinical and laboratory diagnosis
Blood culture is the gold standard for diagnosing bacteraemia, enabling rapid detection and targeted
antibiotic treatment (following empirical antibiotic therapy), to reduce mortality (Health Protection
Agency, 2012a; Pradipta et al. 2013). However, only 7%-12% of blood cultures sent to the laboratory are
positive. This may be because blood cultures were taken as a precaution, as it is not always possible to
distinguish between an infectious cause and non-infectious cause from symptoms alone; the patient
may have been given antibiotics prior to cultures being collected; and a low volume of blood can cause

Page | 40
false-negatives. This also means multiple blood culture sets may be required to identify a pathogen
causing bacteraemia (Deen et al. 2012; Eykyn et al. 1990; O'Grady et al. 2008; Sogaard et al. 2011). The
source of infection is confirmed by culturing the same pathogen from a non-blood site showing signs of
infection, such as the urinary tract (Bouza et al. 2002; Horan et al. 2008; O'Grady et al. 2008). Elevated
C-reactive protein (secreted in response to acute inflammation) and procalcitonin (increased in serum
during severe bacterial infections) levels may also indicate infection (Tunkel et al. 2004).
1.6 Treatment and prevention
1.6.1 Urinary tract infection
UTIs are predominantly diagnosed clinically and treated empirically, using the recommended antibiotics
listed in table 2. Unless the patient has had a previous infection, it is assumed that the urinary strain will
be fully antibiotic-susceptible. Generally a short course of antibiotics is used to treat cystitis and a longer
course is prescribed for complicated infections (e.g. prostatitis) and pyelonephritis. Patients not
receiving antibiotics include the elderly (ABU only) and catheter-associated bacteruria, unless a new
symptomatic episode arises.
Infection with a resistant isolate is more likely to be diagnosed microbiologically, and is often
associated with recent antibiotic therapy. Ampicillin and trimethoprim prescriptions have been
significantly associated with subsequent UTIs caused by resistant E. coli. A similar trend has been
documented with low-dose ciprofloxacin inducing resistance-conferring mutations (Hillier et al. 2007;
Marcusson et al. 2005; Nicolle et al. 2005). In response many GPs have reduced unnecessary prescribing,
especially if the patient’s symptoms are mild (Butler et al. 2007). The GP may also refer a urine specimen
for culture to confirm the absence of a UTI or suggest self-management, such as increased fluid intake
and cranberry supplements (Fahey et al. 2003; Leydon et al. 2009; McNulty et al. 2003; SIGN, 2006).

Page | 41
Table 2 Recommended antibiotic treatment for Escherichia coli urinary tract infections
Infection type Antibiotic(s)Asymptomatic bacteruria, not pregnant No treatmentAsymptomatic bacteruria, pregnant Nitrofurantoin (avoid at term) or co-trimoxazole (avoid in
first trimester), 3-7 daysCystitis Nitrofurantoin or co-trimoxazole or fosfomycin (one dose)
or pivmecillinam, 3-5 days (7 days for men); amoxicillin or oral cephalosporin if pregnant
Pyelonephritis Augmentin or ciprofloxacin or co-trimoxazole, 7 days (women) or 14 days (men); add IV amikacin or IV ceftriaxone if hospital-acquired, patient has a co-morbidity or received antibiotics in last 3 months
Catheter-associated bacteruria Ciprofloxacin or augmentin, 7-10 days
Prostatitis Ciprofloxacin, 14-28 days; trimethoprim as an alternative(Gupta et al. 2011; Joint Formulary Committee 2013; Lipsky et al. 2010; SIGN, 2006; Barts and the
London Trust Antimicrobial Review Group, 2011)
1.6.2 Bacteraemia
National and local (Bart’s and the London Trust) recommendations for antibiotic treatment of E. coli
bacteraemia can be found in table 3. Empirical treatment is started within one to two hours of diagnosis
due to the high morbidity and mortality rates. Treatment may also involve catheter removal, fluid
drainage or surgical debridement. If severe sepsis is diagnosed, fluids and vasopressors may also be
administered to facilitate tissue recovery. Treatment length varies according to antibiotic resistance,
source of infection and complicating factors. If the source of infection can be removed (e.g. catheter)
treatment can last 7 days, whilst bacteraemia secondary to endocarditis, liver abscess, brain abscess,
prosthetic device-related infection or disciitis may be extended to 4-6 weeks to achieve optimal tissue
penetration. In pregnant women, treatment for 14 days with amoxicillin, augmentin or a third-
generation cephalosporin has been reported (Surgers et al. 2012). However, with the high rates (70%) of

Page | 42
augmentin resistance reported in E. coli, a third-generation cephalosporin with low-level resistance
would be more appropriate (Cooke et al. 2010; Health Protection Agency, 2011; Schlackow et al. 2012).
Table 3 Recommended antibiotic treatment for Escherichia coli bacteraemia
Treatment type Antibiotic(s) Infection sourceEmpirical Broad-spectrum cephalosporin (e.g.
cefuroxime) or anti-pseudomonas penicillin (e.g. piperacillin-tazobactam)
Unknown
Suspected resistant bacteria
Use carbapenem (e.g. meropenem)
Escherichia colibacteraemia
Augmentin or piperacillin-tazobactam or ciprofloxacin, 14 days. Add amikacin if severe
Genitourinary tract
Meropenem, 14 days Pancreatitis
Meropenem, 21 days. De-escalate to ceftriaxone (if required) once antibiogram known
Meningitis
Piperacillin-tazobactam or ciprofloxacin or ceftriaxone, 14 days
Cholecystitis, peritonitis
Augmentin, 14 days. Add amikacin if severe Biliary, (post-surgical) intra-abdominal
Ciprofloxacin, 4-6 weeks Osteomyelitis
(Bouza et al. 2002; Dellinger et al. 2013; Phee, 2013; Pradipta et al. 2013; Barts and the London Trust
Antimicrobial Review Group, 2011)
1.6.3 Vaccines
Vaccines targeting E. coli are currently licensed for use in cattle and poultry only (e.g. SCOURMUNE®,
Merck, NJ, USA; PROSYSTEM® RCE, Merck). An E. coli vaccine for preventing human UTI/ExPEC infections
is required, because recurrent UTI does not confer a protective effect, increasing resistance is limiting
treatment options, and the ExPEC population is highly heterogeneous. However, this heterogeneity also
makes designing an E. coli vaccine difficult.
Various UPEC strains, outer membrane proteins and virulence factors have been trialled in E. coli

Page | 43
vaccines including Urovac® (SolcoBasel, Basel, Switzerland and Protein Express, Cincinnati, OH, USA),
Uro-Vaxom® (OM Pharma, Myerin, Switzerland), Urvakol® (Institute of Microbiology, Olomouc, Czech
Republic) and Urostim® (Bulbio, National Centre for Infectious and Parasitic Diseases, Sofia, Bulgaria).
However, these were poorly immunogenic, did not confer long-term protection and compliance issues
were raised (Brumbaugh and Mobley, 2012). A novel vaccine (Medimmune, Gaithersburg, MD, USA)
containing the fimH adhesin and fimC chaperone protein was evaluated in monkey and human trials.
While promising in monkeys, protective antibody levels in women were comparable to previous vaccine
trials, requiring further vaccine development (Langermann et al. 2000; Meiland et al. 2004).
Bacterial interference by means of a 2-hour indwelling bladder suspension with non-pathogenic
E. coli provides an alternative option, with>50% patients remaining infection-free one year after
treatment. However, the once-daily dosing will likely result in compliance issues (Darouiche et al. 2005).
1.7 Antibiotic Resistance
1.7.1 Antibiotic resistance by age and sex
Antibiotic resistance rates in E. coli are reported to be higher in men, or women, depending on the study.
This is likely due to the chosen study population and/or regional differences in prescription practices
(Bean et al. 2008; De Backer et al. 2008; den Heijer et al. 2013; Health Protection Agency, 2008; Koeijers
et al. 2010; Linhares et al. 2013; Schito et al. 2009).
In children, the antibiotic-naive may carry E. coli that is resistant to trimethoprim (34%) and
amoxicillin-clavulanate (48%), representative of community strains and resistance rates (Chakupurakal et
al. 2010). Resistance increases into adulthood as patients are prescribed antibiotics, acquire resistant
community strains and are hospitalised (Fahey et al. 2003; Hillier et al. 2007; Sahm et al. 2001).
Antibiotic resistance peaks in patients aged >65 years and isolates are more likely to be multi-drug

Page | 44
resistant (Gobernado et al. 2007; Goettsch et al. 2000).
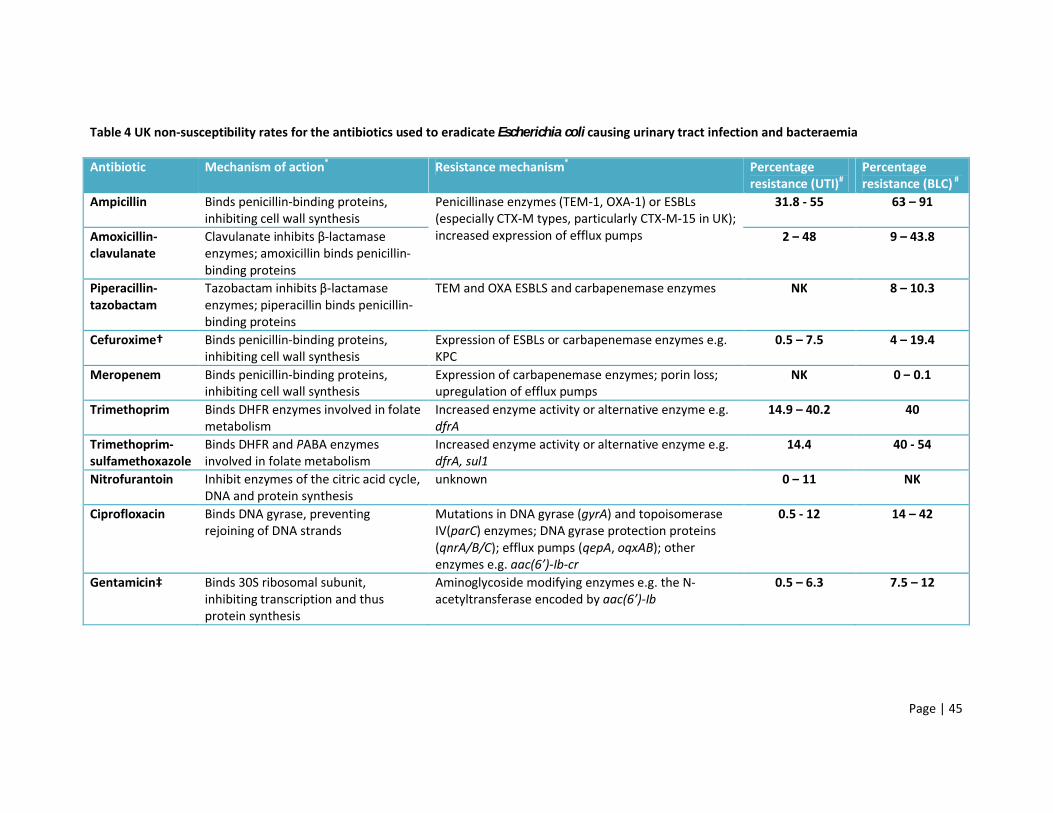
1.7.2 Antibiotic resistance in urinary tract infections
Empirical treatment has evolved as resistance has increased. Short courses of ampicillin or trimethoprim
have been replaced with β-lactam/β-lactamase inhibitor combinations, early-generation cephalosporins
and trimethoprim-sulfamethoxazole (co-trimoxazole). Transmission of plasmid-mediated extended-
spectrum β-lactamases (ESBLs) with aac(6’)-Ib-cr and spread of strains with chromosomal
fluoroquinolone resistance, has also led to the re-evaluation of ciprofloxacin in treating complicated
UTIs, with dual therapy proposed. Nitrofurantoin and fosfomycin may be considered for uncomplicated
cystitis (Den Heijer et al. 2010; Dyer et al. 1998). Fortunately community-associated infections (CAI) tend
to demonstrate lower rates of resistance than hospital-associated infections (HAI) (Bean et al. 2008).
Antibiotic resistance rates and associated resistance mechanisms, for urinary and bloodstream E. coli
isolates, can be found in table 4.
1.7.3 Antibiotic resistance in bacteraemia
E. coli causing bacteraemia are often more resistant than urinary strains (Bean et al. 2008; Livermore et
al. 2008), as demonstrated by the resistance rates in table 4. In addition, ESBLs are more frequently
isolated from bloodstream infections than UTIs (e.g. 12% vs. 2%) (Livermore et al. 2008; Schito et al.
2009). Despite this, carbapenem resistance remains low and carbapenemase enzymes are rarely
detected in E. coli compared to other Enterobacteriaceae and non-fermenting Gram-negative rods
(European Centre for Disease Prevention and Control, 2011; Woodford et al. 2013). However, this will
probably change as plasmid-mediated carbapenemases start to circulate within the E. coli population.
Page | 45
Table 4 UK non-susceptibility rates for the antibiotics used to eradicate Escherichia coli causing urinary tract infection and bacteraemia
Antibiotic Mechanism of action* Resistance mechanism* Percentage resistance (UTI)#
Percentage resistance (BLC) #
Ampicillin Binds penicillin-binding proteins, inhibiting cell wall synthesis
Penicillinase enzymes (TEM-1, OXA-1) or ESBLs (especially CTX-M types, particularly CTX-M-15 in UK); increased expression of efflux pumps
31.8 - 55 63 – 91
Amoxicillin-clavulanate
Clavulanate inhibits β-lactamase enzymes; amoxicillin binds penicillin-binding proteins
2 – 48 9 – 43.8
Piperacillin-tazobactam
Tazobactam inhibits β-lactamase enzymes; piperacillin binds penicillin-binding proteins
TEM and OXA ESBLS and carbapenemase enzymes NK 8 – 10.3
Cefuroxime† Binds penicillin-binding proteins, inhibiting cell wall synthesis
Expression of ESBLs or carbapenemase enzymes e.g. KPC
0.5 – 7.5 4 – 19.4
Meropenem Binds penicillin-binding proteins, inhibiting cell wall synthesis
Expression of carbapenemase enzymes; porin loss; upregulation of efflux pumps
NK 0 – 0.1
Trimethoprim Binds DHFR enzymes involved in folate metabolism
Increased enzyme activity or alternative enzyme e.g. dfrA
14.9 – 40.2 40
Trimethoprim-sulfamethoxazole
Binds DHFR and PABA enzymes involved in folate metabolism
Increased enzyme activity or alternative enzyme e.g. dfrA, sul1
14.4 40 - 54
Nitrofurantoin Inhibit enzymes of the citric acid cycle, DNA and protein synthesis
unknown 0 – 11 NK
Ciprofloxacin Binds DNA gyrase, preventing rejoining of DNA strands
Mutations in DNA gyrase (gyrA) and topoisomerase IV(parC) enzymes; DNA gyrase protection proteins (qnrA/B/C); efflux pumps (qepA, oqxAB); other enzymes e.g. aac(6’)-Ib-cr
0.5 - 12 14 – 42
Gentamicin‡ Binds 30S ribosomal subunit, inhibiting transcription and thus protein synthesis
Aminoglycoside modifying enzymes e.g. the N-acetyltransferase encoded by aac(6’)-Ib
0.5 – 6.3 7.5 – 12

Page | 46
†representative of cephalosporin resistance; ‡representative of aminoglycoside resistance
NB. DHFR – dihydrofolate reductase, PABA – para-aminobenzoic acid, UTI – urinary tract infection, BLC – bacteraemia, NK - unknown
*(Drawz and Bonomo, 2010; Joint Formulary Committee, 2013; Lacey, 1982; McOsker and Fitzpatrick, 1994; Neu and Gootz, 1996; Pan et al. 1996;
Strahilevitz et al. 2009)
#(Bean et al. 2008; Chakupurakal et al. 2010; Cooke et al. 2010; Health Protection Agency, 2011; Horner et al. 2014; Kahlmeter and Poulsen, 2012;
Livermore et al. 2008)

Page | 47
1.8 Typing
Traditionally E. coli strains were differentiated by phenotypic and biochemical methods, but these
have been surpassed by various molecular methods. Typing of E. coli was originally performed to
improve understanding of the species and infections it causes, but now typing facilitates outbreak
investigations and various research studies (Gibreel et al. 2012; Gordon et al. 2008; Johnson et al.
2012b; Ochman et al. 1983).
1.8.1 Serotyping
Serotyping of Escherichia coli was first described by Kauffman, who classified this genus according to
its O (somatic antigen, part of the surface lipopolysaccharide), H (flagellar) and K (capsular) antigens
(Kauffmann, 1947). One hundred and eighty-one O-antigens, 80 K-antigens and 56 H-antigens have
since been identified, creating thousands of possible unique O:H:K serotypes. Occasionally multiple
genera of Enterobacteriaceae may share the same serogroup, such as E. coli O8 and Klebsiella
pneumoniae O5 (Orskov and Orskov, 1992; Scheutz et al. 2004; Reeves and Wang, 2002).
Within virulent E. coli specific serogroups have been associated with intestinal and extra-
intestinal infections. In 1978, serogroups O6 and O16 were associated with adult and neonatal
infections, respectively, with O4, O6 and O18 particularly associated with septic shock and death
(McCabe et al. 1978). Other important extra-intestinal serogroups included O1, O2, O7, O8, O11,
O15, O22, O25, O75, O78, O83 and O86 (Ananias and Yano, 2008; Kanamuru et al. 2006; Korhonen
et al. 1985; McCabe et al. 1978; Melzer et al. 2008; Orskov and Orskov, 1992). Multiple E. coli
pathotypes (e.g. ExPEC, EAEC and ETEC) often share the same serogroups, probably due to genetic
exchange in the intestine before transmission to other sites. These include O1, O2, O4, O6, O15,
O18, O25 and O77 (Nataro and Kaper, 1998). ExPEC causing UTIs in companion animals, meanwhile,
also share serogroups common to human strains: O4 and O6. Together these serogroups
demonstrate the universal, cross-species virulence and success of E. coli (Orskov and Orskov, 1992;
Wang et al. 2010).

Page | 48
1.8.2 Multi-locus enzyme electrophoresis
Multi-locus enzyme electrophoresis (MLEE) was first described in the 1980s to characterise E. coli by
allelic variation of enzymes encoded at specific loci in the genome. Differences between alleles could
be used to approximate the number of nucleotide differences or amino acid substitutions. Unlike
serotyping, which often branded strains non-typeable; MLEE identified an allele every time. Analysis
of E. coli allelic variation identified three distinct clusters - I, II and III - with groups II and III closely
related (Ochman et al. 1983; Selander et al. 1986). The ECOR collection comprised 72 E. coli
reference strains isolated from humans and animals, from around the world, which represented the
genotypic diversity of E. coli, as determined by MLEE (Ochman and Selander, 1984). MLEE
characterisation of these isolates using 38 enzyme loci, instead of the traditional 20, separated these
isolates into four main phylogenetic groups (A, B1, B2 and D), which corresponded with Ochman’s
groups: I (A), II (B) and III (D). Originally there was also a phylogenetic group designated C, but MLEE
analysis led to the redistribution of these strains among the four other phylogenetic groups (Herzer
et al. 1990). However, phylogenetic group C has since been re-established as a sister group to B1,
while phylogenetic group E contains EHEC O157:H7 strains and phylogenetic group F is a sister group
to B2 strains (Clermont et al. 2011b; Croxen et al. 2013).
1.8.3 Phylogenetic Grouping
These studies and subsequent ones revealed phylogenetic groups (phylogroup) A and B1 to comprise
principally commensal and intestinal pathogenic strains, while phylogroups B2 and D contained
virulent, persistent strains causing extra-intestinal pathogenic infections. Occasionally there were
strains that contradicted this general consensus, such as EAEC and EPEC isolates which have been
classified as phylogroup D (Bingen et al. 1998; Croxen et al. 2013; Herzer et al. 1990; Ochman et al.
1983). Phylogroup distribution of Shigella species also varied, with most Shigella dysenteriae
classified as phylogroup B1, Shigella boydii classified as either phylogroup B1 or D, while the
remaining species were classified as phylogroup D. However, the closely related EIEC was classified

Page | 49
mostly within phylogroups A or B1 (Rolland et al. 1998). In addition, phylogroups B2 and D were
reported to have much larger genomes, suggesting acquisition of virulence-associated DNA
fragments and mobile elements from other strains or species (Boyd and Hartl, 1998).
To avoid the complex and time-consuming use of MLEE, a triplex PCR was developed, using
the genes chuA, yjaA and the DNA fragment TspE4C2, to identify these four principal phylogenetic
groups based on combinations of presence and absence of these three amplicons (Clermont et al.
2000). This simple, rapid procedure has since been used internationally to classify E. coli isolates
(Bukh et al. 2009; Cagnacci et al. 2008; Johnson et al. 2009a). However, comparison of this triplex
PCR with multi-locus sequence typing (MLST) schemes (see 1.1.2.4) identified some discrepancies,
due to genetic variation in the PCR target genes (Gordon et al. 2008). MLST data suggested that this
triplex PCR could not accurately assign 100% of E. coli isolates to the correct phylogroup. This report
also assigned isolates to phylogroups C and E, according to MLST data, but the PCR assay reported
these isolates as either phylogroup A, B1, B2 or D. It is possible that these strains represent hybrids
of the main phylogroups or that the assay needs updating, as these rare phylogroups have been
described previously (Clermont et al. 2011a; Escobar-Paramo et al. 2004; Gordon et al. 2008).
Recently a novel phylogroup has been described, but it is unclear how these strains relate to the
established phylogroups A - F (Mendonca et al. 2011; Molina-Lopez et al. 2011). To resolve this issue
of the novel phylogroup, the triplex PCR was revisited and primers redesigned for optimal
assignation of phylogroups (Doumith et al. 2012).
1.8.4 Multi-locus sequence typing (MLST)
Six years after the development of the phylogroup triplex PCR, MLST was developed to analyse and
classify the E. coli population. There are two main MLST schemes used for E. coli: the Institut Pasteur
scheme (www.pasteur.fr/mlst), which uses six gene targets, and the UK-based Achtman scheme,
which uses seven alternative gene targets, described here (Wirth et al. 2006). Sequencing and
concatenation of seven chromosomally conserved (house-keeping) genes interspersed around the E.

Page | 50
coli genome created a numeric profile or sequence type (ST): adk (adenylate kinase), fumC (fumarate
hydratase), gyrB (DNA gyrase, subunit B), icd (isocitrate dehydrogenase), mdh (malate
dehydrogenase), purA (adenylosuccinate synthetase) and recA (recombinase A). This scheme has
identified between 292 and 533 alleles, based on sequence polymorphisms, for each of the seven
target genes, creating thousands of hypothetical STs. However, only 600 STs and 54 sequence type
complexes (STC) have been identified (http://mlst.warwick.ac.uk), demonstrating the conservative
and clonal nature of E. coli (according to ST and STC), but also the diversity (according to alleles).
Clustering of ST data was mostly in agreement with the four major phylogenetic groups. However,
there were additional hybrid groups containing isolates belonging to two (AxB1) or three (ABD) of
the phylogenetic groups, which appear to have resulted from homologous recombination. These
virulent hybrids likely represent phylogroups C and E, as these clusters included Shigella species,
diarrhoeagenic strains and some extra-intestinal strains (Wirth et al. 2006).
The Achtman MLST scheme has since become well established in the field of ExPEC (Dias et al. 2009;
Manges et al. 2008; Nicolas-Chanoine et al. 2008). However, it should be noted that data generated
by the Institut Pasteur scheme and Achtman scheme are not entirely comparable (Gordon et al.
2008) and major ExPEC clones have often been defined by the Achtman scheme only (Tartof et al.
2005).
With the advent of whole genome sequencing, MLST and phylogroup data can now be acquired
simultaneously, along with the detection and identification of genes for virulence factors and those
conferring antibiotic resistance or raised MICs. Isolates may also be compared by SNP analysis
(McNally et al. 2013). In the future, this technique may supersede all those used in this study to
characterise ExPEC.
1.8.5 Pulsed-field gel electrophoresis
Pulsed-field gel electrophoresis (PFGE) has been used to analyse inter-strain, inter-species and
intergenic variation in DNA. Restriction enzymes are used to cleave DNA, infrequently, at specific

Page | 51
restriction sites, producing DNA bands of various lengths according to the number of restriction sites
and polymorphisms. Separation of these bands using an alternating electric current enables optimal
resolution of large DNA fragments and separation of the smaller DNA fragments (Bingen et al. 1994).
In reference facilities and research laboratories, PFGE compares epidemiologically linked isolates to
determine their genetic relatedness and to identify outbreak strains (Gibreel et al. 2012; Manges et
al. 2008). As with serotyping this method can be time-consuming, but PFGE provides a deeper
analysis of E. coli populations, often sub-dividing different clones and lineages. While this can
facilitate understanding of a particular lineage, it also adds another layer of complexity in
understanding extra-intestinal E. coli. Therefore, it is important to use this method in the right
setting, such as discriminating outbreak and non-outbreak strains.
1.9 Lineages of extra-intestinal pathogenic Escherichia coli
1.9.1 Major lineages
Monitoring of antibiotic resistance and molecular typing has identified specific ExPEC lineages. They
pose a significant public health threat due to their resistance and circulation in the community
(Johnson et al. 2009a; Woodford et al. 2004). The five major lineages are ST131, ST95, ST73, ST69
and ST127 and belong principally to phylogroup B2, but also to group D (ST69). Particular serogroups
associated with these lineages include O1 (ST95), O6 (ST73 and ST127), O17 (ST69) and O25 (ST131
and ST69), which are frequently identified along with O2, O4, O8, O9, O15, O17, O18 and O75
(Gibreel et al. 2012; Johnson and Stell, 2000; Johnson et al. 2013; Lau et al. 2008b; Manges et al.
2008; Weissman et al. 2012; Johnson and Russo, 2002).
1.9.2 ST127
ST127 (phylogroup B2) is associated with UTIs, serotype O6:H31 and IroN, S/F1C-fimbriae, HlyA and
Cnf1 (Johnson et al. 2006; Lau et al. 2008b). An alternative study linked ST127 to canine infections
and virulence factors IreA, K15 and F48, F536 and F16 fimbriae (Johnson et al. 2008b). Compared to

Page | 52
the other ExPEC lineages, ST127 reportedly has the highest number of virulence factors, but is
relatively antibiotic susceptible (Gibreel et al. 2012). Despite this, ST127 comprised approximately
1%-6% ExPEC strains (Banerjee et al. 2013a; Gibreel et al. 2012; Horner et al. 2014; Lau et al. 2008b;
Mahjoub-Messai et al. 2011).
1.9.3 ST73
ST73 (phylogroup B2) was associated with serogroup O6, specifically serotype O6:K2:H1, and causing
UTIs. Additional associated serogroups included O2 and O18, plus the virulence factors P-fimbriae,
F1C-fimbriae, IutA, Iha, Sat and HlyA (Johnson et al. 2006; Johnson et al. 2008b; Lau et al. 2008b;
Mahjoub-Messai et al. 2011; Manges et al. 2008).
ST73 strains are often pan-susceptible (29%), with ampicillin, amoxicillin-clavulanate and
trimethoprim resistance reported, very occasionally with ESBL expression (Dias et al. 2009; Horner et
al. 2014; Kang et al. 2013; Manges et al. 2008). However, ST73 strains were more prevalent
accounting for 7%-15% of ExPEC (Dias et al. 2009; Lau et al. 2008b; Mahjoub-Messai et al. 2011).
1.9.4 ST95
Human ST95 (phylogroup B2) strains are reported to have originated from APEC. Classified by
serogroups O2 and O18, plus serotype O1:K1:H7/NM, isolates appear to have an antibiogram similar
to ST73 (Manges et al. 2008; Mora et al. 2009). Associated virulence factors included type I fimbriae,
P-fimbriae, Tsh, IroN, colicin V and Iss, although Tsh, IroN, Iss and colicin C were more common in
APEC (Mora et al. 2009). Studies reveal ST95 to account for 7%-38% ExPEC strains causing UTI and
bacteraemia (Lau et al. 2008b; Mahjoub-Messai et al. 2011).
1.9.5 ST69
ST69 (phylogroup D) was originally isolated from women with a UTI in North America, in 2001, and
was associated with trimethoprim-sulfamethoxazole resistance (Manges et al. 2001). Also known as
Clonal group A (CgA) the majority of isolates belong to serogroups O11, O15, O17, O25, O44, O73,
Page | 53
O77, O86 and O125ab. However, resistance to trimethoprim-sulfamethoxazole has varied by study
(8%-93%), calling into question the validity of UTI treatment guidelines in eradicating this lineage
(Blanco et al. 2011; Dias et al. 2009; Gupta et al. 2011; Lau et al. 2008b; Manges et al. 2008; SIGN,
2006; Skjot-Rasmussen et al .2012b; Tartof et al. 2005). Virulence factors are also varied, but include
type I fimbriae, P-fimbriae, Sat, IutA, group II capsule, TraT, Iha, FyuA, Sat, OmpT and Ag43 (Blanco et
al. 2011; Johnson et al. 2009a; Skjot-Rasmussen et al. 2012b). Prevalence of ST69 also varies by
study and country (4%-15%), demonstrating that the significance of this particular lineage varies
geographically (Blanco et al. 2011; Dias et al. 2009; Johnson et al. 2009a; Skjot-Rasmussen et al.
2012b).
1.9.6 ST131
The ST131 lineage contains an extensive range of strains, predominantly of phylogroup B2, but also
group D, as well as ranging in antibiotic susceptibility. However, studies tend to focus on CTX-M-15
producing, ciprofloxacin resistant, O25b:H4 strains; using fluoroquinolone resistance as the
definitive characteristic of this sub-clone (Clermont et al. 2008; Gibreel et al. 2012; Lau et al. 2008a;
Nicolas-Chanoine et al. 2008; Peirano and Pitout, 2010). PFGE analysis also demonstrates great sub-
clonal diversity (Lau et al. 2008a), but virulence factors are relatively conserved with most strains
expressing type I fimbriae, Sat, FyuA, Usp, OmpT, TraT and malX (Blanco et al. 2011; Clermont et al.
2008; Johnson et al. 2009a; Nicolas-Chanoine et al. 2008). The prevalence of this clone ranges from
12% to 43%, as does resistance to extended-spectrum cephalosporins (16%-69%), fluoroquinolones
(26%-67%), aminoglycosides (28%-55%) and trimethoprim-sulfamethoxazole (18%-31%) (Blanco et
al. 2011; Johnson et al. 2009a; Johnson et al. 2010).
1.10 Present-day situation
E. coli is the predominant cause of UTIs and bacteraemia within the UK and worldwide (de Kraker et
al. 2012; Den Heijer et al. 2010; Health Protection Agency, 2011; Koeijers et al. 2010).

Page | 54
Phylogroups B2 and D are most prevalent, but phylogroups A and B1 are also increasing (Abdallah et
al. 2011; Clermont et al. 2013a; Lee et al. 2010), with a significant number of ESBL producers
observed among phylogroup A (Lee et al. 2010; Pitout et al. 2005).
Increasing resistance to cephalosporins, fluoroquinolones, aminoglycosides and trimethoprim-
sulfamethoxazole has been associated with these circulating lineages, particularly ST131 and ST69
(Colpan et al. 2013; Johnson et al. 2011). However, it is unclear how other sequence types may be
contributing to antibiotic resistance in E. coli. In addition, UK resistance rates are routinely
monitored for E. coli causing bacteraemia by the BSAC bacteraemia resistance surveillance
programme, but little is known about resistance in other infections, such as urinary tract infections,
with the exception of hospitals or research groups reporting results from their studies (Reynolds et
al. 2008; Bean et al. 2008; Gibreel et al. 2012). Resistance surveillance is especially important in light
of the rapid rise and spread of carbapenemase-producing Enterobacteriaceae across Europe, with
13% of those referred to Public Health England’s Antimicrobial Resistance and Healthcare Associated
Infections Reference Unit identified as E. coli (Woodford et al. 2013).
ExPEC isolates are reported to have an inverse relationship between antibiotic resistance and
virulence (Cooke et al. 2010; Piatti et al. 2008). As the major ExPEC lineages vary in their virulence
and resistance it is important to investigate this phenomenon, to achieve greater understanding of
the true implication of these lineages (Gibreel et al. 2012; Johnson et al. 2009a).
In order to accomplish this the current ExPEC population needs to be defined and the future
population structure predicted; the repercussions of ESBL-producing phylogroup A strains needs to
be evaluated, as well as the likelihood of carbapenem-resistant and pan-resistant ExPEC emerging;
and the heterogeneity of virulence factor possession within clonal strains and ExPEC as a whole
needs to be investigated, as does the potential for novel MLST types or emerging clones.

Page | 55
2. Hypothesis and Project aims
Hypothesis 1: Urinary E. coli strains are predominantly isolated from female patients aged 18-60
years, while bacteraemia strains are frequently isolated from patients >60 years old. ExPEC strains in
the UK and London are highly variable, but predominantly comprise specific lineages and
serogroups, with the majority of isolates belonging to phylogroups B2 and D.
Aim 1: Define the patient population for ExPEC infections and the UK ExPEC population using patient
data and molecular typing techniques. Compare isolates from London and the UK to identify
similarities between these two populations.
Hypothesis 2: Urinary E. coli are more susceptible to antibiotics than bacteraemia strains, with
resistance more significant in bacteraemia isolates. However, overall antibiotic resistance in E. coli is
rising.
Aim 2: Determine the antibiograms for urinary and bacteraemia E. coli strains by agar dilution and
perform PCRs to detect various resistance genes. Describe resistance rates according to patient and
strain variables; compare with published reports; and interpret the results in light of current
therapeutic guidelines.
Hypothesis 3: ST131-O25b is the most prevalent ExPEC lineage and the greatest threat to empirical
antibiotic therapy in the UK.
Aim 3: Determine the prevalence of ST131 strains in the UK and by Public Health England region.
Characterise the clone using established methods.
Hypothesis 4: Specific virulence factors are required to cause bacteraemia, which differ from those
required for causing UTI. E. coli causing urosepsis are more resistant and virulent.

Page | 56
Aim 4: Define and compare the virulence factors required for causing UTI, bacteraemia and
urosepsis. Use an infection model to determine the significance of virulence or resistance in
urosepsis.

Page | 57
3. Materials and Methods
This chapter includes details of the isolate collections and the tests performed on these specimens
prior to study collection. Generic methods used throughout the study are detailed here, while
chapter-specific methods and amendments are included in the relevant sections of this thesis.
3.1 Study Definitions
E. coli Bacteraemia – E. coli isolated from a positive blood culture as determined using the BD
BACTEC™ (Becton Dickinson, Maryland, USA). At the Royal London Hospital only isolates with ≥1 of
the following signs or symptoms were collected during the study: fever, rigors, confusion, query
sepsis, pyelonephritis, fall, diarrhoea and vomiting, query unwell or hypotension (O'Grady et al.
2008).
Asymptomatic Bacteruria - Isolation of ≥104-105 CFU per ml of bacteria, in pure form, from the
patient’s urine (Kass, 1957), with no symptoms suggestive of UTI at the time of collection (Nicolle et
al. 2005; SIGN, 2006) and no other signs or sources of infection detected. For pregnant women,
isolates were collected from urine that was taken at the first antenatal appointment.
Uncomplicated Cystitis – Diagnosis was based on semi-quantitative culture, as described above, and
the presence of ≥1 of the following symptoms: frequency, urgency, dysuria and/or suprapubic pain,
pyuria and/or haematuria, with no signs suggestive of kidney infection (Nicolle et al. 2005; SIGN,
2006).
Complicated cystitis and/or pyelonephritis – Complicated cystitis was defined as a patient with lower
UTI symptoms in the presence of a functional/structural abnormality or complication, including
prostatitis, recurrent infection, immunocompromised (e.g. diabetes, multiple sclerosis), urinary tract
abnormality or recent genito-urinary surgery. UTIs in men were considered complicated infections.
Pyelonephritis was defined as bladder infection, accompanied by ≥1 symptoms suggestive of upper

Page | 58
UTI, including costovertebral angle (flank) pain and tenderness, loin pain, fever, chills, rigors or other
signs suggestive of systemic inflammatory response (Nicolle et al. 2005; SIGN, 2006).
Note: there has been much debate about how to classify UTI in children due to difficulty diagnosing
UTIs and the risk of renal scarring. As part of this study, children <18 years who presented with
symptoms suggestive of lower urinary tract infection were classified as uncomplicated cystitis.
Children <18 years presenting with a fever, loin pain and/or tenderness or other signs suggestive of
upper urinary tract infection were classified as complicated UTI (Habib, 2012; NICE, 2007). As with
adults, all males with a UTI were considered complicated infections.
Community-associated Infection (CAI) – Patient presenting with signs or symptoms of an infection to
their General Practitioner (GP), community clinic or out-patient department (OPD), including
Accident and Emergency. CAI also included hospitalised patients who presented with signs or
symptoms of infection within 48 hours of admission.
Hospital-associated Infection (HAI) – Hospitalised patient who presented with signs or symptoms of
infection more than 48 hours after admission. Infections may also be defined as healthcare-
associated, such as those in nursing homes or those that have been hospitalized within the last 30
days but have since been discharged (Cooke et al. 2010). Due to the lack of patient information it
was not possible to identify isolates that fit this definition. Therefore, this study defines isolates as
CAI and HAI only.
Non-susceptible – In this study non-susceptible referred to isolates considered as completely
resistant or with intermediate resistance to an antibiotic, as determined by comparing the minimum
inhibitory concentration (MIC) with the antibiotic specific breakpoint (Andrews, 2001; The European
Committee on Antimicrobial Susceptibility Testing, 2014).

Page | 59
3.2 Escherichia coli Isolates
3.2.1 Local Collection
In total 556 (n=508 urinary & n=48 bacteraemia) E. coli isolates were collected from 540 patients at
the Clinical Microbiology Laboratory at the Royal London Hospital, between October 2011 and
February 2012. Demographical data collected alongside each isolate included patient age, sex and
healthcare setting (e.g. GP, Accident & emergency, Hospital name, etc). The Clinical Microbiology
laboratory serves GPs, clinics and hospitals of three London boroughs; Hackney, Tower Hamlets,
Newham and now Waltham Forest, although Waltham Forest was included after all study isolates
were collected.
Patients were classed as having either a community-associated infection (CAI) or a hospital-
associated (HAI); urinary tract infections were defined as asymptomatic bacteruria (ABU),
uncomplicated cystitis (UC) or complicated cystitis and/or pyelonephritis (COMP) based on clinical
details; and source of infection was identified by a positive culture of the same organism, collected
within 24 hours of the blood culture, from urine, stool, site-specific swab, site-specific fluid, cerebral
spinal fluid (CSF), tips or sputum specimen.
Only one isolate was collected per patient, except for 17 patients where E. coli isolates were
collected from both their urine and their blood (paired isolates), for comparison. Paired isolates
were only collected from clinical specimens that were taken within 24 hours of each other.
3.2.2 BSAC Collection
In total 521 E. coli isolates were collected as part of the BSAC Bacteraemia Resistance Surveillance
Programme by Public Health England (PHE, Colindale, UK), from 38 laboratories around the UK and
Republic of Ireland, between 1st January and 31st December 2011. Each laboratory sent up to 14
consecutive E. coli isolates from separate patients. Demographical data received with the isolates
included patient age, sex, source of bacteraemia and healthcare setting. From here on these isolates
will be known as the BSAC (2011) collection. Only isolates accompanied by a full set of
demographical data were included in the study.

Page | 60
3.2.3 Identification
Local collection: Pink colonies grown on BrillianceTM UTI Agar (Oxoid, Basingstoke, UK) were
provisionally identified as urinary E. coli. Blood culture isolates were sub-cultured on to blood agar
(Oxoid) after a Gram stain of the positive bottle revealed Gram-negative rods. All urinary and blood
culture isolates were identified as E. coli using MALDI-Tof MS (Bruker Daltonik GmbH, Bremen,
Germany), according to the manufacturer’s instructions. Briefly, individual colonies were lightly
smeared on to the target plate and overlaid with matrix (α-cyano-4-hydroxycinnamic acid in 50%
acetonitrile/2.5% trifluoroacetic acid). Once dried, the plates are loaded into the mass spectrometer,
where each sample is vaporised (desorption) by the laser and ionised. The mass analyser detects
these ions, creating a spectral image unique to bacterial and fungal genera and most species (Clark
et al. 2013).
BSAC collection: Isolates were sub-cultured on to MacConkey agar (PHE) to check for pure growth.
Pure cultures were then sub-cultured on to nutrient agar (PHE) before their identity was confirmed
using MALDI-Tof MS (Bruker Daltonik), as above.
3.3 DNA extraction
DNA lysates were prepared from pure cultures using a simple boil extraction. A 10 µl loop of
overnight culture was suspended in 200 µl sterile distilled water and incubated at 95°C for 10
minutes. The suspensions were cooled to room temperature and centrifuged for 1 minute at 13,000
rpm in a HeraeusTM PicoTM microcentrifuge (Thermo Scientific, MA, USA) to pellet the cell debris.
Supernatant containing the DNA was transferred to a new eppendorf and stored at -20°C, for
approximately one month, until required for PCR assays and/or transformation.
3.4 Polymerase chain reaction (PCR)
Throughout this project multiple genes were sought to facilitate characterisation and identification
of the study isolates.

Page | 61
Assays performed at the Blizard Institute (Queen Mary’s) used 12.5 µl ReddyMixTM PCR Master Mix
(Thermo Scientific) as the main component for all PCR reactions. While assays performed at PHE
used 12.5 µl MyTaqTM Red Mix (Bioline, London, UK) as the main component for all PCR reactions.
Only the phylogrouping assay (section 4.2.2) was performed at both sites, using both master mixes.
Positive controls were used to validate the assay at each site and master mixes were found to be
comparable.
Primers were used at a concentration of 0.5 µM and reactions made up to 20 µl with sterile-filtered
water (Sigma-Aldrich Company Ltd., Gillingham, Dorset, UK), unless otherwise stated.
Amplification typically consisted of an initial hold at 94°C for 3 minutes; followed by 30 cycles of
denaturation at 94°C for 30 seconds, annealing at 65°C for 30 seconds, and extension at 72°C for 1
minute; with a final extension at 72°C for 5 minutes. Alternative cycling conditions are included in
the relevant sections and all primers are listed in appendix C.
Amplified DNA was separated by 2% gel electrophoresis (section 3.5), alongside an InvitrogenTM 100
base-pair (bp) or 123 bp DNA ladder (Life Technologies, Paisley, UK).
3.5 Gel electrophoresis
A 2% agarose gel was prepared using 2 g UltraPureTM agarose (InvitrogenTM, Life Technologies)
dissolved in 100 ml 1X Tris-Borate-EDTA (TBE) buffer (Promega, Southampton, UK). DNA samples
were electrophoresed in BionicTM 1X buffer (Sigma) or TBE buffer at 130 volts for 90 minutes. Gels
were stained for at least 30 minutes in ethidium bromide solution or GelredTM (Biotium, CA, USA)
and excess removed by rinsing in distilled water. The banding patterns were visualised using a G:Box
imaging camera (IMGEN technologies, Alexandria, VA, USA) and software.
3.6 PCR product purification
Purification of CMY PCR products, at QMUL, (see section 5.2.8) was performed using the MinElute®
PCR purification kit (Qiagen, Crawley, UK). The in-house method was used to purify all other PCR
Page | 62
products. Purified DNA was stored at 4°C to -20°C until required for DNA sequencing (maximum one
week).
For the MinElute® PCR purification PCR products were diluted 5-fold in binding buffer and
transferred to a spin column. Centrifugation for 1 minute at 13,000 rpm transferred DNA onto the
column membrane. The DNA was washed with 750 µl of wash buffer and centrifuged again. DNA
was then eluted in 20 µl elution buffer (10mM Tris-chloride, pH 8.5) or water, by centrifuging again
for one minute.
For the in-house method 2 µl reaction solution was mixed with 10 µl PCR product and incubated at
37°C for 45 minutes (enzyme activation), followed by 80°C for 20 minutes (enzyme inactivation). The
final purified product was diluted 1:2 prior to sequencing. The reaction solution was made up in 10
µl aliquots consisting of 1 µl exonuclease I reaction buffer (New England BioLabs© Inc., MA, USA), 1
µl rAPid alkaline phosphatase reaction buffer (Roche Diagnostics Ltd., Burgess Hill, UK), 1 µl
exonuclease I enzyme (New England BioLabs©), 1 µl rAPid alkaline phosphatase enzyme (Roche
Diagnostics Ltd.) and 6 µl sterile-filtered water.
3.7 Sanger DNA sequencing
PCR amplicons were sequenced using the dideoxy Sanger sequencing method (Shendure et al. 2004)
and DNA sequences determined using an ABI Genetic Analyser Capillary Platform (Life technologies).
CMY plasmids were sequenced by Source Bioscience (London) and all other purified PCR products
were sequenced by the Genomic Services Unit at PHE.
3.8 Statistics
Statistical analysis was performed using STATA®, version 12 (StataCorp LP, TX, USA). For tests used
and set significance level please refer to each chapter.
GraphPad Prism version 5.04 (GraphPad Software Inc., CA, USA) was used for analysis of data
generated using the Galleria mellonella assay (chapter 8).

Page | 63
3.9 Ethics
This research project was logged with the Queen Mary Research Office, the Barts Health NHS Trust
Joint Research and Development Office and Public Health England’s Research and Development
Office (Appendix A).
NHS research ethics approval was not required for this study, as this study used sub-cultures of
bacteria isolated from patient’s specimens and patient identifiable information was not used. Please
see a quote from the Barts Health NHS Trust website below:
“We often receive queries asking if it is necessary to seek ethics approval before
commencing research using collections of micro organisms, where the organisms were
derived from human samples. Professor Terry Stacey, Director of the National Research
Ethics Service, has advised that there is no need to seek approval from an NHS research
ethics committee for such projects.
Guidance from the Department of Health’s inspector of microbiology confirmed this, and in
addition stated that “any bacterial sub-cultures and viruses isolates, made from clinical
specimens, are not part of the specimen themselves, they do not belong to the patient from
whom they were obtained”.
However, if you are at all in doubt about your study, it is best to check before going ahead,
to confirm that no ethics approval is needed.”
(http://www.bartshealth.nhs.uk/research/governance/administrative-processes/ethical-approval/
Accessed 8th October 2011).

Page | 64
4. The UK ExPEC population
4.1 Introduction
Escherichia coli is the most common cause of urinary tract infection (UTI) in the UK and Europe
(Chakupurakal et al. 2010; Denes et al. 2012; Kahlmeter, 2003). Predominantly an infection of
women, the majority of symptomatic patients (men and women) present to their GP or community
clinic, with fewer healthcare-associated UTIs reported (Bean et al. 2008; Hryniewicz et al. 2001).
Although, the World Health Organisation ranks UTIs as the most common hospital-associated
infection (HAI), in the UK UTI is secondary to respiratory infections among hospitalised patients,
while across Europe UTIs are the third most frequently reported HAI (World Health Organisation,
2002; Health Protection Agency, 2012c; European Centre for Disease Prevention and Control, 2013a).
Importantly, the urinary tract is reported as the most frequent source of bacteraemia and E. coli the
most common pathogen (Bukh et al. 2009; de Kraker et al. 2012; Horner et al. 2014; Hounsom et al.
2011). Unlike UTI, bacteraemia is more frequently diagnosed in men and is predominantly an
infection of those aged >64 years. However, as with UTIs, bacteraemia is more frequently a
community-associated infection (CAI) (Health Protection Agency, 2011; Health Protection Agency,
2014; Hounsom et al. 2011; Laupland et al. 2008).
With these slight variations in patient demographics, it is important to define the UK patient
population at risk of E. coli UTI and/or bacteraemia. This will provide insight into how these two
infections are linked or whether they are primarily independent infections that occasionally occur
together.
Over the years extra-intestinal pathogenic E. coli (ExPEC) have been characterised by source of
infection (extra-intestinal site), phylogroup (chiefly B2 and D), virulence factors and antibiotic
resistance (Clermont et al. 2000; Johnson et al. 2009a; Johnson and Stell, 2000; Russo and Johnson,
2000). However, studies of ExPEC often focus on restricted geographical areas (e.g. North-West
England), particular infection syndromes (e.g. urosepsis) or strain characteristics (e.g. serogroup O6),

Page | 65
rather than the ExPEC population as a whole in a particular region or country (Johnson et al. 2008b;
Lau et al. 2008a; Lau et al. 2008b). In the UK the BSAC Bacteraemia Resistance Surveillance
Programme routinely monitors the antibiogram of E. coli isolates collected from around the UK
(Reynolds et al. 2008), but does not analyse the genotypic characteristics that comprise this E. coli
population. In addition, there is no UK-wide study of urinary E. coli and it was impractical to collect
urinary E. coli from around the UK for this study. However, as E. coli bacteraemia is primarily caused
by urinary E. coli, it was decided that urinary E. coli isolates collected in East London could be directly
compared to the UK-derived bloodstream isolates.
Therefore, this study characterised 521 bloodstream isolates collected from across the UK, as well as
556 urinary and bloodstream isolates collected in London, with the aim of defining the UK ExPEC
population, the patients frequently affected by these strains and to determine whether these
populations have changed over time.

Page | 66
4.2 Methods
4.2.1 Isolates
Details of the Local (n=556; 508 urinary, 48 bloodstream) and BSAC (n=521) collections of E. coli
isolates can be found in section 3.2. It was originally planned to collect urinary and bloodstream
isolates over a similar time period so that they could be directly comparable. Unfortunately it was
not possible to collect urinary isolates retrospectively from January 2011 through to October 2011
when this project started. Therefore, urinary isolates were collected between October 2011 and
March 2012. A similar number of urinary and BSAC isolates were collected to facilitate fair
comparisons between specimen collections, although the bacteraemia isolates were collected from
a widespread geographical region compared to the urinary isolates which were restricted to East
London.
Only BSAC isolates with a full complement of patient data (sex, age, location) were analysed,
regardless of the source of infection. The strategy for collecting the urinary isolates was different
and focused on the type of UTI, with relatively equal proportions of uncomplicated (UC) and
complicated (COMP) cystitis/pyelonephritis isolates and a smaller proportion of asymptomatic
bacteruria (ABU) isolates. This was to enable large-scale characterisation of E. coli isolates causing
uncomplicated cystitis, complicated cystitis/pyelonephritis and asymptomatic bacteruria, but also
considered the difficulty in collecting an equally large proportion of asymptomatic bacteruria
isolates. The lack of clinical details accompanying urine specimens and available information on the
hospital information systems led to development of the study definitions (section 2.1). These
definitions ensured urinary isolates were collected that categorically matched each UTI type. Local
bloodstream isolates were collected similarly to the BSAC isolates, with complete patient
demographics. However, the focus on collecting paired isolates, from both the urine and blood of a
patient, led to a much smaller collection of Local bloodstream isolates.

Page | 67
4.2.2 Phylogenetic Grouping
All 1077 isolates underwent phylogenetic grouping using a modified multiplex PCR assay (Doumith et
al. 2012) based on the PCR previously described by Clermont et al (2000). This method enabled
distinction between phylogroup A isolates that lacked all three ExPEC genetic markers and PCR-
negative isolates, by inclusion of a universal E. coli (gadA) marker.
PCR reaction and amplification conditions were as described in section 3.4, with an abbreviated
extension step of 30 seconds per cycle. Primers are listed in appendix C. The banding pattern
generated by gel electrophoresis (section 3.5) was used to identify the phylogroup (Table 5).
Table 5 Multiplex PCR profiles for the four principal Escherichia coli phylogenetic groups
All possible phylogroup A, B1, B2 and D profiles are included, along with an unknown profile
reported by several authors and seen in this study (Clermont, Bonacorsi, & Bingen 2000;Doumith,
Day, Hope, Wain, & Woodford 2012;Mendonca, Calhau, Lin, Boaventura, Ribeiro, & Da Silva
2011;Skjot-Rasmussen et al. 2013). Targets included the E. coli specific target, glutamate
decarboxylase alpha gene (gadA), an outer membrane heme receptor (chuA), a hypothetical protein
(yjaA) and a DNA fragment from a lipase esterase gene (TspE4.C2).
Targets A A B1 B2 B2 D D UnknowngadA X X X X X X X XchuA X X X XyjaA X X X X
TspE4.C2 X X X X
4.2.3 Sequence type PCR
The five major ExPEC lineages are ST131, ST127, ST95, ST73 and ST69 (Gibreel et al. 2012; Lau et al.
2008b; Manges et al. 2008). All isolates were screened for these lineages by multiplex PCR (Doumith
et al. 2014). Primers are listed in appendix C. PCR reactions were prepared according to section 3.4,
with 12.5 µl PCR buffer. Amplification conditions were as described in section 3.4, with an annealing

Page | 68
temperature of 60°C and an extension step of 30 seconds, followed by a final hold at 72°C for 3
minutes. Products were separated by gel electrophoresis (section 3.5) and band size used to identify
the lineage: ST131 (310bp), ST127 (404bp), ST95 (200bp), ST73 (490bp) and ST69 (100bp).
4.2.4 Multi-Locus Sequence Typing (MLST)
Paired isolates that were PCR-negative for the five major ExPEC lineages underwent MLST, using the
Achtman scheme (http://mlst.warwick.ac.uk/mlst/) and a modified version of the protocol described
by Wirth et al (Wirth et al. 2006). Primers and corresponding annealing temperatures can be found
in appendix C. The isolate with the unusual phylogroup profile also underwent MLST, as did an ST131
isolate with a serogroup novel to this clone, to confirm the sequence type PCR result.
PCR reactions were as described in section 3.4, using 15 µl PCR buffer. Cycling conditions consisted
of an initial hold at 94°C for 2 minutes; followed by 30 cycles of denaturation at 94°C for 1 minute,
annealing at 54°C for 1 minute and extension at 72°C for 1 minute; completed by a final hold at 72°C
for 5 minutes. Products were separated by gel electrophoresis (section 3.5) to confirm gene
presence; amplicons purified (section 3.6) and sequenced (section 3.7). Sequences were aligned in
BioNumerics version 6.1 (Applied Maths NV, Sint-Martens-Latem, Belgium) and entered into the
Achtman scheme database to identify the specific gene alleles and composite sequence type.
4.2.5 Serogrouping
Six hundred and fifty-nine of 1077 (61%) sequential E. coli isolates (n=380 urinary and n=279
bloodstream) were serogrouped and this was done according to the method by Gross and Rowe
(Gross and Rowe, 1985), as adopted by the Gastrointestinal Bacterial Reference Unit, Public Health
England.
Isolates were grown overnight at 37°C in Hedley Wright broth, then steamed at 100°C for 40 minutes
using an SBB14 boiling bath (Grant Instruments Ltd, Cambridge, UK). Cultures were cooled and
preserved in 0.3% (v/v) formal saline at a ratio of 1:2.

Page | 69
Serogrouping was performed in three stages. 1) Equal volume of culture (40 µl) was added to the
screening plate, containing all 191 O-antisera (PHE), and incubated at 50°C overnight. Positive
agglutinations were recorded and these O-antisera used in the second stage. 2) Titrations of the
positive sera were prepared (doubling dilutions in saline from 1/100 to 1/6400), equal volumes of
culture were added (50 µl) and the plate incubated as previous. Positive agglutinations and titres
were recorded and compared with titres of the relevant O-antigen control strain. Titres equal to that
of the control strain, or within two doubling dilutions, were titrated against pure absorbed antisera.
3) Pure monoclonal antisera were diluted 1:5 then titrated in a 96-well microtitre plate (Thermo
Scientific) as before (doubling dilutions in saline). Equal volumes of culture were added (50 µl) and
suspensions were incubated overnight as previous. If the test isolate generated a titre equal to, or
within one doubling dilution, of the O-antigen control strain the serogroup was recorded and
identified.
All bloodstream isolates and urinary isolates that were negative at the initial screen (191 O-antisera)
were autoclaved at 121°C for 15 minutes to remove possible capsular material. Isolates that
agglutinated with all O-antisera at the initial screen were sub-cultured into a Thiotone Craigie broth
for 1-5 days at 37°C to remove the rough coat and serogrouping repeated.
Isolates that were positive for one of the five major ExPEC lineages (section 4.2.3) were screened for
all serogroups previously identified in each corresponding ST (Table 6) (Johnson et al. 2008b;
Manges et al. 2008; Platell et al. 2011). If negative for these serogroups, the complete serogrouping
procedure was performed. All other isolates underwent the complete serogrouping procedure.
Isolates that did not generate significant agglutination titres or did not agglutinate with any of the
initial antiserum were classified as O-non-typeable (NT). Isolates which agglutinated with more than
40 antisera were classified as rough/NT.

Page | 70
Table 6 The five major ExPEC lineages and their corresponding serogroups as reported in studies
conducted in the UK, North America and Australia (Johnson et al. 2008b; Lau et al. 2008b; Manges et
al. 2008; Platell et al. 2011).
Sequence type
Phylogroup Corresponding serogroups
ST131 B2 O16 O25ST127 B2 O6ST95 B2 O1 O2 O18ST73 B2 O6 O18ST69 D O11 O15 O17 O25 O73 O77
4.2.6 Enteroaggregative E. coli (EAEC) PCR
A selection of urinary isolates, with serogroups frequently detected in EAEC (O3, O15, O44, O62,
O77, O78 and O86), were selected for aggR screening (Olesen et al. 2012; Smith et al. 1994;
Wallace-Gadsden et al. 2007). The aggR gene regulates expression of aggregative adherence
fimbriae I (AAF/I) and is restricted to EAEC, making it an ideal target for differentiating between
EAEC and other diarrheal pathotypes (Nataro et al. 1994), plus extra-intestinal E. coli. This assay was
performed by colleagues in the Gastrointestinal Bacterial Reference Unit, PHE, using the method
published by Chattaway and Jenkins (2014) (Chattaway et al. 2014).
Each PCR reaction contained 12.5 µl FAST BLUE qPCR MasterMix (Eurogentec, Southampton, UK), 10
µM of each primer, 1 mM of probe and 1 µl of DNA lysate made up to 25 µl with sterile-filtered
water (Sigma). Primers are listed in appendix C. Amplification consisted of an initial hold at 95°C for 5
minutes; followed by 30 cycles of denaturation at 94°C for 1 minute, annealing at 55°C for 1 minute
and elongation at 72°C for 1 minute; and a final extensions at 72°C for 10 minutes on a Rotor-Gene Q
(Qiagen GmbH, Hilden, Germany).
4.2.7 Pulsed-field Gel Electrophoresis (PFGE)
Paired isolates, isolate 3837 (unknown phylogroup) and a random, diverse selection of isolates
(n=22) representing the major ExPEC lineages and phylogroups were analysed by PFGE. This was
performed to facilitate identification (unknown phylogroup), to determine if urosepsis is caused by

Page | 71
one or multiple strains (paired isolates) and to determine the general relatedness of ExPEC strains
(lineage isolates). PFGE was performed using the method described by Turton et al (Turton et al.
2004), as adopted by the Antimicrobial Resistance and Healthcare Associated Infections Reference
Unit (AMRHAI), PHE.
Isolates were grown on nutrient agar overnight at 37°C and colonies suspended in 1 ml suspension
(SE) buffer to a density of 2.3-2.7 McFarland. A 1:1 suspension of culture and 2% agarose (Sigma)
was prepared and aliquotted into gel blocks. Blocks were set at 4°C for <1 hour, then suspended in 3
ml first lysis buffer with 0.5 mg/ml lysozyme (Sigma), overnight at 37°C, with shaking at 550 rpm on
an Innova® 2100 platform shaker (New Brunswick Scientific, Stevenage, UK). Lysis buffer was
aspirated and replaced with 3 ml alkaline phosphate buffer and 3.6 µl proteinase K, then incubated
in an OLS200 shaking waterbath (Grant instruments Ltd) overnight at 56°C and 550 rpm. Buffer was
aspirated and blocks washed 3 times with 1X Tris-EDTA (TE) buffer at 4°C for at least 30 minutes.
After the final wash blocks were suspended in 2 ml 1X TE buffer until digestion.
1X FastDigest buffer (Thermo Scientific, MA, USA) was aliquotted (100 µl) into 0.5 ml eppendorf
tubes and a 1-2 mm strip from each agarose block was suspended in the digest buffer. Blocks were
incubated overnight at 4°C. Digest buffer was aspirated and replaced with 100 µl fresh 1X FastDigest
buffer, plus 2 µl (2U/100µl) Xbal FastDigest enzyme (Thermo Scientific), before incubation at 37°C
for at least 30 minutes. Isolate blocks were loaded into the wells of a 1.25% (approximately) agarose
gel (MacroSieve low melt agarose; SLS Ltd, Hessle, UK), interspersed every 6-8 lanes with a
concatenated lambda ladder (New England BioLabs©). The gel was run for 30 hours, at 6 volts and at
12°C, with an initial switch of 5 seconds and a final switch of 35 seconds, using a CHEF-DR II chiller
system (Bio-rad, Hemel Hempstead, UK). After electrophoresis gels were stained with GelredTM
(Biotium, CA, USA; section 3.5) and analysed using BioNumerics, version 6.1 (Applied Maths NV).
Isolate similarity was calculated using dice coefficient and isolates clustered using unweighted pair
group method with arithmetic averages (UPGMA) with a band tolerance of 1%.

Page | 72
4.2.8 Statistical analysis
Associations between isolate and patient variables were calculated using the chi2 test, with Stata,
version 12 (StataCorp LP). A P-value of ≤0.05 was considered significant, unless stated otherwise.
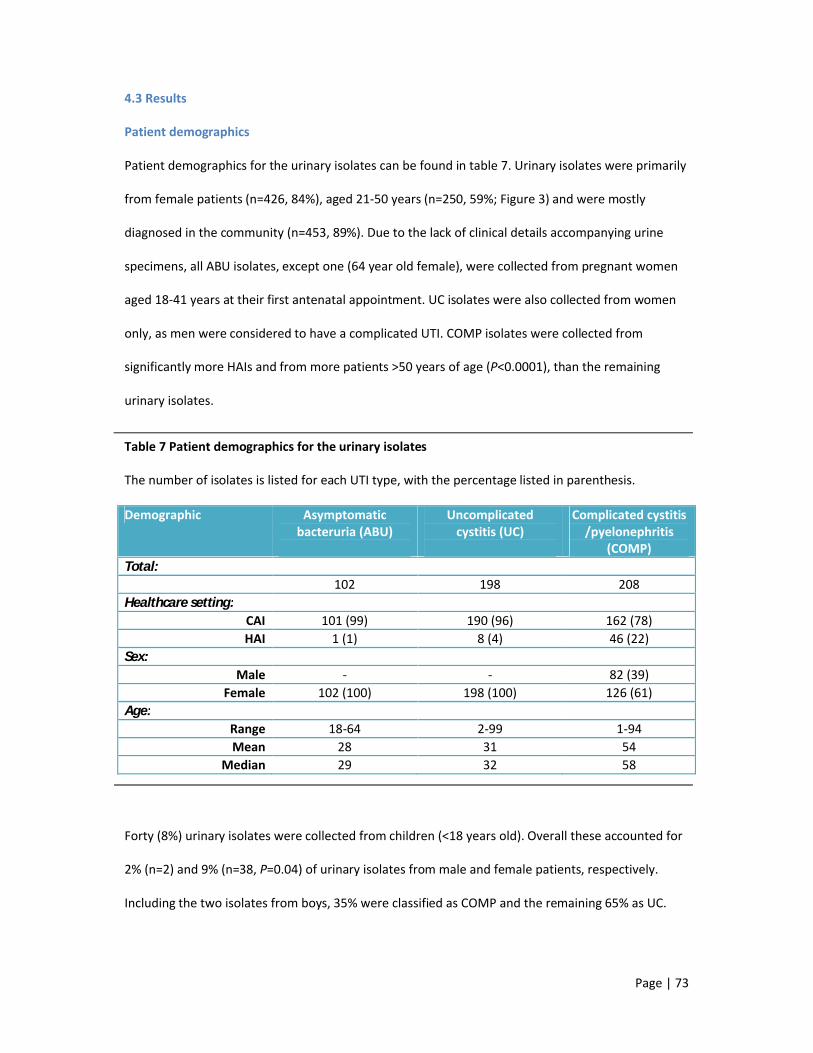
Page | 73
4.3 Results
Patient demographics
Patient demographics for the urinary isolates can be found in table 7. Urinary isolates were primarily
from female patients (n=426, 84%), aged 21-50 years (n=250, 59%; Figure 3) and were mostly
diagnosed in the community (n=453, 89%). Due to the lack of clinical details accompanying urine
specimens, all ABU isolates, except one (64 year old female), were collected from pregnant women
aged 18-41 years at their first antenatal appointment. UC isolates were also collected from women
only, as men were considered to have a complicated UTI. COMP isolates were collected from
significantly more HAIs and from more patients >50 years of age (P<0.0001), than the remaining
urinary isolates.
Table 7 Patient demographics for the urinary isolates
The number of isolates is listed for each UTI type, with the percentage listed in parenthesis.
Demographic Asymptomatic bacteruria (ABU)
Uncomplicated cystitis (UC)
Complicated cystitis /pyelonephritis
(COMP)Total:
102 198 208Healthcare setting:
CAI 101 (99) 190 (96) 162 (78)HAI 1 (1) 8 (4) 46 (22)
Sex:Male - - 82 (39)
Female 102 (100) 198 (100) 126 (61)Age:
Range 18-64 2-99 1-94Mean 28 31 54
Median 29 32 58
Forty (8%) urinary isolates were collected from children (<18 years old). Overall these accounted for
2% (n=2) and 9% (n=38, P=0.04) of urinary isolates from male and female patients, respectively.
Including the two isolates from boys, 35% were classified as COMP and the remaining 65% as UC.
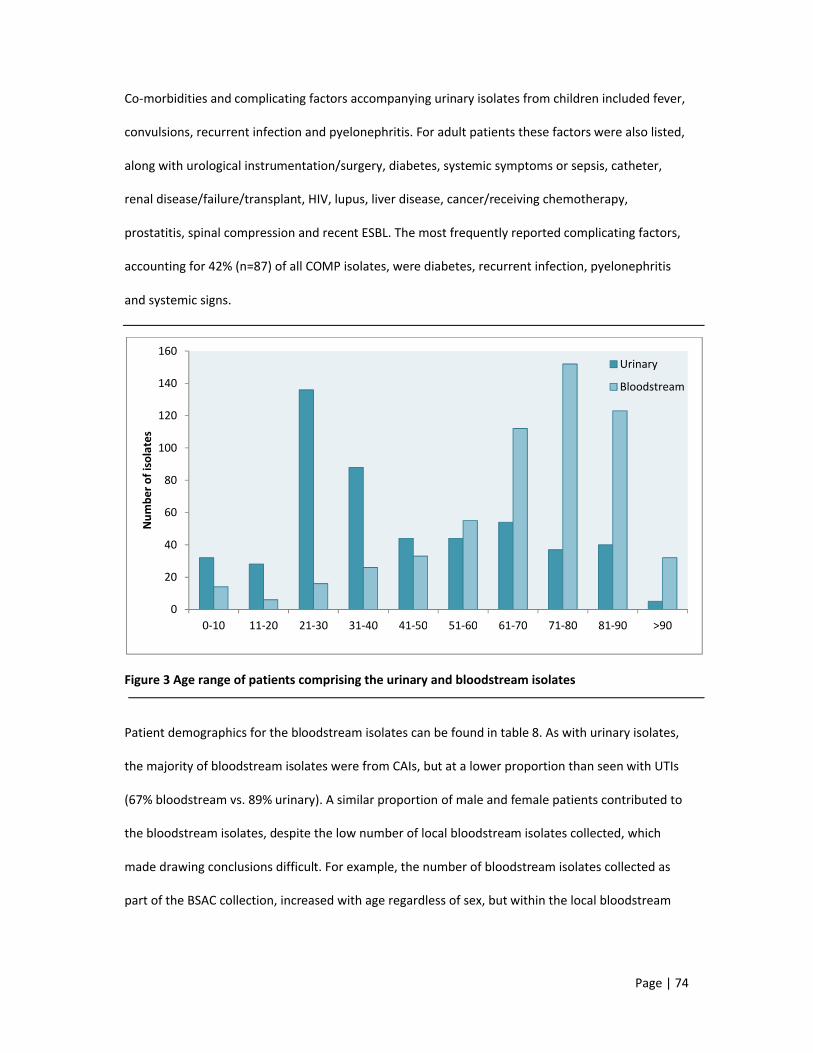
Page | 74
Co-morbidities and complicating factors accompanying urinary isolates from children included fever,
convulsions, recurrent infection and pyelonephritis. For adult patients these factors were also listed,
along with urological instrumentation/surgery, diabetes, systemic symptoms or sepsis, catheter,
renal disease/failure/transplant, HIV, lupus, liver disease, cancer/receiving chemotherapy,
prostatitis, spinal compression and recent ESBL. The most frequently reported complicating factors,
accounting for 42% (n=87) of all COMP isolates, were diabetes, recurrent infection, pyelonephritis
and systemic signs.
Figure 3 Age range of patients comprising the urinary and bloodstream isolates
Patient demographics for the bloodstream isolates can be found in table 8. As with urinary isolates,
the majority of bloodstream isolates were from CAIs, but at a lower proportion than seen with UTIs
(67% bloodstream vs. 89% urinary). A similar proportion of male and female patients contributed to
the bloodstream isolates, despite the low number of local bloodstream isolates collected, which
made drawing conclusions difficult. For example, the number of bloodstream isolates collected as
part of the BSAC collection, increased with age regardless of sex, but within the local bloodstream
0
20
40
60
80
100
120
140
160
0-10 11-20 21-30 31-40 41-50 51-60 61-70 71-80 81-90 >90
Num
ber o
f iso
late
s
Urinary
Bloodstream

Page | 75
isolates this pattern was only noted for male patients, as there was no discernible relationship
between age and the female sex.
Bloodstream isolates were also collected from children (<18 years old), accounting for 4% (n=11) and
1% (n=4) of male and female patients with bacteraemia, respectively.
Table 8 Patient demographics for the bloodstream isolates
Demographic Local No. Isolates (%) BSAC No. Isolates (%)Total:
48 521Healthcare setting:
CAI 30 (63) 353 (68)HAI 18 (37) 168 (32)
Sex:Male 23 (48) 260 (50)
Female 25 (52) 261 (50)Age:
Range 11-90 0–99Mean 55 68
Median 64 73
The genitourinary (GU) tract was the most common source of bacteraemia, accounting for 56% and
38% of the local and BSAC isolates, respectively (Figure 4). The gastrointestinal tract (GIT) was the
second most common source, followed by the respiratory tract (Chest). Skin and soft tissue
infections (SSTI), intravenous lines (Line) and cerebral spinal fluid (CSF) comprised the remaining
bloodstream isolates in the BSAC collection, but these sources were not reported in the local
bloodstream isolates. Unknown source was recorded for 31% and 43% of local and BSAC
bloodstream isolates, respectively, with ascites, diabetic foot ulcers, trauma, cancer and surgery
listed as potential foci of infection.
Notably, all local bloodstream isolates from female patients were recorded as having a urinary focus
of infection and in the BSAC collection GU-source isolates were more frequently collected from
female patients than male patients. In contrast, respiratory-source isolates were more frequently
collected from male patients (15 male, 5 female).

Page | 76
Figure 4 Source of bacteraemia for both Local and BSAC collections Sources included the
genitourinary (GU) tract, gastrointestinal tract (GIT), skin and soft tissue infections (SSTI), respiratory
(Chest) infection, cerebral spinal fluid (CSF) and intravenous (Line) line infections.
Strain characteristics
Phylogenetic grouping
Phylogroup distribution according to infection type (UTI or bacteraemia) is displayed in figure 5.
Phylogroup B2 comprised 64% of all study isolates, followed by phylogroup D (22%). Phylogroup A
isolates consisted mostly of urinary strains (13% vs. 7% bloodstream), while phylogroup B1 strains
were relatively evenly distributed between the urinary (5%) and bloodstream (3%) isolates.
Generally, phylogroups A, B1 and D were more frequently detected in urinary isolates, but B2
isolates were more frequent in bloodstream isolates. Local urinary and bloodstream isolates
followed a similar trend in phylogroup.
Overall phylogroup B2 was more common in male patients (74% vs. 59%) and phylogroup D was
more common in female patients (26% vs. 13%), except for the local bloodstream isolates, where
phylogroups A (26% vs. 0%) and B1 (9% vs. 4%) were more prevalent in male patients and
<1 <10
10
20
30
40
50
60
GU GIT SSTI Chest CSF Line
% is
olat
es
Local
BSAC

Page | 77
phylogroups B2 (60% vs. 43%) and D (36% vs. 22%) were more prevalent in female patients (Figure
6).
Figure 5 Phylogroup distributions within the urinary and bloodstream isolates
Figure 6 Phylogroup distributions according to patient sex and ExPEC collection
0
10
20
30
40
50
60
70
80
90
100
A B1 B2 D
% s
peci
men
type
Urinary
Bloodstream
0%
10%
20%
30%
40%
50%
60%
70%
80%
90%
100%
M F M F M F
Urinary Local bloodstream BSAC
A
B1
B2
D

Page | 78
In the urinary isolates the proportion of phylogroup B2 isolates increased from ABU<UC<COMP,
while phylogroup A and D isolates decreased and phylogroup B1 remained constant (Figure 7). In the
bloodstream isolates phylogroup B2 dominated all sources of bacteraemia, followed, in decreasing
order, by groups D, A and B1. In addition, phylogroups B1 was not detected in bloodstream isolates
with a SSTI or line-source, group A was lacking from the respiratory-source isolates and the one CSF-
source isolate belonged to group B2 (Figure 8).
The other exception was a bloodstream isolate, of unknown source, which generated an unusual
phylogroup profile (gadA+, chuA-, yjaA+, TspE4.C2+).
Figure 7 Phylogroup distributions according to UTI type
0%
10%
20%
30%
40%
50%
60%
70%
80%
90%
100%
ABU UC COMP
A
B1
B2
D

Page | 79
Figure 8 Phylogroup distributions according to source of bacteraemia. Number of isolates per
source is as follows: GU (n=224), GIT (n=63), SSTI (n=6), Chest (n=20), CSF (n=1) and Line (n=10).
Sequence type
The major ExPEC lineages (ST131, ST127, ST95, ST73 and ST69) accounted for 40% and 44% of
urinary and bloodstream isolates, respectively, with a slightly larger proportion detected in HAIs
(53%).
ST95, followed by ST69, was the most frequently detected lineage in urinary isolates. In the
bloodstream isolates ST131 was the most common lineage, followed by ST73 (BSAC) or ST69 (Local),
as displayed in figure 9.
The major lineages predominantly comprised phylogroup B2 strains, except for ST69, which was
mostly comprised of phylogroup D strains. Exceptions to this included an ST131 isolate (phylogroup
D), five ST127 isolates (phylogroup A), three ST95 isolates (phylogroup D) and three ST69 isolates (2
phylogroup B2, 1 phylogroup B1).
0%
10%
20%
30%
40%
50%
60%
70%
80%
90%
100%
GU GIT SSTI Chest CSF Line
A
B1
B2
D

Page | 80
Figure 9 Sequence type distributions according to ExPEC collection and specimen type. These five
lineages accounted for 40% of the urinary isolates, 39% of the local bloodstream isolates and 57% of
the BSAC bloodstream isolates.
As expected, ST95 and ST69 comprised a large cluster of urinary isolates from female patients aged
21-40 years (Figure 10), while ST131 was more prevalent in patients >50 years from which
bloodstream isolates were collected (Figure 11). These clusters correlate with the patients most
frequently affected by urinary tract and bloodstream infections. In addition, ST95 clustered
predominantly in patients aged 21-50 years, ST73 increased in prevalence in patients aged >70
years, ST69 peaked in patients aged 31-40 years, while ST127 was lacking in patients ≤30 years.
Regarding patient sex, both ST131 (P=0.04) and ST127 (P=0.02) were more frequently detected in
male patients (38% and 13%, respectively) rather than female patients (23% and 5%, respectively).
0
5
10
15
20
25
ST131 ST127 ST95 ST73 ST69
% c
olle
ctio
nUrines
Local bloodstream
BSAC bloodstream

Page | 81
Figure 10 Sequence type distributions in urinary isolates according to patient age
Figure 11 Sequence type distributions in bloodstream isolates according to patient age
0%
10%
20%
30%
40%
50%
60%
70%
80%
90%
100%
0-10 11-20 21-30 31-40 41-50 51-60 61-70 71-80 81-90 >90Age (years)
ST69
ST73
ST95
ST127
ST131
0%
10%
20%
30%
40%
50%
60%
70%
80%
90%
100%
0-10 11-20 21-30 31-40 41-50 51-60 61-70 71-80 81-90 >90Age (years)
ST69
ST73
ST95
ST127
ST131

Page | 82
Among the urinary isolates ST69 (8%) was the most common lineage in ABU infection, followed by
ST95 (6%). ST95 was also the most common lineage in COMP isolates (13%), followed by ST131
(12%) and ST73 (11%). While in UC isolates ST95 (12%) was second to ST69 (14%).
For the GU-derived bloodstream isolates ST131 (21%) was the most common lineage, closely
followed by ST73 (20%). This pattern was seen for respiratory-source isolates also (3% and 2%,
respectively). While GIT strains were mostly ST131 (21%) and ST95 (13%) and the sole CSF strain also
belonged to ST95. The line-source isolates demonstrated no obvious trend and all five lineages were
absent from the SSTI strains.
As the BSAC isolates were collected from around the UK and Republic of Ireland, the distribution of
each of the major lineages by country (Table 9) and region (Table 10) was reviewed. Of note, ST131
was almost twice as prevalent in Welsh isolates (P≤0.008), than isolates from England, Scotland and
the Republic of Ireland. ST127 and ST95 were more common in English isolates than all other
countries, while ST73 was more prevalent in Irish isolates. Interestingly, ST69 was only detected in
isolates collected from England and the Republic of Ireland (P≤0.04).
Table 9 Distributions of the major ExPEC lineages in bloodstream isolates according to country of
origin. Number of isolates is shown, plus the proportion of isolates encompassing that lineage per
country, in parenthesis.
Country ST131N (%)
ST127N (%)
ST95N (%)
ST73N (%)
ST69N (%)
England 75 (20) 22 (6) 53 (14) 62 (17) 14 (4)Ireland 12 (17) 3 (4) 7 (10) 15 (21) 8 (11)Scotland 7 (17) 1 (2) 3 (7) 6 (15) 0Wales 14 (37) 1 (3) 5 (13) 6 (16) 0
Public Health England has defined nine regions of England, as follows: South-East, South-West,
London, East Midlands, West Midlands, East of England, North-East, North-West and Yorkshire and
Humber (Figure 12). Within these regions ST131 was most prevalent in London and the South-West,

Page | 83
compared with all other regions (P≤0.02). ST69 was also more prevalent in London, along with the
East and West Midlands. In addition to ST69, the East Midlands also had the highest proportion of
ST127 isolates (P≤0.01), compared to all other regions, and ST95 (P≤0.02). However, ST73 was most
prevalent in Yorkshire and Humber isolates (P≤0.03), whereas ST127 could not be detected in
isolates from here or in South-East isolates either.
Table 10 Distributions of the major ExPEC lineages in bloodstream isolates according to region of
origin in England. Number of isolates is shown, plus the proportion of isolates encompassing that
lineage per region, in parenthesis.
Region ST131N (%)
ST127N (%)
ST95N (%)
ST73N (%)
ST69N (%)
South-East 7 (10) 0 9 (13) 14 (13) 1 (1)South-West 15 (28) 4 (7) 5 (9) 6 (11) 3 (6)London 16 (29) 2 (4) 11 (20) 8 (14) 4 (7)East Midlands 2 (14) 4 (29) 5 (36) 0 1 (7)West Midlands
9 (21) 6 (14) 5 (12) 8 (19) 3 (7)
East England 9 (22) 3 (7) 8 (20) 4 (10) 1 (2)North-East 4 (14) 1 (4) 2 (7) 6 (21) 0North-West 4 (14) 2 (7) 6 (21) 5 (18) 0Y. & Humber 9 (21) 0 2 (5) 11 (26) 1 (2)

Page | 84
Figure 12 Map displaying the countries and English regions from which the BSAC bacteraemia resistance surveillance study (2011) isolates were collected, as defined by Public Health England. The number of centres is represented by proportionally sized circles, increasing from one (small) to five (large).
Serogroup
Six hundred and fifty-nine isolates were serogrouped, including 380 urinary and 279 bloodstream
isolates. Sixty serogroups were identified, of which 29 were only identified in urinary isolates, 6 were
only identified in bacteraemia isolates and 25 were identified in both (Figure 13). In 21% (n=139) a
serogroup could not be identified and isolates were recorded as non-typeable.

Figure 13 Serogroups identified in either urinary or bloodstream isolates or both
Sixty-three percent (n=413/659) of isolates comprised the 15 most common serogroups (table 11),
of which O2, O6 and O25 were the three most frequently identified, comprising a higher proportion
of the BSAC isolates (46%) than the urinary (29%) and local b
Within the urinary isolates, serogroups O2, O6 and O25 were more frequently detected in COMP
(n=58, 15%) isolates rather than UC (n=39, 10%) or ABU (n=11, 3%) isolates. While in the BSAC
isolates these serogroups were more preva
other bloodstream isolates (n=2-13,
UrinesO3 O4 O5 O12 O17O28ac O31 O32 O39 O40 O45 O56 O62 O73 O78 O81 O83 O84 O87 O93 O101 O103 O110 O118O119 O134 O135O150 O158
entified in either urinary or bloodstream isolates or both
three percent (n=413/659) of isolates comprised the 15 most common serogroups (table 11),
of which O2, O6 and O25 were the three most frequently identified, comprising a higher proportion
of the BSAC isolates (46%) than the urinary (29%) and local bloodstream isolates (24%).
Within the urinary isolates, serogroups O2, O6 and O25 were more frequently detected in COMP
(n=58, 15%) isolates rather than UC (n=39, 10%) or ABU (n=11, 3%) isolates. While in the BSAC
isolates these serogroups were more prevalent in GU-source isolates (n=52, 22%), compared to all
13, ≤5%). These findings were not significant (P>0.05).
BloodstreamO18ab
O19aO29 O36O37
O136
O1 O2 O6 O7 O8 O11 O15 O16 O18ac O20 O21 O22 O25 O27 O44 O46 O75 O77 O86 O102 O117 O120 O141 O153 O182
Page | 85
three percent (n=413/659) of isolates comprised the 15 most common serogroups (table 11),
of which O2, O6 and O25 were the three most frequently identified, comprising a higher proportion
loodstream isolates (24%).
Within the urinary isolates, serogroups O2, O6 and O25 were more frequently detected in COMP
(n=58, 15%) isolates rather than UC (n=39, 10%) or ABU (n=11, 3%) isolates. While in the BSAC
source isolates (n=52, 22%), compared to all
>0.05).

Page | 86
Table 11 the most common serogroups according to each of the ExPEC collections. Number of
isolates is listed in the table, with the percentage in parenthesis
Serogroup Urinary Local bloodstream
BSAC bloodstream
Total
O1 14 (4) 0 13 (5) 27 (4)O2 21 (6) 2 (5) 21 (9) 44 (7)O4 7 (2) 2 (5) 0 9 (1)O6 45 (12) 4 (11) 29 (12) 78 (12)O7 10 (3) 1 (3) 2 (1) 13 (2)O8 10 (3) 1 (3) 5 (2) 16 (2)
O15 6 (2) 0 4 (2) 10 (2)O16 6 (2) 2 (5) 10 (4) 18 (3)
O18ac 9 (2) 1 (3) 3 (1) 13 (2)O22 5 (1) 1 (3) 2 (1) 8 (1)O25 43 (11) 3 (8) 61 (25) 107 (16)O44 7 (2) 2 (5) 2 (1) 11 (2)O75 11 (3) 2 (5) 10 (4) 23 (3)O77 17 (4) 0 6 (2) 23 (3)O86 5 (1) 1 (3) 7 (3) 13 (2)
Four serogroups were only detected in urinary and local bloodstream isolates from female patients:
O7, O44, O75 and O77 (P>0.05). All of the O44 and O77 isolates belonged to phylogroup D (n=24/24)
and most to ST69 (n=20/24). The O75 isolates belonged to phylogroup B2 and the O7 strains to a
combination of phylogroups, all of unknown sequence type, and both serogroups were lacking from
ABU isolates. However, O75 along with O77 were prevalent among UC isolates, in particular, while
O7 and O44 isolates were equally prevalent among UC and COMP isolates.
As well as infection-specific patterns in serogroup, a limited serogroup profile was also observed in
each of the major ExPEC lineages (Table 12), although some serogroups were found in multiple
lineages, such as O6 in ST73 and ST127.

Page | 87
Table 12 Serogroups detected in each of the major ExPEC lineages in order of frequency
For serogroups comprising more than 10% of isolates, the proportion is listed in parenthesis
Lineage SerogroupST131 O25 (77%), O16 (14%), O19a, O136, O153
ST127 O6 (75%), O27, O11, O16, O25
ST95 O2 (28%), O1 (21%), O4, O18ac, O25, O16, O31, O6, O110, O150, O153
ST73 O6 (57%), O2 (11%), O22, O25, O8, O4, O18ac, O27, O158
ST69 O77 (25%), O44 (14%), O15, O25, O11, O17, O27, O45, O73, O86, O102, O117, O125ab, O150, O153
In addition to the frequently identified O-antigens, several serogroups that have not been reported
in ExPEC strains were identified. These included O12, O31, O32, O36, O37, O39, O40, O46, O56, O62,
O81, O83, O87, O93, O110, O118, O135, O150, O158, O162 and O182, of which most were detected
in urinary isolates, except O36 and O37 (bloodstream isolates) and O162 and O182 (urinary and
bloodstream isolates). Together these serogroups encompassed 6% of the ExPEC collections.
Enteroaggregative E. coli
Thirty-one urinary isolates, encompassing three phylogroups (A, B1 and D), possessed serogroups
associated with EAEC: O3 (n=1), O15 (n=5), O44 (n=7), O62 (n=1), O77 (n=11), O78 (n=1) and O86
(n=5). However, the aggR gene was not detected in any of these isolates, indicating they all lacked
EAEC traits.
Paired isolates
Thirty-four paired (urinary and bacteraemia) isolates were collected from seventeen patients with
urosepsis. Patient demographics and strain characteristics are listed in table 13. Data reveals that
16/17 of these patients were infected with a single E. coli strain, while patient 16 had two E. coli
strains simultaneously causing infection (ST14/B2-O18ac and ST354/D-O153). The majority of paired
isolates belonged to phylogroups B2 and D (16/17), with 10/17 encompassing the five major ExPEC
lineages. Other sequence types detected included ST14, ST62, ST354, ST404, ST405, ST617 and

Page | 88
ST1405. Eight of the common serogroups (O2, O4, O6, O7, O18ac, O25, O44 and O75) were
identified in 21/34 of the paired isolates. The remaining isolates were non-typeable (n=8) or were
phylogroup D isolates with serogroups O11, O125ab and O153.
PFGE
PFGE of the paired isolates revealed those of the same phylogroup and/or sequence type to cluster
in groups and confirmed that UTI and bacteraemia in patient 16 was caused by two separate isolates
(Figure 14). Percentage relatedness was much higher between isolates of the same sequence type
than those of the same phylogroup. For example, phylogroup D isolates demonstrated
approximately 40% DNA relatedness, but ST69 isolates demonstrated approximately 60%
relatedness.
While PFGE of isolate 3837 (unusual phylogroup profile), along with a selection of ExPEC isolates,
revealed approximately 40% relatedness to all other ExPEC strains analysed, including ST127 isolates
(Figure 15). These ExPEC isolates also appeared less related, especially within the different sequence
types, to the paired urosepsis isolates.
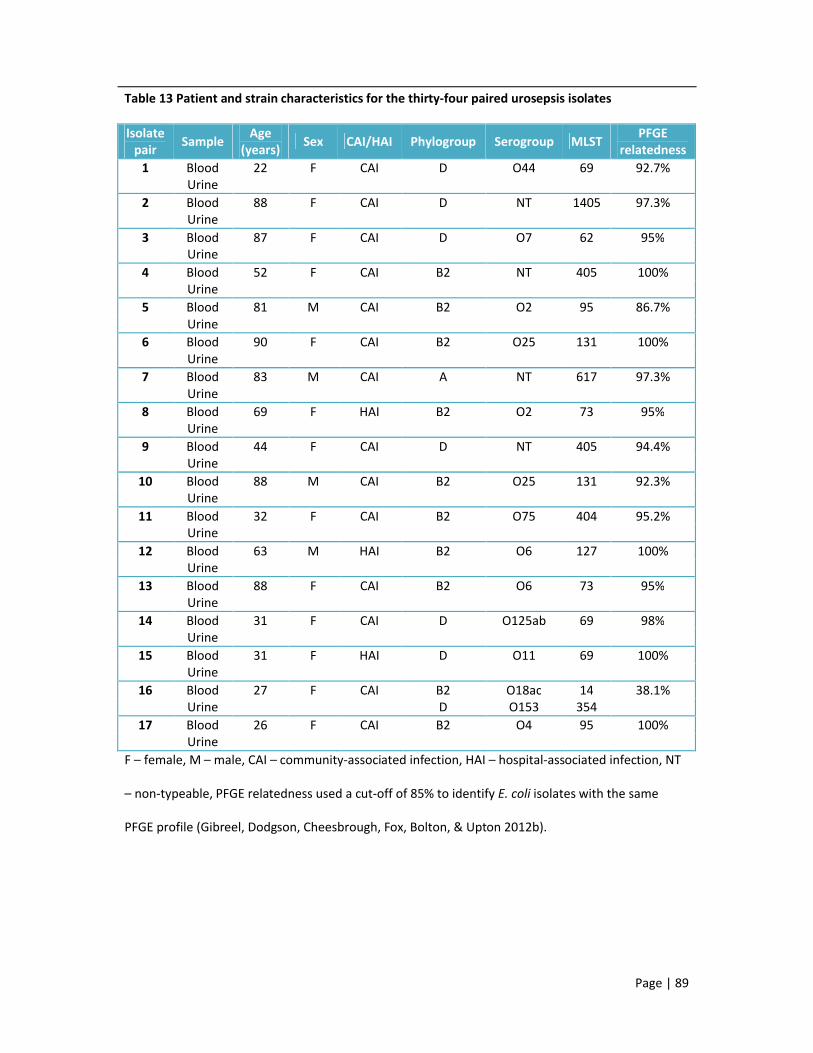
Page | 89
Table 13 Patient and strain characteristics for the thirty-four paired urosepsis isolates
Isolate pair Sample
Age (years) Sex CAI/HAI Phylogroup Serogroup MLST
PFGE relatedness
1 Blood 22 F CAI D O44 69 92.7%Urine
2 Blood 88 F CAI D NT 1405 97.3%Urine
3 Blood 87 F CAI D O7 62 95%Urine
4 Blood 52 F CAI B2 NT 405 100%Urine
5 Blood 81 M CAI B2 O2 95 86.7%Urine
6 Blood 90 F CAI B2 O25 131 100%Urine
7 Blood 83 M CAI A NT 617 97.3%Urine
8 Blood 69 F HAI B2 O2 73 95%Urine
9 Blood 44 F CAI D NT 405 94.4%Urine
10 Blood 88 M CAI B2 O25 131 92.3%Urine
11 Blood 32 F CAI B2 O75 404 95.2%Urine
12 Blood 63 M HAI B2 O6 127 100%Urine
13 Blood 88 F CAI B2 O6 73 95%Urine
14 Blood 31 F CAI D O125ab 69 98%Urine
15 Blood 31 F HAI D O11 69 100%Urine
16 Blood 27 F CAI B2 O18ac 14 38.1%Urine D O153 354
17 Blood 26 F CAI B2 O4 95 100%Urine
F – female, M – male, CAI – community-associated infection, HAI – hospital-associated infection, NT
– non-typeable, PFGE relatedness used a cut-off of 85% to identify E. coli isolates with the same
PFGE profile (Gibreel, Dodgson, Cheesbrough, Fox, Bolton, & Upton 2012b).

Page | 90
Figure 14 Dendrogram showing Xbal PFGE profiles for the 34 paired ExPEC isolates representing the principal phylogroups and lineages. The key identifies the paired isolates by number and source of isolation. For example, 2B is the bloodstream isolate from pair 2. Percentage band relatedness is detailed on the left hand side.
100
806040 Key
2B
2U
16U
1B
1U
14B
14U
15B
15U
3B
3U
9B
9U
8B
8U
13B
13U
11B
11U
4B
4U
12B
12U
16B
7B
7U
10B
10U
6B
6U
5B
5U
17B
17U
phylo group
D
D
D
D
D
D
D
D
D
D
D
D
D
B2
B2
B2
B2
B2
B2
B2
B2
B2
B2
B2
A
A
B2
B2
B2
B2
B2
B2
B2
B2
MLST
1405
1405
354
69
69
69
69
69
69
62
62
405
405
73
73
73
73
404
404
405
405
127
127
14
617
617
131
131
131
131
95
95
95
95
serotype
NT
NT
O153
O44
O44
O125ab
NT
O11
O11
O7
O7
NT
NT
O2
NT
06
O6
O75
O75
NT
NT
O6
O6
O18ac
NT
NT
NT
NT
O25
O25
O2
O2
O4
O4

Page | 91
Figure 15 Dendrogram showing Xbal PFGE profiles for a selection of ExPEC isolates representing various sequence types and phylogroups, including the unusual phylogroup (underlined in red). Percentage band relatedness is detailed on the left hand side.
100
806040 Key
192..
349..
090.
3520..
3669.
3786.
3860
219.
3656.
3732.
3631.
3379.
3493.
3336.
3498.
3393.
367.
3363.
3422.
3396.
3820.
3350.
3625.
3760.
231.
197.
152.
153.
025.
188.
3339.
3434.
3837
phylo group
B2
B2
D
B2
B2
B2
B2
A
B2
B2
B2
A
B1
D
B1
B1
B2
A
B1
B2
B2
B2
B2
B2
B2
B2
D
D
D
B2
A
A
NK
MLST
131
131
1405
131
131
NK
NK
617
127
131
95
NK
NK
NK
NK
NK
404
127
NK
95
73
73
73
73
73
95
62
62
69
405
NK
NK
NK
serotype
O25
O25
NT
O25
O18ab
O75
NT
O75
O27
O2
O2
O2
O7
O7
O44
NT
O18ab

Page | 92
4.4 Discussion points
UTIs were predominantly a community-associated infection (87%) of women (84%) aged
approximately 40 years, while bacteraemia was less frequently community-associated (68%) and
equally affected men and women with an average age of 68 years. However, UTIs (8%) and
bacteraemia (3%) also affected paediatric patients (<18 years old).
Collection of urinary isolates was heavily influenced by the specimen collection criteria. In contrast,
the random specimen collection of the BSAC bloodstream isolates suggests accurate conclusions can
be drawn regarding the typical patient presenting with bacteraemia, including the urinary tract as
the number one source of infection.
ExPEC strains causing UTI and bacteraemia predominantly belonged to phylogroups B2 (64%) and D
(22%), with the five major ExPEC lineages (ST131, ST127, ST95, ST73 and ST69) comprising a
significant proportion of the isolates collected locally (40%) and nationally (57%). In addition,
distribution of these lineages, within the BSAC collection, varied by country and region.
Despite the range of serogroups (n=60) identified in this study, isolates encompassing the major
ExPEC lineages also possessed the most frequently identified serogroups. Other reported ExPEC
clones identified in this study included ST62-O7 and ST404-O75. PFGE revealed isolates of these
lineages and isolates of the same phylogroup to cluster in groups, but also demonstrated the great
diversity of ExPEC strains.
Urosepsis was typically associated with a single strain, although one patient suffered simultaneous
infection with 2 different E. coli strains.

Page | 93
5. Antibiotic resistance in Escherichia coli causing urinary tract infections and
bacteraemia, in East London and across the United Kingdom
5.1 Introduction
The previous chapter demonstrated that patient demographics have remained relatively unchanged
for those with E. coli causing UTIs and bacteraemia, compared to recent UK and international
studies. However, ExPEC strains are highly varied, encompassing many serogroups, sequence types
and lineages, as demonstrated in chapter 4. With this heterogeneity it is important to review and
understand the current antibiotic resistance profiles and to determine if they have changed and
whether therapeutic guidelines are still applicable or need updating.
Increasing antibiotic resistance in E. coli has led to changes in the treatment of UTIs, with current
guidelines recommending trimethoprim or nitrofurantoin for uncomplicated UTIs and ciprofloxacin
or amoxicillin-clavulanate with amikacin for complicated UTIs (Cormican et al. 1998; Dyer et al. 1998;
Gupta et al. 2011; Huovinen and Toivanen, 1980; SIGN, 2006; Barts and the London Trust
Antimicrobial Review Group, 2011). However, the most recent UK studies of urinary E. coli in
paediatric patients (<16 years) reported resistance rates of 3.8%-7% to nitrofurantoin, 5.9% to
ciprofloxacin, 3.6% to gentamicin, 8.2%-11% to cefalexin, 34%-46.3% to trimethoprim and 12.9%-
48% to amoxicillin-clavulanate (augmentin) (Bean et al. 2008; Chakupurakal et al. 2010). While in
adults with urinary E. coli, 13.7% were resistant to amoxicillin-clavulanate, 10.6% to cefalexin, 6.1%
to nitrofurantoin, 39.4% to trimethoprim, 12.7% to ciprofloxacin and 6.6% to gentamicin (Bean et al.
2008). In comparison, European studies typically reported lower resistance rates of 2.5%-8.9%
amoxicillin-clavulanate, 15.8%-19.1% trimethoprim, 0%-1.4% nitrofurantoin, 2.5%-7.6%
ciprofloxacin, 1%-2.8% gentamicin and 0%-2.7% ceftazidime (Den Heijer et al. 2010; Kahlmeter and
Poulsen, 2012).

Page | 94
E. coli causing bacteraemia are reported to have higher rates of antibiotic resistance than urinary
isolates (Kahlmeter, 2003; Livermore et al. 2008; Martin et al. 2012). There are no specific guidelines
for treating bacteraemia due to the multiple sources of infection and causative organisms.
Therefore, empirical treatment is often broad-spectrum (Joint Formulary Committee, 2013). At the
Royal London Hospital, E. coli bacteraemia is typically treated with amoxicillin-clavulanate with or
without an aminoglycoside, which may be changed to ciprofloxacin (osteomyelitis), meropenem
(meningitis) or piperacillin-tazobactam (cholecystitis) depending on the source of bacteraemia
(Phee, 2013).
HAIs often demonstrate higher rates of resistance than CAIs, as these patients have likely received
antibiotics previously and are more likely to be colonised with a multi-drug resistant nosocomial
strain (Bean et al. 2008). In the UK, 15% of Enterobacteriaceae causing HAIs are reported to involve
an ESBL (Health Protection Agency, 2012c), with CTX-M-15 the most frequently detected enzyme in
Klebsiella and E. coli (Woodford et al. 2004; Younes et al. 2011). Multiple studies have linked
circulation of these enzymes and particular resistance phenotypes to lineages such as ST131, ST405
and CgA (ST69) (Johnson et al. 2009a; Matsumura et al. 2012; Peirano and Pitout, 2010; Wallace-
Gadsden et al. 2007).
Data on E. coli causing UTIs are often restricted to studies of healthy women with uncomplicated
cystitis and test against few antibiotics (De Backer et al. 2008; Kahlmeter, 2003; Schito et al. 2009),
while data on E. coli causing bacteraemia in the UK is limited to the BSAC Bacteraemia Resistance
Surveillance Programme (Reynolds et al. 2008) and reports collected from UK hospitals via Public
Health England’s labBase2 system. As patients live longer and receive more antibiotics, it is
important to continually review antibiotic resistance rates, especially with the rapid spread of β-
lactamases and resistance determinants further complicating antibiotic treatment.

Page | 95
5.2 Methods
5.2.1 Antibiotic susceptibility testing (AST)
5.2.1.1 Local Antibiotic susceptibility testing
At the Royal London Hospital all urinary isolates underwent susceptibility testing with ciprofloxacin
(1 µg), gentamicin (10 µg), cefalexin (30 µg), amoxicillin (25 µg), amoxicillin-clavulanate (30 µg),
cefpodoxime (10 µg), trimethoprim (2.5 µg) and nitrofurantoin (200 µg) impregnated discs (Oxoid,
UK), using the BSAC disc diffusion method (BSAC, 2011). Resistance to cefpodoxime prompted
further AST using the MicroScan WalkAway 96 plus (Siemens) Gram-negative panel to identify
potential ESBL-producers and determine susceptibilities against a larger panel of antibiotics. All
isolates from blood cultures (bacteraemia) were subjected to AST using the MicroScan system.
5.2.1.2 Minimum Inhibitory Concentration (MIC)
MICs were determined for all 1077 isolates to ensure uniform testing against the same antibiotic
panel. MICs were determined using the BSAC agar dilution method (Andrews 2001) and considered
the gold standard for determining antibiotic susceptibilities. EUCAST breakpoints were used to
determine whether an isolate was susceptible, had reduced susceptibility (intermediate) or was
resistant to the antibiotics tested. As there is no EUCAST breakpoint for cefoxitin the Clinical
Laboratory Standards Institute (CLSI) breakpoint was used. MICs were determined for the following
antibiotics on ISO-Sensitest (ISO) or Mueller-Hinton (MH) agars for the carbapenems: amikacin
(AMK), amoxicillin-clavulanate (AUG), ampicillin (AMP), aztreonam (AZT), cefotaxime (CTX) with and
without clavulanate, cefoxitin (FOX), cefpirome (CPR) with and without clavulanate, ceftazidime
(CAZ) with and without clavulanate, ciprofloxacin (CIP), chloramphenicol (CHL), ertapenem (ERP),
gentamicin (GEN), imipenem (IM), meropenem (MEM), minocycline (MIN), nitrofurantoin (NIT),
piperacillin-tazobactam (PZT), temocillin (TEM), tigecycline (TIG), trimethoprim (TRIM) with and
without sulfamethoxazole (SXT), and tobramycin (TOB). Antibiotic suppliers are listed in appendix B.
E. coli control strains ATCC 25922 and NCTC 10418 were included in each MIC run to validate the

Page | 96
MIC results and to check for any anomalies between the initial disc diffusion/ MicroScan® AST results
and the MIC results. ESBL possession was inferred if the MIC of the cephalosporin compared to the
MIC of the cephalosporin with clavulanate was ≥8-fold higher (Livermore and Brown, 2001). Isolates
resistant to ≥1 cephalosporin were analysed by PCR for β-lactamase enzymes (see section 5.2.2).
MICs were compared to MIC data reported by EUCAST (http://www.eucast.org/).
5.2.2 CTX-M group detection and identification
Genes for CTX-M enzyme groups 1 and 9 were detected using the PCR assay described by Woodford
(2010) (Woodford 2010). PCR reactions and amplification conditions are as described in section 3.4,
but with annealing step of 60°C for 40 seconds.
PCR products were separated by agarose gel electrophoresis and product size (appendix C) was used
to identify the CTX-M group. CTX-M group 1 PCR products were purified (section 3.6) and sequenced
(section 3.7). DNA sequences were aligned in BioNumerics version 6.1 (Applied Maths NV) and
compared with sequences in the GenBank database (National Institute of Health, MD, USA) to
identify the specific CTX-M allele.
Isolates that were positive for CTX-M group 9 genes were investigated using the primers described
by Girlich et al (Girlich et al. 2009), which amplified the entire open reading frame of the CTX-M
gene. PCR amplicons were generated and identified as described above. All primers are listed in
appendix C.
5.2.3 TEM and SHV Detection
All CTX-M-positive strains and isolates with an antibiogram suggestive of cephalosporinase activity
(cephalosporin resistant) were analysed for TEM and SHV genes using the primers described
previously (Livermore et al. 2001; M'Zali et al. 1996). PCR reactions, amplification conditions and
enzyme identification were as described in section 5.2.2. Primers are listed in appendix C.

Page | 97
5.2.4 OXA Detection
All CTX-M-positive strains and isolates with an antibiogram suggestive of cephalosporinase activity
(cephalosporin resistant) were analysed for OXA-1-like genes using the primers described previously
(Karisik et al. 2006). PCR reactions, amplification conditions and enzyme identification were as
described in section 5.2.2. Primers are listed in appendix C.
5.2.5 AmpC β-lactamase detection and identification
Isolates that were cefoxitin-resistant and/or negative for CTX-M, TEM, SHV or OXA-1 enzymes
(sections 5.2.2 – 5.2.4), were investigated for acquired AmpC enzymes using the PCR described by
Dallenne et al (Dallenne et al. 2010). PCR reactions, amplification conditions and enzyme
identification were as described in section 5.2.2. Primers are listed in appendix C.
Isolates that were positive for the CIT family of acquired AmpC β-lactamases were subjected to a
CMY-specific PCR, as CMY is the most commonly detected CIT AmpC β-lactamase in E. coli (Dierikx et
al. 2012; Jacoby, 2009). PCR reaction and cycling conditions were as described above, using primers
(appendix C) published previously (Ahmed and Shimamoto, 2008). CMY PCR products were purified
and cloned into plasmids (section 5.2.7) prior to DNA sequencing. DNA sequences were aligned and
identified, as described in section 5.2.2.
5.2.6 Aminoglycoside-modifying enzymes
All urinary isolates demonstrating reduced susceptibility to ≥1 aminoglycoside were screened for the
common aminoglycoside-modifying enzymes (AME), using the PCRs developed by Noppe-Leclercq et
al (1999) and Leelaporn et al (2008). PCR reactions and amplification conditions were as described in
section 3.4, but with varying annealing temperatures, as listed in appendix C (Leelaporn et al. 2008;
Noppe-Leclercq et al. 1999).
Isolates demonstrating pan-resistance to all three aminoglycosides were screened for genes
encoding all 16S rRNA methyltransferases using the multiplex PCR developed by Fritsche et al
(2008). PCR reactions were as described in section 3.4, but with 25 cycles of denaturation for 15

Page | 98
seconds at 94°C, annealing at 58°C for 30 seconds and extension at 72°C for 60 seconds. PCR
amplicons were resolved and identified by gel electrophoresis (section 3.5). All primers are listed in
appendix C.
5.2.7 Plasmid-mediated quinolone resistance (PMQR) determinants
All ciprofloxacin-resistant isolates were subjected to a multiplex PCR, developed as part of this
project, targeting eight plasmid-mediated genes that confer reduced susceptibility to
fluoroquinolones. The targets were qnrA, qnrB, qnrC, qnrD, qnrS, oqxAB, qepA and the aac (6’)-lb-cr
allele (appendix C). The Qiagen Multiplex PCR kit (Qiagen) was used for the PCR reactions, according
to the manufacturer’s instructions. Each PCR reaction contained 12.5 µl master mix, 10X primer mix
(2 µM each primer), 2.5 µl Q solution and 5 µl DNA lysate made up to a final volume of 25 µl with
sterile-filtered water. Amplification conditions were as recommended with an initial hold at 95°C for
15 minutes; followed by 30 cycles of denaturation at 94°C for 30 seconds, annealing at 63°C for 90
seconds and extension at 72°C for 90 seconds; with a final hold at 72°C for 10 minutes. PCR products
were resolved by gel electrophoresis (section 3.5) for 120 minutes and product size used to identify
the PMQR determinant (Figure 16). In order to determine the optimal annealing temperature a
gradient PCR was performed, with a range of annealing temperatures from 56-64°C. Pooled (positive
control) DNA was amplified at each annealing temperature and products resolved by gel
electrophoresis. The temperature at which optimal resolution of all eight targets was achieved was
selected as the chosen annealing temperature for the PMQR PCR.
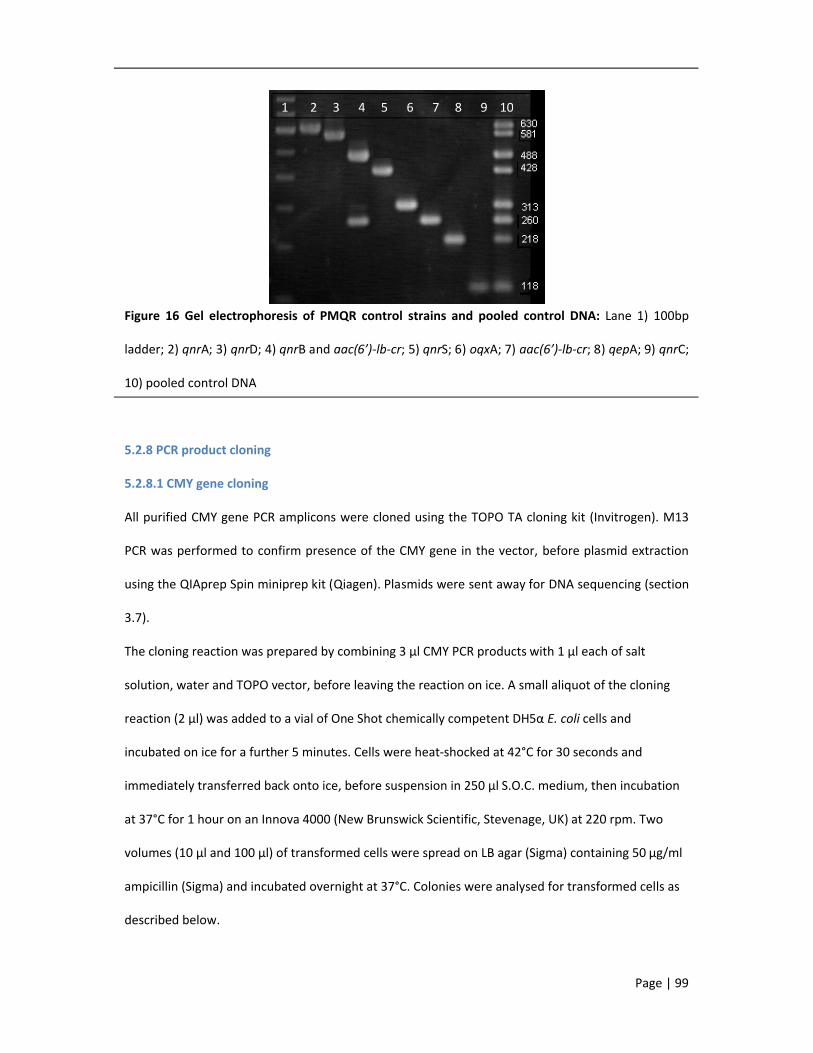
Page | 99
Figure 16 Gel electrophoresis of PMQR control strains and pooled control DNA: Lane 1) 100bp
ladder; 2) qnrA; 3) qnrD; 4) qnrB and aac(6’)-lb-cr; 5) qnrS; 6) oqxA; 7) aac(6’)-lb-cr; 8) qepA; 9) qnrC;
10) pooled control DNA
5.2.8 PCR product cloning
5.2.8.1 CMY gene cloning
All purified CMY gene PCR amplicons were cloned using the TOPO TA cloning kit (Invitrogen). M13
PCR was performed to confirm presence of the CMY gene in the vector, before plasmid extraction
using the QIAprep Spin miniprep kit (Qiagen). Plasmids were sent away for DNA sequencing (section
3.7).
The cloning reaction was prepared by combining 3 µl CMY PCR products with 1 µl each of salt
solution, water and TOPO vector, before leaving the reaction on ice. A small aliquot of the cloning
reaction (2 µl) was added to a vial of One Shot chemically competent DH5α E. coli cells and
incubated on ice for a further 5 minutes. Cells were heat-shocked at 42°C for 30 seconds and
immediately transferred back onto ice, before suspension in 250 µl S.O.C. medium, then incubation
at 37°C for 1 hour on an Innova 4000 (New Brunswick Scientific, Stevenage, UK) at 220 rpm. Two
volumes (10 µl and 100 µl) of transformed cells were spread on LB agar (Sigma) containing 50 µg/ml
ampicillin (Sigma) and incubated overnight at 37°C. Colonies were analysed for transformed cells as
described below.
1 2 3 4 5 6 7 8 9 10

Page | 100
5.2.8.2 M13 PCR
The M13 primers bind either side of the pCR4-TOPO vector insertion site. Therefore, positive PCR
amplification products should contain the inserted CMY gene.
DNA lysates (section 3.3) were prepared from the transformed cells. PCR reactions are as described
in section 3.4, but made up to a final volume of 25 µl with sterile-distilled water. Primers are listed in
appendix C. Amplification was as follows: initial hold at 94°C for 4 minutes; 35 cycles of denaturation
at 94°C for 30 seconds, annealing at 50°C for 30 seconds and extension at 72°C for 90 seconds. PCR
products were separated by gel electrophoresis (section 3.5) to identify the transformed isolates
carrying the CMY gene.
5.2.9 Statistics
Associations between patient variables and antibiotic resistance were calculated using the chi2 test,
in Stata, version 12 (StataCorp LP). A P-value of ≤0.05 was considered significant, unless stated
otherwise.

Page | 101
5.3 Results
Minimum Inhibitory Concentrations
Non-susceptibility (intermediate or resistant isolates) results for 22 antibiotics, as determined by
agar dilution MICs, are displayed in figure 17, for all study isolates.
Figure 17 Percentage non-susceptibility to 22 antibiotics, as determined by MICs, for all ExPEC
isolates Proportions are displayed for the local urinary isolates (n=508), local bloodstream isolates
(n=48) and the BSAC bloodstream isolates (n=521).
Overall, the resistance rates in the local isolates were comparable to the prevalence seen in the
national BSAC collection. The proportion of resistance in the local bloodstream isolates appear
disproportionately higher due to the small sample size (n=48).
Excluding the local bacteraemia isolates, non-susceptibility among local urinary and BSAC
bloodstream isolates to ampicillin and amoxicillin-clavulanate was 72% and 35%, respectively.
Amoxicillin-clavulanate resistance was reduced even further in light of the amended EUCAST
breakpoint for uncomplicated cystitis, as clavulanate was reported to accumulate in high
0
10
20
30
40
50
60
70
80
90
100
% n
on-s
usce
ptib
ility
BSAC
Local bloodstream
Local Urinary
Page | 102
concentrations in the bladder (Alou et al. 2006). The breakpoint was increased to 32 mg/L, resulting
in 0% of UC and ABU urinary isolates demonstrating amoxicillin-clavulanate resistance.
Cephalosporin resistance was higher in bloodstream isolates versus urinary isolates (10% vs. 1%,
P=0.01), as was resistance to cefoxitin (17% vs. 8%) and piperacillin-tazobactam (15% vs. 3%,
P=0.01). Resistance to the carbapenems and tigecycline was negligible, with only one bloodstream
isolate showing ertapenem resistance and two urinary isolates demonstrating reduced susceptibility
to tigecycline. Ciprofloxacin resistance in BSAC isolates was double that of urinary isolates (21% vs.
10% NS, P=0.05), while gentamicin resistance was less different (11% vs. 8%). Temocillin resistance
appeared higher in BSAC isolates than urinary isolates, due to the difference in breakpoint between
these two infection types (8 mg/L vs. 32 mg/L), but analysis of the MIC distributions reveals a similar
trend for urinary and bloodstream isolates (Figure 18). Chloramphenicol (48% vs. 46%) and
nitrofurantoin (both 1%) resistance was also not significantly different between the BSAC
bacteraemia and urinary isolates. However, the urinary isolates demonstrated slightly higher
resistance rates to trimethoprim (47% vs. 38%) and trimethoprim-sulfamethoxazole (44% vs. 36%).

Page | 103
Figure 18 Temocillin MIC distributions for all urinary and bloodstream isolates. Dark blue bars
represent bloodstream isolates (n=569) and light blue bars represents urinary isolates (n=508).
Comparison with the EUCAST wild type MICs (http://www.eucast.org/mic_distributions/ accessed
13th September 2014) revealed similar trends in MIC distribution for all antibiotics, except ampicillin,
amoxicillin-clavulanate and cefoxitin (Figures 19 and 21). For these three antibiotics there was a shift
towards higher MICs compared to the EUCAST wild type. There was also a slight variation in
cefotaxime MICs where the EUCAST wild-type had two MIC peaks at <=0.125mg/L and 1mg/L. This
second peak is missing in the study isolates, with most isolates generating an MIC <=0.125mg/L and
a small peak of (ESBL-expressing) isolates with an MIC >=128mg/L. Unfortunately there were no
wild-type data for temocillin MICs, but the urinary isolates and BSAC isolates demonstrated a normal
MIC distribution, with a peak at 8 mg/L (Figure 18).
Disc diffusion versus MIC (urinary isolates)
The limited panel of antibiotics used to screen urinary isolates at the Royal London Hospital is
designed to detect resistance against antibiotics recommended in the therapeutic guidelines, as well
as ESBL production. MIC results suggested that antibiotic resistance, as determined by disc diffusion
(DD), is greatly underestimated for amoxicillin, amoxicillin-clavulanate, chloramphenicol and
0
50
100
150
200
250
<=1 2 4 8 16 32 64 >=128
Num
ber o
f iso
late
s
MIC (mg/L)
Bloodstream
Urinary

Page | 104
trimethoprim, while nitrofurantoin resistance is over-estimated (Figure 19). EUCAST data for E. coli
also revealed resistance rates in London to be higher than Europe for all antibiotics, except
ciprofloxacin, gentamicin and nitrofurantoin, which were similar (Figure 19).
According to MICs, isolates causing all three types of UTI (ABU, UC and COMP) displayed similar
trends in resistance (>20% non-susceptible to ampicillin, amoxicillin-clavulanate, minocycline,
chloramphenicol, trimethoprim and trimethoprim-sulfamethoxazole), but resistance to individual
antibiotics was higher in COMP infections (Figure 20).
When comparing resistance rates between male and female patients, resistance was significantly
higher in men for the cephalosporins, piperacillin-tazobactam, ciprofloxacin, tobramycin, gentamicin
and temocillin. While in female patients resistance was higher against trimethoprim and
trimethoprim-sulfamethoxazole, but not significantly so.
Figure 19 Percentage non-susceptibility of local urinary isolates (n=508), according to disc diffusion
and MIC, overlaid with the European E. coli non-susceptibility rates as reported by EUCAST.
EUCAST data can be accessed here http://www.eucast.org/mic_distributions/).
0
10
20
30
40
50
60
70
80
90
100
AMOX AUG 3GC CIP GEN CHL TRIM NIT
% n
on-s
usce
ptib
ility
Urine DD
Urine MIC
EUCAST WT

Page | 105
Figure 20 Percentage non-susceptibility according to the type of urinary tract infection:
asymptomatic bacteruria (ABU, n=102), uncomplicated cystitis (UC, n=198), complicated
cystitis/pyelonephritis (COMP, n=208).
MicroScan versus MIC
For the local bloodstream isolates, susceptibility results as determined by MicroScan and MIC were
relatively comparable (within 1-5% of each other), with the exception of ampicillin, ampicillin-
sulbactam, cefoxitin, minocycline and chloramphenicol (Figure 21). As with the urinary isolates, MICs
for the local bloodstream isolates demonstrated higher resistance rates to ampicillin, ampicillin-
sulbactam (compared to amoxicillin-clavulanate), cefoxitin, minocycline and chloramphenicol, with
overall resistance higher than the rest of Europe (EUCAST data, figure 21). Resistance rates were also
higher in isolates collected from male patients, compared to female patients: amoxicillin-clavulanate
74% vs. 60%, cefotaxime 35% vs. 4%, ciprofloxacin 48% vs. 8%, gentamicin 35% vs. 12%; except for
trimethoprim resistance which was slightly higher in female patients (48% vs. 43%).
0
10
20
30
40
50
60
70
80
90
100
% n
on-s
usce
ptib
ility
ABU
COMP
UC

Page | 106
Figure 21 Percentage non-susceptibility of local bloodstream isolates (n=48), according to
MicroScan and MIC, overlaid with the European E. coli non-susceptibility rates as reported by
EUCAST. Additional antibiotics tested by MicroScan included ampicillin-sulbactam (AMS) and
cefepime (4GC, compared to cefpirome MIC). EUCAST data can be accessed here
http://www.eucast.org/mic_distributions/).
Within the BSAC collection, breakdown of the MICs by bacteraemia source revealed the CSF-source
isolate to be relatively susceptible; resistant only to ampicillin, minocycline, trimethoprim and
trimethoprim-sulfamethoxazole. Among the remaining sources of bacteraemia, resistance to
individual antibiotics varied (Figure 22). For example, trimethoprim-sulfamethoxazole resistance was
highest in GU isolates (42% vs. 25-41%).
0
10
20
30
40
50
60
70
80
90
100
AMP AMS AZT CAZ CTX 4GC FOX PTZ IM MEM ERP CIP TOB AMK GEN MIN CHL SXT
% n
on-s
usce
ptib
ility
BLC MS
BLC MIC
EUCAST WT

Figure 22 Percentage non-susceptibility according to source of bacteraemia:
antibiotics used in the MIC testing, representing al
display resistance rates according to each source of bacteraemia: skin and soft tissue infection (SSTI),
intravenous lines (Line), genitourinary infection (GU), gastrointestinal infection (GIT), respiratory
tract infection (Chest) and cerebral spinal fluid (CSF).
Healthcare Setting
Comparison of MICs between isolates causing community
associated infections (HAI) revealed higher rates of resistance for HAI isolates, for
antibiotics (Table 14). In particular, resistance to the cephalosporins, the aminoglycosides and
ciprofloxacin was ≥5% higher in HAI isolates than CAI isolates, with temocillin resistance almost
double that of the CAI isolates (P<0.01).
0
20
40
60
80
100
MIN AMP AUG CTX ERP
% n
on-s
usce
ptib
ility
susceptibility according to source of bacteraemia: Twelve of the 22
antibiotics used in the MIC testing, representing all included antibiotic classes, were chosen to
display resistance rates according to each source of bacteraemia: skin and soft tissue infection (SSTI),
intravenous lines (Line), genitourinary infection (GU), gastrointestinal infection (GIT), respiratory
ct infection (Chest) and cerebral spinal fluid (CSF).
Comparison of MICs between isolates causing community-associated infections (CAI) and hospital
associated infections (HAI) revealed higher rates of resistance for HAI isolates, for nearly all
antibiotics (Table 14). In particular, resistance to the cephalosporins, the aminoglycosides and
≥5% higher in HAI isolates than CAI isolates, with temocillin resistance almost
<0.01).
ERP CIP GEN TEM TIG CHL SXT NIT
Page | 107
Twelve of the 22
l included antibiotic classes, were chosen to
display resistance rates according to each source of bacteraemia: skin and soft tissue infection (SSTI),
intravenous lines (Line), genitourinary infection (GU), gastrointestinal infection (GIT), respiratory
associated infections (CAI) and hospital-
nearly all
antibiotics (Table 14). In particular, resistance to the cephalosporins, the aminoglycosides and
≥5% higher in HAI isolates than CAI isolates, with temocillin resistance almost
CHESTCSFGITGULINESSTI

Page | 108
Table 14 Percentage non-susceptibility in ExPEC isolates from community-associated infections
and hospital-associated infections
Antibiotic Community(n=836, %)
Hospital(n=241, %)
Ampicillin 70 80Amoxicillin-clavulanate 34 44Cefotaxime 5 10Ciprofloxacin 15 20Gentamicin 9 15Temocillin* 25 47Chloramphenicol 46 49Trimethoprim 40 41Nitrofurantoin 1 2Non-susceptibility, as defined by the breakpoint, for each antibiotic is as follows: ampicillin,
amoxicillin-clavulanate, temocillin (bloodstream isolates) and chloramphenicol >8 mg/L; cefotaxime
>2 mg/L; ciprofloxacin >1 mg/L; gentamicin and trimethoprim ≥4 mg/L; temocillin (urinary isolates)
>32 mg/L; nitrofurantoin >64 mg/L. Significant differences in resistance rates are indicated with an
asterisk.
Regional Setting
MICs of the BSAC isolates were analysed according to country and, for England, regions.
Overall resistance rates were similar for all four countries (Figure 23), but Welsh isolates
demonstrated higher rates of resistance to amoxicillin-clavulanate, aztreonam, cephalosporins and
aminoglycosides. Scottish isolates had the highest rates of chloramphenicol resistance and Irish
isolates had the highest percentage cefoxitin resistance.
Major variation in regional resistance rates was observed for specific antibiotics (Figure 24). Of note,
amoxicillin-clavulanate, trimethoprim and trimethoprim-sulfamethoxazole resistance was highest in
York and Humber isolates; resistance to cephalosporins and ciprofloxacin was highest in London and
the South-West; and amikacin and chloramphenicol resistance was highest in the East Midlands,
with amikacin resistance two to four times higher than any other region.

Figure 23 Percentage non-susceptibility according to country of origin:
used in the MIC testing, representing all included antibiotic classes, were chosen to display
resistance rates for BSAC isolates collected from England, the Republic of Ireland, Scotland and
Wales.
0
20
40
60
80
100
MIN AMP AUG CTXERP
susceptibility according to country of origin: Twelve of the 22 antibiotics
used in the MIC testing, representing all included antibiotic classes, were chosen to display
resistance rates for BSAC isolates collected from England, the Republic of Ireland, Scotland and
ERP CIPGEN
TEM TIGCHL
SXTNIT
Page | 109
Twelve of the 22 antibiotics
used in the MIC testing, representing all included antibiotic classes, were chosen to display
resistance rates for BSAC isolates collected from England, the Republic of Ireland, Scotland and
England
Ireland
Scotland
Wales

Page | 110
Figure 24 Percentage non-susceptibility according to region of England. Regions include the South-
East (SE), South-West (SW), London, East of England (East), East Midlands (E Mid), West Midlands (W
Mid), Yorkshire and Humber (York & H), the North-East (NE) and North-West (NW). Imipenem and
meropenem are excluded as all isolates were 100% susceptible. Cumulative % resistance for all
regions is plotted against the y-axis.
Strain characteristics
Phylogroup A and B1 isolates demonstrated the highest rates of resistance of all four phylogroups
(Table 15). Comparison of the two principal virulent ExPEC phylogroups (B2 and D) revealed higher
rates of resistance to the cephalosporins, ciprofloxacin and the aminoglycosides in B2 strains, while
phylogroup D strains were more resistant to temocillin, chloramphenicol, trimethoprim and
trimethoprim-sulfamethoxazole.
0
100
200
300
400
500
600
700
800
900
% n
on-s
usce
ptib
ility
SE
SW
London
East
E Mid
W Mid
York & H
NE
NW
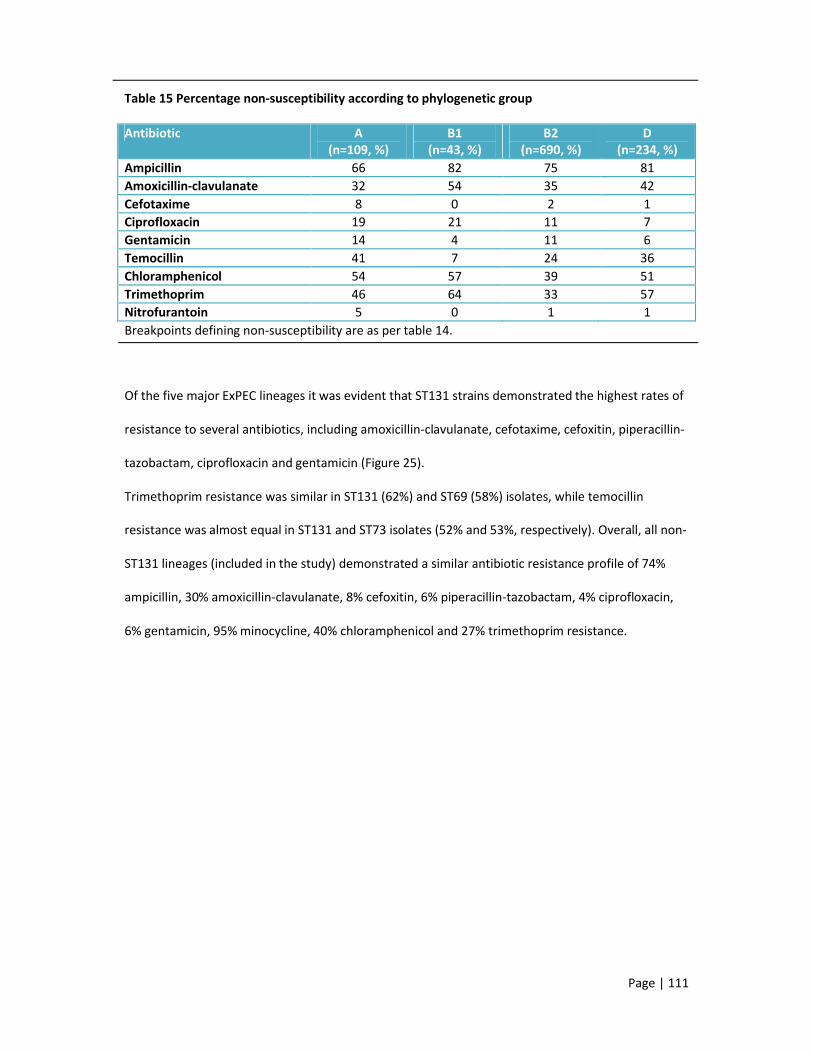
Page | 111
Table 15 Percentage non-susceptibility according to phylogenetic group
Antibiotic A (n=109, %)
B1 (n=43, %)
B2 (n=690, %)
D (n=234, %)
Ampicillin 66 82 75 81Amoxicillin-clavulanate 32 54 35 42Cefotaxime 8 0 2 1Ciprofloxacin 19 21 11 7Gentamicin 14 4 11 6Temocillin 41 7 24 36Chloramphenicol 54 57 39 51Trimethoprim 46 64 33 57Nitrofurantoin 5 0 1 1Breakpoints defining non-susceptibility are as per table 14.
Of the five major ExPEC lineages it was evident that ST131 strains demonstrated the highest rates of
resistance to several antibiotics, including amoxicillin-clavulanate, cefotaxime, cefoxitin, piperacillin-
tazobactam, ciprofloxacin and gentamicin (Figure 25).
Trimethoprim resistance was similar in ST131 (62%) and ST69 (58%) isolates, while temocillin
resistance was almost equal in ST131 and ST73 isolates (52% and 53%, respectively). Overall, all non-
ST131 lineages (included in the study) demonstrated a similar antibiotic resistance profile of 74%
ampicillin, 30% amoxicillin-clavulanate, 8% cefoxitin, 6% piperacillin-tazobactam, 4% ciprofloxacin,
6% gentamicin, 95% minocycline, 40% chloramphenicol and 27% trimethoprim resistance.

Figure 25 Percentage non-susceptibility for the five major ExPEC lineagesdisplayed for minocycline (MIN), ampicillin (AMP), amoxicillincefoxitin (FOX), piperacillin-tazobactam (PTZ), ertapenem (gentamicin (GEN), chloramphenicol (CHL), trimethoprim (TRIM), trimethoprim(SXT) and nitrofurantoin (NIT).
Penicillin, fluoroquinolone and aminoglycoside resistance determinants
Only isolates demonstrating resistance to one or more cephalosporins were tested for ESBL
possession. In total, three urinary and 50 bloodstream
enzyme, accounting for 0.6% and 8.8% of all urinary and bloodstream isolates, respectively.
Separation of the local and BSAC bloodstream isolates revealed a β
and 9.6%, respectively. The specific enzymes detected and identified are listed in table 16. The most
frequently detected enzyme was CTX
bloodstream isolate encoded both CTX
detected in local bloodstream isolates, both of which encoded CTX
encoding TEM-1. The two common enzyme profiles detected were CTX
and CTX-M-15/OXA-1 (n=20). In addition, isolate
0102030405060708090
100%
non
-sus
cept
ibili
ty
susceptibility for the five major ExPEC lineages. Non-susceptibility is displayed for minocycline (MIN), ampicillin (AMP), amoxicillin-clavulanate (AUG), cefotaxime (CTX),
tazobactam (PTZ), ertapenem (ERP), temocillin (TEM), ciprofloxacin (CIP), gentamicin (GEN), chloramphenicol (CHL), trimethoprim (TRIM), trimethoprim-sulfamethoxazole
Penicillin, fluoroquinolone and aminoglycoside resistance determinants
s demonstrating resistance to one or more cephalosporins were tested for ESBL
possession. In total, three urinary and 50 bloodstream E. coli strains encoded at least one ESBL
enzyme, accounting for 0.6% and 8.8% of all urinary and bloodstream isolates, respectively.
Separation of the local and BSAC bloodstream isolates revealed a β-lactamase prevalence of 18.8%
ific enzymes detected and identified are listed in table 16. The most
frequently detected enzyme was CTX-M-15, followed by OXA-1 and TEM-1. Of note, one local
bloodstream isolate encoded both CTX-M-15 and CTX-M-27. Two CMY-42 enzymes were also
local bloodstream isolates, both of which encoded CTX-M-15 and OXA-1, with just one
1. The two common enzyme profiles detected were CTX-M-15/OXA-1/TEM
1 (n=20). In addition, isolates from male patients possessed a higher proportion
Page | 112
susceptibility is clavulanate (AUG), cefotaxime (CTX),
ERP), temocillin (TEM), ciprofloxacin (CIP), sulfamethoxazole
s demonstrating resistance to one or more cephalosporins were tested for ESBL
strains encoded at least one ESBL
enzyme, accounting for 0.6% and 8.8% of all urinary and bloodstream isolates, respectively.
lactamase prevalence of 18.8%
ific enzymes detected and identified are listed in table 16. The most
1. Of note, one local
42 enzymes were also
1, with just one
1/TEM-1 (n=18)
her proportion
ST73
ST95
ST127
ST69
ST131

Page | 113
of CTX-M type enzymes for bloodstream isolates (11% vs. 7%) and for urinary isolates (3% vs. 1%,
P<0.05).
These ESBLs were detected in 11, 2, 45 and 8 phylogroup A, B1, B2 and D isolates, respectively.
Forty-one of the 53 ESBL isolates belonged to a major ExPEC lineage: ST131 (n=40) and ST69 (TEM-1
only). All but one (OXA-1 only) of the ST131 isolates expressed CTX-M-15, CTX-M-14 or CTX-M-27.
The ST131 isolates are discussed in more detail in chapter 6.
Table 16 Beta-lactamases detected in cephalosporin-resistant isolates according to specimen type
Β-lactamase Urinary isolates(n=4)
Bloodstream isolates(n=55)
Total(n=59)
CTX-M:CTX-M-1 0 2 2
CTX-M-14 0 5 5CTX-M-15 3 41 44CTX-M-27 0 4 4
OXA:OXA-1 3 37 40
TEM:TEM-1 3 26 29
SHV:SHV-12 0 2 2
CMY:CMY-42 0 2 2
All ciprofloxacin-resistant isolates (n=170) were screened for PMQR determinants, but only qnrS,
qepA, oqxAB and aac(6’)-Ib-cr were detected, as detailed in table 17. The gene for aac(6’)-Ib-cr was
the most frequently detected PMQR determinant. In 38/59 aac(6’)-Ib-cr positive isolates a β-
lactamase was also detected. The remaining PMQR-positive isolates (n=26, 41%) were β-lactamase
negative. According to phylogroup/lineage combinations, the PMQR determinants were identified
within the following: aac(6’)-Ib-cr (10 A/-; 1 B2/-; 1 B2/ST73; 1 B2/ST127; 45 B2/ST131; 3 D/-), qnrS
(1 B1/-, 1 B2/-), qepA (1 B1/-, 1 D/-) and oqxAB (1 B2/ST95).

Page | 114
Table 17 Plasmid-mediated quinolone resistance determinants detected in ciprofloxacin-resistant
isolates according to specimen type Ciprofloxacin resistance was determined according to the
EUCAST breakpoint (>1 mg/L). Forty-seven urinary isolates and 123 bloodstream isolates were
resistant and analysed for PMQR genes.
PMQR Urinary isolates Bloodstream isolates
aac(6’)-Ib-cr (n=59) 10 49
qnrS (n=2) 2 0
qepA (n=2) 1 1
oqxAB (n=1) 1 0
Seventy-seven of 556 (14%) local isolates demonstrated non-susceptibility to ≥1 aminoglycoside and
at least one aminoglycoside-modifying enzyme (AME) was detected by PCR in 43/77 (56%) of these
isolates. These isolates encompassed 32 (6%) urinary and 11 (23%) bloodstream strains. According to
phylogroup, the majority of AME-positive isolates belonged to phylogroup B2 (n=25), followed by
group A (n=10) and D (n=7), with just one phylogroup B1 isolate. Only two AMEs were detected in
these resistant isolates: aac(3’)-IIa (n=36) and aac(6’)-Ib (n=21). All of the isolates, except one,
encoding the acetyltransferase aac(6’)-Ib encoded its fluoroquinolone-resistant conferring allele
aac(6’)-Ib-cr. Fourteen isolates encoded both aac(3’)-IIa and aac(6’)-Ib-cr, of which 11/14 also
encoded CTX-M-15.
Within the BSAC collection a slightly higher proportion of isolates (n=92/521, 18%) demonstrated
reduced susceptibility to ≥1 aminoglycoside and 62/92 (67%) encoded at least one AME. Thirty-eight
BSAC isolates encoded aac(3’)-IIa, 43 encoded aac(6’)-Ib and 19 encoded both. All but two isolates
encoding aac(6’)-Ib possessed the fluoroquinolone-resistance conferring allele aac(6’)-Ib-cr. As with
the local isolates, the majority of AME genes were detected in phylogroup B2 (n=50) isolates,

Page | 115
followed by groups D (n=8) and A (n=4). Interestingly, aac(6’)-Ib and its allele were not detected in
phylogroup D isolates.
Comparison of phenotypic resistance with AME production revealed the majority (n=63/74) of
aac(3’)-IIa isolates and (n=25/61) aac(6’)-Ib-cr isolates to have the phenotype RSR (TOB/AMK/GEN).
All three aminoglycoside pan-resistant (RRR) isolates, with MICs of >32, 16 and >32 mg/L, expressed
both enzymes and were negative for any of the 16S methyltransferases. Analysis of MICs in
conjunction with AME genes revealed an MIC of ≥16 for gentamicin and tobramycin to be linked to
possession of aac(3’)-IIa and aac(6’)-Ib, respectively.

Page | 116
5.4 Discussion points
Within ExPEC strains antibiotic resistance is high (>20%) for many of the antibiotics used to treat
UTIs and bacteraemia empirically. In particular, antibiotic resistance appears greater in bloodstream
isolates, HAI isolates and those collected from male patients. Comparison of the three different AST
methods revealed inconsistencies, especially when comparing disc diffusion to agar dilution.
Within the BSAC bacteraemia collection, isolates from Wales had the highest rates of resistance to
the cephalosporins and aminoglycosides, Irish isolates had the highest rates of cefoxitin resistance
and Scottish isolates had the highest rates of chloramphenicol resistance. Within England, resistance
to trimethoprim +/- sulfamethoxazole was highest in strains from York and Humber; cephalosporin
and fluoroquinolone resistance was highest in strains from London and the South-West; with
amikacin and chloramphenicol resistance highest in strains from the East Midlands.
Despite the prevalence of phylogroup B2 and D isolates, strains belonging to phylogroups A and B1
demonstrated the highest rates of resistance to individual antibiotics. Within the five major ExPEC
lineages, ST131 isolates were significantly more resistant than isolates belonging to the other four
sequence types. However, trimethoprim +/- sulfamethoxazole resistance was similar in ST131 and
ST69 isolates.
ESBL genes accounted for 0.6% of urinary and 8.8% of bloodstream isolates, with CTX-M-15 the most
frequently detected ESBL and OXA-1 the most common β-lactamase in cephalosporin-resistant
isolates.
PMQR genes were rarely detected within these ExPEC isolates, with the exception of aac(6’)-Ib-cr,
which was often detected alongside the aminoglycoside-modifying enzyme aac(3’)-IIa.
Overall, MIC data and resistance genes detected in this study suggest that nitrofurantoin would be a
more appropriate first-line antibiotic for uncomplicated cystitis, even in the presence of ESBLs, with
trimethoprim-sulfamethoxazole no longer prescribed empirically, due to the high resistance rates.

Page | 117
Ideally patients with pyelonephritis and/or complicated UTIs should have urine culture and antibiotic
sensitivities reviewed prior to commencing treatment, to prevent unnecessary use of ciprofloxacin
and increasing resistance to this antibiotic. However, this delay in treatment would prolong
symptoms and increase the risk of bacteraemia developing.
For E. coli causing bacteraemia use of cephalosporins as first-line therapy would be more effective
than amoxicillin-clavulanate, due to the lower rates of resistance against this class of antibiotics.
However, national data reveals reductions in cephalosporin prescriptions, to avoid selection of ESBL-
positive isolates and reduce the risk of Clostridium difficile-associated diarrhoea. Therefore,
alternative treatments such as piperacillin-tazobactam, tigecycline or a carbapenem may be more
appropriate.

Page | 118
6. The UK ST131-O25b Clone
6.1 Introduction
ST131-O25b strains have dominated extra-intestinal infections since the early 2000s (Nicolas-
Chanoine et al. 2008). Often cited as the most common sequence type causing multi-drug resistant
UTIs and bacteraemia since 2000, this clone is associated with fluoroquinolone resistance and CTX-
M-15 ESBL expression (Blanco et al. 2011; Johnson et al. 2010; Peirano and Pitout, 2010; Smet et al.
2010).
Additional resistances reported in this clone include non-susceptibility to chloramphenicol,
tetracyclines, macrolides, sulphonamides and aminoglycosides, which adds to the cumulative
resistance burden posed by this particular ExPEC clone. Genes conferring these resistances are
usually located on IncF or IncI1 plasmids, alongside the genes for CTX-M, SHV, TEM, OXA and aac(6’)-
Ib-cr, although IncK/B and IncN plasmids have also been reported in this clone (Carattoli et al. 2005;
Ho et al. 2013; Huang et al. 2012; Matsumura et al. 2012; Matsumura et al. 2013; Wang et al. 2013;
Woodford et al. 2009). More recently, AmpC beta-lactamase and carbapenemase genes have been
identified in this clone, including CMY-2, KPC and NDM-1 (Bonnin et al. 2012; O'Hara et al. 2014;
Peirano and Pitout, 2014).
In the UK, epidemic CTX-M-15-producing ExPEC strains, collected between 2004 and 2005, were
identified as belonging to the ST131-O25b clone and this clone was the most frequently detected
lineage in urinary and bloodstream isolates (Lau et al. 2008a; Lau et al. 2008b). However, more
recent studies conducted in the North of England, which included all ExPEC regardless of antibiotic
resistance, revealed ST131 was second to ST73 in frequency among ExPEC isolates (Gibreel et al.
2012; Horner et al. 2014). In addition, these later studies revealed <70% DNA relatedness among
clonal isolates by pulsed-field gel electrophoresis, compared with earlier studies reporting >70%
DNA relatedness (Gibreel et al. 2012b; Lau et al. 2008a). Another interesting observation was the
identification of CTX-M-3 enzymes in ST131 isolates collected from Northern Ireland, which conflicts

Page | 119
with all other studies reporting CTX-M-15 as the most frequently identified CTX-M enzyme;
highlighting the ability of this clone to acquire locally circulating genes and plasmids quite readily
(Dhanji et al. 2011). Despite all these differences, each UK study has confirmed that the ST131 clone
is multi-drug resistant, regardless of ESBL expression.
Many molecular methods have been developed to facilitate identification of ST131 strains which
often divide this clone into various sub-clades, including repetitive element (rep) PCR, pabB allele
PCR, mdh and gyrB single nucleotide polymorphism (SNP) PCR and a triplex PCR that targets the afa
operon and CTX-M-15 gene (Peirano and Pitout, 2010). These methods are often employed
alongside identification of the O25b serogroup, which was reported to be unique to this clone
(Clermont et al. 2007). However, another O-antigen has recently been identified in ESBL-positive
ST131 strains, O16 (Dahbi et al. 2013; Matsumura et al. 2012).
Virulence factors are also relatively conserved among ciprofloxacin-resistant ST131 strains, with
>75% reported to possess fimH, fyuA, usp, ompT, iutA, sat, pap, iha, traT and the virulence marker,
malX (Platell et al. 2011). Of importance is fimH, the type I fimbrial adhesin, which comprises a
multitude of alleles (Weissman et al. 2012). Sequencing of the fimH gene has identified specific
alleles associated with ST131-O25b strains, including H30, H22 and H35 (Johnson et al. 2013), with
particular focus on the H30-Rx sub-clone, which has been linked with fluoroquinolone resistant,
ESBL-positive isolates only (Price et al. 2013). Taken together these data suggest that the ST131
clone is relatively homogeneous, with the occasional new addition, such as O16.
ST131 was identified in 7% of urinary and 19% of bloodstream isolates collected as part of this study.
As such a prolific clone in the UK and worldwide, it was important to determine whether these UK
isolates reflect the results of previous studies. Therefore, all ST131 isolates from this study were fully
characterised using established methods to define the ST131 clone within the UK.

6.2 Methods
The ST131 clone can be sub-divided according to the laboratory tests performed, as described in the
relevant sections below. Figure 26 details the sub
performed.
Figure 26 Sub-division of ST131 according to laboratory tests
6.2.1 ST131 identification
Thirty-eight urinary and 106 bloodstream (4 local, 102 BSAC) isolates were identified as phylogroup
B2 (section 4.2.2) and ST131 (section 4.2.3), by PCR. A small
including paired ST131 strains (n=4) and isolates with novel serogroups (n=3), underwent MLST
(section 4.2.4) to confirm their sequence type. These 144 ST131 strains were analysed, using the
following methods, to assign them t
clonal isolates.
ST131lineage
ST131clone
•Conventional serogrouping (O25, O16, plus others)•O25b PCR (Distinguish O25 types, confirms serogrouping result)
ST131 FQ-Rsub-clone
ST131 FQ-R& CTX-M+sub-clade
••CTX-M PCR & sequencing (CTX
divided according to the laboratory tests performed, as described in the
relevant sections below. Figure 26 details the sub-division of ST131, in conjunction with the tests
division of ST131 according to laboratory tests
eight urinary and 106 bloodstream (4 local, 102 BSAC) isolates were identified as phylogroup
B2 (section 4.2.2) and ST131 (section 4.2.3), by PCR. A small random number of isolates (n=7),
including paired ST131 strains (n=4) and isolates with novel serogroups (n=3), underwent MLST
(section 4.2.4) to confirm their sequence type. These 144 ST131 strains were analysed, using the
following methods, to assign them to either the resistant and virulent ST131-O25b clone or as non
•Phylogroup PCR (B2)•Sequence type PCR (ST131)
•MLST (Confirm ST131)
•Clonal specific pabB SNP (T144 & A450) PCRConventional serogrouping (O25, O16, plus others)
O25b PCR (Distinguish O25 types, confirms serogrouping result)
•MICs (Ciprofloxacin >1mg/L)•fimH typing (H30 associated with FQ-R)
•MICs (ciprofloxacin >1mg/L, cefotaxime >2mg/L)M PCR & sequencing (CTX-M-15, CTX-M-14, CTX-M-27)
•Plasmid replicon typing (IncF type)•fimH typing (H30, H22, plus others)
Page | 120
divided according to the laboratory tests performed, as described in the
division of ST131, in conjunction with the tests
eight urinary and 106 bloodstream (4 local, 102 BSAC) isolates were identified as phylogroup
number of isolates (n=7),
including paired ST131 strains (n=4) and isolates with novel serogroups (n=3), underwent MLST
(section 4.2.4) to confirm their sequence type. These 144 ST131 strains were analysed, using the
O25b clone or as non-
Page | 121
6.2.2 ST131-O25b (pabB) real-time PCR
All 144 ST131 isolates were analysed for two ST131-O25b specific (‘clonal’) SNPs using the real-time
assay described by Dhanji et al (2010).
Each PCR reaction contained 10 µl SensiFASTTM SYBR No-ROX buffer (Bioline), 0.4 µM each primer
(appendix C) and 3 µl DNA lysate made up to a final volume of 20 µl with sterile-filtered water. The
thymine-144 and adenine-450 SNP reactions were run separately on a Lightcycler® 2.0 (Roche,
Burgess Hill, UK) according to the following cycling conditions: polymerase activation step at 95°C for
3 minutes; followed by 40 cycles of denaturation at 95°C for 5 seconds and annealing/extension for
10 seconds at 58°C, with a single fluorescence acquisition step after each cycle. After amplification
the PCR reaction underwent high resolution melt, heating the PCR product to 95°C with a ramp rate
of 0.05°C per second. E. coli ST131 epidemic strain A was used as a positive control and E. coli ATCC
25922 as a negative control to determine the positive and negative values for each of the SNPs.
Isolates positive for the adenine and thymine ST131-O25b pabB-specific SNPs had a Tm value of
79.79 ± 0.29°C and 81.28 ± 0.17°C, respectively.
6.2.3 Serogroup O25b PCR
All 144 ST131 isolates underwent conventional serogrouping (section 4.2.5) and those that were
identified as O25 were analysed using the O25b antigen-specific PCR described by Clermont et al
(2008) (Clermont et al. 2008). Each reaction was prepared and amplified as described in section 3.4,
using the primers listed in appendix C, with an annealing temperature of 60°C. The 300 bp product
was resolved by gel electrophoresis (section 3.5).
6.2.4 FimH PCR
Isolates that possessed the clonal-specific SNPs (section 6.2.2) were analysed by PCR for the fimH
gene, which was purified (section 3.6) and sequenced (section 3.7) if identified.
Each PCR reaction was prepared according to section 3.4, with 0.2 µM of each primer (appendix C)
and an annealing step of 57°C lasting 15 seconds.
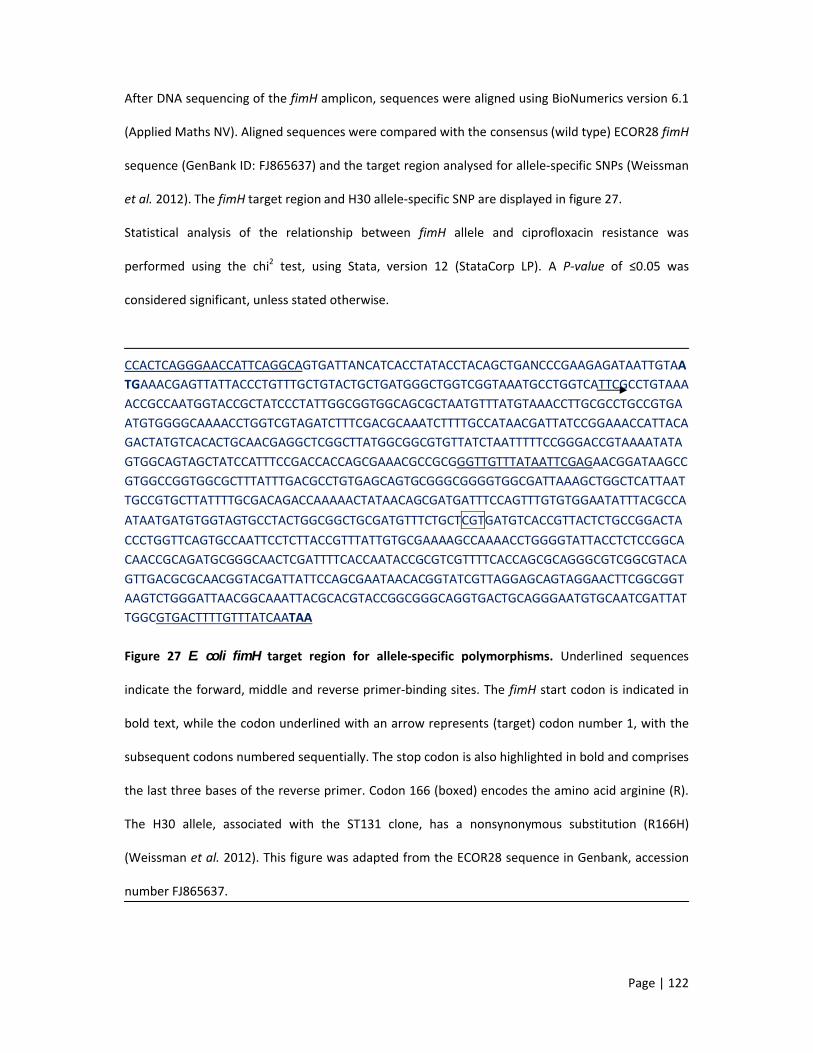
Page | 122
After DNA sequencing of the fimH amplicon, sequences were aligned using BioNumerics version 6.1
(Applied Maths NV). Aligned sequences were compared with the consensus (wild type) ECOR28 fimH
sequence (GenBank ID: FJ865637) and the target region analysed for allele-specific SNPs (Weissman
et al. 2012). The fimH target region and H30 allele-specific SNP are displayed in figure 27.
Statistical analysis of the relationship between fimH allele and ciprofloxacin resistance was
performed using the chi2 test, using Stata, version 12 (StataCorp LP). A P-value of ≤0.05 was
considered significant, unless stated otherwise.
CCACTCAGGGAACCATTCAGGCAGTGATTANCATCACCTATACCTACAGCTGANCCCGAAGAGATAATTGTAATGAAACGAGTTATTACCCTGTTTGCTGTACTGCTGATGGGCTGGTCGGTAAATGCCTGGTCATTCGCCTGTAAAACCGCCAATGGTACCGCTATCCCTATTGGCGGTGGCAGCGCTAATGTTTATGTAAACCTTGCGCCTGCCGTGAATGTGGGGCAAAACCTGGTCGTAGATCTTTCGACGCAAATCTTTTGCCATAACGATTATCCGGAAACCATTACAGACTATGTCACACTGCAACGAGGCTCGGCTTATGGCGGCGTGTTATCTAATTTTTCCGGGACCGTAAAATATAGTGGCAGTAGCTATCCATTTCCGACCACCAGCGAAACGCCGCGGGTTGTTTATAATTCGAGAACGGATAAGCCGTGGCCGGTGGCGCTTTATTTGACGCCTGTGAGCAGTGCGGGCGGGGTGGCGATTAAAGCTGGCTCATTAATTGCCGTGCTTATTTTGCGACAGACCAAAAACTATAACAGCGATGATTTCCAGTTTGTGTGGAATATTTACGCCAATAATGATGTGGTAGTGCCTACTGGCGGCTGCGATGTTTCTGCTCGTGATGTCACCGTTACTCTGCCGGACTACCCTGGTTCAGTGCCAATTCCTCTTACCGTTTATTGTGCGAAAAGCCAAAACCTGGGGTATTACCTCTCCGGCACAACCGCAGATGCGGGCAACTCGATTTTCACCAATACCGCGTCGTTTTCACCAGCGCAGGGCGTCGGCGTACAGTTGACGCGCAACGGTACGATTATTCCAGCGAATAACACGGTATCGTTAGGAGCAGTAGGAACTTCGGCGGTAAGTCTGGGATTAACGGCAAATTACGCACGTACCGGCGGGCAGGTGACTGCAGGGAATGTGCAATCGATTATTGGCGTGACTTTTGTTTATCAATAA
Figure 27 E. coli fimH target region for allele-specific polymorphisms. Underlined sequences
indicate the forward, middle and reverse primer-binding sites. The fimH start codon is indicated in
bold text, while the codon underlined with an arrow represents (target) codon number 1, with the
subsequent codons numbered sequentially. The stop codon is also highlighted in bold and comprises
the last three bases of the reverse primer. Codon 166 (boxed) encodes the amino acid arginine (R).
The H30 allele, associated with the ST131 clone, has a nonsynonymous substitution (R166H)
(Weissman et al. 2012). This figure was adapted from the ECOR28 sequence in Genbank, accession
number FJ865637.

Page | 123
6.2.5 Pulsed-field Gel Electrophoresis (PFGE)
All ST131 isolates were analysed by PFGE, as described in section 4.2.7, to determine the relatedness
of the isolates and identify any specific clusters within the clone.
6.2.6 Plasmid extraction
6.2.6.1 Crude extraction
This method was performed on all 39 CTX-M-positive clinical isolates prior to transformation (section
6.2.6.3) and has been published elsewhere (Barton et al. 1995; Guerra et al. 2004).
Isolates were sub-cultured in 3 ml LB broth and incubated overnight at 37°C. Cultures were
centrifuged for 5 minutes at 13,000 rpm and 4°C in an Eppendorf 5415 R bench top centrifuge
(Eppendorf, Stevenage, UK). Broth was aspirated and the pellet was emulsified in 200 µl solution A
(20mM EDTA and 400mM Tris, pH 8). Equal volumes of solutions B (0.4M sodium hydroxide) and C
(400mM Tris and 4% sodium dodecyl sulphate, SDS) were mixed together and 400 µl aliquots were
added to the emulsified pellet. The tube was then inverted 5-10 times and incubated at room
temperature for 5 minutes. After cell lysis proteins were precipitated by adding 240 µl 5M sodium
chloride. Tubes were inverted 5-10 times and incubated on ice for 5 minutes. After incubation, tubes
were centrifuged for 20 minutes at 13,000 rpm and 4°C in the 5415 R centrifuge (Eppendorf).
Protein-free supernatant was transferred to a new tube and DNA purified by adding 800 µl ice cold
(stored at -20°C) absolute ethanol (VWR). Tubes were inverted 5-10 times and incubated at -20°C for
one hour. Tubes were then centrifuged again for 20 minutes, as described previously. The
supernatant was discarded, 1 ml 70% ethanol added to wash the DNA pellet and tubes centrifuged
as described previously. After discarding the supernatant the DNA pellet was air dried for 10-15
minutes then re-suspended in 30 µl sterile-filtered water. Plasmid extracts were stored at -20°C until
use (within one month).
Page | 124
6.2.6.2 Clean extraction
For a purer plasmid extract, an additional phenol-chloroform step was added. This method was
performed on plasmid transformants, prior to S1 nuclease digestion (section 6.2.7).
Cells were lysed, as described above, using solutions A, B and C. In place of sodium chloride, 300 µl
3M sodium acetate (pH 5.5) was added to the cell lysis suspension. Tubes were inverted 5-10 times
and incubated on ice for 5 minutes. Tubes were centrifuged for 20 minutes, as described previously
(section 6.2.6.1), and the supernatant transferred to a new tube. Protein was precipitated by adding
500 µl phenol-chloroform and inverting the tubes 5-10 times, before centrifuging again for 5
minutes at 5,000 rpm and 4°C. The upper aqueous phase was transferred to a new tube and 500 µl
chloroform was added, before repeating the 5 minute centrifugation step. The upper aqueous phase
was transferred to a new tube and DNA purified using the two ethanol steps described previously
(section 6.2.6.1). The pellet was re-suspended in 30 µl sterile-filtered water and stored at -20°C until
use.
6.2.6.3 Plasmid Transformation
Seven isolates encoding the three CTX-M genes represented in this study (3 CTX-M-27, 2 CTX-M-14
and 2 CTX-M-15) underwent plasmid extraction and transformation into E. coli alpha cells (Bioline,
London, UK) by electroporation. Results from these seven isolates were used to infer plasmid
abundance in the remaining 32 CTX-M-15 isolates. Two microlitres of plasmid extract was mixed
with 20 µl electrocompetent cells (defrosted on ice) and transferred to a pre-chilled GenePulser 0.1
cm cuvette (Bio-rad, Hemel Hempstead, UK). Cells were electroporated in a GenePulser Xcell (Bio-
rad) set at 1.8 kV, 25 µF and 200 Ω. Cells were immediately recovered with 1 ml S.O.C. medium
(Bioline) and transferred to a 15 ml polystyrene tube (Greiner Bio-one GmbH, Germany).
Electroporated cells were incubated at 37°C, with rotation, for one hour. After incubation 100 µl
cells were inoculated on to an LB agar plate containing 2 mg/L cefotaxime (Sigma), for selection.
Plates were incubated overnight at 37°C. Cefotaxime-resistant colonies (transformed cells) were sub-
cultured onto non-selective media (ISO) and incubated as above. Cultures of the transformants were

Page | 125
stored at 4°C. DNA lysates (section 3.3) and plasmid extraction (section 6.2.6.2) was performed on
the transformants, as required.
6.2.7 REP typing
It was expected that the majority of CTX-M enzymes would be encoded on IncF plasmids of FIA:FIB
type (Huang et al. 2012; Johnson et al. 2012b; Matsumura et al. 2013; Wang et al. 2013). Therefore,
all CTX-M-positive isolates and the seven plasmid transformants were screened for IncF FIA and FIB
alleles, using the PCR plasmid replicon-typing method described by Carattoli et al (2005). The PCR
reactions and amplification conditions were as described in section 3.4, with 0.2 µM of each primer
(appendix C), an annealing temperature of 60°C and a denaturation step lasting one minute.
Products were resolved by gel electrophoresis (section 3.5). All FIA and FIB alleles were cleaned up
(section 3.6) and sequenced (section 3.7). The generated sequences were aligned using BioNumerics
version 6.1 (Applied Maths NV) and compared with known alleles in the plasmid MLST website
(http://pubmlst.org/ plasmid/) to identify the allele combinations (Jolley and Maiden, 2010).
Isolates that did not carry an IncF plasmid were screened for all other replicon types, as described
above, in simplex PCRs using the primers listed in appendix C. If isolates could not be typed using this
PCR scheme they were screened using the PBRT kit (Diatheva, Italy), which contains updated
primers. Each PCR reaction contained 23.8 µl PCR mix, 0.2 µl DNA polymerase and 1 µl DNA lysate,
as per the manufacturer’s instructions. There were eight PCR mixes together comprising primers for
25 replicon types. PCR amplification and product resolution was as described above.
6.2.8 S1 nuclease pulsed-field gel electrophoresis
Plasmid analysis by S1 nuclease PFGE was performed to identify the number of plasmids carried by
each of the CTX-M-positive ST131 isolates; to confirm that the transformed plasmid was the same
size as in the clinical isolate; to determine if plasmids of the same IncF type were the same size; and
to determine the size of the plasmids that encoded CTX-M enzymes. This was performed using a
modified version of the method described by Barton et al (1995) (Guerra et al. 2004).

Page | 126
Overnight cultures of all CTX-M-positive ST131 isolates and the seven transformants were used to
prepare DNA blocks, as described in section 4.2.5. A 1-2 mm strip was cut from each block and
incubated in 100 µl 1X S1 nuclease buffer (Promega), for 20 minutes at room temperature. The
buffer was aspirated and replaced with 100 µl fresh buffer, plus 8 U S1 nuclease enzyme (Promega),
for 45 minutes at 37°C. The enzyme reaction was stopped with 10 µl 0.5M EDTA (Sigma) and the
enzyme-buffer reaction replaced with 100 µl 0.5X TBE (Invitrogen).
Each strip was loaded into an individual well of a 1.25% (approximately) agarose gel, as described in
section 4.2.5. The gel was run for 17 hours, at 6 volts and at 12°C, with an initial switch of 1 second
and a final switch of 25 seconds, using a CHEF-DR II chiller system (Bio-rad). After electrophoresis
gels were stained with GelredTM (section 3.5) and analysed using BioNumerics, version 6.1 (Applied
Maths NV), to identify the bands and size the plasmids. Each defined band was considered to be a
linearised plasmid (Barton et al. 1995; Wang et al. 2013). Isolates that failed to produce a band after
initial digestion were repeated twice more.

Page | 127
6.3 Results
Clonal ST131 strains
All phylogroup B2, ST131 isolates (144/1077, 13%) were separated into two main clades, designated
clonal and non-clonal, as determined by ST131-O25b specific SNPs detected by real-time PCR
(section 6.2.2). The ‘clonal’ clade (pabB SNPs detected) was then further sub-divided according to
CTX-M possession (Figure 28).
Figure 28 Sub-clades of E. coli ST131 isolates as defined by clonal specific single nucleotide
polymorphisms, serogroup, CTX-M expression and ciprofloxacin resistance All non-clonal isolates
were CTX-M negative and ciprofloxacin-susceptible, whereas clonal isolates included both
ciprofloxacin-susceptible and resistant isolates, plus CTX-M positive isolates, all of which were
ciprofloxacin-resistant.
Patient demographics
Of the clonal isolates, 27% belonged to the local E. coli collection (n=32 urinary, n=3 bloodstream,
total n=35, 6%), but the majority belonged to the BSAC collection (n=92, 18%). Patients with ST131
isolates ranged from 8 to 96 years, with a modal age of 85 years and a mean of 43 years. The
majority of clonal isolates (>70%) were isolated from patients aged >60 years, which corresponded
with the high proportion of bloodstream isolates (75%, n=95) and the urinary tract (44%, n=42/95)
as the most common source of these bloodstream isolates. Of the 32 urinary isolates, 19 (60%) were
ST131
(n=144)
Clonal (n=127):ST131-O25b, ST131-O19a,
ST131-O136, ST131-O153
CTX-M+ (n=39):All ciprofloxacin resistant
CTX-M- (n=88):59/88 ciprofloxacin
resistant
Non-clonal (n=17): ST131-O16, ST131-O25a,
ST131-O-NT

Page | 128
classified as COMP, 11 (34%) as UC and two (6%) as ABU. The majority of these clonal isolates were
classified as CAIs (59%, n=75/127).
Serogroup
Within the clonal isolates, 124 (98%) were identified as serogroup O25 by conventional
serogrouping, which were confirmed as O25b by PCR (section 6.2.3). The three other clonal isolates
were identified as serogroup O19a, O136 and O153 and were negative by the O25b PCR. Further
characterisation, including pabB SNP detection, fimH typing and antibiogram, classified these three
strains as clonal.
Within the non-clonal strains (n=17), one was identified as O25 by conventional serogrouping, but
was negative by O25b PCR, identifying the allele as O25a. Twelve isolates belonged to serogroup
O16 and the remaining four were non-typeable, but all were negative by the O25b PCR and for one
or both of the ST131-specific SNPs.
CTX-M Extended-spectrum β-lactamases
Only 39 clonal ST131 isolates (31%) encoded a CTX-M enzyme, all of which were serogroup O25b.
The CTX-M enzymes detected were CTX-M-15 (n=34), CTX-M-27 (n=3) and CTX-M-14 (n=2). In
addition, 30 (24%) also expressed OXA-1 and 16 (13%) expressed TEM-1 (13 expressed both). None
of the CTX-M-positive isolates expressed an SHV enzyme. Replicon typing of the 39 CTX-M-encoding
isolates and the seven transformants revealed all, except two, to possess IncF type plasmids. CTX-M-
15 enzymes were identified in isolates encoding FIA or FIA-FIB plasmid combinations, as displayed in
figure 29. Both CTX-M-14 enzymes were encoded on approximately sized 100 Kb IncF A2:B- plasmids
and the three CTX-M-27 enzymes were encoded on IncF A2:B20 plasmids of approximately 120-140
Kb. The two non-IncF plasmids were identified as IncU and assumed to encode the CTX-M-15
enzymes.
Only 35 of 39 CTX-M-positive isolates produced a linear plasmid band after S1 nuclease digestion
and PFGE, despite repeat digestion. Plasmids of equal size were identified within the seven

transformants and their respective c
plasmid, probably encoding the CTX
1-2 plasmids. The four isolates that failed to generate a linear band on three separate occasion
included the two IncU strains, the only A6:B26 IncF strain and one A3:B1 IncF strain.
The remaining 88 clonal ST131 isolates were negative for CTX
except for one isolate which encoded OXA
enzymes.
Figure 29 IncF plasmids identified in ST131 strains expressing CTX
in size from 50Kb-165Kb. Alleles as defined by pubMLST database (
Ciprofloxacin resistance
All 39 CTX-M-positive isolates were ciprofloxacin
59/88 (67%) CTX-M-negative isolates were also ciprofloxacin
providing an overall resistance of 77%. All non
A4:B1
A6:B-
A6:B26
transformants and their respective clinical isolates. The majority (n=25/35) possessed only an IncF
plasmid, probably encoding the CTX-M enzyme, while the remaining (n=10) possessed an additional
2 plasmids. The four isolates that failed to generate a linear band on three separate occasion
included the two IncU strains, the only A6:B26 IncF strain and one A3:B1 IncF strain.
The remaining 88 clonal ST131 isolates were negative for CTX-M, TEM, OXA and SHV enzymes,
except for one isolate which encoded OXA-1. All non-clonal ST131 isolates were negative for these
Figure 29 IncF plasmids identified in ST131 strains expressing CTX-M-15 enzymes. Plasmids ranged
165Kb. Alleles as defined by pubMLST database (http://pubmlst.org/plasmid/
positive isolates were ciprofloxacin-resistant according to MICs (section 5.2.1.2) and
negative isolates were also ciprofloxacin-resistant, including the O136 isolate,
providing an overall resistance of 77%. All non-clonal isolates were susceptible to ciprofloxacin.
A1:B-
A1:B20
A1:B26
A2:B-
A2:B20
A3:B1
Page | 129
linical isolates. The majority (n=25/35) possessed only an IncF
M enzyme, while the remaining (n=10) possessed an additional
2 plasmids. The four isolates that failed to generate a linear band on three separate occasions
M, TEM, OXA and SHV enzymes,
e negative for these
Plasmids ranged
http://pubmlst.org/plasmid/)
resistant according to MICs (section 5.2.1.2) and
resistant, including the O136 isolate,
clonal isolates were susceptible to ciprofloxacin.

Page | 130
The aac(6’)-Ib-cr enzyme was detected in 30/39 CTX-M positive isolates and 9/88 CTX-M negative
isolates. This enzyme was not detected in the non-clonal ST131 isolates.
Antibiogram
As reported in chapter 5, antibiotic resistance in ST131 isolates was much higher than in the other
lineages analysed in this study. Comparison of clonal versus non-clonal isolates and CTX-M positive
versus CTX-M negative, revealed further differences within this clone (Table 18).
Table 18 Percentage non-susceptibility of non-clonal versus clonal ST131 isolates, including
percentage resistance in CTX-M positive versus CTX-M negative strains. Breakpoints used to
determine non-susceptibility were as follows: ≥1 (ciprofloxacin), ≥2 (cefotaxime), ≥4 mg/L
(gentamicin, trimethoprim), >8 mg/L (ampicillin, chloramphenicol, temocillin for bloodstream
isolates) and >32 mg/L (temocillin for urinary isolates). The two CTX-M-negative isolates that were
cefotaxime resistant had MICs of 2 and 64, with the former encoding OXA-1, while the latter lacked
genes for CTX-M groups, TEM, SHV and OXA enzymes, but may have lost porins and activated efflux
pumps, conferring resistance (Perez-Moreno et al. 2004).
Antibiotic Non-clonal(n=17)
Clonal(n=127)
CTX-M positive(n=39)
CTX-M negative(n=88)
Ampicillin 88 87 100 82Cefotaxime 0 32 100 2
Ciprofloxacin 0 77 100 67Gentamicin 24 34 49 27Temocillin 53 53 85 39
Chloramphenicol 59 49 49 49Trimethoprim 59 62 82 53
Between the clonal and non-clonal isolates similar resistance rates was observed for ampicillin,
temocillin and trimethoprim. However, resistance was higher in clonal isolates for cefotaxime,
ciprofloxacin and gentamicin, but lower for chloramphenicol. The higher rates of resistance in the
clonal isolates is likely attributable to the CTX-M positive isolates, which demonstrated much greater
levels of reduced susceptibility against all antibiotics tested, except chloramphenicol.

Page | 131
Alleles of type 1 fimbriae (fimH)
Alongside the consensus (wild-type) fimH DNA sequence, three different fimH alleles were identified
within this ST131 collection; H30, H27 and H22. The proportion of each allele according to
ciprofloxacin susceptibility is displayed in figure 30.
Greater diversity was seen within the susceptible isolates, while the ciprofloxacin-resistant isolates
mostly possessed the H30 allele (94%, P<0.01). Despite being identified in both ciprofloxacin-
resistant and -susceptible strains, the H22 allele was significantly associated with susceptible strains
(P<0.001).
Figure 30 Alleles of the fimH target sequence according to ciprofloxacin susceptibility. Alleles
detected included H30, H27, H22, wild type (WT) or isolates were negative for the fimH gene.
PFGE
Analysis of XbaI-digested DNA from all ST131 isolates revealed the clonal and non-clonal strains to
share ≤40% similarity, with small isolate clusters of highly related PFGE profiles (>70%). Within the
clonal isolates there was no clustering of strains according to fimH allele, CTX-M enzyme, IncF
plasmid, ciprofloxacin resistance or serogroup; with random dispersion of these characteristics
0
10
20
30
40
50
60
70
80
90
100
Resistant Susceptible
Num
ber o
f iso
late
s
Negative
WT
H22
H27
H30

Page | 132
within the clone (Figure 31). In particular, the H27 allele and serogroups that were atypical of ST131-
O25b strains were all closely related (>70%) to ciprofloxacin-resistant ST131-O25b strains.
Figure 31 PFGE Dendrogram of XbaI-digested clonal ST131 strains. Isolate highlighted in red
encoded the H27 fimH allele. Profiles highlighted in green identify the isolates of serogroups O19a,
O136 and O153.
(Please turn the page for figure 31).

Page | 133
10
0
90
80
70
60
50
40 serotype
O25b
O25b
O25b
O25b
O25b
O25b
O25b
O25b
O25b
O25b
O25b
O25b
O25b
O25b
O25b
O25b
O25b
O25b
O25b
O25b
O25b
O25b
O153
O25b
O25b
O25b
O25b
O25b
O25b
O19a
O25b
O25b
O25b
O25b
O25b
O25b
O136
O25b
O25b
O25b
O25b
O25b
O25b
O25b
O25b
O25b
O25b
O25b
O25b
O25b
O25b
O25b
O25b
O25b
O25b
O25b
O25b
O25b
O25b
O25b
O25b
O25b
O25b
O25b
O25b
O25b
O25b
O25b
O25b
O25b
O25b
O25b
O25b
O25b
O25b
O25b
O25b
O25b
O25b
O25b
O25b
O25b
O25b
O25b
O25b
O25b
O25b
O25b
O25b
O25b
O25b
O25b
O25b
O25b
O25b
O25b
O25b
O25b
O25b
O25b
O25b
O25b
O25b
O25b
O25b
O25b
O25b
O25b
O25b
O25b
O25b
O25b
O25b
O25b
O25b
O25b
O25b
O25b
O25b
O25b
O25b
O25b
O25b
O25b
O25b
O25b
O25b
Cip
R
R
R
R
R
R
R
R
R
R
R
S
R
R
R
R
R
R
R
R
S
R
S
R
R
R
R
R
R
S
R
S
R
R
R
R
R
R
R
R
R
R
R
R
R
R
R
R
R
R
R
R
R
R
R
R
R
R
R
R
R
R
R
R
R
R
R
R
R
R
R
R
R
R
R
R
S
S
S
S
S
S
S
R
R
R
S
S
R
S
S
R
R
R
R
R
R
S
R
R
S
S
R
R
R
S
S
S
R
R
R
S
R
R
S
R
S
R
R
R
R
R
R
S
S
S
S
CTX-M
-
15
15
15
15
15
15
-
-
-
15
-
-
-
-
-
15
-
-
15
-
-
-
-
-
-
-
-
-
-
-
-
14
14
-
15
-
15
15
15
27
27
-
-
15
15
15
15
15
-
15
15
-
-
-
-
-
27
-
15
-
-
-
-
15
15
-
-
-
-
-
15
15
15
-
-
-
-
-
-
-
-
-
-
-
15
-
-
-
-
-
-
-
15
15
15
-
-
-
-
-
-
-
-
-
-
-
-
15
-
-
-
-
-
-
-
-
-
-
15
15
-
15
-
-
-
-
TEM
OXA-1
OXA-1
OXA-1
TEM-1, OXA-1
TEM-1, OXA-1
OXA-1
TEM-1, OXA-1
OXA-1
OXA-1
TEM-1, OXA-1
TEM-1, OXA-1
TEM-1
TEM-1
TEM-1
OXA-1
OXA-1
TEM-1, OXA-1
TEM-1, OXA-1
TEM-1
TEM-1, OXA-1
OXA-1
OXA-1
OXA-1
OXA-1
OXA-1
TEM-1
OXA-1
OXA-1
OXA-1
OXA-1
OXA-1
TEM-1, OXA-1
TEM-1, OXA-1
TEM-1, OXA-1
FIA:FIB
A3:B1
A3:B1
A3:B1
IncU
IncU
A3:B1
A2:B20
A1:B-
A3:B1
A2:B-
A2:B-
A1:B-
A3:B1
A3:B1
A1:B20
A2:B20
A2:B20
A1:B-
A2:B20
A1:B-
A1:B-
A1:B-
A1:B-
A1:B26
A2:B20
A1:B-
A3:B1
A3:B1
A1:B-
A3:B1
A1:B-
A6:B26
A3:B1
A3:B1
A4:B1
A1:B-
A1:B26
A3:B1
A6:B-
fimH
H30
H30
H30
H30
H30
H30
H30
H30
H30
H30
H30
-
H30
H30
H30
H30
H30
H30
H30
H30
H22
H30
H30
-
H30
H30
H30
H30
H30
H30
H30
H30
H30
H30
H30
H30
H30
H30
H30
H30
H30
-
H30
H30
H30
H30
H30
H30
-
H30
H30
H30
H30
H30
H30
H30
H30
H30
H30
H30
H30
H30
H30
H30
H30
H30
H30
H30
H30
-
H30
H30
H30
H30
H30
H30
H22
-
-
-
-
-
-
H30
H22
-
H22
H30
H30
H30
-
H30
H30
H30
H30
H30
H30
WT
H30
H30
H30
H22
H30
H30
H30
-
H30
H30
H30
H30
H30
-
H30
H30
H27
H30
-
H30
H30
H30
H30
H30
H30
-
-
WT
H22
40 50 60 70 80 90 100

Page | 134
6.4 Discussion points
Peirano et al (2010) described ST131 as a successful, fluoroquinolone-resistant clone, whose rapid
spread was intensified by the acquisition of a CTX-M-15 encoding IncF plasmid and the possession of
the virulence factors ompT, usp and malX.
Within the UK the ST131 clone predominantly caused bloodstream infections, with a smaller
proportion of urinary tract infections.
Thirty-one percent (n=39/127) of clonal isolates exhibited the traditional characteristics of ST131-
O25b-CTX-M, but in-depth characterisation of ST131 isolates revealed new serogroups and plasmid
replicon types associated with the UK clone.
Clonal ST131 strains were highly resistant, especially in conjunction with ESBL enzymes.
The ST131 clone within the UK appeared more diverse than strains analysed in other parts of the
world.
Analysis of the virulence determinants expressed by these clonal isolates would reveal whether
virulence of ST131 strains has changed and whether these factors can provide an alternative means
to identify the clone.

Page | 135
7. ExPEC virulence determinants
7.1 Introduction
E. coli strains express a variety of virulence factors (VF) for attachment to host cells (fimH, pap, hra,
iha), to facilitate transmission by damaging host cells (sat, vat, cnf1), to acquire iron (hlyA, fyuA,
iutA) and to evade the host immune response (K1, traT) (Bhargava et al. 2009; Johnson, 1991;
Johnson et al. 2005a; Waters and Crosa, 1991). In ExPEC, in particular, VF expression is reported to
be highly varied.
Johnson and Stell (2000) originally defined ExPEC by the possession of ≥2 of the following: pap, fimH,
hlyA, fyuA, iutA, KpsII, traT and malX. Specific VFs have also been linked with particular infections:
ibeA and sfa have been associated with neonatal meningitis; usp was identified as UTI-specific; pap
were discovered in E. coli causing pyelonephritis; plus iss and traT facilitate serum survival during
bloodstream infections (Blum et al. 1991; Huang et al. 1995; Kurazono et al. 2000; Waters and Crosa,
1991).
Since then VFs have been used to characterise specific ExPEC clones and pathotypes, including
ST131-O25b (fimH, fyuA, iutA, traT, malX), CgA (pap, iutA, traT, kpsII) and APEC (iutA, cvaC, iss, traT,
iroN, hlyF, fimH, ompT) (Clark et al. 2012; Jeong et al. 2012; Johnson et al. 2012b; Manges et al.
2001; Platell et al. 2011). It has been reported that the expression of particular VFs (pap, hlyA, cnf1,
iutA, traT and ibeA) is inversely related to antibiotic resistance (Cooke et al. 2010; Piatti et al. 2008).
With the highly resistant ST131 clone and highly susceptible ST127 clone, it will be interesting to
determine how relevant this observation is today.
Studies investigating the virulence of ExPEC have used multiple PCRs or traditional laboratory
methods, such as latex agglutination and haemagglutination to identify few VFs (Blanco et al. 1997;
Moreno et al. 2005; Venier et al. 2007). These types of investigation were improved by the
development of six multiplex PCR assays, to screen for a multitude of E. coli virulence factors
(Johnson and Stell, 2000), which have been used regularly since first reported (Czaja et al. 2009;

Page | 136
Karisik et al. 2008; Moreno et al. 2008; Pitout et al. 2005). However, multiplex PCRs are limited to
approximately 4-8 targets per PCR. Microarrays provide an alternative to PCR, enabling simultaneous
detection of hundreds of targets and can determine the expression level of specific targets. Many
arrays have been developed for genus and species identification, typing data, antibiotic resistance
and VFs (Hu et al. 2012; Platteel et al. 2011; Vanhomwegen et al. 2013).
Alere Technologies GmbH (Jena, Germany) has produced multiple arrays, including those for
genotyping of common pathogens, antibiotic resistance and species identification (http://alere-
technologies.com). For this project, an experimental E. coli combined genotyping array was
evaluated alongside phenotypic (MIC determination, serogroup) and genotypic methods (multiplex
PCR assays of Johnson and Stell (2000), as the ‘gold standard’.

Page | 137
7.2 Methods
7.2.1 E. coli Genotyping Combined Array
The E. coli combined genotyping microarray (Alere Technologies GmbH, Jena, Germany) consisted of
targets for 74 virulence determinants, 94 antibiotic resistance genes, 48 H-antigens and 23 O-
antigens. Details of the targets can be found on the company website (http://alere-
technologies.com) and appendix D. A schematic detailing the layout of the microarray and
hybridisation process is detailed in figure 32.
Figure 32 Schematic of the microarray including hybridisation and labelling steps
A) Target-specific probes are immobilised on the array surface. B) Biotin-labelled ssDNA, which has
been amplified using one target-specific antisense primer, binds the complementary probe. C)
During hybridisation streptavidin binds to the biotin label and horseradish peroxidase (HRP)
subsequently binds to streptavidin. The conjugation of streptavidin with HRP causes seramun green
dye to precipitate, which is detected by the ArrayMate reader.
7.2.1.1 Genotyping DNA Extraction
DNA was extracted from overnight cultures using a modified version of the Animal Tissue – spin
column protocol of the DNeasy® Blood and Tissue Kit (Qiagen). Bacterial colonies were resuspended
A B C
Page | 138
in 180 µl buffer ATL and 20 µl proteinase K then incubated at 56°C for 10 minutes in an Eppendorf
thermomixer comfort (Eppendorf, Hamburg, Germany). Four microlitres of RNase A (Qiagen) at 100
µg/ml was added to the suspension, vortexed briefly and incubated at room temperature for 2
minutes. Suspensions were vortexed again, and 200 µl buffer AL and 200 µl 95% ethanol added
before vortexing for 10-15 seconds.
Suspensions were transferred to a spin column and processed according to the manufacturer’s
instructions. Columns were centrifuged for 1 minute at 8000 rpm in an IEC® MicroMax centrifuge
(Thermo Scientific). The column was transferred to a new tube, 500 µl AW1 buffer added and
centrifugation repeated as above. The column was transferred to a new tube, 500 µl AW2 buffer
added and centrifuged for 3 minutes at 14000 rpm. The column was transferred to a new eppendorf
tube, 200 µl AE buffer added and tubes incubated at room temperature for 1 minute. Tubes were
centrifuged for 1 minute at 8000 rpm and eluted DNA stored at 4°C until required. Prior to analysis
DNA was quantified using a ND-1000 NanoDrop (Thermo Scientific).
7.2.1.2 Genotyping PCR
Multiplex PCR was performed with primers and reagents provided by Alere Technologies (Germany),
to label the DNA with a biotin marker for detection, according to the manufacturer’s instructions.
Each reaction contained 3.9 µl B1 buffer, 0.1 µl B2 (polymerase enzyme), 1 µl primer mix, 4 µl sterile-
filtered water and 1 µg DNA. Alere Technologies recommended 0.5-2 µg, while Geue et al (2010),
which have been referenced by several similar studies, recommended 1.0-1.5 µg (Monecke et al.
2011; Schilling et al. 2012; Wu et al. 2013). Therefore, a compromise of 1 µg was selected.
Amplification consisted of an initial denaturation at 96°C for 5 minutes, followed by 45 cycles of
denaturation at 96°C for 60 seconds, annealing at 60°C for 20 seconds and elongation at 72°C for 40
seconds, with a final 4°C hold. PCR products were stored at 4°C until required for hybridisation.

Page | 139
7.2.1.3 Genotyping Hybridisation
All reagents were supplied by Alere Technologies (Germany). Prior to hybridisation DNA samples
were prepared by suspending 10 µl PCR product in 90 µl C1 buffer. Horse radish peroxidase (HRP)-
streptavidin conjugate was also prepared by adding 1 µl C3 concentrated HRP to 99 µl C4 buffer, per
sample.
The ArrayStripsTM, which were spotted with probes for each of the targets, were washed with 200 µl
sterile distilled water, per well, for 5 minutes at 56°C with shaking at 550 rpm in an OLS200 shaking
waterbath (Grant Instruments). As with all subsequent washes and incubations, the water was
removed using a pastette, at the edge of the well, so as not to scratch the array surface. The initial
wash step was repeated with 200 µl C1 buffer and incubated as above. C1 buffer was aspirated and
100 µl DNA preparation was added to each well before re-incubation, as above, for 60 minutes. The
wells were washed twice with 200 µl C2 buffer. C2 buffer was aspirated and 100 µl pre-prepared
conjugate added to each well then incubated for 15 minutes at 30°C with shaking at 550 rpm. Wells
were washed twice with 200 µl C5 buffer, before incubation with 100 µl D1 seramun green substrate
at room temperature for 10 minutes. The substrate was aspirated before the target signals were
read using an ArrayMateTM reader (Identibac, Alere Technologies GmbH, Cologne, Germany), using
IconoClust software, version 3 (Alere Technologies, Germany).
7.2.1.4 Genotyping Analysis
The array signal value(s) was determined by subtracting the background signal from the target
signal, using the manufacturer’s software. The manufacturer recommends that all signal values of
≤0.1 should be considered negative (target absent), values of ≥0.3 should be considered positive
(target present) and values between 0.1 – 0.3 as indeterminate. Array signals were considered
positive if the signal value was above the cut-off level for both target spots. Four controls were
included on the microarray: a biotin staining control and three E. coli controls; glutamate
decarboxylase (gad), integration host factor subunit A (ihfA) and glyceraldehydes-3-phosphate
(gapA).

Page | 140
Microarray results were compared with MICs (presence of certain antibiotic resistance genes should
confer an MIC greater than the breakpoint), β-lactamase PCRs (specific β-lactamase gene should be
detected by the microarray), PMQR determinant PCR (specific PMQR genes should be detected by
the microarray) and serogrouping data. These tests were considered the gold standard for
evaluating the microarray. As well as confirming and validating these results, the microarray would
reveal the virulence factors encoded by these isolates.
Preliminary analysis resulted in the cut-off being revised. Several studies using this array, or
alternative versions, used a positive cut-off of ≥0.4 (Charnock et al. 2014; Dierikx et al. 2012; Vogt et
al. 2014; Wagner et al. 2014), but this did not improve the results here. While adjustment of the cut-
off (≥0.86) according to the ATCC 25922 control results (as a fully susceptible type strain antibiotic
resistance determinants conferring resistance should not be hybridized), did not improve the
accuracy or reliability of the array either.
7.2.2 E. coli isolates
Ninety-five E. coli isolates (appendix E) and the ATCC 25922 control were analysed using the E. coli
combined genotyping microarray (Alere Technologies), according to the manufacturer’s instructions,
as described above. Isolates encompassed a range of ages, sexes, infection types and sources of
bacteraemia. The 34 paired isolates (section 3.2.1) were also included to determine whether they
carried the same VFs and antibiotic resistance genes.
For the virulence determinant PCRs 154 newly selected isolates (appendix E) were investigated,
including 53 of the microarray isolates. These included 30 asymptomatic bacteruria (ABU) isolates,
30 uncomplicated cystitis (UC) isolates, 30 complicated cystitis/pyelonephritis (COMP) isolates, 30
bloodstream isolates and the 34 paired urosepsis isolates.
7.2.3 Virulence determinant PCRs
E. coli isolates were investigated for E. coli virulence factors (VF), using an updated version (personal
correspondence from Prof. James Johnson, 2013) of Johnson and Stell’s PCR assays (Johnson and

Page | 141
Stell, 2000). The results of these PCRs, in conjunction with antibiotic resistance data and
serogrouping data, were compared with the microarray results.
PCR reactions were prepared using the Qiagen® Multiplex PCR kit (Qiagen). Each PCR reaction
contained 10 µl master mix, 2.5 µl Q solution, primer mix, and 5 µl DNA lysate made up to a final
volume of 25 µl with sterile-filtered water. Primers were separated into 6 primer mixes (appendix C)
at a working concentration of 0.6 µM per primer. Amplification consisted of an initial hold at 95°C
for 15 minutes; followed by 30 cycles of denaturation at 94°C for 30 seconds, annealing at 68°C for
30 seconds and extension at 72°C for 1 minute; with a final hold at 72°C for 5 minutes. Primer mix six
was amplified with an annealing temperature of 58°C. Products were resolved by gel electrophoresis
(section 3.5).
7.2.4 Cyclomodulin PCR
These 154 E. coli isolates were also analysed for cycle inhibiting factor (cif), cytotoxic necrotising
factor – 1 (cnf1), cytolethal distending toxin (cdtB) and the colibactin-encoding pks island, which was
detected by identification of two marker genes; clbA and clbQ. These cyclomodulins were detected
using previously published PCRs (Dubois et al. 2010; Salvarani et al. 2011). PCR reactions and cycling
conditions were as described in section 3.4, using two different annealing temperatures; 48°C (cnf1)
and 55°C (all other targets) and the primers listed in appendix C. PCR products were resolved by gel
electrophoresis (section 3.5).
7.2.5 Pathogenicity islands
In addition to VFs, the Galleria isolates were investigated for eight pathogenicity islands (PAI) that
have been identified in ExPEC strains (Dobrindt et al. 2002; Sabate et al. 2006). Two multiplex PCR
assays were used to screen for the PAIs. Multiplex 1 detected CFT073 II, 536 III and 536 IV, while
multiplex 2 detected J96 I, J96 II, CFT073 I, 536 I and 536 II. PCR reactions were prepared as
described in section 3.4, using the primers listed in appendix C, with 3 µl DNA lysate. Cycling
conditions were also as described in section 3.4 with an annealing temperature of 55°C and all cycle
Page | 142
steps extended to 1 minute. PCR products were resolved by gel electrophoresis (section 3.5). CFT073
(Mobley et al. 1990), J96 (Minshew et al. 1978) and 536 (Blum et al. 1991) type strains were included
as positive controls. These strains were kindly provided by Dr McNally (University of Nottingham,
UK) and Professor Johnson (University of Minnesota, MN, USA). PAIs were included in the analysis of
the G. mellonella model to identify any association with larvae mortality.
7.2.6 Rifamycin resistance PCR
Isolates identified by the microarray as encoding rifamycin resistance genes (arr) were screened by
PCR for these targets (Hopkins et al. 2014), using the primers listed in appendix C. PCR reactions and
cycling conditions were as described in section 3.4, with an annealing temperature of 55°C. PCR
products were resolved by gel electrophoresis (section 3.5).
7.2.7 Statistics
All statistical analysis was performed using Stata®, version 12 (StataCorp LP, TX, USA).
Based on the VF determinant PCRs, isolates were given a virulence (VF) score, calculated as the sum
of virulence factors (and cyclomodulins) identified in each isolate. Multiple targets for the same
virulence factor were considered as one for scoring. Isolates were also given an antibiotic (Abx)
resistance score, calculated as the sum of antibiotics demonstrating reduced susceptibility per
isolate, according to MICs. VF and Abx scores were rounded to the nearest whole number and
percentage positive calculated according to various strain characteristics and patient demographics.
Associations between patient variables, strain characteristics and VFs were determined by
correlation coefficient. Any significant associations were analysed using the Fishers exact test.
The association between VF and Abx score was calculated by linear regression. Comparisons of
scores, according to various patient and strain variables, were calculated using the Mann-Whitney U
test.
A P-value ≤0.05 was considered significant for all statistical tests, except for the correlation
coefficient, which used a P-value ≤0.01.

Page | 143
Combined genotyping array
Sensitivity and specificity of specific targets on the microarray were calculated, by comparing to the
gold standard tests (MICs and PCR).
Paired Isolates
A paired t-test was performed to calculate whether there was a significant difference in VF score and
Abx resistance score between the urinary and blood culture isolate of each pair. Significance was set
at a value P<0.05.

Page | 144
7.3 Results
Genotyping Microarray
Using the recommended cut-off of ≥0.3; 93 of the 95 isolates were positive for the biotin (staining
control) and 54 were positive for the gadA (E. coli control), yet failed to hybridise with the ihfA and
gapA E. coli control targets. All 95 isolates were positive for the gadA gene in the phylogrouping PCR
(section 4.2.2), resulting in the array gadA target demonstrating a sensitivity of 57%. Employing the
higher cut-off levels of 0.4 and 0.86, further reduced the sensitivity of gadA to 41% (39/95) and 0%
(0/95), respectively. The ATCC 25922 control was negative for gadA (both target spots) at each cut-
off. Although each of the four DNA controls should be positive for the array results to be accurately
interpreted and validated, the data for the antibiotic resistance genes and O-antigens were
analysed, as a second step in determining the reliability of this microarray, using the ≥0.3 cut-off.
Fifteen of the 95 isolates possessed either a CTX-M group 1 or group 9 gene, or both, as determined
by PCR (section 5.2.5). However, only 2/15 of these genes (both CTX-M group 9) were detected using
the microarray. An additional 27 ESBL-negative isolates also hybridized with these targets, resulting
in a sensitivity and specificity of 13% and 66% respectively, for the microarray. Multiple AmpC/beta-
lactamase targets (ACC-1, ACT-1, DHA, KHM, LEN-1, OXA, SPM, VIM) hybridized with 83 isolates that
were negative for these genes by PCR and the microarray failed to detect 8/12 OXA and 10/10 TEM-
1 genes. However, the two CMY-positive isolates were correctly identified using the microarray,
although a further 44 also hybridized with the CMY target on the array, despite being negative by
PCR.
PCR identified the PMQR genes aac(6’)-Ib-cr, qepA and qnrS (section 5.2.7) in 19/25 of the
ciprofloxacin-resistant isolates and 1/70 ciprofloxacin-susceptible isolates that were subsequently
analysed using the microarray. The microarray successfully identified the aac(6’)-Ib gene in 12
isolates, but also detected this target in 42 other ciprofloxacin-susceptible isolates, as well as qnrB
and/or qnrD in 66 isolates (all false-positive as determined by PCR). In addition, the 16S rRNA
methyltransferases armA, rmtA, rmtB and rmtC, which confer pan-resistance to the
Page | 145
aminoglycosides, were detected using the microarray in 85 isolates. However, none of these 16S
methyltransferases were confirmed by PCR (section 5.2.6). Multiple aminoglycoside modifying
enzymes (AME) were also detected by the array, including aadA, aadB and aphD, in isolates of varied
aminoglycoside susceptibility, none of which were confirmed by PCR (section 5.2.6). The only AME
detected by PCR was aac(3’)-IIa, which was not detected by the array.
The arr-1 and arr-4 genes, that confer resistance to rifampicin (da Fonseca et al. 2008), were
detected in 83 isolates. PCR (Hopkins et al. 2014) did not confirm the presence of these genes. The
tetA, tetB, tetC and tetD genes were detected by microarray in 79 isolates, of which 73 (92%) were
minocycline resistant. The dfrA and sul2 genes confer trimethoprim and sulfamethoxazole resistance
respectively, by encoding alternative alleles of the dihydrofolate reductase and dihydropteroate
synthase enzymes (Skold, 2001). These targets were detected in 52 and 76 isolates, respectively.
However, of these isolates 27/52 (52%) and 32/76 (42%) were resistant and 25/52 and 44/76 were
susceptible to trimethoprim and sulfamethoxazole respectively. The chloramphenicol
acetyltransferase, catB, was detected in 72 isolates, of which 25/72 (35%) were chloramphenicol
resistant. The genes floR and cmlA1 also confer florfenicol and chloramphenicol resistance and were
detected in 49 and 26 isolates respectively, of which 19 were chloramphenicol resistant.
Eighty-two of 95 isolates analysed by the microarray underwent conventional serogrouping (section
4.2.5), of these 18/82 expressed an O-antigen that was included as a target on the microarray.
However, the microarray failed to correctly identify the O-antigen in all isolates and often detected
multiple (1 - 6) O-antigens per isolate.
Overall the microarray lacked both sensitivity and specificity when compared with PCR detection of
antibiotic resistance targets and serogroup data. Therefore, the virulence factor data obtained from
the microarray was also considered to be unreliable. Especially as the array failed to detect pap, sfa,
sat, tsh, iha and cnf1 in the majority of isolates, but hybridized with cif, cdtB, K88 fimbriae, hlyE and
vat which were not confirmed by PCR. Other common virulence targets hybridized by the array
included cloacin, microcins B, ipaH, perA and shiga-toxin.

Page | 146
Virulence factor PCR
The imprecision of the microarray (see section 7.3) led to 154 isolates (appendix E) being
investigated for VF genes using the updated PCR protocol (2010) published by Johnson and Stell
(2000). Fifty-three of the isolates analysed using the microarray were also included in this PCR
analysis.
Multiple ExPEC and diarrhoeagenic E. coli (DEC) virulence factors were detected by PCR (Table 19),
with a prevalence ranging from 1% (gafD, clpG, pic, and kpsMTII) to 81% (fimH). The determinants
fimH, pap, fyuA, iutA, kpsMTII, traT and usp were all detected in >50% isolates.
The proportion of each detected VF according to infection (UTI or bacteraemia), UTI type (ABU, UC,
COMP) and GIT versus GU source bacteraemia can be found in table 19.
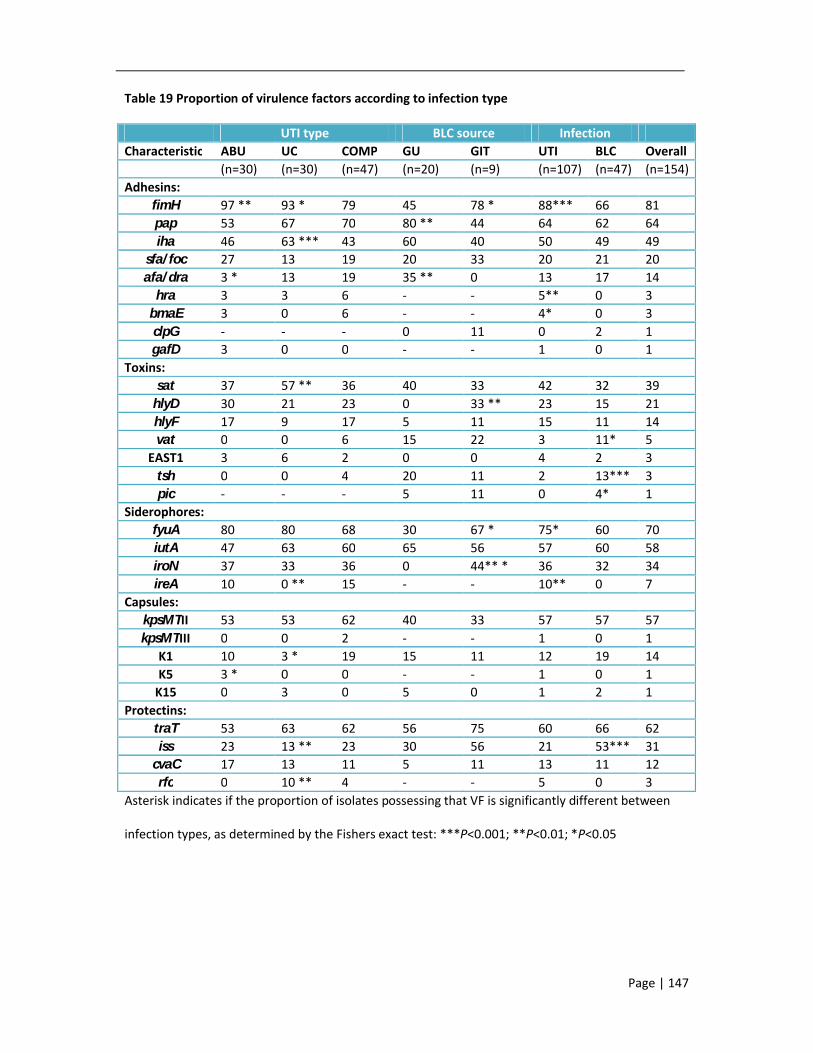
Page | 147
Table 19 Proportion of virulence factors according to infection type
UTI type BLC source InfectionCharacteristic ABU UC COMP GU GIT UTI BLC Overall
(n=30) (n=30) (n=47) (n=20) (n=9) (n=107) (n=47) (n=154)Adhesins:
fimH 97 ** 93 * 79 45 78 * 88*** 66 81pap 53 67 70 80 ** 44 64 62 64iha 46 63 *** 43 60 40 50 49 49
sfa/foc 27 13 19 20 33 20 21 20afa/dra 3 * 13 19 35 ** 0 13 17 14
hra 3 3 6 - - 5** 0 3bmaE 3 0 6 - - 4* 0 3clpG - - - 0 11 0 2 1gafD 3 0 0 - - 1 0 1
Toxins:sat 37 57 ** 36 40 33 42 32 39
hlyD 30 21 23 0 33 ** 23 15 21hlyF 17 9 17 5 11 15 11 14vat 0 0 6 15 22 3 11* 5
EAST1 3 6 2 0 0 4 2 3tsh 0 0 4 20 11 2 13*** 3pic - - - 5 11 0 4* 1
Siderophores:fyuA 80 80 68 30 67 * 75* 60 70iutA 47 63 60 65 56 57 60 58iroN 37 33 36 0 44** * 36 32 34ireA 10 0 ** 15 - - 10** 0 7
Capsules:kpsMTII 53 53 62 40 33 57 57 57kpsMTIII 0 0 2 - - 1 0 1
K1 10 3 * 19 15 11 12 19 14K5 3 * 0 0 - - 1 0 1
K15 0 3 0 5 0 1 2 1Protectins:
traT 53 63 62 56 75 60 66 62iss 23 13 ** 23 30 56 21 53*** 31
cvaC 17 13 11 5 11 13 11 12rfc 0 10 ** 4 - - 5 0 3
Asterisk indicates if the proportion of isolates possessing that VF is significantly different between
infection types, as determined by the Fishers exact test: ***P<0.001; **P<0.01; *P<0.05
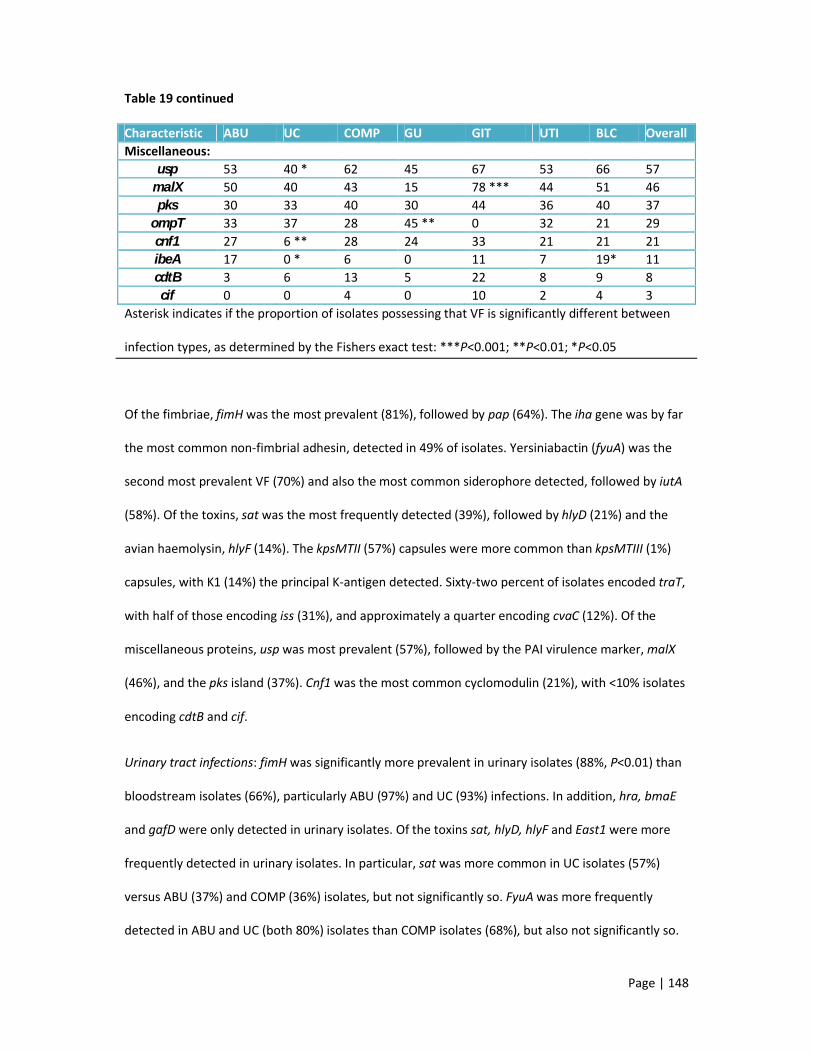
Page | 148
Table 19 continued
Characteristic ABU UC COMP GU GIT UTI BLC OverallMiscellaneous:
usp 53 40 * 62 45 67 53 66 57malX 50 40 43 15 78 *** 44 51 46pks 30 33 40 30 44 36 40 37
ompT 33 37 28 45 ** 0 32 21 29cnf1 27 6 ** 28 24 33 21 21 21ibeA 17 0 * 6 0 11 7 19* 11cdtB 3 6 13 5 22 8 9 8cif 0 0 4 0 10 2 4 3
Asterisk indicates if the proportion of isolates possessing that VF is significantly different between
infection types, as determined by the Fishers exact test: ***P<0.001; **P<0.01; *P<0.05
Of the fimbriae, fimH was the most prevalent (81%), followed by pap (64%). The iha gene was by far
the most common non-fimbrial adhesin, detected in 49% of isolates. Yersiniabactin (fyuA) was the
second most prevalent VF (70%) and also the most common siderophore detected, followed by iutA
(58%). Of the toxins, sat was the most frequently detected (39%), followed by hlyD (21%) and the
avian haemolysin, hlyF (14%). The kpsMTII (57%) capsules were more common than kpsMTIII (1%)
capsules, with K1 (14%) the principal K-antigen detected. Sixty-two percent of isolates encoded traT,
with half of those encoding iss (31%), and approximately a quarter encoding cvaC (12%). Of the
miscellaneous proteins, usp was most prevalent (57%), followed by the PAI virulence marker, malX
(46%), and the pks island (37%). Cnf1 was the most common cyclomodulin (21%), with <10% isolates
encoding cdtB and cif.
Urinary tract infections: fimH was significantly more prevalent in urinary isolates (88%, P<0.01) than
bloodstream isolates (66%), particularly ABU (97%) and UC (93%) infections. In addition, hra, bmaE
and gafD were only detected in urinary isolates. Of the toxins sat, hlyD, hlyF and East1 were more
frequently detected in urinary isolates. In particular, sat was more common in UC isolates (57%)
versus ABU (37%) and COMP (36%) isolates, but not significantly so. FyuA was more frequently
detected in ABU and UC (both 80%) isolates than COMP isolates (68%), but also not significantly so.

Page | 149
While iutA was less common in ABU (47%) than the other urinary isolates (60-63%) and iroN was
similarly distributed across all UTI types (33-37%). Of note was ireA, which was only detected in
urinary isolates (10%, P<0.05), but not UC infections. KpsMTII genes were detected more frequently
in COMP isolates (62%) than other urinary isolates (53%). As for the protectins, traT was more
common in UC (63%) and COMP (62%) isolates, while iss was more frequently detected in COMP and
ABU isolates (both 23% vs. 13%). Of the miscellaneous proteins usp, pks, cnf1, cdtB and cif were
more common in COMP isolates, while malX and ibeA were more common in ABU isolates and ompT
was more prevalent in UC isolates.
Analysis of UC isolates alone, as an indicator of the VF required to cause infection in non-
compromised patients, revealed iha, sat, iutA, traT and ompT to be more frequently detected. Of
these, the association of iha and sat with UC approached significance (P<0.08).
Bacteraemia: As the urinary tract is the most common source of E. coli bacteraemia, GU and GIT
isolates were compared to identify VFs associated with severe infection, versus those required for
colonisation or less severe infections. In contrast to fimH, pap appeared more prevalent in GU
isolates, but the difference was not significant (80% vs. 44%, P=0.07). The adhesins iha (60%) and
afa/dra (35%) were also more common in GU isolates. CS31A adhesins were only detected in
bacteraemia isolates, albeit at a low rate (2%), but were detected in GI isolates only and were absent
in GU isolates. Sat was notably more prevalent in GU isolates (40% vs. 33%), as was tsh (20% vs.
11%). However, in GIT isolates, hlyD was more common (33% vs. 0%), along with vat (22% vs. 15%)
and pic (11% vs. 5%). Of the siderophores fyuA (67% vs. 30%) was significantly more prevalent in GIT
isolates, along with iroN (44% vs. 0%, P<0.01). As for the capsular types, all were more prevalent in
GU isolates, while the protectins and miscellaneous proteins were all more prevalent in GIT isolates,
except for ompT (0% vs. 45%, P<0.05). The association of pap, afa/dra and ompT with GU isolates,
approached significance (P<0.06).
Analysis of the alternative source bacteraemia isolates (Line, Chest, CSF, SSTI) revealed other
associations. The CSF-source isolate belonged to ST95 and encoded fimH, pap, sfa/foc, hlyF, fyuA,

Page | 150
iutA, iroN, K1, traT, iss, cvaC, usp, ibeA, pks and malX. Of the Chest-source isolates only fyuA was
encoded in 100% of isolates, with fimH in 80%. In Line-source isolates 100% encoded usp only, with
83% also encoding fimH, fyuA, iss and malX. In SSTI-source isolates 100% of isolates encoded fyuA,
iroN, kpsMTII, iss and usp, with 75% also possessing pap, fimH, iha, ibeA, pks and malX.
Urosepsis: Analysis of VFs more prevalent in COMP and GU isolates may indicate determinants
important in urosepsis. Notably, pap (P<0.01), afa/dra (P<0.01) and kpsMTII were more frequently
detected in these isolates, while fimH (P<0.01), fyuA (P<0.01) and cvaC were lacking.
VF and Abx scores were not significantly different (P>0.05) between the urinary isolates and
bloodstream isolates of the 17 pairs (Table 20), except for pair 16 which comprised two separate
strains (see Table 13). However, there were some minor differences in VF possession and
antibiogram between paired isolates. For example, in one pair the bloodstream isolate had two
additional VFs (afa/dra and iha); while in another pair the urinary isolate was resistant to additional
antibiotics (cefoxitin and ertapenem). In addition, fimH and fyuA were only detected in 13/34 and
8/34 of the paired isolates respectively, despite being detected in 112/120 (93%) and 100/120 (83%)
of the remaining 120/154 isolates analysed by PCR.

Page | 151
Table 20 Virulence and resistance scores for the 34 paired urosepsis isolates
Isolate pair Sample VF score Abx score1 Blood
Urine8 56 5
2 BloodUrine
12 311 3
3 BloodUrine
10 510 5
4 BloodUrine
12 613 6
5 BloodUrine
10 39 3
6 BloodUrine
9 1112 10
7 BloodUrine
2 161 18
8 BloodUrine
12 414 2
9 BloodUrine
8 210 3
10 BloodUrine
10 1510 13
11 BloodUrine
9 67 5
12 BloodUrine
10 612 5
13 BloodUrine
16 313 3
14 BloodUrine
12 410 4
15 BloodUrine
11 410 4
16 BloodUrine
10 54 8
17 BloodUrine
15 615 5

Page | 152
Pathogenicity islands: 134/154 (87%) of the VF isolates possessed ≥1 of the PAIs. The isolates lacking
the PAIs were mostly from UTIs (n=17/20) and belonged to phylogroup A (n=11/20), with a VF score
ranging from 1-9.
In order of prevalence, 536 IV was the most frequently detected (n=129/154), followed by CFT073 I
(n=71/154), CFT073 II (n=68/154), 536 I (n=25/154), J96 II (n=18/154), 536 II (n=13/154), J96 I
(n=7/154) and 536 III (n=5/154).
The most common PAI profile, which was detected in 49/154 (32%) isolates, was CFT073 I, CFT073 II
and 536 IV. Isolates possessed between 1-7 PAIs.
PAIs were often significantly associated (P≤0.01) with the presence of other PAIs, including CFT073 I
with CFT073 II and 536 I with 536 III. The CFT073 and J96 PAIs were also significantly more prevalent
in phylogroup B2 isolates, than any other phylogroup, while 536 III was significantly associated with
serogroup ST127 and serogroup O6 isolates (all P<0.01).
Scores: Across all isolates, VF scores ranged from 0-18 (median=9) and Abx scores ranged from 0-30
(median=4). Linear regression revealed VF scores were inversely associated with the Abx scores
(P<0.05), for all isolates, including the paired isolates. VF scores and Abx scores according to patient
and isolate variables are listed in table 21.
Of note, Abx scores increased with age and were higher in male patients and bacteraemia isolates,
although these observations were not significant. COMP isolates had higher scores than the other
urinary isolates, while bacteraemia scores were difficult to interpret according to source due to the
variation in sample number.

Page | 153
Table 21 Virulence and resistance scores according to patient demographics and strain
characteristics
Variable Number of isolates VF score Abx scoreInfection:
Urinary tract 107 9 4Bacteraemia 47 9 6 **
UTI type:ABU 30 9 3UC 30 9 4
COMP 47 9 5BLC type:
Chest 5 6 9CSF 1 18 4GI 9 9 7GU 20 8 6Line 6 10 5SSTI 4 13 5NK 2 12 2
Phylogenetic group:A 26 5 6*
B1 2 7 6B2 84 11*** 4D 42 7 5
Sequence type:ST131 13 10 8**ST127 9 10 4ST95 14 12 *** 4 *ST73 12 12*** 3**ST69 20 7** 4NK 86 8* 5
Age (years):0-10 8 9 3
11-20 6 9 421-30 29 9 531-40 30 9 441-50 14 9 451-60 15 10 661-70 13 10 571-80 15 8 781-90 19 9 7>90 5 9 3

Page | 154
Table 21 continued
Variable Number of isolates VF score Abx scoreSex:
Female 113 9 4Male 41 8 7 **
Healthcare setting:CAI 122 9 5HAI 32 10 5
Overall: 9 4Asterisk indicates if the scores are significantly different according to various patients and strain
variables, as determined by the Mann Whitney U test: ***P<0.001; **P<0.01; *P<0.05
Phylogroup: Phylogroup B2 had the highest mean VF score of 11 (P<0.01), while phylogroups D and
B1 both had a score of 7. Phylogroup A had the lowest VF score of 5, but also the highest Abx score
at 6, along with phylogroup B1 isolates. VFs only detected in phylogroup B2 included sfa/foc, gafD,
clpG, pic, tsh, ireA, cif and cdtB, while vat and ibeA were detected in phylogroups B2 and D only. The
isolate of the novel phylotype (gadA+, chuA-, yjaA+, TspE4.C2+) possessed pap, fimH, iha, sat, ireA,
iutA, usp, traT, pks and malX. No other isolates in this collection shared this virulence profile.
Sequence type (ST): ST73 and ST95 had the highest VF score (VF=12, P<0.01). ST69 had the lowest
score of the 5 lineages (VF=7). All STs had a low Abx score compared with the VF score, with the
exception of ST131 isolates, which had a mean VF and Abx score of 10 and 8 respectively. Multiple
VFs were detected in at least three of the lineages, including pap, usp, malX and pks, but some VFs
were also significantly associated with one lineage compared to all others, according to a correlation
matrix; ST131 was significantly associated with iha (92%, P<0.01) and iutA (100%, P<0.01); ST127
was significantly associated with cnf1 (78%, P<0.01); ST95, the avian lineage, was significantly
associated with cvaC (42%, P<0.01), hlyF (50%, P<0.01) and K1 (57%, P<0.01); ST73 was significantly
associated with sfa/foc fimbriae (83%, P<0.01), pks (100%, P<0.01) and cytolethal distending toxin,
cdtB (42%, P<0.01); and ST69 was significantly associated with sat (80%, P<0.01) plus ompT (75%,
P<0.01). Despite these differences in VF detection, it was not possible to use VFs to identify

Page | 155
particular lineages or to distinguish them. Analysis of the ST131 virulence repertoire (Table 22)
according to the three sub-clones (section 6.3) revealed afa/dra and pap to be absent from the non-
clonal strain, while in the clonal isolates pap was present in all ESBL+ isolates, but only in one of the
ESBL- isolates and cnf1 was detected in three of the ESBL+ isolates only. Median VF scores also varied
between the three sub-clones: 8 (clonal, ESBL+), 10 (clonal, ESBL-) and 11 (non-clonal).
Table 22 Virulence factors detected in the ST131 isolates according to sub-clone. VFs that are
underlined were identified in >70% of isolates, according to each sub-group, except for non-clonal
isolates, of which only one was investigated using the VF PCR assays.
ST131
sub-group
No. of
isolates
VF
score
Virulence factors (% isolates positive for VF)
Clonal,
ESBL+7 8
fimH (57) pap (86) afa/dra (43) clpG (14) iha (100) hlyD (14) sat
(43)
pic (14) fyuA (57) kpsII (57) ompT (29) usp (86) traT (71) iss (57)
cnf1 (43) malX (43)
Clonal,
ESBL-6 10
fimH (100) pap (17) afa/dra (17) iha (67) hlyF (33) sat (83) fyuA (83)
iutA (100) iroN (17) kpsII (83) usp (100) traT (100) iss (50) ibeA (50)
cdtB (17) cvaC (17) malX (100)
Non-clonal 1 11 fimH iha sat fyuA iutA kpsII usp traT iss pks malX (100)

Page | 156
Virulence profiles: Particular clones and pathotypes have been investigated for virulence profiles,
with VFs detected in ≥70% of isolates included in the profile (Clark et al. 2012). For example, Clonal
group A (ST69/D) isolates have been characterised by the presence of pap, iutA, traT and kpsII and
the absence of sfa/foc, afa/dra, hlyD, cnf1, iroN, iss and malX (Manges et al. 2001).
Using this method ≥70% UK ST131 isolates possessed ≥3 of the following: fimH, iutA, fyuA, iha, kpsII,
usp, traT and malX, with some variations according to sub-clone (Table 22). The ST69 profile
included pap, fimH, iutA, iha, sat, traT and ompT but lacked sfa/foc, afa/dra, hlyD, malX, cnf1, hra,
pic, vat, tsh, ireA, usp, ibeA, pks, cif and cdtB.
In addition, 10% of UK isolates possessed APEC traits including iroN, fimH, hlyF, iss and iutA and 94%
possessed ≥2 of the following, defining these isolates as ExPEC according to Johnson and Stell
(2000): pap, fimH, hlyD, fyuA, iutA, kpsII, traT and malX.
Page | 157
7.4 Discussion points
It was not possible to evaluate the virulence and resistance profile of 95 selected ExPEC isolates
using the E. coli combined genotyping microarray.
The ExPEC VF PCR assays designed by Johnson and Stell (2000) revealed the virulence repertoire of
154 UK ExPEC isolates to be highly varied.
Specific VFs were identified within the five major ExPEC lineages that were highly prevalent, but
unable to distinguish between these sequence types.
Paired isolates causing urosepsis typically possess the same virulence factors, but during
transmission from the urinary tract to the bloodstream, additional factors may be gained or lost.
Evaluation of VFs prevalent in UC cystitis and genitourinary-source bacteraemia, compared to all
other isolates, could identify those required for colonisation and those required for virulence.

Page | 158
8. ExPEC virulence in Galleria mellonella
8.1 Introduction
Multiple virulence factors have been reported in ExPEC (Johnson and Stell, 2000). Recent studies
suggest that pap, fyuA, iroN, kpsMTII and ompT are important in pyleonephritis strains, with kpsMTII
associated with particularly severe infection (Kudinha et al. 2013b; Marschall et al. 2012). Despite
this, only the presence of fyuA and pap have been linked to increased patient mortality (Mora-Rillo
et al. 2013), while the pks island encoding colibactin is suggested to decrease sepsis survival in a
mouse model (Marcq et al. 2014). Another study investigated the role of O-antigens in ExPEC
survival and confirmed that O-antigens increase serum survival, but O6, in particular, facilitates
colonisation of the urinary tract (Sarkar et al. 2014). Antibiotic resistance and delay in receiving
appropriate antibiotic therapy have been strongly linked to patient mortality, specifically the
presence of ESBL enzymes (Ku et al. 2013; Melzer and Petersen, 2007). These two observations are
interesting given that Piatti et al (2008) and Cooke et al (2010) have demonstrated the inverse
relationship between VF expression and antibiotic resistance, suggesting that mortality and severity
of infection is due to one or the other, but not both.
UK ExPEC isolates revealed great diversity in their virulence factor (VF) repertoire (see 7.3). Data
suggested that iutA and traT were important VFs in UTIs, while pap, afa/dra and tsh were important
VFs in GU-source bacteraemia and iha, sat and ompT were important in both infection types.
Analysis of urosepsis isolates suggested that the presence of pap, afa/dra and kpsMTII coupled with
the absence of fimH, fyuA and cvaC were significantly associated with these infections. Overall
phylogroup B2 strains possessed the highest number of VFs, along with ST73 and ST95 strains and
specific VFs were associated with particular sequence types, such as ST131 and iha. While statistical
analysis has revealed many of these findings to be significant, evaluation of these strains in an
infection model would further support the validity of these results.

Page | 159
Various cell lines, mice and Caenorhabditis elegans have been used as models of infection for
investigating virulence of ExPEC (Bhargava et al. 2009; Blango and Mulvey, 2010; Johnson et al.
2012a; Lemaitre et al. 2013; Totsika et al. 2013). Disadvantages include their time-consuming nature,
the expense to maintain these cell lines and animal models, but also the ethical requirements that
need to be addressed before some of the models can be used. Final instar larvae of the greater wax
moth, Galleria mellonella, provide a more affordable, high-throughput model that is simple to
maintain, can be incubated over a large temperature range (15-37°C) and can be inoculated with
exact quantities of test organism and antibiotic (Glavis-Bloom et al. 2012). As such, G. mellonella
have been used in numerous studies to analyse the pathogenesis, virulence and antibiotic treatment
of multiple bacterial and fungal pathogens, including Francisella tularensis, Listeria monocytogenes,
Pseudomonas aeruginosa, Acinetobacter baumannii, Stenotrophomonas maltophilia and
Cryptococcus neoformans (Andrejko and Mizerska-Dudka, 2012; Aperis et al. 2007; Hornsey et al.
2013; Joyce and Gahan, 2010; Mylonakis et al. 2005; Nicoletti et al. 2011). Recently G. mellonella
was also established as a good model for assessing the comparative virulence of clinical Klebsiella
pneumoniae strains, by analysing larval mortality (Insua et al. 2013; Wand et al. 2013). In addition,
non-pathogenic bacteria demonstrated larval mortality comparable to that seen in PBS-inoculated
larvae, suggesting that avirulent strains could be identified using this criteria (Aperis et al. 2007;
Mylonakis et al. 2005).
The innate immune system of G. mellonella is comprised of the hemolymph which carries the
hemocytes (equivalent to white blood cells in mammals). The hemocytes recognise invading
pathogens and perform oxidative killing or encapsulation/nodulisation of these organisms and
necrotic tissue (Lionakis, 2011; Ribeiro and Brehelin, 2006). Recognition and encapsulation of these
pathogens result in the hemocytes producing phenoloxidase, which is released on cell destruction
(Ribeiro and Brehelin, 2006). Phenoloxidase metabolises phenol precursors into quinine molecules,
melanin pigments and toxic reactive oxygen and nitrogen species (Nappi and Christensen, 2005). The
dark melanin pigments act as a structural immune defence by hardening and preventing pathogens

Page | 160
from spreading further into the larval cuticle, as well as perturbing pathogen enzymes, which would
degrade the larval cuticle. This process can be monitored readily by eye because it results in a
darkening of the larvae from cream to brown/black (Dubovskiy et al. 2013). Lactate dehydrogenase
(LDH) is produced by skeletal muscle and erythrocytes during glycolysis. As a result LDH is produced
during exercise (Berg et al. 2002), but also in tumour cells where glucose metabolism is highly
upregulated (Lu et al. 2013). During infection apoptosis leads to release of cellular LDH in G.
mellonella, enabling the level of LDH to act as a marker of cell damage (Wand et al. 2013). Therefore,
measurement of melanin production and LDH concentration can be used as additional markers of
pathogen virulence and tissue damage.
Until 2014 there were no published studies analysing the virulence of ExPEC in the G. mellonella
model (Williamson et al. 2014). Therefore 40 ExPEC strains, encompassing both urinary and
bloodstream isolates and the five major ExPEC lineages, were analysed using the G. mellonella
model to identify patient and strain characteristics associated with larval mortality and to determine
how severity of human infection might relate to larval mortality.
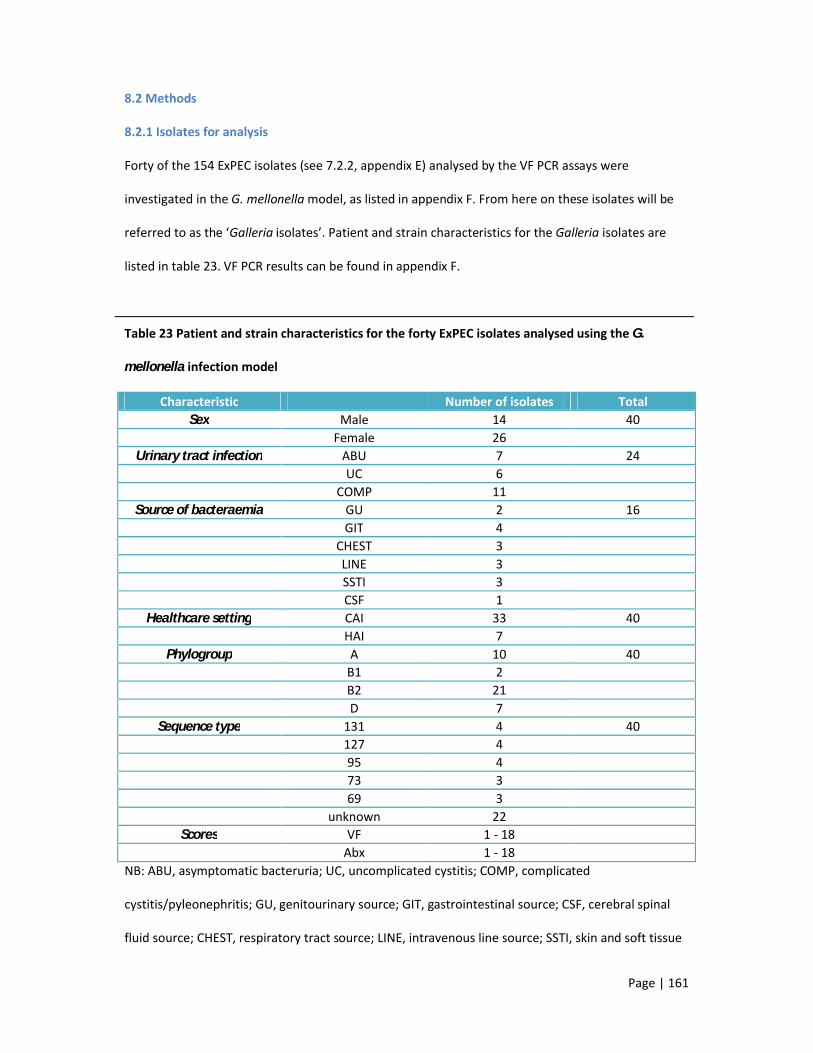
Page | 161
8.2 Methods
8.2.1 Isolates for analysis
Forty of the 154 ExPEC isolates (see 7.2.2, appendix E) analysed by the VF PCR assays were
investigated in the G. mellonella model, as listed in appendix F. From here on these isolates will be
referred to as the ‘Galleria isolates’. Patient and strain characteristics for the Galleria isolates are
listed in table 23. VF PCR results can be found in appendix F.
Table 23 Patient and strain characteristics for the forty ExPEC isolates analysed using the G.
mellonella infection model
Characteristic Number of isolates TotalSex Male 14 40
Female 26Urinary tract infection ABU 7 24
UC 6COMP 11
Source of bacteraemia GU 2 16GIT 4
CHEST 3LINE 3SSTI 3CSF 1
Healthcare setting CAI 33 40HAI 7
Phylogroup A 10 40B1 2B2 21D 7
Sequence type 131 4 40127 495 473 369 3
unknown 22Scores VF 1 - 18
Abx 1 - 18NB: ABU, asymptomatic bacteruria; UC, uncomplicated cystitis; COMP, complicated
cystitis/pyleonephritis; GU, genitourinary source; GIT, gastrointestinal source; CSF, cerebral spinal
fluid source; CHEST, respiratory tract source; LINE, intravenous line source; SSTI, skin and soft tissue

Page | 162
infection source; CAI, community-associated infection; HAI, hospital-associated infection; VF,
virulence factor; Abx, antibiotic resistance.
8.2.2 G. mellonella Infection Model
8.2.2.1 Inoculum Preparation
From an overnight culture on ISO agar (Oxoid), a 1 µl loop of culture was taken and inoculated in 3-
5ml LB broth (Sigma). Suspensions were incubated overnight, at 37°C, in an Innova 4000 incubator
shaker (New Brunswick Scientific; Eppendorf). Cultures were centrifuged at 4000 rpm for 10 minutes
in an IEC CL40 centrifuge (Thermo Fisher Scientific) and the supernatant aspirated. Pellets were re-
suspended in 3ml PBS. Centrifugation and re-suspension steps were repeated twice more. A serial
1:10 dilution was performed (100 µl pellet suspension in 900 µl PBS), with a final dilution of 1 x
107/ml. A 100 µl aliquot of the 1 x 10⁷ suspension was spread evenly on an ISO agar plate using an L-
shaped spreader (STARLAB, Hamburg, Germany). Inoculated plates were incubated overnight, at
37°C. Colony counts were performed to determine the number of colony forming units (CFU) in all
serial dilutions. The most appropriate dilution was selected and diluted to achieve the required
inoculum for the G. mellonella (Livefood UK Ltd, Rooks Bridge, Somerset, UK) model.
8.2.2.2 Inoculum Test
Prior to analysing the E. coli isolates in the G. mellonella model an inoculum test was performed to
determine the most appropriate inoculum required for the virulence assay. Previous studies have
used an inoculum of 101-107 CFU (Hornsey et al. 2013; Nicoletti et al. 2011); however, other studies
conducted here at the Blizard Institute indicated that an inoculum of 104-106 was most appropriate
for important Gram-negative bacteria (Betts et al. 2014; Hornsey et al. 2013). Therefore, for this test
an inoculum of 1 x 10⁴, 1 x 10⁵ or 1 x 10⁶ of three ExPEC strains was injected into ten larvae each to
identify the inoculum that would kill 50% of G. mellonella after 24 hours incubation at 37°C. These
three strains included the ATCC 25922 type strain (VF score = 4), one clinical isolate with a VF score
of two and another clinical isolate with a VF score of seven.

Page | 163
8.2.2.3 Virulence Assay
Ten G. mellonella larvae were injected in the first left proleg (Figure 33) with 105 CFU/larvae, per test
isolate using a 22-gauge gastight syringe (Hamilton, Bonaduz, Switzerland). The UPEC type strain
CFT073 was also inoculated into G. mellonella larvae as a comparator for the test isolates. Ten larvae
were inoculated with PBS as a stress control. Larvae were incubated aerobically at 37°C (for optimal
E. coli growth conditions) on Grade 1 WhatmanTM filter paper (Whatman plc, Maidstone, UK) in
extra-deep petri dishes (Thermo Fisher Scientific) for 96 hours. Larvae were considered dead if they
did not respond to touch. The virulence assay was performed on three separate occasions with three
different batches of larvae. Virulence of the Galleria isolates (as determined by the proportion of
larvae killed) was analysed according to various patient and strain characteristics to identify
variables linked to larval mortality.
Figure 33 External morphology of the underside of G. mellonella larvae. A indicates the
mesothoracic legs and B indicates the prothoracic legs, or pro-legs. This image was amended from
the image by Smith (1965).
8.2.2.4 Melanisation Assay
Galleria larvae were investigated for melanin production, as a marker of the immune response, four
hours post-inoculation, as performed by Wand et al (2013). Ten G. mellonella were injected per
strain and incubated, as described above. After four hours the larvae were chilled on ice for 10-15
A B

Page | 164
minutes and surface sterilised with 70% ethanol (Thermo Fisher Scientific). Larvae were sacrificed
using a sterile disposable surgical scalpel (Swann-Morton, Sheffield, UK) and hemolymph collected
into a pre-chilled eppendorf tube (STARLAB, Germany) containing 10-20 crystals of N-phenylthiourea
(Alfa Aesar, Ward Hill, MA, USA) to prevent further melanisation of the hemolymph (Andrejko and
Mizerska-Dudka, 2012). A 100 µl aliquot of pooled hemolymph was transferred into a 96-well
polystyrene microplate (STARLAB, Germany) and the optical density (OD) measured at a wavelength
of 450 nm using an ELx800 absorbance microplate reader (Biotec, Winooski, VT, USA). Uninoculated
larvae were used as a background control and their OD subtracted from the OD readings of each of
the Galleria isolates. The assay was performed in triplicate on three separate days. The highly
virulent CFT073 strain was included as a comparator for the test strains.
OD was measured at 450 nm, instead of 490 nm, as described by Wand et al (2013). Yellow solutions
(hemolymph is yellow) absorb blue light with a wavelength of 450-490 nm (Royal Society of
Chemistry, 2013). Therefore, readings at 450 nm, instead of 490 nm, were considered valid and
comparable.
8.2.2.5 Lactate Dehydrogenase Assay
Galleria larvae were investigated for lactate dehydrogenase (LDH) production, as a marker of cell
damage, four hours post-inoculation, as performed by Wand et al (2013). Ten larvae were
inoculated, incubated and sacrificed, as described above (see 8.2.4.4). A 50 µl aliquot of pooled
hemolymph was transferred to a 96-well polystyrene microplate (STARLAB) and analysed using the
CytoTox 96 non-radioactive cytotoxicity assay (Promega), according to the manufacturer’s
instructions. Briefly, 50 µl assay buffer was added to each well containing hemolymph. The
microplate was incubated at room temperature, in the dark, for 30 minutes. After incubation 50 µl
of stop solution was added to each well and the OD read using an ELx800 absorbance microplate
reader (Biotec), at a wavelength of 450 nm. Uninoculated larvae were used as a background control,
as described previously. The assay was performed in triplicate on three separate days. The highly
virulent CFT073 strain was included as a comparator for the test strains.

Page | 165
8.2.3 Statistics
All statistical analyses were performed using GraphPad Prism version 5.04 (GraphPad Software Inc.,
La Jolla, California, USA).
Association between PAIs and patient/strain characteristics were analysed by Spearman correlation,
assuming data were non-parametric. Association between two variables was further analysed using
Fishers exact test. A P-value ≤0.01 was considered significant for both tests.
Association between larvae survival and melanin/LDH production was measured by linear
regression, with a P-value ≤0.01 considered as significant. Difference in melanin/LDH production
according to patient and strain variables was measured using the unpaired t-test, with a P-value
≤0.05 considered significant.
Larvae survival curves have traditionally been analysed by the log rank test (Betts et al. 2014;
Hornsey et al. 2013; Mylonakis et al. 2005). However, this test analyses the trend of survival curves,
irrespective of time. After discussions with a statistician, relative risk was used to analyse larvae
survival 96 hours after inoculation. This test is more appropriate as it analyses the proportion of
dead larvae at specific time points and can be used to analyse different variables irrespective of
sample size. The relative risk (RR) of larvae death is reported according to various strain and patient
variables, with a P-value <0.01 considered significant. Variables that generated a RR >5 were
analysed further by Spearman correlation to identify those significantly associated with mortality. A
P-value <0.05 was considered significant.

Page | 166
8.3 Results
G. mellonella Infection Model
A dose of 1 x 10⁵ was identified as the most appropriate inoculum for virulence discrimination in this
assay (Table 24). The CFT073 control strain affected 100% larvae mortality and the PBS control
affected 87% larvae survival after 96 hours. For the 40 Galleria isolates, larvae survival ranged from
0% - 100% (Figure 34).
Table 24 Larvae survival 24 hours post-inoculation with 1 x 10⁴, 105 and 106 colony forming units
Isolate Inoculum No. surviving larvae after 24hrs 3 1 x 10⁴ 109 1025922 83 1 x 10⁵ 39 325922 23 1 x 10⁶ 09 025922 0

Page | 167
Figure 34 Percentage larvae survival, melanin
production and LDH production for each of the
40 ExPEC isolates. Percentage larvae survival,
96-hours post-inoculation is plotted on the lower
x-axis (blue dots). Melanin (green bars) and
lactate dehydrogenase (red bars) OD readings
are plotted on the upper x-axis. For each isolate
the specimen type (U, urine or B, bloodstream)
and sequence type (131, 127, 95, 73, 69 or
unknown; -) are included with the isolate number
on the y-axis.
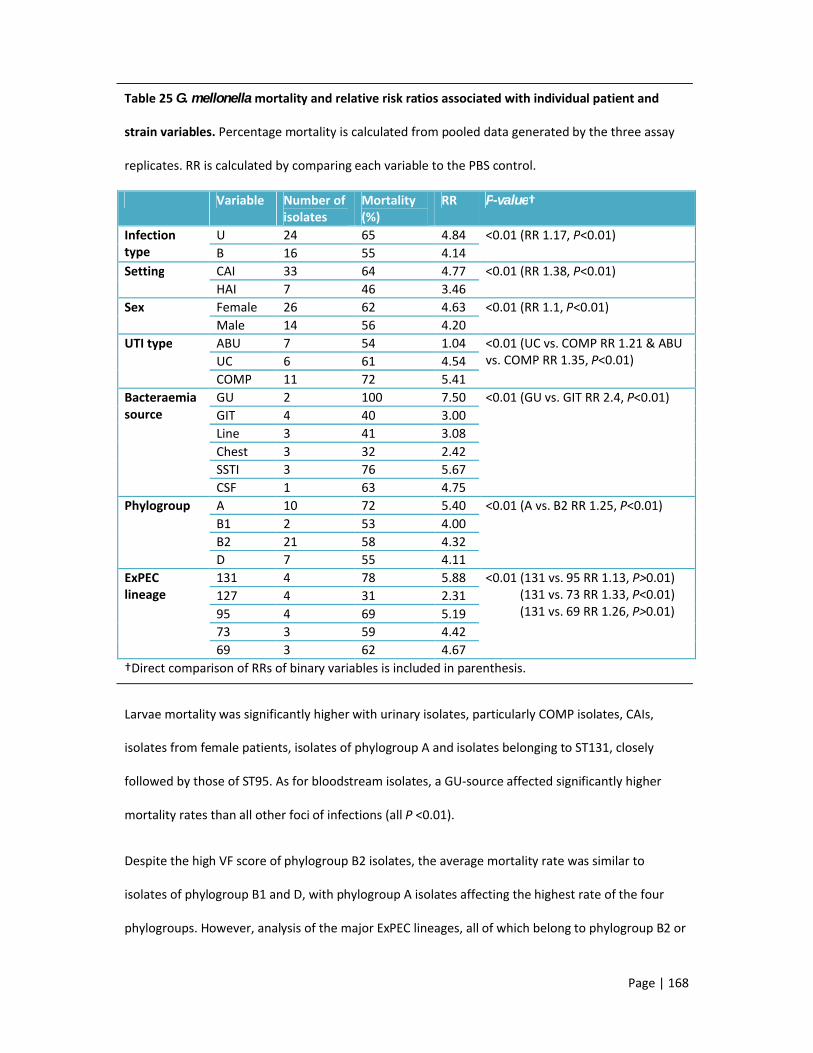
Page | 168
Table 25 G. mellonella mortality and relative risk ratios associated with individual patient and
strain variables. Percentage mortality is calculated from pooled data generated by the three assay
replicates. RR is calculated by comparing each variable to the PBS control.
Variable Number of isolates
Mortality (%)
RR P-value†
Infection type
U 24 65 4.84 <0.01 (RR 1.17, P<0.01)B 16 55 4.14
Setting CAI 33 64 4.77 <0.01 (RR 1.38, P<0.01)HAI 7 46 3.46
Sex Female 26 62 4.63 <0.01 (RR 1.1, P<0.01)Male 14 56 4.20
UTI type ABU 7 54 1.04 <0.01 (UC vs. COMP RR 1.21 & ABU vs. COMP RR 1.35, P<0.01)UC 6 61 4.54
COMP 11 72 5.41Bacteraemia source
GU 2 100 7.50 <0.01 (GU vs. GIT RR 2.4, P<0.01)GIT 4 40 3.00Line 3 41 3.08Chest 3 32 2.42SSTI 3 76 5.67CSF 1 63 4.75
Phylogroup A 10 72 5.40 <0.01 (A vs. B2 RR 1.25, P<0.01)B1 2 53 4.00B2 21 58 4.32D 7 55 4.11
ExPEC lineage
131 4 78 5.88 <0.01 (131 vs. 95 RR 1.13, P>0.01) (131 vs. 73 RR 1.33, P<0.01) (131 vs. 69 RR 1.26, P>0.01)
127 4 31 2.3195 4 69 5.1973 3 59 4.4269 3 62 4.67
†Direct comparison of RRs of binary variables is included in parenthesis.
Larvae mortality was significantly higher with urinary isolates, particularly COMP isolates, CAIs,
isolates from female patients, isolates of phylogroup A and isolates belonging to ST131, closely
followed by those of ST95. As for bloodstream isolates, a GU-source affected significantly higher
mortality rates than all other foci of infections (all P <0.01).
Despite the high VF score of phylogroup B2 isolates, the average mortality rate was similar to
isolates of phylogroup B1 and D, with phylogroup A isolates affecting the highest rate of the four
phylogroups. However, analysis of the major ExPEC lineages, all of which belong to phylogroup B2 or
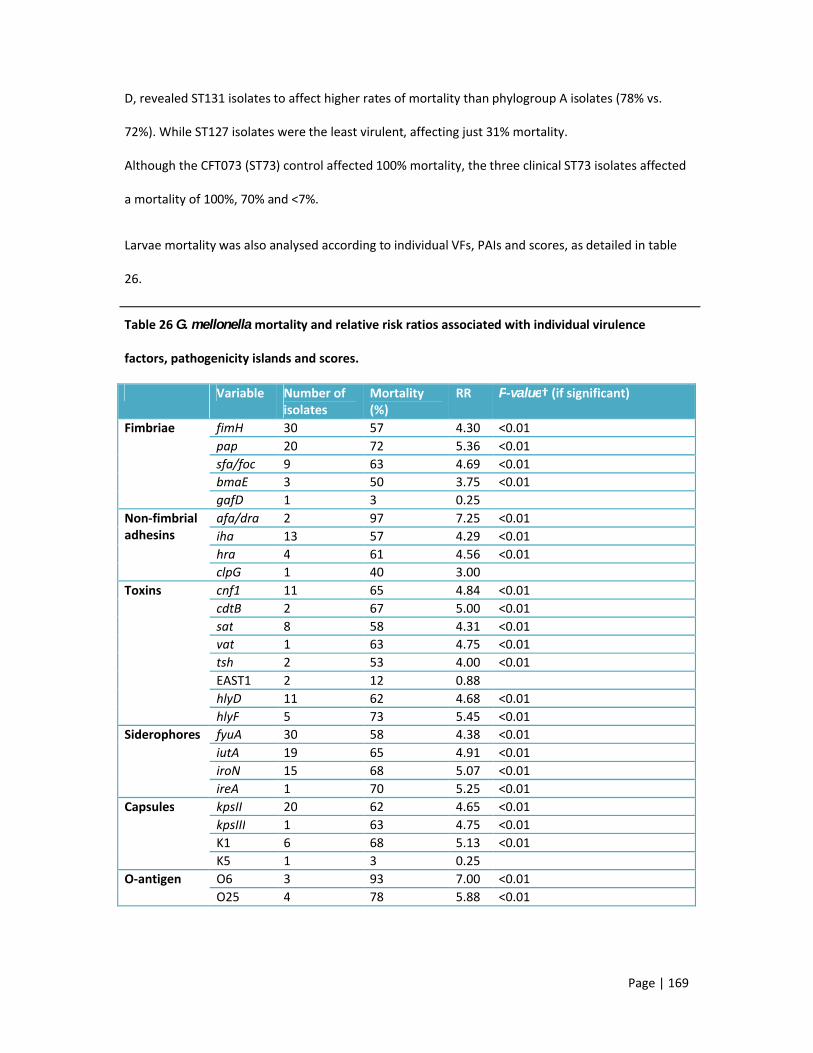
Page | 169
D, revealed ST131 isolates to affect higher rates of mortality than phylogroup A isolates (78% vs.
72%). While ST127 isolates were the least virulent, affecting just 31% mortality.
Although the CFT073 (ST73) control affected 100% mortality, the three clinical ST73 isolates affected
a mortality of 100%, 70% and <7%.
Larvae mortality was also analysed according to individual VFs, PAIs and scores, as detailed in table
26.
Table 26 G. mellonella mortality and relative risk ratios associated with individual virulence
factors, pathogenicity islands and scores.
Variable Number of isolates
Mortality (%)
RR P-value† (if significant)
Fimbriae fimH 30 57 4.30 <0.01 pap 20 72 5.36 <0.01 sfa/foc 9 63 4.69 <0.01 bmaE 3 50 3.75 <0.01 gafD 1 3 0.25
Non-fimbrial adhesins
afa/dra 2 97 7.25 <0.01 iha 13 57 4.29 <0.01 hra 4 61 4.56 <0.01 clpG 1 40 3.00
Toxins cnf1 11 65 4.84 <0.01 cdtB 2 67 5.00 <0.01 sat 8 58 4.31 <0.01 vat 1 63 4.75 <0.01 tsh 2 53 4.00 <0.01 EAST1 2 12 0.88hlyD 11 62 4.68 <0.01 hlyF 5 73 5.45 <0.01
Siderophores fyuA 30 58 4.38 <0.01 iutA 19 65 4.91 <0.01 iroN 15 68 5.07 <0.01 ireA 1 70 5.25 <0.01
Capsules kpsII 20 62 4.65 <0.01 kpsIII 1 63 4.75 <0.01 K1 6 68 5.13 <0.01 K5 1 3 0.25
O-antigen O6 3 93 7.00 <0.01 O25 4 78 5.88 <0.01

Page | 170
Table 26 continued
Variable Number of isolates
Mortality (%)
RR P-value† (if significant)
Miscellaneous usp 23 57 4.28 <0.01 traT 21 64 4.82 <0.01 ompT 4 87 6.50 <0.01 iss 13 63 4.69 <0.01 ibeA 4 75 5.63 <0.01 cvaC 4 71 5.31 <0.01 pks 16 63 4.72 <0.01 malX 20 54 4.04 <0.01
Pathogenicity islands
CFT073 I 24 60 4.52 <0.01 CFT073 II 18 64 4.79 <0.01 J96 I 7 59 4.39 <0.01 J96 II 8 73 5.50 <0.01 536 I 5 41 3.05 <0.01 536 II 7 81 6.11 <0.01 536 III 1 97 7.25 <0.01 536 IV 33 63 4.74 <0.01
High Scores VF (>9) 18 61 4.58 <0.01 Abx (>4) 22 62 4.66 <0.01
Note: RR is calculated by comparing each variable to the PBS control.
Of all the virulence factors, isolates possessing afa/dra, serogroup O6 or the PAI 536 III (encodes
sfa/foc, tsh and sat) were >7x as likely to affect larvae death, than isolates lacking these factors.
Isolates possessing ompT or 536 II (encodes hlyA and hra) were >6X more likely to affect larvae
death and isolates with pap, hlyF, iroN, ireA, K1, serogroup O25, ibeA, cvaC or J96 II (encodes pap,
hlyA, cnf1 and hra) were >5x more likely to affect larvae death than isolates lacking these
determinants (Bidet et al. 2005; Dobrindt et al. 2002). The remaining virulence factors were
associated with a RR ≤5 and gafD, clpG, bmaE, EAST1 and K5, in particular, were associated with low
RRs (<4) and low rates of mortality (≤50%).
Isolates with high VF scores or high Abx scores affected similar mortality and RRs. Notably, malX,
which was considered a marker of virulent ExPEC isolates affected 54% mortality, with a RR <5.

Page | 171
Variables generating a RR >5 were considered to be associated with larvae mortality and were
analysed further by Spearman correlation (Figure 35). Of these, genitourinary-source bloodstream
isolates, pap, PAI 536 II and serogroup O6 correlated with larvae mortality (P<0.05).
Figure 35 the ExPEC variables significantly associated with larvae mortality. Spearman correlation
revealed strains from genitourinary-source bacteraemia or those with pap, 536 II or serogroup O6 to
be associated with low larvae survival (P<0.05).
G. mellonella immune response
Melanin production was used as a marker of the G. mellonella immune response. The CFT073
control strain induced melanin production with a mean OD reading of 1.69. The Galleria isolates
induced a mean melanin OD reading ranging from 0-2.32 (Figure 34). Linear regression revealed an
inverse association between larvae survival and melanin production (P<0.0001). In addition, urinary
isolates induced significantly higher melanin production than bloodstream isolates (P=0.04), with

Page | 172
isolates causing UC inducing the highest mean melanin production (OD 1.48), compared with COMP
(OD 0.92) and ABU (OD 0.72) isolates. Of all six known sources of bacteraemia, GU isolates induced
the highest mean melanin production (OD 1.06) and GIT isolates the lowest (OD 0.16).
While not significant, phylogroup B2 isolates induced the highest mean melanin production (OD
0.86), followed by phylogroup A isolates (OD 0.80), compared with phylogroup B1 (OD 0.67) and D
isolates (OD 0.75). Within the five major lineages ST73 isolates induced the highest mean melanin
production (OD 1.38), followed by ST131 (OD 1.09) and ST127 induced the lowest mean melanin
production (OD 0.68). Isolates with a VF score >9 also induced higher mean melanin production (OD
1.14) than isolates with a low VF score (OD 0.92). Virulence factors found to significantly induce
higher melanin production included P-fimbriae (OD 1.13) and OmpT (OD 1.7)(P<0.01).
LDH production was used as a marker of cell damage as a result of ExPEC infection. The CFT073
control strain induced a mean LDH OD reading of 0.34. Mean LDH OD readings ranged between 0.05-
0.98 (Figure 34), but LDH production was found to be unrelated to larvae survival.
LDH production was higher for urinary isolates (OD 0.26 vs. 0.19), particularly COMP isolates (OD
0.28 vs. 0.22 – 0.27); for GU bacteraemia isolates (OD 0.42 vs. 0.09 – 0.25); and for CAIs (OD 0.23 vs.
0.21), but these findings were not significant. However, isolates from men produced significantly
more LDH than isolates from women (OD 0.32 vs. 0.21, P=0.05), despite there being no difference in
melanin production.
Isolates from phylogroups A and B1 induced higher LDH production than isolates from phylogroups
B2 and D. As with melanin, ST73 isolates (OD 0.45) induced the highest LDH production of all the
major lineages, followed by ST131 (OD 0.25), with the remaining generating an LDH OD reading of
0.14-0.15. However, these readings were not significant.
Interestingly, isolates lacking fimH, fyuA (P=0.03), hlyF, hra, ibeA (P=0.04), iss, cvaC, usp and malX
induced higher LDH production than isolates possessing these virulence factors. While possession of
iutA, sat and ompT resulted in higher LDH production compared with isolates that lacked these

Page | 173
virulence factors. Again, however, these findings were not significant. In addition, LDH production
was highly similar between isolates with a high VF score (>9) and those with a low VF score (≤9).

Page | 174
8.4 Discussion points
The three most prevalent PAIs (CFT073 I, CFT073 II and 536 IV) encode four frequently detected
ExPEC virulence factors; pap, hlyA, fyuA and the marker malX. Of these, pap was significantly
associated with low larvae survival, but the others were not.
Urinary isolates, particularly from complicated infections, were associated with higher mortality
rates than bloodstream isolates, in which a GU-source affected the highest mortality compared with
all other sources. Community-associated infections were also linked to high mortality, as was
phylogroup A and ST131 isolates. Notably, urinary isolates, GU-source and ST73 isolates induced a
strong immune response and urinary isolates causing complicated infection, community-associated
isolates and GU-source isolates were associated with high levels of cell damage.
Regarding virulence factors, afa/dra, ompT, serogroups O6 and O25 generated the highest relative
risk ratios and mortality, all of which are associated with ST131, except for O6, which is frequently
identified in ST73 isolates. ST73 isolates and those possessing ompT were also associated with high
levels of cell damage. However, only pap and O6 were significantly correlated with mortality.
In contrast isolates possessing fimH, fyuA, hlyF, hra, ibeA, iss, cvaC, usp or malX were associated with
low levels of cell damage, supporting the idea of a colonisation factor, rather than a virulence factor.
Many of the findings from these assays approached significance, but often the number of isolates
analysed was too small. Subsequent studies analysing a larger sample population would confirm the
significance and validity of these observations. In addition, current and future research involving
whole genome sequencing of ExPEC strains could identify novel virulence factors or genetic
elements associated with urosepsis, severe infection and high mortality.
The G. mellonella infection model provides a simple and effective method for analysing the virulence
of ExPEC strains.

Page | 175
9. General discussion and concluding remarks
The UK ExPEC population
There have been no large-scale investigations of UK ExPEC strains for several years (Lau et al. 2008b)
and recent studies were restricted geographically (Gibreel et al. 2012) and by infection type (Horner
et al. 2014). This study improved on earlier investigations by comparing >1000 urinary and
bloodstream isolates, collected from around the UK and Republic of Ireland, between January 2011
and March 2012. As expected the patient populations were similar for these two infection types and
the distribution of phylogenetic groups was consistent with previous studies (Banerjee et al. 2013a;
Bukh et al. 2009). However, there were some variations in age, sex, clonal composition and
serogroup depending on whether the isolate caused a UTI or bacteraemia.
There was no change, from previous studies, in the patient demographics for urinary strains (Bean et
al. 2008; Foxman, 2002; Kahlmeter, 2003; Linhares et al. 2013), with the majority (89%) causing CAIs,
isolated from female patients (84%) aged 21-50 years (55%), with an average age of 40 years. This is
unsurprising given the common, tedious nature of UTIs and empirical management, which lends to
this infection being diagnosed more frequently in community clinics, GP practices or out-patient
departments (Bean et al. 2008; Denes et al. 2012; Leydon et al. 2009).
In contrast to female patients, the average age of men presenting with a UTI was higher (62 years)
and the frequency of UTIs in men increased with age, likely a result of the increased risk of
prostatitis and instrumentation (e.g. catheter) in this age group (Cornia et al. 2006; Etienne et al.
2008; Lipsky, 1999). Otherwise the demographics of men presenting with UTI was similar to recent
UK and European studies (Bean et al. 2008; den Heijer et al. 2013; Koeijers et al. 2010; Marschall et
al. 2013). The most recent UK study of UTI in children was conducted in Staffordshire (Chakupurakal
et al. 2010), reporting approximately 72 paediatric UTIs each year, predominantly in girls. A study in
London found 10% (n=1227) of urinary isolates were from patients <16 years (Bean et al. 2008),

Page | 176
although the distribution according to patient sex was unknown. Similar to these studies, 8% of
urinary strains here were isolated from patients aged <18 years, with the majority from girls.
The lack of sufficient clinical information often made it difficult to determine the UTI type caused by
the isolates. Together with the criteria for collecting urinary strains, some bias was introduced
during isolate collection. Lack of good clinical information supplied with study isolates led to all
asymptomatic bacteruria isolates, except one, being collected from asymptomatic pregnant women
screened for UTI at their initial antenatal visit. Uncomplicated infections affect both men and
women (Bean et al. 2008; Kahlmeter, 2003), but the controversy surrounding the classification of UTI
in men (it is assumed that men have an anatomical or structural abnormality resulting in infection)
led to isolates from male patients being classified as complicated (SIGN, 2006; Lipsky, 1989).
Therefore, all uncomplicated isolates, by default, were from female patients only. Further analysis of
the clinical information from male patients identified 32/82 (39%) with symptoms of cystitis only and
the majority aged 50–78 years (56%), suggesting that approximately 40% of men diagnosed with a
UTI have an uncomplicated infection. However, without a complete patient history it cannot be
confirmed that these male patients lacked an abnormality, co-morbidity or other complication that
would alter their UTI diagnosis. In patients <18 years old complicating factors included urosepsis or
recurrent infection, but in adults additional factors included immunocompromising conditions,
surgery and instrumentation, suggesting that environmental and host factors are more influential in
adult UTIs, but also more common in this age group. Despite the overall isolate collection bias,
especially towards uncomplicated cystitis isolates, these strains were typical of the reported patient
population (Den Heijer et al. 2010; Foxman et al. 2000; Kahlmeter, 2003).
ExPEC causing bacteraemia also reflected recent studies, being isolated almost equally from male
and female patients, predominantly aged >60 years and prevalence of bacteraemia increased with
patient age (Alhashash et al. 2013; Health Protection Agency, 2011; Schlackow et al. 2012; Wester et
al. 2013; Williamson et al. 2013b). Similar to urinary isolates the majority were CAIs (67%). Despite
the collection process for the local bacteraemia strains being skewed toward urinary-source strains,

Page | 177
the non-biased BSAC (Reynolds et al. 2008) strains still revealed the genitourinary tract to be the
most common source of infection (39%), as identified in multiple UK and European studies (Bukh et
al .2009; Horner et al. 2014; Laupland et al. 2008; Wester et al. 2013).
Interestingly, respiratory-source strains were more common in male patients than female patients. It
is possible that this is due to aspiration pneumonia (Wei et al. 2013) and community-acquired
pneumonia (Millett et al. 2013; van Gageldonk-Lafeber et al. 2013) occurring more frequently in
men or that the respiratory tract infection was reported as the most common HAI in the UK (Health
Protection Agency, 2012c). However, this is unclear here without further investigation of patient
histories. Genitourinary, gastrointestinal and respiratory-source isolates were predominantly
isolated from patients aged 61–90 years, demonstrating the high number of patients presenting with
bacteraemia between these ages and the increased likelihood of co-morbidity at this age (Wester et
al. 2013).
There has been no major change in the phylogroups dominating ExPEC strains in the UK (Cooke et al.
2010). Phylogroups B2 and D were most prevalent in all infection types, with a higher proportion of
these two groups in bloodstream isolates than urinary isolates (89% versus 82%). The success of
these groups was affirmed by the prevalence of the five major lineages ST131, ST95, ST127, ST73 (all
B2) and ST69 (D), which have been reported as frequent causes of extra-intestinal infections in the
UK and around the world over the last few years (Abraham et al. 2012; Banerjee et al. 2013a; Horner
et al. 2014; Johnson et al. 2011; Skjot-Rasmussen et al. 2012b). These lineages were identified in a
similar proportion of urinary (40%) and bloodstream (44%) isolates, which supports the notion of
urinary strains spreading to the bloodstream and causing infection. Occasionally (2%) strains of
these sequence types were detected in other phylogroups (e.g. ST131/D, ST127/A, ST95/D,
ST69/B1), as identified previously (Johnson et al. 2008b; Molina-Lopez et al. 2011). These rare strains

Page | 178
likely display traits of these sequence types, but differ enough to be distinguished, such as EAEC
strains (ST69/A) with clonal group A (CgA) characteristics that occasionally cause UTIs, but were
absent in this study (Olesen et al. 2012; Wallace-Gadsden et al. 2007).
Regarding infection type, ST95 and ST127 were uniformly distributed among bloodstream and
urinary isolates, suggesting universal adaption to multiple anatomical sites or lack of site-specific
virulence factors. ST95 strains are known to cause avian and human extra-intestinal infections, with
virulence factors (ibeA) enabling invasion of the brain endothelium (Homeier et al. 2010). This
confirms the former conclusion, that these sequence types possess universal virulence factors, as
ST95 strains appear specifically adapted to brain tissue, but also possess some of the adhesins and
toxins that allow colonisation of the urinary tract or bloodstream (Mora et al. 2009). In addition,
ST95 was responsible for the only CSF-source bloodstream isolate in this study, also supporting these
conclusions. ST127 isolates are reported to possess a high number of virulence factors (Gibreel et al.
2012), but are more closely linked to infections in dogs than humans (Johnson et a.l 2008b),
suggesting this even distribution among extra-intestinal infections is due to low adaptation to
human anatomical sites, which is overcome by the virulence factors present .
In contrast ST131 and ST73 were more frequently detected in bloodstream isolates. This mirrors a
recent study from Nottingham, UK (Alhashash et al. 2013). However, another study from the same
region reported ST73 as the predominant clone causing bacteraemia (Horner et al. 2014). The
former study investigated isolates from HAIs only, while the latter study included both CAIs and
HAIs, demonstrating that ST131 is more successful in the hospital setting, while ST73 is better
adapted for success in the community. The success of ST73 in the community is confirmed by
another study of UPEC in Manchester, UK, which identified this sequence type as the most prevalent
in urinary isolates also (Gibreel et al. 2012).
Unsurprisingly ST69 was more frequently detected in urinary isolates than bloodstream isolates. As a
clone originally identified in college women with uncomplicated cystitis (Manges et al. 2001), studies

Page | 179
from around the world indicate that ST69 has remained a significant cause of UTIs (Banerjee et al.
2013a; Dias et al. 2009; Johnson et al. 2011). In conjunction with ST95 these two clones were
responsible for the majority of ABU, UC and COMP isolates, reaffirming the adaption of these
lineages to the urinary tract.
The geographical spread and distribution of the major lineages around the UK was surprising. As a
well characterised multi-drug resistant clone, it was assumed that ST131 would be the most
common lineage in bloodstream isolates in each region and country of the UK. However, this was
only observed for London, the South-West of England and Wales. The office of National Statistics
(http://www.neighbourhood.statistics.gov.uk/) reports that Wales has a higher proportion of people
aged >65 years (19.1%) compared with England (16.9%). In addition, of all nine regions of England,
the South-West also has the highest proportion of people aged >65 years (20.3% vs. 11.3-18.2%). As
this aged population is the most frequently affected by E. coli bacteraemia, it is possible that ST131
is prevalent in these regions due to the larger susceptible population. ECDC data also reports that
more quinolones are prescribed in Wales than in England, which may be driving the success of ST131
in this country also (European Centre for Disease Prevention and Control, 2013a).
Also of note was the lack of ST69 in Welsh and Scottish isolates. However, as a predominantly
uropathogenic clone it is possible that this lineage is not as well adapted for the bloodstream and
limited use of trimethoprim in treating UTIs in these countries may prevent this clone from
becoming established in these communities and spreading to the bloodstream (Johnson et al. 2011).
Defying the general phylogenetic consensus, an unusual phylogroup PCR profile (gadA+, chuA-, yjaA+,
TspE4.C2+) was identified in this study. Though uncommon, two other studies have reported this
unique profile (Mendonca et al. 2011; Skjot-Rasmussen et al. 2013). Contrary to these previous
reports and the hypothesis that this phylotype was related to ST127, the UK isolate belonged to a
novel sequence type, ST3679, and serogroup O18ab. In addition, PFGE analysis (Figure 15) revealed
just 40% DNA relatedness between this strain, the four major phylogroups and five major lineages of
Page | 180
this study, indicating a non-ST127 origin. It is possible that this phylotype represents an atypical
ExPEC strain or is not ExPEC in origin, as all E. coli strains and pathotypes share 40% of their core
genome (Welch et al. 2002).
Serotyping can facilitate identification of new ExPEC clones, but this method is usually limited to
reference facilities and characterisation of small research collections (Blanco et al. 1997; Loos et al.
2012), with serotyping of ExPEC strains typically focused on internationally recognised clones (Blanco
et al. 2011; Johnson et al. 2006). This potentially reduces detection of atypical clonal isolates and full
understanding of the ExPEC population. A benefit of such a large isolate collection included the
detection of twenty-one novel ExPEC serogroups in this study, as well as 14 serogroups previously
unlinked to the five major clones. Conversely, 14 well-known ExPEC serogroups were frequently
(61%) identified in urinary and bloodstream isolates and dominated the five major clones, such as
ST95-O2, ST73-O6 and ST131-O25 (Ananias and Yano, 2008; Blanco et al. 2011; Emanghoraishi et al.
2011; Johnson et al. 2008b; Kudinha et al. 2013b; Lau et al. 2008b; Manges et al. 2008; Melzer et al.
2008; Skjot-Rasmussen et al. 2012a). Serogroup O6 in particular has been identified as an important
colonisation factor of the urinary tract, with an additional role in serum resistance (Sarkar et al.
2014). Therefore, it is possible that the other common O-antigens have similar functions. Together
these results demonstrate the serogroup diversity within ExPEC and confirm the clonal success of
many ExPEC strains. Other important serogroups of note included O7 and O75 (Johnson et al. 2006;
Platell et al. 2011), which were not identified in the five major clones, but were identified in
urosepsis isolates of ST62 and ST404, both of which are recognised ExPEC clones (Alhashash et al.
2013; Berman et al. 2014). This observation reaffirms the role of serotyping in identifying clinically
significant clones when molecular methods, such as MLST, may be unavailable.
Analysis of the paired urosepsis isolates demonstrated the success of the five major ExPEC lineages
and identified other clones circulating within the UK; ST354, ST404, ST405, ST62, ST14 and ST617
(Alhashash et al. 2014; Horner et al. 2014; Matsumura et al. 2012; Mora et al. 2011; Novais et al.

Page | 181
2013; Smet et al. 2010). ST1405 was also detected, but little was discovered about this sequence
type except its association with asymptomatic bacteruria (http://mlst.ucc.ie/mlst accessed 26th
March 2014), highlighting the importance of understanding ExPEC as a whole, as it cannot be
guaranteed that new sequence types will not become prevalent in the future. Generally urosepsis
was caused by one strain, however, one patient in this study was simultaneously infected with two
different strains (ST14/B2 and ST354/D). It is possible that this phenomenon occurs more frequently
in E. coli infections than reports suggest (Clermont et al. 2013b; Leflon-Guibout et al. 2002),
especially with the tendency in diagnostic microbiology to select one colony forming unit for
identification and analysis if all colonies appear the same. In these cases one strain may benefit from
the virulence repertoire expressed by the other strain, despite being avirulent or antibiotic
susceptible. This type of symbiotic relationship is particularly evident in biofilms and intracellular
communities (Blango and Mulvey, 2010). In the future it would be interesting to analyse multiple E.
coli colonies from urosepsis patients to determine whether there are any strains or clones that
function together.
In summary, this study has confirmed the findings of previous studies by observing no major change
in the UK patient population susceptible to E. coli bacteraemia and UTIs (Bean et al. 2008; Health
Protection Agency, 2011). Although, this study does provide the supporting information necessary
for classification of UTIs in men to be more defined. In contrast the ExPEC population in the UK is
highly diverse, as demonstrated by phylogroup, serogroup, sequence type and PFGE, despite the
dominance of the five major ExPEC clones. It is also apparent that the clonal composition of UK
isolates differs from other international studies, demonstrating the importance of local routine
monitoring of E. coli, not just in bacteraemia, but also UTIs, the most common bacterial infection in
the community. With the variation in prescribing practices around the world, it is important to
understand how this diversity affects antibiotic resistance and to determine whether standard
empirical therapy remains valid.

Page | 182
Antibiotic resistance in Escherichia coli causing urinary tract infections and bacteraemia, in East
London and across the UK
Comparison of antibiotic resistance data from this study with published studies reveals resistance
rates to have increased in E. coli (Bean et al. 2008; Health Protection Agency, 2011; Kahlmeter and
Poulsen, 2012; Schito et al. 2009), but without any recent or large-scale studies in the UK, it is
difficult to understand the changes in urinary isolates on a national level.
The Infectious Diseases Society of America (IDSA) has suggested that antibiotics with resistance rates
≥20% should no longer be prescribed, so as to prevent selection of resistant strains and to minimise
the risk of treatment failure (Gupta et al. 2011). If this recommendation was adopted, ampicillin,
amoxicillin-clavulanate (augmentin), trimethoprim and trimethoprim-sulfamethoxazole should no
longer be prescribed for the eradication of UTIs and bacteraemia caused by ExPEC in the UK. Within
urinary isolates this high prevalence of resistance was multi-factorial, attributable in part to two
ExPEC clones, clonal group A/ST69 (58% trimethoprim-resistant) and ST131 (66% ciprofloxacin-
resistant, 62% trimethoprim-resistant), plus the recommended use of trimethoprim-
sulfamethoxazole (uncomplicated cystitis) and ciprofloxacin (complicated cystitis/pyelonephritis)
which now appear to be inappropriate given these high resistance rates and associated clonal
resistance (Gupta et al. 2011; Johnson et al. 2011; Johnson et al. 2010; SIGN, 2006; Barts and the
London Trust Antimicrobial Review Group, 2011).
Fortunately nitrofurantoin resistance has remained low (1%), possibly due to the negative impact on
bacterial fitness and lack of plasmid-mediated resistance genes targeting this antibiotic (Sandegren
et al. 2008; Whiteway et al. 1998). In addition, nitrofurantoin is highly effective against ESBL-
producing isolates (Fournier et al. 2013; Livermore et al. 2011; Sahm et al. 2001), making this
antibiotic a viable option for first-line treatment of lower UTIs. Despite 29% of urinary isolates
demonstrating amoxicillin-clavulanate resistance, this antibiotic combination could still be used for
lower UTIs, including those caused by ESBL-producing isolates and infections in pregnant women.
Clavulanate achieves a high concentration in the bladder, enabling eradication of E. coli with an

Page | 183
amoxicillin/clavulanate MIC of 64/32 mg/L (Alou et al. 2006). EUCAST has now adjusted its clinical
breakpoints accordingly (The European Committee on Antimicrobial Susceptibility Testing, 2014) and
repeat analysis of the UC study isolates resulted in a shift in resistance rates from 29% to 0%, while
ABU resistance rates changed from 28% to 0% also. In children, Chakupurakal et al (2010)
recommended cefalexin as first-line UTI treatment due to the ampicillin and trimethoprim resistance
in this population. Results from this study support this suggestion. For multi-drug resistant isolates
that express ESBLs, such as ST131 strains, a carbapenem would be effective (Fournier et al. 2013).
Especially as carbapenem resistance was rarely reported in UK E. coli during this study, despite the
circulation of carbapenemase enzymes within this species (Hopkins et al. 2014; Woodford et al.
2013). However, recent data from Public Health England (Personal communication with Prof. Neil
Woodford, September 2014) suggests this low level carbapenem resistance won’t last and this
proposed treatment of multi-drug resistant isolates will need to be revisited in the future.
Antibiotic resistance in bloodstream isolates was higher than urinary isolates, increasing 2-8-
fold in the presence of ESBLs, but comparable to recent UK and European bacteraemia reports
(European Centre for Disease Prevention and Control, 2012; European Centre for Disease Prevention
and Control, 2013b; Horner et al. 2014). However, resistance to the cephalosporins (10%),
ciprofloxacin (21%) and aminoglycosides (11 – 26%) was often higher in these UK strains, likely as a
result of the higher proportion of ST131 strains causing bacteraemia. A recent UK study linked rising
antibiotic resistance to the increasing number of E. coli bacteraemias (Schlackow et al. 2012).
Therefore, it is important that regular monitoring of prescribing practices and infection control
policies is performed alongside antibiotic resistance surveillance, to prevent further increases in
antibiotic resistance and empirical therapy becoming redundant. Until this happens temocillin and
carbapenems are currently recommended as alternative antibiotic options for eradicating multi-drug
resistant ExPEC strains causing bacteraemia (Fournier et al. 2013; Livermore et al. 2011). Another
factor in treating bacteraemia is targeting the source of infection, to prevent repeat infection of the
bloodstream and to ensure that the prescribed antibiotics will reach effective concentrations at both
Page | 184
sites. The genitourinary tract was the most common source of bacteraemia in this study and
urosepsis can be prevented by improving UTI management. One Danish study indicated that higher
resistance in their community-associated urosepsis isolates was due to high prescribing in the
community (Skjot-Rasmussen et al. 2012a). However, in this study hospital-associated bloodstream
isolates were more resistant than the community-associated isolates, suggesting this principle is not
applicable here, but revision of prescribing practices may reduce the number of E. coli isolates that
go on to cause urosepsis and reduce antibiotic resistance (Livermore et al. 2013).
The BSAC bacteraemia isolates revealed regional variations in antibiotic resistance that could
not be completely explained by antibiotic prescription data (Health Protection Agency, 2008). The
recent English surveillance programme for antimicrobial utilisation and resistance report from Public
Health England reveals a north/south divide in antibiotic consumption in England, with a higher
number of prescriptions in the North (Public Health England, 2014a). However, the lack of national
guidelines for empirical treatment of E. coli bacteraemia lends to clinicians prescribing antibiotics
based on their experience, medical specialty and local hospital guidelines, which can vary from
clinician to clinician (McNulty et al. 2003). Although in London and the South-West of England, the
high rates of cephalosporin and fluoroquinolone resistance are likely to be a direct result of the
ST131 prevalence in these regions. On a national level, possible reasons for high rates of resistance
to cephalosporins, aminoglycosides (both Wales), cefoxitin (Republic of Ireland) and
chloramphenicol (Scotland) may include the high prevalence of ST131 (Wales), circulation of AmpC
beta-lactamases (Ireland), co-circulation of plasmid-mediated resistance determinants in animal
strains (all), the use of chloramphenicol-medicated feed for farm animals (Scotland) and, for the
South-West and Yorkshire and Humber regions, high prescriptions of ciprofloxacin and
trimethoprim, respectively. Although further investigation would be required to confirm these
hypotheses (Frye and Jackson, 2013; Public Health England, 2014a; Woodford et al. 2007).

Page | 185
Interestingly, isolates from male patients demonstrated higher rates of resistance compared
with female patients, with particular emphasis on ciprofloxacin resistance. Published studies have
reported similar observations (Bean et al. 2008; Linhares et al. 2013), while others contradict this
finding, likely as a result of differing prescription practices (Den Heijer et al. 2012; SIGN, 2006;
Wagenlehner et al. 2013b). The logical explanation for this finding lies in the infection types and
treatment options for male patients. Prostatitis and bacteraemia occur more frequently in male
patients >50 years (Health Protection Agency, 2011; Lipsky et al. 2010), with the former often
leading to the latter in 46% cases (Etienne et al. 2008). In the UK ciprofloxacin is recommended for
treating prostatitis (SIGN, 2006) leading to selection and expansion of ciprofloxacin-resistant clones,
such as ST131 (Wagenlehner et al. 2013b; Williamson et al. 2013a). In addition, ciprofloxacin is not
the first-line treatment for UTI in female patients and they are not prescribed fluoroquinolones as
frequently as male patients (Den Heijer et al. 2012; Den Heijer et al. 2010; Goettsch et al. 2000;
Linhares et al. 2013). Furthermore, in hospitalised patients ciprofloxacin is avoided to prevent the
development of Clostridium difficile-associated diarrhoea and prescriptions in this setting have
declined over the last few years (Dancer et al. 2013; Public Health England, 2014a).
Much of the resistance observed within UK ExPEC isolates was associated with multi-drug
resistant clones, such as ST131 and ST69, which belong to phylogroups B2 and D, respectively.
However, strains of phylogroup A and B1 were cumulatively more resistant than these virulent
phylogroups. This is likely a result of the low numbers of phylogroup A and B1 strains, plus the
number of ESBLs (n=13) expressed by these isolates, generating disproportionately high resistance
rates.
ESBL prevalence remained low within the urinary (0.6%) and bloodstream (8.8%) isolates (Health
Protection Agency, 2011; Kahlmeter and Poulsen, 2012) and, similar to previous studies, CTX-M-15
was the most frequently detected enzyme (Woodford et al. 2004; Horner et al. 2014; Schito et al.
2009), often in conjunction with OXA-1 and/or TEM-1 (Huang et al. 2012; Karisik et al. 2006; Wang et
al. 2013). It should be noted that approximately 35-88.2% of all E. coli isolates possess the TEM-1

Page | 186
gene, conferring resistance to ampicillin +/- amoxicillin-clavulanate, but in this study only
cephalosporin-resistant isolates were investigated for this gene (Olesen et al. 2004; Perez-Moreno et
al. 2004; Thomson and Amyes, 1993). However, the frequency at which aac(6’)-Ib-cr was detected in
ESBL-producing strains has increased to 59%, compared with the 32-51% reported previously in UK
isolates (Amin and Wareham, 2009; Wu et al. 2013) and was often identified with the widespread
aminoglycoside modifying enzyme aac(3’)-IIa (Jones et al. 2008; Lindemann et al. 2012; Xiao and Hu,
2012). Notably, aac(6’)-Ib-cr was not found in phylogroup D strains, along with ESBLs, indicating that
the prevalence of these resistance determinants was directly attributable to ST131 strains and the
multi-drug resistance plasmids they possess (Calhau et al. 2013; Chmielarczyk et al. 2013; Olesen et
al. 2013). In addition, isolates lacked 16S rRNA methyltransferases, which confer pan-resistance to
aminoglycosides, confirming that this pan-resistance was a result of multiple AME possession and/or
loss of an aminoglycoside transport system or change in membrane potential. It is these additional
mechanisms, along with efflux pumps, change in membrane permeability and mutations in the 16S
rRNA that likely confer aminoglycoside non-susceptibility in the AME-negative/aminoglycoside-
resistant isolates (Ramirez and Tolmasky, 2010). Few E. coli isolates are reported to possess qnrS,
qepA or oqxAB (Jones et al. 2008; Kirchner et al. 2011), as confirmed by the results of this study.
While these genes may benefit other Enterobacteriaceae, such as Klebsiella species (Deepak et al.
2009; Younes et al. 2011), they are likely redundant in E. coli that possess mutations in the DNA
gyrase gene and/or aac(6’)-Ib-cr , as these are sufficient to raise the MICs for survival in the presence
of fluoroquinolones (Johnson et al. 2013; Kim et al. 2013).
Despite this concerning increase in resistance to empirical therapy, a significant proportion
of urinary isolates displayed susceptibility profiles that should have resulted in effective eradication
of the infection according to current guidelines. In addition, several antibiotic candidates have been
identified (e.g. nitrofurantoin, fosfomycin) that could be routinely employed for empirical treatment
of multi-drug resistant UTI and bloodstream isolates. Also concerning was the discrepancies
between the antibiotic susceptibility testing methods evaluated as part of this study (disc diffusion,

Page | 187
MicroScan and agar dilution), suggesting that antibiotic resistance may be under-reported. However,
MICs here are unlikely to be 100% representative of the community and nosocomial ExPEC
population, given the lack of good quality clinical information accompanying patient specimens and
the typical reasons for referral of urinary isolates (e.g. treatment failure, recurrent infection,
complication). Much of the antibiotic resistance seen in these UK isolates could be attributed to
major ExPEC clones, especially ST131, which was likely a major contributor. To ensure that this
increasing tide in resistance can be controlled, or even reduced, therapeutic strategies targeting the
multi-drug resistant clones need to be developed, such as rapid diagnostic tests, as well as changes
in prescribing practices which select for these strains.
The UK ST131-O25b clone
Many studies of antibiotic resistance in ExPEC have focused on the ST131 clone (Kudinha et al.
2013a; Liss et al. 2013; Matsumura et al. 2013). This multi-drug resistant clone emerged in the early
2000s, becoming a significant cause of UTIs and bacteraemia, while providing a challenge to
empirical antibiotic therapy (Nicolas-Chanoine et al. 2008; Peirano and Pitout, 2010). However, in
the last few years studies have concentrated on the H30 sub-clade, identified by sequencing of the
fimH gene, and its associated fluoroquinolone resistance and ESBL expression (Banerjee et al. 2013b;
Peirano and Pitout, 2014; Price et al. 2013). Therefore, it was important to identify and characterise
ST131 strains in the UK and establish how they related to previous studies and this new sub-clade.
Multiple PCRs, SNP analyses and sequencing methods have been employed to identify ST131 strains
(Blanc et al. 2014; Dahbi et al. 2013; Olesen et al. 2013). In this study a sequence type PCR (Doumith
et al. 2014) was evaluated as a simple method to identify strains belonging to this clone, which was
in turn validated using the published pabB SNP PCR (Dhanji et al. 2010). Serogrouping, fimH
sequencing and antibiotic resistance further differentiated UK ST131 strains into three sub-clones
based on the presence (clonal) or absence (non-clonal) of both pabB SNPs, then by the presence or
absence of ESBLs (Table 27).

Page | 188
Sub-clone ST131 SNPs ESBL FQ-R1 X X X X2 X X X3 X
Table 27 Algorithm for identification of UK ExPEC strains belonging to the three ST131 sub-clones
ST131 as determined by sequence type PCR, presence of SNPs determined by real-time PCR, ESBLs
identified by PCR and DNA sequencing and fluoroquinolone resistance (FQ-R).
ST131 was the most frequently detected ExPEC clone in this study and dominated bloodstream
isolates (19%), which emulates recent UK and international studies (Horner et al. 2014; Johnson et
al. 2010; Kang et al. 2013; Kudinha et al. 2013a). However, ST131 (8%) was not the dominant clone
in urinary isolates, being surpassed by ST95 (11%) and ST69 (10%), although urinary ST131 strains
were mostly isolated from complicated cystitis/pyelonephritis infections. This trend in infection type
can be explained by the antibiotic resistance of ST131. UK clonal ST131 strains demonstrated 62%
and 77% resistance to trimethoprim and ciprofloxacin, respectively, rendering empirical UTI therapy
with these antibiotics mostly ineffective (Gupta et al. 2011; SIGN, 2006). This ability to overcome
first-line therapy can result in ascension to the kidneys and initiation of a more severe infection (e.g.
bacteraemia), which is facilitated by the possession of virulence factors (Rogers et al. 2011). The
proportion of ciprofloxacin resistance observed here was much higher than recent studies from
Europe and North America reporting 26%-40% (Blanco et al. 2011; Chmielarczyk et al. 2013; Colpan
et al. 2013), although some studies have reported 93%-100% resistance (Dahbi et al. 2013; Olesen et
al. 2013), but these focused on the ESBL-producing variants of the clone.
The prevalence of CTX-M genes in UK ST131 isolates was also higher (31% vs. 10%-12%) than similar
studies describing ST131 strains (Blanco et al. 2011; Platell et al. 2011) and 92% of CTX-M-positive
isolates belonged to the newly designated H30-R sub-clone (Price et al. 2013), with the R
representing ciprofloxacin resistance. The dominance of CTX-M-15 in these UK strains, reflects the
successful circulation of this ESBL in the UK (Woodford et al. 2004; Gibreel et al. 2012), but CTX-M-

Page | 189
14 and CTX-M-27 genes were also detected; a feature reported in Danish ST131 isolates also (Olesen
et al. 2013). CTX-M-27 is derived from CTX-M-14 (alanine->glycine substitution at position 725),
sharing >98% amino acid identity, and is one of few CTX-M genes with a D240G (aspartic acid-
>glycine) substitution along with CTX-M-15; together demonstrating the conserved nature of ESBL
possession in E. coli strains (Bonnet et al. 2003; Bonnet, 2004). These CTX-M genes, except two,
were encoded on IncF plasmids of FIA or FIA-FIB allelic combinations, many of which have not been
described in this clone (http://pubmlst.org/plasmid/). The two exceptional strains carried IncU
plasmids and were thought to encode CTX-M-15, the first description of this plasmid type in ST131
strains from the UK, however these plasmids were recently described in ST131 strains from Japan
(Matsumura et al. 2013). Associated with qnrS genes and identified in multi-drug resistant
Aeromonas species (Cattoir et al. 2008; Picao et al. 2008), the IncU plasmids identified here also
encoded TEM-1, OXA-1 and aac(6’)-Ib-cr, typical of resistance plasmids in ST131 strains (Dahbi et al.
2013; Matsumura et al. 2012).
Long established as an identifying feature of the ST131 clone, the O25b antigen was detected in
100% of UK H30-R isolates, as well as in ciprofloxacin-susceptible and non-H30 strains. In contrast to
previous studies, (Dahbi et al. 2013; Kudinha et al. 2013a; Matsumura et al. 2013; Olesen et al. 2013)
O16 was identified in non-clonal isolates only, all of which were ciprofloxacin-susceptible and CTX-
M-negative. Importantly, three serogroups novel to ST131 strains within the UK and around the
world, were identified (O19a, O136 and O153). These serogroups have been reported in E. coli
(Ananias and Yano, 2008; Croxen et al. 2013; Staaf et al. 1999) and, like the IncU plasmids, were
likely acquired as a result of the plastic nature of the E. coli genome, by horizontal gene transfer of
plasmids or high-frequency recombination events of chromosomal DNA fragments (Wiesner et al.
2013; Brouwer et al. 2013; Chewapreecha et al. 2014).
Further evidence of the expansion of this sub-clone lies in analysis of the fimH alleles. Historically the
H22 allele dominated ciprofloxacin-susceptible ST131 strains (Johnson et al. 2013). However, H30
was just as prevalent in ciprofloxacin-susceptible strains here, suggesting that the H30-R sub-clone

Page | 190
may soon encompass all clinically isolated ST131 strains, especially if the use of fluoroquinolones is
not restricted further.
Despite the expansion and spread of H30-R ST131 isolates PFGE revealed great heterogeneity, with
just 40% DNA relatedness. This differs to previous reports of ST131 strains being highly related
(>60%), although these reports were limited geographically (Colpan et al. 2013; Gibreel et al. 2012;
Johnson et al. 2009a; Lau et al. 2008a; Liss et al. 2013), whereas these UK isolates represent the
national diversity of ST131. In addition, there was no clustering of traits such as CTX-M genes,
serogroups and fimH alleles, as seen in previous studies (Lau et al. 2008a; Price et al. 2013). Together
these results revealed how ST131 strains have evolved significantly since the first report of this
emerging clone (Nicolas-Chanoine et al. 2008) and vary from country to country, despite retaining
the molecular traits specifically attributed to this clone. These results also suggest that PFGE should
no longer be used to compare such geographically-widespread ST131 collections, given this
heterogeneity and the over-complicated characterisation of this clone. Peirano and Pitout (2010)
suggested that only the sequence type, ST131, characterized this clone, with sub-clades comprising
ciprofloxacin-resistant and/or CTX-M-15 strains. Although, this was before the discovery of ST131-
O16 strains and identification of the H30 fimH allele (Johnson et al. 2013; Matsumura et al. 2012).
Despite these novel attributes of ST131 strains, results from this study support Peirano’s statement
(see Table 26 above). However, it is important that the algorithm is re-visited regularly as new traits
are identified within this clone.
CTX-M production was always accompanied by ciprofloxacin resistance in this clone (Banerjee and
Johnson, 2014), but CTX-M-negative ST131 isolates may also be ciprofloxacin-resistant. Therefore,
antibiotic susceptibility needs to be determined before antibiotics can be prescribed rationally to
eradicate clonal isolates and prevent treatment failure, except for bacteraemic patients where rapid
treatment is required. Development of a point-of-care test that identifies this clone, in a similar
manner to urine dipsticks or pregnancy tests, would enable rapid identification of ciprofloxacin-
resistant ST131 strains in patients presenting to their GP with a UTI and, potentially, patients with

Page | 191
bacteraemia presenting to accident and emergency departments. It would also facilitate appropriate
antibiotic therapy, which in turn would reduce treatment failure and the need to re-visit the GP, as
well as prevent the infection ascending to the kidneys and causing bacteraemia. A test that targeted
ST131, cefotaxime resistance (as a marker of ESBL) and ciprofloxacin resistance would enable
identification of all clonal isolates and distinction of the sub-clades. These patients could then be
treated with appropriate antibiotics such as nitrofurantoin (lower UTI) or a carbapenem
(bacteraemia or upper UTI) (Gupta et al. 2007; Takahashi et al. 2009).
Further analysis of this clone, such as examination of the virulence determinants possessed by ST131
strains and the three sub-clones, may help explain the diversity of this clone, whether the ‘limited
profile’ in CTX-M-positive strains (i.e. O25b, ciprofloxacin resistant, H30) includes their virulence
repertoire and if these determinants explain the invasiveness of the ST131 clone.
ExPEC virulence determinants
In this study an E. coli genotyping microarray was used to simultaneously investigate the antibiotic
resistance determinants, serotypes and virulence repertoire of 95 ExPEC isolates. Unfortunately this
array did not perform as expected, producing multiple false-positive and false-negative signals, as
determined by comparison with data for the same isolates from published PCRs and their MICs. This
is not the first time that discrepant results have been reported with these arrays (Dierikx et al. 2012;
Geue et al. 2010; Geue et al. 2014; Schilling et al. 2012). Possible reasons include microarray printing
errors, inefficient primers, excess DNA and low temperatures resulting in non-specific hybridisations,
inefficient washing during the hybridisation process, stability of stored reagents and inefficient
labelling (Eads et al. 2006). The microarray assay was performed according to the manufacturer’s
instructions, using the reagents and protocols recommended at the time. However, subsequent to
this work being performed, Alere Technologies updated the array (http://alere-
technologies.com/en/products/lab-solutions/e-coli) and removed several targets. These included cif,
vat, tsh, sat and iha. In this evaluation sat, tsh and iha were not detected in 34 isolates by the

Page | 192
microarray, while cif and vat were frequently detected by the microarray (n=62), demonstrating
poor specificity, despite the VF PCRs demonstrating contradictory results. Although removal of non-
specific targets may improve the performance of the microarray, this does not explain all the
ambiguous results. Raising the signal value cut-off above that recommended by the manufacturer
(e.g. ≥0.5) has been used by some researchers to reduce discrepancies (Wagner, 2012). However,
raising the signal value cut-off did not improve the microarray results in this study. Problems with
DNA-based microarray platforms have been reported, suggesting that at present this technology can
be problematic for analysing the genetic content of bacterial strains (Bogaerts et al. 2011; Cohen et
al. 2010; Nijhuis et al. 2011). Fortunately, whole genome sequencing has advanced in recent years
and may provide an improved technique for evaluating the gene content of ExPEC isolates
(Subashchandrabose et al. 2013).
The VF PCR assays provided an improved method for investigating the VF content of these strains, by
including a higher number of ExPEC, DEC and APEC VFs that have been reported in ExPEC strains
(Johnson and Stell, 2000). In addition, these assays have been used by multiple international
research groups, confirming their reliability (Banerjee et al. 2013b; Blanco et al. 2013; Lopez-Banda
et al. 2014; Santos et al. 2013).
The majority (94%) of isolates analysed were classified as ExPEC, according to the characteristic VFs
fimH, pap, fyuA, iutA, kpsMTII, traT and usp, and this proportion was in agreement with similar
studies (Cooke et al. 2010; Micenkova et al. 2014; Oteo et al. 2014; Piatti et al. 2008). However, in
contrast to the minimum ExPEC profile defined by Johnson and Stell, hlyD and malX were less
frequently detected and usp has become more prevalent (Johnson and Stell, 2000). Notably, the 6%
of isolates that lacked the characteristic VFs were generally avirulent (maximum 3 VFs), collected
from patients with a complication (diabetic, catheter) and mostly belonged to phylogroup A,
suggesting their success was a result of patient compromise rather than virulence. Overall, the UK
ExPEC strains demonstrated great variety in their VF repertoire, with the major ExPEC lineages also

Page | 193
differing in their VF content compared to internationally characterised strains (Manges et al. 2001;
Platell et al. 2011).
As well as possessing the highest VF score of the four phylogroups, phylogroup B2 isolates also
demonstrated the highest prevalence of pathogenicity islands (PAI). As reported by Calhau et al
(2013), CFT073 I, CFT073 II and 536 IV were frequently identified together within these isolates.
These islands encode pap, hlyA, sat, fyuA and malX, supporting the notion that high numbers of PAIs
and prevalent virulence factors go hand in hand (Dobrindt et al. 2002; Guyer et al. 2000; Parham et
al. 2005a; Guyer et al. 1998). Another interesting observation from this study was the association of
536 III with ST127-O6 isolates. This PAI encodes sfa and tsh, of which sfa has been linked to ST127-
O6 isolates and was identified in these UK strains (Dobrindt et al. 2002; Johnson et al. 2008b).
Based on infection-specific differences, virulence factors could be sub-divided into colonisation
factors and virulence factors. Identified in 94% of isolates, fimH, fyuA, iutA, kpsMTII, traT and usp
could be considered ExPEC colonisation factors. The role of fyuA as a colonisation factor was
supported by Johnson and Stell (2000), who identified the importance of fyuA in compromised and
non-compromised patients. In this study fyuA was equally as prevalent as traT (66%), which was
common to both urinary and bloodstream isolates. Furthermore, fyuA was lacking in the paired
urosepsis isolates, advocating a colonisation role, along with fimH which was also less prevalent
(81% vs. 95-100%) than previous studies (Cooke et al. 2010; Johnson et al. 2005b; Norinder et al.
2011).
Whereas iha and sat were prevalent in both UC and GU isolates, indicating a role in ExPEC virulence
in UTIs and bacteraemia, which has been confirmed by the presence of these determinants in EHEC
O157:H7, EAEC causing UTIs and the ST131 H30-Rx sub-clone (Banerjee et al. 2013b; Bielaszewska et
al. 2011; Olesen et al. 2012).
In urosepsis isolates (COMP and GU), pap, afa/dra and ompT were more frequently detected
compared to isolates from other infection types and sources of infection, indicating a urosepsis-
Page | 194
specific virulence role. As discussed, fyuA and fimH were surprisingly lacking, suggesting a
colonisation role. One study suggested that pap was required for urosepsis development (Venier et
al. 2007). However, a more recent study suggested that both pap and afa/dra are required for the
translocation of E. coli from the urinary tract to the bloodstream (Szemiako et al. 2013), as observed
here. Interestingly, another study reported pap to be more prevalent in community-associated
urosepsis isolates, compared with hospital-associated urosepsis isolates (Skjot-Rasmussen et al.
2012a), but this may be a result of UTIs presenting predominantly in the community (Bean et al.
2008) and the increased role of catheters in hospital-acquired infections (Melzer and Welch, 2013)
ruling out the need for conventional adhesins. Johnson et al (2008a) also demonstrated the
importance of ompT in bacteraemia, with 22% of faecal isolates and 82% of bloodstream isolates
encoding this protein, as well as the majority of American ST131 clonal isolates (Colpan et al. 2013;
Johnson et al. 2010). Paired urosepsis isolates were mostly of the same strain, but there were
differences between the virulence factors detected in urinary and bloodstream isolates. It is possible
that these discrepancies actually represent multiple variants of an ExPEC strain simultaneously
causing infection (Clermont et al. 2013b; Leflon-Guibout et al. 2002) or, that during translocation to
the bloodstream, there has been a change in or acquisition of genetic material that improves
invasiveness (Mahjoub-Messai et al. 2011; Szemiako et al. 2013).
As with previous reports, there was an inverse relationship between VF score and Abx score (Cooke
et al. 2010; Piatti et al. 2008), confirming that the success of ExPEC relies on either virulence or
antibiotic resistance, but generally not both. The high VF score of phylogroup B2 isolates was likely
partly due to the major ExPEC clones within this group (Gibreel et al. 2012b), especially as the seven
VFs that characterised 94% of UK ExPEC strains were highly prevalent within ST131, ST95, ST73 and
ST127 strains. However, virulence profiles specific to these clones (ST131 and ST69) differed to
previous reports (Clark et al. 2012; Johnson et al. 2012a; Manges et al. 2001; Platell et al. 2011),
demonstrating the temporal and geographical variation in ExPEC strains (Table 28). In particular,

Page | 195
ST73 and ST95 isolates possessed the highest number of VFs (n=12) compared with the infamously
virulent ST131 clone, which possessed fewer (n=10). Sub-clonal differences in ST131 isolates
provided insight into this virulent clone. The non-clonal isolate lacked adhesins seemingly important
in virulence (afa/dra and pap), while the clonal-ESBL+ isolates demonstrated lower VF scores, as
expected, but possessed pap and iha, suggesting these adhesins compensated for the lack of
virulence factors in highly resistant strains. However, all three sub-clones included a high proportion
of isolates with usp and traT, indicating that these two virulence factors are important in ST131
success. Unfortunately recent ST131 studies have focused primarily on the H30-Rx clone, so it would
be interesting to investigate these three sub-clones further, such as in an in vivo model, to provide
insight into the importance of these virulence factors within the sub-clones.
Table 28 Virulence profiles identified in UK isolates of five major ExPEC clones. Virulence factors
included in the profile are detected in ≥70% isolates of each clone.
Clone Virulence factor profileST131 fimH iha iutA kpsII traT usp ST127 fimH pap cnf1 usp pks malXST95 fimH pap fyuA usp pks malXST73 fimH pap sfa/foc iha iutA usp pksST69 fimH pap fyuA iutA sat traT ompT
The unusual phylotype isolate was investigated for virulence factors as another means to determine
relatedness to ExPEC and ST127. This isolate possessed ten virulence factors included in the PCR,
including the ExPEC defining fimH, pap, iutA, traT and malX, confirming that this isolate likely
belongs to this pathotype (Johnson and Stell, 2000). Analysis of ST127 strains revealed the majority
(7/9 analysed) to possess fimH, pap, usp, pks and malX, as detected in this novel isolate. However,
this strain also possessed iha, sat, ireA, iutA and traT, which were less common in ST127, but have
been detected frequently in other ExPEC clones. Together these findings suggest that this isolate is
potentially a rare hybrid of clones, seen in a similar manner with the recent E. coli O104 outbreak

Page | 196
strain (Bielaszewska et al. 2011) or is a novel ExPEC variant that has acquired virulence factors
commonly detected in other sequence types. The intestines act as a melting pot for E. coli strains
and pathotypes, enabling regular sharing of genetic material, therefore, it is possible that this
unusual phylotype will become more prevalent and expand, just as the major ExPEC clones have. For
example, pic and EAST1 were detected in a few ExPEC isolates in this study, highlighting the
increasing trend of EAEC traits in ExPEC isolates (Olesen et al. 2012; Toval et al. 2014), as a result of
the sharing of genetic material between E. coli pathotypes.
Bacteraemia isolates with a GIT-source likely originate from commensal or avirulent E. coli in the
intestines (Bokranz et al. 2005; Johnson et al. 1998). With this in mind, it could be argued that
isolates with a VF score higher than that of GIT-source isolates (>9) be considered virulent. Closer
analysis of the UK ExPEC isolates revealed that 69/154 (45%) of isolates had a VF score >9, of which
63/69 (91%) were phylogroup B2 and 62/69 (90%) belonged to one of the major ExPEC lineages.
Therefore, it could be assumed that the remaining 55% of isolates, which are seemingly less virulent,
caused infection in the presence of host compromise, antibiotic selection or other environmental
factors or were caused by a commensal isolate of phylogroup A/B1. But this was unfounded, with
many of these less virulent isolates including major ExPEC clones (ST69, ST95, ST131) or causing
urosepsis. Therefore, invasiveness and success seems multi-factorial.
In summary, results from this study demonstrated the link between high VF scores and strain
variables, such as phylogroup B2 and ST73, while high resistance scores were linked to male
patients, those aged >50 years and bloodstream isolates. Colonisation factors enable ExPEC to infect
the urinary tract and, occasionally, the bloodstream, but specific virulence factors are required for
urosepsis. As the UK ExPEC population has evolved and diversified, its virulence factor repertoire has
also changed, with different pathotypes and clones sharing virulence factors that facilitate success.
In order to understand and confirm the importance of these virulence factors, a selection of these
strains were analysed in an invertebrate infection model.

Page | 197
ExPEC virulence in G. mellonella
Mortality effected by the 40 ExPEC isolates was highly varied; however, particular patient and strain
features were significantly associated with larvae mortality.
Isolates from female patients, UTIs and community-associated infections (CAI) all effected slightly
higher mortality compared with isolates from male patients, the bloodstream and hospital-
associated infections (HAI). More significant than these were isolates of GU-source (100%), ST131
(78%), SSTI-source (76%), complicated UTIs (72%) and phylogroup A (72%), which effected the
highest mortality and relative risk ratios of ≥5.40.
The urinary tract has been identified as the most common source of bacteraemia in the UK (Horner
et al. 2014; Livermore et al. 2008). Notably GU isolates also induced the strongest immune response
(high melanin) and the most cell damage (high LDH), of all bacteraemia sources, supporting the
notion of urosepsis as a severe and often fatal infection, often mediated by an overwhelming
immune response (Knowles et al. 2014; Ku et al. 2013; Melzer and Petersen, 2007; Wagenlehner et
al. 2013a). Analysis of the urinary isolates identified those causing complicated infections to induce
high levels of cell damage, which would be required for transmission to the bloodstream, whereas
isolates from uncomplicated cystitis induced a strong immune response that would result in
eradication from the bladder. This digression among urinary isolates could possibly be explained by
UC isolates expressing more immunogenic virulence factors (Brumbaugh et al. 2013), which initiated
a strong immune response, compared with the immune evasion factors expressed by COMP and GU
isolates, such as capsules and serum resistance proteins (Sarkar et al. 2014; Ulett et al. 2013).
Interestingly, isolates from male patients produced significantly more cell damage compared with
isolates from female patients, whereas isolates from female patients effected higher mortality. The
high levels of cell damage associated with isolates from men is probably linked to the high LDH levels
induced by COMP isolates, as men tend to present with complicated UTIs, such as prostatitis which is
more common in older men (Kizilbash et al. 2013; Koeijers et al. 2010; Lipsky, 1999). The higher

Page | 198
mortality observed with female patients is likely due to a specific strain characteristic or virulence
factor that is more frequently encountered in women than men. It was thought that pap may be the
responsible virulence factor, but statistical analysis revealed no association between pap and female
patients. However, pap was significantly associated with CAIs and GU isolates (P<0.01), both of
which were also associated with female patients (P<0.01). It is also possible that the higher mortality
associated with strains from female patients is due to an unknown genetic trait that has yet to be
identified and could be explored in future studies.
The extensive virulence factor repertoire of phylogroup B2 isolates explains the strong immune
response observed with this phylogroup, compared with groups A, B1 and D. However, mortality
was significantly higher with phylogroup A isolates (72%), compared with phylogroup B2 (58%), even
though phylogroup A isolates possessed a lower VF score. This difference can be explained by LDH
production, which was higher with isolates of phylogroups A and B1, compared with groups B2 and
D, indicating that cell damage plays an important role in larvae mortality, as purported by Wand et al
(2013) with clinically important Klebsiella strains. These findings also suggest that it is not the
possession of multiple virulence factors that affect mortality, but other genetic or clonal features.
It was no surprise that ST131 isolates, of all the major ExPEC lineages, effected the highest mortality,
as this clone is known to be highly pathogenic and transmissible (Colpan et al. 2013; Price et al.
2013). However, it was isolates of ST73 that induced the strongest immune response and cell
damage, closely followed by ST131 isolates. The virulence of these two lineages may also explain the
higher mortality associated with CAIs, rather than HAIs, as both ST131 and ST73 were more
prevalent in CAIs in this study. The increased invasiveness of ST73 isolates observed here, compared
with ST131, could also explain the high proportion of ST73 isolates causing bacteraemia around the
UK (Horner et al. 2014). However, an alternative hypothesis is the role of O-antigens in the virulence
of these lineages. Serogroups O6 and O25 are frequently detected in ST73 and ST131 isolates
respectively (Dahbi et al. 2013; Johnson et al. 2008b). The O6 antigen has recently been reported as
Page | 199
an important colonisation factor of the urinary tract, with an O6-associated insertion sequence (IS1)
specifically linked to this virulence (Alghoribi et al. 2014; Sarkar et al. 2014). In support, this study
identified isolates of serogroup O6 to affect the highest mortality (93%); second only to afa/dra
(97%) of all the virulence factors, with O25 isolates affecting much lower mortality (78%). Lack of this
insertion sequence would also explain the low mortality of ST127 isolates, which also encode the O6-
antigen (Johnson et al. 2008b), but future work would need to confirm this.
In addition to afa/dra, the other virulence factor affecting significantly high mortality, and also cell
damage, was ompT (87%). Both of these factors were significantly associated with urosepsis isolates
(see section 7.3) and have been associated with the ST131-O25b clone, which could explain the high
mortality associated with this lineage (Colpan et al. 2013; Dahbi et al. 2013; Platell et al. 2011). Of all
the fimbriae detected pap was significantly associated with high mortality (72% vs. 3-63%), a strong
immune response and was another virulence factor linked to urosepsis in this study. Together these
data confirm that pap, afa/dra and ompT are undoubtedly essential in extra-intestinal infection,
particularly urosepsis, as demonstrated in previous studies (Johnson et al. 2005b; Kariyawasam et al.
2006; Mahjoub-Messai et al. 2011; Santos et al. 2013; Skjot-Rasmussen et al. 2012b; Szemiako et al.
2013; Tarchouna et al. 2013).
In contrast, fimH and fyuA, which were the two most common virulence factors in urinary isolates,
were not associated with mortality, a strong immune response or cell damage; confirming their role
as colonisation factors. Yersiniabactin (fyuA) has been linked to patient mortality (Mora-Rillo et al.
2013), but this study did not support this association. 536 IV, the pathogenicity island which encodes
fyuA, was frequently detected alongside the islands CFT073 I and CFT073 II, as observed in this study
(Calhau et al. 2013). However, the combination of these three islands did not affect significantly high
mortality, nor did the virulence factors frequently encoded by these islands; hlyA, iha, sat and iutA,
except pap; although iutA and sat were associated with significant cell damage. Interestingly, the
pathogenicity islands 536 II and 536 III were associated with high mortality compared to all other

Page | 200
islands. Loss of the 536 III PAI from ST127 strains has been linked to decreased virulence. It was
hypothesised that loss of the iroN gene, located on this island, caused this drop in virulence, but
future work would need to confirm the effect of this island and associated genes on ExPEC virulence
(Tourret et al. 2010).
Analysis of the virulence factors on 536 II and 536 III found no evidence to support this finding,
suggesting that this associated mortality was due to the genomic content or clonal features of
isolates encoding these islands, rather than specific virulence factors.
Other determinants associated with low levels of cell damage included hlyF, hra, usp, ibeA, iss, cvaC
and malX, suggesting these factors also function during colonisation rather than as virulence factors.
A study comparing ExPEC with non-ExPEC also suggested that iss and cvaC were not associated with
virulence (Santos et al. 2013), while the frequent detection of malX in GIT-source isolates and those
causing asymptomatic bacteruria, conditions generally associated with less virulent ExPEC, also
implies that malX is no longer a marker of virulence.
Despite the range in mortality, larvae death was not associated with one specific, universal virulence
factor. This is particularly apparent with phylogroup B2 isolates, which were frequently reported as
expressing a high number of virulence determinants, but did not affect significantly higher mortality
than the other major phylogroups. Similarly, a recent Danish study investigating mortality of patients
with urosepsis found no association with specific virulence factors or antimicrobial resistance (Skjot-
Rasmussen et al. 2012a). Notably, ST131 isolates were associated with significantly high mortality,
but few possessed afa/dra or ompT, which were also linked to mortality. Another important feature
of ST131, compared to the other major lineages, is that these isolates often have a high VF score and
a high Abx score, despite previous studies reporting virulence and resistance to be inversely related
(Banerjee et al. 2013b; Cooke et al. 2010; Ewers et al. 2010). This suggests that virulence and
mortality, particularly with ST131 isolates, is clonal and determined by particular genomic fragments
Page | 201
or genetic make-up, which together confer ExPEC virulence, rather than antibiotic resistance alone
or a specific virulence factor repertoire.
Williamson et al (2014) were the first group to publish their findings on ExPEC virulence in the G.
mellonella model. While they found that this model correlated well with the mouse model and that
high aggregate VF scores were associated with mortality, they were limited by their sample
population. This study has improved on their initial work by analysing isolates in this model with
respect to phylogroup, lineage, patient demographics and various virulence factors. However, more
remains to be done to understand the virulence of ExPEC.
Next-generation sequencing has recently entered the forefront of diagnostic and research
microbiology (Bialasiewicz et al. 2014; Skurnik et al. 2013; Underwood et al. 2013), providing greater
understanding of clinically important ExPEC clones, such as ST131 (McNally et al. 2013). The
combination of next-generation sequencing and a much larger G. mellonella study could confirm the
findings reported here, but also determine whether the hypothesis that virulence and mortality of
ExPEC is clonal and not defined by one sole variable or feature, is valid.

Page | 202
Concluding remarks
ExPEC remains the most significant cause of urinary tract infections and bacteraemia, in the UK and
around the world. However, the diversity of ExPEC strains causing these infections makes antibiotic
therapy problematic and vaccine development challenging. This study aimed to improve on current
UK and international ExPEC data by: defining the UK ExPEC population and the patient population
affected; establishing the antibiograms for urinary and bloodstream isolates; determining the
prevalence and characteristics of the ST131 clone in the UK; and defining the virulence factors
required for causing the major ExPEC infections; UTI, bacteraemia and urosepsis. It is hoped that
results from this study will inform future vaccine development, therapeutic guidelines and facilitate
development of diagnostic tests.
This is the first UK study to analyse such a large collection of ExPEC strains, by phylogroup, sequence
type, serogroup and virulence factors. The findings of this study agreed with many long established
trends in ExPEC, but also identified a number of unique findings.
In agreement with previous studies, it was found that uncomplicated cystitis typically
affected women, aged 21-50 years in the community, while UTIs in men occurred later in life and
was typically complicated in nature, likely due to prostatitis in this age group. Bacteraemia, however,
affected both sexes equally, predominantly in those aged >60 years, and with the genitourinary tract
the most frequent source of infection. Phylogroup B2 strains remained predominant in UK ExPEC
infections, followed by phylogroup D. The major ExPEC clones ST131, ST127, ST95, ST73 and ST69
accounted for ≥40% of UK isolates, with ST131 and ST95 the most prevalent types in bloodstream
and urinary tract infections, respectively. This finding contrasts with recent UK studies which found
ST73 to be the most frequent sequence type causing these infections (Gibreel et al. 2012; Horner et
al. 2014), but this might be a result of ST131 becoming more dominant in the interim.
This large-scale study led to identification of 21 serogroups previously unreported in ExPEC,
as well as 14 serogroups novel to the major ExPEC clones ST131, ST127, ST95, ST73 and ST69. The
internationally recognised ST131 clone is known for possessing a few characteristic traits, including

Page | 203
serogroups O25 and O16 (Johnson et al. 2010). However, UK ST131 isolates possessed serogroups
previously unreported in this clone, including O19a, O136 and O153, suggesting that UK ST131
isolates are more diverse and have evolved differently from ST131 strains in North America, for
example.
Novel to this UK study, an isolate of unknown phylotype was identified. Though reported in
Portugal and Denmark (Mendonca et al. 2011; Skjot-Rasmussen et al. 2013), this variant (of ST3679)
had not been recognised in the UK until now. Unlike these previous studies, this strain could not be
linked to ST127 isolates, indicating that it might belong to an unknown clone or possibly a novel
pathotype that combines intestinal and extra-intestinal traits, similar to Enteroaggregative E. coli
strains with traits of clonal group A (CgA) (Wallace-Gadsden et al. 2007).
Importantly, antibiotic resistance has increased in the ExPEC population, despite the
decreased use of specific antibiotic classes (e.g. cephalosporins, ciprofloxacin). For example,
comparison of BSAC isolates collected in 2006 with those collected in 2011 revealed that
ciprofloxacin resistance had increased from 19% to 21% and gentamicin resistance had increased
from 9% to 12%. However, cefotaxime resistance has remained stable, at 11% (Health Protection
Agency, 2011). Within urinary E. coli, ampicillin resistance has increased from 55% to 74%,
trimethoprim resistance has increased from 40% to 47%, ciprofloxacin resistance has remained
relatively stable at 12%, but nitrofurantoin resistance has decreased from 6% to 1% (Bean et al.
2008). Some of the increased resistance can be attributed to the circulation of multi-drug resistant
clones, such as ST131-O25 and ST69-CgA. However, this study identified a high number of ESBLs in
phylogroup A isolates, suggesting that phylogroup A isolates contribute significantly to the increased
resistance, despite previously reports suggesting these isolates were antibiotic susceptible (Johnson
et al. 2003; Kawamura-Sato et al. 2010). ST617, of phylogroup A, was identified in a patient with
urosepsis in this study and possessed an ESBL. This sequence type has been reported as a frequent
carrier of ESBLs, indicating that ExPEC studies shouldn’t limit themselves to the highly prevalent
clones (ST131, ST127, ST95, ST73 and ST69), but also consider those associated with multi-drug

Page | 204
resistance (Kang et al. 2013; Novais et al. 2012; Peirano et al. 2012). The decrease in nitrofurantoin
resistance is interesting. However, this study compared multiple antibiotic susceptibility testing
methods and found that disc diffusion often identified isolates as nitrofurantoin-resistant, but MICs
revealed them to be susceptible; indicating that this decrease in resistance is actually an artifact of
two non-comparable testing methods. In addition, the regional variation in antibiotic resistance of
bloodstream isolates indicates that a national guideline for E. coli bacteraemia is urgently required
to decrease antibiotic resistance, decrease the use of last-line antibiotics and introduce formal
stewardship of antibiotic prescribing (Public Health England, 2014a). This study also highlighted the
importance of conducting regular surveillance of antibiotic resistance in urinary E. coli. As an E. coli
UTI can lead to bacteraemia and urosepsis, it would be logical to target the E. coli before it reaches
the bloodstream. By reviewing regional and national antibiotic resistance on an annual basis, or
semi-regularly, results would inform local resistance rates and prescribing practices, as well as
update treatment guidelines accordingly.
Empirical prescribing is one of the possible reasons that the ST131-O25b clone is able to
succeed. Another is the ability to evolve and acquire new virulence factors that facilitate infection
and success. These UK ST131 isolates possessed many characteristics of this clone, including H30-Rx
and CTX-M-15. However, one UK isolate possessed a fimH allele typically associated with ST95 (H27)
and two other isolates possessed IncU plasmids. These features have not been reported in UK strains
and, until recently, IncU plasmids were limited to an ST131-O16 isolate in Japan and multi-drug
resistant Aeromonas species (Cattoir et al. 2008; Matsumura et al. 2013; Picao et al. 2008; Price et
al. 2013; Weissman et al. 2012). However, this may be because UK studies have not performed such
a thorough molecular analysis. The virulence factor repertoire of this clone also varied in the UK,
compared with earlier studies in the UK, Europe and Australia, with fyuA, ompT and malX lacking,
but iha, iutA and traT highly prevalent and important (Clark et al. 2012; Mora et al. 2014; Platell et
al. 2011).
Page | 205
In addition to ST131, the virulence factors that define UK ExPEC differ slightly to those
identified by Johnson and Stell (Johnson and Stell, 2000). In the UK, fimH, fyuA, hlyD and malX are
less prevalent, while afa/dra, iha, sat and iroN seem more important in ExPEC infections, particularly
those caused by the major clones. This is partially in agreement with another UK study conducted in
Manchester in 2011, which identified fyuA, hlyD and malX in <50% of isolates (Gibreel et al. 2012).
This study was one of the first in the UK to analyse a selection of ExPEC strains in the Galleria
mellonella model. This analysis confirmed that fyuA and fimH are commensal factors required for
establishing an infection, but not the development of severe infections. In addition, this virulence
model identified ST131 isolates and serogroup O6 as ExPEC variables associated with increased
mortality. The latter finding is in agreement with a study conducted in Manchester, which identified
an insertion sequence in the O6-antigen operon of these virulent isolates. The authors linked ST127
isolates to high mortality, compared with isolates of the other major clones, including ST131, as a
result of the O6-specific insertion sequence (Alghoribi et al. 2014). While these two studies are
conflicting, together they highlight the heterogeneity and virulence of ExPEC, but also the diversity
of these strains within the same country.
This regional variation indicates that ExPEC studies from around the world are not directly
comparable to those conducted in the UK. However, UK studies conducted to date have been limited
by their sample size, the range of virulence factors that were investigated and the degree of
molecular exploration. Therefore, it is important to review the local resistance and virulence of
ExPEC, rather than assuming all ExPEC populations are the same.

Page | 206
Key findings from this study
In the UK, E. coli bacteraemia affects both men and women equally.
Resistance has increased to first-line (trimethoprim) and second-line (ciprofloxacin and
gentamicin) antibiotics used to treat urinary tract infections.
ST131 and ST95 are the most frequent clones causing bacteraemia and urinary tract
infections, respectively.
UK ST131 isolates are largely similar to those described in North America, except that IncU
plasmids and serogroups O19a, O136 and O153 have also been identified here.
Type 1 fimbriae and yersiniabactin are not essential for severe ExPEC infection, while P-
fimbriae and serogroup O6 are associated with mortality.
Future work
This study has increased the knowledge of ExPEC within the UK, but also on an international level.
However, it is important that the findings from these studies are confirmed and explored further.
Therefore, future work to expand on this study is described below:
1. Virulence – use whole genome sequencing to confirm the virulence factor, phylogrouping,
serotyping and sequence typing data. This would also generate more accurate phylogeny
data and help characterise the unusual phylotype, plus identify novel virulence factors for
colonisation, infection and those associated with heightened mortality.
2. Serogrouping – Determine the serogroup of the remaining 40% of isolates to reaffirm the
serogroup diversity of ExPEC isolates causing UTIs and bacteraemia.
3. Urinary ExPEC resistance – similar to the BSAC Bacteraemia Resistance Surveillance
Programme, urinary E. coli isolates could be collected from around the UK to monitor trends
in antibiotic resistance. Or centre-focused projects could be set up in a similar manner, with
urine specimens collected directly from GP practices to determine more accurate

Page | 207
community-associated antibiotic resistance rates, as well as cystitis, asymptomatic
bacteruria and pyelonephritis antibiograms.
4. ST131 plasmids – isolate and sequence the ST131 plasmids encoding CTX-M genes to identify
any differences between those encoding different CTX-M groups. Also compare the IncU
plasmids with the IncF plasmids frequently identified in ST131 isolates.
5. ST131 virulence – conduct a larger study in the Galleria mellonella model to confirm the
findings of this study, but also compare sub-clonal ST131 isolates (e.g. CTX-M-negative vs.
CTX-M-positive)
6. ST127 virulence - investigate the O6-associated insertion sequence (IS1), PAI 536 III and iroN
in ST127 isolates, plus the other major clones, to identify any patterns in highly virulent
strains compared with avirulent strains.
7. Develop a point-of-care test for ST131 H30-Rx clone that can be used by GPs, out-patient
departments and accident and emergency departments to guide empirical therapy.
8. Vaccine development – use data from whole genome sequencing with the Galleria
mellonella model to identify potential vaccine targets to prevent E. coli urinary tract
infection.

Page | 208
Bibliography
Abdallah, K.S., Cao, Y., & Wei, D.J. 2011. Epidemiologic investigation of extra-intestinal pathogenic E. coli (ExPEC) based on PCR phylogenetic group and fimH single nucleotide polymorphisms (SNPs) in China. Int.J.Mol.Epidemiol.Genet., 2, (4) 339-353
Abraham, S., Chapman, T.A., Zhang, R., Chin, J., Mabbett, A.N., Totsika, M., & Schembri, M.A. 2012. Molecular characterization of Escherichia coli strains that cause symptomatic and asymptomatic urinary tract infections. J.Clin.Microbiol., 50, (3) 1027-1030
Achtman, M., Kennedy, N., & Skurray, R. 1977. Cell--cell interactions in conjugating Escherichia coli: role of traT protein in surface exclusion. Proc.Natl.Acad.Sci.U.S.A., 74, (11) 5104-5108
Ahmed, A. & Shimamoto, T. 2008. Emergence of a cefepime- and cefpirome-resistant Citrobacter freundii clinical isolate harbouring a novel chromosomally encoded AmpC Beta-lactamase, CMY-37. International J. Antimicrob. Agents., 32, (3) 256-261
Alghoribi, M.F., Gibreel, T.M., Dodgson, A.R., Beatson, S.A., & Upton, M. 2014. Galleria mellonellainfection model demonstrates high lethality of ST69 and ST127 uropathogenic E. coli. PLoS.One., 9, (7) e101547
Alhashash, F., Weston, V., Diggle, M., & McNally, A. 2013. Multidrug-resistant Escherichia colibacteremia. Emerg.Infect.Dis., 19, (10) 1699-1701
Alou, L., Aguilar, L., Sevillano, D., Gimenez, M.J., Cafini, F., Valero, E., Relano, M.T., & Prieto, J. 2006. Urine bactericidal activity against resistant Escherichia coli in an in vitro pharmacodynamic model simulating urine concentrations obtained after 2000/125 mg sustained-release co-amoxiclav and 400 mg norfloxacin administration. J.Antimicrob.Chemother., 57, (4) 714-719
Amin, A. & Wareham, D. 2009. Plasmid-mediated quinolone resistance genes in Enterobacteriaceae isolates associated with community and nosocomial urinary tract infection in East London, UK. International J. Antimicrob. Agents., 34, (5) 490-491
Ananias, M. & Yano, T. 2008. Serogroups and Virulence Genotypes of Escherichia coli isolated from patients with sepsis. Braz. J. Med. Biol. Res., 41, (10) 877-883
Anderson, G.G., Palermo, J.J., Schilling, J.D., Roth, R., Heuser, J., & Hultgren, S.J. 2003. Intracellular bacterial biofilm-like pods in urinary tract infections. Science., 301, (5629) 105-107
Andrejko, M. & Mizerska-Dudka, M. 2012. Effect of Pseudomonas aeruginosa elastase B on level and activity of immune proteins/peptides of Galleria mellonella hemolymph. J.Insect Sci., 12: 88.
Andrews, J.M. 2001. Determination of minimum inhibitory concentrations. J.Antimicrob.Chemother., 48 Suppl 1:5-16., 5-16
Aperis, G., Fuchs, B.B., Anderson, C.A., Warner, J.E., Calderwood, S.B., & Mylonakis, E. 2007. Galleria mellonella as a model host to study infection by the Francisella tularensis live vaccine strain. Microbes.Infect., 9, (6) 729-734
Balsara, Z.R., Ross, S.S., Dolber, P.C., Wiener, J.S., Tang, Y., & Seed, P.C. 2013. Enhanced susceptibility to urinary tract infection in the spinal cord-injured host with neurogenic bladder. Infect. Immun., 81, (8) 3018-3026

Page | 209
Banerjee, R. & Johnson, J.R. 2014. A new clone sweeps clean: the enigmatic emergence of Escherichia coli ST131. Antimicrob. Agents Chemother., 58, (9) 4997-5004
Banerjee, R., Johnston, B., Lohse, C., Chattopadhyay, S., Tchesnokova, V., Sokurenko, E.V., &Johnson, J.R. 2013a. The clonal distribution and diversity of extraintestinal Escherichia coli varies according to patient characteristics. Antimicro. Agents Chemother., 57, (12) 5912-5917
Banerjee, R., Robicsek, A., Kuskowski, M.A., Porter, S., Johnston, B.D., Sokurenko, E., Tchesnokova, V., Price, L.B., & Johnson, J.R. 2013b. Molecular epidemiology of Escherichia coli sequence type 131 and Its H30 and H30-Rx subclones among extended-spectrum-beta-lactamase-positive and -negative E. coli clinical isolates from the Chicago Region, 2007 to 2010. Antimicrob. Agents Chemother., 57, (12) 6385-6388
Barber, A.E., Norton, J.P., Spivak, A.M., & Mulvey, M.A. 2013. Urinary tract infections: current and emerging management strategies. Clin.Infect.Dis., 57, (5) 719-724
Barton, B.M., Harding, G.P., & Zuccarelli, A.J. 1995. A general method for detecting and sizing large plasmids. Anal.Biochem., 226, (2) 235-240
Barts and the London Trust Antimicrobial Review Group. 2011. Adult emperic antibiotic treatment guide.
Bean, D., Krahe, D., & Wareham, D. 2008. Antimicrobial resistance in Community and Nosocomial Escherichia coli Urinary Tract Isolates, London 2005-2006. Ann. Clin. Microbiol. Antimicrob., 7, (13)
Berg, J., Tymoczko, J., & Stryer, L. 2002. Biochemistry, 5th ed. New York, W H Freeman. Chapter 16.
Berman, H., Barberino, M.G., Moreira, E.D., Jr., Riley, L., & Reis, J.N. 2014. Distribution of strain type and antimicrobial susceptibility of Escherichia coli causing meningitis in a large urban setting in Brazil. J. Clin. Microbiol., 52, (5) 1418-1422
Bettelheim, K. 1997, "E. coli in the normal flora of humans and animals," In Escherichia coli: Mechanisms of virulence, M. Sussman, ed., Cambridge: Cambridge University Press, pp. 85-109.
Betts, J.W., Phee, L.M., Woodford, N., & Wareham, D.W. 2014. Activity of colistin in combination with tigecycline or rifampicin against multidrug-resistant Stenotrophomonas maltophilia. Eur.J.Clin.Microbiol.Infect.Dis., 33, (9) 1565-1572
Beutin, L. 1991. The different hemolysins of Escherichia coli. Med. Microbiol.Immunol., 180, (4) 167-182
Bhargava, S., Johnson, B.B., Hwang, J., Harris, T.A., George, A.S., Muir, A., Dorff, J., & Okeke, I.N. 2009. Heat-resistant agglutinin 1 is an accessory enteroaggregative Escherichia coli colonization factor. J.Bacteriol., 191, (15) 4934-4942
Bialasiewicz, S., McVernon, J., Nolan, T., Lambert, S.B., Zhao, G., Wang, D., Nissen, M.D., & Sloots, T.P. 2014. Detection of a divergent Parainfluenza 4 virus in an adult patient with influenza like illness using next-generation sequencing. BMC.Infect.Dis., 14, 275
Bidet, P., Bonacorsi, S., Clermont, O., De, M.C., Brahimi, N., & Bingen, E. 2005. Multiple insertional events, restricted by the genetic background, have led to acquisition of pathogenicity island IIJ96-like domains among Escherichia coli strains of different clinical origins. Infect. Immun., 73, (7) 4081-4087

Page | 210
Bielaszewska, M., Mellmann, A., Zhang, W., Kock, R., Fruth, A., Bauwens, A., Peters, G., & Karch, H. 2011. Characterisation of the Escherichia coli strain associated with an outbreak of haemolytic uraemic syndrome in Germany, 2011: a microbiological study. Lancet Infect.Dis., 11, (9) 671-676
Bingen, E., Picard, B., Brahimi, N., Mathy, S., Desjardins, P., Elion, J., & Denamur, E. 1998. Phylogenetic analysis of Escherichia coli strains causing neonatal meningitis suggests horizontal gene transfer from a predominant pool of highly virulent B2 group strains. J.Infect.Dis., 177, (3) 642-650
Bingen, E.H., Denamur, E., & Elion, J. 1994. Use of ribotyping in epidemiological surveillance of nosocomial outbreaks. Clin.Microbiol.Rev., 7, (3) 311-327
Binns, M.M., Mayden, J., & Levine, R.P. 1982. Further characterization of complement resistance conferred on Escherichia coli by the plasmid genes traT of R100 and iss of ColV,I-K94. Infect. Immun., 35, (2) 654-659
Blanc, V., Leflon-Guibout, V., Blanco, J., Haenni, M., Madec, J.Y., Rafignon, G., Bruno, P., Mora, A., Lopez, C., Dahbi, G., Dunais, B., Anastay, M., Branger, C., Moreau, R., Pradier, C., & Nicolas-Chanoine, M.H. 2014. Prevalence of day-care centre children (France) with faecal CTX-M-producing Escherichia coli comprising O25b:H4 and O16:H5 ST131 strains. J.Antimicrob.Chemother., 69, (5) 1231-1237
Blanco, J., Mora, A., Mamani, R., Lopez, C., Blanco, M., Dahbi, G., Herrera, A., Blanco, J.E., Alonso, M.P., Garcia-Garrote, F., Chaves, F., Orellana, M.A., Martinez-Martinez, L., Calvo, J., Prats, G., Larrosa, M.N., Gonzalez-Lopez, J.J., Lopez-Cerero, L., Rodriguez-Bano, J., & Pascual, A. 2011. National survey of Escherichia coli causing extraintestinal infections reveals the spread of drug-resistant clonal groups O25b:H4-B2-ST131, O15:H1-D-ST393 and CGA-D-ST69 with high virulence gene content in Spain. J.Antimicrob.Chemother., 66, (9) 2011-2021
Blanco, J., Mora, A., Mamani, R., Lopez, C., Blanco, M., Dahbi, G., Herrera, A., Marzoa, J., Fernandez, V., de la Cruz, F., Martinez-Martinez, L., Alonso, M.P., Nicolas-Chanoine, M.H., Johnson, J.R., Johnston, B., Lopez-Cerero, L., Pascual, A., & Rodriguez-Bano, J. 2013. Four main virotypes among extended-spectrum-beta-lactamase-producing isolates of Escherichia coli O25b:H4-B2-ST131: bacterial, epidemiological, and clinical characteristics. J. Clin. Microbiol., 51, (10) 3358-3367
Blanco, M., Blanco, J., Alonso, M., Mora, A., Balsalobre, C., Munoa, F., Juarez, A., & Blanco, J. 1997. Detection of pap, sfa and afa adhesin-encoding operons in uropathogenic Escherichia coli strains: Relationship with expression of adhesins and production of toxins. Res. Microbiol., 148, (9) 745-755
Blango, M. & Mulvey, M. 2010. Persistence of Uropathogenic Escherichia coli in the Face of Multiple Antibiotics. Antimicrob. Agents Chemother., 54, (5) 1855-1863
Blattner, F.R., Plunkett, G., III, Bloch, C.A., Perna, N.T., Burland, V., Riley, M., Collado-Vides, J., Glasner, J.D., Rode, C.K., Mayhew, G.F., Gregor, J., Davis, N.W., Kirkpatrick, H.A., Goeden, M.A., Rose, D.J., Mau, B., & Shao, Y. 1997. The complete genome sequence of Escherichia coli K-12. Science., 277, (5331) 1453-1462
Blum, G., Falbo, V., Caprioli, A., & Hacker, J. 1995. Gene clusters encoding the cytotoxic necrotizing factor type 1, Prs-fimbriae and alpha-hemolysin form the pathogenicity island II of the uropathogenic Escherichia coli strain J96. FEMS Microbiol.Lett., 126, (2) 189-195
Blum, G., Ott, M., Cross, A., & Hacker, J. 1991. Virulence determinants of Escherichia coli O6 extraintestinal isolates analysed by Southern hybridizations and DNA long range mapping techniques. Microb.Pathog., 10, (2) 127-136

Page | 211
Boadi, S., Wren, M.W., & Morris-Jones, S. 2010. Selective testing of ss-galactosidase activity in the laboratory identification of Salmonella and Shigella species. J.Clin.Pathol., 63, (12) 1101-1104
Bogaerts, P., Hujer, A.M., Naas, T., de Castro, R.R., Endimiani, A., Nordmann, P., Glupczynski, Y., & Bonomo, R.A. 2011. Multicenter evaluation of a new DNA microarray for rapid detection of clinically relevant bla genes from beta-lactam-resistant gram-negative bacteria. Antimicrob. AgentsChemother., 55, (9) 4457-4460
Bokranz, W., Wang, X., Tschape, H., & Romling, U. 2005. Expression of cellulose and curli fimbriae by Escherichia coli isolated from the gastrointestinal tract. J.Med. Microbiol., 54, (Pt 12) 1171-1182
Bonnet, R. 2004. Growing group of extended-spectrum beta-lactamases: the CTX-M enzymes. Antimicrob. Agents Chemother., 48, (1) 1-14
Bonnet, R., Recule, C., Baraduc, R., Chanal, C., Sirot, D., De, C.C., & Sirot, J. 2003. Effect of D240G substitution in a novel ESBL CTX-M-27. J.Antimicrob.Chemother., 52, (1) 29-35
Bonnin, R.A., Poirel, L., Carattoli, A., & Nordmann, P. 2012. Characterization of an IncFII plasmid encoding NDM-1 from Escherichia coli ST131. PLoS.One., 7, (4) e34752
Bouza, E., Burillo, A., & Munoz, P. 2002. Catheter-related infections: diagnosis and intravascular treatment. Clin.Microbiol.Infect., 8, (5) 265-274
Boyd, E.F. & Hartl, D.L. 1998. Chromosomal regions specific to pathogenic isolates of Escherichia colihave a phylogenetically clustered distribution. J.Bacteriol., 180, (5) 1159-1165
Brouwer, M., Roberts, A., Hussain, H., Williams, R., Allan, E. & Mullany, P. 2013. Horizontal gene transfer converts non-toxigenic Clostridium difficile strains into toxin producers. Nat. commun., 4, 2601
Brumbaugh, A.R. & Mobley, H.L. 2012. Preventing urinary tract infection: progress toward an effective Escherichia coli vaccine. Expert.Rev.Vaccines., 11, (6) 663-676
Brumbaugh, A.R., Smith, S.N., & Mobley, H.L. 2013. Immunization with the yersiniabactin receptor, FyuA, protects against pyelonephritis in a murine model of urinary tract infection. Infect. Immun., 81, (9) 3309-3316
BSAC. BSAC Methods for antimicrobial susceptibility testing. 10.2. 2011.
Bukh, A., Schonheyder, H., Emmersen, J., Sogaard, M., Bastholm, S., & Roslev, P. 2009. Escherichia coli phylogenetic groups are associated with site of infection and level of antibiotic resistance in community-acquired bacteraemia: a 10 year population-based study in Denmark. J. Antimicrob.Chemother., 64, (1) 163-168
Butler, C., Dunstan, F., Heginbotham, M., Mason, B., Roberts, Z., Hillier, S., Howe, R., Palmer, S., & Howard, A. 2007. Containing antibiotic resistance: decreased antibiotic-resistant coliform urinary tract infections with reduction in antibiotic prescribing by general practices. Br. J. Gen. Pract., 57, (543) 785-792
Cagnacci, S., Gualco, L., Debbia, E., Schito, G., & Marchese, A. 2008. European emergence of ciprofloxacin-resistant Escherichia coli clonal groups O25:H4-ST 131 and O15:K52:H1 causing community-acquired uncomplicated cystitis. J. Clin. Microbiol., 46, (8) 2605-2612
Page | 212
Calhau, V., Ribeiro, G., Mendonca, N., & Da Silva, G.J. 2013. Prevalent combination of virulence and plasmidic-encoded resistance in ST 131 Escherichia coli strains. Virulence., 4, (8) 726-729
Caprioli, A., Falbo, V., Roda, L.G., Ruggeri, F.M., & Zona, C. 1983. Partial purification and characterization of an escherichia coli toxic factor that induces morphological cell alterations. Infect.Immun., 39, (3) 1300-1306
Carattoli, A., Bertini, A., Villa, L., Falbo, V., Hopkins, K.L., & Threlfall, E.J. 2005. Identification of plasmids by PCR-based replicon typing. J.Microbiol.Methods, 63, (3) 219-228
Cattoir, V., Poirel, L., Aubert, C., Soussy, C.J., & Nordmann, P. 2008. Unexpected occurrence of plasmid-mediated quinolone resistance determinants in environmental Aeromonas spp. Emerg.Infect.Dis., 14, (2) 231-237
Cattoir, V., Poirel, L., Rotimi, V., Soussy, C., & Nordmann, P. 2007. Multiplex PCR for detection of plasmid-mediated quinolone resistance qnr genes in ESBL-producing enterobacterial isolates. J.Antimicrob. Chemother., 60, 394-397
Cavaco, L., Hasman, H., Xia, S., & Aarestrup, F. 2009. qnrD, a novel gene conferring transferable quinolone resistance in Salmonella enterica serovar Kentucky and Bovismorbificans strains of human origin. Antimicrob. Agents Chemother., 53, (2) 603-608
Cavalieri, S.J., Bohach, G.A., & Snyder, I.S. 1984. Escherichia coli alpha-hemolysin: characteristics and probable role in pathogenicity. Microbiol.Rev., 48, (4) 326-343
Chakupurakal, R., Ahmed, M., Sobithadevi, D., Chinnappan, S., & Reynolds, T. 2010. Urinary tract pathogens and resistance pattern. J. Clin. Pathol., 63, (7) 652-654
Charnock, C., Nordlie, A.L., & Hjeltnes, B. 2014. Toxin production and antibiotic resistances in Escherichia coli isolated from bathing areas along the coastline of the Oslo Fjord. Curr.Microbiol., 69, (3) 317-328
Chattaway, M., Jenkins, C., Ciesielczuk, H., Day, M., DoNascimento, V., Day, M., Rodriguez, I., van Essen-Zandbergen, A., Schink, A., Wu, G., Threlfall, J., Woodward, M., Coldham, N., Kadlec, K., Schwarz, S., Dierikx, C., Guerra, B., Helmuth, R., Mevius, D., Woodford, N., Wain, J., & SAFEFOODERA 2014. Evidence of evolving extraintestinal enteroaggregative Escherichia coli ST38 clone. Emerg.Infect. Dis., 20, (11) 1935-1937
Chewapreecha, C., Harris, S., Croucher, N., Turner, C., Marttinen, P., Cheng, L., Pessia, A., Aanensen, D., Mather, A., Page, A., Salter, S., Harris, D., Nosten, F., Goldblatt, D., Corander, J., Parkhill, J., Turner, P. & Bentley, S. 2014. Nat. Genet. 46, (3) 305-309
Chien, T.I., Lu, J.Y., Kao, J.T., Lee, T.F., Ho, S.Y., Chang, C.Y., Liu, C.W., Lee, C.H., Yan, S.N., Yang, J.Y., Lin, P.C., & Wang, M.J. 2007. Comparison of three automated urinalysis systems--Bayer Clinitek Atlas, Roche Urisys 2400 and Arkray Aution Max for testing urine chemistry and detection of bacteriuria. Clin.Chim.Acta, 377, (1-2) 98-102
Chmielarczyk, A., Pobiega, M., Wojkowska-Mach, J., Romaniszyn, D., Adamski, P., Heczko, P.B., & Bulanda, M. 2013. Molecular epidemiology, plasmid analysis, virulence, and resistance of Escherichia coli isolated from neonatal intensive care units in Poland. Diagn.Microbiol.Infect.Dis., 76, (4) 542-545
Page | 213
Ciesielczuk, H., Hornsey, M., Choi, V., Woodford, N., & Wareham, D. 2013. Development and evaluation of a multiplex PCR for eight plasmid-mediated quinolone resistance determinants. J.Med.Microbiol., 62, (Pt 12) 1823-1827
Clark, A.E., Kaleta, E.J., Arora, A., & Wolk, D.M. 2013. Matrix-assisted laser desorption ionization-time of flight mass spectrometry: a fundamental shift in the routine practice of clinical microbiology. Clin.Microbiol.Rev., 26, (3) 547-603
Clark, G., Paszkiewicz, K., Hale, J., Weston, V., Constantinidou, C., Penn, C., Achtman, M., & McNally, A. 2012. Genomic analysis uncovers a phenotypically diverse but genetically homogeneous Escherichia coli ST131 clone circulating in unrelated urinary tract infections. J.Antimicrob.Chemother., 67, (4) 868-877
Clermont, O., Bonacorsi, S., & Bingen, E. 2000. Rapid and simple determination of the Escherichia coli phylogenetic group. Appl. Environ. Microbiol., 66, (10) 4555-4558
Clermont, O., Gordon, D., Brisse, S., Walk, S., & Denamur, E. 2011a. Characterization of the cryptic Escherichia lineages: rapid identification and prevalence. Environ. Microbiol., 13, (9) 2468-2477
Clermont, O., Christenson, J.K., Denamur, E., & Gordon, D.M. 2013a. The Clermont Escherichia coliphylo-typing method revisited: improvement of specificity and detection of new phylo-groups. Environ.Microbiol.Rep., 5, (1) 58-65
Clermont, O., Glodt, J., Burdet, C., Pognard, D., Lefort, A., Branger, C., & Denamur, E. 2013b. Complexity of Escherichia coli bacteremia pathophysiology evidenced by comparison of isolates from blood and portal of entry within single patients. Int.J.Med.Microbiol., 303, (8) 529-532
Clermont, O., Johnson, J.R., Menard, M., & Denamur, E. 2007. Determination of Escherichia coli O types by allele-specific polymerase chain reaction: application to the O types involved in human septicemia. Diagn.Microbiol.Infect.Dis., 57, (2) 129-136
Clermont, O., Lavollay, M., Vimont, S., Deschamps, C., Forestier, C., Branger, C., Denamur, E., & Arlet, G. 2008. The CTX-M-15-producing Escherichia coli diffusing clone belongs to a highly virulent B2 phylogenetic subgroup. J.Antimicrob.Chemother., 61, (5) 1024-1028
Clermont, O., Olier, M., Hoede, C., Diancourt, L., Brisse, S., Keroudean, M., Glodt, J., Picard, B., Oswald, E., & Denamur, E. 2011b. Animal and human pathogenic Escherichia coli strains share common genetic backgrounds. Infect.Genet.Evol., 11, (3) 654-662
Cohen, S.J., Dierikx, C., Al, N.N., Karczmarek, A., Van Hoek, A.H., Vos, P., Fluit, A.C., Scharringa, J., Duim, B., Mevius, D., & Leverstein-van Hall, M.A. 2010. Rapid detection of TEM, SHV and CTX-M extended-spectrum beta-lactamases in Enterobacteriaceae using ligation-mediated amplification with microarray analysis. J.Antimicrob.Chemother., 65, (7) 1377-1381
Colman, G., Fox, E., Gross, R., Holmes, B., Jenkins, P., Jones, D., Lee, J., Marples, R., Priest, F., Schofield, G., Scruton, M., Skirrow, M., Slack, M., Snell, J., & Willis, A. 1993. Cowan and Steel's manual for the identification of medical bacteria, 3 ed. Cambridge, Cambridge University Press.Chapter 7.
Colpan, A., Johnston, B., Porter, S., Clabots, C., Anway, R., Thao, L., Kuskowski, M.A., Tchesnokova, V., Sokurenko, E.V., & Johnson, J.R. 2013. Escherichia coli sequence type 131 (ST131) sub-clone H30 as an emergent multidrug-resistant pathogen among US veterans. Clin.Infect.Dis., 57, (9) 1256-1265

Page | 214
Cooke, N., Smith, S., Kelleher, M., & Rogers, T. 2010. Major differences exist in frequencies of virulence factors and multidrug resistance between community and nosocomial Escherichia colibloodstream isolates. J. Clin. Microbiol., 48, (4) 1099-1104
Cormican, M., Morris, D., Corbett-Feeeney, G., & Flynn, J. 1998. Extended spectrum beta-lactamase production and fluorquinolone resistance in pathogens associated with community acquired urinary tract infection. Diagn.Microbiol.Infect.Dis., 32, (4) 317-319
Cornia, P.B., Takahashi, T.A., & Lipsky, B.A. 2006. The microbiology of bacteriuria in men: a 5-year study at a Veterans' Affairs hospital. Diagn.Microbiol.Infect.Dis., 56, (1) 25-30
Cowan, S. 1954. A review of names for coliform organisms. Int. J. Syst.Evol. Microbiol., 4, (2) 119-124
Crichton, P. & Old, D. 1985, "Biotyping of E. coli," In The virulence of Escherichia coli, M. Sussman, ed., London: Academic Press Inc.
Croxen, M.A., Law, R.J., Scholz, R., Keeney, K.M., Wlodarska, M., & Finlay, B.B. 2013. Recent Advances in Understanding Enteric Pathogenic Escherichia coli. Clin.Microbiol.Rev., 26, (4) 822-880
Czaja, C.A., Stamm, W.E., Stapleton, A.E., Roberts, P.L., Hawn, T.R., Scholes, D., Samadpour, M., Hultgren, S.J., & Hooton, T.M. 2009. Prospective cohort study of microbial and inflammatory events immediately preceding Escherichia coli recurrent urinary tract infection in women. J.Infect.Dis., 200, (4) 528-536
da Fonseca, E.L., Freitas, F.S., de Amorim, J.C., & Vicente, A.C. 2008. Detection of new arr-4 and arr-5 gene cassettes in clinical Pseudomonas aeruginosa and Klebsiella pneumoniae strains from Brazil. Antimicrob. Agents Chemother., 52, (5) 1865-1867
Dahbi, G., Mora, A., Lopez, C., Alonso, M.P., Mamani, R., Marzoa, J., Coira, A., Garcia-Garrote, F., Pita, J.M., Velasco, D., Herrera, A., Viso, S., Blanco, J.E., Blanco, M., & Blanco, J. 2013. Emergence of new variants of ST131 clonal group among extraintestinal pathogenic Escherichia coli producing extended-spectrum beta-lactamases. Int.J.Antimicrob.Agents, 42, (4) 347-351
Dallenne, C., Da Costa, A., Decre, D., Favier, C., & Arlet, G. 2010. Development of a set of multiplex PCR assays for the detection of genes encoding important B-lactamases in Enterobacteriaceae. J.Antimicrob. Chemother., 65, (3) 490-495
Dancer, S.J., Kirkpatrick, P., Corcoran, D.S., Christison, F., Farmer, D., & Robertson, C. 2013. Approaching zero: temporal effects of a restrictive antibiotic policy on hospital-acquired Clostridium difficile, extended-spectrum beta-lactamase-producing coliforms and meticillin-resistant Staphylococcus aureus. Int.J.Antimicrob.Agents, 41, (2) 137-142
Darouiche, R.O., Thornby, J.I., Cerra-Stewart, C., Donovan, W.H., & Hull, R.A. 2005. Bacterial interference for prevention of urinary tract infection: a prospective, randomized, placebo-controlled, double-blind pilot trial. Clin.Infect.Dis., 41, (10) 1531-1534
De Backer, D., Christiaens, T., Heytens, S., De Sutter, A., Stobberingh, E., & Verschraegen, G. 2008. Evolution of bacterial susceptibility pattern of Escherichia coli in uncomplicated urinary tract infections in a country with high antibiotic consumption: a comparison of two surveys with a 10 year interval. J. Antimicrob. Chemother., 62, (2) 364-368

Page | 215
De Kraker, M.E.A., Jarlier, V., Monen, J.C.M., Heuer, O.E., van de Sande, N., & Grundmann, H. 2012. The changing epidemiology of bacteraemias in Europe: trends from the European Antimicrobial Resistance Surveillance System. Clin. Microb. Infect., 19, (9) 860-868
De, L., V, Bindereif, A., Paw, B.H., & Neilands, J.B. 1986. Aerobactin biosynthesis and transport genes of plasmid ColV-K30 in Escherichia coli K-12. J.Bacteriol., 165, (2) 570-578
Deen, J., von Seidlein, L., Andersen, F., Elle, N., White, N.J., & Lubell, Y. 2012. Community-acquired bacterial bloodstream infections in developing countries in south and southeast Asia: a systematic review. Lancet Infect. Dis., 12, (6) 480-487
Deepak, R.N., Koh, T.H., & Chan, K.S. 2009. Plasmid-mediated quinolone resistance determinants in urinary isolates of Escherichia coli and Klebsiella pneumoniae in a large Singapore hospital. Ann.Acad.Med Singapore., 38, (12) 1070-1073
Del Castillo, F.J., Leal, S.C., Moreno, F., & del, C., I 1997. The Escherichia coli K-12 sheA gene encodes a 34-kDa secreted haemolysin. Mol.Microbiol., 25, (1) 107-115
Dellinger, R.P., Levy, M.M., Rhodes, A., Annane, D., Gerlach, H., Opal, S.M., Sevransky, J.E., Sprung, C.L., Douglas, I.S., Jaeschke, R., Osborn, T.M., Nunnally, M.E., Townsend, S.R., Reinhart, K., Kleinpell, R.M., Angus, D.C., Deutschman, C.S., Machado, F.R., Rubenfeld, G.D., Webb, S., Beale, R.J., Vincent, J.L., & Moreno, R. 2013. Surviving sepsis campaign: international guidelines for management of severe sepsis and septic shock, 2012. Intensive Care Med., 39, (2) 165-228
Den Heijer, C.D., Penders, J., Donker, G.A., Bruggeman, C.A., & Stobberingh, E.E. 2013. The importance of gender-stratified antibiotic resistance surveillance of unselected uropathogens: a Dutch Nationwide Extramural Surveillance study. PLoS.One., 8, (3)
Den Heijer, C.D., van Dongen, M.C., Donker, G.A., & Stobberingh, E.E. 2012. Diagnostic approach to urinary tract infections in male general practice patients: a national surveillance study. Br.J.Gen.Pract., 62, (604)
Den Heijer, C., Donker, G., Maes, J., & Stobberingh, E. 2010. Antibiotic susceptibility of unselected uropathogenic Escherichia coli from female Dutch general practice patients: a comparison of two surveys with a 5 year interval. J.Antimicrob. Chemother., 65, (10) 2128-2133
Denes, E., Prouzergue, J., Ducroix-Roubertou, S., Aupetit, C., & Weinbreck, P. 2012. Antibiotic prescription by general practitioners for urinary tract infections in outpatients. Eur.J.Clin.Microbiol.Infect.Dis., 31, (11) 3079-3083
Dhanji, H., Doumith, M., Clermont, O., Denamur, E., Hope, R., Livermore, D., & Woodford, N. 2010. Real-time PCR for detection of the O25b-ST131 clone of Escherichia coli and its CTX-M-15-like extended-spectrum B-lactamases. Int. J. Antimicrob. Agents, 36, (4) 355-358
Dhanji, H., Doumith, M., Rooney, P.J., O'Leary, M.C., Loughrey, A.C., Hope, R., Woodford, N., & Livermore, D.M. 2011. Molecular epidemiology of fluoroquinolone-resistant ST131 Escherichia coliproducing CTX-M extended-spectrum beta-lactamases in nursing homes in Belfast, UK. J.Antimicrob.Chemother., 66, (2) 297-303
Dias, R., Marangoni, D., Smith, S., Alves, E., Pellegrino, F., Riley, L., & Moreira, B. 2009. Clonal composition of Escherichia coli causing community-acquired urinary tract infections in the state of Rio de Janeiro, Brazil. Microb. Drug Resist., 15, (4) 303-308

Page | 216
Dierikx, C.M., van, D.E., Schoormans, A.H., van Essen-Zandbergen, A., Veldman, K., Kant, A., Huijsdens, X.W., van der Zwaluw, K., Wagenaar, J.A., & Mevius, D.J. 2012. Occurrence and characteristics of extended-spectrum-beta-lactamase- and AmpC-producing clinical isolates derived from companion animals and horses. J.Antimicrob.Chemother., 67, (6) 1368-1374
Dobrindt, U., Blum-Oehler, G., Nagy, G., Schneider, G., Johann, A., Gottschalk, G., & Hacker, J. 2002. Genetic structure and distribution of four pathogenicity islands (PAI I(536) to PAI IV(536)) of uropathogenic Escherichia coli strain 536. Infect. Immun., 70, (11) 6365-6372
Doumith, M., Day, M., Ciesielczuk, H., Hope, R., Underwood, A., Reynolds, R., Wain, J., Livermore, D., & Woodford, N. 2014. Rapid identification of major Escherichia coli sequence types causing urinary tract and bloodstream infections. J. Clin. Microbiol.,epub ahead of print
Doumith, M., Day, M., Hope, R., Wain, J., & Woodford, N. 2012. Improved multiplex PCR strategy for rapid assignment of the four major Escherichia coli phylogenetic groups. J. Clin. Microbiol., 50, (9) 3108-3110
Drawz, S.M. & Bonomo, R.A. 2010. Three decades of beta-lactamase inhibitors. Clin.Microbiol.Rev., 23, (1) 160-201
Dubois, D., Delmas, J., Cady, A., Robin, F., Sivignon, A., Oswald, E., & Bonnet, R. 2010. Cyclomodulins in urosepsis strains of Escherichia coli. J. Clin. Microbiol., 48, (6) 2122-2129
Dubovskiy, I.M., Whitten, M.M., Kryukov, V.Y., Yaroslavtseva, O.N., Grizanova, E.V., Greig, C., Mukherjee, K., Vilcinskas, A., Mitkovets, P.V., Glupov, V.V., & Butt, T.M. 2013. More than a colour change: insect melanism, disease resistance and fecundity. Proc.Biol.Sci., 280, (1763)
Duguid, J.P. & Campbell, I. 1969. Antigens of the type-1 fimbriae of salmonellae and other enterobacteria. J.Med Microbiol., 2, (4) 535-553
Dyer, I.E., Sankary, T.M., & Dawson, J.A. 1998. Antibiotic resistance in bacterial urinary tract infections, 1991 to 1997. West J.Med., 169, (5) 265-268
Eads, B., Cash, A., Bogart, K., Costello, J., & Andrews, J. 2006. Troubleshooting microarray hybridizations. Methods Enzymol., 411, 34-49
el, M.K., Oswald, E., Hernalsteens, J.P., Lintermans, P., & De, G.H. 1994. F17-like fimbriae from an invasive Escherichia coli strain producing cytotoxic necrotizing factor type 2 toxin. Infect.Immun., 62, (6) 2633-2638
Emanghoraishi, F., Farshad, S., & Kalani, M. 2011. Relationship between O serotype and virulent genes in Escherichia coli causing urinary tract infections. Iran. J. Kidney Dis., 5, (4) 234-237
Escobar-Paramo, P., Grenet, K., Le, M.A., Rode, L., Salgado, E., Amorin, C., Gouriou, S., Picard, B., Rahimy, M.C., Andremont, A., Denamur, E., & Ruimy, R. 2004. Large-scale population structure of human commensal Escherichia coli isolates. Appl.Environ.Microbiol., 70, (9) 5698-5700
Etienne, M., Chavanet, P., Sibert, L., Michel, F., Levesque, H., Lorcerie, B., Doucet, J., Pfitzenmeyer, P., & Caron, F. 2008. Acute bacterial prostatitis: heterogeneity in diagnostic criteria and management. Retrospective multicentric analysis of 371 patients diagnosed with acute prostatitis. BMC.Infect.Dis., 8, 12
Page | 217
European Centre for Disease Prevention and Control 2011, Annual Epidemiological Report: Reporting on 2009 Surveillance Data and 2010 Epidemic Intelligence Data Stockholm.http://www.ecdc.europa.eu/en/publications/Publications/1111_SUR_Annual_Epidemiological_Report_on_Communicable_Diseases_in_Europe.pdf
European Centre for Disease Prevention and Control 2012, Antimicrobial resistance surveillance in Europe 2011:Annual report of the European Antimicrobial Resistance Surveillance Network (EARS-NET). http://ecdc.europa.eu/en/publications/Publications/antimicrobial-resistance-surveillance-europe-2012.pdf
European Centre for Disease Prevention and Control 2013a, Point prevalence survey of healthcare-associated infections and antimicrobial use in European acute care hospitals, ECDC, Stockholm.http://www.ecdc.europa.eu/en/publications/Publications/healthcare-associated-infections-antimicrobial-use-PPS.pdf
European Centre for Disease Prevention and Control 2013b, Surveillance of antimicrobial consumption in Europe, 2010 Stockholm.http://www.ecdc.europa.eu/en/publications/Publications/antimicrobial-antibiotic-consumption-ESAC-report-2010-data.pdf
Ewers, C., Grobbel, M., Stamm, I., Kopp, P., Diehl, I., Semmler, T., Fruth, A., Beutlich, J., Guerra, B., Wieler, L., & Guenther, S. 2010. Emergence of human pandemic O25:H4-ST131 CTX-M-15 extended-spectrum-B-lactamase-producing Escherichia coli among companion animals. J. Antimicrob.Chemother., 65, (4) 651-660
Eykyn, S.J., Gransden, W.R., & Phillips, I. 1990. The causative organisms of septicaemia and their epidemiology. J.Antimicrob.Chemother., 25 Suppl C:41-58
Fahey, T., Webb, E., Montgomery, A.A., & Heyderman, R.S. 2003. Clinical management of urinary tract infection in women: a prospective cohort study. Fam.Pract., 20, (1) 1-6
Fournier, D., Chirouze, C., Leroy, J., Cholley, P., Talon, D., Plesiat, P., & Bertrand, X. 2013. Alternatives to carbapenems in ESBL-producing Escherichia coli infections. Med.Mal Infect., 43, (2) 62-66
Foxman, B. 2002. Epidemiology of urinary tract infections: incidence, morbidity, and economic costs. Am. J.Med., 113, (1, Supplement 1) 5-13
Foxman, B., Barlow, R., D'Arcy, H., Gillespie, B., & Sobel, J. 2000. Urinary tract infection: self-reported incidence and associated costs. Ann. Epidemiol., 10, (8) 509-515
Frakking, F.N., Rottier, W.C., Dorigo-Zetsma, J.W., van Hattem, J.M., van Hees, B.C., Kluytmans, J.A., Lutgens, S.P., Prins, J.M., Thijsen, S.F., Verbon, A., Vlaminckx, B.J., Cohen Stuart, J.W., Leverstein-van Hall, M.A., & Bonten, M.J. 2013. Appropriateness of empirical treatment and outcome in bacteremia caused by extended-spectrum-beta-lactamase-producing bacteria. Antimicrob. AgentsChemother., 57, (7) 3092-3099
Fraser, T.N., Avellaneda, A.A., Graviss, E.A., & Musher, D.M. 2012. Acute kidney injury associated with trimethoprim/sulfamethoxazole. J.Antimicrob.Chemother., 67, (5) 1271-1277
Fritsche, T., Castanheira, M., Miller, G., Jones, R., & Armstrong, E. 2008. Detection of methyltransferases conferring high-level resistance to aminoglycosides in Enterobacteriaceae from Europe, North America, and Latin America. Antimicrob. AgentsChemother., 52, (5) 1843-1845
Page | 218
Frye, J.G. & Jackson, C.R. 2013. Genetic mechanisms of antimicrobial resistance identified in Salmonella enterica, Escherichia coli, and Enteroccocus spp. isolated from U.S. food animals. Front Microbiol., 4, 135
Geue, L., Monecke, S., Engelmann, I., Braun, S., Slickers, P., & Ehricht, R. 2014. Rapid microarray-based DNA genoserotyping of Escherichia coli. Microbiol.Immunol., 58, (2) 77-86
Geue, L., Schares, S., Mintel, B., Conraths, F.J., Muller, E., & Ehricht, R. 2010. Rapid microarray-based genotyping of enterohemorrhagic Escherichia coli serotype O156:H25/H-/Hnt isolates from cattle and clonal relationship analysis. Appl.Environ.Microbiol., 76, (16) 5510-5519
Ghanbarpour, R. & Oswald, E. 2010. Phylogenetic distribution of virulence genes in Escherichia coliisolated from bovine mastitis in Iran. Res.Vet.Sci., 88, (1) 6-10
Gibreel, T., Dodgson, A., Cheesbrough, J., Fox, A., Bolton, F., & Upton, M. 2012. Population structure, virulence potential and antibiotic susceptibility of uropathogenic Escherichia coli from Northwest England. J. Antimicrob. Chemother., 67, (2) 346-356
Girardeau, J.P., Bertin, Y., Martin, C., Der, V.M., & Boeuf, C. 1991. Sequence analysis of the clpG gene, which codes for surface antigen CS31A subunit: evidence of an evolutionary relationship between CS31A, K88, and F41 subunit genes. J.Bacteriol., 173, (23) 7673-7683
Girardeau, J.P., Lalioui, L., Said, A.M., De, C.C., & Le, B.C. 2003. Extended virulence genotype of pathogenic Escherichia coli isolates carrying the afa-8 operon: evidence of similarities between isolates from humans and animals with extraintestinal infections. J. Clin. Microbiol., 41, (1) 218-226
Girlich, D., Poirel, L., & Nordmann, P. 2009. CTX-M expression and selection of ertapenem resistance in Klebsiella pneumoniae and Escherichia coli. Antimicrob. AgentsChemother., 53, (2) 832-834
Glavis-Bloom, J., Muhammed, M., & Mylonakis, E. 2012. Of model hosts and man: using Caenorhabditis elegans, Drosophila melanogaster and Galleria mellonella as model hosts for infectious disease research. Adv.Exp.Med.Biol., 710, 11-17
Gobernado, M., Valdes, L., Alos, J., Garcia-Rey, C., Dal-Re, R., Garcia-de-Lomas, J., & Spanish Surveillance Group for E.coli Urinary Pathogens 2007. Quinolone resistance in female outpatient urinary tract isolates of Escherichia coli: age-related differences. Rev.Esp.Quimioter., 20, (2) 206-210
Goettsch, W., van, P.W., Nagelkerke, N., Hendrix, M.G., Buiting, A.G., Petit, P.L., Sabbe, L.J., van Griethuysen, A.J., & de Neeling, A.J. 2000. Increasing resistance to fluoroquinolones in Escherichia coli from urinary tract infections in the netherlands. J.Antimicrob.Chemother., 46, (2) 223-228
Gordon, D., Clermont, O., Tolley, H., & Denamur, E. 2008. Assigning Escherichia coli strains to phylogenetic groups: multi-locus sequence typing versus the pcr triplex method. Environ. Microbiol., 10, (10) 2484-2496
Gormley, F.J., Little, C.L., Rawal, N., Gillespie, I.A., Lebaigue, S., & Adak, G.K. 2011. A 17-year review of foodborne outbreaks: describing the continuing decline in England and Wales (1992-2008). Epidemiol.Infect., 139, (5) 688-699
Gross, R. & Rowe, B. 1985, "Serotyping of Escherichia coli," In The Virulence of Escherichia coli, M. Sussman, ed., Cambridge: Cambridge University Press, pp. 345-360.

Page | 219
Guentzel, M. 1996, "Escherichia, Klebsiella, Enterobacter, Serratia, Citrobacter and Proteus," In Medical Microbiology, 4th ed. S. Baron, ed., Galveston: University of Texas Medical Branch at Galveston. Chapter 26.
Guerra, B., Junker, E., Miko, A., Helmuth, R., & Mendoza, M.C. 2004. Characterization and localization of drug resistance determinants in multidrug-resistant, integron-carrying Salmonella enterica serotype Typhimurium strains. Microb.Drug Resist., 10, (2) 83-91
Guignot, J., Breard, J., Bernet-Camard, M.F., Peiffer, I., Nowicki, B.J., Servin, A.L., & Blanc-Potard, A.B. 2000. Pyelonephritogenic diffusely adhering Escherichia coli EC7372 harboring Dr-II adhesin carries classical uropathogenic virulence genes and promotes cell lysis and apoptosis in polarized epithelial caco-2/TC7 cells. Infect. Immun., 68, (12) 7018-7027
Gupta, K., Hooton, T., Naber, K., Wullt, B., Colgan, R., Miller, L., Moran, G., Nicolle, L., Raz, R., Schaeffer, A., & Soper, D. 2011. International clinical practice guidelines for the treatment of acute uncomplicated cystitis and pyelonephritis in women: a 2010 update by the Infectious Diseases Society of America and the European Society for Microbiology and Infectious Diseases. Clin. Infect.Dis., 52, (5) e103-e120
Gupta, K., Hooton, T.M., Roberts, P.L., & Stamm, W.E. 2007. Short-course nitrofurantoin for the treatment of acute uncomplicated cystitis in women. Arch.Intern.Med., 167, (20) 2207-2212
Guyer, D.M., Henderson, I.R., Nataro, J.P., & Mobley, H.L. 2000. Identification of sat, an autotransporter toxin produced by uropathogenic Escherichia coli. Mol.Microbiol., 38, (1) 53-66
Guyer, D.M., Kao, J.S., & Mobley, H.L. 1998. Genomic analysis of a pathogenicity island in uropathogenic Escherichia coli CFT073: distribution of homologous sequences among isolates from patients with pyelonephritis, cystitis, and Catheter-associated bacteriuria and from fecal samples. Infect.Immun., 66, (9) 4411-4417
Habib, S. 2012. Highlights for management of a child with urinary tract infection. Int.J. Pediatr., epub ahead of print
Hagan, E.C. & Mobley, H.L. 2007. Uropathogenic Escherichia coli outer membrane antigens expressed during urinary tract infection. Infect. Immun., 75, (8) 3941-3949
Hale, T. & Keusch, G. 1996, "Shigella," In Medical Microbiology, 4th ed. S. Baron, ed., Galveston: University of Texas Medical Branch at Galveston. Chapter 22.
Harris, K.A. & Hartley, J.C. 2003. Development of broad-range 16S rDNA PCR for use in the routine diagnostic clinical microbiology service. J.Med Microbiol., 52, (Pt 8) 685-691
Health Protection Agency 2008, Antimicrobial resistance and prescribing in England, Wales andNorthern Ireland, 2008.http://webarchive.nationalarchives.gov.uk/20140714084352/http://www.hpa.org.uk/web/HPAwebFile/HPAweb_C/1216798080469
Health Protection Agency 2011, Escherichia coli Bacteraemia in England, Wales and Northern Ireland, 2009-2013.https://www.gov.uk/government/uploads/system/uploads/attachment_data/file/339992/Ecoli_bacteraemia_in_Eng_Wales_and_NI_2009_to_2013.pdf

Page | 220
Health Protection Agency 2012a. Investigation of blood cultures (for organisms other than Mycobacterium species). UK standards for microbiology investigation, B37, (6.1) https://www.gov.uk/government/uploads/system/uploads/attachment_data/file/372070/B_37i8.pdf
Health Protection Agency 2012b. Investigation of urine. UK standards for microbiology investigation, B41, (7.1) https://www.gov.uk/government/uploads/system/uploads/attachment_data/file/343969/B_41i7.2.pdf
Health Protection Agency 2012c. English national point prevalence survey on healthcare associated infections and antimicrobial use, 2011. https://www.gov.uk/government/uploads/system/uploads/attachment_data/file/331871/English_National_Point_Prevalence_Survey_on_Healthcare_associated_Infections_and_Antimicrobial_Use_2011.pdf
Health Protection Agency 2013, Health Protection Report 7 (11).http://webarchive.nationalarchives.gov.uk/20140714084352/http://www.hpa.org.uk/hpr/archives/2013/hpr1113.pdf
Health Protection Agency 2014, Health Protection Report 8 (19).https://www.gov.uk/government/uploads/system/uploads/attachment_data/file/326930/hpr1914.pdf
Health Protection Agency & Health 2012, Health Protection Report 6 (24).http://webarchive.nationalarchives.gov.uk/20140714084352/http://www.hpa.org.uk/hpr/archives/2012/hpr2412.pdf
Heimer, S.R., Rasko, D.A., Lockatell, C.V., Johnson, D.E., & Mobley, H.L. 2004. Autotransporter genes pic and tsh are associated with Escherichia coli strains that cause acute pyelonephritis and are expressed during urinary tract infection. Infect.Immun., 72, (1) 593-597
Henderson, I.R., Czeczulin, J., Eslava, C., Noriega, F., & Nataro, J.P. 1999. Characterization of pic, a secreted protease of Shigella flexneri and enteroaggregative Escherichia coli. Infect.Immun., 67, (11) 5587-5596
Herzer, P., Inouye, S., Inouye, M., & Whittam, T. 1990. Phylogenetic distribution of branched RNA-linked multicopy single-stranded DNA among natural isolates of Escherichia coli. J. Bacteriol., 172, (11) 6175-6181
Hill, D.R. & Ryan, E.T. 2008. Management of travellers' diarrhoea. BMJ, 337
Hillier, S., Roberts, Z., Dunstan, F., Butler, C., Howard, A., & Palmer, S. 2007. Prior antibiotics and risk of antibiotic-resistant community-acquired urinary tract infection: a case-control study. J.Antimicrob.Chemother., 60, (1) 92-99
Hillier, S., Bell, J., Heginbothom, M., Roberts, Z., Dunstan, F., Howard, A., Mason, B., & Butler, C.C. 2006. When do general practitioners request urine specimens for microbiology analysis? The applicability of antibiotic resistance surveillance based on routinely collected data. J.Antimicrob.Chemother., 58, (6) 1303-1306

Page | 221
Ho, P.L., Chan, J., Lo, W.U., Lai, E.L., Cheung, Y.Y., Lau, T.C., & Chow, K.H. 2013. Prevalence and molecular epidemiology of plasmid-mediated fosfomycin resistance genes among blood and urinary Escherichia coli isolates. J.Med Microbiol., 62, (Pt 11) 1707-1713
Homeier, T., Semmler, T., Wieler, L.H., & Ewers, C. 2010. The GimA locus of extraintestinal pathogenic E. coli: does reductive evolution correlate with habitat and pathotype? PLoS.One., 5, (5)
Hooton, T., Bradley, S., Cardenas, D., Colgan, R., Geerlings, S., Rice, J., Saint, S., Schaeffer, A., Tambayh, P., Tenke, P., & Nicolle, L. 2010. Diagnosis, Prevention, and Treatment of Catheter-Associated Urinary Tract Infection in Adults: 2009 International Clinical Practice Guidelines from the Infectious Diseases Society of America. Clinical Infectious Diseases, 50, (5) 625-663
Hooton, T. & Stamm, I. 1996, "The Vaginal Flora and Urinary Tract Infections," In Urinary Tract Infections: Pathogenesis and Clinical Management, H. Mobley & D. Warren, eds., Washington DC: American Society for Microbiology. Chapter 3.
Hopkins, K.L., Mushtaq, S., Richardson, J.F., Doumith, M., de, P.E., Cheasty, T., Wain, J., Livermore, D.M., & Woodford, N. 2014. In vitro activity of rifaximin against clinical isolates of Escherichia coliand other enteropathogenic bacteria isolated from travellers returning to the UK. Int.J.Antimicrob.Agents, 43, (5) 431-437
Horan, T.C., Andrus, M., & Dudeck, M.A. 2008. CDC/NHSN surveillance definition of health care-associated infection and criteria for specific types of infections in the acute care setting. Am.J.Infect.Control., 36, (5) 309-332
Horner, C., Fawley, W., Morris, K., Parnell, P., Denton, M., & Wilcox, M. 2014. Escherichia colibacteraemia: 2 years of prospective regional surveillance (2010-12). J.Antimicrob.Chemother., 69, (1) 91-100
Hornsey, M., Phee, L., Longshaw, C., & Wareham, D.W. 2013. In vivo efficacy of telavancin/colistin combination therapy in a Galleria mellonella model of Acinetobacter baumannii infection. Int.J.Antimicrob.Agents, 41, (3) 285-287
Hounsom, L., Grayson, K., & Melzer, M. 2011. Mortality and associated risk factors in consecutive patients admitted to a UK NHS trust with community acquired bacteraemia. Postgrad.Med.J., 87, (1033) 757-762
Hryniewicz, K., Szczypa, K., Sulikowska, A., Jankowski, K., Betlejewska, K., & Hryniewicz, W. 2001. Antibiotic susceptibility of bacterial strains isolated from urinary tract infections in Poland. J.Antimicrob. Chemother., 47, (6) 773-780
Hu, Y., Liu, J., Xia, D., & Chen, S. 2012. Simultaneous analysis of foodborne pathogenic bacteria by an oligonucleotide microarray assay. J.Basic Microbiol., 52, (1) 27-34
Huang, S.H., Chen, Y.H., Fu, Q., Stins, M., Wang, Y., Wass, C., & Kim, K.S. 1999. Identification and characterization of an Escherichia coli invasion gene locus, ibeB, required for penetration of brain microvascular endothelial cells. Infect.Immun., 67, (5) 2103-2109
Huang, S.H., Chen, Y.H., Kong, G., Chen, S.H., Besemer, J., Borodovsky, M., & Jong, A. 2001. A novel genetic island of meningitic Escherichia coli K1 containing the ibeA invasion gene (GimA): functional annotation and carbon-source-regulated invasion of human brain microvascular endothelial cells. Funct.Integr.Genomics, 1, (5) 312-322

Page | 222
Huang, S.H., Wass, C., Fu, Q., Prasadarao, N.V., Stins, M., & Kim, K.S. 1995. Escherichia coli invasion of brain microvascular endothelial cells in vitro and in vivo: molecular cloning and characterization of invasion gene ibe10. Infect. Immun., 63, (11) 4470-4475
Huang, X.Z., Frye, J.G., Chahine, M.A., Glenn, L.M., Ake, J.A., Su, W., Nikolich, M.P., & Lesho, E.P. 2012. Characteristics of plasmids in multi-drug-resistant Enterobacteriaceae isolated during prospective surveillance of a newly opened hospital in Iraq. PLoS.One., 7, (7)
Huovinen, P. & Toivanen, P. 1980. Trimethoprim resistance in Finland after five years' use of plain trimethoprim. Br.Med J., 280, (6207) 72-74
Insua, J.L., Llobet, E., Moranta, D., Perez-Gutierrez, C., Tomas, A., Garmendia, J., & Bengoechea, J.A. 2013. Modeling Klebsiella pneumoniae pathogenesis by infection of the wax moth Galleria mellonella. Infect. Immun., 81, (10) 3552-3565
Ipe, D.S., Sundac, L., Benjamin, W.H., Jr., Moore, K.H., & Ulett, G.C. 2013. Asymptomatic bacteriuria: prevalence rates of causal microbes, etiology of infection in different patient populations, and recent advances in molecular detection. FEMS Microbiol.Lett. 10-6968
Jacoby, G.A. 2009. AmpC beta-Lactamases. Clin. Microbiol. Rev., 22, (1) 161-182
Jakovljevic, E., Ilic, K., Jelesic, Z., & Konstantinidis, G. 2013. A one-year prospective study on the antibiotic resistance of E. coli strains isolated in urinary specimens of children hospitalized at the University Pediatric Medical Center in Novi Sad, Serbia. Infection., 41, (6) 1111-1119
Jallat, C., Darfeuille-Michaud, A., Girardeau, J.P., Rich, C., & Joly, B. 1994. Self-transmissible R plasmids encoding CS31A among human Escherichia coli strains isolated from diarrheal stools. Infect.Immun., 62, (7) 2865-2873
Jenkins, C., Evans, J., Chart, H., Willshaw, G.A., & Frankel, G. 2008. Escherichia coli serogroup O26--a new look at an old adversary. J.Appl.Microbiol., 104, (1) 14-25
Jeong, Y.W., Kim, T.E., Kim, J.H., & Kwon, H.J. 2012. Pathotyping avian pathogenic Escherichia colistrains in Korea. J.Vet.Sci., 13, (2) 145-152
Johnson, J., Menard, M., Lauderdale, T., Kosmidis, C., Gordon, D., Collignon, P., Maslow, J., Andrasevic, A., Kuskowski, M., & Trans-global Initiative for Antimicrobial Resistance Analysis Investigators. 2011. Global distribution and epidemiologic associations of Escherichia coli clonal group A, 1998-2007. Emerg. Infect. Dis., 17, (11) 2001-2009
Johnson, J., Johnston, B., Kuskowski, M., Nougayrede, J., & Oswald, E. 2008a. Molecular epidemiology and phylogenetic distribution of the Escherichia coli pks genomic island. J. Clin.Microbiol., 46, (12) 3906-3911
Johnson, J., Menard, M., Johnston, B., Kuskowski, M., Nichol, K., & Zhanel, G. 2009a. Epidemic clonal groups of Escherichia coli as a cause of antimicrobial-resistant urinary tract infections in Canada, 2002 to 2004. Antimicrob. Agents Chemother., 53, (7) 2733-2739
Johnson, J. & Stell, A. 2000. Extended virulence genotypes of Escherichia coli strains from patients with urosepsis in relation to phylogeny and host compromise. J. Infect. Dis., 181, (1) 261-272
Johnson, J.R. 1991. Virulence factors in Escherichia coli urinary tract infection. Clin.Microbiol.Rev., 4, (1) 80-128

Page | 223
Johnson, J.R., Brown, J.J., Carlino, U.B., & Russo, T.A. 1998. Colonization with and acquisition of uropathogenic Escherichia coli as revealed by polymerase chain reaction-based detection. J.Infect.Dis., 177, (4) 1120-1124
Johnson, J.R., Jelacic, S., Schoening, L.M., Clabots, C., Shaikh, N., Mobley, H.L., & Tarr, P.I. 2005a. The IrgA homologue adhesin Iha is an Escherichia coli virulence factor in murine urinary tract infection. Infect.Immun., 73, (2) 965-971
Johnson, J.R., Johnston, B., Clabots, C., Kuskowski, M.A., & Castanheira, M. 2010. Escherichia colisequence type ST131 as the major cause of serious multidrug-resistant E. coli infections in the United States. Clin.Infect.Dis., 51, (3) 286-294
Johnson, J.R., Johnston, B., Clabots, C.R., Kuskowski, M.A., Roberts, E., & DebRoy, C. 2008b. Virulence genotypes and phylogenetic background of Escherichia coli serogroup O6 isolates from humans, dogs, and cats. J. Clin. Microbiol., 46, (2) 417-422
Johnson, J.R., Kuskowski, M.A., Gajewski, A., Soto, S., Horcajada, J.P., Jimenez de Anta, M.T., & Vila, J. 2005b. Extended virulence genotypes and phylogenetic background of Escherichia coli isolates from patients with cystitis, pyelonephritis, or prostatitis. J.Infect.Dis., 191, (1) 46-50
Johnson, J.R., Kuskowski, M.A., Owens, K., Gajewski, A., & Winokur, P.L. 2003. Phylogenetic origin and virulence genotype in relation to resistance to fluoroquinolones and/or extended-spectrum cephalosporins and cephamycins among Escherichia coli isolates from animals and humans. J.Infect.Dis., 188, (5) 759-768
Johnson, J.R., Owens, K.L., Clabots, C.R., Weissman, S.J., & Cannon, S.B. 2006. Phylogenetic relationships among clonal groups of extraintestinal pathogenic Escherichia coli as assessed by multi-locus sequence analysis. Microbes.Infect., 8, (7) 1702-1713
Johnson, J.R., Porter, S.B., Zhanel, G., Kuskowski, M.A., & Denamur, E. 2012a. Virulence of Escherichia coli clinical isolates in a murine sepsis model in relation to sequence type ST131 status, fluoroquinolone resistance, and virulence genotype. Infect.Immun., 80, (4) 1554-1562
Johnson, J.R. & Russo, T.A. 2002. Uropathogenic Escherichia coli as agents of diverse non-urinary tract extraintestinal infections. J.Infect.Dis., 186, (6) 859-864
Johnson, J.R., Tchesnokova, V., Johnston, B., Clabots, C., Roberts, P.L., Billig, M., Riddell, K., Rogers, P., Qin, X., Butler-Wu, S., Price, L.B., Aziz, M., Nicolas-Chanoine, M.H., DebRoy, C., Robicsek, A., Hansen, G., Urban, C., Platell, J., Trott, D.J., Zhanel, G., Weissman, S.J., Cookson, B.T., Fang, F.C., Limaye, A.P., Scholes, D., Chattopadhyay, S., Hooper, D.C., & Sokurenko, E.V. 2013. Abrupt emergence of a single dominant multidrug-resistant strain of Escherichia coli. J.Infect.Dis., 207, (6) 919-928
Johnson, T.J., Logue, C.M., Johnson, J.R., Kuskowski, M.A., Sherwood, J.S., Barnes, H.J., DebRoy, C., Wannemuehler, Y.M., Obata-Yasuoka, M., Spanjaard, L., & Nolan, L.K. 2012b. Associations between multidrug resistance, plasmid content, and virulence potential among extraintestinal pathogenic and commensal Escherichia coli from humans and poultry. Foodborne.Pathog.Dis., 9, (1) 37-46
Johnson, T.J., Logue, C.M., Wannemuehler, Y., Kariyawasam, S., Doetkott, C., DebRoy, C., White, D.G., & Nolan, L.K. 2009b. Examination of the source and extended virulence genotypes of Escherichia coli contaminating retail poultry meat. Foodborne.Pathog.Dis, 6, (6) 657-667

Page | 224
Joint Formulary Committee 2013. British National Formulary, 65 ed. London, BMJ Group and Pharmaceutical Press.
Jolley, K.A. & Maiden, M.C. 2010. BIGSdb: Scalable analysis of bacterial genome variation at the population level. BMC.Bioinformatics., 11, 595
Jones, G.L., Warren, R.E., Skidmore, S.J., Davies, V.A., Gibreel, T., & Upton, M. 2008. Prevalence and distribution of plasmid-mediated quinolone resistance genes in clinical isolates of Escherichia colilacking extended-spectrum beta-lactamases. J Antimicrob.Chemother., 62, (6) 1245-1251
Joyce, S.A. & Gahan, C.G. 2010. Molecular pathogenesis of Listeria monocytogenes in the alternative model host Galleria mellonella. Microbiology., 156, (Pt 11) 3456-3468
Jubelin, G., Chavez, C., Taieb, F., Banfield, M., Samba-Louaka, A., Nougayrede, J., Zumbihl, R., Givaudan, A., Escoubas, J., & Oswald, E. 2009. Cycle Inhibiting Factors (CIFs) are a growing family of functional cyclomodulins present in invertebrate and mammal bacterial pathogens. PLoS ONE, 4, (3)
Kahlmeter, G. 2003. An international survey of the antimicrobial susceptibility of pathogens from uncomplicated urinary tract infections: the ECO-SENS Project. J. Antimicrob. Chemother., 51, (1) 69-76
Kahlmeter, G. & Poulsen, H.O. 2012. Antimicrobial susceptibility of Escherichia coli from community-acquired urinary tract infections in Europe: the ECO.SENS study revisited. Int.J.Antimicrob.Agents, 39, (1) 45-51
Kanamuru, S., Karuzono, H., Nakano, M., Terai, A., Ogawa, O., & Yamamoto, S. 2006. Subtyping of uropathogenic Escherichia coli according to the pathogenicity island encoding uropathogenic-specific protein: Comparison with phylogenetic groups. Int. J. Urol., 13, (6) 754-760
Kang, C.I., Cha, M.K., Kim, S.H., Ko, K.S., Wi, Y.M., Chung, D.R., Peck, K.R., Lee, N.Y., & Song, J.H. 2013. Clinical and molecular epidemiology of community-onset bacteremia caused by extended-spectrum beta-lactamase-producing Escherichia coli over a 6-Year Period. J.Korean Med Sci., 28, (7) 998-1004
Kanukollu, U., Bieler, S., Hull, S., & Hull, R. 1985. Contribution of the traT gene to serum resistance among clinical isolates of Enterobacteriaceae. J.Med Microbiol., 19, (1) 61-67
Kao, J.S., Stucker, D.M., Warren, J.W., & Mobley, H.L. 1997. Pathogenicity island sequences of pyelonephritogenic Escherichia coli CFT073 are associated with virulent uropathogenic strains. Infect.Immun., 65, (7) 2812-2820
Karch, H., Schubert, S., Zhang, D., Zhang, W., Schmidt, H., Olschlager, T., & Hacker, J. 1999. A genomic island, termed high-pathogenicity island, is present in certain non-O157 Shiga toxin-producing Escherichia coli clonal lineages. Infect. Immun., 67, (11) 5994-6001
Karisik, E., Ellington, M., Livermore, D., & Woodford, N. 2008. Virulence factors in Escherichia coliwith CTX-M-15 and other extended-spectrum B-lactamases in the UK. J. Antimicrob. Chemother., 61, (1) 54-58
Karisik, E., Ellington, M.J., Pike, R., Warren, R.E., Livermore, D.M., & Woodford, N. 2006. Molecular characterization of plasmids encoding CTX-M-15 beta-lactamases from Escherichia coli strains in the United Kingdom. J.Antimicrob.Chemother., 58, (3) 665-668

Page | 225
Kariyawasam, S., Johnson, T.J., & Nolan, L.K. 2006. The pap operon of avian pathogenic Escherichia coli strain O1:K1 is located on a novel pathogenicity island. Infect. Immun., 74, (1) 744-749
KassS, E. 1957. Bacteriuria and the Diagnosis of Infections of the Urinary Tract: With Observations on the Use of Methionine as a Urinary Antiseptic. AMA Arch. Intern. Med., 100, (5) 709-714
Kauffmann, F. 1947. The Serology of the Coli Group. J.Immunol., 57, (1) 71-100
Kawamura-Sato, K., Yoshida, R., Shibayama, K., & Ohta, M. 2010. Virulence genes, quinolone and fluoroquinolone resistance, and phylogenetic background of uropathogenic Escherichia coli strains isolated in Japan. Jpn. J. Infect. Dis., 63, (2) 113-115
Kim, N.H., Choi, E.H., Sung, J.Y., Oh, C.E., Kim, H.B., Kim, E.C., & Lee, H.J. 2013. Prevalence of plasmid-mediated quinolone resistance genes and ciprofloxacin resistance in pediatric bloodstream isolates of Enterobacteriaceae over a 9-year period. Jpn.J.Infect.Dis., 66, (2) 151-154
Kirchner, M., Wearing, H., & Teale, C. 2011. Plasmid-mediated quinolone resistance gene detected in Escherichia coli from cattle. Vet.Microbiol., 148, (2-4) 434-435
Kizilbash, Q.F., Petersen, N.J., Chen, G.J., Naik, A.D., & Trautner, B.W. 2013. Bacteremia and mortality with urinary catheter-associated bacteriuria. Infect.Control Hosp.Epidemiol., 34, (11) 1153-1159
Knowles, S., O'Sullivan, N., Meenan, A., Hanniffy, R., & Robson, M. 2014. Maternal sepsis incidence, aetiology and outcome for mother and fetus: a prospective study. BJOG., 121, (13) 1755-1756
Knutton, S., Shaw, R., Phillips, A.D., Smith, H.R., Willshaw, G.A., Watson, P., & Price, E. 2001. Phenotypic and genetic analysis of diarrhea-associated Escherichia coli isolated from children in the United Kingdom. J.Pediatr.Gastroenterol.Nutr., 33, (1) 32-40
Kobayashi, R.K., Gaziri, L.C., & Vidotto, M.C. 2010. Functional activities of the Tsh protein from avian pathogenic Escherichia coli (APEC) strains. J.Vet.Sci., 11, (4) 315-319
Koeijers, J.J., Verbon, A., Kessels, A.G., Bartelds, A., Donkers, G., Nys, S., & Stobberingh, E.E. 2010. Urinary tract infection in male general practice patients: uropathogens and antibiotic susceptibility. Urology., 76, (2) 336-340
Korhonen, T., Valtonen, M., Parkkinen, J., Vaisanen-Rhen, V., Finne, J., Orskov, F., Orskov, I., Svensen, S., & Makela, P. 1985. Serotypes, hemolysin production, and receptor recognition of Escherichia colistrains associated with neonatal sepsis and meningitis. Infect. Immun., 48, (2) 486-491
Korth, M.J., Schneider, R.A., & Moseley, S.L. 1991. An F41-K88-related genetic determinant of bovine septicemic Escherichia coli mediates expression of CS31A fimbriae and adherence to epithelial cells. Infect. Immun., 59, (7) 2333-2340
Krieger, J.N., Nyberg, L., Jr., & Nickel, J.C. 1999. NIH consensus definition and classification of prostatitis. JAMA, 282, (3) 236-237
Ku, N.S., Kim, Y.C., Kim, M.H., Song, J.E., Oh, D.H., Ahn, J.Y., Kim, S.B., Kim, H.W., Jeong, S.J., Han, S.H., Kim, C.O., Song, Y.G., Kim, J.M., & Choi, J.Y. 2013. Risk factors for 28-day mortality in elderly patients with extended-spectrum beta-lactamase (ESBL)-producing Escherichia coli and Klebsiella pneumoniae bacteremia. Arch.Gerontol.Geriatr., 58, (1) 105-109
Page | 226
Kudinha, T., Johnson, J.R., Andrew, S.D., Kong, F., Anderson, P., & Gilbert, G.L. 2013a. Escherichia colisequence type 131 (ST131) as a prominent cause of antibiotic resistance among urinary Escherichia coli isolates from reproductive-age women. J. Clin. Microbiol. , 51, (10) 3270-3276
Kudinha, T., Johnson, J.R., Andrew, S.D., Kong, F., Anderson, P., & Gilbert, G.L. 2013b. Genotypic and phenotypic characterization of Escherichia coli isolates from children with urinary tract infection and from healthy carriers. Pediatr.Infect.Dis.J., 32, (5) 543-548
Kurazono, H., Yamamoto, S., Nakano, M., Nair, G.B., Terai, A., Chaicumpa, W., & Hayashi, H. 2000. Characterization of a putative virulence island in the chromosome of uropathogenic Escherichia colipossessing a gene encoding a uropathogenic-specific protein. Microb.Pathog., 28, (3) 183-189
Labigne-Roussel, A.F., Lark, D., Schoolnik, G., & Falkow, S. 1984. Cloning and expression of an afimbrial adhesin (AFA-I) responsible for P blood group-independent, mannose-resistant hemagglutination from a pyelonephritic Escherichia coli strain. Infect.Immun., 46, (1) 251-259
Lacey, R.W. 1982. Do sulphonamide-trimethoprim combinations select less resistance to trimethoprim than the use of trimethoprim alone? J.Med Microbiol., 15, (4) 403-427
Langermann, S., Mollby, R., Burlein, J.E., Palaszynski, S.R., Auguste, C.G., DeFusco, A., Strouse, R., Schenerman, M.A., Hultgren, S.J., Pinkner, J.S., Winberg, J., Guldevall, L., Soderhall, M., Ishikawa, K., Normark, S., & Koenig, S. 2000. Vaccination with FimH adhesin protects cynomolgus monkeys from colonization and infection by uropathogenic Escherichia coli. J.Infect.Dis., 181, (2) 774-778
Lau, S., Kaufmann, M., Livermore, D., Woodford, N., Willshaw, G., Cheasty, T., Stamper, K., Reddy, S., Cheesbrough, J., Bolton, F., Fox, A., & Upton, M. 2008a. UK epidemic Escherichia coli strains A-E, with CTX-M-15 B-lactamase, all belong to the international O25:H4-ST131 clone. J. Antimicrob.Chemother., 62, (6) 1241-1244
Lau, S., Reddy, S., Cheesbrough, J., Bolton, F., Willshaw, G., Cheasty, T., Fox, A., & Upton, M. 2008b. Major uropathogenic Escherichia coli strain isolated in the North West of England identified by multilocus sequence typing. J. Clin. Microbiol., 46, (3) 1076-1080
Laupland, K., Gregson, D., Church, D., Ross, T., & Pitout, J. 2008. Incidence, risk factors and outcomes of Escherichia coli bloodstream infections in a large Canadian region. Clin. Microbiol. Infect., 14, (11) 1041-1047
Lawes, T., Edwards, B., Lopez-Lozano, J.M., & Gould, I. 2012. Trends in Staphylococcus aureusbacteraemia and impacts of infection control practices including universal MRSA admission screening in a hospital in Scotland, 2006-2010: retrospective cohort study and time-series intervention analysis. BMJ Open., 2, (3)
Lee, S., Yu, J.K., Park, K., Oh, E.J., Kim, S.Y., & Park, Y.J. 2010. Phylogenetic groups and virulence factors in pathogenic and commensal strains of Escherichia coli and their association with blaCTX-M. Ann.Clin.Lab Sci., 40, (4) 361-367
Leelaporn, A., Yodkamol, K., Waywa, D., & Pattanachaiwit, S. 2008. A novel structure of Tn4001-truncated element, type V, in clinical enterococcal isolates and multiplex PCR for detecting aminoglycoside resistance genes. Int. J. Antimicrob. Agents, 31, (3) 250-254
Leflon-Guibout, V., Bonacorsi, S., Clermont, O., Ternat, G., Heym, B., & Nicolas-Chanoine, M.H. 2002. Pyelonephritis caused by multiple clones of Escherichia coli, susceptible and resistant to co-amoxiclav, after a 45 day course of co-amoxiclav. J.Antimicrob.Chemother., 49, (2) 373-377

Page | 227
Lemaitre, C., Mahjoub-Messai, F., Dupont, D., Caro, V., Diancourt, L., Bingen, E., Bidet, P., & Bonacorsi, S. 2013. A conserved virulence plasmidic region contributes to the virulence of the multiresistant meningitis strain s286 belonging to phylogenetic group C. PLoS ONE, 8, (9)
Leuko, S. & Raivio, T. L. 2012. Mutations that impact the enteropathogenic Escherichia coli Cpx envelope stress response attenuate virulence in Galleria mellonella. Infect.Immun., 80, (9) 3077-3085
Leveille, S., Caza, M., Johnson, J.R., Clabots, C., Sabri, M., & Dozois, C.M. 2006. Iha from an Escherichia coli urinary tract infection outbreak clonal group A strain is expressed in vivo in the mouse urinary tract and functions as a catecholate siderophore receptor. Infect.Immun., 74, (6) 3427-3436
Leydon, G.M., Turner, S., Smith, H., & Little, P. 2009. The journey from self-care to GP care: a qualitative interview study of women presenting with symptoms of urinary tract infection. Br.J.Gen.Pract., 59, (564)
Lindemann, P.C., Risberg, K., Wiker, H.G., & Mylvaganam, H. 2012. Aminoglycoside resistance in clinical Escherichia coli and Klebsiella pneumoniae isolates from Western Norway. APMIS, 120, (6) 495-502
Linhares, I., Raposo, T., Rodrigues, A., & Almeida, A. 2013. Frequency and antimicrobial resistance patterns of bacteria implicated in community urinary tract infections: a ten-year surveillance study (2000-2009). BMC.Infect.Dis., 13:19.
Lintermans, P.F., Pohl, P., Bertels, A., Charlier, G., Vandekerckhove, J., Van, D.J., Schoup, J., Schlicker, C., Korhonen, T., De, G.H., & . 1988. Characterization and purification of the F17 adhesin on the surface of bovine enteropathogenic and septicemic Escherichia coli. Am.J.Vet.Res., 49, (11) 1794-1799
Lionakis, M.S. 2011. Drosophila and Galleria insect model hosts: new tools for the study of fungal virulence, pharmacology and immunology. Virulence., 2, (6) 521-527
Lipsky, B.A. 1989. Urinary tract infections in men. Epidemiology, pathophysiology, diagnosis, and treatment. Ann.Intern.Med., 110, (2) 138-150
Lipsky, B.A. 1999. Prostatitis and urinary tract infection in men: what's new; what's true? Am.J.Med., 106, (3) 327-334
Lipsky, B.A., Byren, I., & Hoey, C.T. 2010. Treatment of bacterial prostatitis. Clin.Infect.Dis., 50, (12) 1641-1652
Liss, M.A., Peterson, E.M., Johnston, B., Osann, K., & Johnson, J.R. 2013. Prevalence of ST131 among fluoroquinolone-resistant Escherichia coli obtained from rectal swabs before transrectal prostate biopsy. Urology, 81, (3) 548-555
Livermore, D.M. & Brown, D.F. 2001. Detection of beta-lactamase-mediated resistance. J.Antimicrob.Chemother., 48 Suppl 1, 59-64
Livermore, D.M., Hope, R., Reynolds, R., Blackburn, R., Johnson, A.P., & Woodford, N. 2013. Declining cephalosporin and fluoroquinolone non-susceptibility among bloodstream Enterobacteriaceae from the UK: links to prescribing change? J.Antimicrob.Chemother., 68, (11) 2667-2674
Page | 228
Livermore, D.M., Warner, M., Hall, L.M., Enne, V.I., Projan, S.J., Dunman, P.M., Wooster, S.L., &Harrison, G. 2001. Antibiotic resistance in bacteria from magpies (Pica pica) and rabbits (Oryctolagus cuniculus) from west Wales. Environ.Microbiol., 3, (10) 658-661
Livermore, D.M., Warner, M., Mushtaq, S., Doumith, M., Zhang, J., & Woodford, N. 2011. What remains against carbapenem-resistant Enterobacteriaceae? Evaluation of chloramphenicol, ciprofloxacin, colistin, fosfomycin, minocycline, nitrofurantoin, temocillin and tigecycline. Int.J.Antimicrob.Agents, 37, (5) 415-419
Livermore, D., Hope, R., Brick, G., Lillie, M., & Reynolds, R. 2008. Non-susceptibility trends among Enterobacteriaceae from bacteraemias in the UK and Ireland, 2001-2006. J. Antimicrob. Chemother., 62, (suppl 2) ii41-ii54
Loos, S., Ahlenstiel, T., Kranz, B., Staude, H., Pape, L., Hartel, C., Vester, U., Buchtala, L., Benz, K., Hoppe, B., Beringer, O., Krause, M., Muller, D., Pohl, M., Lemke, J., Hillebrand, G., Kreuzer, M., Konig, J., Wigger, M., Konrad, M., Haffner, D., Oh, J., & Kemper, M.J. 2012. An outbreak of Shiga toxin-producing Escherichia coli O104:H4 hemolytic uremic syndrome in Germany: presentation and short-term outcome in children. Clin.Infect.Dis., 55, (6) 753-759
Lopes, L.M., Fabbricotti, S.H., Ferreira, A.J., Kato, M.A., Michalski, J., & Scaletsky, I.C. 2005. Heterogeneity among strains of diffusely adherent Escherichia coli isolated in Brazil. J. Clin.Microbiol., 43, (4) 1968-1972
Lopez-Banda, D.A., Carrillo-Casas, E.M., Leyva-Leyva, M., Orozco-Hoyuela, G., Manjarrez-Hernandez, A.H., Arroyo-Escalante, S., Moncada-Barron, D., Villanueva-Recillas, S., Xicohtencatl-Cortes, J., & Hernandez-Castro, R. 2014. Identification of virulence factors genes in Escherichia coli isolates from women with urinary tract infection in Mexico. Biomed.Res.Int., epub ahead of print
Lu, R., Jiang, M., Chen, Z., Xu, X., Hu, H., Zhao, X., Gao, X., & Guo, L. 2013. Lactate dehydrogenase 5 expression in non-hodgkin lymphoma is associated with the induced hypoxia regulated protein and poor prognosis. PLoS.One., 8, (9) e74853
Lundrigan, M.D. & Webb, R.M. 1992. Prevalence of ompT among Escherichia coli isolates of human origin. FEMS Microbiol.Lett., 76, (1-2) 51-56
Lutwyche, P., Rupps, R., Cavanagh, J., Warren, R.A., & Brooks, D.E. 1994. Cloning, sequencing, and viscometric adhesion analysis of heat-resistant agglutinin 1, an integral membrane hemagglutinin from Escherichia coli O9:H10:K99. Infect.Immun., 62, (11) 5020-5026
M'Zali, F.H., Gascoyne-Binzi, D.M., Heritage, J., & Hawkey, P.M. 1996. Detection of mutations conferring extended-spectrum activity on SHV beta-lactamases using polymerase chain reaction single strand conformational polymorphism (PCR-SSCP). J.Antimicrob.Chemother., 37, (4) 797-802
Mahjoub-Messai, F., Bidet, P., Caro, V., Diancourt, L., Biran, V., Aujard, Y., Bingen, E., & Bonacorsi, S. 2011. Escherichia coli isolates causing bacteremia via gut translocation and urinary tract infection in young infants exhibit different virulence genotypes. J.Infect.Dis., 203, (12) 1844-1849
Manges, A., Tabor, H., Tellis, P., Vincent, C., & Tellier, P. 2008. Endemic and epidemic lineages of Escherichia coli that cause urinary tract infections. Emerg. Infect. Dis., 14, (10) 1575-1583
Manges, A.R., Johnson, J.R., Foxman, B., O'Bryan, T.T., Fullerton, K.E., & Riley, L.W. 2001. Widespread distribution of urinary tract infections caused by a multidrug-resistant Escherichia coli clonal group. N. Engl.J. Med., 345, (14) 1007-1013

Page | 229
Marches, O., Ledger, T., Boury, M., Ohara, M., Tu, X., Goffaux, F., Mainil, J., Rosenshine, I., Sugai, M., De Rycke, J., & Oswald, E. 2003. Enteropathogenic and enterohaemorrhagic Escherichia coli deliver a novel effector called Cif, which blocks cell cycle G2/M Transition. Mol. Microbiol., 50, (5) 1553-1567
Marcq, I., Martin, P., Payros, D., Cuevas-Ramos, G., Boury, M., Watrin, C., Nougayrede, J.P., Olier, M., & Oswald, E. 2014. The genotoxin colibactin exacerbates lymphopenia and decreases survival rate in mice infected with septicemic Escherichia coli. J.Infect.Dis., 210, (2) 285-294
Marcusson, L.L., Olofsson, S.K., Komp, L.P., Cars, O., & Hughes, D. 2005. Mutant prevention concentrations of ciprofloxacin for urinary tract infection isolates of Escherichia coli. J Antimicrob.Chemother., 55, (6) 938-943
Marschall, J., Piccirillo, M., Foxman, B., Zhang, L., Warren, D., & Henderson, J. 2013. Patient characteristics but not virulence factors discriminate between asymptomatic and symptomatic E. colibacteriuria in the hospital. BMC Infectious Diseases, 13, 213
Marschall, J., Zhang, L., Foxman, B., Warren, D., & Henderson, J. 2012. Both host and pathogen factors predispose to Escherichia coli urinary-source bacteremia in hospitalized patients. Clin. Infect.Dis., 54, (12) 1692-1698
Martin, P., Marcq, I., Magistro, G., Penary, M., Garcie, C., Payros, D., Boury, M., Olier, M., Nougayrede, J.P., Audebert, M., Chalut, C., Schubert, S., & Oswald, E. 2013. Interplay between Siderophores and Colibactin Genotoxin Biosynthetic Pathways in Escherichia coli. PLoS.Pathog., 9, (7) e1003437
Martin, V., Mushtaq, S., Livermore, D., Reynolds, R., & BSAC Working Party on Resistance Surveillance. BSAC Bacteraemia Resistance Surveillance Update 2011. Federation of Infection Societies (FIS) Scientific Meeting . 19-11-2012. Liverpool, UK.
Martinez-Medina, M., Mora, A., Blanco, M., Lopez, C., Alonso, M.P., Bonacorsi, S., Nicolas-Chanoine, M.H., Darfeuille-Michaud, A., Garcia-Gil, J., & Blanco, J. 2009. Similarity and divergence among adherent-invasive Escherichia coli and extraintestinal pathogenic E. coli strains. J.Clin. Microbiol., 47, (12) 3968-3979
Matsumura, Y., Yamamoto, M., Nagao, M., Hotta, G., Matsushima, A., Ito, Y., Takakura, S., & Ichiyama, S. 2012. Emergence and spread of B2-ST131-O25b, B2-ST131-O16 and D-ST405 clonal groups among extended-spectrum-beta-lactamase-producing Escherichia coli in Japan. J.Antimicrob.Chemother., 67, (11) 2612-2620
Matsumura, Y., Yamamoto, M., Nagao, M., Ito, Y., Takakura, S., & Ichiyama, S. 2013. Association of fluoroquinolone resistance, virulence genes, and IncF plasmids with extended-spectrum beta-lactamase-producing Escherichia coli ST131 and ST405 clonal groups. Antimicrob. Agents Chemother., 57, (10) 4736-4742
McCabe, W.R., Kaijser, B., Olling, S., Uwaydah, M., & Hanson, L.A. 1978. Escherichia coli in bacteremia: K and O antigens and serum sensitivity of strains from adults and neonates. J.Infect.Dis., 138, (1) 33-41
McNally, A., Alhashash, F., Collins, M., Alqasim, A., Paszckiewicz, K., Weston, V., & Diggle, M. 2013. Genomic analysis of extra-intestinal pathogenic Escherichia coli urosepsis. Clin.Microbiol.Infect., 19, (8) E328-334

Page | 230
McNulty, C., Freeman, E., Nichols, T., & Kalima, P. 2003. Laboratory diagnosis of urinary symptoms in primary care--a qualitative study. Commun.Dis.Public Health., 6, (1) 44-50
McNulty, C.A., Bowen, J., Clark, G., Charlett, A., & Cartwright, K. 2004. How should general practitioners investigate suspected urinary tract infection? Variations in laboratory-confirmed bacteriuria in South West England. Commun.Dis.Public Health., 7, (3) 220-226
McOsker, C.C. & Fitzpatrick, P.M. 1994. Nitrofurantoin: mechanism of action and implications for resistance development in common uropathogens. J.Antimicrob.Chemother., 33 Suppl A:23-30., 23-30
Meiland, R., Geerlings, S.E., Langermann, S., Brouwer, E.C., Coenjaerts, F.E., & Hoepelman, A.I. 2004. Fimch antiserum inhibits the adherence of Escherichia coli to cells collected by voided urine specimens of diabetic women. J.Urol., 171, (4) 1589-1593
Melzer, M. & Petersen, I. 2007. Mortality following bacteraemic infection caused by extended spectrum beta-lactamase (ESBL) producing E. coli compared to non-ESBL producing E. coli. J. Infect., 55, (3) 254-259
Melzer, M., Petersen, I., & Cheasty, T. 2008. The difference in serotypes between extended-beta-lactamase (ESBL) and non-ESBL-producing E.coli blood culture isolates at a UK district general hospital. J. Hosp. Infect., 68, (4) 367-369
Melzer, M. & Welch, C. 2013. Outcomes in UK patients with hospital-acquired bacteraemia and the risk of catheter-associated urinary tract infections. Postgrad.Med.J., 89, (1052) 329-334
Mendonca, N., Calhau, V., Lin, T., Boaventura, L., Ribeiro, G., & Da Silva, G.J. 2011. Unusual genotype of a Uropathogenic Escherichia coli strain assigned to the B2 phylogenetic group. J. Clin. Microbiol., 49, (8) 3105-3106
Menozzi, M.G., Eigner, U., Covan, S., Rossi, S., Somenzi, P., Dettori, G., Chezzi, C., & Fahr, A.M. 2006. Two-center collaborative evaluation of performance of the BD phoenix automated microbiology system for identification and antimicrobial susceptibility testing of gram-negative bacteria. J. Clin.Microbiol., 44, (11) 4085-4094
Micenkova, L., Staudova, B., Bosak, J., Mikalova, L., Littnerova, S., Vrba, M., Sevcikova, A., Woznicova, V., & Smajs, D. 2014. Bacteriocin-encoding genes and ExPEC virulence determinants are associated in human fecal Escherichia coli strains. BMC.Microbiol., 14, (1) 109
Millett, E.R., Quint, J.K., Smeeth, L., Daniel, R.M., & Thomas, S.L. 2013. Incidence of community-acquired lower respiratory tract infections and pneumonia among older adults in the United Kingdom: a population-based study. PLoS ONE, 8, (9)
Mims, C., Playfair, J., Roitt, I., Wakelin, D., & Williams, R. 1998. Medical Microbiology. 2nd ed. London: Mosby International Ltd. Chapter 32.
Minshew, B.H., Jorgensen, J., Counts, G.W., & Falkow, S. 1978. Association of hemolysin production, hemagglutination of human erythrocytes, and virulence for chicken embryos of extraintestinal Escherichia coli isolates. Infect. Immun., 20, (1) 50-54
Mitsumori, K., Terai, A., Yamamoto, S., Ishitoya, S., & Yoshida, O. 1999. Virulence characteristics of Escherichia coli in acute bacterial prostatitis. J.Infect.Dis., 180, (4) 1378-1381

Page | 231
Mobley, H.L., Green, D.M., Trifillis, A.L., Johnson, D.E., Chippendale, G.R., Lockatell, C.V., Jones, B.D., & Warren, J.W. 1990. Pyelonephritogenic Escherichia coli and killing of cultured human renal proximal tubular epithelial cells: role of hemolysin in some strains. Infect.Immun., 58, (5) 1281-1289
Molina-Lopez, J., Aparicio-Ozores, G., Ribas-Aparicio, R.M., Gavilanes-Parra, S., Chavez-Berrocal, M.E., Hernandez-Castro, R., & Manjarrez-Hernandez, H.A. 2011. Drug resistance, serotypes, and phylogenetic groups among uropathogenic Escherichia coli including O25-ST131 in Mexico City. J.Infect.Dev.Ctries., 5, (12) 840-849
Monecke, S., Mariani-Kurkdjian, P., Bingen, E., Weill, F.X., Baliere, C., Slickers, P., & Ehricht, R. 2011. Presence of enterohemorrhagic Escherichia coli ST678/O104:H4 in France prior to 2011. Appl.Environ.Microbiol., 77, (24) 8784-8786
Money, P., Kelly, A.F., Gould, S.W., Denholm-Price, J., Threlfall, E.J., & Fielder, M.D. 2010. Cattle, weather and water: mapping Escherichia coli O157:H7 infections in humans in England and Scotland. Environ.Microbiol., 12, (10) 2633-2644
Mora, A., Blanco, M., Lopez, C., Mamani, R., Blanco, J.E., Alonso, M.P., Garcia-Garrote, F., Dahbi, G., Herrera, A., Fernandez, A., Fernandez, B., Agulla, A., Bou, G., & Blanco, J. 2011. Emergence of clonal groups O1:HNM-D-ST59, O15:H1-D-ST393, O20:H34/HNM-D-ST354, O25b:H4-B2-ST131 and ONT:H21,42-B1-ST101 among CTX-M-14-producing Escherichia coli clinical isolates in Galicia, northwest Spain. Int.J.Antimicrob.Agents., 37, (1) 16-21
Mora, A., Dahbi, G., Lopez, C., Mamani, R., Marzoa, J., Dion, S., Picard, B., Blanco, M., Alonso, M.P., Denamur, E., & Blanco, J. 2014. Virulence patterns in a murine sepsis model of ST131 Escherichia coliclinical isolates belonging to serotypes O25b:H4 and O16:H5 are associated to specific virotypes. PLoS.One., 9, (1) e87025
Mora, A., Lopez, C., Dabhi, G., Blanco, M., Blanco, J.E., Alonso, M.P., Herrera, A., Mamani, R., Bonacorsi, S., Moulin-Schouleur, M., & Blanco, J. 2009. Extraintestinal pathogenic Escherichia coliO1:K1:H7/NM from human and avian origin: detection of clonal groups B2 ST95 and D ST59 with different host distribution. BMC.Microbiol., 9:132.
Mora-Rillo, M., Fernandez-Romero, N., Navarro-San Francisco, C., Romero-Gomez, M., Pano-Pardo, J., Arribas-Lopez, J., & Mingorance, J. 2013, The presence of the fyuA and P fimbriae genes are related with mortality in Escherichia coli bloodstream infections, ECCMID. Abstract O663.
Morales, C., Lee, M.D., Hofacre, C., & Maurer, J.J. 2004. Detection of a novel virulence gene and a Salmonella virulence homologue among Escherichia coli isolated from broiler chickens. Foodborne.Pathog.Dis., 1, (3) 160-165
Moreno, E., Planells, I., Prats, G., Planes, A., Moreno, G., & Andreu, A. 2005. Comparative study of Escherichia coli virulence determinants in strains causing urinary tract bacteremia versus strains causing pyelonephritis and other sources of bacteremia. Diagn. Microbiol.Infect. Dis., 53, (2) 93-99
Moreno, E., Andreu, A., Pigrau, C., Kuskowski, M.A., Johnson, J.R., & Prats, G. 2008. Relationship between Escherichia coli strains causing acute cystitis in women and the fecal E. coli population of the host. J. Clin.Microbiol., 46, (8) 2529-2534
Mylonakis, E., Moreno, R., El Khoury, J.B., Idnurm, A., Heitman, J., Calderwood, S.B., Ausubel, F.M., & Diener, A. 2005. Galleria mellonella as a model system to study Cryptococcus neoformanspathogenesis. Infect.Immun., 73, (7) 3842-3850

Page | 232
Nappi, A.J. & Christensen, B.M. 2005. Melanogenesis and associated cytotoxic reactions: applications to insect innate immunity. Insect Biochem.Mol.Biol., 35, (5) 443-459
Narciso, A., Nunes, F., Amores, T., Lito, L., Melo-Cristino, J., & Duarte, A. 2011. Persistence of uropathogenic Escherichia coli strains in the host for long periods of time: relationship between phylogenetic groups and virulence factors. Eur.J. Clin. Microbiol. Infect. Dis., 31, (6) 1211-1217
Nataro, J.P. & Kaper, J.B. 1998. Diarrheagenic Escherichia coli. Clin.Microbiol.Rev., 11, (1) 142-201
Nataro, J.P., Yikang, D., Yingkang, D., & Walker, K. 1994. AggR, a transcriptional activator of aggregative adherence fimbria I expression in enteroaggregative Escherichia coli. J.Bacteriol, 176, (15) 4691-4699
Neu, H. & Gootz, T. 1996, "Antimicrobial chemotherapy," In Medical Microbiology, 4th ed. S. Baron, ed., Galveston: University of Texas, Medical Branch at Galveston. Chapter 11.
Newcastle asymptomatic bacteruria research group. 1975. Asymptomatic bacteriuria in schoolchildren in Newcastle upon Tyne. Arch.Dis.Child., 50, (2) 90-102
NICE 2007. Urinary tract infection in children: diagnosis, treatment and long-term management, 1 ed. RCOG Press.
Nicolas-Chanoine, M., Blanco, J., Leflon-Guibout, V., Demarty, R., Alonso, M., Canica, M., Park, Y., Lavigne, J., Pitout, J., & Johnson, J. 2008. Intercontinental emergence of Escherichia coli clone O25:H4-ST131 producing CTX-M-15. J. Antimicrob.Chemother., 61, (2) 273-281
Nicoletti, M., Iacobino, A., Prosseda, G., Fiscarelli, E., Zarrilli, R., De, C.E., Petrucca, A., Nencioni, L., Colonna, B., & Casalino, M. 2011. Stenotrophomonas maltophilia strains from cystic fibrosis patients: genomic variability and molecular characterization of some virulence determinants. Int.J.Med.Microbiol., 301, (1) 34-43
Nicolle, L., Bradley, S., Colgan, R., Rice, J., Schaeffer, A., & Hooton, T. 2005. Infectious Diseases Society of America Guidelines for the Diagnosis and Treatment of Asymptomatic Bacteriuria in Adults. Clin. Infect. Dis., 40, (5) 643-654
Nijhuis, R.H., van Zwet, A.A., Savelkoul, P.H., Roovers, E.A., Bosboom, R.W., Postma, B., & van Griethuysen, A.J. 2011. Distribution of extended-spectrum beta-lactamase genes using a commercial DNA micro-array system. J.Hosp.Infect., 79, (4) 349-353
Nipic, D., Podlesek, Z., Budic, M., Crnigoj, M., & Zgur-Bertok, D. 2013. The Escherichia coliuropathogenic specific protein Usp, is a bacteriocin-like genotoxin. J.Infect.Dis., 208, (10) 1545-1552
Noppe-Leclercq, I., Wallet, F., Haentjens, S., Courcol, R., & Simonet, M. 1999. PCR detection of aminoglycoside resistance genes: a rapid molecular typing method for Acinetobacter baumannii. Res. Microbiol., 150, (5) 317-322
Norinder, B., Koves, B., Yadav, M., Brauner, A., & Svanborg, C. 2011. Do Escherichia coli strains causing acute cystitis have a distinct virulence repertoire? Microb. Pathog., 52, (1) 10-16
Nougayrede, J.P., Homburg, S., Taieb, F., Boury, M., Brzuszkiewicz, E., Gottschalk, G., Buchrieser, C., Hacker, J., Dobrindt, U., & Oswald, E. 2006. Escherichia coli induces DNA double-strand breaks in eukaryotic cells. Science, 313, (5788) 848-851

Page | 233
Novais, A., Viana, D., Baquero, F., Martinez-Botas, J., Canton, R., & Coque, T.M. 2012. Contribution of IncFII and broad-host IncA/C and IncN plasmids to the local expansion and diversification of phylogroup B2 Escherichia coli ST131 clones carrying blaCTX-M-15 and qnrS1 genes. Antimicrob.AgentsChemother., 56, (5) 2763-2766
Novais, A., Vuotto, C., Pires, J., Montenegro, C., Donelli, G., Coque, T.M., & Peixe, L. 2013. Diversity and biofilm-production ability among isolates of Escherichia coli phylogroup D belonging to ST69, ST393 and ST405 clonal groups. BMC.Microbiol., 13, 144
Nowicki, B., Labigne, A., Moseley, S., Hull, R., Hull, S., & Moulds, J. 1990. The Dr hemagglutinin, afimbrial adhesins AFA-I and AFA-III, and F1845 fimbriae of uropathogenic and diarrhea-associated Escherichia coli belong to a family of hemagglutinins with Dr receptor recognition. Infect. Immun., 58, (1) 279-281
O'Grady, N., Barie, P., Bartlett, J., Bleck, T., Carroll, K., Kalil, A., Linden, P., Maki, D., Nierman, D., Pasculle, W., & Masur, H. 2008. Guidelines for evaluation of new fever in critically ill adult patients: 2008 update from the American College of Critical Care Medicine and the Infectious Diseases Society of America. Crit. Care Med., 36, (4) 1330-1349
O'Hara, J.A., Hu, F., Ahn, C., Nelson, J., Rivera, J.I., Pasculle, A.W., & Doi, Y. 2014. Molecular Epidemiology of KPC-Producing Escherichia coli: Occurrence of ST131-fimH30 Subclone Harboring pKpQIL-Like IncFIIk Plasmid. Antimicrob. Agents Chemother., 58, (7) 4234-4237
O'Sullivan, O., Coakley, M., Lakshminarayanan, B., Conde, S., Claesson, M.J., Cusack, S., Fitzgerald, A.P., O'Toole, P.W., Stanton, C., & Ross, R.P. 2013. Alterations in intestinal microbiota of elderly Irish subjects post-antibiotic therapy. J.Antimicrob.Chemother., 68, (1) 214-221
Obata-Yasuoka, M., Ba-Thein, W., Tsukamoto, T., Yoshikawa, H., & Hayashi, H. 2002. Vaginal Escherichia coli share common virulence factor profiles, serotypes and phylogeny with other extraintestinal E. coli. Microbiol., 148, (Pt 9) 2745-2752
Ochman, H., Whittam, T., Caugant, D., & Selander, R. 1983. Enzyme polymorphism and genetic population structure in Escherichia coli and Shigella. J. Gen.Microbiol., 129, (9) 2715-2726
Ochman, H. & Selander, R.K. 1984. Standard reference strains of Escherichia coli from natural populations. J.Bacteriol., 157, (2) 690-693
Olesen, B., Hansen, D.S., Nilsson, F., Frimodt-Moller, J., Leihof, R.F., Struve, C., Scheutz, F., Johnston, B., Krogfelt, K.A., & Johnson, J.R. 2013. Prevalence and characteristics of the epidemic multiresistant Escherichia coli ST131 clonal group among extended-spectrum beta-lactamase-producing E. coliIsolates in Copenhagen, Denmark. J. Clin. Microbiol., 51, (6) 1779-1785
Olesen, B., Scheutz, F., Andersen, R.L., Menard, M., Boisen, N., Johnston, B., Hansen, D.S., Krogfelt, K.A., Nataro, J.P., & Johnson, J.R. 2012. Enteroaggregative Escherichia coli O78:H10, the cause of an outbreak of urinary tract infection. J. Clin. Microbiol., 50, (11) 3703-3711
Olesen, F. & Oestergaard, I. 1995. Patients with urinary tract infection: proposed management strategies of general practitioners, microbiologists and urologists. Br.J.Gen.Pract., 45, (400) 611-613
Olesen, I., Hasman, H., & Aarestrup, F.M. 2004. Prevalence of beta-lactamases among ampicillin-resistant Escherichia coli and Salmonella isolated from food animals in Denmark. Microb.Drug Resist., 10, (4) 334-340
Page | 234
Orskov, F. & Orskov, I. 1992. Escherichia coli serotyping and disease in man and animals. Can.J.Microbiol., 38, (7) 699-704
Ostblom, A., Adlerberth, I., Wold, A.E., & Nowrouzian, F.L. 2011. Pathogenicity island markers, virulence determinants malX and usp, and the capacity of Escherichia coli to persist in infants' commensal microbiotas. Appl.Environ.Microbiol., 77, (7) 2303-2308
Oteo, J., Gonzalez-Lopez, J.J., Ortega, A., Quintero-Zarate, J.N., Bou, G., Cercenado, E., Conejo, M.C., Martinez-Martinez, L., Navarro, F., Oliver, A., Bartolome, R.M., & Campos, J. 2014. Inhibitor-resistant TEM and OXA-1 producing Escherichia coli isolates resistant to amoxicillin-clavulanate are more clonal and possess lower virulence gene content than susceptible clinical isolates. Antimicrob.AgentsChemother., 58, (7) 3874-3881
Paiva de, S.C. & Dubreuil, J.D. 2001. Distribution and expression of the astA gene (EAST1 toxin) in Escherichia coli and Salmonella. Int.J.Med Microbiol., 291, (1) 15-20
Pan, X.S., Ambler, J., Mehtar, S., & Fisher, L.M. 1996. Involvement of topoisomerase IV and DNA gyrase as ciprofloxacin targets in Streptococcus pneumoniae. Antimicrob. Agents Chemother., 40, (10) 2321-2326
Parham, N.J., Pollard, S.J., Chaudhuri, R.R., Beatson, S.A., Desvaux, M., Russell, M.A., Ruiz, J., Fivian, A., Vila, J., & Henderson, I.R. 2005a. Prevalence of pathogenicity island IICFT073 genes among extraintestinal clinical isolates of Escherichia coli. J. Clin.Microbiol., 43, (5) 2425-2434
Parham, N.J., Pollard, S.J., Desvaux, M., Scott-Tucker, A., Liu, C., Fivian, A., & Henderson, I.R. 2005b. Distribution of the serine protease autotransporters of the Enterobacteriaceae among extraintestinal clinical isolates of Escherichia coli. J.Clin. Microbiol., 43, (8) 4076-4082
Peirano, G. & Pitout, J. 2010. Molecular epidemiology of Escherichia coli producing CTX-M B-lactamases: the worldwide emergence of clone ST131 O25:H4. Int. J.Antimicrob. Agents, 35, (4) 316-321
Peirano, G. & Pitout, J.D. 2014. Fluoroquinolone resistant Escherichia coli ST131 causing bloodstream infections in a centralized Canadian region: the rapid emergence of H30-Rx sublineage. Antimicrob.Agents Chemother., 58, (5) 2699-2703
Peirano, G., van der Bij, A.K., Gregson, D.B., & Pitout, J.D. 2012. Molecular epidemiology over an 11-year period (2000 to 2010) of extended-spectrum beta-lactamase-producing Escherichia coli causing bacteremia in a centralized Canadian region. J. Clin. Microbiol., 50, (2) 294-299
Perez-Moreno, M.O., Perez-Moreno, M., Carulla, M., Rubio, C., Jardi, A.M., & Zaragoza, J. 2004. Mechanisms of reduced susceptibility to amoxycillin-clavulanic acid in Escherichia coli strains from the health region of Tortosa (Catalonia, Spain). Clin.Microbiol.Infect., 10, (3) 234-241
Perry, N., Jenkins, C., Cheasty, T., & Wain, J. 2010. Diarrhoeagenic Escherichia coli from routine diagnostic faecal samples in England and Wales. J.Med.Microbiol., 59, (Pt 7) 870-872
Persson, S., Olsen, K.E., Scheutz, F., Krogfelt, K.A., & Gerner-Smidt, P. 2007. A method for fast and simple detection of major diarrhoeagenic Escherichia coli in the routine diagnostic laboratory. Clin.Microbiol.Infect., 13, (5) 516-524
Phee, L. Antibiotic treatment of bacteraemia caused by E. coli at the Royal London Hospital. 4-5-2013.

Page | 235
Piatti, G., Mannini, A., Balistreri, M., & Schito, A. 2008. Virulence factors in urinary Escherichia colistrains: phylogenetic background and quinolone and fluoroquinolone resistance. J.Clin. Microbiol., 46, (2) 480-487
Picao, R.C., Poirel, L., Demarta, A., Silva, C.S., Corvaglia, A.R., Petrini, O., & Nordmann, P. 2008. Plasmid-mediated quinolone resistance in Aeromonas allosaccharophila recovered from a Swiss lake. J.Antimicrob.Chemother., 62, (5) 948-950
Pitout, J.D., Laupland, K.B., Church, D.L., Menard, M.L., & Johnson, J.R. 2005. Virulence factors of Escherichia coli isolates that produce CTX-M-type extended-spectrum beta-lactamases. Antimicrob.Agents Chemother., 49, (11) 4667-4670
Platell, J.L., Cobbold, R.N., Johnson, J.R., Heisig, A., Heisig, P., Clabots, C., Kuskowski, M.A., & Trott, D.J. 2011. Commonality among fluoroquinolone-resistant sequence type ST131 extraintestinal Escherichia coli isolates from humans and companion animals in Australia. Antimicrob.Agents Chemother., 55, (8) 3782-3787
Platteel, T.N., Stuart, J.W., Voets, G.M., Scharringa, J., van de Sande, N., Fluit, A.C., & Leverstein-van Hall, M.A. 2011. Evaluation of a commercial microarray as a confirmation test for the presence of extended-spectrum beta-lactamases in isolates from the routine clinical setting. Clin.Microbiol.Infect., 17, (9) 1435-1438
Pradipta, I.S., Sodik, D.C., Lestari, K., Parwati, I., Halimah, E., Diantini, A., & Abdulah, R. 2013. Antibiotic resistance in sepsis patients: evaluation and recommendation of antibiotic use. N.Am.J.Med.Sci., 5, (6) 344-352
Price, L.B., Johnson, J.R., Aziz, M., Clabots, C., Johnston, B., Tchesnokova, V., Nordstrom, L., Billig, M., Chattopadhyay, S., Stegger, M., Andersen, P.S., Pearson, T., Riddell, K., Rogers, P., Scholes, D., Kahl, B., Keim, P., & Sokurenko, E.V. 2013. The epidemic of extended-spectrum-beta-lactamase-producing Escherichia coli ST131 is driven by a single highly pathogenic subclone, H30-Rx. MBio., 4, (6)
Provence, D.L. & Curtiss, R., III 1994. Isolation and characterization of a gene involved in hemagglutination by an avian pathogenic Escherichia coli strain. Infect.Immun., 62, (4) 1369-1380
Public Health England 2014a, English surveillance programme for anitmicrobial utilisation and resistance (ESPAUR), Public Health England, 2014362.https://www.gov.uk/government/uploads/system/uploads/attachment_data/file/362374/ESPAUR_Report_2014__3_.pdf
Public Health England 2014b, Trends in mandatory Staphylococcus aureus (MRSA and MSSA) and Escherichia coli bacteraemia, and Clostridium difficile infection (CDI) data for England up to January-March 2014.https://www.gov.uk/government/uploads/system/uploads/attachment_data/file/326700/Quarterly_commentary_June_2014_7318.pdf
Ramirez, M.S. & Tolmasky, M.E. 2010. Aminoglycoside modifying enzymes. Drug Resist.Updat., 13, (6) 151-171
Reeves, P.P. & Wang, L. 2002. Genomic organization of LPS-specific loci. Curr. Top. Microbiol.Immunol., 264, (1) 109-135

Page | 236
Reidl, J. & Boos, W. 1991. The malX malY operon of Escherichia coli encodes a novel enzyme II of the phosphotransferase system recognizing glucose and maltose and an enzyme abolishing the endogenous induction of the maltose system. J.Bacteriol., 173, (15) 4862-4876
Reingold, J., Starr, N., Maurer, J., & Lee, M.D. 1999. Identification of a new Escherichia coli She haemolysin homolog in avian E. coli. Vet.Microbiol., 66, (2) 125-134
Reynolds, R., Hope, R., & Williams, L. 2008. Survey, laboratory and statistical methods for the BSAC Resistance Surveillance Programmes. J.Antimicrob.Chemother., 62 Suppl 2, ii15-ii28
Rhen, M., Klemm, P., & Korhonen, T.K. 1986. Identification of two new hemagglutinins of Escherichia coli, N-acetyl-D-glucosamine-specific fimbriae and a blood group M-specific agglutinin, by cloning the corresponding genes in Escherichia coli K-12. J.Bacteriol., 168, (3) 1234-1242
Ribeiro, C. & Brehelin, M. 2006. Insect haemocytes: what type of cell is that? J.Insect Physiol., 52, (5) 417-429
Riley, M., Abe, T., Arnaud, M.B., Berlyn, M.K., Blattner, F.R., Chaudhuri, R.R., Glasner, J.D., Horiuchi, T., Keseler, I.M., Kosuge, T., Mori, H., Perna, N.T., Plunkett, G., III, Rudd, K.E., Serres, M.H., Thomas, G.H., Thomson, N.R., Wishart, D., & Wanner, B.L. 2006. Escherichia coli K-12: a cooperatively developed annotation snapshot--2005. Nucleic Acids Res., 34, (1) 1-9
Rogers, B.A., Sidjabat, H.E., & Paterson, D.L. 2011. Escherichia coli O25b-ST131: a pandemic, multiresistant, community-associated strain. J. Antimicrob. Chemother., 66, (1) 1-14
Rolland, K., Lambert-Zechovsky, N., Picard, B., & Denamur, E. 1998. Shigella and enteroinvasive Escherichia coli strains are derived from distinct ancestral strains of E. coli. Microbiol., 144 ( Pt 9), 2667-2672
Ronald, A. & Ludwig, E. 2001. Urinary tract infections in adults with diabetes. Int. J.Antimicrob.Agents, 17, (4) 287-292
Rosa, F.M., Vega, A.D., & Fernandez, G.C. 1980. Evaluation of Urea-motility-indole medium for recognition and differentiation of Salmonella and Shigella species in stool cultures. J.Clin. Microbiol., 12, (3) 310-313
Royal Society of Chemistry 2013. Modern chemical techniques: Ultraviolet/visible spectroscopyCambridge.
Ruan, X. & Zhang, W. 2013. Oral immunization of a live attenuated Escherichia coli strain expressing a holotoxin-structured adhesin-toxoid fusion (1FaeG-FedF-LT(A2):5LT(B)) protected young pigs against enterotoxigenic E. coli (ETEC) infection. Vaccine., 31, (11) 1458-1463
Rubin, R., Shapiro, E., Andriole, V., Davis, R., & Stamm, W. 1992. Evaluation of new anti-infective drugs for the treatment of urinary tract infection. Infectious Diseases Society of America and the Food and Drug Administration. Clin. Infect. Dis., 15, (Suppl. 1) S216-S227
Rupprecht, K.R., Gordon, G., Lundrigan, M., Gayda, R.C., Markovitz, A., & Earhart, C. 1983. omp T: Escherichia coli K-12 structural gene for protein a (3b). J.Bacteriol., 153, (2) 1104-1106
Russo, T.A., Carlino, U.B., & Johnson, J.R. 2001. Identification of a new iron-regulated virulence gene, ireA, in an extraintestinal pathogenic isolate of Escherichia coli. Infect. Immun., 69, (10) 6209-6216
Page | 237
Russo, T. & Johnson, J. 2000. Proposal for a new inclusive designation for extraintestinal pathogenic isolates of Escherichia coli: ExPEC. J.Infect. Dis., 181, (5) 1753-1754
Saarela, S., Taira, S., Nurmiaho-Lassila, E.L., Makkonen, A., & Rhen, M. 1995. The Escherichia coli G-fimbrial lectin protein participates both in fimbrial biogenesis and in recognition of the receptor N-acetyl-D-glucosamine. J.Bacteriol., 177, (6) 1477-1484
Sabate, M., Moreno, E., Perez, T., Andreu, A., & Prats, G. 2006. Pathogenicity island markers in commensal and uropathogenic Escherichia coli isolates. Clin.Microbiol.Infect., 12, (9) 880-886
Sahm, D.F., Thornsberry, C., Mayfield, D.C., Jones, M.E., & Karlowsky, J.A. 2001. Multidrug-resistant urinary tract isolates of Escherichia coli: prevalence and patient demographics in the United States in 2000. Antimicrob. AgentsChemother., 45, (5) 1402-1406
Sakkejha, H., Byrne, L., Lawson, A.J., & Jenkins, C. 2013. An update on the microbiology and epidemiology of enteropathogenic Escherichia coli in England 2010-2012. J.Med.Microbiol., 62, (Pt 10) 1531-1534
Salvarani, S., Tramuta, C., Nebbia, P., & Robino, P. 2011. Occurrence and functionality of cycle inhibiting factor, cytotoxic necrotising factors and cytolethal distending toxins in Escherichia coliisolated from calves and dogs in Italy. Res. Vet. Sci., 92, (3) 372-377
Samba-Louaka, A., Nougayrede, J., Watrin, C., Oswald, E., & Taieb, F. 2009. The Enteropathogenic Escherichia coli Effector Cif Induces Delayed Apoptosis in Epithelial Cells. Infect.Immun., 77, (12) 5471-5477
Sandegren, L., Lindqvist, A., Kahlmeter, G., & Andersson, D.I. 2008. Nitrofurantoin resistance mechanism and fitness cost in Escherichia coli. J.Antimicrob.Chemother., 62, (3) 495-503
Santos, A.C., Zidko, A.C., Pignatari, A.C., & Silva, R.M. 2013. Assessing the diversity of the virulence potential of Escherichia coli isolated from bacteremia in Sao Paulo, Brazil. Braz.J.Med.Biol.Res., 46, (11) 968-973
Sarkar, S., Ulett, G.C., Totsika, M., Phan, M.D., & Schembri, M.A. 2014. Role of capsule and O antigen in the virulence of uropathogenic Escherichia coli. PLoS ONE, 9, (4)
Savarino, S.J., Fasano, A., Watson, J., Martin, B.M., Levine, M.M., Guandalini, S., & Guerry, P. 1993. Enteroaggregative Escherichia coli heat-stable enterotoxin 1 represents another subfamily of E. coliheat-stable toxin. Proc.Natl.Acad.Sci.U.S.A., 90, (7) 3093-3097
Scarparo, C., Piccoli, P., Ricordi, P., & Scagnelli, M. 2002. Comparative evaluation of two commercial chromogenic media for detection and presumptive identification of urinary tract pathogens. Eur.J.Clin.Microbiol.Infect.Dis., 21, (4) 283-289
Scheutz, F., Cheasty, T., Woodward, D., & Smith, H.R. 2004. Designation of O174 and O175 to temporary O groups OX3 and OX7, and six new E. coli O groups that include Verocytotoxin-producing E. coli (VTEC): O176, O177, O178, O179, O180 and O181. APMIS, 112, (9) 569-584
Schilling, A.K., Hotzel, H., Methner, U., Sprague, L.D., Schmoock, G., El-Adawy, H., Ehricht, R., Wohr, A.C., Erhard, M., & Geue, L. 2012. Zoonotic agents in small ruminants kept on city farms in southern Germany. Appl.Environ.Microbiol., 78, (11) 3785-3793
Page | 238
Schito, G., Naber, KG., Botto, H., Palou, J., Mazzei, T., Gualco, L., & Marchese, A. 2009. The ARESC study: an international survey on the antimicrobial resistance of pathogens involved in uncomplicated urinary tract infections. Int.J. Antimicrob. Agents, 34, (5) 407-413
Schlackow, I., Stoesser, N., Walker, A.S., Crook, D.W., Peto, T.E., & Wyllie, D.H. 2012. Increasing incidence of Escherichia coli bacteraemia is driven by an increase in antibiotic-resistant isolates: electronic database study in Oxfordshire 1999-2011. J.Antimicrob.Chemother., 67, (6) 1514-1524
Schnaar, R., Suzuki, A., & Stanley, P. 2009, "Glycosphingolipids," In Essentials of glycobiology, 2nd ed. A. Varki et al., eds., New York: Cold Spring Harbour.
Schneider, G., Dobrindt, U., Bruggemann, H., Nagy, G., Janke, B., Blum-Oehler, G., Buchrieser, C., Gottschalk, G., Emody, L., & Hacker, J. 2004. The pathogenicity island-associated K15 capsule determinant exhibits a novel genetic structure and correlates with virulence in uropathogenic Escherichia coli strain 536. Infect. Immun., 72, (10) 5993-6001
Schubert, S., Rakin, A., Karch, H., Carniel, E., & Heesemann, J. 1998. Prevalence of the "high-pathogenicity island" of Yersinia species among Escherichia coli strains that are pathogenic to humans. Infect. Immun., 66, (2) 480-485
Selander, R.K., Caugant, D.A., Ochman, H., Musser, J.M., Gilmour, M.N., & Whittam, T.S. 1986. Methods of multilocus enzyme electrophoresis for bacterial population genetics and systematics. Appl.Environ.Microbiol, 51, (5) 873-884
Shaikh, N., Morone, N.E., Bost, J.E., & Farrell, M.H. 2008. Prevalence of urinary tract infection in childhood: a meta-analysis. Pediatr.Infect.Dis.J., 27, (4) 302-308
Shendure, J., Mitra, R.D., Varma, C., & Church, G.M. 2004. Advanced sequencing technologies: methods and goals. Nat.Rev.Genet., 5, (5) 335-344
SIGN. Management of suspected bacterial urinary tract infection in adults. 1-42. 2006.
Skjot-Rasmussen, L., Ejrnaes, K., Lundgren, B., Hammerum, A.M., & Frimodt-Moller, N. 2012a. Virulence factors and phylogenetic grouping of Escherichia coli isolates from patients with bacteraemia of urinary tract origin relate to sex and hospital- vs. community-acquired origin. Int.J.Med.Microbiol., 302, (3) 129-134
Skjot-Rasmussen, L., Olsen, S., Frimodt-Moller, N., Hammerum, A., & Jakobsen, L. Unusual pathogenic B1 genotype (yjaA/TspE4.C2) detected among Escherichia coli from pig, chicken broiler meat, and human extraintestinal infection. European Congress of Clinical Microbiology and Infectious Diseases 2013. 27-4-2013.
Skjot-Rasmussen, L., Olsen, S., Jakobsen, L., Ejrnaes, K., Scheutz, F., Lundgren, B., Frimodt-Moller, N., & Hammerum, A. 2012b. Escherichia coli clonal group A causing bacteraemia of urinary tract origin. Clin. Microbiol.Infect., epub ahead of print,
Skold, O. 2001. Resistance to trimethoprim and sulfonamides. Vet.Res., 32, (3-4) 261-273
Skurnik, D., Roux, D., Cattoir, V., Danilchanka, O., Lu, X., Yoder-Himes, D.R., Han, K., Guillard, T., Jiang, D., Gaultier, C., Guerin, F., Aschard, H., Leclercq, R., Mekalanos, J.J., Lory, S., & Pier, G.B. 2013. Enhanced in vivo fitness of carbapenem-resistant oprD mutants of Pseudomonas aeruginosarevealed through high-throughput sequencing. Proc.Natl.Acad.Sci.U.S.A, 110, (51) 20747-20752

Page | 239
Smet, A., Martel, A., Persoons, D., Dewulf, J., Heyndrickx, M., Claeys, G., Lontie, M., Van, M.B., Herman, L., Haesebrouck, F., & Butaye, P. 2010. Characterization of extended-spectrum beta-lactamases produced by Escherichia coli isolated from hospitalized and nonhospitalized patients: emergence of CTX-M-15-producing strains causing urinary tract infections. Microb.Drug Resist., 16, (2) 129-134
Smith, H.R., Scotland, S.M., Willshaw, G.A., Rowe, B., Cravioto, A., & Eslava, C. 1994. Isolates of Escherichia coli O44:H18 of diverse origin are enteroaggregative. J.Infect.Dis., 170, (6) 1610-1613
Smith, J., Fratamico, P., & Gunther, N. 2007. Review: Extraintestinal Pathogenic Escherichia Coli. Foodborne Pathog.Dis., 4, (2) 134-163
Smith, T.L. 1965. External morphology of the larva, pupa and adult of the Wax moth, Galleria mellonella L. J. Kan. Entomol. Soc., 38, (3) 287-310
Sogaard, M., Norgaard, M., Pedersen, L., Sorensen, H.T., & Schonheyder, H.C. 2011. Blood culture status and mortality among patients with suspected community-acquired bacteremia: a population-based cohort study. BMC.Infect.Dis., 139-11
Spurbeck, R.R., Stapleton, A.E., Johnson, J.R., Walk, S.T., Hooton, T.M., & Mobley, H.L. 2011. Fimbrial profiles predict virulence of uropathogenic Escherichia coli strains: contribution of ygi and yad fimbriae. Infect.Immun., 79, (12) 4753-4763
Srinivasan, U., Foxman, B., & Marrs, C.F. 2003. Identification of a gene encoding heat-resistant agglutinin in Escherichia coli as a putative virulence factor in urinary tract infection. J. Clin.Microbiol., 41, (1) 285-289
Staaf, M., Weintraub, A., & Widmalm, G. 1999. Structure determination of the O-antigenic polysaccharide from the enteroinvasive Escherichia coli O136. Eur.J.Biochem., 263, (3) 656-661
Strahilevitz, J., Jacoby, G., Hooper, D., & Robicsek, A. 2009. Plasmid-mediated quinolone resistance: a multifaceted threat. Clin.Microbiol. Rev., 22, (4) 664-689
Stromberg, N., Marklund, B.I., Lund, B., Ilver, D., Hamers, A., Gaastra, W., Karlsson, K.A., & Normark, S. 1990. Host-specificity of uropathogenic Escherichia coli depends on differences in binding specificity to Gal alpha 1-4Gal-containing isoreceptors. EMBO J., 9, (6) 2001-2010
Subashchandrabose, S., Smith, S.N., Spurbeck, R.R., Kole, M.M., & Mobley, H.L. 2013. Genome-wide detection of fitness genes in uropathogenic Escherichia coli during systemic infection. PLoS.Pathog., 9, (12) e1003788
Surgers, L., Valin, N., Carbonne, B., Bingen, E., Lalande, V., Pacanowski, J., Meyohas, M.C., Girard, P.M., & Meynard, J.L. 2012. Evolving microbiological epidemiology and high fetal mortality in 135 cases of bacteremia during pregnancy and postpartum. Eur J Clin Microbiol Infect Dis 1-7
Sussman, M. 1985, "Escherichia coli in animal and human disease," In The virulence of Escherichia coli, M. Sussman, ed., London: Academic Press Inc.
Szemiako, K., Krawczyk, B., Samet, A., Sledzinska, A., Nowicki, B., Nowicki, S., & Kur, J. 2013. A subset of two adherence systems, acute pro-inflammatory pap genes and invasion coding dra, fim, or sfa, increases the risk of Escherichia coli translocation to the bloodstream. Eur.J.Clin.Microbiol.Infect.Dis., 32, (12) 1579-1582

Page | 240
Taieb, F., Nougayrede, J., Watrin, C., Samba-Louaka, A., & Oswald, E. 2006. Escherichia colicyclomodulin Cif induces G2 arrest of the host cell cycle without activation of the DNA-damage checkpoint-signalling pathway. Cell. Microbiol., 8, (12) 1910-1921
Takahashi, S., Kurimura, Y., Takeyama, K., Hashimoto, K., Miyamoto, S., Ichihara, K., Igarashi, M., Hashimoto, J., Furuya, R., Hotta, H., Uchida, K., Miyao, N., Yanase, M., Takagi, Y., Tachiki, H., Taguchi, K., & Tsukamoto, T. 2009. Efficacy of treatment with carbapenems and third-generation cephalosporins for patients with febrile complicated pyelonephritis. J.Infect.Chemother., 15, (6) 390-395
Tanskanen, J., Saarela, S., Tankka, S., Kalkkinen, N., Rhen, M., Korhonen, T.K., & Westerlund-Wikstrom, B. 2001. The gaf fimbrial gene cluster of Escherichia coli expresses a full-size and a truncated soluble adhesin protein. J.Bacteriol., 183, (2) 512-519
Tarchouna, M., Ferjani, A., Ben-Selma, W., & Boukadida, J. 2013. Distribution of uropathogenic virulence genes in Escherichia coli isolated from patients with urinary tract infection. Int.J.Infect.Dis.(13) 10
Tarr, P.I., Bilge, S.S., Vary, J.C., Jr., Jelacic, S., Habeeb, R.L., Ward, T.R., Baylor, M.R., & Besser, T.E. 2000. Iha: a novel Escherichia coli O157:H7 adherence-conferring molecule encoded on a recently acquired chromosomal island of conserved structure. Infect. Immun., 68, (3) 1400-1407
Tartof, S.Y., Solberg, O.D., Manges, A.R., & Riley, L.W. 2005. Analysis of a uropathogenic Escherichia coli clonal group by multilocus sequence typing. J. Clin. Microbiol., 43, (12) 5860-5864
The European Committee on Antimicrobial Susceptibility Testing. Breakpoint tables for interpretation of MICs and zone diameters. 4.0. 2014. http://www.eucast.org/fileadmin/src/media/PDFs/EUCAST_files/Breakpoint_tables/Breakpoint_table_v_3.1.pdf
Thomson, C.J. & Amyes, S.G. 1993. Molecular epidemiology of the plasmid-encoded TEM-1 beta-lactamase in Scotland. Epidemiol.Infect., 110, (1) 117-125
Toth, I., Herault, F., Beutin, L., & Oswald, E. 2003. Production of cytolethal distending toxins by pathogenic Escherichia coli strains isolated from human and animal sources: establishment of the existence of a new cdt variant (Type IV). J. Clin.Microbiol., 41, (9) 4285-4291
Totsika, M., Kostakioti, M., Hannan, T.J., Upton, M., Beatson, S.A., Janetka, J.W., Hultgren, S.J., & Schembri, M.A. 2013. A FimH inhibitor prevents acute bladder infection and treats chronic cystitis caused by multidrug-resistant uropathogenic Escherichia coli ST131. J.Infect.Dis., 208, (6) 921-928
Tourret, J., Diard, M., Garry, L., Matic, I., & Denamur, E. 2010. Effects of single and multiple pathogenicity island deletions on uropathogenic Escherichia coli strain 536 intrinsic extra-intestinal virulence. Int.J.Med.Microbiol., 300, (7) 435-439
Toval, F., Kohler, C.D., Vogel, U., Wagenlehner, F., Mellmann, A., Fruth, A., Schmidt, M.A., Karch, H., Bielaszewska, M., & Dobrindt, U. 2014. Characterization of Escherichia coli isolates from hospital inpatients or outpatients with urinary tract infection. J. Clin. Microbiol., 52, (2) 407-418
Tunkel, A.R., Hartman, B.J., Kaplan, S.L., Kaufman, B.A., Roos, K.L., Scheld, W.M., & Whitley, R.J. 2004. Practice guidelines for the management of bacterial meningitis. Clin.Infect.Dis., 39, (9) 1267-1284

Page | 241
Turton, J.F., Kaufmann, M.E., Warner, M., Coelho, J., Dijkshoorn, L., van der Reijden, T., & Pitt, T.L. 2004. A prevalent, multiresistant clone of Acinetobacter baumannii in Southeast England. J.Hosp.Infect., 58, (3) 170-179
Ulett, G.C., Totsika, M., Schaale, K., Carey, A.J., Sweet, M.J., & Schembri, M.A. 2013. Uropathogenic Escherichia coli virulence and innate immune responses during urinary tract infection. Curr.Opin.Microbiol. (13) 10
Underwood, A.P., Dallman, T., Thomson, N.R., Williams, M., Harker, K., Perry, N., Adak, B., Willshaw, G., Cheasty, T., Green, J., Dougan, G., Parkhill, J., & Wain, J. 2013. Public health value of next-generation DNA sequencing of enterohemorrhagic Escherichia coli isolates from an outbreak. J. Clin.Microbiol., 51, (1) 232-237
van Gageldonk-Lafeber, A.B., Wever, P.C., van der Lubben, I.M., de Jager, C.P., Meijer, A., de Vries, M.C., Elberse, K., van der Sande, M.A., & van der Hoek, W. 2013. The aetiology of community-acquired pneumonia and implications for patient management. Neth.J.Med., 71, (8) 418-425
Vanhomwegen, J., Berthet, N., Mazuet, C., Guigon, G., Vallaeys, T., Stamboliyska, R., Dubois, P., Kennedy, G.C., Cole, S.T., Caro, V., Manuguerra, J.C., & Popoff, M.R. 2013. Application of high-density DNA resequencing microarray for detection and characterization of botulinum neurotoxin-producing clostridia. PLoS ONE, 8, (6) e67510
Venier, A., Talon, D., Patry, I., Mercier-Girard, D., & Bertrand, X. 2007. Patient and bacterial determinants involved in symptomatic urinary tract infection caused by Escherichia coli with and without bacteraemia. Clin. Microbiol. Infect., 13, (2) 205-208
Vogt, D., Overesch, G., Endimiani, A., Collaud, A., Thomann, A., & Perreten, V. 2014. Occurrence and Genetic Characteristics of Third-Generation Cephalosporin-Resistant Escherichia coli in Swiss Retail Meat. Microb.Drug Resist., 20, (5) 485-494
Wagenlehner, F.M., Lichtenstern, C., Rolfes, C., Mayer, K., Uhle, F., Weidner, W., & Weigand, M.A. 2013a. Diagnosis and management for urosepsis. Int.J.Urol., 20, (10) 963-970
Wagenlehner, F.M., Pilatz, A., Bschleipfer, T., Diemer, T., Linn, T., Meinhardt, A., Schagdarsurengin, U., Dansranjavin, T., Schuppe, H.C., & Weidner, W. 2013b. Bacterial prostatitis. World J.Urol., 31, (4) 711-716
Wagner, S. Use of the E. coli combined genotyping array (Alere Technologies) to investigate canine E. coli isolates from urinary tract infections. 29-11-2012. Presented at BSAC Antimicrobial Resistance Workshop, Birmingham, UK.
Wagner, S., Gally, D.L., & Argyle, S.A. 2014. Multidrug-resistant Escherichia coli from canine urinary tract infections tend to have commensal phylotypes, lower prevalence of virulence determinants and ampC-replicons. Vet.Microbiol., 169, (3-4) 171-178
Wallace-Gadsden, F., Johnson, J.R., Wain, J., & Okeke, I.N. 2007. Enteroaggregative Escherichia colirelated to uropathogenic clonal group A. Emerg.Infect.Dis., 13, (5) 757-760
Wand, M., McCowen, J., Nugent, P., & Sutton, J. 2013. Complex interactions of Klebsiella pneumoniae with the host immune system in a Galleria mellonella infection model. J.Med.Microbiol., 62, (Pt 12) 1790-1798

Page | 242
Wang, J., Stephan, R., Karczmarczyk, M., Yan, Q., Hachler, H., & Fanning, S. 2013. Molecular characterization of bla ESBL-harboring conjugative plasmids identified in multi-drug resistant Escherichia coli isolated from food-producing animals and healthy humans. Front Microbiol., 4, 188
Wang, X.M., Liao, X.P., Zhang, W.J., Jiang, H.X., Sun, J., Zhang, M.J., He, X.F., Lao, D.X., & Liu, Y.H. 2010. Prevalence of serogroups, virulence genotypes, antimicrobial resistance, and phylogenetic background of avian pathogenic Escherichia coli in south of China. Foodborne.Pathog.Dis, 7, (9) 1099-1106
Waters, V.L. & Crosa, J.H. 1991. Colicin V virulence plasmids. Microbiol.Rev., 55, (3) 437-450
Wei, C., Cheng, Z., Zhang, L., & Yang, J. 2013. Microbiology and prognostic factors of hospital- and community-acquired aspiration pneumonia in respiratory intensive care unit. Am.J.Infect.Control, 41, (10) 880-884
Weissman, S.J., Johnson, J.R., Tchesnokova, V., Billig, M., Dykhuizen, D., Riddell, K., Rogers, P., Qin, X., Butler-Wu, S., Cookson, B.T., Fang, F.C., Scholes, D., Chattopadhyay, S., & Sokurenko, E. 2012. High-resolution two-locus clonal typing of extraintestinal pathogenic Escherichia coli. Appl.Environ.Microbiol., 78, (5) 1353-1360
Welch, R.A., Burland, V., Plunkett, G., III, Redford, P., Roesch, P., Rasko, D., Buckles, E.L., Liou, S.R., Boutin, A., Hackett, J., Stroud, D., Mayhew, G.F., Rose, D.J., Zhou, S., Schwartz, D.C., Perna, N.T., Mobley, H.L., Donnenberg, M.S., & Blattner, F.R. 2002. Extensive mosaic structure revealed by the complete genome sequence of uropathogenic Escherichia coli. Proc.Natl.Acad.Sci.U.S.A., 99, (26) 17020-17024
Werner, N.L., Hecker, M.T., Sethi, A.K., & Donskey, C.J. 2011. Unnecessary use of fluoroquinolone antibiotics in hospitalized patients. BMC.Infect.Dis., 187-11
Wester, A.L., Dunlop, O., Melby, K.K., Dahle, U.R., & Wyller, T.B. 2013. Age-related differences in symptoms, diagnosis and prognosis of bacteremia. BMC.Infect.Dis., 13, (1) 346
Whiteway, J., Koziarz, P., Veall, J., Sandhu, N., Kumar, P., Hoecher, B., & Lambert, I.B. 1998. Oxygen-insensitive nitroreductases: analysis of the roles of nfsA and nfsB in development of resistance to 5-nitrofuran derivatives in Escherichia coli. J.Bacteriol., 180, (21) 5529-5539
Whitfield, C. & Roberts, I.S. 1999. Structure, assembly and regulation of expression of capsules in Escherichia coli. Mol.Microbiol., 31, (5) 1307-1319
Wiesner, M., Fernández-Mora, M., Cevallos, M., Zavala-Alvarado, C., Zaidi, M., Calva, E. & Silva, C. 2013. Conjugative transfer of an IncA/C plasmid-borne blaCMY-2 gene through genetic re-arrangements with an IncX1 plasmid. BMC Microbiol., 13, 264
Wiles, T., Kulesus, R., & Mulvey, M. 2008. Origins and virulence mechanisms of uropathogenic Escherichia coli. Exp.Mol. Path., 85, (1) 11-19
Williamson, D.A., Barrett, L.K., Rogers, B.A., Freeman, J.T., Hadway, P., & Paterson, D.L. 2013a. Infectious complications following transrectal ultrasound-guided prostate biopsy: new challenges in the era of multidrug-resistant Escherichia coli. Clin.Infect.Dis., 57, (2) 267-274
Williamson, D.A., Lim, A., Wiles, S., Roberts, S.A., & Freeman, J.T. 2013b. Population-based incidence and comparative demographics of community-associated and healthcare-associated Escherichia colibloodstream infection in Auckland, New Zealand, 2005 -- 2011. BMC.Infect.Dis., 13, (1) 385

Page | 243
Williamson, D.A., Mills, G., Johnson, J.R., Porter, S., & Wiles, S. 2014. In vivo correlates of molecularly inferred virulence among extraintestinal pathogenic Escherichia coli (ExPEC) in the wax moth Galleria mellonella model system. Virulence., 5, (3) 388-393
Wirth, T., Falush, D., Lan, R., Colles, F., Mensa, P., Wieler, L., Karch, H., Reeves, P., Maiden, M., Ochman, H., & Achtman, M. 2006. Sex and virulence in Escherichia coli: an evolutionary perspective. Molecular Microbiology, 60, (5) 1136-1151
Woodford, N. 2010. Rapid characterization of beta-lactamases by multiplex PCR. Methods Mol.Biol., 642, 181-192
Woodford, N., Carattoli, A., Karisik, E., Underwood, A., Ellington, M.J., & Livermore, D.M. 2009. Complete nucleotide sequences of plasmids pEK204, pEK499, and pEK516, encoding CTX-M enzymes in three major Escherichia coli lineages from the United Kingdom, all belonging to the international O25:H4-ST131 clone. Antimicrob. AgentsChemother., 53, (10) 4472-4482
Woodford, N., Reddy, S., Fagan, E.J., Hill, R.L., Hopkins, K.L., Kaufmann, M.E., Kistler, J., Palepou, M.F., Pike, R., Ward, M.E., Cheesbrough, J., & Livermore, D.M. 2007. Wide geographic spread of diverse acquired AmpC beta-lactamases among Escherichia coli and Klebsiella spp. in the UK and Ireland. J.Antimicrob.Chemother., 59, (1) 102-105
Woodford, N., Ward, M.E., Kaufmann, M.E., Turton, J., Fagan, E.J., James, D., Johnson, A.P., Pike, R., Warner, M., Cheasty, T., Pearson, A., Harry, S., Leach, J.B., Loughrey, A., Lowes, J.A., Warren, R.E., & Livermore, D.M. 2004. Community and hospital spread of Escherichia coli producing CTX-M extended-spectrum beta-lactamases in the UK. J.Antimicrob.Chemother., 54, (4) 735-743
Woodford, N., Wareham, D.W., Guerra, B., & Teale, C. 2013. Carbapenemase-producing Enterobacteriaceae and non-Enterobacteriaceae from animals and the environment: an emerging public health risk of our own making? J.Antimicrob.Chemother., 69, (2) 287-291
World Health Organisation 2002. Prevention of hospital-acquired infections: a practical guide, 2 ed.
Wu, G., Day, M., Mafura, M., Nunez-Garcia, J., Fenner, J., Sharma, M., Essen-Zandbergen, A., Rodriguez, I., Dierikx, C., Kadlec, K., Schink, A., Wain, J., Helmuth, R., Guerra, B., Schwarz, S., Threlfall, J., Woodward, M., Woodford, N., Coldham, N., & Mevius, D. 2013. Comparative analysis of ESBL-positive Escherichia coli isolates from animals and humans from the UK, the Netherlands and Germany. PLoS ONE, 8, (9)
Xiao, Y. & Hu, Y. 2012. The major aminoglycoside-modifying enzyme AAC(3)-II found in Escherichia coli determines a significant disparity in its resistance to gentamicin and amikacin in China. Microb.Drug Resist., 18, (1) 42-46
Yamamoto, S., Nakano, M., Terai, A., Yuri, K., Nakata, K., Nair, G.B., Kurazono, H., & Ogawa, O. 2001. The presence of the virulence island containing the usp gene in uropathogenic Escherichia coli is associated with urinary tract infection in an experimental mouse model. J.Urol., 165, (4) 1347-1351
Yamane, K., Wachino, J., Suzuki, S., & Arakawa, Y. 2008. Plasmid-Mediated qepA Gene among Escherichia coli Clinical isolates from Japan. Antimicrob. Agents Chemother., 52, (4) 1564-1566
Yokoyama, K., Doi, Y., Yamane, K., Kurokawa, H., Shibata, N., Shibayama, K., Yagi, T., Kato, H., & Arakawa, Y. 2003. Acquisition of 16S rRNA methylase gene in Pseudomonas aeruginosa. Lancet, 362, (9399) 1888-1893

Page | 244
Younes, A., Hamouda, A., Dave, J., & Amyes, S.G. 2011. Prevalence of transferable blaCTX-M-15 from hospital- and community-acquired Klebsiella pneumoniae isolates in Scotland. J.Antimicrob.Chemother., 66, (2) 313-318

Page | 245
Appendices
Appendix A
Bart’s Health NHS Trust, R&D Approval

Page | 246
Public Health England, Project Approval

Page | 247
Appendix B
Materials and Reagents
Media
Agar and broths, once prepared according to the manufacturers’ instructions, were autoclaved at
121°C for 15 minutes. At PHE agar and broths were prepared by the Media department. At Queen
Mary’s agar and broths were prepared personally.
The majority of media was supplied by Oxoid (Basingstoke, UK), except where specified below, and
included: BrillianceTM UTI Agar, blood agar, nutrient agar, ISO-Sensitest agar, Mueller-Hinton agar,
Luria-Bertani (LB) agar and thiotone Craigie broth.
Media supplied from elsewhere included: Hedley Wright broth (Mast, Bootle, UK), SOC medium
(Bioline, London, UK) and LB broth (Sigma-Aldrich Company Ltd., Gillingham, Dorset, UK).
Antibiotics (see section 5.2.1.2)
All antibiotics used in this study were supplied by Sigma-Aldrich Company Ltd. (Gillingham, Dorset,
UK), except for those specified below:
Cefpirome sulphate (Sanofi-Aventis, Guildford, Surrey, UK)
Ertapenem and imipenem monohydrate (Merck Sharpe and Dohme (MSD) Ltd, Hoddesdon,
Hertfordshire, UK)
Lithium clavulanate (GlaxoSmithKline, Brentford, Middlesex, UK)
Meropenem (AstraZeneca, London, UK)
Temocillin (Eumedica, Basel, Switzerland)
Tigecycline (Pfizer, Walton Oaks, Surrey, UK)
Miscellaneous reagents
Formal saline: 160ml formaldehyde (Sigma), 800ml 17% sodium chloride (VWR International Ltd.)
and 15.2L distilled water (PHE)

Page | 248
Sterile phosphate buffered saline (PBS) and sterile distilled water: provided by the in-house media
departments (Blizard Institute, Queen Mary’s & PHE)
DNA and plasmid extraction (see sections 5.2.8 and 6.2.6)
Absolute ethanol (VWR International Ltd.): 70% ethanol prepared by diluting in sterile distilled water
DNeasy® Blood and Tissue Kit (Qiagen, Hilden, Germany)
Lysis buffer: 0.05M Tris (Sigma), 0.01M EDTA (VWR International Ltd.), 4% sodium-dodecyl-sulphate
(SDS) (Sigma), pH 12.45
Neutralisation buffer: 2M Tris (Sigma), pH 7.0
TE buffer: 0.05M Tris (Sigma), 0.01M ethylene-diamine-tetra-acetic acid (EDTA) (VWR International
Ltd.), pH 8.0
Solution A: 20mM EDTA (Sigma) and 400mM Tris (Gibco®, Life technologies, Paisley, UK), pH8
Solution B: 0.4M sodium hydroxide (Sigma)
Solution C: 400mM Tris (Life technologies) and 4% SDS (FlukaTM, Sigma)
5M sodium chloride (Sigma)
Sterile-filtered water (Sigma)
Sodium acetate, 3M, pH5.5 (Sigma)
Phenol: chloroform: isoamyl alcohol 25:24:1 saturated with 10mM Tris and 1mM EDTA, pH8 (Sigma)
Chloroform (BDH Prolabo®, VWR, UK)
PCR master mix(s) and enzymes (see sections 3.5, 4.2.6, 5.2.7, 6.2.2, 6.2.7 & 7.2.2)
All primers were sourced from Sigma.
FAST BLUE qPCR MasterMix (Eurogentec, Southampton, UK)
MyTaqTM Red Mix (Bioline)
Qiagen® Multiplex PCR kit (Qiagen)
ReddyMixTM PCR Master Mix (Thermo Scientific, MA, USA)
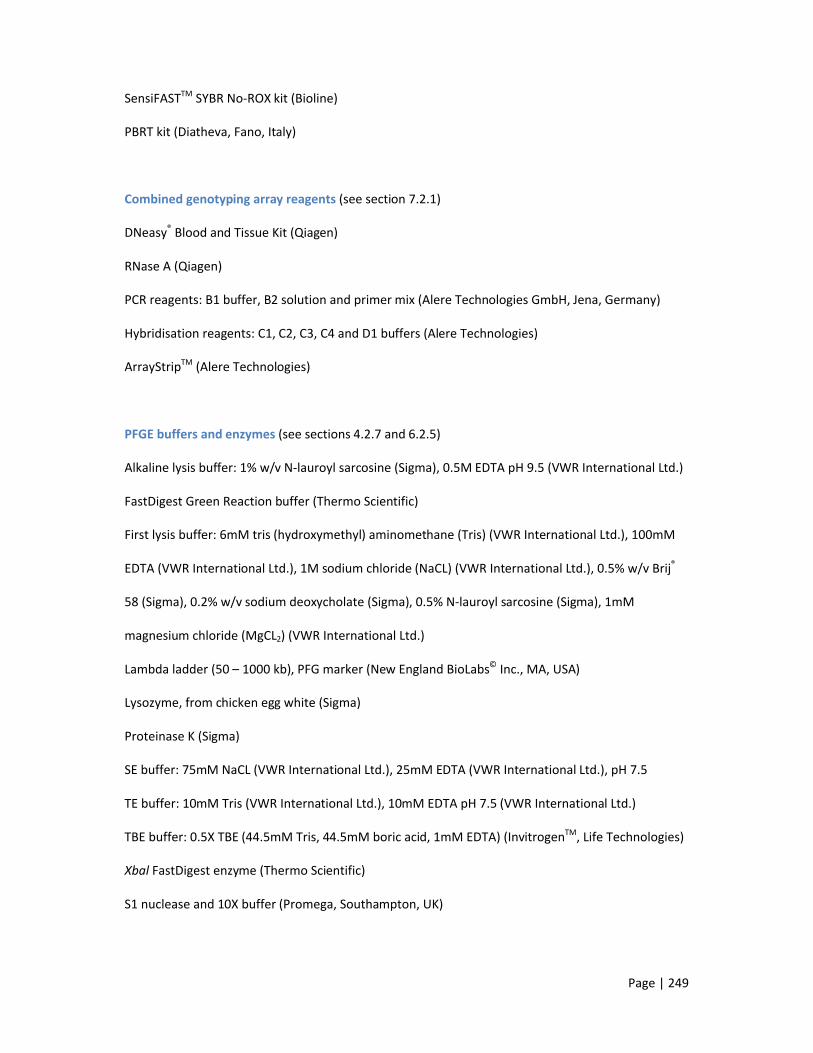
Page | 249
SensiFASTTM SYBR No-ROX kit (Bioline)
PBRT kit (Diatheva, Fano, Italy)
Combined genotyping array reagents (see section 7.2.1)
DNeasy® Blood and Tissue Kit (Qiagen)
RNase A (Qiagen)
PCR reagents: B1 buffer, B2 solution and primer mix (Alere Technologies GmbH, Jena, Germany)
Hybridisation reagents: C1, C2, C3, C4 and D1 buffers (Alere Technologies)
ArrayStripTM (Alere Technologies)
PFGE buffers and enzymes (see sections 4.2.7 and 6.2.5)
Alkaline lysis buffer: 1% w/v N-lauroyl sarcosine (Sigma), 0.5M EDTA pH 9.5 (VWR International Ltd.)
FastDigest Green Reaction buffer (Thermo Scientific)
First lysis buffer: 6mM tris (hydroxymethyl) aminomethane (Tris) (VWR International Ltd.), 100mM
EDTA (VWR International Ltd.), 1M sodium chloride (NaCL) (VWR International Ltd.), 0.5% w/v Brij®
58 (Sigma), 0.2% w/v sodium deoxycholate (Sigma), 0.5% N-lauroyl sarcosine (Sigma), 1mM
magnesium chloride (MgCL2) (VWR International Ltd.)
Lambda ladder (50 – 1000 kb), PFG marker (New England BioLabs© Inc., MA, USA)
Lysozyme, from chicken egg white (Sigma)
Proteinase K (Sigma)
SE buffer: 75mM NaCL (VWR International Ltd.), 25mM EDTA (VWR International Ltd.), pH 7.5
TE buffer: 10mM Tris (VWR International Ltd.), 10mM EDTA pH 7.5 (VWR International Ltd.)
TBE buffer: 0.5X TBE (44.5mM Tris, 44.5mM boric acid, 1mM EDTA) (InvitrogenTM, Life Technologies)
Xbal FastDigest enzyme (Thermo Scientific)
S1 nuclease and 10X buffer (Promega, Southampton, UK)

Page | 250
Electrophoresis solutions and reagents (see sections 3.6, 4.2.7 and 6.2.5)
BionicTM 10X buffer (Sigma)
DNA ladder, 100 bp or 123 bp (InvitrogenTM, Life Technologies)
Ethidium Bromide, 10 mg/ml (Sigma): dilute 1:10,000
GelredTM (Biotium, CA, USA): 3X solution, dilute 60 µl in 200 ml 0.1M NaCL (VWR International Ltd.)
MacroSieve Low Melt Agarose (Scientific Laboratory Supplies Ltd, Hessle, UK): 2.04g in 170ml 0.5X
TBE (InvitrogenTM, Life Technologies)
Sterile-filtered water (Sigma)
Tris-Borate-EDTA (TBE) buffer, 10X (Promega)
TE buffer, 100X (InvitrogenTM, Life Technologies): dilute 1:100
UltraPureTM agarose (InvitrogenTM, Life Technologies): 1.4g/70ml (2%) or 2.1g/70ml (3%)
UltraPureTM 10X TBE buffer (InvitrogenTM, Life Technologies)
DNA cloning and purification kits (see sections 5.2.8 and 6.2.6.3)
Alpha-select electrocompetent cells (Bioline)
Exonuclease I enzyme (New England BioLabs©)
Exonuclease I reaction buffer (New England BioLabs©)
MinElute® PCR purification kit (Qiagen)
QIAprep® Spin miniprep kit (Qiagen)
rAPid alkaline phosphatase reaction buffer (Roche Diagnostics Ltd, Burgess Hill, UK)
rAPid alkaline phosphatase enzyme (Roche Diagnostics Ltd)
TOPO TA cloning® kit (Invitrogen)
Galleria mellonella model (see section 8.2.3)
Galleria mellonella (Livefood UK Ltd, Rooks Bridge, Somerset, UK)
30ml universal container (STARLAB GmbH, Hamburg, Germany)

Page | 251
1 µl calibrated loop (STARLAB)
10 µl calibrated loop (STARLAB)
1 ml graduated pipette (STARLAB)
1.5 ml microcentrifuge tube (STARLAB)
Polypropylene L-shaped spreader (STARLAB)
FisherbrandTM extra-deep disposable petri dishes (Thermo Scientific)
WhatmanTM, Grade 1 circles, 240mm, filter paper (Whatman plc, Maidstone, UK)
25 µl, 22 gauge, gastight, bevel tip syringe (Hamilton, Bonaduz, Switzerland)
CytoTox 96® non-radioactive cytotoxicity assay (Promega)
Sterile disposable surgical scalpel (Swann-Morton, Sheffield, UK)
96-well polystyrene microplate, round well, flat bottom (STARLAB)
N-phenylthiourea, crystals (Alfa Aesar, Ward Hill, MA, USA)
Absolute ethanol (Thermo Scientific): diluted to 70% as described above
Consumables
Easy pierce heat sealing foil (Thermo Scientific)
GenePulser® 0.1cm cuvettes (Bio-rad, Hemel Hempstead, Hertfordshire, UK)
Microtitre plate, 96-well U bottom, non-sterile (Thermo Scientific)
PCR plate, 96-well low profile, non-skirted (Thermo Scientific)
PCR tube, 8 strip, 0.2 ml flat cap (Thermo Scientific)
PCR microtube with attached cap, 0.2 ml (Sigma)
Polystyrene tube, 15 ml, with conical bottom, blue screw cap (Greiner Bio-one GmbH,
Frickenhausen, Germany)
Pro-Lab DiagnosticsTM MicrobankTM Bacterial and Fungal Preservation System, cryobeads (Thermo
Scientific)
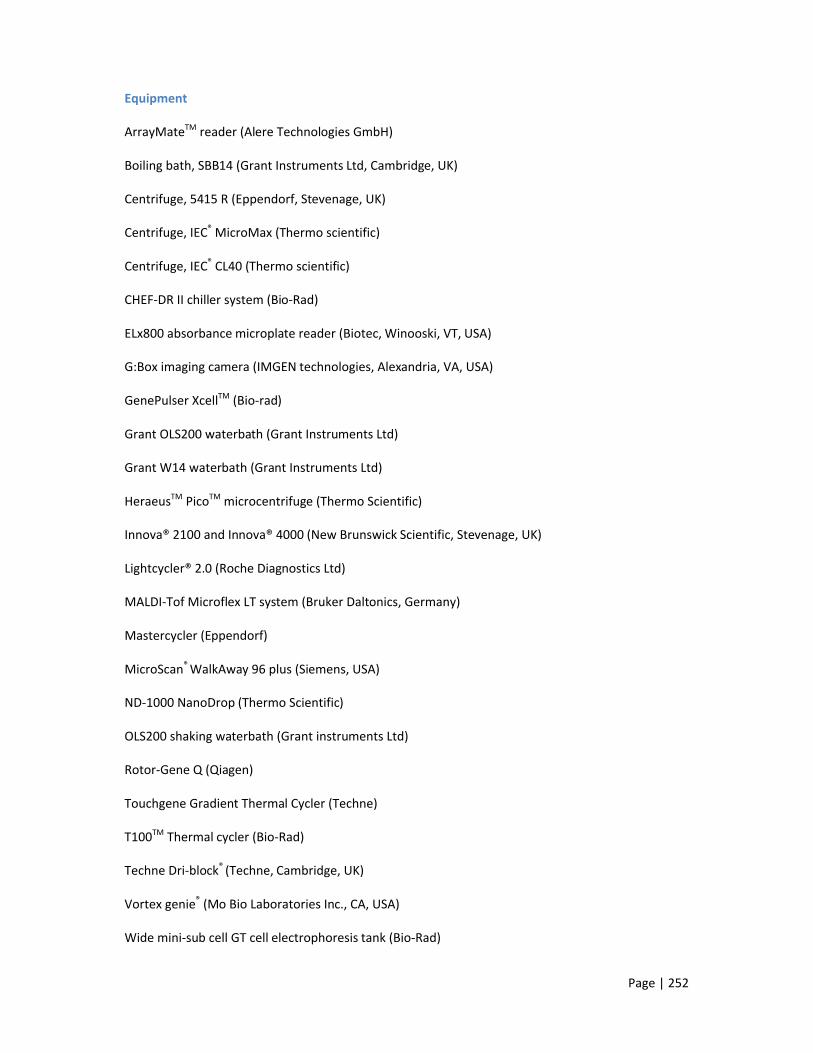
Page | 252
Equipment
ArrayMateTM reader (Alere Technologies GmbH)
Boiling bath, SBB14 (Grant Instruments Ltd, Cambridge, UK)
Centrifuge, 5415 R (Eppendorf, Stevenage, UK)
Centrifuge, IEC® MicroMax (Thermo scientific)
Centrifuge, IEC® CL40 (Thermo scientific)
CHEF-DR II chiller system (Bio-Rad)
ELx800 absorbance microplate reader (Biotec, Winooski, VT, USA)
G:Box imaging camera (IMGEN technologies, Alexandria, VA, USA)
GenePulser XcellTM (Bio-rad)
Grant OLS200 waterbath (Grant Instruments Ltd)
Grant W14 waterbath (Grant Instruments Ltd)
HeraeusTM PicoTM microcentrifuge (Thermo Scientific)
Innova® 2100 and Innova® 4000 (New Brunswick Scientific, Stevenage, UK)
Lightcycler® 2.0 (Roche Diagnostics Ltd)
MALDI-Tof Microflex LT system (Bruker Daltonics, Germany)
Mastercycler (Eppendorf)
MicroScan® WalkAway 96 plus (Siemens, USA)
ND-1000 NanoDrop (Thermo Scientific)
OLS200 shaking waterbath (Grant instruments Ltd)
Rotor-Gene Q (Qiagen)
Touchgene Gradient Thermal Cycler (Techne)
T100TM Thermal cycler (Bio-Rad)
Techne Dri-block® (Techne, Cambridge, UK)
Vortex genie® (Mo Bio Laboratories Inc., CA, USA)
Wide mini-sub cell GT cell electrophoresis tank (Bio-Rad)

Page | 253
Appendix C
PCR Primers
C1 E. coli Phylogenetic groupPrimer Sequence (5’-3’) Product Size (bp) Target ReferencegadA-F GATGAAATGGCGTTGGCGCAAG 373 Glutamate decarboxylase-α (Doumith et al. 2012)gadA-R GGCGGAAGTCCCAGACGATATCCchuA-F ATGATCATCGCGGCGTGCTG 281 Heme transport protein (Doumith et al. 2012)chuA-R AAACGCGCTCGCGCCTAATyjaA-F TGTTCGCGATCTTGAAAGCAAACGT 216 Unknown function, protein (Doumith et al. 2012)yjaA-R ACCTGTGACAAACCGCCCTCATSPE4.C2-F GCGGGTGAGACAGAAACGCG 152 Unknown function, DNA
fragment(Doumith et al. 2012)
TSPE4.C2-R TTGTCGTGAGTTGCGAACCCG
C2 Five most common ExPEC sequence types Primer Sequence (5’-3’) Product Size (bp) Target ReferenceST131-F GACTGCATTTCGTCGCCATA 310 (Doumith et al. 2014)ST131-R CCGGCGGCATCATAATGAAAST127-F CGCATAACAGGATTGTCTGG 404 This studyST127-R GCTATTCTACGGGCATTGTGST95-F ACTAATCAGGATGGCGAGAC 200 (Doumith et al. 2014)ST95-R ATCACGCCCATTAATCCAGTST73-F TGGTTTTACCATTTTGTCGGA 490 (Doumith et al. 2014)ST73-R GGAAATGGTTGATGTTGGCTST69-F AGAGAAAGGGCGTTCAGAAT 100 (Doumith et al. 2014)ST69-R ATCTGGAGGCAACAAGCATA

Page | 254
C3 E. coli Multi-locus sequence typing (Achtman Scheme)Primer Sequence (5’-3’) Product size
(bp)Target Annealing
Tm (°C)Reference
adk-F ATTCTGCTTGGCGCTCCGGG 583 Adenylate kinase 54 (Wirth et al. 2006)adk-R CCGTCAACTTTCGCGTATTTfumC-F TCACAGGTCGCCAGCGCTTC 806 Fumarate hydratase C 54 (Wirth et al. 2006)fumC-R GTACGCAGCGAAAAAGATTCgyrB-F TCGGCGACACGGATGACGGC 911 DNA gyrase, subunit B 54 (Wirth et al. 2006)gyrB-R ATCAGGCCTTCACGCGCATCicd-F ATGGAAAGTAAAGTAGTTGTTCCGGCACA 878 Isocitrate dehydrogenase 54 (Wirth et al. 2006)icd-R GGACGCAGCAGGATCTGTTmdh-F ATGAAAGTCGCAGTCCTCGGCGCTGCTGGCGG 932 Malate dehydrogenase 60 (Wirth et al. 2006)mdh-R TTAACGAACTCCTGCCCCAGAGCGATATCTTTCTTpurA-F CGCGCTGATGAAAGAGATGA 816 Adenylosuccinate synthetase 54 (Wirth et al. 2006)purA-R CATACGGTAAGCCACGCAGArecA-F ATCTACAGAGAAATCCGGCG 780 Recombinase A 60 (Wirth et al. 2006)recA-R TTTATCGATGCTGAACACGC
C4 fimH allele determinationPrimer Sequence Product size (bp) Target ReferencefimH-F CACTCAGGGAACCATTCAGGCA 976 Type 1 fimbriae, minor subunit (Weissman et al. 2012)fimH-M CGTTGTTTATAATTCGAGfimH-R CTTATTGATAAACAAAAGTCAC
C5 EAEC PCR (real-time PCR)Primer Sequence (5’-3’) Target ReferenceaggR-F CCATTTATCGCAATCAGATTAA aggR EAEC regulatory gene (Chattaway et al. 2014)aggR-R CAATGTATAGAAATCCGCTGTTaggR-probe Cy5-CAGCGATACATTAAGACGCCTAAAGGA -BHQ

Page | 255
C6 Sequencing primers: M13PCR Assay Primer Sequence (5’-3’) Product Size (bp) Target ReferenceM13 M13-F GTAAAACGACGGCCAG variable Lac promoter and lacZα
geneInvitrogen Cat. No. K4575-40M13-R CAGGAAACAGCTATGAC
C7 Genes encoding plasmid-mediated quinolone resistance determinantsPrimer Sequence (5’-3’) Product Size (bp) Target ReferenceqnrA-F CAGCAAGAGGATTTCTCACG 630 Quinolone resistance determinant A (Ciesielczuk et al. 2013)qnrA-R AATCCGGCAGCACTATTACTCqnrB-F GGCTGTCAGTTCTATGATCG 488 Quinolone resistance determinant B (Ciesielczuk et al. 2013)qnrB-R GAGCAACGATGCCTGGTAGqnrC-F GCAGAATTCAGGGGTGTGAT 118 Quinolone resistance determinant C (Ciesielczuk et al. 2013)qnrC-R AACTGCTCCAAAAGCTGCTCqnrD-F CGAGATCAATTTACGGGGAATA 581 Quinolone resistance determinant D (Cavaco et al. 2009)qnrD-R AACAAGCTGAAGCGCCTGqnrS-F GCAAGTTCATTGAACAGGGT 428 Quinolone resistance determinant S (Cattoir et al. 2007)qnrS-R TCTAAACCGTCGAGTTCGGCGqepA-F GCAGGTCCAGCAGCGGGTAG 218 Quinolone efflux pump A (Yamane et al. 2008)qepA-R CTTCCTGCCCGAGTATCGTGoqxA-F CCGCACCGATAAATTAGTCC 313 RND efflux pump protein A (Ciesielczuk et al. 2013)oqxA-R GGCGAGGTTTTGATAGTGGAaac(6’)-lb-cr-F ACACGGCTGGACCATA 260 6’-N-acetyltransferase, type lb-cr allele (Ciesielczuk et al. 2013)aac(6’)-lb-cr-R TTGGAAGCGGGGACGGAM
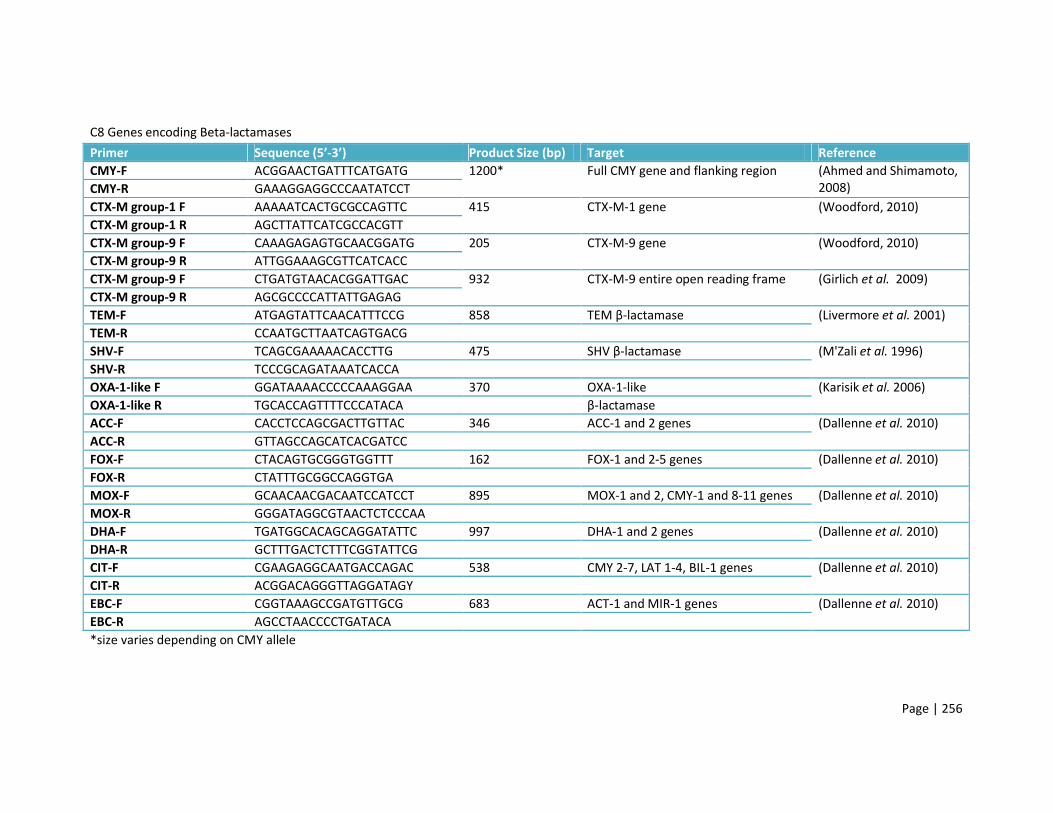
Page | 256
C8 Genes encoding Beta-lactamases Primer Sequence (5’-3’) Product Size (bp) Target ReferenceCMY-F ACGGAACTGATTTCATGATG 1200* Full CMY gene and flanking region (Ahmed and Shimamoto,
2008)CMY-R GAAAGGAGGCCCAATATCCTCTX-M group-1 F AAAAATCACTGCGCCAGTTC 415 CTX-M-1 gene (Woodford, 2010)CTX-M group-1 R AGCTTATTCATCGCCACGTTCTX-M group-9 F CAAAGAGAGTGCAACGGATG 205 CTX-M-9 gene (Woodford, 2010)CTX-M group-9 R ATTGGAAAGCGTTCATCACCCTX-M group-9 F CTGATGTAACACGGATTGAC 932 CTX-M-9 entire open reading frame (Girlich et al. 2009)CTX-M group-9 R AGCGCCCCATTATTGAGAGTEM-F ATGAGTATTCAACATTTCCG 858 TEM β-lactamase (Livermore et al. 2001)TEM-R CCAATGCTTAATCAGTGACGSHV-F TCAGCGAAAAACACCTTG 475 SHV β-lactamase (M'Zali et al. 1996)SHV-R TCCCGCAGATAAATCACCAOXA-1-like F GGATAAAACCCCCAAAGGAA 370 OXA-1-like (Karisik et al. 2006)OXA-1-like R TGCACCAGTTTTCCCATACA β-lactamaseACC-F CACCTCCAGCGACTTGTTAC 346 ACC-1 and 2 genes (Dallenne et al. 2010)ACC-R GTTAGCCAGCATCACGATCCFOX-F CTACAGTGCGGGTGGTTT 162 FOX-1 and 2-5 genes (Dallenne et al. 2010)FOX-R CTATTTGCGGCCAGGTGAMOX-F GCAACAACGACAATCCATCCT 895 MOX-1 and 2, CMY-1 and 8-11 genes (Dallenne et al. 2010)MOX-R GGGATAGGCGTAACTCTCCCAADHA-F TGATGGCACAGCAGGATATTC 997 DHA-1 and 2 genes (Dallenne et al. 2010)DHA-R GCTTTGACTCTTTCGGTATTCGCIT-F CGAAGAGGCAATGACCAGAC 538 CMY 2-7, LAT 1-4, BIL-1 genes (Dallenne et al. 2010)CIT-R ACGGACAGGGTTAGGATAGYEBC-F CGGTAAAGCCGATGTTGCG 683 ACT-1 and MIR-1 genes (Dallenne et al. 2010)EBC-R AGCCTAACCCCTGATACA*size varies depending on CMY allele

Page | 257
C9 Genes encoding aminoglycoside modifying enzymes Primer Sequence (5’-3’) Product Size (bp) Target (annealing temperature, °C) Referenceaph(3’)-VI - F CGGAAACAGCGTTTTAGA 716 3’-phosphotransferase, type VI (49) (Noppe-Leclercq et al.
1999)aph(3’)-VI - R TTCCTTTTGTCAGGTCant(2’’)-Ia - F T 404 2’-nucleotidyltransferase, type Ia (49) (Noppe-Leclercq et al.
1999)ant(2’’)-Ia - R CGAGCCTGTAGGACTaac(6’)-Ih - F TGCCGATATCTGAATC 407 6’-acetyltransferase, type Ih (58) (Noppe-Leclercq et al.
1999)aac(6’)-Ih - R ACACCACACGTTCAGaac(3)-Ia - F GACATAAGCCTGTTCGGTT 372 3-acetyltransferase, type Ia (58) (Noppe-Leclercq et al.
1999)aac(3)-Ia - R CTCCGAACTCACGACCGAaac(3)-IIa - F ATGCATACGCGGAAGGC 822 3-acetyltransferase, type IIa (58) (Noppe-Leclercq et al.
1999)aac(3)-IIa - R TGCTGGCACGATCGGAGaac(6’)-Ib - F TATGAGTGGCTAAATCGAT 395 6’-acetyltransferase, type Ib (55) (Noppe-Leclercq et al.
1999)aac(6’)-Ib - R CCCGCTTTCTCGTAGCAaph(3’)-Ia - F CGAGCATCAAATGAAACTGC 623 3’-phosphotransferase, type Ia (55) (Noppe-Leclercq et al.
1999)aph(3’)-Ia - R GCGTTGCCAATGATGTTACAGaacA-aphD - F GAGCAATAAGGGCATACCAAA 829 Acetyltransferase-phosphotransferase
(56)(Leelaporn et al. 2008)
aacA-aphD - R GTTCCTATTTCTTCTTCACTATCTTCAaph(2’’)-Ib - F TCAAATCCCTGCGGTAGTGTA 428 2’’-phosphotransferase, type Ib (56) (Leelaporn et al. 2008)aph(2’’)-Ib - R CGCCAAAATCAATAACTCCAAaph(2’’)-Ic - F GAGGGCTTTAGGAATTACGC 125 2’’-phosphotransferase, type Ic (56) (Leelaporn et al. 2008)aph(2’’)-Ic - R ACACAACCGACCAACAGAGGaph(2’’)-Id - F TAATCTGCCGAAGCAATCTCA 550 2’’-phosphotransferase, type Id (56) (Leelaporn et al. 2008)aph(2’’)-Id - R TAATCCCTCTTCATACCAATCCaadA - F ACCGTAAGGCTTGATGAAACA 624 3’’-adenyltransferase (56) (Leelaporn et al. 2008)aadA - R GCCGACTACCTTGGTGATCTCaadE - F GCCCTTGGAAGAGTTAGATAATT 198 6’-adenyltransferase (56) (Leelaporn et al. 2008)aadE - R CGGCACAATCCTTTAATAACA

Page | 258
Primer Sequence (5’-3’) Product Size (bp) Target ReferencearmA - F TATGGGGGTCTTACTATTCTGCCTAT 545 16S methyltransferases ArmA (Fritsche et al. 2008)armA - R TCTTCCATTCCCTTCTCCTTTrmtA - F CTAGCGTCCATCCTTTCCTC 635 16S methyltransferases RmtA (Yokoyama et al. 2003)rmtA - R TTTGCTTCCATGCCCTTGCCrmtB - F TCAACGATGCCCTCACCTC 466 16S methyltransferases RmtB (Fritsche et al. 2008)rmtB - R GCAGGGCAAAGGTAAAATCCrmtC - F GCCAAAGTACTCACAAGTGG 752 16S methyltransferases RmtC (Fritsche et al. 2008)rmtC - R CTCAGATCTGACCCAACAAGrmtD - F CTGTTTGAAGCCAGCGGAACGC 376 16S methyltransferases RmtD (Fritsche et al. 2008)rmtD - R GCGCCTCCATCCATTCGGAATAGnpmA - F CTCAAAGGAACAAAGACGG 641 16S methyltransferases NpmA (Fritsche et al. 2008)npmA - R GAAACATGGCCAGAAACTC
C10 Genes encoding rifamycin resistance determinantsPrimer Sequence (5’-3’) Product Size (bp) Target Referencearr2/3-F CTATCATGGAACCAAAGCCA 296 arr-2 and arr-3 (Hopkins et al. 2014)arr2/3-R CAACGCCAACAATTCTCAAGarr4-F ACATCTACATCGTTGAACCG 190 arr-4 (Hopkins et al. 2014)arr4-R TGAAGATCCTCCAGAGACG
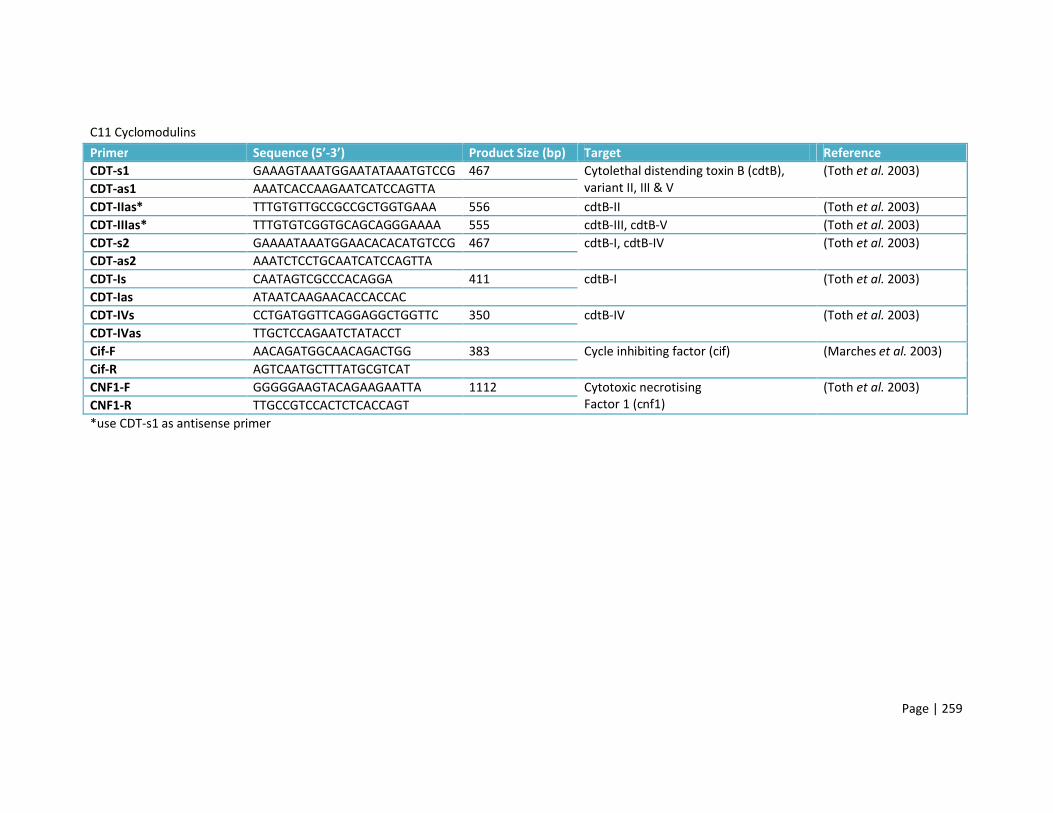
Page | 259
C11 CyclomodulinsPrimer Sequence (5’-3’) Product Size (bp) Target ReferenceCDT-s1 GAAAGTAAATGGAATATAAATGTCCG 467 Cytolethal distending toxin B (cdtB),
variant II, III & V(Toth et al. 2003)
CDT-as1 AAATCACCAAGAATCATCCAGTTACDT-IIas* TTTGTGTTGCCGCCGCTGGTGAAA 556 cdtB-II (Toth et al. 2003)CDT-IIIas* TTTGTGTCGGTGCAGCAGGGAAAA 555 cdtB-III, cdtB-V (Toth et al. 2003)CDT-s2 GAAAATAAATGGAACACACATGTCCG 467 cdtB-I, cdtB-IV (Toth et al. 2003)CDT-as2 AAATCTCCTGCAATCATCCAGTTACDT-Is CAATAGTCGCCCACAGGA 411 cdtB-I (Toth et al. 2003)CDT-Ias ATAATCAAGAACACCACCACCDT-IVs CCTGATGGTTCAGGAGGCTGGTTC 350 cdtB-IV (Toth et al. 2003)CDT-IVas TTGCTCCAGAATCTATACCTCif-F AACAGATGGCAACAGACTGG 383 Cycle inhibiting factor (cif) (Marches et al. 2003)Cif-R AGTCAATGCTTTATGCGTCATCNF1-F GGGGGAAGTACAGAAGAATTA 1112 Cytotoxic necrotising
Factor 1 (cnf1)(Toth et al. 2003)
CNF1-R TTGCCGTCCACTCTCACCAGT*use CDT-s1 as antisense primer

Page | 260
C12 Genes encoding ExPEC Virulence FactorsPrimer Mix 1 Sequence (5’-3’) Product Size (bp) Target ReferencePAI-F GGACATCCTGTTACAGCGCGCA 930 malX virulence marker (Johnson and Stell,
2000) updated protocol (2010)
PAI-R TCGCCACCAATCACAGCCGAACpapA-F ATGGCAGTGGTGTCTTTTGGTG 717 P-fimbriae, minor subunit ApapA-R CGTCCCACCATACGTGCTCTTCK15-F ACGGATTCACGACAAAGCTC 581 K15 capsule (Schneider et al. 2004)K15-R GGCAAATATCGCTTGGGTTAfimH-F TCGAGAACGGATAAGCCGTGG 508 Type 1 fimbriae, adhesin (Johnson and Stell,
2000) updated protocol (2010)
fimH-R GCAGTCACCTGCCCTCCGGTAkpsIII-F TCCTCTTGCTACTATTCCCCCT 392 Type III capsulekpsIII-R AGGCGTATCCATCCCTCCTAAC papEF-F GCAACAGCAACGCTGGTTGCATCAT 326 P-fimbriae, subunits E and FpapEF-R AGAGAGAGCCACTCTTATACGGACAVat-F AGAGACGAGACTGTATTTGC 289 Vacuolating toxin (Srinivasan et al. 2003)Vat-R GTCAGGTCAGTAACGAGCAC ireA-F GATGACTCAGCCACGGGTAA 254 ireA siderophore (Johnson and Stell,
2000) updated protocol (2010)
ireA-R CCAGGACTCACCTCACGAATIbe10-F AGGCAGGTGTGCGCCGCGTAC 171 Invasion of brain endothelium proteinIbe10-R TGGTGCTCCGGCAAACCATGC

Page | 261
Primer Mix 2 Sequence (5’-3’) Product Size (bp) Target ReferenceCnf1-F GGGGGAAGTACAGAAGAATTA 1112 Cytotoxic necrotising factor 1 (Toth et al. 2003)Cnf1-R TTGCCGTCCACTCTCACCAGTfyuA-F TGATTAACCCCGCGACGGGAA 787 Yersiniabactin (Johnson and Stell,
2000) updated protocol (2010)
fyuA-R CGCAGTAGGCACGATGTTGTAiroN-F AAGTCAAAGCAGGGGTTGCCCG 667 iroN E. coli siderophoreiroN-R GACGCCGACATTAAGACGCAGclbB-F GATTTGGATACTGGCGATAACCG 579 Pks PAI marker clbB (Nougayrede et al.
2006)clbB-R CCATTTCCCGTTTGAGCACACbmaE-F ATGGCGCTAACTTGCCATGCTG 507 Blood group M adhesin (Johnson and Stell,
2000) updated protocol (2010)
bmaE-R AGGGGGACATATAGCCCCCTTCSfa-F CTCCGGAGAACTGGGTGCATCTTAC 410 S-fimbriaeSfa-R CGGAGGAGTAATTACAAACCTGGCAiutA-F GGCTGGACATCATGGGAACTGG 302 AerobactiniutA-R CGTCGGGAACGGGTAGAATCGAllele III-F GGCCTGCAATGGATTTACCTGG 258 P-fimbriae, papG adhesin allele IIIAllele III-R CCACCAAATGACCATGCCAGACHra-F CGAATCGTTGTCACGTTCAG 162 Heat-resistant agglutinin (Srinivasan et al. 2003)Hra-R TATTTATCGCCCCACTCGTC

Page | 262
Primer Mix 3 Sequence (5’-3’) Product Size (bp) Target ReferencePic-F GGGTATTGTCCGTTCCGAT 1200 Protein involved in intestinal
colonisation(Wallace-Gadsden et al.2007)Pic-R ACAACGATACCGTCTCCCG
hlyD-F CTCCGGTACGTGAAAAGGAC 904 Alpha-haemolysin (Johnson and Stell, 2000) updated protocol (2010)
hlyD-R GCCCTGATTACTGAAGCCTGrfc-F ATCCATCAGGAGGGGACTGGA 788 Serogroup O4 regulatory generfc-R AACCATACCAACCAATGCGAG ompT-F ATCTAGCCGAAGAAGGAGGC 559 Outer membrane protein TompT-R CCCGGGTCATAGTGTTCATCAllele I’-F* CTACTATAGTTCATGCTCAGGTC 479 P-fimbriae, papG adhesin allele I’Allele I’-R CTGCATCCTCCACCATTATCGAAllele I-F* TCGTGCTCAGGTCCGGAATTT 461 P-fimbriae, papG adhesin allele IAllele I-R TGGCATCCCCCAACATTATCGIss-F CAGCAACCCGAACCACTTGATG 323 Increased serum survival proteinIss-R AGCATTGCCAGAGCGGCAGAAKii-F GCGCATTTGCTGATACTGTTG 272 Group 2/II capsule, except K2Kii-R CATCCAGACGATAAGCATGAGCApapC-F GTGGCAGTATGAGTAATGACCGTTA 205 P-fimbriae, subunit CPapC-R ATATCCTTTCTGCAGGGATGCAATA *if positive for allele I’ and/or allele I, repeated in separate simplex PCRs to identify allele
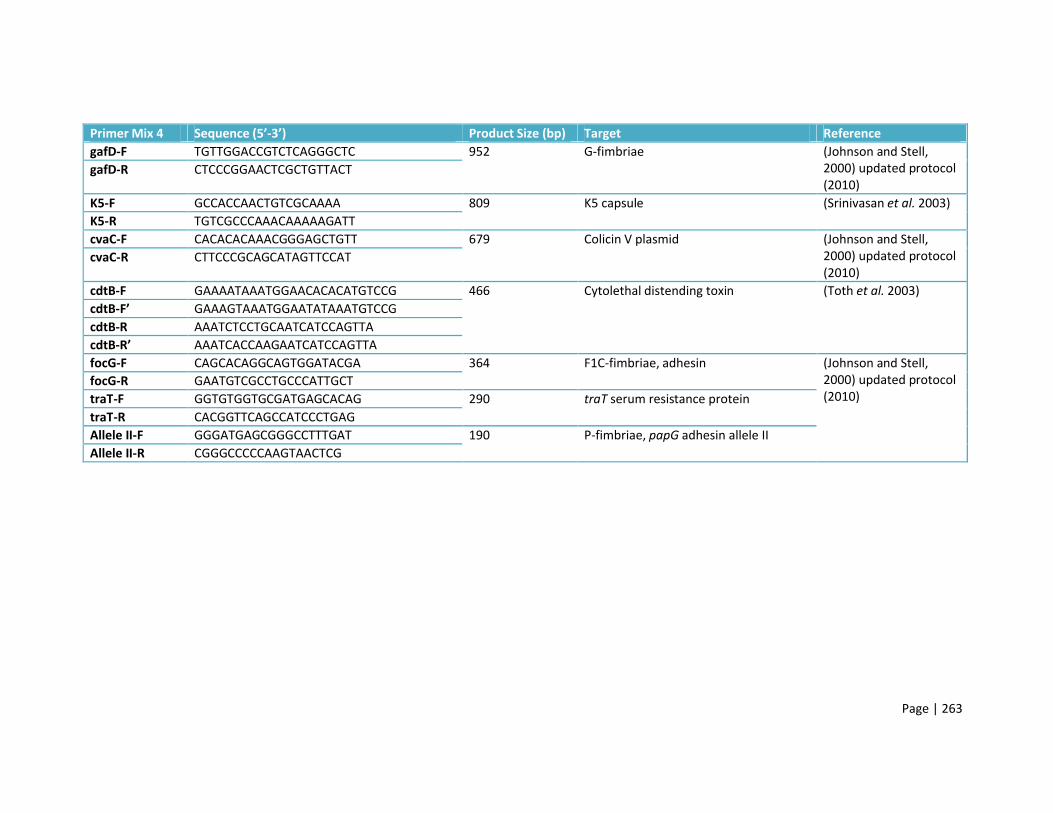
Page | 263
Primer Mix 4 Sequence (5’-3’) Product Size (bp) Target ReferencegafD-F TGTTGGACCGTCTCAGGGCTC 952 G-fimbriae (Johnson and Stell,
2000) updated protocol (2010)
gafD-R CTCCCGGAACTCGCTGTTACT
K5-F GCCACCAACTGTCGCAAAA 809 K5 capsule (Srinivasan et al. 2003)K5-R TGTCGCCCAAACAAAAAGATTcvaC-F CACACACAAACGGGAGCTGTT 679 Colicin V plasmid (Johnson and Stell,
2000) updated protocol (2010)
cvaC-R CTTCCCGCAGCATAGTTCCAT
cdtB-F GAAAATAAATGGAACACACATGTCCG 466 Cytolethal distending toxin (Toth et al. 2003)cdtB-F’ GAAAGTAAATGGAATATAAATGTCCGcdtB-R AAATCTCCTGCAATCATCCAGTTA cdtB-R’ AAATCACCAAGAATCATCCAGTTAfocG-F CAGCACAGGCAGTGGATACGA 364 F1C-fimbriae, adhesin (Johnson and Stell,
2000) updated protocol (2010)
focG-R GAATGTCGCCTGCCCATTGCTtraT-F GGTGTGGTGCGATGAGCACAG 290 traT serum resistance proteintraT-R CACGGTTCAGCCATCCCTGAGAllele II-F GGGATGAGCGGGCCTTTGAT 190 P-fimbriae, papG adhesin allele IIAllele II-R CGGGCCCCCAAGTAACTCG

Page | 264
Primer Mix 5 Sequence (5’-3’) Product Size (bp) Target ReferenceG allele 123-F CTGTAATTACGGAAGTGATTTCTG P-fimbriae, papG adhesin
alleles 1, 2 & 3(Johnson and Stell, 2000) updated protocol (2010)
G allele 1-R TCCAGAAATAGCTCATGTAACCCG 1140G allele 2&3-R ACTATCCGGCTCCGGATAAACCAT 1070iha-F CTGGCGGAGGCTCTGAGATCA 829 Iha adhesiniha-R TCCTTAAGCTCCCGCGGCTGAafa-F GGCAGAGGGCCGGCAACAGGC 594 Afimbrial adhesinafa-R CCCGTAACGCGCCAGCATCTChlyF-F TCGTTTAGGGTGCTTACCTTCAAC 444 Avian haemolysin (Morales et al. 2004)hlyF-R TTTGGCGGTTTAGGCATTCCtsh-F CCGTACACAAATACGACGG 300 Temperature-sensitive haemagglutinin Johnston, B. & Menard,
M., 2010. Unpublished.tsh-R GGATGCCCCTGCAGCGTsfaS-F GTGGATACGACGATTACTGTG 244 S-fimbriae (Johnson and Stell,
2000) updated protocol (2010)
sfaS-R CCGCCAGCATTCCCTGTATTCK1-F TAGCAAACGTTCTATTGGTGC 153 K1 capsuleK1-R (Kii-R) CATCCAGACGATAAGCATGAGCA

Page | 265
Primer Mix 6 Sequence (5’-3’) Product Size (bp) Target Referencesat-F GCAGCTACCGCAATAGGAGGT 937 Secreted autotransporter toxin (Johnson and Stell,
2000) updated protocol (2010)
sat-R CATTCAGAGTACCGGGGCCTA
clbN-F GTTTTGCTCGCCAGATAGTCATTC 733 Pks PAI marker clbN (Nougayrede et al.2006)clbN-R CAGTTCGGGTATGTGTGGAAGG
F17-F CGGAGCTAATACTGCATCAACC 615 F17 fimbriae (Johnson and Stell, 2000) updated protocol (2010)
F17-R TGTTGATATTCCGTTAACCGTACkpsII-F (Kii-F) GCGCATTTGCTGATACTGTTG 570 Type II capsulekpsII-R AGGTAGTTCAGACTCACACCT uidA-F GCGTCTGTTGACTGGCAGGTGGTGG 508 Beta-D-glucuronidaseuidA-R GTTGCCCGCTTCGAAACCAATGCCTusp-F ACATTCACGGCAAGCCTCAG 440 Uropathogenic-specific proteinusp-R AGCGAGTTCCTGGTGAAAGCclpG-F GGGCGCTCTCTCCTTCAAC 384 CS31A adhesinclpG-R CGCCCTAATTGCTGGCGACafaE8-F CTAACTTGCCATGCTGTGACAGTA 302 Afimbrial adhesin VIIIafaE8-R TTATCCCCTGCGTAGTTGTGAATCastA-F CCATCAACACAGTATATCCG 100 EAST1 toxinastA-R GGTCGCGAGTGACGGCTTTG

Page | 266
C13 ExPEC Pathogenicity IslandsPrimer Sequence (5’-3’) Product Size (bp) Target ReferenceCFT073 I-F GGACATCCTGTTACAGCGCGCA 930 malX (Johnson and Stell,
2000) updated protocol (2010)
CFT073 I-R TCGCCACCAATCACAGCGAAC
CFT073 II-F ATGGATGTTGTATCGCGC 400 ORF38 – ORF39 of CFT073 II, GenBank accession no. AF447814
(Sabate et al. 2006)CFT073 II-R ACGAGCATGTGGATCTGCJ96 I-F TCGTGCTCAGGTCCGGAATTT 461 papGI allele I (Johnson and Stell,
2000) updated protocol (2010)
J96 I-R TGGCATCCCACATTATCG
J96 II-F ATGAAAACATGGTTAATGGG 2300-2412 hlyD and cnf1 fragment (Sabate et al. 2006)J96 II-R GATATTTTTGTTGCCATTGGTTAC536 I-F TAATGCCGGAGATTCATTGTC 1800 1.9 and 1.10 (Dobrindt, 2002) (Dobrindt et al. 2002)536 I-R AGGATTTGTCTCAGGGCTTT536 II-F CATGTCCAAAGCTCGAGCC 1000 Orf1 up and orf1 down (Dobrindt, 2002) (Dobrindt et al. 2002)536 II-R CTACGTCAGGCTGGCTTTG536 III-F CGGGCATGCATCAATTATCTTTG 162-200 sfaA (Sabate et al. 2006)536 III-R TGTGTAGATGCAGTCACTCCG536 IV-F AAGGATTCGCTGTTACCGGAC 287-300 Irp2 (Karch et al. 1999)536 IV-R TCGTCGGGCAGCGTTTCTTCT

Page | 267
C14 Plasmid replicon typing Primer Sequence (5’-3’) Product Size (bp) Target ReferenceHI1-F GGAGCGATGGATTACTTCAGTAC 471 parA-parB (Carattoli et al. 2005)HI1-R TGCCGTTTCACCTCGTGAGTAHI2-F TTTCTCCTGAGTCACCTGTTAACAC 644 iterons (Carattoli et al. 2005)HI2-R GGCTCACTACCGTTGTCATCCTI1-F CGAAAGCCGGACGGCAGAA 139 RNAI (Carattoli et al. 2005)I1-R TCGTCGTTCCGCCAAGTTCGTX-F AACCTTAGAGGCTATTTAAGTTGCTGAT 376 ori γ (Carattoli et al. 2005)X-R TGAGAGTCAATTTTTATCTCATGTTTTAGCL/M-F GGATGAAAACTATCAGCATCTGAAG 785 repA, B, C (Carattoli et al. 2005)L/M-R CTGCAGGGGCGATTCTTTAGGN-F GTCTAACGAGCTTACCGAAG 559 repA (Carattoli et al. 2005)N-R GTTTCAACTCTGCCAAGTTCFIA-F CCATGCTGGTTCTAGAGAAGGTG 462 iterons (Carattoli et al. 2005)FIA-R GTATATCCTTACTGGCTTCCGCAGFIB-F GGAGTTCTGACACACGATTTTCTG 702 repA (Carattoli et al. 2005)FIB-R CTCCCGTCGCTTCAGGGCATTW-F CCTAAGAACAACAAAGCCCCCG 242 repA (Carattoli et al. 2005)W-R GGTGCGCGGCATAGAACCGTY-F AATTCAAACAACACTGTGCAGCCTG 765 repA (Carattoli et al. 2005)Y-R GCGAGAATGGACGATTACAAAACTTTP-F CTATGGCCCTGCAAACGCGCCAGAAA 534 iterons (Carattoli et al. 2005)P-R TCACGCGCCAGGGCGCAGCCFIC-F GTGAACTGGCAGATGAGGAAGG 262 repA2 (Carattoli et al. 2005)FIC-R TTCTCCTCGTCGCCAAACTAGAT

Page | 268
Primer Sequence (5’-3’) Product Size (bp) Target ReferenceA/C-F GAGAACCAAAGACAAAGACCTGGA 465 repA (Carattoli et al. 2005)A/C-R ACGACAAACCTGAATTGCCTCCTTT-F TTGGCCTGTTTGTGCCTAAACCAT 750 repA (Carattoli et al. 2005)T-R CGTTGATTACACTTAGCTTTGGACK/B-F GCGGTCCGGAAAGCCAGAAAAC 160 RNAI (Carattoli et al. 2005)K-R TCTTTCACGAGCCCGCCAAAK/B-F GCGGTCCGGAAAGCCAGAAAAC 159 RNAI (Carattoli et al. 2005)B/O-R TCTGCGTTCCGCCAAGTTCGA
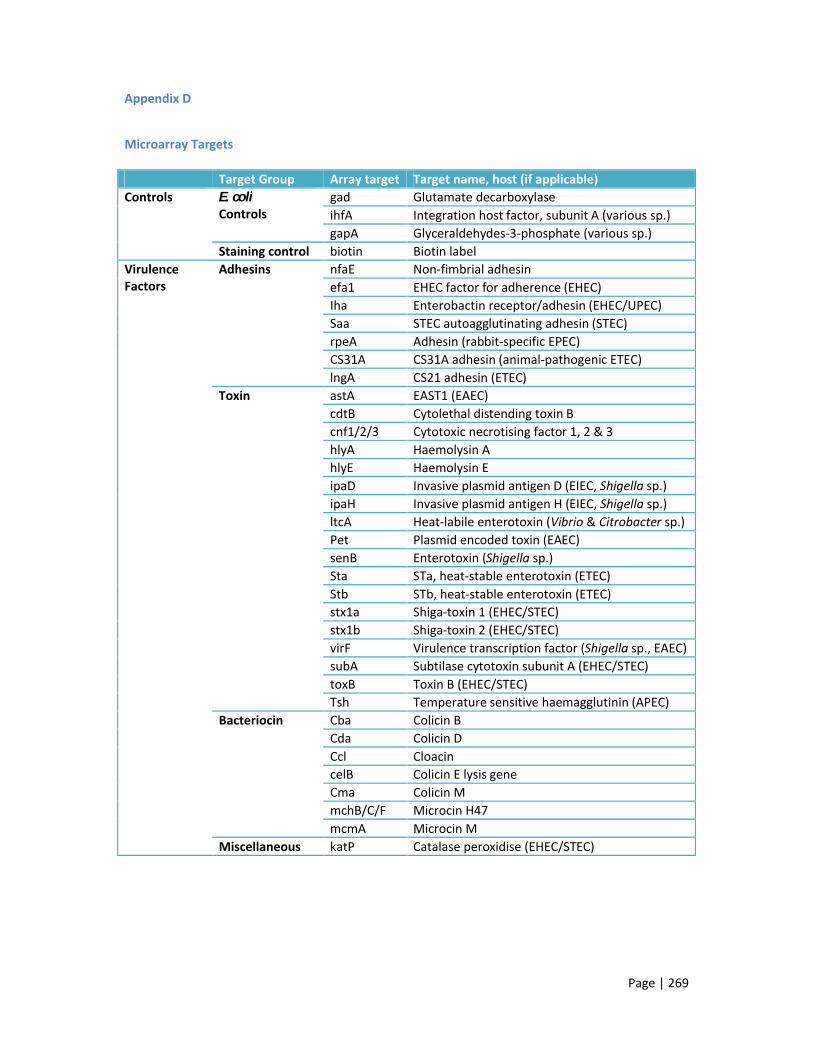
Page | 269
Appendix D
Microarray Targets
Target Group Array target Target name, host (if applicable)Controls E. coli
Controlsgad Glutamate decarboxylaseihfA Integration host factor, subunit A (various sp.)gapA Glyceraldehydes-3-phosphate (various sp.)
Staining control biotin Biotin labelVirulenceFactors
Adhesins nfaE Non-fimbrial adhesinefa1 EHEC factor for adherence (EHEC)Iha Enterobactin receptor/adhesin (EHEC/UPEC)Saa STEC autoagglutinating adhesin (STEC)rpeA Adhesin (rabbit-specific EPEC)CS31A CS31A adhesin (animal-pathogenic ETEC)lngA CS21 adhesin (ETEC)
Toxin astA EAST1 (EAEC)cdtB Cytolethal distending toxin Bcnf1/2/3 Cytotoxic necrotising factor 1, 2 & 3hlyA Haemolysin AhlyE Haemolysin EipaD Invasive plasmid antigen D (EIEC, Shigella sp.)ipaH Invasive plasmid antigen H (EIEC, Shigella sp.)ltcA Heat-labile enterotoxin (Vibrio & Citrobacter sp.) Pet Plasmid encoded toxin (EAEC)senB Enterotoxin (Shigella sp.)Sta STa, heat-stable enterotoxin (ETEC)Stb STb, heat-stable enterotoxin (ETEC)stx1a Shiga-toxin 1 (EHEC/STEC)stx1b Shiga-toxin 2 (EHEC/STEC)virF Virulence transcription factor (Shigella sp., EAEC)subA Subtilase cytotoxin subunit A (EHEC/STEC)toxB Toxin B (EHEC/STEC)Tsh Temperature sensitive haemagglutinin (APEC)
Bacteriocin Cba Colicin BCda Colicin DCcl CloacincelB Colicin E lysis geneCma Colicin MmchB/C/F Microcin H47mcmA Microcin M
Miscellaneous katP Catalase peroxidise (EHEC/STEC)

Page | 270
Target Group Array target
Target name, host (if applicable)
Fimbriae K88 K88 fimbriae (ETEC)bfpA Bundle forming pilus (EPEC)cfaC Colonisation factor antigen CcofA CFA major pilin subunitF17 F17 fimbriae (animal-pathogenic ETEC)fanA K99 fimbriae (animal-pathogenic ETEC)fasA 987P fimbriae (animal-pathogenic ETEC)fedA F107 fimbriae (animal-pathogenic ETEC)fedF F18 fimbriae (animal-pathogenic ETEC/STEC)fim41a F41 fimbriae (animal-pathogenic ETEC)lngA Longus type IV pilus (ETEC)perA Plasmid encoded regulator of BFP (EPEC)prfB P-related fimbriaesfaS S fimbriaepapB P-fimbriaelpfA Long polar fimbriae (EHEC/EPEC)
Siderophores/iron acquisition
ireA Iron-regulated elementiroN Novel siderophorehemL Heme biosynthesis gene
Serum resistance Iss Increased serum survival proteinType IIISecretionSystem (T3SS)proteins
Cif Cycle inhibiting factoreaaA Serine protease (commensal E. coli)eatA Serine protease (ETEC)epeA Serine protease (EHEC)espA Serine protease (EHEC/EPEC)espB Serine protease (EHEC/EPEC)espC Serine protease (EHEC/EPEC)espF Serine protease (EHEC/EPEC)espI Serine protease (EHEC/EPEC)espJ Serine protease (EHEC/EPEC)espP Serine protease (EHEC/EPEC)nleA Non-LEE encoded protein (EHEC/EPEC)sepA Secreted protein (Shigella & Salmonella sp. E.
coli)Vat Vacuolating autotransporter toxinPic Protein involved in intestinal colonisation
(EAEC)Sat Secreted autotransporter toxin (DAEC)sigA Serine protease (Shigella sp.)tccP Tir cytoskeleton coupling protein (EHEC/EPEC)Tir Translocated Intimin receptor (EHEC/EPEC)eae Intimin (EHEC/EPEC)
T2SS etpD Serine protease (EHEC/STEC)Genome DNA fragment IS285 Insertion sequence 285 (Yersinia sp.)

Page | 271
Target Group Array target Target name, host (if applicable)AntibioticResistance
Aminoglycosides armA 16S rRNA methyltransferasenpmA 16S rRNA methyltransferaseGrm Gentamicin resistance methylasermtA/B/C/D 16S rRNA methyltransferaseRrs 16S rRNA (mutations conferring resistance)strA/B Streptomycin resistance proteinaac3I 3’-N-acetyltransferase aac3Iva 3’-N-acetyltransferase aac3Ia 3’-N-acetyltransferase aac3Ib 3’-N-acetyltransferase aac3Ic 3’-N-acetyltransferase aac3Ie 3’-N-acetyltransferase aac6II 6’-N-acetyltransferase aac6IIa 6’-N-acetyltransferase aac6IIc 6’-N-acetyltransferase aac6Ib 6’-N-acetyltransferase aac6 6’-N-acetyltransferase aac-aph N-Acetyltransferase-O-phosphotransferaseaadA1 3’-O-nucleotidyltransferaseaadA12 3’-O-nucleotidyltransferaseaadA13 3’-O-nucleotidyltransferaseaadA15 3’-O-nucleotidyltransferaseaadA2 3’-O-nucleotidyltransferaseaadA23b 3’-O-nucleotidyltransferaseaadA3 3’-O-nucleotidyltransferaseaadA4 3’-O-nucleotidyltransferaseaadA5 3’-O-nucleotidyltransferaseaadB 2’-O-nucleotidyltransferaseaphA 3’- O-phosphotransferase
Rifampin arr-1 ADP-ribosylating transferase (Mycobacteriumsp.)
arr-4 ADP-ribosylating transferase (Pseudomonas sp.)arr-5 ADP-ribosylating transferase (Klebsiella sp.)arr-6 ADP-ribosylating transferase (Pseudomonas sp.)
Erythromycin Mrx Macrolide inactivation operon proteinMph Macrolide phosphotransferaseereA Erythromycin esterase AereB Erythromycin esterase BermB Erythromycin rRNA methyltransferase
Streptogramin vatE Streptogramin acetyltransferaseSph Streptomycin phosphotransferase
Chloramphenicol catB Chloramphenicol acetyltransferasecmlA1 Chloramphenicol efflux pump floR Florphenicol exporter protein
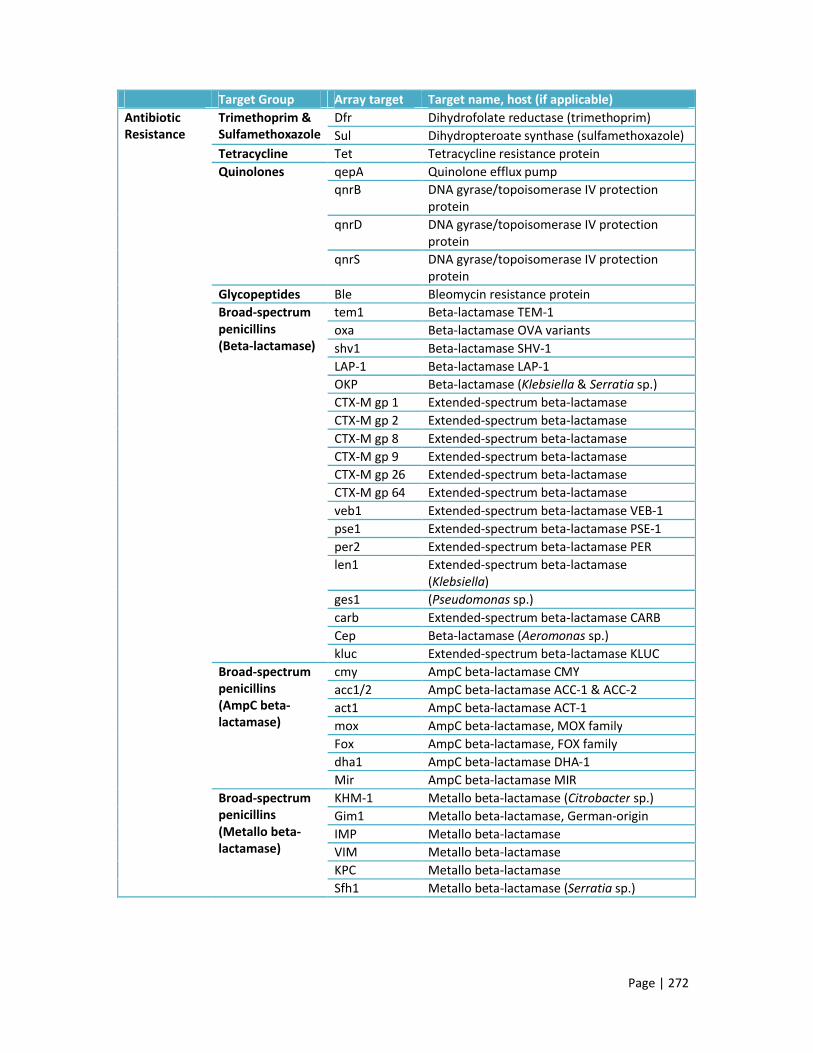
Page | 272
Target Group Array target Target name, host (if applicable)Antibiotic Resistance
Trimethoprim & Sulfamethoxazole
Dfr Dihydrofolate reductase (trimethoprim)Sul Dihydropteroate synthase (sulfamethoxazole)
Tetracycline Tet Tetracycline resistance proteinQuinolones qepA Quinolone efflux pump
qnrB DNA gyrase/topoisomerase IV protection protein
qnrD DNA gyrase/topoisomerase IV protection protein
qnrS DNA gyrase/topoisomerase IV protection protein
Glycopeptides Ble Bleomycin resistance proteinBroad-spectrum penicillins (Beta-lactamase)
tem1 Beta-lactamase TEM-1oxa Beta-lactamase OVA variantsshv1 Beta-lactamase SHV-1LAP-1 Beta-lactamase LAP-1OKP Beta-lactamase (Klebsiella & Serratia sp.)CTX-M gp 1 Extended-spectrum beta-lactamaseCTX-M gp 2 Extended-spectrum beta-lactamaseCTX-M gp 8 Extended-spectrum beta-lactamaseCTX-M gp 9 Extended-spectrum beta-lactamaseCTX-M gp 26 Extended-spectrum beta-lactamaseCTX-M gp 64 Extended-spectrum beta-lactamaseveb1 Extended-spectrum beta-lactamase VEB-1pse1 Extended-spectrum beta-lactamase PSE-1per2 Extended-spectrum beta-lactamase PERlen1 Extended-spectrum beta-lactamase
(Klebsiella)ges1 (Pseudomonas sp.)carb Extended-spectrum beta-lactamase CARBCep Beta-lactamase (Aeromonas sp.)kluc Extended-spectrum beta-lactamase KLUC
Broad-spectrum penicillins (AmpC beta-lactamase)
cmy AmpC beta-lactamase CMYacc1/2 AmpC beta-lactamase ACC-1 & ACC-2act1 AmpC beta-lactamase ACT-1mox AmpC beta-lactamase, MOX familyFox AmpC beta-lactamase, FOX familydha1 AmpC beta-lactamase DHA-1Mir AmpC beta-lactamase MIR
Broad-spectrum penicillins (Metallo beta-lactamase)
KHM-1 Metallo beta-lactamase (Citrobacter sp.)Gim1 Metallo beta-lactamase, German-originIMP Metallo beta-lactamaseVIM Metallo beta-lactamaseKPC Metallo beta-lactamaseSfh1 Metallo beta-lactamase (Serratia sp.)

Page | 273
Target Group Array target Target name, host (if applicable)Broad-spectrum penicillins (Carbapenemase)
sme1 Carbapenemase (Serratia sp.)spm1 Carbapenemase, Brazil-originimi3 Carbapenemase IMI
Antibiotic Resistance
Integrons intI1 Class I integraseintI2 Class II integrase
dnaE dnaE DNA polymerase III alpha-subunitSerotype Flagellin (fliC
gene)H01 H1-antigenH02 H2-antigenH04 H4-antigenH05 H5-antigenH06 H6-antigenH07 H7-antigenH08 H8-antigenH09 H9-antigenH10 H10-antigenH11 H11-antigenH12 H12-antigenH14 H14-antigenH15 H15-antigenH16 H16-antigenH18 H18-antigenH19 H19-antigenH20 H20-antigenH21 H21-antigenH23 H23-antigenH24 H24-antigenH25 H25-antigenH26 H26-antigenH27 H27-antigenH28 H28-antigenH28/46 H28/46-antigenH29 H29-antigenH30 H30-antigenH31 H31-antigenH32 H32-antigenH33 H33-antigenH34 H34-antigenH37 H37-antigenH38 H38-antigenH39 H39-antigenH41 H41-antigenH42 H42-antigenH43 H43-antigenH45 H45-antigenH46 H46-antigenH48 H48-antigen

Page | 274
Target Group Array target Target name, host (if applicable)Serotype Flagellin (fliC
gene)H49 H49-antigenH51 H51-antigenH52 H52-antigenH56 H56-antigen
O-antigen flipase (wzx) & polymerase (wzy)
O103 O103-antigen flipase & polymeraseO104 O104-antigen flipase & polymeraseO111 O111-antigen flipase & polymeraseO113 O113-antigen flipase & polymeraseO114 O114-antigen flipase & polymeraseO121 O121-antigen flipase & polymeraseO128 O128-antigen flipase & polymeraseO15 O15-antigen flipase & polymeraseO157 O157-antigen flipase & polymeraseO172 O172-antigen flipase & polymeraseO26 O26-antigen flipase & polymeraseO55 O55-antigen flipase & polymeraseO6 O6-antigen flipase & polymeraseO7 O7-antigen flipase & polymeraseO79 O79-antigen flipase & polymeraseO8 O8-antigen flipase & polymeraseO86 O86-antigen flipase & polymeraseO9 O9-antigen flipase & polymeraseO91 O91-antigen flipase & polymerase
Other fl-H40 H40-antigen fl-H-NM H-antigen non-motilefljA Phase-1 flagellin repressorflkA-H03 H3 flagellin, non-fliC locusflkA-H53 H53 flagellin, non-fliC locusflmA-H54 H54 flagellin, non-fliC locusisla29-O145 O145 genomic islandrfbE-O157 O157 ABC transporterrfbU-O157 O157 glycosyltransferasesil1-O157 O157 silver resistance genesil-inv-O145 O145 silver resistance genewbdA-O9 O9 mannosyltransferase genewbdA-O9a O9a mannosyltransferase genewbd-O111 O111 glycosyltransferase genewbd-O79 O79 glycosyltransferase genewzm-O52 O52 ABC transporterwz-O101 O101 O-antigen alternative gene

Page | 275
Appendix E
Microarray isolates
No. Study No.
Specimen Type/source Age (years)
Sex Setting Phylo. Serogroup ST VFPCR
1 002 Blood GU 73 M HAI A O162 NK Y2 008 Blood NK 25 M HAI A NT NK3 190 Blood GU 90 F CAI B2 O25 131 Y4 192 Urine COMP 90 F CAI B2 O25 131 Y5 218 Urine COMP 83 M CAI A NT NK Y6 219 Blood GU 83 M CAI A NT NK Y7 295 Blood CHEST 80 M CAI D O31 NK Y8 348 Blood GU 88 M CAI B2 O25 131 Y9 349 Urine COMP 88 M CAI B2 O25 131 Y10 445 Blood GIT 61 M HAI A NT NK Y11 520 Blood NK 77 M HAI B2 O25 13112 561 Blood GIT 55 M HAI A O8 NK Y13 025 Urine COMP 22 F CAI D O44 69 Y14 026 Blood GU 22 F CAI D O44 69 Y15 090 Blood GU 88 F CAI D NT 1405 Y16 091 Urine COMP 88 F CAI D NT 1405 Y17 152 Urine COMP 87 F CAI D O7 62 Y18 153 Blood GU 87 F CAI D O7 62 Y19 187 Urine COMP 52 F CAI B2 NT 405 Y20 188 Blood GU 52 F CAI B2 NT 405 Y21 189 Blood GU 81 M CAI B2 O2 95 Y22 197 Urine COMP 81 M CAI B2 O2 95 Y23 230 Urine COMP 69 F HAI B2 O2 73 Y24 231 Blood GU 69 F HAI B2 O2 73 Y25 293 Blood GU 44 F CAI D NT 405 Y26 294 Urine COMP 44 F CAI D NT 405 Y27 366 Urine COMP 32 F CAI B2 O75 404 Y28 367 Blood GU 32 F CAI B2 O75 404 Y29 494 Blood GU 63 M HAI B2 O6 127 Y30 495 Urine COMP 63 M HAI B2 O6 127 Y31 536 Blood GU 88 F CAI B2 O6 73 Y32 537 Urine COMP 88 F CAI B2 O6 73 Y33 538 Blood GU 31 F CAI D O125ab 69 Y34 539 Urine COMP 31 F CAI D O125ab 69 Y35 542 Blood GU 31 F HAI D O11 69 Y36 543 Urine COMP 31 F HAI D O11 69 Y

Page | 276
No. Study No.
Specimen Type/source Age (years)
Sex Setting Phylo. Serogroup ST VF PCR
37 548 Blood GU 27 F CAI B2 O18ac 14 Y38 549 Urine COMP 27 F CAI D O153 354 Y39 566 Urine COMP 26 F CAI B2 NK 95 Y40 567 Blood GU 26 F CAI B2 NK 95 Y41 3352 Blood GU 87 F CAI D NK NK42 3381 Blood NK 33 F CAI B2 NK 95 Y43 3403 Blood GIT 21 F CAI B2 O1 9544 3413 Blood NK 63 M HAI B2 O16 NK45 3437 Blood GU 26 F CAI B2 NK 9546 3456 Blood GU 88 F CAI B2 NK 7347 3465 Blood GU 35 F CAI B2 NK 9548 3487 Blood NK 31 F HAI D NK NK49 3497 Blood GU 57 F CAI B2 NK 7350 3517 Blood GU 25 F CAI B2 O1 9551 3544 Blood NK 43 F CAI B2 NT 9552 3566 Blood GU 88 F CAI B2 O25 13153 3713 Blood NK 81 M CAI B2 O25 13154 3856 Blood NK 69 F HAI B2 O25 13155 007 Blood NK 39 M CAI B1 NK NK56 156 Urine COMP 44 F CAI B2 O6 NK Y57 302 Urine COMP 56 M CAI D NT NK Y58 384 Urine COMP 54 F CAI A O12 NK Y59 020 Urine COMP 75 F HAI A O135 NK60 113 Urine COMP 79 M HAI A O1 NK Y61 463 Urine COMP 23 M HAI B2 NK NK Y62 065 Urine ABU 18 F CAI A O5 NK Y63 100 Urine ABU 24 F CAI B1 O8 NK64 226 Urine ABU 64 F CAI D NT NK65 354 Urine ABU 30 F CAI B1 NT NK66 370 Urine ABU 24 F CAI B2 NK NK Y67 049 Urine UC 77 F HAI B2 NT NK68 058 Urine UC 26 F CAI B1 NT NK69 108 Urine UC 32 F CAI B1 O8 NK70 122 Urine COMP 61 M CAI B1 O8 NK71 017 Urine COMP 6 F CAI D O17 6972 024 Urine UC 3 F CAI D O86 NK73 085 Urine UC 6 F CAI D O135 NK Y74 109 Urine UC 7 F CAI B2 NT NK75 125 Urine COMP 8 F HAI B2 O7 NK76 014 Urine UC 98 F CAI D O102 NK77 107 Urine UC 99 F CAI B2 O4 NK Y78 285 Urine COMP 90 M HAI B2 O25 131

Page | 277
No. Study No.
Specimen Type/source Age (years)
Sex Setting Phylo. Serogroup ST VF PCR
79 425 Urine COMP 93 F HAI B2 NK NK80 478 Urine COMP 91 M CAI B2 O25 13181 087 Urine ABU 29 F CAI B2 O6 NK Y82 150 Urine UC 59 F CAI B1 NT NK83 157 Urine COMP 60 M CAI B2 O18ac NK84 193 Urine UC 23 F CAI A NT NK85 420 Urine COMP 63 F CAI D NK NK86 182 Urine ABU 26 F CAI A O62 NK87 201 Urine COMP 37 F CAI B2 O39 NK88 240 Urine COMP 56 M CAI B2 NT NK89 316 Urine COMP 46 M CAI B2 O25 NK90 422 Urine ABU 35 F CAI B2 NK NK Y91 028 Urine UC 40 F CAI A O93 NK92 122 Urine COMP 61 M CAI B1 O8 NK93 253 Urine COMP 57 M CAI A O20 NK Y94 356 Urine UC 34 F CAI A NT NK Y95 374 Urine UC 74 F CAI B2 NK NK Y96 25922 Control NA NA NA NA NA NA NANA, not applicable; NK, unknown; NT, non-typeable; GU, genitourinary source; GIT, gastrointestinal
source; CSF, cerebral spinal fluid source; CHEST, respiratory tract source; LINE, intravenous line
source; SSTI, skin and soft tissue infection source; ABU, asymptomatic bacteruria; UC, uncomplicated
cystitis; COMP, complicated cystitis/pyelonephritis; CAI, community-associated infection; HAI,
hospital-associated infection; VF PCR, isolates also analysed for virulence factors using the six
multiplex PCR assays; Y, yes

Page | 278
Virulence factor PCR isolates
No.
Spec
imen
Type
/so
urce
Age
Sex
Sett
ing
Phyl
o.
Sero
.
ST CFT0
73 I
CFT0
73 II
J96
I
J96
II
536
I
536
II
536
III
536
IV
Arra
y
1 U ABU 32 F CAI B2 O25 131 •2 U ABU 18 F CAI A O5 NK • Y3 U ABU 29 F CAI B2 O6 NK • • • • • Y4 U ABU 23 F CAI D NT NK •5 U ABU 26 F CAI D NT 696 U ABU 35 F CAI D O77 69 •7 U ABU 20 F CAI B2 O119 NK • •8 U ABU 22 F CAI B2 O158 73 • • • • •9 U ABU 31 F CAI B2 O25 131 • •10 U ABU 29 F CAI D O17 69 • •11 U ABU 38 F CAI D NT 6912 U ABU 29 F CAI D NK 69 •13 U ABU 34 F CAI B2 O6 127 • • • • • • •14 U ABU 24 F CAI B2 NK NK • • • Y15 U ABU 37 F CAI B2 NK NK16 U ABU 32 F CAI B2 NK NK • • • •17 U ABU 35 F CAI B2 NK NK • Y18 U ABU 41 F CAI D NK NK •19 U ABU 22 F CAI D NK NK • •20 U ABU 35 F CAI A O141 NK21 U ABU 19 F CAI D NK NK •22 U ABU 20 F CAI B2 NK NK •23 U ABU 35 F CAI A NK NK24 U ABU 29 F CAI B2 NK NK •25 U ABU 31 F CAI B2 O6 127 • • • •26 U ABU 26 F CAI D NK NK •27 U ABU 27 F CAI A NK NK28 U ABU 29 F CAI A NK NK29 U ABU 37 F CAI B2 NK NK • • • • •30 U ABU 29 F CAI B2 NK NK • • • •31 U COMP 75 M CAI A O150 NK32 U COMP 79 M HAI A O1 NK Y33 U COMP 41 M CAI B2 O2 73 • • • •34 U COMP 37 F CAI D O73 6935 U COMP 44 F CAI B2 O6 NK • • • Y36 U COMP 80 M HAI B2 O22 73 • • • • •37 U COMP 27 F CAI B2 O25 95 • • •38 U COMP 54 M HAI B2 O1 95 • • •

Page | 279
No.
Spec
imen
Type
/so
urce
Age
Sex
Sett
ing
Phyl
o.
Sero
.
ST CFT0
73 I
CFT0
73 II
J96
I
J96
II
536
I
536
II
536
III
536
IV
Arra
y
39 U COMP 48 F HAI B2 O25 127 • • •40 U COMP 57 M CAI A O20 NK • Y41 U COMP 67 M CAI B2 NT 127 • • • • • •42 U COMP 56 M CAI D NT NK • Y43 U COMP 49 F CAI B2 NK NK • • • • •44 U COMP 71 F CAI B2 NK NK • • •45 U COMP 54 F CAI A O12 NK • Y46 U COMP 50 F CAI A O135 NK •47 U COMP 62 F CAI B2 O25 131 • •48 U COMP 61 M CAI B1 O8 NK49 U COMP 79 F CAI B2 NK NK • • •50 U COMP 65 M HAI B2 O25 131 • •51 U COMP 52 F CAI B2 NT 95 • •52 U COMP 36 M HAI D O153 69 • •53 U COMP 23 M HAI B2 NK NK • Y54 U COMP 1 F CAI B2 O2 95 • • •55 U COMP 27 F CAI B2 NK NK • • •56 U COMP 73 M CAI B2 O6 127 • • • • •57 U COMP 80 F HAI B2 NK NK • • • •58 U COMP 23 F CAI B2 NK NK •59 U COMP 82 M CAI B2 NK NK •60 U COMP 84 F CAI D NK NK •61 U COMP 22 F CAI D O44 69 • Y62 U COMP 88 F CAI D NT 1405 • Y63 U COMP 87 F CAI D O7 62 • Y64 U COMP 52 F CAI B2 NT 405 • • Y65 U COMP 90 M CAI B2 O25 131 • • • • • Y66 U COMP 81 F CAI B2 O2 95 • • Y67 U COMP 83 M CAI A NT 617 • • Y68 U COMP 69 F HAI B2 O2 73 • • • • Y69 U COMP 44 F CAI D NT 405 • • Y70 U COMP 88 M CAI B2 NT 131 • • • Y71 U COMP 32 F CAI B2 O75 404 • • Y72 U COMP 63 M HAI B2 O6 127 • • • • • Y73 U COMP 88 F CAI B2 O6 73 • • • Y74 U COMP 31 F CAI D O125ab 69 • • Y75 U COMP 31 F HAI D O11 69 • Y76 U COMP 27 F CAI D O153 354 • Y

Page | 280
No.
Spec
imen
Type
/so
urce
Age
Sex
Sett
ing
Phyl
o.
Sero
.
ST CFT0
73 I
CFT0
73 II
J96
I
J96
II
536
I
536
II
536
III
536
IV
Arra
y
77 U COMP 26 F CAI B2 O4 95 • • • • Y78 U UC 35 F HAI B2 O4 73 • • •79 U UC 25 F HAI D O77 6980 U UC 65 F CAI B2 O6 73 • • • • • •81 U UC 33 F CAI D O77 69 •82 U UC 49 F CAI A O87 NK83 U UC 56 F CAI B2 O4 95 • • • • •84 U UC 6 F CAI D O135 NK Y85 U UC 99 F CAI B2 O4 NK • Y86 U UC 29 F CAI B2 O18ac NK • • •87 U UC 40 F CAI A O78 NK • •88 U UC 36 F CAI D NT 69 •89 U UC 32 F CAI B2 O6 73 • • •90 U UC 35 F CAI D O77 69 •91 U UC 7 F CAI A NT NK •92 U UC 18 F CAI B2 O75 NK • •93 U UC 5 F CAI B1 NT NK •94 U UC 40 F CAI B2 O18ac 95 • • •95 U UC 9 F CAI D O153 69 •96 U UC 23 F CAI A O8 NK •97 U UC 34 F CAI A NT NK • Y98 U UC 74 F CAI B2 NK NK • Y99 U UC 78 F CAI A O7 NK100 U UC 10 F CAI A O20 NK101 U UC 50 F HAI B2 NK NK • •102 U UC 27 F CAI D NK NK •103 U UC 46 F CAI D NK NK •104 U UC 21 F CAI D NK NK105 U UC 70 F CAI B2 NK NK • • •106 U UC 8 F CAI A NK NK •107 U UC 28 F CAI A NK NK •108 B GU 73 M HAI A O162 NK • • • Y109 B GIT 43 M HAI B2 O22 NK • • • •110 B CHEST 76 M HAI B2 NT NK •111 B CHEST 80 M CAI D O31 NK • • Y112 B GIT 75 M CAI D O31 NK • •113 B GIT 61 M HAI A NT NK • Y114 B GIT 55 M HAI A O8 NK Y

Page | 281
No.
Spec
imen
Type
/so
urce
Age
Sex
Sett
ing
Phyl
o.
Sero
.
ST CFT0
73 I
CFT0
73 II
J96
I
J96
II
536
I
536
II
536
III
536
IV
Arra
y
115 B CSF 0 M HAI B2 NK 95 • • •116 B CHEST 99 F CAI D NK NK •117 B GU 83 M CAI D NK NK • •118 B GIT 60 F CAI B2 O25 131 • • •119 B LINE 43 M HAI B2 NK 95 • • • • •120 B NK 33 F CAI B2 NK 95 • • • • • Y121 B GIT 91 F HAI B2 NK 95 • • •122 B LINE 54 F CAI B2 O25 131 • • • • •123 B GU 52 M CAI B2 O25 131 • • •124 B LINE 19 M HAI B2 NK 127 •125 B CHEST 35 M HAI B2 O25 131 • • •126 B SSTI 45 F CAI B2 NK NK • • • •127 B GIT 78 M CAI D NK NK128 B SSTI 88 F HAI B2 NK NK • • •129 B GIT 64 F HAI B2 O2 73 • • • •130 B GIT 64 M CAI B2 O27 127 • • • • • •131 B LINE 55 M HAI A O36 69132 B SSTI 90 F CAI A O11 69 •133 B CHEST 98 M CAI B2 NK NK • • •134 B LINE 98 F CAI D NK NK • •135 B NK 60 M CAI B2 O25 131 • • •136 B LINE 59 F HAI B2 O6 73 • • • •137 B SSTI 73 M HAI B2 O18ab NK • • •138 B GU 22 F CAI D O44 69 • Y139 B GU 88 F CAI D NT 1405 • • Y140 B GU 87 F CAI D O7 62 • Y141 B GU 52 F CAI B2 NT 405 • • Y142 B GU 81 F CAI B2 O2 95 • • Y143 B GU 90 M CAI B2 O25 131 • • • • • Y144 B GU 83 M CAI A NT 617 • • Y145 B GU 69 F HAI B2 O2 73 • • • • Y146 B GU 44 F CAI D NT 405 • • Y147 B GU 88 M CAI B2 NT 131 • • • • Y148 B GU 32 F CAI B2 O75 404 • • Y149 B GU 63 M HAI B2 O6 127 • • • • • Y150 B GU 88 F CAI B2 O6 73 • • • Y

Page | 282
No.
Spec
imen
Type
/so
urce
Age
Sex
Sett
ing
Phyl
o.
Sero
.
ST CFT0
73 I
CFT0
73 II
J96
I
J96
II
536
I
536
II
536
III
536
IV
Arra
y
151 B GU 31 F CAI D O125ab 69 • Y152 B GU 31 F HAI D O11 69 • Y153 B GU 27 F CAI B2 O18ac 14 • • • Y154 B GU 26 F CAI B2 O4 95 • • • • Y
B, bloodstream isolate; U, urinary isolate; NK, unknown; NT, non-typeable; GU, genitourinary source;
GIT, gastrointestinal source; CSF, cerebral spinal fluid source; CHEST, respiratory tract source; LINE,
intravenous line source; SSTI, skin and soft tissue infection source; ABU, asymptomatic bacteruria;
UC, uncomplicated cystitis; COMP, complicated cystitis/pyelonephritis; CAI, community-associated
infection; HAI, hospital-associated infection; Array, isolates also analysed by microarray; Y, yes

Page | 283
Appendix F
Galleria isolatesN
o.
Spec
imen
Type
/sou
rce
Age
(yea
rs)
Sex
Sett
ing
Phyl
o.
Sero
.
ST VF P
CR
1 B CHEST 76 M HAI B2 NT NK fyuA
2 U UC 65 F CAI B2 O6 73 fimH pap sfa/foc iha hlyD sat fyuA iutA iroN kpsII usp traT pks malX
3 U UC 49 F CAI A O87 NK fimH sat
4 U UC 56 F CAI B2 O4 95 fimH pap hra hlyD cnf1 fyuA iroN kpsII usp pks malX
5 U UC 6 F CAI D O135 NK fimH EAST1 kpsII
6 U ABU 29 F CAI B2 O6 NK fimH pap sfa/foc hlyD cnf1 fyuA iroN kpsII usp ompT pks malX
7 U COMP 79 M HAI A O1 NK fimH
8 U COMP 41 M CAI B2 O2 73 fimH pap sfa/foc iha cdtB hlyD sat fyuA iutA iroN usp traT pks malX
9 B GU 90 F CAI B2 O25 131 pap iha cnf1 iutA kpsII ompT iss
10 U COMP 90 F CAI B2 O25 131 pap afa/dra iha cnf1 iutA kpsII usp ompT iss
11 U COMP 83 M CAI A NT 617 traT
12 B GU 83 M CAI A NT 617 traT
13 U ABU 20 F CAI B2 O119 NK fimH gafD iha sat fyuA iutA kpsII K5 usp malX
14 U COMP 57 M CAI A O20 NK fimH pap bmaE hra cnf1 hlyD fyuA iutA traT pks
15 U ABU 22 F CAI B2 O158 73 fimH pap sfa/foc iha cnf1 hlyD fyuA usp traT pks malX
16 U UC 5 F CAI B1 NT NK fimH pap iha fyuA iutA kpsII
17 U COMP 67 M CAI B2 NT 127 fimH bmaE hra cnf1 hlyD fyuA kpsII usp pks malX
18 B CHEST 80 M CAI D O31 NK fimH fyuA iutA kpsII usp traT malX
19 U ABU 34 F CAI B2 O6 127 fimH pap sfa/foc cnf1 hlyD fyuA iroN usp pks malX
20 U UC 9 F CAI D O153 69 fimH pap iha sat fyuA iutA kpsII traT ompT

Page | 284
No.
Spec
imen
Type
/sou
rce
Age
(yea
rs)
Sex
Sett
ing
Phyl
o.
Sero
.
ST VF P
CR
21 B GIT 75 M CAI D O31 NK fyuA iutA traT malX
22 U COMP 54 F CAI A O12 NK fimH fyuA kpsII traT
23 U COMP 50 F CAI A O135 NK fimH fyuA kpsIII
24 U COMP 61 M CAI B1 O8 NK fimH pap hlyF iutA iroN traT iss
25 U ABU 41 F CAI D NK NK fimH fyuA traT
26 U COMP 1 F CAI B2 O2 95 fimH pap hlyF fyuA iutA iroN ireA kpsII K1 usp traT iss cvaC pks malX
27 U ABU 35 F CAI A NK NK fimH
28 U COMP 27 F CAI D O153 354 fyuA usp ibeA
29 U ABU 29 F CAI B2 NK NK fimH sfa/foc bmaE hra cnf1 hlyD sat fyuA iroN usp traT pks malX
30 B CSF 0 M HAI B2 NK 95 fimH pap sfa/foc cdtB hlyF fyuA iutA iroN kpsII K1 usp traT ibeA iss cvaC pks malX
31 B CHEST 99 F CAI D NK NK fimH fyuA
32 B GIT 60 F CAI B2 O25 131 clpG iha sat fyuA iutA usp traT malX
33 B GIT 91 F HAI B2 NK 95 fimH pap hlyF vat fyuA iutA iroN kpsII K1 usp traT iss cvaC pks malX
34 B LINE 54 F CAI B2 O25 131 fimH pap iha cnf1 hlyD sat fyuA iutA kpsII usp traT iss malX
35 B LINE 19 M HAI B2 NK 127 EAST1 iutA usp traT iss malX
36 B SSTI 45 F CAI B2 NK NK fimH pap sfa/foc afa/dra iha hlyF tsh fyuA iutA iroN kpsII K1 usp ibeA iss cvaC pks malX
37 B SSTI 88 F HAI B2 NK NK fimH pap iha fyuA iroN kpsII K1 usp traT ibeA iss malX
38 B GIT 64 M CAI B2 O27 127 fimH pap sfa/foc iha cnf1 hlyD tsh fyuA iroN usp iss pks malX
39 B LINE 55 M HAI A O36 69 fimH fyuA iroN kpsII usp iss pks
40 B SSTI 90 F CAI A O11 69 pap fyuA iutA iroN kpsII K1 usp traT iss pks
NB. B, bacteraemia; U, urinary tract infection; F, female; M, male; CAI, community-associated
infection; HAI, hospital-associated infection; NK, unknown; NT, non-typeable; GU, genitourinary
source; GIT, gastrointestinal source; CSF, cerebral spinal fluid source; CHEST, respiratory tract
source; LINE, intravenous line source; SSTI, skin and soft tissue infection source; ABU, asymptomatic
bacteruria; UC, uncomplicated cystitis; COMP, complicated cystitis/pyelonephritis

Page | 285
Pathogenicity islands in the Galleria isolates
No. CFT073 I CFT073 II J96 I J96 II 536 I 536 II 536 III 536 IV1 Y2 Y Y Y Y Y Y34 Y Y Y Y Y56 Y Y Y Y Y78 Y Y Y Y9 Y Y Y Y Y10 Y Y Y Y Y11 Y Y12 Y Y13 Y Y14 Y15 Y Y Y Y Y16 Y17 Y Y Y Y Y Y18 Y Y19 Y Y Y Y Y Y Y20 Y21 Y Y22 Y23 Y2425 Y26 Y Y Y2728 Y29 Y Y Y Y30 Y Y Y31 Y32 Y Y Y33 Y Y Y34 Y Y Y Y Y35 Y36 Y Y Y Y37 Y Y Y38 Y Y Y Y Y Y3940 Y