Variable sizes of Escherichia coli chemoreceptor signaling teams
Upload
khangminh22Category
view
0download
0
�����������������
Citation: Saffioti, N.A.; Lauri, N.;
Cané, L.; Gonzalez-Lebrero, R.;
Alleva, K.; Mouro-Chanteloup, I.;
Ostuni, M.A.; Herlax, V.;
Schwarzbaum, P.J. Interactive
Dynamics of Cell Volume and Cell
Death in Human Erythrocytes
Exposed to α-Hemolysin from
Escherichia coli. Int. J. Mol. Sci. 2022,
23, 872. https://doi.org/10.3390/
ijms23020872
Academic Editor: Francesco Misiti
Received: 18 December 2021
Accepted: 11 January 2022
Published: 14 January 2022
Publisher’s Note: MDPI stays neutral
with regard to jurisdictional claims in
published maps and institutional affil-
iations.
Copyright: © 2022 by the authors.
Licensee MDPI, Basel, Switzerland.
This article is an open access article
distributed under the terms and
conditions of the Creative Commons
Attribution (CC BY) license (https://
creativecommons.org/licenses/by/
4.0/).
International Journal of
Molecular Sciences
Article
Interactive Dynamics of Cell Volume and Cell Death in HumanErythrocytes Exposed to α-Hemolysin from Escherichia coliNicolas A. Saffioti 1,2,† , Natalia Lauri 2,3,†, Lucia Cané 4, Rodolfo Gonzalez-Lebrero 2,3 , Karina Alleva 3,Isabelle Mouro-Chanteloup 5, Mariano A. Ostuni 5,* , Vanesa Herlax 4 and Pablo Julio Schwarzbaum 2,3
1 Laboratorio de Biosensores Avanzados, Instituto de Nanosistemas, Universidad Nacional de San Martín,San Martín, Buenos Aires 1650, Argentina; [email protected]
2 Departamento de Química Biológica, Facultad de Farmacia y Bioquímica, Universidad de Buenos Aires,Junín 956, Buenos Aires 1113, Argentina; [email protected] (N.L.); [email protected] (R.G.-L.);[email protected] (P.J.S.)
3 Instituto de Química y Físico-Química Biológicas “Prof. Alejandro C. Paladini”, UBA, CONICET, Facultad deFarmacia y Bioquímica, Junín 956, Buenos Aires 1113, Argentina; [email protected]
4 Instituto de Investigaciones Bioquímicas de La Plata (INIBIOLP) CCT-La Plata, CONICET, Facultad deCiencias Médicas, Universidad Nacional de La Plata, 60 y 120, La Plata, Buenos Aires 1900, Argentina;[email protected] (L.C.); [email protected] (V.H.)
5 Université de Paris and Université des Antilles, INSERM, BIGR, F-75015 Paris, France;[email protected]
* Correspondence: [email protected]† These authors have contributed equally to this work and share first authorship.
Abstract: α-hemolysin (HlyA) of E. coli binds irreversibly to human erythrocytes and induces cellswelling, ultimately leading to hemolysis. We characterized the mechanism involved in watertransport induced by HlyA and analyzed how swelling and hemolysis might be coupled. Osmoticwater permeability (Pf) was assessed by stopped-flow light scattering. Preincubation with HlyAstrongly reduced Pf in control- and aquaporin 1-null red blood cells, although the relative Pf decreasewas similar in both cell types. The dynamics of cell volume and hemolysis on RBCs was assessedby electrical impedance, light dispersion and hemoglobin release. Results show that HlyA inducederythrocyte swelling, which is enhanced by purinergic signaling, and is coupled to osmotic hemolysis.We propose a mathematical model of HlyA activity where the kinetics of cell volume and hemolysisin human erythrocytes depend on the flux of osmolytes across the membrane, and on the maximumvolume that these cells can tolerate. Our results provide new insights for understanding signalingand cytotoxicity mediated by HlyA in erythrocytes.
Keywords: purinergic; cell volume regulation; RTX toxins; aquaporins
1. Introduction
α-hemolysin (HlyA) is an exotoxin secreted by uropathogenic strains of E. coli (UPEC)that causes lysis of several cell types, including red blood cells (RBCs) from humans andother mammalian species [1–3]. HlyA belongs to the repeats-in-toxin (RTX) family, a groupof bacterial toxins sharing a glycine- and aspartate-rich motif repeated in tandem [4].
The severity of urinary tract infections correlates with the expression levels of HlyAin UPEC isolates, suggesting that HlyA is an important virulence factor [5–7]. Moreover,HlyA has been associated with complicated urinary tract infections, pyelonephritis andbacteremia in humans [5,8,9], whereas intravenous inoculation of the toxin in animalmodels enhanced lethal sepsis [10]. Although HlyA at high doses is highly lytic, relativelylow toxin concentrations are thought to mimic the environment found during infections ofthe urinary tract, which are sometimes accompanied by discrete cell lysis and exfoliation ofthe bladder epithelial cells [11].
Int. J. Mol. Sci. 2022, 23, 872. https://doi.org/10.3390/ijms23020872 https://www.mdpi.com/journal/ijms
Int. J. Mol. Sci. 2022, 23, 872 2 of 19
UPEC strains can translocate to the circulatory system, where they synthetize andrelease HlyA to the intravascular milieu. HlyA can then bind to and irreversibly insertinto the RBCs cell membrane [12], inducing an increase of transmembrane ionic perme-ability of low selectivity [13]. It is a matter of discussion whether these changes areproduced by HlyA generating a defined pore (as observed in the unrelated α-hemolysinfrom Staphylococcus aureus [14,15]) or by producing lesions in the cell membrane by adetergent-like mechanism [16]. Permeability changes seem complex, since the size of thepore or lesions was suggested to increase with time of toxin exposure, thus allowing atime-dependent incremental exchange of osmolytes [16]. It is also not clear whether HlyAis active as a monomer [17] or requires oligomerization inside the cell membrane to becomeactive [18,19].
Regarding sublytic effects observed in RBCs, HlyA induced Ca2+ influx causingactivation of the Ca2+ activated K+ channel (KCa3.1) and the transmembrane protein 16A(TMEM16A) (K+ and Cl− channels, respectively) [20]. The resulting elevated cytosolicCa2+ triggered eryptosis (the apoptosis of RBCs, see [21]), a process involving activationof calpains that proteolyze α and β-spectrins of the cytoskeleton [22], translocation ofphosphatidylserine to the external layer of the plasma membrane [23], generation ofceramide [22] and concomitant decreases in RBCs deformability [23]. Although the acuteeffects of HlyA may induce cell shrinkage, the toxin was reported to trigger compensatorycell swelling. In RBCs, this is achieved by HlyA-dependent accumulation of extracellularATP (ATPe), leading to activation of ionotropic purinergic P2X receptors, followed byactivation of the influx of osmolytes and water [23,24].
In several studies, there has been focus on HlyA inducing changes in the membranepermeability to ions, which then leads to osmotic imbalance and osmotically determinedchanges of cell volume. However, HlyA may also affect cell volume by affecting waterpermeability in different ways.
In RBCs, although rapid changes in water transport are governed by aquaporin 1(AQP1) [25], other mechanisms, such as AQP3 [26], the urea transporter B (UT-B) [27],and simple diffusion through the lipid membrane, can also mediate water transmembranefluxes. In principle, about two-thirds of water transport occurs via AQP1, an abundantprotein in human RBCs [27,28]. The importance of AQP1 in RBCs was confirmed usingRBCs from the rare variants of the Colton-null phenotype (AQP1 null RBCs), which donot express AQP1 and, therefore, exhibit low water permeability [28]. Whether calpainactivation by HlyA can directly affect AQP1, or any other member of the AQP family, iscurrently unknown. Alternatively, the toxin could affect water transport due to perturbationof the lipidic environment [29].
In this work, we analyzed, for the first time, the water transport pathways duringcell volume increase by HlyA. Among the various osmotic and cytotoxic effects exerted bythe toxin on RBCs, we also analyzed whether hemolytic activity can be explained basedonly on osmotic stress created by HlyA, or else other processes increasing cell fragility areinvolved.
We characterized changes in mean corpuscular volume (MCV) and water transportelicited by HlyA through electrical impedance, flow cytometry and stopped-flow side lightscattering, whereas cell rupture was monitored by hemoglobin release and light dispersion.Based on our results, we propose a simplified mathematical model of HlyA activity thatexplains the experimental data. In this model, kinetics of cell volume and hemolysisof RBCs results from the net movement of osmolytes across the membrane induced bythe toxin.
2. Results
Results of this study describe the dynamics of MCV, changes in osmotic permeabil-ity (Pf), and lysis of HlyA-treated RBCs. We present experimental results, as well as adata-driven model, to account for the relationships between these processes. Given the im-
Int. J. Mol. Sci. 2022, 23, 872 3 of 19
portance of AQP1 for facilitating water transport in RBCs, key experiments were repeatedusing AQP1-deficient RBCs (denoted as AQP1nullRBCs).
2.1. Pre-Lytic Volume Changes
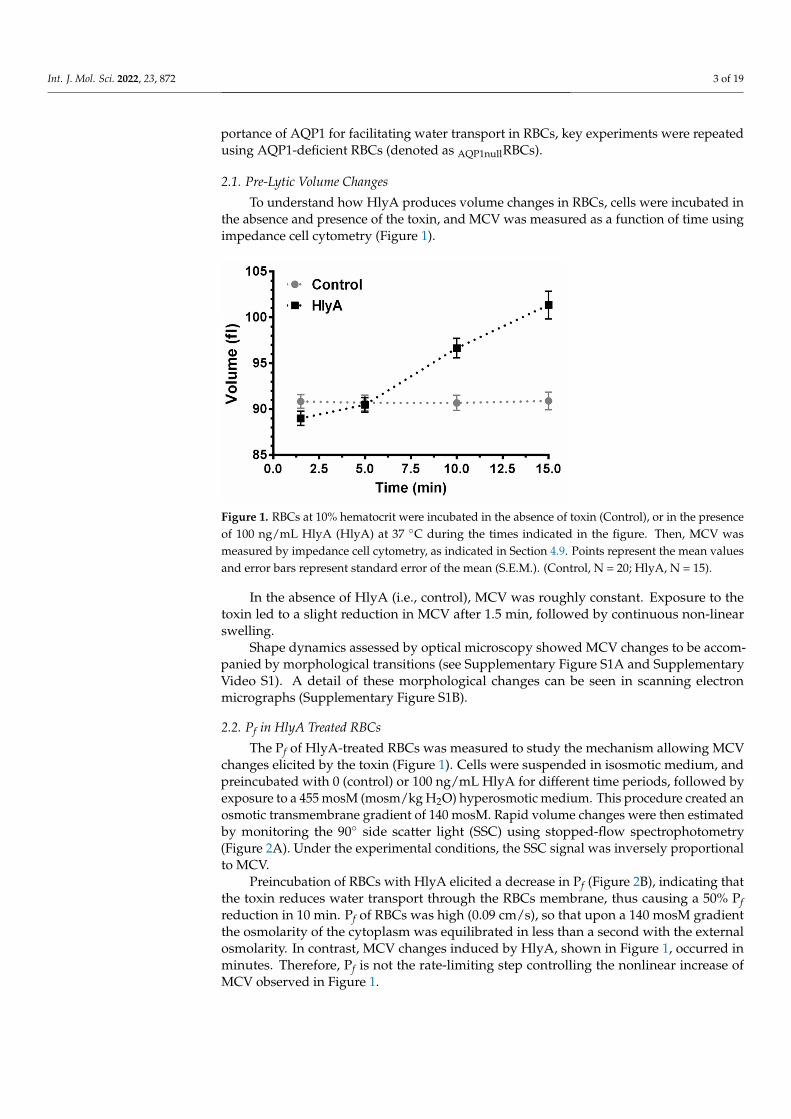
To understand how HlyA produces volume changes in RBCs, cells were incubated inthe absence and presence of the toxin, and MCV was measured as a function of time usingimpedance cell cytometry (Figure 1).
Int. J. Mol. Sci. 2022, 23, x FOR PEER REVIEW 3 of 20
ta-driven model, to account for the relationships between these processes. Given the im-portance of AQP1 for facilitating water transport in RBCs, key experiments were repeat-ed using AQP1-deficient RBCs (denoted as AQP1nullRBCs).
2.1. Pre-Lytic Volume Changes To understand how HlyA produces volume changes in RBCs, cells were incubated
in the absence and presence of the toxin, and MCV was measured as a function of time using impedance cell cytometry (Figure 1).
In the absence of HlyA (i.e., control), MCV was roughly constant. Exposure to the toxin led to a slight reduction in MCV after 1.5 min, followed by continuous non-linear swelling.
Figure 1. RBCs at 10% hematocrit were incubated in the absence of toxin (Control), or in the pres-ence of 100 ng/mL HlyA (HlyA) at 37 °C during the times indicated in the figure. Then, MCV was measured by impedance cell cytometry, as indicated in Section 4.9. Points represent the mean val-ues and error bars represent standard error of the mean (S.E.M.). (Control, N = 20; HlyA, N = 15).
Shape dynamics assessed by optical microscopy showed MCV changes to be ac-companied by morphological transitions (see Supplementary Figure S1A and Supple-mentary Video S1). A detail of these morphological changes can be seen in scanning electron micrographs (Supplementary Figure S1B).
2.2. Pf in HlyA Treated RBCs The Pf of HlyA-treated RBCs was measured to study the mechanism allowing MCV
changes elicited by the toxin (Figure 1). Cells were suspended in isosmotic medium, and preincubated with 0 (control) or 100 ng/mL HlyA for different time periods, followed by exposure to a 455 mosM (mosm/kg H2O) hyperosmotic medium. This procedure created an osmotic transmembrane gradient of 140 mosM. Rapid volume changes were then es-timated by monitoring the 90° side scatter light (SSC) using stopped-flow spectropho-tometry (Figure 2A). Under the experimental conditions, the SSC signal was inversely proportional to MCV.
Preincubation of RBCs with HlyA elicited a decrease in Pf (Figure 2B), indicating that the toxin reduces water transport through the RBCs membrane, thus causing a 50% Pf reduction in 10 min. Pf of RBCs was high (0.09 cm/s), so that upon a 140 mosM gradi-ent the osmolarity of the cytoplasm was equilibrated in less than a second with the ex-ternal osmolarity. In contrast, MCV changes induced by HlyA, shown in Figure 1, oc-curred in minutes. Therefore, Pf is not the rate-limiting step controlling the nonlinear in-crease of MCV observed in Figure 1.
Figure 1. RBCs at 10% hematocrit were incubated in the absence of toxin (Control), or in the presenceof 100 ng/mL HlyA (HlyA) at 37 ◦C during the times indicated in the figure. Then, MCV wasmeasured by impedance cell cytometry, as indicated in Section 4.9. Points represent the mean valuesand error bars represent standard error of the mean (S.E.M.). (Control, N = 20; HlyA, N = 15).
In the absence of HlyA (i.e., control), MCV was roughly constant. Exposure to thetoxin led to a slight reduction in MCV after 1.5 min, followed by continuous non-linearswelling.
Shape dynamics assessed by optical microscopy showed MCV changes to be accom-panied by morphological transitions (see Supplementary Figure S1A and SupplementaryVideo S1). A detail of these morphological changes can be seen in scanning electronmicrographs (Supplementary Figure S1B).
2.2. Pf in HlyA Treated RBCs
The Pf of HlyA-treated RBCs was measured to study the mechanism allowing MCVchanges elicited by the toxin (Figure 1). Cells were suspended in isosmotic medium, andpreincubated with 0 (control) or 100 ng/mL HlyA for different time periods, followed byexposure to a 455 mosM (mosm/kg H2O) hyperosmotic medium. This procedure created anosmotic transmembrane gradient of 140 mosM. Rapid volume changes were then estimatedby monitoring the 90◦ side scatter light (SSC) using stopped-flow spectrophotometry(Figure 2A). Under the experimental conditions, the SSC signal was inversely proportionalto MCV.
Preincubation of RBCs with HlyA elicited a decrease in Pf (Figure 2B), indicating thatthe toxin reduces water transport through the RBCs membrane, thus causing a 50% Pfreduction in 10 min. Pf of RBCs was high (0.09 cm/s), so that upon a 140 mosM gradientthe osmolarity of the cytoplasm was equilibrated in less than a second with the externalosmolarity. In contrast, MCV changes induced by HlyA, shown in Figure 1, occurred inminutes. Therefore, Pf is not the rate-limiting step controlling the nonlinear increase ofMCV observed in Figure 1.

Int. J. Mol. Sci. 2022, 23, 872 4 of 19Int. J. Mol. Sci. 2022, 23, x FOR PEER REVIEW 4 of 20
Figure 2. (A) SSC kinetics of HlyA pre-treated RBCs. RBCs suspensions at 10% hematocrit were treated with HlyA 100 ng/mL for 1, 5 and 10 min at 37 °C. After preincubation, cells were exposed to a hyperosmotic medium and the osmotic shrinkage of the cells was monitored by measuring the SSC signal in stopped-flow equipment as indicated in Section 4.7. Control experiments were performed in the absence of toxin. (B) Osmotic water permeability (Pf) as a function of time of HlyA preincubation. Values of Pf were calculated as detailed in Section 4.8 from SSC data. Data is represented as a function of the time during which cells were pre-exposed to 0 (control) or 100 ng/mL HlyA before stopped-flow experiments were performed. Values represent means ± S.E.M. (Control, N = 18; HlyA, N = 15).
2.3. Effect of Purinergic Signalling on Pf HlyA induces the release of intracellular ATP, leading to accumulation of ATPe
[23,24]. Elevated ATPe induced by HlyA and other stimuli plays an important role in amplifying RBCs swelling by acting on ionotropic P2X purinergic channels [30,31].
Thus, MCV and Pf of HlyA-treated RBCs were measured in the absence and pres-ence of suramin, a generic antagonist of P2, and in the absence and presence of HlyA. Our results show that the addition of suramin delayed cell swelling induced by HlyA (Figure 3A), to the extent that MCV kinetics were roughly similar in the absence and presence of toxin.
Figure 3. Effects of Suramin on MCV and Pf changes induced by HlyA. RBCs suspensions at 10% hematocrit were used to determine MCV (A) and Pf (B) after 1, 5 and 10 min of HlyA treatment (100 ng/mL). Pf values were calculated, as indicated in Section 4.8, from stopped-flow experiments. Before HlyA addition, cells were pre-incubated in the absence or presence of suramin 100 µM for 10 min at 37 °C. Control experiments were run in the absence of toxin. Points in the plots represent means ± S.E.M. In (A) Control, N = 20; Control+Suramin and HlyA+Suramin, N = 5; HlyA, N = 15. In (B) Control, N = 18; Control+Suramin and HlyA+Suramin, N = 4; HlyA, N = 15.
When assessing Pf, no effect was observed with suramin alone (Figure 3B), while treatment with both suramin and HlyA caused a 27% reduction after 10 min of toxin ex-
Figure 2. (A) SSC kinetics of HlyA pre-treated RBCs. RBCs suspensions at 10% hematocrit weretreated with HlyA 100 ng/mL for 1, 5 and 10 min at 37 ◦C. After preincubation, cells were exposedto a hyperosmotic medium and the osmotic shrinkage of the cells was monitored by measuringthe SSC signal in stopped-flow equipment as indicated in Section 4.7. Control experiments wereperformed in the absence of toxin. (B) Osmotic water permeability (Pf) as a function of time ofHlyA preincubation. Values of Pf were calculated as detailed in Section 4.8 from SSC data. Data isrepresented as a function of the time during which cells were pre-exposed to 0 (control) or 100 ng/mLHlyA before stopped-flow experiments were performed. Values represent means ± S.E.M. (Control,N = 18; HlyA, N = 15).
2.3. Effect of Purinergic Signalling on Pf
HlyA induces the release of intracellular ATP, leading to accumulation of ATPe [23,24].Elevated ATPe induced by HlyA and other stimuli plays an important role in amplifyingRBCs swelling by acting on ionotropic P2X purinergic channels [30,31].
Thus, MCV and Pf of HlyA-treated RBCs were measured in the absence and presenceof suramin, a generic antagonist of P2, and in the absence and presence of HlyA. Our resultsshow that the addition of suramin delayed cell swelling induced by HlyA (Figure 3A), tothe extent that MCV kinetics were roughly similar in the absence and presence of toxin.
Int. J. Mol. Sci. 2022, 23, x FOR PEER REVIEW 4 of 20
Figure 2. (A) SSC kinetics of HlyA pre-treated RBCs. RBCs suspensions at 10% hematocrit were treated with HlyA 100 ng/mL for 1, 5 and 10 min at 37 °C. After preincubation, cells were exposed to a hyperosmotic medium and the osmotic shrinkage of the cells was monitored by measuring the SSC signal in stopped-flow equipment as indicated in Section 4.7. Control experiments were performed in the absence of toxin. (B) Osmotic water permeability (Pf) as a function of time of HlyA preincubation. Values of Pf were calculated as detailed in Section 4.8 from SSC data. Data is represented as a function of the time during which cells were pre-exposed to 0 (control) or 100 ng/mL HlyA before stopped-flow experiments were performed. Values represent means ± S.E.M. (Control, N = 18; HlyA, N = 15).
2.3. Effect of Purinergic Signalling on Pf HlyA induces the release of intracellular ATP, leading to accumulation of ATPe
[23,24]. Elevated ATPe induced by HlyA and other stimuli plays an important role in amplifying RBCs swelling by acting on ionotropic P2X purinergic channels [30,31].
Thus, MCV and Pf of HlyA-treated RBCs were measured in the absence and pres-ence of suramin, a generic antagonist of P2, and in the absence and presence of HlyA. Our results show that the addition of suramin delayed cell swelling induced by HlyA (Figure 3A), to the extent that MCV kinetics were roughly similar in the absence and presence of toxin.
Figure 3. Effects of Suramin on MCV and Pf changes induced by HlyA. RBCs suspensions at 10% hematocrit were used to determine MCV (A) and Pf (B) after 1, 5 and 10 min of HlyA treatment (100 ng/mL). Pf values were calculated, as indicated in Section 4.8, from stopped-flow experiments. Before HlyA addition, cells were pre-incubated in the absence or presence of suramin 100 µM for 10 min at 37 °C. Control experiments were run in the absence of toxin. Points in the plots represent means ± S.E.M. In (A) Control, N = 20; Control+Suramin and HlyA+Suramin, N = 5; HlyA, N = 15. In (B) Control, N = 18; Control+Suramin and HlyA+Suramin, N = 4; HlyA, N = 15.
When assessing Pf, no effect was observed with suramin alone (Figure 3B), while treatment with both suramin and HlyA caused a 27% reduction after 10 min of toxin ex-
Figure 3. Effects of Suramin on MCV and Pf changes induced by HlyA. RBCs suspensions at 10%hematocrit were used to determine MCV (A) and Pf (B) after 1, 5 and 10 min of HlyA treatment(100 ng/mL). Pf values were calculated, as indicated in Section 4.8, from stopped-flow experiments.Before HlyA addition, cells were pre-incubated in the absence or presence of suramin 100 µM for10 min at 37 ◦C. Control experiments were run in the absence of toxin. Points in the plots representmeans ± S.E.M. In (A) Control, N = 20; Control + Suramin and HlyA + Suramin, N = 5; HlyA, N = 15.In (B) Control, N = 18; Control + Suramin and HlyA + Suramin, N = 4; HlyA, N = 15.
When assessing Pf, no effect was observed with suramin alone (Figure 3B), whiletreatment with both suramin and HlyA caused a 27% reduction after 10 min of toxinexposure. This relative decrease of Pf was significant, but nevertheless weaker than the 49%reduction observed with HlyA in the absence of the purinergic blocker.

Int. J. Mol. Sci. 2022, 23, 872 5 of 19
The kinetics of both MCV and Pf as a function of toxin exposure time seem to berelated, considering that P2 blockage induced a reduction of both swelling and Pf.
2.4. Effects of MCV on Pf
Since swelling caused by HlyA, as observed in Figure 1, may be the primary causefor the observed changes in Pf, we decided to run additional experiments with RBCspreincubated in different hypoosmotic media (to trigger swelling), in the absence of toxin.In this way, different initial MCV levels could be generated and measured. Subsequently,cells were exposed to hyperosmotic media of different osmolarities, to create a 140 mosMosmotic gradient (similarly to that used for Pf measurements using HlyA-treated cells)between the intracellular and the extracellular compartments. Accordingly, for RBCspreincubated in 190, 215, 245 and 260 mosM media, hyperosmotic media of 346, 370, 400and 415 mosM were used.
Having determined MCV and Pf values for RBCs exposed to HlyA and hypo-osmoticmedia, it was then possible to plot Pf-MCV relationships for RBCs pre-exposed to thedifferent conditions, i.e., hypo-osmotic media, HlyA, and HlyA-suramin.
In Figure 4, MCV values were expressed relative to the isotonic control. For bothHlyA- and hypo-osmolarity challenged RBCs, Pf values decreased inversely with MCV,though the patterns were different for the two treatments. The main difference being thatunder HlyA treatment, unlike hypo-osmotic exposure, Pf values decreased more steeplyfor small increments of MCV. These results demonstrate that cell swelling does affect Pf.However, the different behavior profiles using HlyA vs. hypo-osmotic media showed thatthe HlyA-dependent effects are not entirely a consequence of its capacity to induce swelling.This can be clearly observed in the inset of Figure 4, showing that Pf steeply decreased withHlyA, with no significant changes when using hypo-osmotic media.
Int. J. Mol. Sci. 2022, 23, x FOR PEER REVIEW 5 of 20
posure. This relative decrease of Pf was significant, but nevertheless weaker than the 49% reduction observed with HlyA in the absence of the purinergic blocker.
The kinetics of both MCV and Pf as a function of toxin exposure time seem to be re-lated, considering that P2 blockage induced a reduction of both swelling and Pf.
2.4. Effects of MCV on Pf Since swelling caused by HlyA, as observed in Figure 1, may be the primary cause
for the observed changes in Pf, we decided to run additional experiments with RBCs pre-incubated in different hypoosmotic media (to trigger swelling), in the absence of toxin. In this way, different initial MCV levels could be generated and measured. Subsequent-ly, cells were exposed to hyperosmotic media of different osmolarities, to create a 140 mosM osmotic gradient (similarly to that used for Pf measurements using HlyA-treated cells) between the intracellular and the extracellular compartments. Accordingly, for RBCs preincubated in 190, 215, 245 and 260 mosM media, hyperosmotic media of 346, 370, 400 and 415 mosM were used.
Having determined MCV and Pf values for RBCs exposed to HlyA and hypo-osmotic media, it was then possible to plot Pf-MCV relationships for RBCs pre-exposed to the different conditions, i.e., hypo-osmotic media, HlyA, and HlyA-suramin.
In Figure 4, MCV values were expressed relative to the isotonic control. For both HlyA- and hypo-osmolarity challenged RBCs, Pf values decreased inversely with MCV, though the patterns were different for the two treatments. The main difference being that under HlyA treatment, unlike hypo-osmotic exposure, Pf values decreased more steeply for small increments of MCV. These results demonstrate that cell swelling does affect Pf. However, the different behavior profiles using HlyA vs. hypo-osmotic media showed that the HlyA-dependent effects are not entirely a consequence of its capacity to induce swelling. This can be clearly observed in the inset of Figure 4, showing that Pf steeply decreased with HlyA, with no significant changes when using hypo-osmotic media.
Thus, HlyA affects Pf by volume-dependent and volume-independent mechanisms.
Figure 4. Changes in Pf as a function of the relative MCV. Cells were incubated 1–10 min with 100 ng/mL HlyA in the presence of 100 µM suramin (gray square) or in its absence (black square), or were exposed to hypo-osmotic media (190–260 mosM, grey circles). After incubation, different ali-quots of RBCs suspensions at 10% hematocrit were used to determine MCV, and to perform stopped-flow experiments, as described in Section 4.7. Pf values were calculated as described in Section 4.8. The relative MCV was calculated by dividing the measured MCV by the MCV of con-trol RBCs in isosmotic medium. For the preparation of this figure, the results were grouped in 8
Figure 4. Changes in Pf as a function of the relative MCV. Cells were incubated 1–10 min with100 ng/mL HlyA in the presence of 100 µM suramin (gray square) or in its absence (black square),or were exposed to hypo-osmotic media (190–260 mosM, grey circles). After incubation, differentaliquots of RBCs suspensions at 10% hematocrit were used to determine MCV, and to performstopped-flow experiments, as described in Section 4.7. Pf values were calculated as described inSection 4.8. The relative MCV was calculated by dividing the measured MCV by the MCV of controlRBCs in isosmotic medium. For the preparation of this figure, the results were grouped in 8 groupsbased on the measured relative volume ranges (0.95–1, 1–1.05, 1.05–1.1, 1.11–1.15, 1.15–1.2, 1.2–1.25,1.25–1.3, 1.3–1.35 relative volume). Then relative cell volumes and Pf values within each range wereaveraged. Inset: Magnification of the main plot between 0.95–1.04 relative volume. Results aremeans ± S.E.M. (Hypo-osmotic media, N = 5; HlyA, N = 8, HlyA and Suramin, N = 4).
Thus, HlyA affects Pf by volume-dependent and volume-independent mechanisms.
Int. J. Mol. Sci. 2022, 23, 872 6 of 19
2.5. Role of AQP1 in HlyA Activity
In RBCs, aquaporin 1 (AQP1) [25], aquaporin 3 (AQP3) [26] and the urea transportertype B (UT-B) [27] can facilitate water transmembrane transport. In addition, water cancross the RBCs membrane by simple diffusion. Among these mechanisms, AQP1 is themajor water transporter. Therefore, reduced AQP1 activity may explain the observeddecreases in Pf in the presence of HlyA. To assess this possibility, we evaluated the effectsof HlyA on Pf of AQP1nullRBCs [32].
Since AQP1nullRBCs were thawed from frozen samples, it was necessary to performcontrol experiments using frozen samples from healthy individuals. Therefore, we workedwith three types of cells: control RBCs (c-RBCs), control RBCs from frozen samples (cf-RBCs), and AQP1nullRBCs. The results obtained from experiments using AQP1nullRBCs werealways compared with those using cf-RBCs, i.e., normal RBCs subjected to the same freezeand thaw treatment performed on AQP1nullRBCs. Thus, any difference observed betweencf-RBCs and AQP1nullRBCs can be assigned to the absence of AQP1 on the latter.
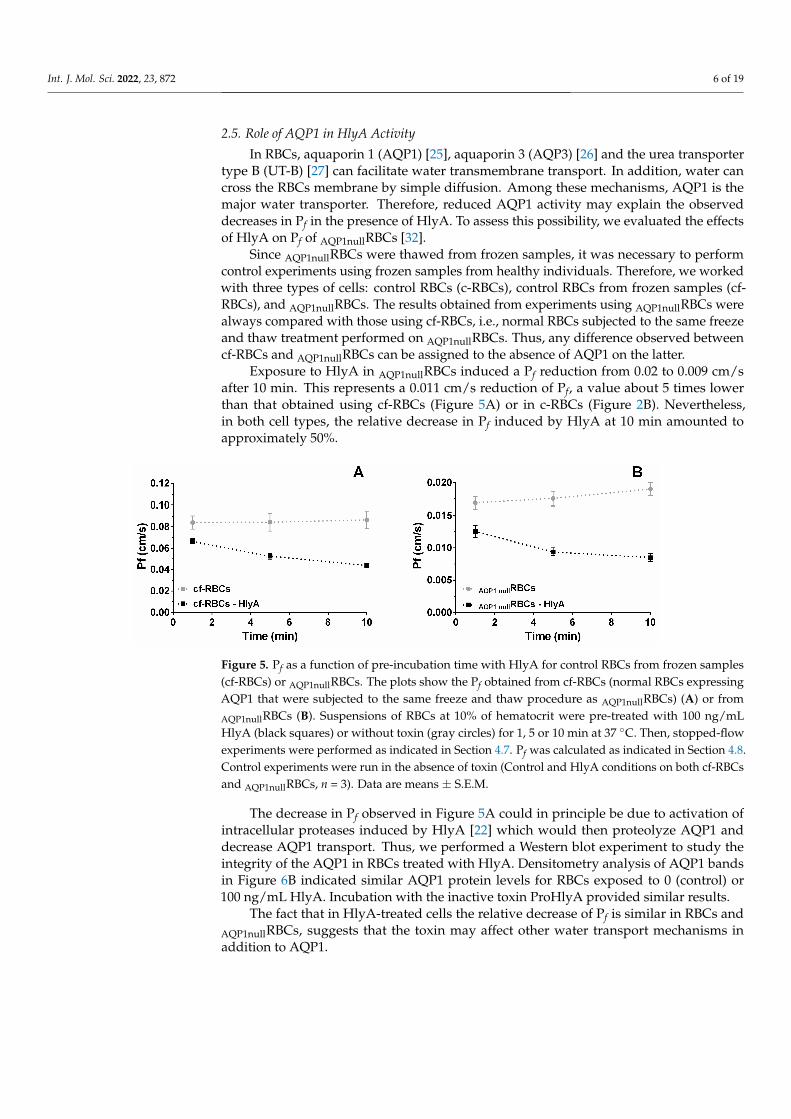
Exposure to HlyA in AQP1nullRBCs induced a Pf reduction from 0.02 to 0.009 cm/safter 10 min. This represents a 0.011 cm/s reduction of Pf, a value about 5 times lowerthan that obtained using cf-RBCs (Figure 5A) or in c-RBCs (Figure 2B). Nevertheless,in both cell types, the relative decrease in Pf induced by HlyA at 10 min amounted toapproximately 50%.
Int. J. Mol. Sci. 2022, 23, x FOR PEER REVIEW 6 of 20
groups based on the measured relative volume ranges (0.95–1, 1–1.05, 1.05–1.1, 1.11–1.15, 1.15–1.2, 1.2–1.25, 1.25–1.3, 1.3–1.35 relative volume). Then relative cell volumes and Pf values within each range were averaged. Inset: Magnification of the main plot between 0.95–1.04 relative volume. Re-sults are means ± S.E.M. (Hypo-osmotic media, N = 5; HlyA, N = 8, HlyA and Suramin, N = 4).
2.5. Role of AQP1 in HlyA Activity In RBCs, aquaporin 1 (AQP1) [25], aquaporin 3 (AQP3) [26] and the urea trans-
porter type B (UT-B) [27] can facilitate water transmembrane transport. In addition, wa-ter can cross the RBCs membrane by simple diffusion. Among these mechanisms, AQP1 is the major water transporter. Therefore, reduced AQP1 activity may explain the ob-served decreases in Pf in the presence of HlyA. To assess this possibility, we evaluated the effects of HlyA on Pf of AQP1nullRBCs [32].
Since AQP1nullRBCs were thawed from frozen samples, it was necessary to perform control experiments using frozen samples from healthy individuals. Therefore, we worked with three types of cells: control RBCs (c-RBCs), control RBCs from frozen sam-ples (cf-RBCs), and AQP1nullRBCs. The results obtained from experiments using AQP1nullRBCs were always compared with those using cf-RBCs, i.e., normal RBCs subject-ed to the same freeze and thaw treatment performed on AQP1nullRBCs. Thus, any differ-ence observed between cf-RBCs and AQP1nullRBCs can be assigned to the absence of AQP1 on the latter.
Exposure to HlyA in AQP1nullRBCs induced a Pf reduction from 0.02 to 0.009 cm/s af-ter 10 min. This represents a 0.011 cm/s reduction of Pf, a value about 5 times lower than that obtained using cf-RBCs (Figure 5A) or in c-RBCs (Figure 2B). Nevertheless, in both cell types, the relative decrease in Pf induced by HlyA at 10 min amounted to approxi-mately 50%.
Figure 5. Pf as a function of pre-incubation time with HlyA for control RBCs from frozen samples (cf-RBCs) or AQP1nullRBCs. The plots show the Pf obtained from cf-RBCs (normal RBCs expressing AQP1 that were subjected to the same freeze and thaw procedure as AQP1nullRBCs) (A) or from AQP1nullRBCs (B). Suspensions of RBCs at 10% of hematocrit were pre-treated with 100 ng/mL HlyA (black squares) or without toxin (gray circles) for 1, 5 or 10 min at 37 °C. Then, stopped-flow ex-periments were performed as indicated in Section 4.7. Pf was calculated as indicated in Section 4.8. Control experiments were run in the absence of toxin (Control and HlyA conditions on both cf-RBCs and AQP1nullRBCs, n = 3). Data are means ± S.E.M.
The decrease in Pf observed in Figure 5A could in principle be due to activation of intracellular proteases induced by HlyA [22] which would then proteolyze AQP1 and decrease AQP1 transport. Thus, we performed a Western blot experiment to study the integrity of the AQP1 in RBCs treated with HlyA. Densitometry analysis of AQP1 bands in Figure 6B indicated similar AQP1 protein levels for RBCs exposed to 0 (control) or 100 ng/mL HlyA. Incubation with the inactive toxin ProHlyA provided similar results.
Figure 5. Pf as a function of pre-incubation time with HlyA for control RBCs from frozen samples(cf-RBCs) or AQP1nullRBCs. The plots show the Pf obtained from cf-RBCs (normal RBCs expressingAQP1 that were subjected to the same freeze and thaw procedure as AQP1nullRBCs) (A) or from
AQP1nullRBCs (B). Suspensions of RBCs at 10% of hematocrit were pre-treated with 100 ng/mLHlyA (black squares) or without toxin (gray circles) for 1, 5 or 10 min at 37 ◦C. Then, stopped-flowexperiments were performed as indicated in Section 4.7. Pf was calculated as indicated in Section 4.8.Control experiments were run in the absence of toxin (Control and HlyA conditions on both cf-RBCsand AQP1nullRBCs, n = 3). Data are means ± S.E.M.
The decrease in Pf observed in Figure 5A could in principle be due to activation ofintracellular proteases induced by HlyA [22] which would then proteolyze AQP1 anddecrease AQP1 transport. Thus, we performed a Western blot experiment to study theintegrity of the AQP1 in RBCs treated with HlyA. Densitometry analysis of AQP1 bandsin Figure 6B indicated similar AQP1 protein levels for RBCs exposed to 0 (control) or100 ng/mL HlyA. Incubation with the inactive toxin ProHlyA provided similar results.
The fact that in HlyA-treated cells the relative decrease of Pf is similar in RBCs andAQP1nullRBCs, suggests that the toxin may affect other water transport mechanisms inaddition to AQP1.

Int. J. Mol. Sci. 2022, 23, 872 7 of 19Int. J. Mol. Sci. 2022, 23, x FOR PEER REVIEW 7 of 20
Figure 6. Western blot analysis of AQP1 in RBCs membranes. (A) RBCs suspensions at 10% hema-tocrit were treated with vehicle (Control), HlyA 100 ng/mL and ProHlyA 1 µg/mL at 37 °C for 10 min. The first row corresponds to the AQP1 band revealed with anti-AQP1 antibody. The second row corresponds to the anti-β actin antibody. (B) Densitometric analysis of the bands in A, ex-pressed as the ratio between optical density of AQP1 and β-actin bands (N = 3).
The fact that in HlyA-treated cells the relative decrease of Pf is similar in RBCs and AQP1nullRBCs, suggests that the toxin may affect other water transport mechanisms in ad-dition to AQP1.
Kinetics of Hemolysis, and Its Relationship to Changes in MCV and Pf To determine whether AQP1 is essential for MCV increase and hemolysis induced
by HlyA, kinetics of MCV and hemolysis were evaluated in AQP1nullRBCs vs. cf-RBCs. Hemolysis rates increased with toxin concentration, with T50 decreasing in a near expo-nential fashion. Although hemolysis rate was 44% lower in AQP1nullRBCs (vs cf-RBCs), at relative high toxin concentrations, all RBCs samples were fully hemolyzed at the end of the incubation period.
On the other hand, toxin-dependent swelling of AQP1nullRBCs was similar to that of c-RBCs after incubation with HlyA (100 ng/mL) at several times (Figure 7D). Thus, the ob-served 75% lower values of Pf of AQP1nullRBCs did not affect HlyA effects on MCV. More-over, the lower hemolysis rates of AQP1nullRBCs could not be explained in terms of chang-es in MCV.
2.6. How Cell Volume Is Linked to Hemolysis HlyA hemolysis can, in principle, be explained by swelling until a maximal critical
MCV (MCVmax) is attained, after which lysis occurs. However, HlyA also affects both RBCs cytoskeleton and the cell membrane [22,33] which could make the cell more fragile and unable to tolerate large volume changes. To the extent that the HlyA-induced in-crease in cell fragility may facilitate hemolysis, the MCVmax should be smaller in the presence than in the absence of toxin. To test this hypothesis, we measured the kinetics of MCV by electrical impedance cell cytometry and hemolysis by hemoglobin release when cells are challenged by 40 ng/mL HlyA or by hypo-osmotic media.
Hemolysis kinetics showed an initial lag phase when steep swelling occurred (Fig-ure 8A).
At approximately 11 min, MCV amounted to 105 fl when significant hemolysis started to be detected. At 20 min, average values of MCV stabilize near 120 fl, while the hemolysis speed was maximal. The MCVmax was 128 ± 5 fl at 25 min post-toxin exposure.
Figure 6. Western blot analysis of AQP1 in RBCs membranes. (A) RBCs suspensions at 10% hematocritwere treated with vehicle (Control), HlyA 100 ng/mL and ProHlyA 1 µg/mL at 37 ◦C for 10 min.The first row corresponds to the AQP1 band revealed with anti-AQP1 antibody. The second rowcorresponds to the anti-β actin antibody. (B) Densitometric analysis of the bands in A, expressed asthe ratio between optical density of AQP1 and β-actin bands (N = 3).
Kinetics of Hemolysis, and Its Relationship to Changes in MCV and Pf
To determine whether AQP1 is essential for MCV increase and hemolysis inducedby HlyA, kinetics of MCV and hemolysis were evaluated in AQP1nullRBCs vs. cf-RBCs.Hemolysis rates increased with toxin concentration, with T50 decreasing in a near expo-nential fashion. Although hemolysis rate was 44% lower in AQP1nullRBCs (vs cf-RBCs), atrelative high toxin concentrations, all RBCs samples were fully hemolyzed at the end of theincubation period.
On the other hand, toxin-dependent swelling of AQP1nullRBCs was similar to thatof c-RBCs after incubation with HlyA (100 ng/mL) at several times (Figure 7D). Thus,the observed 75% lower values of Pf of AQP1nullRBCs did not affect HlyA effects on MCV.Moreover, the lower hemolysis rates of AQP1nullRBCs could not be explained in terms ofchanges in MCV.
2.6. How Cell Volume Is Linked to Hemolysis
HlyA hemolysis can, in principle, be explained by swelling until a maximal criticalMCV (MCVmax) is attained, after which lysis occurs. However, HlyA also affects bothRBCs cytoskeleton and the cell membrane [22,33] which could make the cell more fragileand unable to tolerate large volume changes. To the extent that the HlyA-induced increasein cell fragility may facilitate hemolysis, the MCVmax should be smaller in the presencethan in the absence of toxin. To test this hypothesis, we measured the kinetics of MCV byelectrical impedance cell cytometry and hemolysis by hemoglobin release when cells arechallenged by 40 ng/mL HlyA or by hypo-osmotic media.
Hemolysis kinetics showed an initial lag phase when steep swelling occurred (Figure 8A).At approximately 11 min, MCV amounted to 105 fl when significant hemolysis started
to be detected. At 20 min, average values of MCV stabilize near 120 fl, while the hemolysisspeed was maximal. The MCVmax was 128 ± 5 fl at 25 min post-toxin exposure.
To test whether this MCVmax is the maximum physically possible MCV for RBCs,we measured the MCV and hemolysis in different hypo-osmotic media in the absence oftoxin. When plotting MCV as a function of media osmolarity, hemolysis can be detectedat osmolarities lower than 200 mosM (Figure 8B). At about 137 mosM, more than 80% ofRBCs were lysed, while the MCVmax of the remaining viable cells was 121 ± 4 fl. Therefore,in RBCs similar MCVmax values can be obtained in the absence or presence of HlyA.

Int. J. Mol. Sci. 2022, 23, 872 8 of 19Int. J. Mol. Sci. 2022, 23, x FOR PEER REVIEW 8 of 20
Figure 7. Hemolysis and volume kinetics in AQP1nullRBCs and cf-RBCs. In panels (A,B), the propor-tion (%) of viable cells for control RBCs from frozen samples (cf-RBC, A) or AQP1nullRBCs (B) is shown. Data were obtained as indicated in Section 4.6.2, using RBCs suspensions at 1% hemato-crit. The concentration of HlyA for each curve is indicated between panels (A,B) in ng/mL. Panel (C). Data of panels (A,B) were used to calculate the necessary time for achieving 50% hemolysis (T50). A semi-logarithmic plot shows values of T50 vs. HlyA concentration. Panel (D). MCV as a function of incubation time with 100 ng/mL HlyA was measured for fresh RBCs (c-RBCs, white circles), control frozen RBCs (cf-RBCs, gray circles) and AQP1nullRBCs (black circles). Panels (A–C) show data from a representative experiment. Results in (D) represent means ± S.E.M. (n = 3).
To test whether this MCVmax is the maximum physically possible MCV for RBCs, we measured the MCV and hemolysis in different hypo-osmotic media in the absence of toxin. When plotting MCV as a function of media osmolarity, hemolysis can be detected at osmolarities lower than 200 mosM (Figure 8B). At about 137 mosM, more than 80% of RBCs were lysed, while the MCVmax of the remaining viable cells was 121 ± 4 fl. There-fore, in RBCs similar MCVmax values can be obtained in the absence or presence of HlyA.
To validate results of MCV kinetics, similar experiments using flow cytometry were performed. Forward light scatter (FSC) of RBCs suspensions was measured, where the signal is directly proportional to MCV. In agreement with results of Figure 8, the maxi-mum value of FSC achieved in the presence of HlyA (isosmotic medium) was similar to that obtained in hypo-osmotic media (Supplementary Figure S3).
To understand the role of ATPe and purinergic signaling in the hemolytic mecha-nism of HlyA, we assessed the kinetics of MCV and hemolysis after toxin addition in the presence of suramin (Figure 8C). At 40 ng/mL HlyA, changes in MCV and hemolysis were reduced, but not abolished by the presence of the P2 blocker, thus suggesting that
A B
C D
Figure 7. Hemolysis and volume kinetics in AQP1nullRBCs and cf-RBCs. In panels (A,B), the pro-portion (%) of viable cells for control RBCs from frozen samples (cf-RBC, A) or AQP1nullRBCs (B) isshown. Data were obtained as indicated in Section 4.6.2, using RBCs suspensions at 1% hematocrit.The concentration of HlyA for each curve is indicated between panels (A,B) in ng/mL. Panel (C).Data of panels (A,B) were used to calculate the necessary time for achieving 50% hemolysis (T50). Asemi-logarithmic plot shows values of T50 vs. HlyA concentration. Panel (D). MCV as a function ofincubation time with 100 ng/mL HlyA was measured for fresh RBCs (c-RBCs, white circles), controlfrozen RBCs (cf-RBCs, gray circles) and AQP1nullRBCs (black circles). Panels (A–C) show data from arepresentative experiment. Results in (D) represent means ± S.E.M. (n = 3).
To validate results of MCV kinetics, similar experiments using flow cytometry wereperformed. Forward light scatter (FSC) of RBCs suspensions was measured, where thesignal is directly proportional to MCV. In agreement with results of Figure 8, the maximumvalue of FSC achieved in the presence of HlyA (isosmotic medium) was similar to thatobtained in hypo-osmotic media (Supplementary Figure S3).
To understand the role of ATPe and purinergic signaling in the hemolytic mechanismof HlyA, we assessed the kinetics of MCV and hemolysis after toxin addition in the presenceof suramin (Figure 8C). At 40 ng/mL HlyA, changes in MCV and hemolysis were reduced,but not abolished by the presence of the P2 blocker, thus suggesting that ATP signaling ismodulating, rather than mediating MCV increase and hemolysis elicited by HlyA.
Int. J. Mol. Sci. 2022, 23, 872 9 of 19
Int. J. Mol. Sci. 2022, 23, x FOR PEER REVIEW 9 of 20
ATP signaling is modulating, rather than mediating MCV increase and hemolysis elicit-ed by HlyA.
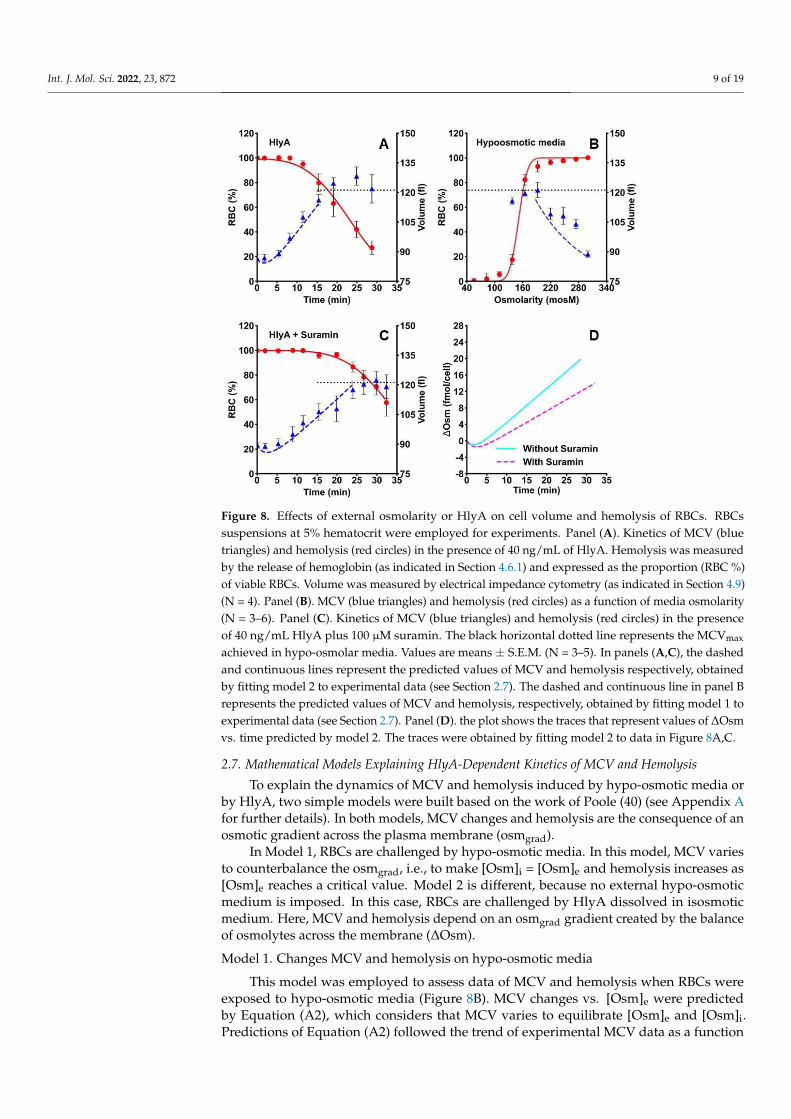
Figure 8. Effects of external osmolarity or HlyA on cell volume and hemolysis of RBCs. RBCs sus-pensions at 5% hematocrit were employed for experiments. Panel (A). Kinetics of MCV (blue tri-angles) and hemolysis (red circles) in the presence of 40 ng/mL of HlyA. Hemolysis was measured by the release of hemoglobin (as indicated in Section 4.6.1) and expressed as the proportion (RBC %) of viable RBCs. Volume was measured by electrical impedance cytometry (as indicated in Sec-tion 4.9) (N = 4). Panel (B). MCV (blue triangles) and hemolysis (red circles) as a function of media osmolarity (N = 3–6). Panel (C). Kinetics of MCV (blue triangles) and hemolysis (red circles) in the presence of 40 ng/mL HlyA plus 100 µM suramin. The black horizontal dotted line represents the MCVmax achieved in hypo-osmolar media. Values are means ± S.E.M. (N = 3–5). In panels (A,C), the dashed and continuous lines represent the predicted values of MCV and hemolysis respective-ly, obtained by fitting model 2 to experimental data (see Section 2.7). The dashed and continuous line in panel B represents the predicted values of MCV and hemolysis, respectively, obtained by fitting model 1 to experimental data (see Section 2.7). Panel (D). the plot shows the traces that rep-resent values of ΔOsm vs. time predicted by model 2. The traces were obtained by fitting model 2 to data in Figure 8A,C.
2.7. Mathematical Models Explaining HlyA-Dependent Kinetics of MCV and Hemolysis To explain the dynamics of MCV and hemolysis induced by hypo-osmotic media or
by HlyA, two simple models were built based on the work of Poole (40) (see Appendix A for further details). In both models, MCV changes and hemolysis are the consequence of an osmotic gradient across the plasma membrane (osmgrad).
In Model 1, RBCs are challenged by hypo-osmotic media. In this model, MCV var-ies to counterbalance the osmgrad, i.e., to make [Osm]i=[Osm]e and hemolysis increases as [Osm]e reaches a critical value. Model 2 is different, because no external hypo-osmotic medium is imposed. In this case, RBCs are challenged by HlyA dissolved in isosmotic medium. Here, MCV and hemolysis depend on an osmgrad gradient created by the bal-ance of osmolytes across the membrane (ΔOsm).
Figure 8. Effects of external osmolarity or HlyA on cell volume and hemolysis of RBCs. RBCssuspensions at 5% hematocrit were employed for experiments. Panel (A). Kinetics of MCV (bluetriangles) and hemolysis (red circles) in the presence of 40 ng/mL of HlyA. Hemolysis was measuredby the release of hemoglobin (as indicated in Section 4.6.1) and expressed as the proportion (RBC %)of viable RBCs. Volume was measured by electrical impedance cytometry (as indicated in Section 4.9)(N = 4). Panel (B). MCV (blue triangles) and hemolysis (red circles) as a function of media osmolarity(N = 3–6). Panel (C). Kinetics of MCV (blue triangles) and hemolysis (red circles) in the presenceof 40 ng/mL HlyA plus 100 µM suramin. The black horizontal dotted line represents the MCVmax
achieved in hypo-osmolar media. Values are means ± S.E.M. (N = 3–5). In panels (A,C), the dashedand continuous lines represent the predicted values of MCV and hemolysis respectively, obtainedby fitting model 2 to experimental data (see Section 2.7). The dashed and continuous line in panel Brepresents the predicted values of MCV and hemolysis, respectively, obtained by fitting model 1 toexperimental data (see Section 2.7). Panel (D). the plot shows the traces that represent values of ∆Osmvs. time predicted by model 2. The traces were obtained by fitting model 2 to data in Figure 8A,C.
2.7. Mathematical Models Explaining HlyA-Dependent Kinetics of MCV and Hemolysis
To explain the dynamics of MCV and hemolysis induced by hypo-osmotic media orby HlyA, two simple models were built based on the work of Poole (40) (see Appendix Afor further details). In both models, MCV changes and hemolysis are the consequence of anosmotic gradient across the plasma membrane (osmgrad).
In Model 1, RBCs are challenged by hypo-osmotic media. In this model, MCV variesto counterbalance the osmgrad, i.e., to make [Osm]i = [Osm]e and hemolysis increases as[Osm]e reaches a critical value. Model 2 is different, because no external hypo-osmoticmedium is imposed. In this case, RBCs are challenged by HlyA dissolved in isosmoticmedium. Here, MCV and hemolysis depend on an osmgrad gradient created by the balanceof osmolytes across the membrane (∆Osm).
Model 1. Changes MCV and hemolysis on hypo-osmotic media
This model was employed to assess data of MCV and hemolysis when RBCs wereexposed to hypo-osmotic media (Figure 8B). MCV changes vs. [Osm]e were predictedby Equation (A2), which considers that MCV varies to equilibrate [Osm]e and [Osm]i.Predictions of Equation (A2) followed the trend of experimental MCV data as a function

Int. J. Mol. Sci. 2022, 23, 872 10 of 19
of osmolarity until 200 mosM, after which, experimental data and the equation diverge(dashed blue line, Figure 8B). In particular, the equation does not agree with data onceMCVmax is reached, because cells can no longer compensate the osmolarity change byswelling. At osmolarities lower than 200 mosM, hemolysis started to be detected.
To analyze hemolysis as a function of [Osm]e, Equation (A5) was employed. Thisequation represents the % of RBCs that is lysed at any [Osm]e. By fitting Equation (A5) todata (red continuous line Figure 8B), the value of best fit of parameter µ was 150 ± 2 mosM.This parameter indicates the [Osm]e at which 50% of RBCs were lysed, which means thatRBCs can withstand, on average, an osmgrad of 150 mosM (i.e., [Osm]i = 300 mosM vs.[Osm]e = 150 mosM).
Model 2. HlyA-dependent changes in MCV and hemolysis
HlyA-dependent changes in MCV and hemolysis were calculated from a simpleequation (Equation (A6)) describing the balance of osmolytes across the membrane (∆Osm)vs. time in the presence of HlyA. Then, the values of MCV (Equation (A8)) and hemolysis(Equation (A9)) were calculated as a function of ∆Osm. Model 2 was fitted to MCV andhemolysis experimental data shown in Figure 8A,C. A good fit of the model to experimentaldata was observed, indicating that the dynamics of MCV and hemolysis can be explainedsolely on osmgrad induced by the toxin.
The dynamics of ∆Osm predicted by model 2 after the addition of HlyA and suraminis shown in Figure 8D. In the absence of suramin, our model predicts that an osmgrad isgenerated rapidly because the osmolytes influx (mainly driven by Na+) overcomes thecontribution of osmolytes efflux (mainly driven by K+). In the presence of suramin, P2blockage decreased cation influx, thus resulting in slower osmolyte incorporation by RBCs(Figure 8D).
Results agree with those of Figure 3A, where MCV changes were inhibited in thepresence of suramin.
Finally, to test if model 2 can explain HlyA activity, we measured the hemolysis kineticsby quantifying the release of hemoglobin at various toxin concentrations (10–160 ng/mL).The model obtained a good fit to experimental data (Figure 9), suggesting that HlyA-hemolysis can be described by changes in osmgrad over a wide range of toxin concentrations.
Int. J. Mol. Sci. 2022, 23, x FOR PEER REVIEW 11 of 20
Figure 9. Fitting of time-dependent effect of HlyA on hemolysis. RBCs suspensions at 5% hemato-crit were treated for different times with 5 HlyA concentrations (10–160 ng/mL). Data are ex-pressed as the proportion of viable cells (RBC%) vs. time. The continuous lines show the fit of model 2 to experimental data at each HlyA concentration. Best fit values of the parameters are shown in Supplementary Table S1. Data represents means ± S.E.M. (N = 3–6).
3. Discussion Despite various studies describing the effects of HlyA on ion permeabilities and cell
volume, the direct effects of the toxin on water permeability, and associated changes in cell volume and hemolysis, have not been assessed until now. Swelling is especially del-eterious to RBCs which, unlike most other cells, lack cell volume regulatory mechanisms to counteract volume increase [34].
Exposure of RBCs to HlyA induced a significant decrease of Pf. The fact that the re-sponse to the toxin depended on exposure time is consistent with the proposed mecha-nism of toxin action [16]. A similar Pf reduction pattern was observed in control- and AQP1nullRBCs, indicating that HlyA affects one or various water transport mechanisms, such as AQP3, UT-B, and/or simple diffusion across the membrane [23]. The observed lack of direct effects of HlyA on AQP1 is supported by Western blot results showing nei-ther proteolysis nor loss of AQP1 in membranes of toxin-treated RBCs. Unlike the lack of effect on AQP1, HlyA was shown to activate calpains producing partial proteolysis of Band 3, another abundant membrane protein of RBCs [22].
Experiments comparing decreases in Pf due to HlyA vs. exposure to hypo-osmotic media show that HlyA-dependent Pf decrease was not entirely due to the capacity of the toxin to induce swelling, so that other signaling steps should be responsible for the ob-served reduction of water permeability. In this respect, previous reports showed that P2 receptor activation induced HlyA-dependent swelling of RBCs [23,24] and, this study shows that blocking P2 not only inhibits swelling, but also partially inhibited the strong Pf inhibition induced by HlyA.
On the other hand, AQP1 disruption did not change MCV kinetics in RBCs, in line with individuals of the rare Colton null phenotype not suffering clinical symptoms [28], probably because sufficient non-AQP1 water permeability is able to control cell volume under HlyA exposure. Thus, relative slow water movements in RBCs may be secondary to net fluxes of osmolytes driving the volumetric response. This ion-dependent induc-tion of water flux was interpreted in terms of a data-driven mathematical model.
Cytotoxicity of HlyA is commonly believed to correlate with acute Ca2+ entry acti-vating K+ efflux, followed by subsequent Na+ influx and water [20]. Since toxin effects are time dependent, the model predicted the rates of osmolyte transport across the
Figure 9. Fitting of time-dependent effect of HlyA on hemolysis. RBCs suspensions at 5% hematocritwere treated for different times with 5 HlyA concentrations (10–160 ng/mL). Data are expressedas the proportion of viable cells (RBC%) vs. time. The continuous lines show the fit of model 2to experimental data at each HlyA concentration. Best fit values of the parameters are shown inSupplementary Table S1. Data represents means ± S.E.M. (N = 3–6).

Int. J. Mol. Sci. 2022, 23, 872 11 of 19
3. Discussion
Despite various studies describing the effects of HlyA on ion permeabilities andcell volume, the direct effects of the toxin on water permeability, and associated changesin cell volume and hemolysis, have not been assessed until now. Swelling is especiallydeleterious to RBCs which, unlike most other cells, lack cell volume regulatory mechanismsto counteract volume increase [34].
Exposure of RBCs to HlyA induced a significant decrease of Pf. The fact that theresponse to the toxin depended on exposure time is consistent with the proposed mech-anism of toxin action [16]. A similar Pf reduction pattern was observed in control- andAQP1nullRBCs, indicating that HlyA affects one or various water transport mechanisms,such as AQP3, UT-B, and/or simple diffusion across the membrane [23]. The observed lackof direct effects of HlyA on AQP1 is supported by Western blot results showing neitherproteolysis nor loss of AQP1 in membranes of toxin-treated RBCs. Unlike the lack of effecton AQP1, HlyA was shown to activate calpains producing partial proteolysis of Band 3,another abundant membrane protein of RBCs [22].
Experiments comparing decreases in Pf due to HlyA vs. exposure to hypo-osmoticmedia show that HlyA-dependent Pf decrease was not entirely due to the capacity ofthe toxin to induce swelling, so that other signaling steps should be responsible for theobserved reduction of water permeability. In this respect, previous reports showed thatP2 receptor activation induced HlyA-dependent swelling of RBCs [23,24] and, this studyshows that blocking P2 not only inhibits swelling, but also partially inhibited the strong Pfinhibition induced by HlyA.
On the other hand, AQP1 disruption did not change MCV kinetics in RBCs, in linewith individuals of the rare Colton null phenotype not suffering clinical symptoms [28],probably because sufficient non-AQP1 water permeability is able to control cell volumeunder HlyA exposure. Thus, relative slow water movements in RBCs may be secondary tonet fluxes of osmolytes driving the volumetric response. This ion-dependent induction ofwater flux was interpreted in terms of a data-driven mathematical model.
Cytotoxicity of HlyA is commonly believed to correlate with acute Ca2+ entry activat-ing K+ efflux, followed by subsequent Na+ influx and water [20]. Since toxin effects aretime dependent, the model predicted the rates of osmolyte transport across the membrane(∆Osm) as a function of time, causing changes in MCV, while hemolysis occurs when ∆Osmvalues surpass the maximal number of osmolytes that an RBCs can physically incorpo-rate before exploding. The model predicted that in HlyA-treated RBCs, early K+ efflux ispartially compensated by Na+ influx, consistent with the observed slow initial phase ofswelling. Later, net Na+ uptake is greatly accelerated, followed by osmotically obligatedwater influx, and swelling, leading to hemolysis.
When studying more closely the cell volume-hemolysis coupling, a lag phase ofhemolysis was observed, while swelling was fast until cells achieved an MCVmax valuebefore bursting. Using different hypo-osmotic media in the absence of toxin, a similarMCVmax was observed, suggesting that HlyA influence on cell volume and hemolysis reliesmainly on osmotic effects. Nevertheless, under HlyA exposure a small population of cellshemolyzes before MCVmax is achieved, thus pointing to higher cell fragility under toxinexposure.
Results of this study may help understand the contribution of HlyA to the virulenceof UPEC strains, where toxin can alter different signaling cascades of the host. Althoughin vitro HlyA-dependent volume and hemolysis kinetics do not appear to depend on highPf mediated by AQP1, RBCs are mobile cells that encounter different environments as theytravel through the circulation. Rapid water exchange mediated by AQP1 is assumed toprotect RBCs from osmotic stress when these cells permeate the hypertonic renal medulla, asituation where HlyA may impair the capacity of RBCs to trigger an adaptive response. Onthe other hand, since AQP1 is very abundant in the proximal tubule kidney and contributes10 times more to Pf than UT-B [35], HlyA reduction of Pf might affect water reabsorptionin the kidney. Consistent with this idea, AQP1-deficient individuals, as well as AQP1null

Int. J. Mol. Sci. 2022, 23, 872 12 of 19
mice, show an impaired ability to concentrate urine [35,36]. Therefore, to the extent that P2blockers partially inhibit HlyA effects on Pf, they may offer a novel protection mechanismof clinical value against toxin-induced osmotic stress, thus limiting HlyA function as avirulence factor.
In addition, the results may shed light on other exotoxins inducing similar osmotic andpurinergic events as HlyA. In this respect, leukotoxin A is another RTX toxin, a virulencefactor produced and released by the bacterium Aggregatibacter actinomycetemcomitans, whichcan cause localized aggressive periodontitis and endocarditis. Interestingly, compared toHlyA, leukotoxin A causes qualitatively similar changes in the volume of RBCs, similarlymodulated by P2X activation [30], though effects on Pf were not studied.
4. Methods
All reagents in this study were of analytical grade. Bovine serum albumin (BSA),suramin, sucrose, chloramphenicol, guanidinium hydrochloride, ethylene glycol-bis(2-aminoethylether)-N,N,N′,N′-tetraacetic acid (EGTA) and phenylmethanesulfonyl fluoride(PMSF) were purchased from Sigma (St. Louis, MO, USA).
4.1. Media Used
• Isosmotic medium: (in mM) 137 NaCl, 2.7 KCl, 2.5 Na2HPO4, 1.50 KH2PO4, 1.32 CaCl2,1.91 MgSO4, 5 glucose, pH 7.4 at 25 ◦C, 300 mosM.
• Hypo-osmotic medium: isosmotic medium reduced in NaCl content to obtain 55, 82, 110,137, 164, 192, 219, 247 and 274 mosM.
• Tris-Chloride (TC) buffer: (in mM) 20 Tris, 150 NaCl, pH 7.4 at 25 ◦C.
4.2. Isolation of RBCs
• Fresh RBCs: RBCs were obtained from healthy individuals by venipuncture. Afterblood collection, the sample was centrifuged at 900× g for 3 min and the plasma,the platelets and the leucocytes were removed and discarded. Isolated RBCs wereresuspended and washed three times in isosmotic medium. Finally, packed RBCswere resuspended at the corresponding hematocrit. The procedure was approvedby the Ethics Committee on Clinical Investigation of the School of Pharmacy andBiochemistry, University of Buenos Aires (Res RESCD-2020-281-E-UBA-DCT_FFYB).
• Frozen RBCs: Control RBCs (cf-RBCs) and RBCs from an individual lacking the majorwater channel aquaporin 1 (AQP1nullRBCs) [27] were provided by the Centre Nationalde Référence des Groupes Sanguins (Paris, France). Before the study, cryopreservedRBCs of both conditions were thawed and washed in isosmotic medium as describedfor fresh RBCs.
4.3. Toxin Purification
HlyA was purified from culture of the overproducing Escherichia coli strain WAM 1824(E. coli JM15 strain transformed with pSF4000 containing hlyCABD operon). WAM 1824 wasgrown in Luria–Bertani medium at 37 ◦C in presence of 20 µg/mL chloramphenicol to latelog phase and an OD600nm of 0.8–1.0. Cells were pelleted and the supernatant was treatedwith 20% (v/v) cold aqueous ethanol at pH 4.5 (pI of HlyA) to precipitate and partiallypurify the toxin. Precipitated toxin was collected by centrifugation (14,500× g at 4 ◦C for 1h, Sorvall centrifuge rotor SSA 34) and then resuspended in TC buffer supplemented with6 M guanidinium hydrochloride. Protein content was determined by Bradford assay [37].SDS-PAGE revealed a main band at 110 kDa corresponding to more than 90% of the totalprotein. The resulting proteins were stored at −70 ◦C in guanidinium hydrochloride.
4.4. RBCs Treatment
RBCs suspensions (1–10% hematocrit) were incubated in the presence of HlyA for thetimes indicated in each figure. Before each experiment, fresh toxin solutions were preparedfrom a stock solution. Controls were run in the absence of toxin.

Int. J. Mol. Sci. 2022, 23, 872 13 of 19
For experiments using suramin, RBCs were pre-treated with 100 µM of this drug for10 min at 37 ◦C before HlyA addition.
For measurements in hypo-osmotic media, the RBCs were pre-incubated in differentosmolarity media (55–280 mosM) for several minutes at the temperature the experimentwas performed.
4.5. Microscopy
Videomicroscopy and scanning electron microscopy (SEM) were used to study cellmorphology.
4.5.1. Videomicroscopy
To determine real-time shape changes of viable cells, RBCs suspensions at 1% ofhematocrit were exposed to vehicle or HlyA, mounted immediately on slides and observedby light microscopy (Biotraza LCD XSP-167SP). During 30 min, images were acquired usinga coupled camera at 100×magnification. Experiments were run at 20 ◦C.
4.5.2. Scanning Electron Microscopy
RBCs were treated with vehicle or HlyA and then fixed using 2.5% glutaraldehyde.Fixed RBCs were coated with graphite by thermal evaporation of charcoal (0.150 Torr at50 Amp for 30 s) by means of a desk carbon accessory coater (Denton Vacuum, Moorestown,NJ, USA). Coated samples were placed in a holder and observed by SEM (JEOL model JSM-IT300-LV, Tokyo, Japan). The images were acquired with a secondary electron detector at30 kV, 10–30 spot size and working distance of 10 mm under high vacuum.
4.6. Hemolysis Assays
The hemolysis of HlyA-treated RBCs was determined by two different methods:
4.6.1. Quantification of Hemoglobin Release at 405 nm
Hemolysis was evaluated by measuring free hemoglobin released to the medium bylysed RBCs. A quantity of 5% v/v of RBCs suspension was treated with different HlyAconcentrations at 37 ◦C for 40 min. During this period, aliquots of the RBCs suspensionwere taken at different times (the suspension was gently agitated each time to ensure ahomogeneous distribution of the cells). The samples were centrifuged at 2680× g in anEppendorf centrifuge for 30 s and free hemoglobin in the supernatant was quantifiedby light absorption at a wavelength of 405 nm [38] in a 96-well microtiter plate. In eachexperiment, the 405 nm absorption of the supernatant of a sample of RBCs in the absenceof HlyA was measured (ABS0). To estimate the hemoglobin released at 100% hemolysis(ABS100), the absorbance of the supernatant of a RBCs suspension treated with 160 ng/mLof HlyA for 30 min at 37 ◦C was also measured. The proportion of remaining RBCs(RBC %) at each time was calculated by the following formula (where ABSs represents theabsorbance of the sample):
RBC(%) = 100− 100(ABSs −ABS0)
ABS100 −ABS0(1)
4.6.2. Measurement of Light Scattering at 595 nm
Hemolysis kinetics of AQP1nullRBCs treated with HlyA was determined by light scat-tering at 595 nm. For this purpose, HlyA was serially diluted in isosmotic medium in a96-well microtiter plate. Then, 100 µL of 2% hematocrit RBCs suspension was added. Theplate was incubated at 25 ◦C and the absorbance at 595 nm was measured every 30 s during30 min. ABS0 correspond to the absorbance at 595 nm of untreated RBCs and ABS100 tothe 100% hemolysis sample as specified in Section 4.6.1. The RBC% was calculated usingEquation (1).

Int. J. Mol. Sci. 2022, 23, 872 14 of 19
4.7. Stopped-Flow Assay
To evaluate changes in Pf induced by HlyA on RBCs variants, cells were treated withthe toxin for fixed times and then the stopped-flow assay was performed.
Experiments were run using SFM 400 stopped-flow equipment (BioLogic, Grenoble,France). HlyA-treated and control RBCs were rapidly mixed with hyperosmotic medium.This hyperosmotic medium was prepared by the addition of 140 mosM sacarose to thesame medium in which the cells were preincubated. Time courses of the changes in90◦ scattered-light intensity (SSC) (λexc of 530 nm) of RBCs were measured to follow theosmotic shrinking of cells at 37 ◦C. At least 8 time-courses were averaged, and the followingequation was fitted to the data:
SSC = A∞
(1− e−kt
)+ A0 (2)
SSC represents side-scattered light and t represents the time. A∞ and A0 represent thescattered light at time 0 and infinite respectively. The k parameter defines the speed of thesignal change. A least squares procedure was applied to obtain the best values of the k, A0and A∞ parameters.
4.8. Pf Calculation
Pf (cm/s) was determined using the equation proposed by van Heeswijk and vanOs [39]:
P f =V0 k
S Vw Cout(3)
where V0 is the initial volume of RBC, S is the cell area, Vw is the molar volume of water(18 cm3/ mol), k is the parameter obtained in Section 4.7 and Cout is the total concentrationof extracellular solutes. Cout was controlled in every experiment using an osmometer(Vapro 5520, Wescor Inc., Logan, UT, USA).
4.9. MCV Determinations
MCV measurements were performed using the automated cell analyzers MS4e (MeletSchloesing, Osny, France) and Casy (Schärfe System, Reutlingen, Germany) based on theCoulter counting principle by measuring changes in electrical impedance. For these deter-minations RBCs hematocrit was 10%. In the case of the MS4e, the equipment was purgedwith the hypo-osmotic media corresponding to the measurement to ensure that all dilutionsand measurements were performed in the same medium. For assays in the presence ofHlyA, measurements were performed in isosmotic media at different times after toxinaddition. The volume histograms obtained from the MS4e cell analyzer were processed toexpress cell volume in femtoliter units as specified in Supplementary Figure S2.
4.10. RBCs Forward Light Scattering (FSC)
The light scattering of individual RBCs was measured by Accuri Plus 6 (BD, FranklinLakes, NJ, USA). For measurements in different hypo-osmotic media, 5% hematocrit ofRBCs suspensions were pre-incubated in each medium for 30 min at 37 ◦C. HlyA-treatedRBCs experiments were performed in isosmotic media at different times after toxin additionat 37 ◦C.
4.11. Western Blot of AQP1
RBCs at 10% hematocrit were incubated in the presence of 100 ng/mL HlyA, 1 µg/mLProHlyA or without toxin for 10 min at 37 ◦C. After treatment, cells were diluted witha buffer containing Tris 15 mM, EDTA 1 mM and PMSF 1 mM, pH 7.65 (membranepurification buffer) to induce cell lysis. Then, the samples were centrifuged for 15 min at16,000 rpm, at 4 ◦C, the supernatant discarded and the pellet containing the RBCs plasmamembranes resuspended in membrane purification buffer. Between 6 and 7 centrifugationswere performed to remove all soluble proteins. Purified RBCs membranes were prepared

Int. J. Mol. Sci. 2022, 23, 872 15 of 19
for a 16% SDS-PAGE. Samples were resuspended in sampling buffer in the presence of2% SDS. After electrophoresis, the gel was transferred to PVDF membranes which wereblocked with 3% skim milk in TBS buffer (10 mM Tris-HCl, 150 mM NaCl, pH 7.4) atroom temperature for 1.5 h. Then, they were incubated with a solution containing apolyclonal rabbit anti-AQP1 antibody (Alpha Diagnostic) (1:1000), washed with TBS buffer,and finally reacted with peroxidase-conjugated anti-rabbit antibody (Jackson) (1:30,000) inTBS buffer with 3% skimmed milk at room temperature for 1.5 h. Finally, the membraneswere incubated with a peroxidase substrate solution (Immobilon Western, Millipore) forthe detection of horseradish peroxidase-conjugate antibodies on the membrane. Imageswere obtained using ChemiDoc MP Imaging System (Bio-rad, Hercules, CA, USA).
4.12. Model Fit
The models of hemolysis and MCV changes elicited by HlyA were prepared as in-dicated in Appendix A and fitted to experimental data. The code was written in Python,employing pandas, scipy, matplotlib and numpy libraries. Details of the procedure can befound in Appendix A.
4.13. Statistics
In each figure, the number of independent experiments used to estimate the meanand standard error of the mean is indicated with the letter “N”. In the Figures 5 and 7,the experiments were performed using AQP1nullRBCs from the same donor, therefore, thenumber of independent assays is indicated with the letter “n”.
Supplementary Materials: The following are available online at https://www.mdpi.com/article/10.3390/ijms23020872/s1.
Author Contributions: Conceptualization, M.A.O., P.J.S., N.A.S., N.L. and V.H.; methodology, N.L.,N.A.S., R.G.-L., I.M.-C., V.H., K.A. and L.C.; validation, N.L., N.A.S., R.G.-L., I.M.-C. and V.H.; formalanalysis, N.L., N.A.S., R.G.-L., I.M.-C., V.H. and K.A.; investigation, M.A.O., P.J.S., V.H., N.A.S. andN.L.; resources, M.A.O. and P.J.S.; data curation, N.A.S.; writing—original draft preparation, M.A.O.,P.J.S., N.A.S., N.L. and K.A.; writing—review and editing, M.A.O., P.J.S., N.A.S., N.L., K.A. and V.H.;project administration, M.A.O. and P.J.S.; funding acquisition, M.A.O. and P.J.S. All authors haveread and agreed to the published version of the manuscript.
Funding: This research was funded by Universidad de Buenos Aires, Grant number 20020170100152BA, the ECOS Sud Program, Grant A15S01, and the Guests Researcher program from Universityof Paris. S.N.A. was funded by Agencia Nacional de Promoción Científica y Tecnológica (PICT2019-03218).
Institutional Review Board Statement: The study was conducted according to the guidelines of theDeclaration of Helsinki and approved by the Ethics Committee on Clinical Investigation of the Schoolof Pharmacy and Biochemistry, University of Buenos Aires (Res RESCD-2020-281-E-UBA-DCT_FFYB).
Informed Consent Statement: Informed consent was obtained from all subjects involved in the study.
Data Availability Statement: Experimental data of the results within this work are available at thefollowing site: https://doi.org/10.6084/m9.figshare.17978210.
Acknowledgments: The authors thank M.C. Jazmin López-Diaz, and Oscar Talavera, for providingthe scanning-electron-microscopical images at the Scanning Electronic Microscopy and MicroanalysisLaboratory of the Universidad Autónoma de Guerrero and Carlos Muñoz Garay of the Instituto deCiencias Físicas, Universidad Nacional Autónoma de México and Alicia Damiano, IFIBIO, Facultadde Medicina, Universidad de Buenos Aires, for providing the antibody antiAQP1. V.H., R.G.-L.,K.A. and P.J.S. are career researchers at Consejo Nacional de Investigaciones Científicas y Técnicas(CONICET). L.C. is a doctoral student from CONICET. N.L. and N.A.S. are doctoral student andpostdoctoral fellow from Universidad de Buenos Aires and Universidad Nacional de San Martín,respectively. I.M-C. is a career researcher at the INSERM. M.A.O. is full professor at Universityof Paris.
Conflicts of Interest: The authors declare no conflict of interest.
Int. J. Mol. Sci. 2022, 23, 872 16 of 19
Appendix A
The models presented here were fitted to experimental data of Figure 8A–C.In the models, changes in MCV and hemolysis are the consequence of an osmotic
gradient across the plasma membrane (osmgrad). This gradient can be calculated by thedifference between extracellular ([Osm]e) and intracellular ([Osm]i) osmolarities using thefollowing equation:
osmgrad = [Osm]i − [Osm]e (A1)
Model 1. MCV and hemolysis of RBCs exposed to hypo-osmolar mediaThe MCV varies to counterbalance the osmgrad, i.e., to make [Osm]i=[Osm]e. This can
be represented by the following equation:
MCV =[Osm]i[Osm]e
(V0(1− fh)) + V0fh (A2)
V0 is the MCV at isosmolar medium (300 mosM) and fh is the fraction of MCV occupiedby hemoglobin and other proteins (volume not occupied by water) which was taken fromthe work of Freedman and Hoffman (fh = 0.35) [40]. The value of [Osm]i is 300 mosM(which corresponds to MCV in isosmolar conditions), but it is recalculated when MCVchanges due to the osmotic activity of hemoglobin [40]. The osmotic activity coefficient ofhemoglobin was calculated using the equation proposed by Freedman and Hoffman:
ΦHb = 1 + 0.0645[Hb] + 0.0258[Hb]2 (A3)
where ΦHb is the osmotic activity coefficient of hemoglobin and [Hb] is the hemoglobinconcentration inside the RBCs. The value of [Hb] at V0 was considered 7.5 mM [40]. Ateach MCV, the value of [Osm]i was recalculated using the following equation:
[Osm]i = [Hb]∗ΦHb + [Osm]notHb (A4)
where [Osm]notHb is the contribution of all osmolytes except for hemoglobin and its valuewas 278 mosM at V0.
Results of Figure 8B show that predictions from Equation (A2) follow the trend ofMCV data as a function of [Osm]e until 200 mosM, an osmolarity where experimentaldata and the equation diverge. Predictions of Equation (A2) do not agree with data onceMCVmax is reached. This is because the cell can no longer compensate the osmolaritychange by swelling.
To explain hemolysis at different [Osm]e, the maximal osmgrad that the RBCs popula-tion can tolerate was considered normally distributed. This means that 50% of all RBCswill lyse at a given osmgrad value called osm50. Also, there is a standard deviation ofosmgrad (osmdev) whose value indicates how many RBCs lyse near osm50. A small osmdevindicates that most RBCs lyse near osm50, while a big osmdev indicates that RBCs lysisoccurs over a wide range of osmgrad. In hypo-osmotic media, osmgrad will depend on[Osm]e, as indicated in Equation (A1). Therefore, it could be predicted that the proportionof lysed RBCs as a function of [Osm]e will be described by:
RBC% =1002
[1 + erf
([Osm]e − µ
osmdev√
2
)](A5)
“Erf” refers to the error function, µ represents the [Osm]e at which 50% of RBCs are lysed(when osmgrad = osm50) and osmdev represents the standard deviation of the probabilitydistribution. Equation (A5) was fitted to data of hemolysis vs. [Osm]e and it is representedas a continuous red line in Figure 8B. The obtained best values of µ and osmdev were150 ± 2 mosM and 17 ± 2 mosM, respectively.
Model 2. Changes in MCV and hemolysis of RBCs induced by HlyA
Int. J. Mol. Sci. 2022, 23, 872 17 of 19
MCV and hemolysis dynamics in the presence of HlyA dissolved in isosmotic mediumare also a consequence of osmgrad. However, in this case, osmgrad is not controlled by[Osm]e, but generated by toxin-induced osmolyte flux across the membrane, consequentlyproducing cell volume changes and hemolysis in RBCs. The net balance of osmolytesacross the membrane after RBCs enter in contact with HlyA is called ∆Osm. The osmolaritychanges in HlyA-treated RBCs are driven by the balance between net K+ efflux and net Na+
influx.The value of ∆Osm was calculated from the following equation:
∆Osm = At− B(
1− e−k1t)
(A6)
where parameter A accounts for the speed at which the RBCs incorporate osmolytes becauseof the inward Na+ flux. Parameter B contains information about the number of osmolyteslost by K+ efflux, and k1 is a kinetic constant that determines how fast the K+ contributionreach its equilibrium value.
∆Osm is expressed in fmol/cell, but can be easily transformed in osmgrad by thefollowing equation:
osmgrad =∆Osm
V0(1− fh)(A7)
The MCV changes and hemolysis in the presence of HlyA were calculated from ∆Osm.Therefore, to explain the MCV changes in terms of ∆Osm, the following equation wasemployed:
MCV =
[∆Osm]V0(1−fh)
+ [Osm]notHb + [Hb]∗ΦHb
[Osm]e(V0(1− fh)) + V0fh (A8)
Equation (A8) is similar to Equation (A2), except that [Osm]e is constant (cells wereincubated in isosmotic medium) and [Osm]i is equal to the sum of 3 terms: the contributionof all osmolytes with the exception of Hb ([Osm]notHb), the contribution of Hb osmoticactivity ([Hb]*ΦHb) and the osmgrad created by the toxin (calculated from ∆Osm). Toexplain the hemolysis kinetics in terms of ∆Osm we employed the following equation:
RBC% =1002
(1 +
[erf
(µ∆osm − ∆Osm
σ∆osm√
2
)])(A9)
“Erf” refers to the error function, µ∆osm represents the number of incorporated osmolytesper cell that elicits the lysis of 50% of RBCs. σ∆osm represents the standard deviation of theprobability distribution (such as osmdev in Equation (A5)).
For fitting Equation (A8) to experimental data, the value of µ∆osm was set to 8.95 fmolosmolytes/cell. This value was calculated considering an MCV of 90 fl, an [Osm]i of300 osmM, and a fraction of 0.35 of the cytoplasm not occupied by water. Using thesenumbers, the number of osmolytes in the RBCs cytoplasm in isosmotic conditions is17.55 fmol/cell. In Figure 8B, we calculated that half of the RBCs population is lysedat [Osm]e = 150 osmM, which corresponds to an osmgrad of 50% of [Osm]i. This meansthat, on average, RBCs can withstand up to a 50% difference in the osmolarity across itsmembrane. Therefore, we considered that the RBCs could withstand up to a 50% increasein the cytoplasm osmolarity, which is achieved when ∆Osm = 8.95 fmol osmolytes/cell, i.e.,when the cells have incorporated 8.95 fmol osmolytes as a consequence of toxin activity.

Int. J. Mol. Sci. 2022, 23, 872 18 of 19
Table A1. Parameters obtained from model 2 fitting to data in Figure 8A,C. The best fit value of k1
was 0.5 min−1. However, the indetermination of the parameter (0.65 min−1) does not allow k1 tobe expressed as the value ± standard error. Model fitting indicates that the value of k1 should bebetween 0 and 1.15 min−1.
Parameter 40 ng/mL HlyA without Suramin 40 ng/mL HlyA with Suramin
A (fmol/(cell*min)) 0.92 ± 0.06 0.61 ± 0.05
σ∆osm (fmol/cell) 5.0 ± 0.6 4.3 ± 0.7
B (fmol/cell) 4.3 ± 1.1
k1 (min−1) <1.15
References1. Gadeberg, O.V.; Orskov, I.; Rhodes, J.M. Cytotoxic Effect of an Alpha-Hemolytic Escherichia coli Strain on Human Blood Monocytes
and Granulocytes in Vitro. Infect. Immun. 1983, 41, 358–364. [CrossRef]2. Keane, W.F.; Welch, R.; Gekker, G.; Peterson, P.K. Mechanism of Escherichia coli Alpha-Hemolysin-Induced Injury to Isolated
Renal Tubular Cells. Am. J. Pathol. 1987, 126, 350–357.3. Wiles, T.J.; Mulvey, M.A. The RTX Pore-Forming Toxin α-Hemolysin of Uropathogenic Escherichia coli: Progress and Perspectives.
Futur. Microbiol. 2013, 8, 73–84. [CrossRef] [PubMed]4. Linhartová, I.; Bumba, L.; Mašín, J.; Basler, M.; Osicka, R.; Kamanová, J.; Procházková, K.; Adkins, I.; Hejnová-Holubová, J.;
Sadílková, L.; et al. RTX Proteins: A Highly Diverse Family Secreted by a Common Mechanism. FEMS Microbiol. Rev. 2010, 34,1076–1112. [CrossRef] [PubMed]
5. O’Hanley, P.; Low, D.; Romero, I.; Lark, D.; Vosti, K.; Falkow, S.; Schoolnik, G. Gal-Gal Binding and Hemolysin Phenotypes andGenotypes Associated with Uropathogenic Escherichia coli. New Engl. J. Med. 1985, 313, 414–420. [CrossRef] [PubMed]
6. Nagy, G.; Altenhoefer, A.; Knapp, O.; Maier, E.; Dobrindt, U.; Blum-Oehler, G.; Benz, R.; Emody, L.; Hacker, J. Both α-HaemolysinDeterminants Contribute to Full Virulence of Uropathogenic Escherichia coli Strain. Microbes Infect. 2006, 8, 2006–2012. [CrossRef][PubMed]
7. Johnson, J.R. Virulence Factors in Escherichia coli Urinary Tract Infection. Clin. Microbiol. Rev. 1991, 4, 80–128. [CrossRef] [PubMed]8. Ulleryd, P.; Lincoln, K.; Scheutz, F.; Sandberg, T. Virulence Characteristics of Escherichia coli in Relation to Host Response in Men
with Symptomatic Urinary Tract Infection. Clin. Infect. Dis. 1994, 18, 579–584. [CrossRef] [PubMed]9. Marrs, C.F.; Zhang, L.; Foxman, B. Escherichia coli mediated Urinary Tract Infections: Are There Distinct Uropathogenic, E. coli
(UPEC) Pathotypes? FEMS Microbiol. Lett. 2005, 252, 183–190. [CrossRef] [PubMed]10. Johnsen, N.; Hamilton, A.D.M.; Greve, A.S.; Christensen, M.G.; Therkildsen, J.R.; Wehmöller, J.; Skals, M.; Praetorius, H.A.
α-Haemolysin Production, as a Single Factor, Causes Fulminant Sepsis in a Model of Escherichia coli-Induced Bacteraemia. Cell.Microbiol. 2019, 21, e13017. [CrossRef] [PubMed]
11. Ristow, L.; Welch, R.A. Hemolysin of Uropathogenic Escherichia coli: A Cloak or a Dagger? Biochim. Biophys. Acta (BBA)-Biomembr.2016, 1858, 538–545. [CrossRef] [PubMed]
12. Herlax, V.; Henning, M.F.; Bernasconi, A.M.; Goni, F.M.; Bakas, L. The Lytic Mechanism of Escherichia coli α-Hemolysin Associatedto Outer Membrane Vesicles. Health 2010, 2, 484–492. [CrossRef]
13. Benz, R. Channel Formation by RTX-Toxins of Pathogenic Bacteria: Basis of Their Biological Activity. Biochim. Biophys. Acta(BBA)-Biomembr. 2016, 1858, 526–537. [CrossRef] [PubMed]
14. Valeva, A.; Palmer, M.; Bhakdi, S. Staphylococcal α-Toxin: Formation of the Heptameric Pore Is Partially Cooperative andProceeds through Multiple Intermediate Stages. Biochemistry 1997, 36, 13298–13304. [CrossRef] [PubMed]
15. Gouaux, J.E.; Braha, O.; Hobaugh, M.R.; Song, L.; Cheley, S.; Shustak, C.; Bayley, H. Subunit Stoichiometry of StaphylococcalAlpha-Hemolysin in Crystals and on Membranes: A Heptameric Transmembrane Pore. Proc. Natl. Acad. Sci. USA 1994, 91,12828–12831. [CrossRef] [PubMed]
16. Moayeri, M.; Welch, R.A. Effects of Temperature, Time, and Toxin Concentration on Lesion Formation by the Escherichia coliHemolysin. Infect. Immun. 1994, 62, 4124–4134. [CrossRef] [PubMed]
17. Menestrina, G. Escherichia coli hemolysin Permeabilizes Small Unilamellar Vesicles Loaded with Calcein by a Single-Hit Mecha-nism. FEBS Lett. 1988, 232, 217–220. [CrossRef]
18. Ludwig, A.; Benz, R.; Goebel, W. Oligomerization of Escherichia coli Haemolysin (HlyA) is Involved in Pore Formation. Mol.Genet. Genom. 1993, 241, 89–96. [CrossRef] [PubMed]
19. Herlax, V.; Maté, S.; Rimoldi, O.; Bakás, L. Relevance of Fatty Acid Covalently Bound to Escherichia coli α-Hemolysin andMembrane Microdomains in the Oligomerization Process. J. Biol. Chem. 2009, 284, 25199–25210. [CrossRef]
20. Skals, M.; Jensen, U.B.; Ousingsawat, J.; Kunzelmann, K.; Leipziger, J.; Praetorius, H.A. Escherichia coli α-Hemolysin TriggersShrinkage of Erythrocytes Via KCa3.1 and TMEM16A Channels with Subsequent Phosphatidylserine Exposure. J. Biol. Chem.2010, 285, 15557–15565. [CrossRef] [PubMed]

Int. J. Mol. Sci. 2022, 23, 872 19 of 19
21. Lang, E.; Qadri, S.M.; Lang, F. Killing Me Softly–Suicidal Erythrocyte Death. Int. J. Biochem. Cell Biol. 2012, 44, 1236–1243.[CrossRef]
22. Velásquez, F.C.; Maté, S.; Bakás, L.; Herlax, V. Induction of Eryptosis by Low Concentrations of E. coli Alpha-Hemolysin. Biochim.Biophys. Acta (BBA)-Biomembr. 2015, 1848, 2779–2788. [CrossRef]
23. Denis, M.L.; Lefevre, S.; Alvarez, C.; Lauri, N.; Enrique, N.; Rinaldi, D.; Gonzalez-Lebrero, R.; Vecchio, L.; Espelt, M.; Stringa, P.;et al. Regulation of Extracellular ATP of Human Erythrocytes Treated with α-Hemolysin. Effects of Cell Volume, Morphology,Rheology and Hemolysis. Biochim. Biophys. Acta (BBA)-Mol. Cell Res. 2019, 1866, 896–915. [CrossRef]
24. Skals, M.; Jorgensen, N.R.; Leipziger, J.; Praetorius, H.A. α-Hemolysin from Escherichia coli Uses Endogenous Amplificationthrough P2X Receptor Activation to Induce Hemolysis. Proc. Natl. Acad. Sci. USA 2009, 106, 4030–4035. [CrossRef] [PubMed]
25. Preston, G.M.; Carroll, T.P.; Guggino, W.B.; Agre, P. Appearance of Water Channels in Xenopus Oocytes Expressing Red CellCHIP28 Protein. Science 1992, 256, 385–387. [CrossRef] [PubMed]
26. Roudier, N.; Verbavatz, J.-M.; Maurel, C.; Ripoche, P.; Tacnet, F. Evidence for the Presence of Aquaporin-3 in Human Red BloodCells. J. Biol. Chem. 1998, 273, 8407–8412. [CrossRef] [PubMed]
27. Azouzi, S.; Gueroult, M.; Ripoche, P.; Genetet, S.; Colin Aronovicz, Y.; Le Van Kim, C.; Etchebest, C.; Mouro-Chanteloup, I.Energetic and Molecular Water Permeation Mechanisms of the Human Red Blood Cell Urea Transporter, B. PLoS ONE 2013, 8,e82338. [CrossRef] [PubMed]
28. Mathai, J.C.; Mori, S.; Smith, B.L.; Preston, G.M.; Mohandas, N.; Collins, M.; van Zijl, P.C.M.; Zeidel, M.L.; Agre, P. FunctionalAnalysis of Aquaporin-1 Deficient Red Cells. J. Biol. Chem. 1996, 271, 1309–1313. [CrossRef] [PubMed]
29. Vazquez, R.F.; Maté, S.M.; Bakás, L.S.; Fernández, M.M.; Malchiodi, E.L.; Herlax, V.S. Novel Evidence for the Specific InteractionBetween Cholesterol and α-Haemolysin of Escherichia coli. Biochem. J. 2014, 458, 481–489. [CrossRef] [PubMed]
30. Munksgaard, P.S.; Vorup-Jensen, T.; Reinholdt, J.; Söderström, C.M.; Poulsen, K.; Leipziger, J.; Praetorius, H.A.; Skals, M. Leuko-toxin from Aggregatibacter actinomycetemcomitans causes Shrinkage and P2X Receptor-Dependent Lysis of Human Erythrocytes.Cell. Microbiol. 2012, 14, 1904–1920. [CrossRef] [PubMed]
31. Denis, F.L.; Alvarez, H.A.; Lauri, N.; Alvarez, C.L.; Chara, O.; Schwarzbaum, P.J. Dynamic Regulation of Cell Volume andExtracellular ATP of Human Erythrocytes. PLoS ONE 2016, 11, e0158305. [CrossRef]
32. Genetet, S.; Ripoche, P.; Picot, J.; Bigot, S.; Delaunay, J.; Armari-Alla, C.; Colin, Y.; Mouro-Chanteloup, I. Human RhAG AmmoniaChannel is Impaired by the Phe65Ser Mutation in Overhydrated Stomatocytic Red Cells. Am. J. Physiol. Physiol. 2012, 302,C419–C428. [CrossRef] [PubMed]
33. Vázquez, R.F.; MatéS, M.; Bakás, L.S.; Muñoz-Garay, C.; Herlax, V.S. Relationship between Intracellular Calcium and MorphologicChanges in Rabbit Erythrocytes: Effects of the Acylated and Unacylated Forms of E. coli Alpha-Hemolysin. Biochim. Biophys. Acta(BBA)-Biomembr. 2016, 1858, 1944–1953. [CrossRef] [PubMed]
34. Pafundo, D.; Alvarez, C.L.; Krumschnabel, G.; Schwarzbaum, P.J. A Volume Regulatory Response Can Be Triggered by Nucleo-sides in Human Erythrocytes, a Perfect Osmometer No Longer. J. Biol. Chem. 2010, 285, 6134–6144. [CrossRef] [PubMed]
35. Yang, B.; Verkman, A.S. Analysis of Double Knockout Mice Lacking Aquaporin-1 and Urea Transporter UT-B. J. Biol. Chem. 2002,277, 36782–36786. [CrossRef]
36. King, L.S.; Choi, M.; Fernandez, P.C.; Cartron, J.-P.; Agre, P. Defective Urinary Concentrating Ability Due to a Complete Deficiencyof Aquaporin-1. New Engl. J. Med. 2001, 345, 175–179. [CrossRef] [PubMed]
37. Bradford, M.M. A Rapid and Sensitive Method for the Quantitation of Microgram Quantities of Protein Utilizing the Principle ofProtein-Dye Binding. Anal. Biochem. 1976, 72, 248–254. [CrossRef]
38. Montalbetti, N.; Denis, M.F.L.; Pignataro, O.P.; Kobatake, E.; Lazarowski, E.R.; Schwarzbaum, P.J. Homeostasis of ExtracellularATP in Human Erythrocytes. J. Biol. Chem. 2011, 286, 38397–38407. [CrossRef] [PubMed]
39. van Heeswijk, M.P.E.; van Os, C.H. Osmotic Water Permeabilities of Brush Border and Basolateral Membrane Vesicles from RatRenal Cortex and Small Intestine. J. Membr. Biol. 1986, 92, 183–193. [CrossRef] [PubMed]
40. Freedman, J.C.; Hoffman, J.F. Ionic and Osmotic Equilibria of Human Red Blood Cells Treated with Nystatin. J. Gen. Physiol. 1979,74, 157–185. [CrossRef]
Copyright © 2022 FDOKUMEN