The Crystal Structure of Glutamine-binding Protein from Escherichia coli
18
J. Mol. Biol. (1996) 262, 225–242 The Crystal Structure of Glutamine-binding Protein from Escherichia coli Chwan-Deng Hsiao 1,2 , Yuh-Ju Sun 1 , John Rose 3 and Bi-Cheng Wang 3 * 1 Department of The crystal structure of the glutamine-binding protein (GlnBP) from Crystallography, University Escherichia coli in a ligand-free ‘‘open’’ conformational state has been determined by isomorphous replacement methods and refined to an of Pittsburgh, Pittsburgh PA 15260, USA R-value of 21.4% at 2.3 Å resolution. There are two molecules in the asymmetric unit, related by pseudo 4-fold screw symmetry. The refined 2 Crystallographic Laboratory model consists of 3587 non-hydrogen atoms from 440 residues (two Institute of Molecular monomers), and 159 water molecules. The structure has root-mean-square Biology, Academia Sinica deviations of 0.013 Å from ‘‘ideal’’ bond lengths and 1.5° from ‘‘ideal’’ Taipei, Taiwan, 11529, ROC bond angles. The GlnBP molecule has overall dimensions of approximately 3 Department of Biochemistry 60 Å × 40 Å × 35 Å and is made up of two domains (termed large and and Molecular Biology small), which exhibit a similar supersecondary structure, linked by two University of Georgia, Athens antiparallel b-strands. The small domain contains three a-helices and four GA 30602-7229, USA parallel and one antiparallel b-strands. The large domain is similar to the small domain but contains two additional a-helices and three more short antiparallel b-strands. A comparison of the secondary structural motifs of GlnBP with those of other periplasmic binding proteins is discussed. A model of the ‘‘closed form’’ GlnBP-Gln complex has been proposed based on the crystal structures of the histidine-binding protein-His complex and ‘‘open form’’ GlnBP. This model has been successfully used as a search model in the crystal structure determination of the ‘‘closed form’’ GlnBP-Gln complex by molecular replacement methods. The model agrees remarkably well with the crystal structure of the Gln-GlnBP complex with root-mean-square deviation of 1.29 Å. Our study shows that, at least in our case, it is possible to predict one conformational state of a periplasmic binding protein from another conformational state of the protein. The glutamine-binding pockets of the model and the crystal structure are compared and the modeling technique is described. 7 1996 Academic Press Limited Keywords: glutamine-binding protein; periplasmic binding proteins; *Corresponding author ligand binding; crystal structure; X-ray crystallography Introduction In Gram-negative organisms, the cell envelope consists of an outer membrane, a thin cell wall, a periplasmic space, and a cytoplasmic membrane. The outer membrane is composed of phospholipids and membrane proteins. This component of the cell envelope behaves as a molecular sieve, allowing small hydrophilic molecules to diffuse inward through the protein channels. The thin cell wall of the Gram-negative bacteria has to rely on the outer membrane to limit the access of molecules to the cytoplasmic membrane. The cytoplasmic mem- brane contains primarily a mosaic of proteins embedded in a phospholipid bilayer. It carries out many additional functions, including lipid syn- thesis, protein secretion, chemotaxis, electron transport and nutrient transport. Two categories of transport processes, passive transport and active Current address: C.D. Hsiao & Y. J. Sun, Crystallographic Laboratory, Institute of Molecular Biology Academia Sinica, Taipei, Taiwan, 11529, ROC. Abbreviations used: GlnBP, glutamine-binding protein; LIVBP, leucine/isoleucine/valine-binding protein; LSBP, leucine-specific-binding protein; LAOBP, lysine-, arginine-, ornithine-binding protein; HisJ, histidine-binding protein; DppA, dipeptide-binding protein; OppA, oligopeptide-binding protein; MMBP, maltodextrin-binding protein; r.m.s., root-mean-square; REDOR, rotational-echo double-resonance. 0022–2836/96/370225–18 $18.00/0 7 1996 Academic Press Limited
-
Upload
independent -
Category
Documents
-
view
3 -
download
0
Transcript of The Crystal Structure of Glutamine-binding Protein from Escherichia coli

J. Mol. Biol. (1996) 262, 225–242
The Crystal Structure of Glutamine-binding Proteinfrom Escherichia coli
Chwan-Deng Hsiao 1,2, Yuh-Ju Sun 1, John Rose 3 and Bi-Cheng Wang 3*
1Department of The crystal structure of the glutamine-binding protein (GlnBP) fromCrystallography, University Escherichia coli in a ligand-free ‘‘open’’ conformational state has been
determined by isomorphous replacement methods and refined to anof Pittsburgh, PittsburghPA 15260, USA R-value of 21.4% at 2.3 Å resolution. There are two molecules in the
asymmetric unit, related by pseudo 4-fold screw symmetry. The refined2Crystallographic Laboratory model consists of 3587 non-hydrogen atoms from 440 residues (twoInstitute of Molecular monomers), and 159 water molecules. The structure has root-mean-squareBiology, Academia Sinica deviations of 0.013 Å from ‘‘ideal’’ bond lengths and 1.5° from ‘‘ideal’’Taipei, Taiwan, 11529, ROC bond angles.
The GlnBP molecule has overall dimensions of approximately3Department of Biochemistry60 Å × 40 Å × 35 Å and is made up of two domains (termed large andand Molecular Biologysmall), which exhibit a similar supersecondary structure, linked by twoUniversity of Georgia, Athensantiparallel b-strands. The small domain contains three a-helices and fourGA 30602-7229, USAparallel and one antiparallel b-strands. The large domain is similar to thesmall domain but contains two additional a-helices and three more shortantiparallel b-strands. A comparison of the secondary structural motifs ofGlnBP with those of other periplasmic binding proteins is discussed.
A model of the ‘‘closed form’’ GlnBP-Gln complex has been proposedbased on the crystal structures of the histidine-binding protein-Hiscomplex and ‘‘open form’’ GlnBP. This model has been successfully usedas a search model in the crystal structure determination of the ‘‘closedform’’ GlnBP-Gln complex by molecular replacement methods. The modelagrees remarkably well with the crystal structure of the Gln-GlnBPcomplex with root-mean-square deviation of 1.29 Å. Our study shows that,at least in our case, it is possible to predict one conformational state of aperiplasmic binding protein from another conformational state of theprotein. The glutamine-binding pockets of the model and the crystalstructure are compared and the modeling technique is described.
7 1996 Academic Press Limited
Keywords: glutamine-binding protein; periplasmic binding proteins;*Corresponding author ligand binding; crystal structure; X-ray crystallography
Introduction
In Gram-negative organisms, the cell envelopeconsists of an outer membrane, a thin cell wall, a
periplasmic space, and a cytoplasmic membrane.The outer membrane is composed of phospholipidsand membrane proteins. This component of the cellenvelope behaves as a molecular sieve, allowingsmall hydrophilic molecules to diffuse inwardthrough the protein channels. The thin cell wall ofthe Gram-negative bacteria has to rely on the outermembrane to limit the access of molecules to thecytoplasmic membrane. The cytoplasmic mem-brane contains primarily a mosaic of proteinsembedded in a phospholipid bilayer. It carries outmany additional functions, including lipid syn-thesis, protein secretion, chemotaxis, electrontransport and nutrient transport. Two categories oftransport processes, passive transport and active
Current address: C.D. Hsiao & Y. J. Sun,Crystallographic Laboratory, Institute of MolecularBiology Academia Sinica, Taipei, Taiwan, 11529, ROC.
Abbreviations used: GlnBP, glutamine-bindingprotein; LIVBP, leucine/isoleucine/valine-bindingprotein; LSBP, leucine-specific-binding protein; LAOBP,lysine-, arginine-, ornithine-binding protein; HisJ,histidine-binding protein; DppA, dipeptide-bindingprotein; OppA, oligopeptide-binding protein; MMBP,maltodextrin-binding protein; r.m.s., root-mean-square;REDOR, rotational-echo double-resonance.
0022–2836/96/370225–18 $18.00/0 7 1996 Academic Press Limited

Structure of Glutamine-binding Protein226
transport, exist for the cytoplasmic membrane. Inpassive transport the nutrient is transported bydiffusion processes and is regulated by thedifference of the concentration gradient acrossthe membrane. However, in active transport, thetransport process is against the concentrationgradient and is controlled by the periplasmicpermease system.
One of the periplasmic permease systems inEscherichia coli consists of ligand-specific periplas-mic binding proteins and two or three kinds ofmembrane-bound proteins. According to the pro-posed transport mechanism (Ames, 1986), when aligand enters the periplasmic space it will bind tothe corresponding periplasmic binding proteinwith high affinity. Upon binding, the periplasmicbinding protein undergoes a conformationalchange which allows the protein-ligand complex tobe recognized by the membrane-bound proteincomponents of the permease system. The inter-actions between the protein-ligand complex and themembrane-bound proteins then cause the ligand tobe released from the binding protein and associatewith the membrane-bound proteins, at which pointthe ligand is then translocated across the periplas-mic membrane.
The glutamine transport system is one of themost studied binding protein-dependent permeasetransport systems (Hunt & Hong, 1981, 1983;Weiner et al., 1971; Weiner & Heppel, 1971; Shenet al., 1989a,b; Tjandra et al., 1992). The systemcontains the ligand binding protein, glutamine-binding protein (GlnBP) which binds L-glutaminewith a dissociation constant (KD) of 5 × 10⁻⁷ M at5°C. GlnBP is monomeric, with 226 amino acidresidues, a molecular mass of 24,935 Da and isstable to changes of pH and temperature (Shenet al., 1989a).
The crystal structures of 12 different ligand-bound periplasmic binding proteins, the L-ara-binose binding protein (Gilliland & Quiocho, 1981),maltose-binding protein (Spurlino et al., 1991),D-galactose/D-glucose-binding protein (Vyas et al.,1988), ribose receptor (Mowbray & Cole, 1992),sulfate-binding protein (Pflugrath & Quiocho,1988), leucine/isoleucine/valine-binding protein(LIVBP; Sack et al., 1989a), leucine specific-bindingprotein (LSBP; Sack et al., 1989b), lysine-, arginine-,ornithine-binding protein (LAOBP; Kang et al.,1991), two histidine-binding proteins (HisJ; Ohet al., 1994; Yao et al., 1994), dipeptide-bindingprotein (DppA; Nickitenko et al., 1994), andoligopeptide-binding protein (OppA; Tame et al.,1994) have been determined. The molecular massesof these proteins range from 26 to 59 kDa. All thebinding proteins mentioned above, except DppAand OppA, have a similar two-domain hingedstructure with a cleft formed between the twodomains which provides the ligand-binding site(Quiocho, 1990).
Three conformational states in terms of the shapeof the cleft have been proposed (Quiocho, 1990):the ligand-free ‘‘open-cleft’’ form where the two
domains are relatively far apart, the ligand-bound‘‘open-cleft’’ form where the relative orientationsof the two lobes remain unchanged upon ligandbinding, and the ligand-bound ‘‘closed-cleft’’ formwhere the two lobes of the protein close in after theligand is bound in the cleft. Recently, a fourthform, the ligand-free ‘‘closed-cleft’’, has beensuggested (Oh et al., 1993) and it has beenpostulated that a dynamic equilibrium with a lowactivation energy barrier exists between theligand-free ‘‘open-cleft’’ (empty open) and theligand-free ‘‘closed-cleft’’ (empty closed) confor-mations (Oh et al., 1993).
The maltodextrin-binding protein (MMBP) is thefirst of these proteins in which the structures ofboth the ligand-free, ‘‘open-cleft’’ form and theligand-bound ‘‘closed-cleft’’ form have been ob-served (Sharff et al., 1992). A comparison of thestructures of the ligand-bound and ligand-freestates of the maltose-binding protein showed alarge ligand-induced, hinge-twist motion (a 35°rotation and an 8° twist) between its two domains(Sharff et al., 1992). The conformational changesobserved between the maltose-free and maltose-bound structures support the mechanism forreceptor differentiation between the ligand-free andligand-bound states in signal transduction. Recentstructural results on the LAOBP (Oh et al., 1993), inwhich both the ligand-free and ligand-bound stateshave been observed, gave further support to thismechanism. However, in the LAOBP protein yetanother type of conformational change, a 52°rotation around a single backbone torsion angle,was observed. These are the only two examples ofperiplasmic binding proteins in which both the‘‘open-cleft’’ and ‘‘closed-cleft’’ structures havebeen determined. Recently, crystal structures oftwo histidine-binding proteins complexed withhistidine, one from E. coli (Oh et al., 1994) and onefrom Salmonella typhimurium have been determined(Yao et al., 1994). Both complexes had a closed-formstructure, similar to that observed for the LAOBP-Lys complex.
Although spectroscopic studies (Penrose et al.,1970; Miller et al., 1983; Shen et al., 1989a; Tjandraet al., 1992) and other methods, such as scanningcalorimetry (Gaudin et al., 1980), immunology(Rotman & Ellis, 1972) and NMR (Shen et al., 1989a;Hing et al., 1994), suggest a conformationalchange of GlnBP upon ligand binding, the exactnature of the conformational change and thegeometry of the glutamine-binding pocket are stillunknown.
We have previously reported the crystallizationof GlnBP in the ‘‘open-cleft’’ (ligand-free) and‘‘closed-cleft’’ (ligand bound) conformations (Hsiaoet al., 1994). Here we report the detailed crystalstructure of the ligand-free, ‘‘open-cleft’’ GlnBP at2.3 A resolution and the GlnBP-Gln interactions asobserved in the ‘‘closed-cleft’’ crystal structure(Yuh-Ju Sun, personal communication). The‘‘closed-cleft’’ crystal structure has recently beensolved using a model which was predicted by us
Structure of Glutamine-binding Protein 227
Figure 1. A ribbon diagram showing the second-ary structural elements of GlnBP, generated withMOLSCRIPT (Kraulis, 1991). Secondary structure assign-ments were made using PROCHECK (Laskowski et al.,1993).
Results and DiscussionThe overall structure
GlnBP contains a single polypeptide chain of 226residues with a tertiary structure of approximately35% a-helix and 37% b-sheet. The overall shape ofthis molecule is a prolate ellipsoid with dimensionsof approximately 60 A × 40 A × 35 A. It consists oftwo similar globular domains (Figure 1), desig-nated as the large and small domains.
The large domain, which contains both the N andC termini of the protein, is built from two separatepeptide segments, residues 1 to 84 and 186 to 226.Structural features of this domain include fivea-helices (I, II, III, VII and VIII) and eight b-strands(A, B, C, D, E, F, G and O; see Table 1 and Fig-ure 1). The strands E, A, F and G are parallel andstrand O is antiparallel to strand G and others.Strands B, C and D are antiparallel (with fivehydrogen bonds among them) and are roughlyperpendicular to the other strands in the largedomain. The first polypeptide segment (residues 1to 84) can be described as having a bbbbabababtopology (Figure 2). The b-sheet (formed by strandsE-A-F-G) which is typical of other bab proteins, hashelix I lying on one side of the sheet and helices IIand III on the other side of the sheet. The short 42amino acid residue segment (residues 186 to 226)folds into the last b-strand (O) and is followed bytwo consecutive helices (VII and VIII) ending at theC terminus of the protein.
The small domain consists of residues 90 to 180,which form three a-helices (IV, V, and VI in Table 1and Figure 1) and four parallel (K, J, L, and M,) andone antiparallel (I) b-strands connected by a largeloop (residues 96 to 109). The b-sheet formed bythese strands is secured by a total of 15 hydrogenbonds. The three helices, together with b-strands K,J, L and M, form a bababab supersecondary struc-ture similar to that observed in the first longpolypeptide segment of the large domain.
Six tight turns have been identified. They arelocated between strands B and C (residues 13 to 16),strands C and D (residues 20 to 23), strand E and
from the ‘‘open-cleft’’ structure. Since our predictedmodel is remarkably similar to the ‘‘closed-cleft’’crystal structure, our modeling techniques might beapplicable for predicting structures in other cases;a description of the techniques and a comparison ofthe results are reported.
Table 1. Secondary structure elements of glutamine-binding proteinStranda Residues Length Domainb Helixa Residues Length Domainb
A 5–9 5 L I 27–38 12 LB 11–13 3 L II 53–58 6 LC 17–20 4 L III 73–78 6 LD 23–25 3 L IV 119–127 9 SE 43–47 5 L V 139–147 9 SF 64–66 3 L VI 158–167 9 SG 79–81 3 L VII 194–209 16 LH 85–89 5 Hinge VIII 212-220 9 LI 90–95 6 SJ 111–115 5 SK 132–137 6 SL 153–157 5 SM 172–179 8 SN 181–185 5 HingeO 186–189 4 L
aSecondary structure assignments were made using PROCHECK (Laskowski et al., 1993).bL, large domain; S, small domain.
Structure of Glutamine-binding Protein228
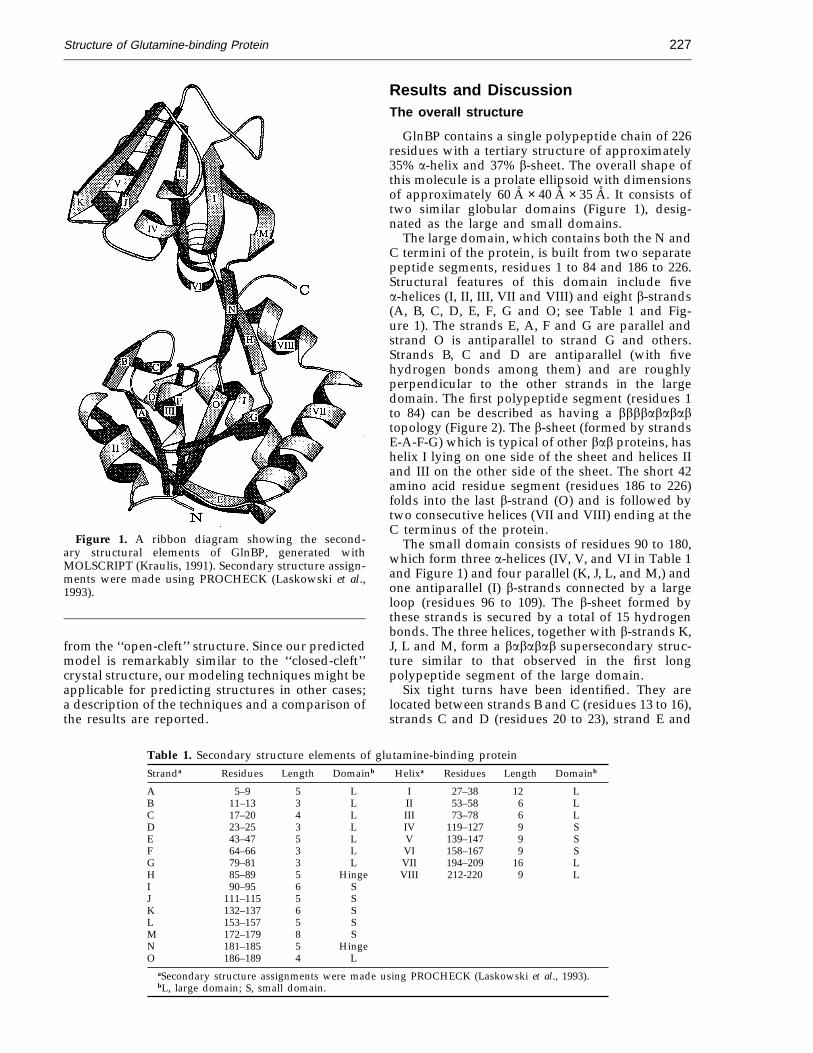
Figure 2. A comparison of secondary structure and folding patterns of all periplasmic binding proteins whosestructures are known. The b-strands are represented by arrows and the a-helices by cylinders.

Structure of Glutamine-binding Protein 229
Figure 3. A comparison of the primary and secondary structures of the large and small domains of GlnBP. Alignmentwas made based on the superposition of the three-dimensional structures of the domains.
helix II (residues 49 to 52), strands I and J (residues95 to 98), helix I and strand M (residues 69 to 72),and strand O and helix VII (residues 190 to 193).
The two domains are connected by b-strands H(residues 85 to 89) and N (residues 181 to 185).Strand H links strand G of the large domain tostrand I of the small domain, and strand N linksstrand M of the small domain to strand O of thelarge domain. Although these two transdomainconnections are widely separated in the sequence,they lie very close to each other in the tertiarystructure and form a two-stranded, anti-parallelb-sheet. Moreover, since these two connections arelocated near the periphery of the molecule, theyalso serve as the base or ‘‘boundary’’ of the deepcleft formed between the two domains. The cleft isabout 12 A deep, with a base measuring approxi-mately 10 A × 14 A.
The two domains exhibit similar supersecondarystructure, consisting of a central pleated sheetflanked on either side by helices. If strands B, C andD, and the last two helices VII and VIII wereexcluded, the supersecondary structures of the largeand small domains would be identical (Fig-ure 3) and exhibit pseudo 2-fold symmetry. Thisstrong similarity in supersecondary structure isremarkable, especially in view of the fact that thehomology between their primary sequences is only22%. If the two domains are products of gene dupli-cations, then this alignment suggests possible se-quence insertions or deletions in domain structures.
Interestingly, the folding topology of GlnBP isquite similar to LAOBP (238 residues; Kang et al.,1991; Oh et al., 1993) and HisJ (238 residues; Ohet al., 1994; Yao et al., 1994) as shown in Figure 2,with the exception of two loop regions (residues 11to 25 and residues 95 to 109) and two interdomainconnections. Although these two amino acid-bind-ing proteins have similar supersecondary structure,their sequence identity is less than 29%.
Potential hydrogen bonds in the GlnBP moleculewere located by examining the distances betweenpossible hydrogen donor-acceptor pairs in our final
structural model. Based on a distance cutoff of 3.2 Afor hydrogen bonds and 3.5 A for possiblehydrogen bonds, a total of 159 hydrogen bonds and30 possible hydrogen bonds were found withinmolecule I. These included 136 main-chain tomain-chain, 27 main-chain to side-chain, and 26side-chain to side-chain hydrogen bonds. Of themain-chain to main-chain hydrogen bonds, 63 arefound within the a-helices, while 46 are foundbetween atoms of the b-strands, including sixbetween the two interdomain connecting segments.Thus, these two connecting segments not onlyconnect two domains, but also stabilize thethree-dimensional structure of both domainsthrough hydrogen-bonding interactions.
Similarly, we found a total of 158 hydrogenbonds and 31 possible hydrogen bonds in moleculeII, including 134 main-chain to main-chain, 35main-chain to side-chain and 20 side-chain toside-chain hydrogen bonds. Of the main-chain tomain-chain hydrogen bonds, 64 are involved in thea-helices while 49 stabilize the b-strands.
Intermolecular contacts and crystal packing
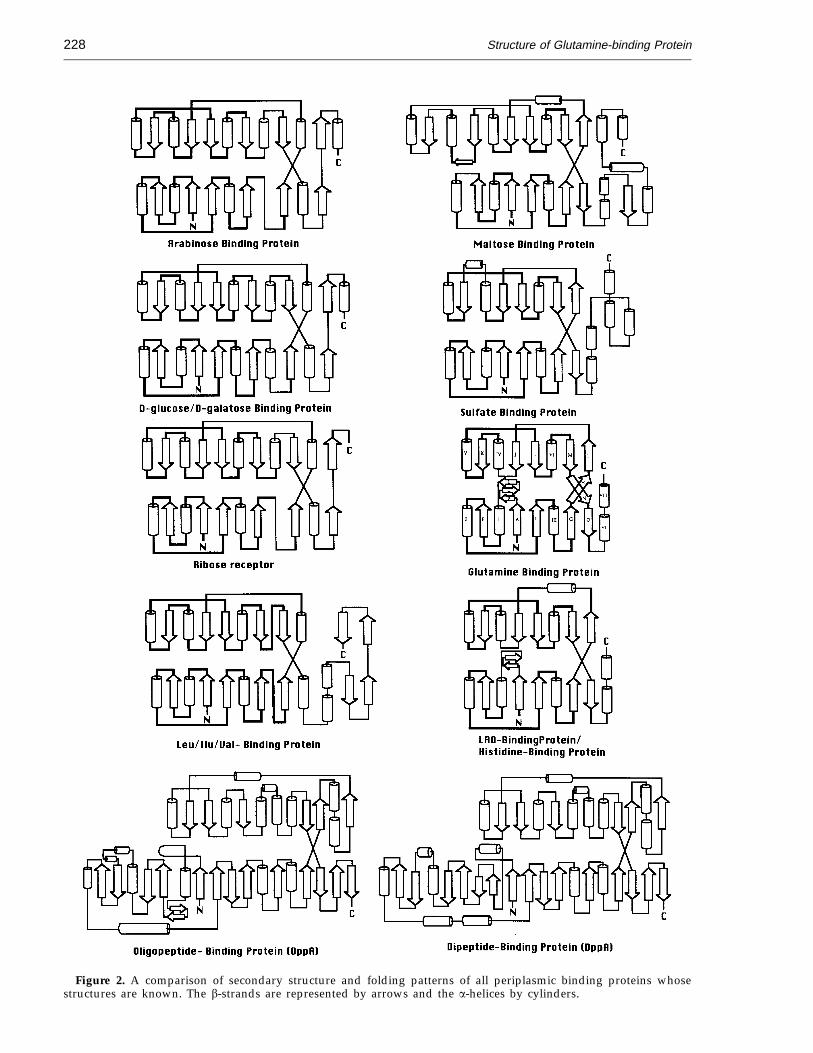
The crystals belong to space group P212121 withcell dimensions of a = b = 86.3 A, c = 81.5 A andcontain two molecules per asymmetric unit. Thetwo molecules (molecules I and II) are related by apseudo 4-fold (43) screw axis running parallel tothe z-axis at x = 0.247 and y = 0.505. The residuesforming the inter-molecular interface between thetwo molecules are Lys205-Thr-Leu-Arg-Glu-Asn-Gly-Thr-Tyr-Asn-Glu215 (portions of helices VIIand VIII) of molecule I and Lys19-Gln-Gly-Asp-Leu-Tyr24 (loop between strands C and D) andAsp42-Tyr-Glu-Leu45 (central region of strand E) ofmolecule II (Figure 4). In addition, a crystallo-graphic 21 screw axis located close to the pseudo 43
symmetry axis produces similar but not identicalintermolecular contacts (Table 2) between mol-ecules II and I' where I' is related to I by thecrystallographic 21 screw axis. Thus molecule I is
Structure of Glutamine-binding Protein230
Figure 4. A stereo view of theinterface between molecule I andmolecule II (bold) showing theintermolecular hydrogen bonds.Water molecules (black balls) arelabeled with their identifier num-bers.
related to molecule II by pseudo 43 symmetry,molecule I is related to molecule I' by exact(crystallographic) 21 symmetry and molecule II isrelated to molecule I' by pseudo 43 symmetry. Atthe interface between molecules I and II, thereare three bridging water molecules (Table 2 andFigure 4).
In the early stages of the structure determinationa question arose about how to define theasymmetric unit. One could choose two moleculesthat were related by pseudo 4-fold screw symmetryas those described previously or one could selecttwo molecules related by a pseudo 2-fold symmetryaxis perpendicular to the pseudo 43 axis. Now thatthe structure has been refined, it is interesting to seewhether there is any structural evidence to supportchoosing dimeric aggregation in the crystal. In the2-fold related case, the closest contacts across thepseudo 2-fold axes occur between a pair of helices(helix III, residues Asp73-Glu-Arg-Lys-Lys-Arg78from both molecules). However, no hydrogenbonding is observed across this or any other pseudo2-fold axis and the interactions at the helix interfaceappear to be weaker and less extensive than thosedescribed previously between molecules I and II.Therefore, there is no strong structural evidence tosuggest that the molecules associate in the crystal asdimers.
The molecular unit assembled in head-to-tailfashion by 43 symmetry appears to play animportant role in molecular packing and crystalformation. Thus, one may consider the crystal to becomposed of columns of parallel and antiparallel‘‘molecular helices’’ (Figure 5) having 43 symmetryrunning parallel to the c-axis.
A comparison of molecules I and II
In the crystal structure, molecules I and II arenearly identical. The Ca positions of the twomolecules can be superimposed (Figure 6(a)) witha root-mean-square (r.m.s.) difference of 0.54 A.The greatest differences in conformation betweenthe two molecules occur in the large loop betweenstrands I and J (residues 96 to 109). Thesedifferences may be due in part to chain flexibility,as indicated by the relatively high thermalparameters for these residues (Figure 7).
In our preliminary study we showed that ourcrystals belonged to the orthorhombic space groupP212121, not a tetragonal space group as one wouldsuspect from the unit cell parameters (Hsiao et al.,1994). Although intensity statistics indicated thatthe crystals were indeed orthorhombic, the devi-ation from the tetragonal symmetry was only minor(Hsiao et al., 1994). The question which could notbe answered then was what was the reason for thissmall deviation from a higher symmetry? Therewere two possibilities: (1) that the individualstructures of the two independent molecules werenot exactly the same and (2) that positions of thetwo molecules could not be related by exact 43
symmetry. Since the crystal structure has now beendetermined we can now answer this question.
Figure 6(b) shows an overlap of molecule I (thickline) with molecule II (thin line) after the 43
symmetry operation around an axis at x = 0.25 andy = 0.50 is applied to molecule I. This 43 axis wouldbe one of the crystallographic symmetry axes if thespace group were P43212 (the origin has beenshifted to agree with P212121 symmetry). The r.m.s.
Structure of Glutamine-binding Protein 231
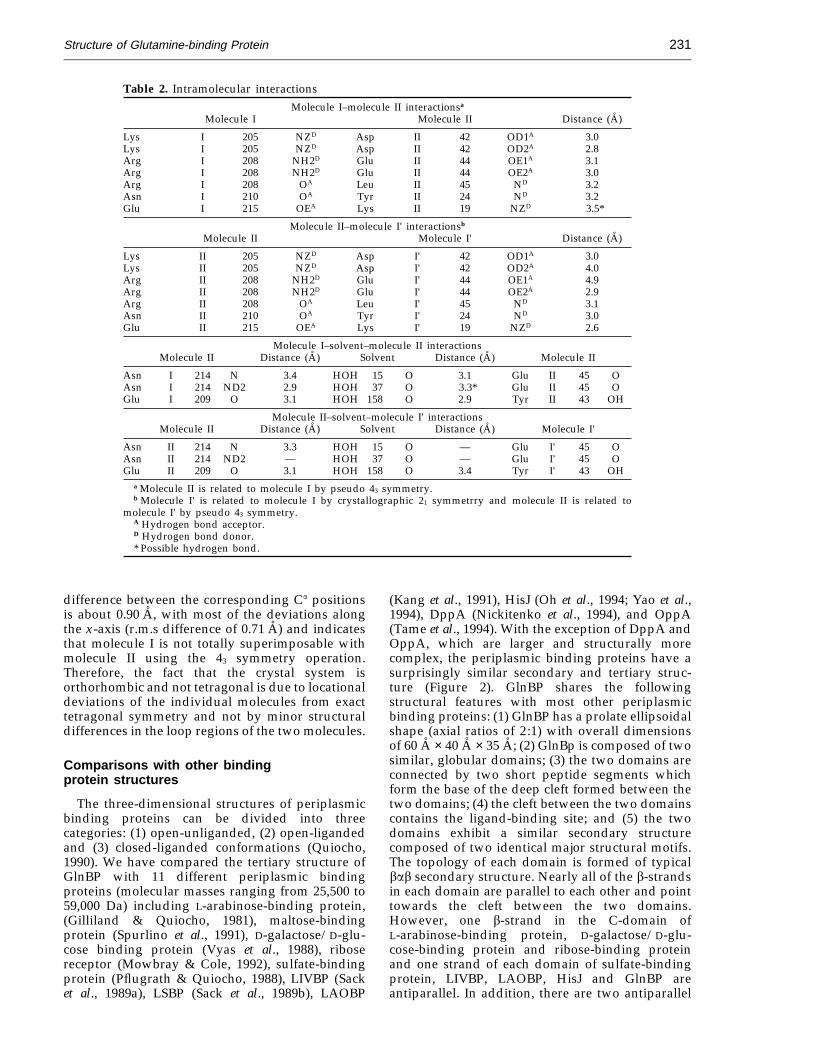
Table 2. Intramolecular interactionsMolecule I–molecule II interactionsa
Molecule I Molecule II Distance (A)
Lys I 205 NZD Asp II 42 OD1A 3.0Lys I 205 NZD Asp II 42 OD2A 2.8Arg I 208 NH2D Glu II 44 OE1A 3.1Arg I 208 NH2D Glu II 44 OE2A 3.0Arg I 208 OA Leu II 45 ND 3.2Asn I 210 OA Tyr II 24 ND 3.2Glu I 215 OEA Lys II 19 NZD 3.5*
Molecule II–molecule I' interactionsb
Molecule II Molecule I' Distance (A)
Lys II 205 NZD Asp I' 42 OD1A 3.0Lys II 205 NZD Asp I' 42 OD2A 4.0Arg II 208 NH2D Glu I' 44 OE1A 4.9Arg II 208 NH2D Glu I' 44 OE2A 2.9Arg II 208 OA Leu I' 45 ND 3.1Asn II 210 OA Tyr I' 24 ND 3.0Glu II 215 OEA Lys I' 19 NZD 2.6
Molecule I–solvent–molecule II interactionsMolecule II Distance (A) Solvent Distance (A) Molecule II
Asn I 214 N 3.4 HOH 15 O 3.1 Glu II 45 OAsn I 214 ND2 2.9 HOH 37 O 3.3* Glu II 45 OGlu I 209 O 3.1 HOH 158 O 2.9 Tyr II 43 OH
Molecule II–solvent–molecule I' interactionsMolecule II Distance (A) Solvent Distance (A) Molecule I'
Asn II 214 N 3.3 HOH 15 O — Glu I' 45 OAsn II 214 ND2 — HOH 37 O — Glu I' 45 OGlu II 209 O 3.1 HOH 158 O 3.4 Tyr I' 43 OH
a Molecule II is related to molecule I by pseudo 43 symmetry.b Molecule I' is related to molecule I by crystallographic 21 symmetrry and molecule II is related to
molecule I' by pseudo 43 symmetry.A Hydrogen bond acceptor.D Hydrogen bond donor.* Possible hydrogen bond.
difference between the corresponding Ca positionsis about 0.90 A, with most of the deviations alongthe x-axis (r.m.s difference of 0.71 A) and indicatesthat molecule I is not totally superimposable withmolecule II using the 43 symmetry operation.Therefore, the fact that the crystal system isorthorhombic and not tetragonal is due to locationaldeviations of the individual molecules from exacttetragonal symmetry and not by minor structuraldifferences in the loop regions of the two molecules.
Comparisons with other bindingprotein structures
The three-dimensional structures of periplasmicbinding proteins can be divided into threecategories: (1) open-unliganded, (2) open-ligandedand (3) closed-liganded conformations (Quiocho,1990). We have compared the tertiary structure ofGlnBP with 11 different periplasmic bindingproteins (molecular masses ranging from 25,500 to59,000 Da) including L-arabinose-binding protein,(Gilliland & Quiocho, 1981), maltose-bindingprotein (Spurlino et al., 1991), D-galactose/D-glu-cose binding protein (Vyas et al., 1988), ribosereceptor (Mowbray & Cole, 1992), sulfate-bindingprotein (Pflugrath & Quiocho, 1988), LIVBP (Sacket al., 1989a), LSBP (Sack et al., 1989b), LAOBP
(Kang et al., 1991), HisJ (Oh et al., 1994; Yao et al.,1994), DppA (Nickitenko et al., 1994), and OppA(Tame et al., 1994). With the exception of DppA andOppA, which are larger and structurally morecomplex, the periplasmic binding proteins have asurprisingly similar secondary and tertiary struc-ture (Figure 2). GlnBP shares the followingstructural features with most other periplasmicbinding proteins: (1) GlnBP has a prolate ellipsoidalshape (axial ratios of 2:1) with overall dimensionsof 60 A × 40 A × 35 A; (2) GlnBp is composed of twosimilar, globular domains; (3) the two domains areconnected by two short peptide segments whichform the base of the deep cleft formed between thetwo domains; (4) the cleft between the two domainscontains the ligand-binding site; and (5) the twodomains exhibit a similar secondary structurecomposed of two identical major structural motifs.The topology of each domain is formed of typicalbab secondary structure. Nearly all of the b-strandsin each domain are parallel to each other and pointtowards the cleft between the two domains.However, one b-strand in the C-domain ofL-arabinose-binding protein, D-galactose/D-glu-cose-binding protein and ribose-binding proteinand one strand of each domain of sulfate-bindingprotein, LIVBP, LAOBP, HisJ and GlnBP areantiparallel. In addition, there are two antiparallel

Structure of Glutamine-binding Protein232
Figure 5. A stereo view of the crystal packing. The GlnBP molecules form extended left-handed helices running alongthe crystallographic c-axis. The two molecular helices (thin and thick lines) are related by pseudo 2-fold symmetry.
b-strands in each domain of maltose-bindingprotein.
Although the overall structure of GlnBP is similarto most other periplasmic binding proteins, there
are some features of GlnBP that are different. Forexample: (1) in most binding proteins the twodomains are designated N-domain and C-domainsince the domain contains one or the other of the
Figure 6. (a) Superposition ofmolecule I (bold) with molecule IIby least-squares fitting; the r.m.s.difference (Ca atoms) is 0.54 A.(b) Superposition of molecule I(bold) with molecule II imposingperfect 43 symmetry, the r.m.s.difference (Ca atoms) is 0.90 A.These results confirm that locationaldeviations of the individual mol-ecules from exact tetragonal sym-metry and not minor structuraldifferences in the loop regions of thetwo molecules are responsible forthe lack of tetragonal crystal sym-metry (see the text).
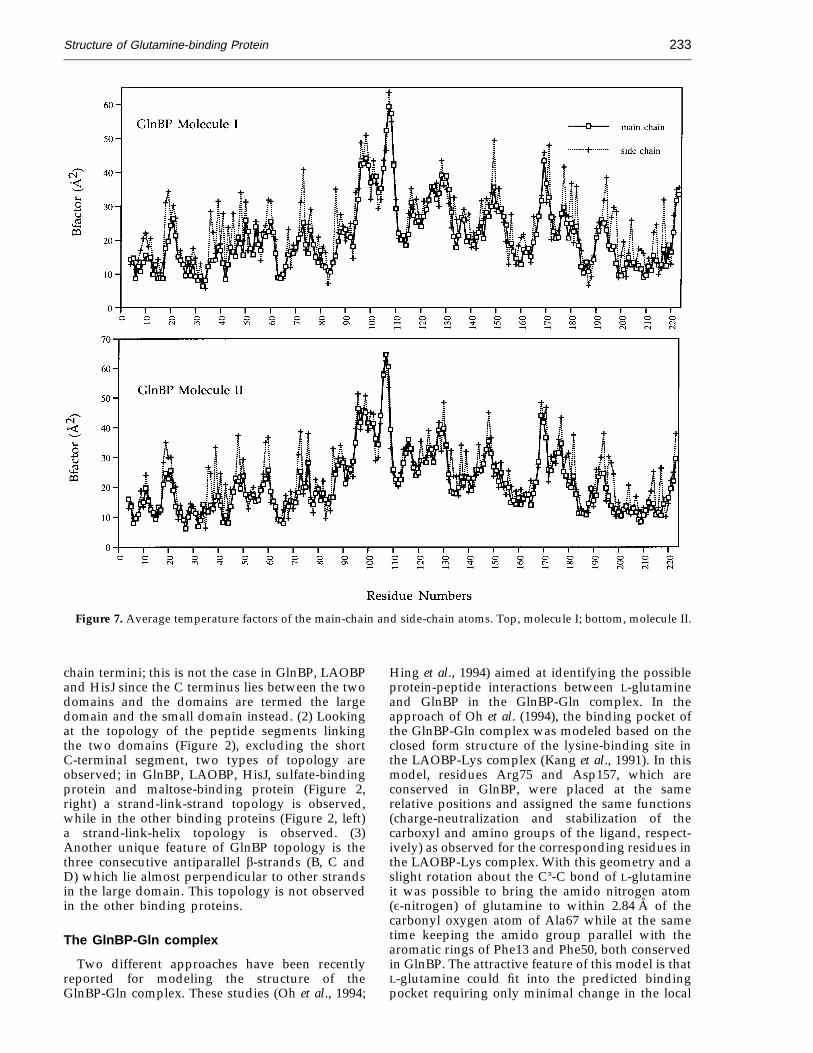
Structure of Glutamine-binding Protein 233
Figure 7. Average temperature factors of the main-chain and side-chain atoms. Top, molecule I; bottom, molecule II.
chain termini; this is not the case in GlnBP, LAOBPand HisJ since the C terminus lies between the twodomains and the domains are termed the largedomain and the small domain instead. (2) Lookingat the topology of the peptide segments linkingthe two domains (Figure 2), excluding the shortC-terminal segment, two types of topology areobserved; in GlnBP, LAOBP, HisJ, sulfate-bindingprotein and maltose-binding protein (Figure 2,right) a strand-link-strand topology is observed,while in the other binding proteins (Figure 2, left)a strand-link-helix topology is observed. (3)Another unique feature of GlnBP topology is thethree consecutive antiparallel b-strands (B, C andD) which lie almost perpendicular to other strandsin the large domain. This topology is not observedin the other binding proteins.
The GlnBP-Gln complex
Two different approaches have been recentlyreported for modeling the structure of theGlnBP-Gln complex. These studies (Oh et al., 1994;
Hing et al., 1994) aimed at identifying the possibleprotein-peptide interactions between L-glutamineand GlnBP in the GlnBP-Gln complex. In theapproach of Oh et al. (1994), the binding pocket ofthe GlnBP-Gln complex was modeled based on theclosed form structure of the lysine-binding site inthe LAOBP-Lys complex (Kang et al., 1991). In thismodel, residues Arg75 and Asp157, which areconserved in GlnBP, were placed at the samerelative positions and assigned the same functions(charge-neutralization and stabilization of thecarboxyl and amino groups of the ligand, respect-ively) as observed for the corresponding residues inthe LAOBP-Lys complex. With this geometry and aslight rotation about the Ca-C bond of L-glutamineit was possible to bring the amido nitrogen atom(e-nitrogen) of glutamine to within 2.84 A of thecarbonyl oxygen atom of Ala67 while at the sametime keeping the amido group parallel with thearomatic rings of Phe13 and Phe50, both conservedin GlnBP. The attractive feature of this model is thatL-glutamine could fit into the predicted bindingpocket requiring only minimal change in the local

Structure of Glutamine-binding Protein234
Table 3. Hydrogen bonds between Gln and GlnBPLigand Protein Crystal Predicted Predicted Predictedcontacts contacts structure distances (A) (this worka) (Oh et al., 1994) (Hing et al., 1994)
Gln NE2 Asp10 OD2 3.1 + (2.5) − −Gln NE2 Ala67 O 3.1 − (4.3) + −Gln N Gly68 O 2.8 + (2.4) + −Gln OXT Thr70 N 2.8 + (3.4) + −Gln N Thr70 OG1 3.0 + (3.3) − −Gln OXT Thr70 OG1 3.1 − (4.3) − −Gln O Arg75 NH1 2.9 + (3.1) + −Gln OXT Arg75 NH1 3.5 − (3.6) − −Gln OXT Arg75 NH2 2.8 + (3.2) − −Gln OE1 Lys115 NE 2.7 − (3.6) + −Gln O Gly119 N 2.9 + (2.1) + −Gln OE1 His156 NE2 2.8 + (2.5) − −Gln N Asp157 OD1 2.8 + (2.5) + +Gln NE2 Val14 O 7.9 − − $Gln O Lys115 NZ 7.8 − − $Gln O His156 NE2 6.7 − − $Gln NE2 Asn160 ND2 7.5 − − $Gln N Tyr185 OH 4.4 − − $
a Distances (A) are shown in parentheses.+, Correctly predicted hydrogen bond; −, hydrogen bond not predicted; $, incorrectly predicted hydrogen bond.
conformation of the conserved residues. However,this model is in conflict with the NMR studies (Shenet al., 1989a,b; Hing et al., 1994) which proposed thatHis156 is involved in ligand binding.
The NMR studies of Shen et al. (1989a,b)predicted that His156 was hydrogen bonded to theg-carboxyl group of L-glutamine. This idea waslater revised by Hing et al. (1994) who proposedthat His156 hydrogen bonded to the a-carboxylgroup of L-glutamine instead and that Lys115 wasinvolved in ligand stabilization. The Hing et al.model also differs from the Oh et al. model withrespect to the conserved residues Arg75 and Asp157. In the Hing et al. model, while the role ofAsp157 in ligand binding is essentially the same asproposed by Oh et al., the ligand-stabilizing role ofArg75 is assigned to the non-conserved Lys115. Thepredicted interactions between L-glutamine andGlnBP based on the Oh et al. and Hing et al. modelsare summarized in Table 3.
In the approach of Hing et al. (1994), the modelwas built starting with the unpublished open formGlnBP crystal structure (this work), which wasthen modified based on the results obtained byrotational-echo double-resonance (REDOR) NMRcombined with isotopic labels using moleculardynamics simulations. The Hing et al. model isintriguing in that the GlnBP-Gln complex appearsto have a ‘‘partially closed’’ conformation since therelative movement between the large and smalldomains for the ligand-free and ligand-boundstates is very small (see Figure 8a of Hing et al.,1994) when compared to the conformationalchange observed in the HisJ-His complex (Figure8). This ‘‘partially closed’’ conformation is unex-pected since the extent of ligand-induced confor-mational change (Quiocho, 1990) is believed to belarge (for example, 35° in MMBP and 52° inLAOBP) and thought to be similar among allperiplasmic binding proteins.
Because of the discrepancies between the Oh et al.and Hing et al. models (Table 3), and the possibilitythat the Hing et al. model might not represent thetrue ‘‘closed-cleft’’ structure of the GlnBP-Glncomplex, we decided to build a model of theGlnBP-Gln complex based on our open form crystalstructure in a manner similar to that used by Ohet al. (1994) with some modifications. In addition, amodel of the ‘‘closed-cleft’’ GlnBP, if correct, couldbe used to solve the crystal structure of theGlnBP-Gln complex by molecular replacementmethods.
In our approach, the large and small domains ofthe GlnBP structure were divided and superim-posed on the large and small domains of theHisJ-His complex (Oh et al., 1994). This was doneusing the conserved residues between the twoproteins as guides by means of a least-squaresprocedure. The sequence-conserved regions, 38residues in the large domain and 19 residues in thesmall domain, were located using the multiple-se-quence alignment algorithm of Feng & Doolittle(1987) as implemented in QUANTA. The resulting‘‘closed-cleft’’ model of GlnBP showed a largeconformational change, 48° in domain movement,which is comparable with the 52° movementobserved in LAOBP (Oh et al., 1993). The least-squares fitting procedure was then repeated tosuperimpose L-glutamine onto the histidine ligandin the HisJ-His complex, side-chain atoms to CGbeing used in the superimposition. The ligand fittedremarkably well into the binding pocket (Fig-ure 9(c)) and nine potential hydrogen bondsbetween the GlnBP and L-glutamine could beimmediately identified without adjustment toeither protein or ligand. Our model of theGlnBP-Gln complex indicates that His156 is indeedlocated inside the binding pocket, but NE2 ishydrogen bonded to OE1 of L-glutamine (2.5 A),not one of the a-carboxyl oxygen atoms, as

Structure of Glutamine-binding Protein 235
Figure 8. a, Stereo drawing of the predicted, closed form structure of GlnBP-Gln, produced by closing in the largeand small domains with a rigid-body movement from the open form structure (see the text). b, The observed closedform crystal structure of the HisJ-His complex (Oh et al., 1994). The orientation of the large domain of both structureswas chosen to be similar to the orientation of the large domain as depicted in Figure 8a of Hing et al. (1994). Our resultssuggest that the Hing et al. (1994) model may not represent the ‘‘true’’ closed form GlnBP-Gln complex (see the text).
proposed by Hing et al. (1994) from NMRmeasurements.
In our unrefined model (Figure 9(c)), the carboxylend of L-glutamine is sandwiched between Phe13and Phe50. This environment is similar to thatobserved in the crystal structures of the HisJ-Hisand LAOBP-Lys complexes where the correspond-ing residues are Tyr14 and Phe52, and Tyr14 andLeu52, respectively. In the GlnBP-Gln model theside-chains of Thr70, Arg75 and Gly119 are used to
neutralize opposing charges and stabilize thecarboxyl and amino groups of the ligand. In theLAOBP-Lys and HisJ-His complexes, the side-chainof Asp161 is also used to stabilize the ligand.However, the corresponding Asp157 in the GlnBP-Gln model does not appear to participate in ligandstabilization, although it is possible to form ahydrogen bond (2.55 A) between OD1 of Asp157and the main-chain nitrogen atom of L-glutamineby rotation around the CA-CB bond of Asp157. The
Structure of Glutamine-binding Protein236
corresponding residue in the LAOBP-Lys andHisJ-His complexes is Leu117, which is involved inhydrophobic stacking with the ligand.
Recently, the proposed model has been used tosolve the crystal structure of the ‘‘closed-cleft’’GlnBP-Gln complex by molecular replacement(Y.-J. Sun, personal communication). The GlnBP-Gln complex has been refined to an R-value of 22%
for data from 6 to 1.8 A resolution. While thedetailed crystal structure of the entire GlnBP-Glncomplex will be published in a separate paper bySun et al., some selected results are reported here toaid in the evaluation of the various predictionsconcerning the structure of the GlnBP-Gln complexand the GlnBP binding pocket.
The crystal structure of the GlnBP-Gln complex
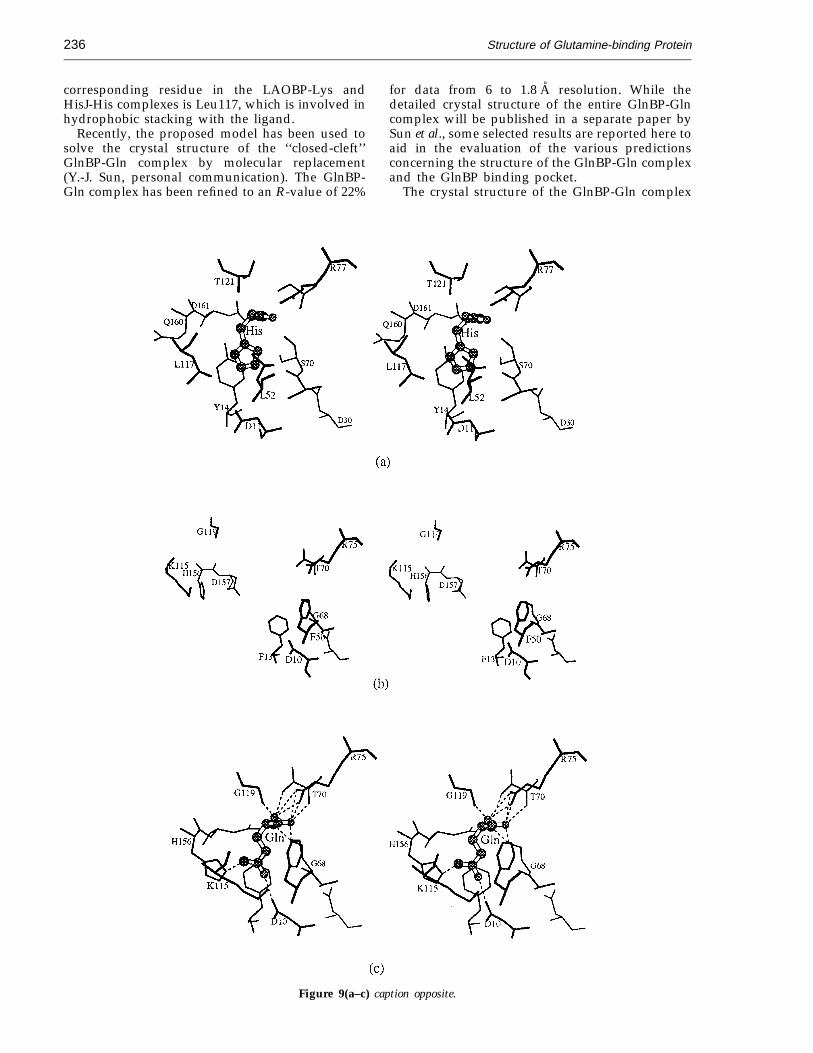
Figure 9(a–c) caption opposite.
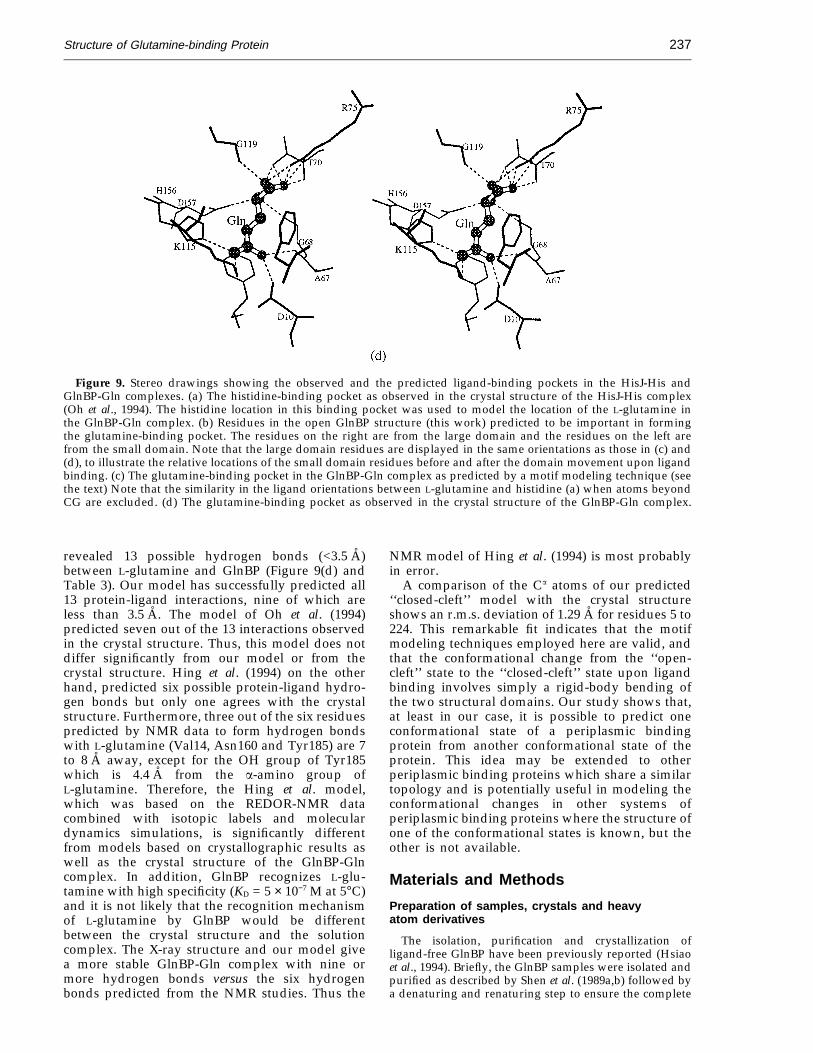
Structure of Glutamine-binding Protein 237
Figure 9. Stereo drawings showing the observed and the predicted ligand-binding pockets in the HisJ-His andGlnBP-Gln complexes. (a) The histidine-binding pocket as observed in the crystal structure of the HisJ-His complex(Oh et al., 1994). The histidine location in this binding pocket was used to model the location of the L-glutamine inthe GlnBP-Gln complex. (b) Residues in the open GlnBP structure (this work) predicted to be important in formingthe glutamine-binding pocket. The residues on the right are from the large domain and the residues on the left arefrom the small domain. Note that the large domain residues are displayed in the same orientations as those in (c) and(d), to illustrate the relative locations of the small domain residues before and after the domain movement upon ligandbinding. (c) The glutamine-binding pocket in the GlnBP-Gln complex as predicted by a motif modeling technique (seethe text) Note that the similarity in the ligand orientations between L-glutamine and histidine (a) when atoms beyondCG are excluded. (d) The glutamine-binding pocket as observed in the crystal structure of the GlnBP-Gln complex.
revealed 13 possible hydrogen bonds (<3.5 A)between L-glutamine and GlnBP (Figure 9(d) andTable 3). Our model has successfully predicted all13 protein-ligand interactions, nine of which areless than 3.5 A. The model of Oh et al. (1994)predicted seven out of the 13 interactions observedin the crystal structure. Thus, this model does notdiffer significantly from our model or from thecrystal structure. Hing et al. (1994) on the otherhand, predicted six possible protein-ligand hydro-gen bonds but only one agrees with the crystalstructure. Furthermore, three out of the six residuespredicted by NMR data to form hydrogen bondswith L-glutamine (Val14, Asn160 and Tyr185) are 7to 8 A away, except for the OH group of Tyr185which is 4.4 A from the a-amino group ofL-glutamine. Therefore, the Hing et al. model,which was based on the REDOR-NMR datacombined with isotopic labels and moleculardynamics simulations, is significantly differentfrom models based on crystallographic results aswell as the crystal structure of the GlnBP-Glncomplex. In addition, GlnBP recognizes L-glu-tamine with high specificity (KD = 5 × 10⁻⁷ M at 5°C)and it is not likely that the recognition mechanismof L-glutamine by GlnBP would be differentbetween the crystal structure and the solutioncomplex. The X-ray structure and our model givea more stable GlnBP-Gln complex with nine ormore hydrogen bonds versus the six hydrogenbonds predicted from the NMR studies. Thus the
NMR model of Hing et al. (1994) is most probablyin error.
A comparison of the Ca atoms of our predicted‘‘closed-cleft’’ model with the crystal structureshows an r.m.s. deviation of 1.29 A for residues 5 to224. This remarkable fit indicates that the motifmodeling techniques employed here are valid, andthat the conformational change from the ‘‘open-cleft’’ state to the ‘‘closed-cleft’’ state upon ligandbinding involves simply a rigid-body bending ofthe two structural domains. Our study shows that,at least in our case, it is possible to predict oneconformational state of a periplasmic bindingprotein from another conformational state of theprotein. This idea may be extended to otherperiplasmic binding proteins which share a similartopology and is potentially useful in modeling theconformational changes in other systems ofperiplasmic binding proteins where the structure ofone of the conformational states is known, but theother is not available.
Materials and Methods
Preparation of samples, crystals and heavyatom derivatives
The isolation, purification and crystallization ofligand-free GlnBP have been previously reported (Hsiaoet al., 1994). Briefly, the GlnBP samples were isolated andpurified as described by Shen et al. (1989a,b) followed bya denaturing and renaturing step to ensure the complete

Structure of Glutamine-binding Protein238
Table 4. Data statisticsCell Dimensions (A)
Total Unique Resolutiona Rsymb Average
Data set A B C measurements reflection (A) (F ) I/sI
Natinec 86.3 86.3 81.5 100,231 24,247 2.3 (93) 5.13 17.37K2PtCl4
d 85.2 85.6 80.5 63,930 20,042 2.4 (82) 4.65 20.12K2PtCl4
e 85.4 85.4 79.9 133,063 35,484f 2.5 (91) 7.37 13.90a Completeness (percentage) is given in parentheses.b Rsym(F ) = ShSi=Fi − F =SiF where F is the mean structure factor of the ith observations of reflection h.c Data were collected on a Siemens X1000 detector and processed with XENGEN V 2.0.d Crystals were soaked for 48 hours in 0.03 mM K2PtCl4. Data were collected on a Siemens X1000 detector and
processed with XENGEN V 2.0.e Crystals were soaked for 48 hours in 0.03 mM K2PtCl4. Data were collected on a SDMS dual detector system and
processed with SDMS software.f Friedel pairs were also collected for this derivative data set.
removal of any bound L-glutamine. The crystals of GlnBPwere grown at 18°C by vapor diffusion in 0.1 M Tris-HClbuffer (pH 8.6) using (NH4)2SO4 as the precipitant.Crystals (denoted form-B by Hsiao et al., 1994) grew toa size of 0.8 mm × 0.8 mm × 0.8 mm in two weeks. Thecrystals belong to space group P212121 with celldimensions of a = b = 86.3 A, c = 81.5 A and contain twomolecules per asymmetric unit. It should be noted thatalthough the lengths of the a- and b-axes are equal, anevaluation of the diffraction intensity differences be-tween the 2-fold and 4-fold related reflections (dataprocessed in space group P1) indicate that the crystalsbelong to an orthorhombic, rather than a tetragonalcrystal system (Hsiao et al., 1994).
A useful platinum-derivative was prepared by soakingcrystals at 18°C for 48 hours in 0.5 ml of 75% (w/v)saturated ammonium sulfate solution containing0.03 mM K2PtCl4. The yellow crystals (native crystalswere colorless) diffracted to about 2.4 A resolution,showed about 1% shrinkage in unit cell lengths(a = 85.2 A, b = 85.6 A and c = 80.5 A) and significantintensity changes (Table 4) which gave consistent peaksin both the isomorphous and Bijvoet Patterson maps.
X-ray data collection and processing
Diffraction data for the native crystals were collectedusing the mirror-focused CuKa radiation (45 kV and90 mA) from a single crystal on a Siemens X1000 area
detector system (Blum et al., 1987). The data set wascomposed of 800 (440 frames plus 360 frames to cover theblind zone) 0.25° data frames, each exposed for 180seconds. Data to 2.3 A were collected using a detectorswing angle (2u) of 18° and a crystal-to-detector distanceof 15 cm. The raw data were indexed, integrated andscaled using XENGEN V2.0 (Howard et al., 1987). TheRsymm(F) based on the data to 2.3 A resolution (93%complete) was 5.13% (Table 4).
Two platinum-derivative data sets were collected. Oneset was collected from a single crystal on the SiemensX1000 area detector system described above and withsimilar operating conditions. The raw data consisted of880 (440 frames plus 440 frames to cover the blind zone)0.25° oscillation data frames, each exposed for 200seconds. The data were processed as described above.The Rsymm(F) based on the data to 2.4 A resolution (82%complete with Friedel pairs merged) was 4.65%. Asecond data set was collected using graphite monochro-matized CuKa radiation (40 kV and 60 mA) on a SDMSdual detector system (Hamlin, 1985). The data setconsisted of 3000, 0.1° oscillation data frames, eachexposed for 180 seconds. The crystal-to-detector dis-tances were 435.2 mm and 517.7 mm, and the swingangles were −17° and 30° for detectors 0 and 1,respectively. The raw data were indexed, integrated andscaled using the SDMS data processing software(Howard et al., 1985) keeping Friedel pairs separate. TheRsymm(F) based on 2.5 A resolution (91% complete) was7.37% (Table 4).
Table 5. Derivative statisticsRefined parameters for isomorphous replacement data to 3.6 A
Site Site residue Site atom X Y Z Occupancy B (A2)
1 Met48 Sd 0.362 0.231 −0.310 1.07 25.02 Met48 Sd 0.521 0.612 −0.560 0.97 25.0
R(Cullis)a = 0.546
Refined parameters for anomalous scattering data to 5.0 ASite Site residue Site atom X Y Z Occupancy B (A2)
1 Met48 Sd 0.363 0.234 −0.316 1.06 25.02 Met48 Sd 0.518 0.615 −0.560 0.93 25.0
R(acentric)b = 0.304a R(Cullis) = S>DFobs= − =FHcal>/S=DFobs=, where DFobs is the observed structure factor
difference between the heavy-atom derivative and the native and FHcal is the calculatedheavy-atom contribution. The summation is taken over only the centric reflections.
b R(acentric) = S>DF "obs= − =F "Hcal>/S=DF "obs=, where, DF "obs is the Bijvoet difference in thederivative data and F "Hcal is the calculated imaginary component of the heavy-atomcontribution. The summation is taken over 25% acentric reflections with the largest DF "obs.

Structure of Glutamine-binding Protein 239
Table 6. Refinement statisticsR-value as a function of resolution
RF RF-Free
Number of R-factor Number of R-factordmax-min reflections R-factor (Accum.) reflections R-factor (Accum.)
4.48–10.00 3532 0.1846 0.1846 347 0.2933 0.29333.61–4.48 3361 0.1531 0.1699 323 0.2508 0.27343.17–3.61 3215 0.1899 0.1749 313 0.2804 0.27522.89–3.17 2980 0.2230 0.1821 294 0.3145 0.28122.68–2.89 2786 0.2538 0.1892 286 0.3080 0.28422.53–2.68 2608 0.2714 0.1953 231 0.3163 0.28652.40–2.53 2471 0.2930 0.2012 216 0.3131 0.28792.30–2.40 782 0.3179 0.2032 55 0.3694 0.2890
Determination of heavy-atom positionand handedness
The native data and the derivative data were placed ona common scale using relative Wilson scaling (Wilson,1949). The Rmerge for the first (Siemens) and second(SDMS) derivative data sets were 12.7% and 15.6%,respectively for data to 3.0 A resolution. While theSiemens data showed consistent peaks in the iso-morphous difference Patterson map only the SDMS datashowed consistent peaks in both the isomorphous andBijvoet difference Patterson maps. However the signal-to-noise ratio was much lower for the SDMS isomorphousdifference Patterson map, which may suggest a degree ofnon-isomorphism in this data set.
The platinum binding sites were found from a visualinterpretation and the heavy-atom parameters wererefined by SHELX76 (Sheldrick, 1976) using centric datato 3.5 A resolution plus the largest Bijvoet difference(25%) from the anomalous scattering data set to 5.0 Aresolution.
The handedness of the heavy-atom set was tested usinga procedure similar to that described by Chen et al.(1991). A comparison of the phase-refinement statisticsindicated that the ‘‘ + + − ’’ enantiomer was more likelycorrect since it gave a higher figure-of-merit (0.81 versus.0.79), a larger correlation coefficient (0.96 versus 0.93) anda lower map-inversion R-value (0.26 versus 0.32). Inaddition, electron density maps generated using the
‘‘ + + + ’’ enantiomer were noisy and ambiguous inmolecular boundary while the maps for the ‘‘ + + − ’’enantiomer clearly showed protein-solvent boundary.The successful fitting of left-handed residues into theelectron density map confirms the correct determinationof the handedness of the heavy-atom sites. The finalheavy-atom parameters and related heavy-atom refine-ment statistics are shown in Table 5.
Calculation of phases
The ISIR-ISAS program suite (Wang, 1985) was used togenerate, improve and extend the protein phases. In ourapplication of this procedure, sub-sets of the data werephased in order to produce the best possible electrondensity map (visual inspection). The selection of data wasdone by trial-and-error, using combinations of reflec-tions, based on resolution. The best map was obtainedusing a 53% solvent content and 3.5 A (7483 reflections)Siemens data with SAS data (SDMS) to 5 A (1918 Bijvoetpairs) followed by phase extension to 2.8 A resolution.Briefly, a map was computed from the combined 3.5 ASIR and 5 A SAS phases, and a 53% solvent content wasused to define the protein-solvent boundary and toconstruct the first filter. Eight cycles of iterations werethen applied using this filter to improve the originalphase information to 3.5 A. A second filter was thenconstructed based on the updated phase information andthe initial SIRAS phases to 3.5 A resolution were refined
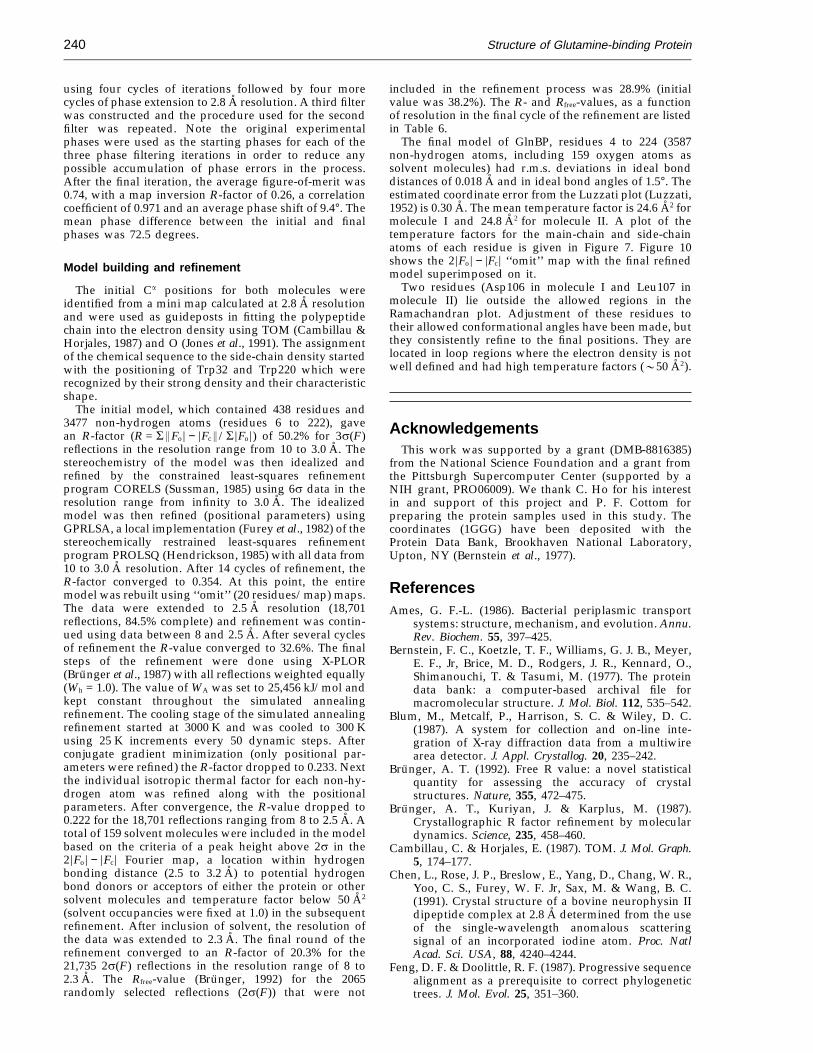
Figure 10. A representative section of the residue-deleted 2=Fo= − =Fc= electron density map with the final refinedmodel (deleted residues) superimposed on it.
Structure of Glutamine-binding Protein240
using four cycles of iterations followed by four morecycles of phase extension to 2.8 A resolution. A third filterwas constructed and the procedure used for the secondfilter was repeated. Note the original experimentalphases were used as the starting phases for each of thethree phase filtering iterations in order to reduce anypossible accumulation of phase errors in the process.After the final iteration, the average figure-of-merit was0.74, with a map inversion R-factor of 0.26, a correlationcoefficient of 0.971 and an average phase shift of 9.4°. Themean phase difference between the initial and finalphases was 72.5 degrees.
Model building and refinement
The initial Ca positions for both molecules wereidentified from a mini map calculated at 2.8 A resolutionand were used as guideposts in fitting the polypeptidechain into the electron density using TOM (Cambillau &Horjales, 1987) and O (Jones et al., 1991). The assignmentof the chemical sequence to the side-chain density startedwith the positioning of Trp32 and Trp220 which wererecognized by their strong density and their characteristicshape.
The initial model, which contained 438 residues and3477 non-hydrogen atoms (residues 6 to 222), gavean R-factor (R = S>Fo= − =Fc>/S=Fo=) of 50.2% for 3s(F )reflections in the resolution range from 10 to 3.0 A. Thestereochemistry of the model was then idealized andrefined by the constrained least-squares refinementprogram CORELS (Sussman, 1985) using 6s data in theresolution range from infinity to 3.0 A. The idealizedmodel was then refined (positional parameters) usingGPRLSA, a local implementation (Furey et al., 1982) of thestereochemically restrained least-squares refinementprogram PROLSQ (Hendrickson, 1985) with all data from10 to 3.0 A resolution. After 14 cycles of refinement, theR-factor converged to 0.354. At this point, the entiremodel was rebuilt using ‘‘omit’’ (20 residues/map) maps.The data were extended to 2.5 A resolution (18,701reflections, 84.5% complete) and refinement was contin-ued using data between 8 and 2.5 A. After several cyclesof refinement the R-value converged to 32.6%. The finalsteps of the refinement were done using X-PLOR(Brunger et al., 1987) with all reflections weighted equally(Wh = 1.0). The value of WA was set to 25,456 kJ/mol andkept constant throughout the simulated annealingrefinement. The cooling stage of the simulated annealingrefinement started at 3000 K and was cooled to 300 Kusing 25 K increments every 50 dynamic steps. Afterconjugate gradient minimization (only positional par-ameters were refined) the R-factor dropped to 0.233. Nextthe individual isotropic thermal factor for each non-hy-drogen atom was refined along with the positionalparameters. After convergence, the R-value dropped to0.222 for the 18,701 reflections ranging from 8 to 2.5 A. Atotal of 159 solvent molecules were included in the modelbased on the criteria of a peak height above 2s in the2=Fo= − =Fc= Fourier map, a location within hydrogenbonding distance (2.5 to 3.2 A) to potential hydrogenbond donors or acceptors of either the protein or othersolvent molecules and temperature factor below 50 A2
(solvent occupancies were fixed at 1.0) in the subsequentrefinement. After inclusion of solvent, the resolution ofthe data was extended to 2.3 A. The final round of therefinement converged to an R-factor of 20.3% for the21,735 2s(F ) reflections in the resolution range of 8 to2.3 A. The Rfree-value (Brunger, 1992) for the 2065randomly selected reflections (2s(F )) that were not
included in the refinement process was 28.9% (initialvalue was 38.2%). The R- and Rfree-values, as a functionof resolution in the final cycle of the refinement are listedin Table 6.
The final model of GlnBP, residues 4 to 224 (3587non-hydrogen atoms, including 159 oxygen atoms assolvent molecules) had r.m.s. deviations in ideal bonddistances of 0.018 A and in ideal bond angles of 1.5°. Theestimated coordinate error from the Luzzati plot (Luzzati,1952) is 0.30 A. The mean temperature factor is 24.6 A2 formolecule I and 24.8 A2 for molecule II. A plot of thetemperature factors for the main-chain and side-chainatoms of each residue is given in Figure 7. Figure 10shows the 2=Fo= − =Fc= ‘‘omit’’ map with the final refinedmodel superimposed on it.
Two residues (Asp106 in molecule I and Leu107 inmolecule II) lie outside the allowed regions in theRamachandran plot. Adjustment of these residues totheir allowed conformational angles have been made, butthey consistently refine to the final positions. They arelocated in loop regions where the electron density is notwell defined and had high temperature factors (050 A2).
AcknowledgementsThis work was supported by a grant (DMB-8816385)
from the National Science Foundation and a grant fromthe Pittsburgh Supercomputer Center (supported by aNIH grant, PRO06009). We thank C. Ho for his interestin and support of this project and P. F. Cottom forpreparing the protein samples used in this study. Thecoordinates (1GGG) have been deposited with theProtein Data Bank, Brookhaven National Laboratory,Upton, NY (Bernstein et al., 1977).
ReferencesAmes, G. F.-L. (1986). Bacterial periplasmic transport
systems: structure, mechanism, and evolution. Annu.Rev. Biochem. 55, 397–425.
Bernstein, F. C., Koetzle, T. F., Williams, G. J. B., Meyer,E. F., Jr, Brice, M. D., Rodgers, J. R., Kennard, O.,Shimanouchi, T. & Tasumi, M. (1977). The proteindata bank: a computer-based archival file formacromolecular structure. J. Mol. Biol. 112, 535–542.
Blum, M., Metcalf, P., Harrison, S. C. & Wiley, D. C.(1987). A system for collection and on-line inte-gration of X-ray diffraction data from a multiwirearea detector. J. Appl. Crystallog. 20, 235–242.
Brunger, A. T. (1992). Free R value: a novel statisticalquantity for assessing the accuracy of crystalstructures. Nature, 355, 472–475.
Brunger, A. T., Kuriyan, J. & Karplus, M. (1987).Crystallographic R factor refinement by moleculardynamics. Science, 235, 458–460.
Cambillau, C. & Horjales, E. (1987). TOM. J. Mol. Graph.5, 174–177.
Chen, L., Rose, J. P., Breslow, E., Yang, D., Chang, W. R.,Yoo, C. S., Furey, W. F. Jr, Sax, M. & Wang, B. C.(1991). Crystal structure of a bovine neurophysin IIdipeptide complex at 2.8 A determined from the useof the single-wavelength anomalous scatteringsignal of an incorporated iodine atom. Proc. NatlAcad. Sci. USA, 88, 4240–4244.
Feng, D. F. & Doolittle, R. F. (1987). Progressive sequencealignment as a prerequisite to correct phylogenetictrees. J. Mol. Evol. 25, 351–360.

Structure of Glutamine-binding Protein 241
Furey, W. F., Wang, B. C. & Sax, M. (1982).Crystallographic computing on an array processor.J. Appl. Crystallog. 21, 160–166.
Gaudin, C., Marty, B., Ragot, M., Sari, J. C. & Belaich, J. P.(1980). Thermodynamic studies of binding proteins:effect of temperature variations on substrate bindingand conformation of the leucine-isoleucine-valinebinding protein of Escherichia coli. Biochimie, 62,741–746.
Gilliland, G. L. & Quiocho, F. A. (1981). Structure of theL-arabinose-binding protein from Escherichia coli at2.4 A resolution. J. Mol. Biol. 146, 341–362.
Hamlin, R. (1985). Multiwire area X-ray diffractometers.Methods Enzymol. 114, 416–452.
Hendrickson, W. A. (1985). Stereochemically restrainedrefinement of macro-molecular structures. MethodsEnzymol. 115, 252–270.
Hing, A. W., Tjandra, N., Cottam, P. F., Schaefer, J. & Ho,C. (1994). An investigation of the ligand-binding siteof the glutamine-binding protein of Escherichia coliusing rotational-echo double-resonance NMR. Bio-chemistry, 33, 8651–8661.
Howard, A. J., Nielsen, C. & Xuong, N. H. (1985).Software for a diffractometer with multiwire areadetector. Methods Enzymol. 114, 452–472.
Howard, A. J., Gilliland, G. L., Finzel, B. C., Poulos, T. L.,Ohlendorf, D. H. & Salemme, F. R. (1987). The useof an imaging proportional counter in macromolecu-lar crystallography. J. Appl. Crystallog. 20, 383–387.
Hsiao, C. D., Sun, Y. J., Rose, J., Cottam, P. F., Ho, C. &Wang, B.-C. (1994). Crystals of glutamine-bindingprotein in various conformational states. J. Mol. Biol.240, 87–91.
Hunt, A. G. & Hong, J.-S. (1981). The reconstitutionof binding protein-dependent active transport ofglutamine in isolated membrane vesicles fromEscherichia coli. J. Biol. Chem. 256, 11988–11991.
Hunt, A. G. & Hong, J.-S. (1983). Involvement of histidineand tryptophan residues of glutamine bindingprotein in the interaction with membrane-boundcomponents of the glutamine transport system ofEscherichia coli. Biochemistry, 22, 851–854.
Jones, T. A., Zou, J.-Y. & Cowan, S. W. (1991). Improvedmethods for building protein models in electrondensity maps and the location of errors in thesemodels. Acta Crystallog. sect. A, 47, 110–119.
Kang, C.-F., Shin, W.-C., Yamagata, Y., Gokcen, S., Ames,F.-L. & Kim, S.-H. (1991). Crystal structure of thelysine-, arginine-, ornithine-binding protein (LAO)from Salmonella typhimurium at 2.7 A resolution.J. Biol. Chem. 266, 23893–23899.
Kraulis, P. J. (1991). MOLSCRIPT: a program to produceboth detailed and schematic plots of proteinstructures. J. Appl. Crystallog. 24, 946–950.
Laskowski, R. A., MacArthur, M. W., Moss, D. S. &Thornton, J. M. (1993). PROCHECK: a program tocheck the stereochemical quality of protein struc-tures. J. Appl. Crystallog. 26, 283–291.
Luzzati, P. V. (1952). Traitements statistique des erreursdans la determination des structures cristallines.Acta Crystallog. 5, 802–810.
Miller, D. M., Olson, J. S., Pflugrath, J. W. & Quiocho,F. A. (1983). Rates of ligand binding to periplasmicproteins involved in bacterial transport and chemo-taxis. J. Biol. Chem. 258, 13665–13672.
Mowbray, S. L. & Cole, L. B. (1992). 1.7 A X-ray structureof the periplasmic ribose receptor from Escherichiacoli. J. Mol. Biol. 225, 155–175.
Nickitenko, A. V., Trakhanov, S. & Quiocho, F. A. (1994).
2 A Resolution structure of DppA, a periplasmicdipeptide transport/chemosensory receptor. Bio-chemistry, 34, 16585–16594.
Oh, B.-H., Pandit, J., Kang, C.-H., Nikaido, K., Gokcen, S.,Ames, G. F.-L. & Kim, S.-H. (1993). Three-dimen-sional structure of the periplasmic lysine/arginine/ornithine-binding protein with and without a ligand.J. Biol. Chem. 268, 11348–11355.
Oh, B.-H., Kang, C.-H., Bondt, H. D., Kim, S.-H. Nikaido,K., Joshi, A. K. & Ames, G. F.-L. (1994). The bacterialperiplasmic histidine-binding protein structure/function analysis of the ligand-binding site andcomparison with related proteins. J. Biol. Chem. 269,4135–4143.
Penrose, W. R., Zand, R. & Oxender, D. L. (1970).Reversible conformational change in a leucine-bind-ing protein from Escherichia coli. J. Biol. Chem. 245,1432–1437.
Pflugrath, J. W. & Quiocho, F. A. (1988). The 2 Aresolution structure of the sulfate-binding proteininvolved in active transport in Salmonella ty-phimurium. J. Mol. Biol. 200, 163–180.
Quiocho, F. A. (1990). Atomic structure of periplasmicbinding proteins and the high-affinity active trans-port systems in bacteria. Phil. Trans. Roy. Soc. London,ser. B, 326, 341–351.
Rotman, B. & Ellis, J. H. (1972). Antibody-mediatedmodification of the binding properties of a proteinrelated to galactose transport. J. Bacteriol. 111,791–796.
Sack, J. S., Saper, M. A. & Quiocho, F. A. (1989a).Periplasmic binding protein structure and function:refined X-ray structure of the leucine/isoleucine/va-line-binding protein and its complex with leucine.J. Mol. Biol. 206, 171–191.
Sack, J. S., Trakhanov, S. D., Tsigannik, I. H. & Quiocho,F. A. (1989b). Structure of L-leucine-binding proteinrefined at 2.4 A resolution and comparison with theLeu/Ile/Val-binding protein structure. J. Mol. Biol.206, 193–207.
Sharff, A. J., Rodseth, L. E., Spurlino, J. C. & Quiocho,F. A. (1992). Crystallographic evidence of a largeligand-induced hinge-twist motion between the twodomains of the maltodextrin binding proteininvolved in active transport and chemotaxis.Biochemistry, 31, 10657–10663.
Sheldrick, G. M. (1976). SHELX76, Program for CrystalStructure Determination, University of Cambridge,UK.
Shen, Q., Simplaceanu, V., Cottam, P. F. & Ho, C. (1989a).Proton nuclear magnetic resonance studies onglutamine-binding protein from Escherichia coli:formation of intermolecular and intramolecularhydrogen bonds upon ligand binding. J. Mol. Biol.210, 849–857.
Shen, Q., Simplaceanu, V., Cottam, P. F., Wu, J.-L., Hong,J.-S. & Ho, C. (1989b). Molecular genetic, biochemicaland nuclear magnetic resonance studies on the roleof the tryptophan residues of glutamine-bindingprotein from Escherichia coli. J. Mol. Biol. 210,859–867.
Spurlino, J. C., Lu, G.-Y. & Quiocho, F. A. (1991). The2.3 A resolution structure of the maltose- ormaltodextrin-binding protein, a primary acceptor ofbacterial active transport and chemotaxis. J. Biol.Chem. 266, 5202–5219.
Sussman, J. L. (1985). Constrained-restrained least-square(CORELS) refinement of proteins and nucleic acids.Methods Enzymol. 115, 271–303.

Structure of Glutamine-binding Protein242
Tame, J. R. H., Murshudov, G. N., Dodson, E. J., Teresa,K. N., Dodson, G. G., Higgins, C. F. & Wilkinson,A. J. (1994). The structural basis of sequence-inde-pendent peptide binding by OppA protein. Science,264, 1578–1581.
Tjandra, N., Simplaceanu, V., Cottam, P. F. & Ho, C.(1992). Multidimensional 1H and 15N NMR investi-gation of glutamine-binding protein of Escherichiacoli. J. Biomol. NMR, 2, 149–160.
Vyas, N. K., Vyas, M. N. & Quiocho, F. A. (1988). Sugarand signal-transducer binding sites of the Escherichiacoli galactose chemoreceptor protein. Science, 242,1290–1295.
Wang, B.-C. (1985). Resolution of phase ambiguity inmacromolecular crystallography. Methods Enzymol.115, 90–112.
Weiner, J. H. & Heppel, L. A. (1971). A bindingprotein for glutamine and its relation to activetransport in Escherichia coli. J. Biol. Chem. 246,6933–6941.
Weiner, J. H., Furlong, C. E. & Heppel, L. A. (1971). Abinding protein for L glutamine and its relation toactive transport in E. coli. Arch. Biochem. Biophys. 142,715–717.
Wilson, A. J. C. (1949). The probability distribu-tion of X-ray intensities. Acta Crystallog. 2, 318–321.
Yao, N., Trakhanov, S. & Quiocho, F. A. (1994). Refined1.89 A structure of the histidine-binding proteincomplexed with histidine and its relationship withmany other active transport/chemosensory proteins.Biochemistry, 33, 4769–4779.
Edited by I. A. Wilson
(Received 13 February 1996; received in revised form 27 June 1996; accepted 3 July 1996)