The utility of Escherichia coli as a contamination indicator for ...
23
RESEARCH ARTICLE The utility of Escherichia coli as a contamination indicator for rural drinking water: Evidence from whole genome sequencing Saskia Nowicki ID 1 *, Zaydah R. deLaurent 2 , Etienne P. de Villiers 2,3,4 , George Githinji 2 , Katrina J. Charles 1 1 School of Geography and the Environment, University of Oxford, Oxford, United Kingdom, 2 KEMRI- Wellcome Trust Research Programme, Centre for Geographic Medicine Research-Coast, Kilifi, Kenya, 3 Nuffield Department of Medicine, Centre for Tropical Medicine and Global Health, University of Oxford, Oxford, United Kingdom, 4 Department of Public Health, Pwani University, Kilifi, Kenya * [email protected] Abstract Across the water sector, Escherichia coli is the preferred microbial water quality indicator and current guidance upholds that it indicates recent faecal contamination. This has been challenged, however, by research demonstrating growth of E. coli in the environment. In this study, we used whole genome sequencing to investigate the links between E. coli and recent faecal contamination in drinking water. We sequenced 103 E. coli isolates sampled from 9 water supplies in rural Kitui County, Kenya, including points of collection (n = 14) and use (n = 30). Biomarkers for definitive source tracking remain elusive, so we analysed the phylogenetic grouping, multi-locus sequence types (MLSTs), allelic diversity, and virulence and antimicrobial resistance (AMR) genes of the isolates for insight into their likely source. Phylogroup B1, which is generally better adapted to water environments, is dominant in our samples (n = 69) and allelic diversity differences (z = 2.12, p = 0.03) suggest that naturalised populations may be particularly relevant at collection points with lower E. coli concentrations (<50 / 100mL). The strains that are more likely to have originated from human and/or recent faecal contamination (n = 50), were found at poorly protected collection points (4 sites) or at points of use (12 sites). We discuss the difficulty of interpreting health risk from E. coli grab samples, especially at household level, and our findings support the use of E. coli risk cate- gories and encourage monitoring that accounts for sanitary conditions and temporal variability. Introduction The gram-negative coliform bacterial species, Escherichia coli, was discovered in 1885 during an investigation of the microbial life of the human gastrointestinal tract [1]. On the basis of their association with the gastrointestinal tract, E. coli have been recommended as indicators of microbial contamination risk in water since 1892 [2]. For decades, they were studied PLOS ONE PLOS ONE | https://doi.org/10.1371/journal.pone.0245910 January 22, 2021 1 / 23 a1111111111 a1111111111 a1111111111 a1111111111 a1111111111 OPEN ACCESS Citation: Nowicki S, deLaurent ZR, de Villiers EP, Githinji G, Charles KJ (2021) The utility of Escherichia coli as a contamination indicator for rural drinking water: Evidence from whole genome sequencing. PLoS ONE 16(1): e0245910. https:// doi.org/10.1371/journal.pone.0245910 Editor: Andrew C. Singer, UK Centre for Ecology and Hydrology, UNITED KINGDOM Received: September 29, 2020 Accepted: January 9, 2021 Published: January 22, 2021 Peer Review History: PLOS recognizes the benefits of transparency in the peer review process; therefore, we enable the publication of all of the content of peer review and author responses alongside final, published articles. The editorial history of this article is available here: https://doi.org/10.1371/journal.pone.0245910 Copyright: © 2021 Nowicki et al. This is an open access article distributed under the terms of the Creative Commons Attribution License, which permits unrestricted use, distribution, and reproduction in any medium, provided the original author and source are credited. Data Availability Statement: The raw sequence read files have been deposited in the European Nucleotide Archive (ENA) as study accession
-
Upload
khangminh22 -
Category
Documents
-
view
0 -
download
0
Transcript of The utility of Escherichia coli as a contamination indicator for ...

RESEARCH ARTICLE
The utility of Escherichia coli as a
contamination indicator for rural drinking
water: Evidence from whole genome
sequencing
Saskia NowickiID1*, Zaydah R. deLaurent2, Etienne P. de Villiers2,3,4, George Githinji2,
Katrina J. Charles1
1 School of Geography and the Environment, University of Oxford, Oxford, United Kingdom, 2 KEMRI-
Wellcome Trust Research Programme, Centre for Geographic Medicine Research-Coast, Kilifi, Kenya,
3 Nuffield Department of Medicine, Centre for Tropical Medicine and Global Health, University of Oxford,
Oxford, United Kingdom, 4 Department of Public Health, Pwani University, Kilifi, Kenya
Abstract
Across the water sector, Escherichia coli is the preferred microbial water quality indicator
and current guidance upholds that it indicates recent faecal contamination. This has been
challenged, however, by research demonstrating growth of E. coli in the environment. In this
study, we used whole genome sequencing to investigate the links between E. coli and
recent faecal contamination in drinking water. We sequenced 103 E. coli isolates sampled
from 9 water supplies in rural Kitui County, Kenya, including points of collection (n = 14) and
use (n = 30). Biomarkers for definitive source tracking remain elusive, so we analysed the
phylogenetic grouping, multi-locus sequence types (MLSTs), allelic diversity, and virulence
and antimicrobial resistance (AMR) genes of the isolates for insight into their likely source.
Phylogroup B1, which is generally better adapted to water environments, is dominant in our
samples (n = 69) and allelic diversity differences (z = 2.12, p = 0.03) suggest that naturalised
populations may be particularly relevant at collection points with lower E. coli concentrations
(<50 / 100mL). The strains that are more likely to have originated from human and/or recent
faecal contamination (n = 50), were found at poorly protected collection points (4 sites) or at
points of use (12 sites). We discuss the difficulty of interpreting health risk from E. coli grab
samples, especially at household level, and our findings support the use of E. coli risk cate-
gories and encourage monitoring that accounts for sanitary conditions and temporal
variability.
Introduction
The gram-negative coliform bacterial species, Escherichia coli, was discovered in 1885 during
an investigation of the microbial life of the human gastrointestinal tract [1]. On the basis of
their association with the gastrointestinal tract, E. coli have been recommended as indicators
of microbial contamination risk in water since 1892 [2]. For decades, they were studied
PLOS ONE
PLOS ONE | https://doi.org/10.1371/journal.pone.0245910 January 22, 2021 1 / 23
a1111111111
a1111111111
a1111111111
a1111111111
a1111111111
OPEN ACCESS
Citation: Nowicki S, deLaurent ZR, de Villiers EP,
Githinji G, Charles KJ (2021) The utility of
Escherichia coli as a contamination indicator for
rural drinking water: Evidence from whole genome
sequencing. PLoS ONE 16(1): e0245910. https://
doi.org/10.1371/journal.pone.0245910
Editor: Andrew C. Singer, UK Centre for Ecology
and Hydrology, UNITED KINGDOM
Received: September 29, 2020
Accepted: January 9, 2021
Published: January 22, 2021
Peer Review History: PLOS recognizes the
benefits of transparency in the peer review
process; therefore, we enable the publication of
all of the content of peer review and author
responses alongside final, published articles. The
editorial history of this article is available here:
https://doi.org/10.1371/journal.pone.0245910
Copyright: © 2021 Nowicki et al. This is an open
access article distributed under the terms of the
Creative Commons Attribution License, which
permits unrestricted use, distribution, and
reproduction in any medium, provided the original
author and source are credited.
Data Availability Statement: The raw sequence
read files have been deposited in the European
Nucleotide Archive (ENA) as study accession
primarily in lab and clinical settings that further emphasised their association with the gastro-
intestinal tract and, therefore, the faeces of humans and other vertebrates. But their ecological
niche is much broader than initially realised, and the species is now recognised as ‘hardy gen-
eralist’ rather than gastrointestinal tract specialist [3]. This has consequences for its use as a
water quality indicator.
E. coli occupy two habitats: the primary [gastrointestinal tract) and secondary [water, sedi-
ment, soil, flora). Initially, they were thought to have a net negative growth rate in the second-
ary habitat, implying short-term extra-host persistence [4]. But since the early 2000s, the
assumption of negative growth rate in secondary habitats has increasingly been challenged by
recognition of naturalised E. coli populations. E. coli have a core genome of about 2,000 genes,
but roughly half the genes in any E. coli bacterium are contained in the ‘accessory genome’–
which exhibits large genotypic and phenotypic diversity across strains, allowing for diverse
adaptive paths [5, 6]. This adaptability enables E. coli to contend with many stresses in envi-
ronmental habitats [7, 8], which could include nutrient deprivation; sub-optimal temperature,
salinity, moisture, and substrate texture ranges; exposure to solar radiation; competition with
other microbes; and predation by protozoans [9, 10]. E. coli have been found to grow in solu-
tions of pH ranging from 4.5 to 9 [11]. They are able to acquire energy in versatile ways and
grow in both anaerobic and aerobic conditions with temperatures ranging from 7.5 to 49˚C
[10].
Studies have demonstrated E. coli persisting on algae and in soils, sediment, and sand in
tropical, subtropical and temperate environments [10], as well as in handpumps removed
from boreholes [12]. Furthermore, long-term growth of E. coli has been demonstrated in a
diverse array of source environments including lakes, rivers, sediments, beaches, soils, and
aquatic plants and animals [13]. Several investigations have described genetically distinct pop-
ulations of naturalised E. coli [14–20], including environmentally associated cryptic clade phy-
logroups [13]. And a recent meta-analysis representing the phylogenetic diversity of more
than 5000 (mostly) non-clinical isolates from Australia associated genetic backgrounds with
specific habitats, including freshwater [21].
Such a meta-analysis is not yet possible for Kenya, nor the African continent more broadly,
because genetic studies of non-clinical E. coli are relatively sparse. The majority of E. coli iso-
lates sequenced in Kenya are from clinical, livestock, or food hygiene sampling [22], so there is
limited information on the genetic background of E. coli sampled from the environment,
including water systems. In general, few studies have undertaken whole genome sequencing of
E. coli in drinking water supplies, although a characterisation of 28 isolates from chlorinated
water supplies in Australia suggested that 9 isolates were naturalised E. coli that were unlikely
to represent human health risk [23].
The utility of E. coli as a faecal contamination indicator in water systems is challenged by
the existence of naturalised E. coli populations [24]. It can be difficult to interpret E. coli sam-
pling results, particularly when water system safety controls have not been validated and when
sampling is infrequent [25]. Thus, the severity and immediacy of the potential threat indicated
by an E. coli positive sample is unclear. Despite this uncertainty, E. coli remains the preferred
indicator of microbial water safety, including for rural community managed supplies [26]. The
World Health Organisation drinking-water quality guidelines do not account for naturalised
E. coli populations in source waters or distribution systems; they continue to assure that “the
presence of E. coli should be considered as evidence of recent faecal contamination” [26 p57].
In tracking progress towards the drinking-water Sustainable Development Goal (SDG 6.1),
E. coli is used to assess whether water is free from faecal contamination, a prerequisite of being
considered ‘safely managed’. As a result, E. coli testing is included in large-scale household sur-
vey programmes in more than thirty countries [27]. These survey programmes are testing
PLOS ONE The utility of E. coli as a drinking water quality indicator: Evidence from WGS
PLOS ONE | https://doi.org/10.1371/journal.pone.0245910 January 22, 2021 2 / 23
PRJEB40218 (http://www.ebi.ac.uk/ena/data/view/
PRJEB40218).
Funding: S.N. and K.C. are supported by the
REACH programme funded by UK Aid from the UK
Foreign, Commonwealth and Development Office
(FCDO | https://www.gov.uk/government/
organisations/foreign-commonwealth-
development-office) for the benefit of developing
countries (Programme Code 201880). S.N. is
further supported by the Commonwealth
Scholarship Commission in the UK (https://www.
gov.uk/government/organisations/commonwealth-
scholarship-commission-in-the-uk). G.G. is funded
by the National Institute for Health Research
(project reference 17/63/82) funded by UK Aid
(FCDO) to support global health research.
However, the views expressed and information
contained in this article are not necessarily those of
or endorsed by the FCDO, which can accept no
responsibility for such views or information, or for
any reliance placed on them. The funders had no
role in study design, data collection and analysis,
decision to publish, or preparation of the
manuscript.
Competing interests: The authors have declared
that no competing interests exist.

water both at point of collection (PoC) and household-level point of use (PoU). That concen-
trations of E. coli often increase between PoC and PoU is well-established in the literature,
evinced by studies from both urban and rural areas in Africa, South-East Asia, South and Cen-
tral America, and the Caribbean [28–30]. However, the health implications of this increase are
debated, as are the implications for where water quality monitoring and treatment efforts
should focus [30]. Increases in E. coli concentration between PoC and PoU may result from
contamination introduced during transport and household storage, which is influenced by
sanitation, hygiene, and water handling practices; however, it may also result from growth of
E. coli that was in the water supply, or from sloughing of biofilms in storage containers–neither
of which would normally represent an increased health hazard [31, 32].
Thus, use of E. coli in rural water quality monitoring involves two key uncertainties. First,
to what extent is E. coli at PoC linked to recent faecal contamination? Second, what are the
health hazard implications of changes in E. coli concentration between PoC and PoU? These
long-standing [33] and strongly context dependant uncertainties are not easily resolved. In
this study, we sought insight for managing them in the context of water supply in rural Kitui
County, Kenya. We isolated E. coli from drinking water supplies and household storage and
used whole genome sequencing to characterise each isolate to investigate the diversity of phy-
logroups, multi-locus sequence types, and virulence and antibiotic resistance genes within and
between water supplies and household water storage. The results contribute to understanding
of non-clinical E. coli populations in Kenya and provide insight into the occurrence of E. coliin rural water systems, allowing comparison between PoC and PoU and informing on the util-
ity of E. coli as a faecal contamination indictor in these settings.
Materials and methods
Ethics statement
Field research was conducted with permission from the Kenyan National Commission for Sci-
ence, Technology and Innovation, License No: NACOSTI/P/18/22793/24854. Ethical approval
was obtained from the University of Oxford’s Central University Research Ethics Committee.
All participation was informed and uncompensated. Engagement with participants was con-
tingent upon consent from participants after they were informed of the study process and
objective verbally. Personal identifiers were stored only for the duration of the study and in a
secured platform.
Water sampling
Nine water supply systems were selected from among those that were sampled by a rural water
maintenance service provider in northern Kitui County, Kenya as part of a monitoring pro-
gramme that had commenced 7 months prior to this study. The systems were chosen to
include multiple supply types with varying degrees of protection against contamination (piped
schemes sourcing water from boreholes or reservoirs and point sources including boreholes
and hand-dug wells with or without handpumps). To be selected, the system had to be a main
or alternative source of drinking-water with above zero median E. coli concentration from the
monitoring programme results. Most of the selected systems are community managed and are
either point sources or small (<5 km) piped distribution systems, all of which include one or
more storage tanks. Only one of them (S5) is managed by a formal water service provider (util-
ity). The water in this system is clarified and chlorinated in a water treatment facility and then
piped through a 66 km distribution network. The utility produces about 3000 m3/day on aver-
age, but due to the size of the distribution system and high demand for water, the supply at the
PoC is intermittent (approximately 2 days / week).
PLOS ONE The utility of E. coli as a drinking water quality indicator: Evidence from WGS
PLOS ONE | https://doi.org/10.1371/journal.pone.0245910 January 22, 2021 3 / 23

For each system, we sampled one or more PoCs. For each PoC, we sampled multiple PoUs.
We asked water system managers and users to help us find homes with stored water. The goal
was to sample at least three PoUs per PoC, but it was sometimes difficult to find households
with stored water from the PoC of interest due to multiple source use and mixing water from
multiple sources in home storage. As indicated in Table 1, a total of 44 sites were sampled
including 14 PoCs and 30 PoUs (more details on site protection and storage length and loca-
tion are available for each site in S1 Table). We refer to a system and its associated PoCs and
PoUs as a set, and each sampling site is labelled according to its corresponding set, PoC and
PoU (S#C#U#). The sampling sites are located within 1,400 km2, with the distance between
any two PoCs from different systems ranging from 50 km to 15 m apart.
Seven months of monitoring data were available for the selected PoC sites, which had been
sampled either weekly or monthly (with some gaps due to breakdowns and dry periods). Mon-
itoring included in situ measurement of pH and conductivity using a HACH multimeter (HQ
40D), which was calibrated weekly, and E. coli sampling using an IDEXX Quanti-Tray2000
system with weekly field blank and duplicate samples. No E. coli was detected in the blank
samples and duplicates had an average relative percent difference of 25.6% with 88% of dupli-
cate pairs indicating the same risk category, as defined by the World Health Organisation [26].
Surveys and interviews were conducted alongside the monitoring activities to understand
water use practices and track managers’ responses to the test results.
The median pH for each site ranged from 6.6 to 8.6 and median conductivity ranged from
90 to 1600 μS/cm except for Sets 4 and 7, which had median conductivity of 5000 and
10,500 μS/cm, respectively. Due to the high conductivity, which is linked to salinity, the man-
agers reported that water from these sites is only used for drinking when better alternatives are
unavailable due to dry periods, breakdowns, affordability, and intermittent supply from the
utility. Box-and-whisker plots for each PoC are available for pH (S1 Fig) and conductivity (S2
Fig). The median E. coli concentrations ranged from 1 to 920 MPN/100mL, with all PoCs hav-
ing variable results over the monitoring period (Fig 1).
No previous sampling was available for the PoU sites. During the sampling visits for this
study, short surveys were conducted with the household water managers (as distinct from
household heads who are not always aware of the details of water management in the home).
Respondents reported that PoU water was transported by donkey, motorbike, wheelbarrow, or
self-carry to be stored in either plastic drums (approximately 200L) or jerricans (20L) located
either inside the main house, a separate shelter, or outside in a private or communal area; at
the time of sampling, the water was reported to have been stored between 0 and 4 days, with 1
or 2 days being most common (S1 Table). Respondents said that jerricans were occasionally
cleaned with sand; they did not approximate a washing schedule but said the decision to clean
depends on the colour inside the jerrican. Although the first household in set 8 reported occa-
sional boiling and the third in set 6 reported occasional chlorination, none had treated the
water that we sampled. PoU water was sampled in line with standard practice by asking the
respondent to provide us with a cup of water that they would normally drink from.
Sites within a set were sampled on the same day between July 18 and August 2, 2019, which
is dry season in Kitui. This season was chosen to control for rain events, which would differen-
tially impact the quality of PoC water versus PoU water that was stored for multiple days. Two
samples were collected at each site in sterile 100mL Whirl-pak bags with sodium thiosulphate
to neutralise residual chlorine. At the PoCs, taps and handpump spouts were disinfected by
flame and at least 20L of water was pumped or flushed prior to sample collection.
PLOS ONE The utility of E. coli as a drinking water quality indicator: Evidence from WGS
PLOS ONE | https://doi.org/10.1371/journal.pone.0245910 January 22, 2021 4 / 23

Table 1. List of sampling sets with site IDs and source, system, collection, transport and storage types.
Set Source and system Collection type Site ID Transport type Storage type
1 Reservoir piped Standpipe S1C1
S1C1U1 Motorbike Jerrican
S1C1U2 Donkey Drum
S1C1U3 Donkey Drum
S1C1U4 Donkey Jerrican
S1C1U5 Donkey Jerrican
S1C1U6 Donkey Jerrican
Standpipe S1C2
S1C2U1 Donkey Drum
S1C2U2 Donkey Jerrican
S1C2U3 Donkey Jerrican
2 Borehole piped Standpipe S2C1
S2C1U1 Wheelbarrow Drum
S2C1U2 Self-carry Jerrican
Standpipe S2C2
S2C2U1 Motorbike Jerrican
S2C2U2 Motorbike Drum
S2C2U3 Wheelbarrow Druma
School standpipe S2C3b
3 Borehole piped2 Standpipe S3C1
S3C1U1 Self-carry Jerrican
S3C1U2 Self-carry Drum
S3C1U3 Donkey Drum
S3C1U4 Self-carry Jerrican
School concrete tank S3C2b
4 Borehole piped Plastic tank S4C1
S4C1U1 Self-carry Jerrican
S4C1U2 Wheelbarrow Jerrican
Concrete tank S4C2c
5 Reservoir pipedd Plastic tank S5C1
S5C1U1 Donkey Jerrican
S5C1U2 Donkey Drum
S5C1U3 Donkey Jerrican
6 Borehole point Handpump S6C1
S6C1U1 Donkey Jerrican
S6C1U2 Donkey Drum
S6C1U3 Donkey Jerrican
7 Borehole point Handpump S7C1
S7C1U1 Donkey Jerrican
S7C1U2 Self-carry Jerrican
8 Dug well point Bucket draw S8C1
S8C1U1 Donkey Jerrican
S8C1U2 Donkey Jerrican
9 Borehole piped School concrete tank S9C1b
aThis storage drum had a dispensing tap.bThe PoCs in schools (n = 3) were not associated with PoU storage because students drank directly from the standpipes or tank taps.cThis PoC was sampled twice, two weeks apart, but no PoU water was available either time.dChlorine is used for treatment in this system, but dosing is inconsistent and chlorine residual testing is not done.
https://doi.org/10.1371/journal.pone.0245910.t001
PLOS ONE The utility of E. coli as a drinking water quality indicator: Evidence from WGS
PLOS ONE | https://doi.org/10.1371/journal.pone.0245910 January 22, 2021 5 / 23

Sample filtration, culturing, and preservation
Samples were transported in a cooler box with icepacks to a field-lab where they underwent
membrane filtration. Based on previous E. coli monitoring results, multiple dilutions were
used for each site to maximise the chance of growing well-isolated colonies. Following filtra-
tion, the samples were incubated with m-ColiBlue24 broth (EPA Approved Hach Co.: 10029
method), which indicates E. coli colonies by blue colouration resulting from hydrolysis of
5-bromo-4-chloro-3-indolyl-β-D-glucuronide (BCIG). In all cases, the time between sample
collection and filtration was less than 6 hours. Between filtration and incubation, samples had
resuscitation time of 1 to 4 hours. Samples were incubated at 44.5˚C for 18–24 hours. The
incubation temperature was chosen to discourage growth of non-thermotolerant coliforms
and improve isolation of E. coli colonies. We considered that incubation at 44.5˚C could disad-
vantage naturalised E. coli, but studies have shown that although environmental strains grow
better than enteric strains at low temperatures, their maximal growth rate and optimal temper-
ature for growth are not distinct from enteric strains [34, 35].
Up to 6 colonies per site were selected for streaking on agar plates (ReadyPlate CHROM
Chromocult Coliform Agar ISO 9308–1:2014), which inhibit growth of non-coliforms and dis-
tinguish E. coli based on β-glucuronidase activity. The plates were incubated at 37.5˚C for 18–
24 hours. To increase the likelihood of selecting single strain E. coli colonies, selected colonies
were well isolated and consistent in colour and morphology. The goal was to select 6 colonies
per site, although this was not possible in a few sites that had low E. coli concentrations. With 6
colonies selected, a strain that composes 25% of the population of E. coli in the sample is 80%
Fig 1. Box-and-whisker plot of log10-transformed monitoring programme E. coli results for selected PoCs. The
boxes show median values and span lower to upper quartiles, the whiskers show the lowest and highest datums within
1.5 times the interquartile range. Data are censored by a lower bound of 0 MPN/100 mL and an upper bound
of> 2419.6 MPN/100mL. Results at the lower bound were converted to 0.1 (log = -1) and results at the upper bound
were converted to 2500 (log = 3.4). Vertical dashed grey lines show the WHO recommended risk category cut-offs [26]
with E. coli equal to 1, 10, and 100 MPN/100mL (corresponding to log values of 0, 1, and 2). The risk categories are low
(<1), intermediate (1–9), high (10–99), and very high (>99).
https://doi.org/10.1371/journal.pone.0245910.g001
PLOS ONE The utility of E. coli as a drinking water quality indicator: Evidence from WGS
PLOS ONE | https://doi.org/10.1371/journal.pone.0245910 January 22, 2021 6 / 23

likely to be selected at least once. Increasing the number of selected colonies gives diminishing
returns in terms of the likelihood of sampling at least one isolate of a strain with a given preva-
lence (see S3 Fig). Two key factors constrained out total sample size: 1) we were limited to sam-
pling one set per day because of the long distances between sites and the need to walk to many
of the homesteads for collecting PoU samples, and 2) our field lab was not equipped for freez-
ing samples nor doing clean DNA extractions, thus limiting the window of time available to us
before samples had to be transported to a better-equipped lab to proceed with DNA
extraction.
Following incubation, E. coli growth on the agar was carefully scraped with a sterile inocula-
tion loop, with care taken to minimise inclusion of agar and off-colour growth (pink growth
observed in 12% of samples and colourless growth in 3% of samples). The E. coli growth was
mixed into 1 mL of DNA Shield (Zymo Research R1100) for preservation in a sterile micro-
centrifuge tube and stored in a fridge before transport to the Kenya Medical Research Institute
(KEMRI) lab in Kilifi.
DNA extraction and whole genome sequencing
DNA were extracted within 1 to 3 weeks of sampling using a Zymo Research Quick-DNA
Mini-prep kit. We adjusted the recommended protocol for monolayer cells to suit E. coli that
is already lysed by preservation in DNA Shield. Thus, we combined 175 μL of sample lysate
with 525 μL of genomic lysis buffer and then proceeded with the monolayer cell protocol as
recommended by Zymo Research. Samples were normalised to 5 ng following DNA quantifi-
cation using a Qubit dsDNA HS Assay Kit and Qubit 3.0 Fluorometer (Life Technologies). We
proceeded to library preparation with Illumina Nextera XT DNA Sample Preparation kit as
per manufacturer instructions with half reaction alteration.
Following tagmentation and indexing, we did a size selection bead clean-up using 0.6x
AMPure XP beads (Beckman Coulter) to select for >500 bp fragments. The libraries were then
quantified using Qubit and size distribution was determined on a 2100 Bioanalyser using the
High Sensitivity DNA Kit (Agilent Technologies). We proceeded to manual normalization
bringing all samples to 2 nm and thereafter pooling the libraries. The pooled libraries were
then denatured, spiked with 8% Phix, and run on an Illumina MiSeq platform using the 600
cycles v3 reagent kit with an output of 2 x 200 bp. We did two runs, with 59 libraries pooled in
the first run and 68 in the second. One library that was poor quality in the first run, was
sequenced again in the second.
Bioinformatics
There are no known biomarkers that can definitively distinguish whether an E. coli isolate comes
from a naturalised population or other source [13], so we used multiple characteristics including
phylogroup, sequence type, allelic diversity, and presence of virulence and antibiotic resistance
genes as suggestive evidence of likely isolate origin. The sequencing reads were processed using
the Nullarbor pipeline [36]. Reads were filtered and trimmed using Trimmomatic [37] and only
reads that were>100 bp with PHRED quality score>20 were retained. Kraken2 was used for
species identification [38] and SPAdes v3.13.1 was used for de novo genome assembly [39].
The assembled genomes were assigned as E. coli sensu stricto (phylogroups A, B1, B2, C, D,
F, E, or G), Escherichia cryptic clades I-V, E. fergusonii, or E. albertii using the ClermonTyping
in silico approach based on standard PCR assays and Mash genome distance estimation [40,
41]. The threshold for minimal nucleotides for a contig to be included in the analysis was set at
100. Twelve of the assembled genomes were overlarge (ranging from 5.8 to 11.9 Mbp) so, sus-
pecting chimeric genomes, we conducted Benchmarking Universal Single-Copy Ortholog
PLOS ONE The utility of E. coli as a drinking water quality indicator: Evidence from WGS
PLOS ONE | https://doi.org/10.1371/journal.pone.0245910 January 22, 2021 7 / 23

(BUSCO) assessment [42, 43] to check the assembled genomes for completeness and duplica-
tion. For the non-chimeric genomes, we used Roary [44] for pan-genome analysis. With
Roary, genes that are present once in every isolate are combined in a multiple FASTA align-
ment, enabling phylogenetic tree construction from the core genes. We used FastTree version
2.1.10 SSE3 [45], with generalised time reversible model for nucleotide alignment, to construct
an approximately-maximum-likelihood phylogenetic tree. We used GrapeTree [46] to visual-
ise the tree including metadata. For comparison with our sample strains, we included 14
strains from the ClemonTyping Mash database [40] in our analysis, chosen to reflect the diver-
sity of Escherichia spp.
Multi-locus sequence typing was done through Nullarbor using the PubMLST database,
and virulence and antimicrobial resistance (AMR) gene identification was done using the
Abricate package [47] by screening contigs against the VFDB [48] and NCBI AMRFinderPlus
[49] databases, respectively. For multi-locus sequence typing, we chose the Achtman MLST
scheme [50], which uses genes adk, fumC, gyrB, icd, mdh, purA, and recA, because it is most
congruent with an established phylogeny for E. coli that is based on whole genome sequencing
[51]. In addition to the Nullarbor typing, the raw sequencing reads were also run through the
MLST screening tool hosted by the Centre for Genomic Epidemiology (CGE) [52] for confir-
mation of the allele identifications.
Statistics
To investigate possible relationships between allelic diversity and sample source, we segregated
our sampling sites into groups based on location (PoC or PoU) and E. coli concentrations
(lower or higher) on the day that the isolates were sampled, as shown in Table 2. The cut-off
between ‘lower’ or ‘higher’ was set at 50 CFU/100mL to balance the number of isolates in each
group as evenly as possible. Focussing on the 7 Achtman MLST scheme genes, we used an
approach developed for estimating average population heterozygosity from a small number of
individuals [53] by calculating the genetic diversity (H) of each group based on the diversity of
alleles (hj) as:
hj ¼ ½1 � Sp2
i �n
n � 1
h ið1Þ
Table 2. Site groupings based on source type and concentration of E. coli on the day that the isolates were sampled.
Groups Sites Included in Each Group No. of
Sets
No. of
Samples
No. of
MLSTs
No. of
Isolates
Median E.
coli�Min E.
coli�Max E.
coli�
All all sites 9 25 46 108+ 45 1 2420
PoU PoU sites 7 15 30 59 16 1 2000
PoC PoC sites 7 10 24 49 64 2 2420
Higher sites with [>50] 9 11 26 57 460 50 2420
Lower sites with [<50] 5 14 22 51 13 1 45
PoU-H S1C2U1, S2C1U1, S5C1U3, S7C1U1, S8C1U1, S8C1U2 5 6 15 31 125 50 2000
PoU-L S1C1U2, S2C1U2, S2C2U1, S2C2U2, S2C2U3, S3C1U3,
S5C1U2, S6C1U1, S6C1U3
5 9 16 28 10 1 17
PoC-H S3C2, S4C2-A/B, S8C1, S9C1 4 5 14 26 1120 84 2420
PoC-L S1C1, S2C1, S2C2, S2C3, S6C1 3 5 10 23 42 2 45
�Units are MPN/100mL.+This includes 5 chimeric isolates that contained only one match for each MLST gene with perfect identity matches for each allele as explained in the following
sequencing overview section.
https://doi.org/10.1371/journal.pone.0245910.t002
PLOS ONE The utility of E. coli as a drinking water quality indicator: Evidence from WGS
PLOS ONE | https://doi.org/10.1371/journal.pone.0245910 January 22, 2021 8 / 23

where pi is the frequency of allele i at locus j and n is the number of isolates. Genetic diversity
(H) was then calculated as the average diversity of alleles using:
H ¼Shj
mð2Þ
where m is the total number of loci. We assessed the significance of differences in the diversity
of the groups using permutation tests derived from the Strasser-Weber framework for condi-
tional inference procedures [54] and performed using the ‘coin’ package in R version 3.6.1
[55]. We used the general independence test function with asymptotic null distribution as
computed by the randomised quasi-Monte Carlo method [56].
Results and discussion
Sequencing overview
The sampling effort targeted 6 isolates for each of the 44 sites, but fewer were sequenced for 16
sites and none were sequenced for 20 sites. This was because of low or no concentration of E.
coli in the sample water (S1C1, S1C1U1/U3-6, S1C2, S1C2U2-3, S2C2U1, S2C3, S3C1,
S3C1U1-2/4, S4C1, S4C1U1-2, S5C1, S5C1U1, S6C1, S7C1) or high concentration of thermo-
tolerant coliforms (TTCs) preventing clean selection of 6 colonies (S1C2U1, S2C2U3,
S3C1U3, S4C2-A, S5C1U2, S5C1U3, S6C1U2, S7C1U2). Other issues preventing sequencing
of isolates included TTC contamination of the agar plate (1 isolate each from S3C2 and
S7C1U1); limited growth on the agar plate (1 isolate from S2C1U2); inadequate DNA extrac-
tion (1 isolate from S4C2-B); and sequencing library preparation failure (1 isolate from
S2C1U1).
A total of 125 libraries were successfully sequenced (see S2 Table for the full list), including
4 duplicates. The duplicates were consistent in phylogroup and sequence type. They are not
otherwise included in the results. Six of the libraries were contaminated with non-EscherichiaDNA, five from S1C1U2 contained Cronobacter sakazakii and one from S5C1U2 contained
Klebsiella pneumoniae. These libraries were removed from further analysis. The remaining 115
libraries had 628,219 reads per library on average (SD = 145 199), with mean read length of
177 bp (SD = 7), mean PHRED quality score of 31 (SD = 0.7), and mean depth of 23 (SD = 6).
BUSCO assessment of the genomes assembled from these 115 libraries identified 12 chimeric
genomes. Excluding the chimeric genomes, the reads from each library assembled into an
average of 246 contigs (SD = 141), with mean genome size of 4.8 Mbp (SD = 0.2).
Four of the chimeric genomes have multiple perfect allele matches for at least one of the
Achtman MLST genes, confirming them as chimeras of multiple MLSTs. A further three of
them have imperfect identity matches for multiple alleles (ranging from 86.5% to 99.8% iden-
tity match) and do not correspond to known sequence types. These 7 chimeras with multiple
MLSTs or imperfect allele matches were excluded from further analysis. The remaining 5 chi-
meric genomes contain only one match for each MLST gene with perfect identity matches for
each allele. These single MLST chimeric genomes are included in the ClermonTyping and
MLST results (total of 108 isolates) but were excluded from the pangenome and virulence and
AMR analyses (total of 103 isolates).
Pan-genome and phylogeny
The pan-genome of our isolates and the 14 references strains that we included for comparison
has a total of 25,526 genes, including 1794 core genes (in� 99% of the genomes), 1201 soft
core genes (in� 95%), 2152 shell genes (in� 15%), and 20,379 cloud genes (in < 15%). The
phylogenetic tree generated from the core genes (Fig 2) reflects the ClermonTyping
PLOS ONE The utility of E. coli as a drinking water quality indicator: Evidence from WGS
PLOS ONE | https://doi.org/10.1371/journal.pone.0245910 January 22, 2021 9 / 23

characterisation of our isolates except for isolate 2-8B (MLST 3519), which the in silico assays
classified as phylogroup A but was closer to B1 isolates in the Mash estimation and the phylo-
genetic tree. We note that the MLST 3519 entries in the Warwick Enterobase database are also
classified as phylogroup A with AxB1 lineage [22]. When the phylogenetic tree nodes are col-
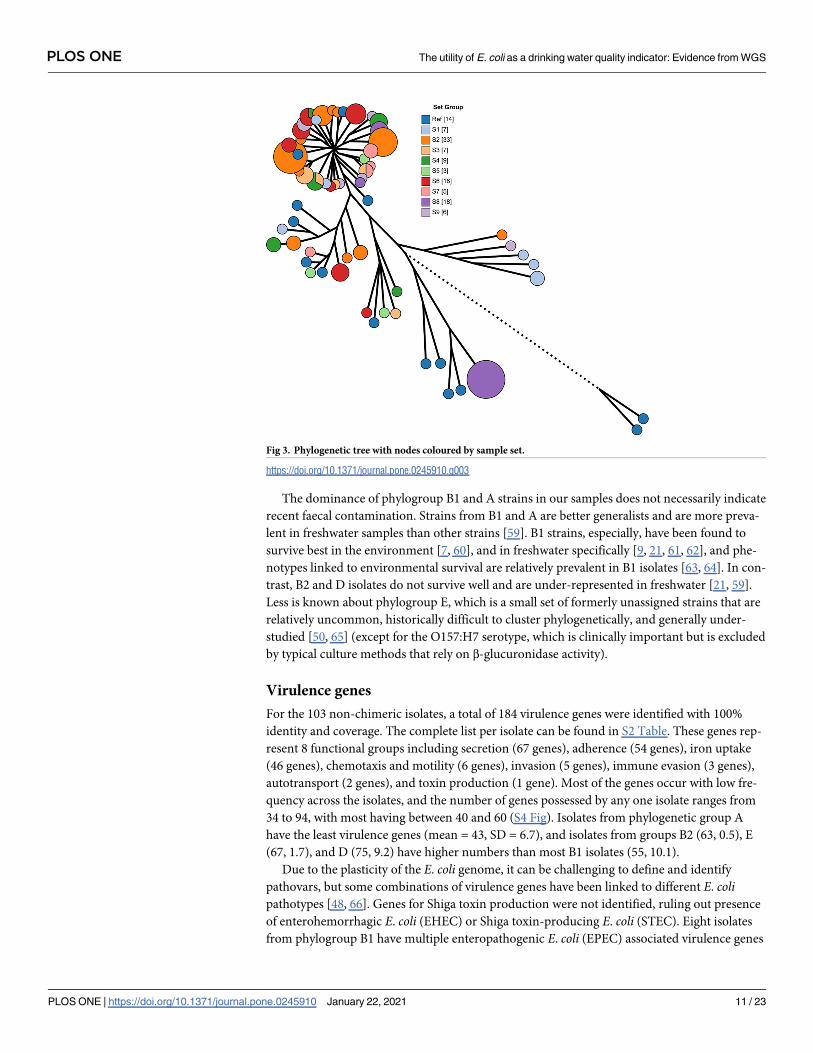
our-coded by set (Fig 3), we observe that the evolutionary similarity of the isolates is not
related to the water system that they came from.
The ClermonTyping analysis classified 69 isolates from 21 sites as belonging to phyloge-
netic group B1, making B1 the most represented group in the sample set. The second-most
prevalent is group A with 15 isolates from 8 sites, followed by group B2 with 14 isolates from 3
sites, group D with 6 isolates from 4 sites, and group E with 3 isolates from 3 sites. One isolate
from S3C2 could not be classified by ClermonTyping, but the phylogenetic tree indicates that
it belongs in phylogroup E (Fig 2). We did not identify cryptic clade E. coli, which are the
group most strongly associated with environmental origins [13, 34].
The association between phylogroup and strain origin varies based on diet, hygiene, animal
domestication status, and morphological and socioeconomic factors [8]. Some localised stud-
ies have found differences in the relative frequency of phylogroups by strain origin [57], but
others have not [58]. A review of results from both higher and lower income countries in
Europe, Africa, the Americas, Asia, and Australia [8] found that phylogroup B1 strains were
dominant in animals (41%), followed by A (22%), B2 (21%), and D strains (16%); whereas A
strains were most common in humans (40.5%), followed by B2 (25.5%) and then B1and D
strains (17% each). Phylogroup B1 strains, which may be more common in animal faeces than
in humans, comprised 78% of our PoC isolates and 50% of our PoU isolates. In contrast, A
strains, which may be more common in humans, comprised 4% of our PoC isolates and 22%
of our PoU isolates.
Fig 2. Phylogenetic tree with nodes coloured by phylogroup as determined by ClermonTyping. The bracketed
numbers in the image keys indicate the number of isolates in each category. The tree is scaled to 125% to make visual
parsing easier. Branches with length less than 0.0006 nucleotide substitutions per site were collapsed and the size of the
nodes is scaled to indicate the number of isolates each one encompasses. The branch length for E. fergusonnii was
shortened from 0.05 to 0.03 substitutions per site.
https://doi.org/10.1371/journal.pone.0245910.g002
PLOS ONE The utility of E. coli as a drinking water quality indicator: Evidence from WGS
PLOS ONE | https://doi.org/10.1371/journal.pone.0245910 January 22, 2021 10 / 23
The dominance of phylogroup B1 and A strains in our samples does not necessarily indicate
recent faecal contamination. Strains from B1 and A are better generalists and are more preva-
lent in freshwater samples than other strains [59]. B1 strains, especially, have been found to
survive best in the environment [7, 60], and in freshwater specifically [9, 21, 61, 62], and phe-
notypes linked to environmental survival are relatively prevalent in B1 isolates [63, 64]. In con-
trast, B2 and D isolates do not survive well and are under-represented in freshwater [21, 59].
Less is known about phylogroup E, which is a small set of formerly unassigned strains that are
relatively uncommon, historically difficult to cluster phylogenetically, and generally under-
studied [50, 65] (except for the O157:H7 serotype, which is clinically important but is excluded
by typical culture methods that rely on β-glucuronidase activity).
Virulence genes
For the 103 non-chimeric isolates, a total of 184 virulence genes were identified with 100%
identity and coverage. The complete list per isolate can be found in S2 Table. These genes rep-
resent 8 functional groups including secretion (67 genes), adherence (54 genes), iron uptake
(46 genes), chemotaxis and motility (6 genes), invasion (5 genes), immune evasion (3 genes),
autotransport (2 genes), and toxin production (1 gene). Most of the genes occur with low fre-
quency across the isolates, and the number of genes possessed by any one isolate ranges from
34 to 94, with most having between 40 and 60 (S4 Fig). Isolates from phylogenetic group A
have the least virulence genes (mean = 43, SD = 6.7), and isolates from groups B2 (63, 0.5), E
(67, 1.7), and D (75, 9.2) have higher numbers than most B1 isolates (55, 10.1).
Due to the plasticity of the E. coli genome, it can be challenging to define and identify
pathovars, but some combinations of virulence genes have been linked to different E. colipathotypes [48, 66]. Genes for Shiga toxin production were not identified, ruling out presence
of enterohemorrhagic E. coli (EHEC) or Shiga toxin-producing E. coli (STEC). Eight isolates
from phylogroup B1 have multiple enteropathogenic E. coli (EPEC) associated virulence genes
Fig 3. Phylogenetic tree with nodes coloured by sample set.
https://doi.org/10.1371/journal.pone.0245910.g003
PLOS ONE The utility of E. coli as a drinking water quality indicator: Evidence from WGS
PLOS ONE | https://doi.org/10.1371/journal.pone.0245910 January 22, 2021 11 / 23
for adherence, autotransport, invasion, iron uptake, motility, secretion, and toxin production,
but they lack key bundle-forming pili (bfp) and intimin (eae) genes, suggesting that they are
neither typical nor atypical EPEC [67]. Similarly, all twenty isolates from phylogroups D or B2
have multiple genes that are associated with uropathogenic E. coli (UPEC) and / or neonatal
meningitis-associated E. coli (NMEC), but all are missing key genes such as fdeC for adherence
or cnf1 for toxin production.
None of our isolates were identified as complete pathovars, but the presence of virulence
genes is informative, nonetheless, since virulence genes are more prevalent in strains isolated
from humans and the trend is conserved within phylogroups [8, 21]. Four phylogroup B1 iso-
lates have exceptionally high numbers of virulence genes (>80), suggesting that they are
human derived. All four were isolated from PoU sites (S3C1U3, S6C1U1, S6C1U3). Further-
more, the phylogroup B2 and D isolates possessed more virulence genes than most of the A
and B1 isolates. Taken together with evidence of their relatively poor survival in the environ-
ment [21, 59], this further supports that the PoC and PoU sites that had B2 or D isolates were
subject to recent contamination. This applies to three PoC sites that were poorly protected
from contamination (S1C1, an open reservoir; S8C1, an open dug well; S9C1, an unsealed con-
crete tank) and 4 household sites (S1C2U1, S2C1U2, S8C1U1, S8C1U2).
Antimicrobial resistance genes
For the 103 non-chimeric isolates, a total of 24 AMR genes were identified with 100% identity
and coverage, with every isolate having at least one AMR gene associated with resistance to
aminoglycosides (aph(6)-Id, aph(3'')-Ib, aadA1, aadA5, aac(3)-IId), beta-lactams (blaCTX-M-14, blaEC-5/8/13/15/18, blaTEM-1), erythromycin (mph(A)), quaternary ammonium com-
pounds (qacEdelta1), sulphonamides (sul1/2), tetracycline (tet(A), tet(B)), or trimethoprim
(dfrA1, dfrA5, dfrA14, dfrA17). Additionally, arsenite resistance gene arsB-mob, which codes
for an arsenite efflux pump, was found in 82 isolates. Arsenic resistance can develop in
response to use of arsenicals in antimicrobial drugs or in response to naturally occurring arse-
nic in the environment [68]. Concentrations of arsenic were low at the PoC sites, ranging from
0.04 to 0.95 ppb (measurement by inductively coupled plasma mass spectrometry; unpublished
data from the monthly monitoring programme). As such, geogenic arsenic is unlikely to
explain the prevalence of the arsB-mob gene. Furthermore, the absence of additional arsenic
resistance genes suggests that the presence of arsB-mob may not be related to drug use or geo-
genic arsenic, rather research into broad arsenic resistance in prokaryotes points to ancestral
gene clusters as a likely explanation [69].
Excluding arsB-mob, at least one AMR gene was found in each of the 103 isolates. Most of
the genes occur with low frequency across the isolates (see S2 Table for a list of AMR genes per
isolate), with 88 isolates having only 1 gene. AMR genes are transferrable between bacteria via
plasmids and environmental reservoirs of resistance genes are widely recognised, including
freshwater and drinking water systems [70, 71]. Nevertheless, multiple AMR genes may be
more common in E. coli strains sourced from human as opposed to animal or naturalised pop-
ulations [13, 72, 73]. Four PoU sites had isolates with multiple AMR genes including 3 phy-
logroup D isolates with 7 to 12 genes each (S1C2U1) and 6 phylogroup B1 isolates with 4 to 7
genes each (S2C2U1, S3C1U3, S7C1U1). Additionally, two PoC sites (S4C2 and S9C1, both
unsealed concrete tanks) had phylogroup B1 isolates with 4 to 7 AMR genes each.
Multi-locus sequence types
Using the Achtman MLST scheme, a total of 40 previously known sequence types were identi-
fied. As detailed in S3 Table, the number of entries for these MLSTs in the Warwick
PLOS ONE The utility of E. coli as a drinking water quality indicator: Evidence from WGS
PLOS ONE | https://doi.org/10.1371/journal.pone.0245910 January 22, 2021 12 / 23

Enterobase database (as of May 2020) ranged from 1 to 7763; 10 of the MLSTs had not previ-
ously been identified in Kenya; and 6 of the isolates have MLST allele combinations that were
not represented in the database. These new combinations are listed in S2 Table, we have
labelled them New_1 to New_6.
We refer to a system and its associated PoCs and PoUs as a set. The main discriminating
factor between the sequence types is the set that the isolate came from (Fig 4). The sequence
types generally do not overlap between sets, except in the cases of ST10, SW180, ST345, and
ST216. We are also interested in the overlap in sequence types between matched PoC and PoU
sites. There was no overlap for set 1, but sets 2, 6, and 8 did have overlap. For sets 3 and 5, no
E. coli was isolated from the PoCs (except S3C2, which is an unsealed concrete water tank at a
school that is unrepresentative of the wider distribution system). For sets 4, 7, and 9, E. coliwas only isolated from one site each.
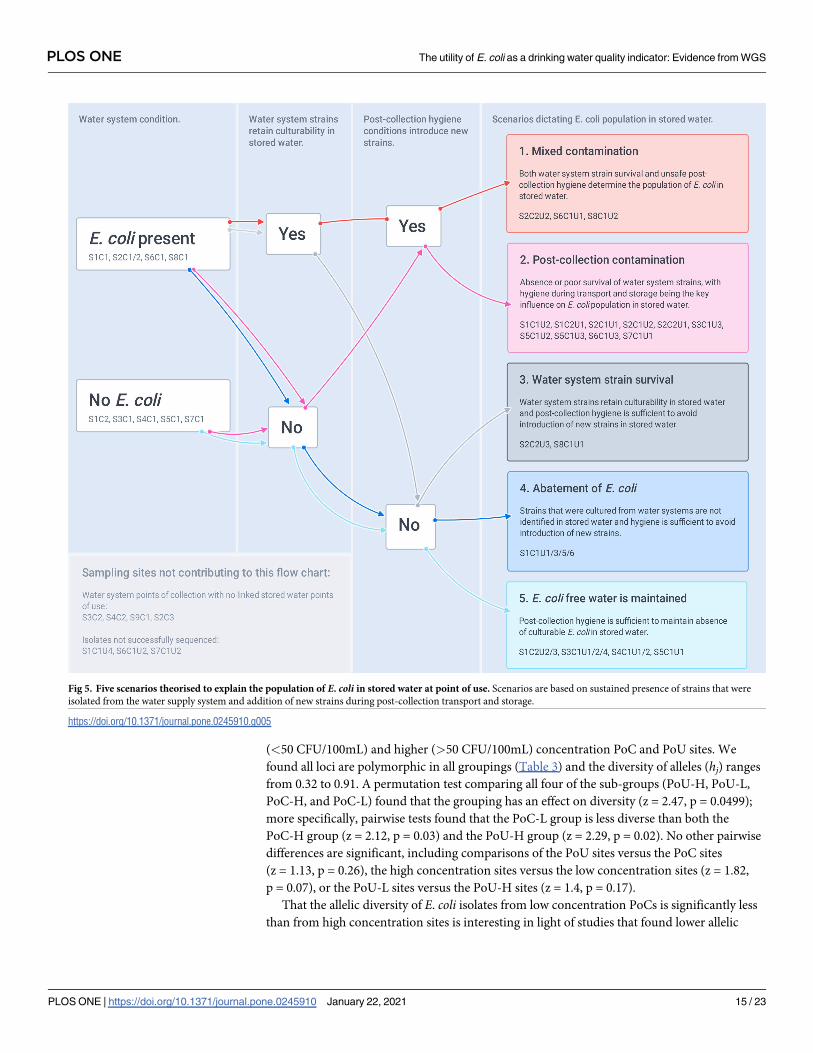
Logically, five scenarios may dictate the population of E. coli in PoU water, these are permu-
tations of three factors: presence or absence of E. coli in the PoC water, whether PoC strains
retain culturability in PoU water, and whether post-collection hygiene conditions introduce
new strains. Although the isolates analysed in our study allow only a partial view of the diver-
sity of E. coli strains at each sampling site, comparison of the MLSTs isolated from matched
PoC and PoU sites suggests that multiple PoUs exemplified each of the five scenarios (Fig 5).
In scenarios 3, 4, and 5 no additional health hazard is introduced at the household level: E.
coli in PoU water is determined by PoC water quality and persistence or abatement of strains
in storage containers. Abatement of E. coli does not equate to abatement of pathogens
(decreased health risk), so PoC results should be prioritised in these scenarios. In scenarios 1
and 2, inadequate hygiene at the household level does influence PoU E. coli population, either
as the exclusive driver (scenario 2) or in combination with persistence of PoC E. coli strains
(scenario 1). Only five of the households that we sampled had overlap in MLSTs between PoC
and PoU (scenarios 1 and 3), this points to strain persistence but is not evidence of regrowth.
Nevertheless, the results are interesting in light of research that a) found increase in E. colibetween PoC and PoU was unrelated to household-level sanitary or hygiene factors [31] and
b] demonstrated regrowth in household storage containers within 48 hours [75]. Conversely,
Scenario 2, post-collection contamination, appears to be the most common for the households
that we sampled, which is consistent with studies that relate PoU water quality deterioration to
unsafe storage [28, 76].
The health implications of post-collection contamination are debated. In households like
those in our study area, with low levels of access to sanitation and hygiene facilities, E. coli and
other faecal indicators and pathogens are widespread on surfaces and in food produce [77]
and it is likely that strains circulate between humans, animals, and the domestic environment
[8, 78]. Large-scale randomised control trials investigating the impact of water, sanitation, and
hygiene interventions on health outcomes for communities in Kenya, Bangladesh and else-
where have demonstrated the importance of considering multiple faecal exposure pathways
[79]. In a household setting, where there are multiple pathways for exposure to pathogens that
are circulating in the household environment, focussing on only one of these pathways (stored
water) is unlikely to reduce the burden of enteric disease in the household [80, 81]. In contrast,
a contaminated water distribution system may pose a unique threat as a pathway for spreading
disease between households and, in some cases, between communities.
Allelic diversity
In addition to directly comparing MLSTs, we queried the differences between sites further by
using the MLST genes to analyse differences in the diversity of the isolates from the lower
PLOS ONE The utility of E. coli as a drinking water quality indicator: Evidence from WGS
PLOS ONE | https://doi.org/10.1371/journal.pone.0245910 January 22, 2021 13 / 23

Fig 4. Heatmap of phylogenetic groups and MLSTs identified for each sampling site. Colour gradients indicate number of isolates. Bar chart annotations
show total counts of isolates per MLST (right) and per site (top). The heatmap was created with R package ‘ComplexHeatmap’ [74].
https://doi.org/10.1371/journal.pone.0245910.g004
PLOS ONE The utility of E. coli as a drinking water quality indicator: Evidence from WGS
PLOS ONE | https://doi.org/10.1371/journal.pone.0245910 January 22, 2021 14 / 23
(<50 CFU/100mL) and higher (>50 CFU/100mL) concentration PoC and PoU sites. We
found all loci are polymorphic in all groupings (Table 3) and the diversity of alleles (hj) ranges
from 0.32 to 0.91. A permutation test comparing all four of the sub-groups (PoU-H, PoU-L,
PoC-H, and PoC-L) found that the grouping has an effect on diversity (z = 2.47, p = 0.0499);
more specifically, pairwise tests found that the PoC-L group is less diverse than both the
PoC-H group (z = 2.12, p = 0.03) and the PoU-H group (z = 2.29, p = 0.02). No other pairwise
differences are significant, including comparisons of the PoU sites versus the PoC sites
(z = 1.13, p = 0.26), the high concentration sites versus the low concentration sites (z = 1.82,
p = 0.07), or the PoU-L sites versus the PoU-H sites (z = 1.4, p = 0.17).
That the allelic diversity of E. coli isolates from low concentration PoCs is significantly less
than from high concentration sites is interesting in light of studies that found lower allelic
Fig 5. Five scenarios theorised to explain the population of E. coli in stored water at point of use. Scenarios are based on sustained presence of strains that were
isolated from the water supply system and addition of new strains during post-collection transport and storage.
https://doi.org/10.1371/journal.pone.0245910.g005
PLOS ONE The utility of E. coli as a drinking water quality indicator: Evidence from WGS
PLOS ONE | https://doi.org/10.1371/journal.pone.0245910 January 22, 2021 15 / 23

diversity and greater genome similarity in samples from environmental sources compared to
samples from faecal sources [13, 82, 83]. The comparison suggests that PoC sites with low con-
centration of E. coli may be more associated with naturalised E. coli. Although not significantly
different from the high concentration sites, the low concentration PoU sites also had lower
allelic diversity and, therefore, may have been less affected by recent contamination. This inter-
pretation of allelic diversity supports use of E. coli risk categories [26] and aligns with research
findings that indicate a threshold effect, with significant increase in diarrhoeal disease burden
only associated with high concentrations (>1000/100 mL) of E. coli [84].
Interpretations of E. coli results, however, should not rely exclusively on concentration: the
health implications of differences in E. coli concentrations are context dependent and naturali-
sation is not the only process that confuses the relationship between E. coli and health hazard.
For example, the water for set 1 is sourced from an open reservoir system, which has animal
and human activity in the catchment area and does not include treatment. Thus, the low con-
centration of E. coli in S1C1, and absence in S1C2, may be better interpreted as indicating
poor survival of E. coli in the reservoir–likely due to a combination of predation, competition,
UV radiation, and absence of surfaces for biofilm formation [9, 10]–rather than absence of fae-
cal contamination. Furthermore, one of the isolates from S1C1 was from phylogroup D with
numerous virulence genes, a likely indicator of recent human faecal contamination. Addition-
ally, for sets 3 and 5 the water is chlorinated in the distribution system, which gives more assur-
ance of safety, but some pathogens are more resistant to chlorine than E. coli [26]. Generally,
concentrations of E. coli do not correlate with concentrations of pathogens: the transport and
survival patterns of E. coli vary considerably from those of faecal pathogens, particularly
viruses and protozoa which tend to be more robust [25]–so the likelihood that water has been
contaminated with faecal matter must be prioritised over E. coli sampling results.
Summary and recommendations
Although definitive attribution is not possible, the strains that most likely originated from
human and/or recent faeces were found in poorly protected PoC water (4 sites including an
unfenced open reservoir, unfenced open dug well, and two unsealed concrete tanks) or PoU
water (12 out of 30 PoU sites). These were the 34 isolates from phylogroups A, B2, and D, and
the 16 from phylogroup B1 with >80 virulence genes or multiple AMR genes. The other B1
isolates with fewer virulence genes account for almost half of our sample (48%), likely because
B1 strains are generally better adapted to the freshwater environment. Allelic diversity com-
parisons suggest that naturalised E. coli may be particularly relevant at PoC sites with lower E.
Table 3. Genetic diversity of alleles (hj) and average genetic diversity (H) for groupings based on source type (PoC vs PoU) and E. coli concentration level (higher or
lower than 50 MPN/100mL).
Groups H Diversity of Alleles (hj)
adk fumC gyrB icd mdh purA recAAll 0.80 0.63 0.83 0.90 0.87 0.85 0.70 0.81
PoU 0.82 0.72 0.88 0.88 0.89 0.86 0.70 0.82
PoC 0.76 0.51 0.76 0.90 0.84 0.81 0.71 0.76
Higher 0.82 0.74 0.84 0.89 0.87 0.84 0.77 0.80
Lower 0.70 0.44 0.78 0.84 0.82 0.80 0.54 0.64
PoU-H 0.81 0.79 0.84 0.85 0.85 0.82 0.80 0.74
PoU-L 0.72 0.52 0.85 0.81 0.87 0.78 0.44 0.76
PoC-H 0.81 0.65 0.80 0.91 0.89 0.86 0.73 0.81
PoC-L 0.62 0.32 0.67 0.76 0.77 0.75 0.62 0.45
https://doi.org/10.1371/journal.pone.0245910.t003
PLOS ONE The utility of E. coli as a drinking water quality indicator: Evidence from WGS
PLOS ONE | https://doi.org/10.1371/journal.pone.0245910 January 22, 2021 16 / 23

coli concentrations (<50 / 100mL). And for PoU sites, analysis based on five theorised PoU E.
coli population scenarios underscores the difficulty of interpreting health risk from grab
samples.
Placing our findings in relation to the literature, we develop two main recommendations.
Firstly, we emphasise the inadequacy of judging hazard based on single E. coli samples at either
PoC or PoU. Tracking sanitary conditions and E. coli concentrations over time can inform a
more reliable understanding of hazard. In addition to E. coli sampling, rapid, in situ measure-
ments such as turbidity or tryptophan-like fluorescence may be useful for high frequency
tracking of water quality variability; although they have their own limitations, these measures
can indicate process changes in water systems including, for example, response to rainfall
events [85, 86], which may help differentiate between naturalised E. coli and contamination
events. And regardless of water quality measures, sanitary inspection is needed to confirm the
current and prospective safety of a system. Studies have found weak or no correlations between
sanitary inspection scores and microbial water quality as measured by faecal indicator bacteria
(FIB) [87], but this does not diminish the importance of the inspections given what we know
of FIB results having multiple possible explanations.
Secondly, we recommend that PoC and PoU E. coli samples should not be compared
directly in terms of their health hazard implications. E. coli in PoC water (especially when con-
centration is high) should be prioritised for interventions with a focus on water safety manage-
ment to provide safe water at the PoC. On the other hand, PoU samples are more difficult to
interpret because uncertainty is introduced by variability in: PoC quality, persistence of strains,
and post-collection hygiene. Positive E. coli samples at household level could indicate no addi-
tional health hazard but, conservatively, they should be interpreted as indicating a hazardous
household environment, generally. Effective intervention at the household-level requires a
multi-pathway approach that goes beyond water treatment and safe storage.
Limitations and further research
The growth of E. coli is influenced by physicochemical characteristics of water such as nutrient
levels, salinity, and temperature, as well as microbiome characteristics such as competition and
predation [9, 10]. But given the sample size of our study, we are not able to query the impact of
these factors on the balance between growth and die-off of E. coli strains. Similarly, our study
did not focus on temporal change in E. coli populations. Only one site was sampled twice:
S4C2 had no overlap in MLSTs between the two samples taken two weeks apart. This suggests
that continual contamination is driving the population dynamics at this site rather than persis-
tent dominance of strains in biofilms or otherwise. The site is a poorly protected concrete tank
with multiple openings situated in a market square. Furthermore, the water at the site is saline
(median 4.1 mS/cm), and salinity is known to inhibit E. coli survival in water [88]. Thus, the
conditions at this site seem to enable ongoing input of new E. coli whilst discouraging E. colisurvival and growth, which could explain the lack of overlap in the time-separated samples. A
larger study incorporating a temporal dimension would improve insight into E. coli population
dynamics in water systems over time–including the impact of sanitary conditions and physio-
chemical and microbiome characteristics. Additionally, a larger study would enable better
characterisation of strain diversity within samples if more isolates per sample were analysed
(S3 Fig).
Another avenue for further work is prompted by the prevalence of phylogroup B1 isolates
in our samples, given their association with animal faeces [8]. Multiple studies have now
emphasised the importance of animal management as a key sanitary factor influencing drink-
ing water safety [89–91]; however, the importance of zoonotic transmission is not well
PLOS ONE The utility of E. coli as a drinking water quality indicator: Evidence from WGS
PLOS ONE | https://doi.org/10.1371/journal.pone.0245910 January 22, 2021 17 / 23

established in the water, sanitation and hygiene (WASH) literature and recent models relating
health outcomes to WASH factors have excluded zoonotic pathways in part due “to data scar-
city on animal faeces and animal presence” [92 p279]. Further work in this space would be
valuable.
Finally, the limitations of genomic characterisation for informing on strain origin is a key
constraint of this study–we are able to comment on the likelihood of isolates being naturalised
or recently sourced from faeces but cannot definitively identify them as such. To-date there
have been few studies focussing on genomic characterisation of E. coli from drinking water
supplies, but as the collective dataset grows it will enable metanalyses and more robust statis-
tics that will improve our ability to distinguish naturalised strains and better understand the
origins, diversity, and dynamics of E. coli populations in water supplies.
Supporting information
S1 Fig. Box-and-whisker plot of monitoring programme pH results for selected PoCs. The
boxes show median values and span lower to upper quartiles, the whiskers show the lowest
and highest datums within 1.5 times the interquartile range.
(TIFF)
S2 Fig. Box-and-whisker plot of monitoring programme conductivity results for selected
PoCs. The boxes show median values and span lower to upper quartiles, the whiskers show the
lowest and highest datums within 1.5 times the interquartile range.
(TIFF)
S3 Fig. Likelihood of strain selection given number of selected colonies and strain preva-
lence.
(TIFF)
S4 Fig. Stacked bar chart displaying the number of virulence genes per isolate by phy-
logroup.
(TIFF)
S1 Table. List of water sets. Includes points of collection (PoC) and points of use (PoU) with
median E. coli, pH and conductivity (EC) from monitoring programme results.
(XLSX)
S2 Table. List of sequenced isolates. Includes Sequencing, Assembly, Phylogroup, MLST, Vir-
ulome, and Resistome Results.
(XLSX)
S3 Table. List of identified MLSTs grouped by water system.
(XLSX)
Acknowledgments
The authors thank Cliff Nyaga, Musenya Sammy, Mbogo Mwaniki and the rest of the Rural
Focus Limited and REACH Kenya teams for their support in making the fieldwork possible.
Author Contributions
Conceptualization: Saskia Nowicki, Katrina J. Charles.
Data curation: Saskia Nowicki, Etienne P. de Villiers.
Formal analysis: Saskia Nowicki, Etienne P. de Villiers, George Githinji.
PLOS ONE The utility of E. coli as a drinking water quality indicator: Evidence from WGS
PLOS ONE | https://doi.org/10.1371/journal.pone.0245910 January 22, 2021 18 / 23

Funding acquisition: Saskia Nowicki, Katrina J. Charles.
Investigation: Saskia Nowicki.
Methodology: Saskia Nowicki, Zaydah R. deLaurent, Etienne P. de Villiers, George Githinji.
Project administration: Saskia Nowicki.
Resources: Saskia Nowicki, Zaydah R. deLaurent.
Software: Etienne P. de Villiers.
Supervision: Katrina J. Charles.
Validation: Saskia Nowicki, Etienne P. de Villiers.
Visualization: Saskia Nowicki.
Writing – original draft: Saskia Nowicki.
Writing – review & editing: Saskia Nowicki, Zaydah R. deLaurent, Etienne P. de Villiers,
George Githinji, Katrina J. Charles.
References1. Chaudhuri RR, Henderson IR. The evolution of the Escherichia coli phylogeny. Infect Genet Evol. 2012;
12(2):214–26. https://doi.org/10.1016/j.meegid.2012.01.005 PMID: 22266241
2. Leclerc H, Mossel D a, Edberg SC, Struijk CB. Advances in the bacteriology of the coliform group: their
suitability as markers of microbial water safety. Annu Rev Microbiol. 2001; 55:201–34. https://doi.org/
10.1146/annurev.micro.55.1.201 PMID: 11544354
3. Alm EW, Walk ST, Gordon DM. The Niche of Escherichia coli. In: Walk ST, Feng PCH, Whittam TS, edi-
tors. Population Genetics of Bacteria: a Tribute to Thomas S Whittam. Washington, D.C.: ASM Press;
2011. p. 69–89.
4. Savageau MA. Escherichia coli Habitats, Cell Types, and Molecular Mechanisms of Gene Control. Am
Nat. 1983; 122(6):732–44.
5. Touchon M, Hoede C, Tenaillon O, Barbe V, Baeriswyl S, Bidet P, et al. Organised genome dynamics in
the Escherichia coli species results in highly diverse adaptive paths. PLoS Genet. 2009; 5(1). https://
doi.org/10.1371/journal.pgen.1000344 PMID: 19165319
6. Rasko DA, Rosovitz MJ, Myers GSA, Mongodin EF, Fricke WF, Gajer P, et al. The pangenome struc-
ture of Escherichia coli: Comparative genomic analysis of E. coli commensal and pathogenic isolates. J
Bacteriol. 2008; 190(20):6881–93. https://doi.org/10.1128/JB.00619-08 PMID: 18676672
7. Bergholz PW, Noar JD, Buckley DH. Environmental patterns are imposed on the population structure of
Escherichia coli after fecal deposition. Appl Environ Microbiol. 2011; 77(1):211–9. https://doi.org/10.
1128/AEM.01880-10 PMID: 21075897
8. Tenaillon O, Skurnik D, Picard B, Denamur E. The population genetics of commensal Escherichia coli.
Nat Rev Microbiol. 2010; 8(3):207–17. https://doi.org/10.1038/nrmicro2298 PMID: 20157339
9. Berthe T, Ratajczak M, Clermont O, Denamur E, Petit F. Evidence for coexistence of distinct Escheri-
chia coli populations in various aquatic environments and their survival in estuary water. Appl Environ
Microbiol. 2013; 79(15):4684–93. https://doi.org/10.1128/AEM.00698-13 PMID: 23728810
10. Ishii S, Sadowsky MJ. Escherichia coli in the environment: Implications for water quality and human
health. Microbes Environ. 2008; 23(2):101–8. https://doi.org/10.1264/jsme2.23.101 PMID: 21558695
11. Luby SP, Halder AK, Huda TM, Unicomb L, Islam MS, Arnold BF, et al. Microbiological contamination of
drinking water associated with subsequent child diarrhea. Am J Trop Med Hyg. 2015; 93(5):904–11.
https://doi.org/10.4269/ajtmh.15-0274 PMID: 26438031
12. Ferguson AS, Mailloux BJ, Ahmed KM, Van Geen A, McKay LD, Culligan PJ. Hand-pumps as reser-
voirs for microbial contamination of well water. J Water Health. 2011; 9(4):708–17. https://doi.org/10.
2166/wh.2011.106 PMID: 22048430
13. Devane ML, Moriarty E, Weaver L, Cookson A, Gilpin B. Fecal indicator bacteria from environmental
sources; strategies for identification to improve water quality monitoring. Water Res. 2020; 185. https://
doi.org/10.1016/j.watres.2020.116204 PMID: 32745743
PLOS ONE The utility of E. coli as a drinking water quality indicator: Evidence from WGS
PLOS ONE | https://doi.org/10.1371/journal.pone.0245910 January 22, 2021 19 / 23

14. Power ML, Littlefield-Wyer J, Gordon DM, Veal DA, Slade MB. Phenotypic and genotypic characteriza-
tion of encapsulated Escherichia coli isolated from blooms in two Australian lakes. Environ Microbiol.
2005; 7(5):631–40. https://doi.org/10.1111/j.1462-2920.2005.00729.x PMID: 15819845
15. Byappanahalli MN, Whitman RL, Shively DA, Sadowsky MJ, Ishii S. Population structure, persistence,
and seasonality of autochthonous Escherichia coli in temperate, coastal forest soil from a Great Lakes
watershed. Environ Microbiol. 2006; 8(3):504–13. https://doi.org/10.1111/j.1462-2920.2005.00916.x
PMID: 16478456
16. Texier S, Prigent-Combaret C, Gourdon MH, Poirier MA, Faivre P, Dorioz JM, et al. Persistence of Cul-
turable Escherichia coli Fecal Contaminants in Dairy Alpine Grassland Soils. J Environ Qual. 2008; 37
(6):2299–310. https://doi.org/10.2134/jeq2008.0028 PMID: 18948484
17. Gordon DM, Bauer S, Johnson JR. The genetic structure of Escherichia coli populations in primary and
secondary habitats. Microbiology. 2002; 148(5):1513–22. https://doi.org/10.1099/00221287-148-5-
1513 PMID: 11988526
18. Nandakafle G, Huegen T, Potgieter SC, Steenkamp E, Venter SN, Brozel VS. Niche preference of
Escherichia coli in a peri-urban pond ecosystem. bioRxiv [Preprint] 2020 [cited 2020 December 15].
Available from: https://www.biorxiv.org/content/10.1101/2020.01.30.926667v1
19. Whittam TS. Clonal dynamics of Escherichia coli in its natural habitat. Antonie Van Leeuwenhoek.
1989; 55(1):23–32. https://doi.org/10.1007/BF02309616 PMID: 2662899
20. Zhi S, Banting G, Stothard P, Ashbolt NJ, Checkley S, Meyer K, et al. Evidence for the evolution, clonal
expansion and global dissemination of water treatment-resistant naturalized strains of Escherichia coli
in wastewater. Water Res. 2019; 156:208–22. https://doi.org/10.1016/j.watres.2019.03.024 PMID:
30921537
21. Touchon M, Perrin A, de Sousa JAM, Vangchhia B, Burn S, O’Brien CL, et al. Phylogenetic background
and habitat drive the genetic diversification of Escherichia coli. PLoS Genet. 2020; 16(6). https://doi.org/
10.1371/journal.pgen.1008866 PMID: 32530914
22. Zhou Z, Alikhan NF, Mohamed K, Fan Y, Achtman M. The EnteroBase user’s guide, with case studies
on Salmonella transmissions, Yersinia pestis phylogeny, and Escherichia core genomic diversity.
Genome Res [Internet]. 2020; 30(1):138–52. Available from: http://enterobase.warwick.ac.uk/ https://
doi.org/10.1101/gr.251678.119 PMID: 31809257
23. Blyton MDJ, Gordon DM. Genetic attributes of E. coli isolates from chlorinated drinking water. PLoS
One. 2017; 12(1):1–14. https://doi.org/10.1371/journal.pone.0169445 PMID: 28107364
24. Jang J, Hur HG, Sadowsky MJ, Byappanahalli MN, Yan T, Ishii S. Environmental Escherichia coli: ecol-
ogy and public health implications—a review. J Appl Microbiol. 2017; 123(3):570–81. https://doi.org/10.
1111/jam.13468 PMID: 28383815
25. Charles KJ, Nowicki S, Bartram JK. A framework for monitoring the safety of water services: from mea-
surements to security. npj Clean Water. 2020; 3(36):1–6.
26. WHO. Guidelines for drinking-water quality: fourth edition incorporating the first addendum [Internet].
4th ed. Geneva, Switzerland: WHO Press; 2017. Available from: http://apps.who.int/iris/bitstream/
handle/10665/254637/9789241549950-eng.pdf;jsessionid=
2E1B7E42B16F03AB88E253B119976D63?sequence=1
27. JMP. Water quality monitoring [Internet]. UNICEF WHO Joint Monitoring Programme; 2020. Available
from: https://washdata.org/monitoring/drinking-water/water-quality-monitoring
28. Sobsey MD. Managing Water in the Home: Accelerated Health Gains from Improved Water Supply
[Internet]. World Health Organization; 2002. Available from: http://www.bvsde.paho.org/bvsacd/who/
sobs.pdf
29. Wright J, Gundry S, Conroy R. Household drinking water in developing countries: A systematic review
of microbiological contamination between source and point-of-use. Trop Med Int Heal. 2004; 9(1):106–
17. https://doi.org/10.1046/j.1365-3156.2003.01160.x PMID: 14728614
30. Shields KF, Bain RES, Cronk R, Wright JA, Bartram J. Association of supply type with fecal contamina-
tion of source water and household stored drinking water in developing countries: A bivariate meta-anal-
ysis. Environ Health Perspect. 2015; 123(12):1222–31. https://doi.org/10.1289/ehp.1409002 PMID:
25956006
31. Trevett AF, Carter RC, Tyrrel SF. Water quality deterioration: A study of household drinking water qual-
ity in rural Honduras. Int J Environ Health Res. 2004; 14(4):273–83. https://doi.org/10.1080/
09603120410001725612 PMID: 15369992
32. Trevett AF, Carter RC, Tyrrel SF. The importance of domestic water quality management in the context
of faecal-oral disease transmission. J Water Health. 2005; 3(3):259–70. https://doi.org/10.2166/wh.
2005.037 PMID: 16209030
PLOS ONE The utility of E. coli as a drinking water quality indicator: Evidence from WGS
PLOS ONE | https://doi.org/10.1371/journal.pone.0245910 January 22, 2021 20 / 23
33. Burke-Gaffney H. The Classification of The Colon-Aerogenes Group of Bacteria in Relation to their Hab-
itat and its Application to the Sanitary Examination of Water Supplies in the Tropics and in Temperate
Climates: A Comparative Study of 2500 Cultures. J Hyg (Lond). 1932; 32(1):85–131. https://doi.org/10.
1017/s002217240001785x PMID: 20475124
34. Ingle DJ, Clermont O, Skurnik D, Denamur E, Walk ST, Gordon DM. Biofilm Formation by and Thermal
Niche and Virulence Characteristics of Escherichia spp. Appl Environ Microbiol. 2011; 77(8):2695–700.
https://doi.org/10.1128/AEM.02401-10 PMID: 21335385
35. Matthews RL, Tung R. Broader incubation temperature tolerances for microbial drinking water testing
with enzyme substrate tests. J Water Health. 2014; 12(1):113–21. https://doi.org/10.2166/wh.2013.076
PMID: 24642438
36. Seemann T, Goncalves da Silva A, Bulach D, Schultz M, Kwong J, Howden B. Nullarbor [Internet].
Github. [cited 2020 Sep 15]. Available from: https://github.com/tseemann/nullarbor
37. Bolger AM, Lohse M, Usadel B. Trimmomatic: A flexible trimmer for Illumina sequence data. Bioinfor-
matics. 2014; 30(15):2114–20. https://doi.org/10.1093/bioinformatics/btu170 PMID: 24695404
38. Wood DE, Salzberg SL. Kraken: Ultrafast metagenomic sequence classification using exact align-
ments. Genome Biol. 2014; 15(3). https://doi.org/10.1186/gb-2014-15-3-r46 PMID: 24580807
39. Bankevich A, Nurk S, Antipov D, Gurevich AA, Dvorkin M, Kulikov AS, et al. SPAdes: A new genome
assembly algorithm and its applications to single-cell sequencing. J Comput Biol. 2012; 19(5):455–77.
https://doi.org/10.1089/cmb.2012.0021 PMID: 22506599
40. Beghain J, Bridier-Nahmias A, Le Nagard H, Denamur E, Clermont O. ClermonTyping: An easy-to-use
and accurate in silico method for Escherichia genus strain phylotyping. Microb Genomics. 2018; 4(7):1–
8.
41. Clermont O, Dixit OVA, Vangchhia B, Condamine B, Dion S, Bridier-Nahmias A, et al. Characterization
and rapid identification of phylogroup G in Escherichia coli, a lineage with high virulence and antibiotic
resistance potential. Environ Microbiol. 2019; 21(8):3107–17. https://doi.org/10.1111/1462-2920.14713
PMID: 31188527
42. Simão FA, Waterhouse RM, Ioannidis P, Kriventseva E V., Zdobnov EM. BUSCO: Assessing genome
assembly and annotation completeness with single-copy orthologs. Bioinformatics. 2015; 31(19):3210–
2. https://doi.org/10.1093/bioinformatics/btv351 PMID: 26059717
43. Waterhouse RM, Tegenfeldt F, Li J, Zdobnov EM, Kriventseva E V. OrthoDB: A hierarchical catalog of
animal, fungal and bacterial orthologs. Nucleic Acids Res. 2013; 41(D1):358–65. https://doi.org/10.
1093/nar/gks1116 PMID: 23180791
44. Page AJ, Cummins CA, Hunt M, Wong VK, Reuter S, Holden MTG, et al. Roary: Rapid large-scale pro-
karyote pan genome analysis. Bioinformatics. 2015; 31(22):3691–3. https://doi.org/10.1093/
bioinformatics/btv421 PMID: 26198102
45. Price MN, Dehal PS, Arkin AP. FastTree 2—Approximately maximum-likelihood trees for large align-
ments. PLoS One. 2010; 5(3). https://doi.org/10.1371/journal.pone.0009490 PMID: 20224823
46. Zhou Z, Alikhan NF, Sergeant MJ, Luhmann N, Vaz C, Francisco AP, et al. Grapetree: Visualization of
core genomic relationships among 100,000 bacterial pathogens. Genome Res. 2018; 28(9):1395–404.
https://doi.org/10.1101/gr.232397.117 PMID: 30049790
47. Seemann T. Abricate [Internet]. Github. [cited 2020 Sep 15]. Available from: https://github.com/
tseemann/abricate
48. Chen L, Zheng D, Liu B, Yang J, Jin Q. VFDB 2016: Hierarchical and refined dataset for big data analy-
sis—10 years on. Nucleic Acids Res. 2016; 44(D1):D694–7. https://doi.org/10.1093/nar/gkv1239
PMID: 26578559
49. Feldgarden M, Brover V, Haft DH, Prasad AB, Slotta DJ, Tolstoy I, et al. Validating the AMRFinder tool
and resistance gene database by using antimicrobial resistance genotype-phenotype correlations in a
collection of isolates. Antimicrob Agents Chemother. 2019; 63(11):1–20.
50. Wirth T, Falush D, Lan R, Colles F, Mensa P, Wieler LH, et al. Sex and virulence in Escherichia coli: An
evolutionary perspective. Mol Microbiol. 2006; 60(5):1136–51. https://doi.org/10.1111/j.1365-2958.
2006.05172.x PMID: 16689791
51. Sahl JW, Matalka MN, Rasko DA. Phylomark, a tool to identify conserved phylogenetic markers from
whole-genome alignments. Appl Environ Microbiol. 2012; 78(14):4884–92. https://doi.org/10.1128/
AEM.00929-12 PMID: 22582056
52. Larsen M V., Cosentino S, Rasmussen S, Friis C, Hasman H, Marvig RL, et al. Multilocus sequence typ-
ing of total-genome-sequenced bacteria. J Clin Microbiol. 2012; 50(4):1355–61. https://doi.org/10.1128/
JCM.06094-11 PMID: 22238442
53. Nei M. Estimation of average heterozygosity and genetic distance from a small number of individuals.
Genetics. 1978; 89(3):583–90. PMID: 17248844
PLOS ONE The utility of E. coli as a drinking water quality indicator: Evidence from WGS
PLOS ONE | https://doi.org/10.1371/journal.pone.0245910 January 22, 2021 21 / 23

54. Strasser H, Weber C. On the Asymptotic Theory of Permutation Statistics. Math Methods Stat. 1999; 8
(2):220–50.
55. Hothorn T, Hornik K, van de Wiel MA, Zeileis A. Implementing a class of permutation tests: The coin
package. J Stat Softw [Internet]. 2008; 28(8). Available from: https://www.jstatsoft.org/article/view/
v028i08
56. Genz A, Bretz F. Computation of Multivariate Normal and t Probabilities. Heidelberg, Germany:
Springer-Verlag; 2009.
57. Smati M, Clermont O, Bleibtreu A, Fourreau F, David A, Daubie AS, et al. Quantitative analysis of com-
mensal Escherichia coli populations reveals host-specific enterotypes at the intra-species level. Micro-
biologyopen. 2015; 4(4):604–15. https://doi.org/10.1002/mbo3.266 PMID: 26033772
58. Julian TR, Islam MA, Pickering AJ, Roy S, Fuhrmeister ER, Ercumen A, et al. Genotypic and phenotypic
characterization of Escherichia coli isolates from feces, hands, and soils in rural Bangladesh via the
Colilert Quanti-Tray System. Appl Environ Microbiol. 2015; 81(5):1735–43. https://doi.org/10.1128/
AEM.03214-14 PMID: 25548044
59. Donnenberg MS. Escherichia coli: Pathotypes and Principles of Pathogenesis. 2nd ed. Donnenberg
MS, editor. Academic Press; 2013.
60. Walk ST, Alm EW, Calhoun LM, Mladonicky JM, Whittam TS. Genetic diversity and population structure
of Escherichia coli isolated from freshwater beaches. Environ Microbiol. 2007; 9(9):2274–88. https://
doi.org/10.1111/j.1462-2920.2007.01341.x PMID: 17686024
61. Ratajczak M, Laroche E, Berthe T, Clermont O, Pawlak B, Denamur E, et al. Influence of hydrological
conditions on the Escherichia coli population structure in the water of a creek on a rural watershed.
BMC Microbiol. 2010; 10. https://doi.org/10.1186/1471-2180-10-222 PMID: 20723241
62. Orsi RH, Stoppe NC, Sato MIZ, Ottoboni LMM. Identification of Escherichia coli from groups A, B1, B2
and D in drinking water in Brazil. J Water Health. 2007; 5(2):323–7. https://doi.org/10.2166/wh.2007.
028 PMID: 17674580
63. White AP, Sibley KA, Sibley CD, Wasmuth JD, Schaefer R, Surette MG, et al. Intergenic sequence
comparison of Escherichia coli isolates reveals lifestyle adaptations but not host specificity. Appl Envi-
ron Microbiol. 2011; 77(21):7620–32. https://doi.org/10.1128/AEM.05909-11 PMID: 21908635
64. Meric G, Kemsley EK, Falush D, Saggers EJ, Lucchini S. Phylogenetic distribution of traits associated
with plant colonization in Escherichia coli. Environ Microbiol. 2013; 15(2):487–501. https://doi.org/10.
1111/j.1462-2920.2012.02852.x PMID: 22934605
65. Clermont O, Christenson JK, Denamur E, Gordon DM. The Clermont Escherichia coli phylo-typing
method revisited: Improvement of specificity and detection of new phylo-groups. Environ Microbiol Rep.
2013; 5(1):58–65. https://doi.org/10.1111/1758-2229.12019 PMID: 23757131
66. Kaper JB, Nataro JP, Mobley HLT. Pathogenic Escherichia coli. Nat Rev Microbiol. 2004; 2(2):123–40.
https://doi.org/10.1038/nrmicro818 PMID: 15040260
67. Robins-Browne RM, Bordun AM, Tauschek M, Bennett-Wood VR, Russell J, Oppedisano F, et al.
Escherichia coli and community-acquired gastroenteritis, Melbourne, Australia. Emerg Infect Dis. 2004;
10(10):1797–805. https://doi.org/10.3201/eid1010.031086 PMID: 15504266
68. Ferrie JE. Arsenic, antibiotics and interventions. Int J Epidemiol. 2014; 43(4):977–82. https://doi.org/10.
1093/ije/dyu152 PMID: 25237690
69. Fekih I Ben, Zhang C, Li YP, Zhao Y, Alwathnani HA, Saquib Q, et al. Distribution of arsenic resistance
genes in prokaryotes. Front Microbiol. 2018; 9(OCT):1–11. https://doi.org/10.3389/fmicb.2018.02473
PMID: 30405552
70. Davies J, Davies D. Origins and evolution of antibiotic resistance. Microbiol Mol Biol Rev. 2010; 74
(3):417–33. https://doi.org/10.1128/MMBR.00016-10 PMID: 20805405
71. Haberecht HB, Nealon NJ, Gilliland JR, Holder A V., Runyan C, Oppel RC, et al. Antimicrobial-Resistant
Escherichia coli from Environmental Waters in Northern Colorado. J Environ Public Health. 2019.
https://doi.org/10.1155/2019/3862949 PMID: 30906330
72. Iramiot JS, Kajumbula H, Bazira J, De Villiers EP, Asiimwe BB. Whole genome sequences of multi-drug
resistant Escherichia coli isolated in a Pastoralist Community of Western Uganda: Phylogenomic
changes, virulence and resistant genes. PLoS One. 2020; 15(5). https://doi.org/10.1371/journal.pone.
0231852 PMID: 32469885
73. Mainda G, Lupolova N, Sikakwa L, Richardson E, Bessell PR, Malama SK, et al. Whole genome
sequence analysis reveals lower diversity and frequency of acquired antimicrobial resistance (AMR)
genes in E. coli from dairy herds compared with human isolates from the same region of central Zambia.
Front Microbiol. 2019; 10(MAY). https://doi.org/10.3389/fmicb.2019.01114 PMID: 31214130
PLOS ONE The utility of E. coli as a drinking water quality indicator: Evidence from WGS
PLOS ONE | https://doi.org/10.1371/journal.pone.0245910 January 22, 2021 22 / 23

74. Gu Z, Eils R, Schlesner M. Complex heatmaps reveal patterns and correlations in multidimensional
genomic data. Bioinformatics. 2016; 32(18):2847–9. https://doi.org/10.1093/bioinformatics/btw313
PMID: 27207943
75. Momba MNB, Kaleni P. Regrowth and survival of indicator microorganisms on the surfaces of house-
hold containers used for the storage of drinking water in rural communities of South Africa. Water Res.
2002; 36(12):3023–8. https://doi.org/10.1016/s0043-1354(02)00011-8 PMID: 12171400
76. Levy K, Nelson KL, Hubbard A, Eisenberg JNS. Following the water: A controlled study of drinking
water storage in Northern Coastal Ecuador. Environ Health Perspect. 2008; 116(11):1533–40. https://
doi.org/10.1289/ehp.11296 PMID: 19057707
77. Pickering AJ, Julian TR, Marks SJ, Mattioli MC, Boehm AB, Schwab KJ, et al. Fecal contamination and
diarrheal pathogens on surfaces and in soils among Tanzanian households with and without improved
sanitation. Environ Sci Technol. 2012; 46(11):5736–43. https://doi.org/10.1021/es300022c PMID:
22545817
78. Montealegre MC, Talavera Rodrıguez A, Roy S, Hossain MI, Islam MA, Lanza VF, et al. High Genomic
Diversity and Heterogenous Origins of Pathogenic and Antibiotic-Resistant Escherichia coli in House-
hold Settings Represent a Challenge to Reducing Transmission in Low-Income Settings. mSphere.
2020; 5(1). https://doi.org/10.1128/mSphere.00704-19 PMID: 31941809
79. Arnold BF, Null C, Luby SP, Colford JM. Implications of WASH Benefits trials for water and sanitation–
Authors’ reply. Lancet Glob Heal [Internet]. 2018; 6(6):e616–7. Available from: http://dx.doi.org/10.
1016/S2214-109X(18)30229-8
80. Feachem RG, Burns E, Cairncross S, Cronin A, Cross P, Curtis D, et al. Water, health and develop-
ment: an interdisciplinary evaluation. London, UK: Tri Med Books Ltd.; 1978.
81. Robb K, Null C, Teunis P, Yakubu H, Armah G, Moe CL. Assessment of fecal exposure pathways in
low-income urban neighborhoods in Accra, Ghana: rationale, design, methods, and key findings of the
Sanipath study. Am J Trop Med Hyg. 2017; 97(4):1020–32. https://doi.org/10.4269/ajtmh.16-0508
PMID: 28722599
82. McLellan SL. Genetic diversity of Escherichia coli isolated from urban rivers and beach water. Appl
Environ Microbiol. 2004; 70(8):4658–65. https://doi.org/10.1128/AEM.70.8.4658-4665.2004 PMID:
15294799
83. Perchec-Merien AM, Lewis GD. Naturalized Escherichia coli from New Zealand wetland and stream
environments. FEMS Microbiol Ecol. 2013; 83(2):494–503. https://doi.org/10.1111/1574-6941.12010
PMID: 22974403
84. Moe CL, Sobsey MD, Samsa GP, Mesolo V. Bacterial indicators of risk of diarrhoeal disease from drink-
ing-water in the Philippines. Bull World Health Organ. 1991; 69(3):305–17. PMID: 1893505
85. Nowicki S, Lapworth DJ, Ward JST, Thomson P, Charles K. Tryptophan-like fluorescence as a measure
of microbial contamination risk in groundwater. Sci Total Environ. 2019; 646:782–91. https://doi.org/10.
1016/j.scitotenv.2018.07.274 PMID: 30064104
86. Carstea EM, Popa CL, Baker A, Bridgeman J. In situ fluorescence measurements of dissolved organic
matter: A review. Sci Total Environ. 2020; 699:134361. https://doi.org/10.1016/j.scitotenv.2019.134361
PMID: 31683216
87. Kelly ER, Cronk R, Kumpel E, Howard G, Bartram J. How we assess water safety: A critical review of
sanitary inspection and water quality analysis. Sci Total Environ. 2020; 718:137237. https://doi.org/10.
1016/j.scitotenv.2020.137237 PMID: 32109810
88. Rozen Y, Belkin S. Survival of enteric bacteria in seawater: FEMS Microbiol Rev. 2001; 25:513–29.
https://doi.org/10.1111/j.1574-6976.2001.tb00589.x PMID: 11742689
89. Daniel D, Diener A, Van De Vossenberg J, Bhatta M, Marks SJ. Assessing drinking water quality at the
point of collection and within household storage containers in the hilly rural areas of mid and far-western
Nepal. Int J Environ Res Public Health. 2020; 17(7). https://doi.org/10.3390/ijerph17072172 PMID:
32218157
90. Dufour A, Bartram J, Bos R, Gannon V. Animal Waste, Water Quality and Human Health. London, UK:
World Health Organization; 2012.
91. Hamzah L, Boehm AB, Davis J, Pickering AJ, Wolfe M, Mureithi M, et al. Ruminant Fecal Contamination
of Drinking Water Introduced Post-Collection in Rural Kenyan Households. Int J Environ Res Public
Health. 2020; 17(2):1–23. https://doi.org/10.3390/ijerph17020608 PMID: 31963600
92. Wolf J, Johnston R, Hunter PR, Gordon B, Medlicott K, Pruss-Ustun A. A Faecal Contamination Index
for interpreting heterogeneous diarrhoea impacts of water, sanitation and hygiene interventions and
overall, regional and country estimates of community sanitation coverage with a focus on low- and mid-
dle-income countries. Int J Hyg Environ Health. 2019; 222(2):270–82. https://doi.org/10.1016/j.ijheh.
2018.11.005 PMID: 30503228
PLOS ONE The utility of E. coli as a drinking water quality indicator: Evidence from WGS
PLOS ONE | https://doi.org/10.1371/journal.pone.0245910 January 22, 2021 23 / 23