Spreadsheet Model for Student Evaluation and Grading - IIM ...
8
IMJ 67 Abstract This technical note describes the application of a spreadsheet-based model for student evaluation and grading. The note shows how a spreadsheet-based model can be used in automating the process of evaluating and grading in situations where advanced technologies like optical recognition are not available. The first part of the note describes how a spreadsheet can be used to evaluate course components, which involve multiple- choice type of questions (MCQs). The second part of the note describes how a spreadsheet can help instructors in determining the final grades for a course and its components, given the institutional grading guidelines. The model was successfully used for several courses at a premier management institute in central India. It was observed that the model helped in saving significant amount of time in student evaluation and grading and thus helped in speeding up the process of feedback from the instructor to the students. Keywords: spreadsheet model; student evaluation; student grading 1. Introduction WIMCI 1 is a well-known institute for management education in central India. The institute offers several post graduate and doctoral level programs for fresh graduates and working professionals. The 2-year Post Graduate Programme (PGP) is the flagship programme of the institute and currently admits approximately 450 students, which includes national as well as international students. The first year of the PGP involves compulsory coursework while the second year involves a mix of compulsory and elective courses. At present there are 6 sections (90 students per section) in the first year of the program. A student has to pass a certain minimum number of courses before he/she can be promoted to the second year. A course typically consists of several components like class participation (CP), quizzes, midterms, end terms, group projects, individual assignments, etc. These course components are given certain weightage while computing the final grade for a given course. The institute follows a relative grading system for evaluating the students in most of the course components. A first year course invariably involves 2 to 3 quizzes along with the midterm and the end term examinations. Due to the large number of students in each section the course instructors often prepare multiple-choice question papers (containing 15 to 30 questions), with multiple sets, for quizzes and examinations. In order to discourage random guessing by the students, a penalty for wrong answers is usually incorporated in such question papers. The help of teaching associates is often taken in evaluating and grading these question papers. However, evaluating 200 to 300 question papers even for multiple- choice questions is a tedious job. It requires a considerable amount of time to tally the answer sheet of a student with the master answer sheet for the given set. The computation of final score for a given student requires manually counting the number of right, wrong and no responses. Since the process of evaluating and grading such huge numbers affects the speed and the quality of feedback to the students, it was felt that some form of automation could be useful in streamlining the process of evaluation and grading at the institute. Optical mark recognition (OMR) machines have been successfully used in the past at several institutions to resolve some of the issues related to evaluation and grading. However, for institutes which cannot afford an OMR type of a setup due to a variety of reasons, there is an inexpensive technology in the form of spreadsheets, which can be used to achieve results similar to an OMR technology without any additional expenditure. This note demonstrates a simple yet powerful spreadsheet based model, which can help the Spreadsheet Model for Student Evaluation and Grading Harshal Lowalekar 1 The actual name of the institute has been changed to WIMCI for the purpose of illustration in this technical note. Harshal Lowalekar
-
Upload
khangminh22 -
Category
Documents
-
view
1 -
download
0
Transcript of Spreadsheet Model for Student Evaluation and Grading - IIM ...
IMJ 67
Volume 3 Issue 4 January-March, 2012
Abstract
This technical note describes the application of aspreadsheet-based model for student evaluation andgrading. The note shows how a spreadsheet-based modelcan be used in automating the process of evaluating andgrading in situations where advanced technologies likeoptical recognition are not available. The first part ofthe note describes how a spreadsheet can be used toevaluate course components, which involve multiple-choice type of questions (MCQs). The second part ofthe note describes how a spreadsheet can help instructorsin determining the final grades for a course and itscomponents, given the institutional grading guidelines.The model was successfully used for several coursesat a premier management institute in central India. Itwas observed that the model helped in saving significantamount of time in student evaluation and grading andthus helped in speeding up the process of feedback fromthe instructor to the students.
Keywords: spreadsheet model; student evaluation;student grading
1. Introduction
WIMCI1 is a well-known institute for managementeducation in central India. The institute offers severalpost graduate and doctoral level programs for freshgraduates and working professionals. The 2-year PostGraduate Programme (PGP) is the flagship programmeof the institute and currently admits approximately 450students, which includes national as well as internationalstudents. The first year of the PGP involves compulsorycoursework while the second year involves a mix ofcompulsory and elective courses. At present there are6 sections (90 students per section) in the first year ofthe program. A student has to pass a certain minimumnumber of courses before he/she can be promoted tothe second year.
A course typically consists of several components likeclass participation (CP), quizzes, midterms, end terms,group projects, individual assignments, etc. These coursecomponents are given certain weightage whilecomputing the final grade for a given course. The institutefollows a relative grading system for evaluating thestudents in most of the course components. A first yearcourse invariably involves 2 to 3 quizzes along with themidterm and the end term examinations. Due to thelarge number of students in each section the courseinstructors often prepare multiple-choice questionpapers (containing 15 to 30 questions), with multiplesets, for quizzes and examinations. In order to discouragerandom guessing by the students, a penalty for wronganswers is usually incorporated in such question papers.The help of teaching associates is often taken inevaluating and grading these question papers. However,evaluating 200 to 300 question papers even for multiple-choice questions is a tedious job. It requires aconsiderable amount of time to tally the answer sheetof a student with the master answer sheet for the givenset. The computation of final score for a given studentrequires manually counting the number of right, wrongand no responses. Since the process of evaluating andgrading such huge numbers affects the speed and thequality of feedback to the students, it was felt that someform of automation could be useful in streamlining theprocess of evaluation and grading at the institute.
Optical mark recognition (OMR) machines have beensuccessfully used in the past at several institutions toresolve some of the issues related to evaluation andgrading. However, for institutes which cannot affordan OMR type of a setup due to a variety of reasons,there is an inexpensive technology in the form ofspreadsheets, which can be used to achieve resultssimilar to an OMR technology without any additionalexpenditure. This note demonstrates a simple yetpowerful spreadsheet based model, which can help the
Spreadsheet Model for Student Evaluationand GradingHarshal Lowalekar
1 The actual name of the institute has been changed to WIMCI for the purposeof illustration in this technical note.
Harshal Lowalekar

IMJ 68
Volume 3 Issue 4 January-March, 2012
instructors in automating the process of grading andevaluation to a great extent.
2. Material and Methods
The next section describes a generic model for evaluatinganswer sheets for multiple-choice question(MCQ) paperswith multiple sets. The subsequent section discussesthe model for grading, given the institutional gradingguidelines. Microsoft Excel 2000 has been used for thepurpose of this note but the model can be developedusing many other spreadsheet applications likeOpenOffice or Google spreadsheets. The readers canrefer to [1] and [2] for an in-depth understanding of theexcel-based commands used in the next few sections ofthis note.
2.1 Spreadsheet Model for Evaluation*
If the question paper of a quiz or an examination involvesmultiple-choice kinds of questions the spreadsheetmodel explained in this section can be used for evaluationpurposes. We shall describe the model for a genericsituation described below:
• There are 20 questions in the question paper, whichare of MCQ kind.
• There are 3 sets of the question paper.
• Each MCQ question has 5 options (A, B, C, D andE) and just one correct option.
• For every correct answer, a student earns 1 mark butfor every wrong answer he /she loses one-fourth ofa mark. No marks are deducted for not attemptinga question.
Three approaches to perform the automatic evaluationare presented. The first method gives the score of thestudent for each question while the second and thirdmethods just give the total score obtained by the studentusing array formula and VBA function respectively.
2.1.1 Method 1
The spreadsheet model for the evaluation has beenshown in Fig 1.The model functions in the followingway:
1. The evaluator enters the set numbers (range B5:B7)and the answer key (range C5:C7) in form of a stringof the correct responses, for the respective sets.
2. The marks earned per correct answer and the penaltyper wrong answer is entered in the worksheet (CellsH5 and I5).
3. The evaluator enters the roll number (column A, row16 onwards) of the student along with the student'sset number (column B, row 16 onwards) and hisresponses in a string format (column C, row 16onwards) in the given sheet. Letter "N" in the responsesheet denotes the questions, which a given studentdid not attempt. The model then compares the stringof student's responses with the answer key for thatset and computes the total marks earned by thestudent and displays them in one column (columnF). The marks earned by a student for an individualquestion are also displayed separately (columns Gto Z, row 16 onwards). Excel also automatically looksup the name of the student corresponding to the rollnumber from a student database sheet (Fig 3).
4. Several checks are added to the model to ensurecorrect entries in the answer keys (range C5:C7), thestudent responses (column C, row 16 onwards) andthe total number of students evaluated (cell C13).
The actual formulae entered in the various cells havebeen shown in Table 1.The formula entered in cell G16basically picks up the response for first question fromthe full string of responses for a given student, comparesit with the correct response for the first question of thegiven set and then returns the marks earned by thestudent for the same in the cell G16.The same formulais then copied to the other columns (H16 to Z16) usingrelative referencing. Fig 2 depicts the student databasewhich contains the roll number of the students alongwith their names and group numbers.(Table 1)
2.1.2 Method 2 (Using Array Formula)
In the previous approach the spreadsheet displays themarks obtained in the individual question. However,using an array formula, it is possible to obtain the totalmarks obtained by a student in a much cleaner and
* Readers can refer to [3]-[4] for preparing pre-designed MCQ quizzes usinggoogle spreadsheets. [5] shows the application of MS-Excel spreadsheetfor analyzing the assessment data.
Harshal Lowalekar

IMJ 69
Volume 3 Issue 4 January-March, 2012
Table 1: Formulae Entered in the Spreadsheet (Method 1)
S. No. Formula Entered in Cell(s) Remark
1 =LEN (C5) Enter in D5. Computes the length of theTo be copied in answer key string.D6:D7
2 =LEN(C16) Enter in D16. Computes the length of the answer keyTo be copied in string (Checking for error)column D, row 17onwards
3 =VLOOKUP(A16,'Student Enter in E16. Looks up the student name correspondingDatabase'!$B$4:$C$48,2, To be copied in to the given roll number in 1st column.FALSE) column E, row 17
onwards
4 =IF(G$13<=$D$5, Enter in G16. Compares the response of 1st question ofIF (MID ($C16,G$13,1)="N", 0, To be copied in the a given set with the correct answer for IF(MID($C16,G$13,1)= range G16 to the same and returns the marks to beMID( VLOOKUP($B16, AF100. awarded for the question.B$5:$C$8,2,TRUE), G$13,1),1,$I$5)), " ")
5 =SUM(G16:AJ16) Enter in F16. Computes the total score for the studentTo be copied incolumn F, row 17onwards
Fig 1: Spreadsheet for Evaluation2
2 The students' names have been changed.
Harshal Lowalekar

IMJ 70
Volume 3 Issue 4 January-March, 2012
Fig 2: Student Database3
efficient way as shown in Fig 3.The list of commandsused for achieving the same are mentioned in Table 2.
2.1.3 Method 3 (Using a VBA function)
Instead of using an array formula to compute the totalmarks, as discussed in the previous section, one candefine a user defined function named "MCQ_evaluator"
which will compare the two strings and return the totalmarks given the marks for a correct and an incorrectanswer. The function to be entered in cell F16 (to becopied in column F, row 17 onwards) is shown below:
=MCQ_Evaluator(C16,VLOOKUP(B16,$B$5:$C$7,2,FALSE),$H$5,$I$5)
3. The students' names have been changed.
Harshal Lowalekar

IMJ 71
Volume 3 Issue 4 January-March, 2012
Table 2: Formulae Entered in the Spreadsheet (Using Array Formula)
S. No. Formula Entered in Cell(s) Remark
1 =LEN (C5) Enter in D5. Computes the length of the answer keyTo be copied in string.D6:D7
2 =LEN(C16) Enter in D16. Computes the length of the answer keyTo be copied in string (Checking for error)column D, row 17onwards
3 =VLOOKUP(A16,'Student Enter in E16. Looks up the student name corresponding Database'!$B$4:$C$48,2, To be copied in to the given roll number in 1st column.FALSE) column E, row 17
onwards
4 {=SUM(IF(MID(C16,ROW Ctrl+Shift+Enter Compares the responses of all the(INDIRECT("1:"&LEN in F16. questions of a given set with the answer($C$5))),1) To be copied in key for the same and returns the total=MID(VLOOKUP(B16,$B$5: column F, row 17 marks to be awarded to the student.$C$7,2,0), ROW(INDIRECT onwards("1:"&LEN($C$5))),1),$H$5,IF(MID(C16,ROW(INDIRECT("1:"&LEN($C$5))),1)="N",0,$I$5)))}
Fig 3: Spreadsheet for Evaluation (Methods 2 and 3)
Harshal Lowalekar
IMJ 72
Volume 3 Issue 4 January-March, 2012
The function "MCQ_evaluator" is defined (in the moduleof the existing workbook) as shown below:
Function MCQ_Evaluator (a As String, b As String, cAs Single, d As Single) As Single
Dim score As Single
Dim i As Integer
For i = 1 To Len(a)
If Mid(a, i, 1) = Mid(b, i, 1) Then
score = score + c
ElseIf Mid(a, i, 1) = "N" Then
score = score
Else
score = score + d
End If
Next i
MCQ_Evaluator = score
End Function
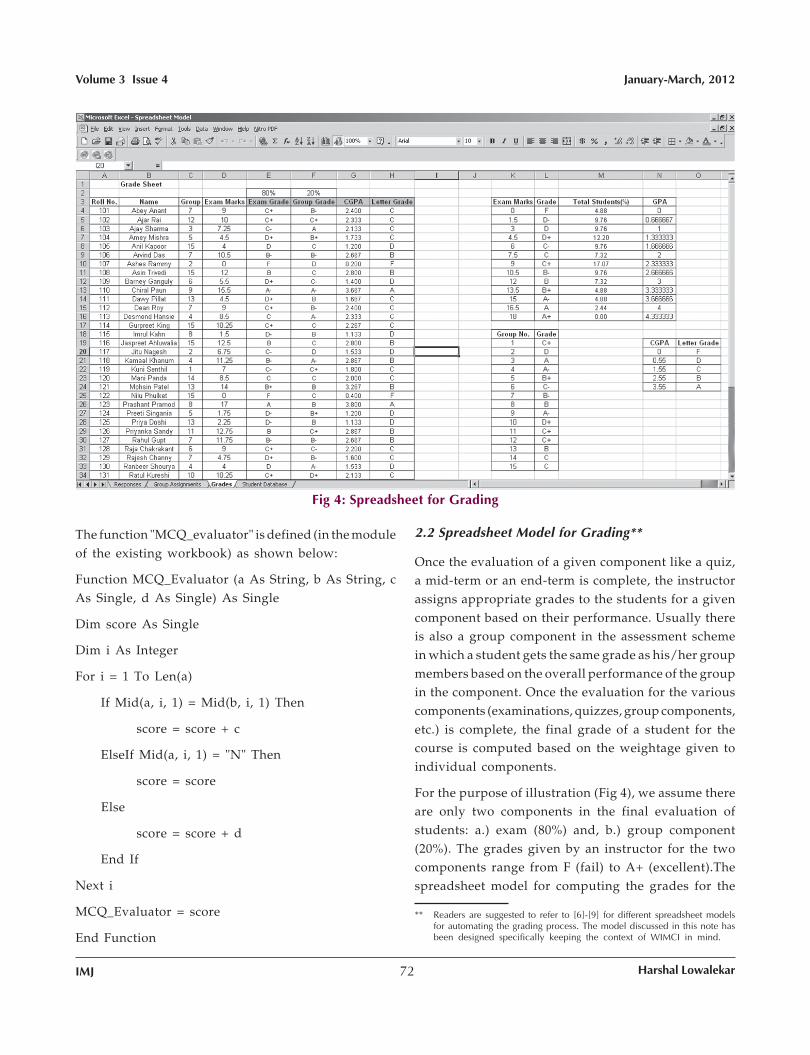
2.2 Spreadsheet Model for Grading**
Once the evaluation of a given component like a quiz,a mid-term or an end-term is complete, the instructorassigns appropriate grades to the students for a givencomponent based on their performance. Usually thereis also a group component in the assessment schemein which a student gets the same grade as his/her groupmembers based on the overall performance of the groupin the component. Once the evaluation for the variouscomponents (examinations, quizzes, group components,etc.) is complete, the final grade of a student for thecourse is computed based on the weightage given toindividual components.
For the purpose of illustration (Fig 4), we assume thereare only two components in the final evaluation ofstudents: a.) exam (80%) and, b.) group component(20%). The grades given by an instructor for the twocomponents range from F (fail) to A+ (excellent).Thespreadsheet model for computing the grades for the
Fig 4: Spreadsheet for Grading
** Readers are suggested to refer to [6]-[9] for different spreadsheet modelsfor automating the grading process. The model discussed in this note hasbeen designed specifically keeping the context of WIMCI in mind.
Harshal Lowalekar
IMJ 73
Volume 3 Issue 4 January-March, 2012
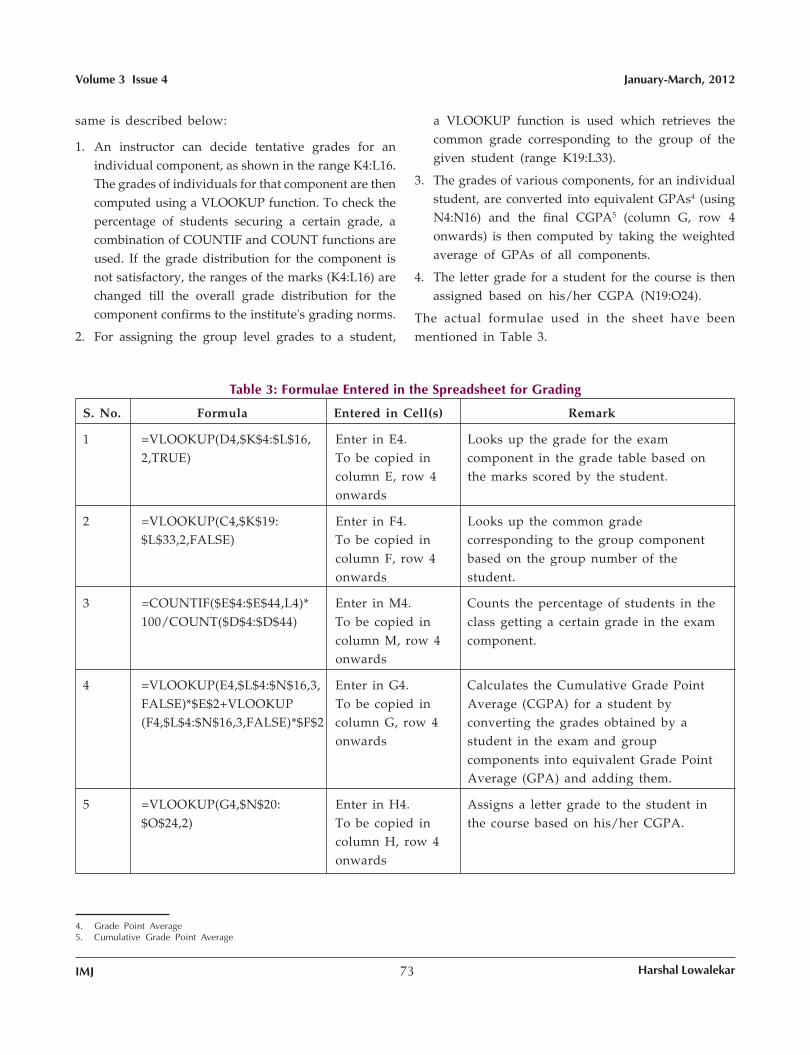
same is described below:
1. An instructor can decide tentative grades for anindividual component, as shown in the range K4:L16.The grades of individuals for that component are thencomputed using a VLOOKUP function. To check thepercentage of students securing a certain grade, acombination of COUNTIF and COUNT functions areused. If the grade distribution for the component isnot satisfactory, the ranges of the marks (K4:L16) arechanged till the overall grade distribution for thecomponent confirms to the institute's grading norms.
2. For assigning the group level grades to a student,
a VLOOKUP function is used which retrieves thecommon grade corresponding to the group of thegiven student (range K19:L33).
3. The grades of various components, for an individualstudent, are converted into equivalent GPAs4 (usingN4:N16) and the final CGPA5 (column G, row 4onwards) is then computed by taking the weightedaverage of GPAs of all components.
4. The letter grade for a student for the course is thenassigned based on his/her CGPA (N19:O24).
The actual formulae used in the sheet have beenmentioned in Table 3.
4. Grade Point Average5. Cumulative Grade Point Average
Table 3: Formulae Entered in the Spreadsheet for Grading
S. No. Formula Entered in Cell(s) Remark
1 =VLOOKUP(D4,$K$4:$L$16, Enter in E4. Looks up the grade for the exam2,TRUE) To be copied in component in the grade table based on
column E, row 4 the marks scored by the student.onwards
2 =VLOOKUP(C4,$K$19: Enter in F4. Looks up the common grade$L$33,2,FALSE) To be copied in corresponding to the group component
column F, row 4 based on the group number of theonwards student.
3 =COUNTIF($E$4:$E$44,L4)* Enter in M4. Counts the percentage of students in the100/COUNT($D$4:$D$44) To be copied in class getting a certain grade in the exam
column M, row 4 component.onwards
4 =VLOOKUP(E4,$L$4:$N$16,3, Enter in G4. Calculates the Cumulative Grade PointFALSE)*$E$2+VLOOKUP To be copied in Average (CGPA) for a student by(F4,$L$4:$N$16,3,FALSE)*$F$2 column G, row 4 converting the grades obtained by a
onwards student in the exam and groupcomponents into equivalent Grade PointAverage (GPA) and adding them.
5 =VLOOKUP(G4,$N$20: Enter in H4. Assigns a letter grade to the student in$O$24,2) To be copied in the course based on his/her CGPA.
column H, row 4onwards
Harshal Lowalekar
IMJ 74
Volume 3 Issue 4 January-March, 2012
3. Results and Discussion
Once the spreadsheet model for evaluation and gradingis ready, the actual effort required to evaluate and gradethe students reduces significantly. As soon as theresponses are typed, the spreadsheet displays the totalmarks for the given set of responses. Also, the effortrequired to type 50 responses is not too different fromthat required to type 20. If the students are asked towrite their answers explicitly in a separate answer sheetinstead of ticking the responses on the question paperitself, the time to read the responses from the questionpaper can be further saved. Since the model does notrequire manual crosschecking of the responses with thecorrect answer for the given set, there is no additionalburden on the evaluator if the number of sets of thequestion paper is large. Also, a significant amount oftime is saved in counting the correct and incorrectresponses. In fact the time taken to type the roll number,the question set and the response string for all thestudents is the only time required for evaluation.
4. Conclusion
The model explained in the note may not be applicablein all situations but it can still be very useful in evaluatingmost of the MCQ type question papers, with fewmodifications. The model for grading is quite genericand it can still be implemented when one wants tocalculate the final grade for a given course once theindividual course components have been evaluated.The spreadsheet model is being successfully used at theinstitute by some of the faculty members and fewacademic associates for evaluating MCQ typeexaminations and overall course grading. The modelhas helped in significantly bringing down the time for
evaluation and grading for a PGP class of 90 studentsthus speeding up the feedback process in a great manner.
References
1. Excel Help and How-to- Office.com (2013). Retrieved onJanuary 23, 2013, from http://office.microsoft.com/en-us/excel-help/
2. Winston, W.L. (2011). Microsoft Excel 2010 Data Analysisand Business Modeling, 3rd edition, PHI Learning PrivateLimited- New Delhi
3. Use Google Forms to create a self-grading quiz. Retrievedon February 8, 2013, from http://www.techrepublic.com/blog/google-in-the-enterprise/use-google-forms-to-create-a-self-grading-quiz/1579
4. Google Apps, Module 4: Docs > Chapter 6: Forms.Retrieved on February 8, 2013, from http://edutraining.googleapps.com/Training-Home/module-4-docs/chapter-6/5-3
5. Using MS Excel to Analyze Data: A Tutorial. Retrievedon February 8, 2013, from http://www.sagepub.com/liustudy/chapters/08/UsingExceltoAnalyzeData.pdf
6. Letter Grades in Excel. Retrieved on February 8, 2013,from http://users.wfu.edu/matthews/plus_minus/excel_example.html
7. Excel 2010: Automating Grading Tasks. Retrieved onFebruary 8, 2013, from http://ase.tufts.edu/its/trainDocuments/ excel10AutomaticGrading.pdf
8. Creating A Grade Sheet With Microsoft Excel. Retrievedon February 8, 2013, from http://www.math.ucla.edu/~tat/Docs/excel.pdf
9. Using an Excel Spreadsheet for Grades. Retrieved onFebruary 8, 2013, from http://www.pcc.edu/resources/ins t ruct ional-support / tools /hardware-sof tware/documents/is-excel-for-grades.pdf
Harshal Lowalekar is an Assistant Professor in theOperations Management and Quantitative TechniquesArea at Indian Institute of Management Indore. He is aFellow of Indian Institute of Management Ahmedabad.
Harshal Lowalekar