ANNUAL REPORT 2019-2020 - IIM Ahmedabad
108
} A 5 th ANNUAL REPORT 2019-20 | 2 0 1 5 - 2 0 2 0 annual report 2019-2020
-
Upload
khangminh22 -
Category
Documents
-
view
0 -
download
0
Transcript of ANNUAL REPORT 2019-2020 - IIM Ahmedabad

} A
5th ANNUAL REPORT 2019-20 |
2 0 1 5 -
20
20
annual report2019-2020

5th ANNUAL REPORT 2019-20 |
5th ANNUAL REPORTApril 2019 – March 2020
INDIA GOLD POLICY CENTRE Indian Institute of Management Ahmedabad
New Campus, Vastrapur, Ahmedabad 380015, Gujarat, India
Telephone: +91 79 71524409 • | Email : [email protected]
Website: https://www.iima.ac.in/web/areas-and-centres/research-centers/igpc
Twitter: https://twitter.com/@IndiaGoldPolicy

IGPC GOVERNING COMMITTEE
PROF. ERROL D’SOUZA DIRECTOR, IIMA
PROF. ARVIND SAHAY CHAIRPERSON, IGPC
MR. P.R. SOMASUNDARAM MANAGING DIRECTOR, INDIA WORLD GOLD COUNCIL
PROF. JOSHY JACOB FACULTY REPRESENTATIVE, IIMA
MS. RAMA BIJAPURKAR INDUSTRY REPRESENTATIVE

2
I am delighted to present the fifth Annual Report of the India Gold Policy Centre at IIMA. The journey these five years has been marked by contributions by the Centre to policy making, academia, and advancement of the industry. The annual report is not just a reflection of the work we have done in the last one year in academic research, industry white papers, and policy advocacy; it is also a vehicle for us to communicate the vision of the think-tank.
After investing the early years of the Centre on research in understanding an industry which is largely fragmented we came up with a comprehensive policy that identifies the issues and the possible solutions that enhance the productivity of the sector. IGPC’s work on these are touched upon in the report.
A policy is as good as its implementation is an adage that the Centre has taken into cognisance while taking the role as an advisor to the government and whilst providing counsel to the industry.
Last year we noticed progress on the regulatory and market development side, such as making hallmarking mandatory effective January 2021, release of guidelines for India Good Delivery Gold, and announcement of International Bullion Exchange in GIFT City. From the advisory side, it gives a sense of satisfaction when recommendations are valued and implemented. These three developments in the last financial year are just the beginning and more such progressive policies are awaited. We are already seeing exchanges looking to commercialise the launch of India Good Delivery which is in line with our larger
FROM THE DESK OF THE
Director, IIMA
Professor Errol D’Souza Professor of Economics, Director, IIMA

} 3
5th ANNUAL REPORT 2019-20 |
Professor Errol D’Souza Professor of Economics, Director, IIMA
policy framework. The inclusion of gold in Multi Asset Allocation Funds in India was an important and timely move, keeping the interest of investors who are less diversified.
The Centre’s research activity which is a blend of academia and industry relevance is making strides in having our work brought out in international publications. The acceptance of our work in top academic journals reaffirms the importance we give for innovation and original thinking. I look forward to more such publications in the future as we continue to work towards building a sustainable, transparent, and ethical ecosystem, with the increasing relevance of gold in the entire economy.
The role of gold during such an unprecedented economic crisis brings to relevance the writings by renowned late American economist John Exter, who is famous for the ‘Inverted Pyramid’ with gold at the base representing an asset with least risk and assets at higher levels in the pyramid being more risky. At the time he wrote third world debt was placed by him at the top of the pyramid. Today sovereign debt from high income countries such as Japan would find place in that position. Public debt is necessary when the economy is in a deflationary stage with commodity prices collapsing, and precautionary savings increasing. When the deflationary environment caused by rising Chinese exports and globalization ceases this surge in spending fuelled by the opening of the fiscal and monetary taps could well spill over into inflation that may be welcomed for its ability to erode the real burden of debt. It will be interesting to see how governments repay coronavirus debts – whether via a wealth tax and a crackdown on corporate tax havens or via raised indirect taxes and a reduction in subsidies or redistributive benefits.
If not for the crisis, an event to commend five years of IGPC was something I was looking forward to where various industry stakeholders and government officials could meet in person at IIMA. That said, we will wait for a bigger moment to raise a toast. Until then let me take this opportunity to personally thank all the stakeholders in the industry, the members of the governing council, faculties from IIMA working on various projects at IGPC, World Gold Council, various institutions IGPC has been working with in collaboration and the government for continued support in helping us deliver the best.

4
India Gold Policy Centre is now in its sixth year of it journey as the only think-tank in the world working exclusively on gold. Looking back at our five years’ journey, the cooperation and support we have received from the industry and World Gold Council has been overwhelming. It was their support that has helped us understand various facets of the industry without which it would have been difficult to develop an approach that is bipartisan, progressive and keeping the nation’s interest at the forefront. And now the IGPC also has a team that will, going forward, make it into the premier think tank of its kind that stands an independent research think tank that connects well with industry and government.
The social, economic and political sensitivity that gold carries in India is quite different from other countries making it difficult to just copy a model that is successful in other countries. Taking all of these into consideration we published a comprehensive policy paper in 2018 after about three years of research and consultation with government, industry and experts in India and globally. In 2019 we came with the implementation plan that detailed sequence of implementing the policy. In these years it is encouraging to note announcements related to financialisation of gold, spot exchange, moving gold from ‘Free’ category to ‘Restricted’ list, International Bullion Exchange and the most recent being consideration to bring reforms in mining.
As IGPC grows strength to strength our contributions are growing in the areas of academic research publications and white papers on the industry. Last year our theme was centred around how to grow businesses more responsible. In this context we initiated multiple projects; one was studying the working standards
THE YEAR IN RETROSPECT…
Chairperson, IGPC
Prof. Arvind Sahay, Chairperson, India Gold Policy Center at IIMA Professor of Marketing and International Business, International Economics.
IIMA Prof. MN Vora Chair in Marketing and Entrepreneurship | Chair, Marketing Area | Chair, NSE Center for Behavioral Science@IIMA
Exec Ed Program Chair: 1. Pricing for Profit 2. Neuroscience in Marketing 3. Enhancing Sales Force Performance 4. Fintech

} 5
5th ANNUAL REPORT 2019-20 |
of artisans in jewellery manufacturing units, a second was understanding the financial disclosures by jewellery industry by going through nearly 200 firms in the jewellery trade, the third was to collaborate with a technology firm to assess the viability of a Blockchain enabled trading platform for banks, jewellers, bullion dealers and refiners. Additionally, we collaborated with the Organisation for Economic Cooperation and Development for helping create a framework for responsible sourcing program for Indian gold trade. These are but a sample of projects underway or completed which also include a couple of cases.
This year our theme is unleashing the new opportunities in the sector. In this context our research focus areas are creating a risk management framework for Bullion Banking in India, opportunities for refining business in India, implementation challenges in mandatory hallmarking and uncover the potential of digital gold market in India in context to Financialisation and GMS. These are in addition to our ongoing nationwide household survey of gold consumers. This is the first of the kind primary research on gold being conducted by creating a panel of respondents across the country, covering 25 states on a sample frame of two lakh households. To implement the Survey, we have on boarded People Research on India’s Consumer Economy (PRICE) an expert in the area of consumer research. We are looking forward to the data published by end of this year should the Pandemic get under control.
The pandemic has reduced the effectiveness of conventional policy tools and with the only major policy choice that limits the increase in debt and increasing the share of fiscal deficit to GDP, gold can potentially be asset class at the forefront to increase the cash flow in the economy. The time ahead is going to be filled with new challenges as these are unchartered territories to operate a business. As we march together, our best wishes to friends and colleagues in industry, academia and government.
6
ABOUT
India Gold Policy Center (IGPC)
The India Gold Policy Center at the Indian Institute of Management Ahmedabad (IIMA) sponsored by World Gold Council is a center of excellence, conducting cutting edge applied research on the Gold Industry in India that provides insights and suggest ways the findings can be put into execution.
IGPC is sponsored by World Gold Council. It was set up as a result of a collaboration between the World Gold Council and the Indian Institute of Management, Ahmedabad.
Activities of Centre◊ Carry out high quality research
◊ Produce an annual lndia gold policy report
◊ Disseminate research through a variety of channels including media outreach, participation in industry conferences, roundtable discussions and/or authored articles
◊ Engage with government and policy makers about the role of gold in the financial architecture and gem and jewellery industry.
◊ Develop business case studies on gold’s role in the financial system and society
◊ Build relationships with other leading management institutions and global institutions on gold industry research, including WGC’s other global research initiatives.
Themes of Research The Center shall focus on multi-disciplinary, thematic, applied research in several key areas relating to the use of gold as a fungible financial asset in India. The themes of research undertaken by the Center shall be outlined by the Governing Body of the Center and shall illustratively include, but not be limited to, the following topics:
◊ Policy on gold industry in India and internationally, including policy frameworks and effective implementation of policies.
◊ Role of gold in the Indian and global economies; India’s role in the global and regional gold markets; India’s response to China emerging as a major player and price influencer in the gold market; and gold’s role as an asset class in relation to the financial system, including households, banks, and financial companies.
◊ Consumption patterns and consumer behaviour across geographies and commitments and inflexion points based on cultural attachment of households to gold.

} 7
5th ANNUAL REPORT 2019-20 |
◊ Putting gold to work for the economy - developing the required framework and incentives to increase domestic supply of gold through recycling and other forms.
◊ Setting world class standards and creating a robust gold ecosystem in India.
◊ Desensitising the current account deficit from gold.
◊ Gold marketing, including demand analysis, branding opportunities, professional marketing, purchase triggers, and other socio-economic aspects.
◊ Employment in the gold industry; organized and unorganized parts of the industry; and the industry’s evolution overtime.
◊ Identifying the institutional infrastructure underlying and needed to strengthen the India Gold industry, including a gold exchange. a gold bank. accredited refineries. vaulting facilities and hallmarking.

8
Contents
Chapter 1: Gold Market - Demand and Supply ..............................................................................................9
Chapter 2: Global macros shaping the gold market ................................................................................... 29
Chapter 3: Understanding The Indian Gold Consumer ............................................................................. 36
Chapter 4: Policies, Regulations and Market Innovations ......................................................................... 45
Chapter 5: IGPC’s Gold & Gold Markets Conference February 2020 ...................................................... 54
Chapter 6: IGPC Events and Engagements .................................................................................................. 68
Media Coverage .................................................................................................................................................... 94
Appendix
a. World official Gold Holdings: International Financial Statistics, May 2020 .................. 96
b. India: Foreign Exchange Reserves & Gold (1959-60 to 2019-20) .....................................97
c. Commodity Composition of India’s Imports from World (2007-08 to 2019-20). ....... 98
d. Worldwide Gold Production & Fabrication Data .............................................................. 99
e. Exports of Precious Metals, Stones, Diamonds and Jewelry (2007-08 to 2019-20) .. 100
f. Imports of Precious metals, stones, diamonds and jewelry 2007-08 to 2019-20 ........101
g. India’s Gold Imports and Gold Price: 1971 to 2020 .......................................................... 102

} 9
5th ANNUAL REPORT 2019-20 |
CHAPTER 1:
Gold Market - Demand and Supply
A. IntroductionThe financial year 2019-20 may be viewed into two periods to understand the factors impacting gold demand. The pre-Covid 19 (April to November 2019) was dominated by US-China trade tariffs, increasing risk of recession, negative yields, unsustainable corporate and household debts. And as the virus started spreading from December 2019 it turned to be the last straw on otherwise a fragile global economy.
Prices in dollar terms gained by 24% in FY 2019-20 and closed at the highest since February 2013. In India the gains were 36% rising to new record high. Price has been holding firm since December 2019 by closing higher for six consecutive months. In comparison with top 13 major consuming countries price gains in India was the fourth highest, Russia, Turkey and Indonesia leading with 48%, 45% and 42% gains in their local prices.
The spread of virus becoming a pandemic was a turning point, and its economic effects began to unfold, investors scrambled for safe haven investments with Gold-backed ETFs rising to a new record high of 3,185 tonnes, these gains were offset by drop in demand in Asian countries.
Figure 1.1: Fears over global impact of coronavirus helped drive gold prices up
Source: World Gold Council (WGC) Gold Demand Trends Q12020

10
The relevance of international logistics, and vaulting came to more prominence with the pandemic and a resulting global lockdown. The result was the rise in spread between Comex and London spot to $60 in March 2020.
Table 1.1: Gold Demand Highlights (in tonnes) 2018-19 2019-20 YoY % changeGold Demand 4,667.1 4,770.3 ▲ 2.2Jewelry1 2,291.2 1,934.2 ▼ -15.6Technology 332.9 320.1 ▼ -3.9Investment 1177.3 1514.0 ▲ 28.6Total bar and coin 1,088.2 855.2 ▼ -21.4ETFs and similar products2 89.1 658.8 ▲ 639.3Central Banks & other institutions3 728.4 636.2 ▼ -12.7
Source: WGC, IGPC
Elsewhere, rising unemployment, drop in income and wages, rise in income uncertainity were all playing heavy on jewellery consumption, although the shops remained shut. Nevertheless, the high networth investors were frantically diversifying their portfolio by adding to gold positions.
Table 1.2: Gold supply Highlights (in tonnes)
Tonnes 2018-19 2019-20 YoY % changeTotal Supply 4,667.1 4,770.3 ▲ 2.2Mine production 3,524.2 3,458.5 ▼ -1.9Net producer hedging -51.5 13.1 ▲ -125.4Recycled gold 1,194.4 1,298.7 ▲ 8.7
Source: WGC, IGPC
In line with government guidelines aimed at addressing the outbreak, several projects around the globe have reduced or halted operations, affecting total mining output in the last quarter and financial year. In FY2020, net hedging of the producer amounted to 13.1 tonnes. It was primarily due to options expiration and closure of existing hedging positions. Given the substantial de-hedging of 24.6 tonnes in the third quarter, the total hedging for the year 2020 was moderate. De-hedging failed to offset 49 tonnes of hedging in Q1 FY20 and in the other three quarters, when miners took advantage of higher gold prices to protect project financing and secure cash prepayments.
1 For an explanation of jewelry fabrication, please see the Notes and definitions download: https://www.gold.org/goldhub/data/gold-supply-and-demand-statistics.2 For a listing of the Exchange Traded Funds and similar products, please see the Notes and definitions download: https://www.gold.org/goldhub/data/gold-supply-and-demand-statistics.3 Excluding any delta hedging of central bank options

} 11
5th ANNUAL REPORT 2019-20 |
B. Global Demand Trends
1) Investment Demand
Exchange Traded Fund
Inflows to gold-backed ETFs increased in Q2 and Q4 of FY 2020; coin investment jumped, offsetting weaker bar demand. Holdings of gold-backed ETFs had hit a historic peak of 3,185 tonnes by the end of the FY2020 by adding record whopping 658.8 tonnes of Gold during the year. The twin engines were ultra-low interest rates, a resulting dollar depreciation and ongoing global economic uncertainties weighed by pandemic.
Figure 1.2: Gold-backed ETFs attracted huge inflows, lifting global holdings to a record high
Source: WGC Gold Demand Trends Q1 2020
Monetary policy and geopolitics fueled the bulk of annual inflows, though price increases have contributed to momentum-driven inflows. North American funds saw the highest net growth in FY2020, contributing 307 tonnes as rising global uncertainties and the steepest Fed rate cuts in a decade contributed to the market uncertainty. In the first five months of calendar year 2020 total additions to gold ETFs globally has touched close to 660 tonnes.
Table 1.3: Physically-backed gold ETF AUM by region in tonnes
Q1’19 Q2’19 Q3’19 Q4’19 Q1’20 YoY change YoY%
changeNorth America 1,261.8 1,266.1 1,447.4 1,440.5 1,568.9 ▲ 307 ▲ 24Europe 1,155.7 1,232.2 1,288.0 1,322.1 1,472.2 ▲ 316 ▲ 27Asia 74.3 70.1 84.4 79.2 92.8 ▲ 18 ▲ 25Other 34.3 33.8 41.5 45.0 50.9 ▲ 17 ▲ 49Global Total 2,526.1 2,602.2 2,861.4 2,886.8 3,184.8 ▲ 659 ▲ 26
Source: WGC Gold Demand Trends Q1 2020

12
Bars and Coins
Figure 1.4: Western investment in gold coins offset weaker bar demand in Asia
Source: WGC Gold Demand Trends Q1 2020
2) Speculative Demand
Commitment of Traders
The Commodity Futures Trading Commission (CFTC) releases a weekly Commitment of Traders (COT) report offering details on the positioning of speculative investors in the U.S. futures markets. The net long positions touched record high position in Q1-2020 which suggest very bullish sentiment in the Gold Market, the net positions have seen a decline since the peak.
Figure 1.5: Gold US CFTC Holdings
Source: US CFTC, Refinitiv, GFMS

} 13
5th ANNUAL REPORT 2019-20 |
3) Central Bank DemandFinancial Year 2019-20, Central Banks brought around 564.6 tonnes as demand was limited to emerging market central banks looking to improve and diversify their overall reserves. The second consecutive year of strong demand underline the importance of gold reserves in their reserve portfolio. To add is the repatriation of gold by central banks in last seven years to their home country.
Figure 1.6: Central Bank net purchasers for tenth consecutive years
Source: World Gold Council
Turkey emerged as the biggest buyer in FY2019-20, with gold reserves rising by 191.3 tonnes. Russian gold reserves increased by a respectable 130.9 tonnes, although 53% lower than a year ago, partially because the central bank started providing discounted buying rates in May to allow domestic miners to sell more gold. Turkey, Poland, China and UAE added more than 2018-19 to their reserves.
Figure 1.7: Top 10 Central Bank Gold Buying in FY20
6
Source: World Gold Council GDT 2019 Turkey emerged as the biggest buyer in FY2019-20, with gold reserves rising by 191.3 tonnes. Russian gold reserves increased by a respectable 130.9 tonnes, although 53% lower than a year ago, partially because the central bank started providing discounted buying rates in May to allow domestic miners to sell more gold. Turkey, Poland, China and UAE added more than 2018-19 to their reserves.
FIGURE 1.7: TOP 10 CENTRAL BANK GOLD BUYING IN FY20
Source: WGC, IGPC
61.9
277.5
25.742.9 52.3
0.0
51.6
1.2 12.5
191.3
130.9
100.0
62.840.4
23.9 19.6 10.3 7.60.0
50.0
100.0
150.0
200.0
250.0
300.0
Turkey RussianFederation
Poland China India UnitedArab
Emirates
Kazakhstan Serbia Mongolia
2018-19 2019-20
tonn
es
Source: WGC, IGPC

14
C. Global Supply Trends
Mine Production
Gold mine production totaled 3,463.7 tonnes in 2019, 1% lower than in 2018. This is the first annual decline in production since 2008. We have seen a sustained decline since 4Q 2018, furthering with the pandemic. For instance, in India the Hutti Gold Mines operation was halted almost the first time in 100 years following lockdown.
Figure 1.8: COVID-19 disrupted mine production, First YoY decline in mine production since 2008
Source: World Gold Council
Environmental regulations slowed mining in China, South Africa had to deal with intense labour union strikes and Latin America witnessed conflicts between local governments and contractors. Although there is a healthy pipeline of projects, securing a social license to operate has proved challenging in South American countries given the efforts by governments to stop money laundering and drug trafficking related to gold mining.
Recycled Gold
While demand for gold struggled in 2019, supply for recycled gold soared in response to price increase. Recycled supply of gold has seen significant rise in both Asia and the Middle East market with increase in prices in local currency terms.

} 15
5th ANNUAL REPORT 2019-20 |
Figure 1.9: Year on year % change in gold price in domestic currency terms
8
Source: World Gold Council; IGPC
FIGURE 1.10: WORLD QUARTERLY SCRAP SUPPLY OF GOLD
Source: WGC, IGPC
48%45%
42%
36%33% 31%
28% 27% 26% 24% 24% 24%
13%
0%
10%
20%
30%
40%
50%
60% YoY % change in prices (FY 2018-19 vs FY 2019-20)
% c
hang
e in
gol
d pr
ice
0
50
100
150
200
250
300
350
400
Mar
/13
Jul/1
3
Nov
/13
Mar
/14
Jul/1
4
Nov
/14
Mar
/15
Jul/1
5
Nov
/15
Mar
/16
Jul/1
6
Nov
/16
Mar
/17
Jul/1
7
Nov
/17
Mar
/18
Jul/1
8
Nov
/18
Mar
/19
Jul/1
9
Nov
/19
Mar
/20
Tonn
es
Deleted: 9Source: World Gold Council; IGPC
Figure 1.10: World Quarterly Scrap supply of gold
8
Source: World Gold Council; IGPC
FIGURE 1.10: WORLD QUARTERLY SCRAP SUPPLY OF GOLD
Source: WGC, IGPC
48%45%
42%
36%33% 31%
28% 27% 26% 24% 24% 24%
13%
0%
10%
20%
30%
40%
50%
60% YoY % change in prices (FY 2018-19 vs FY 2019-20)
% c
hang
e in
gol
d pr
ice
0
50
100
150
200
250
300
350
400
Mar
/13
Jul/1
3
Nov
/13
Mar
/14
Jul/1
4
Nov
/14
Mar
/15
Jul/1
5
Nov
/15
Mar
/16
Jul/1
6
Nov
/16
Mar
/17
Jul/1
7
Nov
/17
Mar
/18
Jul/1
8
Nov
/18
Mar
/19
Jul/1
9
Nov
/19
Mar
/20
Tonn
es
Source: WGC, IGPC
D. Indian Demand and Supply
1) Demand TrendsIndia’s demand for jewellery and investment declined by 17.5% to 633 tonnes in FY 2019-20. Sharp drop in consumer spending across sectors, slowdown in economic activity, liquidity crisis and employment uncertainty were largely the reasons attributed to sharp drop in demand. As a result, spot markets were at discount to landed price through a major part of the year, increasing to $70/oz by end of the FY.
a. Jewelry DemandJewellery demand decline by 18% YoY fall due to domestic economic slowdown, and muted rural demand. Q4 FY20 demand for jewelry plummeted 41 per cent to eleven-year low of 73.9 tonnes as COVID-19 exacerbated the influence of higher domestic prices of gold in the face

16
of a depreciating currency and a weaker economic outlook. While the wedding season raised demand early in the year, a dramatic rise in local gold prices from mid-February led to a decline in demand as consumers stopped purchasing. Later in the year, the market struggled when the lockdown took effect.
Figure 1.11: Higher gold prices and slowing economies caused weakness in India
Source: World Gold Council
Bar and coin investment in India decreased by 9 percent to 140 tons in 2019-20, with the lowest demand in decades. Gold bar and coin demand were overshadowed as a whole by the runaway performance of the stock market in 2019. BSE Sensex had hit consecutive record highs over the year, catching the interest of urban investors who may have flooded the market. High prices were a headwind to the market for investment in Dhanteras. While the festival improved sales of gold coins, they ended up about 10-15 percent lower than last year. Digital gold platforms, however, have seen a major increase in customers and total volumes last FY; low entry points for digital gold investments (as low as Re 1) have helped to overcome the affordability barrier created by higher gold prices.
Figure 1.12: Gold Consumer Demand in India
10
last FY; low entry points for digital gold investments (as low as Re 1) have helped to overcome the affordability barrier created by higher gold prices.
FIGURE 1.12: GOLD CONSUMER DEMAND IN INDIA
Source: WGC, IGPC b. Investment Demand through ETF
Indian Investors invested over 3,500 crore in gold exchange-traded funds (ETFs) in 2019-20, after withdrawing money over the last six financial years, as the coronavirus epidemic fuelled the purchasing of safe havens. As per AMFI data, inflows of assets under management (AUM) of gold funds increased by 79 percent to 7,949 crore at the end of March 2020 from 4,447 crore at the end of March 2019. Investors put a net sum of 3,502 crore in 14 gold-linked ETFs in 2019-20, compared to 412 crore in 2018-19. With the coronavirus pandemic hanging as a specter of the global economy and markets around the world, gold, with its safe haven status, has emerged as a favorite investment destination for investors.
TABLE 1.4: GOLD ETF ASSET UNDER MANAGEMENT IN INDIA
Source: AMFI, IGPC
0.0
50.0
100.0
150.0
200.0
250.0
Q1'
10
Q3'
10
Q1'
11
Q3'
11
Q1'
12
Q3'
12
Q1'
13
Q3'
13
Q1'
14
Q3'
14
Q1'
15
Q3'
15
Q1'
16
Q3'
16
Q1'
17
Q3'
17
Q1'
18
Q3'
18
Q1'
19
Q3'
19
Q1'
20
Tonn
es
Jewellery Bar and Coin
Year Total AUM (Rs. Crores) Net Inflow or (outflow) Rs. Crores 2019-20 7,949 3,502 2018-19 4,447 -412 2017-18 4,806 -835 2016-17 5,480 -775 2015-16 6,346 -903 2014-15 6,655 -1,475 2013-14 8,676 -2,293 2012-13 11,648 1,414 2011-12 9,886 3,646 2010-11 4,400 2,250
Source: WGC, IGPC

} 17
5th ANNUAL REPORT 2019-20 |
b. Investment Demand through ETFIndian Investors invested over 3,500 crore in gold exchange-traded funds (ETFs) in 2019-20, after withdrawing money over the last six financial years, as the coronavirus epidemic fuelled the purchasing of safe havens. As per AMFI data, inflows of assets under management (AUM) of gold funds increased by 79 percent to 7,949 crore at the end of March 2020 from 4,447 crore at the end of March 2019. Investors put a net sum of 3,502 crore in 14 gold-linked ETFs in 2019-20, compared to 412 crore in 2018-19. With the coronavirus pandemic hanging as a specter of the global economy and markets around the world, gold, with its safe haven status, has emerged as a favorite investment destination for investors.
Table 1.4: Gold ETF asset under management in India
Year Total AUM (Rs. Crores) Net Inflow or (outflow) Rs. Crores2019-20 7,949 3,5022018-19 4,447 -4122017-18 4,806 -8352016-17 5,480 -7752015-16 6,346 -9032014-15 6,655 -1,4752013-14 8,676 -2,2932012-13 11,648 1,4142011-12 9,886 3,6462010-11 4,400 2,250
Source: AMFI, IGPC
Figure 1.13: Gold ETF nav vs Gold spot price
11
FIGURE 1.13: GOLD ETF NAV VS GOLD SPOT PRICE
Source: AMFI, IGPC
c. Investment Demand through SGB
The Sovereign Gold Bond (SGB) scheme was first unveiled by the Government of India (GOI) on 30 October 2015. So far, 40 tranches of the Sovereign Gold Bond Scheme have been issued until May 2020. Gold has become one of the top performing asset groups, with domestic investors earning 45 per cent in the last year and three-year gains accounting for 16.62 percent. They have a tenor of eight years, with investors having the option to exit after the fifth year on interest payment dates.
The biggest advantage of investing in SGBs over any physical form of gold is that the former is free of any purity and storage concerns. SGBs generate 2.5 per cent interest over the holding duration, which investors gain over and above the appreciated price of Gold, rendering their returns higher than the real yield on Gold. Unlike physical gold, even SGBs could act as collateral for a bank, FI, or NBFC loan, as compared to a Gold ETF fund. Physical gold or gold ETFs attract a Long Term Capital Gain Tax (LTCG) of 20.8 per cent (including cessation) with indexation advantages when the ownership duration becomes more than 3 years, whereas Short-term Capital Gain Tax (STCG) becomes applied to the taxable profit and paid at the relevant slab limit. Currently interest on SGBs is paid in compliance with the terms of the I-T Act, but the return on capital gains on redemption is tax-free.
Financial planners believe that one of the best ways for investors to capture this asset class is through sovereign gold bonds, and investors looking to build up the allocation could add small
25
27
29
31
33
35
37
39
41
43
45
25000
27000
29000
31000
33000
35000
37000
39000
41000
43000
45000
01-A
pr-1
9
22-A
pr-1
9
13-M
ay-1
9
03-Ju
n-19
24-Ju
n-19
15-Ju
l-19
05-A
ug-1
9
26-A
ug-1
9
16-S
ep-1
9
07-O
ct-1
9
28-O
ct-1
9
18-N
ov-1
9
09-D
ec-1
9
30-D
ec-1
9
20-Ja
n-20
10-F
eb-2
0
02-M
ar-2
0
23-M
ar-2
0
NAV
Rs/ 1
0 gm
MCX Gold Spot Price (L) Nippon Gold Bees ETF ( R)
Source: AMFI, IGPC

18
c. Investment Demand through SGBThe Sovereign Gold Bond (SGB) scheme was first unveiled by the Government of India (GOI) on 30 October 2015. So far, 40 tranches of the Sovereign Gold Bond Scheme have been issued until May 2020. Gold has become one of the top performing asset groups, with domestic investors earning 45 per cent in the last year and three-year gains accounting for 16.62 percent. They have a tenor of eight years, with investors having the option to exit after the fifth year on interest payment dates.
The biggest advantage of investing in SGBs over any physical form of gold is that the former is free of any purity and storage concerns. SGBs generate 2.5 per cent interest over the holding duration, which investors gain over and above the appreciated price of Gold, rendering their returns higher than the real yield on Gold. Unlike physical gold, even SGBs could act as collateral for a bank, FI, or NBFC loan, as compared to a Gold ETF fund. Physical gold or gold ETFs attract a Long Term Capital Gain Tax (LTCG) of 20.8 per cent (including cessation) with indexation advantages when the ownership duration becomes more than 3 years, whereas Short-term Capital Gain Tax (STCG) becomes applied to the taxable profit and paid at the relevant slab limit. Currently interest on SGBs is paid in compliance with the terms of the I-T Act, but the return on capital gains on redemption is tax-free.
Financial planners believe that one of the best ways for investors to capture this asset class is through sovereign gold bonds, and investors looking to build up the allocation could add small amounts to each tranche offered by the government. Long-term investors looking to accumulate yellow metal could do this by buying sovereign gold bonds (SGBs).
There were ten series of SGB that were open for subscription in 2019-20. All tranches saw muted responses in terms of Number of Units subscribed, except the third tranche. However, in the wake of rising demand for Gold, the first and second tranche of sovereign gold bond for this FY2021, issued in April and May noticed a total offtake crossing 4 tonnes. That being said, the average issue price since launch of SGB is Rs. 3,272/gram while the latest issue price being 40%, indicating the price risk that the central bank has exposed itself to.
The Sovereign Gold Bonds has as of date mobilized just 12,760 crores in five years whereas the projected was 75,000 crores. This has made the secondary market listing very illiquid and added to difficulty for investors to exit. Mutual fund participation will be a key here and allowing addition of SGB as part of multi asset allocation fund could drive up the volumes. Clearly, like the GMS, the SGB is also not a scheme that has obtained the scale that it intended to have.

} 19
5th ANNUAL REPORT 2019-20 |
Table 1.5: Data on Outstanding of Sovereign Gold Bonds (Tranche wise) as on 20.05.2020S No Series Issue price/
unitNumber of units
(in grams)In Rupees
(crores)1 2015-I 2,684 9,13,571 245 2 2016-I 2,600 28,69,973 746 3 2016-II 2,916 11,19,741 327 4 2016-17 Series I 3,119 29,53,025 921 5 2016-17 Series II 3,150 26,15,800 824 6 2016-17 Series III 3,007 35,98,055 1,082 7 2016-17 Series IV 2,943 22,20,885 654 8 2017-18 Series I 2,951 20,27,695 598 9 2017-18 Series II 2,830 23,49,953 665 10 2017-18 Series III 2,956 2,64,815 78 11 2017-18 Series IV 2,987 3,78,945 113 12 2017-18 Series V 2,971 1,74,024 52 13 2017-18 Series VI 2,945 1,53,356 45 14 2017-18 Series VII 2,934 1,75,121 51 15 2017-18 Series VIII 2,961 1,35,666 40 16 2017-18 Series IX 2,964 1,05,512 31 17 2017-18 Series X 2,961 1,07,380 32 18 2017-18 Series XI 2,952 81,614 24 19 2017-18 Series XII 2,890 1,11,218 32 20 2017-18 Series XIII 2,866 1,31,958 38 21 2017-18 Series XIV 2,881 3,27,434 94 22 2018-19 Series I 3,114 6,50,337 203 23 2018-19 Series II 3,146 3,12,258 98 24 2018-19 Series III 3,183 4,09,398 130 25 2018-19 Series IV 3,119 2,07,886 65 26 2018-19 Series V 3,214 2,43,606 78 27 2018-19 Series VI 3,326 2,07,388 69 28 2019-20 Series I 3,196 4,59,789 147 29 2019-20 Series II 3,443 5,35,947 185 30 2019-20 Series III 3,499 10,24,837 359 31 2019-20 Series IV 3,890 6,27,892 244 32 2019-20 Series V 3,788 4,55,776 173 33 2019-20 Series VI 3,835 6,93,210 266 34 2019-20 Series VII 3,795 6,48,304 246 35 2019-20 Series VIII 4,016 5,22,119 210 36 2019-20 Series IX 4,070 4,05,957 165 37 2019-20 Series X 4,260 7,57,338 323 38 2020-21, Series I 4,639 17,72,874 822 39 2020-21, Series II 4,590 25,44,294 1,168 40 2020-21, Series III 4,677 23,88,328 1,117 TOTAL 376,83,279 12,760
Source: RBI4, IGPC
4 https://www.rbi.org.in/Scripts/BS_SwarnaBharat.aspx

20
d. Central Bank DemandThe Reserve Bank of India (RBI) purchased 40.45 tonnes of gold in the financial year 2019-20, bringing its total holdings of gold to 653 tonnes. The total gold reserves of the RBI amounted to 612.56 tonnes in 2018-19. With the addition of more stocks, the value of gold reserves rose to $30.57 billion (about Rs 2,32,000 crore) by March 2020 from $23.07 billion in March 2019.
Figure 1.14: Indian Central Bank Gold purchases
14
Source: IMF, IGPC
As per RBI Report on Management of Foreign Exchange Reserves5, as many as 360.71 tonnes of gold is kept in safe storage overseas with the Bank of England and the Bank for International Settlements, while the remaining gold is retained domestically. In value terms (USD), the share of gold in total foreign exchange reserves increased from about 5.59 per cent in March 2019 to about 6.40 per cent in March 2020.
2) Supply Trends a. Gold imports India is the largest importer of gold, which mainly caters to the demand of the jewelry industry. According to Ministry of Commerce data6, Gold imports, which have an impact on the country's current account deficit (CAD), dropped by 14.23 per cent to $28.2 billion in 2019-20. Imports of yellow metal amounted to $32.91 in 2018-19. The fall in gold imports has helped to reduce the country's trade deficit to $152.88 billion in the last fiscal year, relative to $184 billion a year earlier.
TABLE 1.6: INDIAN BULLION SUPPLY ESTIMATES (IN TONNES) Units in tonnes 2016-17 2017-18 2018-19 2019-20 Y/Y % change Banks --Duty paid 212.9 261.4 172.2 132.2 -23% --Duty free 40.9 41.9 41.4 26.5 -36% Nominated agencies --Duty paid 91 95.2 37.0 24.3 -34% --Duty free 136.1 94.6 9.2 6.7 -27% Fine gold refined from doré 139.9 232.1 269.9 176.1 -35%
5https://m.rbi.org.in/Scripts/PublicationsView.aspx?id=19442#I6 6https://economictimes.indiatimes.com/news/economy/foreign-trade/gold-imports-dip-14-23-to-28-2-billion-during-2019-20/articleshow/75167104.cms?from=mdr
0.01.02.03.04.05.06.07.08.0
Jan2018
Mar2018
May2018
Jul2018
Sep2018
Nov2018
Jan2019
Mar2019
May2019
Jul2019
Sep2019
Nov2019
Jan2020
Mar2020
Tonn
es
Source: IMF, IGPC
As per RBI Report on Management of Foreign Exchange Reserves5, as many as 360.71 tonnes of gold is kept in safe storage overseas with the Bank of England and the Bank for International Settlements, while the remaining gold is retained domestically. In value terms (USD), the share of gold in total foreign exchange reserves increased from about 5.59 per cent in March 2019 to about 6.40 per cent in March 2020.
2) Supply Trends
a. Gold importsIndia is the largest importer of gold, which mainly caters to the demand of the jewelry industry. According to Ministry of Commerce data6, Gold imports, which have an impact on the country’s current account deficit (CAD), dropped by 14.23 per cent to $28.2 billion in 2019-20. Imports of yellow metal amounted to $32.91 in 2018-19. The fall in gold imports has helped to reduce the country’s trade deficit to $152.88 billion in the last fiscal year, relative to $184 billion a year earlier.
5 https://m.rbi.org.in/Scripts/PublicationsView.aspx?id=19442#I66https://economictimes.indiatimes.com/news/economy/foreign-trade/gold-imports-dip-14-23-to-28-2-billion-during-2019-20/articleshow/75167104.cms?from=mdr

} 21
5th ANNUAL REPORT 2019-20 |
Table 1.6: Indian Bullion Supply Estimates (in tonnes)
Units in tonnes 2016-17 2017-18 2018-19 2019-20 Y/Y % changeBanks --Duty paid 212.9 261.4 172.2 132.2 -23%--Duty free 40.9 41.9 41.4 26.5 -36%Nominated agencies --Duty paid 91 95.2 37.0 24.3 -34%--Duty free 136.1 94.6 9.2 6.7 -27%Fine gold refined from doré 139.9 232.1 269.9 176.1 -35%Direct import by exporters 7 79.5 218.6 205.9 -6%Total i.e Gross Imports 627.8 804.6 748.3 571.6 -24%Net Imports i.e, import for domestic consumption
443.8 588.7 479.1 332.5 -31%
Imported for re-exporting 184 215.9 269.2 239.0 -11%Source: Refinitiv GFMS; India Gold Policy Centre
India meets nearly all its gold demand through imports, which amounted to 572 tonnes imported in 2019-20, down from 748 tonnes a year ago. India’s gold imports in 2019-20 dropped by 24 per cent from a year earlier to the lowest point in a decade, as retail sales plunged in the second half as local rates soared to a record high and also due to outbreak of Coronavirus, which lead to lockdown in entire world.
Figure 1.15: Monthly gold imports (in tonnes)
15
Direct import by exporters 7 79.5 218.6 205.9 -6% Total i.e Gross Imports 627.8 804.6 748.3 571.6 -24% Net Imports i.e, import for domestic consumption
443.8 588.7 479.1 332.5 -31%
Imported for re-exporting 184 215.9 269.2 239.0 -11% Source: Refinitiv GFMS; India Gold Policy Centre
India meets nearly all its gold demand through imports, which amounted to 572 tonnes imported in 2019-20, down from 748 tonnes a year ago. India's gold imports in 2019-20 dropped by 24 per cent from a year earlier to the lowest point in a decade, as retail sales plunged in the second half as local rates soared to a record high and also due to outbreak of Coronavirus, which lead to lockdown in entire world.
FIGURE 1.15: MONTHLY GOLD IMPORTS (IN TONNES)
Source: Refinitiv GFMS; India Gold Policy Centre
There were 19 refiners who were active in importing dore’ gold and silver. Share of the largest refiner to total dore imports was 50% to 55% of the total. Adding to it the total supplies by rest of top six refiners makes their combined share of 86%. Interesting to note in 2019-20 was that the total volumes supplied by refiners are now near the total supply by banks for domestic demand.
0
20
40
60
80
100
120
140
Tonn
es
Bank Imports Nominated agencies Imports
Fine gold refined from doré Direct import by exporters
Source: Refinitiv GFMS; India Gold Policy Centre
There were 19 refiners who were active in importing dore’ gold and silver. Share of the largest refiner to total dore imports was 50% to 55% of the total. Adding to it the total supplies by rest of top six refiners makes their combined share of 86%. Interesting to note in 2019-20 was that the total volumes supplied by refiners are now near the total supply by banks for domestic demand.

22
Figure 1.16: Dore supplying Countries (Gross Weight Content)
16
FIGURE 1.16: DORE SUPPLYING COUNTRIES (GROSS WEIGHT CONTENT)
Source: DGCIS, CEIC and India Gold Policy Centre
This is linked to discounts in domestic markets thereby banks supplying majorly (70% to 85%) for Gold Metal Loan customers. The outright business has now largely shifted to supplies from domestic refiners. Also the share of the only LBMA accredited refiner in India has remained in the range of 50% to 55% for last few years, suggesting that the number of end users that are indifferent whether the gold is from a LBMA accredited refinery or not, is still the same. From a policy angle this would mean that there is an immense potential for BIS with launch of the India Good Delivery standard.
FIGURE 1.17: INDIAN ANNUAL DORE IMPORTS BY COUNTRY (TOP SUPPLIERS)
Source: Refinitiv, IGPC
16.0%
14.0%
9.7%
9.4%9.4%
8.8%
5.3%
5.2%
4.5%
3.7%3.6%
3.5% 2.4%2.3%
1.4% PeruUSDomincian RepublicGhanaBoliviaTanzaniaColombiaSouth AftcaBurkina FasoLaosArgentinaBrazilGuineaChileMexicoIvory CoastPhillipinesCanadaPapua New GuinesEcuador
0
50
100
150
200
250
300
350
2015 2016 2017 2018 2019
Tonn
es
LaosTanzaniaGhanaPeruDominican RepublicUS
Source: DGCIS, CEIC and India Gold Policy Centre
This is linked to discounts in domestic markets thereby banks supplying majorly (70% to 85%) for Gold Metal Loan customers. The outright business has now largely shifted to supplies from domestic refiners. Also the share of the only LBMA accredited refiner in India has remained in the range of 50% to 55% for last few years, suggesting that the number of end users that are indifferent whether the gold is from a LBMA accredited refinery or not, is still the same. From a policy angle this would mean that there is an immense potential for BIS with launch of the India Good Delivery standard.
Figure 1.17: Indian Annual dore imports by country (top suppliers)
16
FIGURE 1.16: DORE SUPPLYING COUNTRIES (GROSS WEIGHT CONTENT)
Source: DGCIS, CEIC and India Gold Policy Centre
This is linked to discounts in domestic markets thereby banks supplying majorly (70% to 85%) for Gold Metal Loan customers. The outright business has now largely shifted to supplies from domestic refiners. Also the share of the only LBMA accredited refiner in India has remained in the range of 50% to 55% for last few years, suggesting that the number of end users that are indifferent whether the gold is from a LBMA accredited refinery or not, is still the same. From a policy angle this would mean that there is an immense potential for BIS with launch of the India Good Delivery standard.
FIGURE 1.17: INDIAN ANNUAL DORE IMPORTS BY COUNTRY (TOP SUPPLIERS)
Source: Refinitiv, IGPC
16.0%
14.0%
9.7%
9.4%9.4%
8.8%
5.3%
5.2%
4.5%
3.7%3.6%
3.5% 2.4%2.3%
1.4% PeruUSDomincian RepublicGhanaBoliviaTanzaniaColombiaSouth AftcaBurkina FasoLaosArgentinaBrazilGuineaChileMexicoIvory CoastPhillipinesCanadaPapua New GuinesEcuador
0
50
100
150
200
250
300
350
2015 2016 2017 2018 2019
Tonn
es
LaosTanzaniaGhanaPeruDominican RepublicUS
Source: Refinitiv, IGPC
b. Scrap supplyIndia saw the greatest increase in recycling in first two quarters of FY2019-20 across Asia as the gold price rose past the previous record high and remained high. The local gold price ended the

} 23
5th ANNUAL REPORT 2019-20 |
year FY2019-20 just above Rs 41000/10 gm, more than 33% higher than previous year. But although this price performance would typically elicit higher levels of recycling, there was a greater shift towards using gold as a collateral for loan.
With expectations of price increase only distress selling could push the scrap sales as most would prefer to take loan against gold with rates on personal gold loans falling to 7% to 7.5%, similar to G-Secs as collateral.
Figure 1.18: Indian Scrap Gold Supply
17
b. Scrap supply
India saw the greatest increase in recycling in first two quarters of FY2019-20 across Asia as the gold price rose past the previous record high and remained high. The local gold price ended the year FY2019-20 just above Rs 41000/10 gm, more than 33% higher than previous year. But although this price performance would typically elicit higher levels of recycling, there was a greater shift towards using gold as a collateral for loan.
With expectations of price increase only distress selling could push the scrap sales as most would prefer to take loan against gold with rates on personal gold loans falling to 7% to 7.5%, similar to G-Secs as collateral.
FIGURE 1.18: INDIAN SCRAP GOLD SUPPLY
Source: WGC GDT Q1 2020, IGPC
3. Gold Monetisation Scheme
With a view to mobilize the idle gold held by households and institutions in the country; and put this gold to productive use, e.g., by making available gold for the gems and jewellery sector; and, over time to reduce the country’s dependence on the import of gold, Government launched the Gold Monetization Scheme on 5th November, 2015. The Gold Monetization Scheme (GMS) comprise of the ‘Revamped Gold Deposit Scheme’ and the ‘Revamped Gold Metal Loan’ scheme, linked together. The minimum deposit at any one
0
5
10
15
20
25
30
35
40
45
Q1'
12
Q3'
12
Q1'
13
Q3'
13
Q1'
14
Q3'
14
Q1'
15
Q3'
15
Q1'
16
Q3'
16
Q1'
17
Q3'
17
Q1'
18
Q3'
18
Q1'
19
Q3'
19
Q1'
20
Tonn
es
India Scrap Supply (tonnes)
Source: WGC GDT Q1 2020, IGPC
3. Gold Monetisation SchemeWith a view to mobilize the idle gold held by households and institutions in the country; and put this gold to productive use, e.g., by making available gold for the gems and jewellery sector; and, over time to reduce the country’s dependence on the import of gold, Government launched the Gold Monetization Scheme on 5th November, 2015.
The Gold Monetization Scheme (GMS) comprise of the ‘Revamped Gold Deposit Scheme’ and the ‘Revamped Gold Metal Loan’ scheme, linked together. The minimum deposit at any one time shall be 30 grams of raw gold (bars, coins, jewellery excluding stones and other metals). There is no maximum limit for deposit under the Scheme. Depositors may avail two options for deposit:
◊ Shorttermbankdeposit(1-3years)and
◊ Medium and Long Term deposit (5-15 year)
Schemes under GMS are running in India for a while. Till January 2020, approximately 20,547 kilograms of gold have been mobilized under GMS. The details are as under:

24
Table 1.7 : Details of Gold Mobilized under GMS (5th Nov, 2015 to 31st January, 2020)
Types of Deposit Deposited gold (in grams)Cumulative Quantity of Gold (in grams) 205,46,628.93 -- Short Term Gold Deposit 69,38,141.45 -- Medium Term Gold Deposit 49,41,944.22 -- Long Term Gold Deposit 86,66,543.26Number of participating Banks 11Number of depositors 2,952
Source: DEA, Ministry of Finance, Annual Report 2019-20
The Indian Gold Coin (IGC) promotes both Gold Monetization Scheme & Make in India. It is manufactured out of domestic gold (received under GMS) and it is domestically manufactured (Make in India) standard gold coins/bars in different denominations which may eventually re-place the imported coins. Till January, 2020, 779.050 Kgs of Indian Gold Coin has been sold out as per summary placed below:
Table 1.8: IGC SALES Details (5th Nov 2015 to 31st January 2020)
Turnover (In Crores)
Weight Sold (In Kgs)
Qty. Sold (in Nos.)
Denomination-wise details ( in Number)
5 GM 10 GM 20 GMGrand Total 257.569 779.05 85,679 36,542 38,640 10,497
Source:DEA, Ministry of Finance, Annual Report 2019-20
E. COMMODITY DERIVATIVE TRADING
1) Exchange ActivityCOMEX was responsible for 75% of total Gold exchange activity and that was the driving force behind the total volumes. Both Chinese exchanges, SGE and SHFE, followed on second and third spot with market share of 10% each. While MCX Gold Volumes were very low and it contributed only around 1% in total Volumes in FY 2019-20. August 2019 registered the highest Gold Volume, close to 45,000 tonnes, while volumes have been on decreasing side with start of FY 2020-21.

} 25
5th ANNUAL REPORT 2019-20 |
Figure 1.19: Total Gold Monthly Exchange Activity
19
highest Gold Volume, close to 45,000 tonnes, while volumes have been on decreasing side with start of FY 2020-21.
FIGURE 1.19: TOTAL GOLD MONTHLY EXCHANGE ACTIVITY
Source: Refinitiv, IGPC
FIGURE 1.20: COMEX GOLD DELIVERY VOLUMES
Source: Exchange, IGPC
MCX Gold registered multi-month high trading volume of over 570 tonnes in month of March, as prices hit record high levels past Rs 47000/10 gm due to safe-haven demand in COVID-19. Stepping into FY21, the initial trend towards ADTV (average daily trading volume) was soft due to the limited exchange time due to COVID-19. MCX traded value decreased in April and May, with the drop in exchange timings. Structural growth levers - options trading, institutional participation, and introduction of intangibles - were still in the slow lane.
10000
15000
20000
25000
30000
35000
40000
45000
50000Ju
l/18
Aug/
18
Sep/
18
Oct
/18
Nov
/18
Dec/
18
Jan/
19
Feb/
19
Mar
/19
Apr/
19
May
/19
Jun/
19
Jul/1
9
Aug/
19
Sep/
19
Oct
/19
Nov
/19
Dec/
19
Jan/
20
Feb/
20
Mar
/20
Apr/
20
May
/20
Volu
me
(in T
onne
s)
COMEX SHFE SGE TOCOM MCX Other Exchanges
0
5000
10000
15000
20000
25000
30000
Apr/
18
Jun/
18
Aug/
18
Oct
/18
Dec/
18
Feb/
19
Apr/
19
Jun/
19
Aug/
19
Oct
/19
Dec/
19
Feb/
20
Apr/
20
Jun/
20
Cont
ract
s
COMEX Gold Delivery Volume
Source: Refinitiv, IGPC
Figure 1.20: COMEX Gold Delivery volumes
19
highest Gold Volume, close to 45,000 tonnes, while volumes have been on decreasing side with start of FY 2020-21.
FIGURE 1.19: TOTAL GOLD MONTHLY EXCHANGE ACTIVITY
Source: Refinitiv, IGPC
FIGURE 1.20: COMEX GOLD DELIVERY VOLUMES
Source: Exchange, IGPC
MCX Gold registered multi-month high trading volume of over 570 tonnes in month of March, as prices hit record high levels past Rs 47000/10 gm due to safe-haven demand in COVID-19. Stepping into FY21, the initial trend towards ADTV (average daily trading volume) was soft due to the limited exchange time due to COVID-19. MCX traded value decreased in April and May, with the drop in exchange timings. Structural growth levers - options trading, institutional participation, and introduction of intangibles - were still in the slow lane.
10000
15000
20000
25000
30000
35000
40000
45000
50000Ju
l/18
Aug/
18
Sep/
18
Oct
/18
Nov
/18
Dec/
18
Jan/
19
Feb/
19
Mar
/19
Apr/
19
May
/19
Jun/
19
Jul/1
9
Aug/
19
Sep/
19
Oct
/19
Nov
/19
Dec/
19
Jan/
20
Feb/
20
Mar
/20
Apr/
20
May
/20
Volu
me
(in T
onne
s)
COMEX SHFE SGE TOCOM MCX Other Exchanges
0
5000
10000
15000
20000
25000
30000
Apr/
18
Jun/
18
Aug/
18
Oct
/18
Dec/
18
Feb/
19
Apr/
19
Jun/
19
Aug/
19
Oct
/19
Dec/
19
Feb/
20
Apr/
20
Jun/
20
Cont
ract
s
COMEX Gold Delivery Volume
Source: Exchange, IGPC
MCX Gold registered multi-month high trading volume of over 570 tonnes in month of March, as prices hit record high levels past Rs 47000/10 gm due to safe-haven demand in COVID-19. Stepping into FY21, the initial trend towards ADTV (average daily trading volume) was soft due to the limited exchange time due to COVID-19. MCX traded value decreased in April and May, with the drop in exchange timings. Structural growth levers - options trading, institutional participation, and introduction of intangibles - were still in the slow lane.

26
Figure 1.21: MCX Gold Volumes and Open Interest
20
FIGURE 1.21: MCX GOLD VOLUMES AND OPEN INTEREST
Source: Refinitiv, IGPC
FIGURE 1.22: MCX GOLD DELIVERY VOLUMES
Source: MCX, IGPC
Table 1.9: MCX Gold Delivery in 2019-20
Year Months GOLD (In Kg)
GOLDGUINEA (In Kg)
GOLDM (In Kg)
GOLDPETAL (In Kg)
Grand Total (In Kg)
2019 Apr 0.6 71.9 0.0 72.5
2019 May 0.4 22.6 23.0
0
5
10
15
20
25
30
35
100150200250300350400450500550600
Jul/1
8Au
g/18
Sep/
18O
ct/1
8N
ov/1
8De
c/18
Jan/
19Fe
b/19
Mar
/19
Apr/
19M
ay/1
9Ju
n/19
Jul/1
9Au
g/19
Sep/
19O
ct/1
9N
ov/1
9De
c/19
Jan/
20Fe
b/20
Mar
/20
Apr/
20M
ay/2
0
Ope
n In
tere
st (T
onne
s)
Volu
me
(Ton
nes)
Standard Contract Mini Contract Open Interest
0
1000
2000
3000
4000
5000
6000
Apr/
18
May
/18
Jun/
18
Jul/1
8
Aug/
18
Sep/
18
Oct
/18
Nov
/18
Dec/
18
Jan/
19
Feb/
19M
ar/1
9
Apr/
19
May
/19
Jun/
19
Jul/1
9
Aug/
19
Sep/
19
Oct
/19
Nov
/19
Dec/
19
Jan/
20
Feb/
20
(Inkg
s)
MCX Total Gold Delivery
Source: Refinitiv, IGPC
Figure 1.22: MCX Gold Delivery volumes
20
FIGURE 1.21: MCX GOLD VOLUMES AND OPEN INTEREST
Source: Refinitiv, IGPC
FIGURE 1.22: MCX GOLD DELIVERY VOLUMES
Source: MCX, IGPC
Table 1.9: MCX Gold Delivery in 2019-20
Year Months GOLD (In Kg)
GOLDGUINEA (In Kg)
GOLDM (In Kg)
GOLDPETAL (In Kg)
Grand Total (In Kg)
2019 Apr 0.6 71.9 0.0 72.5
2019 May 0.4 22.6 23.0
0
5
10
15
20
25
30
35
100150200250300350400450500550600
Jul/1
8Au
g/18
Sep/
18O
ct/1
8N
ov/1
8De
c/18
Jan/
19Fe
b/19
Mar
/19
Apr/
19M
ay/1
9Ju
n/19
Jul/1
9Au
g/19
Sep/
19O
ct/1
9N
ov/1
9De
c/19
Jan/
20Fe
b/20
Mar
/20
Apr/
20M
ay/2
0
Ope
n In
tere
st (T
onne
s)
Volu
me
(Ton
nes)
Standard Contract Mini Contract Open Interest
0
1000
2000
3000
4000
5000
6000
Apr/
18
May
/18
Jun/
18
Jul/1
8
Aug/
18
Sep/
18
Oct
/18
Nov
/18
Dec/
18
Jan/
19
Feb/
19M
ar/1
9
Apr/
19
May
/19
Jun/
19
Jul/1
9
Aug/
19
Sep/
19
Oct
/19
Nov
/19
Dec/
19
Jan/
20
Feb/
20
(Inkg
s)
MCX Total Gold Delivery
Source: MCX, IGPC
Table 1.9: MCX Gold Delivery in 2019-20
Year MonthsGOLD
(In Kg)GOLDGUINEA
(In Kg)GOLDM (In Kg)
GOLDPETAL (In Kg)
Grand Total (In Kg)
2019 Apr 0.6 71.9 0.0 72.5 2019 May 0.4 22.6 23.0 2019 Jun 114.0 1.5 47.1 0.0 162.6 2019 Jul 0.2 83.9 1.0 85.1 2019 Aug 4,598.0 1.9 560.8 0.0 5,160.7 2019 Sep 1.6 1,710.4 1.0 1,712.9 2019 Oct 917.0 1.0 378.6 1,296.6

} 27
5th ANNUAL REPORT 2019-20 |
Year MonthsGOLD
(In Kg)GOLDGUINEA
(In Kg)GOLDM (In Kg)
GOLDPETAL (In Kg)
Grand Total (In Kg)
2019 Nov 44.0 0.0 135.3 2.0 181.3 2019 Dec 88.0 0.3 229.6 3.1 321.0 2020 Jan 0.1 55.7 1.2 57.0 2020 Feb 215.0 0.3 93.3 0.2 308.9 2020 Mar 10.0 17.0 1.8 28.8 Gold All Variant Total 9,410.4
Source: MCX India
2) Spot and Future SpreadLondon spot gold prices dropped far below U.S. Gold futures in March and April in a sign that market concerns about air travel restrictions and precious metal refinery closures hampered bullion shipments to the U.S. to meet contractual requirements. At certain trading platforms operated by banks and brokers, the gap between bid buy and sell rates for spot gold-normally below 50 cents-also grew to as much as $50. Only imported or LBMA gold can be delivered on the exchange platform, and imports stopped after non-landing international flights. There were possibilities of sellers facing financial problems in case they are forced to give delivery.
Figure 1.23: COMEX Gold Future and Spot price spread
21
2019 Jun 114.0 1.5 47.1 0.0 162.6
2019 Jul 0.2 83.9 1.0 85.1
2019 Aug 4,598.0 1.9 560.8 0.0 5,160.7
2019 Sep 1.6 1,710.4 1.0 1,712.9 2019 Oct 917.0 1.0 378.6 1,296.6
2019 Nov 44.0 0.0 135.3 2.0 181.3
2019 Dec 88.0 0.3 229.6 3.1 321.0
2020 Jan 0.1 55.7 1.2 57.0
2020 Feb 215.0 0.3 93.3 0.2 308.9
2020 Mar 10.0
17.0 1.8 28.8
Gold All Variant Total 9,410.4 Source: MCX India
2) Spot and Future Spread
London spot gold prices dropped far below U.S. Gold futures in March and April in a sign that market concerns about air travel restrictions and precious metal refinery closures hampered bullion shipments to the U.S. to meet contractual requirements. At certain trading platforms operated by banks and brokers, the gap between bid buy and sell rates for spot gold-normally below 50 cents-also grew to as much as $50. Only imported or LBMA gold can be delivered on the exchange platform, and imports stopped after non-landing international flights. There were possibilities of sellers facing financial problems in case they are forced to give delivery.
FIGURE 1.23: COMEX GOLD FUTURE AND SPOT PRICE SPREAD
-40-30-20-10
0102030405060
Apr/
18
Jun/
18
Aug/
18
Oct
/18
Dec/
18
Feb/
19
Apr/
19
Jun/
19
Aug/
19
Oct
/19
Dec/
19
Feb/
20
Apr/
20
$/oz
Spread
Source: Exchange, LBMA, IGPC
Huge premiums were also witnessed in Canadian gold and silver markets and many traders were seen taking the opportunity to arbitrate between MCX and COMEX where the traders were selling on the COMEX (in US) and buying on the MCX, at a disparity of 1000 rupees. But due to liquidity problems, a lot of them had to square off their positions because of which we also saw disparity growing to as high as Rs.2,000-2,200 per 10 gram. Lately, as there was lockdown in India from 25th March to 7th June 2020, all Gold businesses were shut and Spot Gold prices were not decided. So last Spot Gold price decided on 22nd March was Rs 40,989/10gm, which

28
remained unchanged for two and half months. While Indian Gold Future prices kept on following COMEX Gold parity and gradually rose past Rs 47,000/ 10 gm mark. Therefore, in month of April and May, there was huge spread of Rs 6,000/ 10 gm seen between Indian Gold Future and Spot prices.
Figure 1.24: MCX Gold Future and Spot price spread
22
Source: Exchange, LBMA, IGPC Huge premiums were also witnessed in Canadian gold and silver markets and many traders were seen taking the opportunity to arbitrate between MCX and COMEX where the traders were selling on the COMEX (in US) and buying on the MCX, at a disparity of 1000 rupees. But due to liquidity problems, a lot of them had to square off their positions because of which we also saw disparity growing to as high as Rs.2,000-2,200 per 10 gram. Lately, as there was lockdown in India from 25th March to 7th June 2020, all Gold businesses were shut and Spot Gold prices were not decided. So last Spot Gold price decided on 22nd March was Rs 40,989/10gm, which remained unchanged for two and half months. While Indian Gold Future prices kept on following COMEX Gold parity and gradually rose past Rs 47,000/ 10 gm mark. Therefore, in month of April and May, there was huge spread of Rs 6,000/ 10 gm seen between Indian Gold Future and Spot prices.
FIGURE 1.24: MCX GOLD FUTURE AND SPOT PRICE SPREAD
Source: MCX, IGPC Outlook: The gold prices are generally driven by demand from Asian consumers and investors, or central bank purchase or the western ETF demand. We could say that over the years the demand from each of these segments has happened in the same sequence as above with Asian consumers buying the most at the bottom. Price increase driven by western world ETF demand has helped sustain rallies for a longer period relatively in the past. Although the demand from central banks has tapered this year, Fed hinting that rates will be maintained at zero till 2022 can actually build a strong case for a depreciating dollar. The OECD in its latest release said that the economic recovery is going to be slow with large economic scars. The same day US equity indices are trading positive for the year, showing a clear divergence between broader economy and liquidity driven capital markets. Interestingly at the same time gold has been holding firm over $1700 while dollar index is down by near 6% from this year high. Our sense is professional money managers and private investors are treading the recovery very cautiously by holding to a more risk diversified portfolio with gold
-2000-1000
01000200030004000500060007000
Apr/
18
Jun/
18
Aug/
18
Oct
/18
Dec/
18
Feb/
19
Apr/
19
Jun/
19
Aug/
19
Oct
/19
Dec/
19
Feb/
20
Apr/
20
Rs/1
0 gm
Spread
Source: MCX, IGPC
Outlook:The gold prices are generally driven by demand from Asian consumers and investors, or central bank purchase or the western ETF demand. We could say that over the years the demand from each of these segments has happened in the same sequence as above with Asian consumers buying the most at the bottom. Price increase driven by western world ETF demand has helped sustain rallies for a longer period relatively in the past. Although the demand from central banks has tapered this year, Fed hinting that rates will be maintained at zero till 2022 can actually build a strong case for a depreciating dollar.
The OECD in its latest release said that the economic recovery is going to be slow with large economic scars. The same day US equity indices are trading positive for the year, showing a clear divergence between broader economy and liquidity driven capital markets. Interestingly at the same time gold has been holding firm over $1700 while dollar index is down by near 6% from this year high. Our sense is professional money managers and private investors are treading the recovery very cautiously by holding to a more risk diversified portfolio with gold carrying higher weightage. We discuss more about the macros and impact on gold in the next chapter.

} 29
5th ANNUAL REPORT 2019-20 |
CHAPTER 2:
Global macros shaping the gold market
Macro-Economics and Gold Outlook The COVID-19 spread which started in China in December 2019 spread to the world in few weeks and countries around the world started introducing emergency measures similar to wartime to counter Coronavirus. As investors have been looking for protection in safe haven assets in the midst of recent market turmoil, the US dollar has been the king of the global foreign exchange market. But in fact, Gold outperformed the greenback. This pandemic and the global reaction to it had a far reaching effect on the investment in gold in Q1-2020. Investment demand increased by 80 percent to a 4-year high of 540 tonnes and ETFs attracted 298 tonnes of inflows, boosting global holdings to new highs.
Gold finished the year FY2020 above US$ 1700/oz – a closing rate not seen since 2012. Although gold still stands at 10% below its all-time highs in US dollars, it has managed to reach all-time highs in every other major currency, namely: Australian and Canadian dollars, Euros, Pounds, Yen, Rupee and Yuan, and has briefly made a new peak in Swiss francs too.
On the one hand, concerns about the economic and social effects of the epidemichave pushed safe-havenflowsinto many investment goods, especially Gol ETFs and official gold coins. Moreover huge monetary infusion by the Fed and other central banks and global recession fears have added fuelling to rising price of gold. But, on the other hand, worries about the bleak economic outlook combined with higher gold prices have prompted many to sell their current holdings in an attempt to overcome the financial distress caused by the outbreak.
OECD projections say that steps to curtail the spread of the virus would result in a decline in economic output by 20 to 25 per cent. While as per latest World Economic Outlook report, IMF says that the world economy is expected to suffer the worst recession since the Great Depression this year, surpassing that was witnessed during the global financial crisis a decade earlier.
Going forward in FY2020-21, COVID-19 pandemic could result in a lack of consumer trust and liquidity, disruption and volatility in global supply chains, capital and financial markets, commodity markets, foreign exchange markets and precious metal markets, all of which could negatively impact interest rates, credit ratings, credit risk, availability of financing and inflation.
The long-term impact of the pandemic on the environment and any future social changes has yet to be determined. In the last week of April, the US reported annual adjusted GDP losses of 4.8% in the first three months of 2020, the highest quarterly drop since the fourth quarter of

30
2008. Eurozone as a whole was worse – the area contracted by 3.8% on an annualized basis in the first quarter, the lowest quarterly ever. This volatility, along with the unpredictable willingness of central banks to help markets, could continue to fuel investor demand for gold. Global recession predictions, along with the rapid pace of government money printing, are expected to raise activity in gold and push prices to uncharted territories in FY 2020-21.
We think the global situation is shaping to an extent where the role of gold is going to be much more significant. In this section we discuss our view on how pandemic and subsequent macroeconomic changes is creating a new World Order.
It is not usual for a Central Banker to say, U.S. government has a technology, called a printing press, it can produce as many U.S. dollars as it wishes at essentially no cost. That was Dr. Ben Bernanke in 2002 much before he took charge as Chairman of the Fed and the Quantitative Easing was kicked off in 2008. This technology which only US has been successful at manoeuvring through the last financial crisis of 2008-09, and is an antidote to deflation. A prescription that is being used again by the Federal Reserve now. Will it work this time as well? Or are we kicking the can down the road?
Irving Fisher in his Debt-Deflation theory in 1933, theorized how all the remaining factors carried less weightage compared to debt and deflation in the triggering a crisis of greater severity. So when the asset prices fall sharply Fed prints money enough to lift the asset prices, eventually the deflation keeps the real yields positive while the interest rates are still at zero percent. This means the debt will keep ballooning and as it keeps financing the purchase of assets and its price shall keep increasing beyond normal levels driven by leveraging. To understand what does that mean for stock market, let’s examine how it works.
Financial markets are premised on the fact that there are some underlying cash flows in the companies, there are some earnings and these earnings then gets translated into a share price in the stock markets. This means price is not just a function of the earnings but also the money that is available to buy those shares in the market. In earlier times we were limited in the amount of money that can buy the shares as we were running on Gold Standard, thus Price Earnings multiple had some sanctity and some limits so what levels they could reach. However, with the ability to print dollars as explained earlier the P/E that we see in the financial markets causes a disconnect between the fundamentals and price of the financial instruments. The market is then held higher (or goes lower) driven by the sentiments of the people operating in this market. The sentiments determine a larger and longer term trend as well as short term trends and these remain consistent in market cycles until a major event hits the market. Such an event, like the combination of Covid 19 and a deep cut in oil prices, quickly triggers revaluation of the corporate debt and country’s debt and the cost of capital that is available to buy these debts. That is the ability to pay out the debt obligation.

} 31
5th ANNUAL REPORT 2019-20 |
Source: IMF’s Global Financial Stability Report, April 2020
Policy intervention by expanding central bank’s balance sheet have so far worked well for the US till about 2015 and to an extent China because it is not only just about the economy but also about the geo-political architecture where the primacy of the US, and to a certain extent, China, limits what Japan, UK, ECB and other countries can do.
The US and China are for the moment joined at the hip, whether, they, or the rest of the world, likes it or not. On a GDP of $14 trillion, China exports $ 450 billion to the US. If the US does not consume, China is also in trouble. US consumption is, of course, fuelled by debt. Referring the IMF’s GFSR we understand that in the U.S the speculative grade debt now constitutes 48% of the total corporate debt which is approximately $13 trillion, and is higher than the 2009 levels, and in China it is 50% of the total. Relatively Europe has been able to control following the previous debt crisis. However, two countries that haven’t done much in reducing the share of debt at risk are the U.S and the UK, with share of over 30% of total debt. All of this can weigh down the performance of financial institutions.
Source: IMF’s Global Financial Stability Report, April 2020

32
Fisher rightly said, “Debt and Deflation are two diseases that act and react on each other in other words just as a bad cold leads to pneumonia, so over-indebtedness leads to deflation”. Needless to say US has been walking the path of over-indebtedness for a while now. The question is whether it will pay the price that countries that do not have the advantages of a reserve currency or a large foreign exchange war chest.
Covid-19 is just the trigger for a market that was overvalued and the risks of a pandemic was not priced into such portfolios. The chain of economic consequences of a global pandemic has never been easy to measure; however, we can predict some events that will happen in the financial markets given the current lockdowns that are taking place. The first thing that happens here is deleveraging, that is reducing the debt. That takes us back to the Fisher’s theory. So to prevent the precipitation of the crisis that starts with deleveraging and can extend into a deflation, the Central Bank reduces the rates, this time it set the rates at zero and starts printing more money. By doing so while they reduce the cost of debt, they also provide fire power to firms by infusing cash through financial markets.
The early signs of economic downturn actually came in when the Fed started participating in the Repo market after the rates shot up in September 2019; this was followed by announcement to buy $60 billion each month in October. And although Fed said it is not aiming for a QE but as the epidemic turned to a pandemic Fed had to cut the rates to zero and step on the accelerator to pump $1.5 trillion followed by a $500 billion and then an unlimited QE. European Central Bank has followed suite with an unlimited bond purchase programme.
Amidst this rising debt and the pandemic came the oil price crash the biggest since 1991, which fundamentally shifted the oil market dynamics. For the capital intensive industry biggest hit were deep sea oil explorers in Europe and Shale oil producers in US and Canada. If real estate was the starting point of crisis of last decade, then this decade would be that of crude oil and it starts from the US again, not to mention the WTI contract settling at negative rates. While the major oil consuming countries may see this as an opportunity to stock their reserves.
In short the recession we are seeing could be longer if not the similar time frame; and this one is once in a hundred year event.
The fallout of US-China trade war, increasing wealth disparity post last recession, mis-management of debt since 2015, the oil fundamentals and managing the pandemic are all indicating that the America’s leadership in domestic and international diplomacy is failing. This failure has been clouded by populism. Historically these are the times when power shifts or when there is a greater battle to retain the power.
As we look at a new world order, a question that arises is whether gold will play a central role in defining the sovereign risks in the competition to become a global currency. The failure of Euro and the Brexit is making the path easier for the new reserve currency Chinese Renminbi to be on higher demand, it’s yields has declined from 4% in Jan 2018 to 2.7% in March 2020. And its share as part of global forex reserves has been rising steadily since 2016 and has now crossed 2% although still far call from 62% for dollar. China has been accumulating gold steadily from start

} 33
5th ANNUAL REPORT 2019-20 |
of last decade. If the research by BullionStar is to be believed, the official gold reserves of China are not 1800 tons but closer to 4000 tons. Working with gold backed yuan and speculation of gold backed cryptocurrency are all adding credence to its future position. And ironically, because China and the US are joined at the hip, the transition, while bumpy may still be peaceful. Of course, if the rest of the world blames China for this pandemic, China will have to wait some more time for the “sentiments” to turn in its favour.
JOHN EXTER’S INVERTED PYRAMID
John Exter’s ‘Inverted Pyramid’ shows gold at the base representing an asset with least risk and assets at higher levels in the pyramid being more risky. At the time he wrote third world debt was placed by him at the top of the pyramid. Today sovereign debt from high income countries such as Japan and the United States would find place in that position.
Image source: https://sdbullion.com/blog/financial-crisis-protection
Making India Super-Dependable as an Economic Power in the time of global economic crisis
Getting realistic on India’s growth projectionsCovid 19 has hit the economies of most nations for a six. While the IMF and Moody’s are still saying that the Chinese and Indian economy will grow in 2020-21, we estimate that the most likely case for the Indian economy is a contraction by between 3-5%. How so? The lockdown means that for one full month the economy was functioning at about 40%. One month’s GDP output is 8.33% of the output for the year. And 60% of this was not present. So, that is, straightaway, a 5% decrease in the GDP from where it would have been. Let’s assume that the economy was to have grown at 6%. So we are now down to 1% growth.

34
Since the economy was shut, supply chains have been disrupted. Workers have moved back to their villages. It will take time to crank up the economy to 100% again. If we assume that it will take two months for the economy to go back up to 100% from 40%. In May we will function at 70% and in June at 90% and we will be back at 100% in July (all optimistic assumptions, incidentally). So, there will be a loss of 30% of GDP in May and 10% for June adding up to a loss of 2.5% and 0.8%. So by the time we get to July we are already at a decrease of 8.3% from where we would have been (a growth of 6%). That is, the economy will contract by 3.3%.
And this is, if everything comes back to full capacity by July. We know, that travel, tourism, restaurants, multiplexes, events, etc. will not get back to normal for another 6 months at least. Of course, we will add some economic activity, but these will not be enough to compensate. More importantly, there are massive job losses likely and a dislocation in economic activity and tax revenues. Clearly, the combination of supply and demand shock needs to be addressed at a policy level. A base case scenario of India’s GDP contraction by about 6% or more is quite plausible; and a worse case scenario could go upto a 20% contraction.
India’s responseThe Fed, the ECB, the Japanese Central Bank have all employed large monetary stimuli (between $1 and $2 trillion) and the respective government’s have also provide fiscal stimuli (between $500 billion and $800 billion). The total amount as a proportion of the respective GDP’s varies between 10% and 15% of the GDP. The question, therefore, is what are the RBI and the Central Government doing in India. The Indian stimuli is less than 2% of the GDP in actual money terms so far. How much more does India need? And what can India do to bridge the gap, seeing that India has some fiscal constraints and the apprehension of a rating downgrade that can make accessing capital from international financial markets more difficult.
So what should be the nature of India’s economic bazooka? We think and the Indian bazooka should be structured around gold for reasons that flow from behavioral science. While the bazookas from the Fed, ECB and the Japanese Central Bank and the respective governments have stabilized the financial markets and prevented panic in those countries, India does not have the luxury of printing money on the same scale that does not have some backing. Therefore, to create money (as the Fed has done), India needs to have something in place that is accepted by the rest of the world, behaviourally and emotionally. That something is either foreign exchange or gold.
India’s total foreign securities holdings since 2008 has increased by 80% as of March 2020 whereas the value of gold holdings has increased by 219%. That said, India’s rank in holding US Securities has increased from 19th to 13th in the same period. While India may claim a record high forex reserve, what does it constitute, it holds bonds whose value is depreciating, it holds currencies whose value is depreciating against gold. India’s external debt to Nominal GDP as of Dec 2019 was 20.1%, at $563.9 bn it was more than the total forex reserves. However, the comforting factor the reserves are more than four time the short-term debt, which is the standard measure to qualify a Sovereign’s position in meeting obligations. Whereas, China with $3.06

} 35
5th ANNUAL REPORT 2019-20 |
trillion reserves, its external debt is only 67% of total reserves and its short-term debt is 30% of the total reserves. And still it is 21% of the nominal GDP. Is this usable to aid India in the current crisis? We think FX needs to stay where it is to take care of external obligations. Bringing the FX into the local money circulation process would be an aberration. Also, a substantial proportion of it is a liability to repay NRI deposits and commercial borrowings.
Building a safety netWith the current playbook, India would only get trapped in a vicious cycle of debt that it creates in the process of stimulating growth by printing money, letting the currency depreciate, and increasing the risk of a downgrade (Moody’s already downgraded). While forex reserve management has a limited role here, however, India does have large reserves of private gold. And some of it is going to come back into circulation as people dip into their savings to tide over the present crisis. In addition, some well off people can also be persuaded to sell gold. With the growing significance of gold in the international monetary system makes it very important to think through the following:
With 102 of 189 member countries seeking grant from IMF, every nation is going through a financial crisis of similar severity at this point, and India should add a new dimension approaching the economic crisis. We need to consider building a safety net. The safety net that protects the country from ratings downgrades and, possibly inflation, – that can be a problem - amidst an increased flow of cheap funds (inflation in times of pay cuts will spiral down the growth), protect from a sharp currency volatility, increases the international investor confidence, reduces the risk of not having a good collateral. The safety net should go on to build an asset that stands as a collateral and not use the liability (government bonds) as collateral, this should happen without tightening the monetary policy. It could be done by mobilising gold from the Indian market as discussed above, thereby not creating a capital account transaction on the exchequer. Instead such mobilisation should lead to fuelling domestic investments. Also efforts to be taken for repatriating at least part of the gold held at Bank of England for postponing the burden on current account emerging from gold imports. In short India should explore ways that makes us the most dependable borrowers and make us the super-dependable Sovereign.
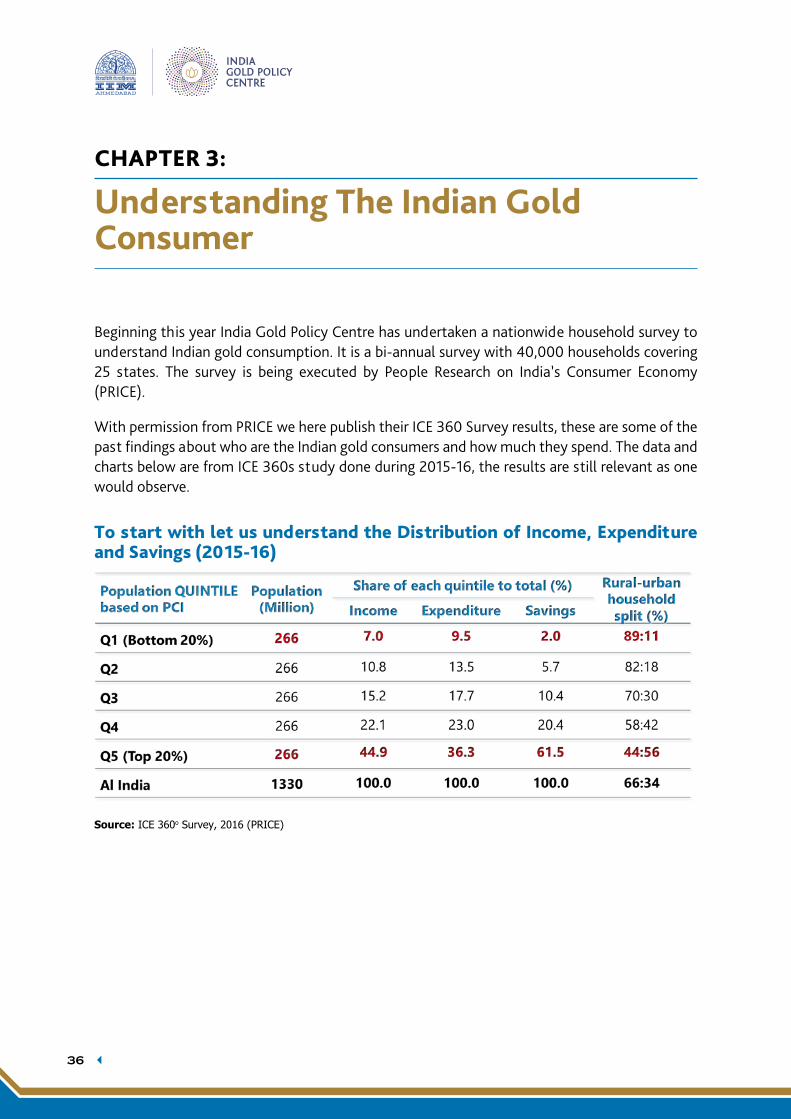
36
CHAPTER 3:
Understanding The Indian Gold Consumer
Beginning this year India Gold Policy Centre has undertaken a nationwide household survey to understand Indian gold consumption. It is a bi-annual survey with 40,000 households covering 25 states. The survey is being executed by People Research on India’s Consumer Economy (PRICE).
With permission from PRICE we here publish their ICE 360 Survey results, these are some of the past findings about who are the Indian gold consumers and how much they spend. The data and charts below are from ICE 360s study done during 2015-16, the results are still relevant as one would observe.
To start with let us understand the Distribution of Income, Expenditure and Savings (2015-16)
1
CHAPTER 3: UNDERSTANDING THE INDIAN GOLD CONSUMER
Beginning this year India Gold Policy Centre has undertaken a nationwide household survey to understand Indian gold consumption. It is a bi-annual survey with 40,000 households covering 25 states. The survey is being executed by People Research on India’s Consumer Economy (PRICE).
With permission from PRICE we here publish their ICE 360 Survey results, these are some of the past findings about who are the Indian gold consumers and how much they spend. The data and charts below are from ICE 360s study done during 2015-16, the results are still relevant as one would observe.
To start with let us understand the Distribution of Income, Expenditure and Savings (2015-16)
Source: ICE 360o Survey, 2016 (PRICE)
How Indians Saves and Invests (Penetration of financial instruments, in %, 2015-16)
Source: ICE 360o Survey, 2016 (PRICE)
Source: ICE 360o Survey, 2016 (PRICE)

} 37
5th ANNUAL REPORT 2019-20 |
How Indians Saves and Invests (Penetration of financial instruments, in %, 2015-16)
Source: ICE 360o Survey, 2016 (PRICE)
Distribution of total saving & investment (%) basis classification of area
2
Distribution of total saving & investment (%) basis classification of area
Source: ICE 360o Survey, 2016 (PRICE)
Gold penetration in the country (2011-16)
Who consumes the largest volume of gold: It is India’s top 30% in the income pyramid
70% of the gold is consumed by top 30% of the population.
Source: ICE 360o Survey, 2016 (PRICE)
Source: ICE 360o Survey, 2016 (PRICE)

38
Gold penetration in the country (2011-16)
Who consumes the largest volume of gold: It is India’s top 30% in the income pyramid70% of the gold is consumed by top 30% of the population.Source: ICE 360o Survey, 2016 (PRICE)
Source: ICE 360o Survey, 2016 (PRICE)

} 39
5th ANNUAL REPORT 2019-20 |
Reason for Purchase of Gold Jewellery: Rich vs. PoorAcross rich and poor, around half of the buyers purchased gold for purely for adornment purpose
A much higher share of rich households buy gold jewellery for gifting (Poor: 10%, rich: 17%) as well as purely as an investment (Poor: 0.2%, rich: 4%)
3
Source: ICE 360o Survey, 2016 (PRICE)
Reason for Purchase of Gold Jewellery: Rich vs. Poor
Across rich and poor, around half of the buyers purchased gold for purely for adornment purpose
A much higher share of rich households buy gold jewellery for gifting (Poor: 10%, rich: 17%) as well as purely as an investment (Poor: 0.2%, rich: 4%)
Source: ICE 360o Survey, 2016 (PRICE)
Source: ICE 360o Survey, 2016 (PRICE)
Penetration of gold by Quintile
4
Penetration of gold by Quintile
Source: ICE 360o Survey, 2016 (PRICE)
Penetration of gold by occupation (42% are self-employed, 20% are salaried, 32% are labourers)
Source: ICE 360o Survey, 2016 (PRICE)
15% 17
% 20% 22
% 25%
5% 6%
11%
15%
23%
Q1 (Bottom 20%)
Q2 Q3 Q4 Q5 (Top 20%)
Share of households (%) % of households purchased gold
8%
8%
10%
31%
36%
28%
15%
16%
12%
16%
9%
15%
9%
25%
7%
2%
1%
1%
17%
1%
5%
9%
4%
20%
Others
Labour (Non-Ag.)
Labour (Ag.)
Officers &exe.
Supervisor
Clerical
Grade 4
SE. (Prof.)
SE. (Nonprof.)
Shop owners
Petty traders
Cultivators
Share of households (%)
% of households purchased gold
Source: ICE 360o Survey, 2016 (PRICE)

40
Penetration of gold by occupation (42% are self-employed, 20% are salaried, 32% are labourers)
4
Penetration of gold by Quintile
Source: ICE 360o Survey, 2016 (PRICE)
Penetration of gold by occupation (42% are self-employed, 20% are salaried, 32% are labourers)
Source: ICE 360o Survey, 2016 (PRICE)
15% 17
% 20% 22
% 25%
5% 6%
11%
15%
23%
Q1 (Bottom 20%)
Q2 Q3 Q4 Q5 (Top 20%)
Share of households (%) % of households purchased gold
8%
8%
10%
31%
36%
28%
15%
16%
12%
16%
9%
15%
9%
25%
7%
2%
1%
1%
17%
1%
5%
9%
4%
20%
Others
Labour (Non-Ag.)
Labour (Ag.)
Officers &exe.
Supervisor
Clerical
Grade 4
SE. (Prof.)
SE. (Nonprof.)
Shop owners
Petty traders
Cultivators
Share of households (%)
% of households purchased gold
Source: ICE 360o Survey, 2016 (PRICE)
Penetration of gold by education
5
Penetration of gold by education
Source: ICE 360o Survey, 2016 (PRICE)
Penetration of gold by geography
Source: ICE 360o Survey, 2016 (PRICE)
8%
34%
16%
22%
18%
2%
4%
8%
13% 17
% 20%
11%
I l l i t e r a t e P r i m a r y M a t r i c H i g h e r s e c o n d a r y
G r a d u a t e & a b o v e
O t h e r s
Share of households
% of households purchased gold
8%
12%
18%
11%
17%
15%
23%
36%
19%
10%
17%
5%
5%
7%
Under-developedRural
Emerging Rural
Developed Rural
Rest of Urban
Niche Cities
Boom Town
Metro
Share of households
% of households purchasedgold
Source: ICE 360o Survey, 2016 (PRICE)

} 41
5th ANNUAL REPORT 2019-20 |
Penetration of gold by geography
5
Penetration of gold by education
Source: ICE 360o Survey, 2016 (PRICE)
Penetration of gold by geography
Source: ICE 360o Survey, 2016 (PRICE)
8%
34%
16%
22%
18%
2%
4%
8%
13% 17
% 20%
11%
I l l i t e r a t e P r i m a r y M a t r i c H i g h e r s e c o n d a r y
G r a d u a t e & a b o v e
O t h e r s
Share of households
% of households purchased gold
8%
12%
18%
11%
17%
15%
23%
36%
19%
10%
17%
5%
5%
7%
Under-developedRural
Emerging Rural
Developed Rural
Rest of Urban
Niche Cities
Boom Town
Metro
Share of households
% of households purchasedgold
Source: ICE 360o Survey, 2016 (PRICE)
Households who purchased gold coin/bar/bonds/securities during 2011-2016 periodHalf of India’s total households (50%) purchased gold at least once between 2011 and 2016. Out of those who purchased, 98% bought jewellery; 2.5% coin/bar and 0.7% securities/-bonds/ETFs. To note here is this doesn’t reflect the volumes but only what form of gold they purchased.
6
Households who purchased gold coin/bar/bonds/securities during 2011-2016 period
Half of India’s total households (50%) purchased gold at least once between 2011 and 2016. Out of those who purchased, 98% bought jewellery; 2.5% coin/bar and 0.7% securities/-bonds/ETFs. To note here is this doesn’t reflect the volumes but only what form of gold they purchased.
Source: ICE 360o Survey, 2016 (PRICE)
Some didn’t buy gold and what were the reasons
Source: ICE 360o Survey, 2016 (PRICE)
How Indians are monetising their gold: growth of gold loan in India
In FY2019-20, NBFCs, engaged in taking gold as collateral against loans, noticed a warm
welcome from the international investors. Muthoot Finance raised $550 million via dollar
bonds at coupon of 4.4%, following a successful $450 million raised in 2019. More
interestingly the bond was launched at 4.75%, however with the overwhelming interest from
international investors they could get at a lower yield. Mannapuram Finance in the same time
raised $300 million at 5.9% as against the initial offer at 6.25%. As per new reports in total all
0.9% 1.7%
4.7% 5.6%
Poor (Bottom 20%) Middle (Middle 60%) Rich (Top 20%) Top 10%
Source: ICE 360o Survey, 2016 (PRICE)

42
Some didn’t buy gold and what were the reasons
Source: ICE 360o Survey, 2016 (PRICE)
How Indians are monetising their gold: growth of gold loan in IndiaIn FY2019-20, NBFCs, engaged in taking gold as collateral against loans, noticed a warm welcome from the international investors. Muthoot Finance raised $550 million via dollar bonds at coupon of 4.4%, following a successful $450 million raised in 2019. More interestingly the bond was launched at 4.75%, however with the overwhelming interest from international investors they could get at a lower yield. Mannapuram Finance in the same time raised $300 million at 5.9% as against the initial offer at 6.25%. As per new reports in total all the NBFC’s together aim to raise about $2.5 billion from overseas bond issuance1. In the meantime, Rupeek an online lending platform has raised in total near $60 million since its inception in 2015.
So what is common about these companies that is getting the attraction of global investors? It is the portfolio of their retail loans which is largely backed by gold as the collateral. According to CARE Ratings the three year CAGR of top seven gold loan NBFCs (with AUM of over Rs. 1000 crores ) was 11.5% as of FY 20192. These seven NBFCs’ total advances were Rs. 70,500 crores, which is 15.8% of approximately Rs. 455,000 crores of Retail Credit given by NBFCs. This would imply an enormous potential in developing a secured credit portfolio by NBFCs, where gold is the collateral. Their revenues and profits are growing at a CAGR that is in excess of 10%. And the pandemic has led to a situation where they are likely to see a much higher level of business as people use their gold to generate cash in the post Covid days where liquidity for many people is a challenge.
Most of the Scheduled Commercial Banks have also built a sizeable portfolio in personal gold loan segment. Due to limited availability of data which were taken from the annual reports, we learn 1 https://economictimes.indiatimes.com/markets/stocks/news/5-nbfcs-plan-to-tap-overseas-market-for-raising-up-to-2-5-bil-lion/articleshow/68714912.cms?from=mdr2 CARE Ratings

} 43
5th ANNUAL REPORT 2019-20 |
that nine banks together provided Rs. 50,979 crores credit for the year 2018-19. Out of these nine only six banks have the data in public for atleast six years. Interesting to note that while the five-year CAGR of NBFCs was 9%, the banks grew more impressively at 25%. The growth for SCBs, one could attribute it to increase in bank account opening following demonetisation.
8
*SCBs data as provided in annual reports of six banks
** CARE Ratings covering 7 NBFCs
Source: ICE 360o Survey, 2016 (PRICE)
So where does the idea of a circular economy and gold come into this entire scenario? Circular
economy is taken to mean an economic system where resources are reutilised without
creating the need to produce it again. Globally it is estimated to create a $4.5 trillion
opportunity by 2030 according to a report presented at the World Economic Forum. In this
context gold holds a much greater significance if one is to look beyond the conventional
definition of circular economy. In India loan against gold is on top of the recall in relation to
monetisation and global investors are now eyeing this market. Betweeen Muthoot Finance,
Muthoot Fincorp and Mannapuram, there is an estimated 200 tons of gold sitting as collateral
on an annual outstanding basis. The entire organised lending where gold is a collateral may
have an estimated 1280 tons. And a reasonably large proportion of this circulates and is not
getting “monetized.”
In addition to NBFCs, there are Scheduled Commercial Banks, Co-operative Banks, Small
Finance Banks and Nidhi Companies providing credit against loan. To give a perspective, a
large private sector bank gave Rs. 5,900 crores as loan against gold. Another nationalised
bank is estimated to have given approximately Rs. 45,000 crores in FY 2019. Until recently the
Schedule Commercial Banks provided loan against gold under the priority sector lending as
13,637 12,344
27,067 28,465
35,306
42,707 45,672
48,723 50,800
57,407 61,615
70,518
-
10,000
20,000
30,000
40,000
50,000
60,000
70,000
80,000
2013-14 2014-15 2015-16 2016-17 2017-18 2018-19
Personal gold loan portfolio of Scheduled Commercial Banks* and NBFCs**
Scheduled Commercial Banks NBFCs
Uni
ts in
cro
res
*SCBs data as provided in annual reports of six banks** CARE Ratings covering 7 NBFCsSource: ICE 360o Survey, 2016 (PRICE)
So where does the idea of a circular economy and gold come into this entire scenario? Circular economy is taken to mean an economic system where resources are reutilised without creating the need to produce it again. Globally it is estimated to create a $4.5 trillion opportunity by 2030 according to a report presented at the World Economic Forum. In this context gold holds a much greater significance if one is to look beyond the conventional definition of circular economy. In India loan against gold is on top of the recall in relation to monetisation and global investors are now eyeing this market. Betweeen Muthoot Finance, Muthoot Fincorp and Mannapuram, there is an estimated 200 tons of gold sitting as collateral on an annual outstanding basis. The entire organised lending where gold is a collateral may have an estimated 1280 tons. And a reasonably large proportion of this circulates and is not getting “monetized.”
In addition to NBFCs, there are Scheduled Commercial Banks, Co-operative Banks, Small Finance Banks and Nidhi Companies providing credit against loan. To give a perspective, a large private sector bank gave Rs. 5,900 crores as loan against gold. Another nationalised bank is estimated to have given approximately Rs. 45,000 crores in FY 2019. Until recently the Schedule Commercial Banks provided loan against gold under the priority sector lending as part of its larger strategy to increase share of the risk-mitigated credit. Some of the banks even provide overdraft on gold holdings. As per the data published in the annual report of nine scheduled commercial banks, they together in the 2018-19 provided Rs. 50, 979 crores as personal loan with gold as collateral.

44
Thus, it would be fair to say that at least Rs. 300,000 crores are being provided as credit from organised lending route including both the retail credit and agri credit which is directly or indirectly related to gold as collateral. And those are short-term credits with the lowest default rate. Assuming average loan to value ratio at 70%, the total value of gold stored as collateral will be of value equivalent to rupees four lakh crores. This loan goes for a value added activity which could be installing a pump set for farming to starting a new business. And the institutions have more willingness to provide credit against a collateral that is liquid. Naturally it makes a business sense for investors to be part of this growth story by giving them access to low cost funds in international market with a three-year maturity.
We are here discussing only about organised market, the non-institutional sources of secured credit is just as big. They are all popular because of the intra- community lending. According to All India Investment and Debt Survey 2012 only following states had more than 10% of the debt in gold loans, Manipur (14.2%), Kerala (17.2%), Tamil Nadu (41.3%), Andaman & Nicobar (13.1%), and Puducherry (50%). Despite the high gold holdings, the non-institutional and unsecured debt is very high. The RBI Household Finance report has clearly shown the gains in income following shift from non-institutional credit to institutional. And if these are going to be backed by gold the gains could be higher.
Policy thought: Looking at the size of the market and the current need to infuse liquidity in the hands of the public due to crisis driven by Covid-19, gold lying with the Indian households provides a way to maintain credit flow and liquidity in consumption markets. If the gold in the hands of top 30% households can be mobilised it can be on one side be used for dollar swap and on the other, the depositor could be provided a low cost credit for a longer period. This is a privilege that only the Indian economy can consider.

} 45
5th ANNUAL REPORT 2019-20 |
CHAPTER 4:
Policies, Regulations and Market Innovations
Amongst the first personal digital assistants was the Palm Pilot in the 1990s. It was ahead of its time. Today, the mobile phone and email platforms performing all the functions that that the PDA was supposed to. A 100 years ago, in the early 20th century, electric cars and steam cars were competing with the internal combustion car. The electric cars could not get the ecosystem in place quickly enough and lost out to the IC cars. After a 100 years, electric cars are coming back for other reasons. If one is late with critical decisions or putting in place elements of an eco-system, then there is a good chance that one will lose out to competitors.
Recent research by Malmendier and Nagel1 showed that the experience of large macro-economic shock affected the long-term risk attitude of investors at large, and thus coined the phrase ‘Depression Babies’, relating to people from era of Great Depression. The study found that individuals who have experienced low returns on an asset class throughout their lives report lower willingness to take financial risk, and invest a lower fraction on such assets.2 It was largely in this context that RBI’s Household Finance Committee Report was able to allude to inflation volatility among other various reasons that influence long-term risk attitude to, and the Indian’s affinity to, gold. The report published in 2017 concluded with some policy recommendations on how to address the households’ demand-side problems.
Why financialisation of gold is important:Despite its unrecognised role, gold is not in the list of assets that RBI measures to evaluate household investment and debt. With an estimated 12% of household savings in the form of gold, the rest of the savings, investment and debt stats are of lesser significance to have a policy outcome that is effective, unless that 12% gets accounted. This means financialisation of the gold is the key to this and developing infrastructure like bullion banking, standardisation and spot exchange. The more government delays recognising its invisible role in the households, more the investors would seek privacy when investing in gold. A behaviour change amongst the population holding gold is required anyway; the longer the government holds off on the changed gold policy, the more difficult it will be to change behaviour through nudges and force is not something that a democratic government would want to use.
Nudging households and bring gold back into circulationGiven the state of the fiscal deficit, where the Central government is already at 115% of the budgeted deficit in the first 8 months of FY, 2020-21, it is necessary to highlight the importance
1 Depression Babies: Do Macroeconomic Experiences Affect Risk-Taking? Ulrike Malmendier, Stefan Nagel2 https://econpapers.repec.org/paper/nbrnberwo/14813.htm

46
of policy towards nudging households invest in and circulate gold responsibly as an alternative that can help bridge some of the negative effects of the deficit. It is a kind of preventive care to ensure nation’s fiscal balance, as it helps manage the household debt at time of economic downturn. And it is these savings that helps the economy stay afloat with minimum government intervention. For instance, if not for the gold that were being used as a collateral under priority sector lending for agriculture related activities, the NPA could have been much bigger, yet the interest rate subvention for such loan is being removed. If not for the gold the consumption and investment, spending could have dropped much faster, it is gold that is helping the households, many small and micro enterprises wade through the liquidity crisis, yet, bars and coins are not accepted as collateral. A large share of such credit is still from the informal and non-institution sector, and thus it doesn’t get directly accounted in the measurement of economic activity.
To put this in perspective, at the start of the decade, gold demand was firm despite price hitting new record highs, the expectations for a sustained price increase was similar to the current sentiment. However, a large amount of cash3 has gone into the rise in land prices till about 2017-18, as people sought privacy for investment, as a large source of land transaction was unaccounted.
Policy choicesIn the trade-off between the choices of bringing an end to privacy in investment and increasing tax collection, the loss has been to the exchequer. That being said, the investor traceability is not just an issue with India, according to various reports Germany was considering slash the cash purchase limit from 10,000 Euros to 2,000 Euros effective 10th January, and investors are queued up to buy gold ahead of the new regulations. A key question for the policy maker is that of the level of traceability that the regulation should insist on; the greater the level of regulatory oversight, the more will be attempts to circumvent without an appropriate mechanism design. An appropriate level will lead to more traceability and greater collections by the exchequer.
These behaviour aspects can’t be dealt efficiently by regulating the consumer but requires better design and delivery from an eco-system that provides the right set of incentives to all the players in the system.
Policies are just as good as its implementation and timing is criticalWhy is the time for getting in place a robust gold policy running out? The context for gold is changing, gold imports are now increasingly dore based; credible refinery accreditation and monitoring is limited; and customer behaviour with respect to gold is also changing. In India the year of 2019 was also the period when the informal refining and scrap collection centres has had best of the business in recent years while the formal tax paying businesses suffered as people took advantage of the rise in gold prices to exchange old gold for new. The loss of GST revenues and dollar earnings from potential exports of bullion are something that cannot be reversed. As parallel centres for gold trade and exchange become more powerful (Shanghai,
3 https://economictimes.indiatimes.com/news/economy/agriculture/great-rural-land-rush-3-to-100-fold-rise-in-farm-land-prices-may-not-bode-well/articleshow/25607513.cms

} 47
5th ANNUAL REPORT 2019-20 |
Singapore, Dubai), the space for the Indian system to create its own heft in the world gold markets decreases. In this context announcement of an International Bullion Exchange4 was important, but how fast it gets implemented is all the more important.
The recent circular from the Directorate General of Foreign Trade moving gold from ‘Free’ list to the ‘Restricted’ list is a long overdue measure for the reason that it otherwise was not possible to stop any individual or firm from importing gold unless with a license. It has given more room for RBI and DGFT to control the gold imports when it is seen necessary, for example by setting quota limits as in China. But so much more remains to be done.
Recently Bureau of Indian Standards notified the good delivery standards for both gold and silver in addition to the mandatory hallmarking for jewellery.
We are hopeful of more such phased implementati on at start of this decade and let open a new chapter for the Indian gold trade.
IGPC has outlined an ideal execution plan:
Phase 1: Revamping the GMS starts with setting the ground ready for service providersNudging needs to happen at two levels one at the household level and other with banks who play an important role convincing their customers to deposit their gold. For depositors it is foremost important that tax authorities don’t question them following the deposit and this deposit should be just as fungible as holding gold at their home/lockers. For banks it has to be a commercially viable business.
Sequence No.
Steps Action required and Nudge wherever applicable
1 Allow banks to do inter-bank dealing on gold and source from LBMA accredited refiners. Use a Blockchain based traceable platform where RBI is on the admin node.
Necessary modifications to RBI Act and Banking Regulation Act
2. Banks to be allowed to hedge even for non-GMS gold
Set limits to gold based liabilities that limits the exposure of banks; gives comfort to RBI
3. Allow banks to sell GMS gold on outright as well and not only leaseAllowing banks to sell investment coins and bars of less than 100 grammes, but not limiting to India Gold Coin. It helps them make good the cost incurred by paying depositors an interest.
Necessary modifications in RBI Act and Banking Regulation Act.
4 Viability of a gold exchange in India by Prof. Jayant Varma and Prof. Joshy Jacob, https://web.iima.ac.in/users/webrequest/files/IGPC/Viability-of-gold-exchange-report-final-edited.pdf

48
Sequence No.
Steps Action required and Nudge wherever applicable
4. Mandate operation of only BIS accredited Collection Purity and Testing Centres (CPTCs) and refiners in country.
All the other independent gold melting and refining units to be made illegal. There will be a time period of 180 days.
Introduce E-way bill that would automatically have track of all nuggets, bullion and jewellery. As jewellers would melt it in house and transfer the nuggets to artisans for making jewellery.
Scraps will move to CPTCs and Refineries directly from jewellers and scrap dealers.
Role of CPTC expands beyond GMS for which it was started, with increased turnover and profits, banks would get comfortable taking exposure on CPTCs by providing credit lines which doesn’t happen currently.
5. Allow banks to source gold locally as there will be supplies from accredited refiners.
Stop consignment imports and provide financing for bullion dealers
Benefit of stopping consignment imports is it would stop speculation on customs tariffs. However it is a step to be taken after local sourcing picks speed.
6. Only Banks to export bullion (only that of LBMA accredited refiners or refiners that take up responsible sourcing programme accredited by OECD). Only banks so as to reduce the leeway for round tripping activity.
Full duty drawback to be given. It creates incentive for more LBMA accredited refiners to start refining in India.
7. Have a common trading platform to monitor and create traceability of all the gold traded as banks will take on a important position in the supply chain.
Establish the spot exchange (covered in another table)
8. Develop a domestic gold lease market. This helps to make gold sourced through GMS be leased at a competitive rate compared to imported gold.

} 49
5th ANNUAL REPORT 2019-20 |
Phase 2: Once the ground is ready, work on the financialisation of gold: getting the customers on board for GMS – on a prospective and retrospective basis can start in more earnest.
SequenceNo.
Steps Nudge
1. Banks to be ready to open gold grammes account for retail customers
For customers no custody cost or management fees; can be used as collateral. For Banks, a clear regulatory change that makes it profitable for them to seek gold deposits. Requires a notification from RBI clarifying whether banks can allow open these accounts.
2. Product 1: Short- term product (can be a gold savings account; gold metal account; other financialized product)Product 2: ETF in GIFT-IFSC by a PSU bank and backed by government. Reason to back by govt is this gold can be leased by the fund to domestic market. It will be a capital account transaction for investors.
Investors get to buy gold without duty and GST, still making good of its fungible status.
3. Revamped GMS pilot launch Nationally communicated circular from MoF / CBDT to reassure consumers, Define an upper limitWhy people should deposit gold (they can get it back, gives them return; higher return option)
4. Following the learning from pilot launch, reach to tier 2 and tier 3 towns in first phase Interest rate at 3% for customers.Cost of refining which is currently at 0.6% would reduce because they would have achieved efficiency with increase in feeds due to formal flow through scrap. Total refining and logistics cost can drop to 1% from 1.2% currently.
Rules / Criteria on which kind of branches of banks in Tier 2 and Tier 3 towns can accept gold deposits.
5. Products for sustained GMS flow:Interest rate subvention for collateralising the gold. This unlike loan for gold products, here the jewellery will be melted down and credit provided at LTV of 80% of gold value. With a repayment period of upto five years. And one can redeem deposit only after five years. On timely repayment of loan one could start receiving interest on the deposit from the bank till the redemption of deposit.
Banks have to mandated that a certain percentage of total lending should be through this mode, ideally be clubbed with retail credit.Benefit: This would be a bigger success than providing interest to depositors.A proper KYC and creating disbursal of credit from specified branches which will be a part of central network can ensure people don’t misuse the scheme. For instance an individual may be allowed only once in five years. The loss from melting jewellery may prevent one to exploit it.

50
GMS products for various age groups:Baby Boomers and Gen X: 1. Individuals, households and institutions eligible under GMS may be allowed to deposit gold
in any form and take loan against it at an interest rate lower (for instance 7%) than market rate subject to condition that it will be held under the Medium or Long term deposit. In this process depositors are able to reduce the household debt by switching from high cost debt to lower, this would have a positive outcome on their financial surplus. Also there is no cost to government as interest pay out for GMS depositors in MLTGD.
2. Gen X continue to be one of the large investors in gold as they plan for their retirement, look at ways to protect their wealth, and plan for big spend that would come up at later stage for the education and wedding related expenses for their children. Shifting the savings to gold savings products (as described in serial number 2 of financialisation of gold) will reduce their cost of purchase (as it excludes duty and GST), secondly it can be redeemed only at the time of converting to jewellery or encashing and the effective duty and GST would apply.
Millennials: 1. E-gold: Various organisations facilitate investors to hold gold in demat form instead of holding
it in their own lockers. It would be prudent to consider moving this gold into circulation as part of the GMS, whereby investor earns interest from bank on agreeing to deposit it under GMS.
2. Product 1 and 2 as described earlier in serial number 2 in Financialisation of gold
Phase 3: Starting a spot exchangeBy the time a spot exchange is started bullion banking, standardisation and transparency would have started taking shape with introduction of least amount of regulations. And GMS would have led to an increase in the level of gold available that can then flow through the spot exchange. (It is also possible that the spot exchange allows the GMS to work more effectively).
Sequence No.
Steps Action required
1. Government could consider launching a SPV with partnership from derivative exchanges and financial institutions.The derivative exchanges will ensure success of the spot exchange; with just a single exchange volume will not be split.
New spot exchange regulation to be regulated by Precious Metals BoardInitial membership by open invitation and the top twenty volume providers could be offered membership at 50% concession one year after starting the exchange.
2. Precious Metals Board Definition of key clauses; membership guidelines; standards / denomination of gold that can be traded.
2. Launch of physical delivery centres across India with various vaulting agencies mutually agreeing to accept each other
Changes to regulations like WDRA
3. Launch of T+0, T+1 , T+2 and deferred contracts
Detailing the Spot Exchange Act.
4. Defining relationships between banks and the spot exchange. Banks that are in GMS should ideally get preference to become members of the spot exchange
Spot exchange regulation to be in place. Make necessary modifications related to risk management and trading for banks through notification by RBI.

} 51
5th ANNUAL REPORT 2019-20 |
A solution driven policy approach we understand can be a better sell India Gold Policy Centre has been working with Chainflux Technologies to explore the possibility of creating a platform. It was grateful of Abhinav Ramesh to volunteer and invest his time and resource to conduct the exploratory work by talking to stake holders across the value chain and coming up with white paper on how Blockchain technology can be used as a strong traceability backbone for the gold industry in India, right from refiner to jeweller. It was a 18-month long effort. Using Blockchain technology, a tamper-proof and auditable ledger can be created which would enable the the promotion of “Indian Good Delivery Standard”, as well as potentially streamline the data flow for the Gold Monetization Scheme (GMS).
To-be scenario with the Blockchain platformFrom the point of Dore import to the creation of the finished Bullion bar, data on source verification and Good Delivery are added by the refiner, shipping company, transport provider, vault, and the assay lab. This data is audited in real time by the regulator. This platform becomes the backbone for the India Good Delivery Standard. Sale of the bullion bar to hallmarking of jewellery is the second half of the traceability process, and similarly data on hallmarking, usage of the gold, sale of the gold is recorded on the platform. When customers deposit gold as part of the GMS, the data sharing and access permissions between vaults, refiners, CPTCs, banks are made instant and secure; the customer experience is made optimal through digitization and potential process modifications to encourage greater deposits.
BenefitsThe SHINE5 Blockchain platform creates closed network for gold movement which would reduce gold smuggling, terror financing. Through Traceability, SHINE creates the foundation and platform enabler for Indian Good Delivery Standard; further to the India Good Delivery Standard, SHINE creates the basis for enabling banks to source locally, hence propping up the Indian gold market which till now relies on gold imports; This can further lead to the creation of bullion banks, followed by the gold spot exchange. The upcoming gold spot exchange can use the data from the traceability platform to authenticate all gold settled on the exchange. This platform enables banks to see real time authentic data on gold movements between various parties, hence enabling banks to provide the much needed credit lines to the Gems and Jewellery industry. In addition to the above benefits, SHINE provides the platform to streamline the data coordination in GMS, and provides customers with a good user experience to participate in the GMS.
Regulatory changes that came into effect in FY 2019-201. Customs duty on gold and gold dore was increased to 12.5% and 11.85% respectively at the
Federal Budget in July
2. On 26th September 2019, the Directorate General of Foreign Trade issued a notification that banned export of gold medallion, coins and jewellery that were fully machine made. The purpose was to stop interest arbitrage trade and for taking interest rate subvention benefit being a MSME exporter. The notification although wasn’t rescinded but a PIL file by an Exporter against DGFT and a subsequent order on the same made this notification not valid.
5 SHINE is name of the platform named by Chainflux Techno

52
3. On 18th December 2019, the Directorate General of Foreign Trade amended the import policy conditions for gold and silver by classifying it under “Restricted” list from “Free” list. It was seen as a radical move to keep check on imports from countries with which India has Free Trade Agreement.
4. On 18th December 2019, a self- attested copy from exporter was considered accepted instead of proof of export copy issued by customs.
5. On 15th January 2020, Ministry of Consumer Affairs issued a gazette mandating that effective 15th January 2021 all jewellery sold in the country have to be hallmarked.
6. On 12th February 2020, a revised version of Banning of Unregulated Deposit Schemes Act, 2019 was released which was focussed on punitive measures.
7. At the Federal Budget 2020, Finance Minister announced setting up of International Bullion Exchange.
8. All the Scheduled Commercial Banks were advised by RBI to give agriculture loans against gold as collateral only with Kisan Credit Card account holders (which as per March 2019 data was 66.2 million6). That move was very important to stop misusing the interest rate subvention that came with it.
9. The Bureau of India Standards notified the India Good Delivery norms for bullion.
Indian responsible gold sourcing workshopAt self regulation level, National Stock Exchange of India took the initiative to launch gold contract deliverable by BIS accredited refiners subject to following the responsible guidelines as stipulated by the OECD. We are seeing other exchanges Multi-Commodity Exchange and Bombay Stock Exchange also trying to walk similar path. In this context important to bring the relevance of Indian responsible gold sourcing workshop which IGPC organised in coordination with the OECD on 6th December 2019 with support from India Bullion and Jewellers Association.
Outcomes, commitments, & milestones set at the conference:1. The meeting aimed to progress conversations about the implementation of international
standards on responsible sourcing of gold in India, particularly on the completion of the India Responsible Sourcing Guidelines (IRSG), training and capacity building needs, and implementing responsible sourcing audits of gold refiners in India.
2. Participants to this multi-stakeholder workshop included representatives from the Indian government, OECD governments, and Indian and international gold supply chain representatives from banks, refiners, bullion dealers, jewellers, manufacturers, consumers, industry groups and responsible sourcing programmes.
3. Participants in the workshop convey broad support and agreement on the following points
a. To promote Responsible sourcing of gold and ensure implementation of international best practices on responsible sourcing in India.
6 https://www.rbi.org.in/Scripts/PublicationReportDetails.aspx?UrlPage=&ID=942#CP23

} 53
5th ANNUAL REPORT 2019-20 |
b. In order to promote global coherence and acceptance, responsible sourcing standards and systems in India should be aligned with the OECD Due Diligence Guidance for Responsible Mineral Supply Chains (the OECD Guidance), while taking into account the distinct characteristics of the Indian market. As stipulated in the OECD Guidance, while all actors in the supply chain have their own role for due diligence, third party audits should focus on refiners of gold. Refer to the OECD and RMI for the definition of ‘refiner.’
c. The IRSG should provide broad recommendations for all actors in the supply chain, with a specific focus on refiners, bullion traders & wholesalers, jewellery manufacturers and retailers.
d. India has a large domestic market for recycled jewellery that is generally considered to be low risk material for refiners’ due diligence purposes.
e. At the same time, specific IRSG would be beneficial to cultivate more local ownership and support, in particular from other segments of the supply chain (Indian bullion traders, wholesalers, jewellers and retailers), and completing the IRSG is an urgent priority.
Participants in the workshop commit to the below follow-up actions: a. Complete the IRSG, drawing from work already carried out by members of the Indian
Responsible Mineral Sourcing Working committee, the derivatives exchanges and domestic banks (India Bank Association / India Bullion Bank Association.
b. Implement responsible sourcing audits of refiners in India as soon as possible.
c. Raise awareness and promote the OECD Guidance and IRSG, and ensure appropriate implementation, training and education in India.
d. Provide critical analysis of the Indian gold supply chain and work closely with the stakeholders of the supply chain to support meaningful monitoring and oversight. One example could include setting up a common due diligence assistance programme, to support common risk assessments of countries and mines. This can include research on gold flows and risk, as well as surveys into company uptake and implementation of the OECD Guidance and IRSG.
e. Industry organisations will inform the Government of India on progress of the above. The Government of India is encouraged to consider, as appropriate, including the standards on responsible sourcing of gold, as aligned with the IRSG and the OECD Guidance, in its relevant policies and approaches, in particular as it relates to licensing or regulating refiners, the nominated agencies, and creating a gold spot exchange as part of an India Good Delivery standard.
f. The OECD will support help in development of the IRSG and will facilitate consultation with international markets, industry associations, in order to help ensure alignment with the OECD Guidance. Depending on the outcome, the OECD will also engage to support cross-recognition of IRSG with existing industry programs like RJC, LBMA, RMI, and DMCC.
For more information on the discussion points and IRSG please contact India Gold Policy Centre, contact details on cover page.

54
CHAPTER 5:
IGPC’s Gold & Gold Markets Conference February 2020
India Gold Policy Centre at IIM Ahmedabad organised its 3rd annual conference on gold & gold markets at the India Habitat Centre, New Delhi on 7th and 8th February. The conference was a mix of presentations and discussions from industry practitioners and academia, making it a platform for deliberating on core policy issues, generating new ideas for research and bringing together thought leaders to create a playbook for Indian gold trade.
The event was inaugurated by Shri K. Rajaraman, Additional Secretary at the Department of Economic Affairs, Ministry of Finance. At the inaugural address he asserted the need for trade to act responsibly and work towards removing the black spot that has mired the industry. Urged to explore how technology can be leveraged to streamline the industry, explore the incentive mechanism to get on board more organised players and promoting ethical business. In relation to the research areas, he asked for directed research so as to answer very specific questions. For instance, try get answers as to why jewellers oppose hallmarking, how value addition is to be created for economy, how exports can be increased. Urged IGPC to institutionalise the interactions with the industry, trade bodies and jewellers and get them on board to our policy thought process. Widen the policy work and bring in the interest of other departments in the ministry as well.
The conference was started with an introduction to the IGPC’s Household Gold Consumption Survey that is being administered by People Research on India’s Consumer Economy (PRICE). They presented some of the findings of their 2014 and 2016 study which went on to show that 70% of the consumption is driven by 30% of the population.
In aggregate there were 27 presentations, this included academic papers and topics related to developing export market, usage of Blockchain technology for bringing transparency in the value chain, and on how technology is being leveraged for personal gold loans.
Papers with academic interest were on spot and derivatives market and analysis of factors influencing the prices, the presentations had a greater focus on relating theories of consumer behaviour and decision making models to the consumers of gold, relevance of gold in the GATT, bullion banking, mining potential in India and regulatory challenges, scope of gold refining in India, credit model of jewellery retailers, statistical analysis of trump tweets and its impact on asset classes, sustainable skill development, studies about artisans and migration, and a case study on how gold holdings has helped a silk weaving community.
} 55
5th ANNUAL REPORT 2019-20 |
Four panel discussions were organised with speakers from the trade which included refiner, bullion dealer, jeweller, and banker. In addition, there were generalists with interest in gold markets that includes wealth advisor, lawyers and auditors engaged with gold and jewellery industry and other new age business service providers. The discussion on derivatives and international bullion exchange involved introspection of volume stagnation in Options and lack of consistent growth in futures volumes, the discussions highlighted on the relevance of the contract size. Greater emphasis of the discussion was on taking forward the India Good Delivery standards and exploring opportunities with start of an international bullion exchange at the IFSC in GIFT City. Second panel discussion deep dived into understanding about consumer choices, their decision making and how the two new age business on the panel were coping with the challenges. Third panel focussed on increasing the bar on compliance, with discussion focussing on the urgency of India comply with FATF guidelines at a time when precious metal sector is seen to increase risk to the membership status. This brought back the topic on Prevention of Money Laundering Act and the failure in pushing through minimum transaction limits. The deliberations also extended to subject on environmental aspects and labour policies followed by jewellery manufacturers. The final discussion was on developing a vibrant gold lease market, on the panel were bankers, refiner and a jeweller. This subject was discussed in an open forum for the first time. With just 10% of total gold imports constituting the Gold Metal Loan market it was intriguing how that was being used against the development of Gold Monetisation Scheme. The discussion went on to answer how to develop a lease market by letting banks source locally, eventually incentivising managing gold received under Gold Monetisation Scheme. One of the banker left a food for thought before concluding this session by asking how is it that a jeweller’s cost of borrowing is less than that of government’s borrowing cost.
The two-day conference concluded with encouraging academia to exchange ideas and asking IGPC to post top ideas that needs to be presented at the conference next year.
In the section later we have provided a brief about the twenty papers of the twenty seven that were presented at the conference.
1. Is gold a luxury product? An empirical study Dr. Rajesh Shukla, PRICEThe results of this study was based on surveying 60,332 households. The survey was done during 2014 and 2016 covering 165 rural districts and 487 urban cities/towns. It was interesting to observe that 87% of the households owned some amount of the gold. Wedding is apparently not the main motive, it is rather other social purposes that has outweighed the reasons to purchase. Considering that the bottom 40% of the population used gold as a collateral at time of financial crisis or medical emergencies, was clearly an indication that it is the absence of adequate social security or financial savings, that has encouraged people to buy gold. That being said, it helped conclude that in value terms the top 30% of the population bought 70% of the gold sold in the country.
The research helped identify the target audience to whom the Gold Monetisation Scheme is to be marketed. For that matter it was reasserting when one looks at the retail customer profile of the Gold Deposit Scheme, which was largely the wealthy households.

56
2. Financial market evidence of gold’s special role in India, Prof. Dirk Baur, University of Western AustraliaThis paper analyzes the economic and cultural role of gold in India from a financial perspective and finds that some Indian firms and their exposure to the price of gold is unique. In India if the price of gold increases consumer sentiment becomes more positive due to a wealth effect and has positively affected the business of firms in the retail sector. It also established the link between share prices and gold prices, which went on to prove scientifically that the link is stronger if share prices go up than if they go down implying a positively skewed asymmetry in the link. Gold’s economic role was reasserted by the wealth effect it has created more specifically when prices go up, also its relevance as a collateral goes up with higher prices.
This work holds greater significance when one has to consider portfolio allocation. The finding that gold jewellery demand is price inelastic when share prices are higher, suggests the influence of liquidity in hand to gold demand. We could also see this confirming to the empirical study by PRICE according to which large part of the demand is occasion driven and that the big spend is driven top 30% of the population.
3. Forecasting short run gold spot prices in India using mixed frequency models. By Varun Yadav, IIMAThe objective of this research paper is to increase the accuracy in gold price forecast (in Indian rupees) by using predictor variables (i.e, various macro factors) which are released at different frequencies. To achieve this, Mixed Data Sampling Regression model was used. The margin of error identified with such forecasts was found to be less than a percentage.
The forecast model has the scope for suggesting ideal date for listing a tranche of the Sovereign Gold Bond or even if RBI wants to plan adding gold to its reserves.
4. Price Discovery in Indian Gold Markets, Himanshu Sharma, Bank of America and Abhishek Haider, IIMAThis study explored if efficient market hypothesis allows for price discovery of gold spot prices from gold futures and volume traded in market using monthly data from 2009-2019. Results show that the lagged volumes of traded gold stocks do not affect the futures or spot prices of gold. Rather, the lagged futures prices cause change in spot prices of domestic gold prices.
The findings here help establish that the Indian market is primarily a price taker due to lagged price reaction. That being said it also shows the scope in arbitrage trading between MCX and Comex.
5. Round the clock International Price discovery of gold. Neharika Sobti, Department of Financial Studies, University of DelhiThe research paper studies an attempt to understand who sets the international price of gold across 24 hours by examining intraday dynamics of price discovery among major gold markets and instruments– gold futures of New York, Shanghai, Tokyo, Mumbai, Dubai, Istanbul, London

} 57
5th ANNUAL REPORT 2019-20 |
along with two main gold spot platforms, largest gold ETF and US Dollar during six non-overlapping time zones in a trading day.
The study was able to prove that the transaction cost, trading volumes, and volatility are the key drivers of be considered a price maker. The New York COMEX was found to take the lead in international price discovery across all six time zones. This was despite the fact that India and China contributes to more than 50% of the global gold consumption. On a policy perspective this study reasserts that creating the right market infrastructure, a rationalised tax structure and capital flow with limited restrictions are the only way gold traded in Indian exchanges can have an impact on international prices.
6. A study of behavioral pattern of physical stocks and deliveries in Indian gold futures market By Dr. V Shunmugam and Tulsi Lingareddy, MCXIn August 2019 contract MCX recorded the highest deliveries of gold at 5.16 tonnes, this was following a customs duty increase in July and at the same time price had increased with demand collapsing. The deliveries generally increase with increased price spread of futures and spot market volatility though at a relatively slower pace. The exchange platform is used by the hedgers to deliver gold increasingly during the periods of higher spot market volatility and under contango market condition. That said, the extent of aggregate gold deliveries on MCX are markedly high at about 0.3% of total volume compared to about 0.01% on SHFE and other international exchanges.
The study helped conclude that when there is a rise in spot price volatility more than that of futures, gold stocks with the exchange warehouses also increase at a lower magnitude thereby suggesting increased use of futures by the hedgers intended to give delivery on the exchange.
On a policy perspective the study helped to impress upon the view that opening up the export market would have helped bring in higher dollar revenue as the traders could have been better of exporting than deliver to the exchange.
7. Gold traceability, GMS, bullion banking and trusted SIP’s using block chain technology. By Abhinav Ramesh, Chainflux TechnologiesThis paper proposes the use of a first-of-its-kind platform - SHINE - which relies on innovative protocols built on a consortium Blockchain network that brings transparency to India’s gold industry. This is in an effort to solve this sector’s traceability shortcomings, blockchain technology can be made use of to guarantee the provenance of gold as it makes its way into a market and enters circulation. The advantage of blockchain is its ability to safely and transparently transmit data downstream as gold transforms during its movement across a supply chain.
SHINE is being designed to put India’s gold industry on the world stage and at par with international bodies on the back of technology that ensures transactional efficiency and enhanced trust in an otherwise unorganised industry.
With regulators on the admin node of the chain they get to view the complete transaction with least interference. Also it helps reduce tax pilferages, thereby increasing government’s revenue from the industry.

58
8. Preferences, use and impact of gold savings product in migrant corridors. By Shashank Sreedharan and Jithin Jose, LEAD AT Krea UniversityKerala’s state economy is heavily reliant on international remittances from migrants in Gulf Cooperation Council (GCC) countries. And Kerala is one of the largest consumers of gold in the country with highest per capita consumption. This study was focussed on understanding the short-comings that dissuade consumers from using Gold Link Deposit Products, their willingness to invest in non-ornamental gold investments, and what are the type of gold products they would be interested in future.
Taking into consideration how digital gold can be utilised for GMS, the survey results was in a way validation that the gold in digital form should also be considered as a collateral. To do this first some broad contours for operation of digital gold needs to be defined, which doesn’t exist currently. Which can help further the reach of this product. It re-emphasised the role of banks in implementation of Gold Linked Financial Products and Gold Accumulation Plans.
9. Enhancing global presence of jewelry products – Key international marketing development models, India’s penetration in world market for gold and silver jewelry, available government benefits w.r.t. marketing, promotion and branding. By Sabyasachi Ray, GJEPC IndiaThis presentation by GJEPC detailed about the penetration of Indian gold jewellery in global markets while also explaining the untapped opportunities and the potential for increasing the share of exports. Also it touched upon the various government incentives to promote the trade. For researchers it was an opportunity to dwell more into this subject and exploring research scope in area of marketing and structuring trade finance.
10. Should gold continue to hold relevance in GATT? By Arjun Raghavendra, Legal Counsel and former IRS officerThis paper looked into the outcomes of including gold in the various Free Trade Agreements and Comprehensive Economic Partnership that India has signed with various regions and nations respectively. Gold unlike any other commodity is fungible, a characteristic which makes it prone to be misused on inclusion in the trade agreements, more so when there is a customs duty applicable on gold in India. The conclusion was country of origin and value addition clause of 35% is mandatory when it comes to adding gold and its products in the bi-lateral and multi-lateral trade agreements.
11. The role of family members in gold buying decision – an empirical study using correspondence analysis. Girish S Pathy and Hareesh N RamanathanThis research was first of the type in our knowledge which has tried to identify the definite roles of family members in gold purchase decision. This study was done for a specific district in Kerala, the results shows the research has scope for a wider coverage. The outcome of the survey was insightful and can help design communication strategies for various gold products and for promoting Gold Monetisation Scheme.

} 59
5th ANNUAL REPORT 2019-20 |
12. Analysis of consumer behavior: a special reference to gold jewelry purchase by Dr. Aanchal AmitabhThe research using factor analysis was able to list down eight factors that influenced decision making of consumers in purchase of unbranded jewellery. The survey for the research was limited to a small region however there is a scope and need to expand this work across major consumption centres in India. The findings from the research is of greater significance for the industry specifically for the small and medium size retailers, a large section of who have traditionally commoditised their offering to the customers. The weightage that was derived for each factor indicates that if the retailers are able to think on similar lines and position their offering to customers it can add significant value to their offerings.
13. Whether President Trump Tweets are noise or not - a study of the impact of President Trump tweets on financial markets using NLP & machine learning”. By Ms. Anuradha Poddar and Ms. Renisha Chainani, India Gold Policy Center at IIM AhmedabadTwitter has been becoming a key source for accessing freaking information and events, and this medium of Alternative Data as a New Normal is used by global investors to beat market returns. This Empirical and Conceptual Research paper looks at the impact of Tweets of US President Donald Trump on the Hourly Closing price data of various financial assets. Twitter Sentiment analysis was done on 500 sample tweets about US Economy, US Financial Markets, and American foreign policy, selected through Natural Language Processing from the population of more than 7080 tweets posted by him in the year 2019.
On differentiating the tweets into negative and positive tweets, the impact on various asset classes including gold were calculated. The conclusion of this work was while a positional trader could ignore the tweets however scalpers and tactitcal traders stand to gain significantly from the short-term volatility from these tweets.
14. Impact of Financial Knowledge in Ascertaining Risk Appetite and Risk Tolerance of Gold Investors- A Test of Expected Utility Theory. By Dr. Vandana Panwar, Prin. L. N. Welingkar Institute of Management Development & ResearchThis survey based research was helpful in validating the importance of financial literacy in assessing the risk tolerance of individuals. The study was basis the choices between physical gold, jewellery, gold coins, gold certificates, ETFs, Gold Mutual Fund, Digital gold, and derivative products.
The findings were that with the risk tolerance was different with various age groups and there was significant difference between the risk tolerance of male and female. The study however had its limitations thus isn’t concrete to be generalised. The attempt however was helpful in factoring in this element while designing the products and also while positioning the same for Gold Monetisation Scheme.

60
15. Understanding working capital requirement of Indian jewellers. By: Pooja Thakker, India Gold Policy Centre at IIM AhemdabadThis case study investigates the challenges faced by small & medium-sized Indian retail jewellery firms in working capital financing as well as challenges faced by bankers in giving credit facilities to the jewellery industry. The study was undertaken using primary data by interviewing various stakeholders of the industry as well as secondary data like analysing the financial statements. Financing has been cited as one of the most common problems faced by the gems & jewellery sector and is often viewed as one of the main barriers to growth and expansion.
Jewellers reported various challenges like high-interest cost, collateral requirements, cumbersome documentation process, delay in loan disbursements, availing the bank credit. On the other hand, banks primarily showed trust deficit existing in the trade with evidences supporting their claim understatement/overstatement of financial records and past financial performance, insufficient information disclosure, difficulty in recovery of bad debts, and inventory frauds. The analysis of the financial statements taken from MCA filing helped us validate the bank’s view point.
For the jewellery industry to move ahead and access bank finance at ease they need to bring more transparency in their business and disclosures in the financial statements. Given that the business holds inventory that is very liquid, mechanisms to track the movement like Unique Identification number for each piece of jewellery in inventory or insurance were seen as the possible way forward.
16. Creating a market for Indian refined gold: a survey. By Prof. Paramita Mukherjee, IMI Kolkata and Prof. Vivekananda Mukherjee, Jadavpur University, Kolkata.This research work comprehends about the gold refining market in India by explaining the complete value chain. The study was based on direct interviews of refiners, bullion dealers, jewellers, dore suppliers, and market experts across various regions in India. It tried to answer the questions related to the need for a differential duty structure, policies related to import of dore, the margins in the business, employment, responsible sourcing, quality standards. Additionally, this work helped understand the areas of government intervention and the prospects of gold refining in the country.
17. Gold exploration and mining in India: current status and the prospect. By Dr.Prabhakar Sangurmath, Former Executive Director, Hutti Gold Mines Co Ltd. Kapil Shukla, IIMA; Minal Marathe, IIMA
This paper on gold mining in India provided insights on the potential of gold mining in India. An estimated 585 tonnes of recoverable gold has been identified, however the exploratory mining and mining feasibility studies to reach a mineable reserves have not been done yet. This paper documented in detail the identified reserves, challenges in getting license to explore and mine, reasons why FDI is difficult with current policy, the Effective Tax Rate. The research paper also

} 61
5th ANNUAL REPORT 2019-20 |
compared with international mining norms and the gross value addition of gold mining in various countries and the potential value add for Indian economy.
18. A sociological study of goldsmiths of Bengal: migration, artisanal entrepreneurship and social mobility. By Prof. Anandita Chakrabarti, IIT Kanpur and Ms. Sruit Kanungo, Symbiosis Law School, PuneThis was a first of the kind research which documents what has made the Bengal the hub for supply of skilled artisans for all over India. The study further explores the impact of migration, and entrepreneurship drive of their artisans, and how they move up the value chain from an Apprentice to a Master Craftsman while passing the skills to their juniors. The research was undertaken through fieldwork by interviewing the artisans and their families in various districts of West Bengal. It explained the guild-like system and went on to explain how mechanisation is taking away part of the jobs. That being said, it also exposed their work environment reducing the average life span of goldsmiths.
The skilled craftsmen and their next generations are gradually losing their interest to continue work in the same field due to policy hurdles and lack of growth since 2016. Thus it has left a very pertinent question on who will be the next artisan
19. Our ears have been bare since then: gold ownership in a raw silk producing town through the economic reform period. By Ms. Nithya Joseph, French Institute PondicherryThis field based study covering gold ownership in a raw silk producing town Ramanagaram in Karantaka looked into the gold ownership characteristics and how the local businesses were using the household gold to fund their working capital requirements. The study showed the increased reliance on informal banking for loans and higher interest rates that they have to pay for raising funds. This was a re-emphasis on the importance of spreading the reach of retail gold loans through banks and financial institutions. Interestingly, although some of those the researcher discussed with were not availing the priority sector loans.
On a policy perspective this provides evidence for the need to introduce gold based savings products and its penetration is more required in smaller towns to support small businesses.
20. State Policies in India and the Gold Industry: Exploring the Labour Process in the Gold Jewellery Making Industry in Kerala, India. By Dr Sumeetha.M, Christ University, BangaloreThis research gets deeper into understanding the labour standards and process in the jewellery manufacturing in one of the country’s largest jewellery manufacturing hubs in India. It explained the reliance on migrant workers and the pigeon-hole workshops in which the artisans operate. This work has helped document the process which indirectly makes one appreciate the reason for pilferages in the system.

62
Panel 1: Stepping up the product offerings in gold derivatives, and importance of International Bullion Exchange at IFSC in GIFT CityOn the panel were:
◊ Viral Shah, India Infoline Wealth & moderator for the panel
◊ Shivanshu Mehta, MCX
◊ Nagendra Kumar, NSE
◊ AmitSuman,MMTC-PAMP
◊ ChiragMehta,QuantumMutualFund
The highlights of the discussion
i. New product offerings likely to come in the next 2-5 years that would propel the growth of the derivatives market in India
ii. Setting up of International bullion exchange at IFSC in GIFT city
iii. Initialization of Responsible gold sourcing in India by NSE and its implications for India
Key takeaways from the discussion:
a. Introduction of products from various Multi Asset Allocation funds to pave way for higher volumes and open interest in the far month contracts
b. Options to be seen as a high leveraged product and not to hedge, unless it is physical settlement
c. Increasing delivery centres would be the next in the plan of exchanges with launch of India Good Delivery standard
d. Participation can increase only from those with unhedged inventories, for instance in case of refineries most price it after refining due to the arrangement with supplier
e. Gold ETF can only be physically backed, future backed ETFs are failure due to the roll over cost. A dollar denominated ETF in IFSC might click among high net worth retail investors.
f. International Bullion Exchange, it was too early for panelists to comment on how it is to function. As long there aren’t too many regulatory hassles it can become an easy start was the consensus.
g. National Stock Exchange took the opportunity to explain their initiative related to launch of their Indian refined gold product, which not only covered the quality parameters specified by BIS but also takes into account the responsible sourcing. This as highlighted was the first time where a refiner was getting into a contractual agreement with the exchange, whereby refiner is held responsible.

} 63
5th ANNUAL REPORT 2019-20 |
Panel 2: How new generation players are shaping gold and jewelry trade as consumers move from a collectivist to an individualistic cultureMembers of the above panel were:
◊ ProfArvindSahay,Chairperson-IGPC,IIMAandmoderatorofthepanel
◊ Rhea Chaterjee, Safe Gold
◊ Prasad Sahane, Rupeek
The key points discussed were
i. How safegold functions
ii. Role of Rupeek
iii. Methodology used by safegold to test the percentage of gold in the jewelry
iv. Does Rupeek continue with the traditional method of appraisal
v. How does the functional purchase take place at Safegold
vi. Safegold and Rupeek’s customer profile
SafeGold: Safegold is a platform that makes it easy for people to buy fractional digital quantities of gold, even with as low as one rupee. One can buy a 24K gold of an amount as low as a rupee. One can liquidate it anytime without even taking delivery and the window is open 24/7. Physical delivery is provided only when volumes are at a minimum quantity. The transactions can be done through mobile wallets or online banking. It is 100 percent physically backed. The owner of gold can exchange the units with any of the Safegold partners with physical jewelry. Non requirement of demat makes it lot more convenient for many customers.
Backend operations at Safegold: Custodian, Trustee model has helped build integrity within the system, ensuring customer’s gold is always secured.
SIP on gold: The key benefit of holding gold digitally is that the customer can purchase can accumulate and as per their requirement, they can redeem it in the form of coin, jewelry or funds as and when they want it subject to terms and conditions . In short, it is a structured asset, has a secured trustee and an independent custodian. As of now, safegold has been partnering the kirana stores, mobile wallets, financial savings platform etc. Thus their customers are across rural and urban sectors across the country.
Customer profile: Digital gold started getting popular through mobile wallet service providers and cashing on the payback rewards that wallet users got. The usage overtime has grown beyond that and there are more serious and investors who see using this platform for their portfolio allocation.
Rupeek: Rupeek enables the customers to take loan against their gold. It typically operates in an urban market where there is basic understanding of how the apps or technology works.

64
Functioning of Rupeek: Rupeek is a fin-tech lending platform where gold is a collateral and provides service at door step. The loan manager’s entire details are given to the customer ahead of his arrival. The customer can ensure the identity of the Rupeek representative by checking their Govt ID and photograph. The transaction begins with an authorization code that the customer shares with Rupeek’s loan manager.
Rupeek serves as a credit card to habitual gold loan pledgers and small businesses. The main reason of preferring Rupeek over other alternatives is that, small businessmen need working capital. They prefer Rupeek who come to their doorstep, pick up the gold and give the money then and there without any hassles. For retail customers, they do not have any avenue to go anywhere. Due to low number of NBFCs, the elite customers do not have any option then to pledge their gold and hence they approach Rupeek which provides them the opportunity to pledge their gold. Banks too are trying to partner with Rupeek, reason being 40% market captured by PSUs, 49% by NBFCs and remaining 20% by cooperatives and private sector banks. Private sector banks are not able to make big on the gold loan side because it requires a very typically special expertise, which the banks may not have for gold appraisal such as huge logistics issues, fraud risk, and final credit decisions based on customer’s cash flows. Hence they prefer Rupeek to execute the gold loans.
The most significant benefit of Rupeek is that the default rate is low compared to the other market players. Secondly, even if there is a default, there is no credit cost, because of the way the LTV norms are mandated by RBI which covers Rupeek more as a lender.
Customer profile : In case of Rupeek, as far as retail customers are concerned, 30% of the Rupeek customers are women, and women essentially prefer Rupeek for the simple reason that they get the benefit of not carrying gold outside the home and face theft.
Also, there is a lot of inherited gold and unlike the old people, younger generations do not have that attachment for old gold. They have a pragmatic attitude. Whenever money is needed, they prefer hedging the gold.
Second are the gold loan borrowers that is salaried class people. Generally the salaried person use their salary to make down payments towards house purchase; medical emergency, consumer durables and some leisure activities like travelling. Hence they pledge gold for other requirements.
Whereas when small businessman need money for their day to day working capital requirement, they do not care of keeping their gold idle as they are more interested in doing maximum business. Hence they love the way Rupeek approaches them at their doorstep and pick their gold and give them the money at their doorstep.
Panel 3: Setting a benchmark on compliance, who takes the leadThe above panel, moderated by Arjun Raghavendra, an Independent Consultant consisted of the below members:
◊ Surendra Mehta, IBJA

} 65
5th ANNUAL REPORT 2019-20 |
◊ DD Karel, NM Karel & Sons
◊ Mr. Anil Kansara, Aurometal Refinery
◊ Mr. Prem Nath, Karur Vysya Bank
The discussion focused on three areas:
◊ Whether compliance and enforcement are two sides of a coin.
◊ If yes, where does it begin and where does it end.
◊ Does ending compliance directly impact on enforcement of legislative provisions.
Need for compliance:Compliance can be for after sales service and for processes also. It may relate to any activity which do not lead to any tax evasion or duty cut or anything related to regulations. It also covers taxation.
In 1991, after the removal of gold control, there was an excise implication on gold manufacturing. This duty was applicable on bullion or jewelry, making gold enter the market only through official channel. But within 2-3 years, the excise duty was removed and thus non-compliance started. From 2000 till 2013, Government tried to introduce excise so as to bring all gold manufacturers under the compliance bracket which was somehow not implemented.
Introduction of PAN in transactions and very importantly notifications issued for prevention of money laundering with respect to jewelers to report with certain limits were made in the year 2017. However, the same were not implemented and subsequently withdrawn. Reason for this as given by one of the panel members was while onboarding any client, a risk assessment is made taking into consideration the below factors:
◊ Company’s business model
◊ Major suppliers
◊ Geographical locations
◊ Creditors
◊ Audited balance sheet
◊ Market feedback
◊ Bankers of the company
◊ Promoters
◊ Income tax
All these are checked as a part of domestic compliance procedure. For international compliances, the exporters list too is checked.
Compliance enhancement in remittance towards dore imports sees a need.

66
Incentivisation of Tax Payers:Indian Govt plans to start digital mechanism shortly, whereby companies whose turnover is above 500 crores and have B2B transactions, shall be given a cash price from 10 lacs to 1 cr.
According to panel Member Mr. Surendra Mehta of IBJA, Government is digitally advanced due to GST. There are hardly 85k jewelers who file regular returns as per the I.T. website. Once hallmarking is made mandatory, actual number of retail jewelers can be derived. And this is what is the ultimate objective of the Govt for making hallmarking mandatory. With the help of e-invoicing most of the bullion transactions would get recorded. He opined that the consumer is the king and deserves what he pays. Compliance should be ranked first and business on the second place.
How can perception towards compliance be improved:The trade should works towards: self-regulation, end consumer focused business model, integration of interest among various industry trade bodies across India, and last but the least compliance should be made integral to the brand.
How perception affects compliance and in turn the incentivisation:
“If compliance is expensive, then one must try non-compliance which is even more expensive”, a popular quote which states that compliance must be thought as an investment instead of a cost. This would lead to a better business.
Proper investments must be done to do proper manufacturing which will pay for all the grammage losses.
There should be clear policies laid down for imports, trading, manufacturing, logistics, KYC, recycling and exports to create a level playing ground in the industry.
The cost competitiveness of a jewelery manufacturer largely is achieved by the sub-par working standards provided to the artisans. They were seen flouting every law that protects the workers interest and well being.
Panel 4: Creating a vibrant domestic gold lease rate for Indian Gold TradeThe panel comprised of:
◊ Manish Goel, ICICI Bank – Panel Moderator
◊ Mehul Thakkar, FirstRand Bank
◊ VipinRaina,MMTC-PAMP
◊ Dileep Narayanan, Malabar Gold Pvt ltd
◊ Gambhir Singh, HDFC Bank

} 67
5th ANNUAL REPORT 2019-20 |
Key discussions in the panel were:
◊ Reasons of GML not being a popular product, despite large number of jewelers and consumption being very high
◊ Functioning of international markets
◊ Evolution of gold lease market
Ways of making GMS work:a. Increase participation from jewelers with which banks already have exposure
b. Banks need to work with CPTCs and Refiners, their risk aversion should not be basis the size of CPTC or Refiner instead a rigid fool-proof process is to be developed to mitigate risks.
c. Banks be given free hand in utilization of gold sourced through GMS subject to they have in place effective risk management principles
d. Banks be allowed to source from accredited refiners
Increase the scope of domestic sourcing:a. With BIS’s India Good Delivery and Responsible Sourcing guidelines for India slowly coming
to materialize banks should be allowed to source locally within the closed loop.
b. Gold Metal Loans be allowed to settle in physical gold sourced locally.
c. Have a mechanism or process to have traceability to the trades and source of metal
International market and gold lease rate
a. Developing a domestic gold lease rate is important to make the GMS successful as international lease rates which are the current benchmarks make its less lucrative to source locally.
b. All domestic transactions from banks has to be in lease catering to jewelers and bullion dealers
c. Banks must be permitted to develop an interbank market where they can freely buy/sell as well as lend/borrow. This way a lease curve can be initialized for the gold market.
d. Credit for not just jewelers but also for refiners and bullion dealers
e. Banks can also provide local India accounts to competent authorities and jewelers by opening gold savings accounts.
f. The borrowing rate of government is higher than that of a jeweler or for that any other business, thus it is important to think through the importance of developing a domestic lease market.

68
CHAPTER 6
IGPC Events and Engagements
India International Gold Convention, August 2019Mr Sudheesh Nambiath, Head-IGPC at IIMA - panelist at India International Gold Convention 2019
Russian Bullion Forum, November 2019
Mr Sudheesh Nambiath, Head-IGPC at IIMA - speaker at Russian Bullion Forum 2019

} 69
5th ANNUAL REPORT 2019-20 |
OECD IGPC Workshop 2019The OECD workshop was organized on Dec 6 at India Habitat Centre, New Delhi in collaboration with IGPC @ IIMA and IBJA.
Welcome address by Mr.Tyler Gillard, the head of Sector Projects, OECD Centre for Responsible Business Conduct.
Economic Advisor to Ministry of Commerce and in-charge of Gem & Jewellery of Export Promotion Ms. Rupa Datta, chief guest at the conference, being welcomed by Prof. Arvind Sahay, Chairperson, IGPC @ IIMA

70
Ms Marianna Smirnova, Director, Responsible Minerals Initiative, making a presentation on RMI and its objectives and assessment process
Mr. Tyler Gillard, head of Sector Projects, OECD Centre for Responsible Business Conduct, moderating a session on - Aligning industry initiatives with the OECD guidance and lessons learnt in other international gold markets
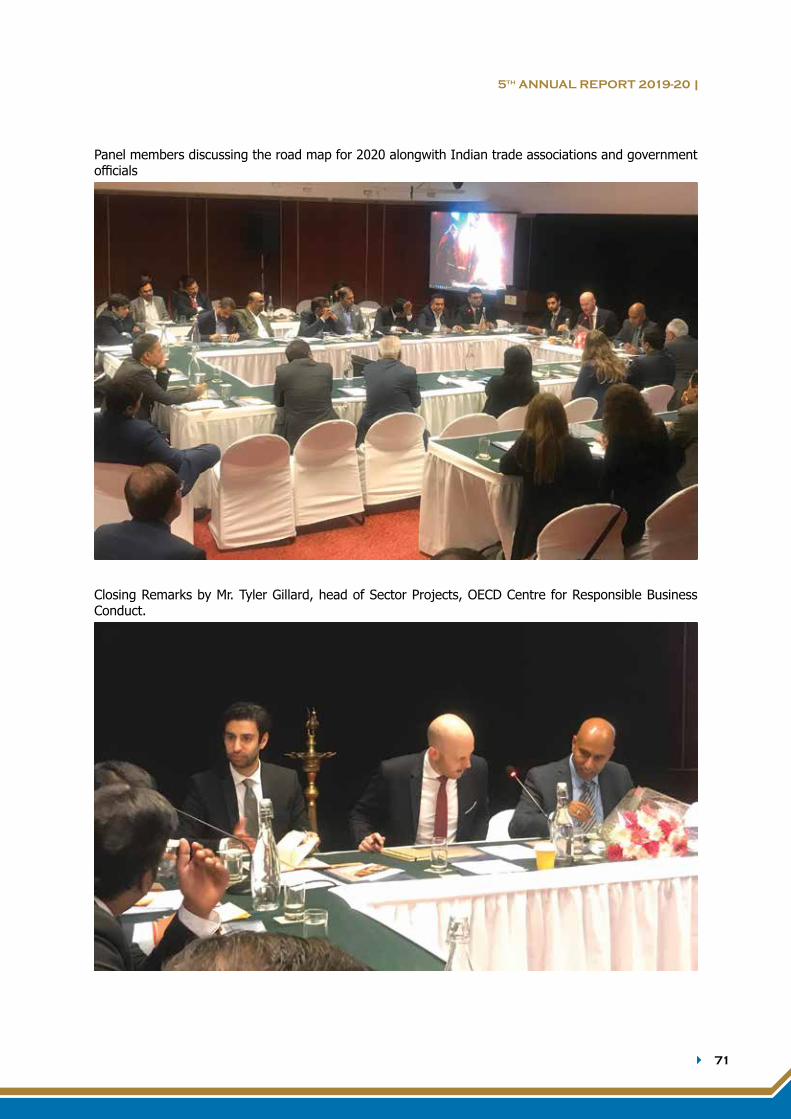
} 71
5th ANNUAL REPORT 2019-20 |
Panel members discussing the road map for 2020 alongwith Indian trade associations and government officials
Closing Remarks by Mr. Tyler Gillard, head of Sector Projects, OECD Centre for Responsible Business Conduct.

72
IGPC IIMA 3rd ANNUAL GOLD AND GOLD MARKETS CONFERENCEThe IGPC IIMA third annual Gold and Gold Markets conference was organized at India Habitat Centre, New Delhi on Feb 7-8, 2020
Day 1: Feb 7, 2020Welcome address by Prof. Arvind Sahay, Chairperson IGPC at IIMA and Mr. PR Somasundaram, Managing Director, India, World Gold Council

} 73
5th ANNUAL REPORT 2019-20 |
Lighting of lamp by - Prof. Arvind Sahay, Chairperson IGPC IIMA; Mr. PR Somasundaram, Managing Director, India, WGC alongwith Chief Guest and Additional Secretary, Department of Economic Affairs, Shri K Rajaraman

74
Prof Arvind Sahay, Chairperson IGPC IIMA, welcoming Shri K Rajaraman, Chief Guest of the conference & Additional Secretary, Department of Economic Affairs
Keynote address by Shri K Rajaraman, Additional Secretary, Department of Economic Affairs

} 75
5th ANNUAL REPORT 2019-20 |
A presentation of an empirical study on ‘Is gold a luxury product’ by Dr Rajesh Shukla, MD & CEO of PRICE Research
A session chaired by Prof Sanket Mohapatra, Professor of Economics at IIMA

76
First to begin the session, Prof Dirk Baur, University of Western Australia presenting a paper on Financial Market Evidence of Gold’s Special Role in India
Mr Varun Yadav, a doctoral student of Economics at IIMA presenting a paper on Forecasting short run gold spot prices in India using mixed frequency models

} 77
5th ANNUAL REPORT 2019-20 |
Mr. Himanshu Sharma, fixed income analyst at Bank of America, presenting a paper on Price Discovery in Indian Gold Markets
Ms. Neharika Sobti, Department of Financial Studies, University of Delhi presenting a paper on Round the clock International Price Discovery of Gold

78
Ms. Tulsi Lingareddy, MCX India Ltd presenting a paper on - a study of behavioral pattern of physical stocks and deliveries in Indian Gold Futures Market
Mr. Viral Shah, India Infoline Wealth moderating a panel discussion on - Stepping up the product offerings in gold derivatives, and importance of International Bullion Exchange at IFSC in GIFT City
From Left to right - Mr Shivanshu Mehta, MCX India Ltd, Mr Nagendra Kumar, NSE India Ltd., Mr. Viral Shah, India Infoline Wealth; Mr Amit Suman, MMTC-PAMP India Ltd and Mr. Chirag Mehta, Quantum Mutual Fund

} 79
5th ANNUAL REPORT 2019-20 |
Mr Sumit Maniyar, CEO, Rupeek presenting a paper on How Rupeek is helping Indian Banks double the personal gold loan market
Prof. Arvind Sahay moderating a session on How new generation players are shaping gold and jewelry trade as consumers move from a collectivist to an individualistic culture.
From left to right - Mr Prasad Sahane, Head of Lender Partnerships, Rupeek and Ms. Rhea Chaterjee, Safe Gold

80
Paper presentation by Mr. Abhinav Ramesh, CEO, Chainflux Technologies on Gold Traceability, GMS, Bullion Banking and trusted SIP’s using Blockchain Technology
Paper on Preferences, Use and Impact of Gold Savings product in Migrant Corridors, presented by Mr Jithin Jose and Mr Shashant Sreedharan, IFMR LEAD (Krea University)
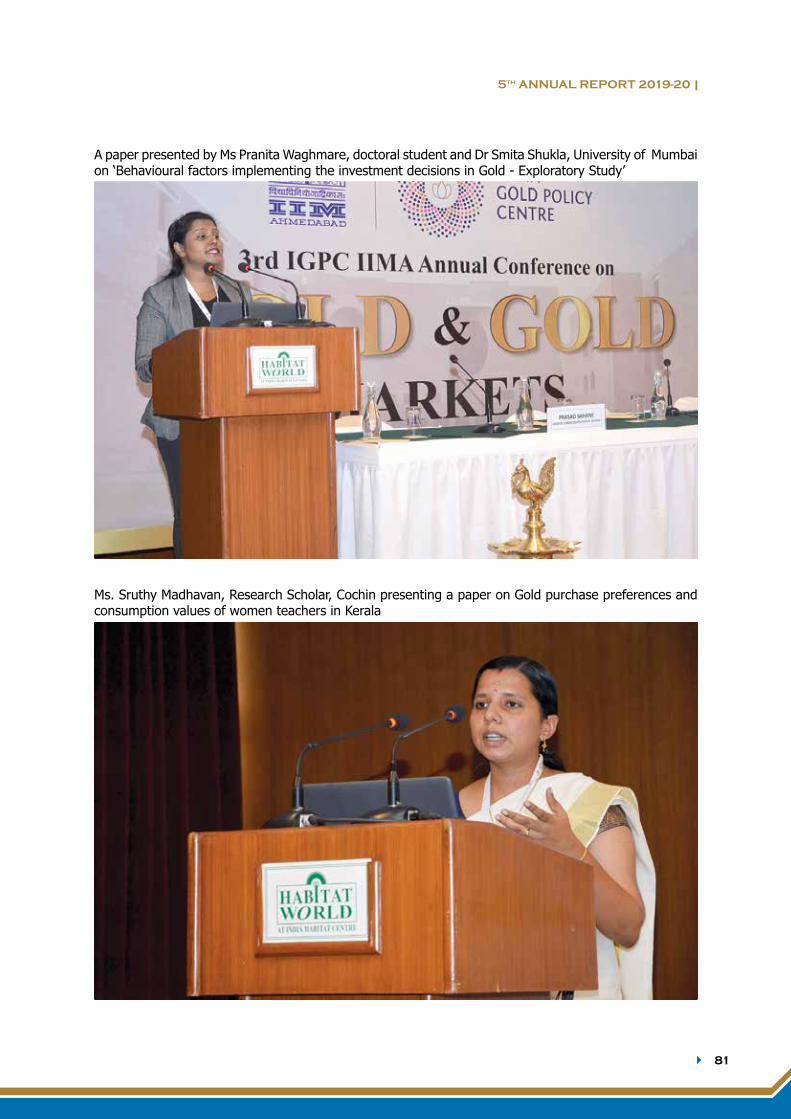
} 81
5th ANNUAL REPORT 2019-20 |
A paper presented by Ms Pranita Waghmare, doctoral student and Dr Smita Shukla, University of Mumbai on ‘Behavioural factors implementing the investment decisions in Gold - Exploratory Study’
Ms. Sruthy Madhavan, Research Scholar, Cochin presenting a paper on Gold purchase preferences and consumption values of women teachers in Kerala

82
Ms. Sukriti Sekhri, doctoral student, IIMA presenting a paper on ‘Online consumer behaviour and consumer perception of wishlist vs cart, in context to jewelry retailing
Mr. Sabyasachi Ray, GJEPC presenting on World market for gold and silver jewelry, available government benefits w.r.t. marketing, promotion and branding

} 83
5th ANNUAL REPORT 2019-20 |
Paper presentation on - The opportunities for the Indian Jewelry industry to improve margins by Mr. Jayant Raniga, Pure Jewels, UK
Mr. Arjun Raghavendra presenting a paper on - Should gold continue to hold relevance in GATT
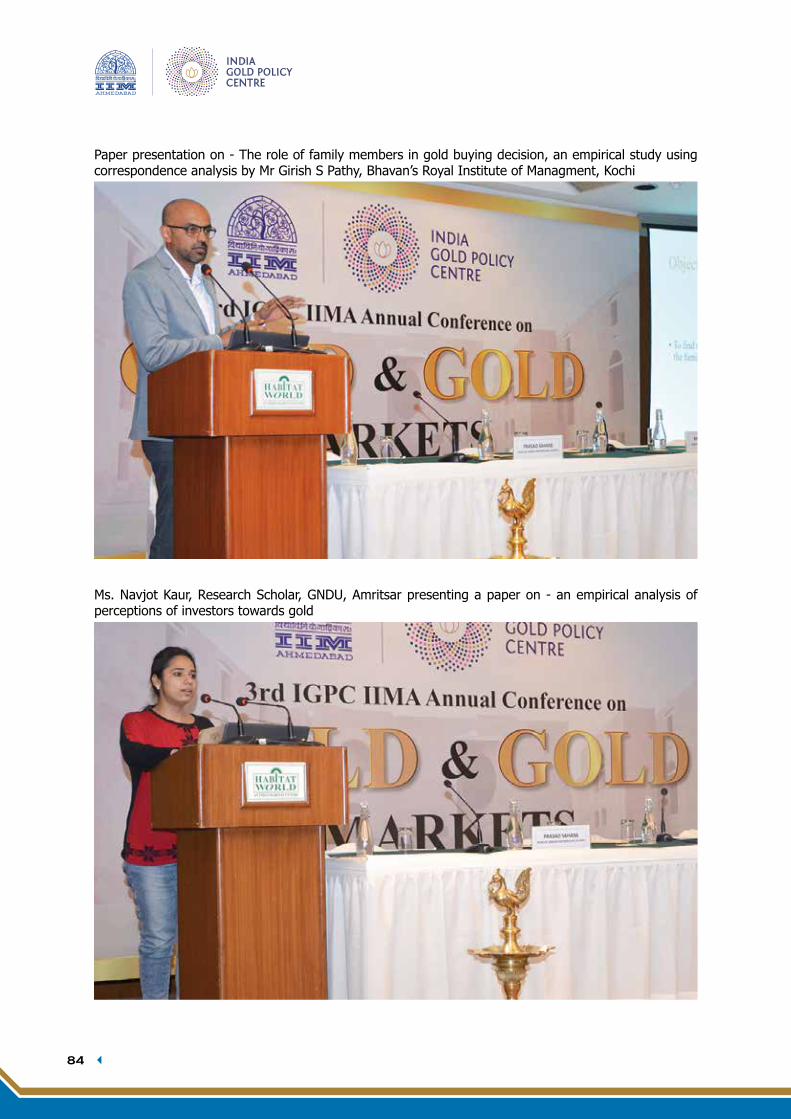
84
Paper presentation on - The role of family members in gold buying decision, an empirical study using correspondence analysis by Mr Girish S Pathy, Bhavan’s Royal Institute of Managment, Kochi
Ms. Navjot Kaur, Research Scholar, GNDU, Amritsar presenting a paper on - an empirical analysis of perceptions of investors towards gold

} 85
5th ANNUAL REPORT 2019-20 |
Ms. Aanchal Amitabh, Associate Professor, SRM IST, Delhi presenting a paper on - Analysis of consumer behavior: A special reference to gold jewelry purchase
Ms. Renisha Chainani and Ms. Anuradha Poddar, IIMA presenting a paper on ‘Sentimental impact of US President Trump tweets on Financial Markets in 2019 and the prediction of the percentage change in gold price using machine learning model and natural language processing

86
Day 2 - Feb 8, 2020The second day of conference started with a paper presentation by Ms. Vandana Panwar, Prin. L.N.Welingkar Institute of Management on - Impact of financial knowledge in ascertaining risk appetite and risk tolerance of gold investors, a test of expected utility theory
Paper presented on - A golden death of dogma to invest in gold: a new investment approach to transform the sector with respect to consumer behaviour by Ms Sudhi Ranjan Dash, strategy consultant and Ms. Jita Rani Udgata, GJEPC

} 87
5th ANNUAL REPORT 2019-20 |
Ms. Pooja Thakker, Research Assistant, IGPC @ IIMA presenting a paper on ‘Understanding working capital requirements of Indian Jewelers’
Paper on - New paradigm of bullion banking in India: an empirical investigation, presented by Ms. P Hemavathy and Mr. S Gurusamy, University of Madras

88
Mr. Arjun Raghavendra, independent legal consultant and former IRS officer, moderating a panel discussion: Setting a benchmark on compliance, who takes the lead?
From Left to right - Mr. Arjun Raghavendra, Independent Consultant; Mr. Premnath, Karur Vyasya Bank; Mr. Surendra Gupta, IBJA; Mr DD Karel, NM Karel & Sons; Mr Bhavin Mehta, CA
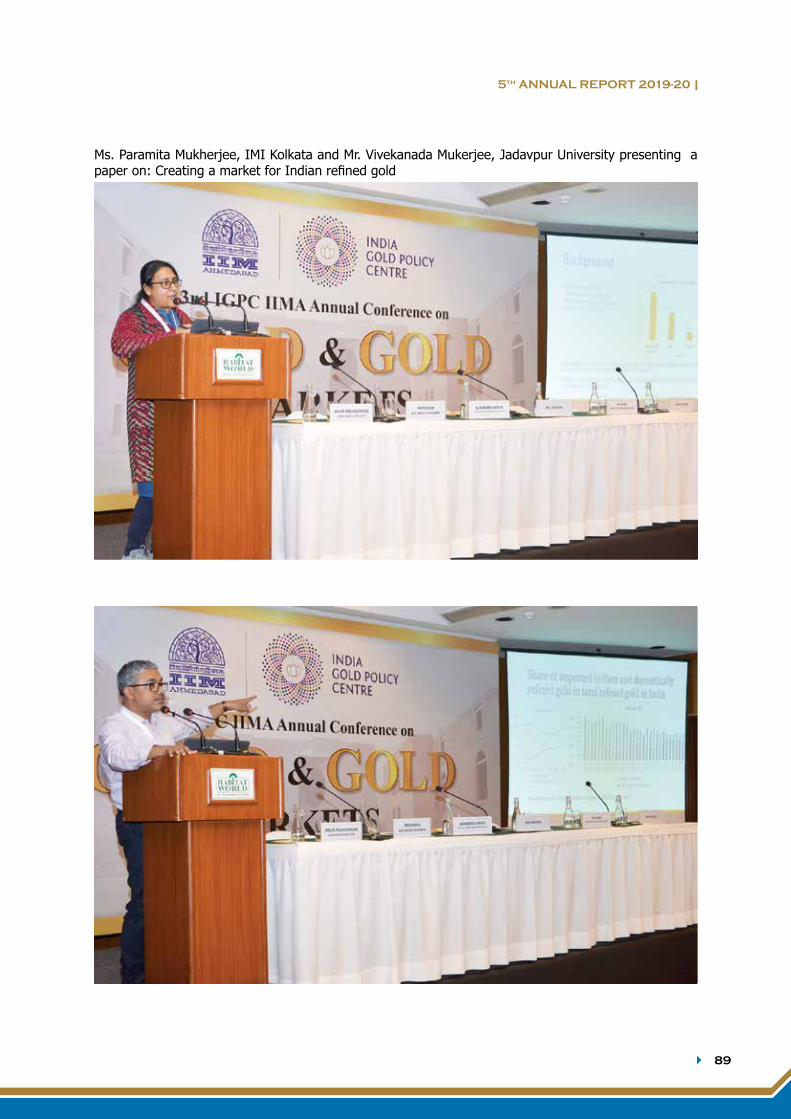
} 89
5th ANNUAL REPORT 2019-20 |
Ms. Paramita Mukherjee, IMI Kolkata and Mr. Vivekanada Mukerjee, Jadavpur University presenting a paper on: Creating a market for Indian refined gold

90
Mr. Prabhakar Sangurmath, former executive director, Hutti Gold Mines presenting a paper on - Gold exploration and mining in India: current status and the prospect
Mr. Gambhir Singh, HDFC Bank Ltd, moderating a panel discussion on Creating a vibrant domestic gold lease rate for Indian Gold Trade
From left to right - Mr. Manish Goel, ICICI Bank Ltd.; Ms. Mehul Thakker, FirstRand Bank; Mr. Gambhir Singh, HDFC Bank; Mr. Vipin Raina, MMTC-PAMP; Mr. Dileep Narayanan, Malabar Gold Pvt Ltd.

} 91
5th ANNUAL REPORT 2019-20 |
Ms. Anindita Chakrabarti, IIT Kanpur presenting a paper on - A sociological study of goldsmiths of Bengal: migration, artisanal entrepreneurship and social mobility
Mr. Nithya Joseph, French Institute, Pondicherry presenting a paper on ‘Our ears have been bare since then’: gold ownership in a raw silk producing town through the economic reform period

92
Ms. Sumeetha M, Christ University presenting a paper on - State policies in India and the gold industry: exploring the labour process in the gold jewelry making industry in Kerala
Closing remarks by Prof. Arvind Sahay, Chair IGPC IIMA

} 93
5th ANNUAL REPORT 2019-20 |
Ms. Taruna Doliya, IES, Deputy Director (left) Department of Economic Affairs at the GGM Conference
Prof. Arvind Sahay Chairperson IGPC IIMA alongwith IGPC team

94
Media Coverage

} 95
5th ANNUAL REPORT 2019-20 |

96
AppendixWorld Official Gold Holdings
International Financial Statistics, May 2020*Tonnes % of
reserves**Tonnes % of
reserves**1 United States 8,133.5 79.1% 51 Qatar 42.2 5.8%2 Germany 3,363.6 75.0% 52 Bulgaria 40.8 7.5%3 IMF 2,814.0 53 Malaysia 38.9 2.1%4 Italy 2,451.8 70.5% 54 WAEMU 36.5 11.7%5 France 2,436.0 65.0% 55 Peru 34.7 2.8%6 Russian Federation 2,298.7 22.2% 56 Slovak Rep. 31.7 21.2%7 China, P.R.: Mainland 1,948.3 3.3% 57 Hungary 31.5 5.5%8 Switzerland 1,040.0 6.7% 58 United Arab Emirates 31.3 1.6%9 Japan 765.2 3.1% 59 Serbia, Rep. of 31.1 12.3%10 India 653.0 7.4% 60 Syrian Arab Republic 25.8 7.8%11 Netherlands, The 612.5 71.5% 61 Ukraine 25.2 5.4%12 Turkey 524.0 35.8% 62 Mongolia 23.4 30.8%13 ECB 504.8 32.3% 63 Morocco 22.1 4.7%14 Taiwan Province of China 422.4 4.6% 64 Afghanistan, Islamic Rep. of 21.9 13.9%15 Portugal 382.5 77.1% 65 Nigeria 21.5 2.9%16 Kazakhstan, Rep. of 377.1 68.0% 66 Tajikistan, Rep. of 17.2 62.6%17 Uzbekistan, Rep. of 335.9 59.1% 67 Ecuador 14.5 49.3%18 Saudi Arabia 323.1 3.4% 68 Bangladesh 14.0 2.3%19 United Kingdom 310.3 9.8% 69 Cyprus 13.9 67.0%20 Lebanon 286.8 30.0% 70 Colombia 13.9 1.4%21 Spain 281.6 19.9% 71 Curaçao and Sint Maarten 13.1 35.9%22 Austria 280.0 58.0% 72 Mauritius 12.4 9.8%23 Poland, Rep. of 228.6 10.6% 73 Cambodia 12.4 3.8%24 Belgium 227.4 40.4% 74 Kyrgyz Rep. 11.8 27.0%25 Philippines 197.9 11.9% 75 Ghana 8.7 4.9%26 Algeria 173.6 13.9% 76 Paraguay 8.2 5.4%27 Venezuela, Republica
Bolivariana de161.2 82.0% 77 Czech Rep. 7.8 0.3%
28 Thailand 154.0 3.6% 78 Myanmar 7.3 6.3%29 Singapore 127.4 2.4% 79 North Macedonia, Republic of 6.9 11.0%30 Sweden 125.7 12.7% 80 Guatemala 6.9 2.3%31 South Africa 125.3 13.0% 81 Tunisia 6.8 4.8%32 Mexico 120.0 3.4% 82 Sri Lanka 6.7 4.6%33 Libya 116.6 7.5% 83 Latvia 6.7 7.6%34 Greece 113.7 65.1% 84 Nepal 6.4 4.1%35 Korea, Rep. of 104.4 1.4% 85 Ireland 6.0 5.8%36 Romania 103.6 13.6% 86 Lithuania 5.8 7.0%37 BIS 102.0 87 Bahrain, Kingdom of 4.7 6.4%38 Iraq 96.3 7.6% 88 Brunei Darussalam 4.5 6.8%39 Australia 79.9 10.3% 89 Mozambique, Rep. of 3.9 5.6%40 Egypt, Arab Rep. of 79.5 11.0% 90 Guinea 3.9 14.8%41 Kuwait 79.0 9.7% 91 Slovenia, Rep. of 3.2 15.7%42 Indonesia 78.6 3.5% 92 Aruba, Kingdom of the
Netherlands3.1 16.3%
43 Brazil 67.4 1.1% 93 Bosnia and Herzegovina 3.0 2.3%44 Denmark 66.5 6.6% 94 Albania 2.8 4.2%45 Pakistan 64.6 20.1% 95 Luxembourg 2.2 11.1%46 Argentina 61.7 7.5% 96 Hong Kong SAR 2.1 0.0%47 Belarus, Rep. of 49.5 30.3% 97 Iceland 2.0 1.6%48 Finland 49.1 23.5% 98 Papua New Guinea 2.0 4.6%49 Jordan 43.5 15.5% 99 Trinidad and Tobago 1.9 1.6%50 Bolivia 42.5 35.8% 100 Haiti 1.8 4.1%Source: https://www.gold.org/goldhub/data/monthly-central-bank-statistics

} 97
5th ANNUAL REPORT 2019-20 |
India: Foreign Exchange Reserves & Gold (1959-60 to 2019-20)
YearTotal
Foreign Exchange Reserves (USD Mn)
Gold (USDMn)
Gold (% ofReserves) Year
Total Foreign
Exchange Reserves (USD Mn)
Gold (USDMn)
Gold (% of
Reserves)
1959-60 762 247 32.4 1990-91 5,834 3,496 59.91960-61 637 247 38.8 1991-92 9,220 3,499 381961-62 624 247 39.6 1992-93 9,832 3,380 34.41962-63 619 247 39.9 1993-94 19,254 4,078 21.21963-64 642 247 38.5 1994-95 25,186 4,370 17.41964-65 524 281 53.6 1995-96 21,687 4,561 211965-66 626 243 38.8 1996-97 26,423 4,054 15.31966-67 638 243 38.1 1997-98 29,367 3,391 11.51967-68 718 243 33.8 1998-99 32,490 2,960 9.11968-69 769 243 31.6 1999-00 38,036 2,974 7.81969-70 1,094 243 22.2 2000-01 42,281 2,725 6.41970-71 975 243 24.9 2001-02 54,106 3,047 5.61971-72 1,194 264 22.1 2002-03 76,100 3,534 4.61972-73 1,219 293 24 2003-04 112,959 4,198 3.71973-74 1,325 293 22.1 2004-05 141,514 4,500 3.21974-75 1,379 304 22 2005-06 151,622 5,755 3.81975-76 2,172 281 12.9 2006-07 199,179 6,784 3.41976-77 3,747 290 7.7 2007-08 309,723 10,039 3.21977-78 5,824 319 5.5 2008-09 251,985 9,577 3.81978-79 7,268 377 5.2 2009-10 279,057 17,986 6.41979-80 7,361 375 5.1 2010-11 304,818 22,972 7.51980-81 6,823 370 5.4 2011-12 294,398 27,023 9.21981-82 4,390 335 7.6 2012-13 292,647 26,292.3 91982-83 4,896 324 6.6 2013-14 303,674 20,978 6.91983-84 5,649 320 5.7 2014-15 341,378 19,837 5.81984-85 5,952 325 5.5 2015-16 355,560 19,325.4 5.41985-86 6,520 417 6.4 2016-17 369,955 19,869 5.41986-87 6,574 471 7.2 2017-18 424,361 21,614.9 5.11987-88 6,223 508 8.2 2018-19 411,905 23,408.4 5.71988-89 4,802 473 9.9 2019-20 4,74,660 30,550.0 6.41989-90 3,962 487 12.3
Source: RBI

98
Com
mod
ity c
ompo
sitio
n of
Ind
ia’s
Im
port
s fr
om W
orld
Fro
m 2
007-
08 to
201
9-20
(R
s. In
Milli
on)
Year
All
Com
mod
ities
Petr
oleu
m &
cr
ude
prod
ucts
(P
OL)
Elec
tron
ic
Goo
dsG
old
POL
%
of a
ctua
l co
mm
oditi
es
Elec
tron
ic
Goo
d %
of
act
ual
com
mod
ities
Gol
d %
of
act
ual
com
mod
ities
2007
-08
1,00
,51,
594.
9032
,05,
471.
808,
12,0
86.1
06,
72,2
60.4
031
.89
8.08
6.69
2008
-09
1,37
,44,
355.
6041
,99,
676.
1010
,73,
197.
809,
53,2
38.0
030
.56
7.81
6.94
2009
-10
1,36
,37,
355.
5041
,16,
490.
709,
94,1
86.1
013
,58,
779.
1030
.19
7.29
9.96
2010
-11
1,68
,34,
669.
6048
,22,
816.
9012
,10,
172.
0018
,47,
422.
1028
.65
7.19
10.9
720
11-1
22,
34,5
4,63
2.50
74,3
0,74
8.80
15,6
5,03
6.20
26,9
9,00
7.10
31.6
86.
6711
.51
2012
-13
2,66
,91,
619.
6089
,18,
708.
6017
,09,
851.
7029
,21,
462.
9033
.41
6.41
10.9
520
13-1
42,
71,5
4,33
9.10
99,7
8,85
4.50
21,6
5,83
2.70
16,6
2,42
6.20
36.7
57.
986.
1220
14-1
52,
73,7
0,86
5.80
84,2
8,74
4.80
24,7
1,53
3.10
21,0
6,58
0.40
30.7
99.
037.
7020
15-1
62,
49,0
2,98
0.80
54,0
5,04
6.90
28,4
4,34
5.80
20,7
4,87
5.30
21.7
011
.42
8.33
2016
-17
2,57
,76,
655.
9058
,32,
171.
7030
,55,
918.
3018
,44,
387.
6022
.63
11.8
67.
1620
17-1
83,
00,1
0,33
4.30
70,0
3,20
8.10
35,9
3,33
4.10
21,7
0,72
0.70
23.3
411
.97
7.23
2018
-19
3,58
,76,
839.
1098
,60,
196.
1042
,08,
935.
7022
,94,
473.
3027
.48
11.7
36.
4020
19-2
03,
30,7
9,77
0.50
92
,36,
247.
35
40,
17,5
56.9
0 19
,92,
483.
4327
.92
12.1
56.
02So
urce
: DGC
IS

} 99
5th ANNUAL REPORT 2019-20 |
Worldwide Production and Fabrication Data(Value in Metric Tonnes)
2015 2016 2017 2018 2019ProductionChina 454.1 453.5 426.1 399.7 413.4Australia 279.2 290.2 295.0 312.2 315.4Russian Federation 249.5 253.6 270.7 281.5 340.5United States 216.2 222.0 230.0 253.2 210.6Canada 162.5 165.0 175.6 193.0 191.8Indonesia 176.3 174.9 154.3 190.0 129.4Peru 177.9 168.5 162.3 155.4 155.8South Africa 151.0 145.7 139.9 123.5 128.4Mexico 141.3 133.3 126.8 121.6 135.7FabricationChina 832.6 691.4 673.9 688.2 628.8India 736.2 454.4 718.1 632.2 514.0Italy 84.9 79.3 79.7 74.9 78.5Turkey 91.6 77.6 83.2 70.1 66.0United States 66.8 66.6 68.1 74.6 74.0Indonesia 48.2 43.5 43.5 47.6 45.2UAE 41.5 41.7 53.1 40.1 35.3S Korea 41.0 40.7 40.4 40.2 35.7Saudi Arabia 51.7 40.0 33.5 34.4 33.6Malaysia 39.4 33.8 30.2 30.1 29.5
Source: Refinitiv GFMS

100
Expo
rts
of P
reci
ous
met
als,
sto
nes,
dia
mon
ds a
nd je
wel
ry 2
007-
08 to
201
9-20
(R
s. In
milli
on)
Year
Tota
l val
ue
Cut &
po
lishe
d di
amon
ds
Gol
d je
wel
ry
Gol
d m
edal
lions
&
coi
ns
Colo
red
gem
ston
esSi
lver
je
wel
ry
Pear
l’s
valu
eSy
nthe
tic
ston
esRo
ugh
Dia
mon
ds
Roug
h di
amon
ds
(qty
in
mill
ion
cara
ts)
Roug
h di
amon
ds
unit
real
isat
ion
(Rs/
cara
t)
2007
-08
8,37
,654
.80
5,71
,171
.70
2,23
,157
.00
-11
,110
.50
9,21
1.10
156.
2045
.00
22,8
03.2
028
.779
4.50
2008
-09
11,1
6,11
4.80
6,62
,246
.80
3,96
,001
.50
-11
,835
.30
10,6
47.4
015
3.30
54.5
035
,176
.00
30.7
1,14
5.40
2009
-10
13,8
7,52
2.90
8,60
,951
.70
3,27
,749
.60
1,29
,750
.70
13,5
80.1
019
,519
.00
162.
5065
.20
35,2
54.2
024
.51,
437.
00
2010
-11
19,5
7,35
8.40
12,8
5,14
0.60
3,52
,682
.70
2,24
,794
.00
14,3
25.4
025
,662
.10
186.
6077
2.90
51,7
50.6
033
.51,
547.
10
2011
-12
20,6
0,80
0.90
11,0
9,26
7.70
4,72
,796
.30
3,34
,703
.80
16,4
72.0
036
,772
.30
157.
101,
180.
6085
,137
.20
33.9
2,50
9.40
2012
-13
21,2
6,85
5.00
9,47
,391
.60
7,12
,078
.10
2,84
,900
.60
35,2
78.1
050
,164
.60
257.
802,
827.
1085
,920
.50
35.2
2,43
8.50
2013
-14
21,1
1,91
3.00
14,8
1,85
2.00
5,07
,388
.50
1,85
,645
.30
39,0
97.0
088
,987
.80
626.
304,
864.
1095
,559
.70
43.3
2,20
5.90
2014
-15
22,1
3,32
1.60
14,1
5,14
2.80
6,05
,100
.30
1,73
,924
.70
27,7
33.9
01,
25,6
89.4
012
1.40
4,83
1.50
86,6
66.7
033
.92,
553.
20
2015
-16
21,3
5,94
6.60
13,5
4,01
2.20
5,61
,368
.10
3,44
,172
.50
28,4
45.0
01,
94,1
09.0
070
.20
4,72
7.90
76,7
58.3
030
.62,
511.
20
2016
-17
23,7
7,02
6.70
15,2
6,82
5.90
5,84
,649
.20
3,62
,437
.50
28,1
66.6
02,
69,2
32.5
034
4.20
9,02
4.90
1,00
,559
.10
30.0
3,35
1.00
2017
-18
21,0
7,85
0.80
15,2
9,08
7.30
6,23
,812
.10
1,27
,080
.50
27,8
54.9
02,
18,1
21.8
014
6.70
14,1
80.8
092
,002
.10
38.1
2,41
6.70
2018
-19
21,6
5,02
1..0
016
,65,
731.
108,
32,3
84.6
061
,260
.80
27,9
07.8
059
,033
.50
111.
0015
,822
.80
94,7
92.3
030
.13,
144.
60
2019
-20
20,5
3,29
8.40
13,1
9,80
9.60
8,48
,873
.60
58,4
17.7
022
,726
.20
1,20
,262
.40
--
78,1
22.0
020
.9-
Sour
ce: G
JEPC

} 101
5th ANNUAL REPORT 2019-20 |Im
port
s of
Pre
ciou
s m
etal
s, s
tone
s, d
iam
onds
and
jew
elry
200
7-08
to 2
019-
20
(Rs.
In m
illion
)
Year
Tota
l val
ueRo
ugh
Dia
mon
ds
valu
e
Roug
h D
iam
onds
(Q
ty in
m
illio
n ca
rats
)
Roug
h di
amon
ds
unit
Rs/
cara
t
Cut &
Po
lishe
d di
amon
dsG
old
bar
Gol
d je
wel
ryRo
ugh
colo
red
gem
ston
esco
lore
d ge
mst
ones
non-
gold
je
wel
rysi
lver
ba
r
2007
-08
7,41,5
05.40
3,99,2
15.00
171.
52,3
27.10
2,22,5
20.00
89,4
96.1
017
,088.7
05,
994.
602,7
67.30
437
796
2008
-09
10,3
3,44
1.70
3,50
,412
.50
118.
82,
950.
104,
06,3
82.9
02,
10,7
69.4
013
,363
.30
4,81
4.20
4,46
4.20
1,52
5.30
1,19
4.90
2009
-10
13,48
,625.1
04,2
7,331
.1014
9.9
2,851
.705,4
7,466
.403,
40,1
86.0
015
,343.6
05,
543.
306,8
08.80
1,683
.901,4
58.20
2010
-11
19,1
9,82
0.70
5,45
,642
.70
154.
23,
538.
809,
47,2
56.5
03,
82,4
50.8
022
,133
.90
6,81
8.30
5,53
8.40
3,80
5.90
1,90
0.70
2011
-12
20,12
,384.7
07,2
2,218
.9013
1.5
5,490
.406,8
3,564
.005,
02,8
33.4
070
,881.3
06,
954.
1014
,053.9
03,5
11.80
3,897
.10
2012
-13
20,3
1,93
4.00
8,09
,925
.20
148.
45,
458.
103,
02,0
08.9
06,
04,7
08.1
02,
50,3
76.1
011
,277
.80
27,7
62.3
04,
726.
602,
809.
90
2013
-14
18,71
,098.9
010
,03,77
2.70
162
6,195
.503,9
5,859
.703,
36,4
95.4
034
,959.4
014
,447
.80
19,72
3.50
7,714
.202,3
60.80
2014
-15
19,0
8,53
4.60
10,2
2,35
0.90
146.
26,
993.
204,
05,4
35.9
03,
25,6
26.3
022
,238
.90
17,3
95.0
048
,678
.70
4,12
8.90
1,93
6.70
2015
-16
15,86
,549.8
09,1
9,705
.3013
8.4
6,645
.001,8
1,277
.002,
65,3
67.4
018
,972.2
024
,241
.70
68,80
4.80
3,500
.702,5
93.40
2016
-17
19,2
5,13
0.90
11,4
4,76
4.00
153.
37,
466.
801,
76,4
93.2
02,
83,6
24.1
018
,079
.90
38,2
56.4
095
,815
.00
2,70
4.70
3,21
8.80
2017
-18
20,30
,227.7
012
,17,44
5.40
187.
76,4
87.40
1,44,0
76.40
3,67
,036
.20
18,00
4.00
56,6
88.9
035
,169.6
04,2
07.10
3,467
.90
2018
-19
18,3
9,83
3.10
10,9
5,23
7.90
165
6,63
7.60
92,6
84.9
05,
48,0
59.5
020
,405
.10
23,9
00.9
027
,624
.90
4,01
1.10
2,64
9.50
2019
-20
16,9
8,99
7.50
8,96
,205
.70
146.
4-
1,21
,946
.90
5,53
,431
.20
20,5
67.4
017
,693
.60
37,3
07.4
011
7.70
2,64
4.20
Sour
ce: G
JEPC

102
Indi
a’s
Gol
d Im
port
s an
d G
old
Pric
e: 1
971
to 2
020
₹ -
₹ 5,
000
₹ 10
,000
₹ 15
,000
₹ 20
,000
₹ 25
,000
₹ 30
,000
₹ 35
,000
₹ 40
,000
0
200
400
600
800
1000
1200
19711972197319741975197619771978197919801981198219831984198519861987198819891990199119921993199419951996199719981999200020012002200320042005200620072008200920102011201220132014201520162017201820192020
Rs. per 10 grammes
Volume in tonnesG
old
impo
rts t
o In
dia
from
197
0-71
to 2
019-
20
Not
e: In
dia
star
ted
impo
rting
unr
efine
d go
ld (d
ore’
) in
larg
e qu
antit
ies
from
201
2 th
us th
e vo
lum
es in
clude
unr
efine
d go
ld. T
he d
olla
r pay
out i
s on
ly o
n th
e go
ld c
onte
nt in
th
e to
tal d
ore’
vol
ume
Sour
ce: h
ttps:
//w
ww.
rbi.o
rg.in
/scr
ipts
/Pub
licat
ions
View
Eco
nom
ic an
d Po
litica
l Wee
kly,
Febr
uary
20
1999
, “Co
nsum
ptio
n of
gol
d in
Indi
a, T
rend
s an
d de
term
inan
ts” b
y A
Vaid
yana
than

} 103
5th ANNUAL REPORT 2019-20 |
is glad to announce its
4th Annual Conference:
IGPC at IIMA
MARKETS
&
A platform where policy makers, academia and industry experts share their thoughts on the
gold markets-current and future.
he
he
Conference Date: February 2021
Mark your calendar Details to be updated shortly:
https://www.iima.ac.in/web/areas-and-centres/research-centers/igpc/igpc-events
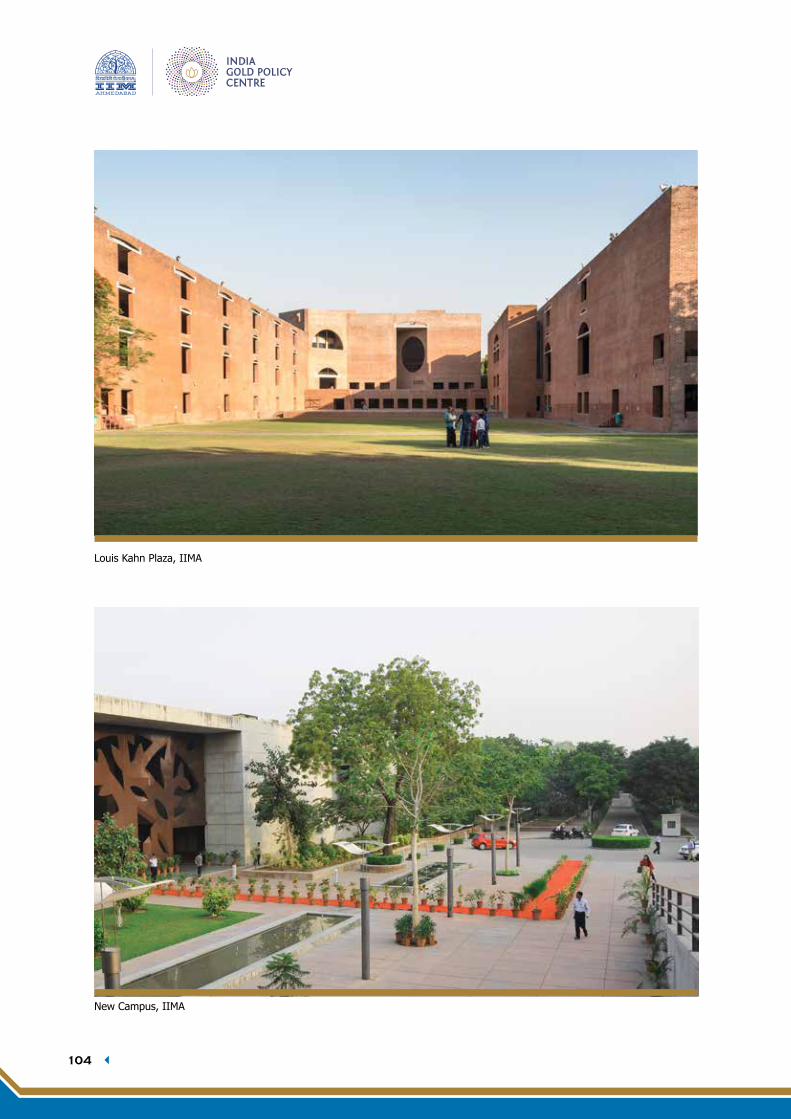
104
Louis Kahn Plaza, IIMA
New Campus, IIMA

IGPC MEMBERS
Prof. Errol D’Souza Director, IIMA
Mr Sudheesh Nambiath Head, IGPC
Prof. Arvind Sahay Chairperson-IGPC & Faculty
IIMA (Marketing)
Prof. Joshy Jacob Faculty IIMA (Finance &
Accounting)
Prof. Sanket Mohapatra Faculty IIMA (Economics)
Prof. Viswanath Pingali Faculty IIMA (Economics)
Harish Chopra Senior Policy Consultant,
IGPC
Prof. Neharika Vohra Faculty IIMA
(Organizational Behaviour)
IGPC TEAM
RESEARCH TEAM
Mr. Kapil Shukla Ms. Minal Marathe Ms. Anuradha Poddar Ms. Pooja Thakkar Ms. Renisha Chainani