Ahmedabad District - Vasudha Foundation
162
January, 2022 Climate Change and Environment Action Plan of Ahmedabad District In Association with Supported By Prepared By
-
Upload
khangminh22 -
Category
Documents
-
view
0 -
download
0
Transcript of Ahmedabad District - Vasudha Foundation
January, 2022
Climate Change and Environment Action Plan of
Ahmedabad District
In Association with Supported ByPrepared By

The Climate Change and Environment Action Plans (CCEAP) have been developed for multiple districts of India by Vasudha Foundation with support from Shakti Sustainable Energy Foundation. For Ahmedabad, the plan was developed in collaboration with the Climate Change Department, Government of Gujarat and Gujarat Ecological Education and Research (GEER) Foundation, Forests and Environment Department, Government of Gujarat.
The CCEAP aims to complement the State Action Plan on Climate Change (SAPCC) version 2.0 as prescribed by the Ministry of Environment, Forest and Climate Change (MoEF&CC) and align it to India’s latest climate change commitments to the United Nations Framework Convention on Climate Change (UNFCCC). The rationale behind this action plan is to follow a bottom-up approach to climate-proof development priorities for the district.
Copyright/ citation: Climate Change and Environment Action Plan of Ahmedabad District, Vasudha Foundation, 2022
Research leads: Rini Dutt, Manjusha Mukherjee
Research support: Shivika Solanki, Archit Batra, Shubhi Gupta, Monika Chakraborty, Rahul K. P.
GIS support: Akinchan Singhai, Amit Yadav
Guided by: Srinivas Krishnaswamy, Raman Mehta
Knowledge partner: Shri B. H. Talati, IAS, Joint Secretary and Shwetal Shah, Technical Advisor, Climate Change Department, GoG
Mr. R. D. Kamboj (former Director) and Dr. Sweta Rajpurohit, Manager, GEER Foundation, Forest and Environment Department, GoG
Copyediting: Swati Prasad
Design and layout: Priya Kalia (Vasudha Foundation), and Aspire Design, New Delhi
Photo credits: Shutterstock, iStock, various government departments websites
January, 2022Ahmedabad, Gujarat
The material in this report is based on data points and information that we believe to be reliable and adequately comprehensive. However, we do not guarantee that such information is in all respects accurate or complete. Vasudha Foundation does not accept any liability for any losses resulting from the use of this report.
Cover page images
Top left image:Torrent power plant, Sabarmati, Ahmedabad (sourced from shutterstock)
Bottom right:Solar panels over Narmada canal, Vadodara (photograph credit: Climate Change Department, GoG)
Land use map of Ahmedabad district: Created using data from Landsat 8, secondary data from NRSC/ISRO Bhuvan portal, Google Earth and ORNL-DAAC
Waste-land
Fallow-land
Water-bodies
ForestBuilt-up land
Shrub-land
Crop-land
Grass-land

Climate Change and Environment Action Plan of
Ahmedabad District
In Association with Supported ByPrepared By


Shri S. J. Haider, IAS Principal Secretary Climate Change Department Government of Gujarat
Message
Climate Change Department, Government of Gujarat has been actively engaged for over a
decade to effectively address climate change. The concerted actions initiated so far have helped
bring forth several innovative initiatives for climate mitigation measures, like the installation of
solar panels on Narmada branch canals that help generate clean power, while reducing water loss
from evaporation. Gujarat is one of the front-runners in renewable energy growth. It ranks first by
contributing 25% of the total national solar rooftop installed capacity. Moreover, the Department
undertakes different studies from time to time as well as initiatives to enhance State’s measures
to combat climate change.
In one such endeavour, the ‘Climate Change and Environment Action Plans’ (CCEAPs) of
Ahmedabad & Rajkot Districts have been developed by Vasudha Foundation in collaboration with
the Climate Change Department and GEER Foundation. I appreciate the collective efforts put in,
for accomplishing this task.
These district Action Plans recognize that there are no universal solutions for climate
change. Therefore, regionally appropriate and district-specific Action Plans have been prepared
for both the districts. They take into account the district-level baseline studies on: climate
variability and projections, emissions profile and budgetary analysis to estimate climate
expenditure, and other crucial aspects. They also bring forth a comprehensive set of
recommendations for various climate-relevant sectors and environmental issues of the districts,
along with case examples and estimated mitigation potential. These Action Plans, I hope, will be
of use and relevance in the exercise of district-level planning to integrate climate action with
development activities.
(S. J. Haider)


ACKNOWLEDGEMENTSWe would like to thank S.J. Haider, IAS (Principal Secretary), Shwetal Shah (Technical Advisor) and other officials from the Climate Change Department, GoG, and U.D. Singh, IFS (Director), R.D. Kamboj, IFS (Retd.) (former Director), Dr. Sweta Rajpurohit (Manager), and Vibha Goswami (Deputy Director) from GEER Foundation, Forest Department, GoG, as their inputs and support have been vital in development of the Climate Change and Environment Action Plan for Ahmedabad district.
We are obliged to Sandip J. Sagale, IAS (District Collector, Ahmedabad) for support and motivation to accomplish the completion of the action plan for Ahmedabad district.
We express our appreciation to V. Subramanian, IAS (Retd.) (former Secretary, MNRE, GoI), for sharing pearls of wisdom during the course of this research.
We extend our gratitude towards other departments and civil organisations – Anis Mankad, IAS (Special Secretary, Revenue Department), A.B. Gor, IAS (CEA, AUDA), Mahesh Singh, IFS (former MD, UGVCL), R.J Bhrambhatt and Mubina Sheikh (WASMO, Ahmedabad), Kartikeya Sarabhai (Director, CEE), and Mahesh Pandya (Director, Paryavaran Mitra) for inputs and suggestions to refine the action plan.
We are grateful to Dr. Ashwini Kulkarni from IITM, Pune and Dr. Koteshwar Rao Kundeti for developing the district climate profile and modelling climate change projections for the district.
We would also like to extend our thanks to participants from various academic institutions, CSOs and line departments who contributed to the development and refinement of CCEAP through their inputs during stakeholder consultations.
We are also grateful to Swati Prasad for proofreading and giving the finishing touches to the manuscript, the team at Aspire Design, New Delhi for designing the final report.
We are thankful to our colleagues from the GIS team, and Energy team at Vasudha Foundation for providing their expertise to assist the research and development of the final action plan.
Last but not the least, we extend our gratitude to Shakti Sustainable Energy Foundation (SSEF), New Delhi, for supporting the endeavour and also to Shubhashis Dey and Aishwarya KS from SSEF.


CONTENTSExecutive summary i
1. District profile 21.1 Key statistics 2
1.2 Power and energy sector 3
1.3 Transport and related infrastructure 6
1.4 Habitat (urban and rural) 6
1.5 Industrial profile 7
1.6 Natural resources 7
1.7 Waste sector 9
2. Climate profile and projections 122.1 Observed climate variability over Ahmedabad district 12
2.1.1 Precipitation variability 12
2.1.2 Temperature variability 13
2.2 Future climate projections for Ahmedabad district 15
2.3 Sectoral impacts of climate change 18
2.3.1 Heat stress in Ahmedabad 18
2.3.2 Agriculture and allied sectors 19
2.3.3 Water resources 19
3. Sectoral greenhouse gas emissions profile: Climate change drivers 223.1 Direct emission estimates 22
3.1.1 Economy-wide emissions 22
3.1.2 Per capita emissions 23
3.1.3 Sectoral analyses and projections 25
3.2 Carbon footprint of electricity consumption 31
3.3 Vehicular growth trends 33
4. Assessment of policies through the lens of climate change 364.1 Sector-wise policy impact analysis 36
4.1.1 Power and energy sector 36
4.1.2 Agriculture, forestry and other land use (AFOLU) and cross-cutting 37
4.1.3 Waste management 38
5. Budgetary analysis to estimate expenditure on climate action 425.1 Introduction to budgetary analysis 42
5.2 Analysis and findings of flagship schemes 42
5.2.1 Mahatma Gandhi National Rural Employment Guarantee Scheme (MGNREGS) 42
5.2.2 Pradhan Mantri Krishi Sinchayee Yojana (PMKSY) 43
5.2.3 Green India Mission (GIM) 44
5.2.4 Atal Mission for Rejuvenation and Urban Transformation (AMRUT) 45
5.2.5 Deen Dayal Upadhyay Gram Jyoti Yojana (DDUGJY) and Saubhagya Scheme 45
6. Recommendations 486.1 Sector specific recommendations 49
6.1.1 Electricity and energy 49
6.1.2 Habitat (urban and rural development) 53
6.1.3 Transport 57

6.1.4 Industry 64
6.1.5 Agriculture, forestry and other land use (AFOLU) 66
6.1.6 Waste management
6.2 Innovative financing 86
6.3 Recommendations based on district-specific environmental problems 87
6.4 Actions district authorities can recommend to state departments 95
6.5 Sustainable Development Goals being addressed 100
6.6 Promoting voluntary individual climate action 103
6.7 Behavioural change communication (BCC) techniques 107
7. Monitoring and evaluation plan 1107.1 Framework for monitoring and evaluation 110
7.2 Proposed institutional set-up 111
8. Impact of COVID-19 vis-à-vis climate action 1148.1 Introduction 114
8.2 Energy consumption 114
8.2.1 Electricity demand 114
8.2.2 Fuel consumption 116
8.3 Agriculture 116
8.4 Migration 116
8.5 Waste management 115
8.6 Air pollution 115
The way forward 123
References 125
Annexes

List of figures
Figure 1: Recommendations for CCEAP Ahmedabad v
Figure 2: Consumer-wise electricity consumption in Ahmedabad (2019) 3
Figure 3: Electricity procurement mix of TPL-D (2019-20) 4
Figure 4: Trend of electricity-mix of TPL-D from 2008-09 to 2019-20 (in %) 4
Figure 5: Electricity procurement mix of GUVNL (2019-20) 5
Figure 6: T&D losses (in %) for UGVCL from 2009-10 to 2018-19 5
Figure 7: T&D losses (in %) for TPL-D from 2009-10 to 2018-19 5
Figure 8: Built-up area (sq. km) in Ahmedabad city over the years (CEPT, 2019) 7
Figure 9: Urban sprawl (CEPT, 2019) in Ahmedabad city over the years (in sq. km area) 7
Figure 10: Pre-monsoon groundwater levels in Ahmedabad: a) 2005 and b) 2019 8
Figure 11: Post-monsoon groundwater levels in Ahmedabad: a) 2005 and b) 2019 9
Figure 12: Inter-annual variability of rainfall (mm/day) over Ahmedabad for 1951-2018 12
Figure 13: Inter-annual variability of rainy days (days) over Ahmedabad for 1951-2018 13
Figure 14: Inter-annual variability of maximum temperature (oC) over Ahmedabad for 1951-2018 13
Figure 15: Inter-annual variability of warm days over Ahmedabad for 1951-2018 14
Figure 16: Inter-annual variability of minimum temperature (oC) over Ahmedabad for 1951-2018 14
Figure 17: Inter-annual variability of cold days over Ahmedabad for 1951-2018 15
Figure 18: Economywide emissions of Ahmedabad district (million tonnes of CO2e.) 22
Figure 19: Percentage share of sectors in total emissions (2019) 22
Figure 20: Projections of economy-wide emissions (BAU) for Ahmedabad district (Mt of CO2e.) 23
Figure 21: Per capita emissions (tCO2e./person)-comparison 23
Figure 22: Projected per capita emissions (BAU) 24
Figure 23: Projected total emissions (Mt of CO2e) with different per capita emissions scenarios 24
Figure 24: Energy sector emissions of Ahmedabad district (million tonnes of CO2e.) 25
Figure 25: Percentage share in total energy emissions (2019) 25
Figure 26: Projected emissions of energy sector (BAU) of Ahmedabad district in Mt of CO2e. 26
Figure 27: AFOLU sector emissions of Ahmedabad district (Mt of CO2e.) 27
Figure 28: Percentage share of categories in total AFOLU emissions 27
Figure 29: Projections of AFOLU sector emissions (BAU) 28
Figure 30: Projected enteric fermentation emissions- comparison 29
Figure 31: Waste sector emissions of Ahmedabad district. (in Mt of CO2e.) 29
Figure 32: Projections for waste sector emissions (BAU) 30
Figure 33: Percentage share of categories in total waste emissions (2019) 30
Figure 34: Electricity consumption in Ahmedabad district across categories 31
Figure 35: Sector wise share in electricity consumption of Ahmedabad district (2019) 31
Figure 36: Carbon footprint of electricity consumption in Ahmedabad district 32
Figure 37: Trend for vehicular registrations in Ahmedabad over the years (Ahmedabad RTO) 33
Figure 38: MGNREGS expenditure in Ahmedabad district (2018-19) 42
Figure 39: MGNREGS expenditure in Ahmedabad district (2019-20) 43
Figure 40: Comparing annual expenditures (in `lakh) under MGNREGS in Ahmedabad between 2018-19 and 2019-20 43
Figure 41: Distribution of budgetary targets for activities targets under GIM in Ahmedabad 2017-18, 2018-19 and 2019-20 44
Figure 42: Comparison of the budgetary targets for various activities under GIM in Ahmedabad for 2017-18, 2018-19 and 2019-20 44

Figure 43: Comparison of budgetary expenditure on climate related activities under AMRUT scheme in Ahmedabad district 45
Figure 44: Distribution of climate relevant budgetary expenditure on activities under AMRUT scheme in Ahmedabad for 2015-16, 2016-17 and 2017-20 45
Figure 45: 2025 deviation of electricity demand from pre-COVID trends projected from major Indian states 114
Figure 46: Month-wise comparison of electricity generation (MUs) by Sabaramati TPP in 2020 vs. in 2019 115
Figure 47: Impact of COVID-19 on electricity demand-UGVCL 115
Figure 48: PM2.5 concentration in Ahmedabad during Jan-May, 2019 vs. 2020 118
Figure 49: PM2.5 concentration in Ahmedabad during June-October, 2019 vs. 2020 118
Figure 50: PM10 concentration in Ahmedabad during Jan-May, 2019 vs. 2020 119
Figure 51: PM10 concentration in Ahmedabad during June-October, 2019 vs. 2020 119
Figure 52: NO2 concentration in Ahmedabad during Jan-May 2019 vs. 2020 120
Figure 53: NO2 concentration in Ahmedabad during June-October, 2019 vs. 2020 120
Figure 54: SO2 concentration in Ahmedabad during Jan-May, 2019 vs. 2020 121
Figure 55: SO2 concentration in Ahmedabad during June-October, 2019 vs. 2020 121
List of tables
Table 1: Summary of flagship schemes – budgetary analysis for Ahmedabad district iii
Table 2: District profile of Ahmedabad 2
Table 3: Ahmedabad vs Gujarat: a comparative profile (DoE&S, 2018) 3
Table 4: Total registered motor vehicles in Ahmedabad (2015-16) (Ministry of Road Transport, 2016) 6
Table 5: Observed (1986-2005), simulated (1986-2005) and projected mean monthly and seasonal rainfall (mm) for Ahmedabad district 16
Table 6: Observed (1986-2005), simulated (1986-2005) and projected mean monthly and seasonal rainy days (rainfall >2.5 mm) for Ahmedabad district 16
Table 7: Characteristics of simulated monthly and seasonal maximum temperature (oC) for Ahmedabad district (baseline and RCP 4.5 and RCP 8.5 emission scenarios) 17
Table 8: Characteristics of simulated monthly and seasonal warm days (%) with respect to baseline for Ahmedabad district (baseline and RCP 4.5 and RCP 8.5 emission scenarios) 17
Table 9: Characteristics of simulated monthly and seasonal minimum temperature (oC) for Ahmedabad district (baseline and RCP 4.5 and RCP 8.5 emission scenarios) 17
Table 10: Characteristics of simulated monthly and seasonal cold days (%) with respect to baseline for Ahmedabad district (baseline and RCP4.5 and RCP8.5 emission scenarios) 17
Table 11: Sectoral contribution and growth in emissions 22
Table 12: Growth in energy sector emissions 26
Table 13: Growth in AFOLU emissions (2005-17) & % share 27
Table 14: Projections for livestock sector 28
Table 15: Projected emissions for livestock sector (2005 to 2030) 29
Table 16: Estimation of emissions from electricity consumption in Ahmedabad district 32
Table 17: Per capita electricity consumption in India and its cities 32
Table 18: Trend of vehicular registrations over the years in Ahmedabad (2005 to 2019) 33
Table 19: Projections for vehicle numbers (vehicle category wise) for Ahmedabad RTO only 34
Table 20: Total vehicular registrations at ARTO Vastral (since 2012) 34
Table 21: Total vehicular registrations at ARTO Bawla (since 01/05/2017) 34
Table 22: Budgetary allocation to PMKSY in Ahmedabad district 43
Table 23: Impact of COVID-19 on electricity demand-UGVCL 115

ACRONYMSAFOLU Agriculture, forestry and other land use
AMC Amdavad Municipal Corporation
AMRUT Atal Mission for Rejuvenation and Urban Transformations
APMC Agricultural Produce Market Committee
ARR Aggregate revenue requirement
ASP Activated sludge process
AT&C Aggregate technical and commercial losses
AUDA Ahmedabad Urban Development Authority
BAU Business as usual
BCC Behaviour change communication
BEE Bureau of Energy Efficiency
BMW Bio-medical waste
BOD Biological oxygen demand
BRT Bus rapid transit
C&D Construction and demolition
CAGR Cumulative annual growth rate
CapEx Capital expenditure
CAAQMS Continuous ambient air quality monitoring system
CBWTF Common bio-medical waste treatment facility
CETP Common effluent treatment plant
CFA Central Finance Assistance
CGWB Central Ground Water Board
CHP Combined heat and power
CPCB Central Pollution Control Board
CPEIR Climate Public Expenditure and Institutional Review
CPP Captive power plant
DDUGJY Deen Dayal Upadhyaya Gram Jyoti Yojana
DG Diesel generator
DISCOM Distribution company
DRE Distributed renewable energy
EC Electricity consumption
ECBC Energy Conservation Building Code
EEPS Energy efficient pumping system
EESL Energy Efficiency Services Limited
EF Emission factor
EV Electric vehicle
FAME Faster Adoption and Manufacturing of Hybrid and Electric Vehicles
FMCG Fast moving consumer goods
FSI Forest Survey of India
FY Financial year
GAIC Gujarat Agro Industries Corporation Limited
GDP Gross domestic product
GHG Greenhouse gas
GHGPI GHG Platform India
GIDB Gujarat Infrastructure Development Board
GIDC Gujarat Industrial Development Corporation
GIM Green India Mission
GoG Government of Gujarat
GoI Government of India
GPCB Gujarat Pollution Control Board
GUDC Gujarat Urban Development Company Ltd
GUVNL Gujarat Urja Vikas Nigam Ltd
GW Gigawatt
HW Hazardous waste
ICAP India cooling action plan
ICE Internal combustion engine
IEC Information, Education & Communication
IISS Indian Institute of Soil Science
IMD India Meteorological Department
IoT Internet of things
IPCC Intergovernmental Panel on Climate Change
IPPU Industrial processes and product use
IPT Intermediate public transport
ISRO Indian Space Research Organisation
ISWM Integrated solid waste management
JNNURM Jawaharlal Nehru National Urban Renewal Mission
KUSUM Kisan Urja Suraksha evam Utthaan Mahabhiyan
KW Kilowatt
kWh Kilowatt hour
LED Light emitting diode

LMV Light motor vehicle
M&E Monitoring and evaluation
MCF Methane correction factor
MGNREGS Mahatma Gandhi National Rural Employment Guarantee Scheme
MLD Million litres per day
MMM Multi-model mean
MRF Material recycling facility
MSME Micro, small and medium enterprises
MtCO2e Million tonnes of carbon dioxide equivalent
MU Million units
MW Megawatt
NASA National Aeronautics and Space Administration
NCAP National Clean Air Programme
NDC Nationally determined contributions
NEX-GDDP NASA Earth Exchange Global Daily Downscaled Projections
NPK Nitrogen, phosphorus and potassium
NRSC National Remote Sensing Centre
NTPC National Thermal Power Corporation
ORNL-DAAC Oak Ridge National Laboratory Distributed Active Archive Centre
PAT Perform, achieve and trade
PCCP Personal care and cosmetic products
PEG Public electricity generation
PGVCL Paschim Gujarat Vij Company Ltd.
PLF Plant load factor
PM Particulate matter
PMKSY Pradhan Mantri Krishi Sinchayee Yojana
PRI Panchayati Raj Institutions
PT Public transport
PUC Pollution under control
RCP Representative Concentration Pathway
RE Renewable energy
REC Renewable Energy Certificate
RESCO Renewable Energy Service Company
RO Reverse osmosis
RPO Renewable purchase obligation
RTS Rooftop solar
RWA Resident welfare association
RWHS Rainwater harvesting system
SBR Sequencing batch reactors
SDG Sustainable Development Goal
SEZ Special economic zone
SLNP Streetlight National Programme
SMB Solar municipal bonds
SMNP Smart Meter National Programme
STP Sewage treatment plant
SUP Single-use plastic
SW Solid waste
SWM Solid waste management
T&D Transmission and distribution
TOE Tonnes of oil equivalent
ToU Time of use
TPD Tonnes per day
TPL Torrent Power Limited
TPP Thermal power plant
TSDF Treatment, storage and disposal facility
UDAY Ujwal DISCOM Assurance Yojana
UGVCL Uttar Gujarat Vij Company Limited
UJALA Unnat Jyoti by Affordable LEDs for All
ULB Urban local body
W Watt
WEEE Waste electrical and electronic equipment
WSP Waste stabilisation pond
WTE Waste to energy
WW Wastewater
ZEV Zero emission vehicle

iExecutive summary
EXECUTIVE SUMMARYThis Climate Change and Environment Action Plan studies the past, present and the future of the district of Ahmedabad from both the climate and policy perspective to know where the district stands in terms of meeting India’s climate commitments. Based on the findings, it evolves concrete recommendations and the way forward for the district collector and other in-line departments.
The ongoing COVID-19 pandemic made it abundantly evident that anthropogenic activities have a far-reaching impact on the environment. On the flip side though, climate action has received a setback. A number of mitigation and adaptation-centric sectors have experienced unforeseen shifts. For instance, an overburdened health infrastructure hasn’t been able to accommodate climate-related health issues. Considerable job losses have further diminished the adaptive capacities of the poor and vulnerable. And, there has been a substantial spike in the waste sector emissions with the rise in covid-related waste incineration and increased disposal of single use plastic.
The action plan, therefore, takes a holistic view of the current policies and recommends steps that need to be taken in the short-, medium- and long-term to bring about the necessary changes that are in compliance with India’s overall climate goals and commitments.
The key components of this Action Plan are summarised in the chart below:
DISTRICT & CLIMATE PROFILE
Demographical information; industrial profile; land categorisation; agricultural profile; transport; natural resources etc.
Observed climate variability
Climate change projections (till end of the century; in time slices of 2030, 2050, 2070 & 2100)
Direct drivers (source-based emissions: 2005 to the latest year as per data availability) + emissions projections.
Carbon footprint of electricity consumption trends + projections-BAU
Energy; AFOLU; waste; district specific issues, such as wetlands, water scarcity, air pollution and heat stress and recommendations by the collector/committee.
Other inputs: Behavioural change communication; M&E (general framework and institutional arrangement)
Changes in electricity consumption, air quality, waste generation, management, etc.
Evaluation of sector-specific policies (energy; AFOLU; waste; cross-cutting).
Budget allocated for climate action (mitigation and resilience) under flagship schemes..
CLIMATE CHANGE DRIVERS
POLICY IMPACT EVALUATION
BUDGETARY ALLOCATION ANALYSIS
RECOMMENDATIONS
IMPACTS OF COVID-19
COMPONENTS OF CCEAP

ii Climate Change and Environment Action Plan for Ahmedabad District
CLIMATE PROFILE AND PROJECTIONSThis section analyses historical data and projects changes in rainfall and temperature for Ahmedabad district using IMD and NASA’s NEX-GDDP datasets, following the multi-modal mean (MMM) approach. Here are some findings for the district:
• Rainfall expected to increase: The seasonal rainfall is projected to increase by 8 to 17 percent under RCP4.5 and 13 to 40 percent under RCP8.5 emission scenarios.1 The number of rainy days is also projected to increase during monsoon, particularly in July and August.
• Summers are getting hotter: A significant trend of increase in the maximum temperatures during summer months is seen in the district, which is observed to be accelerated during the last decade. The mean percentage of warm days has shown an increasing trend of around 8 to 10 percent. The minimum temperature has shown an increasing tendency during the season. Cold days show a decreasing trend in the recent decade.
• Warms days to increase: Maximum temperatures are projected to increase by about 1.2°C to 2.4°C under RCP4.5 and 1.4°C to 3.5°C under RCP8.5 emission scenarios. In future, the percentage of warm days are also projected to increase by over 45 percent of the present climate. The minimum temperatures also show an increasing trend – the percent of cold days may decrease in all epochs under changing climate conditions.
SECTORAL GREENHOUSE GAS EMISSIONS PROFILE: CLIMATE CHANGE DRIVERS• Greenhouse gases have risen by 78 percent since 2005: Between 2005 and 2019, the total greenhouse
gas (GHG) emissions of Ahmedabad district increased by 78 percent (from 5.16 million tonnes CO2e in 2005 to 9.18 million tonnes CO2e in 2019) with a CAGR of 4.20 percent. These estimates cover GHG emissions from 13 categories under three major sectors – energy, AFOLU (agriculture, forestry and other land use) and waste.
• Energy sector is the highest contributor of emissions: The energy sector (direct fuel combustion in transport, electricity generation, CPP, agriculture, residential etc.) is the highest contributor with 77 percent of total emissions in Ahmedabad district. This is followed by AFOLU (13 percent) and waste (10 percent).
� Energy sector emissions have increased by 71.32 percent (from 4.14 Mt of CO2e in 2005 to 7.09 Mt of CO2e in 2019) with a CAGR of 3.92 percent.
� Public electricity generation and transport are the highest contributors towards energy emissions. This is followed by residential, captive power plants, agriculture and industries.
• Enteric fermentation and rice cultivation are major contributors to AFOLU emissions: Emissions from the AFOLU sector have increased at a CAGR of 4.02 percent (by 73.93 percent between 2005 and 2019). Major emission contributors are enteric fermentation and rice cultivation. Increase in forest cover in recent years has added to the sink potential of the Ahmedabad district.
• Waste sector emissions are growing rapidly: Although the waste sector has the smallest contribution in economy-wide emissions, it witnessed the highest growth between 2005 and 2019, growing at a CAGR of 7.06 percent. Total waste emissions have increased by 159.85 percent (2005-2019).
• Business-as-usual scenario will be disastrous: If no actions/policies are put in place to mitigate the emissions – i.e. the business-as-usual scenario -- the total emissions of Ahmedabad are likely to grow by 96 percent till 2030, with respect to 2015 levels.
ASSESSMENT OF POLICIES THROUGH THE LENS OF CLIMATE CHANGEA total of 40 major national/state level policies and programmes of energy, AFOLU and waste sector was evaluated for their climate mitigation potential.
• Power and energy: Twelve policies/programmes were evaluated. UDAY and PAT schemes were found to be the biggest contributors to GHG mitigation.
� Policies related to clean energy generation mitigated 96,000 tCO2e emissions.
1 Representative concentration pathways (RCPs) are concentration pathways used by the IPCC. They are prescribed pathways for greenhouse gas and aerosol concentrations, together with land use change that are consistent with a set of broad climate outcomes used by the climate modelling community. The pathways are characterised by the radiative forcing produced by the end of the 21st century. Radiative forcing is the extra heat that will be retained by the lower atmosphere as a result of additional greenhouse gases, measured in watts per square metre (W/m²). There are four RCPs – RCP2.5 (low pathway where radiative forcing peaks at approximately 3 W/m² before 2100), RCP4.5 and RCP6.0 (two intermediate stabilisation pathways in which radiative forcing is stabilised at approximately 4.5 W/m² and 6.0 W/m² after 2100) and RCP 8.5 (high pathway for which radiative forcing reaches greater than 8.5 W/m² by 2100).

iiiExecutive summary
� Policies pertaining to energy-efficient buildings and processes helped avoid 83,31,667 tCO2e.� Transportation interventions led to emission avoidance of 3,64,361 tCO2e.
• AFOLU and cross-cutting: Twelve policies were assessed
� Forestry policies alone led to a mitigation of 16,12,544 tCO2e emissions.� Policies pertaining to livestock proved to be beneficial for climate action, avoiding 598.97 tCO2e emissions.� In agricultural sub-sector, impact of only one policy could be computed – the National Food Security Mission
added 11,515 tCO2e emissions.� Policies pertaining to cross-cutting sector helped mitigate 6,79,686 tCO2e emissions.
• Waste: Fifteen policies were assessed.
� Policies pertaining to sanitation added 2,29,215 tCO2e. emissions.� Composting as a part of solid waste management practices mitigated 3,977 tCO2e emissions.� Domestic wastewater treatment interventions have led to 4,99,332 tCO2e. emissions.
BUDGETARY ANALYSIS TO ESTIMATE EXPENDITURE ON CLIMATE ACTIONThis action plan analyses the district expenditure to estimate spending on climate action. A total of 38 flagship schemes were reviewed to identify those with climate resilience and mitigation relevance. Of these, based on the availability of information across districts as well as relevance to climate actions, five schemes were selected for further analysis.
Table 1: Summary of flagship schemes – budgetary analysis for Ahmedabad district
Scheme Climate -relevant activities Year
Total allocation to district under the scheme (in `
lakh)
Allocation to climate action
(` lakh)
% of total scheme budget for
climate action at district level*
MGNREGS
Eleven out of 17 activities were identified as climate relevant – drought proofing, fisheries, flood control and protection, land development, micro-irrigation, renovation of traditional water bodies, rural connectivity, drinking water, sanitation, water conservation and water harvesting
2018-19 1390.09 194.6114
2019-20 1,097.77 153.69
PMKSY Micro-irrigation activities2016-17 641 442.29
692019-20 206 142.14
GIMEnhancing forest cover, ecosystem restoration, agro-forestry, social forestry, wetland restoration, promoting alternative fuels
2017-18 165.22 165.22
1002018-19 107.56 107.56
2019-20 39.97 39.97
AMRUT Water supply, sewage and septage management, urban transport, drainage, green spaces
2015-16 7,170 4,282.50
542016-17 12,425 6,341.90
2017-20 27,128 15,175.60
DDUGJY + Saubhagya
New sub-stations and upgradation of existing ones, LT lines, feeder segregation, consumer metering, DTR metering etc
Up to April
20202,035 1,017 50
*Percentage has been attributed by using Climate Public Expenditure and Institutional Review (CPEIR) methodology of UNDP
RECOMMENDATIONSThe action plan provides comprehensive, sector-wise recommendations from a climate perspective. The aim is to align the district with India’s climate commitments through this Climate Change and Environment Action Plan (CCEAP).
The recommendations factor-in state/district vision documents/development plans. They also list the current policies, programmes and schemes and identify concerned departments that can help streamline the actions. This section also provides information on SDGs and other co-benefits that will be addressed through these recommendations. Overall, the mitigation actions suggested in the recommendations can help mitigate 5 Mt CO2e per annum. The sectoral breakdown of the same is as following:
Energy
30,54,254AFOLU
13,66,129Waste
5,85,044
GHG mitigation potential of CCEAP recommendations (tCO2e)
iv Climate Change and Environment Action Plan for Ahmedabad District
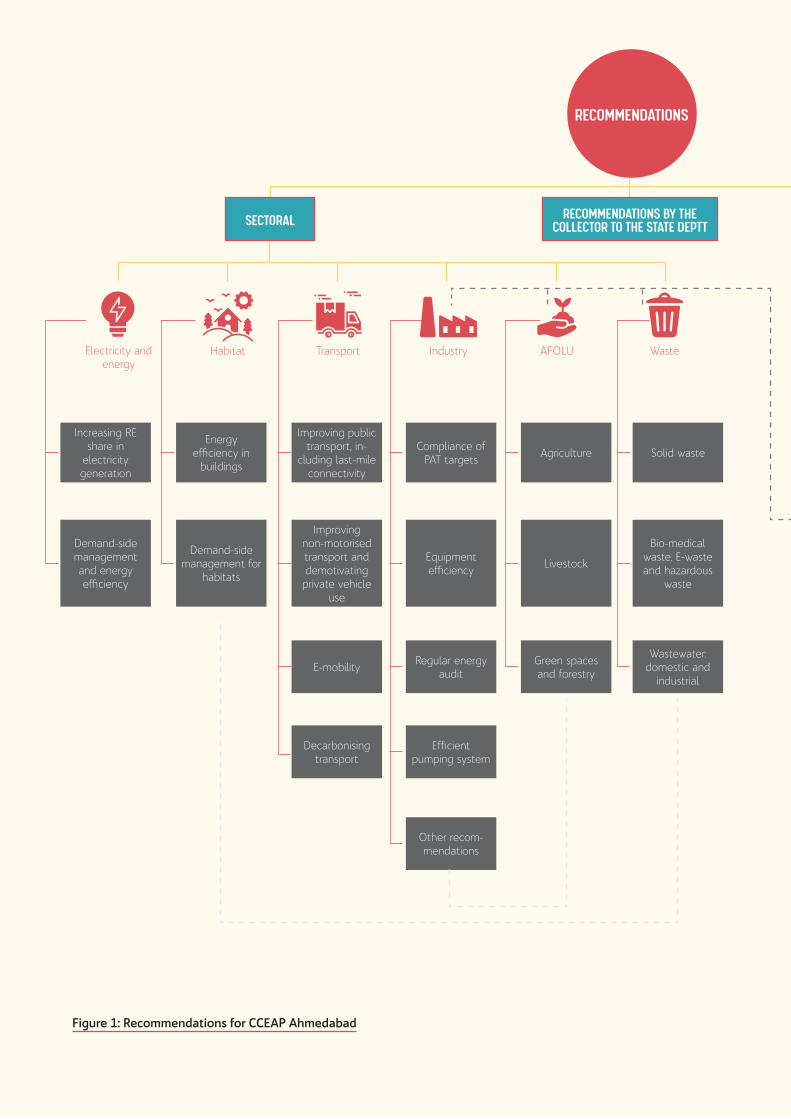
Figure 1: Recommendations for CCEAP Ahmedabad
Increasing RE share in
electricity generation
Demand-side management and energy efficiency
Energy efficiency in
buildings
Demand-side management for
habitats
Improving public transport, in-
cluding last-mile connectivity
Improving non-motorised transport and demotivating private vehicle
use
E-mobility
Decarbonising transport
Compliance of PAT targets
Equipment efficiency
Regular energy audit
Efficient pumping system
Other recom-mendations
Agriculture
Livestock
Green spaces and forestry
Solid waste
Bio-medical waste, E-waste and hazardous
waste
Wastewater: domestic and
industrial
RECOMMENDATIONS
SECTORAL
Electricity and energy
Habitat Transport Industry AFOLU Waste
RECOMMENDATIONS BY THE COLLECTOR TO THE STATE DEPTT

vExecutive summary
DISTRICT ENVIRONMENTAL ISSUES
PROMOTING VOLUNTARY ACTIONS
BEHAVIORAL CHANGE COMMUNICATION
: Interlinkages across sectors and sub-sectors (cross-cutting aspects)
Water scarcity Lighting
Transport
Housing
Kitchen
Daily use appliance
Waste management
Other recommendations
Nalsarovar-wetland
Brick kilns
Air pollution
Heat stress
Grassroots-communicators as energy ambassadors
Ward/village level Urja Samiti
IEC products
Reward residential societies on environmental performance
Issue specific campaigns using all forms of media
Encourage lifestyle changes

vi Climate Change and Environment Action Plan for Ahmedabad District
Though the energy sector is crucial to achieving India’s growth ambitions, it is also responsible for around 70 percent of the country’s annual GHG emissions. This calls for a paradigm shift in the energy sector.
Therefore, the action plan recommends (a) increasing the share of RE generation in the district by advancing on-grid and off-grid solar rooftop, ground-mounted installations and other RE installations; (b) encouraging faster penetration of energy-efficient and star-labelled fixtures and upgrading existing power-grid infrastructure to advanced metering infrastructure (in public, institutional and commercial setups); (c) promoting energy efficiency in the residential sector by encouraging the incorporation of ECBC in the building bye-laws, implementation of India Cooling Action Plan, 2018, etc.; and (d) promoting energy conservation in the industrial sector by introducing measures such as a “cap and trade” system for MSMEs at the district level, encouraging industries to follow the Gujarat Industrial Policy, 2020, etc.
AFOLU
For agriculture, forestry and other land use (AFOLU) sector, it’s important to promote climate conscious practices that do not have an adverse impact on the ecosystem, biodiversity and natural resource dependent communities. Our recommendations include: (a) promoting the use of organic fertilisers, solar pumps and practices such as micro-irrigation and alternative ways to manage crop-residue under agriculture; (b) having a good mix of high-yield cross-breed cattle and indigenous cattle, and encouraging the use of good quality fodder to bring down enteric fermentation emissions; and (c) maintaining the forest area and the tree cover of Ahmedabad through strict M&E, afforestation in fallow and wasteland, use of alternative funding like CSR, adoption of Miyawaki urban forestry and study on suitability of plantation sites/species, etc. The action plan also recommends involvement of regional agriculture universities to initiate research on high yielding, drought- and temperature-resilient genotypes for various crops, among other measures.
Power and Energy
Transport
Being one of the fastest growing sectors in India, transport contributes 12 percent to India’s total GHG emissions. The action plan recommends (a) promoting e-mobility through awareness, increase of e-vehicles’ modal share, transition of public transport (PT) and intermediate public transport (IPT) to electric-powered or hybrid vehicles, developing widespread charging infrastructure, incentivising e-vehicle owners, etc.; (b) ensuring last-mile connectivity and promoting increased use of PT and IPT; (c) augmenting non-motorised transport through dedicated cycle lanes; and (d) improving traffic flow through decongestion and improving road conditions.
Waste
With waste sector being one of the biggest contributor of methane emissions globally, major recommendations revolve around reducing landfill disposal of waste and managing wastewater to reduce GHG emissions from them through measures such as: (a) reducing waste at source; (b) proper segregation, collection and channelisation of different categories of waste (including bio-medical waste and e-waste) for recycling and treatment; (c) 100 percent conversion of organic waste to compost and gas management of composting units; (d) recycling, recovery and reuse of 100 percent inert waste (plastic, construction waste, etc); and (e) setting up of centralised aerobic wastewater treatment plants with closed sewer networks and periodical sludge removal facility.
WET WASTE
DRY WASTE
Here are some in-brief, sector-wise recommendations:

viiExecutive summary
Given the unique environmental issues of the district, the action plan also recommends:
1. Adopting a holistic approach to water conservation and wastewater management, including conservation techniques such as rainwater harvesting, net zero water infrastructure, minimising losses in water supply, installing water-efficient fittings, water metering and adoption of inclusive and sustainable water governance.
2. Developing extensive infrastructure to monitor air pollution and suggestions on interventions for preventive measures.
3. The action plan also identifies degradation of Nalsarovar wetland, need for improving sustainability of brick kilns and management of heat stress in the district as key environmental issues and lists recommendations for the same.
COVID-19 IMPACTThis section presents an assessment of how the COVID-19 pandemic has impacted various sectors and the developmental measures. During the national lockdown in 2020, the district saw a 63 percent reduction in electricity generation (between January and August 2020) at the Sabarmati Thermal Power Plant. In agriculture, harvesting activities got interrupted due to the lockdown. The sector also witnessed supply chain problems. However, reverse migration benefitted kharif crops with 21.20 percent increase in sown area in the district.
Overall, the pandemic resulted in significant reduction in air pollution due to reduced transport and industrial activities during the lockdown and unlock periods. However, the most impacted sector was waste management with single-use plastic waste and bio-medical waste from both households and healthcare sector increasing manifold, leading to increased incineration, landfilling and single-use product consumption.

viii Climate Change and Environment Action Plan for Ahmedabad District
Bharuch
Bhavnagar
Botad
Surendranagar
Kheda
Anand
GandhinagarMahesana
PatanSabar Kantha
Gujarat
Ahmedabad
Bharuch
Bhavnagar
Botad
Surendranagar
Kheda
Anand
GandhinagarMahesana
PatanSabar Kantha
Gujarat
Ahmedabad

1District profile
DISTRICT PROFILE
Aerial view of Ahmedabad
2 Climate Change and Environment Action Plan for Ahmedabad District
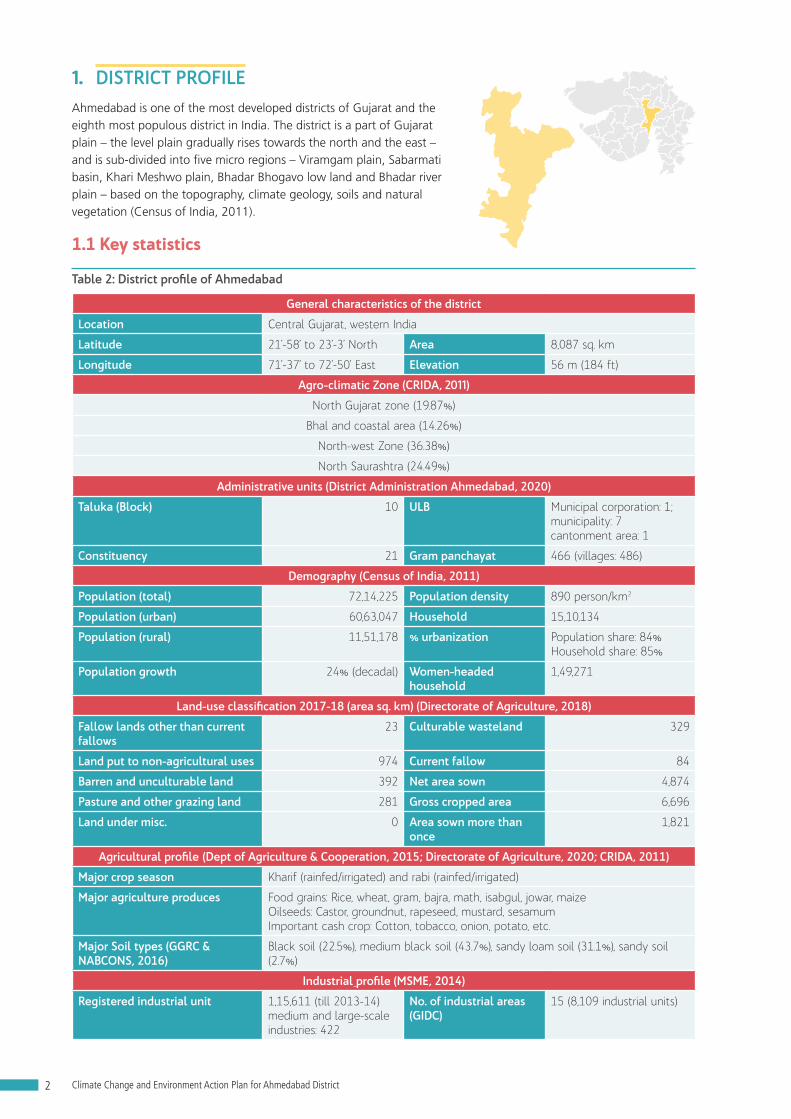
1. DISTRICT PROFILEAhmedabad is one of the most developed districts of Gujarat and the eighth most populous district in India. The district is a part of Gujarat plain – the level plain gradually rises towards the north and the east – and is sub-divided into five micro regions – Viramgam plain, Sabarmati basin, Khari Meshwo plain, Bhadar Bhogavo low land and Bhadar river plain – based on the topography, climate geology, soils and natural vegetation (Census of India, 2011).
1.1 Key statistics
Table 2: District profile of Ahmedabad
General characteristics of the district
Location Central Gujarat, western India
Latitude 21’-58’ to 23’-3’ North Area 8,087 sq. km
Longitude 71’-37’ to 72’-50’ East Elevation 56 m (184 ft)
Agro-climatic Zone (CRIDA, 2011)
North Gujarat zone (19.87%)
Bhal and coastal area (14.26%)
North-west Zone (36.38%)
North Saurashtra (24.49%)
Administrative units (District Administration Ahmedabad, 2020)
Taluka (Block) 10 ULB Municipal corporation: 1; municipality: 7cantonment area: 1
Constituency 21 Gram panchayat 466 (villages: 486)
Demography (Census of India, 2011)
Population (total) 72,14,225 Population density 890 person/km2
Population (urban) 60,63,047 Household 15,10,134
Population (rural) 11,51,178 % urbanization Population share: 84%Household share: 85%
Population growth 24% (decadal) Women-headed household
1,49,271
Land-use classification 2017-18 (area sq. km) (Directorate of Agriculture, 2018)
Fallow lands other than current fallows
23 Culturable wasteland 329
Land put to non-agricultural uses 974 Current fallow 84
Barren and unculturable land 392 Net area sown 4,874
Pasture and other grazing land 281 Gross cropped area 6,696
Land under misc. 0 Area sown more than once
1,821
Agricultural profile (Dept of Agriculture & Cooperation, 2015; Directorate of Agriculture, 2020; CRIDA, 2011)
Major crop season Kharif (rainfed/irrigated) and rabi (rainfed/irrigated)
Major agriculture produces Food grains: Rice, wheat, gram, bajra, math, isabgul, jowar, maizeOilseeds: Castor, groundnut, rapeseed, mustard, sesamumImportant cash crop: Cotton, tobacco, onion, potato, etc.
Major Soil types (GGRC & NABCONS, 2016)
Black soil (22.5%), medium black soil (43.7%), sandy loam soil (31.1%), sandy soil (2.7%)
Industrial profile (MSME, 2014)
Registered industrial unit 1,15,611 (till 2013-14)medium and large-scale industries: 422
No. of industrial areas (GIDC)
15 (8,109 industrial units)

3District profile
Table 3: Ahmedabad vs Gujarat: a comparative profile (DoE&S, 2018)
Particular Ahmedabad district Gujarat Percentage contribution
Total population (2011) 72,14,225 6,04,39,692 11.9%
Urban population (2011) 60,63,047 2,57,45,083 23.5%
Percentage of urban population 84% 42.6% 2 times higher than the state
Geographical area (sq. km) 8,087 196,244 4%
Forest cover (sq km) (FSI, India State of Forest Report 2019: Gujarat Vol 2, 2019)
131.21
(very dense: 0; moderately dense: 12.75; open forest: 118.46)
14,857
(very dense: 377.9; moderately dense: 5,092; open forest: 9,387.43)
0.88%
(No dense forest in the district)
Per capita forest area (ha/person) 0.0018 0.024 13 times less than
that of the state
Total registered vehicles 46,16,919 2,32,86,418 19.83%
Total rice production (in ‘000 tonnes) 323 1,692 19.08%
Installed capacity of electricity generation (conventional, MW) 362 25,236 1.43%
Major types of industries (MSME, 2017)
Pharmaceuticals, chemicals and other healthcare, textiles, food processing & agro-based, milk products, metallurgical, plastic, mineral based industries, etc.
Pharmaceuticals, textiles, chemicals, gems and jewelleries, marine products, milk products, food processing, etc.
--
Total MSME units registered 1,13,156 4,89,617 23.11%
1.2. Power and energy sector Ahmedabad is home to Sabarmati Thermal Power Plant, a coal-based plant by Torrent Power Limited, with a total installed capacity of 362 MW. Bulk of the electricity in the district is supplied by Gujarat’s north zone DISCOM – Uttar Gujarat Vij Company Limited (UGVCL), which in turn procures electricity from Gujarat Urja Vikas Nigam Limited (GUVNL). The remaining portion of the electricity is supplied by Torrent Power Limited-Distribution company (TPL-D). The industrial sector is the predominant electricity consuming sector in the district, followed by residential, commercial and agricultural sectors (Figure 2). The overall electricity consumption increased by 8.59 percent CAGR between 2012 and 2018, with the consumption mix remaining unchanged for that period (GERC, 2021).
Figure 2: Consumer-wise electricity consumption in Ahmedabad (2019)
RGP(Domestic)
18.86%
2.60%
Commercial5.63%
Public lighting
0.06%
Others22.16%
1.74%Public water
worksAgriculture
Industrial (LT+HT)
49.36%

4 Climate Change and Environment Action Plan for Ahmedabad District
For FY 2019-20, TPL-D purchased 12,382 MUs of electricity, of which around 52 percent came from gas, followed by coal and renewable sources-based generation, as illustrated in Figure 3 (GERC, 2021) (Vasudha Power Info Hub, 2021). In the renewable energy (RE) basket, solar power contributed to around 41.36 percent of the electricity procurement. (GERC, 2021) (Vasudha Power Info Hub, 2021).
For FY 2019-20, GUVNL purchased 98,262 MUs of electricity, of which around 80 percent came from coal, followed by renewable sources and gas-based generation, illustrated in Figure 5 (GERC, 2021) (Vasudha Power Info Hub, 2021). Out of the total RE purchased, wind power contributed around 55 percent (GERC, 2021) (Vasudha Power Info Hub, 2021).
0
10
20
30
40
50
60
70
80
90
100
REGasCoal
2019-202018-192017-182016-172015-162013-142012-132011-122010-112009-102008-09
Perc
ent
(%)
99.64
76.25
55.43
42.04
0
22.55
43.70
56.82
35.09
21.85 20.42
44.01
55.42
51.18
51.22
0.36 1.21 0.87 1.14 2.26 1.66 3.38 5.179.11 9.40
14.30
62.64
76.49
65.17
23.36 21.29 22.00 20.87
Figure 4: Trend of electricity-mix of TPL-D from 2008-09 to 2019-20 (in %)
The transmission and distribution losses for TPL-D were 11.7 percent during the FY 2016-17 (GERC, 2018), while for UGVCL they were 7.9 percent during the same time period (GERC, 2018). T&D losses for both the DISCOMs were much lower than the national average of 21.42 percent (CEA , 2019). At present, the T&D losses of UGVCL stand at 6.06 percent (GERC, 2021).
Figure 3: Electricity procurement mix of TPL-D (2019-20)
Oil & gas52.22%
RE13.3%
Trading and others13.61%
Coal20.87%
Other RE sources
58.64%Solar41.36%

5District profile
Nuclear2.34%
Coal79.58%
RE15.35%
Oil & gas2.73%
Wind52.44%
Solar35.83% Small
hydro
4.88%
Other RE sources
6.84%
Figure 5: Electricity procurement mix of GUVNL (2019-20)
0
2
4
6
8
10
12
2018
-19
2017
-18
2016
-17
2015
-16
2013
-14
2012
-13
2011
-12
2010
-11
2009
-10
10.93
9.959.23 9.3 9.34
7.79 7.9
6.766.06
T&D
loss
es in
%
Figure 6: T&D losses (in %) for UGVCL from 2009-10 to 2018-19
19.0817.54
13.80
18.33
10.23
12.61
14.47
11.71
16.77
14.52
0
4
8
12
16
20
2018
-19
2017
-18
2016
-17
2015
-16
2014
-15
2013
-14
2012
-13
2011
-12
2010
-11
2009
-10
T&D
loss
es in
%
Figure 7: T&D losses (in %) for TPL-D from 2009-10 to 2018-19
Wind energy contributes highest to the RE basket of GUVNL electricity procurement
UGVCL is one of the best performing DISCOMs in India having
6% T&D losses in 2018-19
T&D losses in TPL-D though remained much below the national average but has scope to improve

6 Climate Change and Environment Action Plan for Ahmedabad District
Category-wise electricity consumption (EC) of Ahmedabad district and projections of electricity consumption are given in Chapter 3.2
1.3. Transport and related infrastructureAhmedabad district is spread over an area of 8,087 km2. The Ahmedabad urban agglomeration area is about 1,866 km2, of this 465 km2 falls under the Ahmedabad Municipal Corporation (AMC). Ahmedabad has two major public transport systems – the Ahmedabad Municipal Transport Service (AMTS), a bus service running in mixed traffic; and the Bus Rapid Transit System (BRTS), operated by Ahmedabad Janmarg Limited (AJL) that runs on dedicated corridors. Both AMTS and BRTS are wholly-owned subsidiaries of the AMC (Shah & Adhvaryu , 2016). The Ahmedabad BRTS is the most successful bus rapid transport in India. However, over the years, the population using public transport has dropped from 15 percent in 2013 to 11 percent in 2019 (CEPT University, 2019). Details on vehicle registration from Ahmedabad district RTOs are given in Chapter 3.
Table 4: Total registered motor vehicles in Ahmedabad (2015-16) (Ministry of Road Transport, 2016)
Mode Vehicle type Number (2016)
Public transport Bus 30,625
IPTTaxi/cab 20,099
Auto-rickshaw 1,69,254
PrivateTwo-wheeler 25,93,116
Four-wheeler 6,09,677
In 2014, the Union Cabinet approved `10,773 crore for Phase-I of Ahmedabad Metro, a 40.03 km stretch. The metro is envisioned to connect four corners of the city with two corridors, covering 32 metro stations in all. In March 2019, 6.5 km stretch between Apparel Park and Vastral Gam was inaugurated as part of the East-West corridor, covering 17 stations (Financial Express, 2019). Until July 2019, the total ridership for the metro was around 2,67,000 passengers (Ahmedabad Mirror, 2019).
1.4 Habitat (urban and rural)Ahmedabad district’s 84.04 percent population resides in urban areas, which is twice the state average (Census, 2011). With a geographical area of 4.13 percent of Gujarat, the population density of the district (around 890/sq.km) is the second highest in the state, and thrice the state average. Ahmedabad’s population density is more than twice the national average. This indicates a huge pressure on its resources and infrastructure. There are eight urban local bodies in the district – while Ahmedabad has a municipal corporation, there are seven municipalities of Bareja, Bavala, Bopal, Dhandhuka, Dholka, Sanand and Viramgam. The increase in urban sprawl of Ahmedabad city is summarised in Figure 9.
2 Electricity is supplied in the district by TPL-D and UGVCL DISCOMs.
In 2014, the Union Cabinet approved `10,773 crore for Phase-I of
Ahmedabad metro, a 40.03 km stretch.
84.04% population of Ahmedabad district resides in urban areas

7District profile
Ahmedabad has also seen a significant jump in the built-up area, as illustrated in Figure 8:
1990
150.06
190.58
1999 2008 2017
140.06
212.27
0
50
100
150
200
250
Are
a (s
q. k
m)
Figure 8: Built-up area (sq. km) in Ahmedabad city over the years (CEPT, 2019)
Urban sprawl has increased over
5 folds since 1973
96.34
0
100
200
300
400
500
600
1973
120.35192.62 214.76 236.02 261.44
299.21338.39
432.62
1976 1991 1994 1997 2001 2008 2011 2014 2017
503.09
Are
a (s
q. k
m)
Figure 9: Urban sprawl (CEPT, 2019) in Ahmedabad city over the years (in sq. km area)
1.5 Industrial profileAhmedabad district has 12 main industrial estates, 12 special economic zones and 10 industrial parks. The industrial zones are restricted to the surrounding areas of Ahmedabad metropolis and some industrial towns of the district. The New Industrial Policy has enabled the government to identify certain areas in the industrially backward talukas of the district. Many industrial units have been coming up along the Saarkhej-Bavla Road and Sarkhej-Viramgam Road, due to the incentives provided to investors. Overall, the district has well-developed infrastructure and connectivity that are conducive for the growth of industries in the region.
The district has 265 large-scale industries and public sector undertakings, some of which contribute to the industrial processes and product use (IPPU) sector emissions as per IPCC. There are 22,839 MSME units, established at an investment of `4,170 crore (MSME - Development Institute, 2012) that employ 2,38,254 workers. Base metal products, machinery equipment and parts are the largest type of industry in Ahmedabad district. For further details please refer to Annexure 1.1.
1.6 Natural resourcesThe district has four agro-climatic zones – north Gujarat, Bhal and coastal area, north-west zone, and north Saurashtra zone – with conditions varying from arid, semi-arid to dry-sub humid. The district has an overall cropping intensity of 137 percent, with a net sown area of over 5,60,000 hectares (CRIDA, 2012). Major crops include cotton, paddy, wheat and horticultural products such as ber (Ziziphus mauritiana), citrus, cucurbits, brinjals and tomatoes. The net irrigated area is 1,85,000 hectare and the rainfed area is 3,14,000 hectare.
The total livestock population of the district is 80,771 (Gujarat Forest Department, 2018) (details provided in Annexure 1.2). Ahmedabad has 2.4 percent of the Gujarat’s cattle population; 3.8 percent of the state’s buffaloes, 0.97 percent
The built-up area has gone up by
52% since 1990

8 Climate Change and Environment Action Plan for Ahmedabad District
of sheep, 2.9 percent of goats, 25 percent of pigs, and 2.7 percent of the state’s poultry share (Department of Animal Husbandry and Dairying, 2012).
The forest area is 13,121 hectares, comprising of 1.62 percent of the geographical area of the Ahmedabad district and is much below the state average of 7.57 percent (FSI, 2019). Table 3 gives details of the forest cover.
Ahmedabad lies on the banks of Sabarmati, with the river dividing the city into distinct eastern and western regions. According to the Revenue Department and Urban Development Department, Ahmedabad has 60 lakes, including Kankaria and Vastrapur. Seventeen lakes were turned into eco-recreational zone spaces during the last decades by the AMC and AUDA. However, most of the lakes have gone dry due to lack of maintenance.
Nalsarovar Lake in Ahmedabad has been notified as one of the wetlands of national conservation significance. It is a Ramsar site since September 2012 and has been a bird sanctuary since 1969. As per the State Forest Report 2017, the net area under wetlands in the district is 3,200 hectare (down from 3,300 hectare in 2015) (Gujarat Forest Department, 2018).
In terms of groundwater availability and use, majority of the district (72 percent) can be categorised as semi-critical. Overall groundwater development (percentage of extraction) in the district is 78.36 percent (CGWB, 2014).3 CGWB statistics indicate that in 2017, the groundwater levels in the district were in the range of 0.13 to 9.22 metres with respect to the decadal averages from 2007 to 2016 (CGWB, 2019).
As per the analysis based on IWRIS data, the pre-monsoon groundwater level of 27 stations located in the eight blocks of Ahmedabad indicate a significantly improved water level in the lower part of the district.4 However, regions in the upper part, which largely feed the urban agglomeration, have seen marginal improvement (Figure 10). Post-monsoon trend, on the other hand, shows an improved water level across the district in the last 15 years (Figure 11).
3 The stage of ground water development is a ratio of annual ground water draft and net annual ground water availability in percentage.
4 India Water Resources Information System (IWRIS) by the Ministry of Jal Shakti provides single window solution for all water resources data and information in a standardised national GIS framework (Weblink: https://indiawris.gov.in/wris/#/about).
Figure 10: Pre-monsoon groundwater levels in Ahmedabad: a) 2005 and b) 2019

9District profile
1.7 Waste sectorAhmedabad is ranked fifth among 47 cities of India with a population of more than a million by Swachh Survekshan 2020 (cleanliness, hygiene and sanitation survey) (MoHUA, Swachh Survekshan 2020). The city has improved its rank from sixth in 2019, indicating an improvement in waste management. Gujarat has adopted the concept of common regional landfills for urban local body (ULB) clusters and vermi-compost treatment facilities at ULB level. The Ahmedabad cluster has five ULBs – Bareja, Motera, Bavla, Sanand and Dholka. Ahmedabad Municipal Corporation (AMC) has its individual landfill site and the collection efficiency within the corporation area is 100 percent (GPCB, 2019). The district is not fully-covered by underground sewerage, but AMC has nine sewage treatment plants or STPs (six aerobic and three anaerobic) for domestic liquid waste treatment with a total capacity of 1,075 MLD (CPCB, Inventorisation of sewage treatment plants, 2015). Although there are several industrial clusters in the district, industrial wastewater generation or treatment database is not in the public domain, with the exception of information on the common effluent treatment plants (CETPs). Ahmedabad has nine CETPs with a total of 128.69 MLD treatment capacity (GPCB, 2020).
Figure 11: Post-monsoon groundwater levels in Ahmedabad: a) 2005 and b) 2019

10 Climate Change and Environment Action Plan for Ahmedabad District
*: C&D: Construction & Demolition; CBWTF: Common Bio-medical Waste Treatment Facility; TSDF: Treatment, Storage & Disposal Facility;
WASTE MANAGEMENT IN AHMEDABAD
e e e e
GENERATION
DISPOSAL
Consumer: 17,004 MT/yr Bulk
consumer: 11,213.37 MT by 2025
No district info No district data3,300-4,000 TPD
Composting, resource derived
fuel, C&D* recycling, landfill
Treated at CBWTF* (incineration,
autoclave ,etc.) & captive facilities
Mostly routed informally
Treated at TSDF* (incineration)
Solid waste
Bio-medical waste
E-waste Hazardous waste
11Climate profile and projections
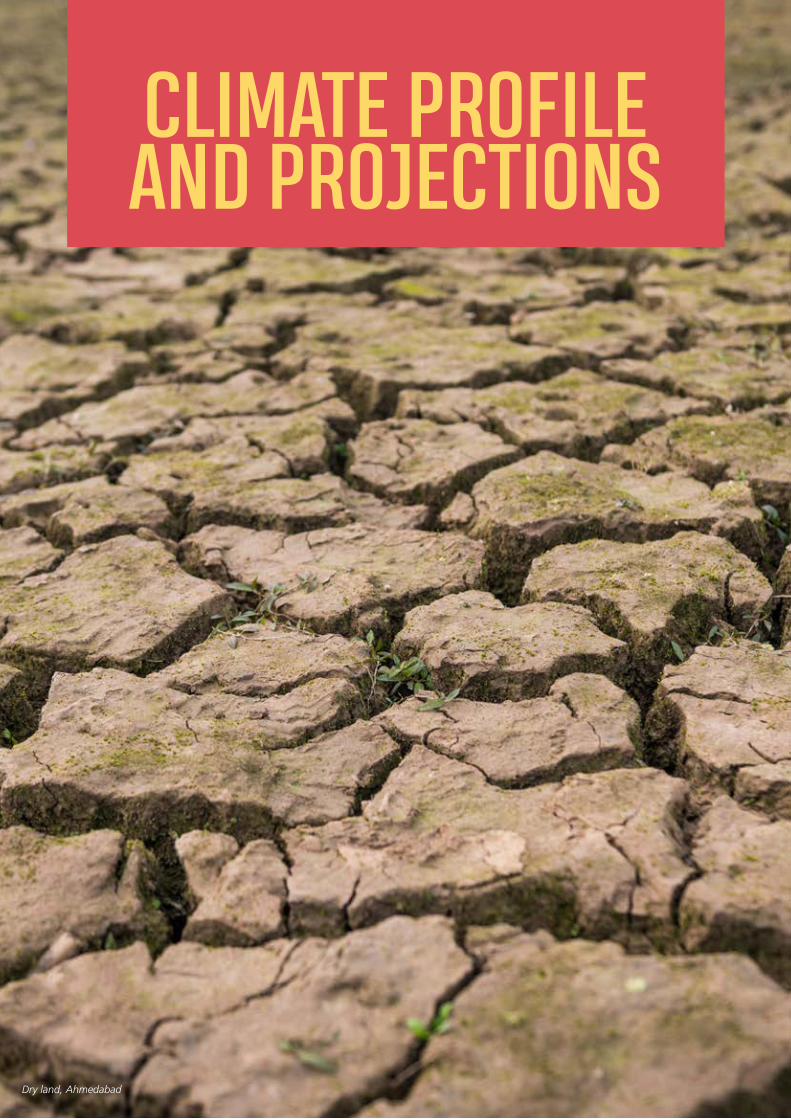
CLIMATE PROFILE AND PROJECTIONS
Dry land, Ahmedabad

12 Climate Change and Environment Action Plan for Ahmedabad District
2. CLIMATE PROFILE AND PROJECTIONS5
2.1 Observed climate variability over Ahmedabad districtClimate variability refers to variations in the mean state (of temperature, monthly rainfall, etc.) and other statistics (such as standard deviations, statistics of extremes, etc.) on the climate on all temporal and spatial scales beyond that of individual weather events. Variability may be due to natural internal processes within the climate system (internal variability), or due to variations in natural (e.g. solar and volcanic) external forces (external variability).
In this section, we focus on the current mean climate variability in Ahmedabad district. Precipitation and temperature are used as the key climate variables in this analysis.
2.1.1. Precipitation variability
The climate of Ahmedabad district is hot and semi-arid with marginally moderate rainfall. The district receives rainfall in summer and monsoon (June-September). However, there is large variation in the distribution of seasonal rainfall. Ahmedabad is one of the driest districts in Gujarat, receiving 95 to 235 mm of precipitation, mostly during summer and monsoon months. The mean monsoon rainfall from June to September is around 625 mm. The number of rainy days (a day with rainfall of 2.5 mm or more) in the district vary from five to 14 during July and August, and it receives more than 30 days of rainfall in the summer monsoon season.
The year-to-year rainfall variability during monsoons as well as the seasonal mean for the period of 1951 to 2018 over Ahmedabad district (area averaged) are depicted in Figure 12. There is no significant trend observed in either rainfall or rainy days during the period, however, July and August – the principal rainy months for the district – showed higher variability in rainy days (Figure 13).
Figure 12: Inter-annual variability of rainfall (mm/day) over Ahmedabad for 1951-2018
0
5
10
15
20June
0
5
10
15
20July
0
5
10
15
20
Rai
nfal
l (m
m/d
ay)
August
0
5
10
15
20
September
1950
1952
1954
1956
1958
1960
1962
1964
1966
1968
1970
1972
1974
1976
1978
1980
1982
1984
1986
1988
1990
1992
1994
1996
1998
2000
2002
2004
2006
2008
2010
2012
2014
2016
2018
Year
0
5
10
15
20JJAS
a)
b)
c)
d)
e)
No significant trend
No significant trend
No significant trend
No significant trend
No significant trend
5 Refer to Annexure 2.1 for background note of climate projections and 2.2 for data source & methodology.
One of the driest districts in Gujarat, Ahmedabad receives only 95-235 mm of rainfall with large variation in distribution

13Climate profile and projections
0
5
10
15
20June
0
5
10
15
20
25July
0
5
10
15
20
25
No.
of r
ainy
day
s
August
0
5
10
15
20
25September
1950
1952
1954
1956
1958
1960
1962
1964
1966
1968
1970
1972
1974
1976
1978
1980
1982
1984
1986
1988
1990
1992
1994
1996
1998
2000
2002
2004
2006
2008
2010
2012
2014
2016
2018
Year
010203040506070
JJAS
a)
b)
c)
d)
e)
No significant trend
No significant trend
No significant trend
No significant trend
No significant trend
Figure 13: Inter-annual variability of rainy days (days) over Ahmedabad for 1951-2018
2.1.2. Temperature variability
The mean temperature in the district ranges between 35°C and 40°C during summer-time (March, April and May) with May being the hottest month. The maximum temperature in these three months shows an increasing trend, which got accelerated in the last decade (Figure 14). The mean percentage of warm days also shows an increasing trend (Figure 15), ranging from 8 to 10 percent during 1986 to 2005.6
323334353637383940
March
36
37
38
39
40
41
42April
36
37
38
39
40
41
42
May
1950
1952
1954
1956
1958
1960
1962
1964
1966
1968
1970
1972
1974
1976
1978
1980
1982
1984
1986
1988
1990
1992
1994
1996
1998
2000
2002
2004
2006
2008
2010
2012
2014
2016
2018
35
36
37
38
39
40
41MAMSignificant Trend
No significant Trend
Significant Trend
No significant Trenda)
b)
c)
d)
Max
imum
tem
pera
ture
(o C)
Figure 14: Inter-annual variability of maximum temperature (oC) over Ahmedabad for 1951-2018
6 Warm days - correspond to cases when the maximum temperature exceeds the 90th percentile of the temperature distribution of the season.
Higher variability in rainy days observed during July & August
Maximum temperature during summer months shows an increasing trend

14 Climate Change and Environment Action Plan for Ahmedabad District
0
10
20
30
40
50
March
01020304050607080
April
010203040506070
War
m d
ays
perc
enta
ge (%
)
May1950
1952
1954
1956
1958
1960
1962
1964
1966
1968
1970
1972
1974
1976
1978
1980
1982
1984
1986
1988
1990
1992
1994
1996
1998
2000
2002
2004
2006
2008
2010
2012
2014
2016
2018
Year
0
10
20
30
40
50
60MAM
a)
b)
c)
d)
Figure 15: Inter-annual variability of warm days over Ahmedabad for 1951-2018
In winter, temperatures (December, January and February) range between 12.1°C and 14.5°C with January being the coldest month. The year-to-year variability of minimum temperature (figure 16) indicates an increase in the mean minimum temperature during the last few decades. The mean percentage of cold days show a decreasing trend in recent decades (figure 17).7 An analysis shows a steady warming trend in both the minimum and maximum temperatures of the district.
Min
imum
tem
pera
ture
(OC)
10
12
14
16
18
20
December
10
12
14
16
18January
10
12
14
16
18
20February
1950
1952
1954
1956
1958
1960
1962
1964
1966
1968
1970
1972
1974
1976
1978
1980
1982
1984
1986
1988
1990
1992
1994
1996
1998
2000
2002
2004
2006
2008
2010
2012
2014
2016
2018
10
12
14
16
18DJF
a)
b)
c)
d)
No significant trend
No significant trend
Significant trend
No significant trend
Max
imum
tem
pera
ture
(o C)
Figure 16: Inter-annual variability of minimum temperature (oC) over Ahmedabad for 1951-2018
7 Cold days - correspond to cases when the minimum temperature falls below the 10th percentile of the temperature distribution of the season.
Similar increasing trend is observed in the mean percentage of warm days
Mean minimum temperature has increased during the last few decades

15Climate profile and projections
0
5
10
15
20
25
December
010203040506070
January
01020304050607080
Col
d da
ys p
erce
ntag
e (%
)
February
1950
1952
1954
1956
1958
1960
1962
1964
1966
1968
1970
1972
1974
1976
1978
1980
1982
1984
1986
1988
1990
1992
1994
1996
1998
2000
2002
2004
2006
2008
2010
2012
2014
2016
2018
Year
0
10
20
30
40
50DJF
a)
b)
c)
d)
Figure 17: Inter-annual variability of cold days over Ahmedabad for 1951-2018
2.2 Future climate projections for Ahmedabad districtPrecipitation and temperature for the 1986 to 2005 period have been simulated using the multi-model mean (MMM) ensemble. The district may experience a projected increase in the quantum of rainfall in the monsoon months and the season as a whole in different epochs (2021-2040, 2041- 2060, 2061-2080 and 2081-2100) under medium (RCP4.5) and high (RCP8.5) emission scenarios. There may be an increase in precipitation by 8 to 19 percent under RCP4.5 and 13 to 42 percent under RCP8.5 emission scenarios respectively (Table 5). The number of rainy days is also projected to increase during the monsoon season, particularly during July and August (Table 6).
Cold days are decreasing in recent decades

16 Climate Change and Environment Action Plan for Ahmedabad District
Table 5: Observed (1986-2005), simulated (1986-2005) and projected mean monthly and seasonal rainfall (mm) for Ahmedabad district
Rainfall (mm)
June July August September JJAS (total of June, July,
Aug & Sept)
Observed 114 234 184 98 629
Simulated 74 224 178 124 602
RCP4.5
2030s(2021-2040)
86 223 187 155 651
2050s(2041-2060)
76 217 195 164 653
2070s(2061-2080)
80 236 216 182 713
2090s(2081-2100)
82 236 224 173 714
RCP8.5
2030s 88 231 216 146 682
2050s 83 242 232 177 734
2070s 85 275 224 183 767
2090s 90 262 276 220 852
Table 6: Observed (1986-2005), simulated (1986-2005) and projected mean monthly and seasonal rainy days (rainfall >2.5 mm) for Ahmedabad district
Rainy days
June July August September JJAS (total of June, July,
Aug & Sept)
Observed 5 12 10 6 33
Simulated 5 13 12 7 36
RCP4.5
2030s(2021-2040)
6 13 12 7 38
2050s(2041-2060)
5 12 12 8 37
2070s(2061-2080)
5 13 12 8 38
2090s(2081-2100)
5 13 12 8 38
RCP8.5
2030s 5 13 12 7 37
2050s 5 13 12 8 38
2070s 5 13 13 8 39
2090s 6 12 13 9 40
The projected changes in maximum and minimum temperatures were analysed on a monthly scale during the summer and winter season. The projections for different time epochs indicate the maximum temperatures may increase by 1.2°C to 2.4°C under RCP4.5 and 1.4°C to 4.5°C under RCP8.5, particularly during the month of May (Table 7). The percentage of warm days is also projected to increase by the end of the century (Table 8). In winter, the minimum temperatures show an increasing trend with the percentage of cold days decreasing in all epochs under changing climate conditions. A clear increase in the temperature towards the end of the century can also be seen (Table 9).

17Climate profile and projections
Table 7: Characteristics of simulated monthly and seasonal maximum temperature (oC) for Ahmedabad district (baseline and RCP 4.5 and RCP 8.5 emission scenarios)
Temp. max (0C)
March April May MAM (average of March, April and
May)
Observed 35.8 38.7 39.6 38
Simulated 35.4 39 40.8 38.4
RCP4.5
2030s 36.8 40.2 41.8 39.6
2050s 37.4 40.8 42.5 40.7
2070s 37.7 41.3 42.9 40.6
2090s 38.1 41.5 43 40.8
RCP8.5
2030s 36.9 40.3 42.1 39.8
2050s 37.9 41.3 42.8 40.9
2070s 39.2 42.3 43.9 41.8
2090s 40.2 43.6 44.9 42.9
Table 8: Characteristics of simulated monthly and seasonal warm days (%) with respect to baseline for Ahmedabad district (baseline and RCP 4.5 and RCP 8.5 emission scenarios)
Warm days (%)
March April May MAM (average of March, April and
May)
Observed 9 10 10 10
Simulated 10 10 9 10
RCP4.5
2030s 34 40 42 39
2050s 48 56 62 56
2070s 55 68 69 65
2090s 64 71 75 70
RCP8.5
2030s 39 45 52 42
2050s 60 69 75 68
2070s 80 87 91 86
2090s 90 95 97 93
Table 9: Characteristics of simulated monthly and seasonal minimum temperature (oC) for Ahmedabad district (baseline and RCP 4.5 and RCP 8.5 emission scenarios)
Temp. min (0C)
Dec Jan Feb DJF (average of Dec, Jan and Feb)
Observed 14.5 12.9 14.9 14.1
Simulated 13.1 11.9 13.9 12.9
RCP4.5
2030s 14.4 13.2 15.1 14.2
2050s 15.2 13.9 15.8 14.9
2070s 15.7 14.5 16.3 15.5
2090s 15.8 14.7 16.5 15.6
RCP8.5
2030s 14.8 13.4 15.4 14.5
2050s 15.7 14.6 16.5 15.5
2070s 17.3 15.9 17.9 17.0
2090s 18.6 17.3 19.0 18.3
Table 10: Characteristics of simulated monthly and seasonal cold days (%) with respect to baseline for Ahmedabad district (baseline and RCP4.5 and RCP8.5 emission scenarios)
Cold days (%)
Dec Jan Feb DJF (average of Dec, Jan and Feb)
Observed 4 22 24 16
Simulated 5 16 36 19
RCP4.5
2030s 1 2 17 7
2050s 0 2 11 14
2070s 0 1 7 3
2090s 0 1 5 2
RCP8.5
2030s 1 5 15 7
2050s 0 2 6 3
2070s 0 0 2 1
2090s 0 0 1 0
18 Climate Change and Environment Action Plan for Ahmedabad District
2.3 Sectoral impacts of climate change
2.3.1 Heat stress in Ahmedabad
Ahmedabad – one of India’s hottest cities – experiences heat stress almost every year, particularly during the pre-monsoon summer months (from March to May), when maximum temperatures average 45oC. The effects of heat stress observed are: (a) health impacts including dehydration, heat exhaustion and stroke, exacerbations of chronic cardiovascular and respiratory diseases; (b) worsening of environmental factors like water stress and deteriorating water quality; (c) outbreaks of vector-borne diseases, such as malaria, chikungunya and dengue; and (d) incidences of diarrheal diseases. Poorer communities and workers in high-risk industries like glass and metal works constitute the vulnerable groups with a higher risk of heat-related illnesses (Knowlton, et al., 2014). During a severe heat wave period in Ahmedabad in 2010, occurrence of all-cause mortality increased by 30 percent. (Tejas, Mavalankar, Azhar, Jaiswal, & Connolly, 2014).
Globally, climate change-linked extreme heat events are widespread. Mean annual temperatures across India have also increased relative to historical averages. The climate variability study conducted under the current district action plan observes a 4.9oC and 2.8oC rise in maximum average summer temperatures (March to May) by the end of the century as per high-emission pathway (RCP8.5) and medium-emission pathway (RCP4.5), respectively. Also, the number of warm days is projected to increase by 83 percent as per RCP8.5 and by 60 percent as per RCP4.5 in the district during the months of March to May. This also suggests that more frequent and intense heat waves are likely to occur, making it a critical issue for climate action plans. The same is already reflected in the record decade-high temperature even during the lockdown in April 2020 and an average of 38.7 percent increase in heat-related emergencies handled by Emergency Management and Research Institute (Project 108) in Gujarat.
A Heat Action Plan (HAP), first of its kind coordinated action in South Asia, was developed for Ahmedabad by a coalition of academic, health and environmental groups in 2013, and is being updated periodically. The HAP intends to prepare local communities for extreme heat periods, prevent health effects of heat stress and provide an early warning system through a framework for the implementation, coordination and evaluation of extreme heat response activities in Ahmedabad.
Key strategies of HAP are as follows:
• To build public awareness and community outreach to communicate the risks of heat waves and implement practices to prevent heat-related deaths and illnesses.
• To initiate an early warning system and inter-agency coordination to alert residents of predicted extreme temperatures. AMC has created formal communication channels to alert government agencies, health officials and hospitals, emergency responders, local community groups and media outlets of extreme temperatures forecasted by the Indian Meteorological Department’s (IMD) Meteorological Centre located in Ahmedabad.
• To build capacity among healthcare professionals (focusing on primary medical officers, paramedical staff and community health staff) in order to recognise and respond to heat-related illnesses, particularly during extreme heat events.
• To reduce heat exposure and promote adaptive measures by launching new efforts, including a draft city-wide cool roofs programme.
The HAP has colour-coded signals for a heat alert based on different temperature thresholds and a communication plan to activate the alert through the nodal officer. It also has key actions listed for all responsible departments in the communication plan. It has the Ahmedabad Cool Roof programme, along with heat illness treatment protocols and a checklist for all agency actions (ULB administration and press officer, medical colleges, labour department, emergency service department) and department-wise activities during heatwave days.
While the HAP effectively addresses all immediate concerns to minimise the impacts and considers a long-term cool roof planning, several other critical aspects remain untouched. These are addressed in Chapter 6.
Ahmedabad is is one of India’s hottest cities
Heat Action Plan (HAP), a first of its kind coordinated action in South Asia, was developed for Ahmedabad

19Climate profile and projections
2.3.2 Agriculture and allied sectors
The trends of change in rainfall and temperature across Ahmedabad indicate greater impacts on kharif season as compared to rabi. It is predicted that climate change would severely affect the yields of wheat crop, followed by maize, paddy and groundnut during kharif season (Pandey, et al., 2015).
A study on the impact of climate change on rice growth and yield found that in Ahmedabad district, the changing climate will not only impact the flowering and maturity of the crop, but also reduce the grain yield by 29.7 percent and the biomass yield by 33 percent (Patel, et al., 2013). Additionally, decrease in biomass production will negatively impact livestock rearing. The projected heat stress will decrease cattle productivity and yield, particularly dairy. It will also impact the reproduction of these animals, while also increasing health issues.
According to a Gujarat Institute of Desert Ecology (GUIDE) study (2019), extended monsoon, unseasonal rain, hailstorms and cyclonic storms will become more intense and frequent along the coasts of Gujarat, compelling farmers to change their cropping patterns and timings. The coastal regions of the districts are projected to lose up to 40 percent of their coconut yield. This can be attributed to the summer temperatures that are projected to increase relatively more in the west coast region. Some studies suggest that agriculture is likely to be affected in the coastal regions as these areas are vulnerable to inundation and salinisation. Moreover, standing crops are more likely to be damaged due to cyclonic activity.
Increasing temperatures and extreme events like cyclones will also adversely impact marine fisheries.
2.3.3 Water resources
In Gujarat, agricultural activities consume 80 percent of the available water resource, of which irrigation is a major part. Various scientific assessments show that climate change will have a significant impact on Gujarat’s freshwater resources. The river basins of Aji, Mahi, Pennar, Sabarmati and Tapi are likely to experience water scarcities (GoG, 2014).
In Gujarat, droughts have occurred with unfailing regularity. Longer periods of drought affect the ground water and river flows. The frequency of extreme drought is higher for north Gujarat agroclimatic zone, which includes the Ahmedabad district. Projections indicate that in the future, though droughts might occur less frequently, they will have a longer duration (Shete & Patel, 2013).
Given the changing climate in the coastal regions of the district, a rise in sea level is inevitable. This will have a far-reaching impact across sectors such as agriculture, habitat and industries.

20 Climate Change and Environment Action Plan for Ahmedabad District

21Sectoral greenhouse gas emissions profile
SECTORAL GREENHOUSE GAS
EMISSIONS PROFILE
Cooling towers of a thermal power plant, Ahmedabad

22 Climate Change and Environment Action Plan for Ahmedabad District
3. SECTORAL GREENHOUSE GAS EMISSIONS PROFILE: CLIMATE CHANGE DRIVERS
This section estimates greenhouse gas (GHG) emissions for Ahmedabad district using the guidelines laid down by the Intergovernmental Panel on Climate Change (IPCC).8 Estimates have been provided for 13 categories covering three major sectors – energy; agriculture, forestry and other land use (AFOLU) and waste – for the period 2005 to 2019.9 Though Ahmedabad has some industrial units that fall under the industrial processes and product use (IPPU) sector, emissions from the IPPU sector could not be taken into account due to unavailability of activity data (industry-wise production details). However, energy used in industries and the corresponding emissions are reported in the energy sector.
The activity data was sourced from government-approved datasets for all the sectors and wherever possible, country-specific emission factors were used in place of default-emission factors.10
3.1 Direct emission estimates3.1.1 Economy-wide emissions
Emis
sion
in M
t of
CO
2e. 7.08
8.20
0
2
4
6
8
10
2005 2010 2015 2019
Energy AFOLU Waste Total
5.16
9.18
Figure 18: Economywide emissions of Ahmedabad district (million tonnes of CO2e.)
Table 11: Sectoral contribution and growth in emissions
SectorGrowth in
emissions CAGR (2005-19)
% share in total emissions
(2019)
Energy 3.92% 77.22%
AFOLU 4.02% 12.53%
Waste 7.06% 10.24%
Total emissions 4.20% -
8 To the extent possible, the 2006 IPCC guidelines were followed; and for a very few categories, the 1996 IPCC guidelines were referred to. Background note on GHG inventorisation and its significance is given in Annexure 3.1
9 Estimates for 2017, 2018 and 2019 have been obtained by applying CAGR on the latest possible GHG calculations for each category (based on availability of activity data)
10 Emission category-wise activity data sources provided in Annexure 3.2
Figure 19: Percentage share of sectors in total emissions (2019)
Energy77%
AFOLU13%
Waste10%
Economy-wide emissions have increased by
78% since 2005

23Sectoral greenhouse gas emissions profile
• Between 2005 and 2019, the total emissions of Ahmedabad district increased by 78 percent (from 5.16 million tonnes CO2e in 2005 to 9.18 million tonnes CO2e in 2019).
• Energy sector (direct fuel combustion in transport, PEG, CPP, agriculture, residential etc) is the highest contributor with 77 percent of total emission in Ahmedabad. This is followed by AFOLU (13 percent) and waste (10 percent). Ahmedabad contributed to 4.11 percent and 3.48 percent in the total emissions of Gujarat state in 2005 and 2015 respectively. Gujarat emission estimates have been sourced from the GHGPI study (GHG Platform India, 2019). It may be noted that IPPU emissions are not included in Ahmedabad estimates.
• Sectoral details and analyses are given in the following sections
• In the business-as-usual (BAU) scenario (i.e. no actions/policies are put in place to mitigate the emissions), the total emissions of Ahmedabad are likely to grow by 96 percent until 2030, with respect to 2015 levels.
• During the same period (2015 to 2030), emissions of Gujarat are likely to increase by 157 percent (given a CAGR of 6.5 percent).
• Overall emissions of the district can be significantly reduced if emissions from public electricity generation are curtailed.
Economy-wide emissions to rise by
96% in BAU scenario
0
2
4
6
8
10
12
14
16
18
2015 2020 2025 2030
Emis
sion
s in
Mt
of C
O2e
.
Energy AFOLU Waste Total
8.20
9.63
12.34
16.10
Figure 20: Projections of economy-wide emissions (BAU) for Ahmedabad district (Mt of CO2e.)
3.1.2 Per capita emissions
0.81
1.001.04
0.02005 2007 2009 2011 2013 2015 2017 2019
0.5
1.0
1.5
2.0
2.5
3.0
3.5
4.0
4.5
5.0
Ahmedabad Gujarat India
Emis
sion
s in
tC
O2e
/per
son
1.07
2.31
1.34
2.04
4.37
Figure 21: Per capita emissions (tCO2e./person)-comparison

24 Climate Change and Environment Action Plan for Ahmedabad District
• The per capita emissions of Ahmedabad district were computed using the district’s total emissions that were estimated in this analysis (therefore, it does not include emissions from IPPU).
• As per this analysis, the per capita emissions of Ahmedabad district in 2019 were around 1.07 tonne of CO2e/person.
• National average is double that of Ahmedabad’s per capita emissions; Gujarat’s is 4 times higher (however, it may be noted that IPPU emissions and emissions from CNG and PNG could not be included in Ahmedabad estimates).
1.04
3.64
1.811.09
4.57
2.10
1.20
5.74
2.45
1.33
7.20
2.85
0.0
1.0
2.0
3.0
4.0
5.0
6.0
7.0
8.0
2015 2020 2025 2030
Emis
sion
s in
tC
O2e
/per
son
Ahmedabad Gujarat India
Figure 22: Projected per capita emissions (BAU)
0.0 2.0 4.0 6.0 8.0 10.0 12.0 14.0 16.0 18.0
2020
2025
2030
Emission in Mt of CO2e.
BAU emissions w.r.t. Ahmedabad's 2025 per capita emissions
w.r.t Ahmedabad's 2020 per capita emissions
Total emissions will be 26% less from BAU (if 2020 per capita emission level is maintained) & 19% less (if 2025 per capita emission level is maintained)
16.1013.09
11.7510.66
9.57
11.87
10.55
12.34
9.63
Figure 23: Projected total emissions (Mt of CO2e) with different per capita emissions scenarios
• In the BAU scenario of per capita emissions, total emissions will increase 67 percent (between 2020 and 2030, as shown in economy-wide section as well).
• If the per capita emissions of 2020 are maintained, the overall growth in emissions would only be around 24 percent.

25Sectoral greenhouse gas emissions profile
3.1.3 Sectoral analyses and projections
Energy sector
4.14
5.746.27
7.09
0
1
2
3
4
5
6
7
8
2005 2006 2007 2008 2009 2010 2011 2012 2013 2014 2015 2016 2017 2018 2019
Total
Emm
issi
on in
MtC
O2e
.
Transport Residential Industries Agriculture Public electricitygeneration
CPP
Figure 24: Energy sector emissions of Ahmedabad district (million tonnes of CO2e.)
• This sector estimates the emissions from direct fuel consumption by various categories.
• Between 2005 and 2019, the emissions from energy sector have increased by 71.32 percent (from 4.14 Mt of CO2e in 2005 to 7.09 Mt of CO2e in 2019)
• Public electricity generation and transport categories are the highest contributors to total energy emissions. These are followed by residential, captive power plants (CPP), agriculture and industries.
• However, emissions of residential category have decreased over the time (w.r.t. the PPAC data that has been analysed). Ahmedabad city has seen an immense rise in PNG connections (replacing LPG). Due to unavailability of PNG data, emissions from consumption of PNG could not be computed. As a result, residential emissions are seen reducing over the years.
Transport41%
Residential8%
Industries1%
Captive power plant
5%
Public electricity generation
41%
Agriculture4%
Figure 25: Percentage share in total energy emissions (2019)
Energy sector emissions have increased by
71% since 2005

26 Climate Change and Environment Action Plan for Ahmedabad District
Table 12: Growth in energy sector emissions
Category Sub-category 11 CAGR (2005-18) % Share to energy emissions (2019)
Public Electricity Generation (PEG) 2.1% 41.46%
Transport(CAGR: 7.63%Share: 43.01%)
Road (77.86% transport emission) 6% 32.28%
40.81%Aviation (19.83%) 14.99% 1.00%
Railway (2.33%) 7.76% 8.21%
Residential 9.24% 8.37%
Captive Power Plant (CPP) 9.41% 4.47%
Agriculture 3.81% 3.76%
Industries 1.17% 1.13%
0
2
4
6
8
10
12
14
2015 2020 2025 2030
Emis
sion
in M
t of
CO
2e.
Transport Residential Industries Agriculture
Public electricity generation
Captive power plant
Total
7.42
9.46
6.27
12.33
Figure 26: Projected emissions of energy sector (BAU) of Ahmedabad district in Mt of CO2e.
• In BAU scenario, the total energy emissions of Ahmedabad district are likely to grow at a CAGR of 3.87 percent and the overall emissions will approximately double by 2030 (with respect to 2015) i.e. there will be an increase of 96.65 percent.
• If emissions from transport category are not curtailed, they are likely to overtake emissions from public electricity generation category by the end of 2020.
• As can be seen in Table 12, emissions from road transport contribute 77.86 percent to the total transport emissions. Reducing emissions from road transport (i.e. reducing direct fuel consumption) will significantly mitigate transport emissions. Modal shift in public transport and a transition to e-vehicles (powered by RE) can help attain this. Detailed recommendations are given in Chapter 6.
11 Data gap: CNG & PNG data was not available for Ahmedabad district
Energy sector emissions to rise by
97% in BAU scenario
CO 2

27Sectoral greenhouse gas emissions profile
Agriculture, forestry and other land use (AFOLU) sector
0.66
0.790.74
1.13 1.181.02 1.15
2005 2006 2007 2008 2009 2010 2011 2012 2013 2014 2015 2016 2017 2018 2019-0.20
0.00
0.20
0.40
0.60
0.80
1.00
1.20
1.40
Enteric fermentation Urea fertilization Crop residue burning
Forest removals Rice cultivation Total
Emis
sion
in M
t of
CO
2 e.
Figure 27: AFOLU sector emissions of Ahmedabad district (Mt of CO2e.)
42%
8%
2015
1%
34%
15%
49%
9%1%
41%
Entericfermentation
Ureafertilization
Crop residueburning
Ricecultivation
Forest removals
2019
Figure 28: Percentage share of categories in total AFOLU emissions
Table 13: Growth in AFOLU emissions (2005-17) & % share
Category CAGR (2005-17) % share in AFOLU emissions (2015) % share in AFOLU emissions (2019)
Enteric fermentation 4.48% 42% 49%
Forest removals 0.93% 15% Became a sink
Urea fertilization 4.89% 8% 9%
Rice cultivation12 3.08% 34% 41%
Crop residue burning 3.87% 1% 1%
Total emissions 4.02% - -
12 For Rice cultivation and crop residue burning CAGR is calculated between 2005 to 2016

28 Climate Change and Environment Action Plan for Ahmedabad District
• AFOLU sector emissions increased by 73.93 percent (between 2005 and 2019).
• Forest removal category was a net sink in Ahmedabad between 2005 and 2011. It became a source of emissions from 2012 to 2015. However, with an increase in total forest cover, this category again turned into a net sink for CO2 from 2016 onwards.
• Rice irrigation through continuous flooding (water regime) has also led to high emissions; contributing 34 percent and 41 percent in 2015 and 2019 respectively.
• Enteric fermentation in livestock is also a key source of AFOLU emissions – its share in total economywide emissions have been around 6 percent throughout the years (considered under this analysis).
Emis
sion
in M
t of
CO
2e.
1.20
1.46
-0.200.000.200.400.600.801.001.201.401.601.802.00
2015 2020 2025 2030
Enteric fermentation Urea fertilization Crop residue burningForest removals Rice cultivation Total
1.18
1.78
Figure 29: Projections of AFOLU sector emissions (BAU)
• In BAU scenario, AFOLU sector emissions are likely to increase by 51 percent by 2030 (as compared to 2015 levels).
• The emissions will be even higher if the current forest cover of the district is not maintained.
• Detailed recommendations to reduce emissions from rice cultivation and enteric fermentation are given in Chapter-6.
Table 14: Projections for livestock sector
Bovine population density (based on 2012 Livestock Census)
Regions Cattle count/sq.km
India 91.23
Gujarat 138.39
Ahmedabad 79.24
• As per 2012 Livestock Census, density of bovine animals in Ahmedabad was 42 percent less than the state average.
• Ahmedabad is likely to reach the state average of bovine density by 2030.
• Based on this scenario, enteric fermentation calculations are done and compared with BAU projections.
• Under the new scenario, emissions will be 7.1 percent higher than the BAU projections for enteric fermentation, since the bovine density in 2030 under the BAU situation will be around 129.23 cattle count/sq. km (still lower than the current state average).
AFOLU sector emissions to rise by
51% in BAU scenarios

29Sectoral greenhouse gas emissions profile
Table 15: Projected emissions for livestock sector (2005 to 2030)
Year 2005 2010 2015 2020 2025 2030
Projected population (BAU)13 4,70,198 6,09,647 6,96,828 7,98,225 9,14,377 10,47,430
BAU projected emissions (Mt of CO2e.) 0.32 0.42 0.50 0.62 0.77 0.95
Projected population (keeping Ahmedabad’s 2030 livestock population density equivalent to the current bovine population density of Gujarat)
4,70,198 6,09,647 6,94,434 8,14,779 9,55,980 11,21,651
Projected emissions (livestock population & emissions increase w.r.t Gujarat’s livestock population density) (Mt of CO2e.)
0.32 0.42 0.49 0.63 0.80 1.02
Emis
sion
in M
t of
CO
2 e.
0.0
0.2
0.4
0.6
0.8
1.0
1.2
2005 2010 2015 2020 2025 2030
BAU projected emissions
Projected emissions (emissions increase wrt Gujarat’s livestock population density)
7.1% higher
Figure 30: Projected enteric fermentation emissions- comparison
Waste sector
0.49
0.65
0.76
0.00
0.10
0.20
0.30
0.40
0.50
0.60
0.70
0.80
0.90
1.00
2005 2006 2007 2008 2009 2010 2011 2012 2013 2014 2015 2016 2017 2018 2019
Solid waste Domestic wastewater Total waste emissions
Emis
sion
in M
illio
n To
nne
of C
O2
e.
0.36
0.94
Figure 31: Waste sector emissions of Ahmedabad district. (in Mt of CO2e.)
13 Based on 2012 Livestock Census

30 Climate Change and Environment Action Plan for Ahmedabad District
• Waste sector is the smallest contributor to economy-wide emissions (10 percent in 2019).
• This sector has witnessed the highest growth rate in emissions between 2005 and 2019 (CAGR of 7.06 percent).
• Total waste emissions have increased by 159.85 percent (2005-19) due to the jump in emissions from domestic wastewater from 2011 onwards.
• If emissions from the domestic wastewater are not mitigated, they are likely to increase by 89 percent by 2030 (w.r.t. 2015 levels).
1.01
1.42
0.00
0.50
1.00
1.50
2.00
2.50
2015 2020 2025 2030
Solid waste Domestic wastewater
Total waste emissions
Emis
sion
in M
t of
CO
2 e.
0.76
1.99
Figure 32: Projections for waste sector emissions (BAU)
Growth in emissions (2005-19) and % share
Category CAGR % Share in waste emissions (2019)
Solid waste
3.24% 24%
Domestic wastewater
5.32% 76%
Figure 33: Percentage share of categories in total waste emissions (2019)
Solid waste45%
Domestic wastewater
55%
Waste sector emissions to rise by
162% in BAU scenario

31Sectoral greenhouse gas emissions profile
3.2 Carbon footprint of electricity consumption
• The district receives electricity from Torrent Power Ltd (private player) and Uttar Gujarat Vij Company Ltd. (UGVCL) – a government of Gujarat DISCOM.
• Projections for electricity consumption have been made on the basis of total electricity supplied by Torrent (CAGR of 5.59 percent) and UGVCL (CAGR of 15.61 percent) between 2005 and 2019.
• Contribution of coal and gas in electricity generation was determined by using the average of 10 years (from 2008-09 to 2019-20) for Torrent Power Ltd, and from FY 2019-20 for UGVCL.
• This way, carbon footprint (basically CO2 emissions) from electricity consumption in Ahmedabad district has been ascertained.
• Emissions (from electricity consumption) are not added to the district emission profile (showcased in sections above) to avoid double counting. The IPCC methodology adopted to build the emission profile of the district clearly mentions that only emissions occurring at the source of production/generation need to be included (and not those occurring at the consumption site).
7,571.28
12,584.27
0
5000
10000
15000
20000
2005 2006 2007 2008 2009 2010 2011 2012 2013 2014 2015 2016 2017 2018 2019
Elec
tric
ity c
onsu
mpt
ion
(MU
s)
RGP (domestic) GLP (commercial) Industrial (LTMD+HT)
Agriculture Public water works Public lightingRailway traction Others Total
18,278.64
5,136.67
Figure 34: Electricity consumption in Ahmedabad district across categories
RGP (domestic)18%
GLP (commercial)6%
Industrial (LTMD+HT)49%
Public water works
22%
Public water works
2%
Agriculture3%
Figure 35: Sector wise share in electricity consumption of Ahmedabad district (2019)

32 Climate Change and Environment Action Plan for Ahmedabad District
Table 16: Estimation of emissions from electricity consumption in Ahmedabad district
Torrent Power Ltd. (TPL)
Units 2005 2010 2015 2020 2025 2030
Total electricity supplied MUs 3,807.38 5,337.79 6,611.54 8,604.99 11,292.54 14,819.49
Coal based electricity (60.15%) MUs 2,290.14 3,210.68 3,976.84 5,175.90 6,792.47 8,913.92
Gas based electricity (36.64%) MUs 1,395.03 1,955.77 2,422.47 3,152.87 4,137.59 5,429.86
Emissions from coal14 based electricity Mt CO2e. 1.97 2.76 3.42 4.45 5.84 7.67
Emissions from gas based electricity Mt CO2e. 0.59 0.82 1.02 1.32 1.74 2.28
Total emissions from TPL elec. supply Mt CO2e. 2.56 3.58 4.44 5.78 7.58 9.95
UGVCL
Units 2005 2010 2015 2020 2025 2030
Total electricity supplied MUs 1,329.28 2,233.49 5,972.73 11,710.08 24,184.70 49,948.39
Coal based electricity MUs 1,141.85 1,918.57 5,130.57 10,058.96 20,774.65 42,905.66
Gas based electricity MUs 132.93 223.35 597.27 1171.01 2,418.47 4,994.84
Emissions from coal based electricity Mt CO2e. 0.98 1.65 4.41 8.65 17.87 36.90
Emissions from gas based electricity Mt CO2e. 0.06 0.09 0.25 0.49 1.02 2.10
Total emissions from UGVCL elec. supply Mt CO2e. 1.04 1.74 4.66 9.14 18.88 39.00
Total emissions from electricity consumption (Mt of CO2e)
Units 2005 2010 2015 2020 2025 2030
Total emissions from electricity consumption
Mt CO2e. 3.59 5.33 9.10 14.92 26.46 48.94
Figure 36: Carbon footprint of electricity consumption in Ahmedabad district
Table 17: Per capita electricity consumption in India and its cities15
City/Region kWh/person
Ahmedabad 1,564
Gujarat 2,378
India 1,181
MP 1,084
Bhopal 588
Indore 724
New Delhi 1,548
Mumbai 1,121
Chennai 1,366
Bengaluru 1,074
0.0
10.0
20.0
30.0
40.0
50.0
60.0Between 2020 and 2030, emissions due to electricity consumption will increase by 2.2 times (i. e. 228%)
203020252020201520102005
3.59
5.33
9.1014.92
24.46
48.94
Emis
sion
in M
t of
CO
2
14 Grid emissions factor for electricity generated through Coal = 0.86 kg CO2/kWh; and through Gas = 0.42 kg CO2/kWh
15 For CAGR calculations, vehicle numbers uptill 2016 are considered because post separation of Bavla RTO from Ahmedabad RTO, the vehicle registrations declined at Ahmedabad RTO
Ahmedabad has a higher per capita electricity consumption than Delhi & Mumbai

33Sectoral greenhouse gas emissions profile
3.3 Vehicular growth trends Ahmedabad has three RTOs – RTO Ahmedabad, ARTO Vastral and ARTO Bavla. The data trend below is that of RTO Ahmedabad (Table 18, 19 and Figure 37). Operations at RTO Vastral commenced in 2012, while RTO Bavla commenced in 2017, diverting the vehicular registrations from RTO Ahmedabad (hence the decline in numbers post 2011 and 2016). Information on the number of vehicles registered at RTO Vastral and RTO Bavla is represented in Table 20 and Table 21.
Table 18: Trend of vehicular registrations over the years in Ahmedabad (2005 to 2019)
Number of vehicles registered in RTO Ahmedabad
Goods Vehicles
Passenger vehicles (4 wheelers and above)
Private Motor Cars
Taxi cabs
Jeeps Auto-rickshaws
Two wheelers
Tractors Trailors Other Electric Vehicles
2005 5,042 655 14,975 265 529 15,297 1,08,225 1,375 724 460 0
2006 5,560 695 18,212 311 641 14,566 1,14,270 1,531 787 528 0
2007 5,630 620 21,105 297 1,149 8,857 1,08,920 1,605 987 762 0
2008 5,026 762 24,232 461 1,340 7,152 90,995 1,828 950 850 0
2009 6,110 720 25,943 531 4,096 9,462 1,10,768 1,817 1,064 935 0
2010 8,225 881 39,839 582 1,373 11,973 1,42,020 2,354 1,099 915 0
2011 9,581 1,209 45,482 837 226 11,646 1,50,446 3,588 1,385 747 0
2012 8,699 1,093 41,634 996 268 9,441 1,34,360 1,938 1,168 631 0
2013 7,515 938 38,270 862 91 5,928 1,31,368 1,876 848 303 0
2014 7,333 819 46,631 1,449 59 6,919 1,49,916 2,811 506 235 0
2015 7,922 997 52,182 1,307 41 8,159 1,61,527 2,353 628 257 0
2016 8,318 1,288 55,640 2,595 28 8,133 1,71,937 2,265 544 274 0
2017 6,050 938 49,131 2,687 7 6,896 1,55,939 875 184 239 0
2018 5,167 852 38,557 2,219 0 7,083 1,10,818 244 25 201 23
2019 5,825 494 35,791 1,999 0 8,549 1,08,847 236 23 209 196
CAGR (2010 to 2016)
0.19 6.54 5.73 28.30 -47.73 -6.25 3.24 -0.64 -11.06 -18.23
0
10
20
30
40
50
60
70
80
90
2005 2006 2007 2008 2009 2010 2011 2012 2013 2014 2015 2016 2017 2018 2019
Electricvehicles
OtherTrailorsTractors
Num
ber
of v
ehi
cles
('00
0)
JeepsTaxi cabsPrivate motor carsPassenger vehicles (4 wheelers and above)
Goods vehicles
Auto-rickshaws
Figure 37: Trend for vehicular registrations in Ahmedabad over the years (Ahmedabad RTO)

34 Climate Change and Environment Action Plan for Ahmedabad District
Table 19: Projections for vehicle numbers (vehicle category wise) for Ahmedabad RTO only
Projections based on CAGR from 2010 to 2016 2005 2010 2015 2020 2025 2030
Goods vehicles 5,042 8,225 7,922 5,835 5,891 5,946
Passenger vehicles (4 wheelers and above) 655 881 997 526 722 991
Private motor cars 14,975 39,839 52,182 37,841 49,987 66,032
Taxi cabs 265 582 1,307 2,565 8,916 30,994
Jeeps 529 1,373 41 0 0 0
Auto-rickshaws 15,297 11,973 8,159 8,016 5,808 4,208
Two wheelers 1,08,225 1,42,020 1,61,527 1,12,371 1,31,776 1,54,531
Tractors 1,375 2,354 2,353 234 227 220
Trailers 724 1,099 628 20 11 6
Other 460 915 257 170 62 23
Electric vehicles 0 0 0 302 2,623 22,778
Year-on-year data on vehicular registrations was not available for ARTOs Vastral and Bavla. However, cumulative vehicular registration data is available since inception of the ARTOs, and have been represented below:
Table 21: Total vehicular registrations at ARTO Bawla (since 01/05/2017)
Number of vehicles registeredCumulative data
(from 01/05/2017 to 06/04/2021)
Goods vehicles 5,855
Passenger vehicles(4 wheelers and above) 331
Private motor cars 24,236
Taxi cabs 709
Jeeps 0
Auto-rickshaws 5,148
Two wheelers 74,307
Tractors 542
Trailors 20
Other 171
Electric vehicles 0
Vehicles for agricultural use 7,330
Construction equipment vehicle 502
Industrial equipment vehicle 65
E-rickshaws 4
Table 20: Total vehicular registrations at ARTO Vastral (since 2012)
Number of vehicles registeredCumulative data
(from 2012 to 23/03/2021)
Goods vehicles 36,654
Passenger vehicles (4 wheelers and above) 565
Private motor cars 1,10,785
Taxi cabs 4,467
Jeeps 0
Auto-rickshaws 32,944
Two wheelers 6,18,041
Tractors 993
Trailors 365
Other 824
Electric vehicles 0
Vehicles for agricultural use 2,844
Construction equipment vehicle 732
Industrial equipment vehicle 525
e-Rickshaws 13
Private motor cars & taxi cabs have seen significant growth (Ahmedabad RTO) with a CAGR of
5.73% &
28.3% respectively

35Assessment of policies through the lens of climate change
ASSESSMENT OF POLICIES THROUGH
THE LENS OF CLIMATE CHANGE
Traffic on the roads of Ahmedabad

36 Climate Change and Environment Action Plan for Ahmedabad District
4. ASSESSMENT OF POLICIES THROUGH THE LENS OF CLIMATE CHANGEThis section uses a climate change mitigation perspective to evaluate the impact of national and state level policies and programmes being implemented in the district. A total of 40 policies have been evaluated for the sectors of energy, AFOLU and waste.
The methodology has been derived from the 2006 IPCC Guidelines, peer-reviewed papers on policy impact evaluation, briefing papers and Phase III work of GHGPI. Relevant methodological assumptions were made after consulting the sectoral experts.
4.1 Sector-wise policy impact analysis
4.1.1 Power and energy sector16
This section includes policies on clean energy, power, energy efficiency, residential and industrial energy, and transport. A total of 12 policies/ programmes have been evaluated for analysing the climate impact by computing the GHG emissions added or avoided by these policies.
List of policies evaluated
Clean Energy
Energy Efficiency in buildings, public infrastructure and industrial processes
Transport
1) Gujarat Solar Policy, 2021; 2) Surya Urja Rooftop Yojana; 3) Solar Power Policy, 2015; 4) Policy for development of small-scale distributed solar projects, 2019; 5) Waste to Energy, 2016.
1) UJALA Scheme, 2015; 2) Streetlight National Programme (SLNP), 2015; 3) Integrated Power Development Scheme (IPDS); 4) Restructured Accelerated Power Development and Reforms Programme (R-APDRP); 5) UDAY Scheme, 2015; 6) PAT (Perform, Achieve and Trade) Scheme.
1) BRTS Ahmedabad.
Amongst the policies evaluated,
� Clean energy-related policies and programmes resulted in avoiding 96,000 tonnes of CO2e emissions (policies on solar energy – 71,000 tCO2e and Waste to Energy – 25,000 tCO2e).
� Policies and programmes related to enhancing energy efficiency in buildings and processes have led to avoiding 83,31,667 tonnes of CO2e emissions (UJALA Scheme – 2,47,668 tCO2e; SLNP – 8,569 tCO2e; IPDS, R-APDRP, UDAY – 70,87,085 tCO2e; PAT Scheme – 9,88,345 tCO2e).
� Interventions in transport resulted in avoidance of 3,64,361 tonnes of CO2e emissions.
Emissions evaluation
16 The detailed impact analysis of policies and programmes (giving information on input indicators, calculation methodology etc.) for energy is given in Annexure 4.1.
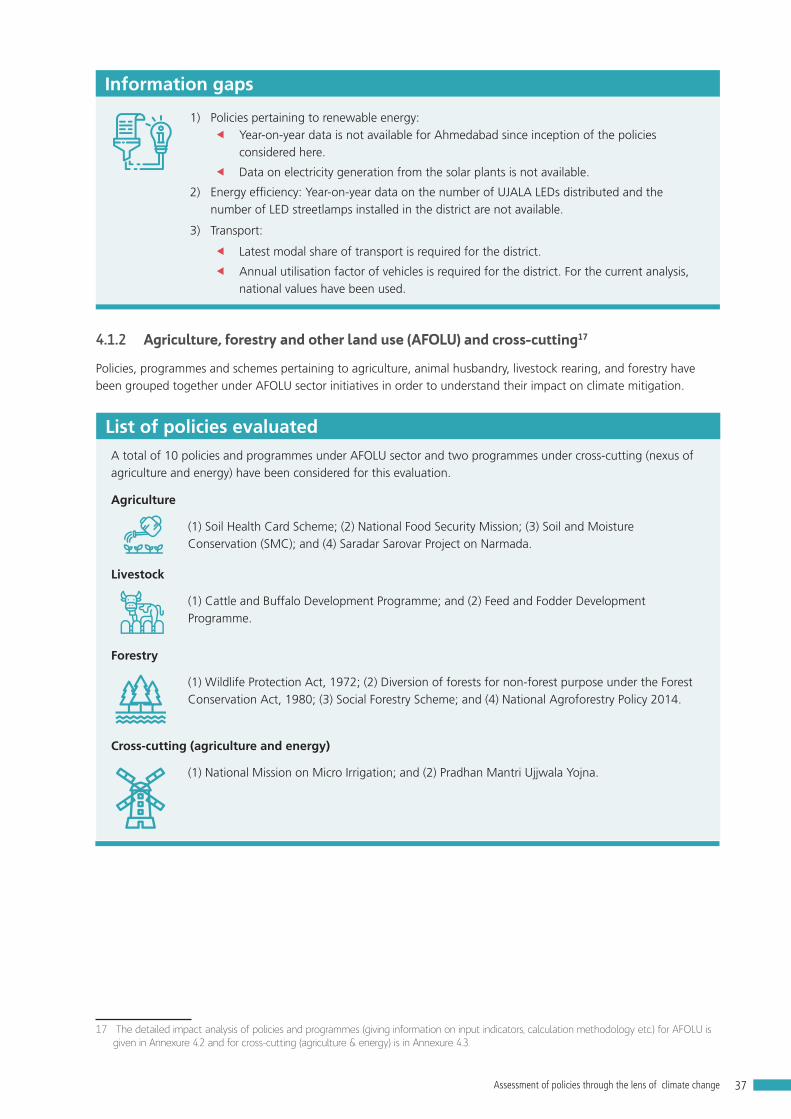
37Assessment of policies through the lens of climate change
Information gaps
1) Policies pertaining to renewable energy:� Year-on-year data is not available for Ahmedabad since inception of the policies
considered here.
� Data on electricity generation from the solar plants is not available.
2) Energy efficiency: Year-on-year data on the number of UJALA LEDs distributed and the number of LED streetlamps installed in the district are not available.
3) Transport:
� Latest modal share of transport is required for the district.
� Annual utilisation factor of vehicles is required for the district. For the current analysis, national values have been used.
4.1.2 Agriculture, forestry and other land use (AFOLU) and cross-cutting17
Policies, programmes and schemes pertaining to agriculture, animal husbandry, livestock rearing, and forestry have been grouped together under AFOLU sector initiatives in order to understand their impact on climate mitigation.
List of policies evaluated
Agriculture
Livestock
Forestry
Cross-cutting (agriculture and energy)
(1) Soil Health Card Scheme; (2) National Food Security Mission; (3) Soil and Moisture Conservation (SMC); and (4) Saradar Sarovar Project on Narmada.
A total of 10 policies and programmes under AFOLU sector and two programmes under cross-cutting (nexus of agriculture and energy) have been considered for this evaluation.
(1) Cattle and Buffalo Development Programme; and (2) Feed and Fodder Development Programme.
(1) Wildlife Protection Act, 1972; (2) Diversion of forests for non-forest purpose under the Forest Conservation Act, 1980; (3) Social Forestry Scheme; and (4) National Agroforestry Policy 2014.
(1) National Mission on Micro Irrigation; and (2) Pradhan Mantri Ujjwala Yojna.
17 The detailed impact analysis of policies and programmes (giving information on input indicators, calculation methodology etc.) for AFOLU is given in Annexure 4.2 and for cross-cutting (agriculture & energy) is in Annexure 4.3.

38 Climate Change and Environment Action Plan for Ahmedabad District
An attempt has been made to quantify GHG emissions avoided/added by each initiative. However, for a few policies and programmes, it could not be computed due to lack of information. This exercise helped identify the following:
� Forestry policies helped in avoiding 16,12,544.27 tonnes of CO2e emissions.� Policies pertaining to livestock proved to be beneficial for climate action by avoiding
598.97 tonnes of CO2e.� In the agricultural sub-sector, impact of only one policy could be computed – the National
Food Security Mission added 11,515 tonne of CO2e.� Under the cross-cutting sector, the National Mission on Micro Irrigation resulted in avoiding
1,140 tonnes of CO2e emissions (from reduction in use of fertiliser). Additionally, the Pradhan Mantri Ujjwala Yojana has helped mitigate 6,78,546 tonnes of CO2e.
Emissions evaluation
In order to accurately quantify the impact of these policies on GHG emissions, the following data/information is needed:
1. Specific number of livestock in Ahmedabad that can be attributed to ‘Cattle & Buffalo Development Programme’.
2. Information pertaining to the ‘Feed & Fodder Development Programme’ like the quantity of feed additives added to fodder, size of target population etc.
3. Percentage of wheat and pulses production in Ahmedabad that can be attributed to National Food Security Mission.
4. Area covered under Soil Health Card Scheme.5. Reduction in chemical fertiliser use due to recommendations (followed by farmers), given in the
soil health cards. 6. Percentage of rice production that can be attributed to improved irrigation with availability of
Narmada canal water.
Information gaps
4.1.3 Waste management 18
Waste sector policies implemented in the district of Ahmedabad were categorised into sanitation, waste management (solid waste, biomedical waste, and hazardous waste) and wastewater management (domestic and industrial).
List of policies evaluated
Sanitation
Waste management
Domestic and industrial wastewater
A total of 15 national and state-level policies and programmes were analysed to evaluate their role in mitigating emissions.
1) Solid Waste Management Rules, 2016 & Amendment 2018; 2) Bio-medical Waste Management Rules, 2016 & Amendment 2018; 3) Hazardous & Other Wastes (Management and Transboundary Movement) Rules, 2016.
1) National River Conservation Plan; 2) Jawaharlal Nehru National Urban Renewal Mission on Urban Infrastructure and Governance; 3) Atal Mission for Rejuvenation and Urban Transformation (AMRUT); 4) Common Effluent Treatment Plant (CETP) for medium- and small-scale industries; 5) Online Continuous Emission Monitoring System (OCEMS).
1) Total Sanitation Campaign; 2) Nirmal Bharat Abhiyan or Clean India Campaign; 3) Swachh Bharat Mission Urban; 4) Integrated Low-Cost Sanitation Scheme (ILCS); 5) Swachh Bharat Mission Rural; 6) Pradhan Mantri Awas Yojana; 7) Integrated Urban Sanitation Programme (IUSP).
18 The detailed impact analysis of policies and programmes (giving information on input indicators, calculation methodology etc.) for Waste is given in Annexure 4.4

39Assessment of policies through the lens of climate change
Along with the methane emission concerns from the sanitary measures and sewerage treatment plants, the current evaluation also considers the waste incineration emission potential for bio-medical waste and hazardous waste. The policy activities have led to the following annual average emissions and mitigation of emissions:
� Emission of 86,325 tCO2e from individual household latrines (IHHL: two pit latrine) and 1,42,890 tCO2e from community latrines (septic tank) constructed under sanitation programmes/policies;
� Mitigation of 3,977 tCO2e emissions from biological treatment (composting) of MSW;� Emission of 4,99,332 tCO2e for STPs constructed under sewerage connection programmes.
The implementation of these activities has avoided an annual average emission (w.r.t. baseline19) of 50,254 tCO2, 5,188 tCO2 and 39,630 tCO2 by sanitation, solid waste and liquid waste management developmental/policy initiatives respectively in the district.
Emissions evaluation
1) Waste: District-level BMW generation and incineration data and hazardous waste incineration data is not available
2) Domestic wastewater (sanitation): For old and completed policies, there is a gap in availability of data on the number of sanitation infrastructure constructed. In most cases, district-level data was not available;
3) Domestic wastewater: Policy-wise data is not available;4) Industrial wastewater: Industry-wise wastewater discharge and treatment data is not in public domain.
Information gaps
Gaps in policy and implementationPower and energy sector
Gujarat ranks fourth in total installed solar capacity and first in solar rooftop installed capacity at the national level. Gujarat’s current total solar installed capacity stands at 4.05 GW (as on Jan 31, 2021), 77.3 percent of which is ground-mounted and 22.7 percent is solar rooftop (MNRE). It is noteworthy that GoG has lifted the capacity ceiling for setting up solar plants and has a subsidy provision of `10,000/kW for domestic consumers and up to 40 percent of the installation cost for government, commercial and industrial buildings, in addition to the 30 percent provided by the central government (to both domestic and non-domestic consumers). Despite these efforts, the state is deficient by around 4 GW in achieving its ‘8 GW of installed solar capacity’ target by 2022. The state needs to enhance its endeavours in implementing the solar projects in the state, in order to cover this lag in due time. The completion of the proposed hybrid RE power plant in Kachchh, with the proposed capacity of 30GW by 2022, would help the state in achieving its target. Ahmedabad also has a huge potential for solar rooftop installations.
Through Surya Shakti Kisan Yojana (SKY), the Gujarat government aims at benefitting 12,400 farmers across 33 districts, by helping them generate solar energy for captive consumption and sell the surplus to the grid. However, the progress report for this scheme is not available. In addition, the Solar Pump Scheme in tandem with PM KUSUM Yojana was launched to provide solar pumps to farmers to reduce grid dependence for irrigation. However, no solar plant or stand-alone solar pumps have been installed in the state under PM KUSUM Yojana (GUVNL)20. Enhanced endeavours of the state in implementing and capturing mass attention towards SKY and PM-KUSUM Yojana would help the state strengthen its RE infrastructure.
19 Quantification of impact of policies (considered in this study) on GHG emissions takes the baseline emissions into account
20 https://pmkusum.guvnl.com/achive.html
Gujarat’s current total solar installed capacity stands at 4.05 GW (as on Jan 31, 2021),
77.3 % of which is ground-mounted and
22.7 % is solar rooftop (MNRE)

40 Climate Change and Environment Action Plan for Ahmedabad District
ECBC Compliance: The draft Energy Conservation Building Code (ECBC) was published in 2017. However, the code is yet to be notified and implemented in the building byelaws for Gujarat.
Transport sector policies:
• The current modal share of public transport is low – at around 11 percent – indicating a weak public transport network. Policy interventions need to be undertaken to overhaul the existing public transport system and increase its popularity and usability.
• Policy-level intervention is needed to improve BRTS and other public transport modes in terms of robustness, reliability, frequency and reach in the district.
• There is need for green transportation policies or programmes in the district.
AFOLU sector
• To address high emissions emanating from continuous flooding undertaken for rice cultivations, policy level interventions are needed to promote techniques and practices that lower emissions. These include measures such as use of aerators (single or multiple) in rice fields, popularising intermittent flooding, and promotion of high yield rice crop.
• Increase in cattle count with low productivity is a key contributor to AFOLU sector emissions due to enteric fermentation. At present, there are a few policies in place which can be enhanced to curtail emissions arising from enteric fermentation in livestock. Sectoral experts can suggest relevant changes in ‘Feed and Fodder Development Programme’ and ‘Cattle & Buffalo Development Programme’ to bring quantifiable reduction in emissions from livestock.
• With rapid urbanisation and development, Ahmedabad is susceptible to losing its already sparse forest cover. Stringent policy measures are needed to ensure that Ahmedabad’s forest cover is not only maintained, but also enhanced. This will ensure several benefits, such as: (a) act as a sink for the district’s GHG emissions; (b) reduce urban heat-island effect; (c) strengthen ground water resources etc.
• Policy level interventions can break the unhealthy nexus between power and agriculture. Activities such as non-judicious irrigation practices, lead to high electricity consumption patterns. Policies pertaining to electricity pricing, subsidies and collection of tariffs need to be revised.
Waste management
• State-level reporting of waste generation and treatment data is mandatory. However, barring BMW, there is no policy that mandates reporting and maintenance of district-wise data on the type of waste treatment undertaken.
• Even for BMW, such data is not being recorded and maintained at the district level (and/or the information is not in public domain).
• There are no policies for data maintenance and availability of domestic and industrial waste water (industry-wise) generation, treatment and discharge pathways.
• Waste management policies do not suggest gas management/capture facilities for composting and incineration units to dispose waste.
• Reduction of waste transportation emissions is not addressed in the waste management policies.
• Though the Solid Waste Management Rules, 2016 suggest producer take back mechanisms for disposables in municipal solid waste, there are no guidelines for monitoring and reporting the same.
• E-waste Management Rules, 2016 recommends states to maintain an e-waste inventory. Though GEMI has an e-waste inventory, it does not reflect the total waste electrical and electronic equipment (WEEE) generation from the district, as it does not consider all categories of electricals and electronics.
With rapid urbanisation and development, Ahmedabad is susceptible to losing its already sparse forest cover

41Budgetary analysis to estimate expenditure on climate action
BUDGETARY ANALYSIS TO ESTIMATE
EXPENDITURE ON CLIMATE ACTION
Construction workers near the power tower, Ahmedabad

42 Climate Change and Environment Action Plan for Ahmedabad District
5. BUDGETARY ANALYSIS TO ESTIMATE EXPENDITURE ON CLIMATE ACTION
5.1 Introduction to budgetary analysisAnnual district budgets and schemes are analysed using a methodology derived from UNDP’s ‘The Climate Public Expenditure and Institutional Review (CPEIR)’ methodology. The CPEIR is a systematic qualitative and quantitative analysis of public expenditures and how they relate to climate change. Since 2011, CPEIRs have been conducted in many countries in the Asia-Pacific, including Bangladesh, Indonesia, Nepal, Thailand and Vietnam among others at both national and sub-national levels.
This section analyses select flagship schemes at district level. A total of 38 schemes were reviewed to identify those with climate resilience and mitigation relevance. Of these, based on the availability of information across districts as well as relevance to climate actions, five schemes were selected for further analysis.
Annexures 5.1 and 5.2 detail the rationale and the methodology adopted to conduct district level analysis.
5.2 Analysis and findings of flagship schemes
5.2.1 Mahatma Gandhi National Rural Employment Guarantee Scheme (MGNREGS)21
� District annual budgetary expenditure: `1,390.09 lakh
� Allocation to climate action: 14%
� Majority of climate action works: drought proofing
2018-19
� District annual budgetary expenditure: `1,097.77 lakh
� Allocation to climate action: 14%
� Majority of climate action works: drought proofing
2019-20
14%83%
3%
8%
1%
3%
1%
1%
Works on individual land
Other works
Activities related to climate action
Drought proofing
Water conservation and water harvesting
Renovation of traditional waterbodies
Rural connectivity
Rural sanitation
Other work related to climate action
Figure 38: MGNREGS expenditure in Ahmedabad district (2018-19)
21 Ministry of Rural Development (MoRD) lists 17 major activities under MGNREGS. Out of these, 11 can be attributed to be acting on Climate Change, categorised as mitigation specific, resilience specific or both, refer annexure 5.3 for details.

43Budgetary analysis to estimate expenditure on climate action
14%83%
3%
8%
1%
2%
1%
2%
Works on individual land
Other works
Activities related to climate action
Drought proofing
Water conservation and water harvesting
Renovation of traditional waterbodies
Rural connectivity
Rural sanitation
Other work related to climate action
Figure 39: MGNREGS expenditure in Ahmedabad district (2019-20)
Annual expenditure ( `lakh)
2018-19
2019-20
Drought proofing
107.69
82.80
16.67
12.76
19.96
16.52
19.30
17.15
36.63
26.77
Renovation oftraditional water
bodies
Ruralconnectivity
Other works relatedto climate action
Water conservationand water harvesting
Figure 40: Comparing annual expenditures (in `lakh) under MGNREGS in Ahmedabad between 2018-19 and 2019-20
5.2.2 Pradhan Mantri Krishi Sinchayee Yojana (PMKSY)
The micro-irrigation techniques employed in the district under this scheme are: 1) Drip irrigation and 2) Sprinkler irrigation. Other works include building of community ponds, tanks, check dams and earth dams. Table 22 summarises the budgetary spending and allocation to climate action under the scheme in the district.
Table 22: Budgetary allocation to PMKSY in Ahmedabad district
Budget allocations 2016-17 2019-20
Budgetary spending on micro-irrigation activities (`lakh) 641 206
Budget attributed to climate action (`lakh) (see annexure 5.3 for methodology) 442.29 142.14
State budget for PMKSY micro-irrigation (`lakh) 25,000 24,000
% attributed to climate action (micro-irrigation budget under PMKSY) given to district w.r.t state budget 1.77 0.59

44 Climate Change and Environment Action Plan for Ahmedabad District
5.2.3 Green India Mission (GIM)
For Ahmedabad district, the Department of Forests provides a five-year plan for the expenditure on the six sub-missions22 under GIM. Figures 41 and 42 detail the fund allocation in Ahmedabad district under GIM. As observed, the major activities under the mission have enhanced the quality of forest cover and improved ecosystem services, i.e., sub-mission 1 under the GIM.
9%
4%
61%
26%
2017-18 2%
16% 56%
26%
2018-19 5%
59%10%
26%
Enhancing quality of forest cover and improving ecosystem service
Agro forestry and social forestry (increasing biomass and creating carbon sink)
Promoting alternative fuel energy
Activities cost (resilience building + IEC + M&E + livelihood improvement)
2019-20
Figure 41: Distribution of budgetary targets for activities targets under GIM in Ahmedabad 2017-18, 2018-19 and 2019-20
100.
49
0 0
14.7
6
0
7.13
42.8
4
60.2
1
0 0
16.8
8
0 2.58
27.8
9
23.4
6
0 0 4.21
0 1.93 10
.37
0
20
40
60
80
100
120
Enhancing quality of forest cover and improving
ecosystem service
Budg
etar
y ta
rget
s (`
lakh
)
Ecosystem restoration
and increase in forest cover
Enhancing tree cover in urban and peri-urban areas (including
institutional lands)
Agro forestry and social
forestry (increas-ing biomass and creating carbon
sink)
Restoration of wetlands
Promoting alternative fuel
energy
Activities cost
2017-18 2018-19 2019-20
Figure 42: Comparison of the budgetary targets for various activities under GIM in Ahmedabad for 2017-18, 2018-19 and 2019-20
22 1) Enhancing quality of forest cover and improving ecosystem service 2) Ecosystem restoration and increase in forest cover 3) Enhancing tree cover in urban and peri-urban areas (including institutional lands) 4) Agro forestry and social forestry (increasing biomass and creating carbon sink) 5) Restoration of wetlands 6) Promoting alternative fuel energy

45Budgetary analysis to estimate expenditure on climate action
5.2.4 Atal Mission for Rejuvenation and Urban Transformation (AMRUT)23
Based on the methodology and assumptions mentioned in Annexure 5.2, amounts of `4,282 lakh and `6,342 lakh can be attributed to climate action under the scheme for Ahmedabad district in FY 2015-16 and FY 2016-17, respectively (See Figure 44 for budget distribution). Further, Figure 43 gives a distribution of budgetary allocations between years 2015 and 2020 in Ahmedabad district, with the total allocation during this period being `46,723 lakh.
Total budget allocated under AMRUT (`crore)
2015-16
2016-17
Water supply
0
43.46
0.28
1.05
42.53
16.55
0
2.37
2017-20
48.81 1.75101.20 0
Sewage and septagemanagement
Parks andgardens
Urbantransport
Figure 43: Comparison of budgetary expenditure on climate related activities under AMRUT scheme in Ahmedabad district
2016-17
1%
99%
2015-1626%
2%
68%
4% 1%
32%67%
2017-20
Sewage and septage management
Park and gardens Water supply Urban transport
Figure 44: Distribution of climate relevant budgetary expenditure on activities under AMRUT scheme in Ahmedabad for 2015-16, 2016-17 and 2017-20
5.2.5 Deen Dayal Upadhyay Gram Jyoti Yojana (DDUGJY) and Saubhagya Scheme24
Till April 30, 2020, an amount of `2,035 lakh has been released to carry out the activities under Deen Dayal Upadhyay Gram Jyoti Yojana (DDUGJY) and Saubhagya Scheme. Hence, based on the methodology, an amount of `1,017.5 lakh can be attributed towards climate action for the Ahmedabad district (see Annexure 5.3 for methodology and assumptions).
23 The activities performed under the mission can be broadly categorized into five sectors: Water Supply; Sewage and septage management; Stormwater drainage; Green space development; Urban transport
24 Major activities carried out under DDUGJY and Saubhagya Yojana by the Ministry of Power, GoI include: installing new substations, augmenting existing substations, installing DTRs, laying LT lines, installing feeders, feeder segregation among others. Of 11 activities under the scheme, 6 were concluded to directly support climate action.

46 Climate Change and Environment Action Plan for Ahmedabad District

47Recommendations
RECOMMENDATIONS
Bicycle rental station, Ahmedabad
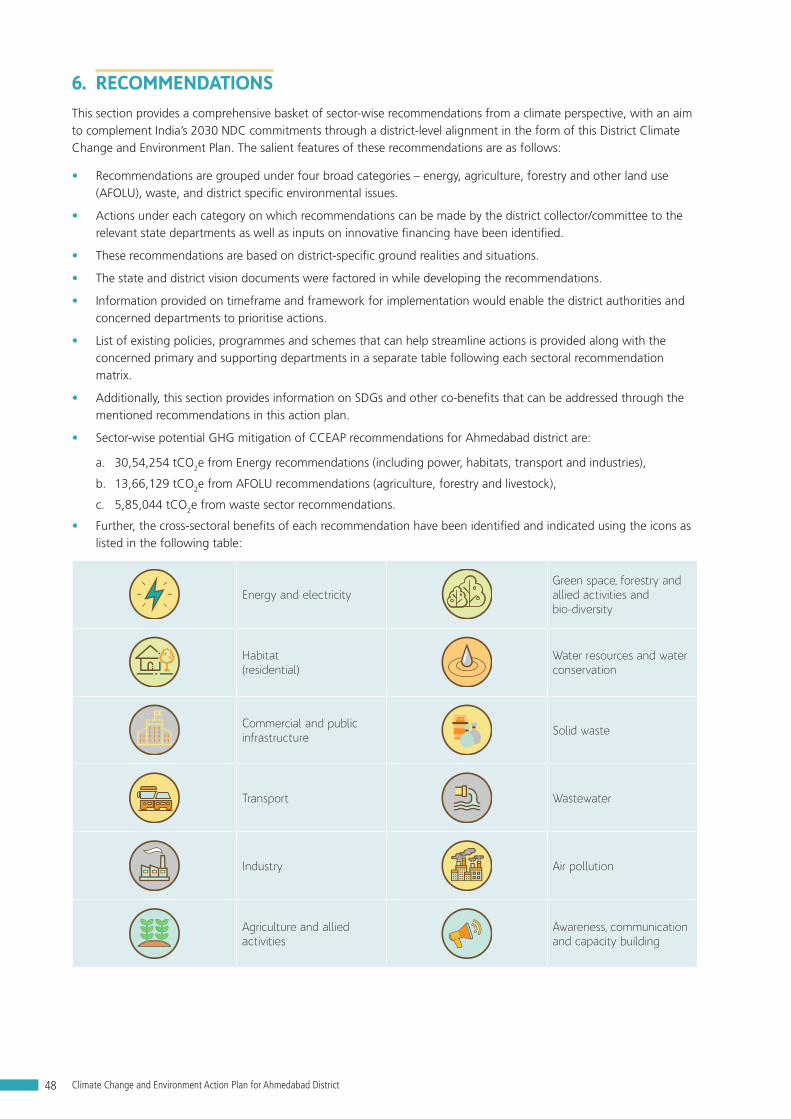
48 Climate Change and Environment Action Plan for Ahmedabad District
6. RECOMMENDATIONS This section provides a comprehensive basket of sector-wise recommendations from a climate perspective, with an aim to complement India’s 2030 NDC commitments through a district-level alignment in the form of this District Climate Change and Environment Plan. The salient features of these recommendations are as follows:
• Recommendations are grouped under four broad categories – energy, agriculture, forestry and other land use (AFOLU), waste, and district specific environmental issues.
• Actions under each category on which recommendations can be made by the district collector/committee to the relevant state departments as well as inputs on innovative financing have been identified.
• These recommendations are based on district-specific ground realities and situations.
• The state and district vision documents were factored in while developing the recommendations.
• Information provided on timeframe and framework for implementation would enable the district authorities and concerned departments to prioritise actions.
• List of existing policies, programmes and schemes that can help streamline actions is provided along with the concerned primary and supporting departments in a separate table following each sectoral recommendation matrix.
• Additionally, this section provides information on SDGs and other co-benefits that can be addressed through the mentioned recommendations in this action plan.
• Sector-wise potential GHG mitigation of CCEAP recommendations for Ahmedabad district are:
a. 30,54,254 tCO2e from Energy recommendations (including power, habitats, transport and industries),
b. 13,66,129 tCO2e from AFOLU recommendations (agriculture, forestry and livestock),
c. 5,85,044 tCO2e from waste sector recommendations.
• Further, the cross-sectoral benefits of each recommendation have been identified and indicated using the icons as listed in the following table:
Energy and electricityGreen space, forestry and allied activities and bio-diversity
Habitat (residential)
Water resources and water conservation
Commercial and public infrastructure Solid waste
Transport Wastewater
IndustryCO2
Air pollution
Agriculture and allied activities
Awareness, communication and capacity building
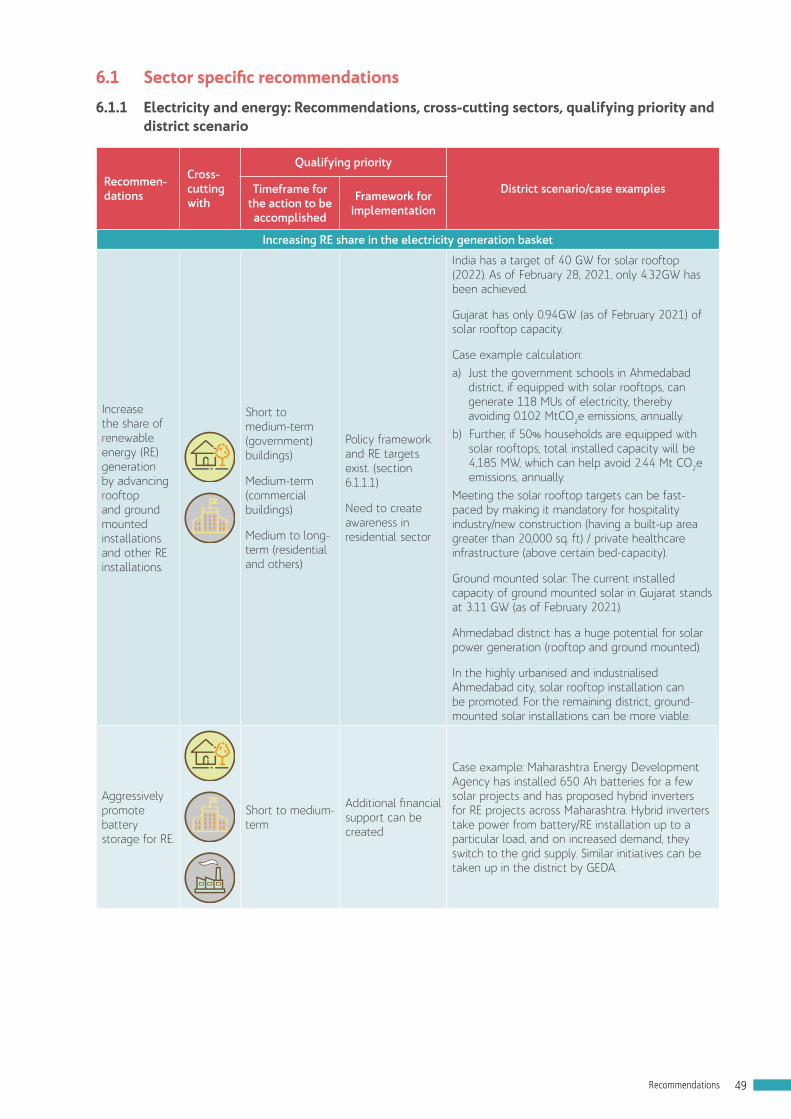
49Recommendations
6.1 Sector specific recommendations
6.1.1 Electricity and energy: Recommendations, cross-cutting sectors, qualifying priority and district scenario
Recommen-dations
Cross-cutting with
Qualifying priority
District scenario/case examplesTimeframe for the action to be accomplished
Framework for implementation
Increasing RE share in the electricity generation basket
Increase the share of renewable energy (RE) generation by advancing rooftop and ground mounted installations and other RE installations.
Short to medium-term (government) buildings)
Medium-term (commercial buildings)
Medium to long-term (residential and others)
Policy framework and RE targets exist. (section 6.1.1.1)
Need to create awareness in residential sector
India has a target of 40 GW for solar rooftop (2022). As of February 28, 2021, only 4.32GW has been achieved.
Gujarat has only 0.94GW (as of February 2021) of solar rooftop capacity.
Case example calculation: a) Just the government schools in Ahmedabad
district, if equipped with solar rooftops, can generate 118 MUs of electricity, thereby avoiding 0.102 MtCO2e emissions, annually.
b) Further, if 50% households are equipped with solar rooftops, total installed capacity will be 4,185 MW, which can help avoid 2.44 Mt CO2e emissions, annually.
Meeting the solar rooftop targets can be fast-paced by making it mandatory for hospitality industry/new construction (having a built-up area greater than 20,000 sq. ft) / private healthcare infrastructure (above certain bed-capacity).
Ground mounted solar: The current installed capacity of ground mounted solar in Gujarat stands at 3.11 GW (as of February 2021).
Ahmedabad district has a huge potential for solar power generation (rooftop and ground mounted).
In the highly urbanised and industrialised Ahmedabad city, solar rooftop installation can be promoted. For the remaining district, ground-mounted solar installations can be more viable.
Aggressively promote battery storage for RE.
Short to medium-term
Additional financial support can be created
Case example: Maharashtra Energy Development Agency has installed 650 Ah batteries for a few solar projects and has proposed hybrid inverters for RE projects across Maharashtra. Hybrid inverters take power from battery/RE installation up to a particular load, and on increased demand, they switch to the grid supply. Similar initiatives can be taken up in the district by GEDA.

50 Climate Change and Environment Action Plan for Ahmedabad District
Recommen-dations
Cross-cutting with
Qualifying priority
District scenario/case examplesTimeframe for the action to be accomplished
Framework for implementation
Encourage captive use of renewable energy, particularly, in rural areas for small industries and creation of local entrepreneurs.
Short to medium-term
Policy framework exists
Need to create awareness
By 2030, the electricity demand for Ahmedabad district is expected to be approximately 30,000 MUs annually. If all of this electricity demand were to be met from coal, it would cause around 25 Mt CO2e emissions, annually.
Decentralised renewable energy (DRE) setups can power small/cottage industries, which in turn can play an important role in providing livelihoods in rural areas. Such setups would create new jobs and empower rural entrepreneurs.
Cold storage and other rural non farm productive use appliances across the district can be powered by DRE. Such set-ups could also be used for reliable storage of vaccines besides farm produce.
RecommendationsCross-cutting with
Qualifying priority
District scenario/case examplesTimeframe for the action to be accomplished
Framework for implementation
Energy demand side management (DSM) and energy efficiency
Encourage faster penetration of Street Lighting National Programme (SLNP). This would ensure that all street and public lighting fixtures are replaced with energy-efficient LED bulbs, prioritising premises and recreational areas of all government / public institutions.
Short-term Policy framework and schemes exist
Smart streetlighting can reduce electricity use by up to 80%. Around 320 million streetlighting poles are in use globally, but fewer than 3% of these are smart enabled.
SLNP had a national target of replacing 1.34 crore conventional street lamps with LED ones by March 2020. Till date, only 1.18 crore LED lamps have been installed.
Replacement of the existing 1,31,281 conventional lamps in Ahmedabad district with LED lamps under SLNP can potentially avoid 64,286 tCO2e emissions, annually.

51Recommendations
RecommendationsCross-cutting with
Qualifying priority
District scenario/case examplesTimeframe for the action to be accomplished
Framework for implementation
Advanced metering infrastructure: Expedite installation of smart meters in collaboration with GUVNL in an effort to develop advanced metering Infrastructure (AMI).
Smart meters, along with its associated IT infrastructure, would allow the DISCOM to obtain real time energy consumption data of each consumer for subsequent analysis and will pave the way for initiating various smart measures like:
(a) Time of day (TOD)/time of use (TOU) billing
(b) prediction and management of peak demand
(c) providing real time energy consumption data to consumer
(d) prepaid billing facility(e) remote connection
and disconnection of load
(f) development and adoption of a differential pricing model to demotivate energy consumption during peak hours, etc.
Short to medium-term
Policy framework and targets exist (section 6.1.1.1)
Need to create awareness
Implemented by EESL (BEE), Smart Meter National Programme aims to replace 250 million conventional meters across the country with smart meters. However, under this programme no smart meter has been installed in Gujarat as of now.
In Naroda (Ahmedabad), smart meters are being installed under the National Smart Grid Mission pilot project through UGVCL. This pilot project aims to cover 22,230 consumers.
Replace/upgrade existing inefficient pumping infrastructure with energy-efficient pumps/solar pumps for supply of piped drinking water in both rural and urban pockets.
Short to medium- term
Relevant schemes and programmes can help achieve this (section 6.1.1.1)
Inter-departmental collaboration.
GUDC has been designated as the nodal agency for the Municipal Energy Efficiency Programme (MEEP). This programme aims to improve the energy efficiency of pumping stations in 139 municipalities across Gujarat through detailed energy auditing.
All the ULBs in Ahmedabad, in co-ordination with the relevant departments, can avail of the financial assistance/benefits under the scheme to make their systems energy-efficient.

52 Climate Change and Environment Action Plan for Ahmedabad District
RecommendationsCross-cutting with
Qualifying priority
District scenario/case examplesTimeframe for the action to be accomplished
Framework for implementation
In agricultural sector, promote use of energy- efficient water pumps (provided by EESL), and solar pumps (through PM-KUSUM and SKY).
Short to medium- term
Policy framework exists (section 6.1.1.1)
According to BEE, agriculture can save 30-40% energy by adoptiing energy-efficient star-labelled pump sets.
Converting 50% of existing electricity/diesel operated tube-wells to solar can potentially reduce 24,288 tCO2e emissions annually.
Increase community awareness on and access to energy-efficient appliances and fixtures.
Provide additional incentives over and above existing schemes/programmes on energy efficient appliances.
(Other recommendations pertaining to energy efficiency are listed under sections: habitat, industry and other recommendations that can be made by Collector's office to the state departments)
Medium-term
Additional financial support can be created
Create awareness through dedicated IEC and long running campaigns
BSES Yamuna Power Ltd. (BYPL) launched an AC replacement scheme in Delhi with the objective of promoting energy efficiency among households. Under the programme, upfront rebate per air conditioner (BEE 5-star rated/ inverter) was offered by BYPL to the consumer in exchange of their old non-star rated air conditioner.
UGVCL can implement a similar scheme in its area of supply.
The unutilised funds from the District Mineral Foundation (DMF) can render much-needed financial support (for subsidies to mining affected communities) to implement the scheme.
6.1.1.1 Electricity and energy: Policy framework and concerned departments/agencies
Sub-sectors Policies and programmes25 that can push forward the recommendation
Primary departments/agencies
Supporting departments/agencies
Increase RE share in electricity generation
1) Gujarat Solar Power Policy, 20212) Surya Urja Rooftop Yojana3) Policy for Development of Small-
scale distributed solar projects, 20194) Waste to Energy Policy, 20165) National Solar Mission6) i-SMART Project7) PM KUSUM8) Surya-Shakti Kisan Yojana (SKY)
1) GEDA, GoG2) Energy and
Petrochemicals Department, GoG
3) ALL ULBs 4) Gujarat Electricity Regulatory
Commission5) Rural Development
Department, GoG6) Urban Development
Department, GoG 7) Climate Change Department,
GoG8) Commissionerate of Cottage
and Rural Industries9) GUVNL-UGVCL, GoG10) Department of Agriculture, GoG11) Proposed District level
Committee on Climate Change and Environment
25 This column enlists information on policies, programmes, rules, schemes and other regulatory provisions pertaining to the sector

53Recommendations
Sub-sectors Policies and programmes25 that can push forward the recommendation
Primary departments/agencies
Supporting departments/agencies
Energy demand-side management (DSM) and energy efficiency
1) Smart Meter National Programme (SMNP)
2) National Smart Grid Mission3) Streetlight National Programme
(SLNP), 20154) UJALA Scheme, 20155) Standards and Labelling Programme6) Sustainable Habitat Mission7) Smart Cities Mission8) National Mission for Enhanced Energy
Efficiency9) Municipal Energy Efficiency
Programme (MEEP)10) PM KUSUM11) Surya-Shakti Kisan Yojana (SKY) 12) Gujarat Solar Power Policy, 202113) Policy for Development of Small-
scale distributed solar projects, 2019
1) BEE (EESL)2) GEDA, GoG3) All ULBs4) Panchayati Raj
Institutions (PRIs)
5) Energy and Petrochemicals Department, GoG
1) Climate Change Department GoG
2) Department of Agriculture, GoG3) District Mineral Foundation
(DMF)4) AUDA5) Smart City Ahmedabad
Development Limited (SCADL)6) Proposed District level
Committee on Climate Change and Environment
6.1.2 Habitat (urban and rural development): Recommendations, cross-cutting sectors, qualifying priority & district scenario
RecommendationsCross-cutting with
Qualifying priority
District scenario/case examplesTimeframe for the action to be accomplished
Framework for implementation
Energy efficiency in buildings
Energy Conservation Building Code (ECBC) to be incorporated in the building by-laws for all ULBs, as a pathway to buildings having net zero energy consumption.
Medium to long-term
Policy framework exists (section 6.1.2.1)
Inter-departmental collaboration required
Capital incentives/relevant exemptions over and above the existing provisions from the district administration are required
The residential and commercial sectors in Ahmedabad contribute around 24% of the total electricity consumed in the district.
GEDA is working with the Urban Development Department and the Climate Change Department to incorporate ECBC into building compliance systems.

54 Climate Change and Environment Action Plan for Ahmedabad District
RecommendationsCross-cutting with
Qualifying priority
District scenario/case examplesTimeframe for the action to be accomplished
Framework for implementation
District administration, in collaboration with the ULBs can implement the India Cooling Action Plan (ICAP) and achieve its objectives, in tandem with the District Heat Action Plan.
District administration can also explore the possibilities of piloting solar-passive architecture/other renewable energy technologies in a few of its iconic buildings.
Implementing this at the district level could help avoid significant GHG emissions.
Medium-term
Policy framework exists (section 6.1.2.1)
Needs inter-departmental collaboration
Capital incentives/relevant exemptions from the district administration required
In September 2018, India became the first country to have a Cooling Action Plan, which seeks to:
(a) Reduce cooling demand across sectors by 20% to 25% by 2037-38
(b) Reduce refrigerant demand by 25% to 30% by 2037-38
(c) Reduce cooling energy requirements by 25-40% by 2037-38
(d) Recognise “cooling and related areas” as a thrust area of research under national S&T programme
(e) Training and certification of 100,000 servicing sector technicians by 2022-23, synergising with Skill India Mission.
The plan aims to provide the following benefits (i) thermal comfort for all – provision for cooling for EWS and LIG housing, (ii) sustainable cooling – low GHG emissions related to cooling, (iii) doubling farmers' income – better cold chain infrastructure, (iv) skilled workforce for better livelihoods and environmental protection, (v) Make in India – domestic manufacturing of air-conditioning and related cooling equipment, and other benefits.
The district cooling system in the Gujarat International Finance Tec-City (GiFT City) in Gandhinagar provides reliable cooling to residential, commercial and industrial buildings. The system, regulated by advanced metering and supervisory control and data acquisition (SCADA) systems, is expected to consume 60-85% of the energy used in conventional air conditioning.
Replace diesel-powered backup with RE-powered backup in a phased manner. This can essentially be promoted in government / commercial / institutional buildings with built-up area >20,000 sqft.
Short to medium-term (govt. buildings)
Medium to long-term (privately-owned, commercial, institutional, and others)
Policy intervention is required
Proper policy backup can mitigate GHG emissions and align India with Paris targets
Needs inter-departmental collaboration
186 entities in Ahmedabad district use DG sets as power backup,
If 50% of the DG sets are replaced with solar-powered backup of the same capacity, 43,680 tCO2e emissions can be averted annually.

55Recommendations
RecommendationsCross-cutting with
Qualifying priority
District scenario/case examplesTimeframe for the action to be accomplished
Framework for implementation
Promoting formulation of energy communities in existing RWAs/other residential committees where residents have ownership over their energy supply. Energy communities can host wind and solar generation installations, or a self-sufficient system functioning as a microgrid/undergrid-minigrid.
These committees can make agreements between the community, the private developer and the utility company. Digitalisation can create innovative billing mechanisms and generating data that will provide important investment information to the energy market.
Medium-term
Deploying public funding schemes like feed-in tariffs, leverage national and international funds
Providing digital upskilling opportunities to citizens can help promoting the initiative.
Upgrade public transport infrastructure to include RE and ECBC compliance. Roadside hoardings near such infrastructure can also be powered through RE.
Short to medium-term
Can be pushed forward by aligning with existing policy framework for solar rooftop (section 6.1.2.1)
ECBC compliance of public transport infrastructure needs to be mandated by building bye-laws
Ahmedabad district can implement initiatives similar to the one in Lucknow, where the municipal corporation has said it would set up 200 solar-powered bus stops.
Encourage fast penetration of UJALA scheme in every household of Ahmedabad district.
Short to medium-term
Schemes and programmes are available (section 6.1.2.1)
The UJALA scheme provides an LED bulb at a nominal price for replacement of incandescent lamps /conventional bulbs.By 2030, the UJALA scheme can potentially avoid emissions of 0.38 MtCO2e annually.

56 Climate Change and Environment Action Plan for Ahmedabad District
RecommendationsCross-cutting with
Qualifying priority
District scenario/case examplesTimeframe for the action to be accomplished
Framework for implementation
Energy-efficient vertical urban development should be promoted instead of horizontal development to conserve green cover..
Medium to long-term
Policy-level intervention required
Vertical urban growth not only provides accommodation to more people per sq. m of space, but also averts loss of agricultural land and open spaces. It makes transport mechanism far more efficient.
Enhance public awareness towards energy-efficient BEE star-labelled home appliances.
Short-term and continuous
Needs collaborations and awareness
Demand side management
Promote and subsidise good practices for all ULBs, such as installing rainwater harvesting setups in buildings that can considerably reduce energy dependence on submersible motors for groundwater pumping.
Short-term
Schemes and programmes exist (section 6.1.2.1)
Awareness generation required
According to the Comprehensive General Development Plan (2017) of AUDA, rainwater harvesting is mandatory for all buildings with ground coverage of 80 sq. m and above.
Implement individual water metering in residential sector to reduce water wastage, thereby bringing down energy consumption.
Medium-term
Policy intervention is required
Need to create awareness
In many cities, drinking water and wastewater plants are municipally owned and are among the largest municipal energy consumers, often accounting for 30% to 40% of total municipal energy consumption. By incorporating energy efficiency measures into their water and wastewater plants, municipalities can save 15% to 30% of their municipal budgets.
Since 2016, around 2,800 ‘building use’ permissions have been given in Ahmedabad to societies on the condition that they install water meters.
Sixteen apartments in Mantri Residency, Bengaluru, installed with water meters, are consuming 25-30% less water every year.

57Recommendations
RecommendationsCross-cutting with
Qualifying priority
District scenario/case examplesTimeframe for the action to be accomplished
Framework for implementation
Encourage residential societies to adopt solar-thermal water heaters.
Short-term and continuous
Schemes and programmes exist (section 6.1.2.1)
Inter-departmental collaboration required
Scheme to be implemented as a part of green buildings
Multi-storey (up to 12 storeys) residential buildings can meet around 70% of the annual electricity requirement for water heating (BEE) through community solar water heating systems (assuming utilisation of 60% roof area).
Promote installation of automatic/smart water pumps to control overflowing of tanks.
Short-term Need to create awareness
Water cess by municipal corporation to be revised and gradually increased.
Medium-term Policy framework to be revised
Digital tools, like, GIS, remote sensing can be used to identify opportunities to reduce energy demand as well as where energy efficiency interventions hold the most value, and where and how to set up mixed-use zones to flatten demand curves. Energy demands (for cooling) of the district can be mapped, combining weather data with demand data, to identify where efficiency interventions are needed.Digital tools can also help to identify where energy efficiency interventions hold the most value, and where and how to set up mixed-use zones to flatten demand curves. Energy demands (for cooling) of the district can be mapped, combining weather data with demand data, to identify where efficiency interventions are needed.
Medium to long-term
Needs policy intervention and infrastructural development
By identifying optimal locations for water features or vegetation, Ahmedabad can counteract on heat islands through tree plantations that provide shade and reduce the power demand for cooling in buildings.

58 Climate Change and Environment Action Plan for Ahmedabad District
6.1.2.1 Habitat: Policy framework and concerned departments/agencies
Sub-sectors Policies and programmes that can push forward the recommendation
Primary departments/agencies
Supporting departments/agencies
Energy efficiency in buildings
1) ECBC 20172) India Cooling Action Plan, 2019 3) UJALA Scheme, 20154) Gujarat Solar Power Policy, 20215) Surya Urja Rooftop Yojana6) Policy for Development of Small-
scale distributed solar projects, 2019 7) Smart Cities Mission8) Sustainable Habitat Mission
1) Urban Development and Urban Housing Department, GoG
2) All ULBs3) Smart City Ahmedabad
Development Limited.4) Panchayati Raj
Institutions (PRIs)
1) GEDA, GoG2) BEE (EESL)3) Rural Development
Department4) Road and Building
Department5) Ports and Transport
Department/GSRTC6) Proposed District
level Committee on Climate Change and Environment
Demand-side management
1) Gujarat Domestic Water Supply Protection Bill, 2019
2) ECBC3) Building by laws 4) Comprehensive General
Development Control Regulations, Urban Development and Urban Housing Development, Government of Gujarat.
1) Urban Development and Urban Housing Department, GoG
2) All ULBs3) Rural Development
Department4) Panchayati Raj
Institutions (PRIs)
1) AUDA2) Gujarat Water Supply
and Sewerage Board.3) Smart City Ahmedabad
Development Limited4) Proposed district-
level committee on climate change and environment
6.1.3 Transport: Recommendations, cross-cutting sectors, qualifying priority and district scenario
RecommendationsCross-cutting with
Qualifying priority
District scenario/case examplesTimeframe for the action to be accomplished
Framework for implementation
Promote e-mobility
Generate awareness and disseminate information to encourage adoption of electric vehicles.
Short-term and continuous
Inter-departmental collaboration and dedicated long-running campaigns required
Increase modal share of e-vehicles to achieve the target of National Electric Mobility Mission Plan (NEMMP) and FAME II.
Short-term and continuous
Policy framework exists (section 6.1.3.1)
Budgetary provisions can be made available through various schemes
In January 2020, the Gujarat government announced it will be installing charging stations at multi-level parking lots and public places across the state.
Make all public transport (PT) modes low carbon intensive, such as shifting current fossil fuel-based vehicles to electric powered or hybrid vehicles.
Medium to long-term
Policy framework (section 6.1.3.1) and budgetary provisions exist
Ahmedabad aims to become the first Indian city to convert its entire fleet of public transport buses into e-vehicles. The first phase of this endeavour was launched with the procurement of 19 EVs.
In 2019, Gujarat announced that 500 electric buses will be procured in Ahmedabad. Till March 2019, Ahmedabad had procured 350 e-buses.

59Recommendations
RecommendationsCross-cutting with
Qualifying priority
District scenario/case examplesTimeframe for the action to be accomplished
Framework for implementation
Similarly, initiate transition of intermediate public transport (IPT) vehicles to electric by incentivising IPT operators through: a) subsidiesb) separate lanesc) dedicated parking spaces d) Replacement of lead acid
battery-powered electric IPT vehicles with more sustainable Li-ion battery e-vehicles in a phased manner.
Medium-termPolicy framework exists (section 6.1.3.1)
At present, subsidies are being provided in Gujarat for Li-ion battery-operated rickshaw of `10,000, bringing the cost to approximately `40,000. However, lead-acid battery-based vehicles are still cheaper, costing around `30,000.
District administration, ULBs (for office use and solid waste transport activities) and all district-level government offices can adopt e-vehicle fleets. Additionally, all these offices need to install charging infrastructure at the earliest.
Short to medium-term
Needs policy backing
The Gujarat EV Policy 2021 has recommended all government office parking areas to mandate installation of charging infrastructure for both employees and visitors. The district can take advantage of this provision and build on the same to encourage government departments to transition their fleets to EV-based vehicles.
Develop robust and widespread charging infrastructure.
a) Charging infrastructure to be created at strategic locations – commercial hubs, public parking, airports and railway stations etc, preferably RE powered.
b) Adoption of relevant policies.c) Prioritise land acquisition
for setting up charging infrastructure.
d) Dedicated parking spaces for EVs should be introduced with charging facilities.
e) Restaurants and commercial spaces on highways can be incentivised to install charging infrastructure for e-vehicles to make long journeys with e-vehicles hassle-free.
f) As a cost effective solution to reduce street clutter and to open acess (particularly for those without garagaes), integrated EV charging points into lampposts can be evaluated as a trail solution for further implementation possibilities.
Medium-term
Policy framework exists (section 6.1.3.1)
Inter-departmental collaboration required
Energy Efficiency Services Limited (EESL) and Ahmedabad Municipal Corporation (AMC) have partnered to establish infrastructure for electric vehicles (EV) in Ahmedabad city over a 10-year period. They plan to establish 100 charging stations to promote renting and purchase of electric vehicles. AMC is expected to save over 4.46 tonnes of CO2 emissions per EV per year.
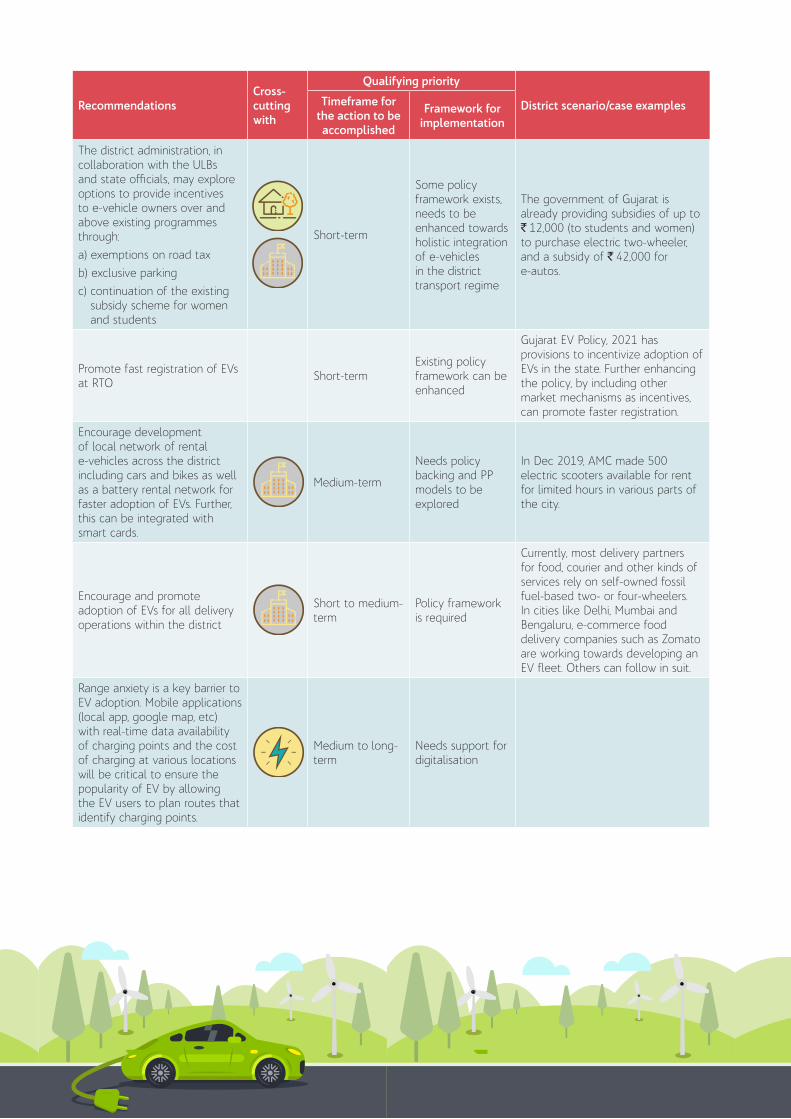
60 Climate Change and Environment Action Plan for Ahmedabad District
RecommendationsCross-cutting with
Qualifying priority
District scenario/case examplesTimeframe for the action to be accomplished
Framework for implementation
The district administration, in collaboration with the ULBs and state officials, may explore options to provide incentives to e-vehicle owners over and above existing programmes through:a) exemptions on road taxb) exclusive parkingc) continuation of the existing
subsidy scheme for women and students
Short-term
Some policy framework exists, needs to be enhanced towards holistic integration of e-vehicles in the district transport regime
The government of Gujarat is already providing subsidies of up to `12,000 (to students and women) to purchase electric two-wheeler, and a subsidy of `42,000 for e-autos.
Promote fast registration of EVs at RTO Short-term
Existing policy framework can be enhanced
Gujarat EV Policy, 2021 has provisions to incentivize adoption of EVs in the state. Further enhancing the policy, by including other market mechanisms as incentives, can promote faster registration.
Encourage development of local network of rental e-vehicles across the district including cars and bikes as well as a battery rental network for faster adoption of EVs. Further, this can be integrated with smart cards.
Medium-term
Needs policy backing and PP models to be explored
In Dec 2019, AMC made 500 electric scooters available for rent for limited hours in various parts of the city.
Encourage and promote adoption of EVs for all delivery operations within the district
Short to medium-term
Policy framework is required
Currently, most delivery partners for food, courier and other kinds of services rely on self-owned fossil fuel-based two- or four-wheelers. In cities like Delhi, Mumbai and Bengaluru, e-commerce food delivery companies such as Zomato are working towards developing an EV fleet. Others can follow in suit.
Range anxiety is a key barrier to EV adoption. Mobile applications (local app, google map, etc) with real-time data availability of charging points and the cost of charging at various locations will be critical to ensure the popularity of EV by allowing the EV users to plan routes that identify charging points.
Medium to long-term
Needs support for digitalisation
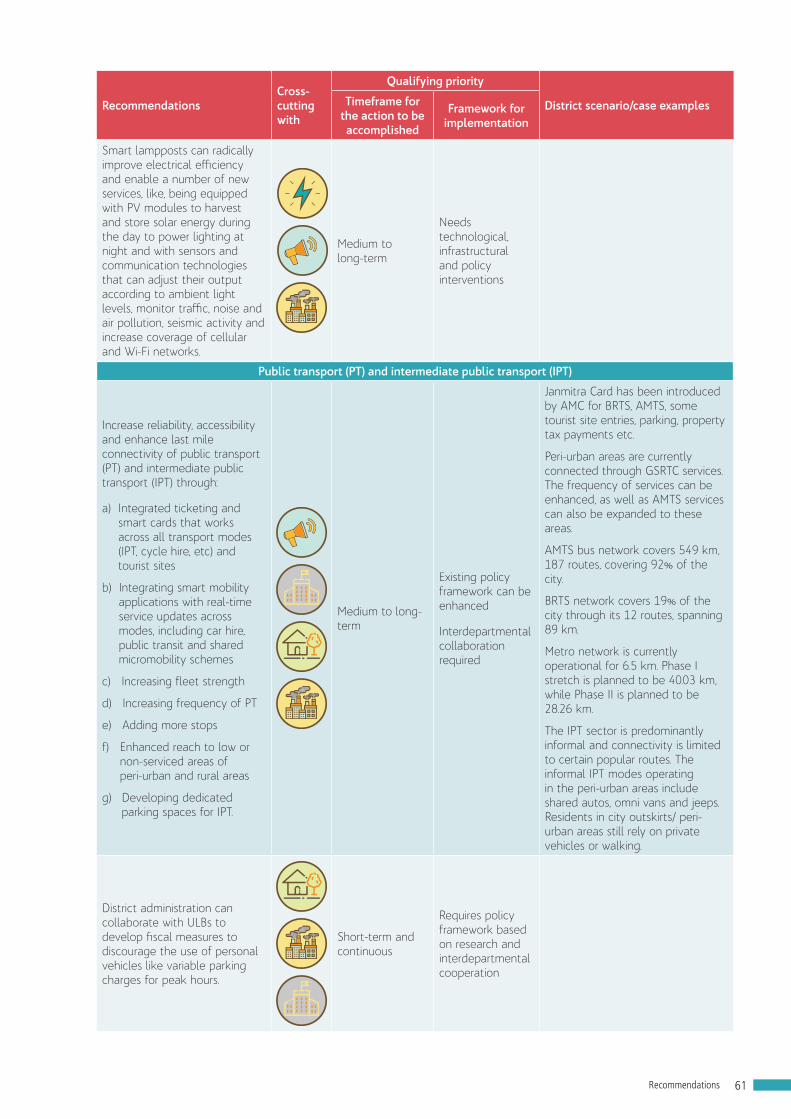
61Recommendations
RecommendationsCross-cutting with
Qualifying priority
District scenario/case examplesTimeframe for the action to be accomplished
Framework for implementation
Smart lampposts can radically improve electrical efficiency and enable a number of new services, like, being equipped with PV modules to harvest and store solar energy during the day to power lighting at night and with sensors and communication technologies that can adjust their output according to ambient light levels, monitor traffic, noise and air pollution, seismic activity and increase coverage of cellular and Wi-Fi networks.
CO2
Medium to long-term
Needs technological, infrastructural and policy interventions
Public transport (PT) and intermediate public transport (IPT)
Increase reliability, accessibility and enhance last mile connectivity of public transport (PT) and intermediate public transport (IPT) through:
a) Integrated ticketing and smart cards that works across all transport modes (IPT, cycle hire, etc) and tourist sites
b) Integrating smart mobility applications with real-time service updates across modes, including car hire, public transit and shared micromobility schemes
c) Increasing fleet strength
d) Increasing frequency of PT
e) Adding more stops
f) Enhanced reach to low or non-serviced areas of peri-urban and rural areas
g) Developing dedicated parking spaces for IPT.
CO2
Medium to long-term
Existing policy framework can be enhanced
Interdepartmental collaboration required
Janmitra Card has been introduced by AMC for BRTS, AMTS, some tourist site entries, parking, property tax payments etc.
Peri-urban areas are currently connected through GSRTC services. The frequency of services can be enhanced, as well as AMTS services can also be expanded to these areas.
AMTS bus network covers 549 km, 187 routes, covering 92% of the city.
BRTS network covers 19% of the city through its 12 routes, spanning 89 km.
Metro network is currently operational for 6.5 km. Phase I stretch is planned to be 40.03 km, while Phase II is planned to be 28.26 km.
The IPT sector is predominantly informal and connectivity is limited to certain popular routes. The informal IPT modes operating in the peri-urban areas include shared autos, omni vans and jeeps. Residents in city outskirts/ peri-urban areas still rely on private vehicles or walking.
District administration can collaborate with ULBs to develop fiscal measures to discourage the use of personal vehicles like variable parking charges for peak hours.
CO2
Short-term and continuous
Requires policy framework based on research and interdepartmental cooperation

62 Climate Change and Environment Action Plan for Ahmedabad District
RecommendationsCross-cutting with
Qualifying priority
District scenario/case examplesTimeframe for the action to be accomplished
Framework for implementation
Implement policy measures to discourage use of private vehicles a) Parking policy for vehicle
ownershipb) No car days on certain roadsc) Parking allowed only in
dedicated areas.
Short to medium-term
Policy framework required
Needs research and interdepartmental collaboration
Sikkim Parking Policy, 2010 mandates that only houses with parking slots can procure vehicles.
Improve enforcement of vehicular pollution control norms to minimise emissions from fossil fuel-based PT and IPT vehicles.
CO2
Short-term and continuous
Policy framework exists (section 6.1.3.1) Stricter implementation required
Awareness campaigns to popularise PT and IPT modes.
Short-term and continuous
Dedicated awareness campaigns required
Augment non-motorised transport (NMT)
Improve infrastructure to increase modal share of NMT transport in urban areas, such as by introduction of segregated cycle lanes.
Medium-term
Requires policy based on research and inter-departmental cooperation
Current modal split in Ahmedabad indicates that the share of NMT is approximately 34%. However, over the years, there has been a downward trend. Efforts need to made to make NMT a preferred and viable option.
Regular O&M of NMT infrastructure: a) Developing and maintaining
well-lit, clean and safe pathways for pedestrians and cyclists.
b) Consulting and engaging local experts and community for development and maintenance.
c) remove encroachments.
Short-term and continuous
Policy framework exists (section 6.1.3.1) Requires inter-departmental cooperation
Promote cycle hire services in key locations across the district. Short-term
Policy framework needs to be enhanced Further, PPP models can be explored for successful implementation.
‘Amdabike’ is SCADL’s flagship project of public bike share system for Ahmedabad city. The services will be available at all BRTS bus stops in the western part of the city and will be connected to various colleges, offices and residential complexes, malls, lakes, gardens, etc within the vicinity. Currently, there are 30 hubs and a fleet of 500 bicycles with a plan of 500 additional bicycles and 30 more hubs.

63Recommendations
RecommendationsCross-cutting with
Qualifying priority
District scenario/case examplesTimeframe for the action to be accomplished
Framework for implementation
Improving traffic flow
Promote staggered and flexible work timings to limit traffic movement at peak hours to and from key busy routes across the district.
CO2
Short-term
Needs proper policy formulation, research, multi-stakeholder and inter-departmental cooperation
Ahmedabad district can adopt the following best practices to minimise congestion at peak hours.
In 2019, the Delhi government decided to stagger working hours of its offices during the implementation of the 12-day odd-even scheme, a move aimed at reducing traffic congestion and pollution in the city. Similar shifts have been planned in Bangalore.
a) Create additional dedicated parking zones for vehicles to deter encroachment of road space and pavements.
b) Encourage business/corporate centres to have mandatory private parking with sufficient slots to avoid parking in public spaces.
a) Medium-term
b) Short-term and continuous
Policy framework exists
Multi stakeholder and inter-departmental cooperation is required
Ahmedabad has multi-level parking spaces. However, since awareness is low, utilisation is poor. Municipal corporations and district authorities need to work towards building awareness and encouraging use of parking facilities.
Develop dedicated areas for street vendors in order to deter encroachment of pavements by them and avoid traffic congestion on roadsides.
Short to medium-term
While the policy framework exists, implementation is irregular and for short timeframes
Multi-stakeholder and inter-departmental cooperation is required
There are regular drives by the AMC and the city plans to clear encroachments. However, these affect the livelihoods of the street vendors.
Regular maintenance of roads to ensure smooth flow of traffic as it can help reduce GHG emissions while extending the life of the road.
CO2
Short to medium-term and continuous
While the policy framework exists, implementation is lacking in some areas
Multi-stakeholder and inter-departmental cooperation are required

64 Climate Change and Environment Action Plan for Ahmedabad District
6.1.3.1 Transport: Policy framework and concerned departments/agencies
Sub-sectors
Policies and programmes that can push forward the recommendation
Primary departments/agencies
Supporting departments/agencies
Promoting e-mobility
1) FAME II2) Gujarat EV Policy,
20213) JNNURM4) National Electric
Mobility Mission Plan5) Smart Cities Mission6) AMRUT7) Proposed e-vehicle
Policy (as per 2021-22 union budget)
8) National Urban Transport Policy, 2006
1) All ULBs2) RTOs
(Ahmedabad, Bavala and Vastral)
3) EESL
1) Urban Development and Urban Housing Department, GoG
2) GEDA3) Transport Department GoG 4) Roads and Buildings Department, GoG5) Climate Change Department, GoG6) Rural Development Department GoG7) Proposed district-level committee on climate
change and environment8) AUDA9) Smart City Ahmedabad Development Limited10) PRIs11) Airport Authority12) Western Railways – Ahmedabad Division
Public transport and intermediate public transport
1) BRTS 2) JNNURM3) ECBC4) Smart Cities Mission5) AMRUT6) National Urban
Transport Policy, 2006
1) All ULBs2) Smart City
Ahmedabad Develop Limited
3) GSRTC4) GMRC
1) Urban Development and Urban Housing Department, GoG;
2) Transport Department, GoG3) RTOs (Ahmedabad, Bavala and Vastral)4) Roads and Buildings Department, GoG5) Climate Change Department, GoG6) Rural Development Department, GoG7) GEDA8) AUDA9) Proposed District level Committee on Climate
Change and Environment
Augment non-motorised transport
1) Smart Cities Mission2) AMRUT3) National Urban
Transport Policy, 2006
1) All ULBs2) AUDA3) Smart City
Ahmedabad Develop Limited;
1) Urban Development & Urban Housing Department, GoG;
2) Roads and Buildings Department, GoG;3) Climate Change Department, GoG4) Rural Development Department, GoG5) Proposed District level Committee on Climate
Change and Environment6) PRIs7) GEDA8) Police Department
Improving traffic flow
1) BRTS 2) JNNURM3) ECBC4) Smart Cities Mission5) AMRUT6) National Urban
Transport Policy, 2006
1) All ULBs2) AUDA3) Smart City
Ahmedabad Develop Limited
4) RTOs
1) Urban Development & Urban Housing Department, GoG;
2) Roads and Buildings Department, GoG; 3) Gujarat Infrastructure Development Board (GIDB)4) Climate Change Department, GoG5) Rural Development Department, GoG6) Proposed District level Committee on Climate
Change and Environment7) Police Department8) Department of Industries9) PRIs10) GIDC

65Recommendations
6.1.4 Industry: Recommendations, cross-cutting sectors, qualifying priority and district scenario
RecommendationsCross-cutting
with
Qualifying priority
District scenario/case examplesTimeframe for the action to be accomplished
Framework for implementation
District can develop an incentive system, similar to a ‘cap-and-trade’ system at district level for enhancing energy efficiency of MSMEs, in coordination with the state energy department.
Medium-term
Requires policy framework, based on research and inter-departmental cooperation.
Promote combined heat and power (CHP)/ co-generation for running captive power plants.
Medium-term
Policy framework exists
Inter-departmental collaboration required
Need to create awareness to popularize the initiative
CHP systems can achieve system efficiencies close to 80% as compared to around 60% by conventional technologies.
Optimise equipment efficiency. Equipment that are not usually turned off during downtime, such as heating or cooling equipment, pumps, alarm systems, etc., need to be energy-efficient and strategies must be developed to switch them off whenever possible.
Medium-termPolicy framework exists (section 6.1.4.1)
Gujarat Industrial Policy 2020 focusses on:
a) Strengthening the regulation and environmental compliance.
b) Implementation of cleaner production technology in place of existing processes, such as substitution. and optimisation of raw material, reduction in water consumption or energy consumption or waste generation. For implementation of cleaner production technologies, MSMEs can get assistance of up to 35% of cost of plant and machinery, with a ceiling of `35 lakh during the operative period of the scheme. Similarly, purchase of new equipment/system related safety, occupational health or for environment compliances for common use of industries located in cluster also get assistance up to 35% of cost of equipment, up to a maximum of `35 lakh.
c) Encouraging green practices and environmental audit of MSMEs by exempting up to 75% of fees of audit services (up to a maximum of `50,000).
d) Industrial buildings with green rating under Indian Green Building Council to be granted 50% exemption on consulting charges (up to `2.5 lakh)
e) Encouraging existing industries to shift their units outside the urban agglomerations
Invest in green projects, such as plantation drives and afforestation activities within and around industrial areas in the district.
Short-term
Policy framework exists
Improved monitoring and evaluation will give recommendation a further push
Target better M&E of energy audits to improve accountability.
Short to medium-term
Policy framework already exists
Inter-departmental collaboration is required for successful implementation
Create appropriate district-level rules to enable and encourage industries to use recycled water from their plants rather than freshwater.
Short term
Policy framework exists. However, it needs to be upgraded in collaboration with responsible agencies and departments
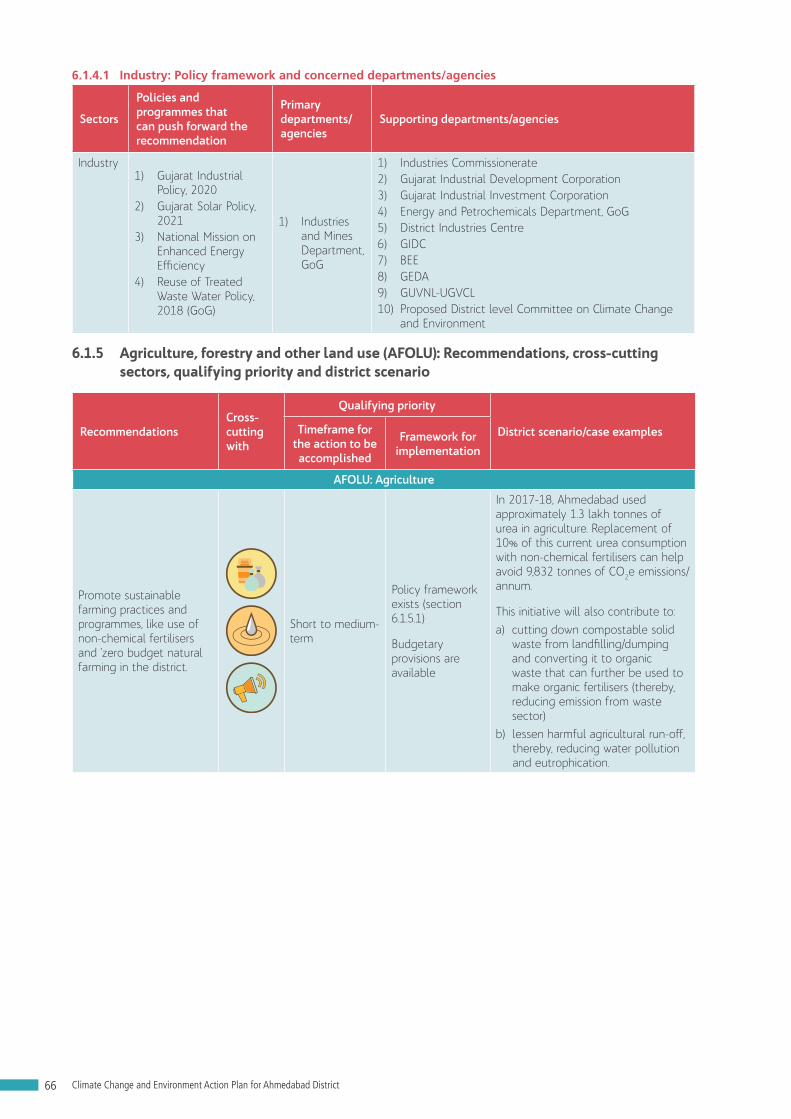
66 Climate Change and Environment Action Plan for Ahmedabad District
6.1.4.1 Industry: Policy framework and concerned departments/agencies
Sectors
Policies and programmes that can push forward the recommendation
Primary departments/ agencies
Supporting departments/agencies
Industry1) Gujarat Industrial
Policy, 20202) Gujarat Solar Policy,
20213) National Mission on
Enhanced Energy Efficiency
4) Reuse of Treated Waste Water Policy, 2018 (GoG)
1) Industries and Mines Department, GoG
1) Industries Commissionerate2) Gujarat Industrial Development Corporation3) Gujarat Industrial Investment Corporation4) Energy and Petrochemicals Department, GoG5) District Industries Centre6) GIDC7) BEE8) GEDA9) GUVNL-UGVCL10) Proposed District level Committee on Climate Change
and Environment
6.1.5 Agriculture, forestry and other land use (AFOLU): Recommendations, cross-cutting sectors, qualifying priority and district scenario
RecommendationsCross-cutting with
Qualifying priority
District scenario/case examplesTimeframe for the action to be accomplished
Framework for implementation
AFOLU: Agriculture
Promote sustainable farming practices and programmes, like use of non-chemical fertilisers and ‘zero budget natural farming in the district.
Short to medium-term
Policy framework exists (section 6.1.5.1)
Budgetary provisions are available
In 2017-18, Ahmedabad used approximately 1.3 lakh tonnes of urea in agriculture. Replacement of 10% of this current urea consumption with non-chemical fertilisers can help avoid 9,832 tonnes of CO2e emissions/annum.
This initiative will also contribute to: a) cutting down compostable solid
waste from landfilling/dumping and converting it to organic waste that can further be used to make organic fertilisers (thereby, reducing emission from waste sector)
b) lessen harmful agricultural run-off, thereby, reducing water pollution and eutrophication.

67Recommendations
RecommendationsCross-cutting with
Qualifying priority
District scenario/case examplesTimeframe for the action to be accomplished
Framework for implementation
Promote adoption of alternative ways of managing crop residue, other than burning.
Promote adoption of improved harvesting practices, like land leveller, direct seeding, nutrition management etc. through agricultural extension programme and financial assistance/formation of cooperatives etc.
Stubble can be used as feedstock for different industries to make products such as paper, cardboard, furniture, organic fertiliser and animal fodder, which will act as an alternative source of income for the farmers.
CO2
Short to medium-term
Policy framework required
Collaboration required
Farmers to have easy access to markets/industries that would take crop residue/stubble
This also helps meet the following targets of SDG#8 (Decent Work and Economic Growth): 8.2; and SDG#12 (Responsible Consumption and Production): 12.5, 12. a
Improved harvesting practices, such as the use of Happy Seeder, has the capacity to eliminate 78% of the GHG emissions (from crop residue burning). It can potentially increase farmers’ profits by at least 10%. Feasibility studies may be undertaken for cost-benefit analysis to support the farmers with such improved harvesting machines and practices. Direct sowing of rice reduces the soil disturbance, enabling it to retain more nutrients, moisture and organic content. It also, removes the need to burn rice stubble, thereby reducing air pollution.
Other feasibility studies or projects can be initiated. Such as the development of biofuel pellets from crop residue.
Farmers should be encouraged to follow the recommendation given in Soil Health Card Scheme.
Short to medium-term
Can be implemented by generating awareness
According to the ‘Soil Health Card’ portal, 16,84,207 samples have been tested in Cycle-II in Gujarat. In Ahmedabad, 83% of the soil samples tested have reported very low nitrogen and 24% of them have reported very low phosphorus and potassium, as per the Soil Health Card information shared by the GoI.
Promotion of micro-irrigation (MI) to improve water use efficiency. It saves water, energy, and fertiliser consumption.
Short to medium-term
Policy framework is available (section 6.1.5.1)
Enable swift procedures and subsidy disbursement for adoption of micro-irrigation
The district may consider to provide additional subsidies
Currently, Gujarat holds 12% of the total area under micro irrigation in India. 26 In Gujarat, all farmers – irrespective of social status, landholding, crops, and geographical location – are entitled to a subsidy of 50% of capital cost of MI or 60,000/ha (whichever is lower), of which, 40% is provided by the national government, and the state government bears the remaining 10%. In addition, more subsidy is provided to dark-zone blocks and tribal blocks (talukas) as well as to SC/ST farmers. In March 2015, additional subsidy was announced for small and marginal farmers, however, it varies for non-dark zone and dark zone blocks.27
According to PMKSY Achievement Report, 924 ha of land was covered under MI in Ahmedabad during 2019-20, which should have led to avoidance of approximately 781 tonnes of CO2 emissions (due to savings in electricity consumption)
26 A. Suresh and Manoj P. Samuel, Current Science, ‘Micro-irrigation development in India: challenges and strategies’
27 Chandra Sekhar Bahinipati and P.K. Viswanathan, Adoption and Diffusion of Micro-irrigation Technologies in Gujarat, Western India: Do Institutions and Policies Matter?

68 Climate Change and Environment Action Plan for Ahmedabad District
RecommendationsCross-cutting with
Qualifying priority
District scenario/case examplesTimeframe for the action to be accomplished
Framework for implementation
Encourage adoption of latest technologies, like:a) Solar pumps (under
PM KUSUM Yojana and SKY)
b) Star-rated energy efficient pump system (EEPS)
c) Smart control panels and internet of things-based systems for optimum resource utilisation (water and energy).
Short to medium-term
Policy framework is available (section 6.1.5.1)
Capital investment support, over and above the existing policy, can be considered
In 2018, GoG launched Suryashakti Kisan Yojana (SKY) with the objective of doubling farmers’ income by generating their own power and selling the surplus back to the state.
Replacement of 1 lakh diesel pumps with solar pumps, over a period of five years, can cut 900 million litres of diesel consumption over the lifecycle of solar pumps, which can potentially save `840 crore of diesel subsidy and 2.53 million tonnes of CO2 emissions.
These initiatives will increase farmers’ income, provide reliable source for irrigation and reduce dependence on diesel in the farm sector.
Enhance the efficiency/network of cold storage systems and initiate a gradual shift to RE-powered cold storages.
Medium to long-term
Policy framework exists and can be enhanced (section 6.1.5.1.)
Capital investment required
Align with solar rooftop policies and ECBC
Under PMKSY, 969 cold storage facilities with a capacity of 38,22,112 tonnes are proposed for Gujarat to avoid post-harvest losses. These new cold storages can be solar-powered.
AFOLU: Livestock
Promote grasslands and cultivation of cattle feedstock for good quality forage and to manage fodder scarcity.
Short to medium-term
Policy framework exists (section 6.1.5.1)
Research inputs required
Collaboration between different communities (farming and pastoral) is needed.
Intensive cultivation of Sesbania grandiflora, which produces about 7.8 kg/tree/year or 93.6 MT/year/ha when fed to lactating crossbred cows, leads to an increase in milk yield by 11.97%.28
Straws from millets, corn and maize have better feeding quality than straws from rice, barley and wheat. This change in quality of forage specie leads to better productivity and 30% reduction in emission.
ICAR-NIANP has recently developed a feed supplement - Harit Dhara and Tamarin Plus, for cattle, buffalo and sheep. It is found effective in cutting down methane emissions by 20%. Use of this feed supplement can be encouraged by Ahmedabad at the district level.29
28 Earagariyanna M.Y. et. al., 2017, Fodder Resource Management in India-Critical Analysis
29 http://nianp.res.in/harit-dhara-tamarin-plus
Soil Carbon Soil respiration
Stubble burning
FertilierManuring
N�xation
CO2 uptake
CH4
CH4
CH4
N2O N2O
CO2
Rice
CO2

69Recommendations
RecommendationsCross-cutting with
Qualifying priority
District scenario/case examplesTimeframe for the action to be accomplished
Framework for implementation
Promote cattle breeds with higher productivity. Productivity of indigenous cattle should also be improved (e.g. through provision of Nand Ghars).
However, the balance between resilience and productivity should be maintained. Currently, in most areas flock sizes are negatively impacting the climate and ecology.
Medium to long-term
Policy framework exists (section 6.1.5.1)
Research collaboration required (to ensure biodiversity of the region is not impacted)
Awareness generation
Monetary support to the pastoral community required
These initiatives will help meet growing demand of milk, while keeping the livestock headcount low. In Ahmedabad, a 10% decrease in the number of indigenous cattle over a period of five years, the loss in milk production will be 30 lakh litres and 1,86,752 tonnes of CO2e emission will be avoided. To compensate for this loss in milk production, a total of 1,88,518 new crossbreed cattle would be needed, which will lead to 1,70,268 tonnes CO2e emissions. The net emissions avoided per year would be approximately 3,296.92 tonnes CO2e.
Promote use of waste from livestock and poultry as an important source of organic manure for various crops, such as, sugarcane, potato etc. for enhancing crop production.
Short to medium-term
Collaboration between different communities (farming and pastoral) is needed
Policy framework is available (section 6.1.5.1)
Poultry manure fertiliser is rich in nitrogen and contains all 13 essentials nutrients required for crop production. In comparison to cow manure, it is two to three times richer in inorganic fertiliser content.
AFOLU: Forestry and green spaces
Ensure minimum diversion of forest land for any activity or project and promote compensatory afforestation (of the same species) from the funds given by the user agency.
Funds for continuous tree improvement and tree breeding programmes can be ensured through CAMPA.
Short to medium-term
Policy framework and budget provisions exist (section 6.1.5.1)
Policy implementation required
Stringent monitoring and evaluation
In 2019, Gujarat received `1,484.60 crore from the Compensatory Afforestation Fund Management and Planning Authority (CAMPA), which aims to promote afforestation and regeneration activities as a way of compensating for forest land diverted to non-forest uses.
Soil Carbon Soil respiration
Stubble burning
FertilierManuring
N�xation
CO2 uptake
CH4
CH4
CH4
N2O N2O
CO2
Rice
CO2

70 Climate Change and Environment Action Plan for Ahmedabad District
RecommendationsCross-cutting with
Qualifying priority
District scenario/case examplesTimeframe for the action to be accomplished
Framework for implementation
Measures to increase trees outside forest area and green spaces in Ahmedabad
a) Setting up of urban parks
b) Adopting Miyawaki Urban Forestry method
c) Transplanting trees with the help of tree transplanter machines
d) Setting up of floating gardens, butterfly gardens etc
e) Initiate afforestation activities on wastelands and fallow lands
f) Plantation along village roads can be taken up under MGNREGS
g) Development of green belt along the major terrain roads and surrounding the industrial areas
h) Making the Tree Census data available to the public.
Medium to long-term
Policy framework is available (section 6.1.5.1)
Requires capital investment
Research collaboration and inter-departmental cooperation are required
As per the FSI report 2019, Gujarat has 11,984 sq km of ‘trees outside the forest’, which includes forest cover outside the recorded forest area/green wash and tree cover.
Miyawaki Urban Forestry method has reported 15% faster growth per year compared to other reforestation methods. Oxygen Park has been developed by adopting Miyawaki method in the Science City on Ahmedabad-Gandhinagar highway.
Green belts help mitigate air pollution, increase urban green cover, thereby leading to carbon sequestration.
The Tree Census reports of Gujarat are in public domain only till 2013.
Enhance forest cover by promoting agro-forestry and social forestry to increase forest biomass and soil moisture.
a) Control illegal timber trade
b) Carry out mapping of agroforestry area to monitor the coverage
c) Create provisions of financial instruments/relaxation in other taxes (over and above the existing schemes) to encourage farming community to adopt agroforestry
d) Encourage plantation of most found local, fast-growing species, particularly key stone species, fodder trees, fruit bearing trees, like, peepal (Ficus religiosa), neem (Azadirachta indica), etc. to aid increase of tree density.
Medium to long-term
Policy framework and budget is available, implementation is required
Stringent monitoring and evaluation are necessary
Currently, the forest area in Ahmedabad district is only 1.62% of its total geographical area. If 7% of its geographical area (equivalent to state average forest cover) is converted to green cover, over a period of 10 years, 8.47 million tonnes of CO2 emissions can be avoided.
Ahmedabad has ‘poor tree density’ i.e., below 10 trees/ha as the tree cover has not improved due to development works.

71Recommendations
RecommendationsCross-cutting with
Qualifying priority
District scenario/case examplesTimeframe for the action to be accomplished
Framework for implementation
Ensure ULBs regularly monitor survival of the trees, post plantation.a) Undertake thorough
study on the suitability of the site and survival ratio of species (majorly native species) before initiating any plantation drive
b) Prepare an audit every year on the number of saplings that survive after plantation drives
c) Ensure geo-tagging of trees (along with site and species) for proper monitoring.
Short to medium-term
Monitoring and evaluation required
Collaboration among different stakeholders is needed
The current survival ratio of the plantation drives is 30-40% within AMC and is lower outside the AMC limits.
Promote regeneration of degraded and open forest areas by developing awareness among locals on the importance of green spaces.
Long-term
Strengthen the existing policy framework
Needs collaboration among different stakeholders
In Ahmedabad circle, 1,181 ha area is under Concentrated Regeneration (as per the Annual Administration Report, Forest Dept., GoG)
Various aspects of joint forest management (JFM) need to be promoted
a) Capacity building and skill development of JFM committees in tribal and non-tribal areas by conducting workshops and training
b) Initiate participatory forest management programs at micro scale.
Short to medium-term
Exclusive communication strategy and information, education and communication (IEC) material to be developed and used
Provisions of monetary support

72 Climate Change and Environment Action Plan for Ahmedabad District
RecommendationsCross-cutting with
Qualifying priority
District scenario/case examplesTimeframe for the action to be accomplished
Framework for implementation
Prevent invasion of non-indigenous species
a) Develop a database and update information on invasive species and their management
b) Raise awareness at regional levels
c) Strengthen and maintain institutions to coordinate invasive species programmes.
Medium to long-term
Undertake research on flora specific to the region
Exclusive communication strategy and IEC materials to be developed and used
Requires funding, monitoring and evaluation, stakeholder collaboration
Prosopis juliflora, Lantana camara, Parthenium hysterophorus are some major invasive species in Gujarat.
Preventing seed production helps in managing spread of invasive species. Removing flower heads prior to seed set will reduce the number of seeds available for spread by birds or other animals. 30
Develop participatory forest fire management strategies such as:
a) Collecting baseline forest fire data in respect to perceptions, beliefs, expectations and behaviour of local people with regard to forest fires
b) Training local communities to tackle forest fires
c) Organising awareness programmes in local schools
d) Building capacities to develop an early warning system.
Medium to long-term
Provisions of monetary support
Exclusive communication strategy and Information, Education and Communication (IEC) material to be developed and used
Monitoring and evaluation required
Requires collaboration among different stakeholders
According to FSI Report, 2019, about 6.39% of the total forest cover in Gujarat is categorised as high to extremely fire prone.
30 Solanki H.A., 2018, Checklist of invasive plants of Gujarat and some most insidious plants of Gujarat, their hazards, its management and public perspective.

73Recommendations
6.1.5.1 AFOLU: Policy framework and concerned departments/agencies
Sectors Policies and programmes that can push forward the recommendation
Primary departments/agencies
Supporting departments/agencies
Agriculture
1) Rashtriya Krishi Vikas Yojana: Remunerative Approaches for Agriculture and Allied Sector Rejuvenation (RAFTAAR)
2) National Mission for Sustainable Agriculture
3) Pradhan Mantri Krishi Sinchayee Yojana
4) PM KUSUM Yojana5) Soil Health Card6) National Mission on Food
Security7) National Mission on Micro-
irrigation8) Price Support Scheme9) AGR 2 (Farm Mechanisation)
scheme of farmers other than SC/ST
10) National Policy for Crop Residue Management
11) Suryashakti Kisan Yojana 12) Dinkar Yojana
Agriculture, Farmers’ Welfare and Co-operation Department, Government of Gujarat
1) Gujarat Green Revolution Company (GGRC)
2) Rural Development Department, GoG3) Irrigation Department, GoG4) Energy and Petrochemicals
Department, GoG5) GEDA6) Animal Husbandry Co-operation7) Gujarat Water Resource Development
Corporation (GWRDC)8) Climate Change Department (for
reporting), GoG9) Forests and Environment Department,
GoG10) GNFC, GSFC11) Commissionerate for Cottage and Rural
Industries12) Gujarat Agro Industries Corporation
(GAIC)13) Anand Agriculture University14) APMCs15) Proposed District level Committee on
Climate Change and Environment 16) Gujarat Urja Vikas Nigam Limited
(GUVNL)
Livestock
1) National Livestock Mission2) Rashtriya Gokul Mission3) Kisan Credit Cards to Livestock
farmers4) National Programme for Dairy
Development5) Livestock Health and Disease
Control6) National Programme for Dairy
Development7) Intensive Cattle Development
Programme8) National Mission on Food
Security9) Rashtriya Krishi Vikas Yojana
Animal Husbandry Department, GoG
1) Forests and Environment Department, GoG
2) Agriculture, Farmers’ Welfare and Co-operation Department, GoG
3) Climate Change Department, GoG
Forestry and Green Spaces
1) National Afforestation Programme (NAP)
2) Project Tiger3) Compensatory Afforestation
Fund Management and Planning Authority (CAMPA)
4) Green India Mission (GIM)5) Integrated Development of
Wildlife Habitat (IDWH) 6) Intensification of Forest
Management Scheme (IFMS)7) Pradhan Mantri Ujjwala Yojana
Gujarat Forest & Environment Department, GoG
1) Agriculture, Farmers’ Welfare and Co-operation Department, GoG
2) Climate Change Department, GoG3) All ULBs (AMC + other Municipalities)4) AUDA5) Industries & Mines Department, GoG6) UDD & RDD7) All PRIs

74 Climate Change and Environment Action Plan for Ahmedabad District
6.1.6 Waste management: Recommendations, cross-cutting sectors, qualifying priority and district scenario
Recommendations Cross-cutting with
Qualifying priorityDistrict scenario/ case examples
Timeframe for the action to be accomplished
Framework for implementation
Solid waste
Waste prevention: Reducing landfilling
Minimise landfill waste disposal by: a) Promoting waste reduction
at source through measures such as product reuse, lifetime extension (maximum use of resources) and putting in place consumers’ right to repair
b) Ensuring efficient and 100% segregated waste collection from across the district (both urban and rural) by distributing colour-coded bins, monitoring waste collected from household and penalising households that do not segregate waste
c) Ensuring and maximising recycling, recovery, optimum resources utilisation throughout the product lifecycle and treatment
d) Promoting resource efficiency and circular economy practices across sectors.
a) Medium to long- term
b) Short to medium-term
c) Medium-termd) Long-term
a) Needs policy intervention, awareness generation, incentivisation
b) Policy framework exists (section 6.1.6.1);
c) and d) Need policy intervention and execution (Resource Efficiency Policy drafted by NITI Aayog but not implemented as of now)
Landfills are one of the largest anthropogenic source of methane emissions contributing to 11% of all global CH4 emissions. Hence, reducing landfill load and emissions is critical in achieving India’s NDCs. Here are some initiatives adopted by Ahmedabad (mostly the city area) which can be undertaken for the district as well:
Waste collection efficiency is reported to be 100% within AMC.
AMC has an SWM Master Plan (2031) for becoming a ‘zero waste’ city.
AMC has a waste to energy (W2E) plant functioning with 1000 TPD waste to 14 MW energy capacity, another W2E plant is coming up at Pirana with a capacity of converting 1000 TPD waste to 11 MW energy.
AMC has initiated a biomining project at the Pirana dumping ground with 36 trommels installed currently, each having 300 TPD waste processing capacity since 2019. This will reduce the landfill legacy waste and emissions.
A compressed biogas plant is also being set up in Ahmedabad.

75Recommendations
Recommendations Cross-cutting with
Qualifying priorityDistrict scenario/ case examples
Timeframe for the action to be accomplished
Framework for implementation
Minimise single use plastic (SUP): detailed information and recommendations on SUP are given in section 6.1.6.2.
Short to medium-term
Already a national priority
Policy framework exists (section 6.1.6.2)
Disposable SW take-back has not been implemented in Gujarat as of now.
25% of the total waste generated in Ahmedabad is inert waste and 23% is paper waste, and much of this can be treated/recycled, resulting in a huge landfill waste reduction.
Currently, 300 TPD construction and demolition (C&D) waste is being treated in AMC.
One material recycling facility (MRF) is coming up in Gyaspur (100 TPD).
Implementing producers (manufacturer/brand owners, etc). take-back mechanism (SWM Rules, 2016) either through financial assistance by the producers or a defined collection system facilitated by the producers for disposables, like tin, glass, plastics packaging, sanitary napkins and diapers, for efficient management of these waste materials, thereby reducing landfill inert waste load.
Short to medium-term
Mandated by the MSW Rules (2016) District level policy formulation and interventions required
Ensure 100% recycling of recyclables at landfill through material recycling facilities (MRFs), refuse derived fuel (RDF), waste to energy, etc.Encourage use of LDPE and HDPE plastic waste in road construction.31
Short to medium-term
Capacity enhancement of existing facilities
Management of construction and demolition (C&D) waste: a) Ensure segregation, collection,
transport and proper management
b) Facilitate processing and recycling facility
c) Incentivise initiatives for C&D waste reuse in non-structural concrete, paving blocks, lower layers of road pavements, colony and rural roads
d) Mandatory procurement of C&D materials (10% to 20%) in municipal and government contracts (subject to quality control).
Short to medium- term
Mandated by the SWM Rules
CPCB guidelines exist (section 6.1.6.1)
Implementation and enforcement required
Investment in infrastructure required
Increasing consumer awareness and access to recycling facilities and repair options within the district.
Short to medium-term
Dedicated campaign required
Education and awareness drives for 100% at source segregation of biodegradable, non-biodegradable, domestic hazardous and household biomedical wastes
Short-termDedicated campaign required
Segregation of domestic hazardous waste and household waste is not practiced in the district.
31 Guidelines given by Indian Roads Congress in this regard can be followed. https://pib.gov.in/PressReleasePage.aspx?PRID=1736774

76 Climate Change and Environment Action Plan for Ahmedabad District
Recommendations Cross-cutting with
Qualifying priorityDistrict scenario/ case examples
Timeframe for the action to be accomplished
Framework for implementation
Introduce fiscal instruments to encourage waste reduction, such as, mandatory carry bag charges, pay-per-bin schemes (charging residents for each community refuse bin).
Short-term
Needs district-level scheme/notification and community participation
About 10-15 percent of global GHG emissions could be reduced through improved waste management, following a lifecycle assessment approach (Global Waste Management Outlook - UNEP/ISWA, 2015). Prevention and recovery of waste (as secondary material or energy) can significantly save GHG emissions from across the sectors of the economy including energy, forestry, agriculture, mining, transport and manufacturing.
Conduct behavioural change communication workshops targeting corporates, educational institutes, PSUs, government offices to influence behaviour at both individual and organisational level to better manage resources and reduce waste generation. For example, conducting weekly workshops at all public schools for waste reduction and recovery. These workshops can also address issues such as, energy efficiency and water conservation.
Short-term and continuous
Needs sustained campaign for the target groups
Consumer awareness for demand-side management of product choices with: a) sustainable packaging, b) displayed higher product
lifespan, c) displayed recycling/resource
recovery efforts and information.
Short-term and continuous
Dedicated campaign required
Conduct waste audits at household level, corporate offices, institutes etc. to identify scope of waste minimisation and promote the same as an evidence-based practice.
Short to medium-term
Needs research collaboration
Ensure segregation, collection and treatment of sanitary waste (sanitary napkins and diapers) to reduce landfill load.
Short to medium-term
Mandated by the SWM Rules, 2016
Capital investment in infrastructure development (for treatment) is required, which can be obtained from the producers
Sanitary waste segregation and treatment is currently not practiced in the district.

77Recommendations
Recommendations Cross-cutting with
Qualifying priorityDistrict scenario/ case examples
Timeframe for the action to be accomplished
Framework for implementation
Transitioning the district to a Green Market approach by: a) promoting local circular
business modelsb) mainstreaming alternative
sustainable business models for the consumers to have a basket of choices.
Medium-term and continuous
Needs alternative business models, collaborations and awareness
Reduce emissions from waste transportation: a) Encourage shifting to electric
or zero emission vehicles (ZEVs) for all kinds of waste transport, including municipal solid waste (in all ULBs), bio-medical waste in all common bio-medical waste treatment facilities (CBWTFs) and hazardous waste in all treatment, storage and disposal facilities (TSDFs).
b) Installation of waste bins with sensors to monitor volume and optimise the routes of collection vehicles to reduce consumption of fuels for waste transport and related emissions.
Medium to long-term
Needs capital investments
AMC has 1,500 vehicles/equipment engaged in SWM. Out of this, 600 small vehicles and 130 heavy vehicles used for primary and secondary transport of SW with significant transport emission potential can be converted to ZEVs.
Though several specifications exist for CBWTF vehicles to ensure efficient management and monitoring of BMW, it does not consider emissions reduction from transport.
Reduced land�ll loadLand�ll emissions can be reduced
through
Reduced wasteCH4 Resource recovery Reuse/repair
Waste segregation
Waste treatment Recycling

78 Climate Change and Environment Action Plan for Ahmedabad District
Recommendations Cross-cutting with
Qualifying priorityDistrict scenario/ case examples
Timeframe for the action to be accomplished
Framework for implementation
Waste treatment - composting
Ensure 100% conversion of organic waste to biological waste processing (composting, bio-gas, etc.).
Short to medium-term
Policy framework exists (section 6.1.6.1),
Needs awareness and infrastructure
Organic treatment of compostable waste initially leads to emissions but reduces GHG emissions drastically in the long run as compared to landfill emissions. It takes at least three decades of landfill emissions to balance with those from aerobic composting.
Several best practices and technologies are available for reducing GHG emissions from composting. Even in the absence of a gas management system, composting is a more environmentally sustainable practice as opposed to methane capturing from landfilling of organic waste. Composting also avoids multi-layered pollution potentials and reduces landfill loads.
Composting emission potential (for 39.5 TPD reported by GPCB AR): 1,211 tCO2e/year No gas management system at composting units.
Composting with gas management of 100% organic waste going to landfill can reduce emission by 46,081 tCO2e./year in Ahmedabad.
Develop composting facilities at ULB level in addition to cluster level to: a) avoid loss of carbon content
in long route organic waste transport; and
b) reduce emissions from waste transport vehicles.
Medium-term
Needs land and infrastructural investment at ULB level
a) Equip new composting units and upgrade/convert existing composting units with gas management systems for gas capture after conducting feasibility studies.
b) Biomethane produced from wastewater and solid waste processing can be used as a fuel for industrial production, to provide energy services in buildings or as a transport fuel. A benefit of biomethane is that existing gas infrastructure can be utilised for transport and distribution. As a local, sustainable source of power and heat, biomethane offers communities and municipalities a flexible option that can contribute to lowering emissions.
Long-term
Needs policy intervention,
Needs district level capital investment
Research collaboration required

79Recommendations
Recommendations Cross-cutting with
Qualifying priorityDistrict scenario/ case examples
Timeframe for the action to be accomplished
Framework for implementation
Emission profiling and reduction
Facilitating research and documentation on characteristics and percentage share of waste, moisture content, localised BODs for domestic wastewater and industrial wastewater, etc. is important for accurately estimating city or district level emissions from the waste sector.
Short-term Needs research collaboration
Ensure better compliance to the waste management rules in terms of maintaining segregated waste collection and treatment data (solid waste, bio-medical waste, e-waste and hazardous waste) in the public domain (annual reports/websites), particularly at the district level.
Short-term and continuous
Policy framework exists in most cases (section 6.1.6.1)
Bio-medical waste and hazardous waste
Promote installation of modern incinerators with energy-recovery facilities (like, use of recovered heat for preheating of waste to be burnt or use of incinerator steam to generate electricity) for new common bio-medical waste treatment facilities (CBWTFs) and upgradation of the existing ones Using smart controls, waste treatment plants equipped with energy recovery incineration facilities can be integrated as distributed energy sources into the electricity grid and as heat sources into the district energy network.
Long-term
Needs policy formulation and investment in infrastructure
Incineration is not recommended due to its emission potential. However, to prevent manual scavenging and further contamination from certain kinds of infectious waste (particularly the anatomical, contaminated waste, discarded medicines and chemical waste), incineration is the recommended practice in India.
TSDFs within the Ahmedabad district are shut and have been shifted out of the district. However, hazardous waste from the district gets incinerated elsewhere.
Strict monitoring of adherence to recommended incineration technologies and practices through regular monitoring by District Bio-medical Waste Management Monitoring Committee.
Short-term and continuous
Mandated by the BMWM Rules (section 6.1.6.1) Needs monitoring by district level BMWM committee
Ensure 100% segregation, collection and treatment of bio-medical waste through coverage and registration of all healthcare facilities with CBWTFs.
Short-term and continuous
Mandated by the BMWM Rules (section 6.1.6.1)

80 Climate Change and Environment Action Plan for Ahmedabad District
Recommendations Cross-cutting with
Qualifying priorityDistrict scenario/ case examples
Timeframe for the action to be accomplished
Framework for implementation
Waste electrical and electronic equipment (WEEE)
As per the provisions of the E-waste Management Rules, 2016, a state level e-waste inventory with district level category-wise e-waste generation information needs to be developed.
For Ahmedabad district, the existing inventory (by GEMI for Ahmedabad city) can be extrapolated with inclusion of fluorescent and mercury containing lamps.
Short to medium-term
Mandated by the rules (section 6.1.6.1)
Research collaboration required
About 95% of e-waste in India is processed informally (including rudimentary operations like open burning, acid wash, open smelting, etc.)
City-based studies show efficient management and recycling of electrical and electronic waste (WEEE) can significantly contribute to emission reduction targets.
Ensure stringent policy implementation: Trace informal routing, ensure copper collection restrict informal processing of e-waste (open burning, metal smelting, etc.), ensure proper disposal of electrical waste (lighting infrastructure, including mercury containing lamps).and strict monitoring to stop landfilling of the same
Short-term and continuous
Mandated by the rules (section 6.1.6.1)
Needs monitoring manufacturer collaboration and consumer awareness
Tapping into the informal e-waste collection network and formalisation of the same to channelise e-waste disposal to the formal sector.
Short to medium-term
Can be achieved through the producers/recyclers/producer responsibility organisations (PROs)
According to an e-waste inventory prepared by GEMI, Ahmedabad city is projected to generate an annual WEEE amount of 17,004 MT from consumers and 11,213 MT from bulk consumers by 2025. However, this inventory estimation does not consider all categories of WEEE. Most of the current e-waste generated in the district is routed informally.
There are three formal e-waste recycling industries in Ahmedabad.
Improve consumer awareness on responsible e-waste disposal and make information available on e-waste collection points, recyclers, producers (manufacturer), producer responsibility organisations or e-waste collection drives at the district level.
Short-term and continuous
Mandated by the rules for the producers (section 6.1.6.1).
Dedicated campaign required, can be achieved through collaborating with producers

81Recommendations
Recommendations Cross-cutting with
Qualifying priorityDistrict scenario/ case examples
Timeframe for the action to be accomplished
Framework for implementation
Formulation of district level e-waste management programmes.
Short to medium-term
Needs inter-departmental collaboration
Wastewater: Domestic and industrial
Achieve 100% domestic wastewater treatment through:
a) In both urban and rural areas of the district set up 100% closed and underground sewer collection network.
b) Shift 100% domestic wastewater treatment (STP) to aerobic setups by having only aerobic STPs for new constructions and transitioning of old anaerobic STPs to aerobic setup
c) Regular maintenance of sludge removal facilities of all STPs. The sludge can be used again for the bio-methanation of compost
Medium to long- term
Policy intervention and capital investment required
Wastewater, if treated anaerobically, can be a huge source of methane and even nitrous oxide emissions. Open sewers (being stagnant and subject to heating cause), anaerobic conditions to emit CH4. Closed underground sewers are an insignificant source of CH4.
AMC has 9 STPs (3 anaerobic, 6 aerobic with capacity of 1075 MLD), 45 sewage pumping stations and 2,500 km sewerage network accounting for 60% to 70% of the AMC area.
The Comprehensive Development Plan for 2021 by AUDA proposes to cover the entire AMC along with fringe areas to meet an estimated requirement of 1627 MLD by 2031 through 2 new STPs, 22 new sewage pumping stations and an additional sewerage network of 154.21 sq km within AMC, 106 sq km within AUC and 55 sq km within growth centres.
Development of rural wastewater disposal and treatment plan for the district.
Medium to long- term
Requires capital investment and inter-departmental collaboration.
Create appropriate connecting infrastructure for the industries to utilise treated industrial and domestic wastewater.
Provide subsidy/tax rebate to industries, healthcare, hospitality sectors for implementation of smart, recycled water investments.
Medium to long-term
Policy implementation required
Needs capital investment in infrastructure and technology upgradation

82 Climate Change and Environment Action Plan for Ahmedabad District
Recommendations Cross-cutting with
Qualifying priorityDistrict scenario/ case examples
Timeframe for the action to be accomplished
Framework for implementation
Implement and operationalise the guidelines and regulations of the National Policy on Faecal Sludge and Septage Management, 2017 to reduce emissions from faecal sludge. Regular collection and appropriate disposal of sludge needs to be ensured.
Medium to long-term
Needs ULB level implementation and capital investment in infrastructure
Extension of network coverage and STPs of combined capacity of 20.9 MLD are under installation (AUDA-GWSSB) in Dhandhuka, Kharej, Viramgan and Babla.
No information is available on rural sewerage coverage and treatment.
100% closed and underground sewer connection and centralised aerobic well-managed STPs can potentially reduce 538,963 tCO2e emissions from STPs to negligible in Ahmedabad.
AMC has set up the first sewage sludge hygienisation plant in the country at Pirana (operational from 2019), which can convert 100 tonnes of dry sludge into fertiliser per day.
Develop a policy mandate for data transparency and availability of waste and wastewater generation, treatment and discharge information for the industrial sector.
Medium to long-term
Needs policy intervention
Inter-departmental collaboration required
Encourage data transparency by the industries for wastewater generation, treatment and discharge information including those of CETPs.
Short to medium-term
Needs collaborative efforts
Data transparency on wastewater generation by industries is key to reducing water pollution, which can be achieved through ratings based on emission and effluent discharge and the treatment done by them.
For example, under its Star Rating Programme, the Odisha State Pollution Control Board gives star rating to industries and presents it through their website. This can help in environmental compliance and encourage public participation.

83Recommendations
6.1.6.1 Waste management: Policy framework and concerned departments/agencies
Sectors Policies and programmes that can push forward the recommendation
Primary departments/agencies
Supporting departments/agencies
Solid waste 1) Solid Waste Management Rules, 2016 & Amendment, 2018
2) Plastic Waste Management Rules, 2016 and Ammendment Rules, 2021
3) Construction & Demolition Waste Management Rules, 2016
4) Integrated Solid Waste Management Project
5) Swachh Bharat Mission - Urban & Rural
6) Ahmedabad District Urban Development Plan, 2021
7) Ahmedabad Smart Cities Mission8) National Resource Efficiency Policy
(draft)9) Guidelines on Environmental
Management of C&D Waste Management in India, CPCB
10) GPCB Annual Report
1) Urban Development and Urban Housing Department, GoG
2) All ULBs, 3) Panchayats, Rural
Housing & Rural Development Department, GoG
4) All Gram Panchayats5) Gujarat Pollution
Control Board (GPCB)
1) Ahmedabad District Administration & the proposed District Level Climate Change & Environment Committee
2) Gujarat Urban Development Company Ltd (GUDC)
3) Climate Change Department, GoG
4) Forest and Environment Department, GoG
5) Ahmedabad Urban Development Agency (AUDA)
6) District Rural Development Agency (DRDA) – Ahmedabad
7) Community or residential associations
Bio-medical waste and hazardous waste
1) Bio-medical Waste Management Rules, 2016
2) Hazardous and Other Waste (Management & Transboundary Movement) Rules, 2016
3) Batteries (Management & Handling) Rules, 2001
4) GPCB Annual Reports (for data availability)
5) Revised Guidelines for Common Bio-medical Waste Treatment and Disposal Facilities, 2016, CPCB
Research funding can be obtained from Department of Forest and Environment, GoG, Climate Change Department, GoG, GPCB, etc.32
1) GPCB2) Ahmedabad district
administration and the proposed District Level Climate Change and Environment Committee
3) Healthcare facilities4) CBWTF
Waste-electrical and electronic (WEE)
1) E-waste Management Rules, 20162) Implementation Guidelines for3) E-Waste (Management) Rules, 2016,
CPCB
Only implementation, monitoring and research needs resources which can be obtained from the Department of Forest and Environment, GoG, Climate Change Department, GoG, GPCB, etc.33
1) GPCB 2) Ahmedabad district
administration and the proposed District Level Climate Change and Environment Committee
3) Electronic and electrical manufacturers/brand owners, producer responsibility organisations
32 Bio-medical and Hazardous waste management is profitable and not funded by Government except for providing the land, which generally are the Industrial Development Corporation lands
33 E-waste management (collection, transport, disposal, treatment – dismantling or recycling) is profitable and is the responsibility of the producers, recyclers, producer responsibility organisations (PROs).

84 Climate Change and Environment Action Plan for Ahmedabad District
Sectors Policies and programmes that can push forward the recommendation
Primary departments/agencies
Supporting departments/agencies
Wastewater: Domestic
1) Atal Mission for Rejuvenation and Urban Transformation (AMRUT)
2) Jawaharlal Nehru National Urban Renewal Mission (JNNURM)
3) National River Conservation Plan4) Integrated Urban Sanitation
Programme5) Swachh Bharat Mission (Urban) –
Gujarat6) Swachh Bharat Mission (Rural) –
Gujarat7) Ahmedabad Smart City Mission8) Ahmedabad District Development
Plan
1) Urban Development and Urban Housing Department, GoG
2) Gujarat Urban Development Company Limited (GUDC)
3) Gujarat Water Supply & Sewerage Board
4) All ULBs5) Panchayats, Rural
Housing & Rural Development Department, GoG
1) AUDA 2) Commissionerate of Rural
Development3) District Rural Development
Agency (DRDA)4) Ahmedabad Smart City
Development Corporation5) All gram panchayats
Wastewater: Industrial
1) Common Effluent Treatment Plant System
2) Online Continuous Emission Monitoring System
3) GPCB Annual Report
1) Gujarat Pollution Control Board (GPCB)
2) Gujarat Industrial Development Corporation (GIDC)
1) Industries and Mines Department
6.1.6.2 Single-use plastics (SUPs) – critical to replace
Definition• SUPs are often referred to as disposable plastics and are commonly used for plastic packaging. They include items
intended to be used only once before they are thrown away or recycled, such as grocery bags, food packaging, bottles, straws, containers, cups and cutlery (UNEP).
Concerns• Since SUPs are made for single use, they increase waste load and are resource intensive.
• SUPs often get out of the collection and treatment network and a) are one of the biggest ocean polluters and are ingested by aquatic animals; b) stay in the environment forever, leading to microplastic pollution; and c) block waterways and intensify natural disasters.
• They have high carbon footprint and cost for collection, transport and treatment/recycling requirement.
• SUPs release harmful toxic chemical additives at their end-of-life disposal (unscientific) and further contaminate soil, water and the food chain.
Single use plastic

85Recommendations
Easily replaceable SUP, their alternatives and key user industries
SUPs Type of plastic majorly used
Key user industries
Alternatives Pros and cons of various alternatives
Polythene Bags Low Density Polyethylene (LDPE)
Fast Moving Consumer Goods (FMCG)
Cotton bags, jute bags, bio-plastics
Glass • Pros: Inert, infinitely recyclable, no toxic chemical additives, low manufacturing carbon footprint
• Cons: Fragile, higher cost, injury and health risk, weight
Cloth (cotton) • Pros: Natural fibre, durable, reusable, biodegradable, profitable and non-food crop
• Cons: High consumption of chemical fertilisers and pesticides in cotton farming, high cost, water intensive crop, not moisture resistant, needs to be reused many times to offset high degradation/recycling carbon footprint
Metal • Pros: Renewable resource, durable, can be recovered and infinitely recycled
• Cons: Expensive, higher transportation carbon footprint, tin-coated steel can leach into food and contaminate, heat conductor
Bioplastics • Pros: Bio-degradable, moisture resistant, inexpensive, light-weight
• Cons: Contains significant number of plastic polymers leading to microplastic pollution; needs commercial composting facility to degrade; can mistakenly be mixed with plastic recyclables in municipal solid waste; needs quality check and control
Jute • Pros: Natural fibre, durable, reusable and biodegradable, high carbon assimilation rate
• Cons: Expensive, water-intensive crop, highly dependent on rainfall, product not moisture-resistant
Paper • Pros: Bio-degradable, low manufacturing cost, can be made from recycled paper
• Cons: Water intensive, high carbon footprint, not durable, not moisture resistant
Plastic packaging
a) Food packagingb) Insulated food
packaging, fragile item protective packaging
c) Multi-layered packaging (chips, biscuits, noodle, etc)
d) Packaging for online delivery
a) LDPEb) Expanded
Polystyrene (EPS)c) Paper + foil +
LDPE/ PE + foil + paper/ Polyethylene Terephthalate (PET) + foil + LDPE, etc.
d) LDPE
FMCG (food & beverages), hospitality and e-commerce
Bio-plastics, recycled paper
Plastic bottles, tubes for household, personal care and cosmetics, sanitisers, toiletries, etc.
High density polyethylene (HDPE)
FMCG (personal care and cosmetics products /PCCP), food, household and toiletries, beauty,hospitality
Glass, metal (tin-plated steel, aluminium), Bamboo, pottery and other ceramics
Plastic sachet LDPE FMCG, (food & beverages, PCCP), hospitality
Cellophane/ another bio-degradable alternative
Styrofoam products (plates, tray, cups)
Expanded polystyrene (EPS)
-- Bioplastic, recycled paper, leaf, bamboo
Biscuit tray, plastic box, air seal for food etc.
Polypropylene (PP) FMCG (food & beverages), hospitality
Bioplastic
Plastic water and other drink bottles
Polyethylene terephthalate (PET)
Hospitality, FMCG (food & beverages)
Glass, metal, ceramics, bulk vending
Plastic cutlery, plates, cups, and stirrers
Polystyrene (PS) Hospitality Bioplastic, recycled paper, steel
Plastic ‘use and throw’ pens
Polypropylene (PP) FMCG (stationary) Paper, bamboo, refillable pens
Straws, stirrers, balloon sticks
Polypropylene (PP) FMCG (stationary) Bamboo, recycled paper
Milk packets LDPE FMCG (food & beverages), Hospitality
Tetra Pak, bottling and bulk vending
Face shields Polycarbonate and polyester (PET)
Healthcare Compostable/bio-degradable face shield
Sticks of cotton buds -- FMCG (PCCP) Recycled paper, other eco-designed materials, bamboo
Cigarette butts Cellulose acetate Tobacco industry --
Freezer bags LDPE Hospitality, healthcare, R&D
Glass container, sealable stainless steel

86 Climate Change and Environment Action Plan for Ahmedabad District
Microplastics
• Definition: Microplastics are defined by UNEP as solid phase materials, particulates < 5mm, water insoluble, non-degradable and made of plastic. The European Commission defines them as man-made, conventional plastics including bio-degradable plastics, bio-based analogue plastics and bio-based alternative plastics with a particle size below 5 mm and include nanometer-sized plastics as well (nanoparticles).
• Major sources: a) vehicle tyres b) fishing gear, rope, painting and maintenance of ships and boats c) loss from plastic manufacturing industries d) painting, construction and road marking e) fibres from synthetic textile f) microbeads in personal care and cosmetic products g) breakdown of plastic products.
• Out of these sources, intentionally-added microbeads in cosmetics and personal care products are ‘designed to drain’ SUPs. Replacement of microbeads in PCCPs come under central regulation. However, at a district level, consumer awareness can make a change through shifting of demand to sustainable alternatives.
Regulatory provisions in India for single-use plastics
• Plastic Waste Management (Amendment) Rules, 2021 (announced on March 11, 2021): a) The manufacture, import, stocking, distribution, sale and use of the SUP commodities: Ear buds with plastic sticks, plastic sticks for balloons, plastic flags, candy sticks, ice-cream sticks, polystyrene (thermocol) for decoration shall be prohibited from January 1, 2022, b) The manufacture, import, stocking, distribution, sale and use of the SUPs (including polystyrene and expanded polystyrene) items – plates, cups, glasses, cutlery such as forks, spoons, knives, straw, trays, wrapping/packing films around sweet boxes, invitation cards, and cigarette packets, plastic/PVC banners less than 100 micron, stirrers – shall be prohibited from July 1, 2022.
• Plastic Waste Management Rules, 2016 and Amendment Rules, 2018: a) Puts the onus on the producers, through extended producer responsibility (EPR), to collect plastic waste either individually or through the concerned local body, b) The primary responsibility is on producers, importers and brand owners (who introduce the products in the market) to collect used multi-layered plastic sachet, pouches and other packaging, c) Manufacturing and use of multi-layered plastic, which is non-recyclable or non-energy recoverable or with no alternate use, should be phased out in two years.
• Solid Waste Management Rules, 2016: a) Introduces EPR for manufacturers or brand owners of disposable products (including plastic packaging, sanitary napkins and diapers) to provide financial assistance to local authorities for waste management system and to set up a collection/take back system for packaging waste.
• Different policy frameworks for SUP ban or restrictions (of different kind) exist in at least 23 states and five union territories of India. Gujarat does not have any policy directive at state level as of now. AMC has banned plastic cups, water pouches, paan masala polythene in 2018. AMC notified plastic waste management bylaws in December 2018.
Recommendations34
• Implement the ban (as specified by the Plastic Waste Management Amendment Rules, 2021) on manufacture, import, stocking, distribution, sale and use of the single use plastic.
• Formulate policies with provisions to: a) mandate producer responsibility for awareness, labelling requirement on disposal, clean-up, collection and treatment of SUP products/packaging, b) mandate collection target (can be a differential target for different products) for SUP producers as part of EPR, c) penalise consumers for accepting banned SUP carrier bags or products, d) strict and random monitoring for implementation of bans in supermarkets, street vendors, shopping malls, large organised markets, etc, e) gradual phasing out of other selected categories of SUP products (by granting the producers some transition time). The phasing out can be achieved by sensitising key producers and sectors and encouraging them to take voluntary action.
• Promote eco-friendly alternatives to SUPs through: a) identifying alternative sustainable products, b) identifying micro-enterprises and cottage industries for the products, c) integrating them into the mainstream business models through connecting/cross-cutting policies, d) providing financial incentives for the alternative industries and for integrating sustainable products into mainstream business models, such as in the hospitality industry,
34 Note: A sustainable solution to SUP products needs both state and district level collaborations at all levels including policy formulations and implementations UNEP. 2018. Single use plastics: a roadmap for sustainability. Available at http://www.indiaenvironmentportal.org.in/files/file/singleUsePlastic_sustainability.pdf Toxics Link. 2020. Single use plastic, the last straw: a watershed moment in the anthropogenic era. MoEF&CC. 2016. Solid Waste Management Rules, 2016. MoEF&CC. 2018. Plastic Waste Management (Amendment) Rules, 2018

87Recommendations
e) strict quality control and certification requirement for plastic-free alternatives (for instance, resin or plastic powder should not be mixed in the product as an alternative).
• Promote extended lifespan and reuse of products (including sustainable ones) through continued and lasting campaigns for ‘No Single Use’ to ensure public participation. Replacing the concept of ‘single use’ is critical as biodegradability or recyclability have ‘time’ and ‘conditions’ (such as energy and water footprint, transport requirement, etc) attached to them.
• Introduce economic incentives/support: a) Invest in R&D to develop alternatives to different SUP products, b) Support technology incubation and stimulate creation of micro-enterprises to drive job creation, c) Introduce livelihood support schemes and/or include special provisions in the existing schemes to accommodate the job loss from plastic industry, d) Tax rebate to alternative models, public-private partnerships, etc e) Incentivise plastic industries for shifting to sustainable alternatives.
6.2 Innovative financing
Recommendations Cross-cutting with
Qualifying priority
District scenario/case examplesTimeframe for the action to be accomplished
Framework for implementation
Promote green municipal bonds to mobilise untapped investments towards green projects, such as RE infrastructure development, waste management etc.
Medium to long-term
Needs policy formulationCollaboration among various stakeholders requiredCreate specific financial instruments
In 2019, AMC issued public bonds (five-year maturity) worth `200 crore, directed towards AMRUT for urban infrastructure development. Gaining massive attention, AMC obtained `1,085 crore worth of subscriptions, with the additional bids being rejected to retain the targeted size at `200 crore.
Voluntary carbon market mechanism can be developed for the district to motivate industries, ULBs and other sectors to lower their emission levels through monetary incentives.
All sectors Medium-term
Need feasibility studies, research and interdepartmental and multi-stakeholder collaboration
Institutional structure needs to be established for the same
Case example: In 2020, Smart City Indore collected carbon credit of around `50 lakh through the city’s two bio-methanisation plants. The gas generated from these plants is used by city buses – City Bus and iBus.
Through these projects, Indore has avoided emissions of 1,70,000 tCO2 since 2019 and generated carbon credits.

88 Climate Change and Environment Action Plan for Ahmedabad District
6.3 Recommendations based on district-specific environmental problems: Recommendations, cross-cutting sectors, qualifying priority and district scenario
RecommendationsCross-cutting with
Qualifying priority
District scenario/case examplesTimeframe for the action to be accomplished
Framework for implementation
Water pollution and scarcity
Conduct assessment and mapping of zone-wise water challenges in the district.
Short-term
Stakeholder and research collaboration required
Gujarat has provided aquifer vulnerability index (AVI) information to Central Ground Water Board and identified areas for mapping.
Prepare a comprehensive district action plan for integrated water resource management with a bottom-up approach.
Establish sustainable and inclusive water governance in the district to develop, implement, evaluate as well as share information on programmes for water resource management in a transparent and inclusive manner with mandatory stakeholder engagement and public participation.
Short to medium-term
Policy intervention required
Stakeholder and research collaboration required
Through Water and Sanitation Management Organisation (WASMO), GoG has presence in all the villages of the state and involves community for in-village water supply network. Their programmes instill community ownership. This initiative can be scaled for urban areas and can be tapped for capacity building of the beneficiaries on efficient water management and conservation.
Implement recommendations given in the Heat Action Plan (for heat alert days), particularly:
a) to settle the suspended road dust,
b) provision of water for cooling, public and institutional distribution,
c) promotion of micro-irrigation,
d) releasing water in canals during summer,
e) ensuring efficient potable water supply,
f) provision of water in reserved/protected forests, zoos for wildlife and human habitations.
Short-term and ongoing
Action plans and studies exist
Policy-level interventions required
Ahmedabad is one of the first cities in India to introduce a Heat Action Plan (AMC and NRDC, 2018) to strengthen response towards heat stress conditions in the city.

89Recommendations
RecommendationsCross-cutting with
Qualifying priority
District scenario/case examplesTimeframe for the action to be accomplished
Framework for implementation
Promote net zero water construction and infrastructure upgradation in urban areas, in alignment with ECBC norms.
Medium-termPolicy level interventions required
Promote rainwater conservation through:
a) renovation of existing rainwater harvesting structures in the old city area (including individual harvesting cisterns)
b) ensuring inclusion of rainwater harvesting in new construction of residential buildings, institutional, commercial centres, and industries in the district, as per building bye-laws
c) Mandatory rainwater harvesting at the upstream to halt run-off and recharge groundwater
Short to medium-term
Policy framework exists
Align with existing regulations
As per the Comprehensive Development Control Regulations, 2017, UD & UHD, GoG, rainwater harvesting is mandatory for all buildings with ground coverage 80 m2 and above.
According to the Gujarat Development Control Regulations, for buildings with area between 500 and 1,500m2, the owner or developer shall have to undertake rainwater harvesting as per the specifications. For buildings with area between 1,500 and 4,000 m2owner/developer has to provide percolation wells with rainwater harvesting system with one percolating well for every 4,000 m2 or part thereof of building unit.
Ensure minimum non-revenue water (NRW), i.e., technical loss due to leakage, seepage or unauthorised use (theft).
Medium-termResearch collaboration required
The average non-revenue water (NRW) across all classes of ULBs in Gujarat ranges between 26% and 34%, indicating that nearly one-third of water is lost in distribution.
One ward – Sabarmati – is losing up to 9.78 million litres of water every year.
Over 42% of the water in the water supply system of Ahmedabad is unaccounted for.
Reducing NRW through leakage repairs can help the district meet the national average of 20% NRW.
Water billing based on water metering rather than fixed charges.
Medium to long-term
Awareness generation and collaboration
Ahmedabad city has already put the water metering system into practice. Since 2016, 2,800 ‘buildings use’ permissions have been given to societies on the condition that they will install water metres.
In 2019, high-precision water meters were installed in two wards of the district on a pilot basis, emulating Rajasthan’s Water Policy.

90 Climate Change and Environment Action Plan for Ahmedabad District
RecommendationsCross-cutting with
Qualifying priority
District scenario/case examplesTimeframe for the action to be accomplished
Framework for implementation
Promote dual-flush systems to reduce water consumption, energy consumption and waste-water generation.
Short to medium-term
Align with the existing policies
Can be implemented as a part of green buildings
As a step towards this direction, UDD has implemented an amendment (through a notification dated March 31, 2018) in the Comprehensive General Development Control Regulation (CGDCR). The inclusion states: “In every water closet or toilet it shall be mandatory to provide double button cistern (dual flush tank)”.
For now, it is mandatory for all new constructions to install dual-flush systems. The initiative can be scaled up by retrofitting in old buildings (starting with government and public buildings).
Prevent dumping of untreated effluent from industries, commercial and residential sector into open water bodies or groundwater.
Short to medium-term
Policy framework available
Strict monitoring and reporting required
Re-use of Treated Wastewater Policy, 2018 mandates that all power plants and large industries within 50 km of a sewage treatment plant must use recycled wastewater to relieve the burden on groundwater and surface water.
Nalsarovar wetland
Promote use of RE-powered sources for recreational activities around the wetland (including lighting, electricity to stalls etc.). RE can be sourced from decentralised solar panels around the periphery of the lake.
Short to medium-term
Sector-specific policy framework is available
Mandate required to ensure compliance
Research and multi-stakeholder collaboration required
Nalsarovar was declared as a Ramsar site on September 24, 2012. Following practices are being undertaken as conservation measures under the Ramsar Convention:
a) The staff of the sanctuary regularly patrols the area to prevent poaching
b) Habitat improvement measures, eco-tourism activities and eco-development activities are undertaken
c) Attempts are being made to reduce people’s dependence on the wetland by providing alternatives
d) Monitoring of water quality of the industry effluents has been proposed
e) Preservation measures of satellite water bodies around the main wetland
f) Ban on fishing, restrictions on movement of human and cattle etc. within the sanctuary area is being undertaken.
Phase out diesel-run boats and introduce RE-based options.
Medium-term
Carrying capacity of the wetland and surrounding ecosystem must be taken into consideration before permitting any new construction /recreational activity around its periphery.
Short-term and continuous

91Recommendations
RecommendationsCross-cutting with
Qualifying priority
District scenario/case examplesTimeframe for the action to be accomplished
Framework for implementation
Demotivate excessive ground water pumping around the wetland. Incentivise rainwater harvesting systems for the nearby resorts/commercial areas/villages.
Short-term and continuous
Restrict direct dumping of untreated domestic solid waste, wastewater (both domestic and industrial) and agricultural run-off in the lakes.
Effective functioning of CETPs, STPs around the wetland must be ensured.
Short to medium-term and continuous
RE-powered aerators can be installed to avoid eutrophication in different pockets of the wetlands.
Short-term
Promote use of native species for any upcoming infrastructure development near wetland habitat to protect native biodiversity.
Short-term and continuous
Promote more focused research on the Nalsarovar wetland biodiversity and its interactions with the habitat, hydrology, soils and landform.
Medium to long-term
Ensure that all the principles/wetland practices according to the Ramsar Convention are followed
Short to medium-term

92 Climate Change and Environment Action Plan for Ahmedabad District
RecommendationsCross-cutting with
Qualifying priority
District scenario/case examplesTimeframe for the action to be accomplished
Framework for implementation
Making brick kilns sustainable
Adopt cleaner kiln technologies like zig-zag kilns and vertical shaft brick kiln (VSBK) to replace fixed chimney bull trench kilns (FCBTKs) and down draught kiln (DDKs).
CO2
Medium to long-term
Needs to be aligned with existing standards
Mandate required to ensure compliance
Capital investment required
Zig-zag kilns appear to be the logical replacement for FCBTKs because of low-capital investment, easy integration with the existing production process and the possibility of retrofitting FCBTKs into zig-zag firing.
Promotion of mechanised coal stoking systems in brick manufacturing.
Medium term
High particulate matter and black carbon emissions in FCBTKs occur during the period of fuel feeding. Continuous feeding of properly sized fuel, using a coal stoker in an FCBTK or a zig-zag kiln can reduce the emissions significantly.
Promote sustainable brick types (eg. clay-fly ash bricks and fly ash bricks). Long-term
Need to generate awareness
Needs to be aligned with existing policies
Market/ demand needs to be generated
Preparing clay-fly ash bricks with around 30% fly ash content (when using black soil) can:
a) prevent consumption of around 30-40 tonnes of alluvial soil or 100-125 tonnes of black soil per lakh bricks, thereby reducing land-degradation and retaining the carbon content in soil
b) save 3-7 tonnes of coal per lakh bricks produced
c) increase the strength of the brick by 30%-40%.
Promote modern RE technologies in brick-making. Also, enhance communication through media engagement and outreach, mass awareness, engaging public, health and academic institutions, stakeholder discussions, etc.
Long-term
Research collaboration needed
Capital investment required
Managing air pollution
Increase the number of continuous ambiant air quality monitoring stations (CAAQMS) to statistically, spatially and temporally represent the mix of sources and range of pollution.
Increase the number of air quality display facilities in public places.
Short to medium-term
Policy framework and budgetary provisions available
Ahmedabad has 1 CAAQMS by GPCB at Maninagar, 10 CAAQMS by SAFAR (Ministry of Earth Sciences) at Navrangpura, Pirana, Rakhiyal, Raikhad, Chandkheda, Bopal, Sattelite, Airport, Lekhwada and GIST City and 14 manual stations operated as per CPCB guidelines under National Air Quality Monitoring Programme (NAMP) and State Air Quality Monitoring Programme (SAMP).
Ahmedabad is categorised as one of the 124 non-attainment cities in India for particulate matter concentration (PM10 & PM2.5) exceeding the prescribed norms by CPCB under the National Clean Air Programme (NCAP) with multiple timelines to clean air.
Increase the modal share of public and non-motorised transportation. Further, promote e-vehicles. (detailed recommendation under Transport Sector).
Medium to long-term
Policy framework available
Need to create awareness
Capital investment required
Inter-departmental coordination
Better traffic management, re-direction of traffic movement, development of multi-layered parking and ban on-street parking within specific perimeters of the multi-layered parking to ensure parking inside the facility.
Short to medium-term
Feasibility studies needed
Implementation of existing rules/policies
Capital investment

93Recommendations
RecommendationsCross-cutting with
Qualifying priority
District scenario/case examplesTimeframe for the action to be accomplished
Framework for implementation
Increase/create green cover or green buffers along the major traffic corridors, roundabouts and industrial areas.
Medium to long-term
Inter-departmental coordination required
Efficient maintenance and monitoring of plantation sites
Major sources for air pollution in Ahmedabad are road dust, vehicular emission, domestic fuel burning, open waste burning, construction activities and industrial emissions.
GPCB has an action plan to control air pollution in Ahmedabad.
A source apportionment study is currently being conducted by GEMI, sponsored by the Department of Forests and Environment.
Union Budget 2020-21 (15th FC report for 2021-2026) has allocated `2,217 crore for 42 urban agglomerations (with million-plus populations) that will be provided as performance-based grants to ULBs to tackle air pollution.
Ahmedabad has three multi-layered parking facilities – one each at Navrangpura (capacity: 250 cars, 350 two-wheelers), Kankaraia (capacity: 400 cars, 200 two-wheelers) and Relief Road (185 cars, 221 two-wheelers) – but operates at much lower capacity. Vehicles are often parked on-street near these facilities.
Enforcement of environmental standards and exhaust fumes for industrial sector.
Short-term and continuous
Robust monitoring and evaluation required
Sprinkling of water (preferably recycled grey water) for road dust suspension during peak pollution episodes.
Short-term and continuous
Inter-departmental coordination required
Open waste burning (of solid waste, biomass, plastic, horticulture waste etc.) should be regulated by the municipal corporations/nagar panchayats.
Short to medium-term
Implementation of existing regulations
Implementation of the action plan for construction and demolition waste (as per the CPCB guidelines).
Short to medium-term
Implementation of existing regulations
Facilitate source apportionment studies to identify the sources and take specific containment measures.
Short to Medium term
Support to enhance the ongoing study (by GEMI)
Ensure installation and operation of air pollution control devices in industries and adhere to emission standards.
Medium to long-term
Implementation of existing rules/regulations
Robust monitoring and evaluation

94 Climate Change and Environment Action Plan for Ahmedabad District
Heat stress in Ahmedabad and Heat-Health Action Plan35
Add
ress
ing
heat
str
ess
Assessment of ground level situation and heat-stress impacts on vulnerable groups in the district
Research on heat impacts on health through extensive epidemiological studies and other adaptation concerns, like impacts on natural resource-based livelihood, water crisis, air pollution, vegetation, forest and wildlife etc.
Creation of an open-source data bank on mortality, morbidity, weather, water consumption, agriculture, power, vegetational impacts etc. to facilitate easy informtion access and better quality research
Formulation and implementation of long-term heat stress mitigation measures
Assess and identify policy context and bring in region-specific changes
Identify, document and promote best practices for heat stress management in all affected sectors
Regular surveillance of heat-related environmental conditions, illnesses and existing adaptive capacities
Promote community resilience through regular education and awareness initiatives (heat stress bulletin and use of all mass-media)
6.3.1 Recommendations based on district-specific environmental problems: Policy framework and concerned departments/agencies
SectorsPolicies and programmes that can push forward the recommendation
Primary Departments/ Agencies
Supporting Departments/ Agencies
Water scarcity (decline of groundwater) and water pollution
1) Model Bill for the Conservation, Protection, Regulation, Management of Ground Water, 2016
2) Water Prevention and Control of Pollution Act, 1974
3) National Water Mission4) Reuse of Treated Waste
Water Policy, 2018 (GoG)5) Gujarat Domestic Water
Supply (Protection) Act, 20196) Comprehensive State Water
Policy, 2015
1) Water Resources Department, GoG
2) Water Supply Department, GoG
3) GPCB
1) Proposed District Level Climate Change & Environment Committee
2) WASMO (Ahmedabad DWSU)3) All ULBs4) AUDA5) Urban Development
Department6) Rural Development
Department7) Commerce and Industries
Department8) GIDC9) GAIC10) CGWB
35 District scenario about Ahmedabad’s heat stress is given in Chapter-2

95Recommendations
SectorsPolicies and programmes that can push forward the recommendation
Primary Departments/ Agencies
Supporting Departments/ Agencies
Nalsarovar wetland
1) Ramsar Convention Wetland (Conservation & Management) Rules, 2017
2) National Water Missions Wildlife (Protection) Act of 1972
1) Forest and Environment Department, GoG
2) GPCB3) Biodiversity Board
Gujarat
1) Proposed District Level Climate Change & Environment Committee
2) Urban Development Department
3) Rural Development Department,
4) Agriculture Department, GoG5) Fisheries Department, GoG6) Revenue Department, GoG7) Tourism Department, GoG8) Water Resources Department,
GoG9) All ULB10) All PRIs
Making brick kilns sustainable
1) Energy Efficient Enterprise (E3) Certification Scheme for Burnt Clay Brick Manufacturing Industry
2) Gujarat Industrial Policy 20203) Environment Protection Act,
1986 – Section 6 and 25.4) Air (Prevention and Control of
Pollution) Act, 1981 – Section 18(1)(b) for the prevention and control of air pollution in different types of brick kilns
1) Industries and Mines Department, GoG
1) Proposed District Level Climate Change & Environment Committee GPCB
2) District Industries Centre3) MSME Development Institute,
Ahmedabad4) Land and Revenue
Department
Managing air pollution
1) Air (Prevention and Control of Pollution) Act- 1981
2) Environment (Protection) Act, 1986
3) National Clean Air Programme, 2020
4) Solid Waste Management Rules, 2016 & Amendment 2018
5) Construction & Demolition Waste Management Rules, 2016
1) GPCB2) System of Air Quality
and Weather Forecasting and Research (SAFAR), IMD
3) All ULBs
1) District administration and the proposed District Level Climate Change & Environment Committee
2) Department of Climate Change, GoG
3) Commissionerate of Transport, GoG
4) Energy and Petrochemicals Dept, GoG
5) RTO6) All ULBs

96 Climate Change and Environment Action Plan for Ahmedabad District
6.4 Actions district authorities can recommend to state departments
Recommendations that could be pursued by the district collector/committee at the state level
Cross-cutting with
Qualifying priority
District scenario/case examplesTimeframe for the action to be accomplished
Framework for implementation
POWER SECTOR: Upgrade DISCOM infrastructure and their supply network to reduce AT&C losses, billing inefficiencies etc. Furthermore, introduction of smart billing system would help curtail power thefts, and increase billing efficiency, helping the DISCOM generate more revenue.
Short to medium- term
Policy framework and targets exist (section 6.4.1)
With optimum push, this initiative can help India align with the Paris Agreement targets
UGVCL is one of the best performing DISCOMs in the country and its AT&C losses (6.73%) are well within the international standard range of 6% to 8%.
The private player DISCOM in Ahmedabad, TPL –D, can aim to do the same.
The Smart Grid Pilot Project was launched by the UGVCL on Feb 25, 2019 (under the National Smart Grid Mission) for Naroda, Ahmedabad. UGVCL is the first DISCOM in India that has commissioned the Smart Grid Project.
HABITAT: Provide subsidies/tax rebates to builders/building owners to encourage adoption of ECBC or IGBC (such as property tax/water cess/IT rebate).
Medium to long- term
Policy framework exists (section 6.4.1), but targets need to be set
Needs inter-departmental collaboration
ECBC buildings deliver 20% to 25% of energy savings, in different climates, when compared with the conventional buildings (BEE, 2017).
Gujarat Tourism Policy 2021-25 offers reimbursement of 50% of certification fee, with a maximum limit of `10 lakh, to hotels / wellness resorts obtaining green rating from Indian Green Building Council (IGBC).
TRANSPORT: Energy efficiency of infrastructure in railways can be enhanced through the following measures:
a) Installing solar panels along electrified tracks and on railway station rooftops.
b) Installing optimal light control systems and appliances, smart sensors and building management systems at station buildings.
c) Equipping electric traction rolling stock with regenerative capability and feedback to the grid.
Medium-termNeeds inter-departmental collaboration
Rail Land Development Authority and National Building Construction Corporation have signed an MoU for redevelopment of 10 railway stations across India as ‘smart railway stations’. Railway stations in the district can also be developed along similar lines.
TRANSPORT: District authorities while gradually rolling out EV infrastructure, can advocate to state and national governments for standardised EV cables and infrastructures for easier integration and interoperability for implementation of smart charging on a large scale.
Medium to long-term
Needs policy intervention

97Recommendations
Recommendations that could be pursued by the district collector/committee at the state level
Cross-cutting with
Qualifying priority
District scenario/case examplesTimeframe for the action to be accomplished
Framework for implementation
TRANSPORT: Use fiscal instruments to discourage the use of personal vehicles. For example:
a) Increase charges on registration of Internal combustion engines (ICE) vehicles.
b) Levy congestion charges and other green taxes.
c) Phase out of older, more polluting vehicles.
CO2
Short-term and continuous
Policy formulation based on research and inter-departmental cooperation needed
In January 2021, the Ministry of Road Transport and Highways announced additional taxes on old vehicles that are unfit for roads and has termed them as ‘green taxes’.
TRANSPORT: Shift key commercial / business centres outside city limits to reduce traffic load.
CO2
Long-term
Requires policy backing based on research and inter-departmental cooperation
Development of areas outside AMC limits through AUDA in areas like, Bopal, South Bopal and Gota etc.
INDUSTRY: a) Ensure regular PAT compliance of DISCOMs and other designated consumers (DCs) in the district; b) Increase the number of DCs for PAT scheme in the district and ensure the compliance of targets.
a) Short-term and continuous
b) Medium to long-term
Policy framework exists (section 6.4.1), but targets need to be revised gradually
Ensure M&E
Collaboration required
Till PAT Cycle VI (2020-21), only 12 DCs have volunteered under the scheme in Ahmedabad district.
Over the years, various DCs from Ahmedabad district have helped avoid around 0.85 MtCO2e by improving their systemic energy efficiency under the PAT scheme.
INDUSTRY/ENERGY: Ensure compliance of renewable purchase obligations (RPO) and increase the RPO targets gradually.
Medium to long-term
Policy framework exists (section 6.4.1)
Currently, the RPO target in Gujarat for industries is 15.65%.
AGRICULTURE: Encourage millet cultivation (requires less water to grow, shows good productivity under extreme climate conditions and is nutritionally rich).
Medium to long-term
Needs creation of appropriate financial mechanisms to encourage farmers to grow millets
Requires research collaboration
This would also help meet SDG#2 targets: 2.1, 2.3, 2.4
In Ahmedabad, jowar and bajra production has continuously decreased (jowar – from 9,600 tonnes in 2011-12 to 538 tonnes in 2017-18 and bajra – from 27,100 tonnes in 2011-12 to 4,569 tonnes in 2017-18).

98 Climate Change and Environment Action Plan for Ahmedabad District
Recommendations that could be pursued by the district collector/committee at the state level
Cross-cutting with
Qualifying priority
District scenario/case examplesTimeframe for the action to be accomplished
Framework for implementation
AGRICULTURE: To compensate for predicted decrease in crop productivity, initiate research on high yield, drought and temperature resilient genotypes for various food and cash crops in association with agricultural institutes/universities.
Medium to long-term
Needs research collaboration and capital investment
This would also help meet SDG#2 targets: Targets 2.1, 2.3, 2.4, 2.a
Production of cotton decreased in Gujarat. In Ahmedabad alone, it reduced from 2.7 lakh bales in 2017-18 to 1.7 lakh bales in 2018-19. However, the area under cotton cultivation has remained the same (1,05,400 ha in 2017-18 and 1,03,200 ha in 2018-19), thereby resulting in reducing the yield by 33.6%. Low rainfall can be one of the key reasons for the reduced yield.
Area under rice cultivation increased in Ahmedabad from 1.47 lakh ha to 1.51 lakh ha (between 2016-17 and 2017-18) resulting in higher methane emissions. However, production reduced from 3.1 MT to 2.5 MT (between 2016-17 and 2017-18 respectively) and the yield reduced by 18%. Therefore, temperature and drought-resilient rice varieties having climate-friendly irrigation practices/water regimes should be preferred. Moreover, avoid rice cultivation in non-traditional rice areas.
Climate change impacts are likely to reduce rice yield in Ahmedabad by 29.7% and other crops will also be affected.
AGRICULTURE: For overall reduction in electricity and water consumption, subsidies can be reduced by some percentage in a phased manner.
Medium to long-term
Policy intervention needed
Awareness needs to be created among the farming communities, followed by collaborations
The tariffs are as per different consumption slabs as well as the horsepower of pump being used. Currently, power tariff for farmers is at 60 to 80 paise/unit in Gujarat.
Electricity tariff policies, in conjunction with large subsidies for agricultural power, have caused rapid groundwater depletion in many regions as well as massive financial losses to power utilities and governments – both state and central.36
Flat tariffs lead to more equitable distribution between high-income and marginal consumers but fail to encourage water conservation. Metered tariffs have the potential to promote water conservation but are difficult to manage and are expensive for low-income farmers. Western states like Gujarat, with rapidly depleting aquifers, should promote tariffs to enhance water conservation.
36 Sindhu B.S. et. al., Power tariffs for groundwater irrigation in India: A comparative analysis of the environmental, equity, and economic tradeoffs

99Recommendations
Recommendations that could be pursued by the district collector/committee at the state level
Cross-cutting with
Qualifying priority
District scenario/case examplesTimeframe for the action to be accomplished
Framework for implementation
FORESTRY/GREEN SPACES: Promote regeneration of degraded and open forest areas through corporate social responsibility (or similar mandates) and encourage corporates to dedicate some percent of their profit for greening the spaces around their units/factories.
Long-term
Needs strengthening of the existing policy framework
Needs different stakeholder collaboration
In Ahmedabad circle, 1,181 ha area is under Concentrated Regeneration (as per the Annual Administration Report, Forest Dept., GoG).
Green belts help mitigate air pollution, increase urban green cover, leading to carbon sequestration.
E-WASTE: Adopting green marketing approach: Promoting green products by displaying product lifespan on the label of e-products to influence purchase decisions, thereby, using the labels as behavioural intervention.
Medium to long- term
Needs policy intervention, collaborations and awareness
WATER SCARCITY & POLLUTION: Enactment of the ‘Model Bill for the Conservation, Protection, Regulation, Management of Ground Water, 2016’ as ‘an Act in the state and ensuring strict regulation of private groundwater abstraction
Short-term Requires policy implementation
Gujarat is the highest performing state in the composite water management indexing (CWMI).
Gujarat has a comprehensive water policy that has led to setting up of institutions like the state regulatory authority, state policy council and implementation committee, river basin organisations, water research and training institutes, integrated water data centre, etc.
However, establishing a regulatory framework can help the state boost water levels in more wells (as compared to the present achievement of a rise in 33% of wells).

100 Climate Change and Environment Action Plan for Ahmedabad District
6.4.1. Actions district authorities can recommend to state departments: Policy framework and concerned departments/agencies
Sub-sectors
Policies and programmes that can push forward the recommendations Primary departments Associated departments/agencies
Power sector
1) National Smart Grid Mission2) Smart Metering National Programme3) Integrated Power Development Scheme
(IPDS) 4) Restructured Accelerated Power
Development and Reforms Programme (R-APDRP)
5) UDAY Scheme, 2015 6) National Mission on energy Efficiency,
specifically PAT (Perform, Achieve and Trade) Scheme
7) Gujarat Solar Power Policy, 20218) Policy for Development of Small-scale
distributed solar projects, 20199) Standards and Labelling Programme
1) GUVNL-UGVCL, GoG
2) MNRE, GoI3) GEDA, GoG4) BEE(EESL)
1) Proposed District Level Climate Change and Environment Committee
2) Climate Change Department, GoG
3) DMF4) Western Railways – Ahmedabad
Division
Habitat 1) ECBC 2017
1) Urban Development and Urban Housing Department, GoG
2) All ULBs3) Smart City
Ahmedabad Development Ltd.
1) Proposed District Level Climate Change and Environment Committee
2) AUDA3) GEDA
Transport1) ECBC 2) JNNURM3) Smart Cities Mission and AMRUT
1) Ports and Transport Department
2) All RTOs3) ALL ULBs
1) GSRTC 2) GEDA3) Smart City Ahmedabad
Development Limited4) Western Railways – Ahmedabad
Division
Industry1) PAT Scheme2) Gujarat Industrial Policy, 2020
1) Industries and Mines Department, GoG
2) Industries Commissionerate3) District Industries Centre4) Proposed District Level Climate
Change and Environment Committee
AFOLU
1) National Mission on Food Security2) Rashtriya Krishi Vikas Yojana:
Remunerative Approaches for Agriculture and Allied Sector Rejuvenation (RAFTAAR)
3) National Mission for Sustainable Agriculture
4) Price Support Scheme5) National Afforestation Programme (NAP)6) Green India Mission7) CSR Act
1) Agriculture, Farmers’ Welfare and Co-operation Department, GoG
2) Gujarat Forest & Environment Department, GoG
1) Proposed District level Committee on Climate Change and Environment
2) Gujarat Agro Industries Corporation (GAIC)
3) Anand Agriculture University, Ahmedabad
4) APMCs5) Energy and Petrochemicals
Department, GoG6) GIDC
Waste 1) E-waste Management Rules, 20161) Science and
Technology Department, GoG
1) Proposed District Level Climate Change and Environment Committee

101Recommendations
6.5 Sustainable Development Goals being addressed
SDGs Targets Sector (sub-sectors) addressing the recommendation
SDG 1: No Poverty Target 1.4: Ensure that all men and women, in particular the poor
and the vulnerable, have access to basic services Waste, water
SDG 2: Zero Hunger
Target 2.1: End hunger and ensure access by all people, in particular the poor and people in vulnerable situations, including infants, to safe, nutritious and sufficient food all year round
AFOLU (agriculture)
Target 2.3: Double agricultural productivity AFOLU (agriculture)
Target 2.4: Implement resilient agricultural practices that increase productivity and production AFOLU (agriculture)
Target 2.a: Increase investment, including through enhanced international cooperation, in rural infrastructure, agricultural research AFOLU (agriculture)
Target 2.a; Article 10.3.e: Development of sustainable irrigation programmes for both crops and livestock. AFOLU (agriculture & livestock)
SDG 3: Good Health & Well-being
Target 3.3: End the epidemics of AIDS, tuberculosis, malaria and neglected tropical diseases and combat hepatitis, water-borne diseases and other communicable diseases
Water pollution, co-benefits from waste (through cleaner neighbourhood, better access to sanitation)
Target 3.4: Reduce by one-third premature mortality from non-communicable diseases through prevention
Co-benefits from waste (by reducing pollution and providing better hygiene)
Target 3.9: Substantially reduce the number of deaths and illnesses from hazardous chemicals and air, water and soil pollution and contamination
Waste, water scarcity and water pollution and air pollution
SDG 6: Clean Water & Sanitation
Target 6.1: Achieve universal and equitable access to drinking water Water scarcity and water pollution
Target 6.3: Improve water quality by reducing pollution, eliminating dumping and minimising release of hazardous chemicals and materials, halving the proportion of untreated wastewater and substantially increasing recycling and safe reuse globally
Waste, energy (industry), water pollution
Targe 6.4: Substantially increase water-use efficiency across all sectors and ensure sustainable withdrawals
Energy (Habitat: Demand-side management, industry), AFOLU (agriculture & green spaces) water scarcity
Target 6.5: Implement integrated water resources management at all levels
AFOLU (agriculture & green spaces/forestry), water scarcity & pollution
Target 6.8: Support and strengthen the participation of local communities
AFOLU (agriculture, livestock & forestry), transport, wetland
Target 6.a: Expand international cooperation and capacity-building support to developing countries in water- and sanitation-related activities and programmes, including wastewater treatment, recycling and reuse technologies
Waste

102 Climate Change and Environment Action Plan for Ahmedabad District
SDGs Targets Sector (sub-sectors) addressing the recommendation
SDG 7: Affordable & Clean Energy
Target 7.1: Ensure universal access to affordable, reliable and modern energy services
Energy (power & habitat), AFOLU (agriculture)
Target 7.2: Increase share of renewable energy in energy mix Energy (power, transport, habitat & industry), wetland
Target 7.3: Double the global rate of improvement in energy efficiency
Energy (power, habitat & industry)
Target 7.a: Enhance international cooperation to facilitate access to clean energy research and technology, including renewable energy, energy efficiency and advanced and cleaner fossil-fuel technology, and promote investment in energy infrastructure and clean energy technology
Energy (power)
Target 7.b: Expand infrastructure and upgrade technology for supplying modern and sustainable energy services for all in developing countries in accordance with their respective programmes of support.
Energy (power), AFOLU, wetland (RE-powered recreational activities)
SDG 8: Decent Work & Economic Growth
All targets AFOLU (agriculture & livestock)
Target 8.2: Achieve higher levels of economic production through diversification, upgradation and innovation
AFOLU (agriculture & livestock); energy
Target 8.4: Improve progressively, through 2030, global resource efficiency in consumption and production and endeavour to decouple economic growth from environmental degradation, in accordance with the 10-year framework of programmes on sustainable consumption and production
Waste
Target 8.9: Devise and implement policies to promote sustainable tourism
Wetland, agriculture (forestry/green spaces)
SDG 9: Industry, Innovation & Infrastructure
Target 9.1: Develop quality, reliable, sustainable and resilient infrastructure
Energy (Habitat: energy efficiency in building & transport); waste
Target 9.2: Promote inclusive and sustainable industrialisation Energy (industry)
Target 9.3: Improving access and connectivity to industries/other enterprises Energy (transport)
Target 9.4: Upgrade infrastructure and retrofit industries to make them sustainable, with increased resource-use efficiency and greater adoption of clean and environmentally sound technologies and industrial processes
AFOLU (agriculture-cold chains/water pumps etc.), waste, energy (industry), water scarcity, sustainable brick kiln
Target 9.5: Enhance scientific research, upgrade the technological capabilities of industrial sectors in all countries, in particular developing countries, including, encouraging innovation and substantially increasing the number of research and development workers per 1 million people and public and private research and development spending
Energy (power & industry), waste
Target 9.b: Research and innovation in developing countries, including by ensuring a conducive policy environment
Waste, energy (power & industry)

103Recommendations
SDGs Targets Sector (sub-sectors) addressing the recommendation
SDG 11: Sustainable Cities & Communities
Target 11.1: Ensure access for all to adequate, safe and affordable housing and basic services and upgrade slums Waste, habitat, water
Target 11.2: Safe, affordable, accessible and sustainable transport systems for all
Energy (transport & habitat), air pollution
Target 11.3: Enhance inclusive and sustainable urbanization and capacity for participatory, integrated and sustainable human settlement planning and management
Waste, energy (power & habitat: energy-efficient building), all district specific sectors
Target 11.4: Strengthen efforts to protect and safeguard the world’s cultural and natural heritage
AFOLU (forestry/green spaces), wetlands, water scarcity
Target 11.6: Reduce the adverse per capita environmental impact of cities, including by paying special attention to air quality and municipal and other waste management
Waste, energy (power; habitat, transport, industry), sustainable brick kiln and air pollution
Target 11.7: Provide universal access to safe, inclusive and accessible, green and public spaces
AFOLU (green spaces), habitat, air pollution
Target 11.a: Support positive economic, social and environmental links between urban, peri-urban and rural areas by strengthening regional development planning
Energy (transport)
Target 11.b: Substantially increase the number of cities and human settlements adopting and implementing integrated policies and plans towards inclusion, resource efficiency, mitigation and adaptation to climate change
Energy, AFOLU, waste
SDG 12: Responsible Consumption & Production
Target 12.1: Implement the 10-year framework of programmes on sustainable consumption and production, all countries taking action, with developed countries taking the lead, taking into account the development and capabilities of developing countries
Energy, waste
Target 12.2: Achieve the sustainable management and efficient use of natural resources
Energy, AFOLU, waste, air pollution and water pollution
Target 12.3: Halve per capita global food waste at the retail and consumer levels and reduce food losses along production and supply chains, including post-harvest losses
AFOLU, waste
Target 12.4: Achieve the environmentally sound management of chemicals and all wastes throughout their life cycle, in accordance with agreed international frameworks, and significantly reduce their release to air, water and soil
AFOLU, waste, air pollution, water pollution
Target 12.5: Substantially reduce waste generation through prevention, reduction, recycling and reuse Waste, habitat, industry
Target 12.6: Encourage companies, especially large and transnational companies, to adopt sustainable practices and to integrate sustainability information into their reporting cycle
Waste, industry
Target 12.8: Ensure that people everywhere have the relevant information and awareness for sustainable development and lifestyles in harmony with nature
Individual action and behavioural change communication
Target 12.a: Support developing countries to strengthen their scientific and technological capacity to move towards more sustainable patterns of consumption and production
Waste, AFOLU (agriculture & livestock)
SDG 13: Climate Action All targets All sectors and sub-sectors
SDG 14: Life under Water Target 14.1: Prevent and significantly reduce marine pollution of all
kinds, in particular from land-based activities, including marine debris and nutrient pollution.
Waste (single use plastic)
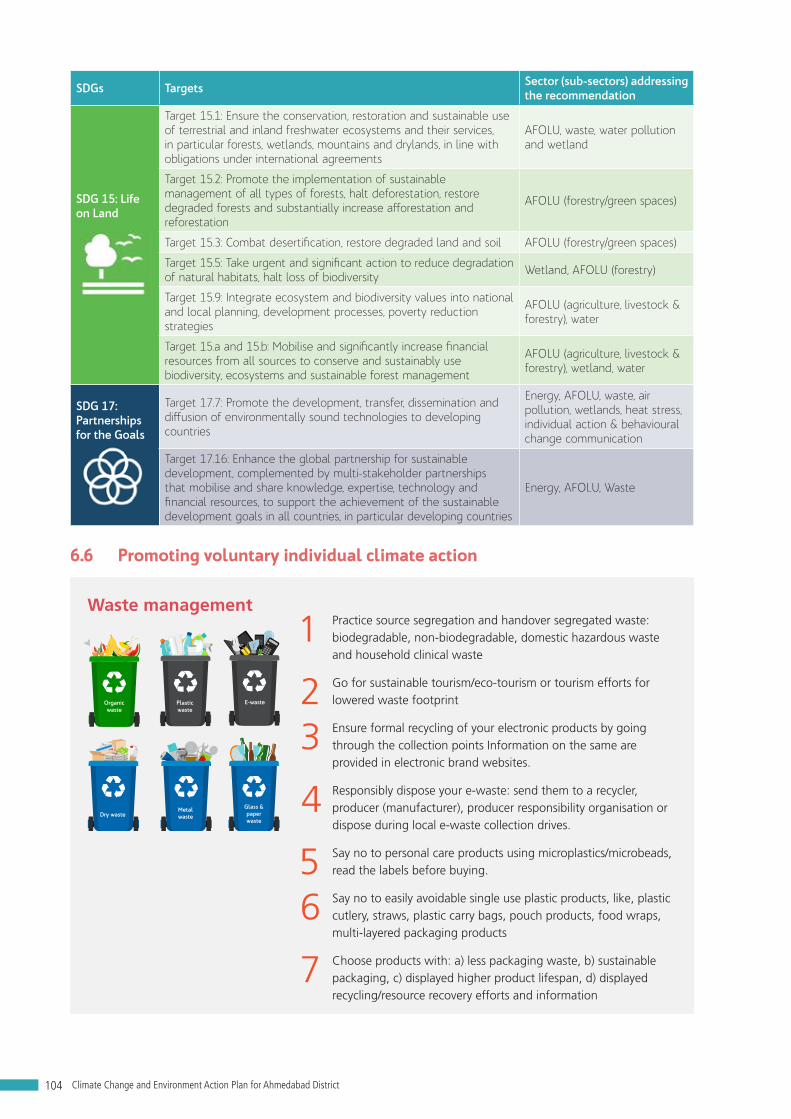
104 Climate Change and Environment Action Plan for Ahmedabad District
SDGs Targets Sector (sub-sectors) addressing the recommendation
SDG 15: Life on Land
Target 15.1: Ensure the conservation, restoration and sustainable use of terrestrial and inland freshwater ecosystems and their services, in particular forests, wetlands, mountains and drylands, in line with obligations under international agreements
AFOLU, waste, water pollution and wetland
Target 15.2: Promote the implementation of sustainable management of all types of forests, halt deforestation, restore degraded forests and substantially increase afforestation and reforestation
AFOLU (forestry/green spaces)
Target 15.3: Combat desertification, restore degraded land and soil AFOLU (forestry/green spaces)
Target 15.5: Take urgent and significant action to reduce degradation of natural habitats, halt loss of biodiversity Wetland, AFOLU (forestry)
Target 15.9: Integrate ecosystem and biodiversity values into national and local planning, development processes, poverty reduction strategies
AFOLU (agriculture, livestock & forestry), water
Target 15.a and 15.b: Mobilise and significantly increase financial resources from all sources to conserve and sustainably use biodiversity, ecosystems and sustainable forest management
AFOLU (agriculture, livestock & forestry), wetland, water
SDG 17: Partnerships for the Goals
Target 17.7: Promote the development, transfer, dissemination and diffusion of environmentally sound technologies to developing countries
Energy, AFOLU, waste, air pollution, wetlands, heat stress, individual action & behavioural change communication
Target 17.16: Enhance the global partnership for sustainable development, complemented by multi-stakeholder partnerships that mobilise and share knowledge, expertise, technology and financial resources, to support the achievement of the sustainable development goals in all countries, in particular developing countries
Energy, AFOLU, Waste
6.6 Promoting voluntary individual climate action
Waste management
1 Practice source segregation and handover segregated waste: biodegradable, non-biodegradable, domestic hazardous waste and household clinical waste
2 Go for sustainable tourism/eco-tourism or tourism efforts for lowered waste footprint
3 Ensure formal recycling of your electronic products by going through the collection points Information on the same are provided in electronic brand websites.
4 Responsibly dispose your e-waste: send them to a recycler, producer (manufacturer), producer responsibility organisation or dispose during local e-waste collection drives.
5 Say no to personal care products using microplastics/microbeads, read the labels before buying.
6 Say no to easily avoidable single use plastic products, like, plastic cutlery, straws, plastic carry bags, pouch products, food wraps, multi-layered packaging products
7 Choose products with: a) less packaging waste, b) sustainable packaging, c) displayed higher product lifespan, d) displayed recycling/resource recovery efforts and information
Organicwaste
Plasticwaste
E-waste
Dry wasteMetalwaste
Glass &paperwaste

105Recommendations
Housing
1 Insulate the building as much as possible, ensure proper sealing of doors and windows to avoid cooling/heating leakage
2 Develop and maintain provision for Rain Water Harvesting.
3 Install solar rooftop panels, if feasible.
4 Adopt wastewater recycling and reuse
5 Rooftop gardens can considerably reduce space cooling requirement
Lighting
1 Switch off lights and fans when not required
2 Replace incandescent bulbs with LEDs.
3 De-dust lighting fixtures to maintain illumination.
4 Smart LEDs are even more convenient-they can be controlled even when the person is not at home.
Kitchen
1 When cooking on gas stove, use moderate flame setting to conserve LPG
2 Prefer the use of pressure cookers
3 Keep the burner clean
4 Use lids to cover the pan while cooking
5 Use flat bottomed pan on electric stove
6 Turn off electric stove several minutes before the specified cooking time

106 Climate Change and Environment Action Plan for Ahmedabad District
Other climate-conscious precepts
Be mindful of water consumption. Use bucket instead of shower. Use bucket instead of hose for cleaning cars/porch/back-yard. Opt for dual-flush toilets. Close the tap while brushing. Reuse RO reject water.
Carry your own water bottle, adopt minimalist lifestyle to reduce overconsumption of resource, purchase only when necessary
Go for climate conscious producers/manufacturers. Develop a knowledge and preference for locally available and sustainably produced and designed products
If possible then opt for work from home options for a few days in a week
Encourage elected representatives and policy makers to opt for green choices/deals/decisions
Choose Standard Shipping when ordering online
Buy locally available produces especially food/vegetables and other perishable products
Invest time and effort in greening local areas through collective community action
Buy local and organic food items not only for health but also to cut down emissions from transport and chemical fertilizers
Opt for water saving fittings and fix any leakages in the house
Develop a habit of repair and reusing appliances and products at home instead of buying new ones. Follow reduce, reuse and recycle principles in the household to reduce footprint
Include more meat-free meals and limit food wastage
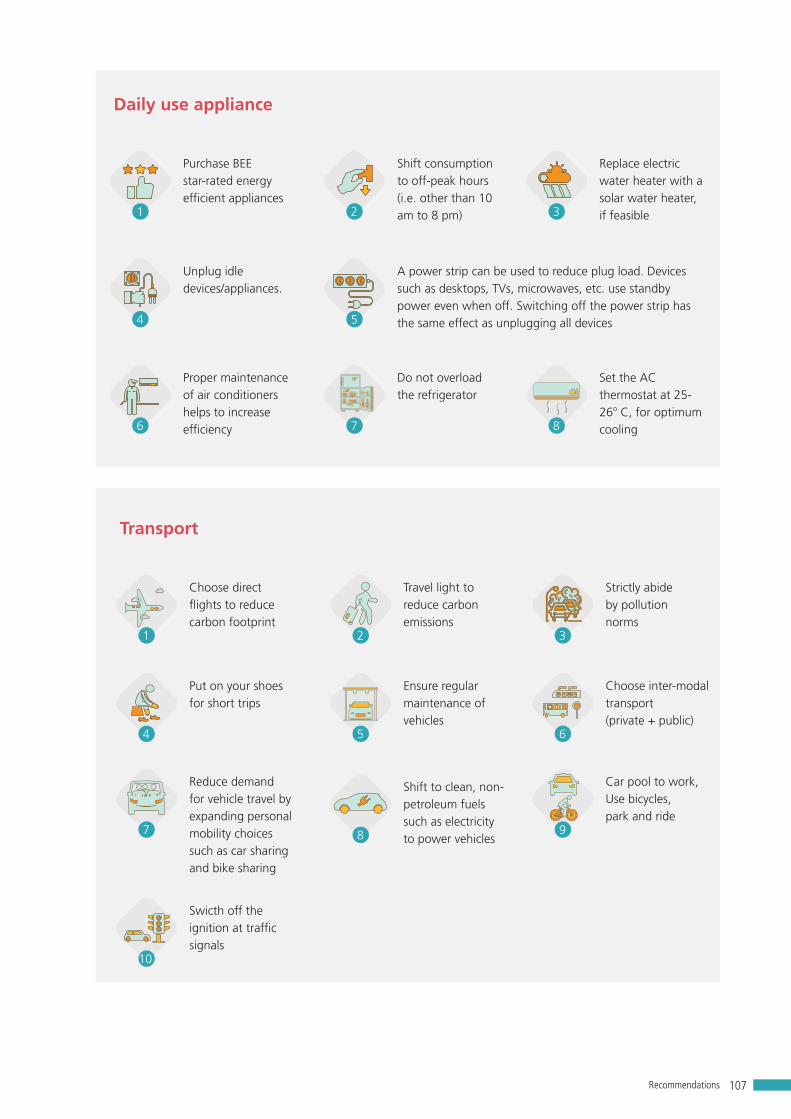
107Recommendations
Daily use appliance
1
6
4
2
7
5
3
8
Purchase BEE star-rated energy efficient appliances
Proper maintenance of air conditioners helps to increase efficiency
Unplug idle devices/appliances.
Shift consumption to off-peak hours (i.e. other than 10 am to 8 pm)
Do not overload the refrigerator
Replace electric water heater with a solar water heater, if feasible
Set the AC thermostat at 25-26º C, for optimum cooling
A power strip can be used to reduce plug load. Devices such as desktops, TVs, microwaves, etc. use standby power even when off. Switching off the power strip has the same effect as unplugging all devices
26º
Transport
1
4
7
10
2
5
8
3
6
9
Choose direct flights to reduce carbon footprint
Put on your shoes for short trips
Reduce demand for vehicle travel by expanding personal mobility choices such as car sharing and bike sharing
Swicth off the ignition at traffic signals
Travel light to reduce carbon emissions
Ensure regular maintenance of vehicles
Shift to clean, non-petroleum fuels such as electricity to power vehicles
Strictly abide by pollution norms
Choose inter-modal transport (private + public)
Car pool to work,Use bicycles,park and ride

108 Climate Change and Environment Action Plan for Ahmedabad District
6.7 Behavioural change communication (BCC) techniquesBe
havi
oura
l cha
nge
com
mun
icat
ion
A cadre of grass-root communicators ‘Urja Doot’ or ‘Energy Ambassadors’
can be created and trained to act as key change makers to further
propagate messages of a particular campaign.
Urja Samiti or Paryavaran Samiti can be formed in every urban ward/
village to channelize communication (from government department to
beneficiaries and back). If a new samiti is not feasible, then the capacity
of one of the existing samitis or SHGs can be developed.
Develop issue specific Information, Education and Communication
(IEC) activities and material in Hindi, English as well as local language
Hold proper competitions to reward residential societies/institutions/villages that
have adopted sustainable development practices. (eg: zero wastewater
generation, efficient waste management/composting, rooftop solar installation)
Develop issue specific campaigns and use:
For proper O&M of any scheme (rainwater harvesting system or e-vehicle
charging infrastructure) in any society, a minimum contribution of the
beneficiaries should be taken (as this will instil the spirit of ownership)
Encourage lifestyle changes that embrace sustainable development practices.
Incentivise green choices (energy efficient appliances, compliance to ECBC, work
from home practice).
Mass media (Radio jingles, advertisements in multiplexes/
newspapers/local news channels)
Reminder media (hoardings, wall writings, flyers)
Folk media (street plays, skits, stalls in local
fairs/exhibition)
News and social media

109Monitoring and evaluation plan
MONITORING AND EVALUATION PLAN
Stakeholder consultation for CCEAP Ahmedabad chaired by the Ahmedabad collector, Shri. Sandip J. Sagale, IAS

110 Climate Change and Environment Action Plan for Ahmedabad District
7. MONITORING AND EVALUATION PLAN
7.1 Framework for monitoring and evaluationThis section describes the planning for monitoring and evaluation (M&E) of the climate change mitigation measures that the district may adopt for the sectors identified in the report. M&E is crucial to realise the achievement and track the effectiveness of results envisaged in order to compliment the national endeavours to attain nationally determined contributions. The framework proposes to incorporate: a) district-level mitigation profiling, b) planning for mitigation measures, c) tracking of implementation and integration to the national mitigation response, and d) evaluation of relevance and effectivity.37
Mitigation measures setting up
District emission profiling and inventorisationPolicy mapping: 1) Identification of relevant sectoral district specific policies, 2) Policy impact evaluation, 3) Policy gap identificationDraw recommended measures to reduce emission aligned to internationally bound national targets
Implementation of mitigation action plans
Set measurable indicators for planned activitiesPlan a timeline with realistic approachCapacity building: 1) Stakeholder analysis & engagement plan, 2) Institutional capacity development & behavioural change communicationPolicy making: 1) Integration of mitigation measures into sensitive policies sectoral and sub-national/district level, 2) Formulation of district climate mitigation policy Piloting recommended activity measures at various scalesImplementing information management system for climate change decision support and other documentations
Across indicator types
Coverage: Stakeholder and sectoral engagement extentImpact: Extent of project delivery to intended resultsSustainability: Policy changes & stakeholder engagement beyond timelineReplicability: The extent to which the inventorisation and evaluation models are dynamic, results and lessons could be captured and disseminated for broader benefits
Miti
gatio
n de
sign
Mitigation thematic areas
Electricity & energyTransportHabitatIndustryAgriculture, forestry and other land use WasteDistrict specific environmental concerns
Trac
king
Eval
uatio
n &
rep
ortin
g
Syst
em w
ide
mea
sure
s to
miti
gate
clim
ate
chan
ge
37 Activities that are already covered in the current CCEAP for Ahmedabad District are in red colour. Activities that are 1) to be based on the CCEAP findings and recommendations or 2) potentially mapped out through the CCEAP report, like the stakeholder mapping or behavioural change communication plan, etc. are given in the blue colour.

111Monitoring and evaluation plan
7.2 Proposed institutional set-upAs a central authority or body to steer the wheels of climate mitigation, it is recommended to formulate a district climate cell/committee or include the perspective of climate change in the existing District Environment Committee.38 The committee shall assign tasks according to stakeholder analysis and engagement as outlined in the following model. This monitoring and evaluation committee shall comprise of representatives from concerned administrative bodies, sectoral experts, civil society organisations and civic/other associations (as applicable) and shall similarly be formed at block, ULB, cluster and ward level. The committee shall oversee implementation of deliverables following the prescribed recommendations/framework and the outputs. A proposed set-up of the committee at each of the levels is as follows:
Chairman: District CollectorMembers: Municipal Corporation Commissioner, District Development Officer (DDO), Superintendent of Police, Deputy Collector, District Level officers/representatives of: Pollution Control Board, MSMEs, Agriculture & Animal Husbandry, Department of Statistics and Planning, District Urban Development Agency, Industry Department, Urban Development Department (UDD), Water Supply, Rural Development Department (RDD), Health Care Department, Regional Transport Office (RTO) etc
District Level Committee on Climate Change and Environment
District level committee
Chairman: Mamlatdar/Taluka Development OfficerMembers: Taluka Level Members of: Rural Development Department, Department of Irrigation, Water Supply Department, Agriculture & Animal Husbandry and other departments mentioned in the district committee
Taluka level
Chairman: Head of Municipality/NagarpalikaMembers: Town level representatives of the departments mentioned above
Town level/municipalities
Chairman: Deputy MamlatdarMembers: Sarpanch and other PRI members, Self-help group members, head of women committee, Village Water and Sanitation Committee (VWSC), grassroot communicators
Village cluster level
Chairman: Ward RepresentativesMembers: President of RWAs, grassroot communicators, civil societies, members of samittee
Urban-ward level
Taluka level Town level/ municipalities/city council
Village cluster level Urban-ward level
Nodal Agency: Climate Change Department, GoG
38 As per the Hon’ble NGT order in O.A. No. 710-713/2017 dated 15.07.2015

112 Climate Change and Environment Action Plan for Ahmedabad District

113Impact of COVID-19 vis-à-vis climate action
IMPACT OF COVID-19 VIS-À-VIS CLIMATE
ACTION
COVID-19 monitoring in Ahmedabad

114 Climate Change and Environment Action Plan for Ahmedabad District
8. IMPACT OF COVID-19 VIS-À-VIS CLIMATE ACTION
8.1 IntroductionThe ongoing COVID-19 pandemic has gravely affected the country. Ahmedabad district reported 2,38,213 (as of September, 2021), accounting for 28.8 percent of the state’s total case-load (Covid19 India, 2021). This has affected management of climate crisis.
Positive impacts: Lockdowns have had several positive impacts on the environment. For the first time in nearly four decades, India saw a reduction in CO2 emissions by 30 million tonnes CO2 (1.4 percent) in FY 2019-20 due to economic slowdown and restricted activities (Lauri & Dahiya, 2020). In April 2020, aerosol levels were at a 20-year low in north India one of the most polluted regions of the world (NASA, 2020). Ahmedabad too saw decreased turbidity levels in Sabarmati River (16.8 percent drop in average suspended particulate matter/SPM than the previous year) and a significant drop in atmospheric pollution level (NO2, PM2.5 and PM10) resulting out of restricted industrial production and pollutant generation (Aman & Yunus, 2020).
However, the economic and social (both direct and indirect) costs of the pandemic are likely to take priority over climate goals and commitments. The following are some likely impacts of COVID-19 vis-à-vis climate action, inferred from observations across the country and drawn for the district of Ahmedabad.
8.2 Energy consumption
8.2.1 Electricity demand
Coal-based power generation reduced by 26 percent in just two weeks after the lockdown, a significantly larger drop as compared to 6 percent globally (Pillay, 2020). India’s power consumption shrunk by 22.7 percent in April and increased by 14.16 percent in May with relaxations in lockdown norms (The Economic Times, 2020). At the national level, while the fuel consumption took a dip of around 70 percent as compared with pre-COVID levels, electricity demand fell by 20 to 25 percent during the strict lockdown.
AP
& T
elan
gana
Biha
r
Chh
attis
garh
Del
hi
Guj
arat
Har
yana
Jhar
khan
d
Kar
nata
ka
Ker
ala
Mad
hya
Prad
esh
Mah
aras
htra
Punj
ab
Raja
stha
n
Tam
il na
du
Utt
ar P
rade
sh
Wes
t Be
ngal
% d
evia
tion
from
pre
-CO
VID
tre
nd b
y 20
25
-0%
-5%
-10%
-15%
Figure 45: 2025 deviation of electricity demand from pre-COVID trends projected from major Indian states
India’s electricity demand is projected to be 7 to 17 percent lower by 2025 due to the downward revision of its GDP growth, partly due to the COVID-19 economic shock (Spencer, 2020).39
39 However, as per Central Electricity Authority's Power Supply Report, the national energy requirement in August, 2021 was 128,519 MU, recording a 14 percent rise in comparison to the same month in 2019.

115Impact of COVID-19 vis-à-vis climate action
Outlook for Ahmedabad
As a consequence of lower demand, electricity generation at the Sabarmati Thermal Power Plant reduced by 63 percent between January and August 2020. The greatest dip in generation was witnessed during May and June 2020 by 78 percent and 69 percent, respectively (Figure 46).
118.5128.84
162.15
0
53.6579.77
103.35
65.83
215.24 223.17243.58 241.5
249.79 249.46 242.03 247.22
0
50
100
150
200
250
300
Jan Feb March April May June July Aug
Elec
tric
ity g
ener
atio
n (M
Us)
2020 2019
Figure 46: Month-wise comparison of electricity generation (MUs) by Sabaramati TPP in 2020 vs. in 2019
Table 23 and Figure 47 illustrate changes in electricity demand for the district of Ahmedabad (as per UGVCL) during the pre-COVID, lockdown and unlock period with respect to 2019.
Table 23: Impact of COVID-19 on electricity demand-UGVCL
UGVCL 2020 Actual electricity consumption (MU) Change in electricity consumption (w.r.t 2019) (%)
Pre-COVID
JAN 1439.92 2.99
FEB 1485.72 4.54
MAR 1470.80 6.42
LockdownAPR 1153.00 -16.95
MAY 398.81 -74.24
Un-lock period
JUN 1928.79 18.53
JUL 1733.21 8.53
AUG 1465.38 -2.72
SEP 1364.77 -1.20
0
500
1000
1500
2000
2500
JAN FEB MAR APR MAY JUN JUL AUG SEP
Act
ual e
lect
ricity
con
sum
ptio
n (M
U)
2019 2020
Figure 47: Impact of COVID-19 on electricity demand-UGVCL

116 Climate Change and Environment Action Plan for Ahmedabad District
Some states have reduced coal power generation to compensate for lower demand. The contribution of coal in total power generation in India fell from an average of 72.5 percent in March 2020 to 65.6 percent in April 2020, since renewable energy sources have a ‘must run’ status and the running cost of RE plants is lower than thermal power plants (Surya, 2020). This presents an opportunity to increase focus on RE production and strengthen its integration into the grid. Ahmedabad district can contribute to Gujarat's RE generation capacity by encouraging projects such as solar rooftops, biogas and solar pumps for agriculture.
8.2.2 Fuel consumption
India’s fuel consumption fell 45.8 percent to 9.929 million tonnes in April, down from 18.32 million tonnes consumed in the same month a year back (Business Standard, 2020). The only fuel that showed growth was LPG as the government dole of free cooking gas cylinders to poor households fired up consumption by 12.2 percent to 2.13 million tonnes in April, 2020.
Outlook for Ahmedabad
As of September 2020, the sale of petrol and diesel were at 70 percent of the pre-COVID levels. This was due to reduced movement of private vehicles as most people were staying home to prevent the spread of the disease (The Times of India, 2020). In such a time, dependence on fossil fuels was clearly decreasing. This provides an opportunity to bring about a paradigm shift in the transport system towards e-mobility. The district needs to take up planning and phase-wise implementation of e-mobility infrastructure and incentives on a priority basis.
8.3 AgricultureCOVID-19 caused disruption to agriculture and its supply chains. Inability to hire harvesters and other machinery interrupted harvesting activities for wheat and pulses. The closure of hotels, restaurants, sweet shops and tea shops during the lockdown caused a depression in milk sales. Shortage of staff at cold storage and food processing units also impacted milk and milk products’ supply chain. Meanwhile, poultry farmers were badly hit due to misinformation on social media.
While lockdown impacted availability of seeds, machinery and irrigation equipment, reverse migration proved beneficial for kharif (monsoon) crops. Across the nation, as of July 2020, kharif crops were sown on a total 691.86 lakh ha area, against 570.86 lakh ha area during the corresponding period last year, an increase of 21.20 percent (WBCSD, 2020) (PIB, 2020).
Overall, sowing in Gujarat went up by 35 percent for summer crop 2020 (as reported by the State Agricultural Department) – highest since 2016. The Saurashtra region, which includes parts of Ahmedabad district, reported the highest spike (165 percent) in sowing (TOI, 2020). A likely impact of COVID-19 was seen on agricultural transactions in Gujarat. Between March and May 2020, 16.35 lakh farmers across Gujarat sold produce worth `5,400 crore to the Agriculture Produce Market Committees, which is significantly lower than the corresponding period in 2019 (Indian Express, 2020).
Outlook for Ahmedabad
To prevent loss of yield, the district administration must ensure availability of irrigation facilities, composts, seeds, farming machines during sowing and harvesting periods and provide support where necessary, in consultation with farmer bodies. Small farmers must be prioritised while provisioning facilities. Further, the prices paid to farmers must be regulated to ensure steady income.
8.4 MigrationIndia witnessed a national migrant crisis resulting from the nationwide lockdown, leading to widespread job loss, particularly for daily wage labourers. The huge migrant exodus from cities to villages added pressure on energy, food and water resources in rural areas, thereby increasing waste footprint. In Gujarat, 6.72 lakh workers exited the major urban centres by special trains and many travelled by road and on foot (The Indian Express , 2020).
Outlook for Ahmedabad
The district administrator must understand the migration pattern in Ahmedabad district, and plan allocation and management of resources accordingly. Agriculture sector schemes, MGNREGS and state employment guarantee programmes can be used to fast-track incorporation of these migrants into the state roll and open employment opportunities for them. To ensure safety of immigrants, the district should continue rapid testing and have adequate isolation centres.
117Impact of COVID-19 vis-à-vis climate action
8.5 Waste managementThe pandemic has a tremendous impact on the waste sector. Grappled with an already burdened healthcare and municipal waste management system, Indian states and district level administrations are going to face serious environmental governance challenges, leading to the risk of higher emission from this sector. The waste sector is facing the following challenges:
• Increase in the use of disposable PPEs, masks, single-use plastic containers for sanitisers, online shopping packaging waste and double layered bags (two bags) for collection of COVID-19 waste in hospitals, etc. leading to a huge amount of additional waste. This not only changes the composition, but also the density of both municipal solid waste and hospital waste.
• All COVID-19 medical waste from hospitals treating COVID-19 patients is categorised as yellow waste, which is to be incinerated as per the Bio-medical Waste Management Rules, 2016. Similarly, biomedical waste generated from quarantine camps, centres and homes is to be treated as ‘domestic hazardous waste’ under the Solid Waste Management Rules, 2016. This increases emissions from waste incineration manifolds (CPCB, 2020).
• The CPCB guideline also asks for immediate disposal of COVID-19 bio-medical waste and permits operation of incineration facilities for extra hours at the CBWTF, if required, thereby increasing emissions even further.
• For rural areas not having CBWTF facilities, COVID-19 waste shall be disposed of in the existing captive facilities, which would have more emission potential (equal to landfilling) than that of incineration. It is to be noted that most of rural India is not connected to CBWTFs and is already impacted by COVID-19.
• Use of hazardous waste treatment facilities (TSDF) for incinerating COVID-19 waste from solid waste stream leads to increased emissions from TSDFs.
8.6 Air pollution40
The term “PM” refers to particulate matter i.e., tiny particles suspended in air in the form of either solid or liquid droplets. They comprise of various organic and inorganic components including acids, ammonia, black carbon, water, mineral dust, etc. The major sources of particulate matter are vehicular, industrial, domestic fuel burning, construction, natural sources including soil dust (re-suspended) and other anthropogenic sources.
PM can be primary – mechanically generated including carbonaceous fly-ash particles produced from high temperature combustion of fossil fuels in coal power plants – and secondary, formed in the atmosphere through reactions of primary gaseous pollutants (NO2, NH3, SO2, Non-methane volatile organic compounds). The size of these particles is critical in defining their potential for causing health problems. Particles less than 10µm in diameter penetrate deep into the lungs causing serious health concerns and reduce visibility (cause haze). Of this, particles having diameter less than 2.5µm (PM2.5) pose greater risk to respiratory and cardiovascular mobility and mortality over the long term.
Comparison of 24-hour average of PM2.5 over Ahmedabad district between Jan and May for the years 2019 and 2020 shows that PM2.5 concentration reduced significantly during the lockdown months (Figures 48 and 49) in 2020 (remaining well below 60 µg/m3, which is in the good category according to Indian standards) than that of 2019. A similar reduction in PM10 concentration was observed during these months in 2020 (Figures 50 and 51). PM10 concentration was also found to be below 100 µg/m3 keeping the air quality mostly in ‘good’ category (PM2.5: 0-30; PM10: 0-50).
40 The PM2.5 and PM10 modal forecast data obtained from European Centre for Medium-Range Weather Forecasts (ECMWF) and analysed at GIS platform for mapping of monthly mean values. The data can be accessed from https://apps.ecmwf.int/datasets/data/cams-nrealtime/levtype=sfc/ For the mapping of NO2 and SO2 the data were obtained from following URLs. https://developers.google.com/earth-engine/datasets/catalog/COPERNICUS_S5P_OFFL_L3_NO2 https://developers.google.com/earth-engine/datasets/catalog/COPERNICUS_S5P_OFFL_L3_SO2

118 Climate Change and Environment Action Plan for Ahmedabad District
2019
Jan
Jan
Feb
Feb
March
March
April
April
May
May
2020
Figure 48: PM2.5 concentration in Ahmedabad during Jan-May, 2019 vs. 2020
2019
June
June
July
July
Aug
Aug
Sept
Sept
Oct
Oct
2020
Figure 49: PM2.5 concentration in Ahmedabad during June-October, 2019 vs. 2020

119
2019
Jan
Jan
Feb
Feb
March
March
April
April
May
May
2020
Figure 50: PM10 concentration in Ahmedabad during Jan-May, 2019 vs. 2020
2019
June
June
July
July
Aug
Aug
Sept
Sept
Oct
Oct
2020
Figure 51: PM10 concentration in Ahmedabad during June-October, 2019 vs. 2020
During the lockdown, most anthropogenic activities came to a standstill or were limited. Therefore, the NO2 concentration over Ahmedabad city (upper eastern region) reduced significantly during March-September 2020, as compared to 2019. However, a rise in NO2 emissions was observed again from October with the lifting of restrictions. From a range of 114-142 µmole/m2 in 2019, the concentration values decreased to 28-57 µmole/m2 during the lockdown in 2020 (Figures 52 and 53).

120 Climate Change and Environment Action Plan for Ahmedabad District
2019
Jan
Jan
Feb
Feb
March
March
April
April
May
May
2020
Figure 52: NO2 concentration in Ahmedabad during Jan-May 2019 vs. 2020
2019
June
June
July
July
Aug
Aug
Sept
Sept
Oct
Oct
2020
Figure 53: NO2 concentration in Ahmedabad during June-October, 2019 vs. 2020
Similar effect was observed on the SO2 concentration over Ahmedabad with a sharp decline in April and May 2020 from its usual high of 350-420 µmole/m2 to 0-280 µmole/m2. Patches of SO2 were observed over the entire district and were particularly dense near urban agglomerations (Figures 54 and 55).

121
2019
Jan
Jan
Feb
Feb
March
March
April
April
May
May
2020
Figure 54: SO2 concentration in Ahmedabad during Jan-May, 2019 vs. 2020
2019
June
June
July
July
Aug
Aug
Sept
Sept
Oct
Oct
2020
Figure 55: SO2 concentration in Ahmedabad during June-October, 2019 vs. 2020
Outlook for Ahmedabad
The COVID-19 lockdown provided a temporary relief from air pollution in most Indian cities. However, with the unlock process, air pollution levels increased gradually, reaching pre-Covid levels post-October when normal life resumed. Source apportionment studies can help identify air pollution hotspots in the district. Authorities in Ahmedabad can focus on measures to minimise and/or optimise industrial processes in order to reduce emissions. Further, authorities must work towards decreasing and distributing traffic during peak hours and encourage the use of public transport to minimise vehicular emissions.

122 Climate Change and Environment Action Plan for Ahmedabad District

123The way forward
THE WAY FORWARD
Rooftop Solar PV Plant SVPI Airport Ahmedabad

124 Climate Change and Environment Action Plan for Ahmedabad District
THE WAY FORWARD
India has set a target to meet its 50% of energy demand through RE by 2030 at COP26/Glasgow, 2021. It is important to break that overall plan into smaller action plans for each district and involve various stakeholders to work towards meeting the targets.
Ahmedabad district has displayed its commitment towards mitigating climate change. The district has been a pioneer in undertaking several measures to address climate change. For instance, Ahmedabad was one of the first cities in India to introduce a Bus Rapid Transit System (BRTS). Together with the Ahmedabad Metro (which was launched in March 2019) and improvement in last-mile connectivity, the district has the potential to emerge as a leader in public transport connectivity in India. It was one of the first cities in India to introduce a Heat Action Plan that strengthens response towards heat stress conditions in the city. For enhancing energy efficiency, the UGVCL became the first DISCOM in the country to commence the smart grid pilot project at Naroda, Ahmedabad, in Feb 2019. In terms of promoting e-mobility, Gujarat already has a scheme in place that provides subsidy to women, students and self-employed persons for procurement of electric two- and three-wheelers.
The district can select recommendations from the comprehensive list provided in Chapter 6 of this action plan, and develop a detailed implementation plan for pilot projects that can be rolled out in the short-, medium- and the long-term.
With the availability of a district-level policy and scheme-wise budgetary allocation, a detailed budgetary analysis with respect to climate action can be carried out for Ahmedabad as an add-on to this action plan. However, this must be treated as a dynamic document and the action plan can be updated regularly with the latest emissions profile and mitigation potential of the district. Organising periodic stakeholder consultations would help strengthen the action plan, as per the changing requirements of the district.
Rapid clean technology enabled e-Toilet in Ahmedabad

125
REFERENCES
Ahmedabad Mirror. (2019, August 12). Metro ridership not quite on track . Ahmedabad Mirror.
Aman, A. M., & Yunus, A. (2020). COVID-19 and its impact on environment: Improved pollution levels during the lockdown period - a case from Ahmedabad, India. Remote Sensing Applications: Society and Environment, 20. doi:https://doi.org/10.1016/j.rsase.2020.100382
Business Standard. (2020). COVID-19: India’s fuel consumption falls 46% in April, may rebound in May. Business Standard. Retrieved from https://www.business-standard.com/article/economy-policy/covid-19-india-s-fuel-consumption-falls-46-in-april-may-rebound-in-may-120051000308_1.html
CEA. (2019). Executive Summary on Power Sector. Retrieved from www.cea.in: http://cea.nic.in/reports/monthly/executivesummary/2019/exe_summary-03.pdf
CEPT. (2019). Retrieved from https://portfolio.cept.ac.in/2019/S/ft/gis-for-governance-5670-spring-2017/urban-growth-potential-ahmedabad-spring-2017-pt200716
CEPT University. (2019, November 20). Understanding the City. Ahmedabad: CEPT University. Retrieved from https://ahmedabadmirror.indiatimes.com/ahmedabad/others/only-11-amdavadis-use-public-transport-study/articleshow/72134099.cms
Covid19India. (2021). Covid 19 Gujarat. Covid19India.org. Retrieved April 8, 2021, from https://www.covid19india.org/state/Gj
CPCB. (2015). Inventorisation of sewage treatment plants. Govt of India, Central Pollution Control Board. Retrieved from https://nrcd.nic.in/writereaddata/FileUpload/NewItem_210_Inventorization_of_Sewage-Treatment_Plant.pdf
CPCB. (2020). Guidelines for Handling, Treatment and Disposal of Waste Generated during Treatment/Diagnosis/Quarantine of COVID-19 patients. Central Pollution Control Board. Retrieved from https://www.mohfw.gov.in/pdf/63948609501585568987wastesguidelines.pdf
CRIDA. (2011). Agriculture Contingency Plan: Ahmedabad. Indian Council of Agricultural Research (ICAR), Central Research Institute for Dryland Agriculture. Retrieved from http://www.nicra-icar.in/nicrarevised/images/statewiseplans/Gujarat%20(Pdf)/SKDAU,Banasakantha/GUJ%2022-Ahmedabad%20%2004.105.2011.pdf
Dept of Agriculture & Cooperation. (2015). Report on Task Force to derive suggestions to increase agriculture development in Gujarat. Govt of Gujarat, Department of Agriculture & Cooperation. Retrieved from https://niti.gov.in/writereaddata/files/Gujarat.pdf
Directorate of Agriculture. (2018). Season and Crop Report 2017-2018. Government of Gujarat, Directorate of Agriculture. Retrieved from https://dag.gujarat.gov.in/images/directorofagriculture/pdf/Provisional-SCR-Yr-2017-18.pdf
Directorate of Agriculture. (2020). District-wise Area, Production & Yield of Important Food & Non-food crops in Gujarat State: 2016-17, 2017-18 & 2018-19. Govt of Gujarat, Directorate of Agriculture. Retrieved from https://dag.gujarat.gov.in/images/directorofagriculture/pdf/APY-2016-17-2017-18-2018-19-for-website.pdf
District Administration Ahmedabad. (2020). Village & Panchayat. Retrieved from District Ahmedabad: https://ahmedabad.nic.in/village-panchayats/
DoE&S. (2018). Statistical abstract of Gujarat State, 2018. Directorate of Economics & Statistics, Govt. of Gujarat.
Financial Express. (2019, March 4). Ahmedabad Metro phase 1 inaugurated by route map, stations and phase 2. Financial Express. Retrieved from https://www.financialexpress.com/infrastructure/ahmedabad-metro-route-map-stations-phase-1-pm-modi-inauguration-phase-2/1504420/
Forest Survey of India. (2019). India State of Forest Report 2019: Gujarat Vol 2. Forest Survey of India, Ministry of Environment, Forest & Climate Change, Govt. of India. Retrieved from https://fsi.nic.in/isfr19/vol2/isfr-2019-vol-ii-gujarat.pdf
GERC. (2018). Tariff Order for TPL-D (Truing Up 2016-17). Retrieved from Gujarat Electricity Regulatory Commission: https://www.gercin.org/wp-content/uploads/document/ddb5dd3c-32fd-4b13-b18f-daa284c5be38.pdf
GERC. (2018). Tariff Order for UGVCL (Truing Up 2016-17). Retrieved from Gujarat Electricity Regulatory Commission: https://www.gercin.org/wp-content/uploads/document/29b39339-1466-4ab6-bf9a-b197b525650b.pdf

126 Climate Change and Environment Action Plan for Ahmedabad District
GERC. (2021). Tariff Order for TPL-D (Truing up for FY 2019-20). Retrieved from Gujarat Electricity Regulatory Commission: https://gercin.org/wp-content/uploads/2021/04/TPL-D-Ahd.-19262021-Tariff-Order-for-FY-2021-22-dtd.-31.03.2021.pdf
GERC. (2021). Tariff Order for UGVCL (Truing up for FY 2019-20). Retrieved from Gujarat Electricity Regulatory Commission: https://gercin.org/wp-content/uploads/2021/04/UGVCL1911-2020-Tariff-Order-for-FY-2021-22-dtd.31.03.2021.pdf
GGRC, & NABCONS. (2016). PMKSY: District Irrigation Plan (2016-2020), Ahmedabad, Gujarat. Gujarat Green Revolution Company Limted. Retrieved from http://www.pmksy.gov.in/mis/Uploads/2016/20160816033430838-1.pdf
GHG Platform India. (2019). Retrieved from GHG Platform India: www.ghgplatform-india.org
GoG. (2014). Gujarat State Action Plan on Climate Change. Climate Change Department, Government of Gujarat. Retrieved from http://moef.gov.in/wp-content/uploads/2017/08/Gujarat-SAPCC.pdf
GPCB. (2019). GPCB Annual Report 2018-19. Govt of Gujarat, Gujarat Pollution Control Board. Gujarat Pollution Control Board, GoG. Retrieved from https://gpcb.gujarat.gov.in/uploads/AR_2018_19_ENGLISH.pdf
GPCB. (2020). Status Of CETPs In Gujarat. Retrieved from Gujarat Pollution Control Board: https://gpcb.gujarat.gov.in/webcontroller/viewpage/status-of-cetps-in-gujarat
Knowlton, K., Kulkarni S, P., Azhar, G. S., Mavalankar, D., Jaiswal, A., Connolly, M., . . . Hess, J. (2014). Development and implementation of South Asia’s first heat-health action plan in Ahmedabad (Gujarat, India). International Journal of Environmental Research and Public Health, 11. doi:10.3390/ijerph110x0000x
Lauri, M., & Dahiya, S. (2020). Analysis: India’s CO2 emissions fall for first time in four decades amid coronavirus. CarbonBrief. Retrieved from https://www.carbonbrief.org/analysis-indias-co2-emissions-fall-for-first-time-in-four-decades-amid-coronavirus
Ministry of Road Transport. (2016). Road Transport Yearbook 2015-16. Retrieved from https://morth.nic.in/sites/default/files/Road_Transport_Year_Book_2015_16_reduce.pdf
MoHUA. (2020). Swachh Survekshan 2020. Govt of India, Ministry of Housing & Urban Affairs. Retrieved from https://swachhsurvekshan2020.org/ImpDocs/SS2020fullreport.pdf?id=j3gfyu64hvx6d2cc
MSME - Development Institute. (2012). Brief Industrial Profile of Ahmedabad District. Ministry of Micro, Small & Medium Enterprises. Retrieved from http://dcmsme.gov.in/dips/dip%20ahmedabad_gu.pdf
MSME. (2014). District Industrial potentiality survey report of Ahmedabad district. MSME Development Institute. Govt of India. Retrieved from http://www.msmediahmedabad.gov.in/download/district/AHMEDABAD.pdf
NASA. (2020). Airborne Particle Levels Plummet in Northern India. NASA, Earth Observatory. Retrieved from https://earthobservatory.nasa.gov/images/146596/airborne-particle-levels-plummet-in-northern-india
Pandey, V., Patel, H. R., Lungaria, M. M., Karande, B., Yadav, S. B., Shah, A. V., & Sood, V. K. (2015, December). Climate change and its impact on major crops in Gujarat. Journal of Agrometeorology, 190-193. Retrieved from https://www.researchgate.net/publication/284725930_Climate_change_and_its_impact_on_major_crops_in_Gujarat/citations
Patel, H. R., Yadav, S. B., Lungaria, M. M., Parmar, P. K., Chaudhari, N. J., Karande, B. I., & Pandey, V. (2013). Impacts of Climate Change on Growth and Yield of Rice in Middle Gujarat Agro Climatic Region. Proceedings of National Seminar on Climate Change Impacts on Water Resources System. Retrieved from https://www.researchgate.net/publication/263619586_1_Climate_Change_Impact_on_Crop_Water_Requirements_in_South_Saurashtra_Region_of_Gujarat_State_2_Climate_Change_Analysis_for_the_Coastal_Belt_Area_of_Saurashtra_3_26_Climate_Change_Impact_on_Rainfall_
PIB. (2020). Sowing area of Kharif crops 21.2 % more compared to last year. Retrieved from https://pib.gov.in/PressReleasePage.aspx?PRID=1639340
Pillay, A. (2020). Lockdown knocked power consumption down by upto 40% in large cities. Retrieved from https://www.business-standard.com/article/printer-friendly-version?
Shah, J., & Adhvaryu , B. (2016). Public Transport Accessibility levels for Ahmedabad, India. Journal of Public Transport. Retrieved from https://www.researchgate.net/publication/305072886_Public_Transport_Accessibility_Levels_for_Ahmedabad_India
Shete, D., & Patel, N. (2013). Climate Change Impacts on Drought in North Gujarat Agroclimatic Zone: Special Reference to Ahmedabad District. Proceedings of National Seminar on Climate Change Impacts on Water Resources Systems. Retrieved from https://www.researchgate.net/publication/263619586_1_Climate_Change_Impact_on_Crop_Water_Requirements_in_South_Saurashtra_Region_of_Gujarat_State_2_Climate_Change_Analysis_for_the_Coastal_Belt_Area_of_Saurashtra_3_26_Climate_Change_Impact_on_Rainfall_

127
Spencer, T. (2020). Bending the curve: 2025 forecasts for electricity demand by sector and state in the light of the COVID-19 epidemic. Delhi: The Energy and Resources Institute. Retrieved from https://www.teriin.org/sites/default/files/2020-07/Bending-the-Curve_Report.pdf
Surya, S. (2020). Impact of COVID-19 on the power sector. PRS Legislative Research. Retrieved from https://www.prsindia.org/theprsblog/impact-covid-19-power-sector
Tejas, S., Mavalankar, D., Azhar, G. S., Jaiswal, A., & Connolly, M. (2014). Addressing heat-related health risks in urban India: Ahmedabad’s Heat Action Plan. Ahmedabad Municipal Corporation, Indian Institute of Public Health, Natural Resources Defense Council. Climate & Development Knowledge Network. Retrieved from cdkn.org: https://cdkn.org/wp-content/uploads/2014/05/Ahmedebad_Inside_Story_final_web-res1.pdf
The Economic Times. (2020). Lockdown pulls down power consumption by 22.75% to 85.05 BU in April 2020. The Economic Times. Retrieved from https://economictimes.indiatimes.com/industry/energy/power/lockdownpulls-
The Indian Express . (2020). Gujarat CM Vijay Rupani: ‘My govt enabled migrants to reach home with dignity, care. The Indian Express. Retrieved from https://indianexpress.com/article/india/gujarat-cm-vijay-rupani-my-govt-enabled-migrants-to-reach-home-with-dignity-care-coronavirus-lockdown-6418273/
The Indian Express. (2020). Gujarat: Over 16 lakh farmers sold produce worth `5,400 crore to APMCs. Ahmedabad: Indianexpress. Retrieved from https://indianexpress.com/article/cities/ahmedabad/gujarat-over-16-lakh-farmers-sold-produce-worth-rs-5400-crore-to-apmcs-6446448/
TOI. (2020, September 4). Gujarat: Fuel sales at 70% of pre-covid levels. The Times of India. Retrieved from https://timesofindia.indiatimes.com/city/ahmedabad/gujarat-fuel-sales-at-70-of-pre-covid-levels/articleshow/77922520.cms
TOI. (2020). No Covid-19 impact on sowing in Gujarat, up by 35%. Ahmedabad: Times of India. Retrieved from https://timesofindia.indiatimes.com/city/ahmedabad/no-covid-19-impact-on-sowing-in-guj-up-by-35/articleshow/75189414.cms
Vasudha Power. (2021, March). Tariff Trend by Sources. Retrieved from Vasudha Power Info Hub: https://vasudhapower.in/analytics/power-cost
WBCSD. (2020). Impact of COVID-19 on smallholder farmers - insights from India. World Business Council for Sustainable Development. Retrieved from https://www.wbcsd.org/Overview/News-Insights/WBCSD-insights/Impact-of-COVID-19-on-smallholder-farmers-in-India


Shakti Sustainable Energy Foundation (SSEF) seeks to facilitate India's transition to a sustainable energy future by aiding the design and implementation of policies in the following sectors: clean power, energy efficiency, sustainable urban transport, climate policy and clean energy finance.
Vasudha Foundation is a not for profit organization set up in April 2010 with the belief in conservation of Vasudha, which in Sanskrit means the Earth, the giver of wealth and with the objective of promoting sustainable consumption of its bounties.
The core mission is to promote environment -friendly, socially just and sustainable models of energy by focusing on renewable energy and energy efficient technologies and lifestyle solutions. Climate change mitigation is one of the key verticals of the organization. The focus is to bring about reduction in greenhouse gas emissions in the environment and ensure energy efficiency, energy security, energy independence, and sustainable development as well as simultaneously, promoting the concept of “Low Carbon Solutions” and “Green Economies'.
The Climate Change Department, established in 2009, acts as a bridge within the Government, and between the Government and the Society to address Climate Change. Gujarat is the first and only State in India, the first in Asia and fourth in the world to form an independent department for Climate Change. 'Enabling a low carbon pathway for Gujarat’s economic growth that would meet people’s aspirations with equity and inclusiveness' is among the department's key objectives. The Department works to address the concerns of Climate Change at State Level by following a multi-pronged strategy, while suitably factoring in National Action Plan on Climate Change (NAPCC), Nationally Determined Contributions (NDCs), Sustainable Development Goals (SDGs), State Action Plan on Climate Change (SAPCC).
Gujarat Ecological Education and Research (GEER) Foundation is an autonomous organization set up in 1982 by the Forests and Environment Department, Government of Gujarat. The Foundation undertakes scientific research and studies on various aspects of ecology and nature conservation, including - wildlife, forests, biodiversity and climate change, together with ecological education and extension. The ecological studies and research carried out by the Foundation have created an important source of scientific information and decision making for the Government and other stakeholders. GEER Foundation is also the designated State Center on Climate Change of Gujarat under the aegis of the DST, MoST, GoI.

CISRS House, 14 Jangpura B, Mathura Road, New Delhi, Delhi 110014
Phone: 011 2437 3680 | www.vasudha-foundation.org
Vasudha Foundation