Transport Related Social Exclusion in Ahmedabad - itc.nl
138
Transport Related Social Exclusion in Ahmedabad Kala Wati 16 th March 2009
-
Upload
khangminh22 -
Category
Documents
-
view
2 -
download
0
Transcript of Transport Related Social Exclusion in Ahmedabad - itc.nl
Transport Related Social Exclusion in Ahmedabad
Kala Wati 16th March 2009
Transport Related Social Exclusion in Ahmedabad
by
Kala Wati
Thesis submitted to the International Institute for Geo-information Science and Earth Observation in partial fulfilment of the requirements for the degree of Master of Science in Geo-information Science and Earth Observation, Specialisation: (Urban Planning and Management)
Thesis Assessment Board:
Chair: Prof. .Dr.Ir. M.F.A.M. van Maarseveen External Examiner: Drs. S.I.A. Tutert Supervisors: Dr. Ir. M.H.P. Zuidgeest Dr. J.A. Martinez
INTERNATIONAL INSTITUTE FOR GEO-INFORMATION SCIENCE AND EARTH OBSERVATION ENSCHEDE, THE NETHERLANDS
Disclaimer
This document describes work undertaken as part of a programme of study at the International Institute for Geo-information Science and Earth Observation. All views and opinions expressed therein remain the sole responsibility of the author, and do not necessarily represent those of the institute.
i
Abstract
Transport plays an integral role in the levels of mobility and socio-economic participation in a given society. Yet, traditional urban and transportation planning has neglected this important role and limit its focus on the efficiency of the transport network itself overlooking the more difficult to measure socio-economic implications. The recent paradigm shift in transport research with a renewed focus on sustainable mobility has brought to the forefront the users of the transport system. With which has come the realisation that prevalent transportation system and policies crucially impact the levels of social exclusion. Social exclusion is seen not so much as a lack of opportunities but a lack of access to those opportunities; which is severely impacted by a lack of adequate access to transport.
This research with a focus on the prevalence of transport related social exclusion in Ahmedabad, India aimed to fill the knowledge gap which exists due to a lack of research on transport related social exclusion within a developing country context. People’s perception of exclusion is integral to the conceptualisation of transport related social exclusion at a local level. Therefore in addition to analysis of transport related social exclusion at a city wide ward level; household surveys were conducted in six selected wards to provide an insight on people’s perception of the implications of a lack of access to transport on their ability to participate in the activities. Accessibility analysis was used to validate the households’ perception of exclusion in addition to providing an objective measurement of the role that transport infrastructure in facilitating access. A comparative activity space analysis based on the daily activity diary of the heads of the households was undertaken to verify if indeed there were major differences in the time budgets and the potential activity paths of the two distinct segments of the population and if it can indeed be used as a proxy indicator of social exclusion.
The city wide analysis revealed that there are spatial concentrations of transport related social exclusion in the Eastern wards of the city. With a Pearson’s correlation coefficient of 0.825, transport capital can explain 68% of the level of social exclusion across the wards (R2 of 0.68). The hot spots analysis revealed that an area based policy can be effective to some extent in alleviating the high levels of exclusion in these wards however any policy would need to take into consideration the views on the exclusion of the affected populations. In addition to affordability the elements which significantly impacted transport access for the socially excluded cluster in the study wards were infrequent public transport, temporal elements relating to the operating hours of public transport and the households’ schedule of activities. The socially excluded perceived a strong sense of transport exclusion in their access to a number of key facilities such as education and shopping with these activities being restricted to the nearest facility within walkable distances. The activity space of the excluded population was significantly smaller across all wards. These findings on transport related social exclusion has strong implication for the landuse and transport policies in Ahmedabad which may need to be more inclusive of the perceptions of the poor and provide a more conducive transport system to enable better participation in the normal activities by these currently excluded segments of the population.
Keywords: Transport related social exclusion; accessibility, perception, activity spaces.
ii
Acknowledgements
Many organisations and individuals have been instrumental in the successful compilation of this thesis. First and foremost I would like to thank the Joint Japan World Bank Graduate Scholarship Program for providing the opportunity to undertake an MSc at ITC. Due thanks are accorded to my two supervisors who provided the necessary guidance and at the same time believed in my capabilities to undertake independent research. Dr. Ir. Mark Zuidgeest thanks for introducing me to the city of Ahmedabad and for your continued academic and emotional support and guidance during the thesis; your passion for transport, in particular the use of non-motorised transport is very inspiring. Dr. Javier Martinez for highlighting the various facets of urban poverty and deprivation during the academic year which combined with transport provided an interesting MSc to pursue. The UPM staff for the excellent academic guidance during the programme and in particular the two programme directors at various periods of the course, Emile and Monika for your support and academic assistance. Frans your kindness and encouragement during the course and the fieldwork in particular have been highly appreciated.
During the field work much needed support was provided from a number of individuals. The staff and students of CEPT; in particular Mr. Talat Munshi, Ajay Katuri and Rupesh for introducing me to the much acclaimed Indian hospitality and providing the necessary support to undertake the fieldwork; Professor Sharma; Sandeep; Pratik; Sejal Patel, Dr. C N Ray, Arindham, Mousumi and Deepty for sharing their knowledge of Ahmedabad, its transport and social exclusion issues. I am indebted to Saath; Mr.Rajendra Joshi, Arpisha Rajpurohit and Chinmayi Desai for providing the much needed profile of slums and chawls in Ahmedabad. And to the fellow ITC – UT researchers in Ahmedabad, thanks, I learnt something valuable from each of you during the fieldwork.
On a personal front, due thanks are accorded to my UPM colleagues, Evy and Oi for keeping me sane at the best of times, Evy for the long personal chats and the much needed encouragement ; Oi for all the technical assistance that you provided. Reshma, Tahera and the rest of the UPM students for the comradeship of 18 months.
Last but not the least special thanks to my mom and two sisters and their respective spouses; Sarita and Savita with Vishal for the much needed emotional support and for their continued encouragement for me to pursue my dreams. This thesis is dedicated to my mom whose perseverance in life and selfless love made this 18 months academic journey feasible.

iii
Table of contents 1. Introduction ......................................................................................................................................1
1.1. Backgound ..............................................................................................................................11.2. Research Problem ...................................................................................................................21.3. Research Objectives................................................................................................................3
1.3.1. Sub Objectives....................................................................................................................31.4. Research Questions.................................................................................................................41.5. Conceptual Framework...........................................................................................................51.6. Research Design......................................................................................................................71.7. Limitations of this Research ...................................................................................................81.8. Organisation of Thesis ............................................................................................................9
2. A Theoretical Perspective on Transport Related Social Exclusion................................................112.1. Social Exclusion; the Origins and Definitions......................................................................112.2. Social Exclusion and Poverty ...............................................................................................11
2.2.1. The Assets / Vulnerability Framework for Poverty and Deprivation Analysis ................132.2.2. Social Exclusion and Poverty Studies within the Indian Context ....................................14
2.3. Urban Transport ....................................................................................................................152.4. The Interrelationship between Transport and Social Exclusion ...........................................152.5. Manifestations of Transport Related Social Exclusion.........................................................16
2.5.1. Spatial Exclusion ..............................................................................................................162.5.2. Economic Exclusion .........................................................................................................172.5.3. Affordability Based Exclusion .........................................................................................182.5.4. Physical Exclusion............................................................................................................182.5.5. Fear Based Exclusion .......................................................................................................182.5.6. Temporal Exclusion..........................................................................................................182.5.7. Infrastructure Based Exclusion.........................................................................................192.5.8. Exposure to Negative Externalities ..................................................................................19
2.6. Approaches Explored in Analysing Transport Related Social Exclusion.............................202.6.1. Accessibility Measures .....................................................................................................202.6.2. Space Time Activity Measures.........................................................................................212.6.3. Peoples Perception of Transport Related Social Exclusion..............................................232.6.4. Limitations of Place Based and Individual Accessibility Measures.................................23
2.7. Summary of Chapter .............................................................................................................243. An Introduction to Ahmedabad City ..............................................................................................25
3.1. A Brief Overview..................................................................................................................253.2. Urban Planning Policies and By-laws...................................................................................26
3.2.1. Types of Residential Zones and their Respective FSI’s ...................................................273.3. Urban Population ..................................................................................................................273.4. Urban Form...........................................................................................................................283.5. Social Exclusion in Ahmedabad ...........................................................................................29
3.5.1. Slums and Chawls as Concentrations of Social Exclusion...............................................303.6. Urban Transport ....................................................................................................................333.7. Summary ...............................................................................................................................36
4. Methodology ..................................................................................................................................37

iv
4.1. The Ahmedabad Fieldwork.................................................................................................. 374.1.1. The Questionnaire Design and Variables ........................................................................ 374.1.2. Selection of Study Wards ................................................................................................ 384.1.3. Household Selection ........................................................................................................ 394.1.4. The Procedure for Conducting the Household Surveys................................................... 414.1.5. Data Validation and Reliability Check ............................................................................ 414.1.6. Limitations in Primary Data Collection........................................................................... 414.1.7. Secondary Data................................................................................................................ 42
4.2. Data Entry and Analysis ...................................................................................................... 424.2.1. City Wide Analysis of Transport Related Social Exclusion at a Ward Level ................. 424.2.2. Analysing the Different Manifestations of Transport Related Social Exclusion in the Case Study Area ............................................................................................................................ 43
4.3. Summary .............................................................................................................................. 435. Transport Related Social Exclusion at a Ward Level in Ahmedabad............................................ 45
5.1. Methodological Approach Used in Constructing the Indicators .......................................... 455.2. The Types of Capitals Deemed Instrumental in Defining Exclusion at a Ward Level in Ahmedabad........................................................................................................................................ 465.3. Ward-wise Overall Exclusion Level and Specific Capital Exclusion Results ..................... 50
5.3.1. Spatial Concentration of Excluded Wards....................................................................... 535.3.2. The Relationship between Slum and Chawl Population and the Level of Social Exclusion 57
5.4. Summary of Findings........................................................................................................... 585.5. Limitations in Area (Ward) Based Analysis of Transport Related Social Exclusion .......... 59
6. Manifestations of Transport Related Social Exclusion in the Selected Wards of Ahmedabad ..... 606.1. Socio-Economic Charateristics of the Surveyed Households .............................................. 60
6.1.1. Stratification of the Surveyed Households ...................................................................... 606.1.2. Housing Typology ........................................................................................................... 626.1.3. Income Levels.................................................................................................................. 646.1.4. Education Levels ............................................................................................................. 656.1.5. Employment Types.......................................................................................................... 656.1.6. Vehicle Ownership .......................................................................................................... 66
6.2. Manifestations of Transport Related Social Exclusion ........................................................ 666.2.1. Affordability Based Exclusion ........................................................................................ 676.2.1.1 Affordability of Private Transport............................................................................. 676.3.1.2 Affordability of Public Transport.............................................................................. 696.2.2. Temporal Exclusion......................................................................................................... 716.2.2.1 Infrequent Public Transport..................................................................................... 726.2.2.2 Operating Hours of Buses ........................................................................................... 726.2.2.3 Households Schedule of Activities and Use of Time ................................................ 736.2.3. Fear Based Exclusion ...................................................................................................... 746.2.3.1 Fear of Road Accidents ........................................................................................... 746.2.3.2 Fear of Safety .......................................................................................................... 766.2.4. Exposure to Negative Externalities.................................................................................. 776.2.4.1 Noise Exposure........................................................................................................ 776.2.4.2 Air Pollution Exposure ............................................................................................ 786.2.5. Infrastructure Based Exclusion........................................................................................ 79
v
6.2.6. Economic Exclusion .........................................................................................................806.2.7. Spatial Exclusion ..............................................................................................................816.2.8. Social Interaction..............................................................................................................83
6.3. Summary of Findings............................................................................................................846.4. Limitations in the Analysis of Peoples Perception of the Different Manifestations of Transport Related Social Exclsuion ...................................................................................................85
7. Accessibility and Spatial Exclusion .............................................................................................867.1. Accessibility Analysis...........................................................................................................86
7.1.1. Educational Facilities .......................................................................................................867.1.2. Accessibility to Education Facilities ................................................................................877.1.3. The Differential Accessibility Levels Based on the Two Networks.................................897.1.4. Walking Distances to Bus Stops.......................................................................................91
7.2. Activity Space as a Measure of Social Exclusion.................................................................927.2.1. Confidence Ellipse Based Activity Space Analysis .........................................................927.2.2. Buffered Network Path based Activity Space Analysis ...................................................937.2.3. Potential Path....................................................................................................................947.2.4. Temporal Element in Activity Space Analysis.................................................................977.2.5. Summary of Findings .......................................................................................................987.2.6. Limitations........................................................................................................................99
8. Conclusion and Recommendations ..............................................................................................1008.1. Summary of Findings..........................................................................................................100
8.1.1. Theoretical Concepts ......................................................................................................1008.1.2. Methodological Approaches to Measuring Transport Related Social Exclusion ...........1018.1.3. Prevalence of Transport Related Social Exclusion in Ahmedabad ................................102
8.2. Concluding Remarks...........................................................................................................1038.3. Urban Policy Recommendations.........................................................................................1048.4. Recommendations for Further Studies................................................................................105
9. Glossary........................................................................................................................................10610. References ...............................................................................................................................10811. Appendix .................................................................................................................................115
11.1. Households Perception of Exclusion from Educational Facilities ......................................11511.2. Sample Activity Spaces by Modes .....................................................................................11611.3. Sample Ellipse based Activity Space for the two Clusters .................................................11711.4. Daily Travel Times of the Excluded Cluster and the Well-off Cluster...............................11711.5. Road Accidents in Ahmedabad...........................................................................................11811.6. Household Questionnaire....................................................................................................119

vi
List of figures
Figure 1.1: Conceptual Framework ......................................................................................................... 7Figure 1.2: Research Design.................................................................................................................... 8Figure 2.1 Space Time Path of an Individual ........................................................................................ 22Figure 3.1: The Location of Ahmedabad City....................................................................................... 25Figure 3.2: Growth of Urban Land Area (km2) in Ahmedabad from 1872- 2001................................. 26Figure 3.3: Population Growth per Ward (1991 – 2001) and the Landuses within Ahmedabad City .. 27Figure 3.4: Facets of Ahmedabad City.................................................................................................. 29Figure 3.4: Ward-wise Slum and Chawl Population as a Percent of the Total Ward Population ......... 32Figure 3.5: Maninagar - Depicting the Chaotic Street Scene which seems to be the Norm of the Commercial Areas of Ahmedabad......................................................................................................... 33Figure 3.6: Number of vehicles in Ahmedabad (1971 – 2006) ............................................................. 33Figure 3.7: Number of Buses on the Roads of Ahmedabad (1961 – 2007)........................................... 34Figure 3.8: Number of Bus Passengers in Ahmedabad (1961 – 2007) ................................................. 34Figure 3.9: Low Income Households and Mode of Transport Used per TAZ....................................... 35Figure 4.1: Location of Selected Wards within Which Households Were Surveyed............................ 39Figure 4.2: Selection of Households Based on Google Earth Images ................................................... 40Figure 4.3: Comparative Percentage of Surveyed and Actual Slum and Chawl Households per Ward 40Figure 4.4: Response to Household Survey in Vasna Ward.................................................................. 41Figure 5.1: Approach Utilised for Analysing Transport Related Social Exclusion at a Ward Level .... 45Figure 5.2: Conceptualisation of the Indicators of Transport Related Social Exclusion in Ahmedabad............................................................................................................................................................... 47Figure 5.3: Percentages of Unpaved Roads in Ahmedabad .................................................................. 49Figure 5.4: Social, Human, Financial and Physical Capital Index per Ward ........................................ 50Figure 5.5: Political, Transport and Overall Social Exclusion Index (Inclusive and Exclusive of Transport Capital per Ward ................................................................................................................... 51Figure 5.6: Distribution of the Indices for the Various Capitals and Social Exclusion......................... 53Figure 5.7: Spatial Correlation of Social Exclusion in Ahmedabad...................................................... 54Figure 5.8: Spatial Correlation of Transport Capital Exclusion in Ahmedabad.................................... 55Figure 5.9: Spatial Comparison of Exclusion Levels with the Percentage of Slum and Chawl Population per Ward.............................................................................................................................. 57Figure 6.1: Stratification of Households and Process for Perception Analysis ..................................... 61Figure 6.2: Spatial Location of the Two Clusters of Households.......................................................... 62Figure 6.3: Examples of Some of the Housing Types in Ahmedabad................................................... 63Figure 6.4: Composition of the Housing Types for the Two Clusters per Ward................................... 63Figure 6.3: Ward-wise Income Typology per Cluster ........................................................................... 64Figure 6.4: Ward-wise Head of Households Education Typology per Cluster ..................................... 65Figure 6.5: Ward-wise Head of Households Employment Typology per Cluster................................. 65Figure 6.6: Ward-wise Households Vehicle Ownership per Cluster..................................................... 66Figure 6.7: Households Perception of Exclusion from Use of Transport.............................................. 67Figure 6.8: Household Ownership of Motorised Vehicles per Cluster ................................................. 67Figure 6.9: Mode of Transport Used by the Head of Household .......................................................... 68Figure 6.10: Reason for Mode Choice of Walking and Cycling by the Head of Household ............... 69Figure 6.11: Household Reason for Not Using Public Transport......................................................... 70
vii
Figure 6.12: Changes in Average Bus Fares over Time.........................................................................70Figure 6.13: Willingness to Change from Current Mode to Public Transport .......................................71Figure 6.14: Percentage of Household Experiencing Limitations in Their Access to Transport Due To Infrequent Public Transport ...................................................................................................................72Figure 6.17: Percentage of Household Experiencing Limitations in Their Access to Transport Due to the Operating Hours of Buses ................................................................................................................73Figure 6.16: Percentage of Household Experiencing Limitations in Their Access to Transport Due to the Their Own Schedule of Activities ....................................................................................................74Figure 6.17: Road Accidents in Ahmedabad (1961- 2007)....................................................................74Figure 6.18: Road Casualties by Transport Mode for the year 2002 .....................................................75Figure 6.19: Accident Rates in Ahmedabad...........................................................................................75Figure 6.20: Percentage of Household Experiencing Limitations in Their Access to Transport Due to a Fear of Road Accidents ..........................................................................................................................76Figure 6.21: Percentage of Household Experiencing Limitations in Their Access to Transport Due to a Fear of Safety .........................................................................................................................................76Figure 6.22: Percentage of Household Experiencing Traffic Induced Noise Exposure.........................78Figure 6.23: Percentage of Household Experiencing Traffic Induced Air Pollution .............................79Figure 6.24: Percentage of Household Experiencing Infrastructure Based Exclusion...........................79Figure 6.25: Percentage of Employed Population per Ward..................................................................80Figure 6.26: Percentage of Household Experiencing Limitations in Their Access to Employment Opportunities..........................................................................................................................................81Figure 6.27: Percentage of Household Experiencing a Limitation in their Choice of Activities...........81Figure 6.28: Percentage of Household Experiencing a Limitation in their Access to Educational Facilities .................................................................................................................................................82Figure 6.29: Percentage of Household Experiencing a Limitation in their Access to Health Facilities 83Figure 6.30: The Frequency of Social Interaction in the Two Clusters per Ward .................................83Figure 6.31: Elements Which Hinder Access to Adequate Transport...................................................84Figure 7.1: Numbers and Percentages of Illiterate Population per Ward in Ahmedabad.......................86Figure 7.2: Comparative Accessibility Analysis based on the Existing and the Virtual Network.........87Figure 7.3: Example of the Real and the Combined Real and Virtual network in Vasna ......................88Figure 7.4: Locations of Public Primary Schools and Ward-wise Population per Hexagon.................89Figure 7.5: Walk Times to Schools with the Existing Network and the Combined Virtual and Existing Network..................................................................................................................................................89Figure 7.6: Ward-wise Existing Network based Percentage of Total Population within Classified Walk Times to Primary Schools ......................................................................................................................90Figure 7.7: Ward-wise Combined Virtual and Existing Network based Percentage of Total Population within Classified Walk Times to Primary Schools.................................................................................90Figure 7.8: Households Perception of the Significance that Transport Plays in Education Accessibility Compared with the Travel Times in Sample Ward of Vasna.................................................................91Figure 7.9: Walking Distances to Bus Stops..........................................................................................92Figure 7.10: Confidence Ellipses with Varying Standard Deviations and the Comparison of Ellipse Based and Network Based Activity Space .............................................................................................93Figure 7.12: An Example of a Buffered Network Path and Buffered Motorcycle Trips .......................94Figure 7.13: Activity Space of the Excluded Cluster and the Well-off Cluster with Travel Times.......95Figure 7.14: Sample Travel Paths for Excluded and Well-off Households ...........................................97Figure 7.15: Sample Travel Paths for Excluded and Well-off Households by Travel Modes ...............98
viii
List of tables
Table 4.1: Characteristics of the Selected Wards .................................................................................. 39Table 5.1: Descriptive Statistics for the Levels of Exclusion per Ward................................................ 52Table 5.2: Correlations between the Overall Social Exclusion per Ward and the Different Capitals of Exclusion ............................................................................................................................................... 56Table 5.3: The Top Fifteen Wards with the Highest Levels of Social Exclusion ................................. 58Table 6.1: Households in the Two Clusters per Ward........................................................................... 61Table 6.2: Correlation between Income Level and Classified Strata .................................................... 64Table 6.3: Correlation between Cluster Type and Non-Motorised Vehicle Ownership ....................... 68Table 6.4: Household Daily Travel Expenses ...................................................................................... 69Table 6.5: Noise Standards Set by CPCB.............................................................................................. 77Table 7.1: Activity Spaces of Heads of Households in Hectares .......................................................... 96Table 7.2: Correlation between Activity Spaces of Households and the Cluster .................................. 96

ix
List of Acronyms
AMC Ahmedabad Municipal Corporation AMTS Ahmedabad Municipal Transport Service AUDA Ahmedabad Urban Development Authority CEPT Centre for Environmental Planning and Technology University IPTS Integrated Public Transit System FSI Floor Space Index SEWA Self Employed Women’s Association GIDB Gujarat Infrastructure Development Board RSPM Respiratory Suspended Particulate Matter SPM Suspended Particulate Matter TAZ Traffic Analysis Zones

x
1
1. Introduction
This introductory chapter sets the scene for this research by providing the background to the research problem and establishing the research aims and objectives. The conceptual framework highlights the theoretical context identifying the elements that contribute to and the manifestations of transport related social exclusion. This together with the research design establishes the framework for this research.
1.1. Backgound
Social exclusion is rapidly becoming a critical urban policy issue globally (Câmara et al., 2001; Hine, 2003; Lucas, 2004). The discussions on social exclusion have evolved to focus not only on the social aspects of exclusion but also its interrelationship with the urban fabric with observations that the socially excluded persons are also excluded from certain parts of the urban environment. The inequitable distribution of urban resources has always been a trait of urban areas, however, social exclusion which looks into inequities amongst groups of people is receiving increasing attention in planning policy research (Lyons, 2003). With an increasing recognition and acceptance that, the enforcement and/or a lack of certain planning by-laws and regulations initiates and aggravates the levels of social exclusion experienced by sections of the population ; various local, national and multi national organisations, in the developed countries, have established research and planning units to explore and provide mitigating policies for reducing the levels of social exclusion (Cabinet Office, 2008; Cork City Council, 2005; Council of the European Union and The European Commission, 2004; Urbact Secretariat, 2008).
Social exclusion is generally understood to have much wider implications than poverty and deprivation. Church (2000; pg. 197) defines socially excluded population as those “that are not just poor, but that have additionally lost the ability to both literally and metaphorically connect with many of the jobs, services, and facilities that they need to participate fully in society”. According to Vranken (2001), social exclusion implies the fulfilment of two conditions; “a hierarchical relationship between individuals, positions or groups and a separation by clearly discernable fault lines, where fault lines manifest themselves as barriers or walls and create a division between society”. One such fault line is the inaccessibility to and the inadequate provision of the transportation system. Whilst the concept of social exclusion itself is not new, the recognition of the implications of transport on social exclusion is a relatively new direction in transport policy and has attracted growing interest and political acceptability especially in the United Kingdom (Church et al., 2000; Hodgson and Turner, 2003).
“The history of transport has always been closely allied with that of urban development, and transport infrastructure is often responsible for shaping the layout of towns and cities and thus determining where people live, work, shop, go to school and carry out leisure activities” (Lucas, 2004). Traditional planning has often overlooked the important role of transport in providing access to services due to a focus on the efficiency of the network itself rather than the users of the transportation system and their travel needs. However given the recent emphasis on sustainable mobility, increasing attention is being devoted to the social dimensions of transport with a focus on the users of the system whether they are on foot or in vehicle (Banister, 2008). Transport plays a critical role in the level of social exclusion experienced by people arising
TRANSPORT RELATED SOCIAL EXCLUSION IN AHMEDABAD, INDIA
2
from poor access to the transport system due to factors such as time and financial budgets of individuals and an absence of adequate transport infrastructure and services.
Access to the transportation system can be a significant problem for those already experiencing social exclusion. The costs of accessing and using the transport system determine the activities that an individual takes part in. People are less likely to engage in travel and are therefore less likely to participate fully in society when they perceive the generalised cost of travel to be relatively high. The perceived high costs of the transportation system can limit the travel choices for the socially excluded population which in turn lowers their chances of entering job markets and restricts their livelihood options with high costs of living (Schönfelder and Axhausen, 2003). The recognition of the critical role of transport in fostering social exclusion by limiting access to services and facilities has spurred the recent state of research in transport related social exclusion in Europe.
However despite the high numbers of the population being socially excluded in the developing countries, very little attention has been given to social exclusion per se with limited or no research carried out on its interrelationship with other elements of the built environment such as transport. With an inability to access public transport and afford private transport; the mode of travel for the socially excluded persons is often restricted to non motorised transport modes of walking and cycling in many developing countries which is associated with long and tedious travel. These modes also get the least priority in the usage of the roads which not only impacts the travel costs in terms of travel time for the excluded but also increases their vulnerability to road accidents and exposure to traffic noise and pollution.
1.2. Research Problem
The urban population of the developing countries is expected to almost double its 2005 figure of 2.3 billion to 3.9 billion by 2030 (Un - Habitat, 2006; United Nations Department of Economic and Social Affairs; Population Division, 2006). Based on the current trends of growth and declining residential densities (as has been observed in recent studies undertaken by the World Bank), by 2030 these urban areas can be expected to triple their land area raising serious urban planning issues associated with this projected rapid urban sprawl (Angel et al., 2005). India is expected to be the largest contributor to the world population growth by far, adding around 570 million persons by 2050 (United Nations Department of Economic and Social Affairs; Population Division, 2005). With rapid urbanisation, amongst other factors, some of the Indian city planning regulations such as the low floor space index (FSI) and difficulties in land recycling has a detrimental impact on the use of urban space and the spatial structure of cities by encouraging development in the periphery of urban areas (Mohan, 2001). The effects of sprawl in developing countries particularly due to their limited budgets for investing in key infrastructure such as the transportation system, is envisaged to have a detrimental impact on the levels of social exclusion experienced by the population.
Social exclusion as an important planning concept has been receiving increasing research and policy attention in the developed countries with the emergence of concepts such as, ‘social exclusion’ in the United Kingdom and ‘just transport’ within the realm of ‘environmental justice’ in the United States; However this concept has yet to be embraced in the policy research of many of the developing countries and has rarely been looked into from a developing city’s perspective.
3
Ahmedabad, a city in India is home to approximately four million people, with forty percent of its population residing in slums and ‘chawls’. The city has poor provision of footpaths for pedestrians and an inadequate public transport system to provide for the transport needs of the poor particularly for those residing in the outskirts of the city. With an almost stagnant transport infrastructure, the rapid growth in population and the number of vehicles on road is felt in the presence of congested road networks with high rates of pollution. The lack of adequate transportation system in the form of poor transport links and unsafe and polluted networks is envisaged to have reduced the level of integration into society of the poor and excluded population.
Despite high rates of exclusion in Ahmedabad and the significance of transport in the level of exclusion experienced by the poor, research has yet to be been undertaken to determine how social exclusion is impacted by the prevailing transport system. Given the background of high urbanisation rates coupled with the growth in the number of people living in slums and the poor performance of the transportation system; with little or no research carried out on the consequences of the prevailing transport system on the social exclusion of the people, research in Ahmedabad can provide valuable insights into the relationship between transport and social exclusion from a developing country’s perspective.
This research will look into the travel needs of people who are perceived to be socially excluded and how the access or the lack of access to the transport system impacts on the level of social exclusion. Research on transport related social exclusion has been predominantly undertaken in the developed countries which has focused on either the category approach which is widely used; or the spatial approach (Church et al., 2000). The category approach looks at the travel patterns, attitudes and needs of particular social groups such as women, the disabled or the elderly and rarely considers the detailed geographical factors such as the interrelationship between residential locations and activities that people want to participate in whilst the spatial approach has generally focused primarily on accessibility dimensions of transport and social exclusion with little attention to the actual travel needs of the people (Church et al., 2000). A combination of both methods will be undertaken in this research to provide a better understanding of the categorical and spatial relationship between transportation and social exclusion in the Ahmedabad context.
1.3. Research Objectives
The overall objective of this thesis is to analyse how access to and the availability of transport impacts the levels of accessibility to and hence the participation in key activities by the different socio-economic classes of people. The cumulative effects of the individual characteristics of the socially excluded, the transport system, land use patterns, the planning system and temporal elements results in critical manifestations of transport related social exclusion. The applicability of these manifestations and peoples’ perception of them will be explored to establish the prevalence of transport related social exclusion in Ahmedabad and the implications of transport on the abilities of the socially excluded population to participate fully in the society.
1.3.1. Sub Objectives
The following sub objectives establish the framework of this research which focuses on the significance of transport related social exclusion in Ahmedabad, India:
1. Define transport related social exclusion and the methodological approaches used in measuring the manifestations of this exclusion
TRANSPORT RELATED SOCIAL EXCLUSION IN AHMEDABAD, INDIA
4
2. Identify the factors contributing to and the levels of transport related social exclusion applicable at a city wide ward level in Ahmedabad
3. Determine the applicability and the relative importance of the different manifestations of transport related social exclusion in selected wards of Ahmedabad.
4. Study the implications of access to and the usage of transport on the activity spaces of the socially excluded households
1.4. Research Questions
The research questions related to the four sub objectives are: Sub objective (1) - Define transport related social exclusion and the methodological approaches used in measuring the manifestations of this exclusion
� What is social exclusion and what significance does it play in urban planning policy research? � What is transport related social exclusion? � What are the various manifestations of transport related social exclusion? � What methods have been explored in analysing transport related social exclusion
Sub objective (2) - Identify the factors contributing to and the levels of transport related social exclusion applicable at a city wide ward level in Ahmedabad
� How can the levels of social exclusion be quantified at city wide ward level? � What elements of the transportation system hinder the access to essential services? � Is transport related social exclusion concentrated spatially? � Which ward within the case study area can be identified as the most excluded based on transportation
factors in the study area? � What is the correlation between transport and the levels of social exclusion experienced at a ward
level? � How significant is the relationship between transport and the levels of exclusion experienced in
Ahmedabad?
Sub objective (3) Determine the applicability and the relative importance of the different manifestations of transport related social exclusion in selected wards of Ahmedabad.
� What modes of transport are available to and used by the residents for their daily travel needs and what factors contribute to and what are the implications of the mode choices?
� Which manifestations of transport related social exclusion are applicable in the selected study area? � What are the residents’ perceptions of these manifestations? � What are the implications of lack of adequate access to transport on the levels of participation in the
selected case study area? � What is the linkage between people’s perception of the role of transport in accessibility to facilities to
the modelled travel time to these facilities?
Sub objective (4) Study the implications of access to and the usage of transport on the activity spaces of the socially excluded households
� What is the geographical extent of the head of households’ activity space for the socially excluded population?
5
� How different is the activity space and travel times of the heads of households of the socially excluded populations when compared to other segments of the population?
� Does transportation access and usage have any impact on the activity space of the socially excluded households and can this be used as a proxy indicator of transport related social exclusion in Ahmedabad?
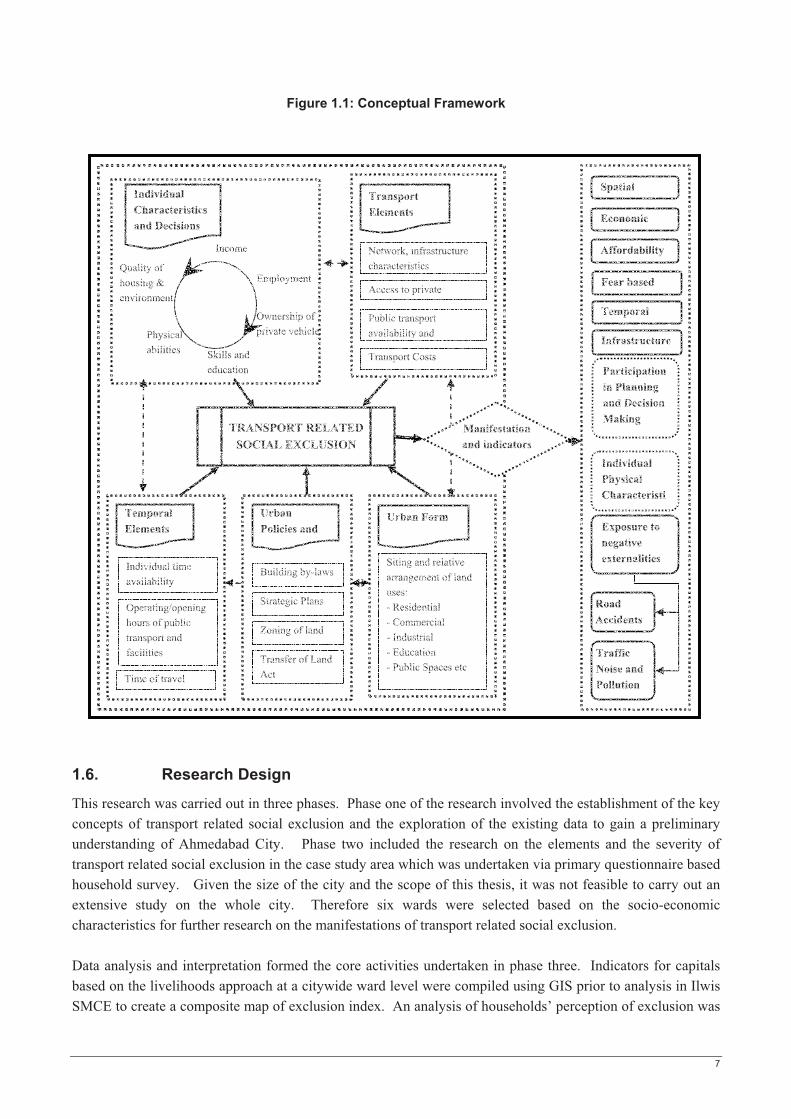
1.5. Conceptual Framework
Transport related social exclusion results from a complex interaction of individual characteristics of persons and households; the transportation and landuse system; temporal elements and urban planning policies. Over time social exclusion of sections of the population is reinforced by the transportation system as a result of complex interactions between transport and land use patterns. The overall effect of these interactions is the creation of ‘accessibility deficit’ amongst low income and excluded groups, which serves to ‘lock them out’ of the activities that is essential to support a reasonable quality of life (Lucas, 2004).
Inadequate transportation systems coupled with increasing levels of urbanisation in the developing cities pushes the poor into marginalized areas and limits their access to essential resources such as employment, health and educational facilities exacerbating their levels of social exclusion. In addition to the loss of economic opportunities, this spatial residential segregation can create a corresponding decrease in social contacts and networks as the daily activity spaces of different social groups become more disjointed, reducing exposure and the possibilities for contact and interaction (Miller, 2004).
Travel is a derived demand and is generally not an activity that people wish to undertake for its own sake with exceptions such as those who travel specifically for leisure purposes. The two underlying principles which are considered in most transport analysis are that people travel due to the value of the activity at the end of travel and that people try to minimise their generalised cost of travel (Banister, 2008). “Unequal access to transport is indicated by disparities in use and ownership of transport means; availability and utility are essential qualities: who can utilize specific means of transport at and during what time and for what purposes” (De Boer, 1986 pg. 135). It is increasingly accepted that access to transport is a key issue in tackling unemployment, poor skills, low incomes, poor housing, high crime, bad health and family breakdown (Dobbs, 2005). For the socially excluded, the key elements of concern generally relate to affordability, availability and accessibility to public transport system and generally they have low accessibility to public transport because they may have less demand for public transport due to the costs which results in decreased services (Root, 2003).
The prevalent transportation system may be adequate in itself, but the combination of individual characteristics of households, temporal elements and the landuse characteristics can lead to transport related social exclusion. The urban form depicts amongst the relative location of landuses, the differential location of residential areas for the various socio-economic groups. The spatial location of differential residential areas is one of the most visual manifestations of social exclusion with spatial segregation being the most visible and evident form of exclusion (De Boer, 1986). Those living in a socially excluded neighbourhood usually not only suffer from low levels of accessibility to facilities but also experience sense of failure, rejection and shame over where they live.
TRANSPORT RELATED SOCIAL EXCLUSION IN AHMEDABAD, INDIA
6
Temporal elements compound transport related social exclusion where the difficulties of organising commitments to allow adequate time for travel given network constraints and the availability and frequency of public transport affects many individuals and more so the excluded due to their precarious situation. The opening hours of facilities, the operating hours of the public transport system and the time of travel plays an important role in the accessibility to essential services and hence could increase the level of exclusion if these do not coincide with the time budgets of individuals and the periods they feel safe and comfortable travelling in.
Urban planning policies dictate the density of urban development and the type of landuses that occur within a city. The enforcement of certain planning policies such as those promoting low residential densities can lead to urban sprawl; which in many developing countries has a detrimental impact on the distances and the quality of travel required for accessing important activities. Transport policies regulate the provision of transport infrastructure and public transport services Planning laws also oversee the operating hours of business, entertainments centres etc which may not be suitable for the time budgets of groups of people. Casual labourers, who work long hours, often lack access to shopping facilities and medical attention amongst other services, due to these enforced operating hours.
Individual characteristics of households influence the level of social exclusion experienced by them. The financial commitments and characteristics for example determine the affordability to private and public transport. A household living in close proximity to the CBD, could have very efficient and timely public transport service available, however if the household is unable to afford it, they would still suffer transport related social exclusion.
Transport related social exclusion was conceptualised as field of urban policy reform and research within the United Kingdom. However despite the integration of social exclusion as a concept in the policy framework in the United Kingdom, no specific indicators per se have been developed for it. Therefore social exclusion is depicted primarily through the elements of multiple deprivation which in the UK though being very versatile (changing every few years); include income deprivation, employment deprivation , health deprivation and disability, education, skills and training deprivation, barriers to housing and services, crime and the living environment deprivation domains (Communities and Local Government, 2004). Inadequate access to the transportation system is looked into as one of the contributing factors to these different types of deprivation such as a lack of access to essential services with indicators of exclusion being the number of services and facilities available within predefined walking thresholds.
This research aims to categorise the manifestations of transport related social exclusion in Ahmedabad with some modifications, based on previous research carried out by Church, Frost and Sullivan (2000) where they identified seven different classes of exclusion, namely; spatial, economic, financial, fear based, temporal and infrastructure based exclusion.
7
Figure 1.1: Conceptual Framework
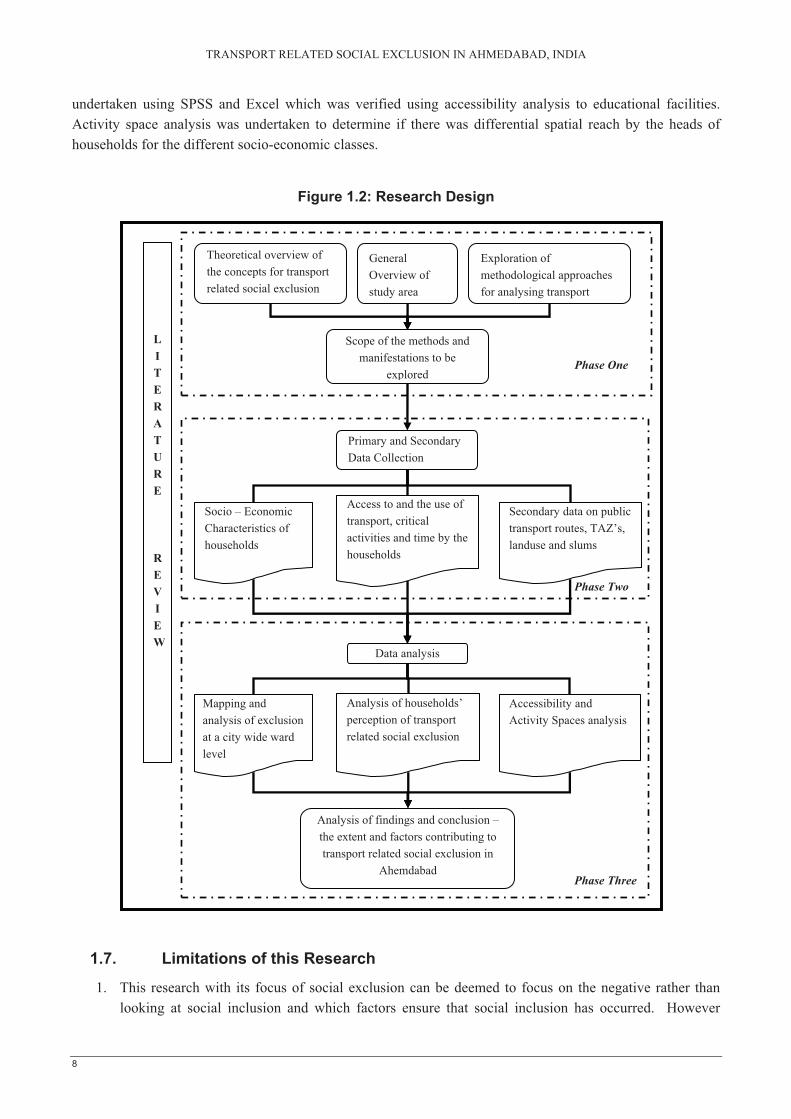
1.6. Research Design
This research was carried out in three phases. Phase one of the research involved the establishment of the key concepts of transport related social exclusion and the exploration of the existing data to gain a preliminary understanding of Ahmedabad City. Phase two included the research on the elements and the severity of transport related social exclusion in the case study area which was undertaken via primary questionnaire based household survey. Given the size of the city and the scope of this thesis, it was not feasible to carry out an extensive study on the whole city. Therefore six wards were selected based on the socio-economic characteristics for further research on the manifestations of transport related social exclusion.
Data analysis and interpretation formed the core activities undertaken in phase three. Indicators for capitals based on the livelihoods approach at a citywide ward level were compiled using GIS prior to analysis in Ilwis SMCE to create a composite map of exclusion index. An analysis of households’ perception of exclusion was
Urban Form
Siting and relative arrangement of land uses: - Residential - Commercial - Industrial - Education - Public Spaces etc
Temporal Elements
Individual time availability
Operating/opening hours of public transport and facilities
Time of travel
Individual Characteristics and Decisions
Income
Employment
Physical abilities
Quality of housing & environment
Skills and education
Ownership of private vehicle
Transport Elements
Network, infrastructure characteristics
Public transport availability and
Access to private
Transport Costs
TRANSPORT RELATED SOCIAL EXCLUSION
Urban Policies and
Building by-laws
Zoning of land
Transfer of Land Act
Strategic Plans
Manifestation and indicators
Traffic Noise and Pollution
Spatial
Economic
Affordability
Fear based
Temporal
Infrastructure
Exposure to negative externalities
Participation in Planning and Decision Making
Road Accidents
Individual Physical Characteristi
TRANSPORT RELATED SOCIAL EXCLUSION IN AHMEDABAD, INDIA
8
Phase Two
LITERATURE
REVIEW
Theoretical overview of the concepts for transport related social exclusion
General Overview of study area
Exploration of methodological approaches for analysing transport
Scope of the methods and manifestations to be
explored
Primary and Secondary Data Collection
Socio – Economic Characteristics of households
Access to and the use of transport, critical activities and time by the households
Secondary data on public transport routes, TAZ’s, landuse and slums
Data analysis
Mapping and analysis of exclusion at a city wide ward level
Analysis of households’ perception of transport related social exclusion
Accessibility and Activity Spaces analysis
Analysis of findings and conclusion – the extent and factors contributing to transport related social exclusion in
Ahemdabad
Phase One
Phase Three
undertaken using SPSS and Excel which was verified using accessibility analysis to educational facilities. Activity space analysis was undertaken to determine if there was differential spatial reach by the heads of households for the different socio-economic classes.
Figure 1.2: Research Design
1.7. Limitations of this Research
1. This research with its focus of social exclusion can be deemed to focus on the negative rather than looking at social inclusion and which factors ensure that social inclusion has occurred. However
9
given the lack of research in this field within the context of a developing city and the perceived high incidences of transport related social exclusion in the study area, it was deemed imperative that this research be undertaken to provide a better understanding of the this social exclusion phenomenon within a developing country context. The extent of transport related social exclusion needed to be identified first prior to any policy formulation for ensuring social inclusion can be tackled.
2. The timing of the collection of data for activity space analysis was restricted to a one day recall method where respondents were asked to list the activities they had undertaken during the day or on a normal working day. For a more exhaustive analysis it may be better to use daily filled in diaries for a week which would give better travel patterns, however given the time frame of research and the educational levels of the respondents only one day’s activity schedule of the head of household survey was carried out.
3. Whilst the availability of and access to information and communication technology does impact on the level of exclusion in the society which may impact on the need for travel, it is beyond the scope of this thesis to look into its role and impacts on social exclusion in the Ahmedabad context.
1.8. Organisation of Thesis
This thesis is organised into eight chapters; commencing with chapters introducing the research, the theoretical concepts and the study area followed by the methodological approaches used, the analysis of transport related social exclusion in Ahmedabad and the selected wards prior to chapters relating to the summarised findings and conclusion. The following provides a brief description of each of the chapters:
Chapter One: Introduction This introductory chapter sets the scene for the research by providing the background to the research problem and specifying the research objectives, conceptual framework and the research design.
Chapter Two: Theoretical Overview of Transport Related Social Exclusion Chapter two looks into the status of the existing research on transport related social exclusion at a global level. This section highlights the origins of the concept of social exclusion, the emerging focus on its interrelationship with transport and the methodologies and indicators used within the policy and research framework.
Chapter Three: An Introduction to Ahmedabad City Discussions in this chapter provide the spatial context within which this research was carried out. It provides an insight into the study area, Ahmedabad, its transportation system, urban planning and the poverty issues.
Chapter Four: Methodology The secondary data collected and the methods for selecting households and the variables for the primary data collection are explained in this chapter. It further expounds on the techniques used in the data entry, verification and the data analysis.
Chapter Five: Analysis of Transport Related Social Exclusion at City Wide Ward Level This chapter explores the level of transport related social exclusion at a ward level based on an adapted livelihoods approach

TRANSPORT RELATED SOCIAL EXCLUSION IN AHMEDABAD, INDIA
10
Chapter Six: Manifestations of Transport Related Social Exclusion Discussed in this chapter are the findings on the households’ perception of the various manifestations of transport related social exclusion in the case study wards
Chapter Seven: Accessibility Accessibility has been used as key measure in defining population who are classified as transport based socially excluded. This chapter examines accessibility to primary education facilities. The availability of time for travel and undertaking activities plays a significant role in accessing and utilising opportunities and facilities. This chapter additionally provides a comparative analysis of the activity space of households and the time and space utilisation of heads of households for the different income classes.
Chapter Eight: Conclusion and Recommendations The concluding remarks on transport related social exclusion in Ahmedabad, the people/ areas most affected by it and policy recommendations are entailed in this chapter.
11
2. A Theoretical Perspective on Transport Related Social Exclusion
This chapter looks into the origins and the evolution of the term social exclusion and its interrelationship with transport. Social exclusion is closely related with the evolving concepts of poverty and deprivation; the relationship between these concepts is explored in this section prior to establishing the extent of poverty and exclusion research within the Indian context. The access to transport plays a critical role in the ability to participate in a given society with a lack of adequate access being manifested in various forms of transport related social exclusion. This section provides an overview of the different manifestations of transport related social exclusion as identified in the existing research.
2.1. Social Exclusion; the Origins and Definitions
Social exclusion as a concept emerged from the world of politics and governance in France during the 1970s to describe the disadvantaged individuals unprotected by the state and the related social policies of that time (Bhalla and Lapeyre, 2002; Bryne, 2005; De Boer, 1986; Miller, 2004). The State had a strong role to play in the conceptualisation of social exclusion within the French context where the invention of the term is attributed to Rene Lenoir ; however when applied to the Anglo-Saxon context, social exclusion was meant to reflect the level of social integration freely chosen by individuals (Bhalla and Lapeyre, 2002; Haan, 1999). The concept of social exclusion has replaced poverty and is increasingly being used in the European context with the commitment by the EU to combat social exclusion through its incorporation in the Maastricht and the Amsterdam treaties. The Amsterdam treaty which commonly refers to the “Treaty of Amsterdam amending the Treaty of the European Union, the Treaties establishing the European Communities and certain related acts” came into force on 1st May 1999 with substantial changes to the “Treaty on European Union” commonly known as the Maastricht Treaty. The Amsterdam treaty saw the innovative incorporation of social exclusion through its social policy which provides a legal basis for ensuring the improvement of social protection systems for eradicating social exclusion within the European context.
Given the complex and relative nature of social exclusion and the widely varying contexts within which it is applied, a singular definition of the term and the identifications of universal measurement indicators is elusive (Lyons, 2003; Silver and Miller, 2003). Social exclusion has evolved over time to be incorporated into various discourses of social sciences and has recently been integrated into mainstream urban and transport planning due to the increasing recognition that effective planning policies can help minimise or alleviate social exclusion. There are various dimensions of the term social exclusion such as economic, political and social which may not necessarily overlap but provide a more inherent meaning to the term. The economic dimension of social exclusion refers to the inability to be engaged in gainful employment, political dimension implies the inability to participate meaningfully in decision-making processes whilst the social dimension refers to the loss of respectability and dignity in one’s own eyes, as well as those of others and when these various dimensions of exclusion reinforce each other, a pattern of accumulated exclusion arises which is difficult to tackle. This conceptualisation of social exclusion implies that social exclusion though similar to is not exactly the same as poverty.
2.2. Social Exclusion and Poverty
Social exclusion is not identical to poverty; however as a broad concept it is closely related to the concepts of poverty (Bhalla and Lapeyre, 2002). The approaches to measuring and defining poverty have evolved over
TRANSPORT RELATED SOCIAL EXCLUSION IN AHMEDABAD, INDIA
12
time from a primarily income and consumption based approach to Sen’s capabilities, Townsends definition of relative deprivation and Moser’s ‘assets/vulnerability’ approach (Baud et al., 2008; Bhalla and Lapeyre, 2002). Sen’s capabilities approach states that poverty is synonymous with capabilities deprivation where the lack of functional capabilities to effectively participate in activities is hindered by the substantive freedoms that people value. Townsend defined poverty in terms of relative deprivation where the poor were classified as those whose ownership of resources was below that of an average individual or household. The assets / vulnerability approach was formulated by Caroline Moser who based her approach to poverty analysis on the links between assets and vulnerability to explain why people moved in and out of poverty and how they adapted to situations that they found themselves in; this approach has been adopted in a number of poverty and deprivation studies (Baud et al., 2008; Rakodi and Lloyd-Jones, 2002). This approach has also been adopted for further analysis of exclusion within the framework at capitals at a ward level in Ahmedabad within this research.
Though poverty is not synonymous with social exclusion, however, due to the changing approach to analysing and measuring poverty, some concepts of poverty and social exclusion do overlap each other. Poverty implies an absolute or relative access to material welfare whilst social exclusion as a broader concept implies that some people or households are not just poor, but that they have additionally lost the ability to both “literally and metaphorically connect with many of the jobs, services, and facilities that they need to participate fully in society” (Church et al., 2000 pg. 197). Relative deprivation is of great significance in the definition of exclusion since people may suffer from deprivation, but if they are not in a position to relate their own circumstances to conditions in which other people live, there may not be a reason for them to feel excluded (Breman, 2004). Social exclusion as a concept has political, economic and social dimensions which are rarely looked into holistically in the poverty literature of the developing countries. People due to their socio-economic status in the developing countries would give greater relative weight and significance to economic exclusion when compared with political dimensions and social dimensions (Bhalla and Lapeyre, 2002). However this does not imply that poverty and social research within the developing countries should focus on material considerations. A holistic analysis of social exclusion demands the incorporation of all dimensions of social exclusion with a focus on the causes of relative deprivation rather than the overall level of deprivation to provide an understanding of how and why people are unable to participate in or have access to the goods and services provided within an economy.
Due to notion that there exists a particular group that is ‘included’, social exclusion implies inequality (Nayak, 1995), however inequality is not a sufficient condition for being trapped in a situation of exclusion. A number of discussions of social exclusion similarly to discussions on poverty and deprivation have stressed that individuals do not usually find themselves in this excluded situation by choice. Social exclusion is a dynamic state and individuals can regularly move in and out of this situation (Atkinson and Hills, 1998). The detachment from society due to an inability to participate in the normal activities is the norm for social exclusion. Social exclusion is a reinforcing process that makes excluded population even poorer, further diminishing their chances of reversing the decreasing levels of participation in a given society. The reversal and eradication of the social exclusion requires an adequate understanding and formulation of measurable indicators which highlight the levels of and the contributing factors of social exclusion. However, given the complex nature of social exclusion with its emphasis on relative social and political participation in addition to material deprivation, adequate measures and indicators have been deemed problematic to formulate. Within the European context, the level of social exclusion has been measured to a large extent through the use of the
13
multiple deprivations index whilst in many developing countries with the focus still on poverty; the assets/vulnerability approach has been adopted to define poverty and / or deprivation.
2.2.1. The Assets / Vulnerability Framework for Poverty and Deprivation Analysis
The assets/ vulnerability framework was proposed with the understanding that the poor do not necessarily rely on only one source of income and that they devise survival strategies based on the ownership of assets and various capitals (Rakodi and Lloyd-Jones, 2002). Five main forms of capitals and their interrelationships form the crux of the livelihoods framework and these include; human; social; physical; financial and natural capitals. The natural capital comprises of nature based assets such as the ecosystem and is often deemed more relevant for poverty analysis in rural areas than in urban settings. The effective operationalisation of the assets/vulnerability framework relies on the formulation of indicators for each of the capitals taking into consideration the local circumstances. Critical to the formulation of indicators for capitals is the definition adopted for each of these capitals.
Social capital is defined as broadly as the “social networks, reciprocities that arise from and the value of these for achieving mutual goals” (Baron et al., 2000). It includes “networks, norms, rules and social values” which can either have a bridging effect which may reduce social exclusion or a bonding effect which increases social exclusion (Piachaud, 2002). Human capital refers to the “individual capacity to flourish in a capitalist – market economy” (Lavalette and Pratt, 2005) which comprises of an individuals skills, education and training (Piachaud, 2002). Financial capital refers to the financial assets that a household has access to (Piachaud, 2002) which can take the form of “savings, credit, remittances and pension” (Rakodi and Lloyd-Jones, 2002). Physical capital can be defined as the ownership and access to physical assets such as land, housing and basic infrastructure of water, sanitation, electricity etc.
Political capital signifies community participation in decision making and is integral component in the conceptualisation of social exclusion. “Voting in free elections is often viewed as the most basic and important form of political participation because it taps the degree to which individuals feel that they should take part in the decision-making process at a very broad level” (Bevelander and Pendakur, 2008). The capitals approach has been widely used in poverty studies with similar approaches adopted in a number of exclusion studies with varying levels and terminologies utilised for classification of individual and communal resources.
Buchardt et al (2002) identify four indicators of social exclusion within the realm of four dimensions; consumption, production, political engagement and social interaction. The indicators for production dimension relate to income; social dimension relate to employment, education and training; political dimension relates to voting or being a member of a campaigning organisation whilst social interaction indicators relate to the emotional support in the form of friends and family (Burchardt et al., 2002). Paichaud (2002) identifies five forms of capital which affects the level of poverty and social exclusion at a national and individual level; being financial, physical, human, public infrastructure and social capital. Public infrastructure capital due to its State rather than individual ownership has been ignored in deprivation studies however, with the recognition that accessibility to public infrastructure impacts the level of participation in activities and the significant role of the State in ensuring participation by all segments of the society, this capital has been accorded great significance in social exclusion analysis. These social exclusion indicators in combination with the livelihoods approach can provide a measure of the level of social exclusion at an
TRANSPORT RELATED SOCIAL EXCLUSION IN AHMEDABAD, INDIA
14
appropriate unit of analysis in developing countries. However within many of the developing countries which is inclusive of India, the primary focus of poverty research is still on absolute poverty with little research carried out on other dimensions of poverty and exclusion.
2.2.2. Social Exclusion and Poverty Studies within the Indian Context
India despite a very a high percent of its population living in slums and in poverty; and with decades of anti-poverty programs and spending on extensive research has focused principally on material deprivation (Parker and Kozel, 2007). The earliest poverty study in India was conducted at a village level by H.H. Mann in 1948 who established a poverty level of 40 percent for the country over a period from 1918 to 1948; these initial poverty surveys were based on a minimal income level applicable at the time of survey; which to a large extent is still applied in the recent poverty analysis (Nayak, 1995). The current Indian official poverty line is calculated through an econometric approach based on the purchasing power of a basket of goods determined through a sample survey of consumer household expenditure for a calorie intake of 2400 and 2100 respectively by the urban and rural households (Baud et al., 2008; Government of India, 2007). The econometric calculation excludes any discussion on the expenditure for non-food items and essential services such as education and health. This is based on the pretext that these services are provided by the State (irrespective of whether the poor can access them and the costs such as transport incurred in accessing these essential services) rendering the official poverty lines as representing conditions of ‘destitution’ (Swaminathan, 1995). A focus on absolute poverty (income poverty based on biological needs) ignores the multiple deprivations that reduce the ability of an individual or household to attain a reasonable standard of living and participate in activities that would be considered the norm in the Indian society. Such approaches have been receiving increasing criticism in the academic literature with authors providing alternative approaches to looking at this age old contentious issue of poverty.
Poverty studies often imply the homogeneity of the poor bunched together as group, with little attention given to the differentiation within the poor itself (Mitlin, 2005). A multiple deprivation index approach within the analytical livelihoods framework has been explored to highlight the hot spots of poverty at ward level for a much better informed policy making in Delhi. This study concluded that there are hot spots of poverty in Delhi and that not only slum dwellers suffer from multiple deprivations but so do other poor sections of the community such as the rehabilitation areas; findings which the authors felt needed to be incorporated into decision making (Baud et al., 2008). Mitlin et al (1996) point out that in developing countries relatively more attention has been given to poverty issues than to inequality which would highlight the privileged position of the high income population. The lack of attention on inequality in developing countries is due to the focus on market driven approaches to development in the last 10-15 years and the perception that income inequalities provide an incentive for entrepreneurship. With an appreciation of the vast differences in the living standards of the poor, in comparison with the better-off segments of the population which excludes them from the main stream society, Arjan de Haan with Amaresh Dubey explored the application of the concept of social exclusion within India’s poorest regions. They conclude that social exclusion as a concept is a useful way of looking at deprivation by drawing attention to the processes and the underlying reasons for deprivation (Haan, 2004). Poverty would be the most significant determinant of social exclusion with the relationship also occurring in the reverse direction (Nayak, 1995). There are various other reasons and cyclic causes for the poor and deprived to feel socially excluded, some which are specific to the Indian context such as the prevalence of the caste system and other more global concerns for example the unequal access to the prevalent transportation system.
15
2.3. Urban Transport
Travel is a derived demand which people undertake to participate in activities and is seldom undertaken for its own sake. Transport describes the movement of people and goods, and facilitates the distribution of services from one location to another. Within the context of this research, transport system is defined as incorporating transport infrastructure such as roads and transport services which facilitates movement such as public and private transport modes which is inclusive of walking. Sustainable mobility is essential for the socio-economic development of urban areas with a need for well integrated motorised and non-motorised transport systems (Zuidgeest, 2005). Given that mobility is “purchased”, there are segments of population who due to their lack of affordability are unable to adequately access basic services (Goulias, 2003).
The two fundamental principles of transport planning relies on the recognition that the value of the activity at destinations results in travel and that people try to minimise their generalised costs of travel. These two principles are generally assumed to dictate the travel patterns and mode choices of people. Although transport has been identified as the daily rhythm of life in all societies, there are many locations and people who suffer from restrictions in mobility (Hoyle and Knowles, 1992). These restrictions are relatively more prevalent in the developing countries where the poor rely on non-motorised modes as their only means of transport with the largest percentage of total trips being pedestrian trips. Modern day difficulties of urban transport relate to traffic congestion, decline in the public transport services, environmental implications and lack of road safety which affects the poor and excluded populations relatively more. The social role of transport needs to be incorporated into urban and transport planning in order to adequately address transport needs of the excluded populations.
2.4. The Interrelationship between Transport and Social Exclusion
“The link between mobility and social goals is much stronger than many people acknowledge and more complicated than transportation experts would like to believe” (De Boer, 1986 pg. 179). Social exclusion is defined as broad political and structural barriers to opportunity with accessibility to transport being very much a barrier to opportunity and one which can exacerbate social exclusion (Mcdonagh, 2006). Transport related social exclusion is built around the premise that it is not the lack of opportunities which hinders participation but more so the lack of access to these opportunities (Lucas, 2004; Preston and Rajé, 2007). Transport planning has passed through many phases over the years with changing social, political, economic conditions and the lobbies for the government protection of public interest stimulating innovations in transport policies (Vuchic, 2005). The growing importance of transport in enabling access to essential goods and services is being increasingly recognized within the transport literature.
Modern societies are built around premise of the need for high levels mobility. As such the socially excluded population are prevented from participating in the economic, political and social life of a given society due to a lack of accessibility which is reflected in their low levels of mobility (Câmara et al., 2001). Access is an end rather than an impact of transport planning. The distribution of access which is defined as the travel time or distance to facilities can be unequal due to geographical and social aspects with the excluded population generally classified as having accessibility deficits. Differential access to facilities arises as result of the varied distances of the residential locations from the services as well as the socio-economic ability of individuals and households to overcome the friction of distance by means of transport. The socially excluded population in many developing countries are generally housed in the outskirts of cities and lack the financial means to afford public and private transport which hinders their access to the transportation system and limits
TRANSPORT RELATED SOCIAL EXCLUSION IN AHMEDABAD, INDIA
16
their ability to participate in activities. The interrelationship between transport and social exclusion is part of a vicious cycle where due to social exclusion people may have inadequate access to transport which further aggravates the levels of exclusion by limiting access to essential resources such as employment, education and health facilities (Miller, 2004). The interactions between transport and land use system can reinforce social exclusion by increasing the generalised cost of travel for persons at risk. If socially excluded persons find themselves in circumstances where their home and activity locations relative to the transport services incurs high access costs both in terms of time and money then they are less likely to engage in travel and are therefore less likely to participate fully in society (Schönfelder and Axhausen, 2003).
Inadequate access to transport also has the potential of undermining policies relating to the provision of essential services where even if these services are adequately provided, if people are unable to afford the transport costs required to access these services, they are less likely to use them. Individuals require access to transport for a variety of reasons such as economic reasons (to participate in gainful employment); social reasons (to maintain adequate levels of interaction with families and friends) and financial reasons amongst many others.
Due to a lack of access to transport; the socially excluded are unable to participate in the full spectrum of activities deemed essential in a society. While modern transport initiatives may bring an improvement in the quality of life of the residents of a particular area due to increased levels of accessibility, this must however be weighed against environmental costs such as air pollution, noise pollution and urban congestion which generally the socially excluded populations are more susceptible to given their mode choices and residential locations.
2.5. Manifestations of Transport Related Social Exclusion
The most common manifestations of transport related social exclusion are spatial, economic, affordability based, physical exclusion, fear based, time based, infrastructure based and exposure to negative externalities exclusion (Church et al., 2000; Lucas, 2004; Miller, 2004).
2.5.1. Spatial Exclusion
The socially excluded individuals and households are also excluded from certain parts of the environment, mostly due to the high generalised transport costs they face in reaching desirable locations. Power and Wilson (2000) argue that spatial location and in particular living in a socially excluded neighbourhood is important for understanding the levels of participation. Those living in a socially excluded neighbourhood experience a situation where amongst factors such as poor access to services and facilities; a sense of failure, rejection and shame over where people live and belong grows which undermines hope of change (Power and Wilson, 2000).
Spatial exclusion arises due to the lack of accessibility to essential facilities in terms of the geographical / spatial reach of individuals rendered by the high costs of transport (either in monetary and/or non monetary terms). People living in areas geographically classified as socially excluded often lack access to basic facilities such as education; medical and shopping facilities etc.
One of the emerging causes of spatial exclusion in many developing countries is the growth of gated communities. The creation of private roads and motorways accessible only to privileged residents of certain
17
residential areas creates large self-sufficient ghettos that are taken out of the public space and which impinge on the level of access enjoyed by the normal citizens (Borsdorf and Hidalgo, 2008). However it is not only the high income classes which enclose their quarters, the poor and middle income do so too, however many a times the enclosures within the low income areas are not physically visible but are reflected in the high crime rates and stigmatisation which restricts access to other segments of the city. Gated communities not only restrict access to certain people but also increase the generalised cost of travel for people who have to find alternative routes instead of being able to travel through these communities. Despite its significance, the prevalence and impacts of gated communities are not discussed further in this research.
Walking is the predominant mode of transport utilised by the socially excluded populations. Due to the dispersion of activities and residential land uses, increased travel time and costs are required to access essential services, which can become increasingly unfeasible due to time and financial budgets of the affected population. In India similar to other developing countries, a high percentage of travel is undertaken by walking or cycling, mainly because much of the population is too poor to afford motorized transport; and with the increasing levels of sprawled development, the trips lengths between residences and almost all other trip destinations become relatively long. In addition to travel distances, the quality and quantity of transport infrastructure also plays a key role in spatial exclusion; services and facilities may be located relatively near to residential locations however these can be placed out of reach for pedestrians with an inadequate and unsafe transportation system. If existing roads are closed off or upgraded to cater for increased traffic flows, they can become increasingly dangerous to cross which can result in a dramatic curtailment of action space for households and children in particular (De Boer, 1986). In addition to limited spatial reach of households, high transport costs are also linked to lower chances of entering and being active in the job markets.
2.5.2. Economic Exclusion
Access to transport plays a critical role in the geographical extent of job-search and work-travel patterns of the socially excluded. In an economic sense, exclusion refers to the inability to be engaged in gainful employment which yields enough income to satisfy basic requirements. Economic exclusion generally arises from the limited spatial extent of employment and job searches due to a lack of affordability and inaccessibility to transport. It is increasingly accepted that access to transport is a key policy issue in tackling unemployment, poor skills, low incomes, poor housing, high crime, bad health and family breakdown (Dobbs, 2005).
Access to employment is the “decisive factor ” in the level of social exclusion experienced by an individual, however it is not always that employment and social exclusion are correlated (Jamet, 2007). Being unemployed does not necessarily mean that a person is socially excluded especially if the household has sufficient financial and other resources to enable participation in society. On the other hand, a person may be employed yet the menial wages would mean that they are unable to afford the basic necessities and hence full participation in the society. However being employed does ensure to a certain degree that an individual is integrated in the social network of a society, since being employed not only provides a source of income to an individual but also provides social networks and a sense of self worth (Saith, 2001). Most of the studies analyzing social exclusion within the European context have explored the relationship between social exclusion and employment (Saith, 2001). The significance awarded to employment in combating social exclusion is reflected in a number of significant policy documents such as the Amsterdam treaty which highlights in its social policy; employment as being on top of the agenda in the fight against discrimination (The European Commission, 2008)
TRANSPORT RELATED SOCIAL EXCLUSION IN AHMEDABAD, INDIA
18
2.5.3. Affordability Based Exclusion
Transport affordability refers to the financial expenses required or the ability to meet the transport needs amongst other basic needs which allows the access to important goods and services (Ahmed et al., 2008; Litman, 2008). The cost of travel is an overwhelming constraint for socially excluded households; which dictates both the method and the extent of their travel. This lack of affordability implies that people simply cannot afford private modes of motorised transports or the fares of public transport required to reach the activities that they need to access. Hence their reliance on non-motorised modes such as walking and cycling which they use for travelling long distances, generally in unfavourable and stressful circumstances to carry out their daily activities.
2.5.4. Physical Exclusion
Physical exclusion is defined as poor accessibility to the transport system due to a person’s physical and mental capabilities which can worsens the predicament of the socially excluded even though as a phenomenon, it may not be exclusively applicable to socially excluded communities. The disabled, for example, particularly in the developing countries face mammoth difficulties in accessing transport systems to be able to participate in activities since most of the transport infrastructure and public modes are not designed to cater for this segment of the population. This manifestation of exclusion is not explored further in this research.
2.5.5. Fear Based Exclusion
Individual perception of fear of public spaces and the use of transport may differ based on different socio-economic characteristics of the population as well as the characteristics of the built environment and the transportation system. The fear of crime has been identified as one of the major barriers for transport choice and use particularly in the deprived neighbourhoods of UK with estimations that the reduction of fear of crime could increase the number of public transport trips by 10.5% (Machin, 2004).
2.5.6. Temporal Exclusion
Temporal exclusion refers to the lack of adequate time for travel given the network constraints and an individuals personal commitments; with those prone to social exclusion most affected by time constraints in their mobility decisions (Church et al., 2000).
The following three types of time based constraints identified by de Boer (1986): • Capability Constraints which limit the activities of the individual because of his biological construction
and demands of time for activities like sleeping and eating which impinges on the time available for travel in order to participate in activities.
• Coupling constraints relate to those activities which need to be conducted in partnership with other individuals where the time and space order of these activities decide whether other activities are possible
• Authority Constraints imply limited access to places and activities due to the restriction on opening hours and hours of services based on rules and regulations.
19
2.5.7. Infrastructure Based Exclusion
The socially excluded especially in the developing countries by virtue of their geographical location gain access to the transportation system via substandard transport infrastructure. They also have least priority on the roads due to the type of mode used which is often restricted to non motorised modes such as cycling and walking. In many developed countries, planners have been concerned about liveability and a revaluation of urban life which stimulated the pursuit of reintegrating the street, of bringing life and people back into the street with two social motives for recapturing the street from the automobile, one to protect liveability in residential streets and one to foster urbanity. Policies to increase the liveability of residential streets has been vigorously at work in the Netherlands and in Germany, “the purpose of the Dutch “woonerf” concept literally meaning the “living yard” is not to expel the car from the residential streets but to create room for other activities, and to equalize pedestrian and vehicular uses” (De Boer, 1986).
2.5.8. Exposure to Negative Externalities
The socially excluded population are often disproportionately affected by the negative impacts arising from the access to the transport system. Poor people are much more likely to live in urban areas in close proximity to busy roads and to undertake walking and / or cycling trips. Due to this combined effects of their residential location and the mode used, experience far higher levels of exposure to traffic congestion, road accidents, traffic noise and pollution. Poor transport links and polluted and unsafe walking and waiting environments reduce social and economic activity within excluded communities. According to the World Health Organization, in developing countries road accidents tend to be ranked second to sixth among the leading causes of death for people between the ages of 15-60, the majority of the victims of traffic accidents tend to be low and moderate income pedestrians (Hook, 2006). Even though the people living in socially excluded areas tend to suffer the worst impacts from transport such as road accidents, pollution; they are also the people least likely to cause these problems since they are less likely to own or have access to a car (Pennycook et al., 2001).
Concerns for the inequitable exposure to the negative transport externalities, has seen the inclusion of the concept of environmental justice in transportation planning in the United States. Though environmental justice as a term is not legally enshrined in planning and transportation legislation, its incorporation in transport planning was initiated due to a number of legal court cases through the interpretation of the common law of the United States (Cairns et al., 2003). The principles which have been adopted to ensure environmental justice are:
• “To avoid, minimize, or mitigate disproportionately high and adverse human health and environmental effects, including social and economic effects, on minority populations and low-income populations.
• To ensure the full and fair participation by all potentially affected communities in the transportation decision-making process.
• To prevent the denial of, reduction in, or significant delay in the receipt of benefits by minority and low-income populations” (United States Department of Transportation, 2000)
The adoption of these principles ensures that the socially excluded populations are not any more adversely impacted by the prevalent transport system than the other segments of the population.

TRANSPORT RELATED SOCIAL EXCLUSION IN AHMEDABAD, INDIA
20
In addition to identifying indicators which are inherent in the above manifestations of transport related social exclusion, appropriate methods for measuring the levels of exclusion need to be adopted in order to adequately identify and measure transport related social exclusion in any given context.
2.6. Approaches Explored in Analysing Transport Related Social Exclusion
Transport related social exclusion looks into the relationship between an individual and the society that they live in and in the Europe has been measured as part of the deprivation index. The UK deprivation index for example comprises of income, employment, health, education, barriers and living environment. The components within the barriers indices reflects some elements of transport related exclusion in terms of accessibility to the services which are considered the norm within the UK context. The outdoors living environment captures some aspects of the negative implications of transport such as the air quality which would take into consideration vehicular emissions whilst the indicator relating to road accidents measures the susceptibility of road users to the risk of injury. Similarly the Scottish deprivation index takes into consideration some aspects of the transportation element through its “access domain” which comprises of indicators on the drive time and public transport travel time to selected services such as GP, shopping centres, post office, schools and petrol stations.
The most common approach utilised in the analysis of transport related social exclusion has been the use of accessibility measures at a place based spatial level and more recently through the use of space time activity measures at an individual level. Recently added dimensions to the analysis of transport related social exclusion have seen the incorporation of peoples’ perception of the various manifestations of exclusion.
2.6.1. Accessibility Measures
Accessibility is the ultimate objective of most transport activities, hence accessibility-based analysis accurately reflects ultimate planning goals (Litman, 2008). Accessibility has been widely used as an urban planning concept and indicator in the developed countries and based on the context it is used in has varying definitions and connotations. The most common understanding of this term is associated with an individuals’ ability to reach other people and activity spaces. Within the time and activity space research accessibility is defined as a person’s physical reach in space and time through movement (Miller, 2004). Four approaches have been identified for measuring accessibility which are infrastructure, location, person based and utility based measures (Geurs, 2006).
The most common approach used in spatial planning has been the use of the location based measure which analyses the accessibility to spatially distributed activities at a macro level and can be used as social indicator for showing the availability of social and economic opportunities for an individual (Geurs and Van Wee, 2004). Distance, contour, potential and balancing factors of spatial interaction models have been used as location based measures of accessibility. Distance measure is the measure of relative accessibility between two points, be it in the form of straight line or infrastructure based calculation of travel time and speed. Contour based measures are the most commonly used in urban planning and depicts isochrones of the number of activities / opportunities which can be reached within a given generalised costs (time or money) or vice versa the amount of generalised costs required to reach certain opportunities. These two measures are easy to interpret and have limited data requirements; however do not take into account individual preferences, the combined effects of landuse and transport, and the capacity restrictions of opportunities. The potential
21
measure is based on the gravity model which estimates accessibility from one zone to other zones with an understanding that the level of interaction between locations declines as the distance between them increases.
Accessibility measures have been widely used to identify and depict areas and population which are considered as being socially excluded due to the combined effect of the transport system and the location of various land uses. Church et al. (2000) argue that there are three processes which influence accessibilities and interact with the process of social exclusion; the household scheduling of time-space budgets; the nature of the transport system and finally the time-space organisation in the services to be accessed. The policies addressing exclusion from spatial, economic and temporal exclusion require initiatives to improve accessibility in terms of journey times and costs. An example of the use of accessibility measures to spatially depict people who are socially excluded has been better incorporated in the social indicators of Merseyside (Church et al., 2000 ). The indicators listed below were used as indicators of transport related social exclusion:
“Proportion of households within 400 m of a bus stop Proportion of households within 800 m of a rail station Proportion of major facilities/services within 400 m of a bus stop or 800 m of a rail station (Facilities include hospitals, retail parks, multiplex cinemas, city parks, recreation areas and major centres of employment.) Proportion of rail stations which are fully accessible to wheel chair users Proportion of buses which are fully accessible to less able members of society Proportion of concessionary passes issued to and used annually by those eligible” (Church et al., 2000 pg. 201)
These accessibility measures however do not take into consideration the financial barriers and individual physical barriers to people using the public transportation system. An alternative approach to measuring an individuals or households physical reach in space is through the use of space time activity measures.
2.6.2. Space Time Activity Measures
Activity space is that part of the environment, which a traveller uses for his/her daily activities and consists of the locations, which the person has visited, and the routes and areas the person has travelled through (Schönfelder and Axhausen, 2003). Whilst activity spaces can provide a relatively good proxy indicator of social exclusion, however a small activity space does not necessarily indicate that an individual/household is socially excluded since a small activity space could be simply by choice with no restrictions on travel.
Activity space analysis has recently started receiving increasing attention in transport research due to the increased capabilities of GIS to handle / process time and space data. Pioneering research into activity space and time trajectories was undertaken by Bunges (1960), Waldo Tobbler (1961) and H�gerstrand in 1970. Space time activity theory had an initial flurry of research in the 1960’s and 70’s with researchers such as Hagerstrand and Chapin propelling transport research into the use of time and space however due to the cumbersome data requirements it was not further explored until recently.
Activity and time space research has recently been looked into to explore its applicability in the research on transport related social exclusion (Miller, 2004; Schönfelder and Axhausen, 2003). Rather than aggregate transport analysis, the focus of space time activity analysis is the individual’s use of time for activities which
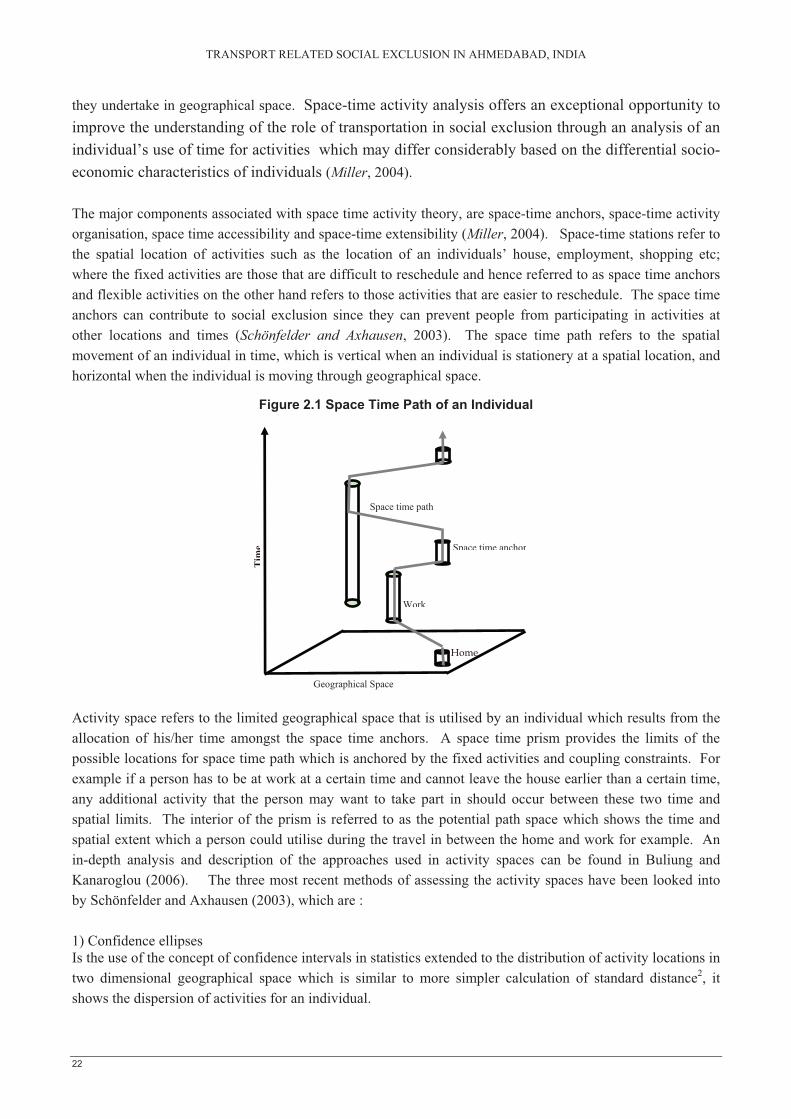
TRANSPORT RELATED SOCIAL EXCLUSION IN AHMEDABAD, INDIA
22
Geographical Space
Space time anchor
�����
Tim
e
Space time path
Work
they undertake in geographical space. Space-time activity analysis offers an exceptional opportunity to improve the understanding of the role of transportation in social exclusion through an analysis of an individual’s use of time for activities which may differ considerably based on the differential socio-economic characteristics of individuals (Miller, 2004).
The major components associated with space time activity theory, are space-time anchors, space-time activity organisation, space time accessibility and space-time extensibility (Miller, 2004). Space-time stations refer to the spatial location of activities such as the location of an individuals’ house, employment, shopping etc; where the fixed activities are those that are difficult to reschedule and hence referred to as space time anchors and flexible activities on the other hand refers to those activities that are easier to reschedule. The space time anchors can contribute to social exclusion since they can prevent people from participating in activities at other locations and times (Schönfelder and Axhausen, 2003). The space time path refers to the spatial movement of an individual in time, which is vertical when an individual is stationery at a spatial location, and horizontal when the individual is moving through geographical space.
Figure 2.1 Space Time Path of an Individual
Activity space refers to the limited geographical space that is utilised by an individual which results from the allocation of his/her time amongst the space time anchors. A space time prism provides the limits of the possible locations for space time path which is anchored by the fixed activities and coupling constraints. For example if a person has to be at work at a certain time and cannot leave the house earlier than a certain time, any additional activity that the person may want to take part in should occur between these two time and spatial limits. The interior of the prism is referred to as the potential path space which shows the time and spatial extent which a person could utilise during the travel in between the home and work for example. An in-depth analysis and description of the approaches used in activity spaces can be found in Buliung and Kanaroglou (2006). The three most recent methods of assessing the activity spaces have been looked into by Schönfelder and Axhausen (2003), which are :
1) Confidence ellipses Is the use of the concept of confidence intervals in statistics extended to the distribution of activity locations in two dimensional geographical space which is similar to more simpler calculation of standard distance2, it shows the dispersion of activities for an individual.

23
2) Kernel densities The kernel densities have been used in a number of studies (Buliung and Kanaroglou, 2006) to show the activity space as the density or probability of visits with an interpolation technique which generalises points to the area. The most common method used is that of a fixed kernel which is symmetrical and is placed over each point.
3) Buffered Short Path Network (minimal spanning trees) The shortest path to the activity locations is calculated based on a given transport network and these paths are buffered by a certain distance (in the example by Axhausen 100m) to provide the activity space.
Miller and Wu have also explored the use of GIS to implement space-time accessibility measures (STAMs) based on space-time prism approach, they measure accessibility relative to mandatory activities with known stop and start times. However due to the large computational requirements, visualization and statistical summary measures to assess accessibility across multiple individuals and activity schedules is yet to be explored in time space activity analysis.
2.6.3. Peoples Perception of Transport Related Social Exclusion
Whilst various measures exist to measure and depict transport related social exclusion, improving transport links between areas with high levels of social exclusion and key activities based on these assessments is useless if these activities are irrelevant to the people who live in these excluded areas. For example the public transportation system could be improved to be affordable, timely and readily accessible, however if a household or individual does not require access to public services but would rather have safe walking environment, such an improvement would be seemingly useless. Therefore the recent focus in the research field of transport related social exclusion has turned to the use of participatory methods in analysing the implications of transport on social exclusion with the use of methods such as focus groups, participatory mapping of activity spaces etc. This is envisaged not only to help better understand the transport related difficulties faced by the people but also assist in effective transport policy formulation.
Improvements in accessibility would not mean much to people if they do not necessarily need access to certain facilities. However peoples’ perception may also be clouded by the level of services and the type of modes that they are used to. Just because people are used to living without access to essential services does not mean that policy makers and researchers should ignore their plight since hence people’s perception should be used with caution and in line with already established norms and measures which are widely used globally such as acceptable walking distances in the form of ped- sheds.
2.6.4. Limitations of Place Based and Individual Accessibility Measures
Place-based measures are useful but incomplete since they cannot capture the full spectrum of social exclusion. Place-based factors such as segregation are important as evidence of social exclusion, but relative to how these affect these individual life courses rather than as a direct incarnation of exclusion (Bryne, 2005). Place-based measures as used in accessibility analysis are incomplete since they cannot capture individualistic life experiences: they suffer from the ecological fallacy of applying aggregate measures to individual cases. In response to these shortcomings in accessibility analysis, there has been resurgence in the research on the use of time and space at an individual level. However, individual measures are also incomplete: they suffer from
TRANSPORT RELATED SOCIAL EXCLUSION IN AHMEDABAD, INDIA
24
the individualistic fallacy of ignoring synergistic, ecological effects at the place level(Miller, 2004). Therefore considering both place and people based measures is necessary for a full depiction of quality of life and social exclusion (National Research Council 2002)
2.7. Summary of Chapter
Social exclusion as a concept emerged from the world of politics and governance in France during the 1970s and has evolved over time to be incorporated into various discourses of social sciences and has recently been integrated into mainstream urban and transport planning research. The assets / vulnerability approach to poverty and deprivation is based on the links between assets and vulnerability to explain why people moved in and out of poverty and how they adapted to situations that they found themselves has been widely used in poverty and deprivation analysis in developing countries. This approach has also been adopted for further analysis of exclusion within the framework at capitals at a ward level in Ahmedabad within this research.
Transport describes the movement of people and goods, and facilitates the distribution of services from one location to another with travel being undertaken to participate in activities but is seldom undertaken for its own sake. The socially excluded population on average undertake less number of trips but spend more time doing so. Modern societies are built around premise of the need for high levels mobility and due to their low levels of mobility; the socially excluded population are prevented from participating in the economic, political and social life of a given society.
Transport related social exclusion is manifested in the forms of spatial, economic, affordability based, physical exclusion, fear based, time based, infrastructure based and exposure to negative externalities exclusion. The most common approach utilised in the analysis of transport related social exclusion has been the use of accessibility measures at a place based spatial level and more recently through the use of space time activity measures at an individual level and the analysis of peoples perception to exclusion. With the exception of physical exclusion, the other forms of exclusion are further explored from the residents’ point of view in selected wards of Ahmedabad followed by accessibility and activity space analysis.
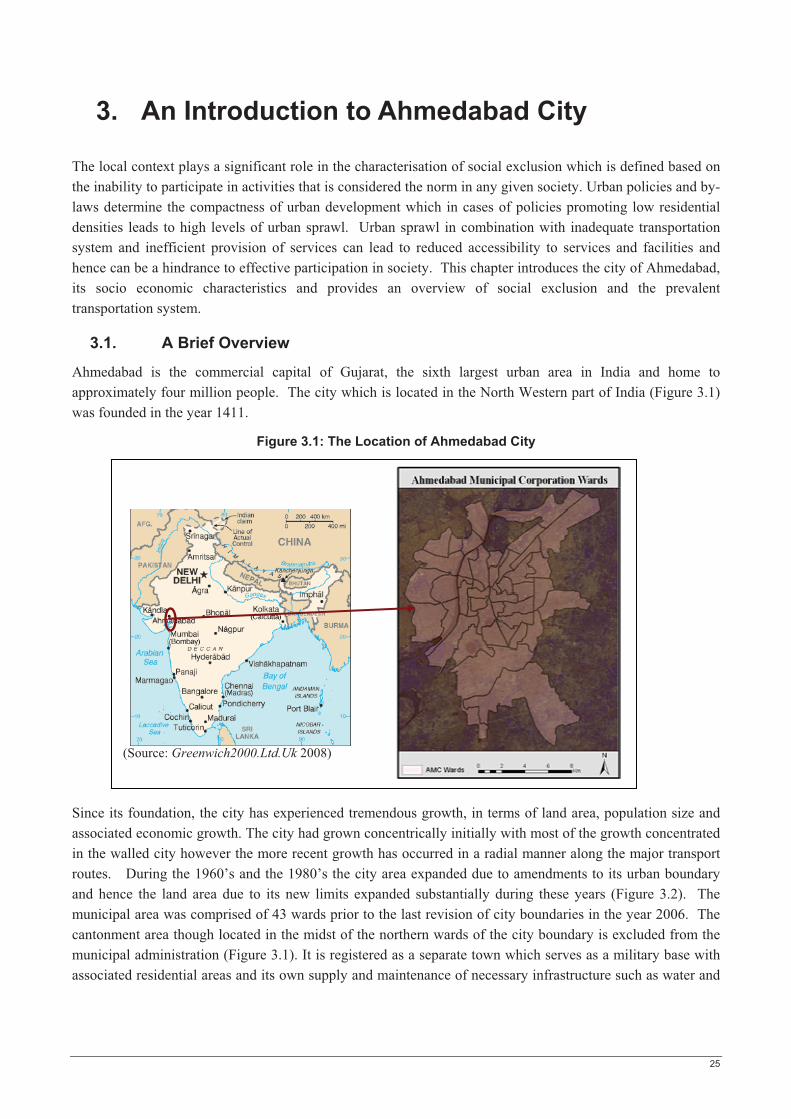
25
3. An Introduction to Ahmedabad City
The local context plays a significant role in the characterisation of social exclusion which is defined based on the inability to participate in activities that is considered the norm in any given society. Urban policies and by-laws determine the compactness of urban development which in cases of policies promoting low residential densities leads to high levels of urban sprawl. Urban sprawl in combination with inadequate transportation system and inefficient provision of services can lead to reduced accessibility to services and facilities and hence can be a hindrance to effective participation in society. This chapter introduces the city of Ahmedabad, its socio economic characteristics and provides an overview of social exclusion and the prevalent transportation system.
3.1. A Brief Overview
Ahmedabad is the commercial capital of Gujarat, the sixth largest urban area in India and home to approximately four million people. The city which is located in the North Western part of India (Figure 3.1) was founded in the year 1411.
Figure 3.1: The Location of Ahmedabad City
(Source: Greenwich2000.Ltd.Uk 2008)
Since its foundation, the city has experienced tremendous growth, in terms of land area, population size and associated economic growth. The city had grown concentrically initially with most of the growth concentrated in the walled city however the more recent growth has occurred in a radial manner along the major transport routes. During the 1960’s and the 1980’s the city area expanded due to amendments to its urban boundary and hence the land area due to its new limits expanded substantially during these years (Figure 3.2). The municipal area was comprised of 43 wards prior to the last revision of city boundaries in the year 2006. The cantonment area though located in the midst of the northern wards of the city boundary is excluded from the municipal administration (Figure 3.1). It is registered as a separate town which serves as a military base with associated residential areas and its own supply and maintenance of necessary infrastructure such as water and
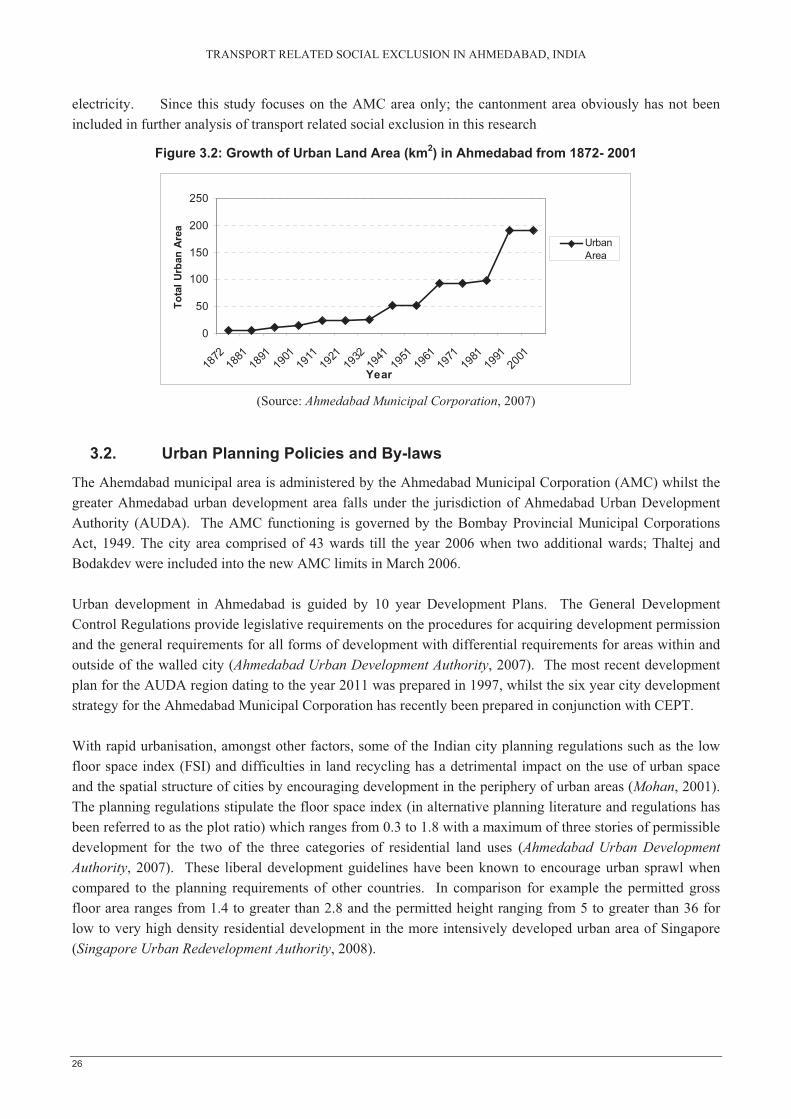
TRANSPORT RELATED SOCIAL EXCLUSION IN AHMEDABAD, INDIA
26
0
50
100
150
200
250
1872
1881
1891
1901
1911
1921
1932
1941
1951
1961
1971
1981
1991
2001
Year
Tota
l Urb
an A
rea
UrbanArea
electricity. Since this study focuses on the AMC area only; the cantonment area obviously has not been included in further analysis of transport related social exclusion in this research
Figure 3.2: Growth of Urban Land Area (km2) in Ahmedabad from 1872- 2001
(Source: Ahmedabad Municipal Corporation, 2007)
3.2. Urban Planning Policies and By-laws
The Ahemdabad municipal area is administered by the Ahmedabad Municipal Corporation (AMC) whilst the greater Ahmedabad urban development area falls under the jurisdiction of Ahmedabad Urban Development Authority (AUDA). The AMC functioning is governed by the Bombay Provincial Municipal Corporations Act, 1949. The city area comprised of 43 wards till the year 2006 when two additional wards; Thaltej and Bodakdev were included into the new AMC limits in March 2006.
Urban development in Ahmedabad is guided by 10 year Development Plans. The General Development Control Regulations provide legislative requirements on the procedures for acquiring development permission and the general requirements for all forms of development with differential requirements for areas within and outside of the walled city (Ahmedabad Urban Development Authority, 2007). The most recent development plan for the AUDA region dating to the year 2011 was prepared in 1997, whilst the six year city development strategy for the Ahmedabad Municipal Corporation has recently been prepared in conjunction with CEPT.
With rapid urbanisation, amongst other factors, some of the Indian city planning regulations such as the low floor space index (FSI) and difficulties in land recycling has a detrimental impact on the use of urban space and the spatial structure of cities by encouraging development in the periphery of urban areas (Mohan, 2001). The planning regulations stipulate the floor space index (in alternative planning literature and regulations has been referred to as the plot ratio) which ranges from 0.3 to 1.8 with a maximum of three stories of permissible development for the two of the three categories of residential land uses (Ahmedabad Urban Development Authority, 2007). These liberal development guidelines have been known to encourage urban sprawl when compared to the planning requirements of other countries. In comparison for example the permitted gross floor area ranges from 1.4 to greater than 2.8 and the permitted height ranging from 5 to greater than 36 for low to very high density residential development in the more intensively developed urban area of Singapore (Singapore Urban Redevelopment Authority, 2008).
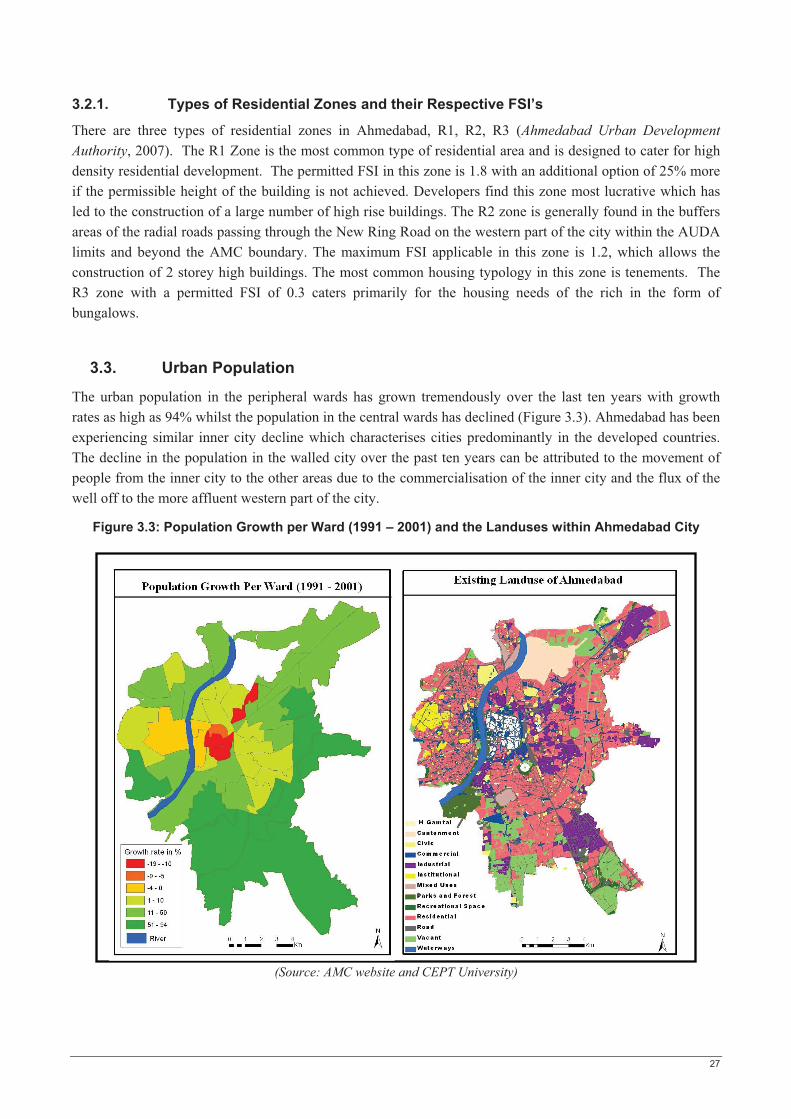
27
3.2.1. Types of Residential Zones and their Respective FSI’s
There are three types of residential zones in Ahmedabad, R1, R2, R3 (Ahmedabad Urban Development Authority, 2007). The R1 Zone is the most common type of residential area and is designed to cater for high density residential development. The permitted FSI in this zone is 1.8 with an additional option of 25% more if the permissible height of the building is not achieved. Developers find this zone most lucrative which has led to the construction of a large number of high rise buildings. The R2 zone is generally found in the buffers areas of the radial roads passing through the New Ring Road on the western part of the city within the AUDA limits and beyond the AMC boundary. The maximum FSI applicable in this zone is 1.2, which allows the construction of 2 storey high buildings. The most common housing typology in this zone is tenements. The R3 zone with a permitted FSI of 0.3 caters primarily for the housing needs of the rich in the form of bungalows.
3.3. Urban Population
The urban population in the peripheral wards has grown tremendously over the last ten years with growth rates as high as 94% whilst the population in the central wards has declined (Figure 3.3). Ahmedabad has been experiencing similar inner city decline which characterises cities predominantly in the developed countries. The decline in the population in the walled city over the past ten years can be attributed to the movement of people from the inner city to the other areas due to the commercialisation of the inner city and the flux of the well off to the more affluent western part of the city.
Figure 3.3: Population Growth per Ward (1991 – 2001) and the Landuses within Ahmedabad City
(Source: AMC website and CEPT University)
TRANSPORT RELATED SOCIAL EXCLUSION IN AHMEDABAD, INDIA
28
The flight of the well-off populations from the inner city centre can eventually lead to the decline in provision of services within these areas which would impact the levels of accessibility to these services by the poor who remain in these areas. An early recognition of such phenomenon and the formulation of adequate urban renewal policies may help reduce the spiral into urban decline in these inner city wards.
Population growth patterns combined with the urban planning policies determines the form an urban area takes.
3.4. Urban Form
Ahmedabad city has developed in a radial manner along the main transport network. The only landuse data available for the city dates back to the year 1997 and most recently prepared Development Plan for the city; which together were verified with Google Earth to compile a landuse map for the city (Figure 3.3). However with the assumption that 1997 landuse map is reflective of the current state of the city, this data has been used in the preparation the city development strategy for the years 2006 – 2012 to fulfil the requirements for evidence based planning.
The western part of the city generally has very low gross population densities ranging from five persons per hectare in ward of Navrangpura to 60 persons per hectare in Vasna. This part of the city houses the most affluent segments of the population who are located away from the possible negative impacts arising from being located close to industrial areas. Income generating uses such as industrial landuses are predominantly concentrated in the Eastern part of the city where there is a concentration of the poor and middle class factory workers with relatively high population densities (maximum gross population density of 300 persons per hectare in ward Kalupur)
Commercial development has occurred in narrow ribbon strips along the major roads whilst industrial development is predominantly concentrated near the airport and in the industrial subdivisions of Gomtipur where there is a concentration of mills such as the Ahmedabad cotton mills, the RamKrsihna Mills and the Marseden Mills and in Vatva which was established as an industrial estate and is currently home to some of the famous Indian manufacturers such as Nirma, Metrochem and Godrej.
There are limited recreation facilities in the city; a number of lakes within the city which have been upgraded as recreation areas for the members of the public however most residential suburbs lack recreation space, hence children especially in the slums, can be found playing on the narrow streets. Educational and institutional facilities are located predominantly in the western part of the city, which implies that the residents of the Eastern part of the city have to travel long distances to access these facilities.
In addition to the planning policies, caste and religious factors have played a strong role in the way the city has developed and the locations at which household have chosen to reside. The following box item (Figure 3.4) provides an insight into the caste and housing situation in Ahmedabad:
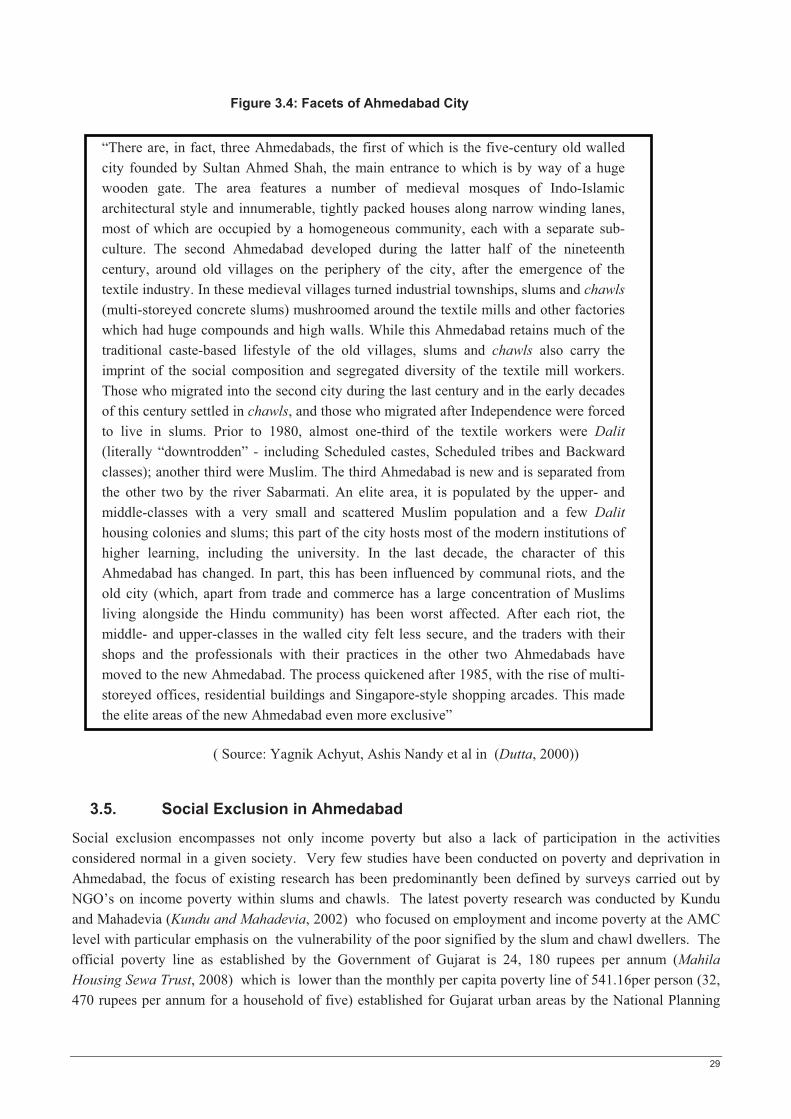
29
Figure 3.4: Facets of Ahmedabad City
“There are, in fact, three Ahmedabads, the first of which is the five-century old walled city founded by Sultan Ahmed Shah, the main entrance to which is by way of a huge wooden gate. The area features a number of medieval mosques of Indo-Islamic architectural style and innumerable, tightly packed houses along narrow winding lanes, most of which are occupied by a homogeneous community, each with a separate sub-culture. The second Ahmedabad developed during the latter half of the nineteenth century, around old villages on the periphery of the city, after the emergence of the textile industry. In these medieval villages turned industrial townships, slums and chawls (multi-storeyed concrete slums) mushroomed around the textile mills and other factories which had huge compounds and high walls. While this Ahmedabad retains much of the traditional caste-based lifestyle of the old villages, slums and chawls also carry the imprint of the social composition and segregated diversity of the textile mill workers. Those who migrated into the second city during the last century and in the early decades of this century settled in chawls, and those who migrated after Independence were forced to live in slums. Prior to 1980, almost one-third of the textile workers were Dalit (literally “downtrodden” - including Scheduled castes, Scheduled tribes and Backward classes); another third were Muslim. The third Ahmedabad is new and is separated from the other two by the river Sabarmati. An elite area, it is populated by the upper- and middle-classes with a very small and scattered Muslim population and a few Dalit housing colonies and slums; this part of the city hosts most of the modern institutions of higher learning, including the university. In the last decade, the character of this Ahmedabad has changed. In part, this has been influenced by communal riots, and the old city (which, apart from trade and commerce has a large concentration of Muslims living alongside the Hindu community) has been worst affected. After each riot, the middle- and upper-classes in the walled city felt less secure, and the traders with their shops and the professionals with their practices in the other two Ahmedabads have moved to the new Ahmedabad. The process quickened after 1985, with the rise of multi-storeyed offices, residential buildings and Singapore-style shopping arcades. This made the elite areas of the new Ahmedabad even more exclusive”
( Source: Yagnik Achyut, Ashis Nandy et al in (Dutta, 2000))
3.5. Social Exclusion in Ahmedabad
Social exclusion encompasses not only income poverty but also a lack of participation in the activities considered normal in a given society. Very few studies have been conducted on poverty and deprivation in Ahmedabad, the focus of existing research has been predominantly been defined by surveys carried out by NGO’s on income poverty within slums and chawls. The latest poverty research was conducted by Kundu and Mahadevia (Kundu and Mahadevia, 2002) who focused on employment and income poverty at the AMC level with particular emphasis on the vulnerability of the poor signified by the slum and chawl dwellers. The official poverty line as established by the Government of Gujarat is 24, 180 rupees per annum (Mahila Housing Sewa Trust, 2008) which is lower than the monthly per capita poverty line of 541.16per person (32, 470 rupees per annum for a household of five) established for Gujarat urban areas by the National Planning
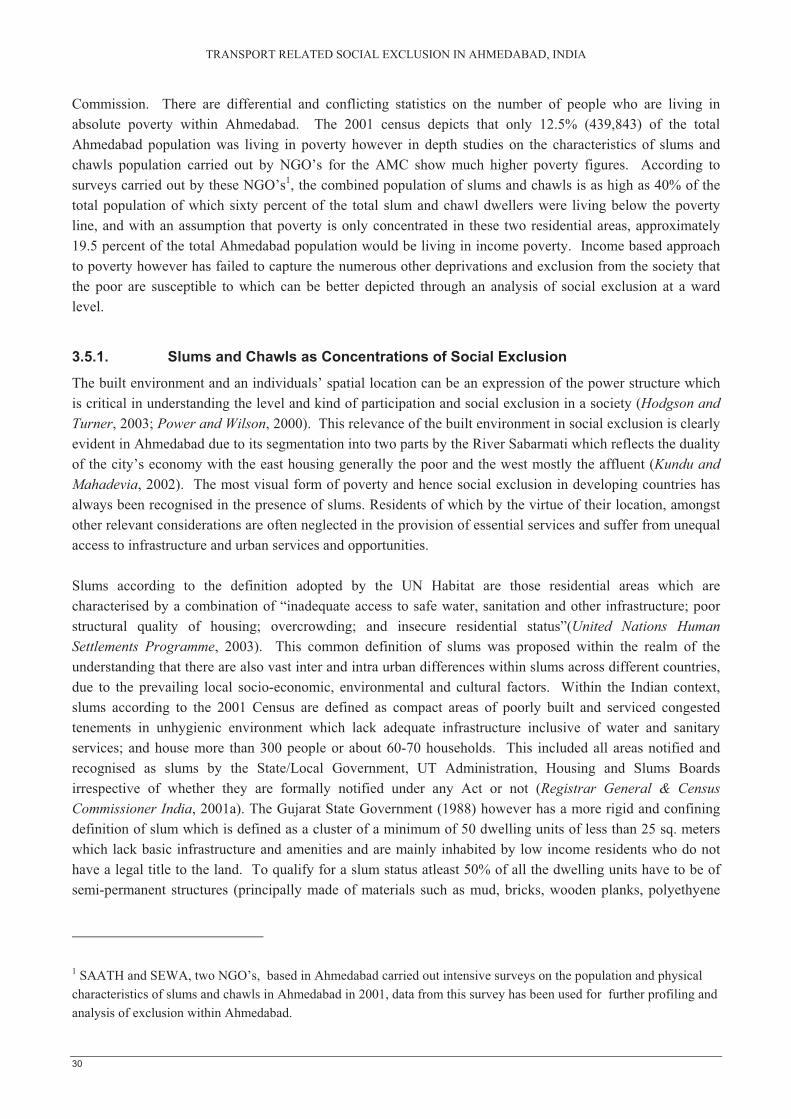
TRANSPORT RELATED SOCIAL EXCLUSION IN AHMEDABAD, INDIA
30
Commission. There are differential and conflicting statistics on the number of people who are living in absolute poverty within Ahmedabad. The 2001 census depicts that only 12.5% (439,843) of the total Ahmedabad population was living in poverty however in depth studies on the characteristics of slums and chawls population carried out by NGO’s for the AMC show much higher poverty figures. According to surveys carried out by these NGO’s1, the combined population of slums and chawls is as high as 40% of the total population of which sixty percent of the total slum and chawl dwellers were living below the poverty line, and with an assumption that poverty is only concentrated in these two residential areas, approximately 19.5 percent of the total Ahmedabad population would be living in income poverty. Income based approach to poverty however has failed to capture the numerous other deprivations and exclusion from the society that the poor are susceptible to which can be better depicted through an analysis of social exclusion at a ward level.
3.5.1. Slums and Chawls as Concentrations of Social Exclusion
The built environment and an individuals’ spatial location can be an expression of the power structure which is critical in understanding the level and kind of participation and social exclusion in a society (Hodgson and Turner, 2003; Power and Wilson, 2000). This relevance of the built environment in social exclusion is clearly evident in Ahmedabad due to its segmentation into two parts by the River Sabarmati which reflects the duality of the city’s economy with the east housing generally the poor and the west mostly the affluent (Kundu and Mahadevia, 2002). The most visual form of poverty and hence social exclusion in developing countries has always been recognised in the presence of slums. Residents of which by the virtue of their location, amongst other relevant considerations are often neglected in the provision of essential services and suffer from unequal access to infrastructure and urban services and opportunities.
Slums according to the definition adopted by the UN Habitat are those residential areas which are characterised by a combination of “inadequate access to safe water, sanitation and other infrastructure; poor structural quality of housing; overcrowding; and insecure residential status”(United Nations Human Settlements Programme, 2003). This common definition of slums was proposed within the realm of the understanding that there are also vast inter and intra urban differences within slums across different countries, due to the prevailing local socio-economic, environmental and cultural factors. Within the Indian context, slums according to the 2001 Census are defined as compact areas of poorly built and serviced congested tenements in unhygienic environment which lack adequate infrastructure inclusive of water and sanitary services; and house more than 300 people or about 60-70 households. This included all areas notified and recognised as slums by the State/Local Government, UT Administration, Housing and Slums Boards irrespective of whether they are formally notified under any Act or not (Registrar General & Census Commissioner India, 2001a). The Gujarat State Government (1988) however has a more rigid and confining definition of slum which is defined as a cluster of a minimum of 50 dwelling units of less than 25 sq. meters which lack basic infrastructure and amenities and are mainly inhabited by low income residents who do not have a legal title to the land. To qualify for a slum status atleast 50% of all the dwelling units have to be of semi-permanent structures (principally made of materials such as mud, bricks, wooden planks, polyethyene
1 SAATH and SEWA, two NGO’s, based in Ahmedabad carried out intensive surveys on the population and physical characteristics of slums and chawls in Ahmedabad in 2001, data from this survey has been used for further profiling and analysis of exclusion within Ahmedabad.
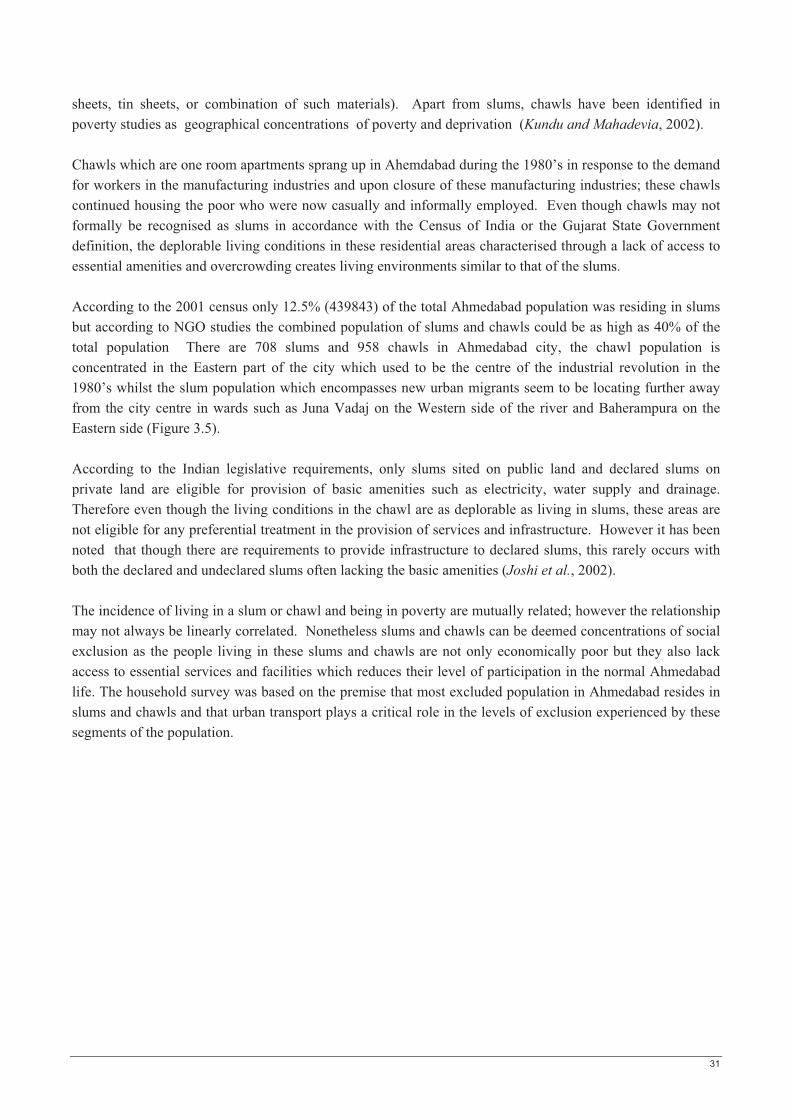
31
sheets, tin sheets, or combination of such materials). Apart from slums, chawls have been identified in poverty studies as geographical concentrations of poverty and deprivation (Kundu and Mahadevia, 2002).
Chawls which are one room apartments sprang up in Ahemdabad during the 1980’s in response to the demand for workers in the manufacturing industries and upon closure of these manufacturing industries; these chawls continued housing the poor who were now casually and informally employed. Even though chawls may not formally be recognised as slums in accordance with the Census of India or the Gujarat State Government definition, the deplorable living conditions in these residential areas characterised through a lack of access to essential amenities and overcrowding creates living environments similar to that of the slums.
According to the 2001 census only 12.5% (439843) of the total Ahmedabad population was residing in slums but according to NGO studies the combined population of slums and chawls could be as high as 40% of the total population There are 708 slums and 958 chawls in Ahmedabad city, the chawl population is concentrated in the Eastern part of the city which used to be the centre of the industrial revolution in the 1980’s whilst the slum population which encompasses new urban migrants seem to be locating further away from the city centre in wards such as Juna Vadaj on the Western side of the river and Baherampura on the Eastern side (Figure 3.5).
According to the Indian legislative requirements, only slums sited on public land and declared slums on private land are eligible for provision of basic amenities such as electricity, water supply and drainage. Therefore even though the living conditions in the chawl are as deplorable as living in slums, these areas are not eligible for any preferential treatment in the provision of services and infrastructure. However it has been noted that though there are requirements to provide infrastructure to declared slums, this rarely occurs with both the declared and undeclared slums often lacking the basic amenities (Joshi et al., 2002).
The incidence of living in a slum or chawl and being in poverty are mutually related; however the relationship may not always be linearly correlated. Nonetheless slums and chawls can be deemed concentrations of social exclusion as the people living in these slums and chawls are not only economically poor but they also lack access to essential services and facilities which reduces their level of participation in the normal Ahmedabad life. The household survey was based on the premise that most excluded population in Ahmedabad resides in slums and chawls and that urban transport plays a critical role in the levels of exclusion experienced by these segments of the population.
TRANSPORT RELATED SOCIAL EXCLUSION IN AHMEDABAD, INDIA
32
Figure 3.4: Ward-wise Slum and Chawl Population as a Percent of the Total Ward Population
.
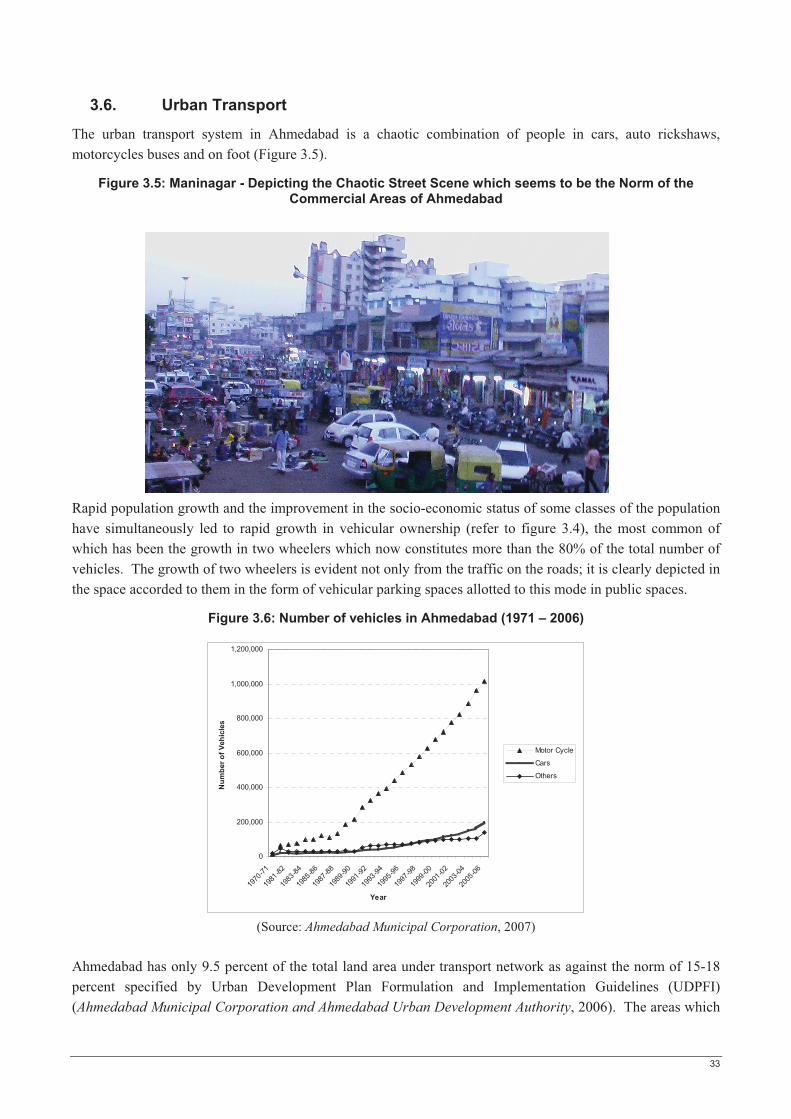
33
0
200,000
400,000
600,000
800,000
1,000,000
1,200,000
1970
-71
1981
-82
1983
-84
1985
-86
1987
-88
1989
-90
1991
-92
1993
-94
1995
-96
1997
-98
1999
-00
2001
-02
2003
-04
2005
-06
Year
Num
ber o
f Veh
icle
s
Motor Cycle
Cars
Others
3.6. Urban Transport
The urban transport system in Ahmedabad is a chaotic combination of people in cars, auto rickshaws, motorcycles buses and on foot (Figure 3.5).
Figure 3.5: Maninagar - Depicting the Chaotic Street Scene which seems to be the Norm of the Commercial Areas of Ahmedabad
Rapid population growth and the improvement in the socio-economic status of some classes of the population have simultaneously led to rapid growth in vehicular ownership (refer to figure 3.4), the most common of which has been the growth in two wheelers which now constitutes more than the 80% of the total number of vehicles. The growth of two wheelers is evident not only from the traffic on the roads; it is clearly depicted in the space accorded to them in the form of vehicular parking spaces allotted to this mode in public spaces.
Figure 3.6: Number of vehicles in Ahmedabad (1971 – 2006)
(Source: Ahmedabad Municipal Corporation, 2007)
Ahmedabad has only 9.5 percent of the total land area under transport network as against the norm of 15-18 percent specified by Urban Development Plan Formulation and Implementation Guidelines (UDPFI) (Ahmedabad Municipal Corporation and Ahmedabad Urban Development Authority, 2006). The areas which
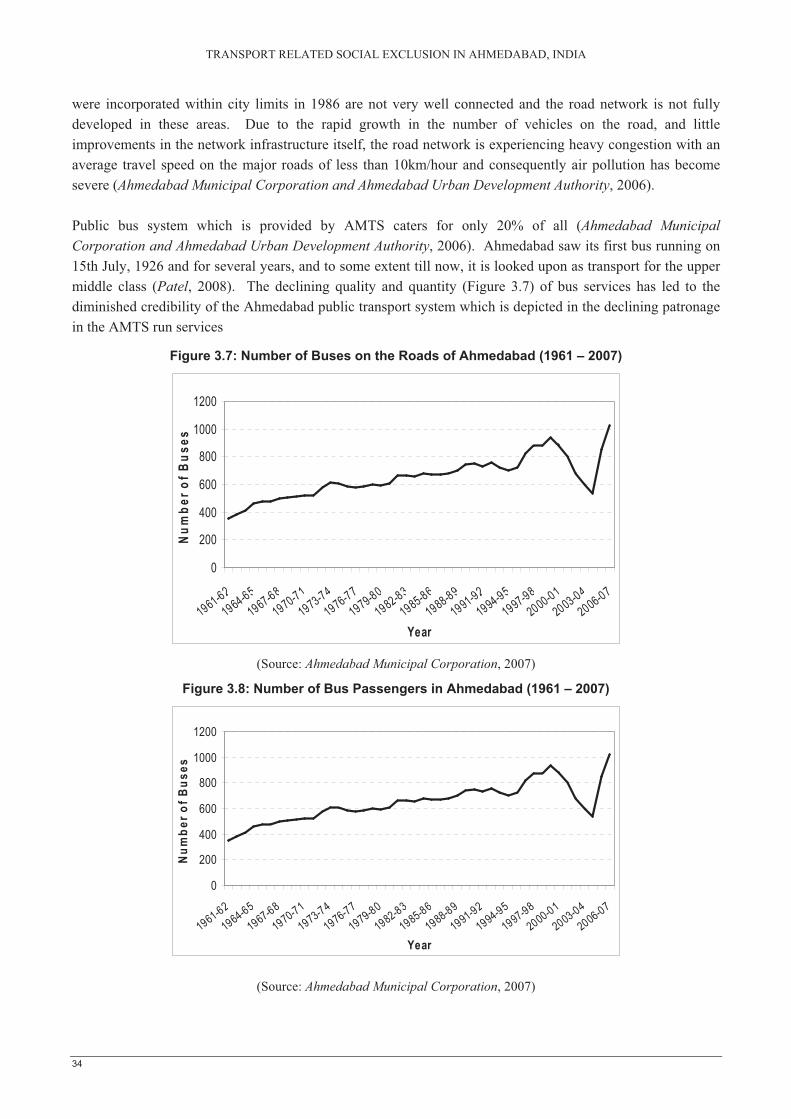
TRANSPORT RELATED SOCIAL EXCLUSION IN AHMEDABAD, INDIA
34
0
200
400
600
800
1000
1200
1961-621964-65
1967-681970-71
1973-741976-77
1979-801982-83
1985-861988-89
1991-921994-95
1997-982000-01
2003-042006-07
Year
Num
ber o
f Bus
es
0
200
400
600
800
1000
1200
1961-62
1964-65
1967-68
1970-71
1973-74
1976-77
1979-80
1982-83
1985-86
1988-89
1991-92
1994-95
1997-98
2000-01
2003-04
2006-07
Year
Num
ber o
f Bus
es
were incorporated within city limits in 1986 are not very well connected and the road network is not fully developed in these areas. Due to the rapid growth in the number of vehicles on the road, and little improvements in the network infrastructure itself, the road network is experiencing heavy congestion with an average travel speed on the major roads of less than 10km/hour and consequently air pollution has become severe (Ahmedabad Municipal Corporation and Ahmedabad Urban Development Authority, 2006).
Public bus system which is provided by AMTS caters for only 20% of all (Ahmedabad Municipal Corporation and Ahmedabad Urban Development Authority, 2006). Ahmedabad saw its first bus running on 15th July, 1926 and for several years, and to some extent till now, it is looked upon as transport for the upper middle class (Patel, 2008). The declining quality and quantity (Figure 3.7) of bus services has led to the diminished credibility of the Ahmedabad public transport system which is depicted in the declining patronage in the AMTS run services
Figure 3.7: Number of Buses on the Roads of Ahmedabad (1961 – 2007)
(Source: Ahmedabad Municipal Corporation, 2007)
Figure 3.8: Number of Bus Passengers in Ahmedabad (1961 – 2007)
(Source: Ahmedabad Municipal Corporation, 2007)
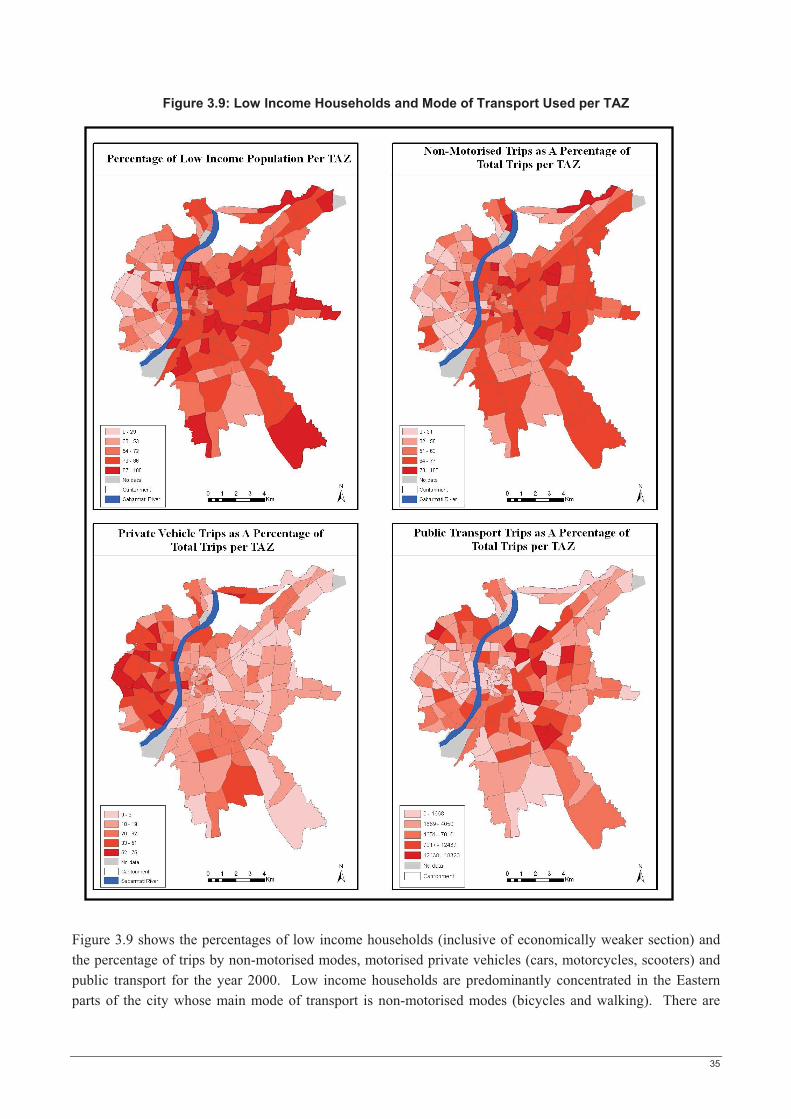
35
Figure 3.9: Low Income Households and Mode of Transport Used per TAZ
Figure 3.9 shows the percentages of low income households (inclusive of economically weaker section) and the percentage of trips by non-motorised modes, motorised private vehicles (cars, motorcycles, scooters) and public transport for the year 2000. Low income households are predominantly concentrated in the Eastern parts of the city whose main mode of transport is non-motorised modes (bicycles and walking). There are
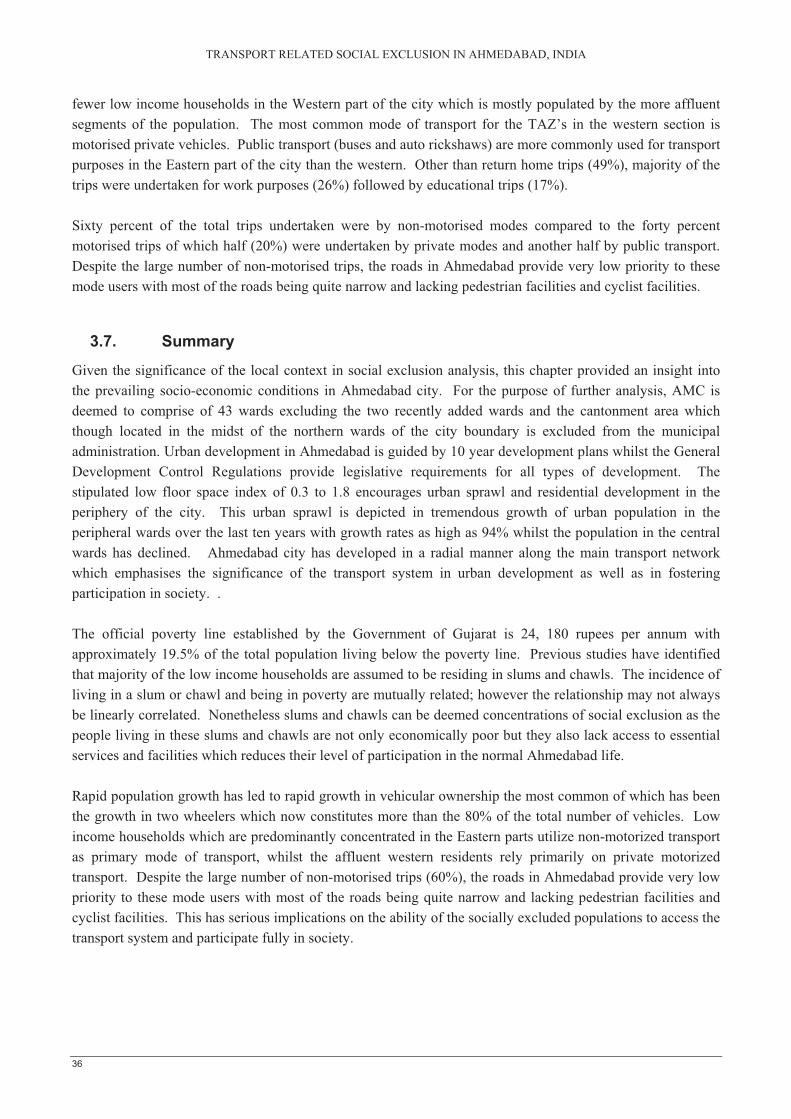
TRANSPORT RELATED SOCIAL EXCLUSION IN AHMEDABAD, INDIA
36
fewer low income households in the Western part of the city which is mostly populated by the more affluent segments of the population. The most common mode of transport for the TAZ’s in the western section is motorised private vehicles. Public transport (buses and auto rickshaws) are more commonly used for transport purposes in the Eastern part of the city than the western. Other than return home trips (49%), majority of the trips were undertaken for work purposes (26%) followed by educational trips (17%).
Sixty percent of the total trips undertaken were by non-motorised modes compared to the forty percent motorised trips of which half (20%) were undertaken by private modes and another half by public transport. Despite the large number of non-motorised trips, the roads in Ahmedabad provide very low priority to these mode users with most of the roads being quite narrow and lacking pedestrian facilities and cyclist facilities.
3.7. Summary
Given the significance of the local context in social exclusion analysis, this chapter provided an insight into the prevailing socio-economic conditions in Ahmedabad city. For the purpose of further analysis, AMC is deemed to comprise of 43 wards excluding the two recently added wards and the cantonment area which though located in the midst of the northern wards of the city boundary is excluded from the municipal administration. Urban development in Ahmedabad is guided by 10 year development plans whilst the General Development Control Regulations provide legislative requirements for all types of development. The stipulated low floor space index of 0.3 to 1.8 encourages urban sprawl and residential development in the periphery of the city. This urban sprawl is depicted in tremendous growth of urban population in the peripheral wards over the last ten years with growth rates as high as 94% whilst the population in the central wards has declined. Ahmedabad city has developed in a radial manner along the main transport network which emphasises the significance of the transport system in urban development as well as in fostering participation in society. .
The official poverty line established by the Government of Gujarat is 24, 180 rupees per annum with approximately 19.5% of the total population living below the poverty line. Previous studies have identified that majority of the low income households are assumed to be residing in slums and chawls. The incidence of living in a slum or chawl and being in poverty are mutually related; however the relationship may not always be linearly correlated. Nonetheless slums and chawls can be deemed concentrations of social exclusion as the people living in these slums and chawls are not only economically poor but they also lack access to essential services and facilities which reduces their level of participation in the normal Ahmedabad life.
Rapid population growth has led to rapid growth in vehicular ownership the most common of which has been the growth in two wheelers which now constitutes more than the 80% of the total number of vehicles. Low income households which are predominantly concentrated in the Eastern parts utilize non-motorized transport as primary mode of transport, whilst the affluent western residents rely primarily on private motorized transport. Despite the large number of non-motorised trips (60%), the roads in Ahmedabad provide very low priority to these mode users with most of the roads being quite narrow and lacking pedestrian facilities and cyclist facilities. This has serious implications on the ability of the socially excluded populations to access the transport system and participate fully in society.
37
4. Methodology
This chapter provides an overview of the methodological approaches used in the analysing transport related social exclusion in Ahmedabad. This research was carried out in three phases. Phase one involved the conceptualisation of transport related social exclusion at a global level prior to determining the key manifestations and methodological approaches for defining and measuring this phenomenon. Phase two was classified as the fieldwork phase which incorporated getting acquainted with the city of Ahmedabad and collecting primary and secondary field data which formed the crux of the fieldwork for this research. The primary focus of any social exclusion analysis are the socially excluded population whose perception of the services which they need to access and the role that transport plays in enabling participation is integral to localising the manifestations of exclusion. The third phase involved the actual analysis of transport related social exclusion which was carried out at two levels; a city wide analysis and another focusing on selected wards. The following sections describe the methodological approaches used in phases two (Ahmedabad field work) and three (data entry and analysis) of this research.
4.1. The Ahmedabad Fieldwork
Primary data collection in the form of household surveys to gauge people’s perception of exclusion was deemed most significant way to establish the relationship between transport and social exclusion at a local level. Field observations and discussion with various modes of transport users was undertaken to get acquainted with the city and the transport system. Prior to the actual household survey discussion were undertaken with staff members of CEPT who were involved in assisting AMC and AMTS with land use and transport planning to gain an insight into the issues pertaining to transport related social exclusion in Ahmedabad. Through these discussions it was unanimously discovered that transport had a tremendous impact on the levels of social exclusion experienced by the socially excluded population; this segment of the population were generally identified as those households who were residing in slums and chawls. Transport access was deemed to hinder participation in certain activities such as employment locations and school choices. The experts noted that the mode choice of the socially excluded impacted on their level of exposure to accidents and pollution and also had serious implications on their time availability and usage. The various steps of the household survey involved the questionnaire design with the selection of study wards and households prior to conducting the household survey; these activities are discussed in the following sections.
4.1.1. The Questionnaire Design and Variables
The questionnaire was formulated to collate information on the socio-economic characteristics of the households, their travel requirements and patterns and their perception of the limitations they faced due to inadequate access to transport. The variables had been pre-selected from literature review and a discussion was held with the academic staff of CEPT University on the content and the local applicability of the manifestations prior to field survey.
The first part of the questionnaire focused on the households’ socio-economic characteristics which included variables such as the income earned by the household, the educational levels and the number of family members in the household; the dwelling characteristics (material and type of construction and access to water and electricity) and the ownership of assets inclusive of refrigerators, TV’s and the different modes of
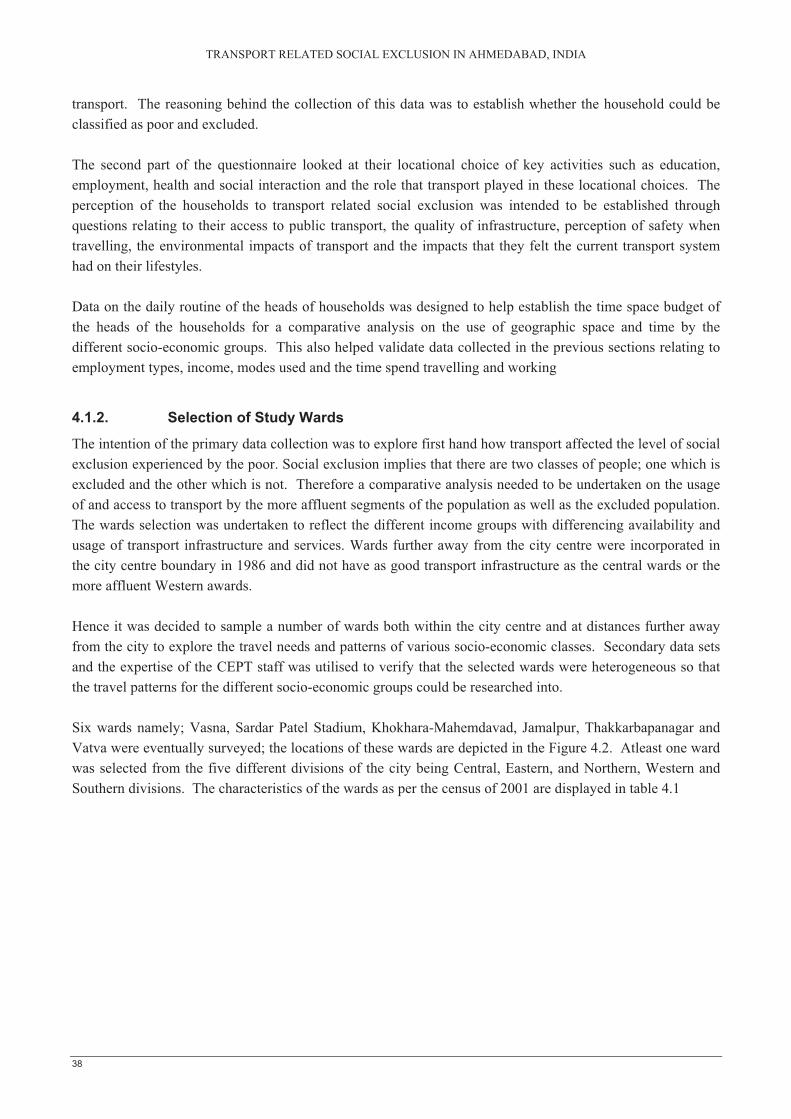
TRANSPORT RELATED SOCIAL EXCLUSION IN AHMEDABAD, INDIA
38
transport. The reasoning behind the collection of this data was to establish whether the household could be classified as poor and excluded.
The second part of the questionnaire looked at their locational choice of key activities such as education, employment, health and social interaction and the role that transport played in these locational choices. The perception of the households to transport related social exclusion was intended to be established through questions relating to their access to public transport, the quality of infrastructure, perception of safety when travelling, the environmental impacts of transport and the impacts that they felt the current transport system had on their lifestyles.
Data on the daily routine of the heads of households was designed to help establish the time space budget of the heads of the households for a comparative analysis on the use of geographic space and time by the different socio-economic groups. This also helped validate data collected in the previous sections relating to employment types, income, modes used and the time spend travelling and working
4.1.2. Selection of Study Wards
The intention of the primary data collection was to explore first hand how transport affected the level of social exclusion experienced by the poor. Social exclusion implies that there are two classes of people; one which is excluded and the other which is not. Therefore a comparative analysis needed to be undertaken on the usage of and access to transport by the more affluent segments of the population as well as the excluded population. The wards selection was undertaken to reflect the different income groups with differencing availability and usage of transport infrastructure and services. Wards further away from the city centre were incorporated in the city centre boundary in 1986 and did not have as good transport infrastructure as the central wards or the more affluent Western awards.
Hence it was decided to sample a number of wards both within the city centre and at distances further away from the city to explore the travel needs and patterns of various socio-economic classes. Secondary data sets and the expertise of the CEPT staff was utilised to verify that the selected wards were heterogeneous so that the travel patterns for the different socio-economic groups could be researched into.
Six wards namely; Vasna, Sardar Patel Stadium, Khokhara-Mahemdavad, Jamalpur, Thakkarbapanagar and Vatva were eventually surveyed; the locations of these wards are depicted in the Figure 4.2. Atleast one ward was selected from the five different divisions of the city being Central, Eastern, and Northern, Western and Southern divisions. The characteristics of the wards as per the census of 2001 are displayed in table 4.1
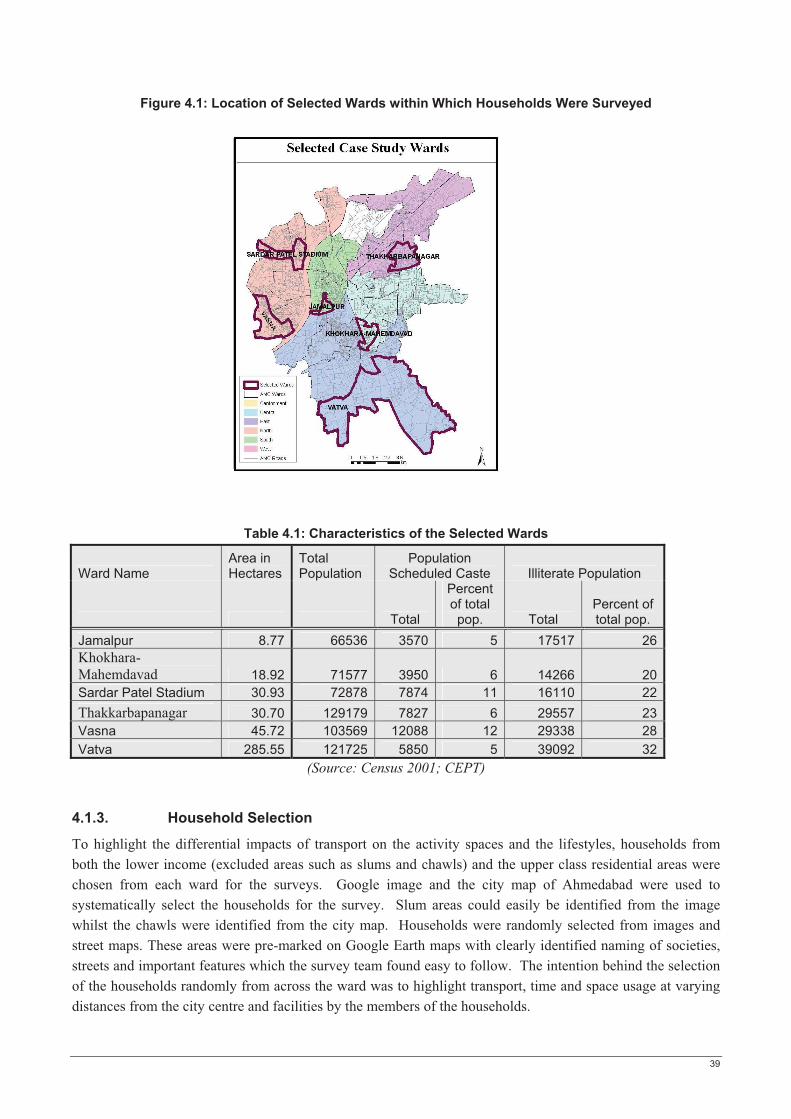
39
Figure 4.1: Location of Selected Wards within Which Households Were Surveyed
Table 4.1: Characteristics of the Selected Wards
Ward Name Area in Hectares
Total Population
Population Scheduled Caste Illiterate Population
Total
Percent of total pop. Total
Percent of total pop.
Jamalpur 8.77 66536 3570 5 17517 26Khokhara-Mahemdavad 18.92 71577 3950 6 14266 20Sardar Patel Stadium 30.93 72878 7874 11 16110 22Thakkarbapanagar 30.70 129179 7827 6 29557 23Vasna 45.72 103569 12088 12 29338 28Vatva 285.55 121725 5850 5 39092 32
(Source: Census 2001; CEPT)
4.1.3. Household Selection
To highlight the differential impacts of transport on the activity spaces and the lifestyles, households from both the lower income (excluded areas such as slums and chawls) and the upper class residential areas were chosen from each ward for the surveys. Google image and the city map of Ahmedabad were used to systematically select the households for the survey. Slum areas could easily be identified from the image whilst the chawls were identified from the city map. Households were randomly selected from images and street maps. These areas were pre-marked on Google Earth maps with clearly identified naming of societies, streets and important features which the survey team found easy to follow. The intention behind the selection of the households randomly from across the ward was to highlight transport, time and space usage at varying distances from the city centre and facilities by the members of the households.
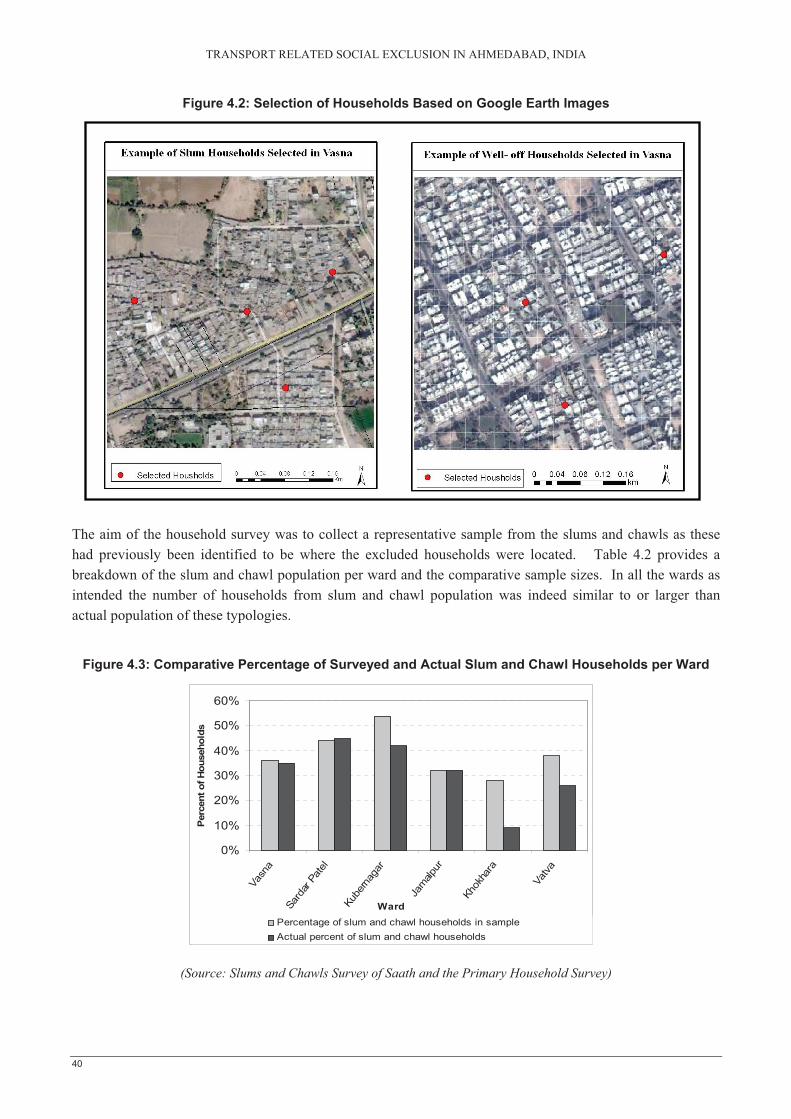
TRANSPORT RELATED SOCIAL EXCLUSION IN AHMEDABAD, INDIA
40
0%
10%
20%
30%
40%
50%
60%
Vasn
a
Sard
arPa
tel
Kube
rnag
ar
Jam
alpur
Khok
hara
Vatva
Ward
Per
cent
of H
ouse
hold
s
Percentage of slum and chawl households in sampleActual percent of slum and chawl households
Figure 4.2: Selection of Households Based on Google Earth Images
The aim of the household survey was to collect a representative sample from the slums and chawls as these had previously been identified to be where the excluded households were located. Table 4.2 provides a breakdown of the slum and chawl population per ward and the comparative sample sizes. In all the wards as intended the number of households from slum and chawl population was indeed similar to or larger than actual population of these typologies.
Figure 4.3: Comparative Percentage of Surveyed and Actual Slum and Chawl Households per Ward
(Source: Slums and Chawls Survey of Saath and the Primary Household Survey)
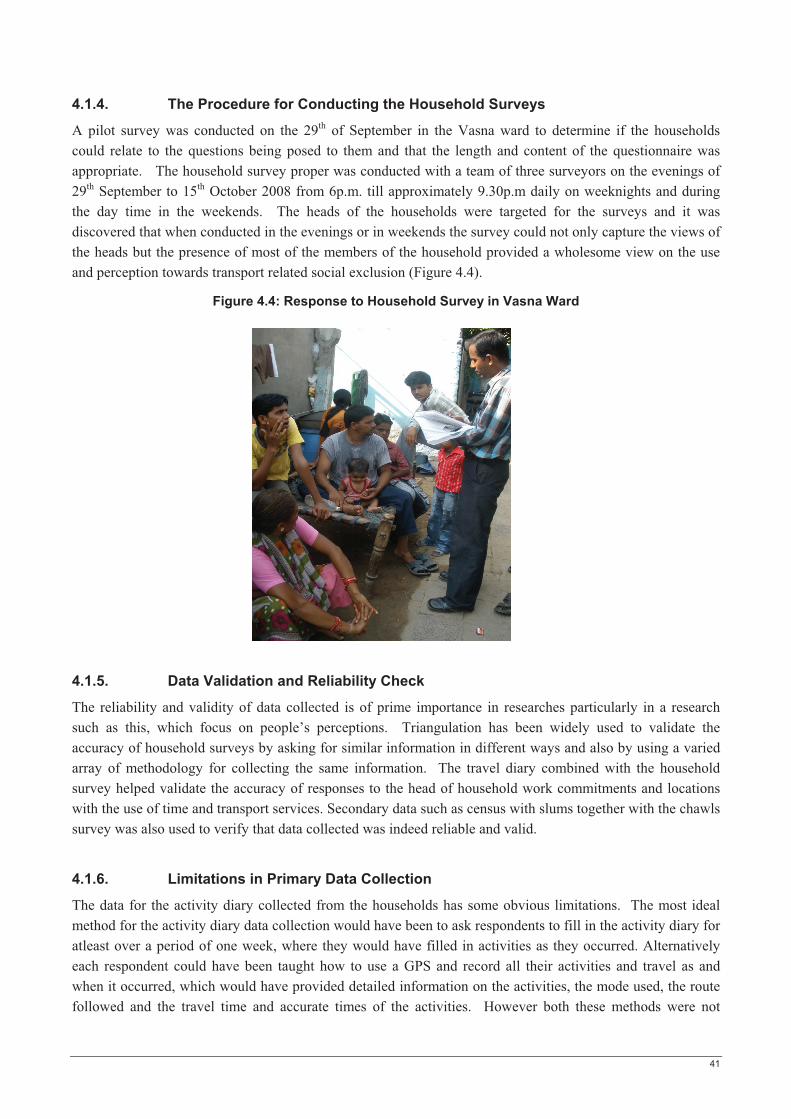
41
4.1.4. The Procedure for Conducting the Household Surveys
A pilot survey was conducted on the 29th of September in the Vasna ward to determine if the households could relate to the questions being posed to them and that the length and content of the questionnaire was appropriate. The household survey proper was conducted with a team of three surveyors on the evenings of 29th September to 15th October 2008 from 6p.m. till approximately 9.30p.m daily on weeknights and during the day time in the weekends. The heads of the households were targeted for the surveys and it was discovered that when conducted in the evenings or in weekends the survey could not only capture the views of the heads but the presence of most of the members of the household provided a wholesome view on the use and perception towards transport related social exclusion (Figure 4.4).
Figure 4.4: Response to Household Survey in Vasna Ward
4.1.5. Data Validation and Reliability Check
The reliability and validity of data collected is of prime importance in researches particularly in a research such as this, which focus on people’s perceptions. Triangulation has been widely used to validate the accuracy of household surveys by asking for similar information in different ways and also by using a varied array of methodology for collecting the same information. The travel diary combined with the household survey helped validate the accuracy of responses to the head of household work commitments and locations with the use of time and transport services. Secondary data such as census with slums together with the chawls survey was also used to verify that data collected was indeed reliable and valid.
4.1.6. Limitations in Primary Data Collection
The data for the activity diary collected from the households has some obvious limitations. The most ideal method for the activity diary data collection would have been to ask respondents to fill in the activity diary for atleast over a period of one week, where they would have filled in activities as they occurred. Alternatively each respondent could have been taught how to use a GPS and record all their activities and travel as and when it occurred, which would have provided detailed information on the activities, the mode used, the route followed and the travel time and accurate times of the activities. However both these methods were not

TRANSPORT RELATED SOCIAL EXCLUSION IN AHMEDABAD, INDIA
42
feasible to explore in this research. Give the interruption to the normal routine for part of the survey time due to religious celebrations in Ahmedabad, the method used was to ask the respondents recall a normal days activities, which may have in certain cases omitted the recollection of non-routine activities such as short work and non-work related activities and trips. The details of the household however do provide good insight into the households’ choice of activity locations, the mode of travel, spending on transport and the time budgets of the households. In addition to primary data, secondary data was collected during the field work for validation of primary data and analysis of transport related social exclusion at a citywide ward level
4.1.7. Secondary Data
As with any other research, working with the secondary data acquired during the fieldwork has its own challenges. Unfortunately most of the secondary data collected during the fieldwork was in different formats with the GIS data having different projection systems; therefore creating a workable data set was time consuming. Secondary data relating to transport system was collected from the BRTS cell in CEPT mostly in AutoCAD format, whilst Saath provided data in PDF format on the characteristics of slums and chawls such as land ownership, type of housing within the slums and the level of infrastructure and services available.
Census of India is considered one of the most reliable sources of data in India. The 2001 census data for Ahmedabad provided information on the socio-economic characteristics of the population in Ahmedabad. The Ahmedabad municipality has a variety of data sets available on its web site, this was also utilised where feasible to determine the transport characteristics as well to cross check the responses from the household survey.
The only landuse data available for Ahmedabad is the 1997 landuse map prepared by CEPT and AMC whilst the guidelines for future landuse was provided by the Development Plan Given that more than 10 years have elapsed since the preparation of this landuse map, many of the landuses had changed. The landuse within the case study wards were verified with Google maps and the Ahmedabad Street maps. However given the scope of this research and the limited time for fieldwork; the detailed change in landuse is not being looked into and the maps are not updated in its entirety. Nevertheless the locations of schools, slums within the study wards have been identified using the Ahmedabad City Map and the correct locations georeferenced for further analysis of activity spaces and accessibility analysis as a measure of transport related social exclusion.
4.2. Data Entry and Analysis
Data collected from the household survey was entered into SPSS spreadsheet with appropriate coding of variables and upon completion was cross checked to verify that indeed data was entered correctly. Household locations and locations of daily activities for the heads of households were entered into feature classes for further analysis relating to accessibility and activity time space analysis. The analysis of transport related social exclusion in Ahmedabad was carried out at two levels; city wide analysis at a ward level and at the level of the case study area.
4.2.1. City Wide Analysis of Transport Related Social Exclusion at a Ward Level
The city wide analysis of social exclusion was undertaken to determine the correlation between access to transport and the levels of social exclusion experienced in the various wards of Ahmedabad. Indicators for each of the elements were based upon literature review of similar studies in developing country and the Indian
43
context. Discussion with academic staff and policy makers helped establish the elements of exclusion and transport access which were deemed most important in the local context. The indicators were formulated based predominantly on the secondary data sources; however the primary data assisted in the choice of indicators which would be meaningful within the local context. A livelihoods approach based on six different types of capital was utilised to calculate the levels of transport related social exclusion which was then correlated with the different types of capitals to establish the relationships if any of the exclusion from the various types of capitals and the overall social exclusion index. The details of the methods employed and the indicators used is discussed further in chapter five
4.2.2. Analysing the Different Manifestations of Transport Related Social Exclusion in the Case Study Area
Transport related social exclusion in manifested in various forms; SPSS and Excel were used to undertake data analysis and presentation of households’ perception of the various manifestations of transport related social exclusion. Where feasible households’ perception of the transport related social exclusion was correlated with secondary data for verification purposes. It was discovered that households perception did indeed correlate with the ground reality for example the secondary accidents data revealed that those households which had ranked dear of accidents as one of major manifestations of transport related social exclusion were indeed more accident prone since the old city and the Eastern parts of Ahmedabad had the worst records for road accidents.
It was revealed from the household survey that low income earners had dramatically different choices in activity locations and mode choices when compared with the middle and high income earners. As an example it was found that the children from the low income family attended the municipal schools and walked to these schools whilst the middle income children attended private schools which had prearranged pick ups from home or the parents dropped them off at schools. Based on locational and mode choice from the primary data, accessibility analysis to the secondary educational facilities was carried out for two fold purpose. Firstly to show the spatially excluded households in terms of travel time and distances to these primary schools to establish the role of transport facilities in accessibility to services and to verify that as noted by the households the lack of transport and the long walking distance did indeed play a critical role in the perception of exclusion.
Research has recently commenced in the possibilities of using activity spaces as proxy indicator of transport related social exclusion. Data collected from the travel diaries of the heads of households was analysed based both on network distances as well as traditional spheres to determine whether there are major differences in the activity spaces of the different socio – economic classes, which will help to establish in conjunction with an analysis of people’s perception on the significance of transport related social exclusion in the six wards of Ahmedabad. The two forms of accessibility analysis; closest facility for educational facilities and network based activity spaces are further explored in chapter seven of this research.
4.3. Summary
To establish the local context of transport related social exclusion, primary data collection in the form of household surveys was used to collate information on the socio-economic characteristics of the households, their travel requirements and patterns together with their perception on the manifestations of transport related
TRANSPORT RELATED SOCIAL EXCLUSION IN AHMEDABAD, INDIA
44
social exclusion. Households by varying socio-economic status were surveyed across the wards of Vasna, Sardar Patel Stadium, Khokhara-Mahemdavad, Jamalpur, Thakkarbapanagar and Vatva; which signified the selection of atleast one ward from the five different divisions of the city. Google image and the city map of Ahmedabad were used to systematically select the households for the survey with slum areas easily identified from the image whilst the chawls were identified from the city map. Data collected from the household survey was entered into SPSS spreadsheet with appropriate coding of variables whilst household locations and locations of daily activities for the heads of households were entered into feature classes in ArcGIS. The validity and accuracy of the data collected from the household survey was established though triangulation. Travel diary helped validate the accuracy of responses to the general questionnaire in addition to the use of secondary data such as census to verify that data collected was indeed reliable and valid.
The analysis of transport related social exclusion in Ahmedabad was carried out at two levels; city wide analysis at a ward level and at the level of the case study area. The city wide analysis of social exclusion was undertaken to determine the correlation between access to transport and the levels of social exclusion experienced in the various wards of Ahmedabad. The details of the methods employed and the indicators fro this city wide analysis used are discussed further in chapter five. At the case study level; the manifestations of transport related social exclusion was analysed using SPSS and Excel and where feasible households’perception of the transport related social exclusion was correlated with secondary data for verification purposes. Further to the perception of manifestations, accessibility analysis to the primary educational facilities was carried out for establishing the role of transport in enabling access to services at an aggregate level and to verify households’ perception of spatial exclusion. An analysis of the activity spaces of the heads of households to determine if the socially excluded household had differential spatial reach than the well-off households was carried using ArcGIS based network analysis. The two forms of accessibility analysis; closest facility for educational facilities and network based activity spaces are further explored in chapter seven of this research.
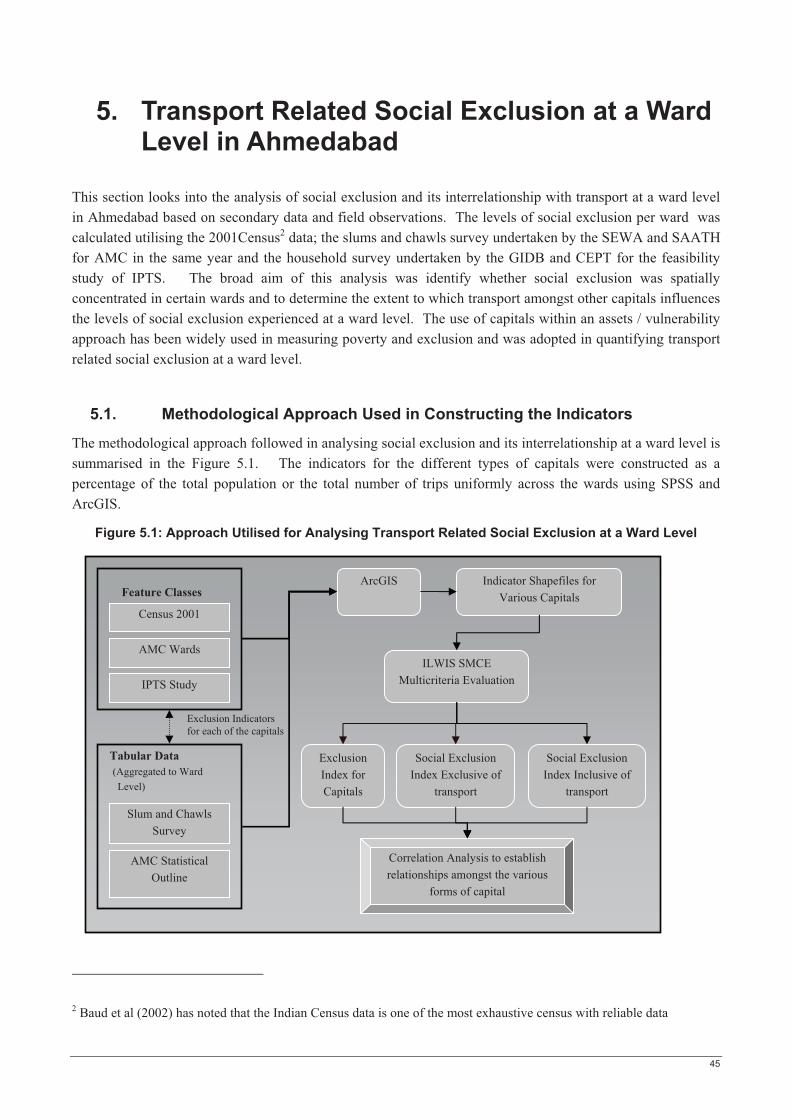
45
Census 2001
Slum and Chawls Survey
ILWIS SMCE Multicriteria Evaluation
Correlation Analysis to establish relationships amongst the various
forms of capital
IPTS Study
AMC Wards
AMC Statistical Outline
Exclusion Index for Capitals
Social Exclusion Index Exclusive of
transport
Feature Classes
Tabular Data (Aggregated to Ward
Level)
ArcGIS Indicator Shapefiles for Various Capitals
Social Exclusion Index Inclusive of
transport
Exclusion Indicators for each of the capitals
5. Transport Related Social Exclusion at a Ward Level in Ahmedabad
This section looks into the analysis of social exclusion and its interrelationship with transport at a ward level in Ahmedabad based on secondary data and field observations. The levels of social exclusion per ward was calculated utilising the 2001Census2 data; the slums and chawls survey undertaken by the SEWA and SAATH for AMC in the same year and the household survey undertaken by the GIDB and CEPT for the feasibility study of IPTS. The broad aim of this analysis was identify whether social exclusion was spatially concentrated in certain wards and to determine the extent to which transport amongst other capitals influences the levels of social exclusion experienced at a ward level. The use of capitals within an assets / vulnerability approach has been widely used in measuring poverty and exclusion and was adopted in quantifying transport related social exclusion at a ward level.
5.1. Methodological Approach Used in Constructing the Indicators
The methodological approach followed in analysing social exclusion and its interrelationship at a ward level is summarised in the Figure 5.1. The indicators for the different types of capitals were constructed as a percentage of the total population or the total number of trips uniformly across the wards using SPSS and ArcGIS.
Figure 5.1: Approach Utilised for Analysing Transport Related Social Exclusion at a Ward Level
2 Baud et al (2002) has noted that the Indian Census data is one of the most exhaustive census with reliable data
TRANSPORT RELATED SOCIAL EXCLUSION IN AHMEDABAD, INDIA
46
In circumstances where it was deemed necessary to convert the number of households into population figures, this conversion was done based on the average household size of five for Ahmedabad as specified by the Census department (Office of the Registrar General & Census Commissioner India, 2007).
The need for spatial data in the analysis required that tabular data on individual slums and chawls be summarised using Excel and SPSS prior to joining with the ward feature class in ArcGIS to compile spatial ward based indicators for each of the capitals prior to spatial analysis in ILWIS SMCE. ILWIS (Integrated Land and Water Information System) has inbuilt functionality named Spatial Multi Criteria Analysis (SMCE) which allows the creation of a composite map of an area based on selected criteria. A composite map is calculated based on individual raster maps applicable to the criteria established using the criteria tree which allows the grouping, weighing and standardizing of individual criteria. Given that no previous studies existed neither did this survey seek the relevance accorded by stakeholders and residents to each of these capitals, equal weights were assigned to the different indicators and capitals. The raster maps for the six types of capitals were standardised using the interval standardisation method3 which is relevant for data measured on a relative scale (Sharifi et al., 2007) prior to the creation of composite maps for each of the capitals and social exclusion per ward both including and excluding transport elements. The following section provides an overview of the different types of capitals used in the analysis, the indicators chosen for each of the capitals and the reason for doing so followed by a discussion on the results of the analysis.
5.2. The Types of Capitals Deemed Instrumental in Defining Exclusion at a Ward Level in Ahmedabad
The types of capital which have been used in calculating social exclusion have been discussed in chapter two; the following classification of indicators follows on from that discussion. Paichaud (2002) identifies five forms of capital which affects the level of poverty and social exclusion at a national and individual level; being financial, physical, human, public infrastructure and social capital. The broad categories of capitals selected for the analysis of social exclusion is partially based on Paichauds (2002) definition of the capitals as well as the livelihoods approach utilised by Baud et al (2008) in mapping urban poverty for Delhi, India. Given the emphasis in this research on transport related social exclusion, selected indicators for transport use and access to transport infrastructure for which supporting data was available at a ward level have been included under a transport domain. In addition to the transport capital, the five other capitals which are used for calculating the overall social exclusion index are social; human; financial; physical and political capitals (Figure 5.2)
Social capital is defined broadly as the “social networks, reciprocities that arise from and the value of these for achieving mutual goals” (Baron et al., 2000). It includes “networks, norms, rules and social values” which can either have a bridging effect which may reduce social exclusion or a bonding effect which increases social exclusion (Piachaud, 2002).
3 Benefit Criteria = score – lowest score Cost Criteria = 1 – Score – lowest score
highest score – lowest score highest score – lowest score
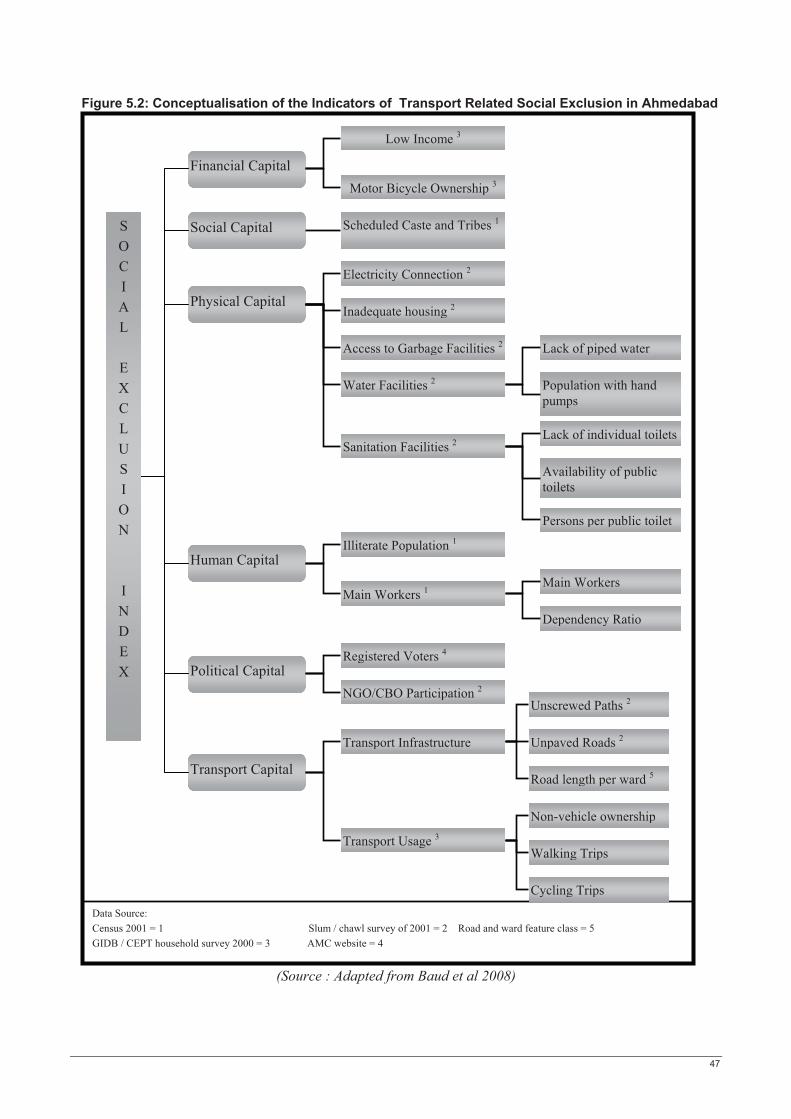
47
Figure 5.2: Conceptualisation of the Indicators of Transport Related Social Exclusion in Ahmedabad
(Source : Adapted from Baud et al 2008)
Cycling Trips
S O C I A L
E X C L U S I O N
I N D E X
Low Income 3
Financial Capital
Social Capital
Physical Capital
Human Capital
Political Capital
Transport Capital
Motor Bicycle Ownership 3
Scheduled Caste and Tribes 1
Data Source: Census 2001 = 1 Slum / chawl survey of 2001 = 2 Road and ward feature class = 5 GIDB / CEPT household survey 2000 = 3 AMC website = 4
Inadequate housing 2
Water Facilities 2
Lack of individual toilets
Population with hand pumps
Access to Garbage Facilities 2
Sanitation Facilities 2
Lack of piped water
Availability of public toilets
Persons per public toilet
Electricity Connection 2
Illiterate Population 1
Main Workers 1
Dependency Ratio
Registered Voters 4
Main Workers
NGO/CBO Participation 2
Transport Infrastructure
Transport Usage 3
Unscrewed Paths 2
Unpaved Roads 2
Road length per ward 5
Non-vehicle ownership
Walking Trips
TRANSPORT RELATED SOCIAL EXCLUSION IN AHMEDABAD, INDIA
48
Within the Indian context, the caste system plays an integral role in the exclusion of certain social groups of people such as the untouchables or the scheduled castes from participating in the full realm of daily activities. However this phenomenon is often ignored in poverty and exclusion studies particularly by the economists (Nayak, 1995). Previous studies have shown that a household in India is 30% more likely to be poor if it belongs to the scheduled caste and tribe (Haan, 2004). In Ahmedabad a households’ religious affiliation in particular the minority Muslims has played an important role in the exclusion and victimisation as has been evidenced by the intensity and magnitude of communal riots described as the worst of the earlier post colonial riots in India (Banerjee et al., 2005). Given a lack of data on the Muslim population and the extent of daily exclusionary practices against them, the percentage of scheduled castes and tribes has been chosen as a proxy indicator of social capital. Social interaction is an important indicator of social exclusion based on the belief that face-to-face social interactions stimulate social trust and this is usually indicated through the total number of friends with which has a person has contact with on a regular basis (Fahmy, 2003). However despite its significance in the level of social exclusion given the obvious difficulties in collating such information, the level of social interaction is not utilised as an indicator of social capital. Human capital refers to the “individual capacity to flourish in a capitalist – market economy”(Lavalette and Pratt, 2005) which comprises of an individuals skills, education and training (Piachaud, 2002). Human capital is characterised by illiterate population, main workers and dependency ratio which illustrates the number of people who are dependent on the main workers. Moser (1998) includes in her definition of human capital the health situation of individuals which inadvertently affects an individuals capacity to participate in the labour market. Health component of the human capital has been depicted as the population suffering from limiting long-standing illness and the comparative illness and disability ratio etc in the Scottish and English indices of deprivation (Noble et al., 2008; Palmer et al., 2006). Neither the census of 2001 nor the slum and chawl survey provided any data on the health status of the population and it is assumed that the participation in workforce reflects indirectly the ability of household members to work and is adopted in the operationalisation of the indicators for human capital.
Financial capital refers to the financial assets that a household has access to (Piachaud, 2002) which can take the form of “savings, credit, remittances and pension” (Rakodi and Lloyd-Jones, 2002). The financial situation of household is mostly demonstrated through the household income. The low income population which includes in the case of Ahmedabad the population living well below the poverty line referred to as the economically weaker section (EWS) and the low income earners which is characterised in the traffic surveys of 2000 as the population earning below 5500 rupees per month is utilised as an indicator of financial deprivation. The ownership of motor cycles is also used as proxy indicator of the financial capital of households.
Physical capital can be defined as the ownership and access to physical assets such as land, housing and basic infrastructure of water, sanitation, electricity etc. The indicators chosen for physical capital relate to the housing condition reflected in the population living in inadequate housing and the lack of access to basic infrastructure. The household survey in the six wards revealed had that even though there are many forms of deprivation in residential areas defined as government quarters, only the slums and chawls did not have adequate access to state provided infrastructure such as water, electricity and sanitation facilities, hence the data from the slum and chawl survey has been used in the construction of the relevant indicators. It is assumed that households which do not have access to piped water but own hand pumps are better off than those who have access to neither. In many of the slums and chawls lacking individual toilets have been provided with
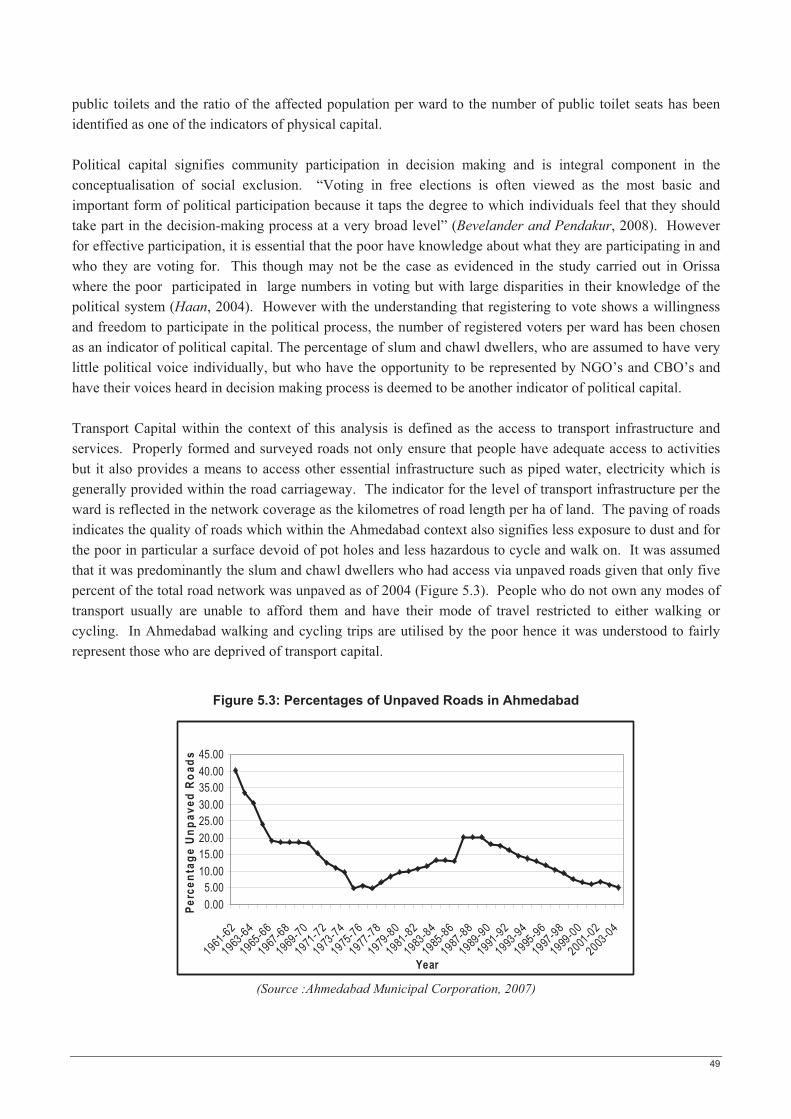
49
0.005.00
10.0015.0020.0025.0030.0035.0040.0045.00
1961-62
1963-64
1965-66
1967-68
1969-70
1971-72
1973-74
1975-76
1977-78
1979-80
1981-82
1983-84
1985-86
1987-88
1989-90
1991-92
1993-94
1995-96
1997-98
1999-00
2001-02
2003-04
Year
Perc
enta
ge U
npav
ed R
oads
public toilets and the ratio of the affected population per ward to the number of public toilet seats has been identified as one of the indicators of physical capital.
Political capital signifies community participation in decision making and is integral component in the conceptualisation of social exclusion. “Voting in free elections is often viewed as the most basic and important form of political participation because it taps the degree to which individuals feel that they should take part in the decision-making process at a very broad level” (Bevelander and Pendakur, 2008). However for effective participation, it is essential that the poor have knowledge about what they are participating in and who they are voting for. This though may not be the case as evidenced in the study carried out in Orissa where the poor participated in large numbers in voting but with large disparities in their knowledge of the political system (Haan, 2004). However with the understanding that registering to vote shows a willingness and freedom to participate in the political process, the number of registered voters per ward has been chosen as an indicator of political capital. The percentage of slum and chawl dwellers, who are assumed to have very little political voice individually, but who have the opportunity to be represented by NGO’s and CBO’s and have their voices heard in decision making process is deemed to be another indicator of political capital.
Transport Capital within the context of this analysis is defined as the access to transport infrastructure and services. Properly formed and surveyed roads not only ensure that people have adequate access to activities but it also provides a means to access other essential infrastructure such as piped water, electricity which is generally provided within the road carriageway. The indicator for the level of transport infrastructure per the ward is reflected in the network coverage as the kilometres of road length per ha of land. The paving of roads indicates the quality of roads which within the Ahmedabad context also signifies less exposure to dust and for the poor in particular a surface devoid of pot holes and less hazardous to cycle and walk on. It was assumed that it was predominantly the slum and chawl dwellers who had access via unpaved roads given that only five percent of the total road network was unpaved as of 2004 (Figure 5.3). People who do not own any modes of transport usually are unable to afford them and have their mode of travel restricted to either walking or cycling. In Ahmedabad walking and cycling trips are utilised by the poor hence it was understood to fairly represent those who are deprived of transport capital.
Figure 5.3: Percentages of Unpaved Roads in Ahmedabad
(Source :Ahmedabad Municipal Corporation, 2007)

TRANSPORT RELATED SOCIAL EXCLUSION IN AHMEDABAD, INDIA
50
5.3. Ward-wise Overall Exclusion Level and Specific Capital Exclusion Results
The following maps depict the results for overall social exclusion index and the individual capitals with green tones highlighting the wards with below mean levels of exclusion and whilst the orange and red tones highlight the wards which have scored higher levels of exclusion than the average for the city as a whole.
Figure 5.4: Social, Human, Financial and Physical Capital Index per Ward
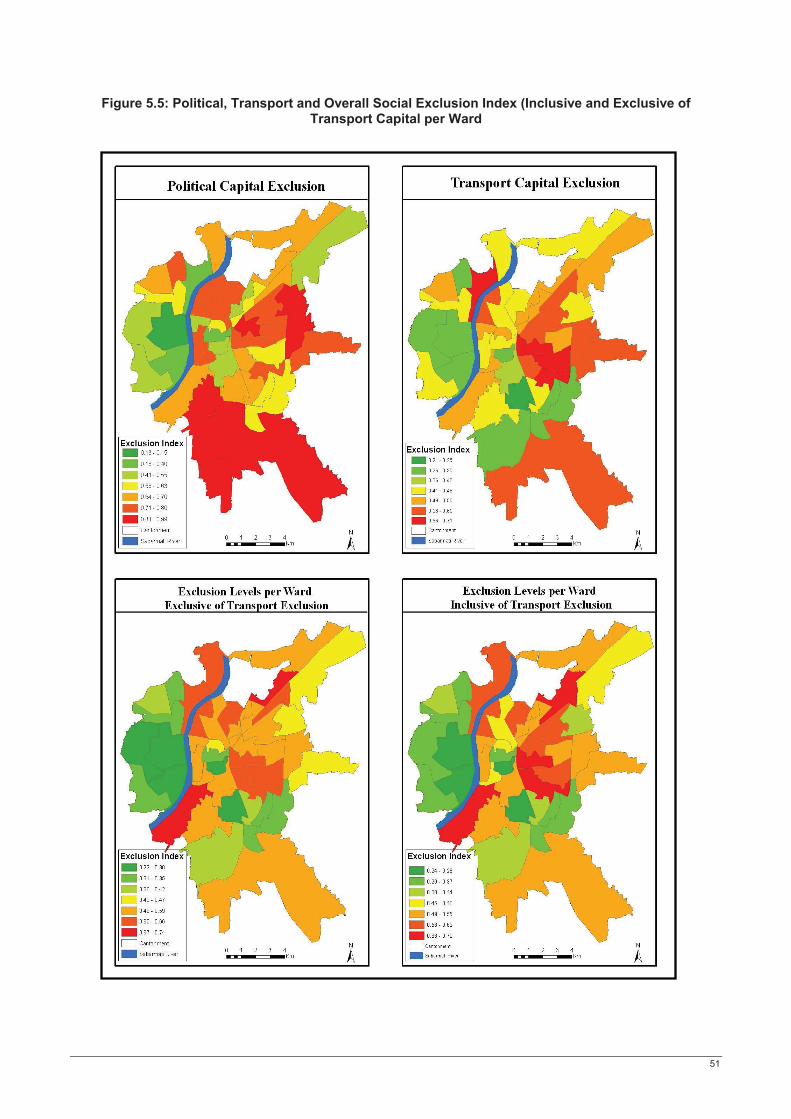
51
Figure 5.5: Political, Transport and Overall Social Exclusion Index (Inclusive and Exclusive of Transport Capital per Ward
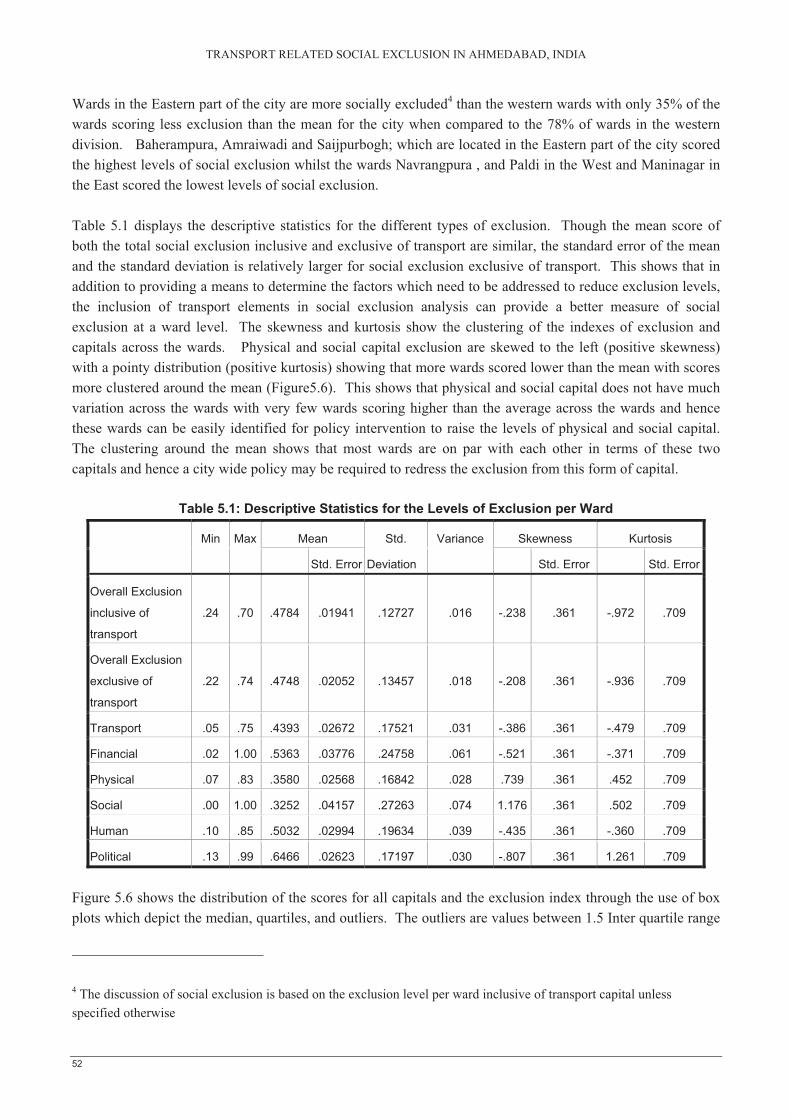
TRANSPORT RELATED SOCIAL EXCLUSION IN AHMEDABAD, INDIA
52
Wards in the Eastern part of the city are more socially excluded4 than the western wards with only 35% of the wards scoring less exclusion than the mean for the city when compared to the 78% of wards in the western division. Baherampura, Amraiwadi and Saijpurbogh; which are located in the Eastern part of the city scored the highest levels of social exclusion whilst the wards Navrangpura , and Paldi in the West and Maninagar in the East scored the lowest levels of social exclusion.
Table 5.1 displays the descriptive statistics for the different types of exclusion. Though the mean score of both the total social exclusion inclusive and exclusive of transport are similar, the standard error of the mean and the standard deviation is relatively larger for social exclusion exclusive of transport. This shows that in addition to providing a means to determine the factors which need to be addressed to reduce exclusion levels, the inclusion of transport elements in social exclusion analysis can provide a better measure of social exclusion at a ward level. The skewness and kurtosis show the clustering of the indexes of exclusion and capitals across the wards. Physical and social capital exclusion are skewed to the left (positive skewness) with a pointy distribution (positive kurtosis) showing that more wards scored lower than the mean with scores more clustered around the mean (Figure5.6). This shows that physical and social capital does not have much variation across the wards with very few wards scoring higher than the average across the wards and hence these wards can be easily identified for policy intervention to raise the levels of physical and social capital. The clustering around the mean shows that most wards are on par with each other in terms of these two capitals and hence a city wide policy may be required to redress the exclusion from this form of capital.
Table 5.1: Descriptive Statistics for the Levels of Exclusion per Ward
Min Max Mean Std. Variance Skewness Kurtosis
Std. Error Deviation Std. Error Std. Error
Overall Exclusion
inclusive of
transport
.24 .70 .4784 .01941 .12727 .016 -.238 .361 -.972 .709
Overall Exclusion
exclusive of
transport
.22 .74 .4748 .02052 .13457 .018 -.208 .361 -.936 .709
Transport .05 .75 .4393 .02672 .17521 .031 -.386 .361 -.479 .709
Financial .02 1.00 .5363 .03776 .24758 .061 -.521 .361 -.371 .709
Physical .07 .83 .3580 .02568 .16842 .028 .739 .361 .452 .709
Social .00 1.00 .3252 .04157 .27263 .074 1.176 .361 .502 .709
Human .10 .85 .5032 .02994 .19634 .039 -.435 .361 -.360 .709
Political .13 .99 .6466 .02623 .17197 .030 -.807 .361 1.261 .709
Figure 5.6 shows the distribution of the scores for all capitals and the exclusion index through the use of box plots which depict the median, quartiles, and outliers. The outliers are values between 1.5 Inter quartile range
4 The discussion of social exclusion is based on the exclusion level per ward inclusive of transport capital unless specified otherwise
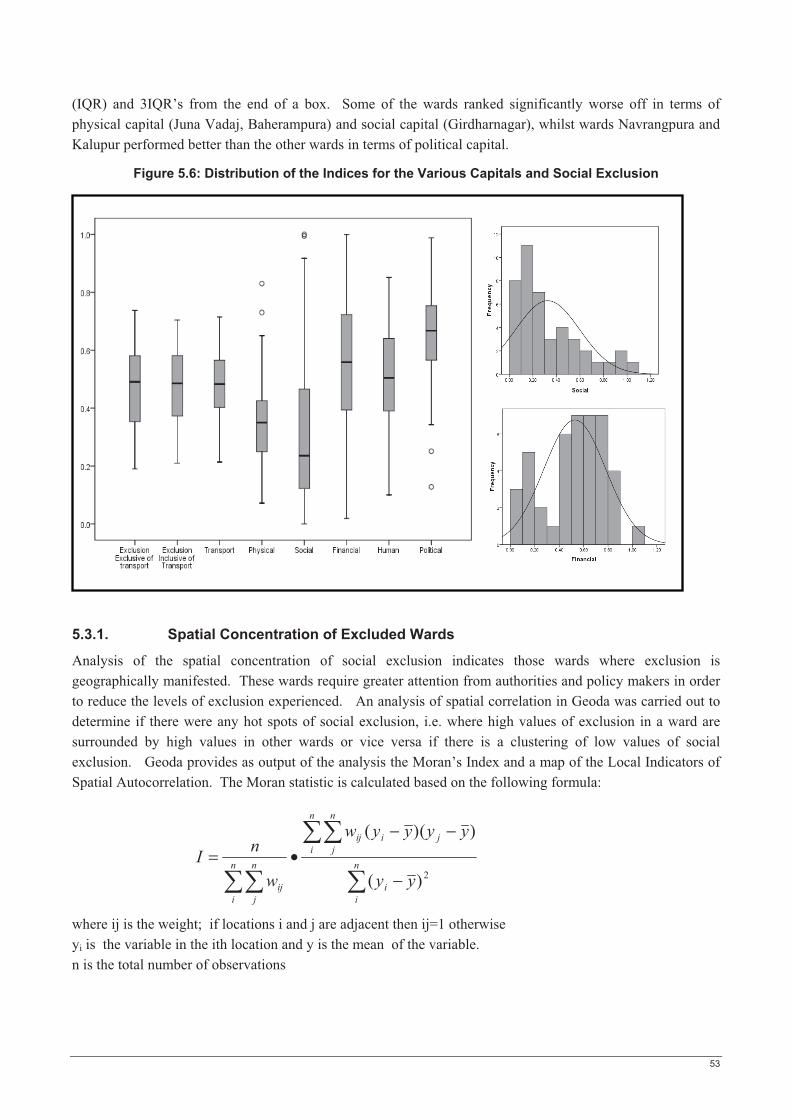
53
�
��
�� −
−−•= n
ii
n
i
n
jjiij
n
i
n
jij yy
yyyyw
w
nI2)(
))((
(IQR) and 3IQR’s from the end of a box. Some of the wards ranked significantly worse off in terms of physical capital (Juna Vadaj, Baherampura) and social capital (Girdharnagar), whilst wards Navrangpura and Kalupur performed better than the other wards in terms of political capital.
Figure 5.6: Distribution of the Indices for the Various Capitals and Social Exclusion
5.3.1. Spatial Concentration of Excluded Wards
Analysis of the spatial concentration of social exclusion indicates those wards where exclusion is geographically manifested. These wards require greater attention from authorities and policy makers in order to reduce the levels of exclusion experienced. An analysis of spatial correlation in Geoda was carried out to determine if there were any hot spots of social exclusion, i.e. where high values of exclusion in a ward are surrounded by high values in other wards or vice versa if there is a clustering of low values of social exclusion. Geoda provides as output of the analysis the Moran’s Index and a map of the Local Indicators of Spatial Autocorrelation. The Moran statistic is calculated based on the following formula:
where ij is the weight; if locations i and j are adjacent then ij=1 otherwise yi is the variable in the ith location and y is the mean of the variable. n is the total number of observations

TRANSPORT RELATED SOCIAL EXCLUSION IN AHMEDABAD, INDIA
54
Spatial Correlation
Hot Spots of Transport Related Social Exclusion
The Morans’ I is used to test hypotheses concerning similarity and is read in the same manner as the product- moment correlation coefficient, where +1 indicates a strong spatial autocorrelation, 0 no correlation and -1 a negative autocorrelation
The spatial autocorrelation for social exclusion was based on weight system assigned using rook contiguity with the results of the analysis shown in figure 5.7. The Moran’s I index for social exclusion is +0.3040, does show that there is positive correlation amongst some of the wards and that there is some level of concentration of high and low values for the social exclusion index. . The associated map shows that there can indeed be some wards identified as hot and cold spots of exclusion. The western wards by virtue of better provision of services and infrastructure show concentrations of low values of social exclusion with wards such as Vasna and Naranpura on the western part of the city identified as cold spots (with low social exclusion index) of exclusion. There is a concentration of hot spots of exclusion within the Eastern part of the city with wards such as Amraiwadi, Rajpur and Rakhial identified as hot spots (high social exclusion index) of exclusion. These wards would most definitely require priority in terms of policy actions to enable the reversal of the high levels of exclusion. The implications of the concentrations of high levels of exclusion such as decay of residential areas and implications on the morale and the lack of desire of individuals to spiral out of exclusion the has been discussed in a number of literature and are not further explored in this research. But it suffices to say that concentrations of social exclusion has serious implications on the quality of life of the affected households and individuals which requires action on the part of policy makers to encourage better participation in society.
Figure 5.7: Spatial Correlation of Social Exclusion in Ahmedabad
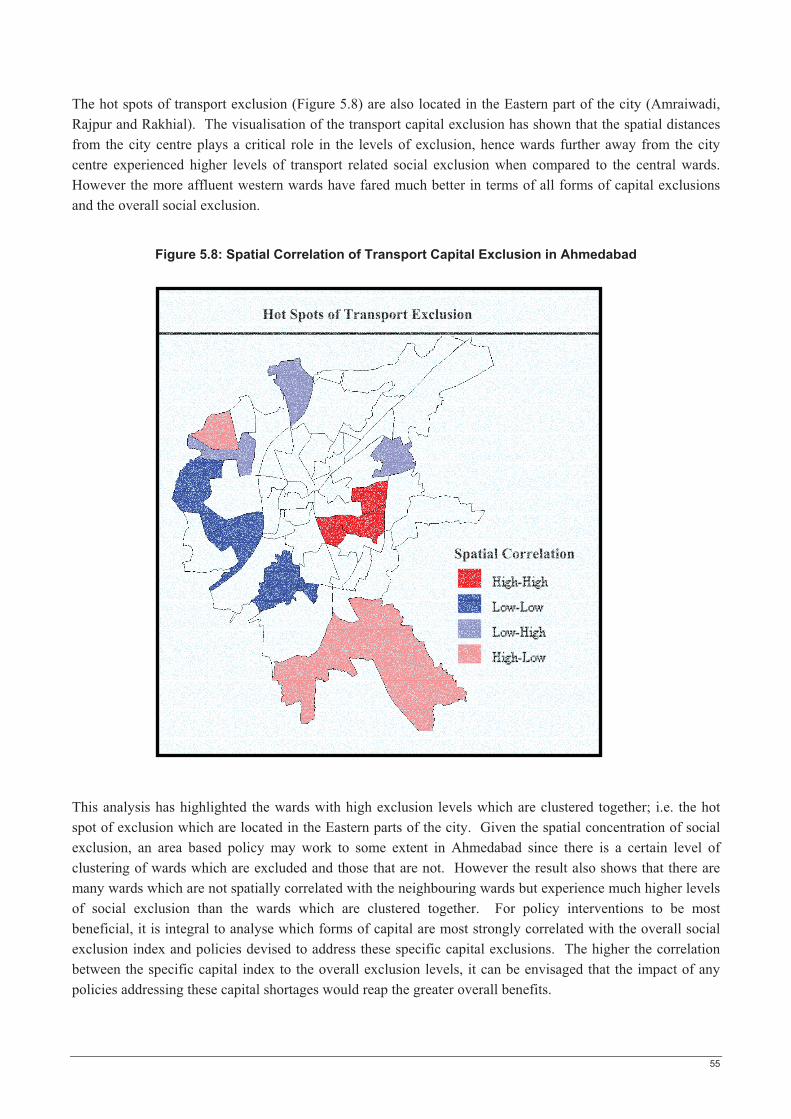
55
Hot Spots of Transport Exclusion
Spatial Correlation
The hot spots of transport exclusion (Figure 5.8) are also located in the Eastern part of the city (Amraiwadi, Rajpur and Rakhial). The visualisation of the transport capital exclusion has shown that the spatial distances from the city centre plays a critical role in the levels of exclusion, hence wards further away from the city centre experienced higher levels of transport related social exclusion when compared to the central wards. However the more affluent western wards have fared much better in terms of all forms of capital exclusions and the overall social exclusion.
Figure 5.8: Spatial Correlation of Transport Capital Exclusion in Ahmedabad
This analysis has highlighted the wards with high exclusion levels which are clustered together; i.e. the hot spot of exclusion which are located in the Eastern parts of the city. Given the spatial concentration of social exclusion, an area based policy may work to some extent in Ahmedabad since there is a certain level of clustering of wards which are excluded and those that are not. However the result also shows that there are many wards which are not spatially correlated with the neighbouring wards but experience much higher levels of social exclusion than the wards which are clustered together. For policy interventions to be most beneficial, it is integral to analyse which forms of capital are most strongly correlated with the overall social exclusion index and policies devised to address these specific capital exclusions. The higher the correlation between the specific capital index to the overall exclusion levels, it can be envisaged that the impact of any policies addressing these capital shortages would reap the greater overall benefits.
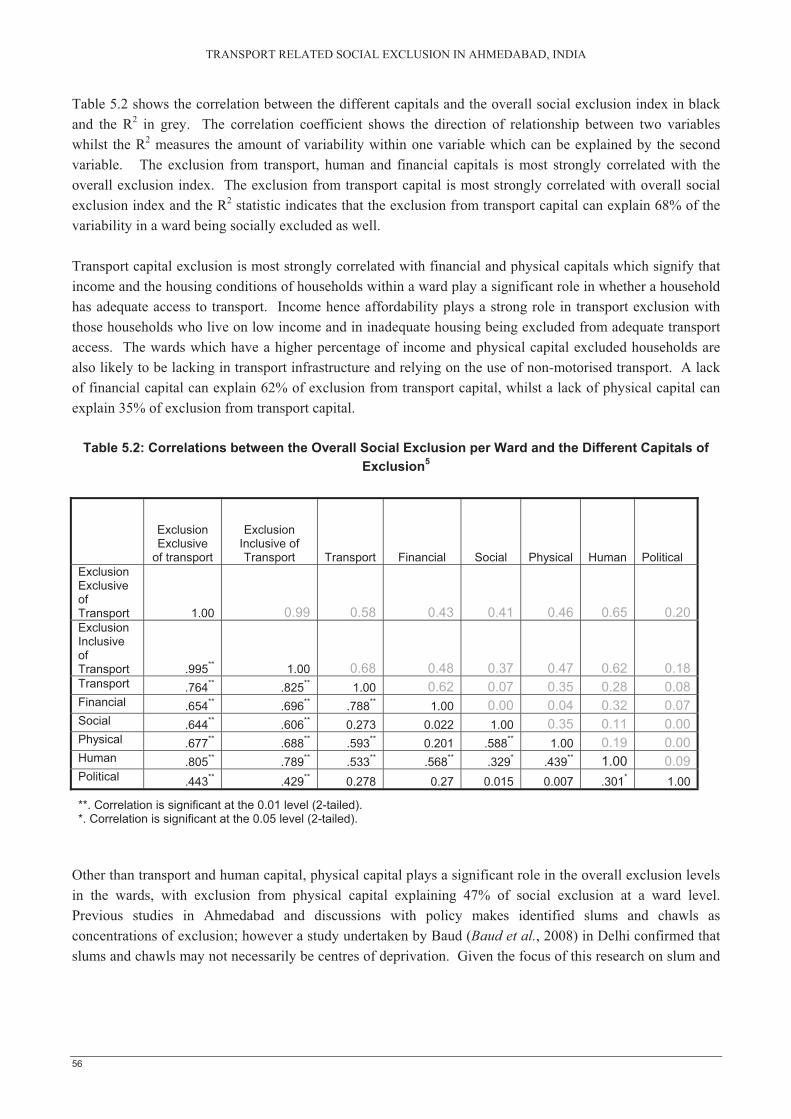
TRANSPORT RELATED SOCIAL EXCLUSION IN AHMEDABAD, INDIA
56
Table 5.2 shows the correlation between the different capitals and the overall social exclusion index in black and the R2 in grey. The correlation coefficient shows the direction of relationship between two variables whilst the R2 measures the amount of variability within one variable which can be explained by the second variable. The exclusion from transport, human and financial capitals is most strongly correlated with the overall exclusion index. The exclusion from transport capital is most strongly correlated with overall social exclusion index and the R2 statistic indicates that the exclusion from transport capital can explain 68% of the variability in a ward being socially excluded as well.
Transport capital exclusion is most strongly correlated with financial and physical capitals which signify that income and the housing conditions of households within a ward play a significant role in whether a household has adequate access to transport. Income hence affordability plays a strong role in transport exclusion with those households who live on low income and in inadequate housing being excluded from adequate transport access. The wards which have a higher percentage of income and physical capital excluded households are also likely to be lacking in transport infrastructure and relying on the use of non-motorised transport. A lack of financial capital can explain 62% of exclusion from transport capital, whilst a lack of physical capital can explain 35% of exclusion from transport capital.
Table 5.2: Correlations between the Overall Social Exclusion per Ward and the Different Capitals of Exclusion5
Exclusion Exclusive
of transport
Exclusion Inclusive of Transport Transport Financial Social Physical Human Political
Exclusion Exclusive of Transport 1.00 0.99 0.58 0.43 0.41 0.46 0.65 0.20Exclusion Inclusive of Transport .995** 1.00 0.68 0.48 0.37 0.47 0.62 0.18Transport .764** .825** 1.00 0.62 0.07 0.35 0.28 0.08Financial .654** .696** .788** 1.00 0.00 0.04 0.32 0.07Social .644** .606** 0.273 0.022 1.00 0.35 0.11 0.00Physical .677** .688** .593** 0.201 .588** 1.00 0.19 0.00Human .805** .789** .533** .568** .329* .439** 1.00 0.09Political .443** .429** 0.278 0.27 0.015 0.007 .301* 1.00
**. Correlation is significant at the 0.01 level (2-tailed). *. Correlation is significant at the 0.05 level (2-tailed).
Other than transport and human capital, physical capital plays a significant role in the overall exclusion levels in the wards, with exclusion from physical capital explaining 47% of social exclusion at a ward level. Previous studies in Ahmedabad and discussions with policy makes identified slums and chawls as concentrations of exclusion; however a study undertaken by Baud (Baud et al., 2008) in Delhi confirmed that slums and chawls may not necessarily be centres of deprivation. Given the focus of this research on slum and
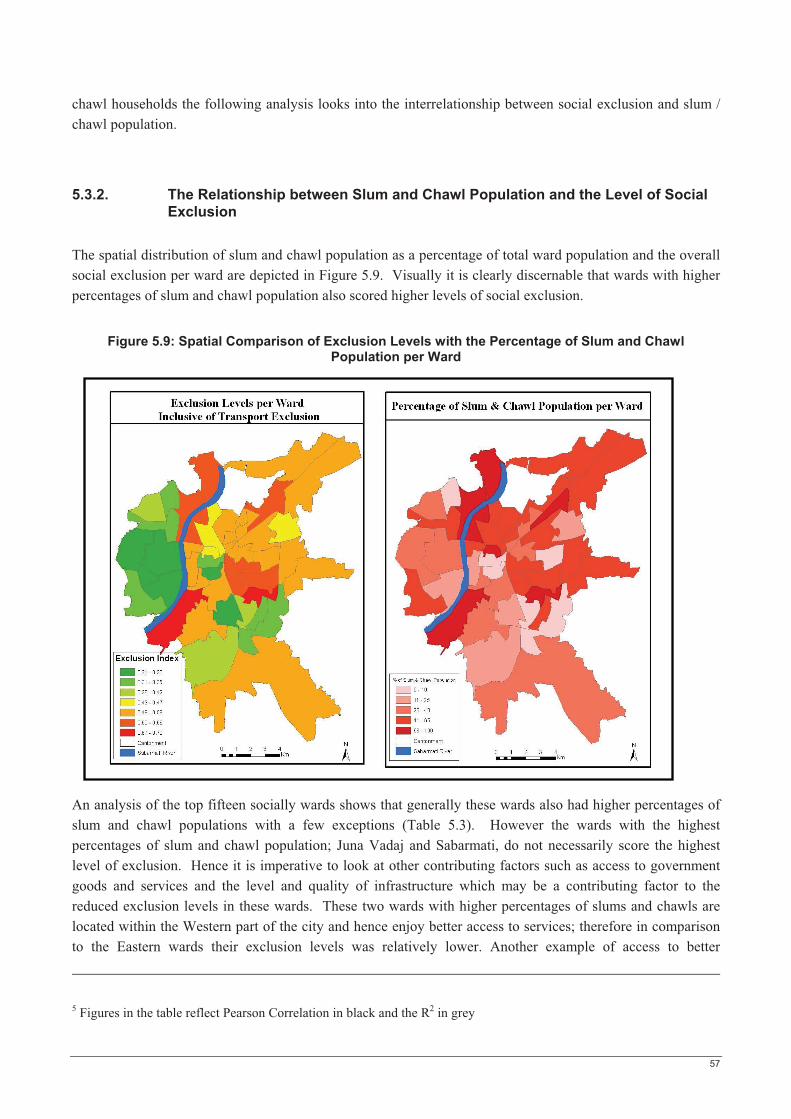
57
chawl households the following analysis looks into the interrelationship between social exclusion and slum / chawl population.
5.3.2. The Relationship between Slum and Chawl Population and the Level of Social Exclusion
The spatial distribution of slum and chawl population as a percentage of total ward population and the overall social exclusion per ward are depicted in Figure 5.9. Visually it is clearly discernable that wards with higher percentages of slum and chawl population also scored higher levels of social exclusion.
Figure 5.9: Spatial Comparison of Exclusion Levels with the Percentage of Slum and Chawl Population per Ward
An analysis of the top fifteen socially wards shows that generally these wards also had higher percentages of slum and chawl populations with a few exceptions (Table 5.3). However the wards with the highest percentages of slum and chawl population; Juna Vadaj and Sabarmati, do not necessarily score the highest level of exclusion. Hence it is imperative to look at other contributing factors such as access to government goods and services and the level and quality of infrastructure which may be a contributing factor to the reduced exclusion levels in these wards. These two wards with higher percentages of slums and chawls are located within the Western part of the city and hence enjoy better access to services; therefore in comparison to the Eastern wards their exclusion levels was relatively lower. Another example of access to better
5 Figures in the table reflect Pearson Correlation in black and the R2 in grey
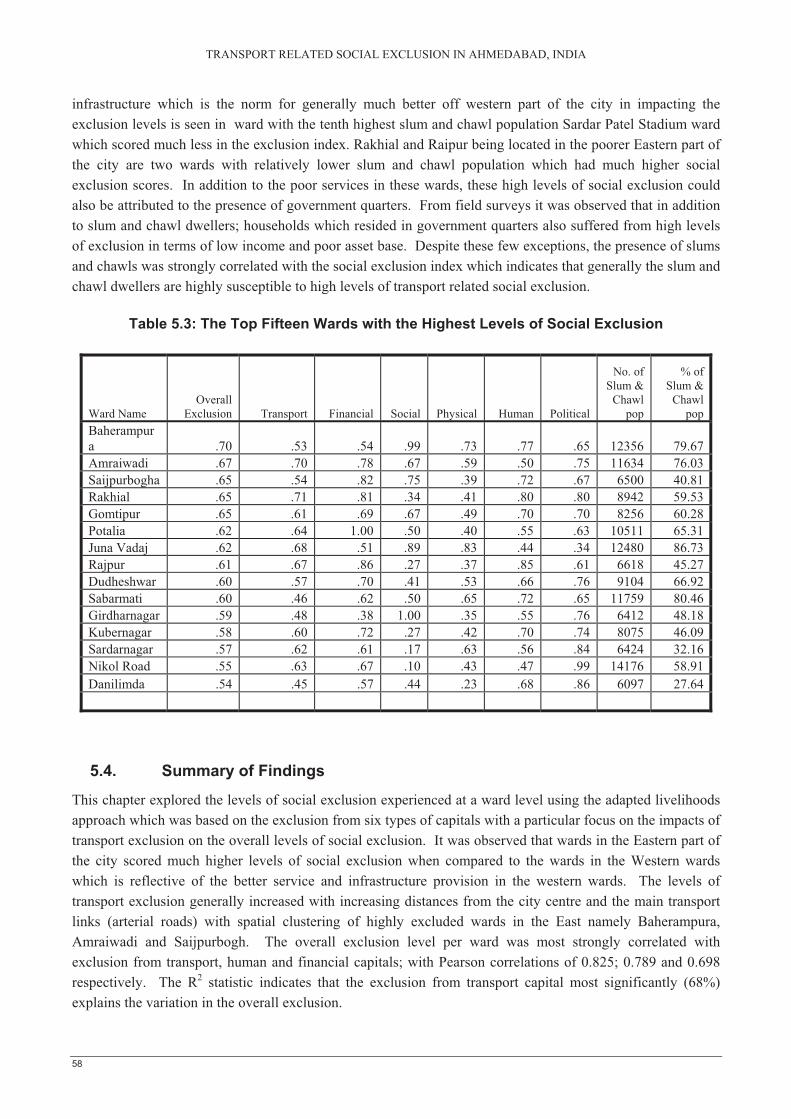
TRANSPORT RELATED SOCIAL EXCLUSION IN AHMEDABAD, INDIA
58
infrastructure which is the norm for generally much better off western part of the city in impacting the exclusion levels is seen in ward with the tenth highest slum and chawl population Sardar Patel Stadium ward which scored much less in the exclusion index. Rakhial and Raipur being located in the poorer Eastern part of the city are two wards with relatively lower slum and chawl population which had much higher social exclusion scores. In addition to the poor services in these wards, these high levels of social exclusion could also be attributed to the presence of government quarters. From field surveys it was observed that in addition to slum and chawl dwellers; households which resided in government quarters also suffered from high levels of exclusion in terms of low income and poor asset base. Despite these few exceptions, the presence of slums and chawls was strongly correlated with the social exclusion index which indicates that generally the slum and chawl dwellers are highly susceptible to high levels of transport related social exclusion.
Table 5.3: The Top Fifteen Wards with the Highest Levels of Social Exclusion
5.4. Summary of Findings
This chapter explored the levels of social exclusion experienced at a ward level using the adapted livelihoods approach which was based on the exclusion from six types of capitals with a particular focus on the impacts of transport exclusion on the overall levels of social exclusion. It was observed that wards in the Eastern part of the city scored much higher levels of social exclusion when compared to the wards in the Western wards which is reflective of the better service and infrastructure provision in the western wards. The levels of transport exclusion generally increased with increasing distances from the city centre and the main transport links (arterial roads) with spatial clustering of highly excluded wards in the East namely Baherampura, Amraiwadi and Saijpurbogh. The overall exclusion level per ward was most strongly correlated with exclusion from transport, human and financial capitals; with Pearson correlations of 0.825; 0.789 and 0.698 respectively. The R2 statistic indicates that the exclusion from transport capital most significantly (68%) explains the variation in the overall exclusion.
Ward Name Overall
Exclusion Transport Financial Social Physical Human Political
No. of Slum &
Chawl pop
% of Slum &
Chawl pop
Baherampura .70 .53 .54 .99 .73 .77 .65 12356 79.67Amraiwadi .67 .70 .78 .67 .59 .50 .75 11634 76.03Saijpurbogha .65 .54 .82 .75 .39 .72 .67 6500 40.81Rakhial .65 .71 .81 .34 .41 .80 .80 8942 59.53Gomtipur .65 .61 .69 .67 .49 .70 .70 8256 60.28Potalia .62 .64 1.00 .50 .40 .55 .63 10511 65.31Juna Vadaj .62 .68 .51 .89 .83 .44 .34 12480 86.73Rajpur .61 .67 .86 .27 .37 .85 .61 6618 45.27Dudheshwar .60 .57 .70 .41 .53 .66 .76 9104 66.92Sabarmati .60 .46 .62 .50 .65 .72 .65 11759 80.46Girdharnagar .59 .48 .38 1.00 .35 .55 .76 6412 48.18Kubernagar .58 .60 .72 .27 .42 .70 .74 8075 46.09Sardarnagar .57 .62 .61 .17 .63 .56 .84 6424 32.16Nikol Road .55 .63 .67 .10 .43 .47 .99 14176 58.91Danilimda .54 .45 .57 .44 .23 .68 .86 6097 27.64
59
Transport capital exclusion is most strongly correlated with financial and physical capitals with Pearson correlation of 0.788 and 0.593 respectively. A lack of financial capital can explain 62% of exclusion from transport capital, whilst a lack of physical capital can explain 35% of exclusion from transport capital. Income hence affordability plays a strong role in transport exclusion with those households who live on low income and in inadequate housing being excluded from adequate transport access. The wards which have a higher percentage of income and physical capital excluded households are also likely to be lacking in transport infrastructure with households relying predominantly on the use of non-motorised transport. Given the strong correlation between transport capital and overall exclusion levels, it can be safely said that policy interventions aimed at providing better transport access could have much significant positive impacts in the reduction of the high exclusion levels experienced in Ahmedabad. Wards with high percentages of slum and chawl population generally scored high levels of exclusion with exception in the Western wards which can be attributed to the better infrastructure and service provision in these wards. Therefore transport policies targeting specific wards (transport and socially excluded wards) and specific groups of people (slum and chawl dwellers in particular amongst other socially excluded groups such as those residing in government quarters) could help alleviate social exclusion in the affected locations.
5.5. Limitations in Area (Ward) Based Analysis of Transport Related Social Exclusion
The most obvious limitation of analysing exclusion at broad ward level relates to the concept of ecological fallacy. Not every household in wards with high levels of exclusion would indeed be socially excluded and vice versa even though a ward ranks very low in social exclusion levels, segments of its population could be more excluded when compared to other worse off wards. However some recent researches have established that depending on the mechanism used for the area based targeting; some area based approaches actually do work effectively as a means to alleviate deprivation of the target group (Tunstall and Lupton, 2003). Hence if utilised correctly, the area based approach to alleviating social exclusion may work within the Ahmedabad context as well given adequately chosen indicators at the appropriate scale of analysis.
One of the significant limitations of area based approaches without incorporating peoples perception is that people may actually be experiencing limitations based on elements which are not considered and the indicators used may be of no significance to the affected population. Therefore it is essential that in addition to ward level analysis, the affected populations’ views are sought on what elements hinder their effective participation in society. The objective analysis of perceptions of exclusion is envisaged to provide a better understanding of effective indicators of exclusion and assist in formulation of appropriate policies to tackle exclusion. The following chapter provides an analysis of people’s perception of transport related social exclusion and identifies the manifestations which are most applicable in conceptualising transport related social exclusion in Ahmedabad.

TRANSPORT RELATED SOCIAL EXCLUSION IN AHMEDABAD, INDIA
60
6. Manifestations of Transport Related Social Exclusion in the Selected Wards of Ahmedabad
Planning studies often emphasise more the supply side of services and facilities rather than the demand side (Chapin, 1974). However unmet travel demands lead to accessibility deficits which limits individuals ability to participate in activities which they deem desirable to do so. An understanding of peoples’ perception in relation to the factors that impinge on their adequate access to transport is integral in conceptualising transport related social exclusion at a local level. This chapter looks into the households’ perception as a whole of factors that affect their access to the transport system and the implications of this on their ability to participate in essential activities identified through the various manifestations of exclusion.
6.1. Socio-Economic Charateristics of the Surveyed Households
An understanding of the socio-economic characteristics of an individual or household is integral in conceptualising their exclusion from transport services. This section provides an overview of the characteristics of the households surveyed in each ward with a description of their ownership and use of the different transport modes.
6.1.1. Stratification of the Surveyed Households
Social exclusion cannot be classified based on any one single criteria be it the housing typology or the income of households; even though each of these factors do play a significant contributing role in the level of exclusion experienced by a household. Therefore it was deemed imperative that further analysis of the manifestations of transport related social exclusion be based upon stratification of households. The stratification of households was carried out to determine if there were varying degrees of exclusion within the wards and if the households could be grouped together based on their socio-economic status for further analysis of the effects of transport on their respective levels exclusion or non-exclusion. Two-step cluster analysis was undertaken using SPSS, which can handle both categorical and continuous variables to automatically provide an optimum number of classes (figure 6.1). The cluster analysis was based upon a number of variables inclusive of the ownership of assets and transport modes; household size; education level of the heads of households; income; housing type and mode used for travel. As a result of the cluster analysis, two distinct clusters of households were identified. The first cluster (identified as cluster 1 hereafter) can be broadly defined as comprising of those households which are socially excluded in terms of income, ownership of assets and housing characteristics and are therefore highly susceptible to transport related social exclusion. The second cluster (identified as cluster 2) comprises of households which are well-off based on their better housing conditions, higher income and assets ownership and hence cannot be classified as socially excluded. These households by virtue of their socio-economic status are less susceptible to transport related social exclusion and have better access to both private and public transport which enables better participation in the society.

61
Household Survey
Household Composition
Income
Two Step Cluster Analysis
Significance and implications of manifestations
of transport related exclusion
Education Levels
Vehicle Ownership
Assets Ownership
Housing Typology
Socially Excluded (Cluster One)
Well – Off (Cluster
Differential Access to and use of transport
Figure 6.1: Stratification of Households and Process for Perception Analysis
The socially excluded cluster comprised of the low income group who resided mostly in slums, chawls and government quarters and predominantly owned bicycles as their only mode of transport. The mean household size and the number of dependent population (adults which are normally retired parents and children) of this strata was much larger than the economically well off which signified that the heads of these households had to provide for a larger number of dependents with their meagre incomes. The economically well off strata comprised of households with middle and high income who owned private modes of transport such as motor cycles, scooters and cars. This group in addition to the dwellers of apartments, detached houses and bungalows included the lower spectrum of the middle income earners who resided in slums and chawls and had access to their own transport. Table 6.1 highlights the number of and percentage of households in each cluster per ward. Given that the total percent of slum and chawl dwellers was much lower in the western wards, the sample size for excluded cluster is much lower in these wards when compared to the wards in the Eastern part of the city.
Table 6.1: Households in the Two Clusters per Ward
Vasna Sardar Patel Kubernagar Jamalpur Khokhara Vatva
Cluster6 1 2 1 2 1 2 1 2 1 2 1 2 Number of cases 18 32 16 34 25 25 27 23 24 26 24 26% of Total sample per ward 36 64 32 68 50 50 54 46 48 52 48 52
6 Cluster 1 = Socially excluded cluster; Cluster 2 = Well-off Cluster
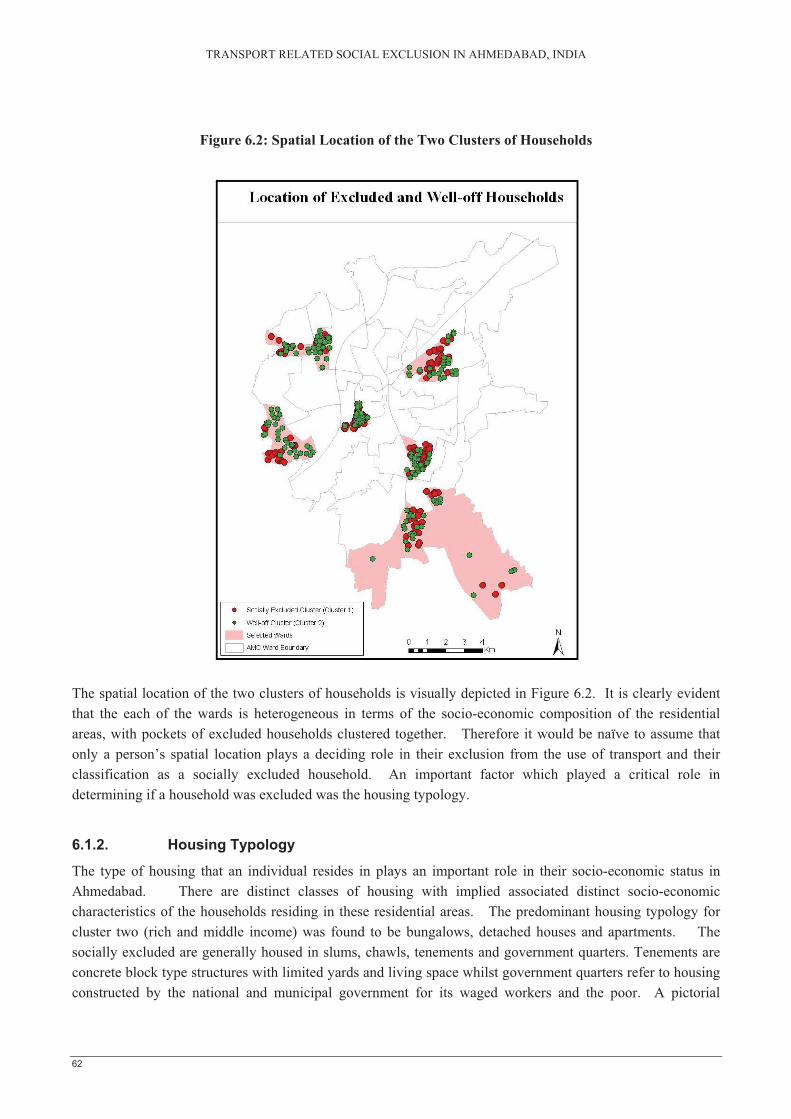
TRANSPORT RELATED SOCIAL EXCLUSION IN AHMEDABAD, INDIA
62
Figure 6.2: Spatial Location of the Two Clusters of Households
The spatial location of the two clusters of households is visually depicted in Figure 6.2. It is clearly evident that the each of the wards is heterogeneous in terms of the socio-economic composition of the residential areas, with pockets of excluded households clustered together. Therefore it would be naïve to assume that only a person’s spatial location plays a deciding role in their exclusion from the use of transport and their classification as a socially excluded household. An important factor which played a critical role in determining if a household was excluded was the housing typology.
6.1.2. Housing Typology
The type of housing that an individual resides in plays an important role in their socio-economic status in Ahmedabad. There are distinct classes of housing with implied associated distinct socio-economic characteristics of the households residing in these residential areas. The predominant housing typology for cluster two (rich and middle income) was found to be bungalows, detached houses and apartments. The socially excluded are generally housed in slums, chawls, tenements and government quarters. Tenements are concrete block type structures with limited yards and living space whilst government quarters refer to housing constructed by the national and municipal government for its waged workers and the poor. A pictorial
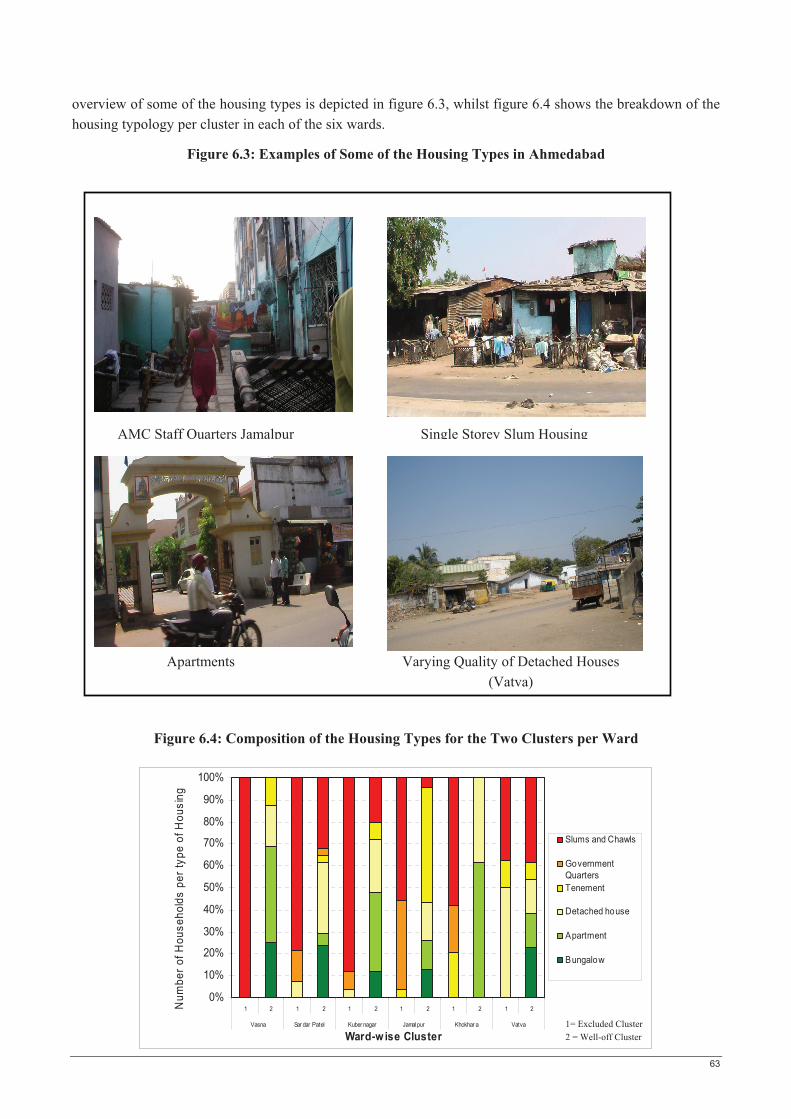
63
AMC Staff Quarters Jamalpur Single Storey Slum Housing
Apartments Varying Quality of Detached Houses (Vatva)
0%
10%
20%
30%
40%
50%
60%
70%
80%
90%
100%
1 2 1 2 1 2 1 2 1 2 1 2
Vasna Sar dar Patel Kuber nagar Jamalpur Khokhar a Vatva
Ward-w ise Cluster
Num
ber o
f Hou
seho
lds
per t
ype
of H
ousi
ng
Slums and Chawls
GovernmentQuartersTenement
Detached house
Apartment
Bungalow
1= Excluded Cluster 2 = Well-off Cluster
overview of some of the housing types is depicted in figure 6.3, whilst figure 6.4 shows the breakdown of the housing typology per cluster in each of the six wards.
Figure 6.3: Examples of Some of the Housing Types in Ahmedabad
Figure 6.4: Composition of the Housing Types for the Two Clusters per Ward
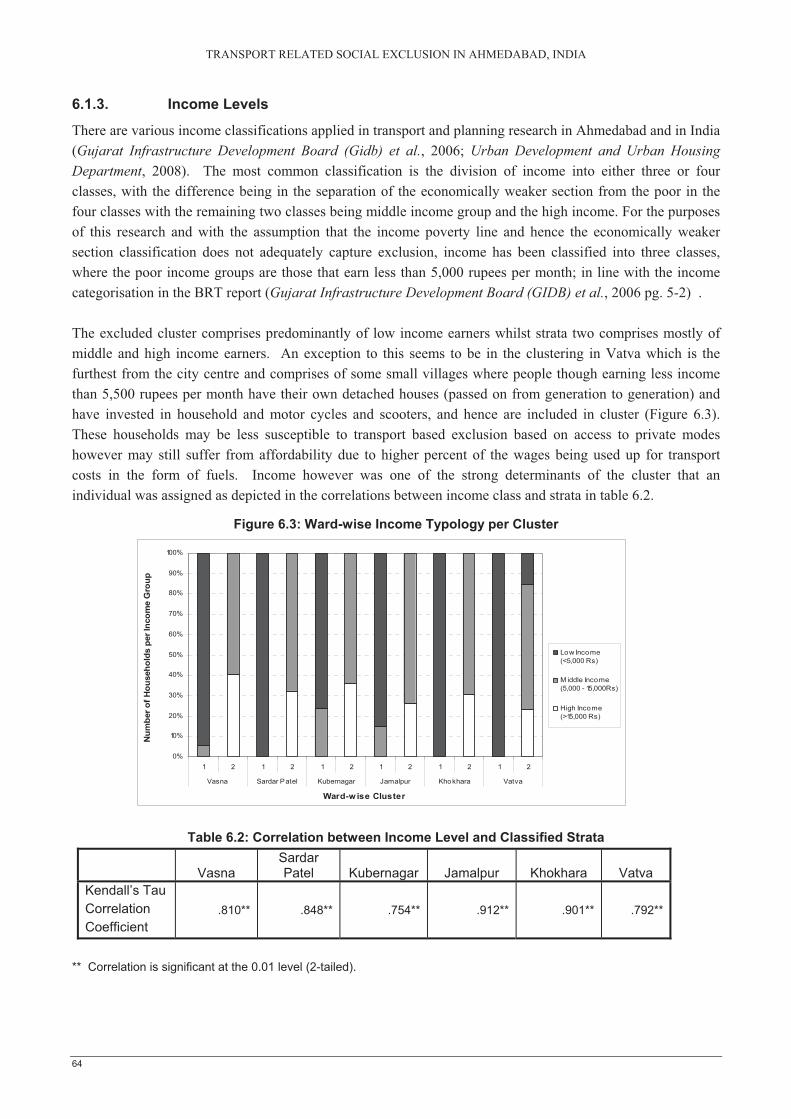
TRANSPORT RELATED SOCIAL EXCLUSION IN AHMEDABAD, INDIA
64
0%
10%
20%
30%
40%
50%
60%
70%
80%
90%
100%
1 2 1 2 1 2 1 2 1 2 1 2
Vasna Sardar Patel Kubernagar Jamalpur Khokhara Vatva
Ward-w ise Cluster
Num
ber o
f Hou
seho
lds
per I
ncom
e G
roup
Low Income(<5,000 Rs)
M iddle Income(5,000 - 15,000Rs)
High Income(>15,000 Rs)
6.1.3. Income Levels
There are various income classifications applied in transport and planning research in Ahmedabad and in India (Gujarat Infrastructure Development Board (Gidb) et al., 2006; Urban Development and Urban Housing Department, 2008). The most common classification is the division of income into either three or four classes, with the difference being in the separation of the economically weaker section from the poor in the four classes with the remaining two classes being middle income group and the high income. For the purposes of this research and with the assumption that the income poverty line and hence the economically weaker section classification does not adequately capture exclusion, income has been classified into three classes, where the poor income groups are those that earn less than 5,000 rupees per month; in line with the income categorisation in the BRT report (Gujarat Infrastructure Development Board (GIDB) et al., 2006 pg. 5-2) .
The excluded cluster comprises predominantly of low income earners whilst strata two comprises mostly of middle and high income earners. An exception to this seems to be in the clustering in Vatva which is the furthest from the city centre and comprises of some small villages where people though earning less income than 5,500 rupees per month have their own detached houses (passed on from generation to generation) and have invested in household and motor cycles and scooters, and hence are included in cluster (Figure 6.3). These households may be less susceptible to transport based exclusion based on access to private modes however may still suffer from affordability due to higher percent of the wages being used up for transport costs in the form of fuels. Income however was one of the strong determinants of the cluster that an individual was assigned as depicted in the correlations between income class and strata in table 6.2.
Figure 6.3: Ward-wise Income Typology per Cluster
Table 6.2: Correlation between Income Level and Classified Strata
Vasna Sardar Patel Kubernagar Jamalpur Khokhara Vatva
Kendall’s Tau Correlation Coefficient
.810** .848** .754** .912** .901** .792**
** Correlation is significant at the 0.01 level (2-tailed).

65
0%
10%
20%
30%
40%
50%
60%
70%
80%
90%
100%
1 2 1 2 1 2 1 2 1 2 1 2
Vasna SardarPatel
Kubernagar Jamalpur Khokhara Vatva
Ward-wise Cluster
Hea
d of
Hou
seho
ld b
y O
ccup
atio
n
Hourly w age earners
Retired
Auto Drivers
Salaried Workers
Business Persons
1= Excluded Cluster 2 = Well-off Cluster
0%10%20%30%40%50%60%70%80%90%
100%
1 2 1 2 1 2 1 2 1 2 1 2
Vasna Sardar Patel Kubernagar Jamalpur Khokhara Vatva
Ward-wise Cluster
Educ
atio
n Le
vel o
f Hea
d of
Hou
seho
ld
No Education
Primary
Secondary
Post secondary training
Tertiary
1= Excluded Cluster 2 = Well-off Cluster
6.1.4. Education Levels
The level of education is a key indicator of the human capital of a household and impacts to a large extent on their ability to participate fully in society by providing better and diverse lifestyle choices (employment opportunities etc). Levels of education of the heads of households in the excluded cluster comprised mainly of primary and no education whilst the heads of households of well-off strata had education beyond primary schooling; which predominantly comprised of tertiary and post secondary training (Figure 6.4)
Figure 6.4: Ward-wise Head of Households Education Typology per Cluster
6.1.5. Employment Types
Employment and the source of income for a household can be a catalyst for the type of transport mode that the household owns and use. Casual hourly paid work formed the core form of employment for the cluster one. Sardar Patel Stadium had the highest percent of its excluded cluster (93.75%) being casually employed whilst at an overall ward level, Khokhara had the highest number (50%) of hourly paid wage earners (Figure 6.5). The business households in cluster 1 are operators of casual shops such as tea shops at bus stations and convenience stores located in their respective slums and bus stations, and though they classified themselves as business people; due to the type of business ventures, their monthly earnings was substantially low.
Figure 6.5: Ward-wise Head of Households Employment Typology per Cluster
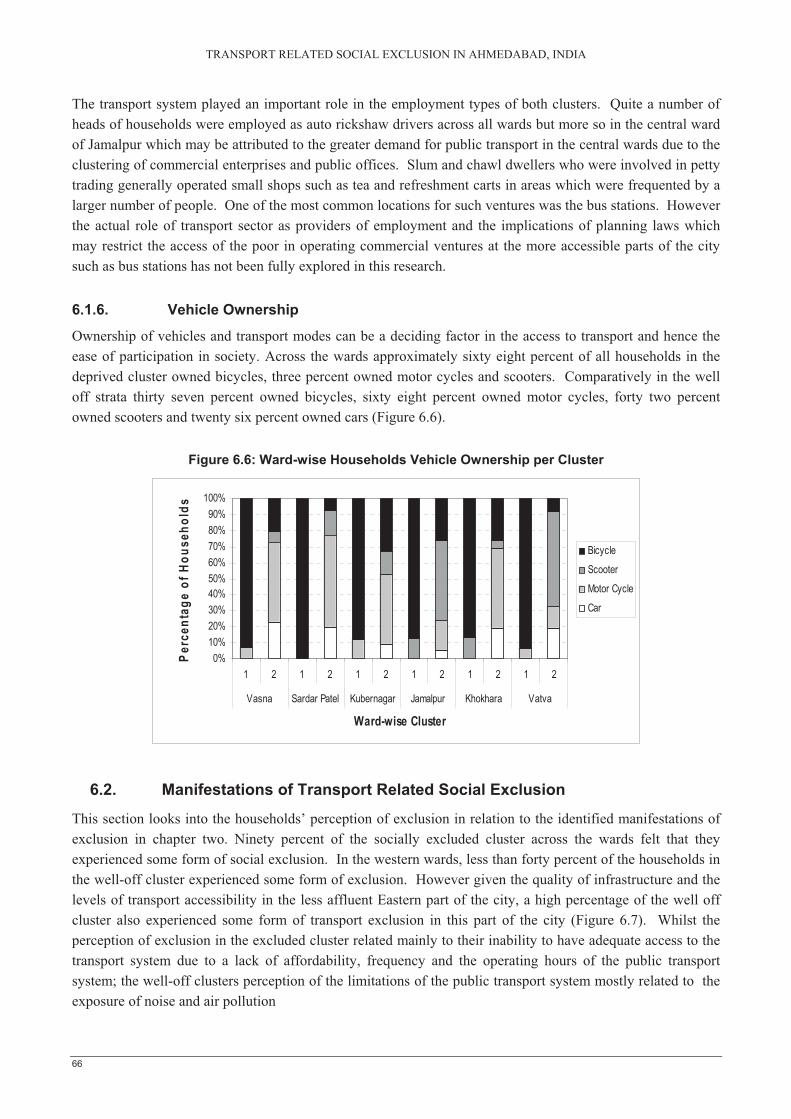
TRANSPORT RELATED SOCIAL EXCLUSION IN AHMEDABAD, INDIA
66
0%10%20%30%40%50%60%70%80%90%
100%
1 2 1 2 1 2 1 2 1 2 1 2
Vasna Sardar Patel Kubernagar Jamalpur Khokhara Vatva
Ward-wise Cluster
Per
cent
age
of H
ouse
hold
s
Bicycle
Scooter
Motor Cycle
Car
The transport system played an important role in the employment types of both clusters. Quite a number of heads of households were employed as auto rickshaw drivers across all wards but more so in the central ward of Jamalpur which may be attributed to the greater demand for public transport in the central wards due to the clustering of commercial enterprises and public offices. Slum and chawl dwellers who were involved in petty trading generally operated small shops such as tea and refreshment carts in areas which were frequented by a larger number of people. One of the most common locations for such ventures was the bus stations. However the actual role of transport sector as providers of employment and the implications of planning laws which may restrict the access of the poor in operating commercial ventures at the more accessible parts of the city such as bus stations has not been fully explored in this research.
6.1.6. Vehicle Ownership
Ownership of vehicles and transport modes can be a deciding factor in the access to transport and hence the ease of participation in society. Across the wards approximately sixty eight percent of all households in the deprived cluster owned bicycles, three percent owned motor cycles and scooters. Comparatively in the well off strata thirty seven percent owned bicycles, sixty eight percent owned motor cycles, forty two percent owned scooters and twenty six percent owned cars (Figure 6.6).
Figure 6.6: Ward-wise Households Vehicle Ownership per Cluster
6.2. Manifestations of Transport Related Social Exclusion
This section looks into the households’ perception of exclusion in relation to the identified manifestations of exclusion in chapter two. Ninety percent of the socially excluded cluster across the wards felt that they experienced some form of social exclusion. In the western wards, less than forty percent of the households in the well-off cluster experienced some form of exclusion. However given the quality of infrastructure and the levels of transport accessibility in the less affluent Eastern part of the city, a high percentage of the well off cluster also experienced some form of transport exclusion in this part of the city (Figure 6.7). Whilst the perception of exclusion in the excluded cluster related mainly to their inability to have adequate access to the transport system due to a lack of affordability, frequency and the operating hours of the public transport system; the well-off clusters perception of the limitations of the public transport system mostly related to the exposure of noise and air pollution

67
0
20
40
60
80
100
120
Vasna
Sardar Patel
Kubernagar
Jamalpur
KhokharaVatva
Wards
Percentage of households experiencing
transport exclusion
Excluded ClusterWell-off Cluster
0%
10%
20%
30%
40%
50%
60%
70%
80%
90%
100%
1 2 1 2 1 2 1 2 1 2 1 2
Vasna Sardar Patel Kubernagar Jamalpur Khokhara Vatva
Ward-wise Cluster
Num
ber o
f Veh
icle
s O
wne
d
0123
Figure 6.7: Households Perception of Exclusion from Use of Transport
6.2.1. Affordability Based Exclusion
Transport affordability relates to the financial ability to own and use private modes of transport as well as being in a position to afford public transport. Affordability of transport is looked into by analysing the modes of transport owned by the households, their use of transport modes and the reasons for their mode choices.
6.2.1.1 Affordability of Private Transport
The economic status of a household has a strong bearing on the ownership and to a large extent the use of vehicles. Majority of the households in the socially excluded cluster did not own any form of motorised transport which would naturally impact their ability to participate in activities (Figure 6.8). In the central wards of Jamalpur all of the excluded households did not own any form of motorised transport, however given the need of longer distance travel in the outskirts of the city, some households in the excluded clusters in ward such as Vasna and Vatva had invested in motor cycles as a mode of transport.
Figure 6.8: Household Ownership of Motorised Vehicles per Cluster
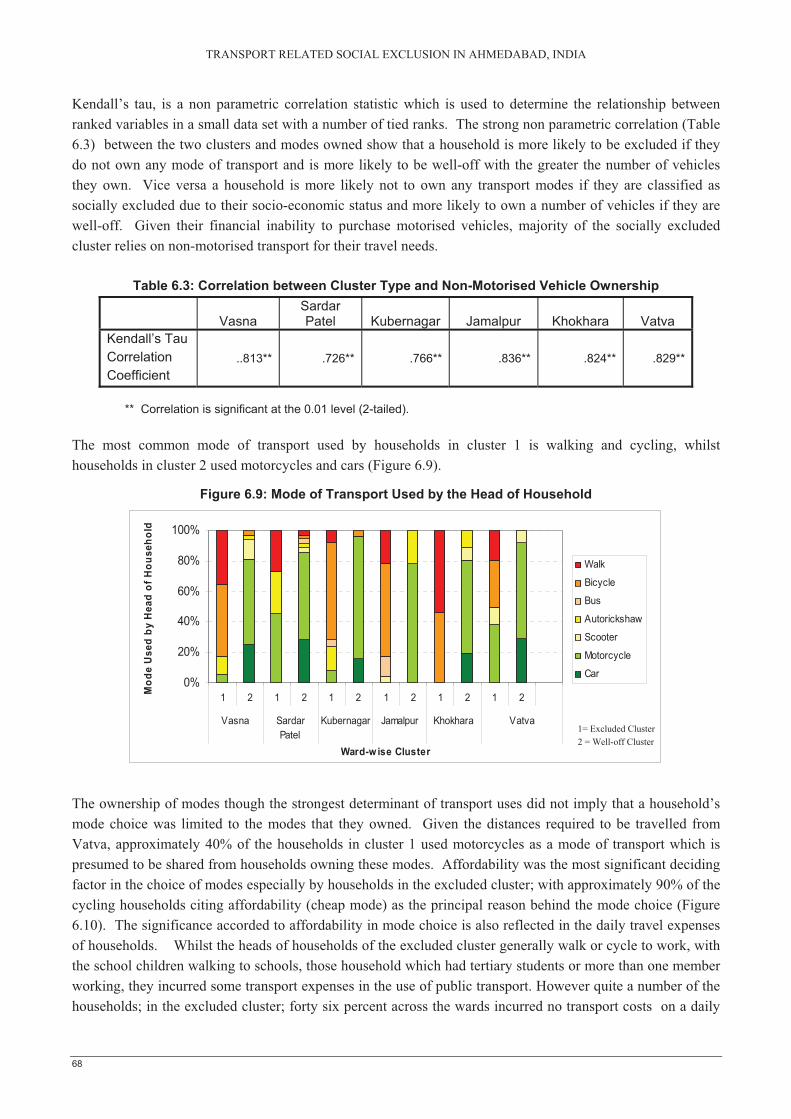
TRANSPORT RELATED SOCIAL EXCLUSION IN AHMEDABAD, INDIA
68
0%
20%
40%
60%
80%
100%
1 2 1 2 1 2 1 2 1 2 1 2
Vasna SardarPatel
Kubernagar Jamalpur Khokhara Vatva
Ward-w ise Cluster
Mod
e U
sed
by H
ead
of H
ouse
hold
Walk
Bicycle
Bus
Autorickshaw
Scooter
Motorcycle
Car
1= Excluded Cluster 2 = Well-off Cluster
Kendall’s tau, is a non parametric correlation statistic which is used to determine the relationship between ranked variables in a small data set with a number of tied ranks. The strong non parametric correlation (Table 6.3) between the two clusters and modes owned show that a household is more likely to be excluded if they do not own any mode of transport and is more likely to be well-off with the greater the number of vehicles they own. Vice versa a household is more likely not to own any transport modes if they are classified as socially excluded due to their socio-economic status and more likely to own a number of vehicles if they are well-off. Given their financial inability to purchase motorised vehicles, majority of the socially excluded cluster relies on non-motorised transport for their travel needs.
Table 6.3: Correlation between Cluster Type and Non-Motorised Vehicle Ownership
Vasna Sardar Patel Kubernagar Jamalpur Khokhara Vatva
Kendall’s Tau Correlation Coefficient
..813** .726** .766** .836** .824** .829**
** Correlation is significant at the 0.01 level (2-tailed).
The most common mode of transport used by households in cluster 1 is walking and cycling, whilst households in cluster 2 used motorcycles and cars (Figure 6.9).
Figure 6.9: Mode of Transport Used by the Head of Household
The ownership of modes though the strongest determinant of transport uses did not imply that a household’s mode choice was limited to the modes that they owned. Given the distances required to be travelled from Vatva, approximately 40% of the households in cluster 1 used motorcycles as a mode of transport which is presumed to be shared from households owning these modes. Affordability was the most significant deciding factor in the choice of modes especially by households in the excluded cluster; with approximately 90% of the cycling households citing affordability (cheap mode) as the principal reason behind the mode choice (Figure 6.10). The significance accorded to affordability in mode choice is also reflected in the daily travel expenses of households. Whilst the heads of households of the excluded cluster generally walk or cycle to work, with the school children walking to schools, those household which had tertiary students or more than one member working, they incurred some transport expenses in the use of public transport. However quite a number of the households; in the excluded cluster; forty six percent across the wards incurred no transport costs on a daily
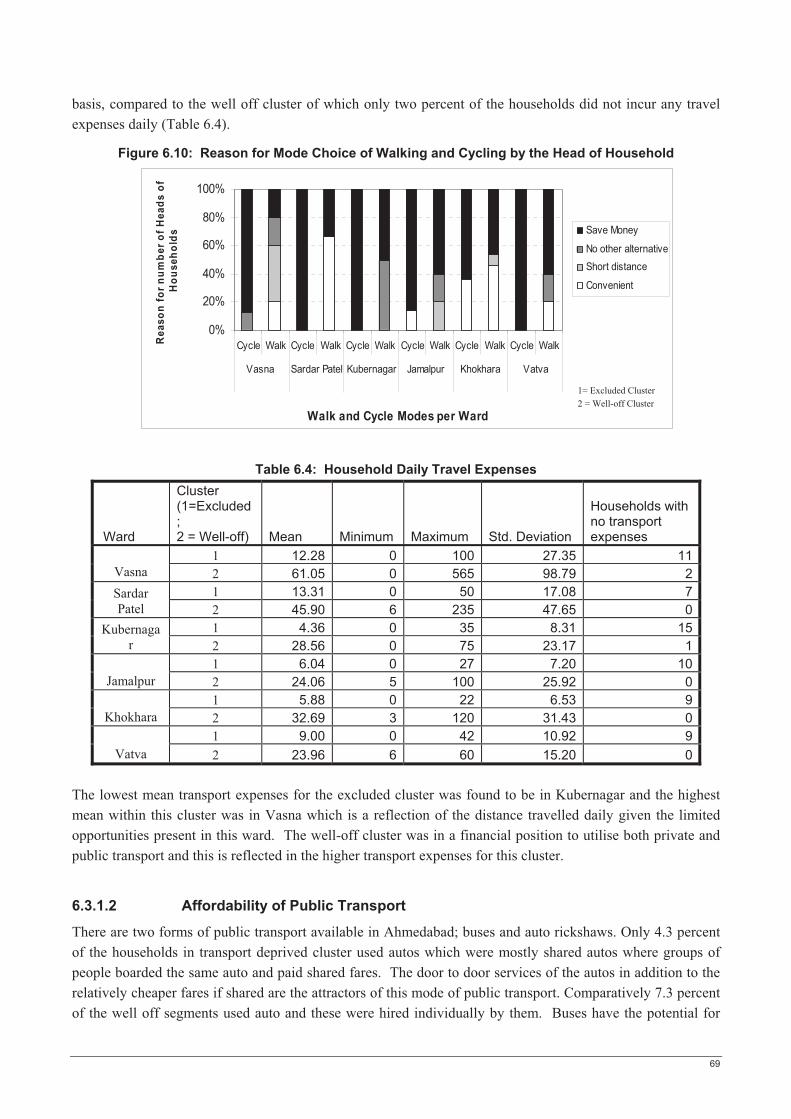
69
0%
20%
40%
60%
80%
100%
Cycle Walk Cycle Walk Cycle Walk Cycle Walk Cycle Walk Cycle Walk
Vasna Sardar Patel Kubernagar Jamalpur Khokhara Vatva
Walk and Cycle Modes per Ward
Rea
son
for n
umbe
r of H
eads
of
Hou
seho
lds Save Money
No other alternativeShort distance
Convenient
1= Excluded Cluster 2 = Well-off Cluster
basis, compared to the well off cluster of which only two percent of the households did not incur any travel expenses daily (Table 6.4).
Figure 6.10: Reason for Mode Choice of Walking and Cycling by the Head of Household
Table 6.4: Household Daily Travel Expenses
Ward
Cluster (1=Excluded; 2 = Well-off) Mean Minimum Maximum Std. Deviation
Households with no transport expenses
1 12.28 0 100 27.35 11Vasna 2 61.05 0 565 98.79 2
1 13.31 0 50 17.08 7Sardar Patel 2 45.90 6 235 47.65 0
1 4.36 0 35 8.31 15Kubernagar 2 28.56 0 75 23.17 1
1 6.04 0 27 7.20 10Jamalpur 2 24.06 5 100 25.92 0
1 5.88 0 22 6.53 9Khokhara 2 32.69 3 120 31.43 0
1 9.00 0 42 10.92 9Vatva 2 23.96 6 60 15.20 0
The lowest mean transport expenses for the excluded cluster was found to be in Kubernagar and the highest mean within this cluster was in Vasna which is a reflection of the distance travelled daily given the limited opportunities present in this ward. The well-off cluster was in a financial position to utilise both private and public transport and this is reflected in the higher transport expenses for this cluster.
6.3.1.2 Affordability of Public Transport
There are two forms of public transport available in Ahmedabad; buses and auto rickshaws. Only 4.3 percent of the households in transport deprived cluster used autos which were mostly shared autos where groups of people boarded the same auto and paid shared fares. The door to door services of the autos in addition to the relatively cheaper fares if shared are the attractors of this mode of public transport. Comparatively 7.3 percent of the well off segments used auto and these were hired individually by them. Buses have the potential for
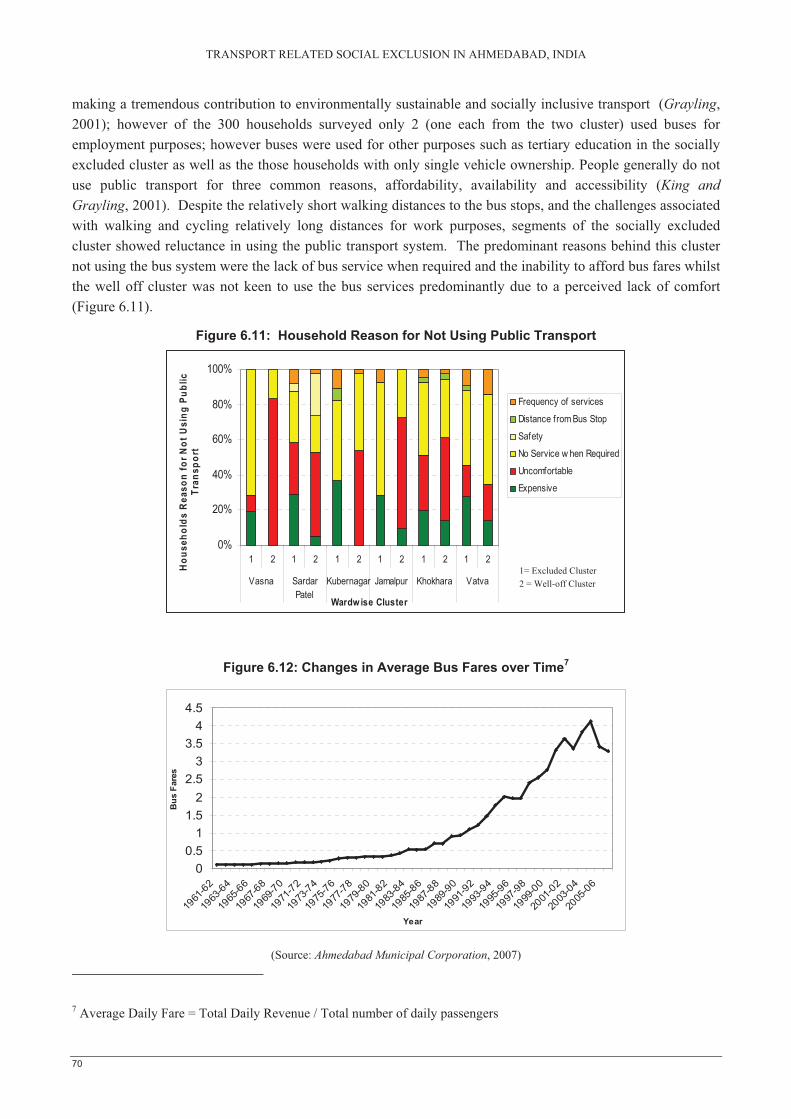
TRANSPORT RELATED SOCIAL EXCLUSION IN AHMEDABAD, INDIA
70
00.5
11.5
22.5
33.5
44.5
1961
-62
1963
-64
1965
-66
1967
-68
1969
-70
1971
-72
1973
-74
1975
-76
1977
-78
1979
-80
1981
-82
1983
-84
1985
-86
1987
-88
1989
-90
1991
-92
1993
-94
1995
-96
1997
-98
1999
-00
2001
-02
2003
-04
2005
-06
Year
Bus
Far
es
0%
20%
40%
60%
80%
100%
1 2 1 2 1 2 1 2 1 2 1 2
Vasna SardarPatel
Kubernagar Jamalpur Khokhara Vatva
Wardwise Cluster
Hou
seho
lds
Rea
son
for N
ot U
sing
Pub
lic
Tran
spor
t
Frequency of services
Distance from Bus Stop
Safety
No Service w hen Required
Uncomfortable
Expensive
1= Excluded Cluster 2 = Well-off Cluster
making a tremendous contribution to environmentally sustainable and socially inclusive transport (Grayling, 2001); however of the 300 households surveyed only 2 (one each from the two cluster) used buses for employment purposes; however buses were used for other purposes such as tertiary education in the socially excluded cluster as well as the those households with only single vehicle ownership. People generally do not use public transport for three common reasons, affordability, availability and accessibility (King and Grayling, 2001). Despite the relatively short walking distances to the bus stops, and the challenges associated with walking and cycling relatively long distances for work purposes, segments of the socially excluded cluster showed reluctance in using the public transport system. The predominant reasons behind this cluster not using the bus system were the lack of bus service when required and the inability to afford bus fares whilst the well off cluster was not keen to use the bus services predominantly due to a perceived lack of comfort (Figure 6.11).
Figure 6.11: Household Reason for Not Using Public Transport
Figure 6.12: Changes in Average Bus Fares over Time7
(Source: Ahmedabad Municipal Corporation, 2007)
7 Average Daily Fare = Total Daily Revenue / Total number of daily passengers

71
0%
20%
40%
60%
80%
100%
1 2 1 2 1 2 1 2 1 2 1 2
Vasna SardarPatel
Kubernagar Jamalpur Khokhara Vatva
Ward-wise cluster
Pece
nt o
f Hou
seol
ds p
er C
lust
er
Change fromcurrent mode tobus useNo Change inbehaviour
1= Excluded Cluster 2 = Well-off Cluster
Over the years, the bus fares have gradually increased until the year 2005-06 when the private companies started servicing some of the routes (Figure 6.12). This indicates that ceteris paribus, over time bus fares have become increasingly unaffordable for the poor.
The excluded cluster due to their financial status strongly felt that they were not in a position to afford public transport. There are two ways in which affordability to the public transport can be tackled; through general fare policy and concessions targeting specific groups of people (King and Grayling, 2001). Figure 6.13 shows the willingness of people to shift from their current mode to using bus services if the quality of these services were to be improved and the bus fares made affordable.
Figure 6.13: Willingness to Change from Current Mode to Public Transport
With the potential of improved bus services in terms of more frequent and cheaper bus fares, more than 70% of the households were unwilling to change their travel behaviour, whilst another 28% were of the view that they would change from their current modes to the use of public transport. A high percent of the transport excluded strata was unwilling to change from walking and cycling to using public transport citing amongst other reasons, the loss of time associated with changing buses numerous times and having to finally walk quite a while to reach their final destinations.
This clearly shows that people are of the view that despite any changes in fares and frequency, their transport needs may not be adequately met by the mass transit system. This implies that to ease the level of transport related exclusion currently experienced by clusters of the population, more innovative solutions need to be provided which specifically target the travel needs of these excluded segments. Alternatively people given their experiences may also have had serious doubts if indeed the fares would be reduced to the level which is affordable for them; for many households this would require substantial concessions in the use of public transport. In addition to affordability, one of the key elements which has hindered access to the transport system is time; the temporal budget of households and operating hours and frequency of public transport.
6.2.2. Temporal Exclusion
Temporal exclusion results from a combination of individual / household time budgets and the operating hours of public transport and the services which people would like to access. Given the scope of this research, the opening and operating hours of services and facilities are not looked into. Peoples’ perception of temporal

TRANSPORT RELATED SOCIAL EXCLUSION IN AHMEDABAD, INDIA
72
0%10%
20%30%
40%50%
60%70%
80%90%
100%
1 2 1 2 1 2 1 2 1 2 1 2
Vasna SardarPatel
Kubernagar Jamalpur Khokhara Vatva
Ward-wise Cluster
Perc
enta
ge H
ouse
hold
s (In
freq
uent
Tr
ansp
ort) Very
Moderate
Least
No
1= Excluded Cluster 2 = Well-off Cluster
exclusion is looked into from their difficulties in accessing public transport due to temporal elements such as frequency and operating hours of bus services and their own schedule of activities.
6.2.2.1 Infrequent Public Transport
The frequency of buses ranged from buses scheduled for operation every fifteen minutes in certain routes in the western wards to every half and/or one hour in majority of the other residential areas. The differing opinions and knowledge of the operating hours of buses and the frequency of services was reflected in very few households responding similarly to questions relating to the frequency and operating hours of buses which may be related to their use of public transport as well as the availability of information from the operators of the public transport system itself. The households in the western ward of Vasna ranked infrequent transport as the most significant factor which influences their access to the transport system (Figure 6.14). Further discussions with these households highlighted their need to walk to the main bus station as buses rarely stopped at the designated stops along the road due to overcrowded buses. A substantial percentage of households in both the excluded and well-off cluster perceived the frequency of public transport system as being a major deterrent to their access of the transport system. Members of households which are in the well–off cluster but owned only one mode of transport relied on the public transport for the travel needs of other members of the households such as university students, shopping trips etc. and also experienced limitations in the use of public transport due to the frequency of the services. However the predominant concerns related to the related to the frequency of buses during the peak travel hours of the socially excluded cluster (6.30 – 8.30), which was different from the general peak travel hours of the well off cluster (9-10am).
Figure 6.14: Percentage of Household Experiencing Limitations in Their Access to Transport Due To Infrequent Public Transport
6.2.2.2 Operating Hours of Buses
The operating hours of buses varied across the wards with operations commencing around 6.30 am – 7am and ending between the hours of 9 pm and midnight depending upon the location of the residential area. Give the early start and late operating hours, a substantial number of households across the study area (51%) did not feel that the operating hours of buses had much significance on their access to the transport system compared to the 28% of households which rated the operating hours of buses as a strong deterrent in their access to the transport system (Figure 6.15). The operating hours of buses seemed to be most strongly impacting access to
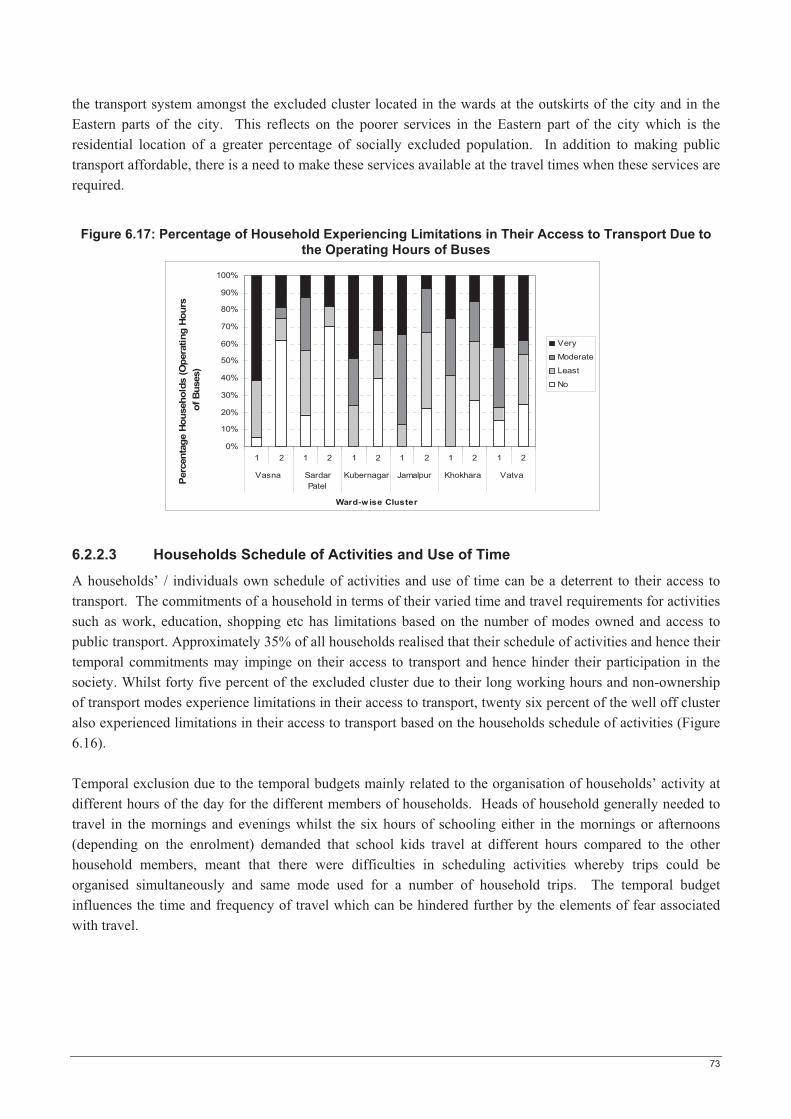
73
0%
10%
20%
30%
40%
50%
60%
70%
80%
90%
100%
1 2 1 2 1 2 1 2 1 2 1 2
Vasna SardarPatel
Kubernagar Jamalpur Khokhara Vatva
Ward-wise Cluster
Perc
enta
ge H
ouse
hold
s (O
pera
ting
Hour
s of
Bus
es)
Very
Moderate
Least
No
the transport system amongst the excluded cluster located in the wards at the outskirts of the city and in the Eastern parts of the city. This reflects on the poorer services in the Eastern part of the city which is the residential location of a greater percentage of socially excluded population. In addition to making public transport affordable, there is a need to make these services available at the travel times when these services are required.
Figure 6.17: Percentage of Household Experiencing Limitations in Their Access to Transport Due to the Operating Hours of Buses
6.2.2.3 Households Schedule of Activities and Use of Time
A households’ / individuals own schedule of activities and use of time can be a deterrent to their access to transport. The commitments of a household in terms of their varied time and travel requirements for activities such as work, education, shopping etc has limitations based on the number of modes owned and access to public transport. Approximately 35% of all households realised that their schedule of activities and hence their temporal commitments may impinge on their access to transport and hence hinder their participation in the society. Whilst forty five percent of the excluded cluster due to their long working hours and non-ownership of transport modes experience limitations in their access to transport, twenty six percent of the well off cluster also experienced limitations in their access to transport based on the households schedule of activities (Figure 6.16).
Temporal exclusion due to the temporal budgets mainly related to the organisation of households’ activity at different hours of the day for the different members of households. Heads of household generally needed to travel in the mornings and evenings whilst the six hours of schooling either in the mornings or afternoons (depending on the enrolment) demanded that school kids travel at different hours compared to the other household members, meant that there were difficulties in scheduling activities whereby trips could be organised simultaneously and same mode used for a number of household trips. The temporal budget influences the time and frequency of travel which can be hindered further by the elements of fear associated with travel.

TRANSPORT RELATED SOCIAL EXCLUSION IN AHMEDABAD, INDIA
74
0
500
1000
1500
2000
2500
3000
3500
1961
1973
1976
1979
1982
1985
1988
1991
1994
1997
2000
2003
2006
Year
Num
ber o
f Acc
iden
ts p
er Y
ear
Fatal Accidents
Total
Figure 6.16: Percentage of Household Experiencing Limitations in Their Access to Transport Due to the Their Own Schedule of Activities
6.2.3. Fear Based Exclusion
Fear of the use of transport can be a strong deterrent in the access to and the use of transport. The socially excluded are generally more susceptible to fear due to their reliance on non-motorised and public transport and their hours of travel. The two forms of fear identified in Ahmedabad relate to road accidents and the fear of safety in terms of crime and theft.
6.2.3.1 Fear of Road Accidents
One of the negative externalities associated with the rapid motorisation in India and Ahmedabad has been the prevalence of road accidents. India’s road accident record, already among the world’s worst, is deteriorating steadily, with the death toll rising from 56,400 to around 80,000 mortalities between 1991 and 2007 (Badami and Haider, 2007). Road accidents in Ahmedabad have dramatically increased over the years (Figure 6.17) with peaks and troughs during the 1990’s and 2000’s; the number of fatal accidents has shown increasing trends over the years.
Figure 6.17: Road Accidents in Ahmedabad (1961- 2007)
(Source: Police Commissioner's Office, Ahmedabad, provided by BRTS Cell CEPT)
0%
10%
20%
30%
40%
50%
60%
70%
80%
90%
100%
1 2 1 2 1 2 1 2 1 2 1 2
Vasna SardarPatel
Kubernagar Jamalpur Khokhara Vatva
Ward-wise Cluster
Per
cent
age
Hou
seho
lds
(Indi
vidu
al
Sche
dule
of A
ctiv
ities
)
Very
Moderate
Least
No
1= Excluded Cluster 2 = Well-off Cluster

75
�
0
10
20
30
40
50
60
70
Motor C
ycle/
Scoo
ter
Auto
Rick
shaw
Motor C
ar
Cycle
Pede
strian Bu
s
Truc
k
Others
Transport Mode
Num
ber
of A
ccid
ents
Number of Casualties
Pedestrians and cyclists are amongst the highest casualties on the roads of Ahmedabad (Figure 6.18) clearly highlighting the non conducive environment for the use of these two modes on the roads of Ahmedabad. Spatially the highest number of road accidents occurred in the Eastern part of the city (Figure 6.19). Road accidents carry with them high socio-economic costs which are difficult to measure however comparatively; economic costs of accidents which amounted to 1% to 2% of the GNP in low income to middle income countries, the costs of accidents for the year 1999- 2000 was estimated at 3% in India (Department of Road Transport and Highways, 2006).
Figure 6.18: Road Casualties by Transport Mode for the year 2002
(Source: Police Commissioner's Office, Ahmedabad, provided by BRTS Cell, CEPT)
Figure 6.19: Accident Rates in Ahmedabad
(Source: Gujarat Infrastructure Development Board (GIDB) et al., 2006)
In addition to the economic costs of accidents, the psychological effects relate to the inbuilt fear amongst the road users in utilizing transport systems which reduces their ability to participate in normal activities. Given that the highest number of accidents by the mode type and location which predominantly occurs in the Eastern part of the city majority of the excluded cluster within the Eastern wards and in particular the households in
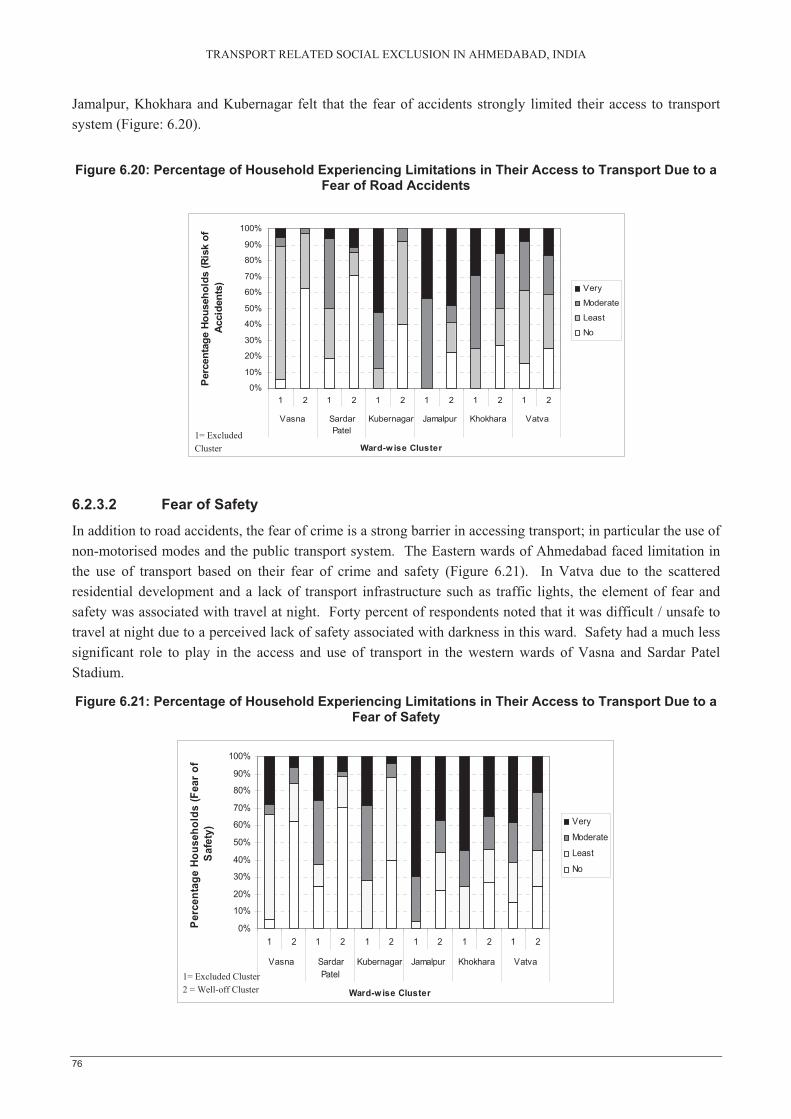
TRANSPORT RELATED SOCIAL EXCLUSION IN AHMEDABAD, INDIA
76
Jamalpur, Khokhara and Kubernagar felt that the fear of accidents strongly limited their access to transport system (Figure: 6.20).
Figure 6.20: Percentage of Household Experiencing Limitations in Their Access to Transport Due to a Fear of Road Accidents
6.2.3.2 Fear of Safety
In addition to road accidents, the fear of crime is a strong barrier in accessing transport; in particular the use of non-motorised modes and the public transport system. The Eastern wards of Ahmedabad faced limitation in the use of transport based on their fear of crime and safety (Figure 6.21). In Vatva due to the scattered residential development and a lack of transport infrastructure such as traffic lights, the element of fear and safety was associated with travel at night. Forty percent of respondents noted that it was difficult / unsafe to travel at night due to a perceived lack of safety associated with darkness in this ward. Safety had a much less significant role to play in the access and use of transport in the western wards of Vasna and Sardar Patel Stadium.
Figure 6.21: Percentage of Household Experiencing Limitations in Their Access to Transport Due to a Fear of Safety
0%
10%
20%
30%
40%
50%
60%
70%
80%
90%
100%
1 2 1 2 1 2 1 2 1 2 1 2
Vasna SardarPatel
Kubernagar Jamalpur Khokhara Vatva
Ward-wise Cluster
Per
cent
age
Hous
ehol
ds (R
isk
of
Acc
iden
ts) Very
Moderate
Least
No
1= Excluded Cluster
0%
10%
20%
30%
40%
50%
60%
70%
80%
90%
100%
1 2 1 2 1 2 1 2 1 2 1 2
Vasna SardarPatel
Kubernagar Jamalpur Khokhara Vatva
Ward-wise Cluster
Perc
enta
ge H
ouse
hold
s (F
ear o
f S
afet
y)
Very
Moderate
Least
No
1= Excluded Cluster 2 = Well-off Cluster
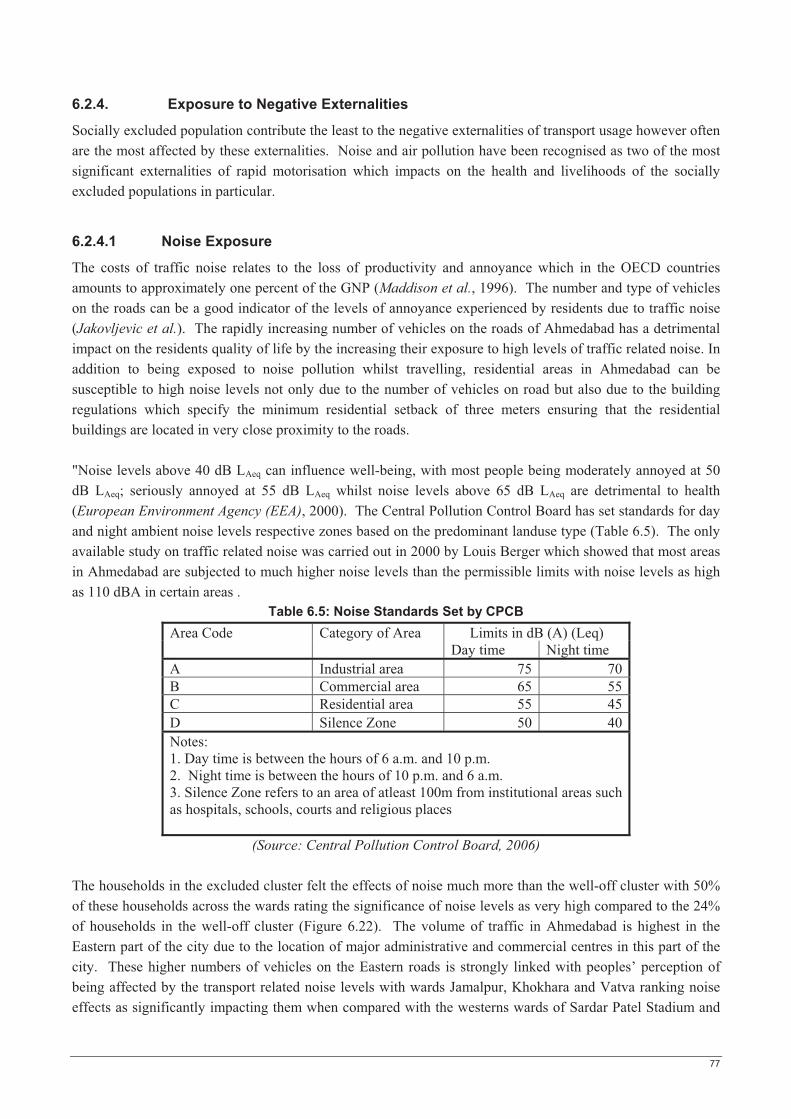
77
6.2.4. Exposure to Negative Externalities
Socially excluded population contribute the least to the negative externalities of transport usage however often are the most affected by these externalities. Noise and air pollution have been recognised as two of the most significant externalities of rapid motorisation which impacts on the health and livelihoods of the socially excluded populations in particular.
6.2.4.1 Noise Exposure
The costs of traffic noise relates to the loss of productivity and annoyance which in the OECD countries amounts to approximately one percent of the GNP (Maddison et al., 1996). The number and type of vehicles on the roads can be a good indicator of the levels of annoyance experienced by residents due to traffic noise (Jakovljevic et al.). The rapidly increasing number of vehicles on the roads of Ahmedabad has a detrimental impact on the residents quality of life by the increasing their exposure to high levels of traffic related noise. In addition to being exposed to noise pollution whilst travelling, residential areas in Ahmedabad can be susceptible to high noise levels not only due to the number of vehicles on road but also due to the building regulations which specify the minimum residential setback of three meters ensuring that the residential buildings are located in very close proximity to the roads.
"Noise levels above 40 dB LAeq can influence well-being, with most people being moderately annoyed at 50 dB LAeq; seriously annoyed at 55 dB LAeq whilst noise levels above 65 dB LAeq are detrimental to health (European Environment Agency (EEA), 2000). The Central Pollution Control Board has set standards for day and night ambient noise levels respective zones based on the predominant landuse type (Table 6.5). The only available study on traffic related noise was carried out in 2000 by Louis Berger which showed that most areas in Ahmedabad are subjected to much higher noise levels than the permissible limits with noise levels as high as 110 dBA in certain areas .
Table 6.5: Noise Standards Set by CPCB Area Code Category of Area Limits in dB (A) (Leq) Day time Night time A Industrial area 75 70B Commercial area 65 55C Residential area 55 45D Silence Zone 50 40Notes: 1. Day time is between the hours of 6 a.m. and 10 p.m. 2. Night time is between the hours of 10 p.m. and 6 a.m. 3. Silence Zone refers to an area of atleast 100m from institutional areas such as hospitals, schools, courts and religious places
(Source: Central Pollution Control Board, 2006)
The households in the excluded cluster felt the effects of noise much more than the well-off cluster with 50% of these households across the wards rating the significance of noise levels as very high compared to the 24% of households in the well-off cluster (Figure 6.22). The volume of traffic in Ahmedabad is highest in the Eastern part of the city due to the location of major administrative and commercial centres in this part of the city. These higher numbers of vehicles on the Eastern roads is strongly linked with peoples’ perception of being affected by the transport related noise levels with wards Jamalpur, Khokhara and Vatva ranking noise effects as significantly impacting them when compared with the westerns wards of Sardar Patel Stadium and
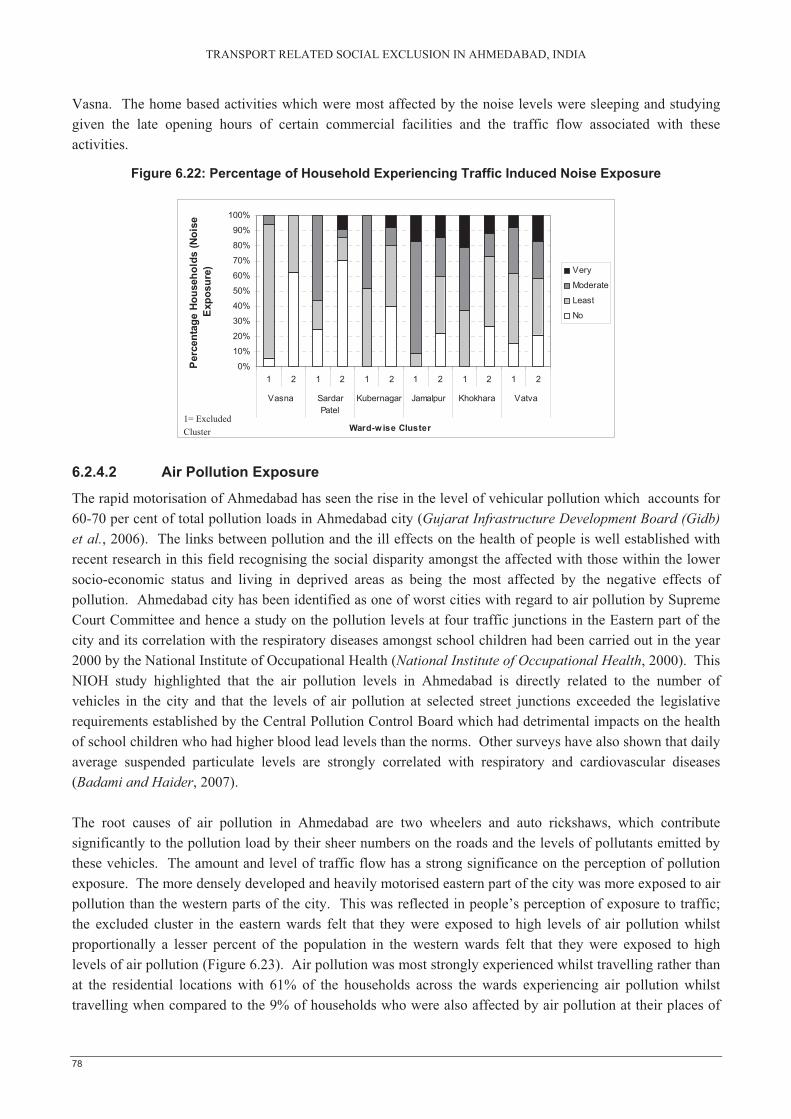
TRANSPORT RELATED SOCIAL EXCLUSION IN AHMEDABAD, INDIA
78
Vasna. The home based activities which were most affected by the noise levels were sleeping and studying given the late opening hours of certain commercial facilities and the traffic flow associated with these activities.
Figure 6.22: Percentage of Household Experiencing Traffic Induced Noise Exposure
6.2.4.2 Air Pollution Exposure
The rapid motorisation of Ahmedabad has seen the rise in the level of vehicular pollution which accounts for 60-70 per cent of total pollution loads in Ahmedabad city (Gujarat Infrastructure Development Board (Gidb) et al., 2006). The links between pollution and the ill effects on the health of people is well established with recent research in this field recognising the social disparity amongst the affected with those within the lower socio-economic status and living in deprived areas as being the most affected by the negative effects of pollution. Ahmedabad city has been identified as one of worst cities with regard to air pollution by Supreme Court Committee and hence a study on the pollution levels at four traffic junctions in the Eastern part of the city and its correlation with the respiratory diseases amongst school children had been carried out in the year 2000 by the National Institute of Occupational Health (National Institute of Occupational Health, 2000). This NIOH study highlighted that the air pollution levels in Ahmedabad is directly related to the number of vehicles in the city and that the levels of air pollution at selected street junctions exceeded the legislative requirements established by the Central Pollution Control Board which had detrimental impacts on the health of school children who had higher blood lead levels than the norms. Other surveys have also shown that daily average suspended particulate levels are strongly correlated with respiratory and cardiovascular diseases (Badami and Haider, 2007).
The root causes of air pollution in Ahmedabad are two wheelers and auto rickshaws, which contribute significantly to the pollution load by their sheer numbers on the roads and the levels of pollutants emitted by these vehicles. The amount and level of traffic flow has a strong significance on the perception of pollution exposure. The more densely developed and heavily motorised eastern part of the city was more exposed to air pollution than the western parts of the city. This was reflected in people’s perception of exposure to traffic; the excluded cluster in the eastern wards felt that they were exposed to high levels of air pollution whilst proportionally a lesser percent of the population in the western wards felt that they were exposed to high levels of air pollution (Figure 6.23). Air pollution was most strongly experienced whilst travelling rather than at the residential locations with 61% of the households across the wards experiencing air pollution whilst travelling when compared to the 9% of households who were also affected by air pollution at their places of
0%
10%
20%
30%
40%
50%
60%
70%
80%
90%
100%
1 2 1 2 1 2 1 2 1 2 1 2
Vasna SardarPatel
Kubernagar Jamalpur Khokhara Vatva
Ward-wise Cluster
Per
cent
age
Hou
seho
lds
(Noi
se
Exp
osur
e) Very
Moderate
Least
No
1= Excluded Cluster
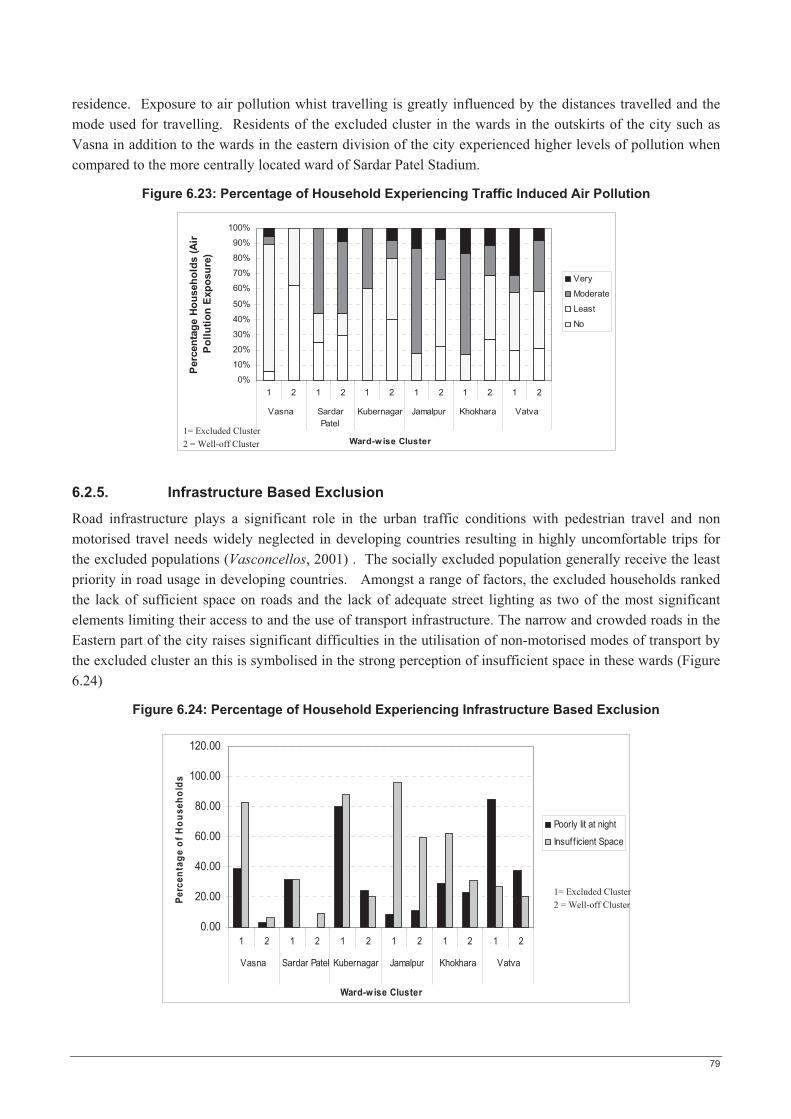
79
0.00
20.00
40.00
60.00
80.00
100.00
120.00
1 2 1 2 1 2 1 2 1 2 1 2
Vasna Sardar Patel Kubernagar Jamalpur Khokhara Vatva
Ward-wise Cluster
Perc
enta
ge o
f Hou
seho
lds
Poorly lit at night
Insuff icient Space
residence. Exposure to air pollution whist travelling is greatly influenced by the distances travelled and the mode used for travelling. Residents of the excluded cluster in the wards in the outskirts of the city such as Vasna in addition to the wards in the eastern division of the city experienced higher levels of pollution when compared to the more centrally located ward of Sardar Patel Stadium.
Figure 6.23: Percentage of Household Experiencing Traffic Induced Air Pollution
6.2.5. Infrastructure Based Exclusion
Road infrastructure plays a significant role in the urban traffic conditions with pedestrian travel and non motorised travel needs widely neglected in developing countries resulting in highly uncomfortable trips for the excluded populations (Vasconcellos, 2001) . The socially excluded population generally receive the least priority in road usage in developing countries. Amongst a range of factors, the excluded households ranked the lack of sufficient space on roads and the lack of adequate street lighting as two of the most significant elements limiting their access to and the use of transport infrastructure. The narrow and crowded roads in the Eastern part of the city raises significant difficulties in the utilisation of non-motorised modes of transport by the excluded cluster an this is symbolised in the strong perception of insufficient space in these wards (Figure 6.24)
Figure 6.24: Percentage of Household Experiencing Infrastructure Based Exclusion
1= Excluded Cluster 2 = Well-off Cluster
0%
10%
20%
30%
40%
50%
60%
70%
80%
90%
100%
1 2 1 2 1 2 1 2 1 2 1 2
Vasna SardarPatel
Kubernagar Jamalpur Khokhara Vatva
Ward-wise Cluster
Perc
enta
ge H
ouse
hold
s (A
ir
Pol
lutio
n Ex
posu
re)
Very
Moderate
Least
No
1= Excluded Cluster 2 = Well-off Cluster
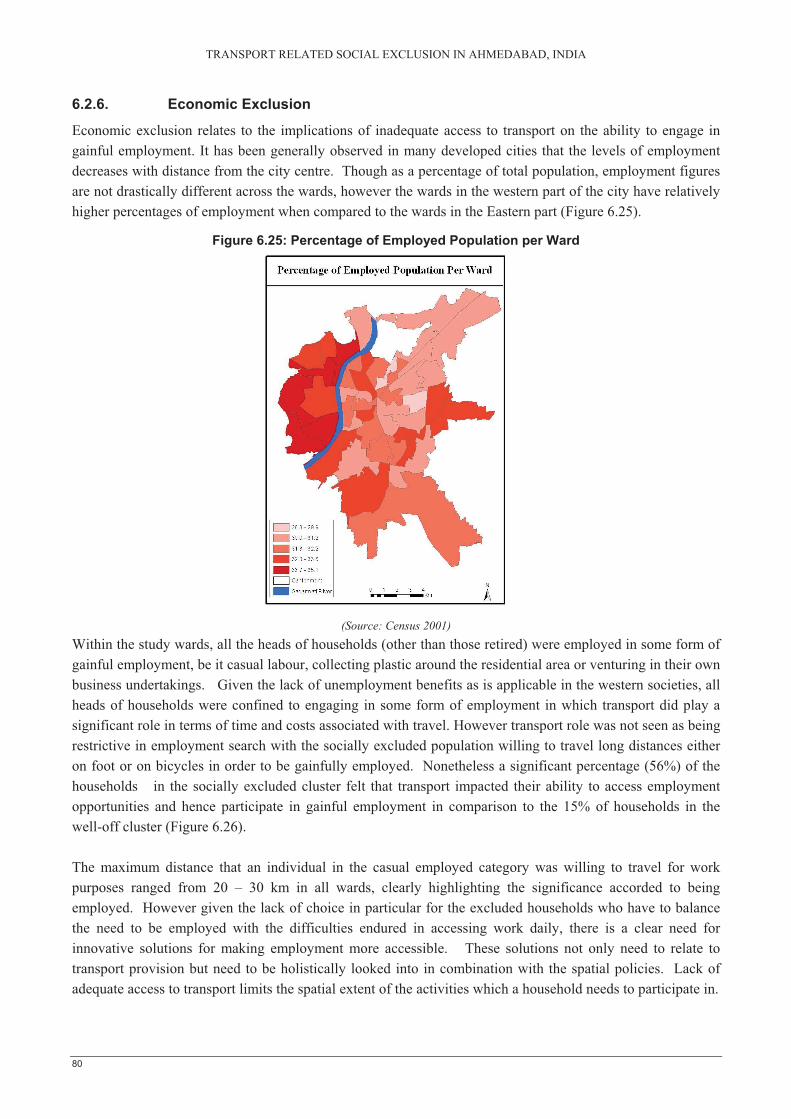
TRANSPORT RELATED SOCIAL EXCLUSION IN AHMEDABAD, INDIA
80
6.2.6. Economic Exclusion
Economic exclusion relates to the implications of inadequate access to transport on the ability to engage in gainful employment. It has been generally observed in many developed cities that the levels of employment decreases with distance from the city centre. Though as a percentage of total population, employment figures are not drastically different across the wards, however the wards in the western part of the city have relatively higher percentages of employment when compared to the wards in the Eastern part (Figure 6.25).
Figure 6.25: Percentage of Employed Population per Ward
(Source: Census 2001) Within the study wards, all the heads of households (other than those retired) were employed in some form of gainful employment, be it casual labour, collecting plastic around the residential area or venturing in their own business undertakings. Given the lack of unemployment benefits as is applicable in the western societies, all heads of households were confined to engaging in some form of employment in which transport did play a significant role in terms of time and costs associated with travel. However transport role was not seen as being restrictive in employment search with the socially excluded population willing to travel long distances either on foot or on bicycles in order to be gainfully employed. Nonetheless a significant percentage (56%) of the households in the socially excluded cluster felt that transport impacted their ability to access employment opportunities and hence participate in gainful employment in comparison to the 15% of households in the well-off cluster (Figure 6.26).
The maximum distance that an individual in the casual employed category was willing to travel for work purposes ranged from 20 – 30 km in all wards, clearly highlighting the significance accorded to being employed. However given the lack of choice in particular for the excluded households who have to balance the need to be employed with the difficulties endured in accessing work daily, there is a clear need for innovative solutions for making employment more accessible. These solutions not only need to relate to transport provision but need to be holistically looked into in combination with the spatial policies. Lack of adequate access to transport limits the spatial extent of the activities which a household needs to participate in.
81
Figure 6.26: Percentage of Household Experiencing Limitations in Their Access to Employment Opportunities
6.2.7. Spatial Exclusion
The mobility of the poor (socially excluded) is constrained by their access to affordable transport which limits the extent to which they can access urban resources (Brown and Lloyd-Jones, 2002). Transport plays an integral role in the spatial reach of individuals; with the activities of the socially excluded populations often restricted to locations in close vicinity to their places of residence. This section looks into the implications of inadequate access to pubic and private transport on the limitations of activity choices of households.
Transport related social exclusion is built on the premise that exclusion exists not due to a lack of facilities per se but due to a lack of access to facilities and services. The socially excluded cluster due to their lack of adequate access to transport experience much greater limitations in their choice of activities when compared to the well off cluster. Eighty seven percent of the households in the excluded cluster across the wards experienced a limitation in their choice of activities be it employment, education shopping or recreation. On the other hand only thirty five percent of the well-off cluster experienced limitation in their choice of activities of which most of the households were located in the Eastern part of the city. Amongst the excluded cluster, the relatively poorer Eastern ward ranked the limited choice of activities much higher than did the western wards (Figure 6.27).
Figure 6.27: Percentage of Household Experiencing a Limitation in their Choice of Activities
0%
10%
20%
30%
40%
50%
60%
70%
80%
90%
100%
1 2 1 2 1 2 1 2 1 2 1 2
Vasna Sardar Patel Kubernagar Jamalpur Khokhara Vatva
Ward-w ise cluster
Hous
ehol
ds A
ffect
ed D
ue to
Lac
k of
Ad
eqau
te A
cces
s to
Em
ploy
men
t
Very
Moderate
Least
None
1= Excluded Cluster 2 = Well-off Cluster
0%
10%
20%
30%
40%
50%
60%
70%
80%
90%
100%
1 2 1 2 1 2 1 2 1 2 1 2
Vasna Sardar Patel Kubernagar Jamalpur Khokhara Vatva
Ward-w ise cluster
Hou
seho
lds
Aff
ecte
d D
ue to
Lim
ited
Cho
ice
of
Act
iviti
es
Very
Moderate
Least
None
1= Excluded Cluster 2 = Well-off Cluster

TRANSPORT RELATED SOCIAL EXCLUSION IN AHMEDABAD, INDIA
82
Education and health are two of the most significant facilities which people and in particular the socially excluded population need access to. This significance is reflected in the recognition that is awarded to these two sectors in their role in the eradication of poverty and exclusion with education being accorded second goal in the MDG’s and child with maternal health being accorded the 4th and 5th goals of MDG’s.
None of the households in the well-off cluster had school children who were not attending schools whilst in the excluded cluster the children who were not attending schools cited the most common reasons being a lack of interest in school work, an inability to afford school expenses and distance to school for dropping out of school. The reliance on walking as the only viable mode for travelling to schools by the excluded cluster meant that parents chose the nearest public school feasible to send the children with distance to schools playing a key role in school choice and attendance. Of the excluded households across the six wards; 70% of them felt that their access to educational facilities was significantly impacted by the transport system. Transport role in education access was most strongly felt in the Eastern wards and the peripheral ward of Vasna (Figure 6.28). Only 15% of the households in the well-off cluster felt that transport impacted their access to educational facilities even though these households spent approximately 350 rupees per child on school transport expenses and generally travelled longer distances due to their preference for private schools.
Figure 6.28: Percentage of Household Experiencing a Limitation in their Access to Educational Facilities
Household generally tended to visit hospitals and medical professionals for serious medical ailments. Distance from central wards and hence the travel time to medical facilities within the wards had a significant role to play in the perception of exclusion from accessing medical facilities due to transport costs. The households in Vasna due to the distance from facilities and the households in the eastern wards experienced a stronger sense of exclusion from the use of medical facilities due to lack of adequate access to the transport system (Figure 6.29). In addition to the health and medical facilities, shopping activities of households was critically impacted by inadequate access to transport system. Shopping activities of the excluded cluster was restricted to nearby shops with 87% of the households stating that the lack of access to transport significantly impacts their access of shopping facilities compared to the 38% of the well-off cluster. Shopping was predominantly undertaken by the wives of the heads of households and hence a high percentage of the well-
0%
10%
20%
30%
40%
50%
60%
70%
80%
90%
100%
1 2 1 2 1 2 1 2 1 2 1 2
Vasna Sardar Patel Kubernagar Jamalpur Khokhara Vatva
Ward-wise cluster
Hou
seho
lds
Affe
cted
Due
to L
ack
of
Ade
qaut
e A
cces
s to
Edu
catio
nal F
acili
ties
Very
Moderate
Least
None
1= Excluded Cluster 2 = Well-off Cluster
83
0%10%20%30%40%50%60%70%80%90%
100%
1 2 1 2 1 2 1 2 1 2 1 2
Vasna Sardar Patel Kubernagar Jamalpur Khokhara Vatva
Ward-wise cluster
Perc
enta
ge o
f Hou
shol
ds
MonthlyFortnightlyWeeklyDaily
off cluster which were one vehicle households experienced limitations in accessing shopping facilities. The impacts of inadequate access to transport was translated in the spatial restriction of shopping to nearby shops which was perceived as being susceptible to more expensive goods, less variety of good and inferior quality of goods.
Figure 6.29: Percentage of Household Experiencing a Limitation in their Access to Health Facilities
6.2.8. Social Interaction
Contrary to findings within the western world where due to transport the poor have been unable to maintain regular social contacts ((Cass et al., 2005), the cluster identified as socially excluded had more frequent interaction with family and friends than the well-off cluster. Figure 6.30 shows the frequency of interaction within the respective two clusters, where it is clearly highlighted that more than 50% of the socially excluded cluster within all wards except Vatva met with relatives and / or friends atleast daily or once a week whereas the well-off cluster met less frequently (once a month or a year). Access to transport had a significant role to play in the level on interaction in Vatva where due to the scattered development and non availability of regular public transport and poorly lit streets social interaction was limited to less frequent fortnights or on weekends. However most of the social interaction of the socially excluded cluster was confined within their respective neighbourhood which implies bonding within their respective homogeneous groups.
Figure 6.30: The Frequency of Social Interaction in the Two Clusters per Ward
0%
10%
20%
30%
40%
50%
60%
70%
80%
90%
100%
1 2 1 2 1 2 1 2 1 2 1 2
Vasna Sardar Patel Kubernagar Jamalpur Khokhara Vatva
Ward-wise cluster
Hous
ehol
ds A
ffect
ed D
ue to
Lac
k of
Ad
eqau
te A
cces
s to
Med
ical
Fac
ilitie
s
Very
Moderate
Least
None
1= Excluded Cluster 2 = Well-off Cluster
1= Excluded Cluster 2 = Well-off Cluster
TRANSPORT RELATED SOCIAL EXCLUSION IN AHMEDABAD, INDIA
84
0
20
40
60
80
100Temporal
Economic
Affordability Based
Fear Based
Infrastructure Risk of road accidents
Noise Exposure
Pollution Exposure
Spatial
Socially Excluded Cluster (1)Well-Off Cluster (2)
6.3. Summary of Findings
This chapter looked into the differential perception of transport related social exclusion amongst the socially excluded population and well-off households in line with the previously identified manifestations. Socially excluded households were identified across the wards based on their low income, inadequate housing, low asset base and the below average socio-economic characteristics. Distinct differences could be identified in the transport access and use for the two different clusters of households. The socially excluded cluster primarily due to their inability to afford motorised modes of transport relied heavily on non-motorised modes such as walking and cycling whilst the well-off cluster could afford private modes as well as public transport fares. In addition to affordability the elements which significantly impacted transport access for the socially excluded cluster were; infrequent public transport, temporal elements relating to the operating hours of public transport and the households’ schedule of activities. Transport related social exclusion results from the complex interaction of amongst other contributing factors the transport system, the characteristics of households and the prevalent landuse. Across the six selected wards, socially excluded households within the Eastern wards and the Vasna located on the periphery of the Western wards experienced transport related social exclusion more than the western ward of Sardar Patel Stadium.
Transport related social exclusion is manifested in various forms; the most common manifestation in the study area was identified as spatial exclusion which restricted the access to services and facilities based on the relative siting of these in relation to the residential locations of the households. Spatial exclusion resulted in the households experiencing limitations in their choice of activities such as education, medical and shopping facilities which in turn would have reduced their participation in the related activities. Previous studies have identified economic exclusion as the most significant manifestation of transport related social exclusion. However whilst transport did play a significant role in access to employment, given the lack of social security benefits, all households had to be gainfully employed and hence the socially excluded cluster was willing to walk and cycle as far as 20km in order to participate in the workforce whether it was within the formal or informal sector. The other manifestations of transport related social exclusion which were identified as being significant in were infrastructure based, fear based manifestations (Figure 6.31).
Figure 6.31: Elements Which Hinder Access to Adequate Transport
85
6.4. Limitations in the Analysis of Peoples Perception of the Different Manifestations of Transport Related Social Exclsuion
Analysis of households’ perception of exclusion is integral in conceptualising transport related social exclusion at a local level which helps to identify the factors which hinder adequate access to transport and the implications of inadequate access from the views of the affected population. However every individual and/or household has differential transport needs and their perception of exclusion is often clouded by their individual expectations and unmet needs which need to be realistically verified with actual transport infrastructure and services available within an area. Whilst elements such as noise pollution levels and accidents rates have been incorporated into the analysis of the manifestations of exclusion, these data were available at a very crude level and for a thorough analysis of transport related social exclusion would require more detailed data at an appropriate scale.
Spatial exclusion has been identified as the most significant manifestation of transport related social exclusion in the study area. Given the data limitations, it would be impossible to carry out a detailed accessibility analysis which would have ideally looked into the number of services / facilities available within walking distances from households and bus stops. However the following chapter looks into the role that transport infrastructure plays in providing accessibility to services with an example of walking distances to primary schools.
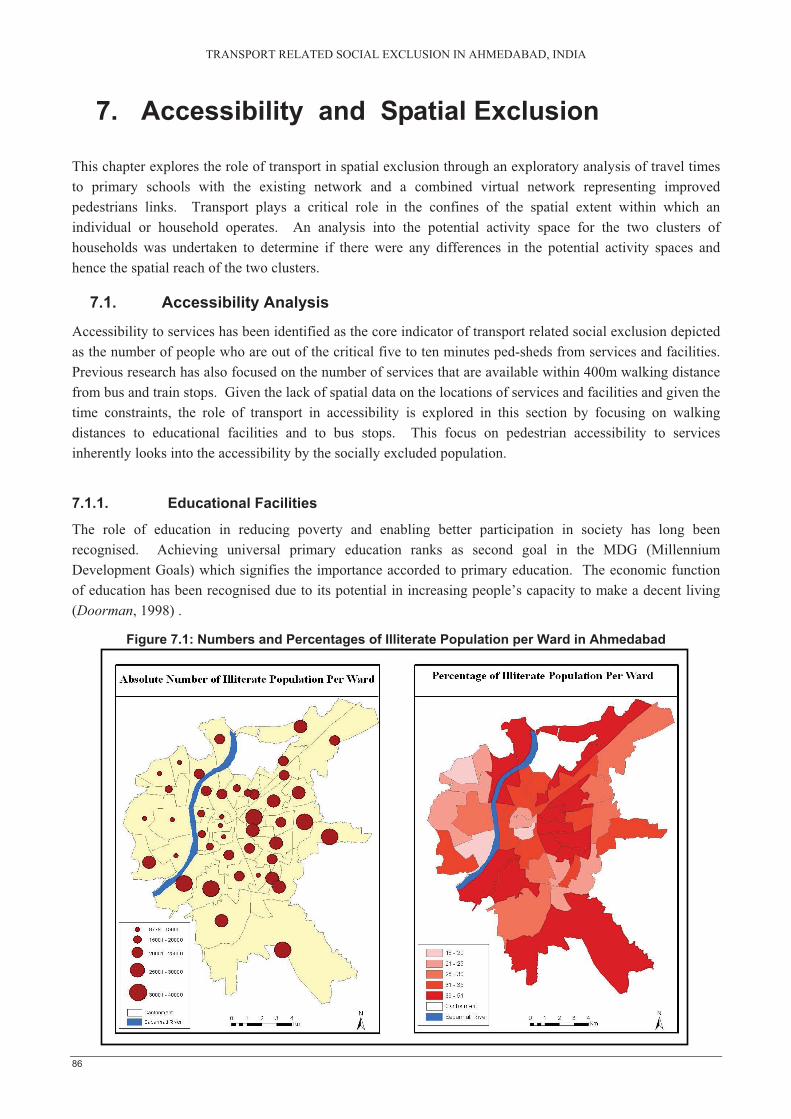
TRANSPORT RELATED SOCIAL EXCLUSION IN AHMEDABAD, INDIA
86
7. Accessibility and Spatial Exclusion
This chapter explores the role of transport in spatial exclusion through an exploratory analysis of travel times to primary schools with the existing network and a combined virtual network representing improved pedestrians links. Transport plays a critical role in the confines of the spatial extent within which an individual or household operates. An analysis into the potential activity space for the two clusters of households was undertaken to determine if there were any differences in the potential activity spaces and hence the spatial reach of the two clusters.
7.1. Accessibility Analysis
Accessibility to services has been identified as the core indicator of transport related social exclusion depicted as the number of people who are out of the critical five to ten minutes ped-sheds from services and facilities. Previous research has also focused on the number of services that are available within 400m walking distance from bus and train stops. Given the lack of spatial data on the locations of services and facilities and given the time constraints, the role of transport in accessibility is explored in this section by focusing on walking distances to educational facilities and to bus stops. This focus on pedestrian accessibility to services inherently looks into the accessibility by the socially excluded population.
7.1.1. Educational Facilities
The role of education in reducing poverty and enabling better participation in society has long been recognised. Achieving universal primary education ranks as second goal in the MDG (Millennium Development Goals) which signifies the importance accorded to primary education. The economic function of education has been recognised due to its potential in increasing people’s capacity to make a decent living (Doorman, 1998) .
Figure 7.1: Numbers and Percentages of Illiterate Population per Ward in Ahmedabad

87
At a city level, the wards in the western and central part of the city have lower percentages of illiterate population which to some extent intensifies with the increasing distances from the central city areas (Figure 7.1). This at a very crude level is based on the assumption that education of population depends on the ability to access educational facilities which indicates that transport plays a significant role in the access to educational facilities which in turn affects the level of participation in educational activities. The following analysis of the household survey further verifies the role that transport plays in enabling accessibility to educational facilities.
The household survey revealed that the choice of schools for the excluded cluster was the Ahmedabad run municipal schools and some of the NGO managed schools with distance to the schools being one of the deciding factors in the actual public school chosen. The well-off cluster predominantly chose private schools in which considerations other than the distance to school such as the perceived quality of the schools played a greater role. The most common mode of travel to school for the children of households classified as socially excluded was on foot (72%) whilst the most common mode of transport for the well-off cluster was the school provided transport which costs on average 350 rupees per month.
7.1.2. Accessibility to Education Facilities
Walking time and distances to facilities is not only impacted by the number of facilities available within an area but also by the pedestrian network. This analysis is carried out based on the assumption that there is sufficient capacity in all schools to cater for the students and that as per survey results people do indeed choose the closest available public school. The role that adequate pedestrian network plays in access to schools is established by calculating the travel times and the population coverage within the classified walking times for the existing schools based on the current road network compared with a virtual network. Figure 7.1 highlights the approach followed for undertaking the accessibility analysis.
Figure 7.2: Comparative Accessibility Analysis based on the Existing and the Virtual Network
Centroids
Ward Population Residential Areas per Ward
Hexagons (100m) withPopulation figures
ArcGIS Based Network Analysis (Closest Facility)
Walking times for Existing And Virtual network
Public and NGOmanaged schools
Connected to form virtual network
New Virtual Network
Existing Road Network

TRANSPORT RELATED SOCIAL EXCLUSION IN AHMEDABAD, INDIA
88
Public schools and NGO run schools (Figure 7.4) were identified and digitised from the GEO Ahmedabad City Map and from the NGO (SAATH) provided information. The locations of these sixty nine schools wereverified based on the responses from the household surveys. The landuse of the selected wards was amended based on the GEO Ahmedabad City Map, Google Earth and Wikimapia to provide the actual residential areas per ward. Given the data in both the street maps and Google Earth was for the year 2004, the census population for the year 2001 was also projected in accordance with the growth rate to the year 2004. Residential density was calculated uniformly across the residential areas of the ward. The wards were found to be quite heterogeneous in terms of residential area with pockets of slums and chawls located along side upmarket residential areas. The most common form of formal residential development are apartments whilst informal residential development are slums and chawls, therefore even though the informal residential areas would have a higher population density; given the mixture of land uses residential density may not differ substantially in hexagons of 2.5 ha.
Hexagons with 100m side lengths were created (Figure 7.3) which were then allotted population densities based on the residential areas within each hexagon (Figure 7.4). The virtual network was created by joining the centres of each hexagon and amalgamating it with the real network before cleaning and building it. The dimensions of 100m was hoped to signify the potential ability to walk around residential blocks in addition to using the street network. The walking speed assigned to the real network was 3km / hr whilst the virtual network was assigned a much lower speed of 2.5km; hence movement preference was accorded to the real road network where it existed. The creation of the virtual network is based on the approach used by Amer (2007) however the purpose of analysis utilising this virtual network is different. The difference in the existing and the combined virtual network is shown in figure 8.4. ArcGIS closest facility analysis was undertaken to find the nearest public school from all hexagons centroids in terms of travel times and travel distances.
Figure 7.3: Example of the Real and the Combined Real and Virtual network in Vasna

89
Population per Hexagon
Figure 7.4: Locations of Public Primary Schools and Ward-wise Population per Hexagon
7.1.3. The Differential Accessibility Levels Based on the Two Networks
There are marked differences in the travel times and the affected population within reasonable reach of schools with the two different networks, the travel time is spatially depicted in figure 7.5 whilst the affected population is graphically shown in figure 7.6 and 7.7.
Figure 7.5: Walk Times to Schools with the Existing Network and the Combined Virtual and Existing Network
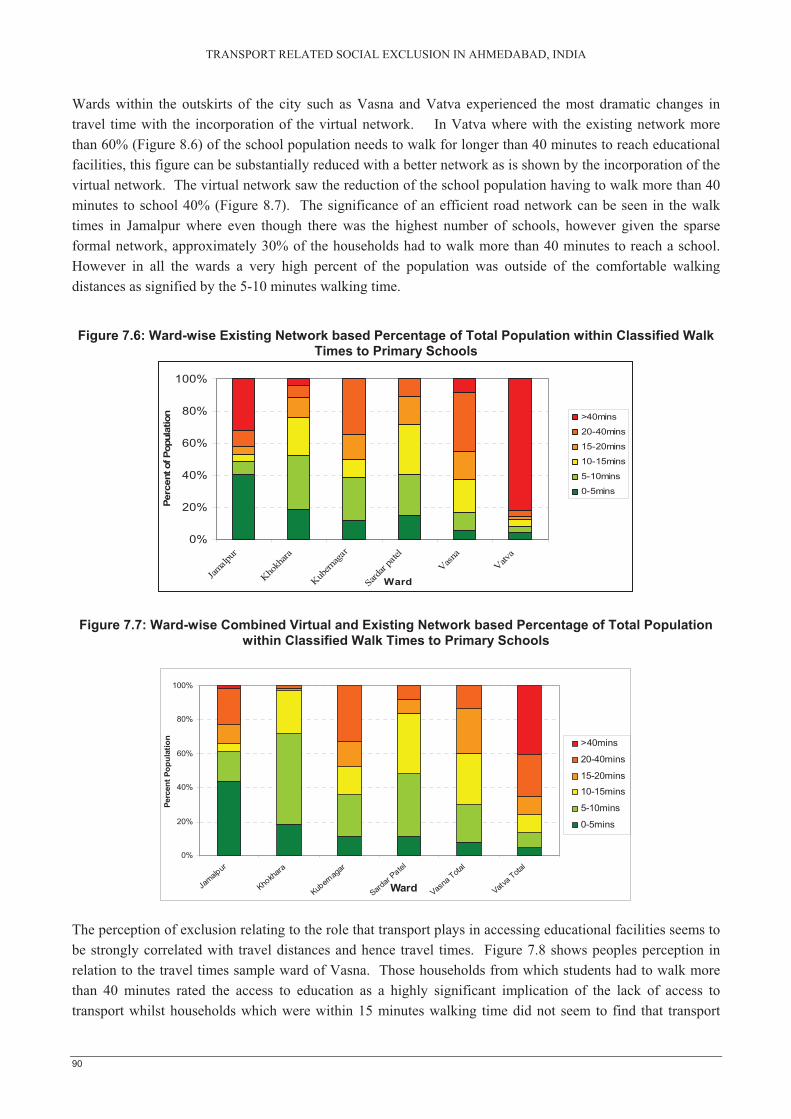
TRANSPORT RELATED SOCIAL EXCLUSION IN AHMEDABAD, INDIA
90
0%
20%
40%
60%
80%
100%
Jamalp
ur
Khokh
ara
Kubern
agar
Sardar
patel
Vasna
Vatva
Ward
Perc
ent o
f Pop
ulat
ion >40mins
20-40mins
15-20mins
10-15mins
5-10mins
0-5mins
0%
20%
40%
60%
80%
100%
Jamalp
ur
Khokh
ara
Kubern
agar
Sardar
Patel
Vasna
Total
Vatva Tota
l
Ward
Perc
ent P
opul
atio
n >40mins
20-40mins
15-20mins
10-15mins
5-10mins
0-5mins
Wards within the outskirts of the city such as Vasna and Vatva experienced the most dramatic changes in travel time with the incorporation of the virtual network. In Vatva where with the existing network more than 60% (Figure 8.6) of the school population needs to walk for longer than 40 minutes to reach educational facilities, this figure can be substantially reduced with a better network as is shown by the incorporation of the virtual network. The virtual network saw the reduction of the school population having to walk more than 40 minutes to school 40% (Figure 8.7). The significance of an efficient road network can be seen in the walk times in Jamalpur where even though there was the highest number of schools, however given the sparse formal network, approximately 30% of the households had to walk more than 40 minutes to reach a school. However in all the wards a very high percent of the population was outside of the comfortable walking distances as signified by the 5-10 minutes walking time.
Figure 7.6: Ward-wise Existing Network based Percentage of Total Population within Classified Walk Times to Primary Schools
Figure 7.7: Ward-wise Combined Virtual and Existing Network based Percentage of Total Population within Classified Walk Times to Primary Schools
The perception of exclusion relating to the role that transport plays in accessing educational facilities seems to be strongly correlated with travel distances and hence travel times. Figure 7.8 shows peoples perception in relation to the travel times sample ward of Vasna. Those households from which students had to walk more than 40 minutes rated the access to education as a highly significant implication of the lack of access to transport whilst households which were within 15 minutes walking time did not seem to find that transport
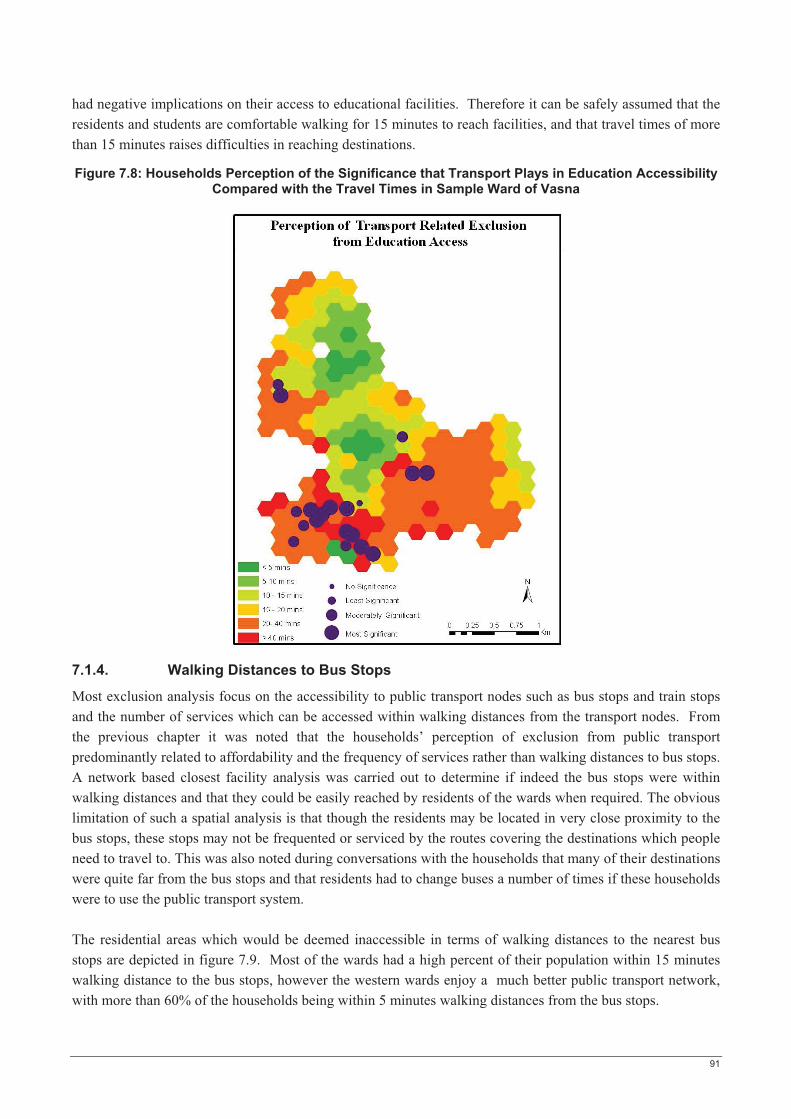
91
had negative implications on their access to educational facilities. Therefore it can be safely assumed that the residents and students are comfortable walking for 15 minutes to reach facilities, and that travel times of more than 15 minutes raises difficulties in reaching destinations.
Figure 7.8: Households Perception of the Significance that Transport Plays in Education Accessibility Compared with the Travel Times in Sample Ward of Vasna
7.1.4. Walking Distances to Bus Stops
Most exclusion analysis focus on the accessibility to public transport nodes such as bus stops and train stops and the number of services which can be accessed within walking distances from the transport nodes. From the previous chapter it was noted that the households’ perception of exclusion from public transport predominantly related to affordability and the frequency of services rather than walking distances to bus stops. A network based closest facility analysis was carried out to determine if indeed the bus stops were within walking distances and that they could be easily reached by residents of the wards when required. The obvious limitation of such a spatial analysis is that though the residents may be located in very close proximity to the bus stops, these stops may not be frequented or serviced by the routes covering the destinations which people need to travel to. This was also noted during conversations with the households that many of their destinations were quite far from the bus stops and that residents had to change buses a number of times if these households were to use the public transport system.
The residential areas which would be deemed inaccessible in terms of walking distances to the nearest bus stops are depicted in figure 7.9. Most of the wards had a high percent of their population within 15 minutes walking distance to the bus stops, however the western wards enjoy a much better public transport network, with more than 60% of the households being within 5 minutes walking distances from the bus stops.
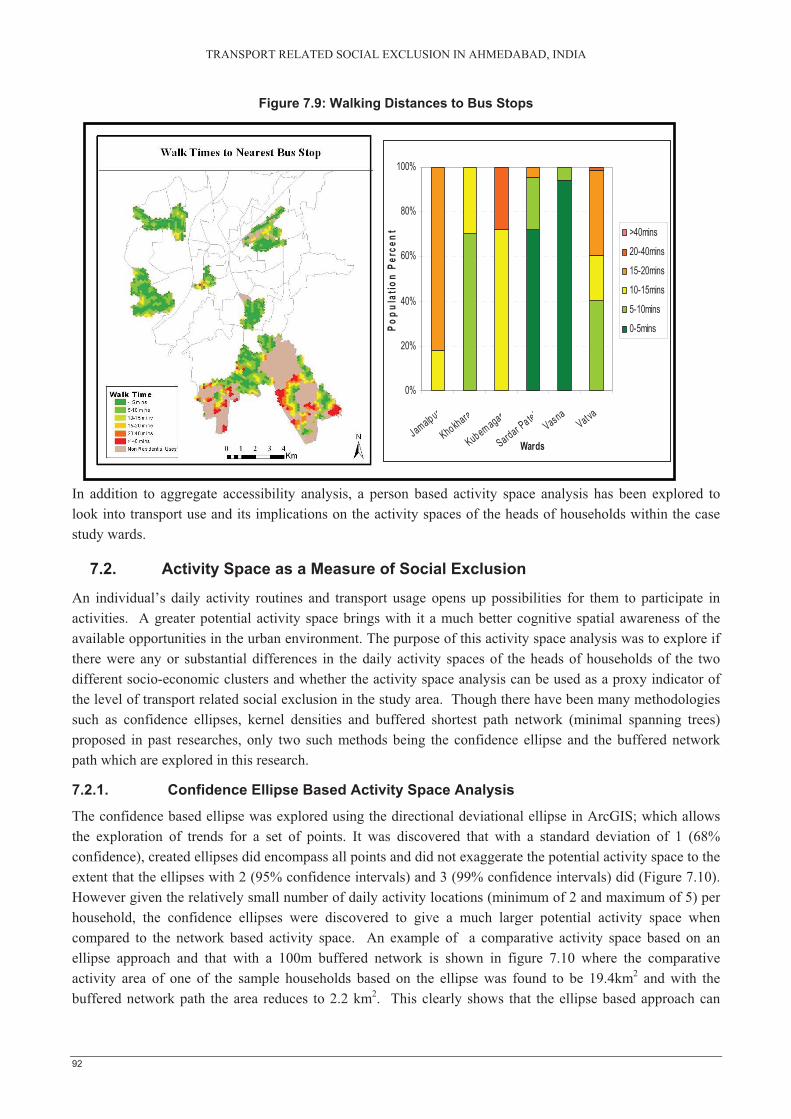
TRANSPORT RELATED SOCIAL EXCLUSION IN AHMEDABAD, INDIA
92
0%
20%
40%
60%
80%
100%
Jamalpur
Khokhara
Kubernagar
Sardar Pa telVasna
Vatva
Wards
Popu
latio
n Pe
rcen
t >40mins
20-40mins
15-20mins
10-15mins
5-10mins
0-5mins
Figure 7.9: Walking Distances to Bus Stops
In addition to aggregate accessibility analysis, a person based activity space analysis has been explored to look into transport use and its implications on the activity spaces of the heads of households within the case study wards.
7.2. Activity Space as a Measure of Social Exclusion
An individual’s daily activity routines and transport usage opens up possibilities for them to participate in activities. A greater potential activity space brings with it a much better cognitive spatial awareness of the available opportunities in the urban environment. The purpose of this activity space analysis was to explore if there were any or substantial differences in the daily activity spaces of the heads of households of the two different socio-economic clusters and whether the activity space analysis can be used as a proxy indicator of the level of transport related social exclusion in the study area. Though there have been many methodologies such as confidence ellipses, kernel densities and buffered shortest path network (minimal spanning trees) proposed in past researches, only two such methods being the confidence ellipse and the buffered network path which are explored in this research.
7.2.1. Confidence Ellipse Based Activity Space Analysis
The confidence based ellipse was explored using the directional deviational ellipse in ArcGIS; which allows the exploration of trends for a set of points. It was discovered that with a standard deviation of 1 (68% confidence), created ellipses did encompass all points and did not exaggerate the potential activity space to the extent that the ellipses with 2 (95% confidence intervals) and 3 (99% confidence intervals) did (Figure 7.10). However given the relatively small number of daily activity locations (minimum of 2 and maximum of 5) per household, the confidence ellipses were discovered to give a much larger potential activity space when compared to the network based activity space. An example of a comparative activity space based on an ellipse approach and that with a 100m buffered network is shown in figure 7.10 where the comparative activity area of one of the sample households based on the ellipse was found to be 19.4km2 and with the buffered network path the area reduces to 2.2 km2. This clearly shows that the ellipse based approach can
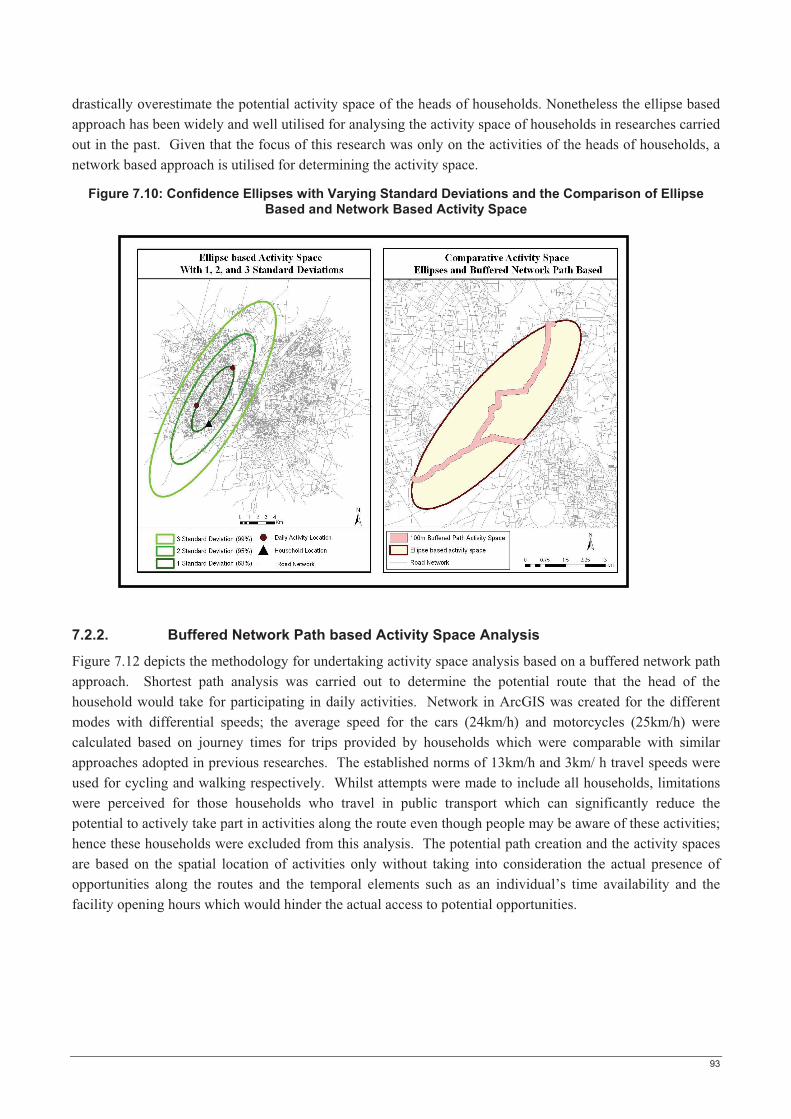
93
drastically overestimate the potential activity space of the heads of households. Nonetheless the ellipse based approach has been widely and well utilised for analysing the activity space of households in researches carried out in the past. Given that the focus of this research was only on the activities of the heads of households, a network based approach is utilised for determining the activity space.
Figure 7.10: Confidence Ellipses with Varying Standard Deviations and the Comparison of Ellipse Based and Network Based Activity Space
7.2.2. Buffered Network Path based Activity Space Analysis
Figure 7.12 depicts the methodology for undertaking activity space analysis based on a buffered network path approach. Shortest path analysis was carried out to determine the potential route that the head of the household would take for participating in daily activities. Network in ArcGIS was created for the different modes with differential speeds; the average speed for the cars (24km/h) and motorcycles (25km/h) were calculated based on journey times for trips provided by households which were comparable with similar approaches adopted in previous researches. The established norms of 13km/h and 3km/ h travel speeds were used for cycling and walking respectively. Whilst attempts were made to include all households, limitations were perceived for those households who travel in public transport which can significantly reduce the potential to actively take part in activities along the route even though people may be aware of these activities; hence these households were excluded from this analysis. The potential path creation and the activity spaces are based on the spatial location of activities only without taking into consideration the actual presence of opportunities along the routes and the temporal elements such as an individual’s time availability and the facility opening hours which would hinder the actual access to potential opportunities.
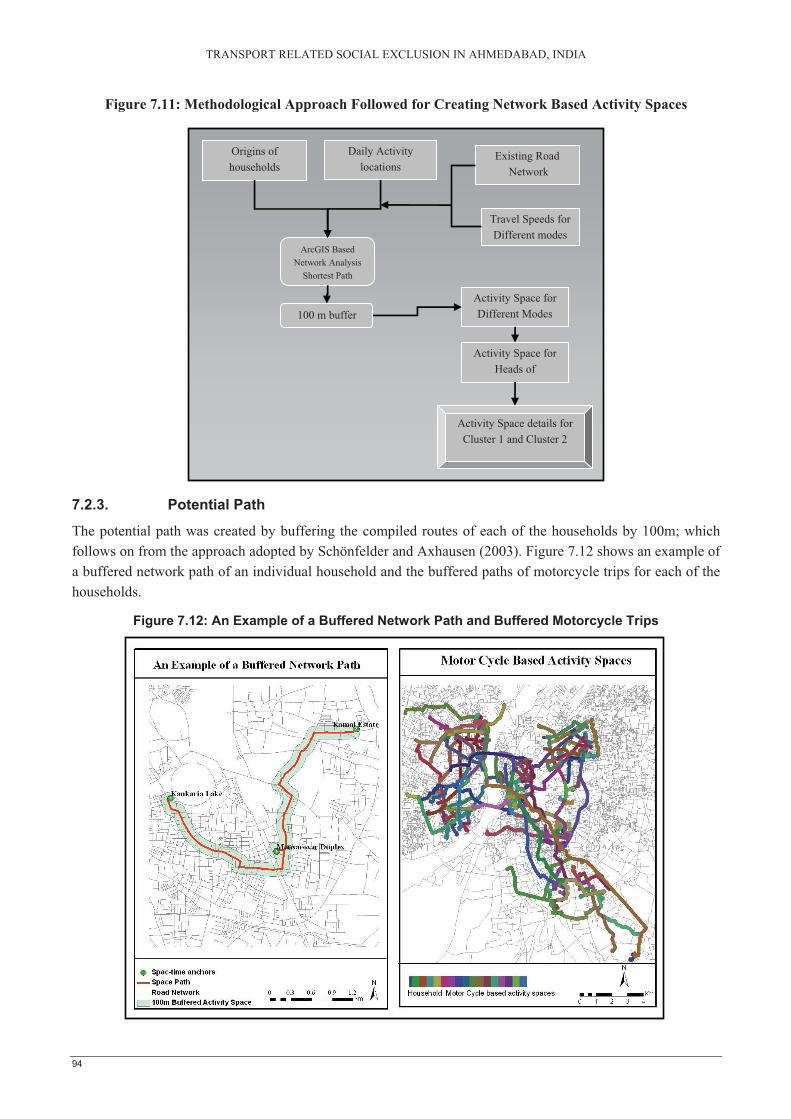
TRANSPORT RELATED SOCIAL EXCLUSION IN AHMEDABAD, INDIA
94
Origins of households
ArcGIS Based Network Analysis
Shortest Path
Activity Space details for Cluster 1 and Cluster 2
Travel Speeds forDifferent modes
Existing Road Network
100 m buffer
Daily Activity locations
Activity Space for Different Modes
Activity Space for Heads of
Figure 7.11: Methodological Approach Followed for Creating Network Based Activity Spaces
7.2.3. Potential Path
The potential path was created by buffering the compiled routes of each of the households by 100m; which follows on from the approach adopted by Schönfelder and Axhausen (2003). Figure 7.12 shows an example of a buffered network path of an individual household and the buffered paths of motorcycle trips for each of the households.
Figure 7.12: An Example of a Buffered Network Path and Buffered Motorcycle Trips
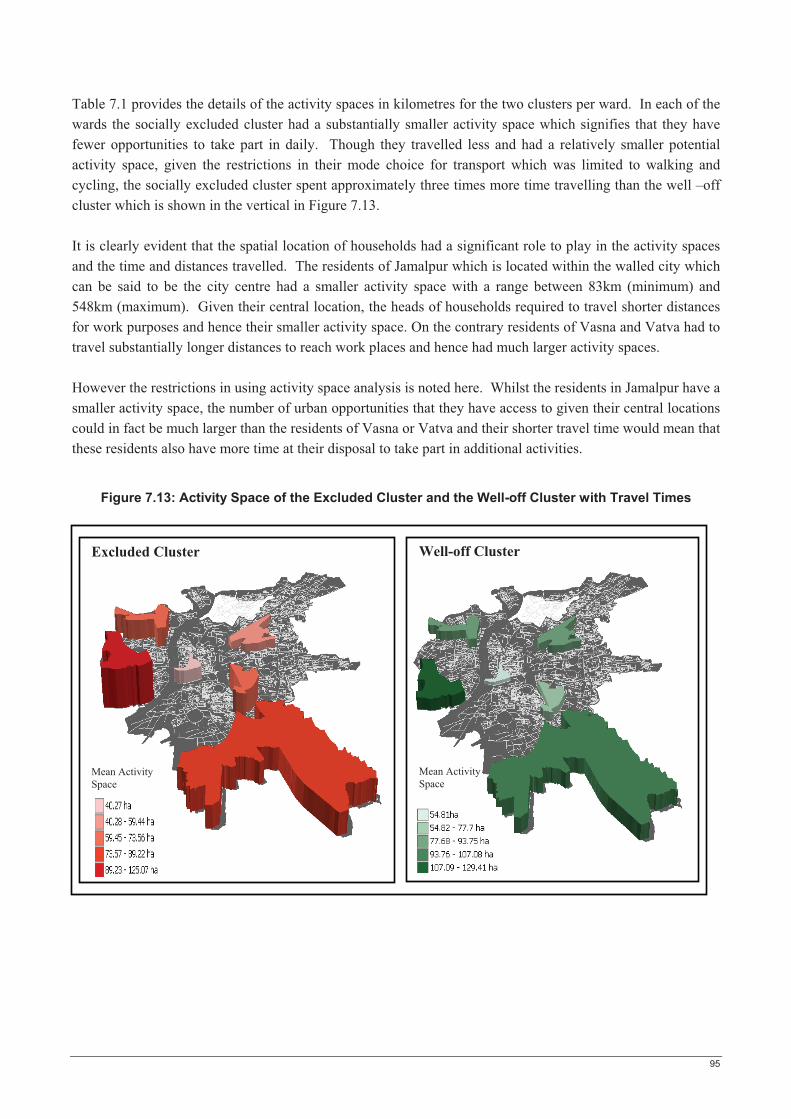
95
Table 7.1 provides the details of the activity spaces in kilometres for the two clusters per ward. In each of the wards the socially excluded cluster had a substantially smaller activity space which signifies that they have fewer opportunities to take part in daily. Though they travelled less and had a relatively smaller potential activity space, given the restrictions in their mode choice for transport which was limited to walking and cycling, the socially excluded cluster spent approximately three times more time travelling than the well –off cluster which is shown in the vertical in Figure 7.13.
It is clearly evident that the spatial location of households had a significant role to play in the activity spaces and the time and distances travelled. The residents of Jamalpur which is located within the walled city which can be said to be the city centre had a smaller activity space with a range between 83km (minimum) and 548km (maximum). Given their central location, the heads of households required to travel shorter distances for work purposes and hence their smaller activity space. On the contrary residents of Vasna and Vatva had to travel substantially longer distances to reach work places and hence had much larger activity spaces.
However the restrictions in using activity space analysis is noted here. Whilst the residents in Jamalpur have a smaller activity space, the number of urban opportunities that they have access to given their central locations could in fact be much larger than the residents of Vasna or Vatva and their shorter travel time would mean that these residents also have more time at their disposal to take part in additional activities.
Figure 7.13: Activity Space of the Excluded Cluster and the Well-off Cluster with Travel Times
Mean Activity Space
Well-off Cluster
Mean Activity Space
Excluded Cluster
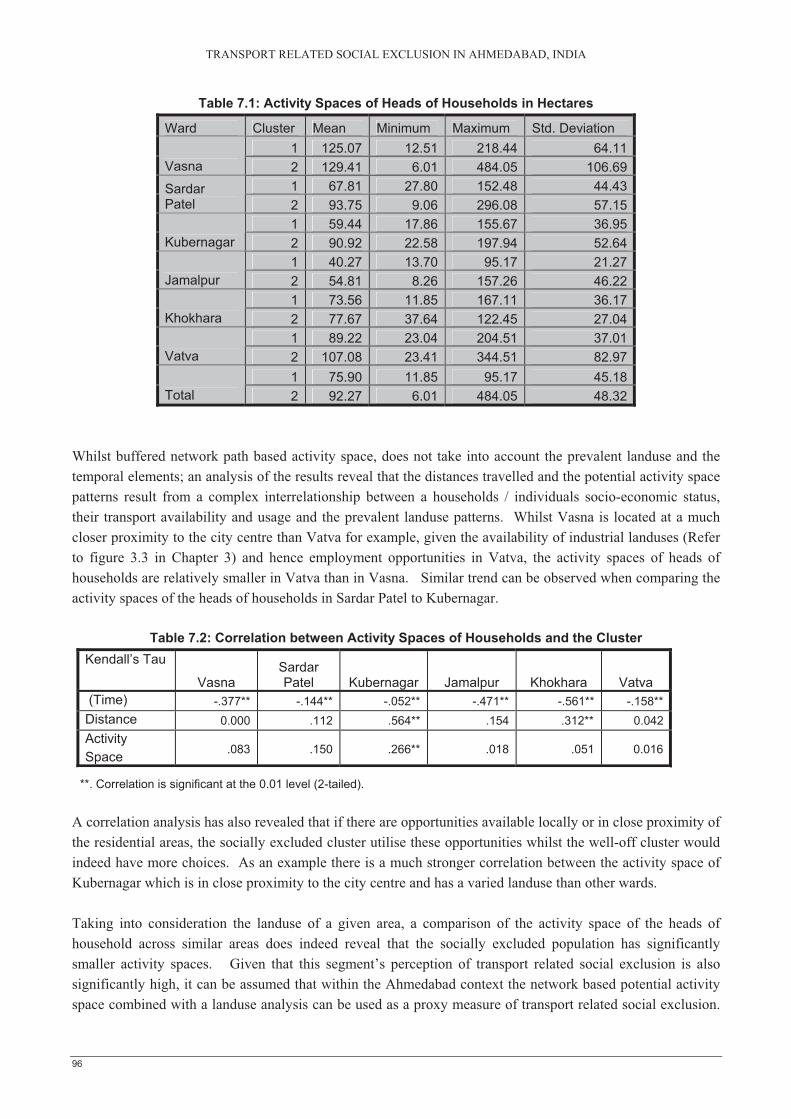
TRANSPORT RELATED SOCIAL EXCLUSION IN AHMEDABAD, INDIA
96
Table 7.1: Activity Spaces of Heads of Households in Hectares
Ward Cluster Mean Minimum Maximum Std. Deviation 1 125.07 12.51 218.44 64.11
Vasna 2 129.41 6.01 484.05 106.691 67.81 27.80 152.48 44.43Sardar
Patel 2 93.75 9.06 296.08 57.151 59.44 17.86 155.67 36.95
Kubernagar 2 90.92 22.58 197.94 52.641 40.27 13.70 95.17 21.27
Jamalpur 2 54.81 8.26 157.26 46.221 73.56 11.85 167.11 36.17
Khokhara 2 77.67 37.64 122.45 27.041 89.22 23.04 204.51 37.01
Vatva 2 107.08 23.41 344.51 82.971 75.90 11.85 95.17 45.18
Total 2 92.27 6.01 484.05 48.32
Whilst buffered network path based activity space, does not take into account the prevalent landuse and the temporal elements; an analysis of the results reveal that the distances travelled and the potential activity space patterns result from a complex interrelationship between a households / individuals socio-economic status, their transport availability and usage and the prevalent landuse patterns. Whilst Vasna is located at a much closer proximity to the city centre than Vatva for example, given the availability of industrial landuses (Refer to figure 3.3 in Chapter 3) and hence employment opportunities in Vatva, the activity spaces of heads of households are relatively smaller in Vatva than in Vasna. Similar trend can be observed when comparing the activity spaces of the heads of households in Sardar Patel to Kubernagar.
Table 7.2: Correlation between Activity Spaces of Households and the Cluster Kendall’s Tau
Vasna Sardar Patel Kubernagar Jamalpur Khokhara Vatva
(Time) -.377** -.144** -.052** -.471** -.561** -.158**Distance 0.000 .112 .564** .154 .312** 0.042Activity Space .083 .150 .266** .018 .051 0.016
**. Correlation is significant at the 0.01 level (2-tailed).
A correlation analysis has also revealed that if there are opportunities available locally or in close proximity of the residential areas, the socially excluded cluster utilise these opportunities whilst the well-off cluster would indeed have more choices. As an example there is a much stronger correlation between the activity space of Kubernagar which is in close proximity to the city centre and has a varied landuse than other wards.
Taking into consideration the landuse of a given area, a comparison of the activity space of the heads of household across similar areas does indeed reveal that the socially excluded population has significantly smaller activity spaces. Given that this segment’s perception of transport related social exclusion is also significantly high, it can be assumed that within the Ahmedabad context the network based potential activity space combined with a landuse analysis can be used as a proxy measure of transport related social exclusion.
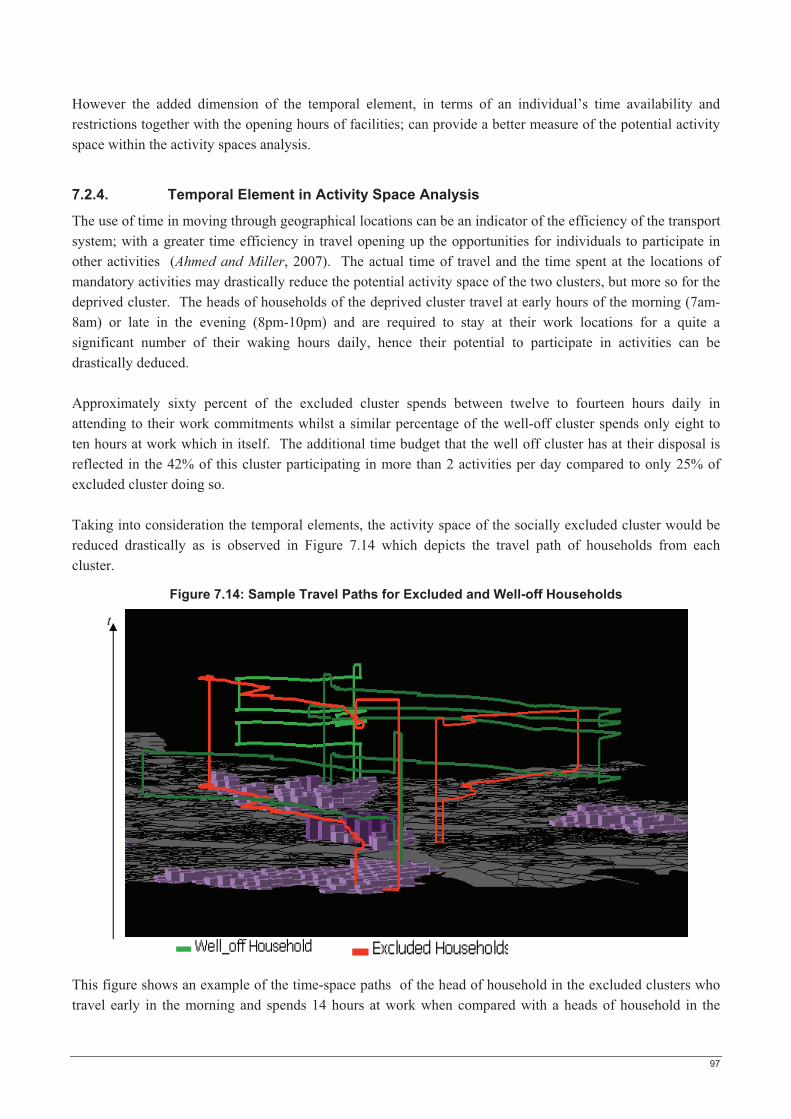
97
However the added dimension of the temporal element, in terms of an individual’s time availability and restrictions together with the opening hours of facilities; can provide a better measure of the potential activity space within the activity spaces analysis.
7.2.4. Temporal Element in Activity Space Analysis
The use of time in moving through geographical locations can be an indicator of the efficiency of the transport system; with a greater time efficiency in travel opening up the opportunities for individuals to participate in other activities (Ahmed and Miller, 2007). The actual time of travel and the time spent at the locations of mandatory activities may drastically reduce the potential activity space of the two clusters, but more so for the deprived cluster. The heads of households of the deprived cluster travel at early hours of the morning (7am-8am) or late in the evening (8pm-10pm) and are required to stay at their work locations for a quite a significant number of their waking hours daily, hence their potential to participate in activities can be drastically deduced.
Approximately sixty percent of the excluded cluster spends between twelve to fourteen hours daily in attending to their work commitments whilst a similar percentage of the well-off cluster spends only eight to ten hours at work which in itself. The additional time budget that the well off cluster has at their disposal is reflected in the 42% of this cluster participating in more than 2 activities per day compared to only 25% of excluded cluster doing so.
Taking into consideration the temporal elements, the activity space of the socially excluded cluster would be reduced drastically as is observed in Figure 7.14 which depicts the travel path of households from each cluster.
Figure 7.14: Sample Travel Paths for Excluded and Well-off Households
This figure shows an example of the time-space paths of the head of household in the excluded clusters who travel early in the morning and spends 14 hours at work when compared with a heads of household in the
t
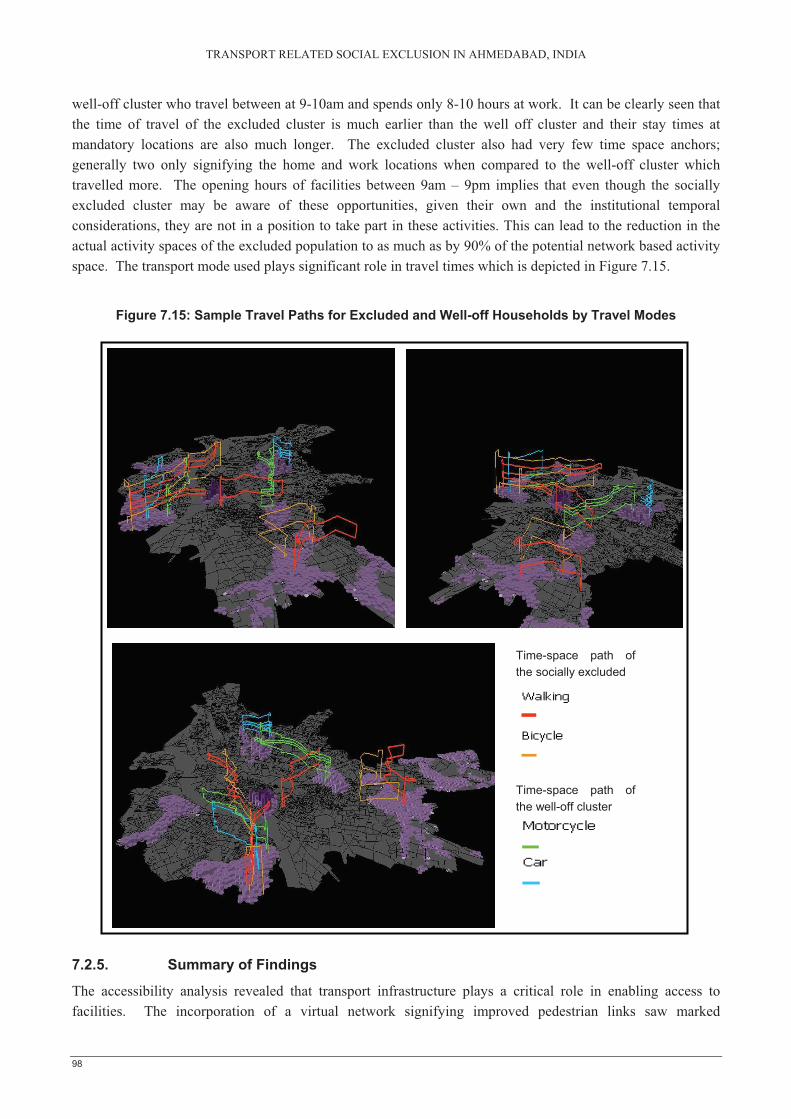
TRANSPORT RELATED SOCIAL EXCLUSION IN AHMEDABAD, INDIA
98
Time-space path of the socially excluded
Time-space path of the well-off cluster
well-off cluster who travel between at 9-10am and spends only 8-10 hours at work. It can be clearly seen that the time of travel of the excluded cluster is much earlier than the well off cluster and their stay times at mandatory locations are also much longer. The excluded cluster also had very few time space anchors; generally two only signifying the home and work locations when compared to the well-off cluster which travelled more. The opening hours of facilities between 9am – 9pm implies that even though the socially excluded cluster may be aware of these opportunities, given their own and the institutional temporal considerations, they are not in a position to take part in these activities. This can lead to the reduction in the actual activity spaces of the excluded population to as much as by 90% of the potential network based activity space. The transport mode used plays significant role in travel times which is depicted in Figure 7.15.
Figure 7.15: Sample Travel Paths for Excluded and Well-off Households by Travel Modes
7.2.5. Summary of Findings
The accessibility analysis revealed that transport infrastructure plays a critical role in enabling access to facilities. The incorporation of a virtual network signifying improved pedestrian links saw marked
99
improvements in travel times to schools. Households’ perception of exclusion was in large determined by the walking distances to schools and bus stops. The households that were located at distances which required more than fifteen minutes walk to educational facilities ranked highly the significance of access to transport in limiting their adequate access to educational facilities. The walking distance to bus stops was not ranked very significant in accessing the public transport system; the network analysis verified that most households were located within walking distances to bus stops.
Activity space analyses have a potential to provide a relative proxy indicator of transport related social exclusion experienced by households. It has been found that at a ward level, the socially excluded households did indeed have a substantially smaller activity space than the well-off cluster. The activity spaces however gradually increased with distances away from the city centre which may not necessarily imply that the households located further away from the city centre have a much greater set of activities for them to participate in. Temporal elements also play a significant role in the potential activity spaces of heads of households, given an individuals time constraints and the institutional temporal constraints manifested in the form of opening and operating hours of facilities. Taking into consideration the temporal elements in an example case, it has been found that an analysis which takes into consideration the temporal elements will have a further reducing effect of the potential activity spaces of the deprived cluster.
7.2.6. Limitations
The incorporation of a dense virtual network which signified the ability to walk around residential blocks may not be realistic to achieve in providing pedestrian infrastructure. However the analysis has shown that there indeed is a need for better pedestrian links to improve the levels of accessibility to services by the excluded population whose main mode of transport is restricted to walking or cycling. Accessibility analysis for example in the walking distances to bus stops provides the spatial proximity to facilities however gives no indications of whether these services to which proximity are being measured are affordable to the affected population.
The activity space analysis was based on a network analysis which calculated the shortest path in ArcGIS. It was assumed that people choose the shortest path based on travel time and distance to their respective destination, however the heads of households may in reality choose other travel routes which would impact their potential activity path. Give the lack of detailed data on the actual opening hours of facilities and a detailed landuse of the study area, the activity space analysis at a ward level did not take into account these two elements which would give exaggerated results particularly for the excluded cluster. Based on previous literature an arbitrary buffer of 100m was chosen as indicating the potential activity space, this analysis could be improved by undertaking participatory mapping exercise to determine the actual spatial extent of an individuals cognitive awareness and collecting data on the distances along a route that people were actually willing to travel to participate in additional activities along the way.
TRANSPORT RELATED SOCIAL EXCLUSION IN AHMEDABAD, INDIA
100
8. Conclusion and Recommendations
This research was undertaken to determine the prevalence of transport related social exclusion in Ahmedabad City; given its developing country context. The main findings of the research are summarised in this section followed by general concluding remarks and recommendations.
8.1. Summary of Findings
The findings from this research can be classified into three sections; theoretical concepts; methodological approaches and the prevalence of transport related social exclusion in the case study area of Ahmedabad, India. The section on theoretical concepts provides an overview of the interrelationship between transport and social exclusion and the forms in which this exclusion can be manifested. Various methodological approaches have been explored to analyse transport related social exclusion; these are summarised in the methodological approaches section. The prevalence of transport related social exclusion looks into the findings on the incidences and significance of transport related social exclusion in Ahmedabad as a whole and for selected study wards in particular, identifies the significance accorded to the various manifestations of exclusion by the households.
8.1.1. Theoretical Concepts
Transport related social exclusion within an urban context is defined not so much as lack of urban resources but as a lack of access to these available services and facilities. Social exclusion as a concept emerged from the world of politics and governance in France during the 1970s and has evolved over time to be incorporated into various discourses of social sciences and has recently been integrated into mainstream urban and transport planning research. Transport related social exclusion results from a complex interaction of individual characteristics of persons and households; the transport and landuse system; temporal elements and urban planning policies. The manifestation of transport related social exclusion are identified as spatial, economic, affordability based, physical exclusion, fear based, time based, infrastructure based and exposure to negative externalities exclusion.
Spatial exclusion arises due to the lack of accessibility to essential facilities in terms of the geographical / spatial reach of individuals rendered by the high costs of transport. In an economic sense, exclusion refers to the inability to be engaged in gainful employment which yields enough income to satisfy basic requirements. The cost of travel is an overwhelming constraint for socially excluded households; which dictates both the method and the extent of their travel. This lack of affordability implies that people simply cannot afford private modes of motorised transports and the fares for public transport required to reach the activities that they need to access. Physical exclusion is defined as poor accessibility to the transport system due to a person’s physical capabilities (e.g. disability of various forms) which can worsen the predicament of the socially excluded. The perception of fear of crime has been identified as one of the major barriers for transport use and access. Temporal exclusion refers to the lack of adequate time for travel given the network constraints and an individuals commitments which require their presence at mandatory locations such as work restricting their time for travel. The socially excluded especially in the developing countries by virtue of their geographical location gain access to the transport system via substandard transport infrastructure and are often disproportionately affected by the negative impacts arising from the access to the transport system such as noise, air pollution and traffic accidents. Given this array of manifestations which results from
101
transport related social exclusion; a single method cannot be employed to adequately measure this phenomenon. The following section provides an overview of some of the methods which were explored to analyse the levels of transport related social exclusion.
8.1.2. Methodological Approaches to Measuring Transport Related Social Exclusion
Transport related social exclusion results from a combination of elements and all these elements need to be incorporated into any analysis of exclusion. To evaluate transport related social exclusion at a city wide ward level an adapted version of the assets / vulnerability approach was espoused. The assets / vulnerability approach to poverty and deprivation is based on the links between assets and vulnerability to explain why people moved in and out of poverty and how they adapted to situations that they found themselves in. This approach has been widely used in poverty and deprivation analysis in developing countries. The adaptations to the assets / vulnerability approach included the addition of two new capitals and their respective indicators; transport and political capital which were deemed mandatory to adequately measure transport related social exclusion. With the utilisation of GIS given its capability of creating composite maps by overlaying various data sets provides a viable means of identifying the levels of exclusion across wards. The assets/ vulnerability approach combined with relevant GIS functions can be used to identify spatial areas at the chosen level of analysis which are most excluded from the various forms of capitals for effective area based policy formulation. However whilst such place-based measures are useful, they are incomplete since they cannot capture the full spectrum of social exclusion and nor can capture individualistic life experience; it thus suffers from the ecological fallacy of applying aggregate measures to individual cases. An alternative measure of transport related social exclusion which can be applied both at an aggregate and local level is accessibility analysis. Accessibility is the ultimate objective of most transport activities and has been widely used to identify and depict areas and population which are considered to be socially excluded due to the combined effect of the transport system and the location of various land uses. Accessibility measures however do not take into consideration the financial barriers and individual physical barriers which limit people from using the transport system. In response to these shortcomings in accessibility analysis, there has been resurgence in the research on the use of time and space at an individual level. Rather than aggregate transport analysis, the focus of space time activity analysis is the individual’s use of time for activities which they undertake in geographical space
An individual’s daily activity routines and transport usage opens up possibilities for them to participate in activities. A greater potential activity space brings with it a much better cognitive spatial awareness of the available opportunities in the urban environment. The shortest path to the activity locations can be calculated based on a given transport network and these paths are buffered by a certain distance to provide the activity space. Whilst activity spaces can provide a relatively good proxy indicator of social exclusion, however a small activity space does not necessarily indicate that an individual/household is socially excluded since a small activity space could be purely by choice with no restrictions on travel. Though many approaches such as confidence ellipses, kernel densities and buffered shortest path network (minimal spanning trees) have been proposed in past researches, only two such methods being the confidence ellipse and the buffered network path were explored in this research and it was concluded that buffered network paths provide a better measure of activity spaces. The buffered network path based activity space however, does not take into account the prevalent landuse and the temporal elements; the incorporation of these two elements into activity space analysis could provide a much better measure of activity spaces.
TRANSPORT RELATED SOCIAL EXCLUSION IN AHMEDABAD, INDIA
102
The various measures such as accessibility and activity space analysis provide means of measuring and depicting transport related social exclusion, improving transport links in areas with high levels of social exclusion based on these assessments is useless if these activities are irrelevant to the people who live in these excluded areas. Analysis of households’ perception of exclusion is integral in conceptualising transport related social exclusion at a local level which helps to identify the factors which hinder adequate access to transport and the implications of inadequate access from the views of the affected population. Household based surveys and / or focus groups provide a means of incorporating the residents’ views of the various manifestations of transport related social exclusion. However every individual and/or household has differential transport needs and their perception of exclusion is often clouded by their individual expectations and unmet needs which need to be realistically verified with actual transport infrastructure and services available within an area. Therefore the incorporation of the combination of these various methods is necessary for the adequately measuring transport related social exclusion in any given context.
8.1.3. Prevalence of Transport Related Social Exclusion in Ahmedabad
This study has revealed that transport related social exclusion is highly prevalent in Ahmedabad and that there is indeed a hierarchy amongst the socially excluded population and the well-off segments in their participation in society based on their unequal access to the transport system. At a city level, through a livelihoods analysis it was observed that wards in the Eastern part of the city scored much higher levels of social exclusion when compared to the wards in the Western part which is reflective of the better service and infrastructure provision in the western wards. The levels of transport exclusion generally increased with increasing distances from the city centre with spatial clustering of highly excluded wards in the East namely Baherampura, Amraiwadi and Saijpurbogh. The overall exclusion level per ward was most strongly correlated with exclusion from transport, human and financial capitals; with Pearson correlations of 0.825; 0.789 and 0.698 respectively. The R2 statistic indicates that the exclusion from transport capital most significantly (68%) explains the variation in the overall exclusion.
Transport capital exclusion is most strongly correlated with financial and physical capitals with Pearson correlation of 0.788 and 0.593 respectively. A lack of financial capital can explain 62% of exclusion from transport capital, whilst a lack of physical capital can explain 35% of exclusion from transport capital. Income hence affordability plays a strong role in transport exclusion with those households who live on low income and in inadequate housing being excluded from adequate transport access. The wards which have a higher percentage of income and physical capital excluded households are also likely to be lacking in transport infrastructure with households relying predominantly on the use of non-motorised transport. Given the strong correlation between transport capital and overall exclusion levels, it can be safely said that policy interventions aimed at providing better transport access could have much significant positive impacts in the reduction of the high exclusion levels experienced in the affected wards of Ahmedabad. However an analysis of the levels and types of infrastructure and service improvements required would need to incorporate the views and perceptions of the affected populations.
An analysis into the differential perception of transport related social exclusion was based on the classification of the households into two distinct clusters; the socially excluded cluster and the well of cluster which was dependent upon various socio-economic variables such as income, housing typology, asset base etc. The socially excluded households experienced much greater degrees of transport related social exclusion when compared to the well-off segments. Slums, chawls and government quarters were identified as
103
concentrations of transport related social exclusion as the people living in these areas were not only economically poor but they also lacked access to essential services and facilities which reduced their level of participation in the normal Ahmedabad life. Distinct differences could be identified in the transport access and use for the two different clusters of households. The socially excluded cluster primarily due to their inability to afford motorised modes of transport relied heavily on non-motorised modes such as walking and cycling. The lack of priority given to these two modes within the Ahmedabad transport system meant that these mode users lacked adequate infrastructure to facilitate their access and were susceptible to negative externalities such as accidents and exposure to high levels of pollution. The most important elements which influence the level of transport access amongst the excluded households were identified as affordability, the frequency of public transport and the priority in the usage of transport infrastructure. This has significant implications on the level of access and participation in essential activities such as employment, education and shopping access. The accessibility analysis to educational facilities was undertaken to verify peoples perception to exclusion and to determine the role that transport plays in enabling access to services and facilities. The perception of exclusion relating to the role that transport played in providing access to educational facilities was strongly correlated with travel distances and hence travel times. The role of transport infrastructure in access to facilities was explored through the incorporation of the artificial network which saw the reduction of travel times dramatically across all wards and in particular the wards in the outskirts of the city.
A comparison of the activity space of the heads of household across similar areas does indeed reveal that the socially excluded population had significantly smaller activity spaces. Given that this segment’s perception of transport related social exclusion is also significantly high, it can be assumed that within the Ahmedabad context the network based potential activity space combined with a landuse analysis can be used as a proxy measure of transport related social exclusion. However the added dimension of the temporal element, in terms of an individual’s time availability and restrictions together with the opening hours of facilities; can provide an even better measure of the potential activity space within the space-time activity analysis methodology.
8.2. Concluding Remarks
Transport related social exclusion was conceptualised as field of urban policy reform and research within the United Kingdom which has readily been incorporated into the urban planning and policy research in many developed countries. However given the emphasis on poverty lines which is calculated through an econometric approach based on the purchasing power of a basket of goods as a measure of income poverty, India as is the case with many developing countries is failing to recognise and address the many forms of exclusion which segments of the population are susceptible to. Transport related social exclusion analysis given its focus on participation in society can be adopted as a better measure of the relative levels of the many difficulties that certain individuals / households suffer from in their daily access to services and facilities which restricts their ability to affectively participate in a given society.
The socially excluded populations in developed country are as susceptible to transport related social exclusion if not more so than the excluded populations in the developed countries. Therefore many of the developing countries would need to adopt research in this field in order to be able to effectively formulate policies to ensure that the transport system does not continue to be a hindrance to people’s access to services and facilities. Inadequate access to transport not only affects the ability of individuals to participate in activities, if
TRANSPORT RELATED SOCIAL EXCLUSION IN AHMEDABAD, INDIA
104
not addressed adequately it has the potential of undermining policies relating to the provision of essential services where even if these services are adequately provided, if people are unable to afford the transport costs required to access these services, they are less likely to use them. Therefore it is mandatory that developing countries expand their analysis into poverty and exclusion to incorporate other elements such as an analysis into transport related social exclusion to better identify the causes and possible remedies for segments of the population being excluded from effectively participating in the society. For any analysis into transport related social exclusion, GIS based assets/ vulnerability approach with appropriately identified locally relevant indictors should provide a reasonable approach to identify the manifestations and contributing factors of transport related exclusion for an area based policy. However to avoid providing services and facilities which are not required or is not relevant to all segments of the population an analysis of peoples perception of exclusion combined with this perception based accessibility analysis can provide a wholesome measure of transport related social exclusion for effective policy formulation.
8.3. Urban Policy Recommendations
Transport related social exclusion results from the combination of inadequate transport provision; urban policies which dictate the siting of landuse and the form that an urban area takes; the individual characteristics of affected populations as well as temporal elements. The following recommendations are proposed to address the high levels of transport related social exclusion in Ahmedabad and where applicable in other developing countries.
1. Transport Infrastructure and Service Provision
• There is a clear need for more proactive transport planning in Ahmedabad which looks at enabling better accessibility to all segments of the population. Priority areas for service provision can be identified though accessibility analysis and the formulations of accessibility plans and strategies accordingly. An example of a well developed accessibility strategy which has been cited in literature is the Merseyside accessibility strategy and action plan (Church et al., 2000; The Merseyside Transport Partnership, 2006). Such plans with local adaptations can assist in better planning to reduce the high levels of social exclusion and by increasing the levels of accessibility to required services.
• Given the reliance of the socially excluded population on non-motorised transport, adequate pedestrian and cyclist networks need to be provided to ensure timely and safe travel. Better pedestrian links can improve the accessibility to a number of facilities such as education, health and shopping.
• The excluded population were not willing to change their travel modes to public transport since even with major travel concessions they may not be a position to afford mass transit both in terms of time and money. This requires the exploration of more innovative means to ease the burden of participating in the society and workforce rather than focusing on the standard transport provision. An example of this is the Scottish Transport to Employment initiative (T2E) which specifically targets and provides shared transport to work for residents of excluded communities (Centre for Transport Research, 2007). Generally socially excluded population in Ahmedabad are concentrated in specific residential areas and are employed in industrial areas, therefore it may be feasible to look into specific innovative ways of providing transport services which eases the burden of walking and / or cycling in unsafe environments for tedious hours for mandatory activities such as employment
105
2. Urban Planning Policies and Regulations • Urban planning regulations dictate the density of urban development and the type of landuses that
occur within a city. The planning policies in relation to building densities need to be critically examined to ensure that the low FSI’s do not encourage urban sprawl to such an extent that there are major drawbacks in the provision of necessary urban facilities and services.
• There is a need for more integrated urban development which encourages mixed use development so that people do not need to travel massive distances of 10-20 km daily to access for example employment opportunities. In terms of integrated urban policies which take into account the integrated landuse and transport system, the Dutch ABC policy which encourages development along transport nodes serves as a good example (European Academy of the Urban Environment, 1998).
8.4. Recommendations for Further Studies
Further to this research, the following recommendations relate to the possible directions of any further studies in transport related social exclusion:
• A detailed accessibility analysis with indicators developed in conjunction with a participatory mapping approach which identifies the essential services and facilities which the socially excluded households require access to and hence identifies households which are out of the spatial reach of activities.
• A detailed study into the role that urban form plays on the levels of transport related social exclusion. This study has highlighted that the urban form is crucial in the conceptualisation of transport related exclusion, however a detailed study can identify the elements of the urban form which actually hinder participation in society
• This research had very briefly explored the utilisation of space time activity analysis as a proxy indicator for transport related social exclusion. The relevance and extended methodological approaches of space time activity measures can be further explored within social exclusion studies.
TRANSPORT RELATED SOCIAL EXCLUSION IN AHMEDABAD, INDIA
106
9. Glossary
Accessibility – the ease with which people can reach their destinations through their choice of based on the transport and current land use system.
Chawls – the low income housing constructed by mill workers to initially house their workers which have deteriorated over time (Kundu and Mahadevia, 2002). Most of the chawls lack basic amenities and are generally grouped together with slums for the provision of essential services in the Ahmedabad city.
Dutch ABC Policy – The Dutch ABC planning policy was introduced in 1989 and laid the procedures for drawing up the procedural plans with a focus on compact city. It distinguishes three categories of locations; A which have excellent public transport provision but poor car accessibility; type B locations have good public and car accessibility whilst category C has poor public transport but good car accessibility. Development which required better public access such as offices and shopping centres were encouraged in locations A, whilst couriers and other industries were located in zone C which was predominantly located in the outskirts of the city (European Academy of the Urban Environment, 1998)
Generalised cost of transport – the monetary (e.g. fares, fuel) and non-monetary costs (e.g. time) of travel
Ped – sheds – acceptable walking distances as applied in planning literature; the norm is a 5- 10 minutes walk covering a distance of 400 – 800m
Permanent House - Houses with wall and roof made of permanent materials. Wall can be G. I., Metal, Asbestos sheets, Burnt bricks, Stone or Concrete. Roof can be made of Tiles, Slate, G. I., Metal, Asbestos sheets, Brick, Stone or Concrete.
Semi Permanent House - Either wall or roof is made of permanent material (and the other having been made of temporary material).
Slums - Compact areas of poorly built and serviced congested tenements in unhygienic environment which lack adequate infrastructure inclusive of water and sanitary services; and house more than 300 people or about 60-70 households
Social Exclusion – term which is used to describe situations where people are unable to participate in activities which are considered normal in a particular society
Temporary House - Houses with wall and roof made of temporary material. Wall can be made of Grass, Thatch, Bamboo etc., Plastic, Polythene, Mud, Unburnt brick or wood. Roof can be made of Grass, Thatch, Bamboo, Wood, Mud, Plastic or Polythene (Registrar General & Census Commissioner India, 2001b).
Transport Related Social Exclusion – a lack of access to essential activities that people need such as employment, health, education etc to participate fully in society due to the prevalent transport system and/or their inability to utilise it
107
Transport System – consists of the modes and infrastructure of transport which facilitates the movement of people and goods.
Urban fabric - The generic term for the physical aspect of urbanism, emphasizing building types, thoroughfares, open space, frontages, and streetscapes; while excluding without prejudice to this useful term, environmental, functional, economic and socio-cultural aspects The urban fabric, like urban structures and spaces, also embodies the concept of continuity, in contrast to built form which could easily be regarded as being a collection of free-standing objects (Marshall, 1998; Parole.Aporee.Org.)
TRANSPORT RELATED SOCIAL EXCLUSION IN AHMEDABAD, INDIA
108
10. References
Ahmed, N., and H. J. Miller (2007), Time-space transformations of geographic space for exploring, analyzing and visualizing transportation systems, Journal of Transport Geography, 15(1), 2-17.
Ahmed, Q. I., H. Lu, and S. Ye (2008), Urban transportation and equity: A case study of Beijing and Karachi, Transportation Research Part A: Policy and Practice, 42(1), 125-139.
Ahmedabad Municipal Corporation, and Ahmedabad Urban Development Authority, (2006), Jawaharlal Nehru National Urban Renewal Mission; City Development Plan Ahmedabad 2006-2012, http://www.egovamc.com/cdp/AMC_CDP.pdf, Accessed on: 15th August,2008
Ahmedabad Municipal Corporation, (2007), Statistical Outline, AMC http://www.egovamc.com/amc_budget/outline0506/outlline.htm, Accessed on: 19th August,2008
Ahmedabad Urban Development Authority (2007), Ahmedabad Urban Development Area Part III General Development Control Regulations, AUDA, Ahmedabad.
Amer, S., H. F. L. P. Ottens, and T. P. De Jong (2007), Towards Spatial Justice in Urban Health Services Planning: A Spatial - Analytic GIS - Based Approach Using Dar Es Salaam, Tanzania as a Case Study, 299 pp, Utrecht University, Utrecht.
Angel, S., S. C. Sheppard, D. L. Civco, R. Buckley, A. Chabaeva, L. Gitlin, A. Kraley, J. Parent, and M. Perlin, (2005), The Dynamics of Global Urban Expansion, The World Bank, Transport and Urban Development Department http://www.citiesalliance.org/doc/resources/upgrading/urban-expansion/worldbankreportsept2005.pdf, Accessed on: 6th August 2008
Badami, M. G., and M. Haider (2007), An analysis of public bus transit performance in Indian cities, Transportation Research Part A: Policy and Practice, 41(10), 961-981.
Banerjee, P., S. B. R. Chaudhary, and S. K. Das (2005), Internal Displacement in South Asia, SAGE.
Banister, D. (2008), The Sustainable Mobility Paradigm, Transport Policy, 15(2), 73-80.
Baron, S., J. Field, and T. Schuller (2000), Social Capital: Critical Perspectives, Oxford University Press, Oxford.
Baud, I., N. Sridharan, and K. Pfeffer (2008), Mapping Urban Poverty for Local Governance in an Indian Mega-City: The Case of Delhi, Urban Studies, 45, 1385 - 1412.
Bevelander, P., and R. Pendakur, (2008), Electoral Participation as a Measure of Social Inclusion for Natives, Immigrants and Descendants in Sweden; Discussion Paper No. 3764, The Institute for the Study of Labor (IZA) http://ftp.iza.org/dp3764.pdf, Accessed on: 7th January,2008
Bhalla, A., and F. Lapeyre (2002), Social Exclusion: Towards an Analytical and Operational Framework Development and Change, 28(3), 413 - 433
Borsdorf, A., and R. Hidalgo (2008), New Dimensions of Social Exclusion in Latin America: From Gated Communities to Gated Cities, the Case of Santiago De Chile, Land Use Policy, 25(2), 153-160.
Breman, J., (2004), Social Exclusion in the Context of Globalization, , ILO Working Paper No. 18, Social Science Research Network (SSRN) http://ssrn.com/paper=908164 Accessed on: 28th May,2008
109
Brown, A., and T. Lloyd-Jones (2002), Spatial Planning, Access and Infrastructure, in Urban Livelihoods: A People Centred Approach to Reducing Poverty, edited by Carole Rakodi and T. Lloyd-Jones, EarthScan Publications Limited, London.
Bryne, D. (2005), Social Exclusion, Second Edition Refine Catch Limited, Suffolk.
Buliung, R. N., and P. S. Kanaroglou (2006), A GIS toolkit for exploring geographies of household activity/travel behavior, Journal of Transport Geography, 14(1), 35-51.
Burchardt, T., J. L. Grand, and D. Piachaud (2002), Degrees of Exclusion: Developing a Dynamic, Multidimensional Measure, in Understanding Social Exclusion, edited by J. Hills, et al., Oxford University Press, Oxford.
Cabinet Office, (2008), Social Exclusion Task Force, http://www.cabinetoffice.gov.uk/social_exclusion_task_force.aspx, Accessed on: 17th August 2008
Cairns, S., J. Greig, and M. Wachs (2003), Environmental Justice & Transportation : A Citizens Handbook,
University of California, Berkeley.
Câmara, G., A. M. Monteiro, F. R. Ramos, A. Sposati, and D. Koga, (2001), Mapping Social Exclusion/Inclusion in Developing Countries: Social Dynamics of São Paulo in the 1990s, http://www.dpi.inpe.br/gilberto/papers/saopaulo_csiss.pdf, Accessed on: 24 July 2008
Cass, N., E. Shove, and J. Urry, (2005), Social Exclusion, Mobility and Access,
http://uit.no/getfile.php?PageId=5468&FileId=6, Accessed on: 12th August 2008 Central Pollution Control Board, (2006), The Noise Pollution (Regulation And Control) Rules, Central
Pollution Control Board http://www.cpcb.nic.in/divisionsofheadoffice/pci2/noise_rules_2000.pdf, Accessed on: 5th February 2009
Centre for Transport Research, (2007), Transport to Employment http://www.abdn.ac.uk/ctr/projects/t2e,
Accessed on: 27th January 2009 Chapin, F. S. (1974), Human Activity Patterns in the City: Things People Do in Time and in Space, 272 pp.,
Wiley & Sons, New York etc.
Church, A., M. Frost, and K. Sullivan (2000), Transport and Social Exclusion in London, Transport Policy, 7(3), 195-205.
Communities and Local Government, (2004), The English Indices of Deprivation 2004: Summary (revised), http://www.communities.gov.uk/documents/communities/pdf/131206.pdf, Accessed on: 29 July 2008
Cork City Council, (2005), City of Difference: Mapping Social Exclusion in Cork, Cork City Council http://www.corkcity.ie/ourservices/communityenterprise/socialinclusionunit/#d.en.3089, Accessed on: 15th August 2008
Council of the European Union, and The European Commission, (2004), Joint Report by the Commission and the Council on Social Inclusion, http://ec.europa.eu/employment_social/soc-prot/soc-incl/final_joint_inclusion_report_2003_en.pdf, Accessed on: 15th August 2008
De Boer, E. (Ed.) (1986), Transport Sociology ; Social Aspects of Transport Planning, 235 pp., Pergamon,
Oxford.

TRANSPORT RELATED SOCIAL EXCLUSION IN AHMEDABAD, INDIA
110
Department of Road Transport and Highways, (2006), National Road Transport Policy, http://morth.nic.in/writereaddata/sublinkimages/Road_Transport_Policy27333191.pdf, Accessed on: 5th February 2009
Dobbs, L. (2005), Wedded To the Car: Women, Employment and the Importance of Private Transport,
Transport Policy, 12(3), 266-278.
Doorman, F. (1998), Global Development: Problems, Solutions and Strategy. A proposal for socially just, ecologically sustainable growth. , Jan van Arkel International Books Utrecht.
Dutta, S. S. (2000), Partnerships In Urban Development: A Review Of Ahmedabad’s Experience, Environment and Urbanization, 12(13-26)14th December 2008
European Academy of the Urban Environment, (1998), Utrecht: 'ABC' Planning As A Planning Instrument In Urban Transport Policy, http://www.eaue.de/winuwd/131.HTM, Accessed on: 10th November 2008,2008
European Environment Agency (EEA), (2000), Are We Moving in the Right Direction? Indicators on Transport and Environmental Integration in the EU: TERM 2000., European Environment Agency (EEA), http://www.eea.europa.eu/publications/ENVISSUENo12/page009.html, Accessed on: 6th February,2009
Fahmy, E. (2003), Civic Capacity, Social Exclusion & Political Participation in Britain: Evidence from the
1999 Poverty & Social Exclusion Survey, paper presented at Political Studies Association Annual Conference, University of Leicester, 15th-17th April 2003.
Geurs, K. T., and B. Van Wee (2004), Accessibility evaluation of land-use and transport strategies: review and research directions, Journal of Transport Geography, 12(2), 127-140.
Geurs, K. T. (2006), Accessibility, Land Use And Transport : Accessibility Evaluation Of Land - Use And Transport Developments And Policy Strategies; Bereikbaarheid, ruimte en verkeer : evaluatie van bereikbaarheidseffecten van ruimtelijk - infrastructurele ontwikkelingen en beleid, 245 pp., Eburon, Delft.
Goulias, K. G. (Ed.) (2003), Transportation systems planning : methods and applications, 365 pp., CRS, Boca Raton.
Government of India, (2007), Poverty Estimates for 2004-05, http://www.planningcommission.gov.in/news/prmar07.pdf, Accessed on: 12th December,2008
Grayling, T. (Ed.) (2001), Any More Fares? Delivering Better Bus Services, Institute for Public Policy
Research, London.
Greenwich2000.Ltd.Uk (2008), Location Map of Ahmedabad, India, http://wwp.greenwichmeantime.com/time-zone/asia/india/ahmedabad/map.htm, Accessed on: 21st August 2008
Gujarat Infrastructure Development Board (Gidb), Ahmedabad Municipal Corporation (AMC), Ahmedabad
Urban Development Authority (AUDA), and Centre for Environmental Planning & Technology University (2006), Bus Rapid Transit System Ahmedabad, Ahmedabad.
Gujarat State Government, (1988), Gujarat State Urban Slum Policy Draft Policy, City Managers' Association Gujarat http://www.cmag-india.com/download/Final%20Draft%20GSUSP.pdf, Accessed on: 23rd December,2008
111
Haan, A. D., (1999), Social Exclusion: Towards An Holistic Understanding Of Deprivation, http://www.dfid.gov.uk/pubs/files/sdd9socex.pdf, Accessed on: 6th August,2008
Haan, A. D., (2004), Conceptualising Social Exclusion in the Context of India’s Poorest Regions: A
Contribution to the Quantitative-Qualitative Debate, http://www.utoronto.ca/mcis/q2/papers/II_deHann_Dubey_Qual-Quant-AdH-21m.pdf, Accessed on: 6th August 2008
Hine, J. (2003), Social Exclusion and Transport Systems, Transport Policy, 10(4), 263-263.
Hodgson, F. C., and J. Turner (2003), Participation Not Consumption: The Need for New Participatory Practices to Address Transport and Social Exclusion, Transport Policy, 10(4), 265-272.
Hook, W. (2006), Facing the Environmental Challenge: Urban Transportation and the Millennium Development Goals, Global Urban Development Magazine, 2(1), http://www.globalurban.org/GUDMag06Vol2Iss1/Hook.htm.6 August 2008
Hoyle, B. S. E., and R. D. E. Knowles (1992), Modern transport geography, 276 pp., Belhaven, London etc.
Jakovljevic, B., K. Paunovic, and G. Belojevic Road-traffic noise and factors influencing noise annoyance in an urban population, Environment International, In Press, Corrected Proof.
Jamet, S. (2007), Combating Poverty and Social Exclusion in France, in OECD Economics Department Working Papers, No. 569, edited, OECD Publishing.
John, P., and P. Shastri, (2008), Ahmedabad: Accident Prone Roads, http://citizensalliance.wordpress.com/2008/11/23/ahmedabad-accident-prone-roads/, Accessed on: 4th February 2009,2009
Joshi, P., S. Sen, and J. Hobson (2002), Experiences with surveying and mapping Pune and Sangli slums on a
geographical information system (GIS), Environment and Urbanization, 14(2), 225-240
King, R., and T. Grayling (2001), Bus Services and Social Inclusion, in Any More Fares? Delivering Better Bus Services, edited by T. Grayling, Institute for Public Policy Research, London.
Kundu, A., and D. Mahadevia (Eds.) (2002), Poverty and Vulnerability in a Globalising Metropolis, Ahmedabad, Manak Publications, New Delhi.
Lavalette, M., and A. Pratt (2005), Social Policy: Theories, Concepts and Issues, Third ed., SAGE, London.
Litman, T., (2008), Transportation Affordability Evaluation and Improvement Strategies, Victoria Transport Policy Institute http://www.vtpi.org/affordability.pdf, Accessed on: 12th November,2008
Lucas, K. (Ed.) (2004), Running on Empty; Transport, Social Exclusion and Environmental Justice, The
Policy Press, University of Bristol, Bristol.
Lyons, G. (2003), The Introduction of Social Exclusion into the Field of Travel Behaviour, Transport Policy, 10(4), 339-342.
Machin, J. (2004), Integrating Crime and Fear of Crime Initiatives With Transport and Accessibility Improvements in Deprived Areas in the UK, paper presented at European Transport Conference Strasbourg, France, 04/10/2004 – 06/10/2005.

TRANSPORT RELATED SOCIAL EXCLUSION IN AHMEDABAD, INDIA
112
Maddison, D., O. Johansson, D. Pearce, E. Calthrop, and T. L. E. Verhoef (1996), Blueprint 5: True Costs of Road Transport, Earthscan Publishing Limited, London.
Mahila Housing Sewa Trust (2008), Urban Poverty Reduction for the City of Ahmedabad, SEWA, Ahmedabad.
Marshall, S., (1998), Defining the Dimensions of Urban Design, http://www.bartlett.ucl.ac.uk/research/marshall/publication2.htm, Accessed on: 16th August 2008
Mcdonagh, J. (2006), Transport Policy Instruments and Transport-Related Social Exclusion in Rural Republic
of Ireland, Journal of Transport Geography, 14(5), 355-366.
Miller, H. J., (2004), Travel Chances and Social Exclusion, http://www.geog.utah.edu/~hmiller/papers/travel_exclusion.pdf, Accessed on: 23 July 2008
Mitlin, D., D. Sattterthwaite, and C. Stephens (1996), City Inequality Environment and Urbanization, 8(2), 3-
7.
Mitlin, D. (2005), Chronic Poverty in Urban Areas, Editorial, Environment and Urbanization, 17(3-10)
Mohan, D. (2001), Planning for Public Transport: Integrating Safety, Environment and Economic Issues, paper presented at Workshop on Transport, Land Use and the Environment, Pune, India.
Moser, C. O. N. (1998), Reassessing urban poverty reduction strategies: The asset vulnerability framework, World Development, 26(1), 1-19, http://www.tessproject.com/products/seminars&training/seminar%20series/Assets_Materials/Reassessing_Urban_Poverty_Reduction_Strategies.pdf.6th January 2009
National Institute of Occupational Health (2000), A Report on Air Pollution due to Vehicular Traffic in Designated Cities/Towns of the Gujarat State and Evaluation of Health Status of School Children Studying nearby Traffic Junctions in Cities Identified by the Honorable High Court, National Institute of Occupational Health, Ahmedabad.
Nayak, P., (1995), Economic Development and Social Exclusion in India, International Institute for Labour Studies, International Labour Organisation http://www.ilo.org/public/english/bureau/inst/papers/1994/dp77/ch2.htm, Accessed on: 10th December,2008
Noble, M., D. Mclennan, K. W. Whitworth, and H. Barnes, (2008), The English Indices of Deprivation 2007, Department for Communities and Local Government http://www.communities.gov.uk/corporate/, Accessed on: 6th January 2008
Office of the Registrar General & Census Commissioner India, (2007), Basic Data Sheet District Ahmedabad
(07), Gujarat (24), http://censusindia.gov.in/Dist_File/datasheet-2407.pdf, Accessed on: 2nd January 2009
Palmer, G., T. Macinnes, and P. Kenway, (2006), Monitoring Poverty and Social Exclusion in Scotland 2006,
The Joseph Rowntree Foundation www.jrf.org.uk, Accessed on: 6th January 2008 Parker, B., and V. Kozel (2007), Understanding Poverty and Vulnerability in India's Uttar Pradesh and Bihar:
A Q-squared Approach, World Development, 35(2), 296-311.
Parole.Aporee.Org., (unknown), Urban Fabric Definition, http://parole.aporee.org/work/hier.php3?spec_id=6718&words_id=504, Accessed on: 17th August 2008
113
Patel, P. B. (2008), Parking Issues and Possible Solutions for Residential Buildings - Ahmedabad a Case
Study., 114 pp, CEPT, Ahmedabad.
Pennycook, F., R. Barrington-Craggs, D. Smith, and S. Bullock, (2001), Environmental Justice: Mapping Transport and Social Exclusion in Bradford, Friends of the Earth http://www.foe.co.uk/resource/reports/env_justice_bradford.pdf, Accessed on: 9th August,2008
Piachaud, D. (2002), Capital and the Determinants of Poverty and Social Exclusion, Centre for Analysis of
Social Exclusion London School of Economics, London.
Power, A., and W. J. Wilson (2000), Social Exclusion and the Future of Cities, Center for Analysis of Social Exclusion, London School of Economics, London
Preston, J., and F. Rajé (2007), Accessibility, Mobility and Transport-Related Social Exclusion, Journal of Transport Geography, 15(3), 151-160.
Rakodi, C., and T. Lloyd-Jones (Eds.) (2002), Urban Livelihoods: A people Centered Approach to Reducing Poverty, Earthscan Publications Limited, London.
Registrar General & Census Commissioner India, (2001a), Census of India 2001: Metadata and Brief Highlights on Slum Population, http://www.censusindia.gov.in/Data_Products/Data_Highlights/Data_Highlights_link/metadata_highlights.pdf, Accessed on: 10th December 2008
Registrar General & Census Commissioner India, (2001b), Census of India- about Housing data and data on
amenities, http://www.censusindia.gov.in/, Accessed on: 10th December 2008 Root, A. (Ed.) (2003), Delivering Sustainable Transport: A Social Science Perspective, Pergamon,
Amsterdam.
Saith, R., (2001), Social Exclusion: the Concept and Application to Developing Countries, http://www3.qeh.ox.ac.uk/RePEc/qeh/qehwps/qehwps72.pdf, Accessed on: 6th August,2008
Schönfelder, S., and K. W. Axhausen (2003), Activity Spaces: Measures of Social Exclusion?, Transport
Policy, 10(4), 273-286.
Sharifi, M. A., M. Van Herwijnen, and W. H. Van Den Toorn (2007), Spatial Decision Support Systems, 234 pp, ITC, Enschede.
Silver, H., and S. M. Miller (2003), Social Exclusion: The European Approach to Social Disadvantage, Indicator, 2(2, Spring 2003), 5-21, http://www.brown.edu/Departments/Sociology/faculty/hsilver/documents/silver_and_miller-european_approach_to_social_disadvantage.pdf.10th December 2008
Singapore Urban Redevelopment Authority, (2008), Development Control Parameters For Residential Development, http://www.ura.gov.sg/circulars/text/dcdrhb_d0e4.htm, Accessed on: 10th December,2008
Swaminathan, M. (1995), Aspects of urban poverty in Bombay, Environment and Urbanization, 7(1), 133-
144, http://eau.sagepub.com/cgi/content/abstract/7/1/133.14th December 2008
TRANSPORT RELATED SOCIAL EXCLUSION IN AHMEDABAD, INDIA
114
The European Commission, (2008), Europa : Activities of the European Union, Summaries of Legislation. The Amsterdam Treaty, http://europa.eu/scadplus/leg/en/lvb/a14000.htm, Accessed on: 10th December,2008
The Merseyside Transport Partnership, (2006), Accessibility Strategy Summary and 2006/07 Action Plan,
http://www.transportmerseyside.org/ltp/accessibility-strategy.html, Accessed on: 14th February,2009 Tunstall, R., and R. Lupton (2003), Is Targeting Deprived Areas An Effective Means to Reach Poor People?
An Assessment of One Rationale for Area Based Funding Programmes, Centre for Analysis of Social Exclusion, London.
Un - Habitat, (2006), State of the World's Cities 2006/7, http://www.unhabitat.org/documents/media_centre/sowcr2006/SOWCR%204.pdf, Accessed on: 6th August,2008
United Nations Department of Economic and Social Affairs; Population Division, (2005), Population
Challenges and Development Goals, United Nations http://www.un.org/esa/population/publications/pop_challenges/Population_Challenges.pdf, Accessed on: 6th August,2008
United Nations Department of Economic and Social Affairs; Population Division, (2006), World
Urbanization Prospects - The 2005 Revision, Working Paper No. ESA/P/WP/200, United Nations http://www.un.org/esa/population/publications/WUP2005/2005WUP_FS5.pdf, Accessed on: 6th August,2008
United Nations Human Settlements Programme (2003), The Challenge of Slums: Global Report on Human
Settlements 2003, 310 pp., Earthscan, London.
United States Department of Transportation, (2000), An Overview of Transportation and Environmental Justice, http://www.fhwa.dot.gov/environment/ej2000.htm, Accessed on: 26th December,2008
Urbact Secretariat, (2008), European Programme for Urban Sustainable Development,
http://urbact.eu/thematic-poles/social-inclusion/pole-presentation.html, Accessed on: 15th August 2008
Urban Development and Urban Housing Department, (2008), Urban Housing: Gujarat Housing Board,
http://www.udd.gujarat.gov.in/udd/urb_hou.htm, Accessed on: 11th Janurary,2009
Vasconcellos, E. A. (2001), Urban Transport, Environment and Equity : The Case for Developing Countries, EarthScan Publications Limited, London.
Vranken, J. (2001), No social cohesion without social exclusion?, Eurex Lecture Notes, edited, University of Antwerpen.
Vuchic, V. R. (2005), Urban Transit: Operations, Planning and Economics, John Wiley & Sons, Inc., New Jersey.
Zuidgeest, M. H. P. (2005), Sustainable Urban Transport Development: A Dynamic Optimisation Approach, 290 pp, University of Twente, Enschede.
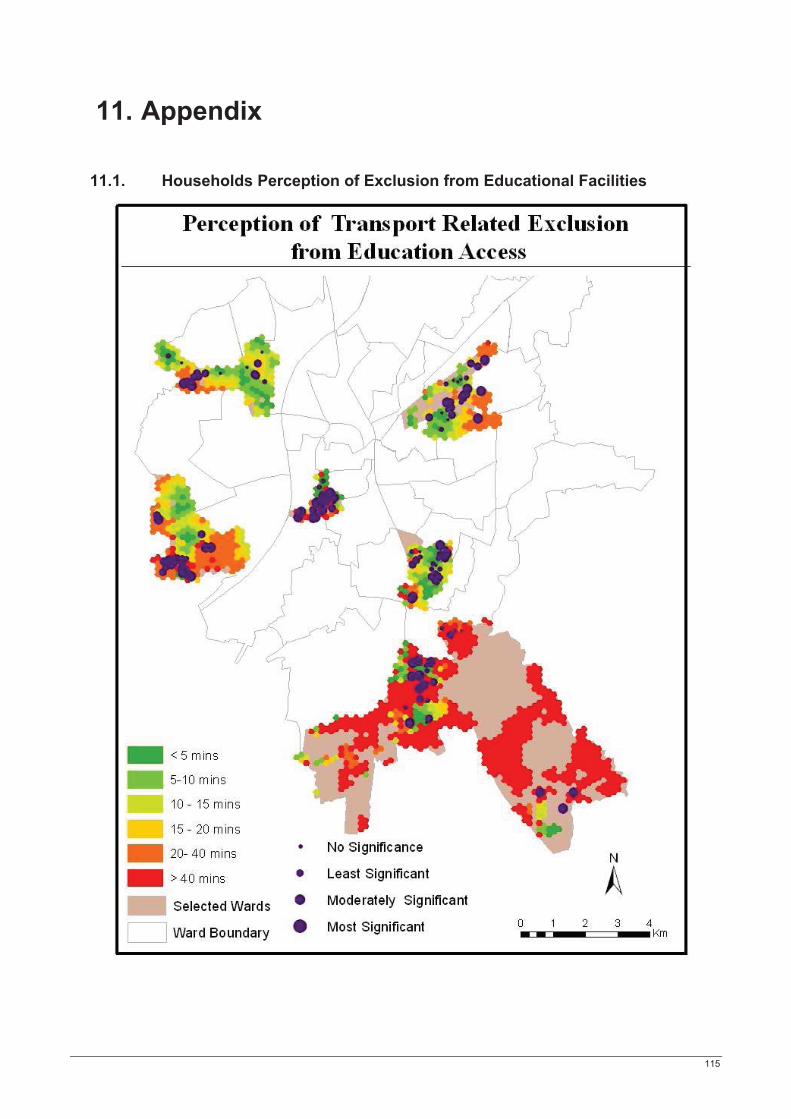
115
11. Appendix
11.1. Households Perception of Exclusion from Educational Facilities
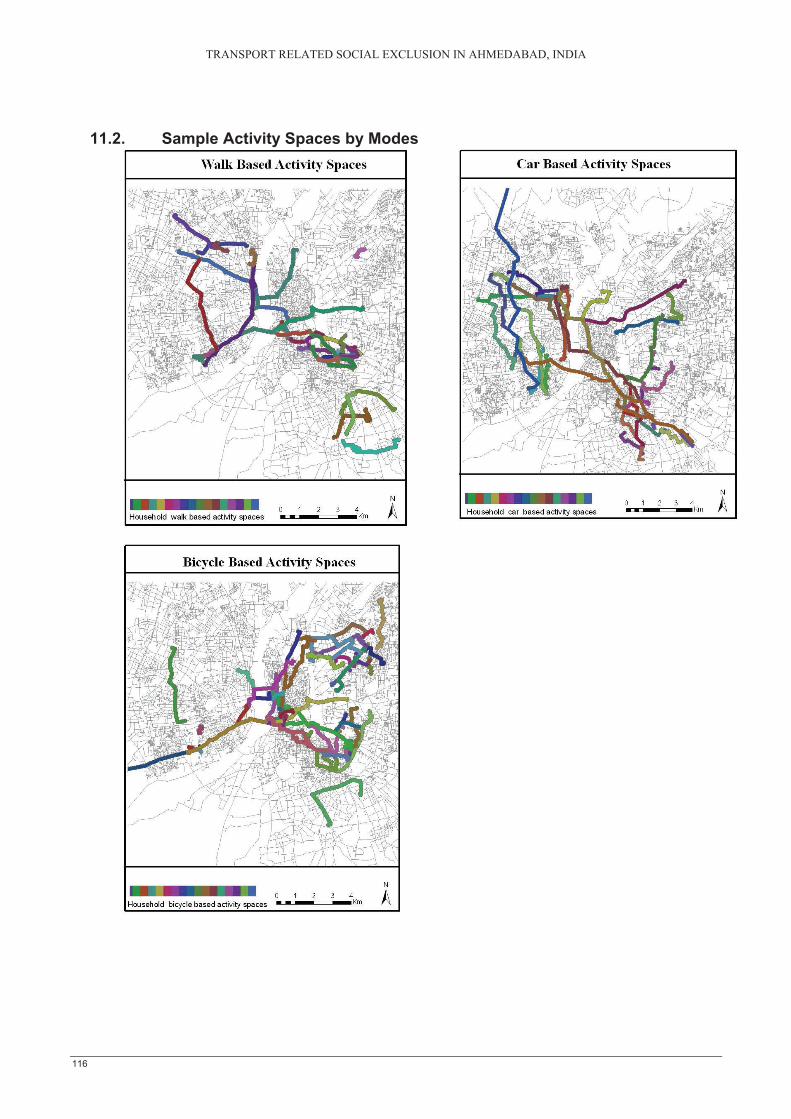
TRANSPORT RELATED SOCIAL EXCLUSION IN AHMEDABAD, INDIA
116
11.2. Sample Activity Spaces by Modes
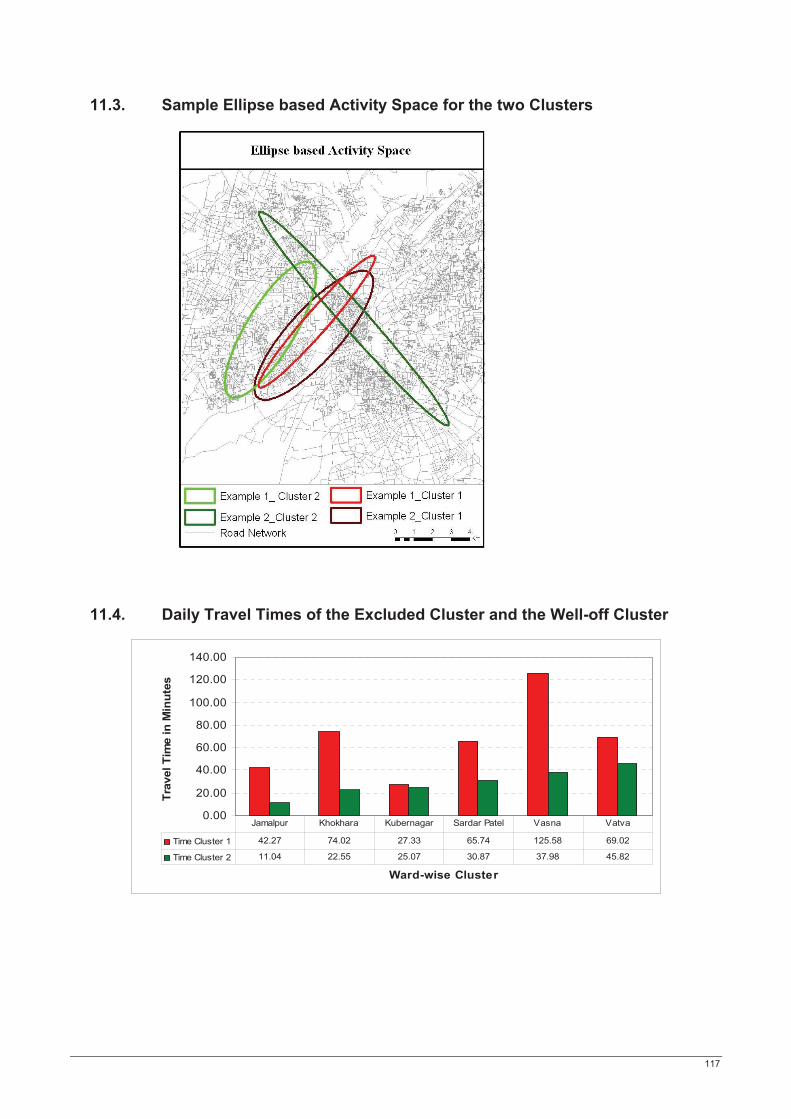
117
0.00
20.00
40.00
60.00
80.00
100.00
120.00
140.00
Ward-wise Cluster
Trav
el T
ime
in M
inut
es
Time Cluster 1 42.27 74.02 27.33 65.74 125.58 69.02
Time Cluster 2 11.04 22.55 25.07 30.87 37.98 45.82
Jamalpur Khokhara Kubernagar Sardar Patel Vasna Vatva
11.3. Sample Ellipse based Activity Space for the two Clusters
11.4. Daily Travel Times of the Excluded Cluster and the Well-off Cluster
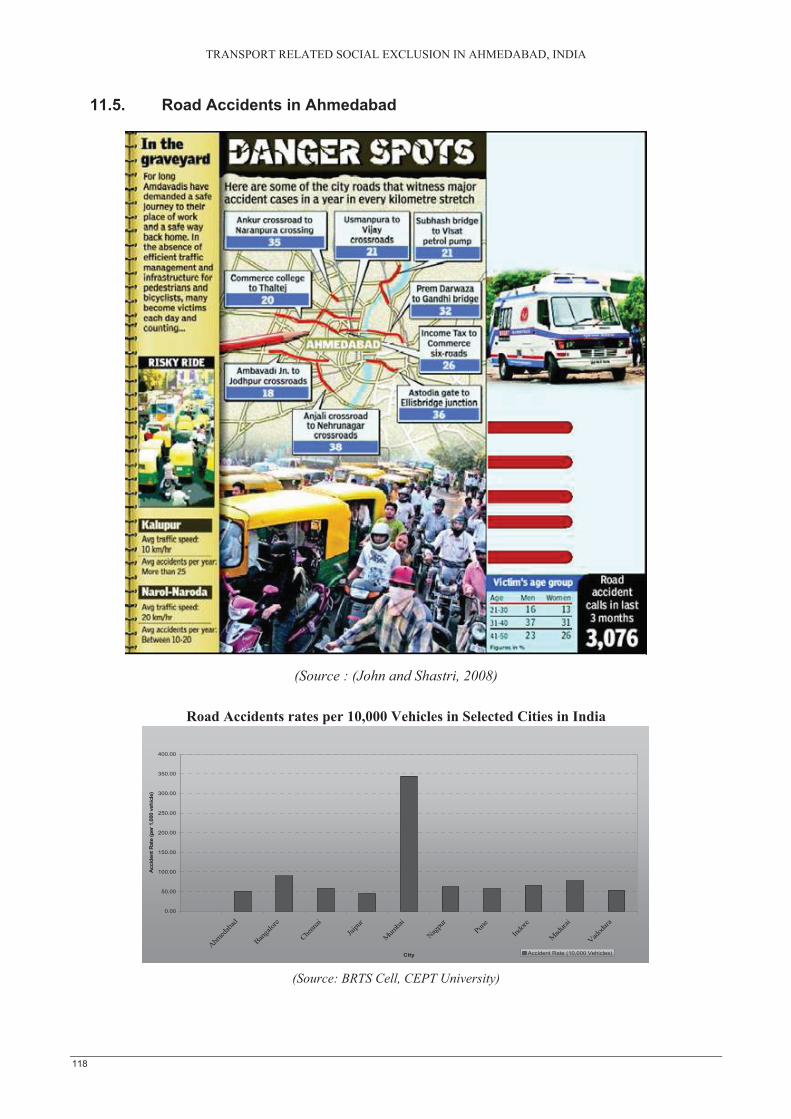
TRANSPORT RELATED SOCIAL EXCLUSION IN AHMEDABAD, INDIA
118
0.00
50.00
100.00
150.00
200.00
250.00
300.00
350.00
400.00
Ahmed
abad
Banga
lore
Chenn
ai
Jaipu
r
Mum
bai
Nagpu
r Pu
ne
Indore
Mad
urai
Vadod
ara
City
Acc
iden
t Rat
e (p
er 1
,000
veh
icle
)
Accident Rate (10,000 Vehicles)
11.5. Road Accidents in Ahmedabad
(Source : (John and Shastri, 2008)
Road Accidents rates per 10,000 Vehicles in Selected Cities in India
(Source: BRTS Cell, CEPT University)
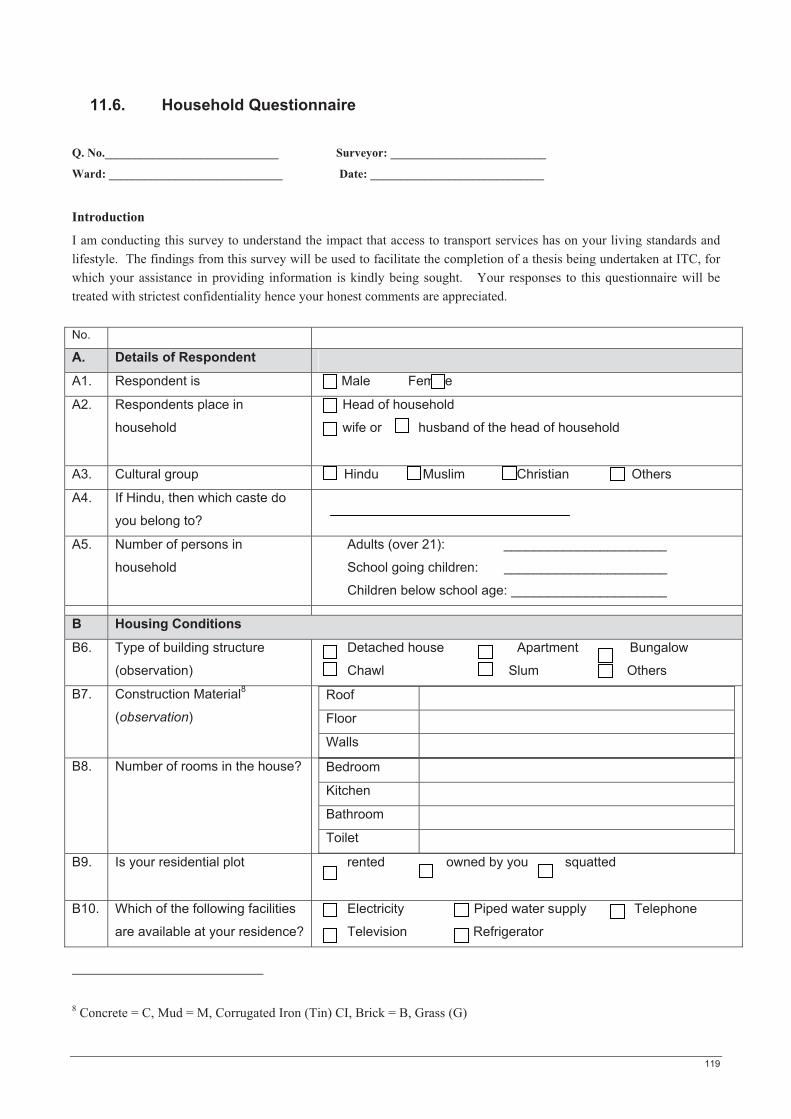
119
11.6. Household Questionnaire
Q. No._____________________________ Surveyor: __________________________
Ward: _____________________________ Date: _____________________________
Introduction
I am conducting this survey to understand the impact that access to transport services has on your living standards and lifestyle. The findings from this survey will be used to facilitate the completion of a thesis being undertaken at ITC, for which your assistance in providing information is kindly being sought. Your responses to this questionnaire will be treated with strictest confidentiality hence your honest comments are appreciated.
No.
A. Details of Respondent
A1. Respondent is Male Female
A2. Respondents place in
household
Head of household
wife or husband of the head of household
A3. Cultural group Hindu Muslim Christian Others
A4. If Hindu, then which caste do
you belong to?
A5. Number of persons in
household
Adults (over 21): ______________________
School going children: ______________________
Children below school age: _____________________
B Housing Conditions
B6. Type of building structure
(observation)
Detached house Apartment Bungalow
Chawl Slum Others
B7. Construction Material8
(observation)
Roof
Floor
Walls
B8. Number of rooms in the house? Bedroom
Kitchen
Bathroom
Toilet
B9. Is your residential plot rented owned by you squatted
B10. Which of the following facilities
are available at your residence?
Electricity Piped water supply Telephone
Television Refrigerator
8 Concrete = C, Mud = M, Corrugated Iron (Tin) CI, Brick = B, Grass (G)
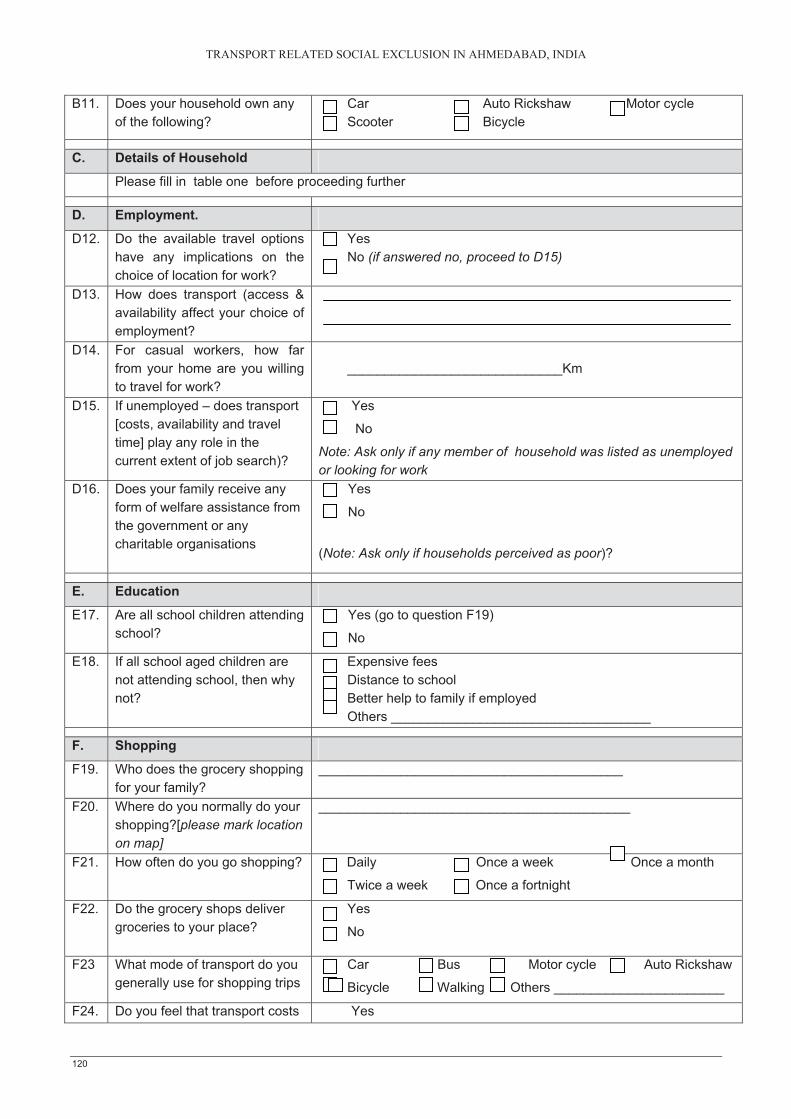
TRANSPORT RELATED SOCIAL EXCLUSION IN AHMEDABAD, INDIA
120
B11. Does your household own any of the following?
Car Auto Rickshaw Motor cycle Scooter Bicycle
C. Details of Household
Please fill in table one before proceeding further
D. Employment.
D12. Do the available travel options have any implications on the choice of location for work?
Yes No (if answered no, proceed to D15)
D13. How does transport (access & availability affect your choice of employment?
D14. For casual workers, how far from your home are you willing to travel for work?
_____________________________Km
D15. If unemployed – does transport [costs, availability and travel time] play any role in the current extent of job search)?
Yes
No
Note: Ask only if any member of household was listed as unemployed or looking for work
D16. Does your family receive any form of welfare assistance from the government or any charitable organisations
Yes
No
(Note: Ask only if households perceived as poor)?
E. Education
E17. Are all school children attending school?
Yes (go to question F19)
No
E18. If all school aged children are not attending school, then why not?
Expensive fees Distance to school Better help to family if employed Others ___________________________________
F. Shopping
F19. Who does the grocery shopping for your family?
_________________________________________
F20. Where do you normally do your shopping?[please mark location on map]
__________________________________________
F21. How often do you go shopping? Daily Once a week Once a month
Twice a week Once a fortnight
F22. Do the grocery shops deliver groceries to your place?
Yes
No
F23 What mode of transport do you generally use for shopping trips
Car Bus Motor cycle Auto Rickshaw
Bicycle Walking Others _______________________
F24. Do you feel that transport costs Yes
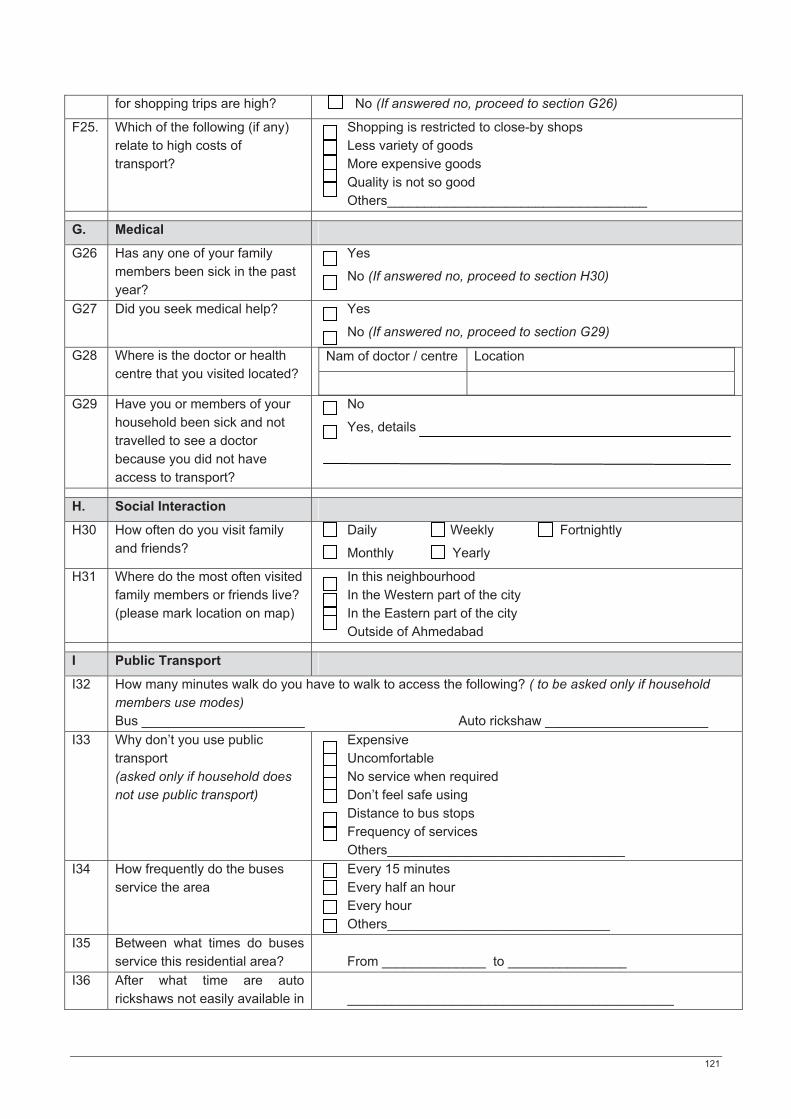
121
for shopping trips are high? No (If answered no, proceed to section G26)
F25. Which of the following (if any) relate to high costs of transport?
Shopping is restricted to close-by shops Less variety of goods More expensive goods Quality is not so good Others___________________________________
G. Medical
G26 Has any one of your family members been sick in the past year?
Yes
No (If answered no, proceed to section H30)
G27 Did you seek medical help? Yes
No (If answered no, proceed to section G29)
G28 Where is the doctor or health centre that you visited located?
Nam of doctor / centre Location
G29 Have you or members of your household been sick and not travelled to see a doctor because you did not have access to transport?
No
Yes, details
H. Social Interaction
H30 How often do you visit family and friends?
Daily Weekly Fortnightly
Monthly Yearly
H31 Where do the most often visited family members or friends live? (please mark location on map)
In this neighbourhood In the Western part of the city In the Eastern part of the city Outside of Ahmedabad
I Public Transport
I32 How many minutes walk do you have to walk to access the following? ( to be asked only if household members use modes)Bus ______________________ Auto rickshaw ______________________
I33 Why don’t you use public transport (asked only if household does not use public transport)
Expensive Uncomfortable No service when required Don’t feel safe using Distance to bus stops Frequency of services Others________________________________
I34 How frequently do the buses service the area
Every 15 minutes Every half an hour Every hour Others______________________________
I35 Between what times do buses service this residential area? From ______________ to ________________
I36 After what time are auto rickshaws not easily available in ____________________________________________
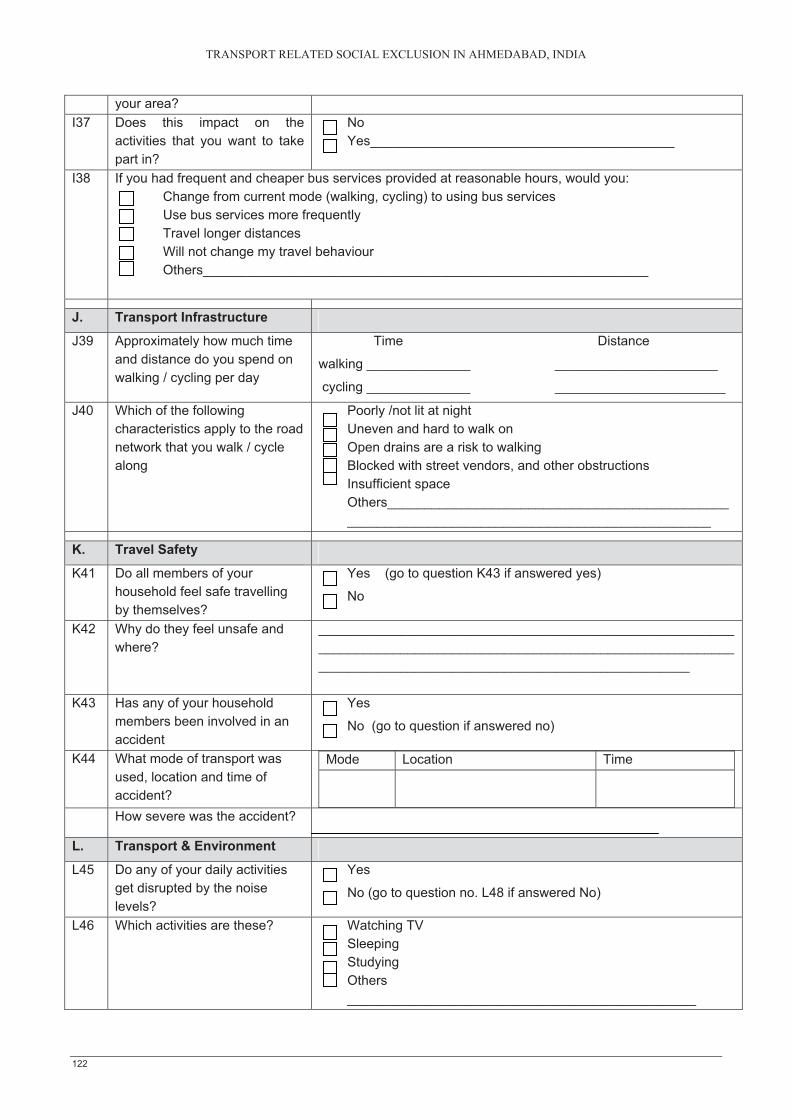
TRANSPORT RELATED SOCIAL EXCLUSION IN AHMEDABAD, INDIA
122
your area? I37 Does this impact on the
activities that you want to take part in?
No Yes_________________________________________
I38 If you had frequent and cheaper bus services provided at reasonable hours, would you: Change from current mode (walking, cycling) to using bus services Use bus services more frequently Travel longer distances Will not change my travel behaviour Others____________________________________________________________
J. Transport Infrastructure
J39 Approximately how much time and distance do you spend on walking / cycling per day
Time Distance
walking ______________ ______________________
cycling ______________ _______________________
J40 Which of the following characteristics apply to the road network that you walk / cycle along
Poorly /not lit at night Uneven and hard to walk on Open drains are a risk to walking Blocked with street vendors, and other obstructionsInsufficient space Others_______________________________________________________________________________________________
K. Travel Safety
K41 Do all members of your household feel safe travelling by themselves?
Yes (go to question K43 if answered yes)
No
K42 Why do they feel unsafe and where?
__________________________________________________________________________________________________________________________________________________________________
K43 Has any of your household members been involved in an accident
Yes
No (go to question if answered no)
K44 What mode of transport was used, location and time of accident?
Mode Location Time
How severe was the accident?
L. Transport & Environment
L45 Do any of your daily activities get disrupted by the noise levels?
Yes
No (go to question no. L48 if answered No)
L46 Which activities are these? Watching TV Sleeping Studying Others _______________________________________________

123
L47 How would you rate the disturbance? Severe Mild
L48 Do you get exposed to excessive fumes, dust (pollution) when travelling?
Yes No (same as every other road, residential area)
L49 Do you get exposed to excessive fumes; dust (pollution) when at home due to traffic?
Yes No (same as every other road, residential area)
M. Significance of Elements
M50 Do you experience any limitations in the use of transport?
Yes
No (go to activity diary if answered No)
M51 How do you rate the importance of the following factors which may limit your access to transport: Very Less Least
a. Infrequent public transport
b. Operating hours of buses
c. Your own schedule of activities (time)
d. Expensive fares
e. Fear of safety
f. High risk of road accidents
g. High exposure to noise
h. High exposure to pollution
M52 Please rank the importance of the implications of lack of access to transport
Very Less Least
Limited choice of services and facilities (due to the large distance from home to shops etc )
Impacts on the locations of employment choice
Impacts on children’s education
Impacts on the ability to seek medical care
Others

124
Gender
Age
Cur
rent
or
high
est
leve
l of
educ
atio
n at
tain
ed 9
Cur
rent
O
ccup
atio
n10
Loca
tion
of
empl
oym
ent /
sc
hool
Dis
tanc
e fr
om
hom
e
Hou
rs o
f em
ploy
me
nt /
scho
ol
Inco
me
Leve
l M
ode
of
trav
el11
Rea
son
for m
ode
choi
ce12
Cos
t of r
etur
n tr
ip
1.
M
F
C1.
2.
M
F
C2.
3.
M
F
C3.
4.
M
F
C4.
5.
M
F
C5.
6.
M
F
C
6.
9 PP
= pr
e pr
imar
y, P
=Prim
ary,
S =
Sec
onda
ry, T
= T
ertia
ry, P
S =
Post
seco
ndar
y tra
inin
g 10
Occ
upat
ion
S= S
tude
nt,
H =
Hou
sew
ife, O
= O
ffic
e w
orke
r, A
= A
uto
ricks
haw
driv
er, B
= bu
sine
ssm
an, C
= ca
sual
wor
ker;
plea
se w
rite
othe
r occ
upat
ions
as s
peci
fied
by
resp
onde
nt
11 M
ode
of tr
avel
: W=
Wal
king
, C=
Cyc
ling,
A=
Aut
o R
icks
haw
, PC
= P
rivat
e C
ar, B
= B
us, S
= Sc
oote
r; M
C=
Mot
or c
ycle
. 12
Fact
ors c
ould
rela
te t
o th
ings
such
as
cost
, av
aila
bilit
y, a
cces
sibi
lity,
saf
ety,
com
fort
Tab
le O
ne: H
ouse
hold
Det
ails
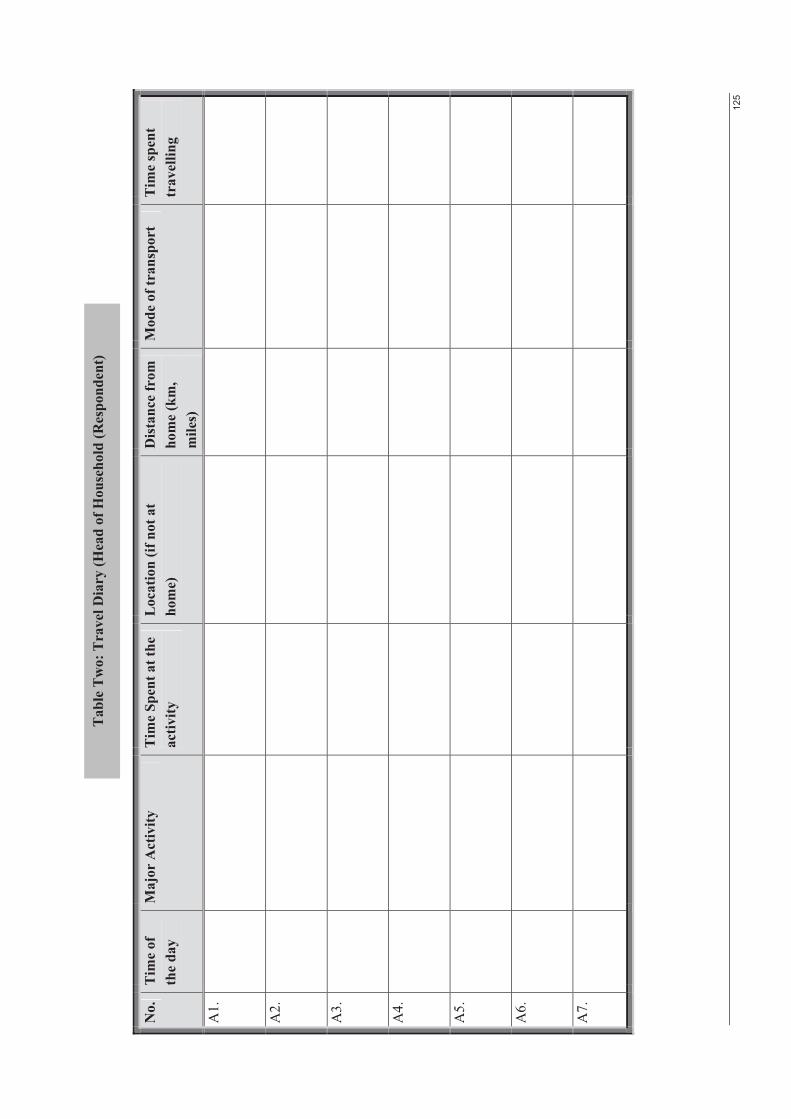
125
No.
T
ime
of
the
day
M
ajor
Act
ivity
T
ime
Spen
t at t
he
activ
ity
Loc
atio
n (if
not
at
hom
e)
Dis
tanc
e fr
om
hom
e (k
m,
mile
s)
Mod
e of
tran
spor
t T
ime
spen
t tr
avel
ling
A1.
A2.
A3.
A4.
A5.
A6.
A7.
Tab
le T
wo:
Tra
vel D
iary
(Hea
d of
Hou
seho
ld (R
espo
nden
t)