Independent Drive Test Report - May'16 Ahmedabad
18
Independent Drive Test Report - May’16 Ahmedabad Key performance indicators for most of the operators: Most of the operators meet the Call Setup Success Rate (CSSR) where as most of the operators fall below the 2% CDR threshold Methodology: Independent Drive test was conducted in Ahmedabad & surrounding areas from 9:00 AM to 9:PM from 18th to 20 th of May 2016. The total drive test covered in Ahmedabad area was approximately 350 km over a period of 3 days. A total of ~5998 calls were made for seven 2G networks, five 3G networks and one CDMA networks covering eight operators 1 2 3 4 City-Level Performance Area-Level Performance Analysis Summary and Highlights Date: 22 June 2016 5 Appendix I. Methodology II. Benchmarking KPIs III. Coverage IV. Receive (Rx) Quality V. City-Level Ranking VI. City-Level KPI The independent drive test has been carried out by M/s IMRB International on behalf of TRAI
-
Upload
khangminh22 -
Category
Documents
-
view
0 -
download
0
Transcript of Independent Drive Test Report - May'16 Ahmedabad

Independent Drive Test Report
- May’16
Ahmedabad
Key performance indicators for most of the operators: Most of the operators meet the Call Setup
Success Rate (CSSR) where as most of the operators fall below the 2% CDR threshold
Methodology:
Independent Drive test was conducted in Ahmedabad & surrounding areas from 9:00 AM to 9:PM from 18th to 20th of May 2016. The total drive
test covered in Ahmedabad area was approximately 350 km over a period of 3 days. A total of ~5998 calls were made for seven 2G networks,
five 3G networks and one CDMA networks covering eight operators
1 2 3 4
City-Level
Performance
Area-Level
Performance Analysis Summary
and
Highlights
Date: 22 June 2016
5
Appendix I. Methodology
II. Benchmarking KPIs
III. Coverage
IV. Receive (Rx) Quality
V. City-Level Ranking
VI. City-Level KPI
The independent drive test has been carried out by M/s IMRB International on behalf of TRAI

1. City-Level Performance
City-Level Details Operator Performance against Key Performance Indicators :
1. Call Setup Success Rate, 2. Blocked Call Rate, 3. Call Drop Rate, 4. Rx Quality
Legends Threshold for each KPI are considered as per TRAI guidelines
Abbreviation / Definition: CSSR (benchmark > =95%) : Call Setup Success Rate
BCR (benchmark <=3%): Blocked Call Rate
CDR (benchmark <=2%): Call Drop Rate
Good RxQuality (benchmark >=95%): 2G (RxQual <=5), 3G (EcNo >=-15dBm), CDMA (FER <=4%)
Most of the operators have met the
Call Setup Success Rate
benchmark of >=95% except
Reliance CDMA. Refer. Fig 1
Most of the operators have met the
Call Blocked Rate benchmark of
<=3% except Aircel 2G , BSNL 2G
& 3G, Reliance 2G & CDMA and
Vodafone 2G. Refer. Fig 2
Most of the operators failed to
meet the Call Drop Rate
benchmark of <=2% except Airtel
2G.
Refer. Fig 3
Most of the operators failed to
meet the Rx Quality Rate
benchmark of >=95% except Airtel
2G & 3G, Idea 3G and Vodafone
3G.
Refer. Fig 4
Operator meeting the benchmark Operator not meeting the benchmark
91.3%
96.1% 98.5%
90.9% 94.6%
87.9%
96.3% 92.4%
88.9%
94.0% 91.6% 90.5%
98.0%
Air
cel 2
G
Air
tel 2
G
Air
tel 3
G
BS
NL
2G
BS
NL
3G
IDE
A 2
G
IDE
A 3
G
Re
lian
ce 2
G
Re
lian
ce
CD
MA
TATA
3G
Tele
no
r 2
G
Vo
da
fon
e 2
G
Vo
da
fon
e 3
G
Fig 4. Rx Quality (%)
95%
4.5% 1.9% 2.3%
5.6%
15.2% 11.4% 11.4%
3.3% 7.4%
3.5% 3.9% 2.4% 3.1%
Air
cel 2
G
Air
tel 2
G
Air
tel 3
G
BS
NL
2G
BS
NL
3G
IDE
A 2
G
IDE
A 3
G
Re
lian
ce 2
G
Re
lian
ce
CD
MA
TATA
3G
Tele
no
r 2
G
Vo
da
fon
e 2
G
Vo
da
fon
e 3
G
Fig 3. Call Drop Rate (%)
2%
95.7% 97.6%
99.3% 96.5% 95.2%
97.1% 97.9% 96.4%
90.7%
97.1% 97.7% 96.6% 97.9%
Air
cel 2
G
Air
tel 2
G
Air
tel 3
G
BS
NL
2G
BS
NL
3G
IDE
A 2
G
IDE
A 3
G
Re
lian
ce 2
G
Re
lian
ce C
DM
A
TATA
3G
Tele
no
r 2
G
Vo
da
fon
e 2
G
Vo
da
fon
e 3
G
Fig 1. Call Setup Success Rate (%)
95%
4.3% 2.4%
0.7%
3.5% 4.8%
2.9% 2.1% 3.6%
9.3%
2.9% 2.3% 3.4%
2.1%
Air
cel 2
G
Air
tel 2
G
Air
tel 3
G
BS
NL
2G
BS
NL
3G
IDE
A 2
G
IDE
A 3
G
Re
lian
ce 2
G
Rel
ian
ce C
DM
A
TATA
3G
Tele
no
r 2
G
Vo
da
fon
e 2
G
Vo
da
fon
e 3
G
Fig 2. Block Call Rate (%)
3%
2

2. Area-Level Performance
Area-Level Details
Legends
Most of the areas of Ahmedabad met the Call Setup Success Rate benchmark of >=95% except
Manin Nagar
Fig 5. Area Level CSSR KPI Performance ( all operators inclusive)
Areas meeting the benchmark Areas not meeting the benchmark
Abbreviation / Definition: CSSR (benchmark > =95%) : Call Setup Success Rate
BCR (benchmark <=3%): Blocked Call Rate
CDR (benchmark <=2%): Call Drop Rate
Good RxQuality (benchmark >=95%): 2G (RxQual <=5), 3G (EcNo >=-15dBm), CDMA (FER <=4%)
3
Call Setup Success Rate Aircel Airtel BSNL Idea RCOM TATA Telenor Vodafone
Ahmedabad Central 95.8% 97.1% 99.1% 97.8% 97.6% 97.1% 96.7% 98.4%
Chandola 98.0% 100.0% 95.5% 97.9% 89.8% 100.0% 100.0% 99.0%
Charodi 92.0% 98.1% 90.7% 96.6% 98.3% 93.3% 100.0% 95.0%
Hansol 92.3% 98.5% 95.0% 98.4% 89.2% 93.1% 97.1% 96.9%
Hebatpur 98.0% 98.9% 92.4% 96.8% 95.3% 97.3% 100.0% 96.7%
Manin nagar 93.5% 98.0% 87.5% 93.6% 87.5% 85.0% 100.0% 95.7%
Naroda 95.0% 100.0% 97.1% 99.1% 87.6% 100.0% 95.1% 95.1%
Prahlad nagar 96.9% 98.2% 94.8% 97.4% 92.6% 100.0% 98.5% 97.3%

2. Area-Level Performance
Area-Level Details
Legends
Fig 6. Area Level Blocked Call Rate KPI performance ( all operators inclusive)
Most of the areas of Ahmedabad failed to meet the benchmark for Blocked Call Rate of <=3%
except Ahmedabad Central and Chandola
Abbreviation / Definition: CSSR (benchmark > =95%) : Call Setup Success Rate
BCR (benchmark <=3%): Blocked Call Rate
CDR (benchmark <=2%): Call Drop Rate
Good RxQuality (benchmark >=95%): 2G (RxQual <=5), 3G (EcNo >=-15dBm), CDMA (FER <=4%)
4
Areas meeting the benchmark Areas not meeting the benchmark
Call Blocked Rate Aircel Airtel BSNL Idea RCOM TATA Telenor Vodafone
Ahmedabad Central 4.2% 2.9% 0.9% 2.2% 2.4% 2.9% 3.3% 1.6%
Chandola 2.0% 0.0% 4.5% 2.1% 10.2% 0.0% 0.0% 1.0%
Charodi 8.0% 1.9% 9.3% 3.4% 1.7% 6.7% 0.0% 5.0%
Hansol 7.7% 1.5% 5.0% 1.6% 10.8% 6.9% 2.9% 3.1%
Hebatpur 2.0% 1.1% 7.6% 3.2% 4.7% 2.7% 0.0% 3.3%
Manin nagar 6.5% 2.0% 12.5% 6.4% 12.5% 15.0% 0.0% 4.3%
Naroda 5.0% 0.0% 2.9% 0.9% 12.4% 0.0% 4.9% 4.9%
Prahlad nagar 3.1% 1.8% 5.2% 2.6% 7.4% 0.0% 1.5% 2.7%

2. Area-Level Performance
Area-Level Details
Legends
All areas of Ahmedabad failed to meet the Call Drop Rate benchmark of <=2%.
Fig 7. Area Level Call Drop Rate KPI Performance ( all operators inclusive)
Abbreviation / Definition: CSSR (benchmark > =95%) : Call Setup Success Rate
BCR (benchmark <=3%): Blocked Call Rate
CDR (benchmark <=2%): Call Drop Rate
Good RxQuality (benchmark >=95%): 2G (RxQual <=5), 3G (EcNo >=-15dBm), CDMA (FER <=4%)
5
Areas meeting the benchmark Areas not meeting the benchmark
Call Drop Rate Aircel Airtel BSNL Idea RCOM TATA Telenor Vodafone
Ahmedabad Central 2.8% 1.0% 5.0%
8.2% 2.8% 1.5% 3.4% 4.9%
Chandola 8.3% 2.6% 5.9%
13.0% 8.2% 6.8% 5.9% 3.1%
Charodi 4.3% 1.9% 12.2%
17.9% 1.7% 7.1% 5.9% 1.8%
Hansol 8.3% 0.0% 8.8%
14.5% 8.6% 0.0% 6.1% 4.8%
Hebatpur 4.1% 2.2% 20.5%
17.4% 4.0% 8.3% 3.9% 0.0%
Manin nagar 6.9% 6.1% 14.3%
13.6% 9.5% 0.0% 13.6% 0.0%
Naroda 5.3% 2.3% 6.7%
11.1% 11.5% 5.9% 0.0% 0.0%
Prahlad nagar 3.2% 3.7% 22.0%
8.1% 3.6% 2.0% 3.0% 1.9%

2. Area-Level Performance
Area-Level Details
Legends
All areas of Ahmedabad failed to meet the Rx Quality benchmark of >=95%
Abbreviation / Definition: CSSR (benchmark >= 95%) : Call Setup Success Rate
BCR (benchmark <=3%): Blocked Call Rate
CDR (benchmark <=2%): Call Drop Rate
Good RxQuality (benchmark >=95%): 2G (RxQual <=5), 3G (EcNo >=-15dBm), CDMA (FER <=4%)
Fig 8. Area Level Rx Quality KPI performance (all operators inclusive)
6
Areas meeting the benchmark Areas not meeting the benchmark
Rx Quality Aircel Airtel BSNL Idea RCOM TATA Telenor Vodafone
Ahmedabad Central 91.79% 97.23% 95.58% 90.55% 93.54% 97.72% 90.96% 95.51%
Chandola 88.00% 99.04% 91.89% 89.22% 88.42% 87.41% 90.12% 90.99%
Charodi 97.18% 95.35% 83.74% 90.76% 96.85% 87.92% 92.63% 90.85%
Hansol 82.08% 96.52% 91.13% 89.74% 76.95% 87.27% 90.79% 89.93%
Hebatpur 88.08% 98.13% 84.48% 91.15% 89.59% 93.01% 93.79% 94.88%
Manin nagr 92.15% 94.56% 91.53% 88.42% 83.90% 93.05% 89.21% 93.17%
Naroda 88.08% 96.11% 94.90% 93.33% 87.21% 96.44% 92.28% 95.21%
Prahlad nagar 99.41% 97.35% 86.83% 94.63% 95.14% 95.54% 93.15% 94.76%

Detailed Analysis of Operators
High RLT
• Radio Link Timeout (RLT indicates how long the call can
sustain during poor quality – Higher the value the
longer it will sustain the call). Higher the RLT, poorer the
consumer experience during the call.
• If Radio Link Timeout of > 40 is considered for Aircel &
Idea. Call Drop Rate would be higher than the present
call drop rate.
Operators No. of Cells with
RLT <= 40
No. of Cells
with RLT > 40 Current CDR
CDR, If all
Cells assume
RLT <= 40
Airtel 100.00% 0.00% 1.86% 1.86%
Aircel 48.43% 51.57% 4.47% 4.88%
Vodafone 99.72% 0.28% 2.45% 2.45%
Idea 12.73% 87.27% 11.36% 11.59%
BSNL 72.91% 27.09% 5.63% 5.63%
Telenor 77.39% 22.61% 3.91% 3.91%
RCOM 90.40% 9.60% 3.27% 3.27%
3. Analysis
Legends Current Drive: May 2016
Operator meeting the set CDR threshold Operator not meeting the set CDR threshold
Abbreviation / Definition: CSSR (benchmark >=95%) : Call Setup Success Rate
BCR (benchmark <=3%): Blocked Call Rate
CDR (benchmark <=2%): Call Drop Rate
Good RxQuality (benchmark >=95%): 2G (RxQual <=5), 3G (EcNo >=-15dBm), CDMA (FER <=4%)

3. Analysis
Detailed Analysis of Operators
Idea 2G (CDR : 11.36%, Signal Quality : 87.86%)
• Ahmedabad Central, Charodi and Hebatpur are the key contributed areas (as shown in highlighted map) to dropped call.
• Dropped calls in these three areas are 60% of total dropped calls in all areas.
• Poor quality of network is clear indication of high call drop rate.
Idea 3G (CDR : 11.40%)
• The observation shows almost 75% of calls which started on 3G network switched to 2G network, even signal Quality of 2G network is poor than 3G network.
• The observation shows 75% of dropped calls on 3G enabled SIM card, dropped on 2G network which make overall 3G performance poor.
Parameter
Highlighted
areas(Ahmedabad
Central, Charodi &
Hebatpur)
Rest of
Ahmedabad
# call drops 30 20
Rx Quality %( Good
sample) 87.30% 88.41%
Parameter 3G network 2G network
# call Attempt 330 109
# call Drop 12 37
# call ended 125 265
% Technology distribution
43.4% 56.6%
BSNL 3G (CDR : 15.21%) Parameter 3G network 2G network
# call Attempt 165 208
# call Drop 14 40
# call ended 99 225
% Technology distribution
39.1% 60.9%
• The observation shows 44% calls were attempted on 3G network only, due to this most of the calls were initiated on 2G network.
• This scenario could be a reason who would not be able to avail 3G services for a long period
• Most of the calls dropped just after compressed mode (IRAT Handover). Need to check the related parameter.
Reliance CDMA (CDR : 7.37%, BCR : 9.31%)
• Signal quality of Reliance CDMA is Very poor and not meeting benchmark of >=95%.
• Poor signal quality is the clear indication of high call drop in network.
Parameter Value(%)
Signal Quality(Good sample <=4% of total FER sample)
88.90%
Legends Current Drive: May 2016
Operator meeting the set CDR threshold Operator not meeting the set CDR threshold
Abbreviation / Definition: CSSR (benchmark > =95%) : Call Setup Success Rate
BCR (benchmark <=3%): Blocked Call Rate
CDR (benchmark <=2%): Call Drop Rate
Good RxQuality (benchmark >=95%): 2G (RxQual <=5), 3G (EcNo >=-15dBm), CDMA (FER <=4%)
7

4. Summary & Highlights
Summary & Highlights
Most of the operators failed to meet the Call Drop Rate Benchmark of <=2% except Airtel 2G
Key Highlights
• Only Airtel 2G met the Call Drop Rate benchmark of <=2% in 2G networks.
• Most of the operators failed to meet the benchmark by a wide margin. Except Airtel 2G & 3G and Vodafone 2G, most
of the operators have Call Drop rate of >3%
• Idea 2G & 3G and BSNL 3G have Call Drop Rates in the range of above 10%. These are exceptionally high and it
clearly indicate for urgent need of improvement in order to deliver reasonable levels of services.
• A big gap between the performances of Airtel (2G & 3G) and Vodafone (2G) compared to the poor performances of
other operators are clearly showing in the areas driven, it is possible for other operators to offer a much better Quality
of service than is currently being provided.
Fig 9. Call Drop Rate
4.5%
1.9% 2.3%
5.6%
15.2%
11.4% 11.4%
3.3%
7.4%
3.5% 3.9% 2.4% 3.1%
Air
cel 2
G
Air
tel 2
G
Air
tel 3
G
BS
NL
2G
BS
NL
3G
IDE
A 2
G
IDE
A 3
G
Rel
ian
ce 2
G
Re
lian
ce C
DM
A
TATA
3G
Tele
no
r 2
G
Vo
da
fon
e 2
G
Vo
da
fon
e 3
G
Fig 9. Call Drop Rate (%)
8

5. Appendix
Ancillary Details
I. Methodology & Other Details
II. Benchmarking KPI Details
III. Coverage Details
IV. Receive (Rx) Quality Details
V. City-Level Ranking and KPI details
VI. City-Level KPI details
Table of Contents in Appendix
9

Appendix
Ancillary Details
1. Methodology & Other Details
Overview:
Telecom Regulatory Authority of India has been entrusted with the task of laying down the standards of quality of service to be provided
by the service providers and ensuring that the quality of service is provided as per norms; and also TRAI is responsible for conducting
the periodical audit of such services provided by the service providers so as to protect the interest of the consumers of
telecommunications service
TRAI is regularly monitoring the performance of Telecom Service Providers (TSP) against the benchmarks for the various Quality of
Service (QoS) parameters laid down by the Authority. TSPs submit Performance Monitoring Reports to TRAI every quarter. TRAI also
undertakes audit and assessment of Quality of Service through independent agencies to verify the Quality of Service claimed. The Audit
agencies conduct sample ‘Drive tests’ across various cities all over the country as part of audit and assessment of the TSPs’
performance
In view of complaints on call drops and other network issues, on behalf of TRAI, an Independent Drive Test (IDT) was conducted from
18th May 2016 to 20th May 2016 covering various locations in North Ahmedabad, South Ahmedabad, Central Ahmedabad and West
Ahmedabad. The performance of Aircel, Airtel, BSNL, Idea, Vodafone, Reliance, Tata, Telenor was monitored across various
technologies (2G, 3G and CDMA). The drive test route was defined on the basis of several factors that include - areas from where call
drop complaints are commonly received; areas of heavy usage; residential areas away from arterial roads; office areas; areas where
previous Drive tests showed network issues; etc.
For the purpose of these tests, 2G + 3G Mode (Auto) was used. The test results obtained from these drive tests were conducted to
assess the network condition more specifically in terms of Radio Frequency (RF) Coverage; Rx Quality; Call Setup Success Rate; Call
Drop Rate; Blocked Calls and Carrier to Interference ratio
Drive Route Details For Ahmedabad Area:
Independent Drive test was conducted in Ahmedabad area from 9:00 AM to 9:PM from 18th to 20th of May 2016. The total drive test
covered in Ahmedabad area was approximately 350 km over a period of 3 days. Total of ~5998 calls were made for seven 2G
networks, five 3G networks and one CDMA networks covering eight operators. Roads and Areas covered in Ahmedabad is shown in the
below map.
Below is the List of Areas Covered and Drive Routes
• Sardar Patel Ring Rd • Subhash Nagar • Vishnu Nagar • Shree Swaminarayan
Gurukul • Chharodi • DevNagar • Morar Nagar Society • Jain Nagar Sabarmari • Ram Nagar • Jal Sabar Society • SBI Rly Station • Nirnay Nagar • Akbar Nagar • Nandanvan • Shenbhai Nagar • Parvar society • BSNL Colony • Sankli Nagar • Vishala Circle • Dwarkesh Nagar • Santhal Circle
• Gujarat Tech University
• Hansol • Airport Road • Military Area • Sabarmati Ashram • Sabarmati Riverfront
Development Corporation Limited
• Ashram Rd • Lal Darwaja • Paldi • Kalupur • Sarangpur • Maninagar • Narol Rd • Piplaj Pirana Rd • Govindwari • Khodiyar Nagar • Jaybharat Society • Ahmedabad Airport • Sardar Patel Stadium • Gujarat University
•
• Muthia • Kotarpur • GIDC Naroda • Bhadreshwar • Naroda Rly Station • New india Colony • Prem Nagar • Krishna nagar • Hirawadi • Bapu Nagar • Rehmat nagar • Lal Bahadur shastri Rd • Paresh Nagar • Pushpvihar • Rabari colony • Vastral • Vidhya nagar • Taxshila Park • Jivan Jyoti Society • Taxshila Nagar • Gopal Nagar Society • Dehgam Rd • Nava Naroda • nikol Gam Rd • ITI
10

Appendix
Ancillary Details
2. Benchmarking KPI Details
RF Coverage
RF Coverage relates to the geographical footprint within the system that has sufficient RF signal strength to provide for a call/data
session. Coverage rate of an operator is calculated basis of % of samples in which the Rx level is better than -85 dBm
Accessibility
Accessibility is the ability of a service to be obtained within specific tolerances and other given conditions, when requested by the user.
In other words, the ability of a user to obtain the requested service from the system. Accessibility is monitored by measuring Call Setup
Success Rate (CSSR) which is defined as the ratio of Established Calls to Call Attempts
Retainability
Retainability is “The ability of a service, once obtained, to continue to be provided under given conditions for a requested duration.” For
determining the Retainability the regulation prescribes three important parameters namely Call Drop Rate (CDR), Worst affected Cells
having more than 3% TCH drop and Connection with good voice quality. Drop Call and Connection with good voice quality were
monitored by the drive test
Mobility
In a cellular system a base station has only a limited coverage area. Hence it is possible for a moving subscriber to be out of range of a
base station while making a call. The process by which a mobile telephone call is transferred from one base station to another as the
subscriber passes the boundary of a cell is called a handover. The Handover success rate (HOSR) more than 95% is considered to be
good
Rx Quality
For measuring voice quality, RxQual samples on a scale from 0 to 7 for GSM operators, EcNo from 0 to -30 dBm and Frame Error Rate
(FERs) for CDMA service providers are measured. As per the QoS norms, RxQual between 0- 5 for GSM operators, EcNo >= -15 dBm and
between 0-4% FER value for CDMA operators FERs is considered to be good, where as RxQual beyond this benchmark is considered to
be bad
Coverage % Accessibility % Retainability % Mobility % Rx Quality %
Aircel 2G 75.29% 95.72% 95.53% 89.66% 91.27%
Airtel 2G 93.34% 97.58% 98.14% 96.34% 96.05%
Airtel 3G 90.81% 99.30% 97.66% 99.93% 98.50%
BSNL 2G 90.98% 96.50% 94.37% 97.07% 90.86%
BSNL 3G 37.06% 95.17% 84.79% 99.82% 94.58%
IDEA 2G 98.80% 97.13% 88.64% 90.14% 87.86%
IDEA 3G 87.26% 97.95% 88.60% 99.67% 96.33%
Reliance 2G 83.85% 96.43% 96.73% 97.97% 92.40%
Reliance CDMA 95.86% 90.69% 92.63% 100.00% 88.90%
TATA 3G 50.67% 97.14% 96.51% 100.00% 93.97%
Telenor 2G 91.77% 97.71% 96.09% 90.63% 91.64%
Vodafone 2G 94.84% 96.56% 97.55% 95.23% 90.45%
Vodafone 3G 89.45% 97.93% 96.95% 100.00% 97.98%
0.00%
25.00%
50.00%
75.00%
100.00%
KPI Distribution
11

Appendix
Ancillary Details
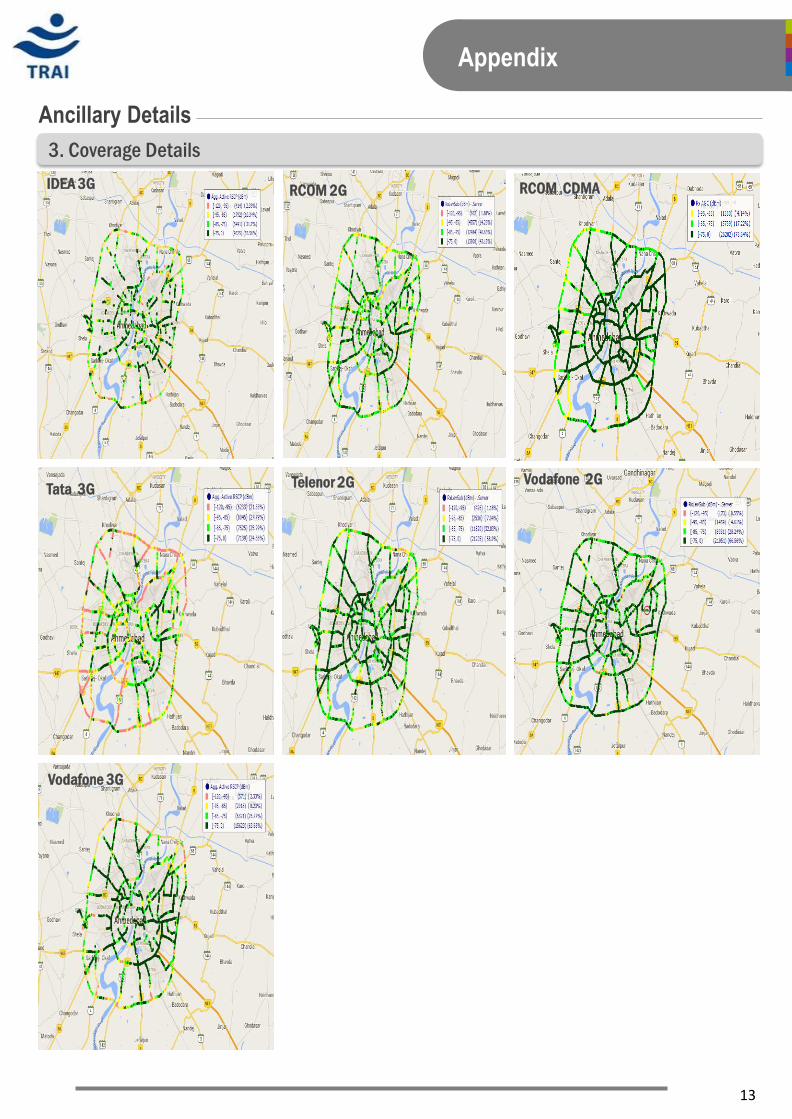
3. Coverage Details
RF Coverage relates to the geographical footprint within the system that has sufficient RF signal strength to provide for a call/data
session. The Coverage rate of an operator is calculated basis of % of samples in which the Rx level is better than -85 dBm. The details
are as follows.
Operators not meeting benchmark
Aircel 2G Airtel 2G Airtel 3G
BSNL 2G BSNL 3G IDEA 2G
0.00%
25.00%
50.00%
75.00%
100.00%
Air
cel 2
G
Air
tel 2
G
Air
tel 3
G
BS
NL
2G
BS
NL
3G
IDE
A 2
G
IDE
A 3
G
Re
lian
ce 2
G
Re
lian
ce C
DM
A
TATA
3G
Tele
no
r 2
G
Vo
da
fon
e 2
G
Vo
da
fon
e 3
G
Coverage Distribution
-95 to -120 dBm -85 to -95 dBm -75 to -85 dBm 0 to -75 dBm
Operators Coverage Rate
Aircel 2G 75.29%
Airtel 2G 93.34%
Airtel 3G 90.81%
BSNL 2G 90.98%
BSNL 3G 37.06%
IDEA 2G 98.80%
IDEA 3G 87.26%
Reliance 2G 83.85%
Reliance CDMA 95.86%
TATA 3G 50.67%
Telenor 2G 91.77%
Vodafone 2G 94.84%
Vodafone 3G 89.45%
12
Appendix
Ancillary Details
3. Coverage Details
IDEA 3G RCOM 2G RCOM CDMA
Tata 3G Telenor 2G Vodafone 2G
Vodafone 3G
13

Appendix
Ancillary Details
4. Receive (Rx) Quality Details
For measuring voice quality, RxQual samples on a scale from 0 to 7 for GSM operators, EcNo for 3G operators on a scale of 0 to -30
dBm and Frame Error Rate (FERs) for CDMA service providers are measured. As per the QoS norms, Rx Qual between 0- 5 for GSM
operators, EcNo >= -15 dBm and between 0-4% FER value for CDMA operators FERs is considered to be good, where as quality beyond
this benchmark is considered to be bad. The benchmark should usually be > =95%.
Operators not meeting benchmark
Aircel 2G Airtel 2G Airtel 3G
BSNL 2G BSNL 3G IDEA 2G
0.00%
25.00%
50.00%
75.00%
100.00%
Air
cel 2
G
Air
tel 2
G
Air
tel 3
G
BS
NL
2G
BS
NL
3G
IDE
A 2
G
IDE
A 3
G
Re
lian
ce 2
G
Rel
ian
ce C
DM
A
TATA
3G
Tele
no
r 2
G
Vo
da
fon
e 2
G
Vo
da
fon
e 3
G
Rx Quality Distribution
RxQual 6 to 7, EcNo <-15 dBm, FER <= 4% RxQual 0 to 5, EcNo >=-15 dBm, FER > 4%
Operator Rx Quality
Aircel 2G 91.27%
Airtel 2G 96.05%
Airtel 3G 98.50%
BSNL 2G 90.86%
BSNL 3G 94.58%
IDEA 2G 87.86%
IDEA 3G 96.33%
Reliance 2G 92.40%
Reliance CDMA 88.90%
TATA 3G 93.97%
Telenor 2G 91.64%
Vodafone 2G 90.45%
Vodafone 3G 97.98%
14

Appendix
Ancillary Details
4. Receive (Rx) Quality Details
IDEA 3G RCOM 2G RCOM CDMA
Tata 3G Telenor 2G Videocon 2G
Vodafone 3G
15

Appendix
Ancillary Details
5. City-Level Ranking and KPI details
Accessibility is the ability of a service to be obtained within specific tolerances and other given conditions, when requested by the user.
In other words, the ability of a user to obtain the requested service from the system. Accessibility is monitored by measuring Call Setup
Success Rate (CSSR) which is defined as the ratio of Established Calls to Call Attempts. The benchmark is >=95%. The details are as
follows:
Retainability is “the ability of a service, once obtained, to continue to be provided under given conditions for a requested duration.” For
determining the Retainability, the regulation prescribes three important parameters namely Call drop rate (CDR), Worst affected Cells
having more than 3% TCH drop and Connection with good voice quality. The call drop and connection with good voice quality were
monitored by the drive test
Call Drop Rate (CDR): The parameter gives a reliable measurement of the mobile network used by the service provider for maintaining a
call once it has been correctly established
Mobility: In a cellular system a base station has only a limited coverage area. Hence it is possible for a moving subscriber to get out of
reach of a base station while making a call. The process by which a mobile telephone call is transferred from one base station to
another as the subscriber passes the boundary of a cell is called a handover. The Handover Ssuccess Rate (HOSR) more than 95% is
considered to be good
*In case of multiple call failure in similar geo location in given period of 60sec has been counted as one call failure
Operators not meeting benchmark
Operator Total Call Attempt Blocked Calls Blocked Call Rate* CSSR
Aircel 2G 514 22 4.28% 95.72%
Airtel 2G 496 12 2.42% 97.58%
Airtel 3G 431 3 0.70% 99.30%
BSNL 2G 515 18 3.50% 96.50%
BSNL 3G 373 18 4.83% 95.17%
IDEA 2G 453 13 2.87% 97.13%
IDEA 3G 439 9 2.05% 97.95%
Reliance 2G 476 17 3.57% 96.43%
Reliance CDMA 494 46 9.31% 90.69%
TATA 3G 384 11 2.86% 97.14%
Telenor 2G 523 12 2.29% 97.71%
Vodafone 2G 465 16 3.44% 96.56%
Vodafone 3G 435 9 2.07% 97.93%
Operator Total Call Established Total Call Drop CDR CCSR
Aircel 2G 492 22 4.47% 95.53%
Airtel 2G 484 9 1.86% 98.14%
Airtel 3G 428 10 2.34% 97.66%
BSNL 2G 497 28 5.63% 94.37%
BSNL 3G 355 54 15.21% 84.79%
IDEA 2G 440 50 11.36% 88.64%
IDEA 3G 430 49 11.40% 88.60%
Reliance 2G 459 15 3.27% 96.73%
Reliance CDMA 448 33 7.37% 92.63%
TATA 3G 373 13 3.49% 96.51%
Telenor 2G 511 20 3.91% 96.09%
Vodafone 2G 449 11 2.45% 97.55%
Vodafone 3G 426 13 3.05% 96.95%
Operators Total HO Attempt HO Failure HO Success HO Failure Rate HO Success Rate
Aircel 2G 1180 122 1058 10.34% 89.66%
Airtel 2G 1448 53 1395 3.66% 96.34%
Airtel 3G 6021 4 6017 0.07% 99.93%
BSNL 2G 1059 31 1028 2.93% 97.07%
BSNL 3G 1120 2 1118 0.18% 99.82%
IDEA 2G 1572 155 1417 9.86% 90.14%
IDEA 3G 3949 13 3936 0.33% 99.67%
Reliance 2G 1378 28 1350 2.03% 97.97%
Reliance CDMA 3730 0 3730 0.00% 100.00%
TATA 3G 5781 0 5781 0.00% 100.00%
Telenor 2G 1388 130 1258 9.37% 90.63%
Vodafone 2G 1131 54 1077 4.77% 95.23%
Vodafone 3G 7347 0 7347 0.00% 100.00%
16

Appendix
Ancillary Details
6. City-Level KPI details
Operators are not meeting benchmark
Call Events
Operators (Summary)
Aircel Airtel BSNL IDEA RCOM TATA Telenor Vodafone
2G 2G 3G 2G 3G 2G 3G 2G CDMA 3G 2G 2G 3G
Call Attempt (May-16) 514 496 431 515 373 453 439 476 494 384 523 465 435
Blocked Call Rate (May-16) 4.28% 2.42% 0.70% 3.50% 4.83% 2.87% 2.05% 3.57% 9.31% 2.86% 2.29% 3.44% 2.07%
CSSR (Accessibility) (May-16) 95.72% 97.58% 99.30% 96.50% 95.17% 97.13% 97.95% 96.43% 90.69% 97.14% 97.71% 96.56% 97.93%
Dropped Call Rate (May-16) 4.47% 1.86% 2.34% 5.63% 15.21% 11.36% 11.40% 3.27% 7.37% 3.49% 3.91% 2.45% 3.05%
Mobility HOSR (May-16) 89.66% 96.34% 99.93% 97.07% 99.82% 90.14% 99.67% 97.97% 100.00% 100.00% 90.63% 95.23% 100.00%
Rx Quality (May-16) 91.27% 96.05% 98.50% 90.86% 94.58% 87.86% 96.33% 92.40% 88.90% 93.97% 91.64% 90.45% 97.98%
17
Operator are meeting the benchmark