SOCIAL EXCLUSION AND COMMUNITY PREPAREDNESS ...
278
0 SOCIAL EXCLUSION AND COMMUNITY PREPAREDNESS IN DISASTER MANAGEMENT – A STUDY IN COASTAL DISTRICTS OF TAMILNADU MAJOR RESEARCH PROJECT REPORT SUBMITTED TO UNIVERSITY GRANTS COMMISSION NEW DELHI BY Dr.S. GURUSAMY PROFESSOR OF SOCIOLOGY& PRINCIPAL INVESTIGATOR DEPARTMENT OF SOCIOLOGY GANDHIGRAM RURAL INSTITUTE DEEMED UNIVERSITY GANDHIGRAM TAMIL NADU SEPTEMBER-2009
-
Upload
khangminh22 -
Category
Documents
-
view
0 -
download
0
Transcript of SOCIAL EXCLUSION AND COMMUNITY PREPAREDNESS ...

0
SOCIAL EXCLUSION AND COMMUNITY PREPAREDNESS IN
DISASTER MANAGEMENT – A STUDY IN COASTAL
DISTRICTS OF TAMILNADU
MAJOR RESEARCH PROJECT REPORT
SUBMITTED TO UNIVERSITY GRANTS COMMISSION
NEW DELHI
BY Dr.S. GURUSAMY
PROFESSOR OF SOCIOLOGY& PRINCIPAL INVESTIGATOR
DEPARTMENT OF SOCIOLOGY GANDHIGRAM RURAL INSTITUTE
DEEMED UNIVERSITY GANDHIGRAM TAMIL NADU
SEPTEMBER-2009

1
LIST OF CONTENTS
CHAPTER
NO
CONTENTS PAGE NO
I INTRODUCTION 1
II NATURAL DISASTERS: THE SCENARIO 29
III REVIEW OF LITERATURE 77
IV RESEARCH METHODOLOGY 95
V DATA ANALYSIS AND INTERPRETATION 100
VI SUMMARY OF MAJOR FINDINGS AND
CONCLUSION
217
VII ACTION PLAN 228
BIBLIOGRAPHY
APPENDICES

2
LIST OF TABLES
Table No Title of Table Page
No
Table-5.1.1 Personal Particulars Age and Sex – Wise Distribution 101
Table-5.1.2 Religion & Community Identity 102
Table-5.1.3 Educational and Occupational Status 103
Table-5.1.4 Structure of Family 105
Table 5.1.5 Nature and Ownership of House After Tsunami 106
Table- 5.1.6 Re marriage- Before and After Tsunami 107
Table- 5.1.7 Dowry Practices 108
Table- 5.1.8 Monthly Income of the Family 109
Table- 5.1.9 Family Monthly Expenditure of the respondent 110
Table-5.2.1 Caste Based Organizations 111
Table-5.2.2 Respondent Involvement in Caste- Based Occupation 113
Table- 5.2.3 Caste Disparity in the Study District 114
Table-5.2.4 Religious Practices 115
Table-5.2.5 Religious Discrimination 117
Table-5.2.6 Religious Problem 118
Table-5.2.7 Celebration of Village Functions 120
Table-5.2.8 Village Meeting and Social Organization 122
Table- 5.2.9 Role of SHG 123
Table- 5.2.10 Role of Village Youth Club 124
Table-5.2.11 Role of Politics in Study Villages 126
Table-5.2.12 Popular Political Party & the Relationship of Caste-Class 128
Table-5.2.13 Number of Days Stay in Sea For Fishing 130
Table-5.2.14 Employment Pattern in the Study Districts 131
Table-5.2.15 Type of Fishes Catch by the Respondents 133
Table- 5.2.16 Mode for Fish Exporting in the Study Districts 134
Table-5.2.17 Dry Fish Export in Study Districts 135
Table - 5.2.18 Method for the Preservation of Dry Fish 136
Table- 5.2.19 Place for Marketing Fish 137
Table- 5.2.20 Role of Women Before and After Fishing 138
Table- 5.3.1 Celebration of Coastal Festival 140
Table-5.3.2 Risks Faced by the Respondents in Fishing 141
Table-5.3.3 Voting Pattern 142
Table 5.3.4 Exclusion 143
Table-5.3.5 Criteria for Exclusion 145
Table- 5.3.6 Separation by Class Consciousness 146
Table-5.3.7 Exploitation by Boat Owner & Money Lender 147
Table-5.3.8 Exploitation from Government Officials 149
Table-5.3.9 Measures to Avoid Exclusion in Future and GOs / NGOs 150
Table-5.3.10 Respondents’ perception towards distribution of Relief and rehabilitation
152
Table-5.3.11 Corruption during Distribution 153
Table-5.3.12 Occurrence of Violence during the Relief Distribution 155
Table-5.3.13 Distribution of House to Real Victims 156
Table- 5.3.14 Respondents’ Satisfaction on the Quality of the House 157

3
Table-5.3.15 Respondents’ Satisfaction on the Quality of Boat & Net 159
Table-5.4.1 Natural Disaster 161
Table- 5.4.2 Respondents’ Perception of the Impact of Depression in Coastal Areas
163
Table- 5.4.3 Prevention and Control Activities for Natural Disaster by GOs/NGOs
164
Table-5.4.4 Type of Destruction, Relief and Rehabilitation Measures / Activities
166
Table-5.4.5 Warning Systems 168
Table- 5.4.6 Life Saving Warning System at the Time of Natural Disaster
170
Table- 5.4.7 Recent Disaster Experience 172
Table-5.4.8 Protection of Huts 173
Table-5.4.9 Common Diseases at the Time of Disaster 174
Table-5.4.10 Respondents’ Preference on Climate Change. 175
Table-5.4.11 Information about Tsunami 177
Table- 5.4.12 Cause of Tsunami and Habitation 179
Table-5.4.13 Loss of Movable and Immovable Property After Tsunami 181
Table- 5.4.14 Catching of Fish before Tsunami 183
Table-5.4.15 Fear and Experience of Tsunami 184
Table- 5.4.16 Knowledge of Monsoon Reports & Volcanic Eruption 186
Table-5.4.17 Knowledge on the Occurrence of Tsunami 187
Table- 5.4.18 Alternative Occupation and Training 189
Table- 5.4.19 Communications after Tsunami 191
Table - 5.5.1 Any Symptoms Before Tsunami 193
Table- 5.5.2 Communication in the Community 195
Table-5.5.3 How do you Communicate Others During Disaster 197
Table- 5.5.4 Suggested Measures to Minimize the Impact of Tsunami 199
Table- 5.5.5 The role of Panchayat at the Time of Disaster 200
Table-5.5.6
The Role of Panchayat/ GOs/NGOs to Control/Minimize the Disaster
201
Table 5.5.7 Role of Community to Minimize the Devastation and Expectation from Government
203
Table - 5.5.8 Preferred Mechanism and Warning System 204
Table-5.5.9 Management of Natural Disaster & Knowledge of Early Warning System
206
Table-5.5.10 Preferred Early Warning System 207
Table-5.5.11 Respondent’s Disaster Preparedness 208
Table-5.5.12 What Type of Preparedness do you know in Addition to EWS
209
Table-5.5.13 Disaster Communication 210
Table-5.5.14 Climatic Change After Tsunami 212
Table-5.5.15 Your Work Affect Because of the Change 213
Table-5.5.16 Tsunami Resistance and Relief Center 214
Table-5.5.17 Respondents’ Opinion Towards Removing Huts From Costal Area
215
Table-5.5.18 Respondents’ Willingness to Live in Coastal Area 216
4
EXECUTIVE SUMMARY
Indian social structure is marked by a number of exclusions and
marginalisations due to the perpetuation of inequalities; exploitations etc. in view of
segmentalisation of the society as well as the system of socio-economic stratification.
The people who are subjected to exclusion are being deprived of what is due to them.
Accordingly the process of alienation has been set in motion the coastal people and
communities are no exception to this feature of exclusions.
As regards coastal social life is concerned, it is prone to lot of uncertainties
and risks as the life is a real struggle between life and death the fishing as the major
work of the coastal people, it is subjugated to the vagaries of tidal waves, cyclone,
monsoon, flood and other natural disaster like tsunami which are beyond their
controls, preventions and managements. Among all this natural disaster, the tsunami
which struck the coastal regions of Tamil Nadu and in the neighbor States viz.,
Kerala, Pondicherry, Andaman & Nicobar Islands and also the neighbor country Sri
Lanka on December 26, 2004 was severe in its magnitude and volume though it
emerged from the coast of Indonesia the severity of loss of human and materials like
boat, net, hut, were all colossal in nature, form and its extent. Tamil Nadu particularly
Kanniyakumari, Cuddalore, Nagapattinam were severely affected, uprooted in the
form of structural and functional destructions.
The task of relief and rehabilitation was voluminous and the government alone
was unable to meet out the expectation and resettlement of the affected people the
NGOs, Corporate sector, funding agency and other socially conscious groups and
individuals had volunteered to fulfill the task of habitat development and rejuvenation
and reconstruction of coastal life.

5
Despite the works of the agencies concerned in the field of relief and
rehabilitation to the victims the uncertainties and risks in the coastal life remind as it
is. To deal with the problem of risks and uncertainties in coastal life it was felt that
there must be a system of community preparedness to take the challenges of
uncertainties and undertaken systematically the disaster mitigation and management
activities. This research emerged from this background with a focus on social
exclusion, community preparedness in disaster management with a view to influence
policies and programmes with the following objectives, to make a comprehensive
analysis of the social structure of the coastal communities in the study area, to expose
the extent of social exclusions and marginalistion as a result of natural disasters with
reference to people living in the tsunami affected coastal areas, to expose the
circumstances leading to occurrence of various types of natural disasters and the risky
social life in the coastal areas, to elicit community’s preparedness in disaster
management with particular reference to tsunami affected coastal areas, and to
suggest suitable measures and a plan of action for community’s preparedness and
disaster management in the tsunami affected areas. The project proposal was
sanctioned by the University Grants Commission (UGC), New Delhi and provided
necessary funding support for which the Principal Investigator profusely thanks the
UGC.
The field works had been carried out in coastal districts of Tamil Nadu
namely Cuddalore and Kanniyakumari in the selected clusters like
Thevanampattinam, Singarathoppu in Cuddalore district and Manakudi in
Kanniyakumari district. The pilot study based pre tested personal interview schedule
covering the objectives of the study was administered with the selected respondent in
the study districts.

6
Since the topic is highly proactive and sensitive the Principal Investigator
Dr.S. Gurusamy and Project Fellow Mr.R. Kathiravan had to struggle hard while
they were on while field investigations. However, without the association of NGOs,
PRIs, CBOs, Youth, Fishermen Associations, Church based Missions, etc. in both the
districts the investigators would not have successfully carried out the field
investigations and collected by primary data. The investigator had to walk several
kilometers in the coastal areas for conducting enquiries. Though painful the
experience was really a rewarding intellectual exercise. The Principal Investigator
records his sincere thanks for all help and assistance provided by all concerned in this
regard. The credit of successful field operation goes to the respondents, leaders and
other knowledgeable persons. In the course of field investigation the Principal
Investigator along with the Project Fellow met the District Collectors, Deputy
Collectors, In-charge of Relief and Rehabilitation, RDOs, VAOs, etc. for not only
collecting the necessary data but also their contributions were useful drafting and
finalizing the action plan focusing on mainstreaming the socially excluded community
preparedness and disaster management.
The primary data collected from respondent had been statistically processed
by means of SPSS and multi dimensional tables were drafted for appropriate analysis
and interpretation. Based upon the tabular analysis the major findings and logical
conclusion were finalised and incorporated. This research report is organised with
seven chapters. The Chapter -I provides the Introduction of the topic precisely
wherein the necessary background material on natural disaster with special reference
to tsunami, Chapter-II presents an elaborate description of Natural Disasters in the
form of the scenario, Chapter-III covers the relevant Review of Literature indicating
the research gap, Chapter-IV deals with Research Methodology of this study, the

7
Data Analysis and Interpretation was presented in Chapter-V, Summary of Major
Findings and Conclusion appear in Chapter-VI and finally the Action Plan to deal
with the Social Exclusion, Community Preparedness and Disaster Management was
incorporated in Chapter-VII in order to influences policies and programmes. The
select Bibliography and Appendices are also added at the end of the report.
(Dr.S.GURUSAMY)
PRINCIPAL INVESTIGATOR
8
CHAPTER-1
INTRODUCTION
Concept of Social Exclusion
The invention of the term social exclusion is usually attributed to Rene Lenoir,
then Secretaries d’état a l’ Action Social in the Chirac government, who published Les
Exclus: Un Francais sur dix, in 1974.Lenoir’s ‘excluded’ included a wide variety of
people: not only the poor, but also handicapped, suicidal and aged people, abused
children, substance abusers, etc. – about 10 per cent of the French population. The
term gained popularity in France during the 1980s (Silver 1994), the period of
economic crisis and restructuring, the crisis of the welfare state, and various social
and political crises. The term exclusion was used to refer to various types of social
disadvantage, related to the new social problems that arose: unemployment,
ghettoisation and fundamental changes in family life (Cannan 1997). Old welfare state
provisions were thought incapable of dealing with these problems, and new social
policies were developed.
The popularity of the new term was partly the result of the unpopularity in
France of the British concept of ‘poverty’. This was discredited because of its
association with Christian charity, the ancient regime, and utilitarian liberalism.
French Republicans have rejected both liberal individualism and socialism in favor of
the idea of ‘solidarity’, and the welfare state was justified as means of furthering
social integration. Correspondingly, social exclusion was defined as a rupture of the
social fabric, and attributed to a failure of the State.1
Social Exclusion:
Social exclusion relates to the alienation or disfranchisement of certain people
within a society. It is often connected to a person’s social class, educational status
9
and living standards and how these might affect their access to various opportunities.
It also applies to some degree to the disabled, to minority men and women of all
races, and to the elderly. Anyone who deviates in any perceived way from the norm
of a population can become subject to coercion or subtle forms of social exclusion.
“Social exclusion” is about the inability of our society to keep all groups and
individuals within reach of what we expect as a society (or) realize their full potential.
To be “excluded from society” can take various relative senses, but social exclusion is
usually defined as more than a simple economic phenomenon; it also has
consequences on the social symbolic field.2
Philosopher Axel Honneth speaks of a “struggle for recognition” which he
attempts to theorize through Hegel’s philosophy. In this sense, to be socially excluded
is to be deprived of social recognition and social value. In the sphere of politics,
social recognition is obtained by full citizenship; in the economic sphere (in
capitalism) it means being paid enough to be able to participate fully in the life of the
community. This concept can be gleaned from considering examples of the social
integration crisis: poverty, professional exclusion or marginalization, social and civil
disenfranchisement absence or weakening of support networks, frequent inter-cultural
conflicts, which relate not only to gender, race and disability but also crime.
Social exclusion is a major cause of crime and re-offending. Removing the
right to vote increases social exclusion by signaling to serving prisoners that at least
for the duration of their sentence, they are dead to society. The additional punishment
of disenfranchisement is not a deterrent. There is no evidence to suggest that
criminals are deterred from offending behavior by the threat of losing the rights to
vote…. (and) the notion of civic death for sentenced prisoners isolates still further
those who are already on the margins of society and encourages them to be seen as

10
aliens to the communities to which they will return on release. The problem of social
exclusion is usually tied to the problem of equal opportunity, as some people are more
subject to such exclusion than others. Marginalization of certain groups is a problem
even in many economically more developed countries, including the UK and US
where the majority of the population enjoys considerable economic and social
opportunities.
DIMENSIONS OF SOCIAL EXCLUSION
Social Exclusion manifests itself in diverse ways – one may consider
exclusion from education, housing property, ownership, domestic participation, access
to health services, public goods etc- in addition to these one may think in terms of
gender based exclusion, exclusion of the old age, infirm, widows, physically
challenged.
The social dimension of exclusion is of central importance in India as it has
the base of caste, the sociological character is fixed at birth due to ascription which is
enforced through the system of social stratification. It is erroneous to assume that the
process of economic development gives rise to the possibility of social exclusion. For
the trance prior to the commandments of modernization and economic development
there had been individual segments of socially excluded. Hence, the prevalence of
social exclusion is nothing to do with the process of modernization and economic
development.
Through the problems of poverty, unemployment, illiteracy, access to the
health care involved GOs, NGOs corporate sectors. Eradication of caste based
exclusion is much slower and a more complicated. Untouchables are affected by the
problems of social discrimination due to the social structural features of segmental
division, restriction on social intercourse, social hierarchy, civil disabilities and denial

11
of equality, restricted occupations and marriages etc. through the structure of Hindu
society which perpetrates the notion of social exclusion.
Vulnerability and Exclusion
The ongoing process of relief and rehabilitation has seen the exclusion of
several groups of people because of a complex matrix of reason relating to factors as
diverse as inherent vulnerability and active discrimination, as well as systematic
deficiencies.
The special needs of vulnerable group such as women, children, the disabled,
and the aged were not considered in the relief phase. For instance, the relief packages
distributors did not contain even children’s clothing; older people also found it
difficult. The service by helpage international during relief phase reveals that the main
reason for developing invisibility of older people is the absence of data disaggregated
by age (Healpage International - 2005). Women faced several problems including
those related to lack of privacy and appropriate sanitation facilities.
There are reports of dalits facing discrimination during the relief phase, and
being denied even food aid on the grounds that there were no deaths among them
(Alternatives Law Forum, and Problems of Relief Distribution in the Immediate
Aftermath, para 2) In the rehabilitation phase the prospect of relocation led to caste
related problems with certain fish worker communities opting for relocations
identifying suitable sites when ‘dalit’ communities were between the new site and the
sea.
Disaster Management
According to the Indian National Disaster Management Act of 2005, disaster
management means a continuous and integrated process of planning, organising,
coordinating and implementing measures which are necessary or expedient for
12
1) Prevention of danger or threat of any disaster
2) Mitigation or reduction of risk of any disaster or its severity or consequences
3) Capacity building
4) Preparedness to deal with any disaster
5) Prompt response to any threatening disaster situation or disaster
6) Assessing severity or magnitude of effects of any disaster
7) Evacuation, rescue and relief and rehabilitation and reconstruction.
The High-powered Committee defines Disaster Management “as a collective
term encompassing all aspects of planning for and responding to disasters including
both pre and post disaster activities. It may refer to the management of both the risk
and consequences of disasters”.
Clearly the term management has emerged as an umbrella term that
encompasses the entire disaster cycle including mitigation. This needs careful noting
and wide spread awareness because traditionally the term management was
restrictively used to address only post disaster operations. Unless the old mindsets get
changed the causes of disaster mitigation will continue to suffer at the hands of
tradition and get integrated with the development process.
Definition and Guidelines
EN-DAT (The International Disaster Database) defines a disaster as “a
situation or event which overwhelms local capacity necessitating a request to national
or international level for external assistance; an unforeseen and often sudden event
that causes great damage destruction and human suffering”. For a disaster to be
entered into the EN-DAT database at least one of the following criteria must be
fulfilled: 10 or more people reported affected or declaration of people killed or 100
people reported affected or declaration of a state of emergency or call for international
assistance.

13
The number of people killed includes people confirmed as dead and presumed
dead. People affected require immediate assistance; during the period of emergency
i.e requiring the basis of survival needs such food, water, shelter, sanitation and
immediate medical assistance people reported injured or homeless or aggregated with
those reported affected to total number of people affected.
The economic impact of a disaster usually consists of direct consequences (e.g
damage to infrastructure, crops, housing) and indirect consequences (e.g loss of
awareness, unemployment, market destabilization) in EN-DAT the registration figures
correspond to the damage value at the moment of the event and usually only to the
direct damage, expressed in US$ EN-DAT distinguishes two generic categories for
central (natural and technologies) divided into 15 main categories, themselves
covering more than 50 sub categories. Natural disasters are split into specific groups.3
1. Hydro-metereological disasters: valances / landslides, droughts, extreme
temperatures, floods, forest / scrub fires windstorms and other disasters, such
as insect intersection and wave surges;
2. Geographical Disaster: earthquake, tsunami and volcanic eruption. The
technological disasters comprise three groups. Explosion ; fires gas leaks;
poisoning; radiation;
3. Industrial Accidents: chemical spills, collapse of industries, infrastructure
explosions; fires; gas leaks; poisoning; radiation; transport accident; by air;
rail; road or water transport;
4. Miscellaneous Accidents: collapse of domestic/ non industrial structures
explosion; fires.
Cyclone is a recurring feature of the coastal area of the tropical maritime state; it
is therefore possible to take adequate measure for protection to the extent possible in
14
such vulnerable areas. There should be organized preparedness to effectively deal
with cyclone so as to bring down loss of life, damage to property and human distrust
predictable minimum; death destruction and damages can be reduced considerably by
improving and organizing pre-disasters preparedness. This will comprise
• Permanent defense,
• Disaster mitigation,
• Disaster management
Meaning of disaster management
Disaster is a sudden, calamitous event causing great damage, loss and
destruction and devastation to life and property. The damage caused by disaster is
immeasurable and varies with the geographical location, climate and the type of the
earth surface/degree of vulnerability. This influences the mental, socio-economic,
political and cultural state of the affected area.
Disaster Mitigation
According to the Indian Act of 2005, “mitigation means measures aimed at
reducing the risk, impact of effect of a disaster or a threatening disaster situation”.
There is the urgent need to ensure that disaster mitigation strategies get emerged and
integrated with the very development process.
Disaster: a disaster is a sudden or great misfortune which can, perhaps be rightly
formed An “act of God” many natural disasters are of meteorological origin, barring
perhaps an earthquake or a fire, the most common disasters which are diversion,
distress and cyclones, floods, severe storms, droughts and heat/cold waves, even in
the case of pollution disasters, fire, locus invasion, etc. Wind temperature and
humidity play on important role in their genesis and fanning out process. It is
accepted that the government and the community must come to the rescue and succor
15
of the victims of disasters. A well planned organization exists in all countries for
“disasters mitigation” 5
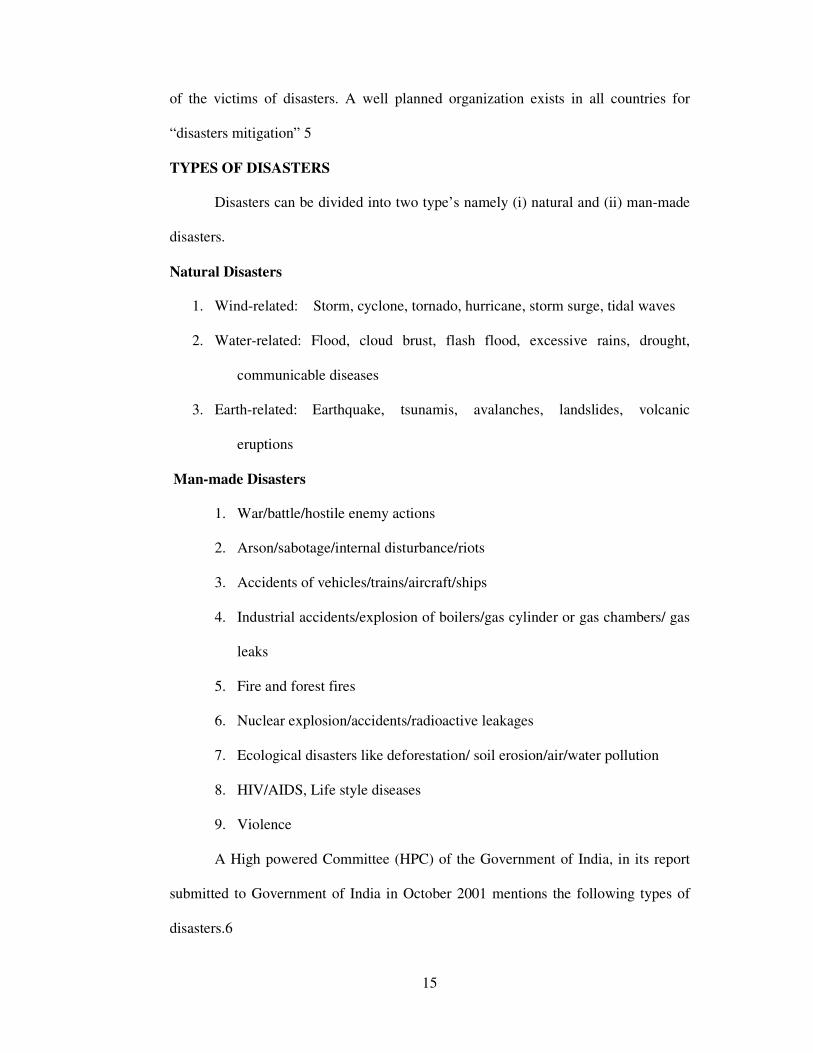
TYPES OF DISASTERS
Disasters can be divided into two type’s namely (i) natural and (ii) man-made
disasters.
Natural Disasters
1. Wind-related: Storm, cyclone, tornado, hurricane, storm surge, tidal waves
2. Water-related: Flood, cloud brust, flash flood, excessive rains, drought,
communicable diseases
3. Earth-related: Earthquake, tsunamis, avalanches, landslides, volcanic
eruptions
Man-made Disasters
1. War/battle/hostile enemy actions
2. Arson/sabotage/internal disturbance/riots
3. Accidents of vehicles/trains/aircraft/ships
4. Industrial accidents/explosion of boilers/gas cylinder or gas chambers/ gas
leaks
5. Fire and forest fires
6. Nuclear explosion/accidents/radioactive leakages
7. Ecological disasters like deforestation/ soil erosion/air/water pollution
8. HIV/AIDS, Life style diseases
9. Violence
A High powered Committee (HPC) of the Government of India, in its report
submitted to Government of India in October 2001 mentions the following types of
disasters.6

16
I: Water and Climate related Disasters
1. Floods and Drainage Management 2. Cyclones3. Tornadoes and Hurricanes
4. Hailstorm, 5. Cloud Burst, 6. Heat Wave and Cold Wave, 7. Snow
Avalanches, 8. Droughts, 9. Sea Erosion,10. Thunder and Lighting,
II: Geologically related Disasters
1. Landslides and Mudflows, 2. Earthquakes, 3. Dam Failures / Dam Bursts
4. Mine Fires
III: Chemical, Industrial and nuclear related Disasters
1. Chemical and Industrial Disasters, 2. Nuclear Disasters
IV: Accident related Disasters
1. Forest Fires, 2. Urban Fires, 3. Mine Flooding, 4. Oil Spill, 5. Major
Building Collapse, 6. Serial Bomb Blasts, 7. Festival Disasters and
Fires, 8. Electrical Disasters and Fires, 9. Air, Road, and Rail
Accidents, 10. Boat Capsizing, 11. Village Fire.
V: Biologically related Disasters
1. Biological Disasters and Epidemics, 2. Pest Attacks, 3. Cattle Epidemics,
4.Food Poisoning
Types of Natural Calamities
Different natural calamities can be distinguished from each other in terms of
their nature and extent of their impact, calamities like earthquake, hail storms. But
they are restricted in their impact in terms of time and space. Similarly, though floods
and cyclones occur with some element of warning yet their occurrence is confined in
duration. Drought, on the other hand, spans over a much longer time frame and its
adverse impact on the economic activities and life in an area is of a more lasting
nature. The measures required to meet the threats posed by different calamities,
17
therefore, differ considerably in terms of disaster preparedness and amelioration of the
economic and social life of the affected people.
Major and Minor Calamities
Natural calamities may be broadly grouped into major and minor types
depending upon their potential to cause damage to human life and property. While
natural calamities like earthquakes, droughts, floods and cyclones could be regarded
as major, hailstorms, avalanches, landslides, fire accidents etc. whose impact is
localized and the intensity of the damage much less can be categorized as minor
calamities. Hailstorms, avalanches, landslide and fires also occur without any
appreciable degree of forewarning and cause damage to properties and lives.
However, areas prone to rich disasters also could be identified and certain
precautionary measures taken according to the extent of potential threat, requiring
general awareness and an ability to relate to a pre-defined system of appropriate
responses on the part of the local administration. Disaster wipes out years of
development in a matter of hours. It destroys farm land, animals, livelihoods and the
future making the people more poor and more hungry.
Experiences have shown that the people, the community, the society, the
government can reduce the risk by preparedness. But it is not enough. Preparedness
is only a part of the broader risk reduction agenda. And reducing the risk posed by
disasters is not an optional area and is central to the very success of development
itself. Northeast India is vulnerable to a number of disasters. It is in highest seismic
zone to flood, landslide/flash flood common to the whole region. 7
Losses due to Disaster
Losses due to disaster both direct and indirect include reliable estimates.
According to one World Bank estimate reported direct losses are on the order of $300
18
billion over the past 35 years. In 2005 alone disaster in India caused direct losses
approximately to the tune of Rs.87, 500crore. During the period 1994-98
approximately 120 million people were affected by natural disasters in one-way or the
other and according to one estimate the economic losses rose to about 28000crore.
The losses mounted to Rs.47000crore during the period 1998-2003. Authentic count
of loss of human and cattle as a whole is not available.
Disaster Data: Essential for Preparedness
The need for systematic data for mitigation and prevention has been an
increasing concern of national governments, UN and other International Development
Institutions and response agencies. Until recently the needs were addressed on an
adhoc basis, collecting the information at the time of emergency. As a result, data
were incomplete, out dated or unusable for a variety of reasons even if better quality
information existed. The time pressure to respond quickly for fund rising or relief
plans was usually paramount and the quality and availability of information scattered.
Disaster management remained reactive in nature, focusing on relief and then
rehabilitation and reconstruction. Prevention planning or community preparedness
was really funded and not a policy priority with national and International
Development Institutions.
With the increase in the scope of disaster impacts, mostly in the poorer
developing countries, concern has been mounting regarding the poor state of
preparedness, mitigation and prevention. Natural disasters engender serious setback
to the development process – highlighted in recent years by earthquake in India
(2001), Iran (2003), Pakistan (2005), and the Indian Ocean Tsunami (2004). The
result of these events has led to the demand for disaster data from policy and
development planners has increased.
19
Science of Tsunami
Tsunami is a series of waves with long wavelength. The word ‘tsunami’ takes
the origin from the Japanese word Soo -Nam-Mee meaning harbor waves (adopted
for general use in 1963 by an international scientific conference). It is often referred
to as “seismic waves” as more frequently tsunamis are generated by earthquakes and
less caused by landslides, volcanic eruption or meteorite impact on ocean. This is also
quoted frequently as “tidal waves” though it does not belong to such category in spite
of the influences at tidal levels. When the wave strikes the cost tsunami occurs with a
wavelength around 500km and lasts for duration of 10 minutes to two hours. This can
be characterized as a shallow water wave that is different from wind generated one
which usually has a wavelength of 100 to 200 meters and last for 5 to 20 seconds. As
it approaches the coast the height of the waves increases so that everything on the way
is swallowed by the giant waves.
Tsunamis are generated by spontaneous displacement on the ocean floor.
Earthquake of a magnitude greater than 6.5 causing displacement of sea bed causes
tsunami. (ref citation sources: http://wcatwc.arh.noad. gcv./physis.htm). Tsunami are
common over the Pacific Ocean because it is surrounded on all sides by seismically
active belt. Countries like Japan, Hawaii Island and Indonesia that fall in this belt are
susceptible to tsunami. There are not much instance where the tsunami have struck
India before the most devastating Indian Ocean tsunami of 2004.
Tsunami of 26 December 2004 and related tectonic setting:
A large tsunami triggered of due to an earth quake in the offshore surface at
7:58:53 a.m. local time on of the Indian Ocean, primarily Indonesia, Thailand,
Malaysia, Andaman-Nicobar (India), East coast of India, Srilanka, Somalia,
Madagascar and several small islands in this area. It caused maximum loss in terms of

20
loss of lives of home. More than 200,000 human lives are reported to have been lost
and millions have been injured. Thousands are reported missing. It has affected the
citizens of more than 50 countries including tourists from developed countries. The
loss of property is so large that an even unofficial report hesitates to make an estimate
and suggests that it may be decades to normalize the situation in the affected region.
The details of this earthquake are as follows: magnitude = 9.0 local depths = 30 km
epicenter=3.32o N and 95.85o E offshore at Sumatra with nearest town of Banda
Aceh about 250km NNN in northern part of Sumatra. The main shock was followed
by several effects aftershocks, which were primarily confined to the Burma micro
plate extending towards Andaman- Nicobar Islands, north of the epicenter area. The
study of the main shock and the immediate after shocks suggest that approximately
1200 km of plane, which resulted in the seismic activity. Subsequently the magnitude
is modified to 9.3 and focal depth to 15 km with much larger slip area covering the
entire stretch of Burma micro plate which makes it the second largest recorded
earthquake during the last 10 years.4
The loss during this tsunami on such a large scale appears to be due to the
unpreparedness in the countries bordering the Indian Ocean against tsunami waves
and socio-economic conditions of the people living along the coasts of these
countries. The lack of preparedness has been primarily attributed to one occurrence
of tsunami in the Indian Ocean so far. However, according to the records in the last
60-65 years atleast three large tsunamis had hit the Indian coasts related to
earthquakes in the Andaman Sea in 1941, offshore Karachi in 1945 and the present
one. The principle of recurring period may apply to earthquakes but not to tsunami.
The tsunamis in 1941 and 1945 suggest that they can strike even at close interval
especially because they are likely to originate from an earthquake along the plate

21
boundaries in the Arabian Sea, The Indian Ocean and the Bay of Bengal and any
other activity such as landslides or volcanic eruption at the bottom of these oceans.
The second offshore Karachi in 1945 resulted into a wave front of almost the same
magnitude of the present earthquake (11-11-5m) along the coasts of Gujarat, India.
Probably the biggest tsunami was also reported from the Indian Ocean related to the
Kurkuton volcanic explosion in 1883. This one was so big that it caused about 40m
high waves along the coasts of Indonesia and some of its Islands vanished under sea.
It affected the entire Indian and Pacific Oceans and even affected the environment in
these regions for days and weeks. With such continuous activities happening in the
Indian Ocean continued unpreparedness around the Indian ocean cannot be logically
explained. As tsunami affects several countries at a time there ought to be an
international effort through international organization like UN etc. as being done in
case of eradication of AIDS, polio etc.
The offshore regions of Andaman-Nicobar, Sumatra-Java are active seduction
zones and are well known for high seism city. Hence, the Indian plate sub ducts under
plate with clockwise rotation in new direction with a speed of 6 mm year causing an
oblique convergent. It resets into high stress generation, which is realized as
earthquakes from time to time. The tectonics in epicenter area of the 26 December
2004 earthquake is further complicated as it is located at the junction of tour plates
viz. Indian, Australian, Burma and Sunda North of the Sunda plate lies at the Euration
plates and their junction represents a continent boundary which makes the
transmission of stress towards north difficult in the epicenter zone. Indian Ocean
tsunami of 2004 and its associated destruction constitute one of the worst tragedies in
the world. It caused heavy damage to several Indian Ocean-brim countries and the
micro level socio-economic impact of this disaster is highly localized and was felt
22
more starkly by the members of affected communities. Fisherflok was the most
affected segment living in the vicinity of the coast that endured damage Such as the
loss of housing and livelihood.
Nature, Disaster and Recovery
Three months later, an 8.7 magnitude earthquake with roughly the same
epicenter generated widespread panic at the prospect of another tsunami and killed
almost 2,000 people in Indonesia. Then, in the fall of 2005, a record number of
hurricanes battered the Caribbean, Mexico, and the U.S Gulf Coast. At the same time,
Central America experienced a series of natural disasters including a hurricane,
flooding and an earthquake.
INDIAN OCEAN EARTHQUAKE
The 2004 Indian Ocean Earthquake, known by the scientific community as the
Sumatra-Andaman earthquake, was an undersea earthquake that occurred at 00:58:53
UTC (07:58:53 local time) on December 26, 2004. The tsunami generated by the
earthquake killed approximately 275,000 people, making it one of the deadliest
disasters in modern history. The disaster was also known in Australia, Canada and the
United Kingdom as the Boxing Day Tsunami. It was still Christmas Day in the
western hemisphere when the disaster hit.
Various values were given for the magnitude of the earthquake, ranging from
9.0 to 9.3 (which would make it the second largest earthquake ever recorded on a
seismograph), though authoritative estimates now have put the magnitude at 9.15.
In May 2005, scientists reported that the earthquake itself lasted close to ten
minutes when most major earthquakes. (CNN) It also triggered earthquake elsewhere;
as far as Alasks (Science).
23
The earthquake originated in the India Ocean just north of Simeulue Island, of
the western coast of northwestern Sumatra, Indonesia. The resulting tsunami
devastated the shores of Indonesia, Sri Lanka, South India, Thailand and other
countries with waves up to 30 m (100 ft). It caused serious damage and deaths as far
as the east coast of Africa; with the furthest recorded death due to the tsunami
occurring at Port Elizabeth in South Africa, 8,000 km (5,000 mi) away from the
epicenter.
Approximately 170,000-275,000 were thought to have died as a result of the
tsunami and the count is not yet complete. In Indonesia in particular, 500 bodies a day
were still being found in February 2005 and the count was expected to continue past
June (CNN- February 10, 2005. the exact final toll may never be known due to bodies
having been swept away to sea, but current estimates use conservative methodologies.
Relief agencies warn of the possibility of more deaths to come as a result of
epidemics caused by poor sanitation, but the threat of starvation seems now to have
been largely averted (BBC news, January 9, 2005. The plight of the many affected
people and countries prompted a widespread humanitarian response.8
QUAKE CHARACTERISTICS
The earthquake was initially reported as 8.6 on the Richter scale. The Pacific
Tsunami Warning Centre (PTWC) also estimated it at 85 shortly after the earthquake.
On the moment magnitude scale, which is more accurate for quakes of this size, the
earthquake‘s magnitude was first reported as 8.1 by the U.S Geological Survey. After
further analysis this was increased to 8.5, 8.9 and 9.0 (USGS, 2004. In February 2005,
some scientists revised the estimate of magnitude to 9.3. Although the Pacific
Tsunami Warning centre has accepted this, the USGS has so far not changed its
estimate of 9.0 (McKee, 9 February, 2005. The most definitive estimate so far has put
the magnitude at 9.15).
24
The hypocenter of the main earthquake was at 3.316oN,95.854o E (3o 19’N 95o
51.24’E), some 160 km (100 mi) west of Sumatra, at a depth of 30 km (18.6 mi)
below mean sea level (initially reported as 10 km). This is at the extreme western end
of the Ring of Fire, an earthquake belt that accounts for 81 percent of the world’s
largest earthquakes (USGS FAQ,). The earthquake itself (apart from the tsunami) was
felt as far away as Bangladesh, India, Malaysia, Myanmar, Thailand, Singapore and
the Maldives.
Power of the Earthquake
The total energy released by the 2004 Indian Ocean earthquake has been
estimated as 3.35 exajoules (3.35 x10 joules). This is equivalent to 0.8 gigations of
TNT, or about as much energy as is used in the United States in 11 days. However,
the most reliable seismic energy release estimate, as of the September 30th 2005, is 1.1
x 1018 joules. This corresponds to about 0.25 gigatons of TNT. The earthquakes is
estimated to have resulted in an oscillation of the Earth’s surface of about 20-30 cm
(8 to 12 in), equivalent to the effect of the tidal forces caused by the Sun and Moon.
The shock waves of the earthquake were felt across the planet; as far away as
Oklahoma, where vertical movements of 3 mm (0.12 in) were recorded. The entire
Earth’s surface is estimated to have moved vertically by up to 1 cm.
The shift of mass and the massive release of energy very slightly altered the
Earth’s rotation. The exact amount is yet undetermined, but theoretical models
suggest the earthquake shortened the length of a day by 2.68 microseconds (2.68US)
(or about one billionth of the length of a day) due to a decrease in the oblations of the
Earth. It also caused the Earth to minutely “wobble’ on its axis by up to 2.5 cm (1 in)
in the direction of 145oeast longitude or perhaps by up to 5 to 6 cm (2.0 to 2.4in).
However, due to tidal effects of the Moon, the length of a day increases at an average
25
of 1.5µs per year, so any rotational change due to the earthquake will be lost quickly.
Similarly the natural Chandler wobble of the Earth can be up to 15 m (50ft).
More spectacularly, there was 10m (33ft) movement laterally and 4 to 5 m (13
to 16 ft) vertically along the fault line. Early speculation was that some of the smaller
islands southwest of Sumatra may have moved southwest by up to 20 m (66 ft). There
were also calculations that the northern tip of Sumatra, which is on the Burma Plate
(the southern regions are on the Sunda plate), may have moved up to 36 m (118 ft)
southwest. Since movement was vertical as well as lateral, some coastal areas may
now be below sea level. Measurements using GPS and satellite imagery are being
used to determine the extent and nature of actual geophysical change. The Andaman
and Nicobar Islands appear to have shifted southwest by around 4m (13 ft), according
to GPS data.
In February 2005, the Royal Navy vessel HMS Scott surveyed the sea bed
around the earthquake zone, which varies in depth between 1,000 m (3,300ft) and
5,000 m (16,500 ft) west of Sumatra. The survey conducted using a high-resolution
multi-beam solar system, revealed that the earthquake had a huge impact on the
topography of the sea bed. It had created large thrust ridges, about 1,500 m high,
which have collapsed in places to produce large landslides several kilometers across.
One landslide consisted of single block of material some 100 m (300 feet) high and 2
km (1.25 mi) long. The force of the displaced water was such that individual blocks of
rock, massing millions of tons apiece, were dragged as much as 10 km (7 mi) across
the sea bed. A newly formed oceanic trench several kilometers wide was also found in
the earthquake zone.
By a beneficial and remarkable coincidence, satellites TOPEX/Poseidon and
Jason 1 happened to pass over the tsunami as it was crossing the ocean. These

26
satellites carry radars that measure precisely the height of the water surface;
anomalies of the order of 50cm (20 in) were measured. Measurements from these
satellites may prove invaluable for the understanding of the earthquake and tsunami.
Unlike data from tide gauges installed ion shores, measurements obtained in the
middle of the ocean can be used for computing the parameters of the source
earthquake without having to compensate for complex effects close to the coast.
Inversion of this height data may help adjust the parameters for the source earthquake.
The sudden vertical rise of the seabed by several meters during the earthquake
displaced massive volumes of water, resulting in a tsunami that struck the coasts of
the Indian Ocean. A tsunami which causes damage far away from its source is
sometimes called a “Tele Tsunami”, and is much more likely to be produced by
vertical motion of the seabed than by horizontal motion (earthquakes and tsunamis,
Lorca et al.).
See a full-length animation of how the waves travelled (large file, about 1
MiB) to see exactly how and why some countries were more affected than others. The
tsunami, like all others, behaved very differently in deep water than in shallow water.
In deep ocean water, tsunami waves form only a small hump, barely noticeable and
harmless, which generally travels at a very high speed of 500 to 1,000 km/h (310 to
620 mph); in shallow water near coastlines, a tsunami slows down to only tens of
kilometers an hour but in doing so forms large destructive waves. Scientists
investigating the damage in Aceh found evidence that the wave reached a height of 24
m (80 ft) when coming ashore along large stretches of the coastline, rising to 30m
(100 ft) income areas when travelling inland.
Radar satellites recorded the heights of tsunami waves in deep water: At two
hours after the earthquake, the maximum height was 60 cm (2 ft). These are the first
27
such observations ever made. However, these observations could not have been used
to provide a warning, because the satellites were not intended for that purpose and the
data took hours to analyze.
Because the 1,200 km of fault line affected by the quake was in a nearly
northsouth orientation, the greatest strength of the tsunami waves was in a east-west
direction. Bangladesh, which lies at the northern end of the Bay of Bengal, had very
few casualties despite being a low-lying country relatively near the epicenter. It also
benefitted from the fact that the earthquake proceeded more slowly in the northern
repute zone, greatly reducing the energy of the water displacement in that region.
Coast that have a mass between them and the tsunami’s location of origin are
usually a safe: however, tsunami waves can sometimes diffract around such land
masses. Thus, the State of Kerala was hit by the tsunami despite being on the western
coast of India, and the western coast of Sri Lanka also suffered substantial impact.
Also distance alone is no guarantee of safety; Somalia was hit harder than Bangladesh
despite being much farther away
Because of the distances involved, the tsunami took anywhere from fifteen
minutes to seven hours (for Somalia) to reach the various coastlines (see travel time
maps). The northern regions of the Indonesian island of Sumatra were hit very
quickly, while Sri Lanka and the east coast of India were hit roughly 90 minutes to
two hours later. Thailand was also struck about two hours later, despite being closer
to the epicenter, because the tsunami travelled more slowly in the shallow Andaman
Sea off its western coast.
The tsunami was noticed as far as Struisbaai in South Africa, some 8,500 km
(5,300 mi) away, where a 1.5 (5 ft) high ‘tide’ surged onshore about 16 hours after the
quake. It took a relatively long time to reach this spot at the southernmost point of
28
Africa, probably because of the broad continental shelf off South Africa and because
the tsunami would have followed the South Africa coast from east to west.
Some of the tsunami’s energy escaped into the Pacific Ocean, where it
produced small measurable tsunamis along the western coasts of North and South
America, typically around 20 to 40 cm (7.9 to 15.7 in). At Manzanillo, Mexico, a 2.6
m (8.5 ft) rest-to tough tsunami was measured. This puzzled many scientists, as the
tsunamis measured in some parts of South America were larger than those measured
in some parts of the Indian Ocean. It has been theorized that the tsunamis were
focused and directed at long ranges by the mid-ocean ridges which run along the
margins of the continental plates.
Sings and Warnings
Despite a lag of upto several hours between the earthquake and the impact of
the tsunami, nearly all of the victims were taken completely by surprise; there were no
tsunami warning systems in the Indian Ocean to detect tsunamis, or equally
importantly, to warn the general populace living around the ocean. Tsunami detection
is not easy because while a tsunami is in deep water it has a very low height and a
network of censors is needed to detect it. Setting up the communications
infrastructure to issue timely warning is an even bigger problem, particularly in a
relatively poor part of the world. Scientists were also hampered by the incorrect
initial estimates for the magnitude of the earthquake, which was originally put at 8.1.
The determination that the earthquake had actually been much stronger (and the
resulting tsunami much larger) was not made until after the tsunami had already
struck.
Tsunamis are much more frequent in the Pacific Ocean due to earthquake in
the “Ring of Fire’ and an effective tsunami warning system has long been in place

29
there. Although the extreme western edge of the “Ring of Fire” extends into the
Indian Ocean (the point where this earthquake struck), no warning system exists in
that ocean. Tsunamis there are relatively aware, despite earthquakes being relatively
frequent in Indonesia. The last major tsunami was caused by the Krakatoa eruption of
1883. It should be noted that not every earthquake produces large tsunamis; on March
28, 2005 a magnitude 8.7 quake hit roughly the same area of the Indian Ocean but did
not result in a major tsunami. In the aftermath of the disaster there is now an
awareness of the need for a tsunami warning system for the Indian Ocean. The UN
has started working on an Indian Ocean Tsunami warning System and aims to have
initial steps in place by the end of 2005. Some have even proposed creating a unified
global tsunami warning system, to include the Atlantic Ocean and Caribbean.
The first warning sign of a possible tsunami is the earthquake itself. However,
tsunami can strike thousands of miles away where the earthquake is only felt weakly
or not at all. Also, in the minutes preceding a tsunami strike the sea often recedes
temporarily from the coast. People in Pacific regions are more familiar with tsunamis
and recognize this phenomenon as a sign to head for higher ground. However, around
the Indian Ocean, this rare sight reportedly induced people, especially children to visit
the coast to investigate and collect stranded fish on as much as 2.5 km (1.6 mi) of
exposed beach, with fatal results.
One of the few coastal areas to evacuate ahead of the tsunami was on the
Indonesian island of Simeulue, very close to the epicenter. Island folklore recounted
earthquake and tsunami in 1907 and the islanders fled to inland hills after the initial
shake before the tsunami struck. On Maikhao beach in northern Phuket, Thailand, a
10 year old British girl named Tilly Smith had studied tsunamis in geography class at
school and recognized the warning signs of the receding ocean and frothing bubbles.
She and her parents warned others on the beach, which was evacuated safely

30
Disaster Preparedness and Management
National Preparedness.
The Central Asian countries have Ministries for emergency situations, which
deal with policy aspects, provide training, manage state disaster reserve resources, and
provide coordination among different levels of Government in developing and
implementing emergency plans. The People’s Republic of China (PRC) has, since
January 2005, a State Disaster Reduction Commission.
� Legal Framework. Each country has each own decrees, acts, and laws that
serve as legal basis for disaster management.
� Hazard/Risk Mapping. Most countries have risk maps. Those in the Central
Asian countries were prepared during the Soviet era, but their scale is not
suitable for risk management activities. Most of these maps are outdated.
� Disaster Preparedness Plans. Countries in the region have made different
levels of progress in developing disaster preparedness plans. The PRC has a
capacity-building program and is making safe storage sites for waste products
from metal processing.
� Structural Measures. In the Central Asian countries, many protective
structures remain from the Soviet era-such as dams, dikes for flood protection,
and sediment control devices. These structures lack maintenance, which not
only decreases their protective value but also can amplify a disaster when they
collapse.
� Community Involvement. General awareness for natural disasters,
preparedness, and mitigation is very low. In the PRC, a Community-based
disaster reduction outreach campaign has been launched.
31
Disaster Prevention and Preparedness
Preparedness measures may include forecasting and warning systems,
community education, and organisation and management of disaster situations
including the preparation of operational plans, Training of relief groups, the
stockpiling of supplies and the provision of the necessary funds. It must be supported
by appropriate emergency legislation which comes into force in disaster situations or
similar emergencies which cannot be avoided.
Prevention and preparedness measures are not isolated activities since both
can be undertaken together or one can be a continuation of the other. This is because
not all disasters can be prevented, and preventive measures may fail to achieve their
objectives. Thus, to limit or mitigate the effects of disasters which cannot be
prevented, certain measures have to be undertaken to return the community to
normality as soon as possible after the event. A variety of prevention and
preparedness measures has been applied in the countries of the ESCAP Region, albeit
with varying degrees of success and often in an uncoordinated fashion.
As previously stated, disaster prevention and preparedness consist of a wide
range of measures, some long term and others short-term, aimed at saving lives and
minimizing the amount of damage that might otherwise be caused. Prevention covers
the damage that might otherwise be caused. Prevention covers the long-term aspects
and is concerned with policies and programmes to prevent or eliminate the occurrence
of disasters.
Preparedness covers the short-term measure which is designed to cover the
action necessary during the approach of a possible disaster, during the existence of a
disaster situation and in the ensuing period devoted to relief and rehabilitation.
Disaster prevention and preparedness are usually accomplished using two
32
fundamental approaches. Firstly, it may be achieved using permanent controls,
structural or non-structural, designed and developed in advance of the disaster.
Secondly, it may be achieved by using temporary measures, planned in advance but
only put into effect during the emergency.
The destructive power of tropical cyclones is manifested by strong winds,
flooding and storm surges. Any disaster prevention and preparedness system must
include warnings and protective measures against each of these effects. Winds are a
fundamental property of tropical cyclones, whilst flooding and storm surges may be a
consequence of tropical cyclones but also of other natural events. The principal
preventive measures employed to mitigate the destructive and injurious effects of
tropical cyclones involve the introduction of building design and construction
standards aimed at improved resistance to the damaging effects of wind and water.
Disaster prevention measures attempt to lessen the impact of flooding or storm
surge on the social and economic conditions of human settlements in floodplains or
low lying coastal areas. The range of preventive controls adopted to protect
development on floodplains includes both structural measures such as channel
modifications, flood detention storages and levees which are designed to reduce the
incidence or extent of flooding, and non-structural measures such as flood insurance,
flood zoning restrictions, land-use management, economic incentives, public
information and community education. Non-structural measures are intended to
modify flood susceptibility and flood impact. The range of measures available to
protect against the effects of flooding is much wider than that available to reduce the
impact of tropical cyclones.
Preventative measures to protect low-lying coastal areas against damage from
tidal inundation also include structural and non-structural measures. The principal
33
structural measures involve the construction of embankments capable of withstanding
the anticipated storm surge heights and forces. Non-structural measures employ land-
use zoning and controls over occupation in high hazard areas. Building controls are
also imposed to restrict building on vulnerable areas. These controls require that flood
heights are set at safe elevation above a given datum.
The selection of the best mix of measures to prevent the occurrence of future
flood or storm surge disaster will be based on the consideration of all the available
structural and non-structural options. The optimal mix of measures will be based on
risk analysis and the economic performance of the overall scheme. Consideration of
social and environmental factors in addition to the legislative and legal constructions
should be included in the planning process.
Disaster preparedness is seen as that action taken when the occurrence of a
tropical cyclone, flood or storm surge threatens to become a disaster. Preparedness
activities are designed to reduce social disruption and losses to existing property and
are an essential component of overall disaster planning. They can serve in the absence
of more permanent measures to reduce the threat to loss of life and property.9
The main types of disaster preparedness include:
� Forecasting and warning systems;
� Evacuation from affected areas;
� Flood fighting
� Flood relief;
� Cyclone shelters.
Depending on the size of the drainage basin, the length of river and the time of
concentration of floodwater in the main channel, flood forecasts and warnings may be
issued well in advance of the arrival of the flood crest on large rivers. Flash floods
34
originating on small catchments present special problems and usually require some
form of forecasting based on rainfall estimates.
Although the forecasts for cyclones and floods may be accurate and timely they
may have little or no effects on the intended recipients if the warning system for
dissemination of the forecast is inadequate. Each agency responsible for emergency
operations should receive prompt forecasts and warnings of the changing
circumstances so that action needed to meet the emergency can be achieved.
Dissemination of forecasts requires an effective communication system based on
radio broadcasts, telephone and special warning systems. The evacuation of people
from a potential or actual disaster area is one of the most important elements of
disaster mitigation. Careful planning is necessary for the efficient evacuation and
relief of flood victims. To be effective the plan should define hazardous areas and
potential dangers. However, the difficulty in evacuating victims and property can be
increased if escape routes cannot cope with the traffic volume, if evacuation services
cannot be contacted or suitable evacuation equipment such as trucks, boats and
helicopters are not available.
Flood fighting can be defined as the taking of precautionary measures against
disaster at times of flood or storm-surge. These measures should aim to prevent
damage or to minimize its extent to protect life and property and in general, to ensure
the safety of the population. Successful flood fighting depends upon good
organization, thorough advance planning, well- trained personnel and the effective
coordination of operations at local, provincial and national levels. The planning
should cover all those who will be involved, the flood-fighting corps, municipality,
town or village officers, and the general public, to the regional and central
government. It involves the construction of temporary controls to exclude floodwater
from protected areas or the strengthening of existing structures to ensure protection.10

35
The main aim of relief is to provide immediate assistance to overcome
personal hardship and distress, including essential repairs to houses and the repair and
replacement of essential items of furniture and personal effects. Relief should include
the reception and care of evacuated victims, the provision of medical services and
similar activities.
This research emerges with this background of social exclusion in disaster
management in order to pace challenges of natural disasters area prone to such
disaster. This research attempts to make a comprehensive analysis of the social
structure of coastal communities, the extent of social exclusion and marginalization
that have taken place as a result of natural disasters with special reference to tsunami
and its impact on social life in coastal area. In addition, this research would attempt to
expose the community preparedness in the form of suggesting an action plan in
disaster management towards influencing policies and programmes.
36
CHAPTER-II
NATURAL DISASTERS: THE SCENARIO
The world health organization/emergency and humanitarian action department
define disasters as, “any occurrence that causes damage, ecological disruption, loss of
human life or deterioration of health and health service on a scale sufficient to warn
an extraordinary response from outside the affected community area”. Disasters are
classified as human made non-natural and natural. Natural disasters are environmental
events, not (directly) human made, such as volcanic eruption, earthquake, floods,
cyclones or more long term epidemics, drought, famine (catastrophic food shortage).
Human made or technological disaster are primarily caused by hardware failure and
human error resulting in toxic emissions for example explosion and transport accident
on setting a chemical spill, leading to insidious air, water and soil pollution and food
contamination.
Natural disaster – A Global Challenge
During the past four decades, natural hazards such as earthquakes, droughts,
floods, storms, and tropical cyclones, wild land fires and volcanic eruptions have
caused major loss of human lives and livelihoods, the destruction of economic and
social infrastructure as well as environmental damages. Economic losses have
increased almost ten times during this period. In the last 30 years, the number of
people directly affected has risen by more than tenfold to approximately USD 70
billion per year. Natural disaster in developing countries often wipes out a large
proportion of annual gross domestic product. In addition to the projected estimation
of 1, 00,000 many lives are lost every year due to natural hazards. The global cost of
natural disasters is anticipated to top $300 billion annually by the year of 2050, if the
likely impact of climate change is not countered with aggressive disaster reduction

37
measures. While no country in the world is entirely safe lack of capacity to limit the
impact of hazards remains a major burden for developing countries. An estimated
97% of natural disaster related deaths each year occur in developing countries and
although smaller in absolute figures, the percentage of economic loss in relation to the
Gross National Product (GNP) in developing countries far exceeds in the ones in
developed countries.
Natural disaster occurs when there is sudden change in the systems and
processes within the physical environment and is classified according to their origin in
the exosphere, atmosphere, hydrosphere and biosphere Cataclysms of nature that took
place before man’s appearance on earth and still occurs in uninhibited areas of the
world not disasters. A host of regulations to enforce maximum standards of public
safety has come as a result of past calamities and yet each year bring its shocking toll
of human life.
The general assembly of the United Nations organization insists “disastrous
efforts could be avoided or at least reduced through scientific understanding of the
nature cause frequency, magnitude and area of influence of natural phenomena.
Environment around us is deeply attended by the development process whether based
on local knowledge or that acquired from outside. These two i.e. environment and
development also affect our lives. Sometimes the degree to which the population at
risk is made more vulnerable to hazards thereby making them less capable of
mitigating the effect on their own.
There has been a rapid increase in the exposure to many natural hazards in the
second half of the twentieth century. It is difficult for people to change their behavior
to reduce risk from hazards that few have ever witnessed. Although many acts of
nature cannot be predicted and controlled better knowledge about these hazards can at
38
least reduce the extent of damage. People could be more vigilant and prepared to face
the natural disaster and their effects. Human take risks in life; they also adapt to
varying environmental hazards accounted a disaster when the proportion and that it
causes mass destruction and loss of life. In recent years however, the development
community has been making the links between disasters and development. This
evaluation would be inevitable when one concedes the vast majority of causalities
caused by natural disasters in the world’s poor countries,
World and Natural Disasters
A disaster strikes, mostly it is hazardous and sometimes it is man-made; the
entire world suffers from various disasters arising from the interplay of human
activities and natural hazards. Major synthesis of the occurrences and impact of the
major natural disaster in the world over in the last few decades shows a growing trend
both in terms of casualties as well as property damages. With the rapid increase in the
densities of population and higher concentration of value in cases exposed to such
catastrophes, this trend of higher losses is expected to continue.
It has been estimated that the world endures on an average about 1, 00, 000,
thunderstorm, thousands of floods, hundreds of landslides earthquakes and series of
cyclones and volcanic eruptions every year. All of them are obviously not equally
harmful depending upon the location of such occurrences and the intensity the natural
hazards become natural disasters. For example, in the twentieth century, 30 major
natural disasters took place in the world. Of these, there were 17 earthquakes 10
cyclones, 2 floods and 1 volcanic eruption
Tsunami in the History of the World
These powerful water waves have historically caused significant damage to
coastal communities throughout the world before 2000 years. Some parts of the
39
Tamil Nadu namely first Tamil Sangam in South Madurai, Second Tamil Sangam in
Kabadapuram and Poompugar were immersed in the sea by the tsunami. It is reported
that since 1900 to this day there are 790 times tsunami took place in the Pacific
Ocean.
Some of the Deadliest Tsunamis
650 AD – 1600 AD: Between the period of 650 AD – 1600 AD Northern Coastal area
of Greek was swallowed by the 100 – 150 meter killer tsunami waves due to the
volcano blast in the island of Sandrine.
July 02, 365: Tsunami waves shook the eastern Mediterranean and killed thousands
of residents of Alexandria in Egypt.
November 1755: After a colossal earthquake that destroyed Lisbon, Portugal and
rocked much of Europe a tsunami ensued that killed more than 60,000 people.
August 13, 1868: In China, 25,000 people were washed out by the killer Tsunami.
August 27, 1883: Eruptions from the Krakatoa volcano fueled a tsunami that
drowned 36,000 people in the Indonesian islands of western Java and Southern
Sumatra. The waves were so powerful that they pushed coral blocks as large as 1000
tonnes on the shore.
August 27, 1893: Islands of Java were affected highly and lost nearly 45,000 of their
population due to the tsunami.
June 15, 1896: Sea waves as high as 30 meters rose spawned by an earthquake and
swept the east coast of Japan killing about 27,000 people.
World’s worst natural disaster since 1900
The following is a list of some of the worst natural calamities to strike the
world since 1900. Earthquakes, volcanic eruptions, tsunamis, cyclones, hurricanes and
others form clearly this natural phenomena. This list is also limited disasters to
40
since1900 an arbitrary cut – off to be sure – but one made to reflect the so called
“Modern Day” disaster only. The death totals from disasters in the large-distant past
are, at best rough estimate and finally by “worst” we mean the death list is not the
costliest. So the list excludes 1992’s hurricanes Andrew, which caused an estimated $
25 billion US in damages in Florida and Louisiana, but left “only” 26 people dead.
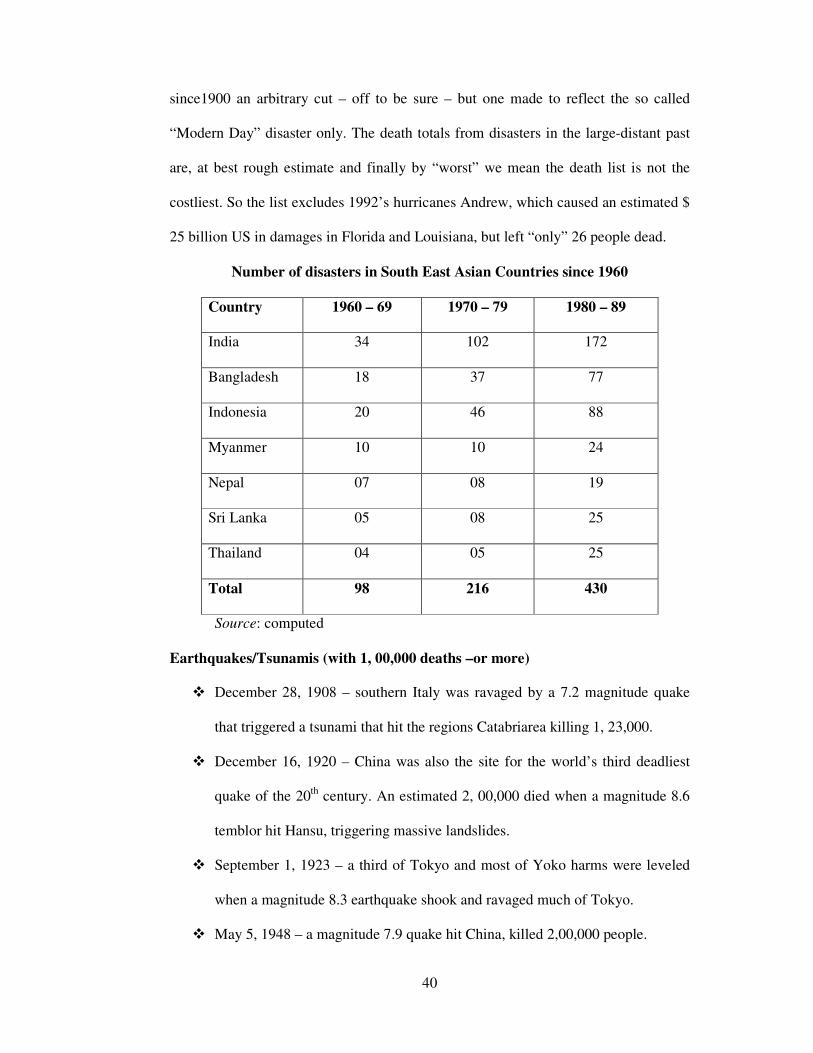
Number of disasters in South East Asian Countries since 1960
Country 1960 – 69 1970 – 79 1980 – 89
India 34 102 172
Bangladesh 18 37 77
Indonesia 20 46 88
Myanmer 10 10 24
Nepal 07 08 19
Sri Lanka 05 08 25
Thailand 04 05 25
Total 98 216 430
Source: computed
Earthquakes/Tsunamis (with 1, 00,000 deaths –or more)
� December 28, 1908 – southern Italy was ravaged by a 7.2 magnitude quake
that triggered a tsunami that hit the regions Catabriarea killing 1, 23,000.
� December 16, 1920 – China was also the site for the world’s third deadliest
quake of the 20th century. An estimated 2, 00,000 died when a magnitude 8.6
temblor hit Hansu, triggering massive landslides.
� September 1, 1923 – a third of Tokyo and most of Yoko harms were leveled
when a magnitude 8.3 earthquake shook and ravaged much of Tokyo.
� May 5, 1948 – a magnitude 7.9 quake hit China, killed 2,00,000 people.

41
� October 5, 1948 – more than 1, 10,000 were killed when a 7.3 quake rolled
through the area around Ashgeb at in Turkmenistan.
� July 28. 1976 – The world’s most devastating quake of the 20th century
(magnitude 7.8) hit the sleeping city of Tang Han, in northeast China. The
official death total was 2, 42,000 but some unofficial estimates put the actual
number of the death as high as 6, 55,000.
� December 26. 2004 – A magnitude 9.0 quake started off the coast Sumatra,
triggering tsunami that swept through the coastal region of a dozen countries
bordering the Indian Ocean. More than 1.56.000 died and thousands more are
still missing.
Volcanic Eruption.
� May 8, 1902 –Erupted on the Caribbean Island of St. Pierre; up to 40,000
were killed.
� No 13-14, 1985 – at least 25,000 were killed near American Colombia when
the Nevada del Ruiz volcano erupted, triggering mudslides.
� July 15, 1991 – at Pinatubo on Luzon Island in the Philippines the volcano
erupted, blanketing 750 sq/kms ; more than 800 died.
Hurricanes/Cyclone/Floods.
1 July –August 1931 – massive flooding of China’s Yangtze River led to
more than three million deaths from disease and starvation.
2 Nov.13.1970 – a cyclone in the Ganges delta killed at least 30,000 in
Bangladesh.
3 August 1971 – an estimated 1, 00,000 died when heavy rain led to
severe flooding around Hanoi in what was then North Vietnam.
42
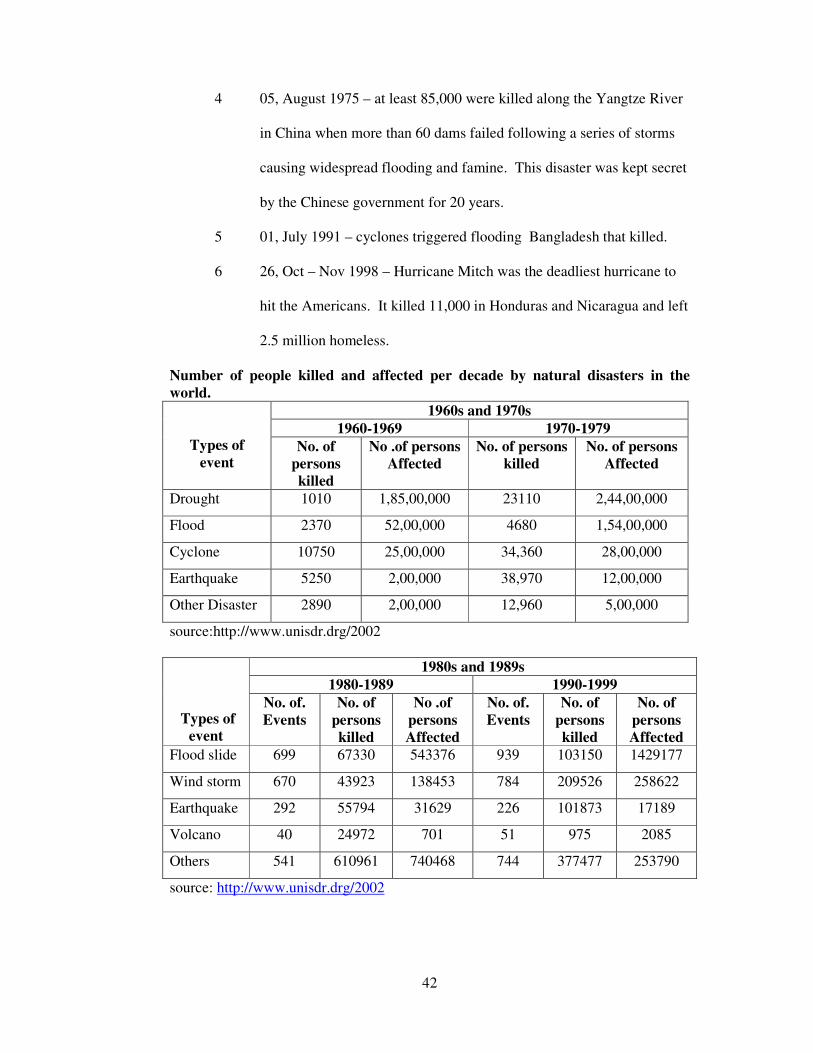
4 05, August 1975 – at least 85,000 were killed along the Yangtze River
in China when more than 60 dams failed following a series of storms
causing widespread flooding and famine. This disaster was kept secret
by the Chinese government for 20 years.
5 01, July 1991 – cyclones triggered flooding Bangladesh that killed.
6 26, Oct – Nov 1998 – Hurricane Mitch was the deadliest hurricane to
hit the Americans. It killed 11,000 in Honduras and Nicaragua and left
2.5 million homeless.
Number of people killed and affected per decade by natural disasters in the
world.
Types of
event
1960s and 1970s
1960-1969 1970-1979
No. of
persons
killed
No .of persons
Affected
No. of persons
killed
No. of persons
Affected
Drought 1010 1,85,00,000 23110 2,44,00,000
Flood 2370 52,00,000 4680 1,54,00,000
Cyclone 10750 25,00,000 34,360 28,00,000
Earthquake 5250 2,00,000 38,970 12,00,000
Other Disaster 2890 2,00,000 12,960 5,00,000
source:http://www.unisdr.drg/2002
Types of
event
1980s and 1989s
1980-1989 1990-1999
No. of.
Events
No. of
persons
killed
No .of
persons
Affected
No. of.
Events
No. of
persons
killed
No. of
persons
Affected
Flood slide 699 67330 543376 939 103150 1429177
Wind storm 670 43923 138453 784 209526 258622
Earthquake 292 55794 31629 226 101873 17189
Volcano 40 24972 701 51 975 2085
Others 541 610961 740468 744 377477 253790
source: http://www.unisdr.drg/2002

43
Types of event 2000-2001
No. of. Events No. of persons
killed
No .of persons
Affected
Flood slide 235 8170 66
Wind storm 133 1553 17
earthquake 38 21389 21
volcano 6 0 124
Others 273 12169 189
source:http://www.unisdr.drg/2002
Damages of natural disaster in the world (2002-2005)
Year No. of Events
Report
Death Total Affected People
(in) Million
Economic Damages
(in) Billion
2002 - 24500 608 Us$. 58.3
2003 700 76806 255 Us$. 56
2004 305 244500 150 Us$ 92.5
2005 360 91900 157 Us$ 159
Source: http://www.redcross.ca/2006
17 individual disasters since 1949 have each killed over 10,000 people
globally and despite development process and advances in the field of service an earth
scan study revealed six time more people died on account of disasters every year
during the decade of 1970s even while the number of disaster went up by only 50
percent.
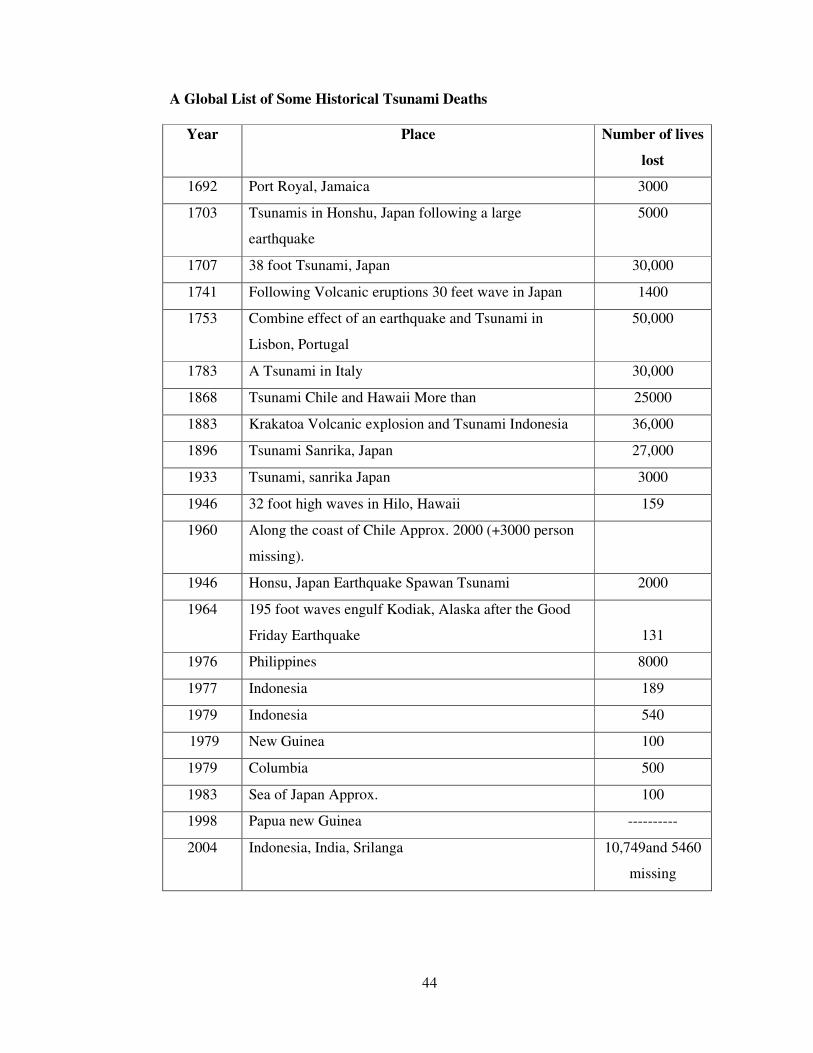
44
A Global List of Some Historical Tsunami Deaths
Year Place Number of lives
lost
1692 Port Royal, Jamaica 3000
1703 Tsunamis in Honshu, Japan following a large
earthquake
5000
1707 38 foot Tsunami, Japan 30,000
1741 Following Volcanic eruptions 30 feet wave in Japan 1400
1753 Combine effect of an earthquake and Tsunami in
Lisbon, Portugal
50,000
1783 A Tsunami in Italy 30,000
1868 Tsunami Chile and Hawaii More than 25000
1883 Krakatoa Volcanic explosion and Tsunami Indonesia 36,000
1896 Tsunami Sanrika, Japan 27,000
1933 Tsunami, sanrika Japan 3000
1946 32 foot high waves in Hilo, Hawaii 159
1960 Along the coast of Chile Approx. 2000 (+3000 person
missing).
1946 Honsu, Japan Earthquake Spawan Tsunami 2000
1964 195 foot waves engulf Kodiak, Alaska after the Good
Friday Earthquake
131
1976 Philippines 8000
1977 Indonesia 189
1979 Indonesia 540
1979 New Guinea 100
1979 Columbia 500
1983 Sea of Japan Approx. 100
1998 Papua new Guinea ----------
2004 Indonesia, India, Srilanga 10,749and 5460
missing

45
Natural Disasters in the Central Asian Region
In the Central Asian countries, during 1991-2001, around 2,500 people were
killed and 5.5 million (10% of the total population) were affected by natural disasters
in Tajikistan, Kyrgyz Republic, Uzbekistan, Kazakhstan, and Turkmenistan.
Tajikistan is the most affected central Asian country in terms of disasters,
level of damage and loss of life. Every year Tajikistan experiences 50,000 landslides,
5,000 tremors and earthquakes, and hundreds of avalanches and debris flows.
According to CRED database, during 1991-2001 over 66,000 people were made
homeless due to natural disasters. The 2003 United Nations Consolidated Appeal for
Tajikistan identified disaster response as a priority area because during the first 9
months of 2002, 65 small-and medium-scale natural disasters affected 200,000
people. The most common were floods, earthquakes, mudslides, and landslides. The
floods in southern Tajikistan in 1992 that killed 1,300 persons and resulted in 90%
loss of gross domestic product that year are indicative of the extent of destruction of
life, property, and natural resources that individual disasters in that country can cause.
The Kyrgyz Republic is characterised by frequent small or mid-scale disasters,
low levels of awareness and preparedness, and inadequate response capacity. In 2001-
2002, the Ministry of Emergencies and Ecology recorded 784 floods, 91 landslides,
37 avalanches, 78 earthquakes, and nearly 10,000 earth tremors. Seepage from more
than 20 nuclear waste storage sites in Mailuu-suu District in Jalalabad is a permanent
and large-scale threat. More than 1,200 natural disasters were registered during 1992-
1999, killing more than 400 people and damaging more than 50,000 houses, 222
schools, and 127 health care facilities, as well as roads, electricity transmission lines,
water facilities, and others. Turkmenistan and Kazakhstan are the least vulnerable to
natural disasters and best able to respond without external assistance.

46
The Xinjiang Uygur Autonomous Region in the People’s Republic of China is
subject to frequent natural disasters. In 2003 alone, there were 12 earthquakes
measuring five or above on the Richter scale, killing 289 people with over 2 billion
yuan (about US$240 million) in economic loss. In the same year, spring sandstorms
led to a drop in farm yields, with almost no harvest in some places. Storms and hail in
the summer months affected 1.8 million people with a loss of 36 lives. As well, there
were many floods and landslides. Mohgolia had several years of drought and mass
deaths of livestock beginning in 1999. Other sources of disaster in recent years
include blizzareds and heavy snowfalls, dust storms, floods, earthquake, and forest
and steppe fires. The United Nations Development Programme has been assisting the
Government strengthen its disaster management system; change the focus from a
military civil-defense approach to a civilian-led mitigation and management
approach; and create partnerships between government, donors, nongovernment
organisations for cooperation, coordination, and allocation of resources for disaster
mitigation.
ADB Assistance in Disaster Mitigation and Recovery
The Asian Development Bank (ADB) adopted a policy on disaster rehabilitation
assistance in 1987 for small Developing Member Countries (DMCs) and broadened
and extended this to all DMCs in 1989. The rationale for assistance was to provide
timely interventions that would enable an affected DMC maintain its development
momentum. The policy was reviewed in 2002. Analyses showed that three main
factors are crucial for project effectiveness:
♣ Good project design;
♣ Effective operation and maintenance of mitigation structures; and
47
♣ Strong institutional development to support structural and preventive
measures, e.g., increased disaster awareness, community preparedness, early
warning systems, effective land-use planning, and sound and enforceable
building codes.
Such measures should be part of the core design of natural disaster mitigation
projects and should be integrated into country strategies and programs.
A new policy- the Disaster and Emergency Assistance Policy-was adopted in
2004, which takes a more proactive stance as described in the text. ADB assistance
for emergency rehabilitation and disaster mitigation, including conflict and epidemic
situations as well as natural disasters, totaled some $3.9 billion during 1987-2005.
This amount comprised 22 project preparatory assistance for a total of $15
million; 55 advisory and operational technical assistance, including 14 regional
technical assistance (RET As), for a total of $48 million; 26 grants for a total of $954
million; and 52 loans, mostly in the category of “multisector”, totaling $2,903 million.
Impact of disasters
The impact of disaster is felt differentially within societies, and those most
socially excluded and economically insecure bear a disproportionate burden. The
impact of disaster also varies between women and men.
Indian Scenario
India is a disaster-prone country. It has already faced the largest number of
disasters till now and enrolled 31 major earthquakes.
Natural disasters are common due to the vast variation of geographical terrain
and climatic conditions of this region. India has 2.4% of world land area being the 7th
largest country with 15% of world’s total population and characterised density of 273
persons per square kilometer. This population density causes destruction in both
ways i.e., social disruption and human destruction.
48
India is the most flood-prone country in the world. 56.3% of its total area
amounts to 3.3 million square km as vulnerable to seismic activities. The entire
northern part of the Indian subcontinent from Hindukush to Himalayas lies in earth
quake-prone belt of violent subterranean volcanic activities. From Kashmir to the
Northeast, the geographical process of rock formulation and uplift makes the area
earthquake-prone, morbidity and mortality due to earthquake and depends upon
magnitude, intensity focal depth, distance from epicenter and other parameters.
India’s 5700 km long coast line is vulnerable to typical cyclone. The havoc caused by
cyclones is mostly due to strong winds accompanied by cyclones torrential rains, tidal
waves and the resultant inundation. Every year, 5-6 cyclones strike India out of
which 2-3 are severe resulting in economic loss. Most of the cyclones occur in the
Bay of Bengal compared to Arabian Sea in the ratio of 4:1. Many are human-made.
And the number is increasing day by day. The most human made disaster in India is
the Bhopal gas tragedy of 3rd December, 1984. Other constitutes train accidents, air
craft crashes, fire, mine, industrial and chemical disasters.
General causes of Natural Disaster
• While some of these occurrences are exclusively of natural origin eg.
Volcanic eruptions;
• Others are due to a combination of both natural and human factors eg:
landslides;
• Rapid population growth is accelerating vulnerability to disasters as
settlements encroach into disaster-prone areas and this will ultimately cause
risk to human lives;
• Vulnerability of disasters has increased due to rapid urbanization
environment degradation and lack of proper planning and preparedness.

49
Major Natural Disasters in India
Year Type Place Death
2004 Tsunami A.P, T.N., A&N Islands,
Kerala, Pondicherry
10,749 and 5460 missing
2004 Flood Assam, Bihar, Gujarat N.A.
2001 Earthquake Buhl - Gujarat 16,480 killed and 1, 44,927
injured.
1999 Fire Delhi 32 died and 100 injured
1999 Super Cyclone Orissa 20,000 died
1993 Earthquake Latur - Maharashtra 8000 died and 14,000 injured.
1991 Earthquake Garhwal - Uttaranchal 1000 died.
1984 Mic Gas Bhopal-Madhya Pradesh 3,800 died.
Source: Computed.
The damages due to natural disaster:
Sharad Powar rightly remarked that disaster management in an all
comprehensive area where everyone has a duty to perform. The eternal preparedness
has to start at individual, family, community, district, and state, national and regional
level. The challenges before us today are to have properties. The knowledge of
science and technology and people’s wisdom should be incorporated in mitigating the
impact of disasters. Safety culture should be taken up in a mission mode. Adequate
and relevant literature has to be prepared, made available and right information and
awareness creation has to be created at all levels especially in the vulnerable areas.

50
Damage due to natural disaster in India:
Year
People
affected
(in lakhs)
Houses and
buildings, partially
or totally damaged
Amount of
property
damages/loss
(Crores)
1965 595.5 2449.878 40.06
1966 550.0 2049.277 30.74
1967 438.4 2919.277 20.57
1968 101.5 242.553 40.63
1990 90.1 782.343 20.41
1990 31.7 1019.930 10.71
1992 342.7 570.696 10.90
1993 190.9 1529.916 20.05
1994 626.5 1051.223 50.80
1995 235.3 2088.335 10.83
1996 549.9 2376.693 40.73
1997 443.8 1103.549 50.43
1998 521.7 1563.405 NA
1999 501.7 3104.064 1020.97
2000 594.34 2736.355 800.00
2001 788.19 864.878 12000.00
Source: Annual Report, NDM Division, Ministry of Agriculture.
III. Damage caused by Tsunami
The feedback from the district collectors shows districts namely Chennai,
Kanchipuram, Tiruvallur, Cuddalore, Villupuram, Nagapattinam, Tiruvarur,
Thanjavur, Kanniyakumary, Tuticurin, Tirunelveli, Ramanathapuram and
Puthukottai have borne the brunt of tsunami covering 373 coastal village/kuppam.
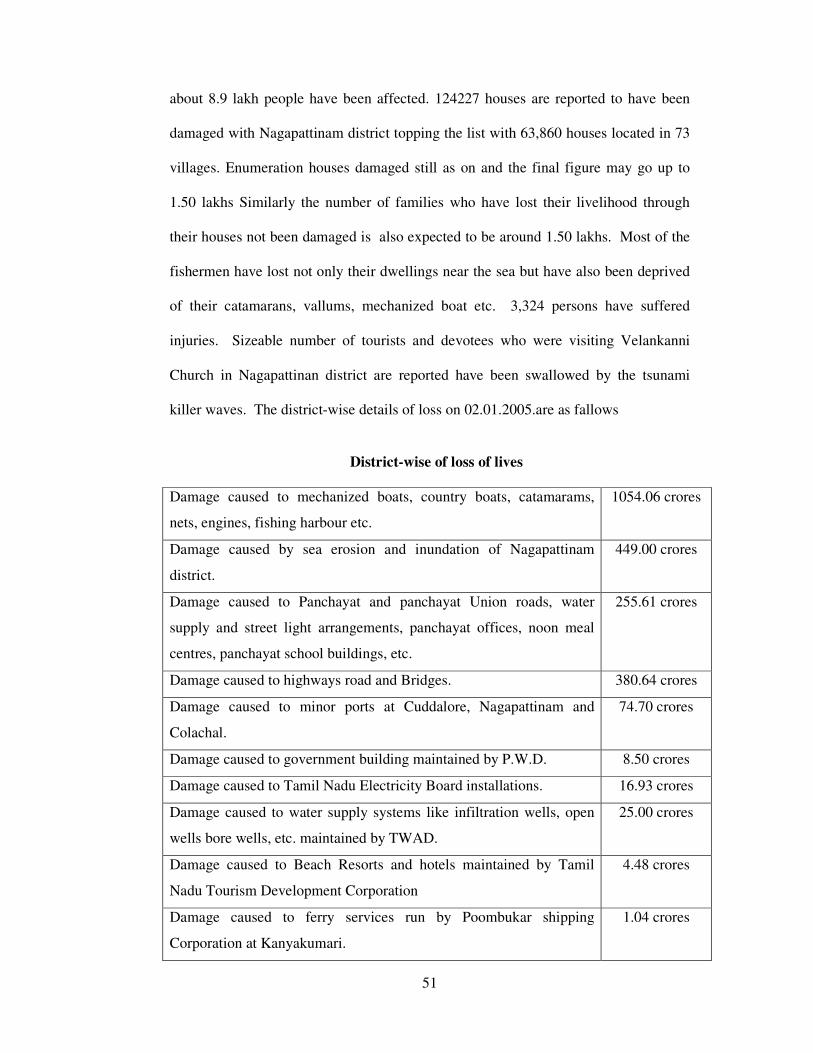
51
about 8.9 lakh people have been affected. 124227 houses are reported to have been
damaged with Nagapattinam district topping the list with 63,860 houses located in 73
villages. Enumeration houses damaged still as on and the final figure may go up to
1.50 lakhs Similarly the number of families who have lost their livelihood through
their houses not been damaged is also expected to be around 1.50 lakhs. Most of the
fishermen have lost not only their dwellings near the sea but have also been deprived
of their catamarans, vallums, mechanized boat etc. 3,324 persons have suffered
injuries. Sizeable number of tourists and devotees who were visiting Velankanni
Church in Nagapattinan district are reported have been swallowed by the tsunami
killer waves. The district-wise details of loss on 02.01.2005.are as fallows
District-wise of loss of lives
Damage caused to mechanized boats, country boats, catamarams,
nets, engines, fishing harbour etc.
1054.06 crores
Damage caused by sea erosion and inundation of Nagapattinam
district.
449.00 crores
Damage caused to Panchayat and panchayat Union roads, water
supply and street light arrangements, panchayat offices, noon meal
centres, panchayat school buildings, etc.
255.61 crores
Damage caused to highways road and Bridges. 380.64 crores
Damage caused to minor ports at Cuddalore, Nagapattinam and
Colachal.
74.70 crores
Damage caused to government building maintained by P.W.D. 8.50 crores
Damage caused to Tamil Nadu Electricity Board installations. 16.93 crores
Damage caused to water supply systems like infiltration wells, open
wells bore wells, etc. maintained by TWAD.
25.00 crores
Damage caused to Beach Resorts and hotels maintained by Tamil
Nadu Tourism Development Corporation
4.48 crores
Damage caused to ferry services run by Poombukar shipping
Corporation at Kanyakumari.
1.04 crores

52
Damage caused to godowns run by Tamil Nadu Warehousing
Corporation.
0.27 crores
Damage caused to Salt Corporation. 1.50 crores
Damage caused to Anganwadi Centres 1.41 crores
Damage caused to protected monuments of Tamil Nadu
Archaeological Department.
1.00 crores
Damage caused to foodgrains stored in the godowns of Tamil Nadu
Civil Supplies Corporation at Port godown Nagapattinam.
2.44 crores.
Damage caused to text books stocked in Text book Society godowns
at Nagapattinam.
7.50 crores
In addition to the loss of economy due to suspension of fishing activities all
along the coast line ran to several thousand crores.
Social and Economic Consequences
Loss of the ability to take care of the family may cause adjustment difficulties
for some men, especially those with more traditional gender role norms; others may
view received financial aid as a stigma and feel challenged in their role as
breadwinners.
Women may find themselves burdened with even greater responsibilities than
before. Post disaster “fight of men” often occurs, leaving women as sole earners. This
phenomenon has been observed in Miami, rural Bangladesh, the Caribbean, and
Brazil where it’s reported then men abandoned women and families and used the
relief aid for themselves.
At the same time, lower literacy level of the ownership land and other
productive assets may leave women on the verge of destitution.
EARTHQUAKE OCCURRENCES
India has large part of its land area liable to wide range of probable maximum
seismic intensities where shallow earthquake of a magnitude of 5.0 or more on rector
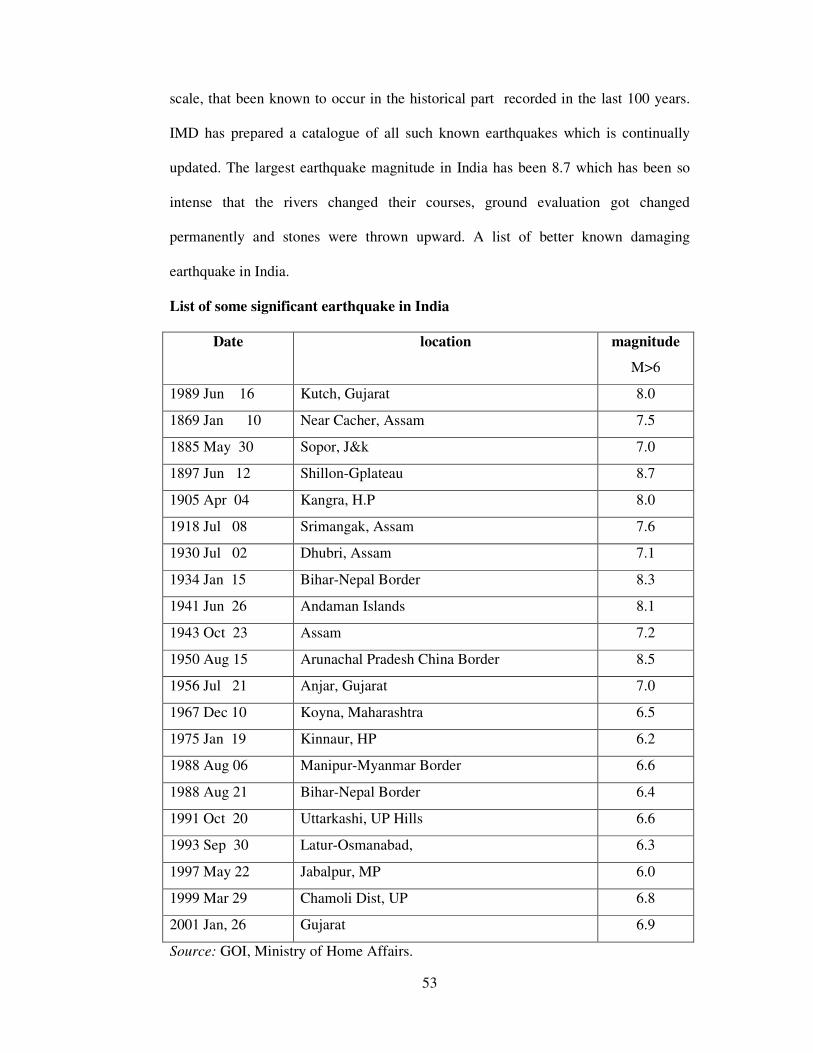
53
scale, that been known to occur in the historical part recorded in the last 100 years.
IMD has prepared a catalogue of all such known earthquakes which is continually
updated. The largest earthquake magnitude in India has been 8.7 which has been so
intense that the rivers changed their courses, ground evaluation got changed
permanently and stones were thrown upward. A list of better known damaging
earthquake in India.
List of some significant earthquake in India
Date location magnitude
M>6
1989 Jun 16 Kutch, Gujarat 8.0
1869 Jan 10 Near Cacher, Assam 7.5
1885 May 30 Sopor, J&k 7.0
1897 Jun 12 Shillon-Gplateau 8.7
1905 Apr 04 Kangra, H.P 8.0
1918 Jul 08 Srimangak, Assam 7.6
1930 Jul 02 Dhubri, Assam 7.1
1934 Jan 15 Bihar-Nepal Border 8.3
1941 Jun 26 Andaman Islands 8.1
1943 Oct 23 Assam 7.2
1950 Aug 15 Arunachal Pradesh China Border 8.5
1956 Jul 21 Anjar, Gujarat 7.0
1967 Dec 10 Koyna, Maharashtra 6.5
1975 Jan 19 Kinnaur, HP 6.2
1988 Aug 06 Manipur-Myanmar Border 6.6
1988 Aug 21 Bihar-Nepal Border 6.4
1991 Oct 20 Uttarkashi, UP Hills 6.6
1993 Sep 30 Latur-Osmanabad, 6.3
1997 May 22 Jabalpur, MP 6.0
1999 Mar 29 Chamoli Dist, UP 6.8
2001 Jan, 26 Gujarat 6.9
Source: GOI, Ministry of Home Affairs.
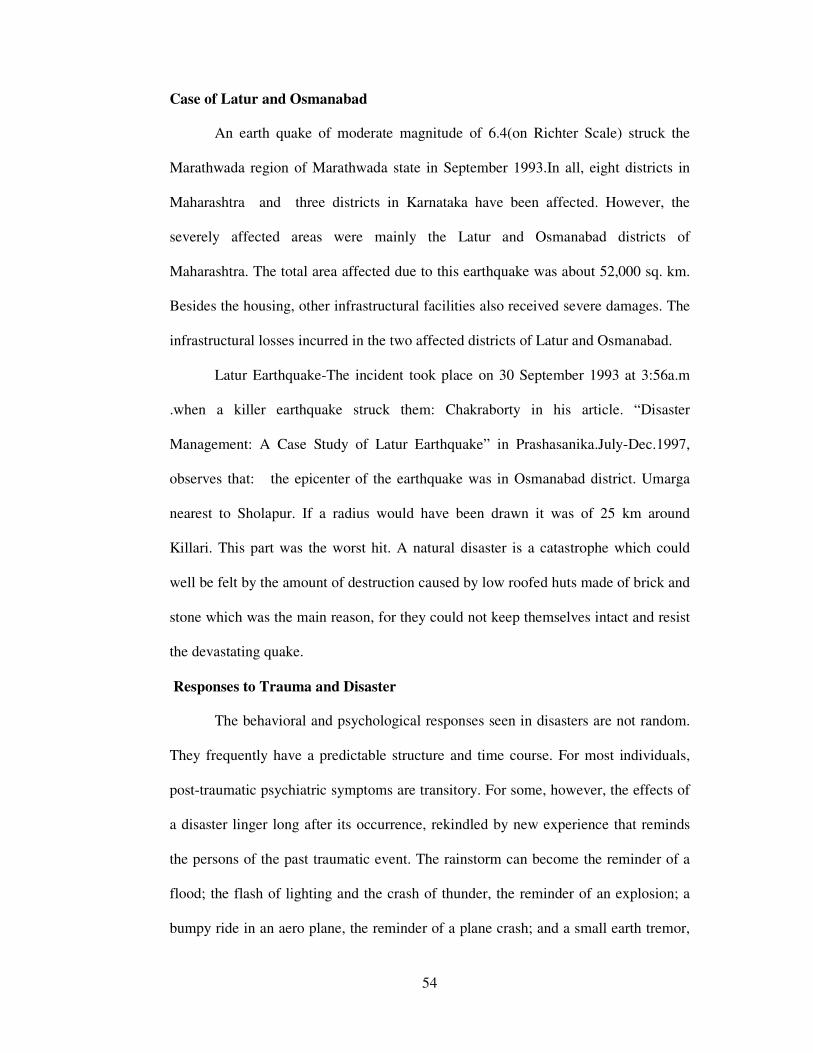
54
Case of Latur and Osmanabad
An earth quake of moderate magnitude of 6.4(on Richter Scale) struck the
Marathwada region of Marathwada state in September 1993.In all, eight districts in
Maharashtra and three districts in Karnataka have been affected. However, the
severely affected areas were mainly the Latur and Osmanabad districts of
Maharashtra. The total area affected due to this earthquake was about 52,000 sq. km.
Besides the housing, other infrastructural facilities also received severe damages. The
infrastructural losses incurred in the two affected districts of Latur and Osmanabad.
Latur Earthquake-The incident took place on 30 September 1993 at 3:56a.m
.when a killer earthquake struck them: Chakraborty in his article. “Disaster
Management: A Case Study of Latur Earthquake” in Prashasanika.July-Dec.1997,
observes that: the epicenter of the earthquake was in Osmanabad district. Umarga
nearest to Sholapur. If a radius would have been drawn it was of 25 km around
Killari. This part was the worst hit. A natural disaster is a catastrophe which could
well be felt by the amount of destruction caused by low roofed huts made of brick and
stone which was the main reason, for they could not keep themselves intact and resist
the devastating quake.
Responses to Trauma and Disaster
The behavioral and psychological responses seen in disasters are not random.
They frequently have a predictable structure and time course. For most individuals,
post-traumatic psychiatric symptoms are transitory. For some, however, the effects of
a disaster linger long after its occurrence, rekindled by new experience that reminds
the persons of the past traumatic event. The rainstorm can become the reminder of a
flood; the flash of lighting and the crash of thunder, the reminder of an explosion; a
bumpy ride in an aero plane, the reminder of a plane crash; and a small earth tremor,
55
the reminder of a major earthquake. Even normal life events can cause anxiety and
bring to mind destroyed home or demise of loved ones. Although exposure to disaster
and other trauma has been associated with liability that can persist for decades, the
effects of traumatic events are not exclusively bad. For some people, trauma and loss
facilitate more toward health. A traumatic experience can become the centre around
which a victim reorganizes a previously disorganized life reorienting values and
goals.
Common Emotional/Behavioral states during first 24 hrs
• Fear
• Running around
• Worry
• Leaving the place
• Sadness
• Crying
• Fear of entering building
• Palpitations
• Inability to think
Emotional/Behavioral states after 1 week
• Fear
• Thought about future
• Loss of sleep
• Sadness
• Hope
• Weeping
• Remembering goal
56
Emotional/Behavioral states after 20 days:
• Fear
• Relief measure
• Thought about future
• Brotherhood
• Worry
• Confusion
• Nature’s play
• Collective efforts
Common psychiatric responses to disaster
Psychiatric diagnosis
• Organic mental disorders secondary to head injury, toxic exposure, illness,
and dehydration
• Acute stress disorder
• Adjustment disorder
• Substance use disorders
• Major depression
• Post-traumatic stress disorder
• Generalized anxiety disorder
• Psychological factors affecting physical disease (in the injured)
Psychological/Behavioral responses
• Grief reactions and other normal responses to an abnormal event
• Family violence
57
Risk factors of post-disaster psychiatric symptoms
• The severity of a disaster is perhaps that single best predictor of both the
probability and the frequency of post-disaster psychiatric illness.
• Physical injury – the number of injured and type of injury is one indicator of
the severity of a disaster.
• Physical injury also appears to increase the risk of psychiatric disorders.
Psychiatric disorder
Symptoms begin within 4 weeks of a traumatic event and last between 2 days
and 4 weeks. The symptoms cannot be due to the direct effects of a substance, a
general medical condition, or exacerbation of a psychiatric disorder present before
exposure to the event.
Post-traumatic stress disorder (PTSD)
PTSD studied both natural and human-made disasters. The diagnosis of PTSD
applies to a similar constellation of symptoms if the symptoms persist longer than one
month or if the onset of symptoms begins later than one month after the traumatic
event.
Other psychiatric illness and physical disease:
Often overlooked after a disaster are the psychiatric disorders attributable to
head trauma and metabolic disturbance following crash injuries and burns co-
occurring psychological symptoms frequently seen in injured victims who may be
dealing with the stress of their injury, the loss of family members, and an absence of
resources and social supports with which to plan recovery. Since most studies
indicate a high rate of psychiatric disorder in the physically injured a practice
consultation liaison plan is a necessary part of a hospital emergency response plan.

58
Mediating factors to disaster response
To understand the nature and degree of trauma sustained by patients, it is also
useful to examine the mediating characteristics of disasters along the following
dimensions:
• Threat
• Physical harm or injury
• Exposure to grotesque, violent loss of a loved one
• Witnessing or learning of violence to a loved one
• Learning of exposure to a noxious agent
Psychological and physiological responses to disaster
Stress mediators
• Individual developmental history
• Pre-existing illness
• Previous exposure social supports
• Socio-cultural context
• Meaning
• Appraisal
Health outcome
• Major depression
• Generalized anxiety disorder
• Substance abuse
• Family violence
• Sleep disturbance
• Somatization
• Adjustment disorders

59
Pre-Disaster Action is Profitable than Post-disaster Reaction
The shocking memories of Bhopal Gas Tragedy of 1984, the Latur earthquake
in 1993, Gujarat earthquake of 2001 and the tsunami calamity of 2004 have not faded
from our mind. Those killers had incapacitated tens of thousands of people and
destroyed properties worth crores of rupees. Throughout the history, the violent side
of nature has manifested itself in destructive phenomena such as floods, volcanic
eruption, severe storms, wild fire, earthquake and tidal waves. Disasters and risks are
part of our life and they will continue to threaten, kill and destroy. Disasters are not
always entirely ‘natural’ on the one hand natural forces are at work on a planet whose
environment is being altered day after day by human kind. Floods are made more
severe by deforestation; global warming more preoccupying by the unchecked
emission of green house gases; then came new disasters that were not of natural origin
but were no less dramatic such as the radioactive cloud that blew from Chernobyl, the
green house effect and the hole in the ozone layer. Human instigated disasters like
terrorism too take a heavy toll globally.
Until a few decades ago humankind seemed to be particularly helpless in the
face of earthquakes, cyclones and volcanic eruptions. It was impossible to predict
when they would happen and what their effects would be. Human intellect and
determination could only bow to divine caprice. The good news is that disaster
reduction is both possible and feasible. While we cannot prevent an earthquake or a
tsunami from occurring, we can use scientific knowledge and technical know-how
and disseminate early warning of those disasters and organize proper community
response to such warning.
Disaster prevention measures cost less than relief and reconstruction
expenditure yet many decision-making tends to focus on relief and treat disaster

60
situation in a ad hock way. When they are presented with them today most typical
strategies are crisis oriented. Resources spent on relief and recoveries are more than
resource spent on prevention. It is high time to a shift is from post disaster reaction to
pre-disaster action
Disasters do not recognise international boundaries nor does any nation have
all the knowledge of material resources needed to cope with them. Only through
international cooperation will significant progress be made, especially in developing
countries. With limited resources and few professional workers dealing with disaster
it require co-operation between may discussion plains and between the public and
private sectors. Disaster management demands as many hands as possible working
like a team of huskies – separate but together. Mitigation of natural disasters in the
form of environmental protection preservation of biodiversity, prevention of disease
education and dissemination of knowledge and equitable economic growth must be
priorities on the agenda of a civilization and human global society of the 21st century.
Science can contribute to all these.
Out of the primary impact areas of disaster is health – both physical and
psychological. It is also one of the most underrated. Health consequences vary
according to the type of the disaster. At one hand of the spectrum are vector-borne
epidemics and waterborne disasters, drowning injuries etc., at the other hand are the
psychological consequences of disaster. Any day prevention is better than cure. When
a disaster strikes at one place on the global, other place should stay vigilant. It is an
old wise caution that “when our neighbor’s house is on fire we have to take care of
our own.”
61
Emergency and Disaster Management
India has been traditionally vulnerable to natural disasters on account of its
unique geo-climatic conditions. Floods, droughts, cyclones, earthquakes and
landslides have been recurrent phenomena. About 60% of the landmass is prone to
earthquakes of various intensities; over 40 million hectares are prone to floods; about
8% of the total area is prone to cyclones and 68% of the area is susceptible to drought.
In the decade 1990-2000, an average of about 4344 people lost their lives and about
30 million people were affected by disasters every year. The loss in terms of private,
community and public assets has been astronomical.
At the global level, there has been considerable concern over natural disasters.
Even as substantial scientific and material progress is made, the loss of lives and
property due to disasters has not decreased. In fact, the human toll and economic
losses have mounted. It was in this background that the United Nations General
Assembly, in 1989, declared the decade 1990-2000 as the International Decade for
Natural Disaster Reduction with the objective to reduce loss of lives and property and
restrict socio-economic damage through concerted international action, especially in
developing countries.
The super cyclone in Orissa in October, 1999 and the Bhuj earthquake in
Gujarat in January, 2001 underscored the need to adopt a multi dimensional
endeavour involving diverse scientific, engineering, financial and social processes; as
well as the need to adopt multi disciplinary and multi sectoral approach and
incorporation of risk reduction in the developmental plans and strategies.
Over the past couple of years, the Government of India have brought about a
paradigm shift in the approach to disaster management. The new approach proceeds
from the conviction that development cannot be sustainable unless disaster mitigation
62
is built into the development process. Another corner stone of the approach is that
mitigation has to be multidisciplinary spanning across all sectors of development. The
new policy also emanates from the belief that investments in mitigation are much
more cost effective than expenditure on relief and rehabilitation. Disaster
management occupies an important place in this country’s policy framework as it is
the poor and the under-privileged who are worst affected on account of
calamities/disasters.
The steps being taken by the Government emanate from the approach outlined
above. The approach has been translated into a national Disaster Framework [a
roadmap] covering institutional mechanisms, disaster prevention strategy, early
warning system, disaster mitigation, preparedness and response and human resource
development. The expected inputs, areas of intervention and agencies to be involved
at the National, State and district levels have been identified and listed in the
roadmap. This roadmap has been shared with all the State Governments and Union
Territory Administrations. Ministries and Departments of Government of India, and
the State Government /UT Administrations have been advised to develop their
respective roadmaps taking the national roadmap as a broad guideline. There is,
therefore, now a common strategy underpinning the action being taken by all the
participating organizations / stakeholders.
The changed approach is being put into effect through:
(a) Institutional changes
(b) Enunciation of policy
(c) legal and techno-legal framework
(d) Mainstreaming Mitigation into Development process
(e) Funding mechanism

63
(f) Specific schemes addressing mitigation
(g) Preparedness measures
(h) Capacity building
(i) Human Resource Development and, above all, community participation.
These are detailed in the following chapters.
Natural Disaster and Disaster Management in India
Asia is a continent most prone to natural disaster. It is followed by Latin
America, Africa Europe and Australia. Human settlement in India have been subject
to vagaries of natural disaster caused by floods that perennially occur, cyclone dust
storm which are seasonal features and earthquake. Being a vast country India has been
prone to recurrent natural calamities from time to time which have deliberated the
agricultural and industrial economy and posed grave problems of relief and
rehabilitation. In India out of 31 States it’s 24 States are vulnerable to natural disasters
like drought, flood, cyclone and earthquake. Only one State (West Bengal) has faced
all types of disaste; rsix States have faced three types of disaster affecting the country
at the same time in different geographical regions. Disasters stemming from these
hazards kill thousands of people and cause huge economic losses
Disaster Management in India
As India is often confronted with natural disasters and calamities of grave
nature such as earthquakes, flood cyclone etc. every time the State machinery is found
unprepared for the task of disaster management such as the Latur earthquake (1993)
cyclone of Orissa (1999) Bhuj earthquake (2001) and the worst flood in Eastern India.
These grim reminders should have led the policy towards creation of disaster
management committee long back and should have enlarged the National Calamity
Fund (NCF) on have priority basis. Though late it augurs well that Union Government

64
decided to constitute the NCF. The Govt. has also finally set up a 35 member
committee headed by the Prime Minister.
The general recommendations regarding natural disaster mitigation and
preparedness Programme can be summarized as follows:
• Mismanagement of natural resources is the main cause behind most of the
environmental degradation and natural disaster. Linkages between
environment, natural disasters and development have to be clearly established
to mitigate disaster and to improve environment.
• The main thrust should be shift from disaster relief to disaster prevention. All
developmental projects in vulnerable areas should be linked with and used to
the maximum extent possible for disaster mitigation. Development projects
having the potential to aggravate or cause hazards should be studied very
carefully and so formulated as to minimize this adverse effects in this regard.
• States should develop area-specific hazard specific advance mitigation plans.
Some funds from central resources may be allocated for mitigation and
preparedness plans. States should provide strong and stable administrative
setup for disaster management preparedness and relief.
• The economic impact of natural disaster should receive adequate attention
and cost benefit analysis should incorporate probable disaster events and for
mitigation programmes to be undertaken in the disaster prone area.
• National centre for Information Research and Training for disaster
management should be established which should also function as a nodal
institution for training and research in the area of disaster management.
The east coast of India which experienced extensive havoc and loss of life,
was lying just in the line of ‘Tsunami’ the grant tidal waves caused by a devastating
65
earthquake in the Indian Ocean. Whenever an earthquake occurs on land, the seismic
energy released by it normally travels in waves resulting in damage to building and
other structure. But the seismic energy released by the earthquake in oceans causes
‘Tsunami’ which travels thousands of kilometers. Tsunamis hit the obstacles that
come along their path with great ferocity and the east coast was the first obstacle
which the huge tidal waves encountered, causing destruction all along. This was the
first time that so many people were killed in the country by Tsunami caused by an
earthquake.
• Charles Mecrecy, the earthquake is shallow land is located under or very
close to the sea, and its magnitude exceeds a predetermined threshold; a
warning is issued based on there being the potential that a destructive tsunami
was generated. Tsunami competition is based on 30 to 50 independent
measurements in the time level of 25 minutes or less. After the first
indication that an earthquake may have triggered a tsunami, it is necessary to
wait until a potential tsunami reaches the nearness sea level sought to confirm
or deny its existence and being to evaluate its character.
• As the tsunami approaches the shore and the depth decreases the waves slow
down but become higher. The last stage of evaluation where tsunami comes
to shore as the breaking wave a wall of water or a tide-like flood is created
although waves two to three meters high are sufficient to cause damage.
• According to the tsunami rehabilitation in Tamil Nadu the NGOs received
partnership assistance from a number of international agencies and it was
reported during the period from January to June 2005, about 650 NGOs have
participated in tsunami relief operation in the State (Salagrama,v) in during
much of provision of FRP boats and formation of SHGs for women and

66
strengthening the existing ones. The corporate sector supported the tsunami
relief operations by directly contributing US$ million and through
contributions to PM relief fund (US$ 92 Million).
The Disaster impact on Communities and Challenges for a Critical Response
queries if one should wait to eradicate poverty before addressing the specific impact
of disaster. Some scholars prefer to study the “particular practices” that make one
segment of the poor differently vulnerable. Other scholars want to understand the
reasons for those “particular practices”. However, the care of the vulnerability
analysis is a closer look at the elements of their everyday life that make people
vulnerable to disaster. One may study the local historical and geographical variations
in culture, or ethnicity, gender, science and technology, and other such factors.
POLICY FRAMEWORK
The institutional and policy mechanisms for carrying out response, relief and
rehabilitation have been well-established since independence. These mechanisms
have proved to be robust and effective insofar as response, relief and rehabilitation are
concerned. The changed policy/approach, however, mandates a priority to pre-disaster
aspects of mitigation, prevention and preparedness and new institutional mechanisms
are being put in place to address the policy change.
Mitigation, preparedness and response are multi-disciplinary functions,
involving a number of Ministries / Departments. Institutional mechanisms which
would facilitate this inter-disciplinary approach are being put in place. It is proposed
to create Disaster Management Authorities, both at the National and State levels, with
representatives from the relevant Ministries / Departments to bring about this
coordinated and multi-disciplinary forum with experts covering a large number of
branches.
67
DISASTER MANGEMENT POLICY
Disaster management is a multidisciplinary forum activity involving a number
of Departments/ agencies spanning across all sectors of development. Where a
number of Departments / agencies are involved, it is essential to have a policy in
place, as it serves as a framework for action to all the relevant departments/ agencies.
A National Policy on disaster management has been drafted, and is in the
process of consultations. In the line with the changed focus, the Policy proposes to
integrate disaster mitigation into development planning. The Policy shall address all
spheres of Central Government activity and shall enjoin upon all existing sectoral
policies. The broad objectives of the policy are to minimize the loss of lives and
social, private and community assets because of natural or man-made disasters and
contribute to sustainable development and better standards of living for all, more
specifically for the poor and vulnerable section by ensuring that the development
gains are not lost through natural calamities / disaster.
Implication for disaster relief programs and policies
� Pre-disaster activities such as hazards mapping and vulnerability analysis
should be integrated with gender concentration. At a minimum, this would
involve taking into account:
� The difference in vulnerability to and impact of disaster in women and man:
and
� How their roles and status affect disaster-relief and recovery
Community-based disaster preparedness project and disaster training and
education program should address their respective needs and concerns.
Information collected through rapid assessments of health status and health
needs and disaster situation should be sex-disaggregated and include a gender

68
analysis. Information is required on productivity and mental health needs, in addition
to information on communicable disease and on malnutrition.
Basic health service provided as part of emergency relief should likewise cater
to women’s and men’s different needs and be provided in a gender-sensitive manner.
Disadvantaged groups such as women and men with disabilities and women
victimized relation should be identified as special-risk population for disaster relief
and recovery services. It may be useful to work with community organizations to
identify these groups.
Gender training of emergency managers and health service providers should
become an integral part of staff training in all organizations and agencies involved in
disaster-relief. The initiative for gender mainstreaming the Coordinated Appeals
Process (CAP), a tool for United Nations coordination and programming for
humanitarian assistance at the international level, needs consciously to address health
issues from a gender perspective.
Disaster Management Act
The States have been advised to enact Disaster Management Acts. These Acts
provide for adequate powers to authorities for coordinating mitigation, preparedness
and response as well as for mitigation / prevention measures required to be
undertaken. Two States Gujarat and Bihar have already enacted such a law. Other
States are in the process.
Disaster Management Code
In line with the changed approach, the State Governments have also been
advised to convert to their Relief Codes into Disaster Management Codes by building
into it the process necessary for drawing up disaster management and mitigation plans
as well as elements of preparedness apart from response and relief. A Committee
69
constituted under the Executive Director, National Institute of Disaster Management
has drafted a Model Disaster Management Code which is being circulated to the
States so as to assist them in this process. Some States have constituted committees to
revise the codes as per GOI guidelines. The revised codes will ensure that the process
of drawing up disaster management plans and mitigation and preparedness measures
get institutionalized.
Mainstreaming Disaster Management into Development
The Government of India has adopted mitigation and prevention as essential
components of their development strategy. The recent Five Year Plan document has a
detailed chapter on disaster management. The plan emphasizes the fact that
development cannot be sustainable without mitigation being built into developmental
process. Each state is supposed to prepare a plan scheme for disaster mitigation in
accordance with the approach outlined in the plan. In brief, mitigation is being
mainstreamed into development planning.
Flood Preparedness and Response
In order to respond effectively to floods, Ministry of Home Affairs have
initiated National Disaster Risk Management Programme in all the flood-prone States.
Assistance is being provided to the States to draw up disaster management plans at the
State, District, Block / Taluk and village levels. Awareness generation campaigns to
sensitize all the stakeholders on the need for flood preparedness and mitigation
measures have been launched elected representatives and officials are being trained in
flood disaster management under the programme. Bihar, Orissa, West Bengal, Assam
and Utter Pradesh are among the 17 multi-hazard prone States where this programme
is being implemented with assistance from UNDP, USAID and European
Commission.
70
Awareness Generation
Recognising the awareness about vulnerabilities is a sine qua non for inducing
a mindset of disaster prevention, mitigation and preparedness, the Government has
initiated a nation-wide awareness generation campaign as part of its overall disaster
risk management strategy. In order to devise an effective and holistic campaign, a
steering committee for mass media campaign has been constituted at the national level
with due representation of experts from diverse streams of communication. The
Committee has formulated a campaign strategy aimed at changing peoples’ perception
of natural hazards and has consulted the agencies and experts associated with
advertising and media to instill a culture of safety against natural hazards.
Apart from the use of print and electronic media, it is proposed to utilize
places with high public visibility viz. Hospitals, Schools, Railway stations and Bus
terminals, Airports and Post Offices, commercial complexes and municipality offices
etc. to make people aware of their vulnerabilities and promote creation of a safe living
environment.
A novel method being tried is the use of government stationery viz. postal
letters, bank stationery, railway tickets, airline boarding cards and tickets etc. for
disseminating the message of disaster risk reduction. Slogans and messages for this
purpose have already been developed and have been communicated to concerned
Ministries/agencies of printing and dissemination. The mass media campaign will
help build the knowledge, attitude and skills of the people in vulnerability reduction
and sustainable disaster risk management measures.
Information, Education and Communication
In order to assist the State Government in capacity building and awareness
generation activities and to learn from past experiences including sharing of best
71
practices, the Ministry of Home Affairs has compiled / prepared a set of resource
materials developed by various organizations / institutions to be replicated and
disseminated by State Governments based on their vulnerabilities after translating it
into the local languages. The voluminous material which runs into about 10,000 pages
has been divided into 4 broad sections in 7 volumes. These sections cover planning to
cope with disasters; education and training; construction toolkit; and information,
education and communication toolkit including multi-media resources on disaster
mitigation and preparedness.
The Planning section contains material for analyzing a community’s risk,
development of preparedness mitigation and disaster management plans, coordinating
available resources and implementing measures for risk reduction. Model bye-laws,
DM Policy, Act and model health sector plan have also been included. Education and
Training includes material for capacity building and upgradation of skills of policy
makers, administrators, trainers, engineers etc. in planning for and mitigating natural
disasters. Basic and detailed training modules in disaster preparedness have been
incorporated along with training methodologies for trainers, for community
preparedness and manuals for training at district, block, panchayat and village levels.
For creating a disaster- resistant building environment, the construction toolkit
addresses the issue of seismic resistant construction and retrofitting of existing
buildings. BIS codes, manuals and guidelines for RCC, masonry and other
construction methodologies as also for repair and retrofitting of masonry and low-rise
buildings have been included.
The IEC material seeks to generate awareness to induce mitigation and
preparedness measures for risk reduction. Material and strategies used by various
states and international organizations, including tips on different hazards, have been

72
incorporated along with multi-media CDs on disasters. The material has been
disseminated to all the State Governments/ UT Administrations with the request to
have the relevant material, based on the vulnerability of each district, culled out,
translated into local languages and disseminate widely down to the village level.
Emergency Support Functional Plans
It is seen that the relevant departments start constituting teams/mobilizing
resources only after the crisis/disaster has struck, leading to delays. The relevant
departments/ agencies have been asked to draw up Emergency Support Function
(ESF) Plans and constitute response teams and designate resources in advance so that
response is not delayed. Ministries/departments have drawn up their ESF Plan and
communicated it to MHA. States have also been asked to take similar steps. Similarly
States have been advised to finalize pre-contract/agreement for all disaster relief items
so as to avoid delays in procuring relief items after disaster situations.
Disaster management requires multi-disciplinary and proactive approach.
Besides various measures for putting in place institutional and policy framework,
disaster prevention, mitigation and preparedness initiatives being taken by the Central
and State Governments, the community, civil society organizations and media also
have a key role to play in achieving moving together, towards a safer India. The
message being put across is that, in order to move towards safer and sustainable
national development, development projects should be sensitive towards disaster
mitigation.
Our mission is vulnerability reduction to all types of hazards, be it natural or
manmade. This is not an easy task to achieve, keeping in view the vast population,
and the multiple natural hazards to which this country is exposed. However, if we are
firm in our conviction and resolve that the Government and the people of this country

73
are not prepared to pay the price in terms of massive casualties and economic losses,
the task, though difficult, is achievable and we shall achieve it.
We have taken the first few but significant steps towards vulnerability
reduction, putting in place prevention and mitigation measures and preparedness for a
rapid and professional response. With a massive awareness generation campaign and
building up of capabilities as well as institutionalization of the entire mechanism
through a techno legal and techno financial framework, we are gradually moving in
the direction.
The various prevention, mitigation measures outlined above are aimed at
building up the capabilities of the communities, voluntary organizations and
Government functionaries at all levels. Particular stress is being laid on ensuring that
these measures are institutionalized considering the vast population and the
geographical area of the country. This is a major task being undertaken by the
Government to put in place mitigation measures for vulnerability reduction.
Impact of Natural Disaster
They have multi-dimensional effects on several sectors of personal, social,
economic and the like.
Direct losses: Damages to building, contents motor vehicles, persons or
infrastructure costs of clearing up, loss mitigation and disposal.
Indirect losses: Damage resulting from business interruption and power
failure, costs of transportation, detours assistance, storage accommodation drinking
water supply and communication.
Intangible losses: Detours of tailbacks on the journey to work, psychological
impairments, and losses of intangible values or moving out of the area at risk:

74
• Natural disaster have generally meant mere destructive of human habitation
over large area causing injury, loss of life, property and disruptions of social,
economic and ecological life.
• Children and women too are more than potential victims of natural disaster.
• It creates physical health problems such as fever, diarrhea, cholera, etc. and
psychological problems for the victims. when the affected people realize the
gravity of the situation they go into depression and develop panic and anxiety
because of the traumatic experience
• One result of disaster can be degradation of productive lands;
• The capital assets and other resources are severely affected by it;
• National hazardous events can cause destruction of transport, buildings and
infrastructure including homes, schools hospitals, factories, temples, water
supply lines and sanitary pipelines, power supplies and communication links;
• Its subsequent effect on health is due to the lack of clean drinking water and
food, the spread of disease and exposure to the elements;
• It can also contribute to economic instability and to an atmosphere of
uncertainty;
• Another important impact that natural disasters have on developing countries
is that funds targeted for development are reallocated to finance relief and
reconstruction efforts, jeopardizing long-term development goals;
• In the aftermath of a disaster, a government will be obliged to meet potential
budgetary pressures by increasing the money supply;
• Natural disaster has been considered a tragic interruption to the development
process. Lives are lost; social networks are disrupted; and capital investment
is destroyed. When development plans are laid and disaster strikes,
75
development funds are diverted to meet the emergency. Additional aid is
directed to relief and reconstruction needs to get the country ‘back on track’
towards economic and social development;
• It create some indirect impact such as the fall of production of goods and
services, transport, labour supplies or markets, loss of income due to
unemployment, financial crises of the poor and increased cost of goods and
services, etc.
• It severely affects country’s tourism.
Relief Work
Relief work means the immediate help to release people from the sudden
incidents providing all the basic and immediate things that they deserve. In other
words, it is the immediate assistance based on their need.
Rehabilitation work
Rehabilitation work implies later help that should be provided to restart their
normal life. It also provides needed materials to begin their normal life. In other
words, it is the secondary assistance which should help the affected to commence a
new life after the loss.
Tsunami Vulnerability Assessment
The exposure inventory on vulnerability to tsunami impact on natural
environment will need to be developed for shores and harbours. Potential damage is
related to the hydrological controls of wave action (surging), flooding and debris
deposition, and consequent geotechnical controls to damage by liquefaction, cracking
and slumping. These result in structural damage to buildings, water damage to
contents, flooding damage to infrastructure (roads, bridges, water supply, sewerage,
wharves, sea-walls), damage to navigational aids and reef damage. There is the
76
potential for “seiching” in the shallow harbor areas where, alternately (from the
tsunami waves), water is drained from the harbor and then flooded to depths greater
than high tide levels. This has the potential for threat to human life (death and injury)
from people collecting fish from the harbor seafloor. In the harbor, waves are a threat
to shipping (sinking, striking wharves) and fishermen (drowning).
The vulnerability assessment is expressed as details of elements of the built,
natural and human environments vulnerable to potential tsunami-related damage.
These need to be considered in terms of the Tsunami Hazard Zones for the terrestrial
environments around the shores and the marine environments.
Tsunami Risk Assessment
By integrating the hazard and vulnerability assessments, the tsunami risk
assessment is to be developed in terms of zonation and inundation maps and
associated affects.
Practical Applications
The key factors to reduce potential losses due to tsunami are awareness and
preparedness. The practical applications of this tsunami risk assessment, in both
quantitative and qualitative terms, for implementation of mitigation strategies for the
terrestrial and marine environments include:
1. Building Codes (potential damage due to wave action and flooding)
2. GIS Mapping
3. Land-Use Planning (taking note of wave action & flooding)
4. Disaster Planning (in identified hazard zones)
5. Emergency Management
6. Emergency Personnel Training (necessary aspects relevant to marine
situations)
77
7. Rescue and Response (marine situations related to shipping) (cargo,
tourist, inter-islands fishing community, recreational boating)
8. Insurance Needs
9. Community Education
10. Simulated Tsunami Exercises
EMERGENCY PREPAREDNESS
Effective response by national health authorities cannot be impromptu. Ministries
of health that neglected to invest in capacity building before emergencies have
generally experienced serious difficulties in exercising their technical and political
leadership in the immediate aftermath of a disaster. Disaster preparedness is
primarily a matter of building institutional capacity and human recourses, not one of
investing heavily in the advance technology and equipment.
Building local coping capacity is one of the most cost-effective ways to improve the
quality of the national response and the external intervention.
Disaster preparedness is not merely having disaster plan written by experts.
It must involve the following:
� Identifying vulnerability to natural or other hazards; The health sector should
seek information and collaborate with other sectors and institutions (civil
protection, meteorology, environment, geology) that have the primary
responsibility for collecting and analyzing this information.
� Building simple and realistic health scenarios of possible and probable
occurrences; It is challenging enough to prepare for a moderate-size disaster;
building and sustaining a culture of fear based on unrealistic worst-case
scenario may serve the corporate interest of the disaster community but not
the interests of the public at large.
78
� Initiating a participative process among the main sectors to develop a basic
plan that outlines the responsibilities of each participant in the health sector
(key departments of the ministry of health, medical crops of the armed forces,
private sector, NGOs, UN agencies, and donors) on what are the possible
overlaps or gaps and building a consensus-not the paper plan itself. Disaster
often presents problems that are unforeseen in the most detailed plans.
� Managing a close collaboration with these main actors. A good coordinator is
one who appreciates and adapts to the strengths and weaknesses of other
institutions. Stability is essential. Changing the key emergency staff members
during a disaster situation or when a new administration or minister takes
over have occasionally complicated the tasks
� Sensitizing and training the first health responders and managers to face the
special challenges of responding to disasters; Participation of external actors
(UN agencies, donors, or NGOs) in designing and implementing the training
is critical. The incorporation of disaster management in the academic
curriculum of medical, nursing, and public health schools should complement
the on-the-job training programs of the ministry of health, UN agencies, and
NGOs Well-designed disaster management training programs will improve
the management of daily medical emergencies and accidents as well.
Range of Tsunami in Tamil Nadu
A very severe earthquake to the magnitude of 8.9 Richter scale struck northern
Sumatra Indonesia at 06.28 a.m. IST. The earthquake was felt widely along the east
coast of India.
The calamity which struck the Tamil Nadu coast on 26.12.2004 was
unpredicted in its suddenness and ferocity. It was also widespread in scale affecting
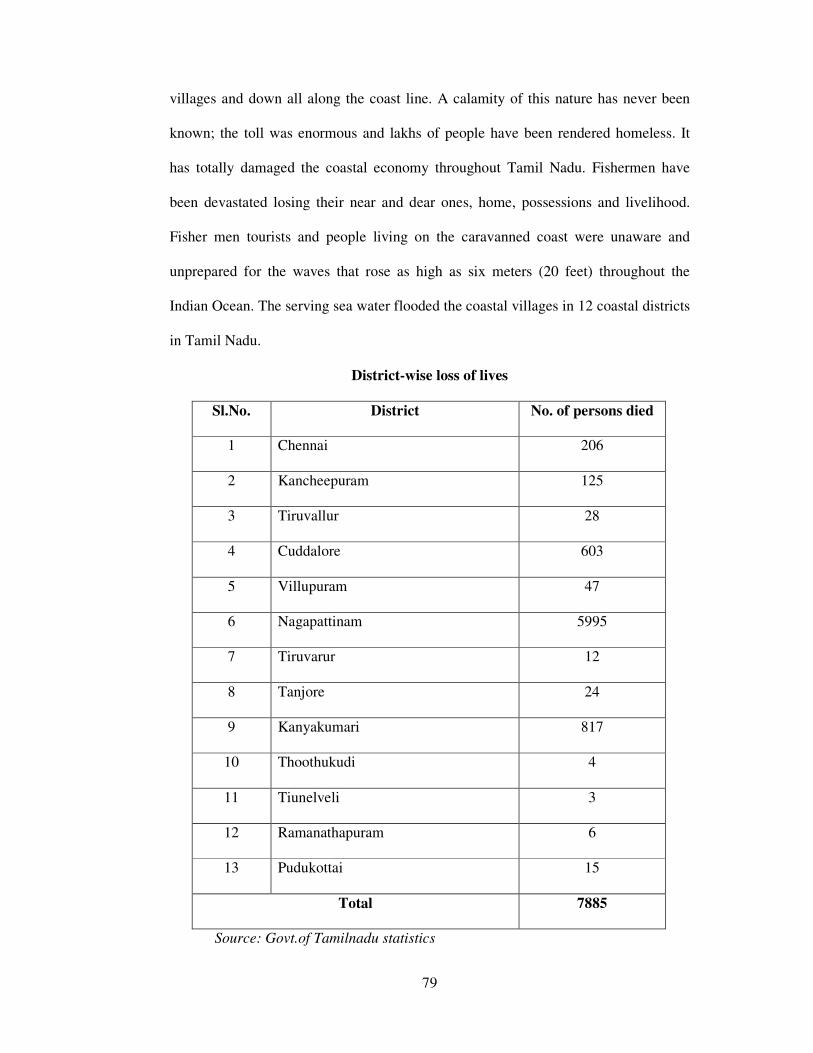
79
villages and down all along the coast line. A calamity of this nature has never been
known; the toll was enormous and lakhs of people have been rendered homeless. It
has totally damaged the coastal economy throughout Tamil Nadu. Fishermen have
been devastated losing their near and dear ones, home, possessions and livelihood.
Fisher men tourists and people living on the caravanned coast were unaware and
unprepared for the waves that rose as high as six meters (20 feet) throughout the
Indian Ocean. The serving sea water flooded the coastal villages in 12 coastal districts
in Tamil Nadu.
District-wise loss of lives
Sl.No. District No. of persons died
1 Chennai 206
2 Kancheepuram 125
3 Tiruvallur 28
4 Cuddalore 603
5 Villupuram 47
6 Nagapattinam 5995
7 Tiruvarur 12
8 Tanjore 24
9 Kanyakumari 817
10 Thoothukudi 4
11 Tiunelveli 3
12 Ramanathapuram 6
13 Pudukottai 15
Total 7885
Source: Govt.of Tamilnadu statistics
80
Relief and Rehabilitation work in Tamil Nadu.
In addition to Government’s efforts voluntary organizations at the
international and national and local level have also started relief operations. The field
officers of the State Board visited the tsunami affected areas and submitted project
proposals for the relief work to be undertaken. Centre for Rural Education and
Economic Development (CREED), and HEART in Cuddalore District, Avvai Village
Welfare Society and Bharathi Women Development Centre in Nagapattinam District,
Centre of Social Reconstruction, Family Planning Association of India, Power, PURA
and Palmyrah Workers Development Society in Kanyakumari District are some of the
aided NGOs who are actively involved in relief work. The NGOs who run short stay
homes in these coastal districts have given shelter to women and children affected by
the tsunami.
The Central Social Welfare Board, based on the Project submitted by the State
Board had sanctioned 10 crèches, 200 awareness generation programme camps and
Rs.1,34,200 for the post disaster counseling services to the tsunami victims. The
Chairperson, Tamil Nadu Social Welfare Board visited the tsunami affected areas and
consoled the victims; Also convened meetings of NGOs and district officials in
Cuddalore and Kanyakumari and discussed the relief measures. As the next step,
outfield officers were also deputed to the tsunami affected districts to guide the NGOs
engaged in the relief work.
Psychological Counseling
To give psychological counseling and for the emotional bounding of people
who had suffered such sudden and extreme distress, a team of doctors from the
National Institute of Mental Health (NIMHANS) a leading institute of mental health
in India also came here to train psychological counselors who were placed in the
81
Marmata – Gruhas. The team of doctors from NIMHANS including doctors of world
repute prepared an information manual for psychological care of victims of the super
cyclone. This was published very quickly in book form to expedite the effort. This
wide dissemination of expert advice on psychological care provided significant help
in the emotional healing of victims of super cyclone particularly the vulnerable
groups.
* Families tracing of children separated from their families in the cyclone
were rendered assistance, so that wherever possible they could be united with their
families.
* The government was urged to declare the VGs among cyclone victims as
below poverty line families. The government was also urged to lock up the ex-gratia
in the form of fixed deposits for orphans and widows.
* It was decided to ensure that the VGs got rightful compensation and it was
to be properly utilized for their long-term welfare careful efforts made. Services of a
law firm were also used for this purpose in order to ensure justice regarding
ownership of land, housing and other assets. Although some cases of ex-gratia
payments being spent in conspicuous consumption could not be avoided, on the whole
the effort was to ensure that in particular the vulnerable groups had ex-gratia
payments in safe long-time deposits while they continued to get the interest payments
on the deposits to meet their immediate needs.
* Special efforts were made to ensure that unscrupulous persons who suddenly
claimed to be the relatives of orphaned children did not get the opportunity to corner
their compensation payment. As several victims originally belonged to Midnapore
region of Bengal some men even appeared from there insisting that they were
relatives even though the children refused to recognize them as so. It is clear from
82
this experience that a lot of caution has to be taken to protect long term life-support
resources of victims from such adventurers.
* One of the most interesting aspects of SA is how the concept of new family
ties evolved and was implemented. In the initial phase as the extreme distress of a
large number of widows orphans and the aged without family became the major
concern a lot of thought was given to how some widows, orphans and aged persons
can come together to start new families which to some extent will meet the special
needs of all of them. Beautiful as the idea looks it cannot obviously be forced on
anyone and its acceptance cannot even be speeded up. Of course, Marmata – Gruhas
provided a very good opportunity for various vulnerable groups to meet each other
and explore the possibilities. Just to make this exploration possible the idea of well-
run community based Marmata – Gruha is a splendid one apart from their other users.
As things turned out bonding of new families were actually formed in the
Marmata – Gruhas but not to the extent was expected at one stage. Other affected
persons went to their relatives or remained more or less in the same family unit as
before. But even though the bondings for the emergence of new families have been
somewhat less than what was expected earlier even the extent to which this has
happened is very heartwarming.
* A project that is aimed mainly at vulnerable groups also runs the risk of
getting alienated from the wider community. If the organizers are not careful they
may end up with a situation where other members of the village community say,
“Well they may be doing good work for widows and orphans but they don’t have
anything to do with us”.
* SA tried from the very beginning to bridge this gap between ‘us’ and ‘them’.
SA did not say we have come here to help widows and orphans. As the village
83
community cannot help them. Instead SA said – only the village community can help
its windows and orphans but as everyone has been so badly divested by floods we
have come here to assist the village community for some time so that it can take
immediate care of widows and orphans later after we have left it is of course the
village community which will look after the vulnerable group on a permanent basis.
84
CHAPTER-III
REVIEW OF LITERATURE
Empirical investigation on social exclusion, community participation in disaster
management is of recent origin in Indian context. However studies on disaster
management with focus on such disaster as flood, earthquake and cyclone based
devastations at international levels are available. Again studies with specific focus on
tsunami are scanty. These limited studies provided the necessary background for
understanding the concept, vulnerability, occurrences, impact, response etc. in the
context of the country concerned. A brief review of previous studies done in this area
is vital and the following are the glimpses of researches undertaken on disaster
management.
The larger mega thrust earthquakes occurred in 1868 (Peru, Nazca plate and
South American Plate); 1812 (Venezuela, Caribbean Plate and South American Plate)
and 1700 (cascadia Earthquake, western US and Canada, Juan de Fuca Plate). All
believed that to have been of greater magnitude 9, but no accurate measurements were
available in those days.
The earthquake was usually large, in geographical extent. As estimated 1200
km (750 mi) of fault line slipped about 15 m (50 ft) along the subduction zone where
the India Plate dives under the Burma Plate. The slip did not happen instantaneously
but took place in two phases over a period of several minutes. Seismographic and
acoustic data indicate that the first phase involved the formation of a rupture about
400 km (250 mi) long and 100 km (60 mi) wide, located 30 km (19 mi) beneath the
sea bed – the longest known rupture ever known to have been caused by an
earthquake. The rupture proceeded at a speed of about 2.8 km/s (1.7 mi/s) or 10,000
km/h (6,300 mph), beginning off the coast of Aceh and proceeding north-westerly
85
over a period of about 100 seconds. A pause of about another 100 seconds took place
before the rupture continued. Northern rupture occurred more slowly than in the
south, at about 2.1 km/s (4,700 mph), continuing north for another five minutes to
strike-slip (the two plates push past one another in opposite directions) thus reducing
the speed of the water displacement and so reducing the size of the tsunami that hit
the northern part of the Indian Ocean.
The Indian Plate is part of the Great Indo-Australian Plate, which underlies the
Indian Ocean and Bay of Bengal, and is drifting north east at an average of 6 cm/a (2
inches per year). The Indian Plate meets the Australasian Plate (which is considered a
portion of the great Eurasian Plate) at the Sunday Trench. At this point the Indian
Plate subducts the Burma Plate, which carries the Nicobar Island, the Andaman Island
and northern Sumatra. The India Plate slips deeper and deeper beneath the Burma
Plate until the increasing temperature and pressure drive volatiles out of the
subducting plate.
Numerous aftershocks were reported off the Andaman Islands, the Nicobar
Islands and the region of the original epicenter in the hours and days that followed.
The largest aftershock of magnitude 8.7 was located off the Sumatran island of Nias.
Other aftershocks of up to magnitude 6.6 continue to shake the region on a daily
basis.
Thwaites’ (1900) analysis of the evolution and interpretation of Huron
tradition reveal the origin of an understanding of earthquake its date, size, and
location. The study aimed at correcting the misinterpretation of the original tradition
and suggests the statement thought to be in better accord with Le Jeune's Relation:
1900, the earthquakes recorded with a greater magnitude were the 1960 Great
Chilean Earthquake (magnitude 9.5), the 1964 Good Friday Earthquake in Prince
86
William Sound (9.2), and the March 9, 1957 earthquake in the Andrean Islands (9.1).
The only other recorded earthquake of magnitude 9.0 was in 1952 off the south east
coast of Kamchatka (see Top 10 earthquakes). Each of these mega thrust earthquakes
also spanned tsunami (in the Pacific Ocean), but the death toll from these was
significantly lower; a few thousand for the worst one, probably because of the lower
population density along the coasts near affected areas and the greater distances to
more populated coasts.
The UNDP, in the aftermath of the earthquake in Gujarat, during May to
August 2001, in the Patan and Surendra Nagar districts, in association with the All
India Disaster Mitigation Institute (Ahmadabad), sought to improve the disaster
preparedness through participatory mapping and action planning cycles, creating
awareness on family disaster preparedness, cyclone preparedness, community-based
disaster management, etc.
According to Reinsurance Company (2001) ‘MunichRe’ coast associated
with natural disasters have gone up 14 fold since the 1950s. Each year from1991 to
2000, an average of 211 million people were killed or affected by natural disasters –
seven times greater than the figure for those killed or affected by conflict. Towards
the end of the 1990s, the world counted some 25 million ‘environmental refugees’-
for the first time more people had fled natural hazards than conflict.
S.L.Goel et al (2001) explain the history of disasters and their occurrence in
India, especially Gujarat Tragedy. Their study also reveals the truth about the
strategies taken by the Government of India after the tragedy. He also explained that
there is no sufficient development in science and technology to warn about the
occurrence of tragedy and rehabilitation and health management.
87
Prafullakumar’s (2004) study on the fisher women of Chandrabhaga, India
reveals that the fisher folk play a crucial role in the development of Orissa and has
ample resources for development of fisheries. It has a continental shelf area of 25,000
forming 8% and 4.5% of country’s total coast line and continental shell, respectively.
It provides a source of livelihood to the fishermen of Orissa. Further the author
described the changing roles of women from fishing to household. Directly engaged
in what may be narrowly defined as a fishing they always participated in a number of
fish related activities not all of which were necessarily paid and which supplemented
the average household earning capacity. In dealing with daily work of fisher-women
they do hard physical labour in order to supplement the family income, they carry
baskets of fish on their head from fish lending place to the vehicle accessible place.
Alongwith fish processing-marketing they also supply dried fish to nearby village and
markets.
The Former Chief Minister of Tamil Nadu (2004) expressed her views about
Tsunami “It is a calamity of unprecedented nature and everything has been smashed
to smithereens within a matters of 20 minutes during my aerial inspection both in
Chennai and Coastal districts. I could see houses collapsed, bodies and fishing boats
stream miles away from the seashore and she also said that, though the sea water
suddenly entered the land after termers, the water started receding and she went on to
ask the people not to panic as there was a possibility of sea water inundating areas
again and she highlighted the extreme suffering of the fishermen who had lost their
kith and kin; she expressed condolences to the bereaved families.
Shahin Sultana et al (2004) discussed the role of social work in rehabilitating
women and children in the tsunami tragedy and hence, the social worker would play
the role of a counselor to assist adapted people during such natural disasters and other
calamities.
88
A study conducted by Shahin Sultana et.al.(2004) on role of social
workers option natural , women are subject to various health challenges and work
stress while managing the entire family. Now the problems have doubled; some have
either lost their children or their husbands hence the problem before them is
enormous. The social worker has a Vidal social role to play in rehabilitation.
Hema Malini et.al (2004): The tour sets of satellite sensor pertaining to the
recent years from 1992 – 2001 in conjunction with the topographic maps of the 1976
of the Godavari delta region revealed conspicuous shoreline changes, especially at the
distributor months of Nilareva, hautami and vasishta. There is no discernible change
at the month of the fourth distributing i.e., vainateyam. The shore zone near the
month of nilareva, which is the terminal branch of nautami in the northern part of the
delta front coast, is subjected to spectacular change during the period under study.
Yenger (2004) described the last tsunami that hit the Indian sub-continent
caused by an earthquake of 6.5 to 6.7 off the mekhrn coast. Pusni town, an important
trading post was destroyed. In Karachi more than 400km away, the port was damaged,
and there was loss of life and damage to property. The surging water caused damage
even in Mumbai about 1000km away. The high waves created tangible effect in
Kuruvar in Karnataka, about 1600 km away.
Chadha (2004) explained that the earthquakes occurring on land do not cause
death directly as the buildings that collapse do. Similarly, earthquake that occur in the
sea do not create killer tsunamis that are precluded by them as do shallow focus
earthquakes measuring 6.5 cause tsunami. But such tsunami will die out after some
distance. The vast extent of the Indian Ocean posed little challenge to the movement
of the killer tsunami reaching a distance of 2000 km. To hit the Indian coast was not
difficult for giant tsunamis that can travel as far as 5000km. through this way.

89
The 2004 Indian Ocean earthquake came just three days after a magnitude 8.1
earthquake in an uninhabited region in west of New Zealand’s sub-Antarctic
Auckland Island and north of Australia’s Macquaric Island. This is unusual, since
earthquake of magnitude 8 or more occur only about once a year on an average. Some
seismologists have speculated about a connection between these two earthquakes,
saying that the former one might have been a catalyst to the Indian Ocean earthquake,
as the two quakes happened on opposite sides of the Indo-Australian plate (a 6.5
earthquake occurred on 19 February, 2005 off Sulawesi at the other end of the
Indonesian island chain). However, the US Geological Survey sees no evidence of a
causal relationship. Coincidentally the earthquake struck almost exactly one year (to
the hour) after magnitude 6.6 earthquakes killed an estimated 30,000 people in the
city of Bam in Iran. Owing to subsequent aftershocks, the energy released by the
original earthquake continued to make its presence felt well after the event. A week
after the earthquake, its reverberations could still be measured, providing valuable
scientific data about the earth’s interior. An earthquake of magnitude 8.7 was reported
shortly at 16:09:37 UTC (23:09:37 local time) on March 28, 2005 approximately at
the same location (see 2005 Sumatran earthquake). It is likely that this was due to
very large aftershocks of the original earthquake. This earthquake had strong
aftershocks of its own, including magnitude 6.0 and 6.1 quakes. At 8.7, it ranks as the
7th largest earthquake since 1900.
An earthquake magnitude 6.7 struck on 10 April at 1729 local time 91029
GMT about 120 km (75 mi) south-west to the city of Padang. (BBC NEWS: Sumatra
shaken by new earthquake also see Wikinews). Some scientists warn that geological
stresses caused by the recent quakes may even have increased the possibility that the
Lake Toba supervolcano could erupt. According to the Toba catastrophe theory, this
90
could threaten human life on earth. Some scientists confirm that the December quake
has activated Leuser Mountain, a volcano in Aceh province along the same range of
peaks as Talang, while the 2005 sumatran earthquake had sparked activity in Lake
Toba, an ancient crater in Sumatra coincidentally, Mount Talang has since erupted
and is now on top alert.
The People’s Republic of China (PRC) has since constituted a state Disaster
Reduction Commission. (January 2005)
Legal frame work Each country has its own decrees, acts, and laws that serve
as legal basis for disaster management. Hazard/Risk Mapping. Most countries have
risk maps. Those in the Central Asian countries were prepared during the soviet era,
but their scale is not suitable for risk management activities. Most of these maps are
outdated. Structural Measures: In the Central Asian countries, many protective
structures remain soviet era-such as dams, disks for flood protection, and sediment
control devise. These structures lack maintenance, which not only decreases their
protective value but also can amplify a disaster when they collapse. Disaster
Preparedness Plans. Countries in the region have made different levels of progress
in developing disaster preparedness plans. The PRC has a capacity-building program
and is making safe storage sites for waste products from metal processing.
Community Involvement: General awareness for natural disasters, preparedness, and
mitigation is very low. In the PRC, a community-based disaster reduction outreach
campaign has been launched.
Rehabilitation measures by Government of Tamil Nadu (2005) it is stated
that out of Rs.65crore sanctioned for replacement of gill nets for vellums and
catamarans, and repair/rebuilding of vellums and catamarans, a sum of Rs.45.22crore
has been disbursed (up to 08.04.2005). The Government sanctioned Rs.78 lakhs for
91
repairing 1560 out Board meters/ in Board engines which have been damaged during
tsunami at the rate of Rs.5000 per engine. The Government has also sanctioned
Rs.395.56 crore for replacement of fully damaged/lost wooden/ catamarans/
mechanized boats and for repairs so a Rs.37.02crore has been disbursed for
fully/partly damaged mechanized fishing boats and Rs.30.71crore has been disbursed
for replacement of wooden/FRP catamarans (up to 08.04.2005).
Nagaraja (2005) has observed that “like any other disasters there were a lot
of injured people so that a massive effort in medical attention was required. All
disasters result in a significant degree of psychological trauma that makes the
recovery takes much longer. They can have problem in establishing a pattern of life,
getting proper sleep, concentrating on any thing and even develop a guilt complex that
they survived while other were dead. If it is very severe, some can also become
suicidal. It is a natural emotional situation. It is not psychiatric but a psychological
problem that is why meditations. What is required is a healing touch. The major fear
of entire communities is that the disaster (tsunami) will occur again and hence the
community is always in a state of tension they have to be convinced that it would not
occur all the time.
The prevention/protection and mitigation from risk of tsunami disaster
(2005) report reveals the Indian coastal belt has not required many tsunamis in the
past. Waves accompanying earthquake activity have been reported over the North Bay
of Bengal. During an earthquake in 1881 with its epicenter near the concept of the
Bay of Bangal, tsunamis were reported. The earthquake of 1941 in Bay of Bengal
caused some damage in Andaman region; during the earthquake of 1819 and 1845
near Kutch, about 2 meters from Mumbai where boats were swept away from their
mooring and casualties occurred. The report said that the coastal region of Gujarat is

92
vulnerable to tsunami from great earthquakes in Mekram coast. Two potential have
Andaman to Sumatra region.
Shahin Sultana et al. (2005): have critically assessed the role of social
worker in rehabilitating women and children in the tsunami tragedy. Special attention
is needed to reach out to these communities as there are chances of discrimination by
the non-victims. They require special counseling to equip them to face the two fold
tragedy – discrimination besides the tsunami tragedy. The children have to be
watched out for health care and the social worker can ensure these families are not left
out in the counseling process.
Geeta Raj (2005) makes a narration on the result of 26th December 2004.
People of Port Blair will never be able to forget the Sunday morning when the earth
shook and everything seemed to come to a standstill. All around there was a
frightening vibration. It was 6.30 in the morning and people who were sleeping ran
out suddenly to the streets in a state in of shock. The Christmas festivities of the
previous evening were forgotten. Nobody was aware of the greater danger which lay
ahead to them.
Bharat Dogra (2005) describes about the rehabilitation the victims of the
widows and orphans. When the super cyclone struck Mahava village of Erasma block
(Jakatingpure village in Orisa) a gie did not know what had happened. She was swept
by the various waves and carried away as much as twelve kilometers. It was a miracle
that she survived and later managed to find her way back to her village.
Madhu Sekar’s (2005) discussion reveals that tsunami comes from the
Japanese language ‘Tsu’ means harbour and ‘nami’ waves. It can be generated by any
disturbance that displaces a large mass of water such as an earthquake, landslide,
volcanic eruptions, explosions, or meteor impact. They can the inundate coastline
93
causing devastating cause in to property and live. They can be generated when the
sea floor abruptly caves in and vertically displaces the overlying water. Large vertical
movements or the earth’s crust can occur at the plate boundaries. When the dense
oceanic plates slip under continental plates in a process known as subduction, the
resultant quakes generate tsunami.
Vijay Agarwal et al. (2005) viewed that recent tsunami of 26 Dec.2004 which
affected large parts of East Coast and Andaman and Nicobar Islands is unique in term
of its rarity and severity. One of the key elements of managing such a disaster is the
forewarning and likely impact in terms of coastal surge and inundation. This calls for
working with appropriate ocean models pertinent to the event. Currently India is
working on a comprehensive model to simulate and predict tidal movement for Ocean
wave propagation and prediction of ocean-air interactions. The surge build up in the
coastal regions is the final outcome or the whole exercise. Tidal Ocean Atmospheric
Surge and Tsunami Simulations (TOASTS) model is currently under extensive
testing.
Parvinder Chawla (2005) gives a detailed description of the nature, causes
and the effect of tsunami He also cites that when tsunami reaches the seashore, its
height increases. At the same time, another part of the waves are migrating towards
to the seashore. The signs and symptoms of tsunami is the change in the water level
of the sea.
Abdul Kalam’s (2005) notion on the human innovations to face any disaster
reveals that science and technology could help us to prevent necessary along with
disaster. The urgent need for setting up of tsunami warning system is also mentioned
people’s movement to handle the disasters in future..
94
Women from fishing households were never directly engaged in what may be
narrowly defined as fishing. They always participated in a number of fish related
activities not all of which were necessarily paid and which supplemented the average
household earning capacity. Unfortunately there is hardly a census or survey that has
adequately captured the full extent of work participation by women from the fishing
households. This is true today as it was a generation ago from the micro level
information. It appears that women’s work participation may increase considerably in
the two sahis (hamlets) of Chandrabhaga fisher community.
Ravender banyal. (2005) states whenever the natural disaster strikes, it leads
to the mixing-up of science with pseudoscience, facts with fiction and professional
with novice. Although literacy level in India has crossed the 60% mark an appalling
amount of pseudoscience has been generated as a by product of this information age.
Scientific literacy still remains an elusive goal to be achieved. Media has to take
significant share of blame for promoting and reinserting pseudoscientific beliefs in the
society. It is just that people today get to know about mere earthquakes due to better
communication and increased awareness about natural disasters and also because
previously uninhabited or poorly inhabited regions are now cluttered with more
people around to feel the event.
Sudhir Jain (2005) analyses the great mega thrust of Sumatra Earthquake
and Tsunami on 26, Dec.2004 at 06:28:53 a.m.IST it was the most devastating
tsunami in the known history. The deadly tsunami waves lashed low-lying towns
adjoining the coastline of eleven countries causing more than 1, 50,000 deaths. Closet
Indian landmarks to the epicenter are Andaman and Nicobar Islands over a narrow
area of about 800km in the Bay of Bengal. The maximum in this area (on the MSK
Scale) along the Andaman and Nicobar Islands may be placed at VII mainland Indian
95
coast at V. It resulted in the death of over 10,000 persons in India with over 5,600
persons missing. Extensive devastation of the built environment occurred across the
populated Andaman and Nicobar Islands and the coastal areas of Andhra Pradesh,
Tamil Nadu and Kerala along the mainland coastline of India. Tsunami created giant
waves as high as 10 – 12m in several instances. Objects were found on top of the
trees after the tsunami, Buildings constructed on the coast were washed away by the
great waves. In general, constructions in circular plane (e.g. circular water tanks, light
house) did better under the onslaught of tsunami as the water could easily flow around
such objects.
Santosh Srinivasan (2005): The tsunami washed out the houses of many
fishermen in the coast. It was the fiber boat and catamaran users who were the most
affected the since they lived mostly in small huts closer to the sea. These houses were
all totally washed out. But they were provided with temporary shelters by both the
government and non-governmental organizations within 10 days after the waves
struck. The organizations compromised on planning and quality of the shelters. The
most common type is the bitumen-cardboard mix used for making these shelters.
While constructing these none of the organizations seem to have thought that the
people may have to stay in these shelters for a considerable amount of time. These
shelters were totally unfit for the summer in these villages. During the month of April
and May it was a common sight in all villages to see women and children sitting
under the trees to escape the heat inside the shelter. Due to the severe heat the
bitumen melted in many of the shelters.
Krishna (2005): examined the vulnerability to coastal hazards along the
Indian coast. The following elements need to be considered for preparedness: a)
awareness about (1) evolution of a hazard based on past experience and its frequency
96
of occurrence, and (2) distribution of the magnitude of past hazardous events; ii)
appreciation (quantitative as far as possible) of vulnerability to a hazard; iii) ability to
predict either deterministically or stochastically; iv) response readiness before and
after hazards(ous) events; and (v) education at all levels.
Madhu Sekar‘s (2005): discussion reveals that disaster can result from
meteorological phenomena such as typhoons and hurricanes, sheet flooding, marine
and drive based floods. Geological processes like volcanic eruptions, earthquakes and
tsunami can cause havocs. Climatic phenomena such as the El Nino Southern
Oscillation that result in a lowering of mean sea level in the east of the region. Failure
of the monsoon rains in India and drought in Indonesia and Australia would be
hazardous to human settlements and the life in general.
Sebastian Ousepparampil’s (2005) discussion reveals that it was due
to the giant tidal waves (tsunami) which lashed the Indian coast on 26, Dec.2004,
following the earthquake in the seabed of the Indonesian coast killed more than
13,000 people were killed and hundreds were homeless in India. It affected the Indian
coastal States and among them the worst hit are Andaman and Nicrobar Islands,
Tamil Nadu, Pondicherry, Kerala and Andhra Pradesh. The calamity was
unprecedented in its suddenness, ferocity and loss to coastal economy. It totally
wrecked the lives of fishermen and farmers along the coast.
Krishna’s (2005) on the tsunami on 26th December, 2004 reveals that over
7000 km long coastline were exposed to hazards and that we are not prepared to face
all of them. Preparedness to guard as against hazards requires implementation of
scientifically associated techonology.
Sebastian Ousepparampil (2006) observed that the catholic Health
Association of India (CHAI) and the Sister Doctor’s Forum of India (SDFI) together
97
responded to the situation immediately. A team of our sister-doctors, four
professional social workers, 8 nurse and one logistic personnel reached the worst
affected district of Nagapattinam on the evening of 26th December, 2004 to render
medical relief. The team camped at Velankanni providing medical and mental health
care for the affected people through mobile clinic, visits to the existing relief camps
and counseling. Affected people from over 28 villages were provided with health
services
WISTA OCEAN WEALTH reveals that the Ocean exploration about to
achieve its mission NOAA has been implementing a programme of ocean exploration
through interdisciplinary expeditions. These have resulted in a wide variety of
impetrated discoveries including active submarine volcanoes, unsuspected ecosystems
in extreme environment, living and non-living marine resources and even historical
shipwrecks in a recently led series of expedition to the Atlantic Ocean in such as the
“lost city of Atlantis” for the first time NOAA exercised “Telepresence Technology”
in less than two seconds. That traveled from 620 meters below sea level to the
NOAA research.
Avanish Kumar (2006) viewed that during the past four decades natural
disasters such as earthquakes, droughts, floods, storms and tropical cyclones wild land
fires, and volcanic eruptions had caused major loss of human lives and livelihoods.
The destruction of economic and social infrastructure as well as environmental
damages, economic losses had increased almost ten times during this period. He
emphasized the need for public participation on how to reduce vulnerability to
hazards. This involves programmes related to formal and non-formal education and
multi-disciplinary professional training. Needless to say those media and school
systems around the world have a crucial role to play. Efficiency can be optimized via
98
exchange of experiences amongst countries and constructive dialogue amongst
stakeholders via participatory processes, prioritization of tasks in the various, phases
of disaster management (prevention, preparedness, response rehabilitation and
recovery) has to be agreed upon to cope with such a situation.
Uthaikumar (2006) stated that the disaster education may include
components namely providing disaster preparedness information and offering hands
on training to deal with disaster. This educational end should be a tool to create an
awareness of disaster with basic information about various types of disaster. In the
recent tsunami all the primitive tribes in the Andaman and Nicobar Island such as the
sentinels shompens and the holschu were unaffected due to the informal early warning
system. To inform the coastal communities about cyclone earthquakes, tsunamis
thunder forms etc…community public address system should be installed for quick
communication. It should also contain action tips that should prepare the people for
all the three “before-during –after” stages of a disaster strike. He also emphasized
some kind of early warning system to inform the coastal community about cyclones
tornadoes, earthquakes, tsunamis, thunderstorms etc if needed. Community public
address system for the quick communication mid-way safe-havens (large halls, toilets,
communication, facilities etc.) are also required for the fishing community some kms
away from their village (not too for, not too near could also be created).
The Department of Environment (2007) global warming as a
climate change refers to a statistically significant variation in either the mean state of
the climate on in it’ variability persisting for an extended period. Climate change may
be due to natural internal processor or external forcing, or persistent anthropogenic
changes in the composition of the atmosphere or in land use.
99
Prakash et..al (2007): hold the opinion that any disaster is a second major
problem after war. Millions of people are affected yearly which cost around 50000
million US dollars/year and result in approximately 25, 0000 deaths per year; 20
major disasters strike the world yearly. Most of them are floods, cyclones and
earthquakes Global statistics has projected the occurrences that reveal “over three
decades the impact of disaster has significantly increased”.
Sebastian Ousepparampil’s (2007) has shocking memories of Bhopal gas
tragedy of 1984, the later earthquake of 1993, and Gujarat earthquake of 2004 They
had the faded from our mind. Those disasters killed and incapacitated tens of
thousands of people and destroyed properties worth crores of rupees. .
Sanjay Srivastava et al. (2007) opine disaster risk reduction being h
information communication technologies (ICTs) that have emerged over the last two
decades lend them to gather possibilities of integration of different communication
system. The interpretability of various communication systems including internet,
mobile phone, fax, e-mail, radio and television are reaching out rapidly to large cross-
sections of the people including the fishing communities. The community-owned
approach has to be considered as a bottom-up strategy for absorption of high-end
technologies like space technology. For environmentally sustainable and socially
equitable development has implemented a variety of programmes in coastal system on
biodiversity and biotechnology, ecotechnology and sustainable agriculture education
communication training and capacity building.
Radha et.al (2008) perceived that after tsunami the administration was very
conscious and gave priority to reach women and children by its relief and
rehabilitation efforts. Even though a large portion of funds is utilized in the areas of
infrastructure development and livelihood equipments the District Collector motivated
100
the administration to concentrate on rehabilitating the children who lost their parents.
Social Welfare Department in Nagapattinam District has been running an orphanage
for the accommodation of 85 children aged 5-18 years. In service home at Sirkali,19
children aged 14 years and above are nurtured with parental care by the Department.
The fisheries department in Nagapattinam district played a vital role in
identifying actual losses of livelihood equipment for fisher folk in tsunami affected
village. By this systematic exercise, the Department found that 18,399 fisherman had
lost their fishing vessels and prepared a package to distribute new equipments for the
amount of Rs.5339.88lakhs. To safeguard the distributed rupees so far 664 boats have
been insured by the district administration.
Chawla, (2008) Tsunami waves typically radiate in the direction opposite to
the seismic disturbance. In case of Sumatra quake (December-26, 2004). The seismic
disturbance was from and north to south beneath the ocean floor. While the tsunamis
are distinguished from normal coastal surf by their great length and speed a single
wave in a Tsunami series might be 160 km long and race across the ocean at 965
kmph. When it approaches a coast line the wave slows dramatically, but it also right
rises to great heights because the enormous volume of water piles up in shallow
coastal bays unlike sand, which is generated by wind and the gravitational tag of the
moon and other celestial bodies. Tsunami does not break on the coast line every few
seconds. Because of the size, it might take an hour for another one to arrive, some
Tsunami’s appear as a tide that does not stop rising while others are turbulent and
savagely chew up the coast without instrumentation. So little is known is about this
tsunami that researches must wait for eyewitness accounts to determine its
characteristics. In the hours following an earthquake tsunamis evenly lose their
family to irrigation over the rough ocean bottom or simply as the waves spread at over
the ocean’s enormous surface. .

101
Murty, Vice-resident of the Tsunami Society observes, the total energy of the
tsunami waves was about five macerations of TNT (20 Perijoules). This is more than
twice the total explosive energy used during all of World War II (including the two
atomic bombs), but still a couple of orders of magnitude less than the energy released
in the earthquake itself. In many places the waves reached as far as 2 km mi) inland.
The review of studies make amply clear that only few attempts had been made on
social exclusion, community preparedness in disaster management with reference to
coastal areas. As natural disaster is sudden in its occurrence the coastal community
life is marked by uncertainties and very many risks. Since the EWS based community
preparedness is not in place to predict the disaster and protect the people in coastal
areas, it provided the necessary research gap and need for preparation of an action
plan in this regard based upon the social structure, circumstance leading to
occurrence, extent of social exclusions and marginalistion as a result of natural
disasters, etc. and a Plan of action for community’s preparedness in disaster
management.
102
CHAPTER-IV
RESEARCH METHODOLOGY
Statement of the Problem
Natural disasters occur at any time without warning and they are considered
more dangerous than the manmade Weapons of Mass Destruction (WMD). The
scientific tradition had continued with the array of scholars increasingly showing
interests in these subjects of study from the early period onwards. Aristotle (384-322
BC) believed that all matters are combinations of five elements-earths, water, air, fire
and celestial bodies like stars, sun etc. Thomas Hobbes (1558-1679) the philosopher
and atheist, who had ridiculed the theological cosmography of the under world stated
water and air inside earth were responsible for earth quake. Isaac Newton (1642 –
1727) had concluded in his study that “earth by heat becomes fire and cold returns to
earth”. His great discovery on gravitational energy was published in 1887 that helped
advance the study relating to earthquakes and other natural disasters in the world.
The evolution of this type of thoughts on natural disasters in the universe had
contributed to the progressive expansion of knowledge on the earth and its
phenomenal activities in the 20th century and thereafter.
The significance of natural disasters in today’s environment sometimes comes
under question why do we need to bother so much? After all, disaster has been with
us long as recorded in history and presumably even longer. Generations of people
have had to withstand many disasters. They have suffered the consequences and
recovered from them and life has continued on. Basically this is true. However, there
are certain factors which need to be considered in relation to the modern challenges,
as people are to involve in disaster management.

103
A natural phenomenon such as earthquake, cyclone, volcanic eruption,
tsunami, wildfire, flood, landslide and drought still persists. So do their basic
manmade counterparts, such as major accidents. These natural disasters continue to
cause the grievances like human casualties, economic and social loss and damage to
the environment. It is certainly true that we have learned to cope with these problems
to some extent. But we have neither eliminated nor contained them, so we may have
to modify their effects in various ways; they continue to inflict unacceptable pressures
on the population which is marked by a total subsistence of life.
India has been suffering from frequent multiple hazards and recognition of this
fact has resulted in the establishment of a well defined organization system at the
Centre and the State levels for response and relief management in the event of
occurrence of any kind of a disaster. Disasters are as inevitable as death. They have a
multidimensional effect on several sectors, personal, social, economic and the like.
They have a crippling effect on the economy and the infrastructure of the country.
Disasters not only undermine development efforts and lead to wastage of scarce
resources, but also put back development by destroying initiatives. The direct effect
of disasters on economy is damage to infrastructure – crops and productive assets of
the local population besides huge financial burden of relief and rescue operations.
Indirectly, disasters also lead to decline in production, loss of income due to
unemployment and indebtedness of the poor and increased cost of goods and services
etc.
The impact of natural disasters is colossal which affects the social life of
people, their habitat, property, animals etc. The response to such a colossal
destruction of humanity, animals, property has been a burden to the society which is
faced with extinction of all kinds. This calls for a system of natural disasters
104
preparedness to control and minimize the severity of the impact of such natural
disasters particularly in the coastal regions of our country. This necessitates the
community’s participation in disaster preparedness. Though not many studies on
natural disasters and community preparedness from the sociological dimension
available, few haphazard attempts were made in isolated areas, to understand the
magnitude of the problems faced by the communities vulnerable to such disasters.
Therefore, this study emerges from this background to undertake a comprehensive
study to measure systematically the extent of social exclusions, community
preparedness in disaster management, and the life risks of the communities living in
the coastal areas in Tamil Nadu in the absence of early warning system to face the
challenges of natural disasters with special reference to Tsunami.
Significance of the study
This study makes a systematic attempt to analyse the circumstances lead to
that tsunami extent of social exclusion as a result of disasters in such areas vulnerable
to frequent occurrence natural disasters like flood, cyclone, tsunami, etc. Yet another
dimension covered under the study proposed is to make an assessment of the nature of
marginalisation as a result of such disasters. The study is expected to come out with a
comprehensive plan of action towards disaster preparedness with community
participation and disaster management activities. Such a study would be highly
helpful in the policy formulation and programme planning towards the relief and
rehabilitation activities as well as creation of early warning system for natural
disasters. The findings and the plan of action expected from the study would be
useful for undertaking development activities by GOs and NGOs as well as the
international development and funding agencies.
105
(iii) Objectives
The following objectives have been formulated for this study:
1. To make a comprehensive analysis of the social structure of the coastal
communities in the study area.
2. To expose the extent of social exclusions and marginalistion as a result of
natural disasters with reference to people living in the tsunami affected
coastal areas.
3. To expose the circumstances leading to occurrence of various types of
natural disasters and their risky social life in the coastal areas.
4. To elicit community’s preparedness in disaster management with
particular reference to tsunami affected coastal areas.
5. To suggest suitable measures and a plan of action for community’s
preparedness and disaster management in the tsunami affected areas.
(iv) Methodology
Selection of the Study Area
This study has been undertaken in two tsunami affected coastal districts of
Tamil Nadu namely Cuddalore and Kanyakumari. In addition to primary data
collected structured interview schedule, case studies and focused group discussions
were also carried out in the tsunami affected areas in the neighborhood of the study
area.
Sampling Design
Purposive sampling procedure was adopted to conduct the structured
interviews in the study areas.
Selection of Respondents
The respondents were selected based upon the list of the victims of tsunami
from Government records.
106
Tools of Data Collection
A suitable interview schedule was constructed by incorporating the objectives
of the study. In addition to case studies, focus group discussions, observation
technique were also adopted as supplementary methods in this research.
Scope of the Study
The study is focused on the social exclusion and the effect of disaster and
management in the coastal communities occurred as a result of tsunami –
a natural disaster that took place recently in the coastal districts in Tamil Nadu.
Sources of Data
Primary Data
Primary data were collected from the respondents by means of personal
interview schedule.
Secondary Data
Relevant secondary data on the topic were collected from published sources
such as Reports, Websites, Newspapers, Books, and Periodicals etc.
Research Design
The Research Design adopted for this study was Descriptive cum Diagnostic
Design with an overtone of ex post facto description.
Data Processing Technique
Primary data collected from the respondents were statistically processed
through application of simple statistical tools and techniques, like averages and
percentages for the analyses and interpretations.
Reference period
The reference period of this research was 2007-2009 with ex post facto
description since tsunami struck in coastal district of Tamil Nadu in 2004.

107
CHAPTER-V
DATA ANALYSIS AND INTERPRETATION
This chapter is devoted to the analysis and discussion of primary data
collected from the study area. It is divided in to five subsections focusing on a specific
aspect of the study. The first subsection deals with Socio Economic Profile of the
respondents, the second subsection deals Social Structure of the study area, in the
third subsection Circumstances Leading to the Occurrence of various types of natural
disasters is presented, the fourth subsection deals with the Natural Disaster and Risks
in Social Life, fifth subsection presents Community Preparedness and Disaster
Management
Tables are presented logically by merging relevant variables in consonance
with the objectives of the study. Percentage and averages are used to analyse the
available data and accordingly interpretations are made based upon the primary data
collected from the respondents in Cuddalore and Kanyakumari districts. The five
subsections focusing on various aspects of the study are presented hereunder. The
figures in parentheses appearing in every table indicate percentage.
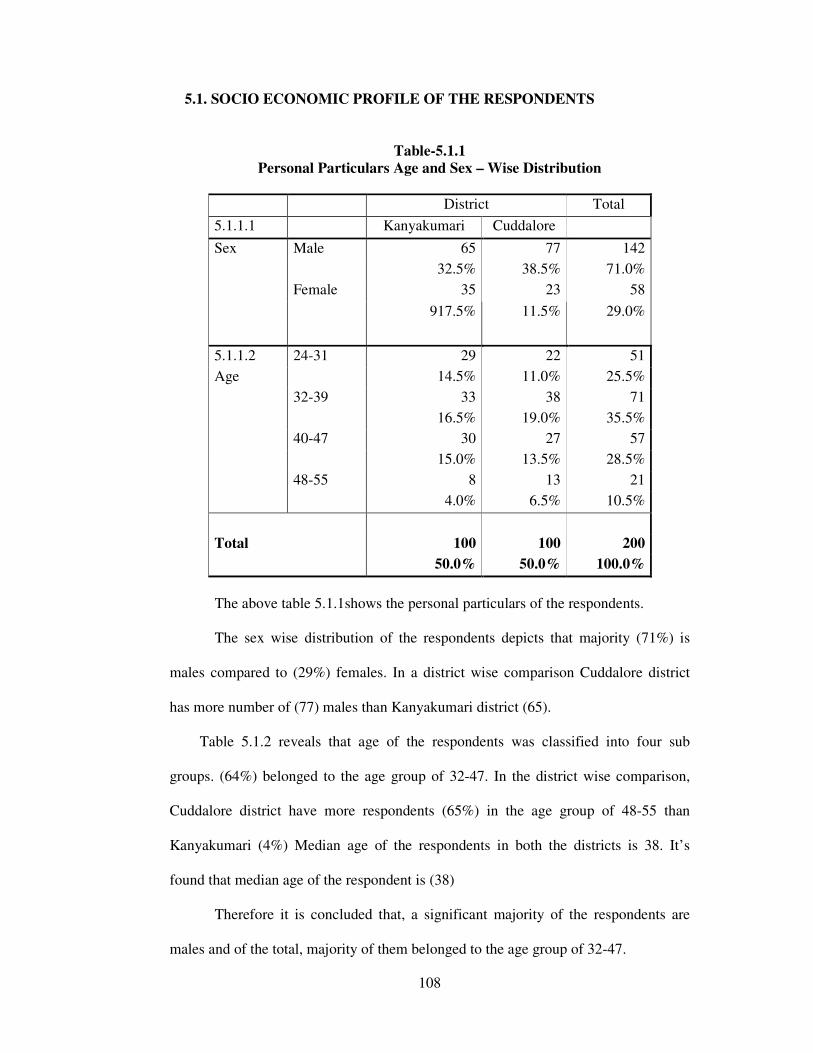
108
5.1. SOCIO ECONOMIC PROFILE OF THE RESPONDENTS
Table-5.1.1
Personal Particulars Age and Sex – Wise Distribution
District Total
5.1.1.1 Kanyakumari Cuddalore
Sex Male 65 77 142
32.5% 38.5% 71.0%
Female 35 23 58
917.5% 11.5% 29.0%
5.1.1.2 24-31 29 22 51
Age 14.5% 11.0% 25.5%
32-39 33 38 71
16.5% 19.0% 35.5%
40-47 30 27 57
15.0% 13.5% 28.5%
48-55 8 13 21
4.0% 6.5% 10.5%
Total 100 100 200
50.0% 50.0% 100.0%
The above table 5.1.1shows the personal particulars of the respondents.
The sex wise distribution of the respondents depicts that majority (71%) is
males compared to (29%) females. In a district wise comparison Cuddalore district
has more number of (77) males than Kanyakumari district (65).
Table 5.1.2 reveals that age of the respondents was classified into four sub
groups. (64%) belonged to the age group of 32-47. In the district wise comparison,
Cuddalore district have more respondents (65%) in the age group of 48-55 than
Kanyakumari (4%) Median age of the respondents in both the districts is 38. It’s
found that median age of the respondent is (38)
Therefore it is concluded that, a significant majority of the respondents are
males and of the total, majority of them belonged to the age group of 32-47.
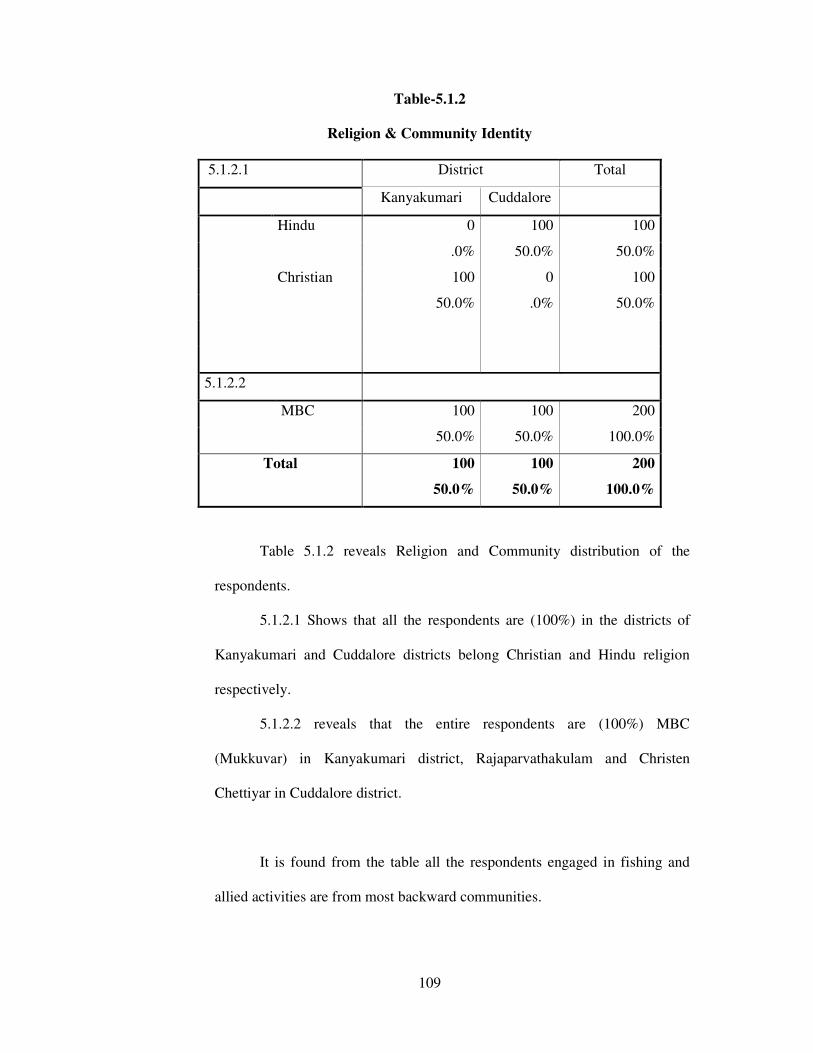
109
Table-5.1.2
Religion & Community Identity
5.1.2.1 District Total
Kanyakumari Cuddalore
Hindu 0 100 100
.0% 50.0% 50.0%
Christian 100 0 100
50.0% .0% 50.0%
5.1.2.2
MBC 100 100 200
50.0% 50.0% 100.0%
Total 100 100 200
50.0% 50.0% 100.0%
Table 5.1.2 reveals Religion and Community distribution of the
respondents.
5.1.2.1 Shows that all the respondents are (100%) in the districts of
Kanyakumari and Cuddalore districts belong Christian and Hindu religion
respectively.
5.1.2.2 reveals that the entire respondents are (100%) MBC
(Mukkuvar) in Kanyakumari district, Rajaparvathakulam and Christen
Chettiyar in Cuddalore district.
It is found from the table all the respondents engaged in fishing and
allied activities are from most backward communities.

110
Table-5.1.3
Educational and Occupational Status
5.1.3.1 District Total
Education Kanyakumari Cuddalore
Illiterate 75 79 154
37.5% 39.5% 77.%
Primary 15 8 23
7.5% 4.% 11.5%
Secondary 6 11 17
3.% 5.5% 8.5%
Higher Secondary 4 2 6
2.0% 1.0% 3.0%
5.1.3.2
Occupation
Fishing 94 89 183
47.0% 44.5% 91.5%
Agriculture 6 0 6
3% .0% 3.0%
Business (other than fishing) --- 11 11
5.5% 5.5%
Total 100 100 200
50.0% 50.0% 100.0%
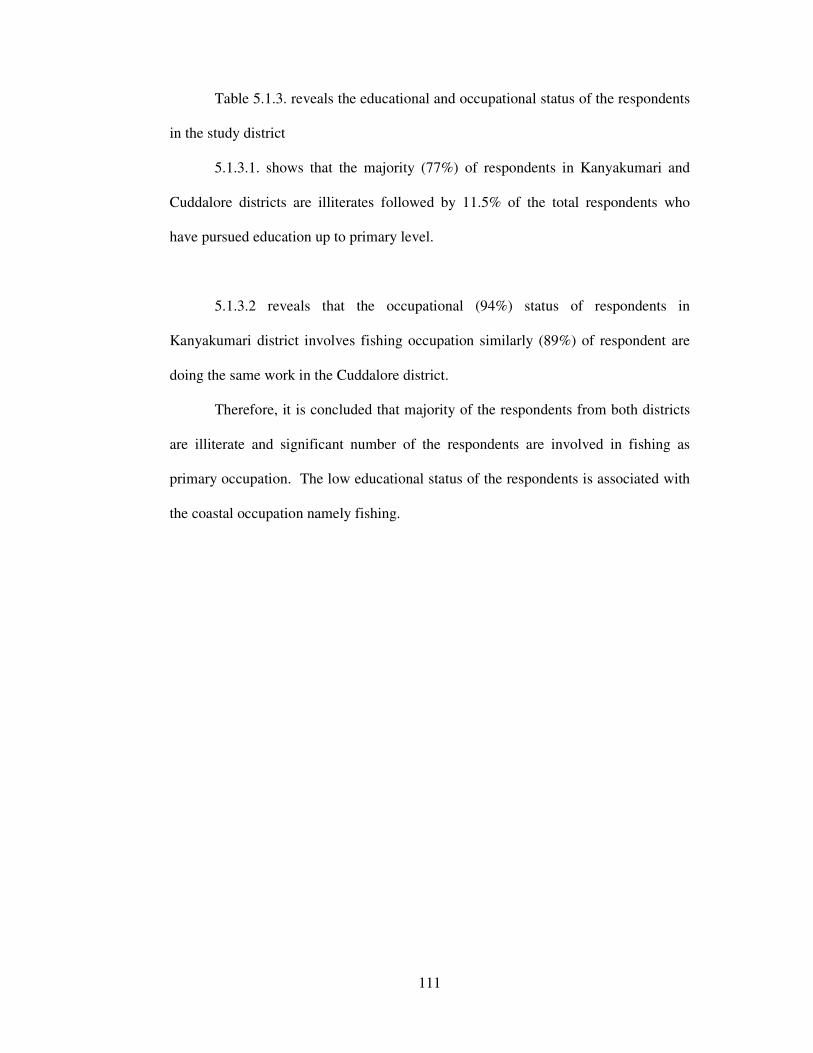
111
Table 5.1.3. reveals the educational and occupational status of the respondents
in the study district
5.1.3.1. shows that the majority (77%) of respondents in Kanyakumari and
Cuddalore districts are illiterates followed by 11.5% of the total respondents who
have pursued education up to primary level.
5.1.3.2 reveals that the occupational (94%) status of respondents in
Kanyakumari district involves fishing occupation similarly (89%) of respondent are
doing the same work in the Cuddalore district.
Therefore, it is concluded that majority of the respondents from both districts
are illiterate and significant number of the respondents are involved in fishing as
primary occupation. The low educational status of the respondents is associated with
the coastal occupation namely fishing.
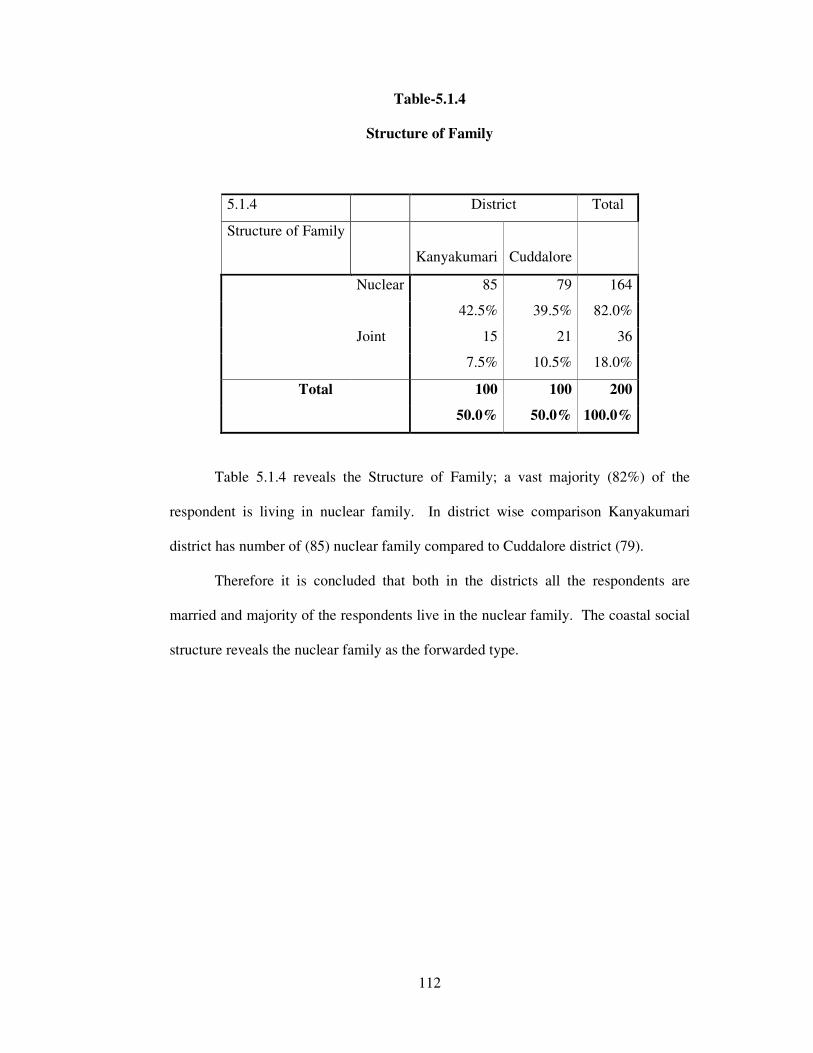
112
Table-5.1.4
Structure of Family
5.1.4 District Total
Structure of Family
Kanyakumari Cuddalore
Nuclear 85 79 164
42.5% 39.5% 82.0%
Joint 15 21 36
7.5% 10.5% 18.0%
Total 100 100 200
50.0% 50.0% 100.0%
Table 5.1.4 reveals the Structure of Family; a vast majority (82%) of the
respondent is living in nuclear family. In district wise comparison Kanyakumari
district has number of (85) nuclear family compared to Cuddalore district (79).
Therefore it is concluded that both in the districts all the respondents are
married and majority of the respondents live in the nuclear family. The coastal social
structure reveals the nuclear family as the forwarded type.

113
Table 5.1.5
Nature and Ownership of House after Tsunami
District Total
5.1.5.1 Kanyakumari Cuddalore
Nature of house
Pucca 100 100 200
50.0% 50.0% 100.0%
Total 100 100 200
50.0% 50.0% 100.0%
5.1.5.2
Ownership of house Government 58 0 58
29.0% .0% 29.0%
Funding Agency 42 0 42
21.0% .0% 21.0%
PMSSS 0 70 70
.0% 35.0% 35.0%
World vision 0 30 30
.0% 15.0% 15.0%
Total 100 100 200
50.0% 50.0% 100.0%
Table 5.1.5 reveals that the nature and ownership of house of respondent in the
two districts.
The of house wise distributions (5.1.5.1) of the respondent depict that majority
(100%) live in pucca houses in both the districts.
The details of ownership of house shows (5.1.5.2) of the houses were
classified the sub groups. 70% of houses were constructed by PMSSS (Pondicherry
Multi Purpose Social Service Society) in Cuddalore districts and the majority (58%)
of houses constructed by Government in Kanyakumari district.
Therefore it is concluded that, all the respondents’ house are pucca and
majority of the houses are built by the PMSSS (Pondicherry Multi Purpose Social
Service Society).
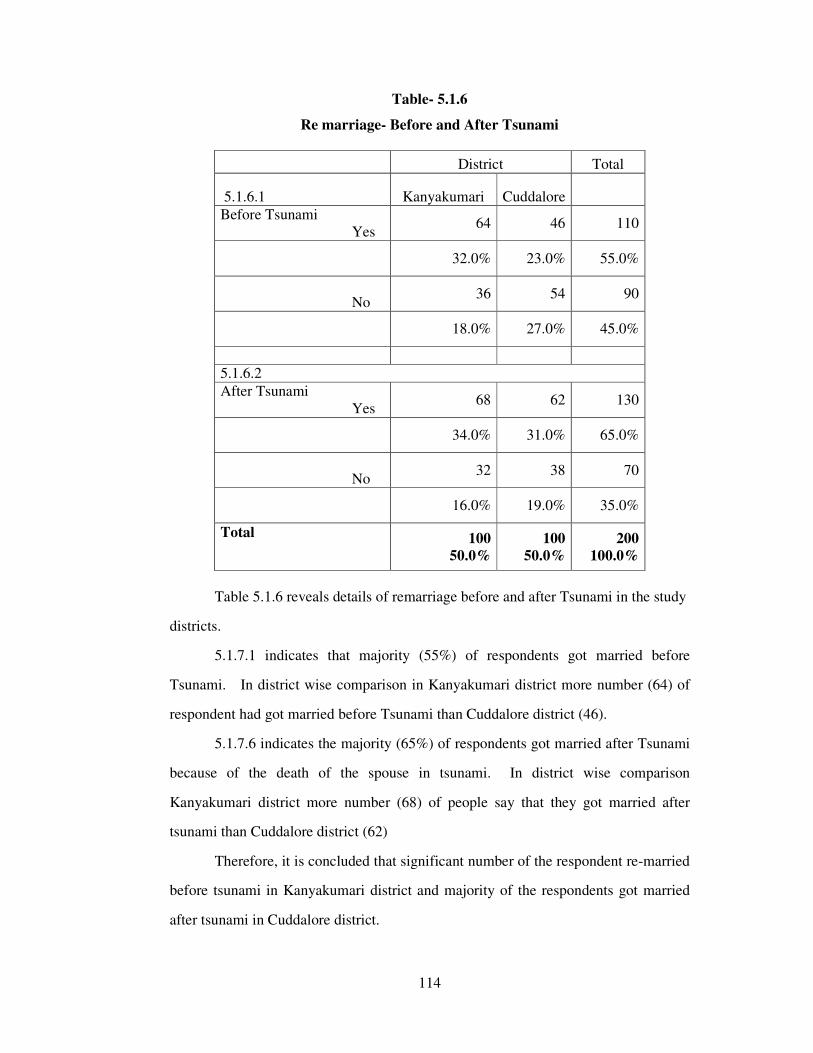
114
Table- 5.1.6
Re marriage- Before and After Tsunami
District Total
5.1.6.1 Kanyakumari Cuddalore
Before Tsunami Yes
64 46 110
32.0% 23.0% 55.0%
No
36 54 90
18.0% 27.0% 45.0%
5.1.6.2
After Tsunami Yes
68 62 130
34.0% 31.0% 65.0%
No
32 38 70
16.0% 19.0% 35.0%
Total
100
50.0%
100
50.0%
200
100.0%
Table 5.1.6 reveals details of remarriage before and after Tsunami in the study
districts.
5.1.7.1 indicates that majority (55%) of respondents got married before
Tsunami. In district wise comparison in Kanyakumari district more number (64) of
respondent had got married before Tsunami than Cuddalore district (46).
5.1.7.6 indicates the majority (65%) of respondents got married after Tsunami
because of the death of the spouse in tsunami. In district wise comparison
Kanyakumari district more number (68) of people say that they got married after
tsunami than Cuddalore district (62)
Therefore, it is concluded that significant number of the respondent re-married
before tsunami in Kanyakumari district and majority of the respondents got married
after tsunami in Cuddalore district.
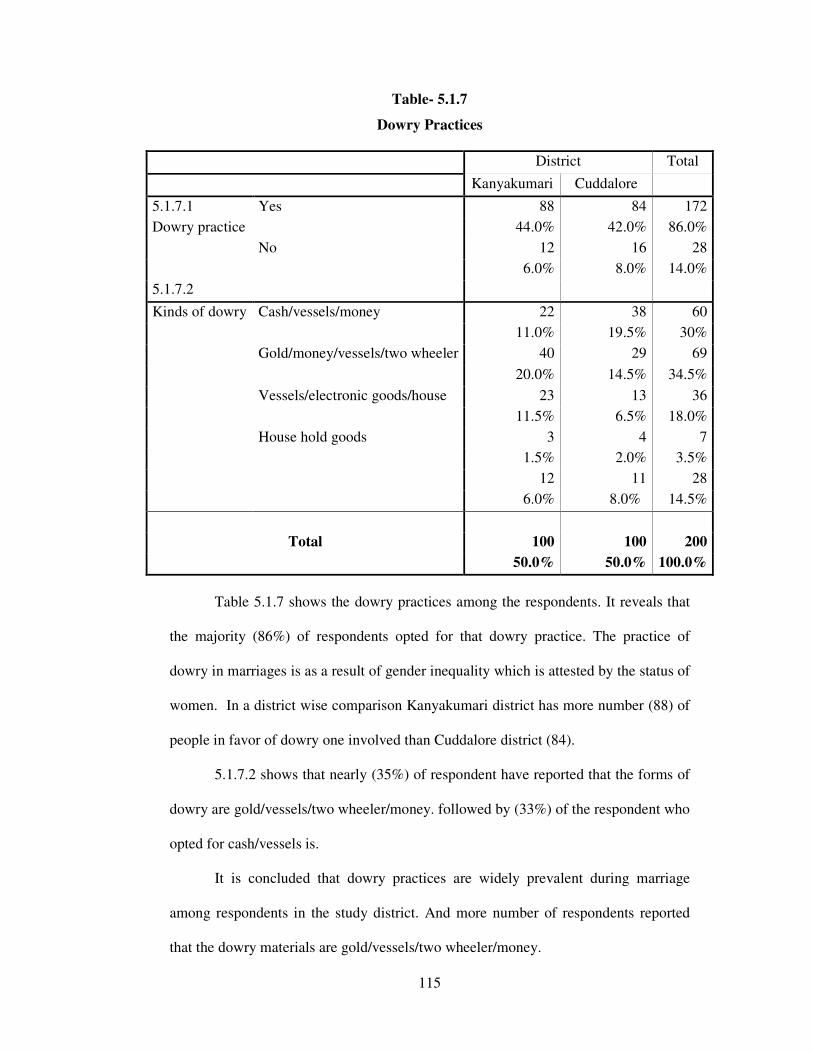
115
Table- 5.1.7
Dowry Practices
District Total
Kanyakumari Cuddalore
5.1.7.1 Yes 88 84 172
Dowry practice 44.0% 42.0% 86.0%
No 12 16 28
6.0% 8.0% 14.0%
5.1.7.2
Kinds of dowry Cash/vessels/money 22 38 60
11.0% 19.5% 30%
Gold/money/vessels/two wheeler 40 29 69
20.0% 14.5% 34.5%
Vessels/electronic goods/house 23 13 36
11.5% 6.5% 18.0%
House hold goods 3 4 7
1.5% 2.0% 3.5%
12 11 28
6.0% 8.0% 14.5%
Total 100 100 200
50.0% 50.0% 100.0%
Table 5.1.7 shows the dowry practices among the respondents. It reveals that
the majority (86%) of respondents opted for that dowry practice. The practice of
dowry in marriages is as a result of gender inequality which is attested by the status of
women. In a district wise comparison Kanyakumari district has more number (88) of
people in favor of dowry one involved than Cuddalore district (84).
5.1.7.2 shows that nearly (35%) of respondent have reported that the forms of
dowry are gold/vessels/two wheeler/money. followed by (33%) of the respondent who
opted for cash/vessels is.
It is concluded that dowry practices are widely prevalent during marriage
among respondents in the study district. And more number of respondents reported
that the dowry materials are gold/vessels/two wheeler/money.
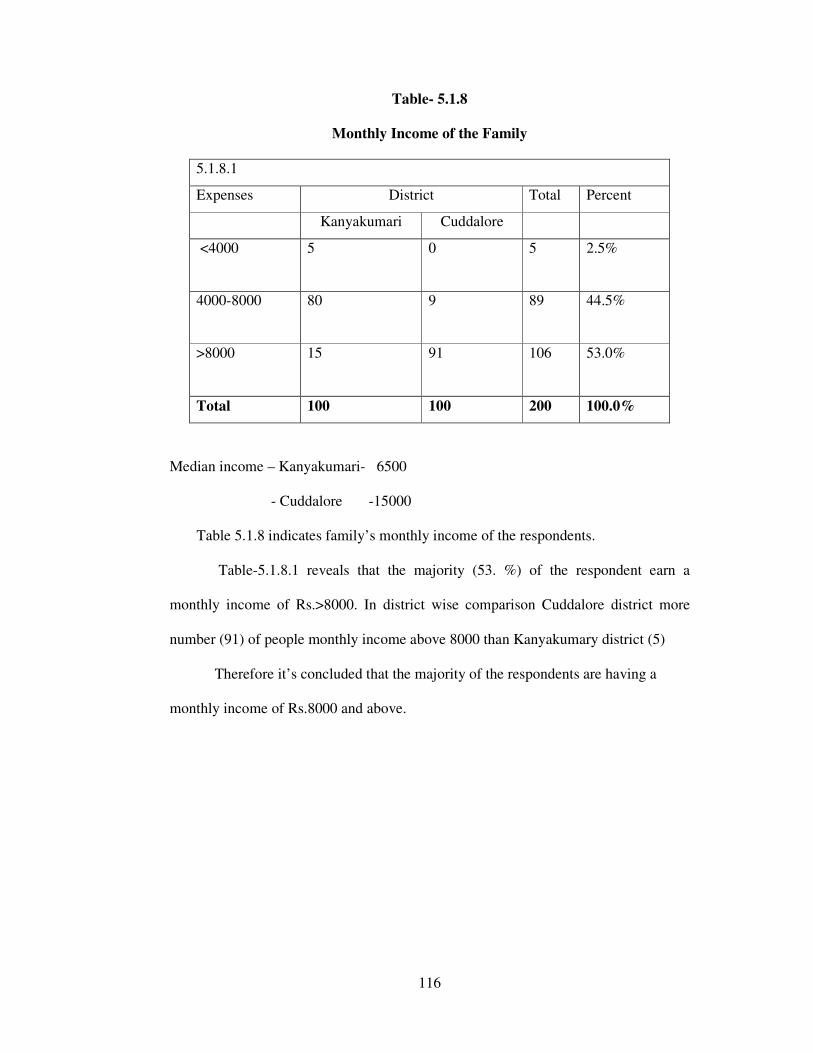
116
Table- 5.1.8
Monthly Income of the Family
5.1.8.1
Expenses District Total Percent
Kanyakumari Cuddalore
<4000 5 0 5 2.5%
4000-8000 80 9 89 44.5%
>8000 15 91 106 53.0%
Total 100 100 200 100.0%
Median income – Kanyakumari- 6500
- Cuddalore -15000
Table 5.1.8 indicates family’s monthly income of the respondents.
Table-5.1.8.1 reveals that the majority (53. %) of the respondent earn a
monthly income of Rs.>8000. In district wise comparison Cuddalore district more
number (91) of people monthly income above 8000 than Kanyakumary district (5)
Therefore it’s concluded that the majority of the respondents are having a
monthly income of Rs.8000 and above.
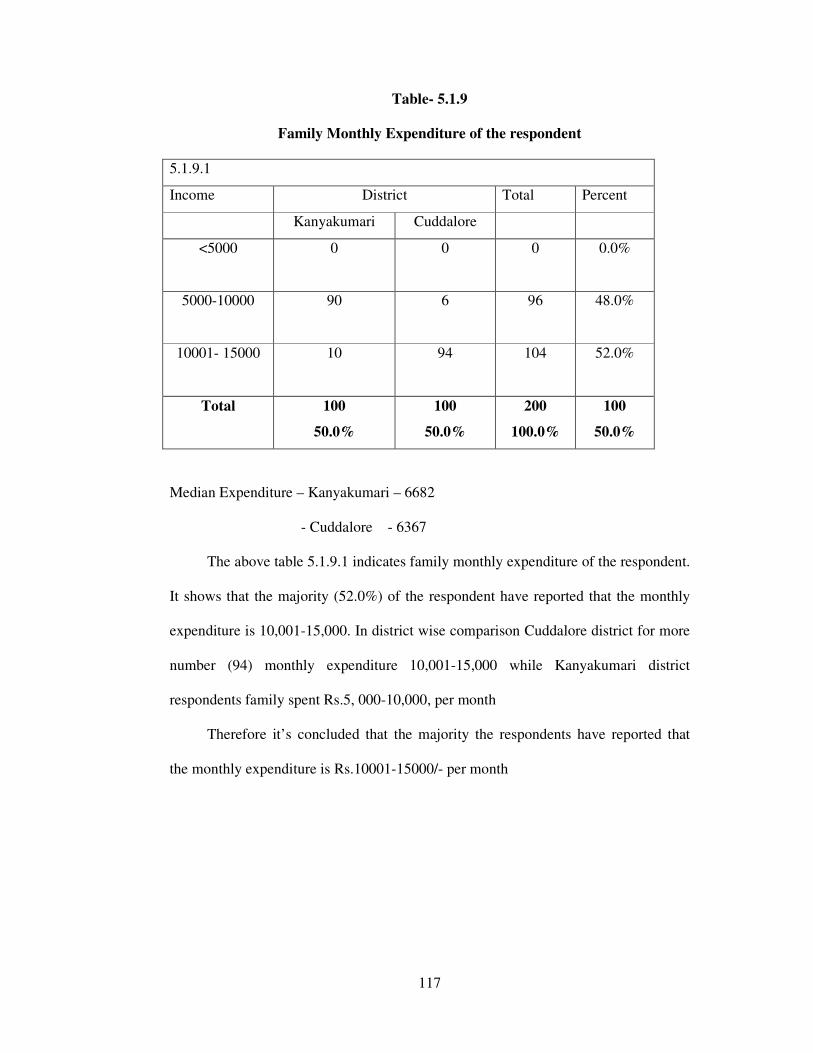
117
Table- 5.1.9
Family Monthly Expenditure of the respondent
5.1.9.1
Income District Total Percent
Kanyakumari Cuddalore
<5000 0 0 0 0.0%
5000-10000 90 6 96 48.0%
10001- 15000 10 94 104 52.0%
Total 100
50.0%
100
50.0%
200
100.0%
100
50.0%
Median Expenditure – Kanyakumari – 6682
- Cuddalore - 6367
The above table 5.1.9.1 indicates family monthly expenditure of the respondent.
It shows that the majority (52.0%) of the respondent have reported that the monthly
expenditure is 10,001-15,000. In district wise comparison Cuddalore district for more
number (94) monthly expenditure 10,001-15,000 while Kanyakumari district
respondents family spent Rs.5, 000-10,000, per month
Therefore it’s concluded that the majority the respondents have reported that
the monthly expenditure is Rs.10001-15000/- per month
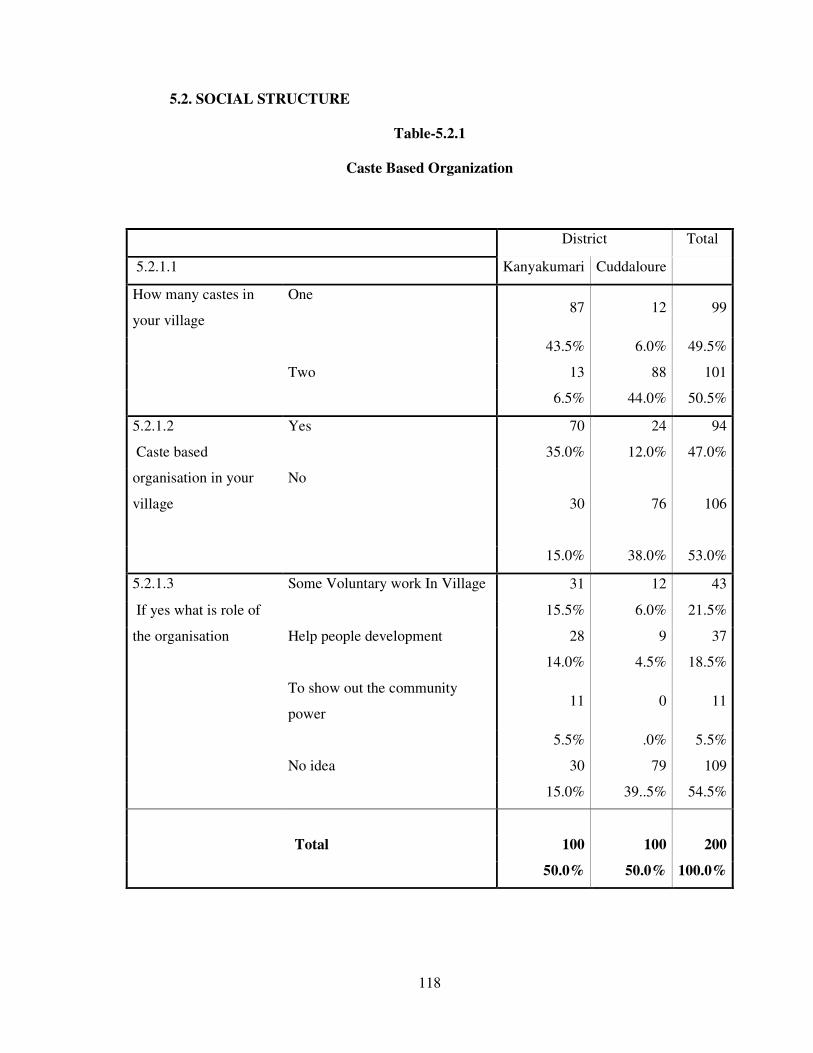
118
5.2. SOCIAL STRUCTURE
Table-5.2.1
Caste Based Organization
District Total
5.2.1.1 Kanyakumari Cuddaloure
How many castes in
your village
One 87 12 99
43.5% 6.0% 49.5%
Two 13 88 101
6.5% 44.0% 50.5%
5.2.1.2 Yes 70 24 94
Caste based
organisation in your
village
35.0% 12.0% 47.0%
No
30 76 106
15.0% 38.0% 53.0%
5.2.1.3 Some Voluntary work In Village 31 12 43
If yes what is role of
the organisation
15.5% 6.0% 21.5%
Help people development 28 9 37
14.0% 4.5% 18.5%
To show out the community
power 11 0 11
5.5% .0% 5.5%
No idea 30 79 109
15.0% 39..5% 54.5%
Total 100 100 200
50.0% 50.0% 100.0%
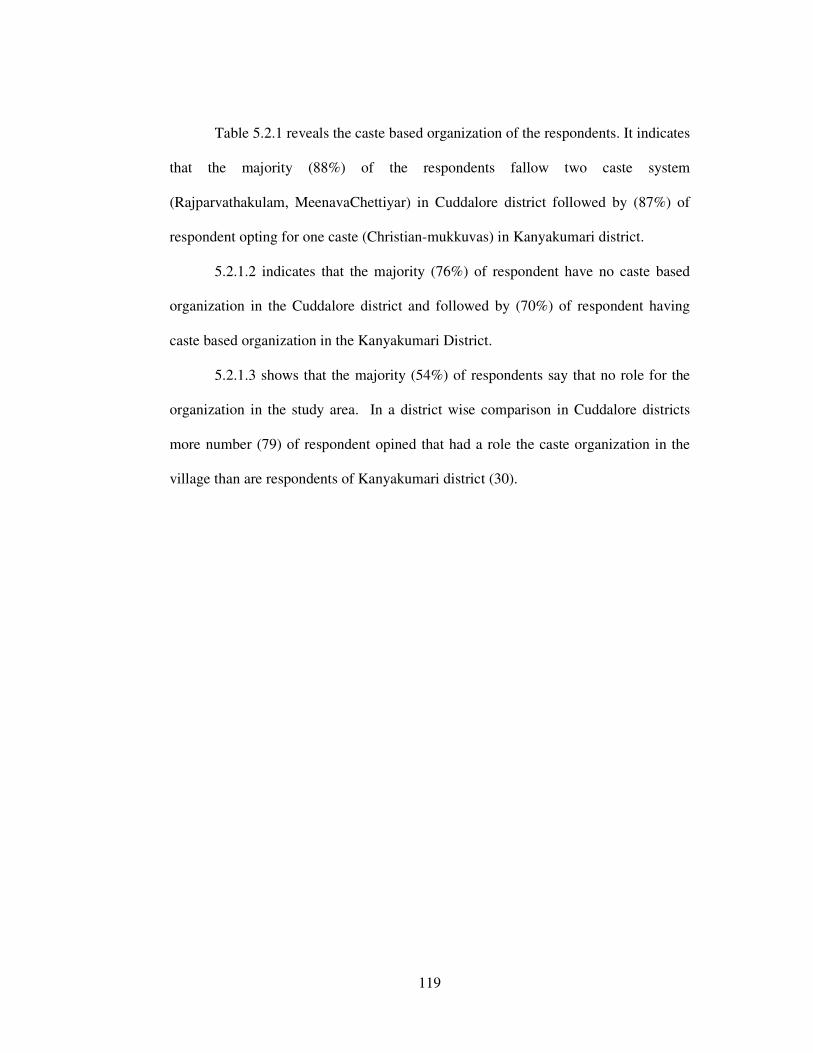
119
Table 5.2.1 reveals the caste based organization of the respondents. It indicates
that the majority (88%) of the respondents fallow two caste system
(Rajparvathakulam, MeenavaChettiyar) in Cuddalore district followed by (87%) of
respondent opting for one caste (Christian-mukkuvas) in Kanyakumari district.
5.2.1.2 indicates that the majority (76%) of respondent have no caste based
organization in the Cuddalore district and followed by (70%) of respondent having
caste based organization in the Kanyakumari District.
5.2.1.3 shows that the majority (54%) of respondents say that no role for the
organization in the study area. In a district wise comparison in Cuddalore districts
more number (79) of respondent opined that had a role the caste organization in the
village than are respondents of Kanyakumari district (30).

120
Table-5.2.2
Respondent Involvement in Caste- Based Occupation
5.2.2.1 District Total
Kanyakumari Cuddalore
Practice of caste based
occupation
Yes 69 88 157
34.5% 44.0% 78.5%
No 31 12 43
15.5% 6.0% 21.5%
5.2.2.2
Type of occupation Fishing
Only 69 88 157
34.5% 44.0% 78.5%
Other than
fishing 31 12 43
15.5% 6.0% 21.5%
Total 100 100 200
50.0% 50.0% 100.0%
The above table 5.2.2.1 shows that the caste and types of occupation of the
respondents. It reveals that the majority (79%) of respondents are involved in caste
based occupation. In district wise comparison Cuddalore district has more number
(88%) belonging to Hindu, (Rajaparvathakulam, Meenava chettiyar engaged in caste
based occupation than Kanyakumari district (69%) (Christian – Mukkuvar).
5.2.2.2 shows the types of occupation of the respondents. The majority (79%)
of respondents are engaged in fishing only. In district-wise comparison Cuddalore
district has more number of respondents engaged (88) in fishing only than
Kanyakumari (69) namely Hindu Padayachi
Therefore it is concluded that, a significant majority of the respondents are
involved in caste based occupation in the study area and the majority of respondents
are engaged only in fishing in the study districts.
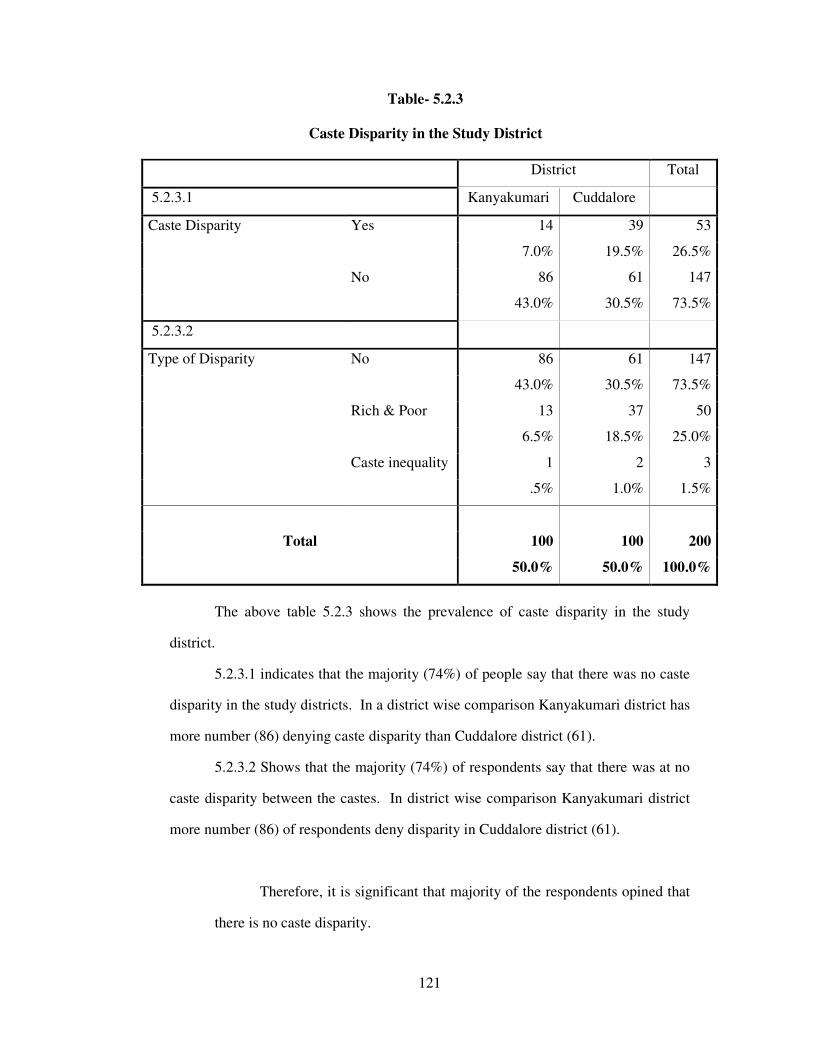
121
Table- 5.2.3
Caste Disparity in the Study District
District Total
5.2.3.1 Kanyakumari Cuddalore
Caste Disparity Yes 14 39 53
7.0% 19.5% 26.5%
No 86 61 147
43.0% 30.5% 73.5%
5.2.3.2
Type of Disparity No 86 61 147
43.0% 30.5% 73.5%
Rich & Poor 13 37 50
6.5% 18.5% 25.0%
Caste inequality 1 2 3
.5% 1.0% 1.5%
Total 100 100 200
50.0% 50.0% 100.0%
The above table 5.2.3 shows the prevalence of caste disparity in the study
district.
5.2.3.1 indicates that the majority (74%) of people say that there was no caste
disparity in the study districts. In a district wise comparison Kanyakumari district has
more number (86) denying caste disparity than Cuddalore district (61).
5.2.3.2 Shows that the majority (74%) of respondents say that there was at no
caste disparity between the castes. In district wise comparison Kanyakumari district
more number (86) of respondents deny disparity in Cuddalore district (61).
Therefore, it is significant that majority of the respondents opined that
there is no caste disparity.
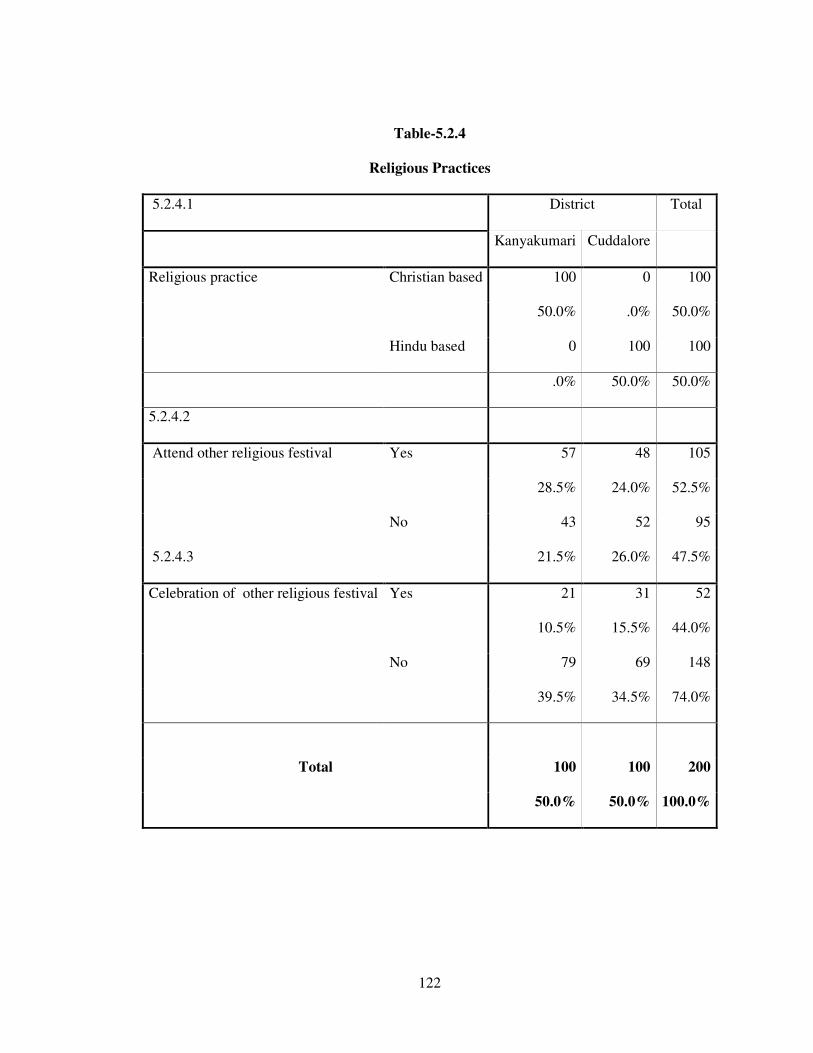
122
Table-5.2.4
Religious Practices
5.2.4.1 District Total
Kanyakumari Cuddalore
Religious practice Christian based 100 0 100
50.0% .0% 50.0%
Hindu based 0 100 100
.0% 50.0% 50.0%
5.2.4.2
Attend other religious festival Yes 57 48 105
28.5% 24.0% 52.5%
No 43 52 95
5.2.4.3 21.5% 26.0% 47.5%
Celebration of other religious festival Yes 21 31 52
10.5% 15.5% 44.0%
No 79 69 148
39.5% 34.5% 74.0%
Total 100 100 200
50.0% 50.0% 100.0%
123
The above table 5.2.4 reveals that religious practices of the respondents.
5.2.4.1 Indicates that all the respondents adopted (100%) Christian and Hindu
religion based practices in the district of Kanyakumari and Cuddalore respectively.
5.2.4.2 shows that majority (53%) of the respondent attended other religious
festivals. In district-wise comparison Kanyakumari district has more number (57)
attending other religious festivals than Cuddalore district (48).
5.2.4.3 reveals that the majority of the (74%) people don of observe other
religious ceremonious and festivals. In a district wise comparison Kanyakumari
district has more number (79) not celebrating other religious functions than Cuddalore
district (69).
Therefore it is concluded that a significant number of the respondents follow
Christian and Hindu religious practices in study districts and majority of the
respondents are attending other religious festivals and majority of respondents are not
celebrating the other religious festivals.

124
Table-5.2.5
Religious Discrimination
District Total
5.2.5. Kanyakumari Cuddalore
Any religious discrimination Yes 15 53 68
7.5% 26.5% 34.0%
No 85 47 132
42.5% 23.5% 66.0%
Total 100 100 200
50.0% 50.0% 100.0%
Table 5.2.5 shows that the majority (68%) of the respondents deny any
religious discrimination in the study area. In district wise comparison Kanyakumari
district has more number of respondents (85) denying religious problems in the area
than Cuddalore district (47).
Therefore it is understood from the table that there is no discrimination based
on religion.
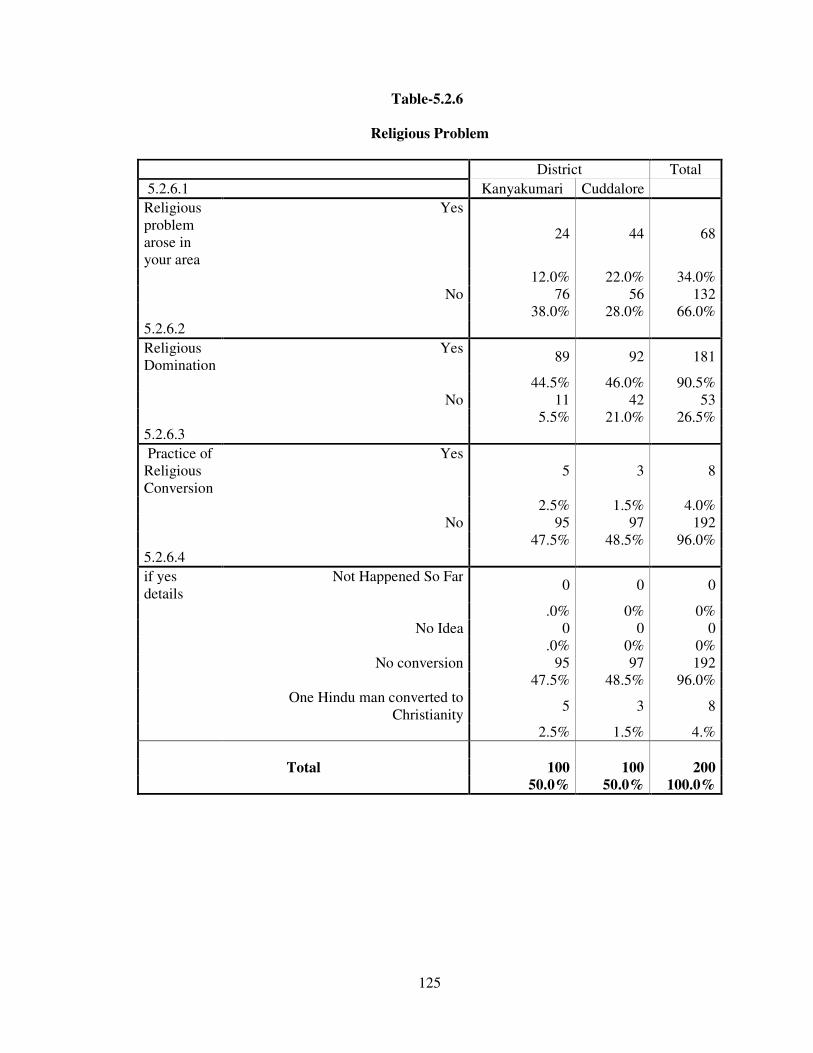
125
Table-5.2.6
Religious Problem
District Total
5.2.6.1 Kanyakumari Cuddalore
Religious problem arose in your area
Yes
24 44 68
12.0% 22.0% 34.0% No 76 56 132 38.0% 28.0% 66.0% 5.2.6.2
Religious Domination
Yes 89 92 181
44.5% 46.0% 90.5% No 11 42 53 5.5% 21.0% 26.5% 5.2.6.3
Practice of Religious Conversion
Yes 5 3 8
2.5% 1.5% 4.0% No 95 97 192 47.5% 48.5% 96.0% 5.2.6.4
if yes details
Not Happened So Far 0 0 0
.0% 0% 0% No Idea 0 0 0 .0% 0% 0% No conversion 95 97 192 47.5% 48.5% 96.0% One Hindu man converted to
Christianity 5 3 8
2.5% 1.5% 4.%
Total 100 100 200
50.0% 50.0% 100.0%
126
Table 5.2.6 reveals that religious problems in the study area
5.2.6.1 indicates that the majority (66%) of the respondents are reported of no
religious problems in the area. In district wise comparison Kanyakumari district has
more number (76) of respondent denying any religious problem in the village than
Cuddalore district (56)
5.2.6.2 shows that the majority (90.5%) of respondents reported that religious
domination there in the study districts because Kanyakumari district has Christian
domination and Cuddalore district had Hindu domination.
5.2.6.3 indicates that majority (96%) of the respondents reported of no religious
conversion in the study area.
5.2.6.4 reveals that majority (96%) of the respondent reported of no religious
conversion in the study area.
It is concluded that the majority of the respondents reported of no religious
problems in the study area and more respondent is reported that religious domination
is there in the study districts because Kanyakumari district had Christian domination
and Cuddalore district has Hindu religion domination and majority of the respondents
reported of no religious conversion in the study area.
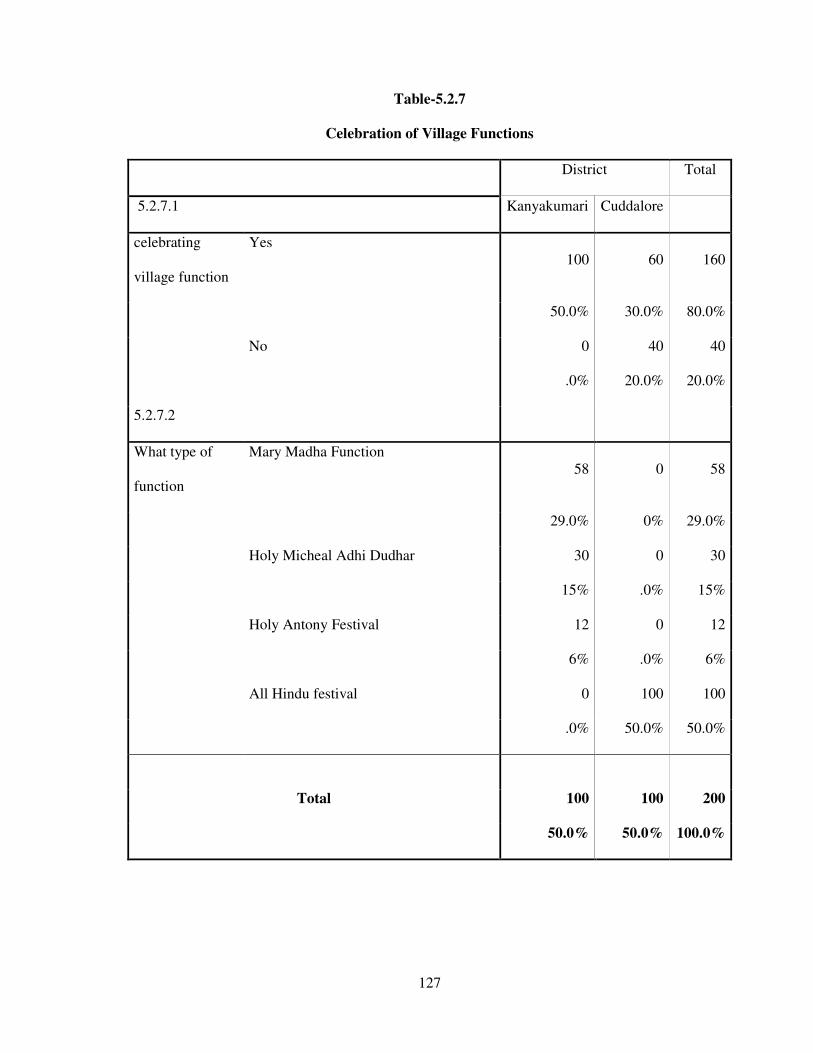
127
Table-5.2.7
Celebration of Village Functions
District Total
5.2.7.1 Kanyakumari Cuddalore
celebrating
village function
Yes 100 60 160
50.0% 30.0% 80.0%
No 0 40 40
.0% 20.0% 20.0%
5.2.7.2
What type of
function
Mary Madha Function 58 0 58
29.0% 0% 29.0%
Holy Micheal Adhi Dudhar 30 0 30
15% .0% 15%
Holy Antony Festival 12 0 12
6% .0% 6%
All Hindu festival 0 100 100
.0% 50.0% 50.0%
Total 100 100 200
50.0% 50.0% 100.0%
128
5.2.7 reveals the celebration of function by the respondent village and their
types in the study districts
5.2.7.1 reveals that the majority of (80%) the respondents celebrate village
functions. In district wise comparison in Kanyakumari district the people are (100%)
celebrating village functions and then the in Cuddalore district (60%).
5.2.7.2 shows that the majority (100%) of the respondents celebrate all the
Hindu festivals in Cuddalore districts. In Kanyakumari district also (100%)
respondents celebrate all Christian function namely Mary Matha function, Holy
MichealAdhiDudhar, Holy Antony festival and all the respondents (100%) celebrate
to the festivals in the district of Kanyakumari
It is concluded that majority of the people are celebrate village functions and
all the people celebrate the Christian and Hindu functions in the study districts and all
the respondents are celebrating all the functions.
129
Table-5.2.8
Village Meeting and Social Organization
District Total
5.2.8.1 Kanyakumari Cuddalore
Engagement in village meeting Yes 5 8 13
2.5% 4.0% 6.5%
No 95 92 187
47.5% 46.0% 92.5%
5.2.8.2
Social organization working in your
village
Yes 61 67 128
30.5% 33.5% 64.0%
No 39 33 72
19.5% 16.5% 36.0%
Total 100 100 200
50.0% 50.0% 100.0%
5.2.8 detail that village meeting and social organization working in the study
area.
5.2.8.1 reveals that the majority of (93%) respondents do not involve
themselves in any village meeting in their area
5.2.8.2 shows that the majority of (64%) respondents know of the social
organization working in their village. In a district wise comparison Cuddalore district
has more number (67%) of social organization working than Kanyakumari district
(61%).
It is concluded that, none of the respondents are engaged in any village
meeting and majority of the respondents are involved in social organization working
in their village.

130
Table- 5.2.9
Role of SHG
District Total
5.2.9.1 Kanyakumari Cuddalore
SHG in your village Yes 78 70 148
39.0% 35.0% 74.0%
No 22 30 52
11.0% 15.0% 26.0%
5.2.9.2
Role of SHG For Women
Development and self
employment
65 69 134
32.5% 34.5% 67.0%
Loan Facilities 13 1 14
6.5% .5% 7.0%
No 22 30 52
11.0% 15.0% 26.0%
Total 100 100 200
50.0% 50.0% 100.0%
Table 5.2.9 reveals the function of SHG’s and their role.
5.2.9. shows that the majority (74%) of the respondents reported that SHG’s
are working in their village.
5.2.9.2 reveals that the majority of (67%) respondents say that it helps
women’s development and create self employment for women. In district wise
comparison in Cuddalore district a number of (69%) respondents mentioned that it is
for women’s development as well as to create self employment than Kanyakumari
district (65%).
Therefore it is concluded that a significant majority of the respondents say that
SHGs work effectively in the study districts. The majority of the respondents are
aware that SHG work for women development and create self employment.

131
Table- 5.2.10
Role of Village Youth Club
District Total
5.2.10.1 Kanyakumari Cuddalore
Youth club in
village
Yes 67 48 115
34.0% 24.0% 58.0%
No 33 52 85
16.5% 26.0% 42.5%
5.2.10.2
Role of youth
club &
Organization
Some Voluntary Work In
Festival Time 30 22 52
15.0% 11.0% 26.%
Help the People In Difficult
Condition 20 12 32
10.0% 22.0% 16.0%
Group Work For Village
Development 17 14 31
8.5% 12.0% 15.5%
Total 100 100 200
50.0% 50.0% 100.0%

132
Table 5.2.10 reveals the arrangement of village youth club and its role for the
respondents in the study district.
Table 5.2.10.1 indicates that (58%) of respondent know youth club is working
in the study district. In district wise comparison Kanyakumari district has got more
(67) number and reported that youth club is available in Kanyakumari district than
Cuddalore district (48)
Table 5.2.10.2 reveals that (26%) of respondent are aware that youth club does
voluntary work during festival time. In district wise comparison Kanyakumari district
has got more (30) number of respondents and reported that they help people in
difficult condition than Kanyakumari district (22)
Therefore it is concluded that majority of the respondents are aware that the
youth clubs and working in the village. And more number feel that youth clubs do
some voluntary work during festival time
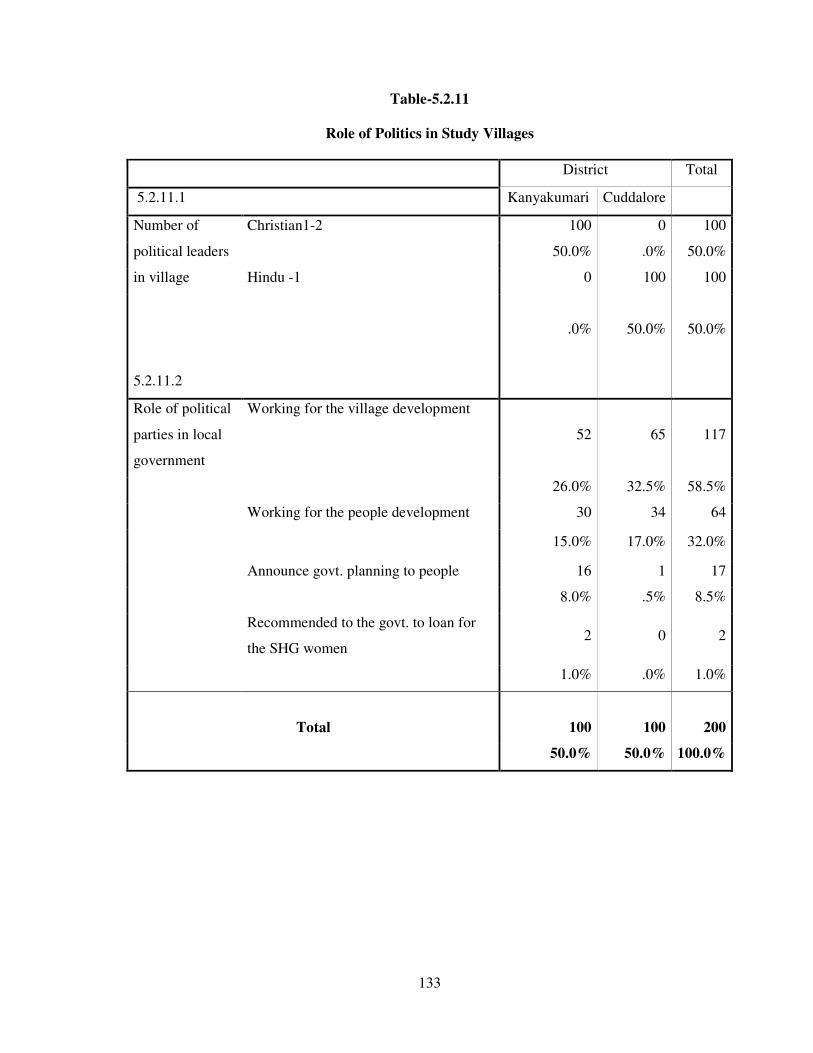
133
Table-5.2.11
Role of Politics in Study Villages
District Total
5.2.11.1 Kanyakumari Cuddalore
Number of
political leaders
in village
Christian1-2 100 0 100
50.0% .0% 50.0%
Hindu -1 0 100 100
.0% 50.0% 50.0%
5.2.11.2
Role of political
parties in local
government
Working for the village development
52 65 117
26.0% 32.5% 58.5%
Working for the people development 30 34 64
15.0% 17.0% 32.0%
Announce govt. planning to people 16 1 17
8.0% .5% 8.5%
Recommended to the govt. to loan for
the SHG women 2 0 2
1.0% .0% 1.0%
Total 100 100 200
50.0% 50.0% 100.0%
134
Table 5.2.11 reveals role of politics in village life in study area.
Table 5.2.11.1 shows that while more than one Christian leader in
Kanyakumari district participates in politics, only one found among Hindus in
Cuddalore district.
Table 5.2.11.2 indicates that the majority (59%) of respondents say that they
are working for village development. In district wise comparison in Cuddalore district
more number (65) of respondents feel the political party working for village
development than Kanyakumari district (52).
The entire respondents are aware that two Christian leaders and one Hindu
leader in district of Kanyakumari and Cuddalore respectively are involved in polities
Majority of the respondents feel that they are working for village development.

135
Table-5.2.12
Popular Political Party & the Relationship of Caste-Class
District Total
5.2.12.1 Kanyakumari Cuddalore
Popular political party in the area DMK 50 62 112
25.0% 31.0% 56.0%
AIADMK 46 38 84
23.0% 19.0% 42.0%
DMDK 4 0 4
2.0% .0% 2.0%
The relationship of caste-class Good 61 55 116
5.2.12.2 30.5% 27.5% 58.0%
Normal 37 45 82
18.5% 22.5% 41.0%
Bad 2 0 2
1.0% .0% 1.0%
Total 100 100 200
50.0% 50.0% 100.0%

136
Table 5.2.12 details the popular political parties and caste-class relationship in
the study districts.
5.2.12.1 indicates the political party wise distribution of the respondents. The
majority of (56%) respondents belong to DMK. Cuddalore district itself 62 belong to
DMK followed by 42% of the total respondents belong in to the AIADMK party. In
district-wise comparison more respondents belong to DMK, followed by AIADMK,
and DMDK in both districts.
5.2.12.2 shows that nearly three-fifth (58%) of the total respondents reported
that the caste-class relationship is good. In district-wise comparison in Kanyakumari
district more number (61) reported that caste-class relationship is those in good than
those in Cuddalore district (55).
Therefore it is obvious that the majority of respondents belonged to DMK
party and majority of respondents reported that caste-class relationship was good.

137
Table-5.2.13
Number of Days Stay in Sea for Fishing
District Total
5.2.13 Kanyakumari Cuddalore
Stay in sea for fishing One day 75 9 84
37.5% 4.5% 42.0%
Two days 25 88 113
12.5% 44.0% 56.5%
Three days 0 3 3
.0% 1.5% 1.5%
Total 100 100 200
50.0% 50.0% 100.0%
Table 5.2.13 indicates the number of days used for fishing into the sea by the
respondents in the study districts.
5.2.13.1 reveals that the majority (56.5%) of the total respondents stay for two
days in the sea for fishing. In district-wise comparison Cuddalore district more
number (88) reported of staying in the sea for two days than Kanyakumari district
(25).
It is concluded that while the respondents of Kanyakumari district stay one
day in sea for fishing, two days are spent by Cuddalore district respondents for
fishing.
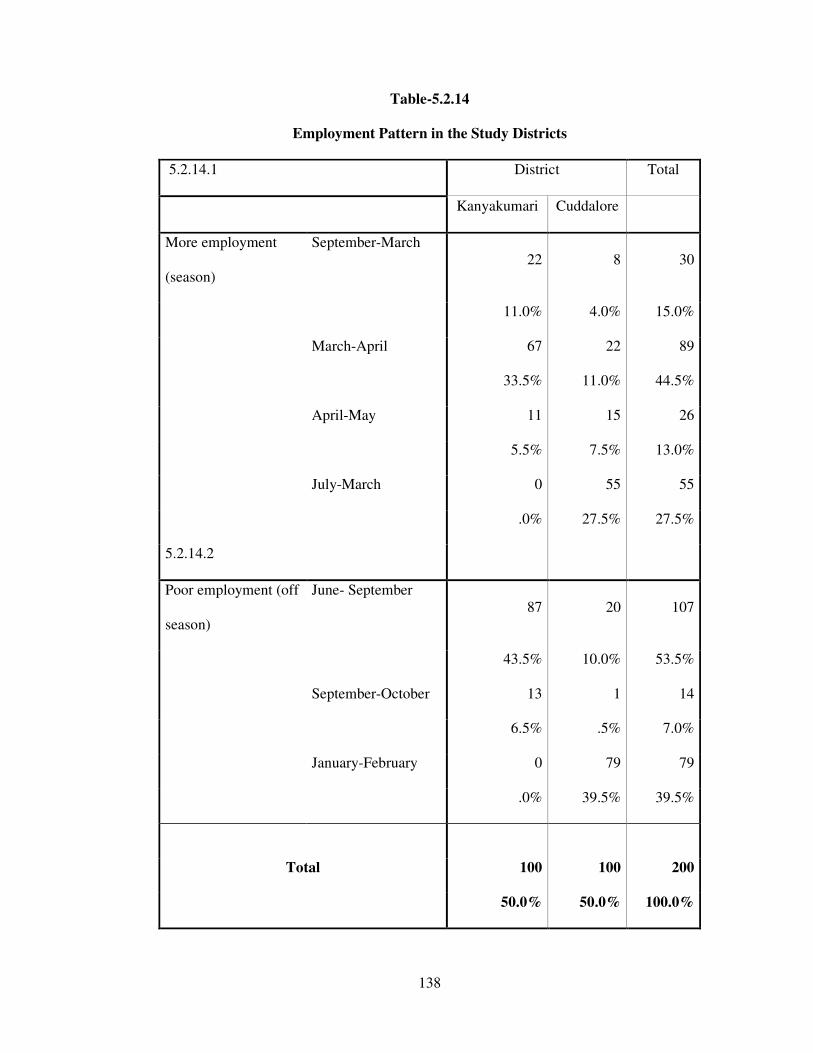
138
Table-5.2.14
Employment Pattern in the Study Districts
5.2.14.1 District Total
Kanyakumari Cuddalore
More employment
(season)
September-March 22 8 30
11.0% 4.0% 15.0%
March-April 67 22 89
33.5% 11.0% 44.5%
April-May 11 15 26
5.5% 7.5% 13.0%
July-March 0 55 55
.0% 27.5% 27.5%
5.2.14.2
Poor employment (off
season)
June- September 87 20 107
43.5% 10.0% 53.5%
September-October 13 1 14
6.5% .5% 7.0%
January-February 0 79 79
.0% 39.5% 39.5%
Total 100 100 200
50.0% 50.0% 100.0%
139
Table 5.2.14 reveals the employment pattern of the respondents in the study
districts.
5.2.14.1 shows that nearly half (44.5%) of the total respondents reported that
March to April offer more employment followed by 27.5% of respondents who
reported July to march.
5.2.14.2 indicates that more than a half (53.5%) of the respondents reported
June to September is the poor employment months. In district-wise comparison in
Kanyakumari district more (87) number say that June to September is the poor
employment months than those in Cuddalore district (77).
It is concluded that better employment opportunity prevails from March to
April to the respondents while June to September stands as off season for fishing in
the study districts.
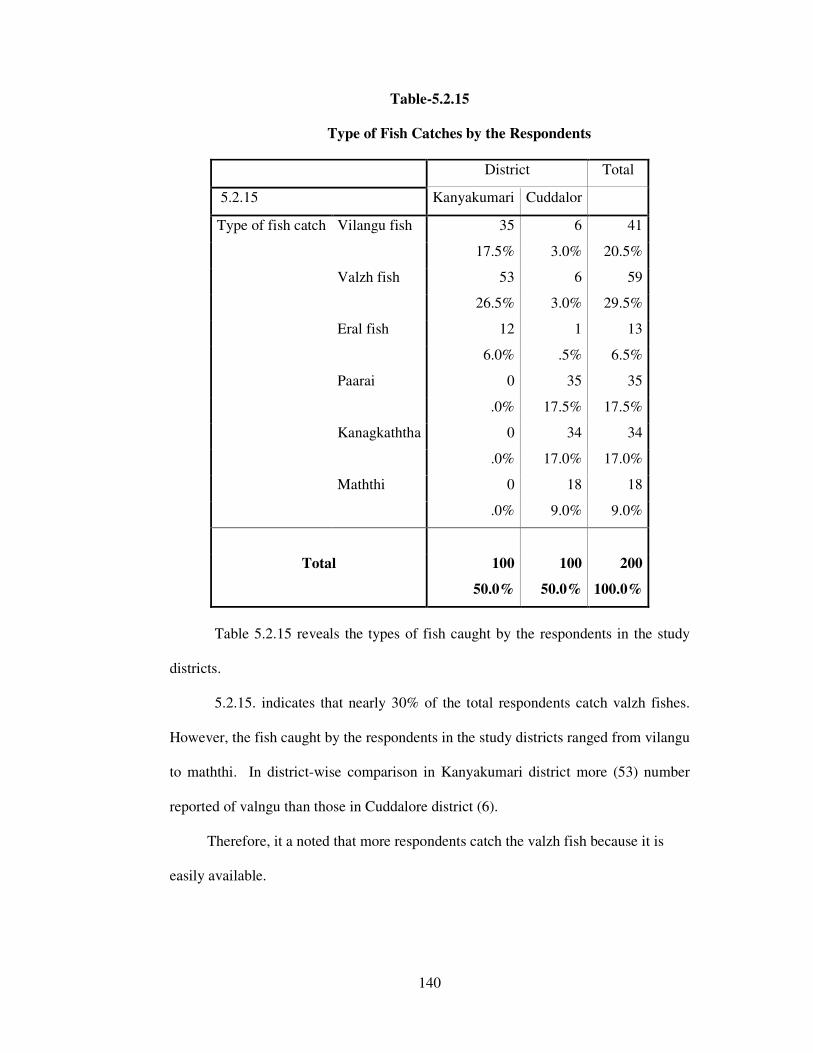
140
Table-5.2.15
Type of Fish Catches by the Respondents
District Total
5.2.15 Kanyakumari Cuddalor
Type of fish catch Vilangu fish 35 6 41
17.5% 3.0% 20.5%
Valzh fish 53 6 59
26.5% 3.0% 29.5%
Eral fish 12 1 13
6.0% .5% 6.5%
Paarai 0 35 35
.0% 17.5% 17.5%
Kanagkaththa 0 34 34
.0% 17.0% 17.0%
Maththi 0 18 18
.0% 9.0% 9.0%
Total 100 100 200
50.0% 50.0% 100.0%
Table 5.2.15 reveals the types of fish caught by the respondents in the study
districts.
5.2.15. indicates that nearly 30% of the total respondents catch valzh fishes.
However, the fish caught by the respondents in the study districts ranged from vilangu
to maththi. In district-wise comparison in Kanyakumari district more (53) number
reported of valngu than those in Cuddalore district (6).
Therefore, it a noted that more respondents catch the valzh fish because it is
easily available.
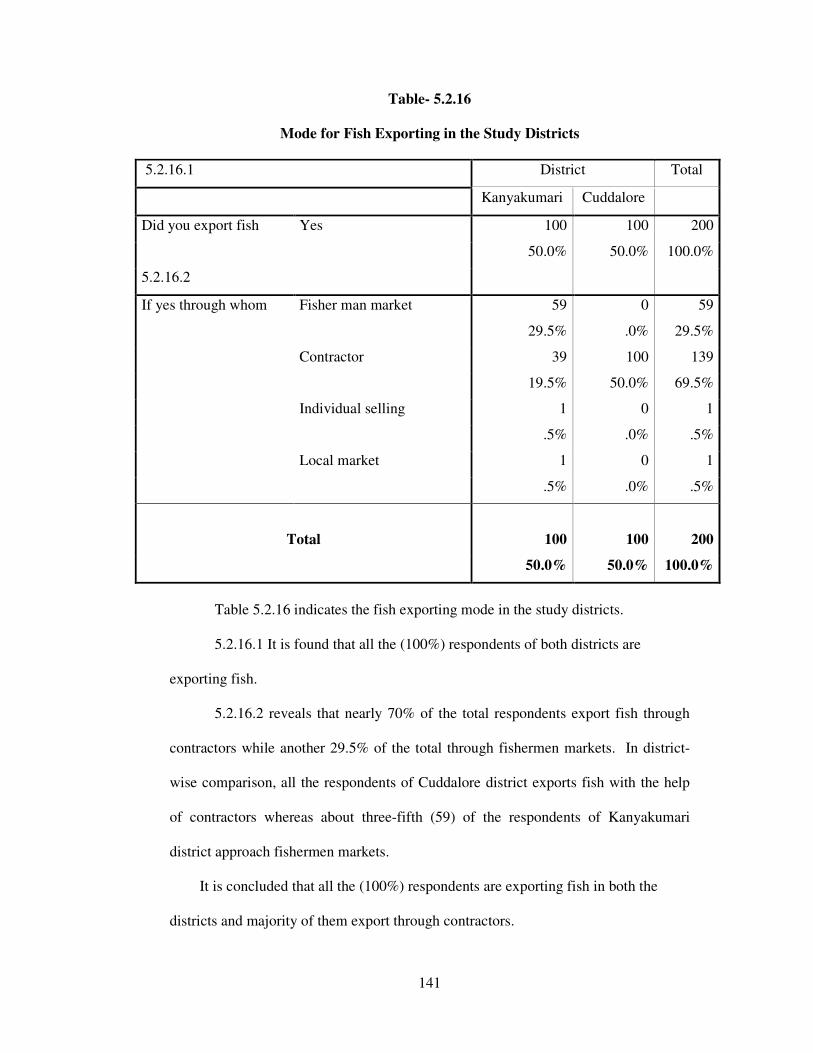
141
Table- 5.2.16
Mode for Fish Exporting in the Study Districts
5.2.16.1 District Total
Kanyakumari Cuddalore
Did you export fish Yes 100 100 200
50.0% 50.0% 100.0%
5.2.16.2
If yes through whom Fisher man market 59 0 59
29.5% .0% 29.5%
Contractor 39 100 139
19.5% 50.0% 69.5%
Individual selling 1 0 1
.5% .0% .5%
Local market 1 0 1
.5% .0% .5%
Total 100 100 200
50.0% 50.0% 100.0%
Table 5.2.16 indicates the fish exporting mode in the study districts.
5.2.16.1 It is found that all the (100%) respondents of both districts are
exporting fish.
5.2.16.2 reveals that nearly 70% of the total respondents export fish through
contractors while another 29.5% of the total through fishermen markets. In district-
wise comparison, all the respondents of Cuddalore district exports fish with the help
of contractors whereas about three-fifth (59) of the respondents of Kanyakumari
district approach fishermen markets.
It is concluded that all the (100%) respondents are exporting fish in both the
districts and majority of them export through contractors.
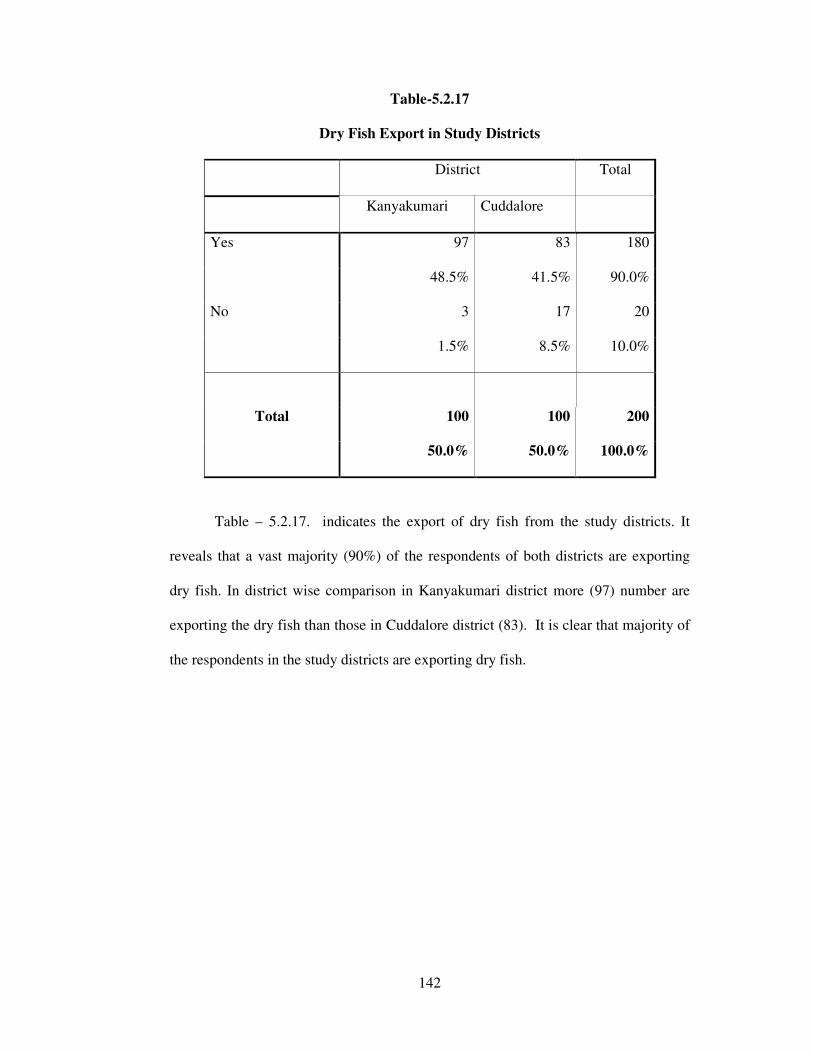
142
Table-5.2.17
Dry Fish Export in Study Districts
District Total
Kanyakumari Cuddalore
Yes 97 83 180
48.5% 41.5% 90.0%
No 3 17 20
1.5% 8.5% 10.0%
Total 100 100 200
50.0% 50.0% 100.0%
Table – 5.2.17. indicates the export of dry fish from the study districts. It
reveals that a vast majority (90%) of the respondents of both districts are exporting
dry fish. In district wise comparison in Kanyakumari district more (97) number are
exporting the dry fish than those in Cuddalore district (83). It is clear that majority of
the respondents in the study districts are exporting dry fish.
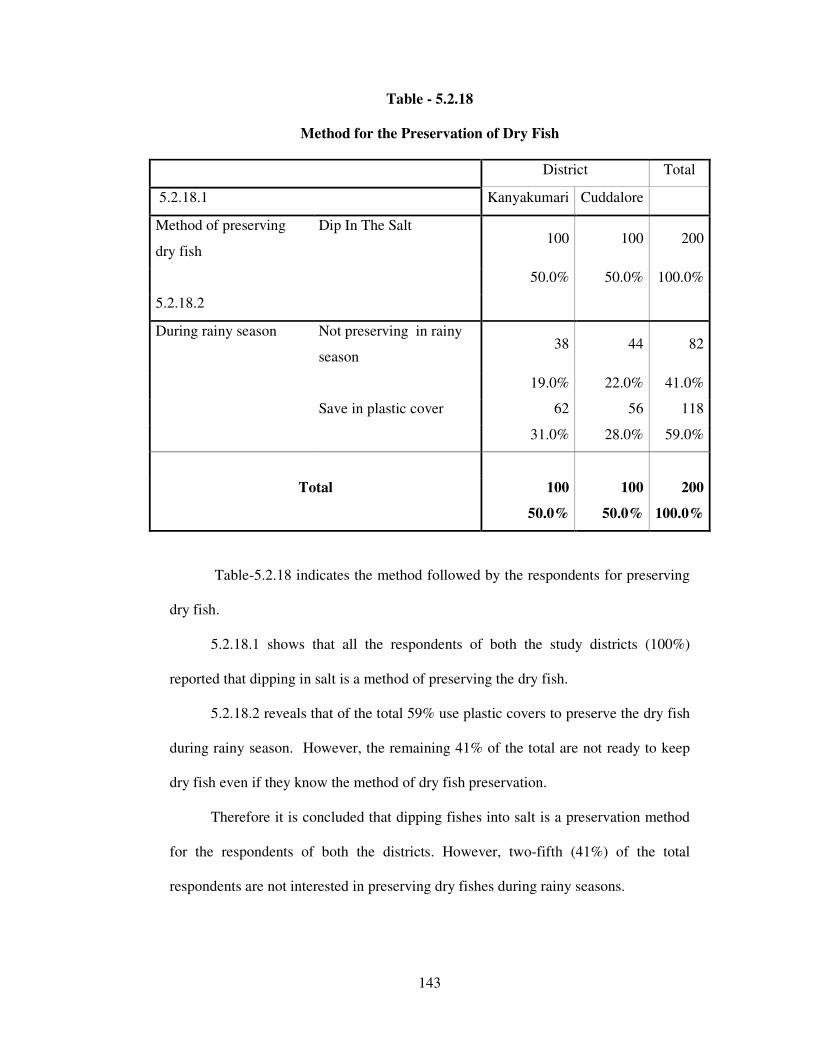
143
Table - 5.2.18
Method for the Preservation of Dry Fish
District Total
5.2.18.1 Kanyakumari Cuddalore
Method of preserving
dry fish
Dip In The Salt 100 100 200
50.0% 50.0% 100.0%
5.2.18.2
During rainy season Not preserving in rainy
season 38 44 82
19.0% 22.0% 41.0%
Save in plastic cover 62 56 118
31.0% 28.0% 59.0%
Total 100 100 200
50.0% 50.0% 100.0%
Table-5.2.18 indicates the method followed by the respondents for preserving
dry fish.
5.2.18.1 shows that all the respondents of both the study districts (100%)
reported that dipping in salt is a method of preserving the dry fish.
5.2.18.2 reveals that of the total 59% use plastic covers to preserve the dry fish
during rainy season. However, the remaining 41% of the total are not ready to keep
dry fish even if they know the method of dry fish preservation.
Therefore it is concluded that dipping fishes into salt is a preservation method
for the respondents of both the districts. However, two-fifth (41%) of the total
respondents are not interested in preserving dry fishes during rainy seasons.
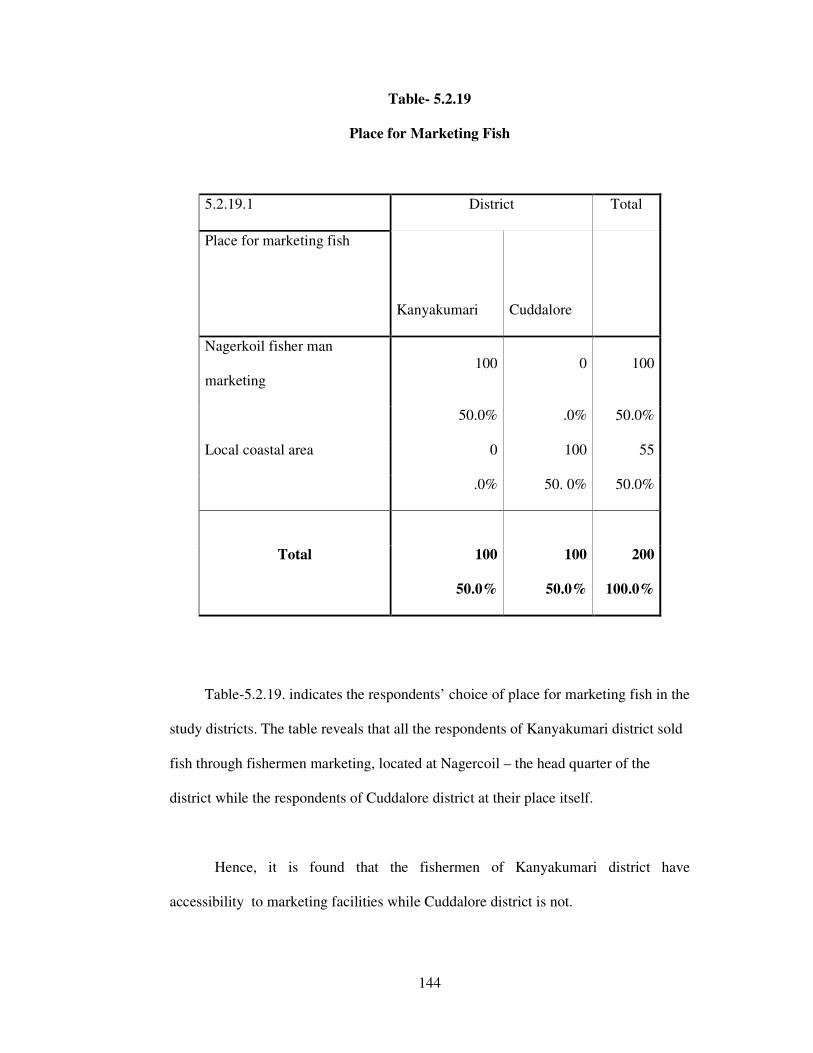
144
Table- 5.2.19
Place for Marketing Fish
5.2.19.1 District Total
Place for marketing fish
Kanyakumari Cuddalore
Nagerkoil fisher man
marketing 100 0 100
50.0% .0% 50.0%
Local coastal area 0 100 55
.0% 50. 0% 50.0%
Total 100 100 200
50.0% 50.0% 100.0%
Table-5.2.19. indicates the respondents’ choice of place for marketing fish in the
study districts. The table reveals that all the respondents of Kanyakumari district sold
fish through fishermen marketing, located at Nagercoil – the head quarter of the
district while the respondents of Cuddalore district at their place itself.
Hence, it is found that the fishermen of Kanyakumari district have
accessibility to marketing facilities while Cuddalore district is not.
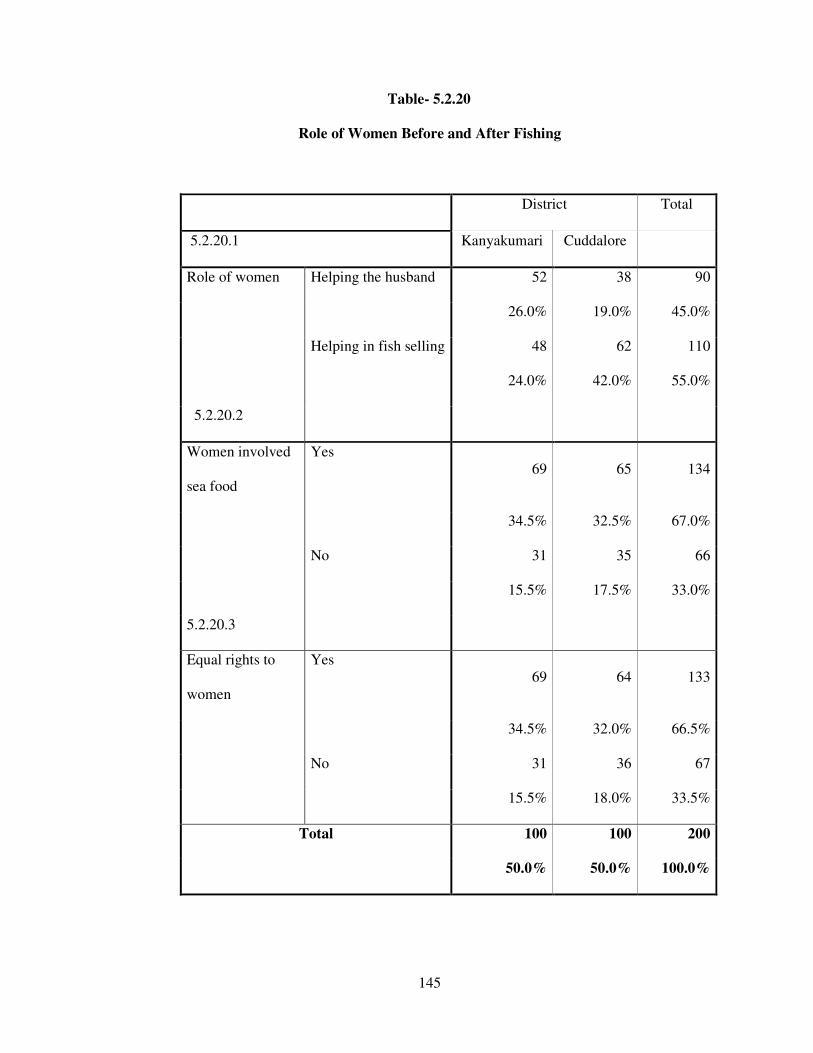
145
Table- 5.2.20
Role of Women Before and After Fishing
District Total
5.2.20.1 Kanyakumari Cuddalore
Role of women Helping the husband 52 38 90
26.0% 19.0% 45.0%
Helping in fish selling 48 62 110
24.0% 42.0% 55.0%
5.2.20.2
Women involved
sea food
Yes 69 65 134
34.5% 32.5% 67.0%
No 31 35 66
15.5% 17.5% 33.0%
5.2.20.3
Equal rights to
women
Yes 69 64 133
34.5% 32.0% 66.5%
No 31 36 67
15.5% 18.0% 33.5%
Total 100 100 200
50.0% 50.0% 100.0%
146
Table 5.2.20 shows the role of women before and after fishing respondent.
5.2.20.1 indicates that more than half (55%) of the total respondents availed
of women for helping in fish selling while the remaining (45%) help their husband in
preparation for fishing. In district-wise comparison in Cuddalore district more (62)
respondents are reported that women are helpful in selling the fish than there in
Kanyakumari district (48).
5.2.20.2 indicates that the majority (67%) of the total respondents reported that
their women involve themselves in preparation of the sea food. In district wise
comparison in Kanyakumari district more (69) number say that women are involved
in the preparation of sea food than those Cuddalore district (65).
5.2.20.3 Reveals that the majority (66.5%) of the respondent give equal right to
women even though the coastal community is uneducated.
It is concluded that the majority of the women help in fish selling and are
involved in the preparation of sea food and majority of the total respondents treat
women equally on par with men.

147
5.3 CIRCUMSTANCES LEADING TO OCCURRENCE OF VARIOUS TYPES
OF NATURAL DISASTERS
Table- 5.3.1
Celebration of Coastal Festival
District Total
5.3.1.1 Kanyakumari Cuddalore
Celebration of coastal festival Yes 71 69 140
35.5% 34.5% 70.0%
No 29 31 60
14.5% 15.5% 30.0%
5.3.1.2
Participation of non coastal people Yes 66 45 111
33.0% 22.5% 55.5%
No 34 55 89
17.0% 27.5% 44.5%
Total 100 100 200
50.0% 50.0% 100.0%
Table 5.3.1 reveals the respondents’ celebration of coastal festivals in the
study districts.
5.3.1.1 indicates that nearly three-fourths (70%) of the total respondents
celebrate coastal festivals while the remaining 30% do not. In district-wise
comparison in Kanyakumari district more number (71) celebrates coastal festivals
than in Cuddalore district (69).
5.3.1.2 indicates that more than half of the total (55.5%) respondents ensure
the participation of non-coastal people in their coastal and related festivals. However,
the remaining proportion (44.5%) maintains themselves as closed group. In district-
wise comparison the participation of non-coastal people found to be more in
Kanyakumari district than in Cuddalore district.
Therefore, it is concluded that majority of respondents of both districts
celebrate coastal festivals and majority of them reported that such festivals are
attended by non-coastal people.
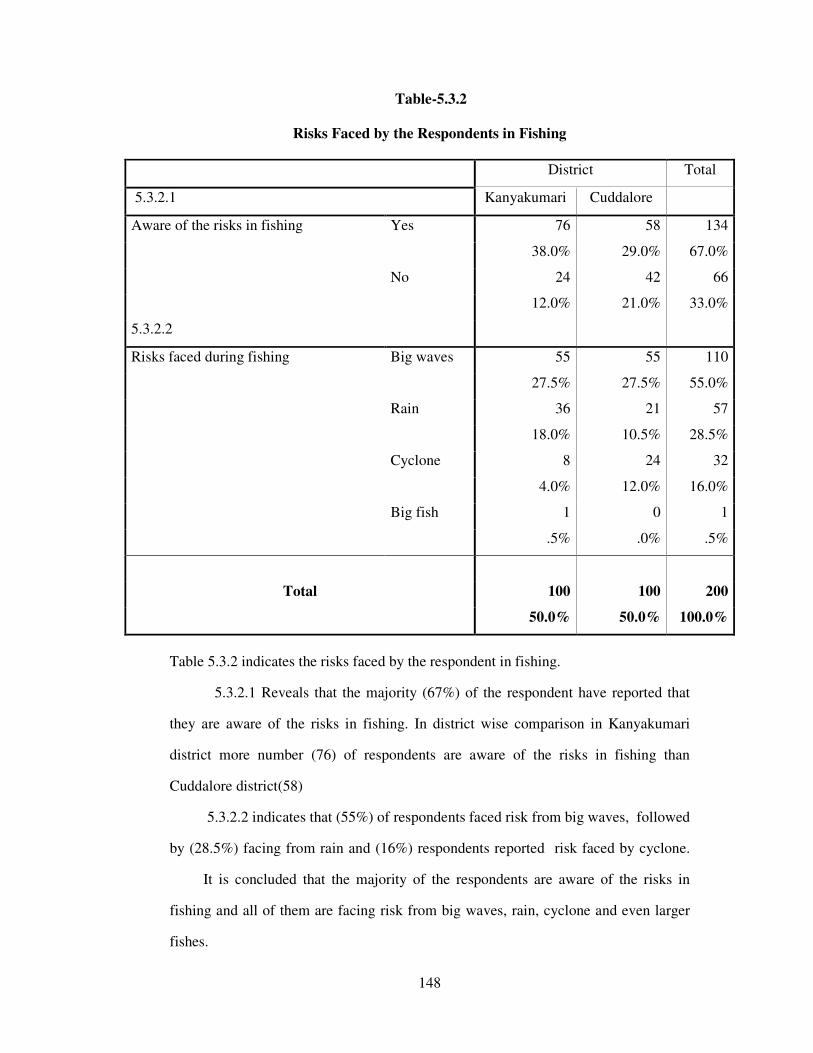
148
Table-5.3.2
Risks Faced by the Respondents in Fishing
District Total
5.3.2.1 Kanyakumari Cuddalore
Aware of the risks in fishing Yes 76 58 134
38.0% 29.0% 67.0%
No 24 42 66
12.0% 21.0% 33.0%
5.3.2.2
Risks faced during fishing Big waves 55 55 110
27.5% 27.5% 55.0%
Rain 36 21 57
18.0% 10.5% 28.5%
Cyclone 8 24 32
4.0% 12.0% 16.0%
Big fish 1 0 1
.5% .0% .5%
Total 100 100 200
50.0% 50.0% 100.0%
Table 5.3.2 indicates the risks faced by the respondent in fishing.
5.3.2.1 Reveals that the majority (67%) of the respondent have reported that
they are aware of the risks in fishing. In district wise comparison in Kanyakumari
district more number (76) of respondents are aware of the risks in fishing than
Cuddalore district(58)
5.3.2.2 indicates that (55%) of respondents faced risk from big waves, followed
by (28.5%) facing from rain and (16%) respondents reported risk faced by cyclone.
It is concluded that the majority of the respondents are aware of the risks in
fishing and all of them are facing risk from big waves, rain, cyclone and even larger
fishes.
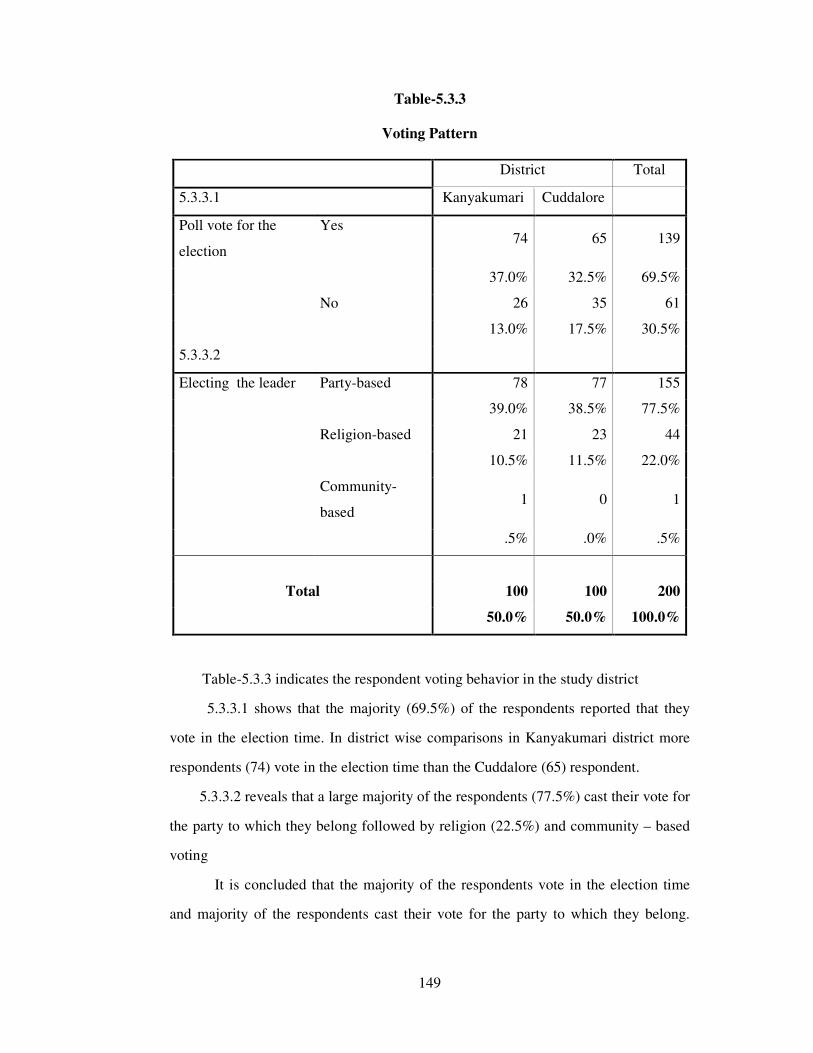
149
Table-5.3.3
Voting Pattern
District Total
5.3.3.1 Kanyakumari Cuddalore
Poll vote for the
election
Yes 74 65 139
37.0% 32.5% 69.5%
No 26 35 61
13.0% 17.5% 30.5%
5.3.3.2
Electing the leader Party-based 78 77 155
39.0% 38.5% 77.5%
Religion-based 21 23 44
10.5% 11.5% 22.0%
Community-
based 1 0 1
.5% .0% .5%
Total 100 100 200
50.0% 50.0% 100.0%
Table-5.3.3 indicates the respondent voting behavior in the study district
5.3.3.1 shows that the majority (69.5%) of the respondents reported that they
vote in the election time. In district wise comparisons in Kanyakumari district more
respondents (74) vote in the election time than the Cuddalore (65) respondent.
5.3.3.2 reveals that a large majority of the respondents (77.5%) cast their vote for
the party to which they belong followed by religion (22.5%) and community – based
voting
It is concluded that the majority of the respondents vote in the election time
and majority of the respondents cast their vote for the party to which they belong.

150
Table 5.3.4
Exclusion
District Total
5.3.4.1 Kanyakumari Cuddalore
Exclusion from community Yes 15 35 50
7.5% 17.5% 25.0%
No 85 65 150
42.5% 32.5% 75.0%
5.3.4.2
Exclusion from religion Yes 17 27 44
8.5% 13.5% 22.0%
No 83 73 156
41.5% 36.5% 78.0%
5.3.4.3
Exclusion from giving wages Yes 10 23 33
5.0% 11.5% 16.5%
No 90 77 167
45.0% 38.5% 83.5%
Total 100 100 200
50.0% 50.0% 100.0%
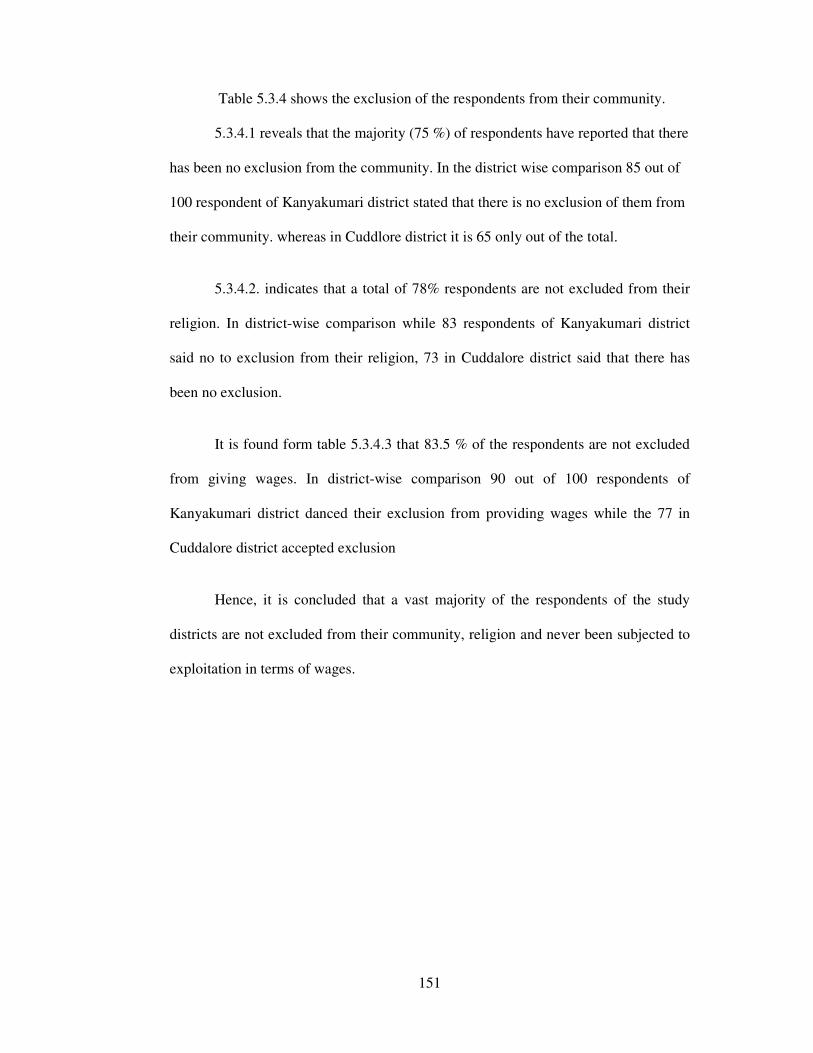
151
Table 5.3.4 shows the exclusion of the respondents from their community.
5.3.4.1 reveals that the majority (75 %) of respondents have reported that there
has been no exclusion from the community. In the district wise comparison 85 out of
100 respondent of Kanyakumari district stated that there is no exclusion of them from
their community. whereas in Cuddlore district it is 65 only out of the total.
5.3.4.2. indicates that a total of 78% respondents are not excluded from their
religion. In district-wise comparison while 83 respondents of Kanyakumari district
said no to exclusion from their religion, 73 in Cuddalore district said that there has
been no exclusion.
It is found form table 5.3.4.3 that 83.5 % of the respondents are not excluded
from giving wages. In district-wise comparison 90 out of 100 respondents of
Kanyakumari district danced their exclusion from providing wages while the 77 in
Cuddalore district accepted exclusion
Hence, it is concluded that a vast majority of the respondents of the study
districts are not excluded from their community, religion and never been subjected to
exploitation in terms of wages.
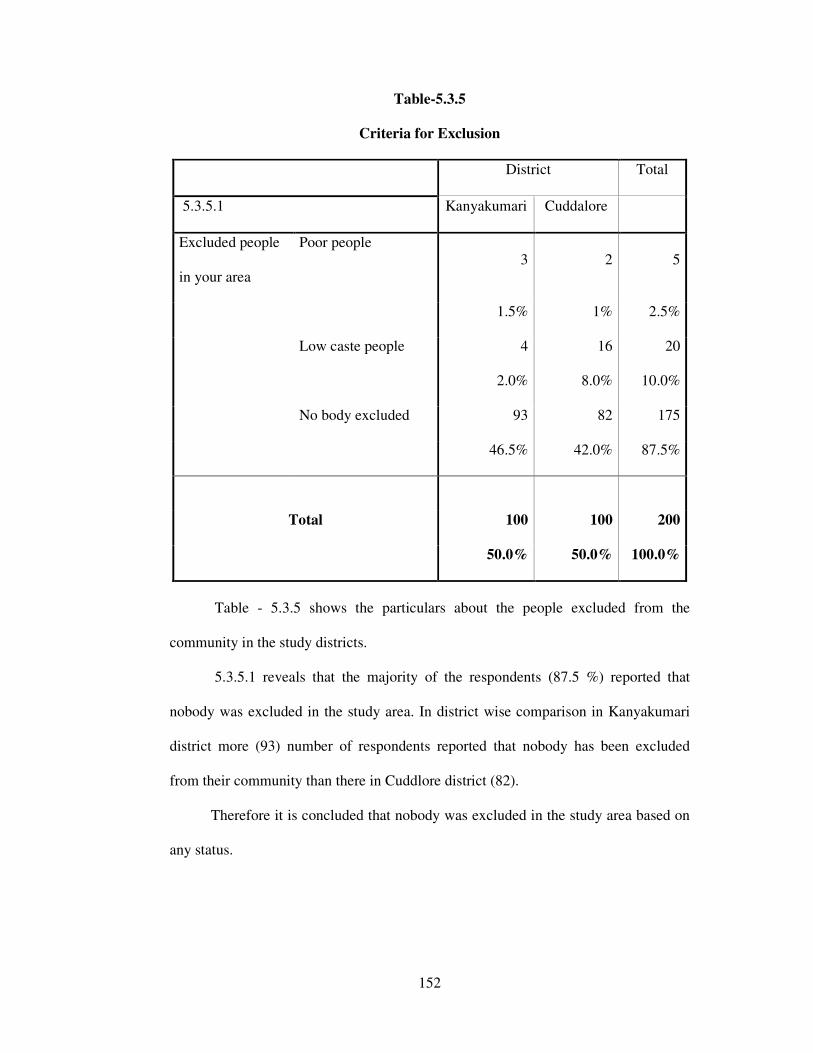
152
Table-5.3.5
Criteria for Exclusion
District Total
5.3.5.1 Kanyakumari Cuddalore
Excluded people
in your area
Poor people 3 2 5
1.5% 1% 2.5%
Low caste people 4 16 20
2.0% 8.0% 10.0%
No body excluded 93 82 175
46.5% 42.0% 87.5%
Total 100 100 200
50.0% 50.0% 100.0%
Table - 5.3.5 shows the particulars about the people excluded from the
community in the study districts.
5.3.5.1 reveals that the majority of the respondents (87.5 %) reported that
nobody was excluded in the study area. In district wise comparison in Kanyakumari
district more (93) number of respondents reported that nobody has been excluded
from their community than there in Cuddlore district (82).
Therefore it is concluded that nobody was excluded in the study area based on
any status.
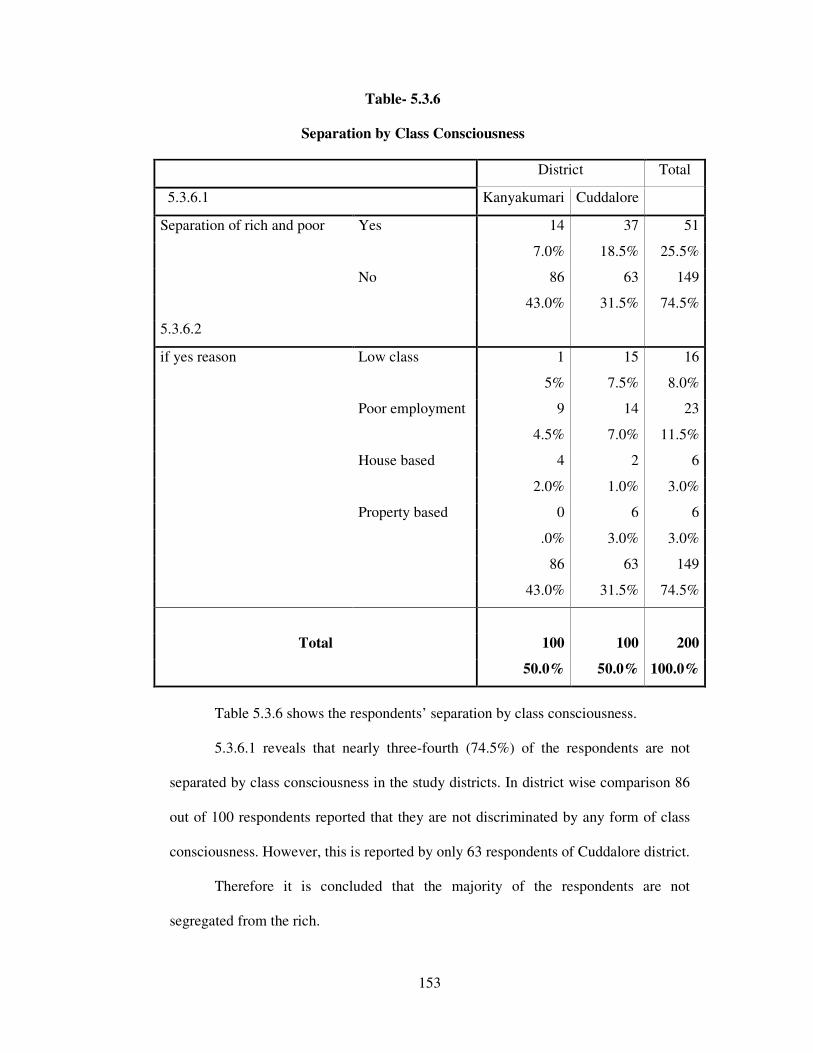
153
Table- 5.3.6
Separation by Class Consciousness
District Total
5.3.6.1 Kanyakumari Cuddalore
Separation of rich and poor Yes 14 37 51
7.0% 18.5% 25.5%
No 86 63 149
43.0% 31.5% 74.5%
5.3.6.2
if yes reason Low class 1 15 16
5% 7.5% 8.0%
Poor employment 9 14 23
4.5% 7.0% 11.5%
House based 4 2 6
2.0% 1.0% 3.0%
Property based 0 6 6
.0% 3.0% 3.0%
86 63 149
43.0% 31.5% 74.5%
Total 100 100 200
50.0% 50.0% 100.0%
Table 5.3.6 shows the respondents’ separation by class consciousness.
5.3.6.1 reveals that nearly three-fourth (74.5%) of the respondents are not
separated by class consciousness in the study districts. In district wise comparison 86
out of 100 respondents reported that they are not discriminated by any form of class
consciousness. However, this is reported by only 63 respondents of Cuddalore district.
Therefore it is concluded that the majority of the respondents are not
segregated from the rich.
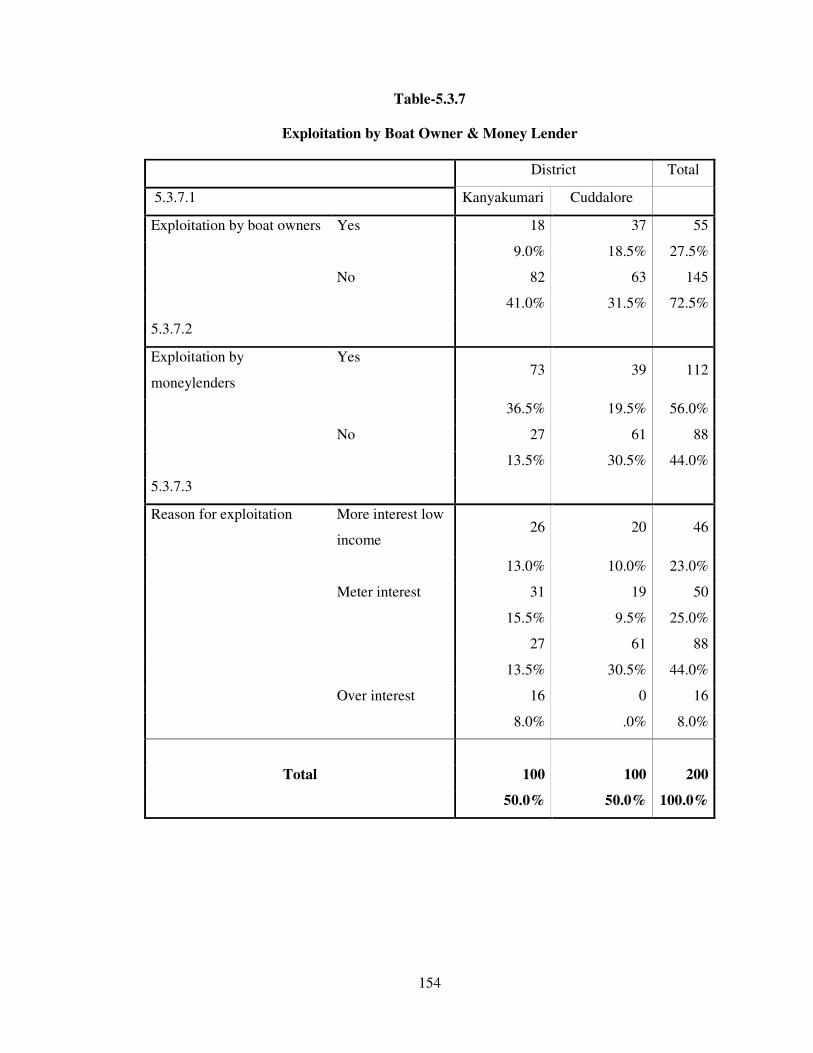
154
Table-5.3.7
Exploitation by Boat Owner & Money Lender
District Total
5.3.7.1 Kanyakumari Cuddalore
Exploitation by boat owners Yes 18 37 55
9.0% 18.5% 27.5%
No 82 63 145
41.0% 31.5% 72.5%
5.3.7.2
Exploitation by
moneylenders
Yes 73 39 112
36.5% 19.5% 56.0%
No 27 61 88
13.5% 30.5% 44.0%
5.3.7.3
Reason for exploitation More interest low
income 26 20 46
13.0% 10.0% 23.0%
Meter interest 31 19 50
15.5% 9.5% 25.0%
27 61 88
13.5% 30.5% 44.0%
Over interest 16 0 16
8.0% .0% 8.0%
Total 100 100 200
50.0% 50.0% 100.0%
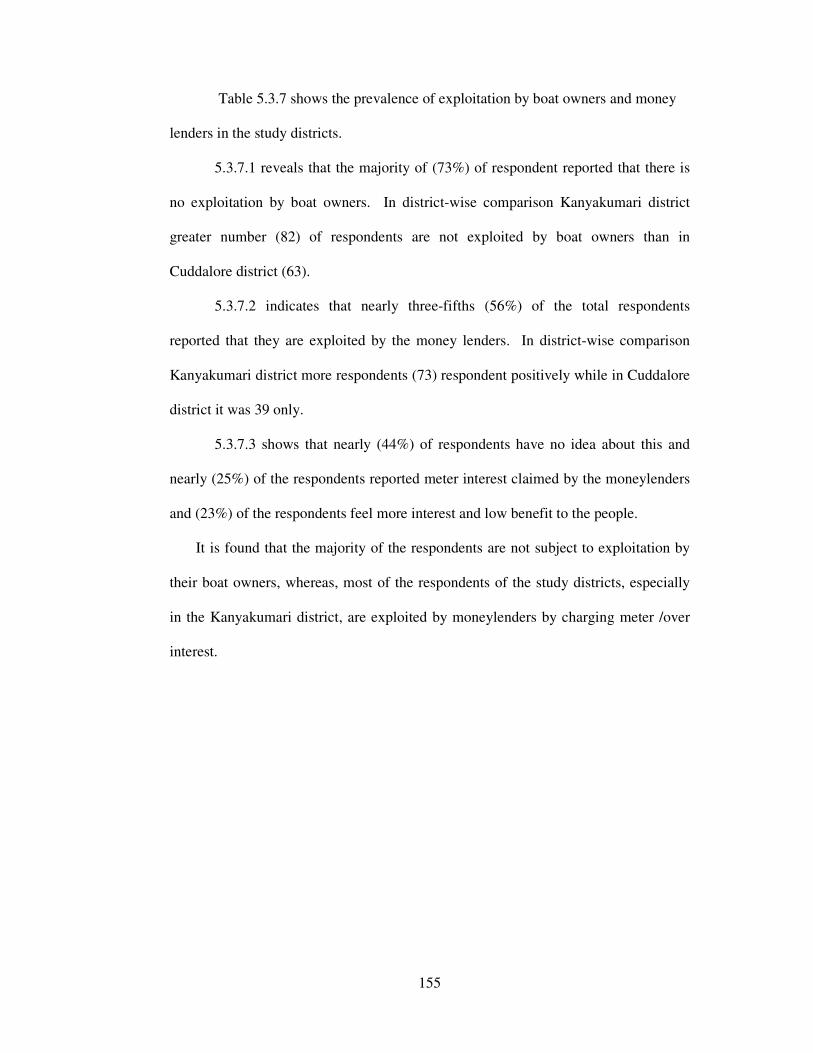
155
Table 5.3.7 shows the prevalence of exploitation by boat owners and money
lenders in the study districts.
5.3.7.1 reveals that the majority of (73%) of respondent reported that there is
no exploitation by boat owners. In district-wise comparison Kanyakumari district
greater number (82) of respondents are not exploited by boat owners than in
Cuddalore district (63).
5.3.7.2 indicates that nearly three-fifths (56%) of the total respondents
reported that they are exploited by the money lenders. In district-wise comparison
Kanyakumari district more respondents (73) respondent positively while in Cuddalore
district it was 39 only.
5.3.7.3 shows that nearly (44%) of respondents have no idea about this and
nearly (25%) of the respondents reported meter interest claimed by the moneylenders
and (23%) of the respondents feel more interest and low benefit to the people.
It is found that the majority of the respondents are not subject to exploitation by
their boat owners, whereas, most of the respondents of the study districts, especially
in the Kanyakumari district, are exploited by moneylenders by charging meter /over
interest.
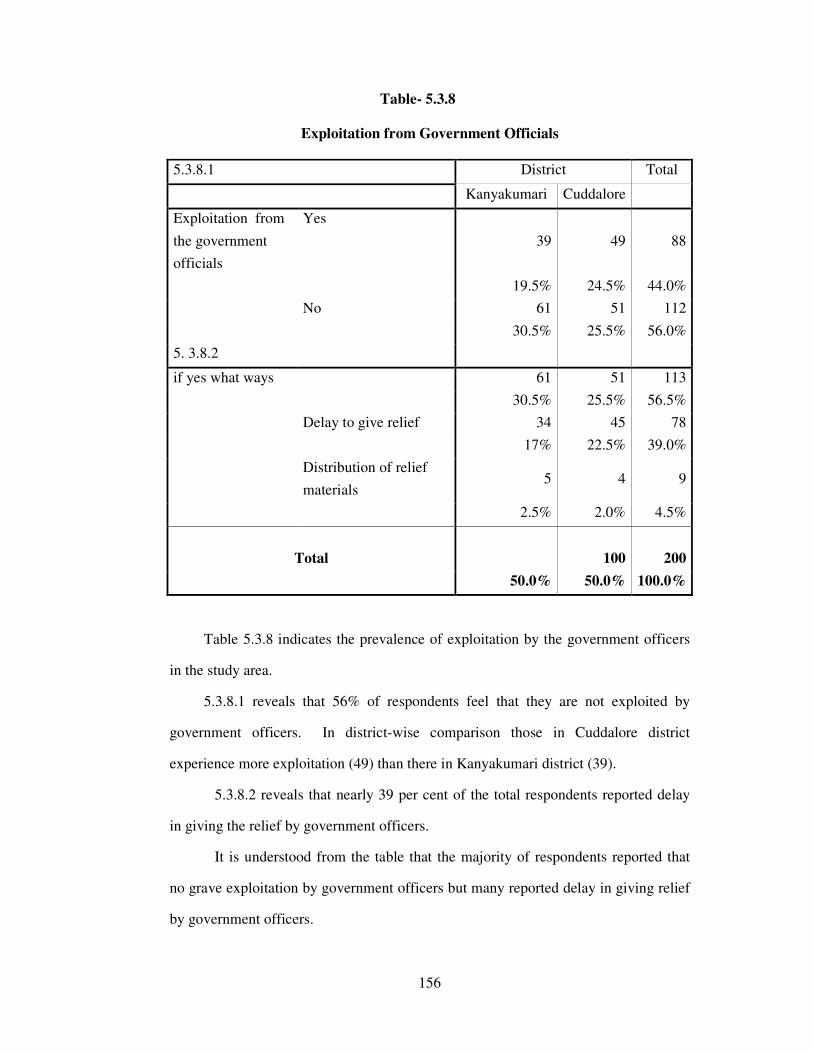
156
Table- 5.3.8
Exploitation from Government Officials
5.3.8.1 District Total
Kanyakumari Cuddalore
Exploitation from
the government
officials
Yes
39 49 88
19.5% 24.5% 44.0%
No 61 51 112
30.5% 25.5% 56.0%
5. 3.8.2
if yes what ways 61 51 113
30.5% 25.5% 56.5%
Delay to give relief 34 45 78
17% 22.5% 39.0%
Distribution of relief
materials 5 4 9
2.5% 2.0% 4.5%
Total 100 200
50.0% 50.0% 100.0%
Table 5.3.8 indicates the prevalence of exploitation by the government officers
in the study area.
5.3.8.1 reveals that 56% of respondents feel that they are not exploited by
government officers. In district-wise comparison those in Cuddalore district
experience more exploitation (49) than there in Kanyakumari district (39).
5.3.8.2 reveals that nearly 39 per cent of the total respondents reported delay
in giving the relief by government officers.
It is understood from the table that the majority of respondents reported that
no grave exploitation by government officers but many reported delay in giving relief
by government officers.
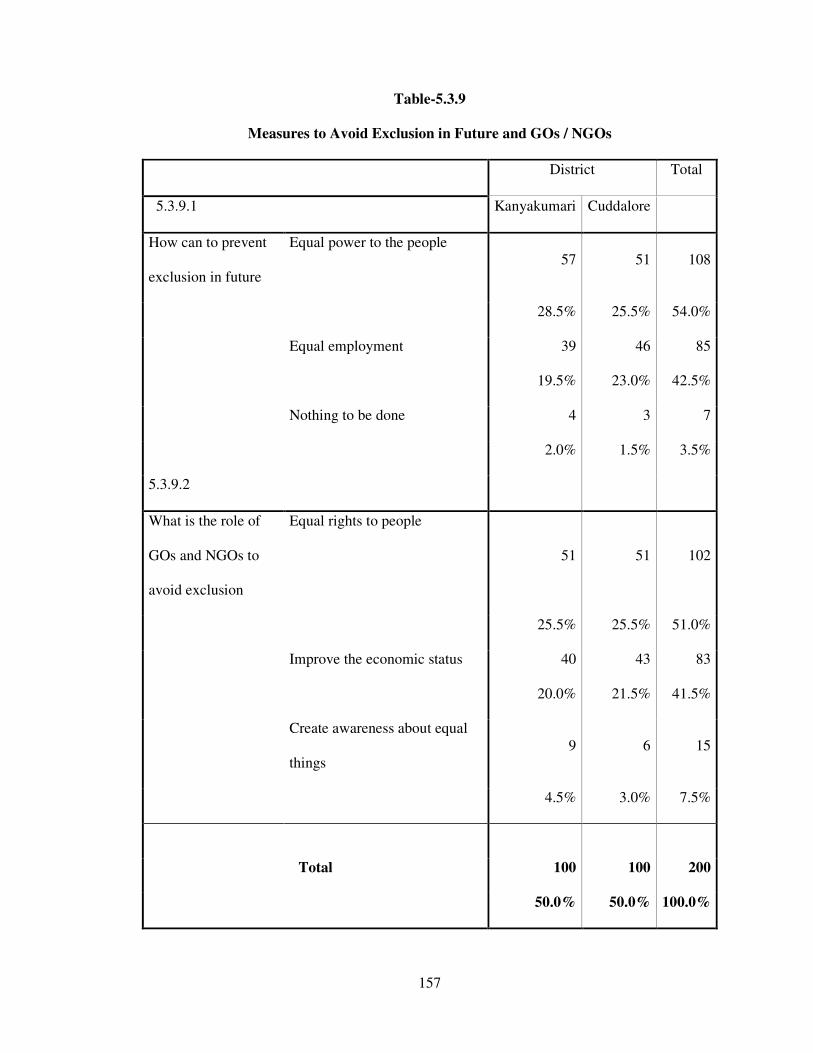
157
Table-5.3.9
Measures to Avoid Exclusion in Future and GOs / NGOs
District Total
5.3.9.1 Kanyakumari Cuddalore
How can to prevent
exclusion in future
Equal power to the people 57 51 108
28.5% 25.5% 54.0%
Equal employment 39 46 85
19.5% 23.0% 42.5%
Nothing to be done 4 3 7
2.0% 1.5% 3.5%
5.3.9.2
What is the role of
GOs and NGOs to
avoid exclusion
Equal rights to people
51 51 102
25.5% 25.5% 51.0%
Improve the economic status 40 43 83
20.0% 21.5% 41.5%
Create awareness about equal
things 9 6 15
4.5% 3.0% 7.5%
Total 100 100 200
50.0% 50.0% 100.0%
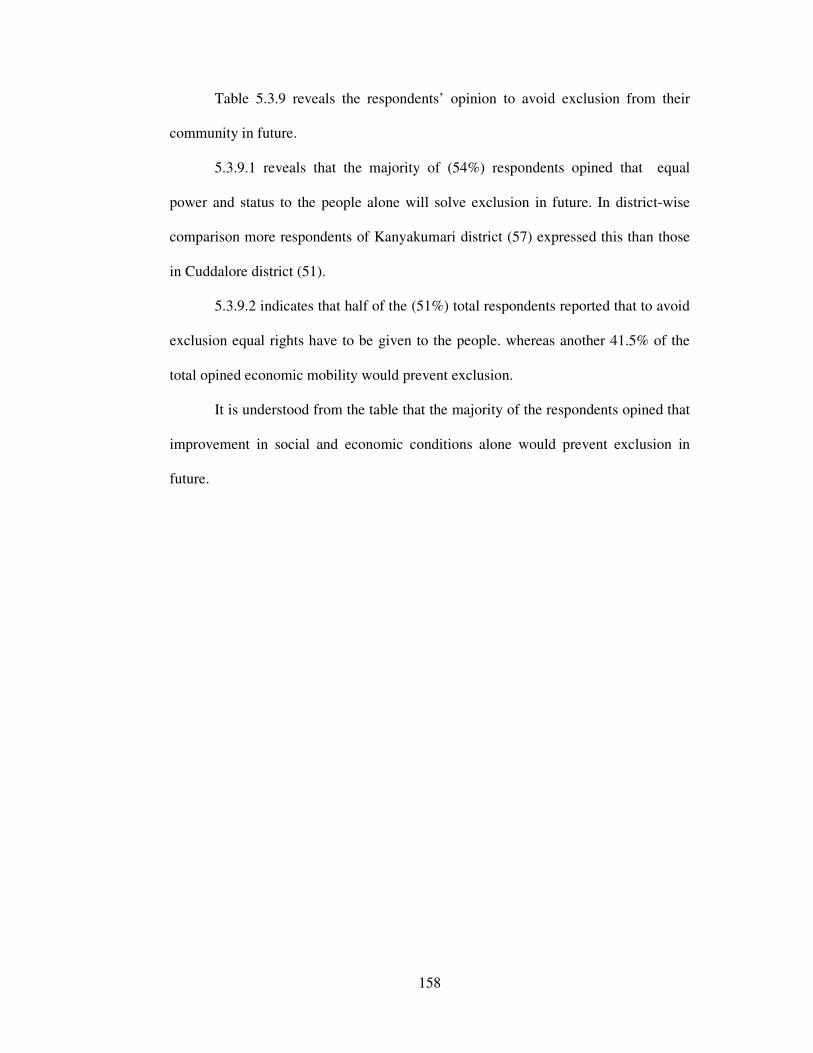
158
Table 5.3.9 reveals the respondents’ opinion to avoid exclusion from their
community in future.
5.3.9.1 reveals that the majority of (54%) respondents opined that equal
power and status to the people alone will solve exclusion in future. In district-wise
comparison more respondents of Kanyakumari district (57) expressed this than those
in Cuddalore district (51).
5.3.9.2 indicates that half of the (51%) total respondents reported that to avoid
exclusion equal rights have to be given to the people. whereas another 41.5% of the
total opined economic mobility would prevent exclusion.
It is understood from the table that the majority of the respondents opined that
improvement in social and economic conditions alone would prevent exclusion in
future.

159
Table-5.3.10
Respondents’ perception forwards distribution of Relief and rehabilitation
District Total
5.3.10.1 Kanyakumari Cuddalor
Improper
distribution of
relief material
Yes
73 60 133
36.5% 30.0% 66.5%
No 27 40 67
13.5% 20.0% 33.5%
5.3.10.2
if yes reason corruption from village leaders 35 29 64
17.5% 14.5% 32.0%
Benefits given only to village
Leaders relatives 38 31 69
19.0% 15.5% 34.5%
No 27 40 67
13.5% 20.0% 33.5%
Total 100 100 200
50.0% 50.0% 100.0%
Table 5.3.10. reveals the respondents’ perception towards the distribution of
relief materials and rehabilitation to them.
5.3.10.1 indicates that the majority of (66.5%) the respondents did not get the
relief materials properly. In a district-wise comparison in Kanyakumari district more
number (73) got relief material improperly than in Cuddalore district (60).
5.3.10.2 indicates that nearly 35% of the respondents reported the relief
materials only benefited relatives of the village leaders and nearly (32%) of
respondents reported some amount of corruption among village leaders.
Therefore, it is concluded that the majority of the respondents got relief
materials improperly while the remaining have no idea about the distribution of relief
and rehabilitation.
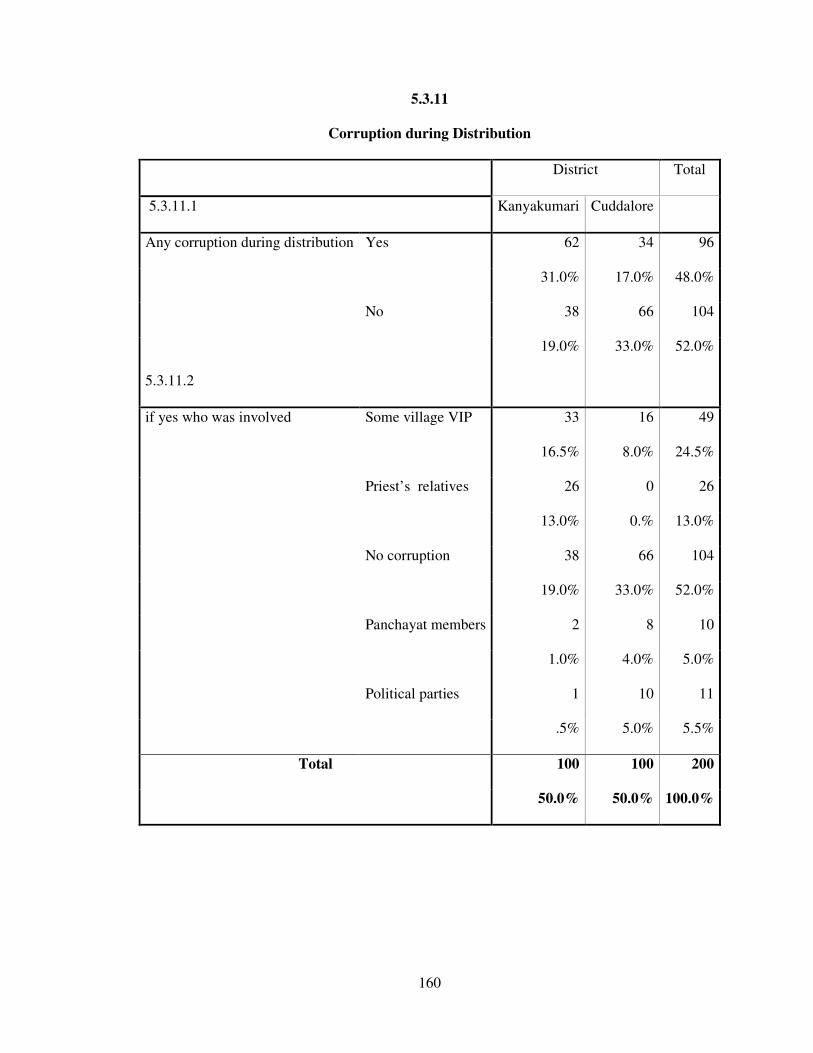
160
5.3.11
Corruption during Distribution
District Total
5.3.11.1 Kanyakumari Cuddalore
Any corruption during distribution Yes 62 34 96
31.0% 17.0% 48.0%
No 38 66 104
19.0% 33.0% 52.0%
5.3.11.2
if yes who was involved Some village VIP 33 16 49
16.5% 8.0% 24.5%
Priest’s relatives 26 0 26
13.0% 0.% 13.0%
No corruption 38 66 104
19.0% 33.0% 52.0%
Panchayat members 2 8 10
1.0% 4.0% 5.0%
Political parties 1 10 11
.5% 5.0% 5.5%
Total 100 100 200
50.0% 50.0% 100.0%

161
Table 5.3.11 shows the prevalence of corruption during distribution of the relief
materials to the respondents.
5.3.11.1 seveals that only 52% of the respondents reported that no corruption in
the distribution, while others (48%) said ‘yes’.
5.3.11.2 Indicates that majority (52%) of respondents expressed they had no
idea about who was involved in corruption. While the remaining (48%) reported that
corruption occurs due to involvement of village leaders (24.5%), relatives of priests
(13%), political members (5.5%) and panchayat members (5 %). In district-wise
comparison in Kanyakumari district more number (33) pointed a village leaders are
than Cuddalore district (16).
Therefore, it is concluded that that there was no corruption during the
distribution and majority of respondents had no idea about who were involved in
corruption. However, the interference of village leaders, and their relatives and
members of political parties and panchayat was a sore point in the study area.
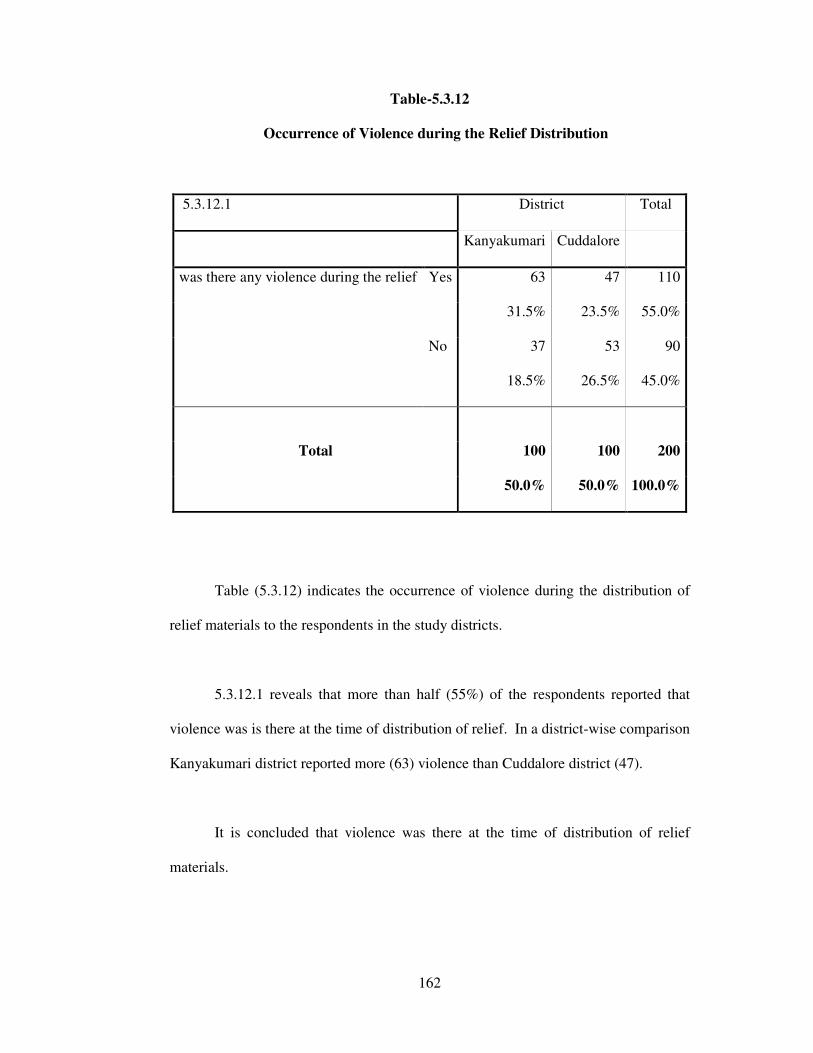
162
Table-5.3.12
Occurrence of Violence during the Relief Distribution
5.3.12.1 District Total
Kanyakumari Cuddalore
was there any violence during the relief Yes 63 47 110
31.5% 23.5% 55.0%
No 37 53 90
18.5% 26.5% 45.0%
Total 100 100 200
50.0% 50.0% 100.0%
Table (5.3.12) indicates the occurrence of violence during the distribution of
relief materials to the respondents in the study districts.
5.3.12.1 reveals that more than half (55%) of the respondents reported that
violence was is there at the time of distribution of relief. In a district-wise comparison
Kanyakumari district reported more (63) violence than Cuddalore district (47).
It is concluded that violence was there at the time of distribution of relief
materials.

163
Table-5.3.13
Distribution of House to Real Victims
District Total
5.3.13.1 Kanyakumari Cuddalor
genuine victims got the house Yes 72 62 134
36.0% 31.0% 67.0%
No 28 38 66
14.0% 19.0% 33.0%
5.3.13.2
if no what is the reason Got house telling lie 19 34 53
9.5% 17.0% 26.5%
non victims got benefits 9 4 13
4.5% 2.0% 6.5%
72 62 134
36.0% 31.0% 67.0%
Total 100 100 200
50.0% 50.0% 100.0%
Table 5.3.13 indicates distribution of house to genuine victims in the study
districts.
5.3.13.1 reveals that only two-third (67%) of the total respondents were
provided with the house in the study districts. In a district-wise comparison in
Kanyakumari district more number (72) got the house than Cuddalore district (62).
Therefore, it is concluded that the majority of the respondent-victims were
provided houses in the study districts.
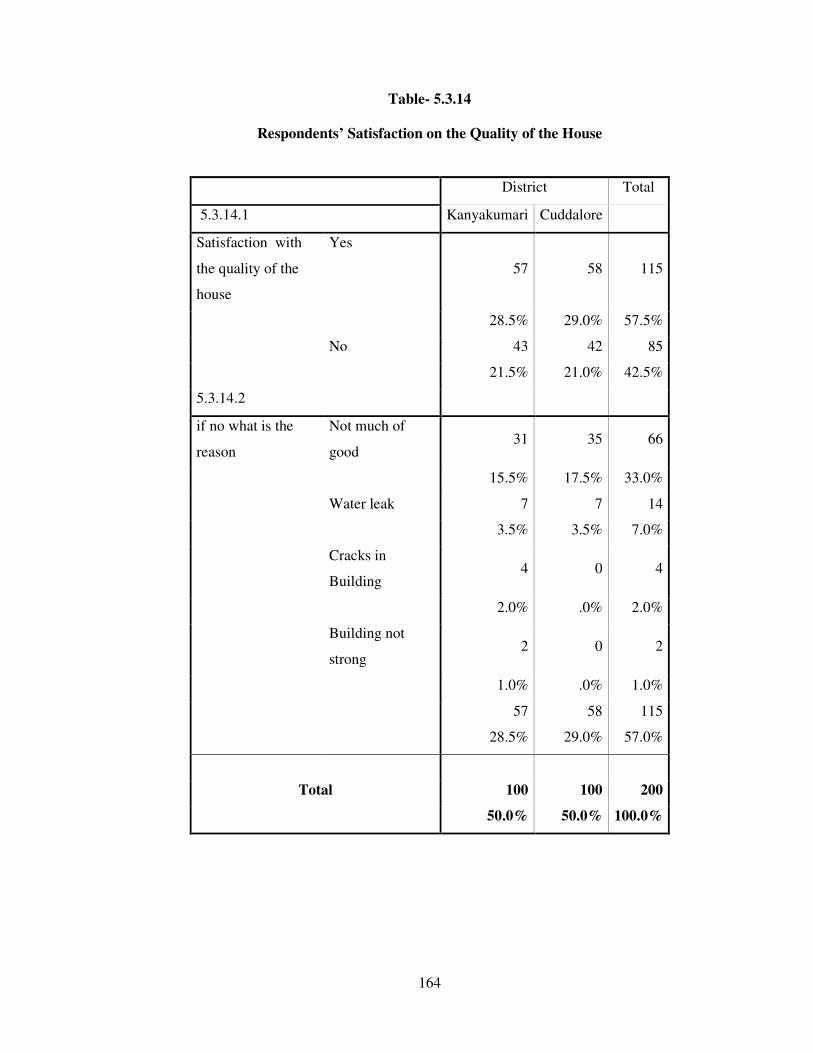
164
Table- 5.3.14
Respondents’ Satisfaction on the Quality of the House
District Total
5.3.14.1 Kanyakumari Cuddalore
Satisfaction with
the quality of the
house
Yes
57 58 115
28.5% 29.0% 57.5%
No 43 42 85
21.5% 21.0% 42.5%
5.3.14.2
if no what is the
reason
Not much of
good 31 35 66
15.5% 17.5% 33.0%
Water leak 7 7 14
3.5% 3.5% 7.0%
Cracks in
Building 4 0 4
2.0% .0% 2.0%
Building not
strong 2 0 2
1.0% .0% 1.0%
57 58 115
28.5% 29.0% 57.0%
Total 100 100 200
50.0% 50.0% 100.0%
165
Table 5.3.14 indicates the respondents’ perception towards the quality of the
house provided to them in the study districts.
5.3.14.1 shows the reason for the respondents’ dissatisfaction. Their houses are
not good (33%), leakage of water from the roof (7%), cracks in the walls (2%), and
were not strong (1%).
5.3.14.2 Indicates that the majority (57%) of the respondents reported that they
were satisfied with the quality of the house and nearly (33%) of the respondents were
not satisfied.
So it is understood from the table that about three-fifth of the total are satisfied
about the quality of the house while the remaining expressed their dissatisfaction and
reported various reasons for this.
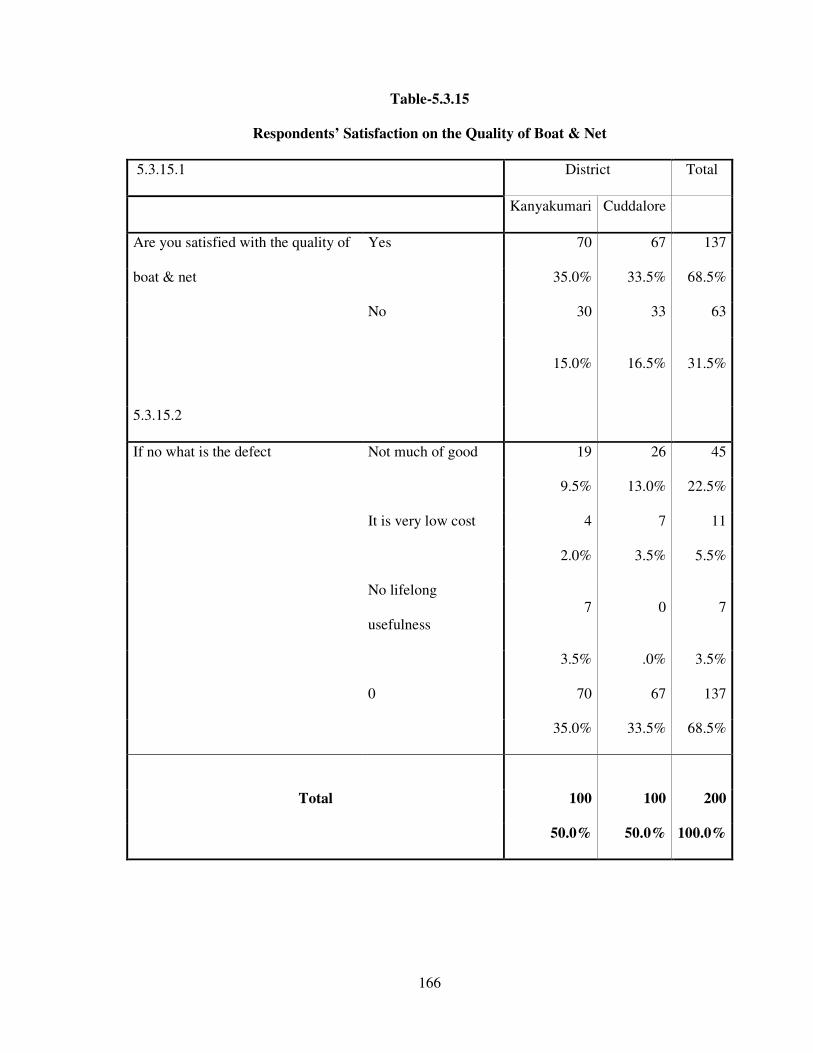
166
Table-5.3.15
Respondents’ Satisfaction on the Quality of Boat & Net
5.3.15.1 District Total
Kanyakumari Cuddalore
Are you satisfied with the quality of
boat & net
Yes 70 67 137
35.0% 33.5% 68.5%
No 30 33 63
15.0% 16.5% 31.5%
5.3.15.2
If no what is the defect Not much of good 19 26 45
9.5% 13.0% 22.5%
It is very low cost 4 7 11
2.0% 3.5% 5.5%
No lifelong
usefulness 7 0 7
3.5% .0% 3.5%
0 70 67 137
35.0% 33.5% 68.5%
Total 100 100 200
50.0% 50.0% 100.0%
167
Table 5.3.15 reveals the respondents’ perception towards the quality of the
Boat and Net.
5.3.15.1 indicates that about 69% of the total respondents were satisfied with
the quality of boats and nets because before tsunami the boat owned by them were not
good. After tsunami they have got good nets and boat with some facilities which
were not in use previously. In a district-wise comparison in Kanyakumari district
more (70) respondents reported their satisfaction towards boat and net than Cuddalore
district (67).
5.3.15.2 indicates that of the total respondents (63) expressed their
dissatisfaction (23%) and worries about the quality of the boat while another (6%) of
the total mentioned the low cost of the boat, and (4%) the remaining opined that it
was not usable.
Therefore, it is concluded that more than two-third of the total respondents are
satisfied about the quality of the boat and while the remaining expressed their
dissatisfaction due to various reasons.
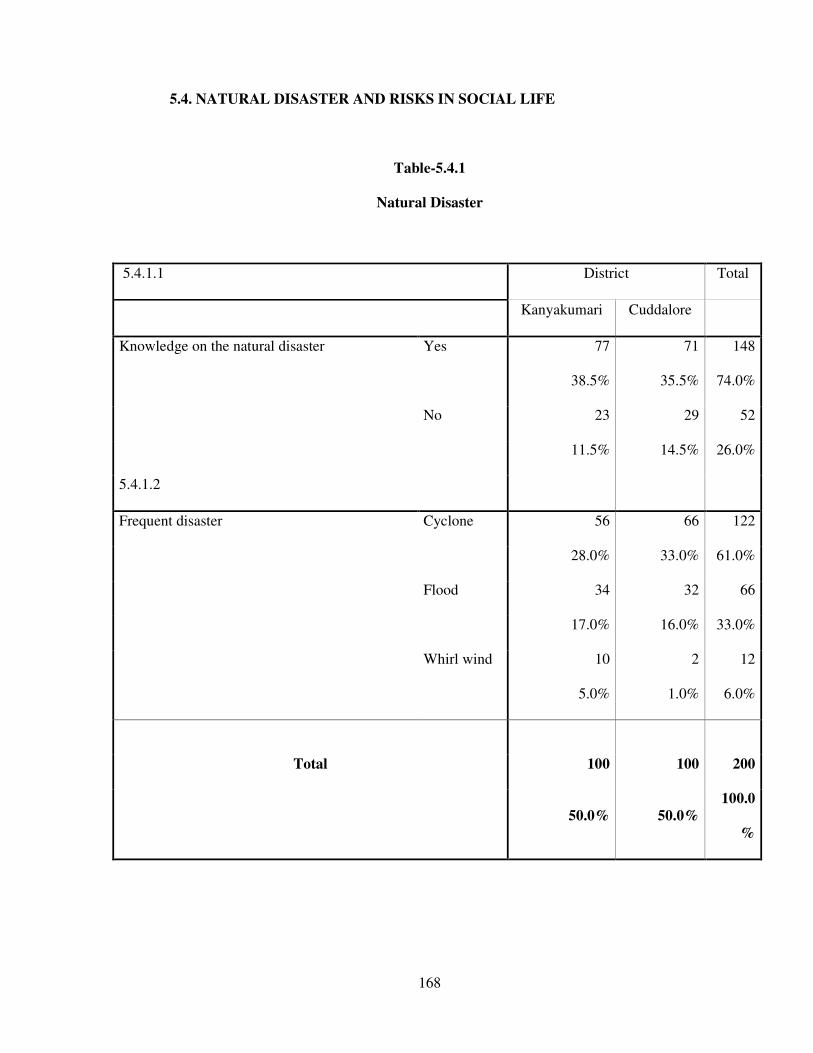
168
5.4. NATURAL DISASTER AND RISKS IN SOCIAL LIFE
Table-5.4.1
Natural Disaster
5.4.1.1 District Total
Kanyakumari Cuddalore
Knowledge on the natural disaster Yes 77 71 148
38.5% 35.5% 74.0%
No 23 29 52
11.5% 14.5% 26.0%
5.4.1.2
Frequent disaster Cyclone 56 66 122
28.0% 33.0% 61.0%
Flood 34 32 66
17.0% 16.0% 33.0%
Whirl wind 10 2 12
5.0% 1.0% 6.0%
Total 100 100 200
50.0% 50.0%
100.0
%
169
Table 5.4.1 reveals the disasters in the study area.
5.4.1.1 Indicates that the majority (74%) of the respondents have knowledge of the
natural disaster. In a district-wise comparison Kanyakumari district more (77)
respondent reported having knowledge about the natural disaster than in Cuddalore
district (71).
5.4.1.2 presents that majority (61%) of the respondents reported that cyclone is
frequently affecting their area followed by flood (33%), and whirl wind (6%). In a
district-wise comparison 66 respondents of Kanyakumari district reported that the
cyclone is the frequently affecting disaster than Cuddalore district respondents (56).
Therefore is concluded that majority of the respondents have knowledge about
the natural disasters and it is found that the cyclone is the frequently occurring
disaster in the coastal areas of the study districts.

170
Table- 5.4.2
Respondents’ Perception of the Impact of Depression in
Coastal Areas
5.4.2.1 District Total
Kanyakumari Cuddalore
Impact of depression in the coastal areas Climate change 53 62 115
26.5% 31.0% 57.5%
High waves 46 32 78
23.0% 16.0% 39.0%
Sea depression 1 6 7
.5% 3.0% 3.5%
5.4.2.2
How normality was affected during
times of natural disaster
Not doing regular
work 52 58 110
26.0% 29.0% 55.0%
Most affected
normal life 43 34 77
21.5% 17.0% 38.5%
loss of income 5 8 13
2.5% 4.0% 6.5%
Total 100 100 200
50.0% 50.0% 100.0%
Table 5.4.2 reveals the respondents’ perception of the impact of depression in
Coastal areas
5.4.2.1 presents that 57.5% of the total respondents reported that the climate
change is the result of depression in coastal areas whereas another 38.5% of the total
stated that high waves are the reason for depression in their areas.
5.4.2.2 indicates that 55% of the respondent gave priority to the fact that
natural disasters affected their normal work pattern. The district wise comparison
reveals that this was felt by more number of respondents in Kanniyakumari district
that those in Cuddalore district.
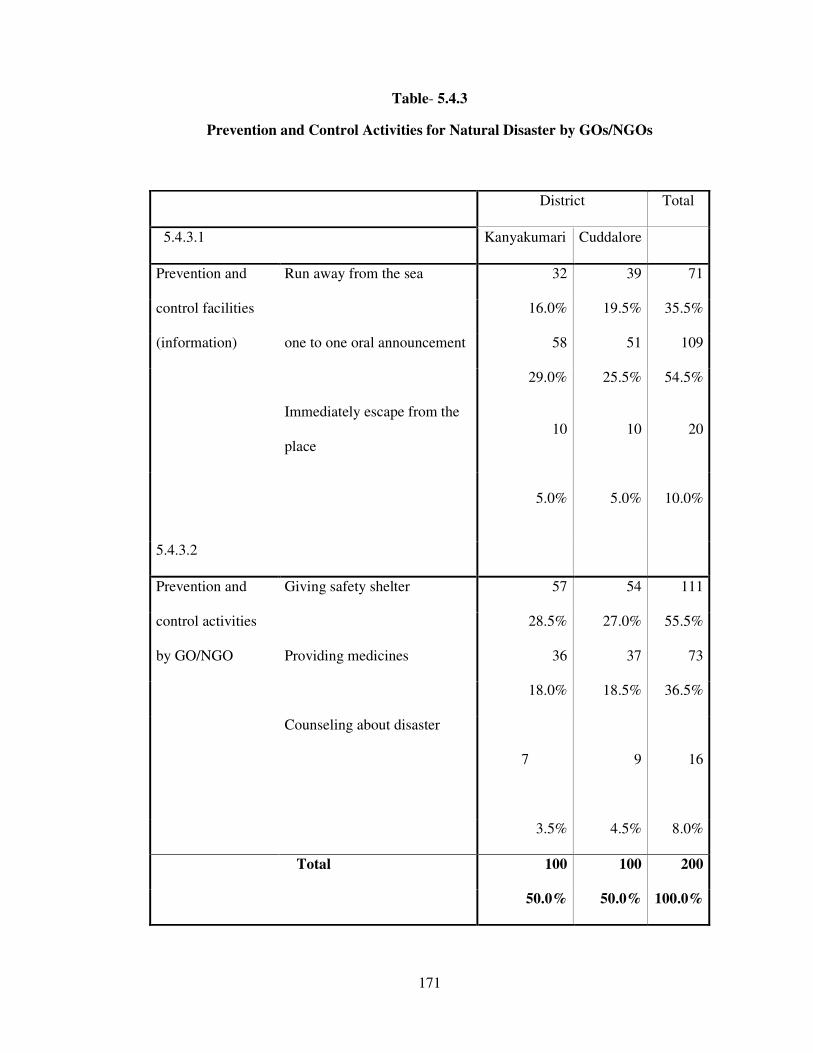
171
Table- 5.4.3
Prevention and Control Activities for Natural Disaster by GOs/NGOs
District Total
5.4.3.1 Kanyakumari Cuddalore
Prevention and
control facilities
(information)
Run away from the sea 32 39 71
16.0% 19.5% 35.5%
one to one oral announcement 58 51 109
29.0% 25.5% 54.5%
Immediately escape from the
place 10 10 20
5.0% 5.0% 10.0%
5.4.3.2
Prevention and
control activities
by GO/NGO
Giving safety shelter 57 54 111
28.5% 27.0% 55.5%
Providing medicines 36 37 73
18.0% 18.5% 36.5%
Counseling about disaster
7 9 16
3.5% 4.5% 8.0%
Total 100 100 200
50.0% 50.0% 100.0%
172
Table 5.4.3 reveals the prevention and control activities of GOs/NGOs during
time of disaster in coastal area
5.4.3.1 reveals that the majority 55% of respondents reported that they
announce individuals orally in the villages, where as nearly 36% of respondents run
away from the sea shores.
Table 5.4.3.2 indicates that the 56% respondents reported that GO/NGOs
provided safety shelter to the affected people. In district-wise comparison
Kanyakumari district more number (57) reported provision of safety shelter than
Cuddalore district (54).
So it is noted that majority of people give individual warning through oral
announcement about disaster and majority of respondents reported that GOs/NGOs
provide safety shelter for prevention and control activities in the area.

173
Table-5.4.4
Type of Destruction, Relief and Rehabilitation Measures / Activities
5.4.4.1 District Total
Kanyakumari Cuddalore
Destruction occurs as a
result of Flood Disaster
Flood 46 43 89
23.0% 21.5% 44.5%
sea aeration 37 44 81
18.5% 22.0% 40.5%
suddenly rain coming 11 13 24
5.5% 6.5% 12.0%
Over sun light 6 0 6
3.0% .0% 3.0%
5.4.4.2
Relief and
rehabilitation
measures/activities by
GO/NGOs
House & Money, food, cloth,
medicine given by GOs / NGOs 83 75 158
39.5% 37.5% 79%
NGOs give cloth only 13 18 31
6.5% 9.0% 15.5%
GO give house only 0 7 7
.0% 3.5% 3.5%
GOs/NGOs give all help 4 0 4
2.0% .0% 2.0%
Total 100 100 200
50.0% 50.0% 100.0%
174
Table 5.4.4 reveals the types of destruction and relief rehabilitation activities.
Table 5.4.4.1 indicates that nearly (45%) of respondent affected by destruction
due to the flood viewed it a normally occurring as a result of natural disaster and
(41%) of respondents reported that the destruction comes from sea aeration. Because
through sea aeration water enters into the villages which affect fishing.
5.4.4.2 Indicates that the majority (79%) of the respondents got house, money,
food, clothes, and medicines given by GO/NGOs for relief and rehabilitations. In
district-wise comparison Kanyakumari district (88) respondent got relief materials
than in Cuddalore district (75) respondents.
It is noted that the majority of respondents reported that they were affected
more frequently by disasters like flood and majority of respondent got the relief
materials from GOs/NGOs.
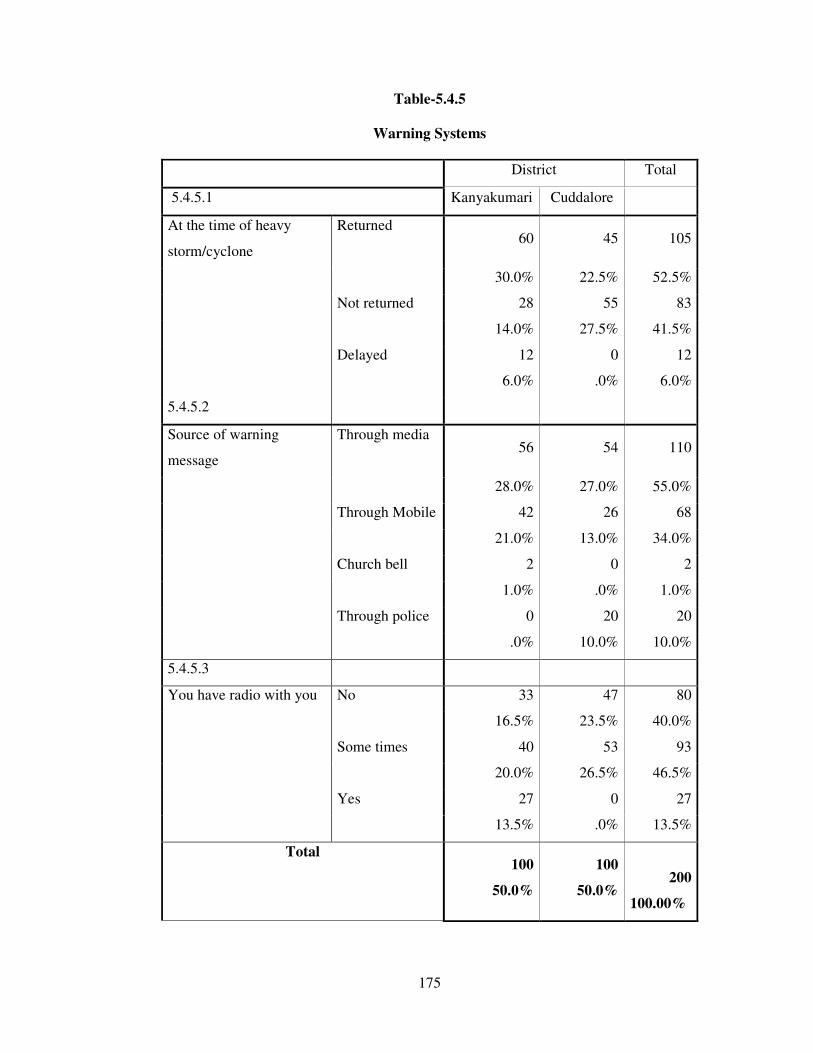
175
Table-5.4.5
Warning Systems
District Total
5.4.5.1 Kanyakumari Cuddalore
At the time of heavy
storm/cyclone
Returned 60 45 105
30.0% 22.5% 52.5%
Not returned 28 55 83
14.0% 27.5% 41.5%
Delayed 12 0 12
6.0% .0% 6.0%
5.4.5.2
Source of warning
message
Through media 56 54 110
28.0% 27.0% 55.0%
Through Mobile 42 26 68
21.0% 13.0% 34.0%
Church bell 2 0 2
1.0% .0% 1.0%
Through police 0 20 20
.0% 10.0% 10.0%
5.4.5.3
You have radio with you No 33 47 80
16.5% 23.5% 40.0%
Some times 40 53 93
20.0% 26.5% 46.5%
Yes 27 0 27
13.5% .0% 13.5%
Total
100
50.0%
100
50.0%
200
100.00%
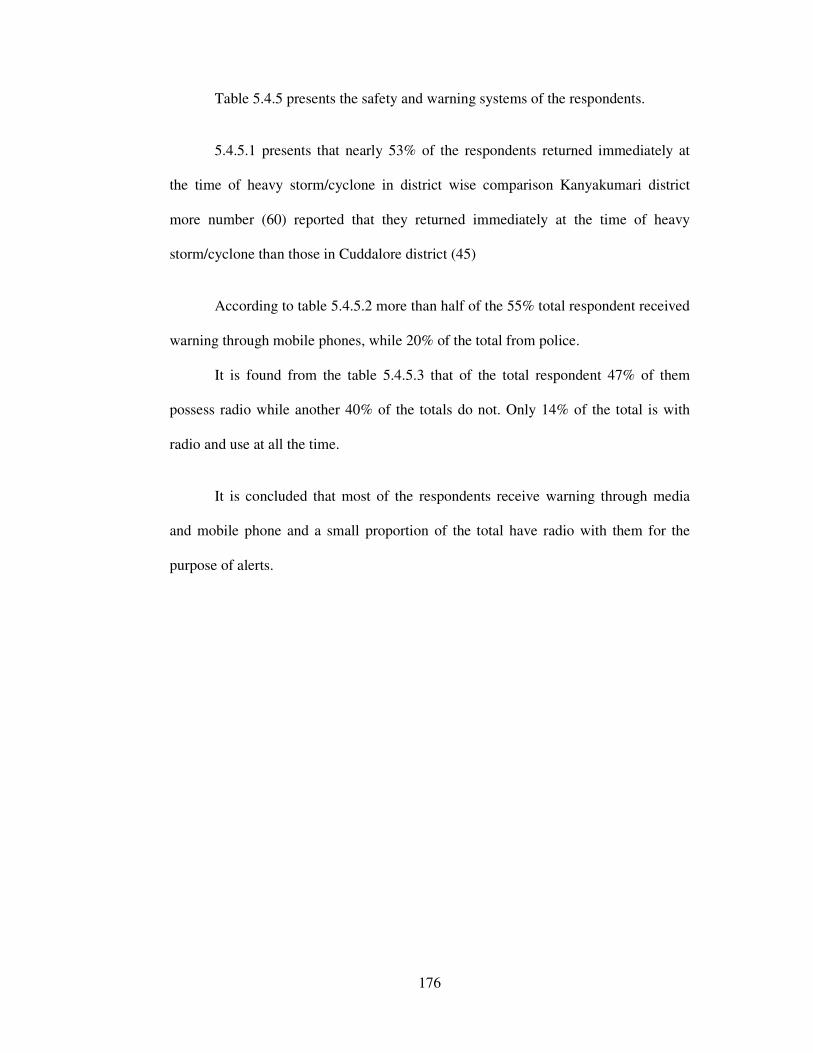
176
Table 5.4.5 presents the safety and warning systems of the respondents.
5.4.5.1 presents that nearly 53% of the respondents returned immediately at
the time of heavy storm/cyclone in district wise comparison Kanyakumari district
more number (60) reported that they returned immediately at the time of heavy
storm/cyclone than those in Cuddalore district (45)
According to table 5.4.5.2 more than half of the 55% total respondent received
warning through mobile phones, while 20% of the total from police.
It is found from the table 5.4.5.3 that of the total respondent 47% of them
possess radio while another 40% of the totals do not. Only 14% of the total is with
radio and use at all the time.
It is concluded that most of the respondents receive warning through media
and mobile phone and a small proportion of the total have radio with them for the
purpose of alerts.
177
Table- 5.4.6
Life Saving Warning System at the Time of Natural Disaster
District Total
5.4.6.1 Kanyakumari Cuddalore
during disaster how
do save your life
Running to safety
place 50 39 89
25.0% 19.5% 44.5%
Running away from
sea 23 44 67
11.5% 22.0% 33.5%
Running high place 27 17 44
13.5% 8.5% 22.0%
5.4.6.2
Warning system Church bell 51 0 51
25.5% 0% 25.5%
Radio 27 34 61
13.5% 17.0% 30.0%
Orally shouting in
street 22 18 40
11.0% 6.5% 17.5%
Through police 0 48 48
.0% 24.0% 24.0%
Total 100 100 200
50.0% 50.0% 100.0%

178
Table – 5.4.6 presents the Life saving & Warning System at the time of natural
disaster
5.4.6.1 indicates that nearly 45% of respondents run to safety place. In district-
wise comparison Kanyakumari district about 50 respondents reported running to
safety place than those in Cuddalore (39).
5.4.6.2 presents that the nearly 30% of the respondents got warning from radio.
And nearly 25.5% respondents got warning from church bell in Kanyakumari district
It is concluded that more respondents preferred running to the place of safety.
About 30% of the respondents got warning from radio.

179
Table- 5.4.7
Recent Disaster Experience
District Total
5.4.7.1 Kanyakumari Cuddalore
it is dangerous to live in
costal area
Yes 65 53 118
32.5% 26.5% 59.0%
No 35 47 82
17.5% 23.5% 41.0%
5.4.7.2
apart from tsunami which
disaster you have
experienced recently
Flood
49 54 103
24.5% 27.0% 51.5%
Storm 35 42 77
17.5% 21.0% 38.5%
Sea
Erosion 13 3 16
6.5% 1.5% 8.0%
Rain 2 0 2
1.0% .0% 1.0%
Big waves 1 1 2
.5% .5% 1.0%
Total 100 100 200
50.0% 50.0% 100.0%
Table 5.4.7 presents the disaster experience of the respondents.
5.4.7.1 reveals that the majority 59% of the respondents reported that it was
dangerous to live in coastal areas. In a district-wise comparison in Kanyakumari
district more number (65) agreed to the same than Cuddalore district (53).
Table 5.4.7.2 presents that 52% of the respondents affected by flood after
tsunami and another 39% of the total faced storm after tsunami.
The conclusion drawn from this table is that the majority of the respondents
perceived that it is dangerous to live in coastal areas and majority of them were
affected flood and storm after tsunami.
180
Table-5.4.8
Protection of Huts
District Total
5.4.8.1 Kanyakumari Cuddalore
Safeguarding huts
during flood
&cyclone
Change the hut to
another place 37 42 79
18.5% 21.0% 39.5%
Nothing is done 49 48 97
24.5% 24.0% 48.5%
Build at house at a safe
place 14 10 24
7.0% 5.0% 12.0%
Total 100 100 200
50.0% 50.0% 100.0%
According to table 5.4.8.1 nearly 49% of them reported that nothing was done
to the huts at the time of flood, while another 40% of respondents changed the hut to
another place at the time of flood. Only 12% of the total built the house at safe place.
181
Table-5.4.9
Common Diseases at the Time of Disaster
District Total
5.4.9.1 Kanyakumari Cuddalore
What are all common
diseases spread at time
of disaster
Itching
32 46 78
16.0% 23.0% 39.0%
Virus Fever 37 30 67
18.5% 15.0% 33.5%
Malaria
Fever 26 11 37
13.0% 5.5% 18.5%
Skin Disease 3 1 4
1.5% .5% 2.0%
Chicken Box 2 12 14
1.0% 6.0% 7.0%
Total 100 100 200
50.0% 50.0% 100.0%
Table 5.4.9. presents the particulars about the common diseases that spread
after disaster in the coastal area.
According to table 5.4.9.1 nearly 39% of the respondents suffered from
itching at the time of stay in the shelter and while other suffered from virus fever
34%,malaria fever 19% chicken pox 7%, and skin disease 2% of respondents are
suffering from virus fever due to the staying the shelter.
Therefore, it is concluded the entire respondent suffered from one or the other
of above said diseases.
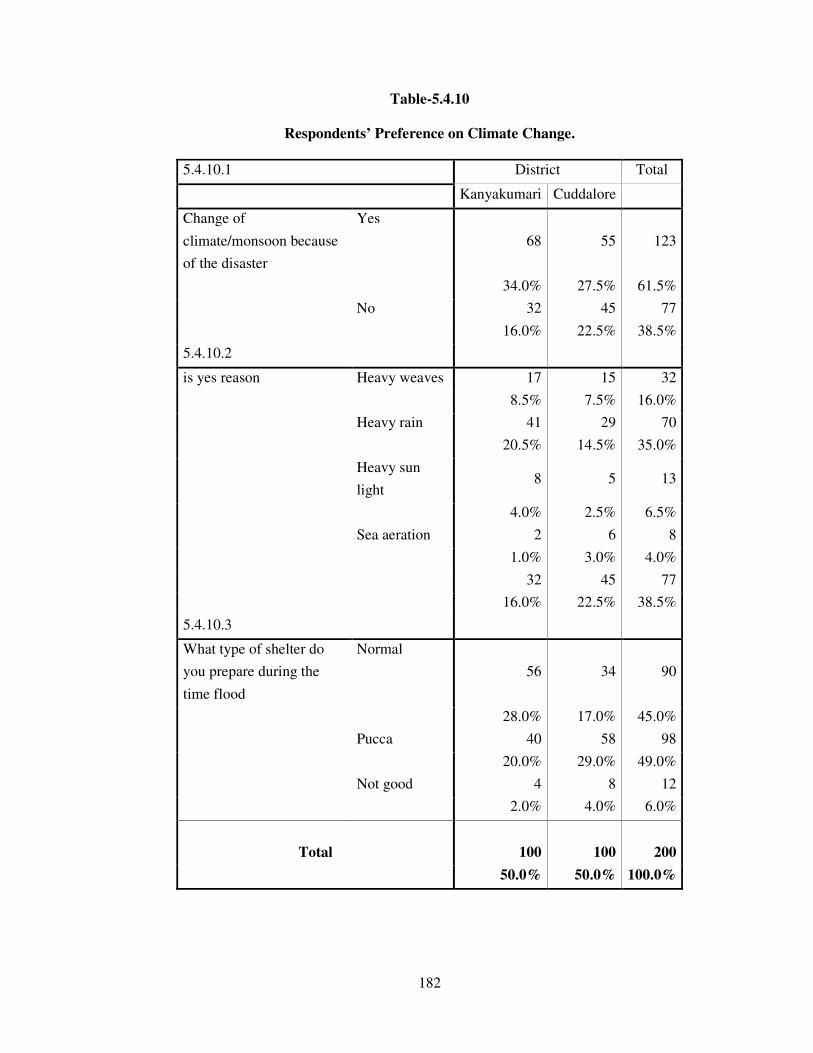
182
Table-5.4.10
Respondents’ Preference on Climate Change.
5.4.10.1 District Total
Kanyakumari Cuddalore
Change of
climate/monsoon because
of the disaster
Yes
68 55 123
34.0% 27.5% 61.5%
No 32 45 77
16.0% 22.5% 38.5%
5.4.10.2
is yes reason Heavy weaves 17 15 32
8.5% 7.5% 16.0%
Heavy rain 41 29 70
20.5% 14.5% 35.0%
Heavy sun
light 8 5 13
4.0% 2.5% 6.5%
Sea aeration 2 6 8
1.0% 3.0% 4.0%
32 45 77
16.0% 22.5% 38.5%
5.4.10.3
What type of shelter do
you prepare during the
time flood
Normal
56 34 90
28.0% 17.0% 45.0%
Pucca 40 58 98
20.0% 29.0% 49.0%
Not good 4 8 12
2.0% 4.0% 6.0%
Total 100 100 200
50.0% 50.0% 100.0%
183
Table 5.4.10 presents the respondent’s preference towards shelter during
monsoon changes in the study districts.
5.4.10.1 indicates that 61.5% of the total respondents reported that monsoon
changes occur due to disaster. In district-wise comparison in Kanyakumari district 68
out of 100 reported the same than in Cuddalore district (56).
According to table 5.4.10.2 nearly 35% of the total respondents reported that
heavy rain due to the monsoon change in the study areas. In a district-wise
comparison more number (41) in Kanyakumari district reported heavy rain due to
monsoon change than in Cuddalore district (29).
It is understood from table 5.4.10.3 about half (49%) of the total respondents
need pucca shelter whereas another 45% of the total stated that normal one is enough
to them. In a district-wise comparison Cuddalore district more number (58) are
staying in the pucca shelter than Kanyakumari district (40).
Therefore, it is understood there was a change in the monsoon due to disaster
and more number of them say that heavy rain had come due to the monsoon change
and great number of respondents reported that they were staying in pucca shelter.
Therefore, it is understood that more number of the respondents require pucca shelter.
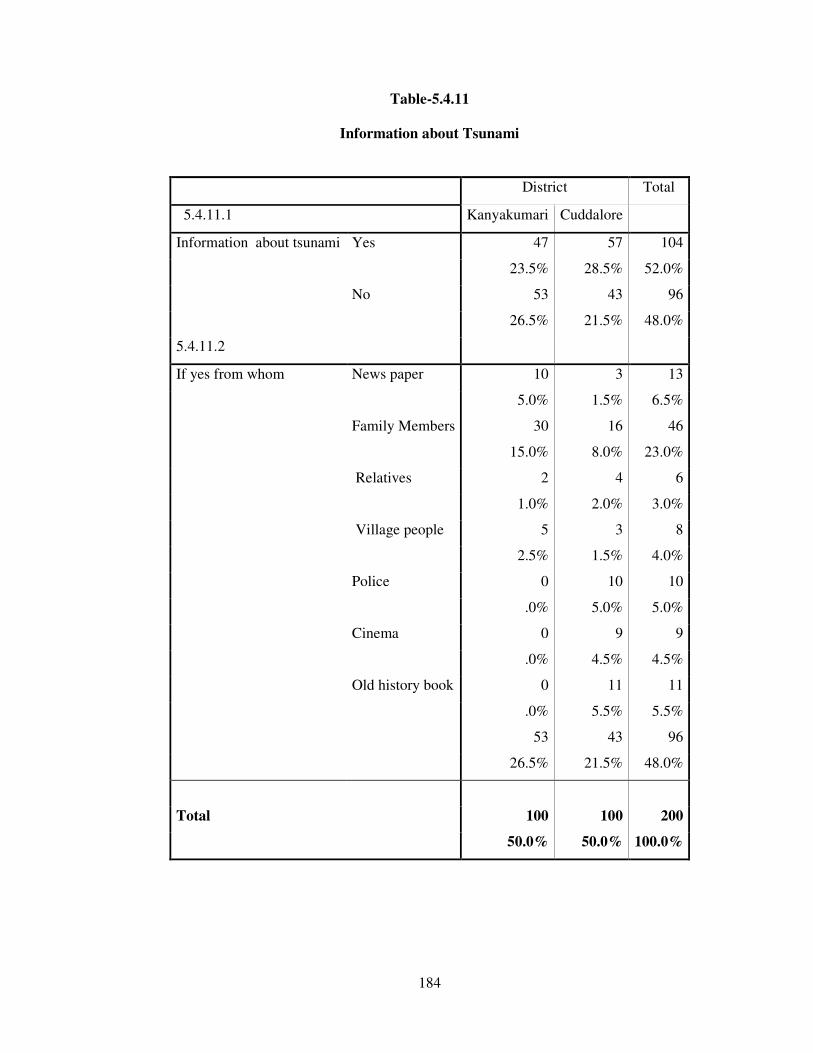
184
Table-5.4.11
Information about Tsunami
District Total
5.4.11.1 Kanyakumari Cuddalore
Information about tsunami Yes 47 57 104
23.5% 28.5% 52.0%
No 53 43 96
26.5% 21.5% 48.0%
5.4.11.2
If yes from whom News paper 10 3 13
5.0% 1.5% 6.5%
Family Members 30 16 46
15.0% 8.0% 23.0%
Relatives 2 4 6
1.0% 2.0% 3.0%
Village people 5 3 8
2.5% 1.5% 4.0%
Police 0 10 10
.0% 5.0% 5.0%
Cinema 0 9 9
.0% 4.5% 4.5%
Old history book 0 11 11
.0% 5.5% 5.5%
53 43 96
26.5% 21.5% 48.0%
Total 100 100 200
50.0% 50.0% 100.0%
185
Table 5.4.11 presents the source of information about tsunami in the study
districts.
5.4.11.1 indicates that more than half (52%) of the respondents reported that
they had prior knowledge about tsunami alert. In a district-wise comparison more
number of respondents in Cuddalore district (57) got information about tsunami than
Kanyakumari district (47).
5.4.11.2 reveals that the majority (52%) of the respondents reported that they
got information about tsunami from various resources like news paper, family
members, relatives, village people, police, cinema and books. However, nearly a half
(48%) of the total respondents of both districts did not receive any information
regarding tsunami.
Therefore it is concluded that only a half of the total respondents are informed
of tsunami.
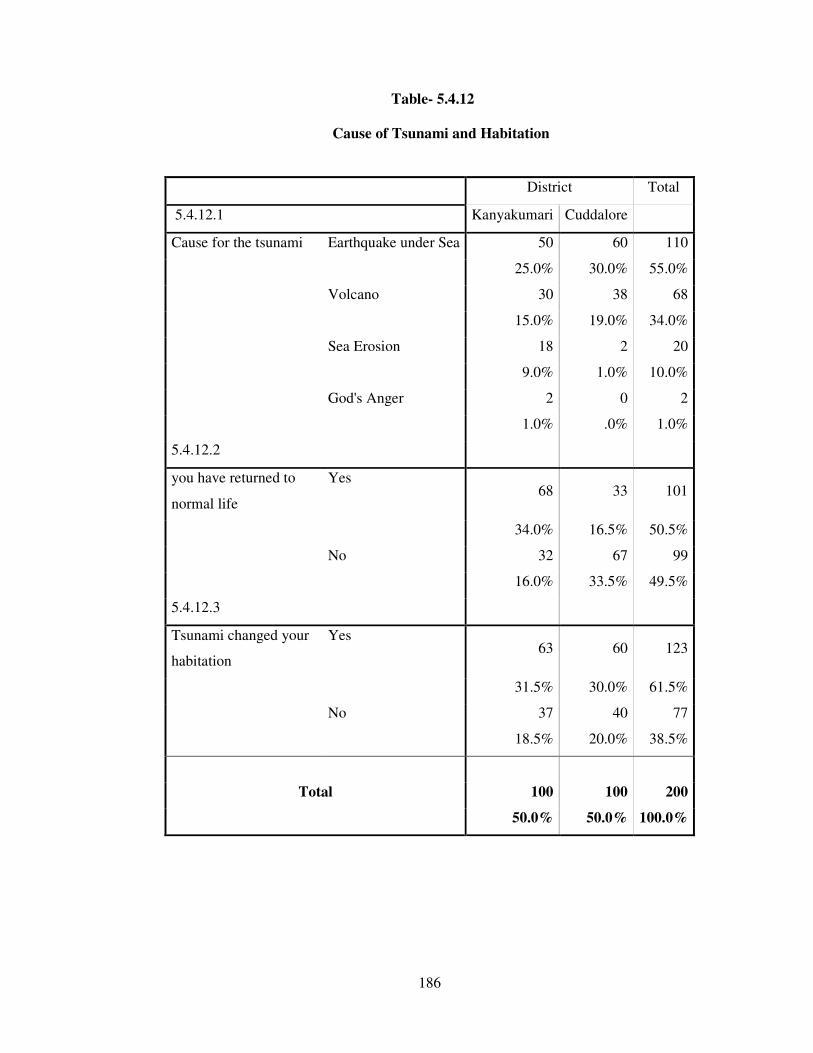
186
Table- 5.4.12
Cause of Tsunami and Habitation
District Total
5.4.12.1 Kanyakumari Cuddalore
Cause for the tsunami Earthquake under Sea 50 60 110
25.0% 30.0% 55.0%
Volcano 30 38 68
15.0% 19.0% 34.0%
Sea Erosion 18 2 20
9.0% 1.0% 10.0%
God's Anger 2 0 2
1.0% .0% 1.0%
5.4.12.2
you have returned to
normal life
Yes 68 33 101
34.0% 16.5% 50.5%
No 32 67 99
16.0% 33.5% 49.5%
5.4.12.3
Tsunami changed your
habitation
Yes 63 60 123
31.5% 30.0% 61.5%
No 37 40 77
18.5% 20.0% 38.5%
Total 100 100 200
50.0% 50.0% 100.0%
187
Table 5.4.12 reveals the respondents’ perception towards the cause for tsunami
and change in their habitation.
Table 5.4.12.1 indicates that the majority of the (55%) respondents are
reported the cause of tsunami is earthquake under the sea. In district-wise comparison
Cuddalore district more number (60%) reported earthquake under the sea due to the
cause for tsunami than in Kanyakumari district (50%).
5.4.12.2 Indicates that the majority (51%) of them returned to the normal life.
In district-wise comparison in Kanyakumari district more number (68) of respondent
returned to normal life than in Cuddalore district (33).
5.4.12.3 indicates that the majority of them (62%) reported that tsunami has
changed the habitation. In district-wise comparison Kanyakumari district more
number (63) of them agreed to above statement than those in Cuddalore district (60).
Therefore, it is concluded that earthquake and volcano eruption under the sea
were the causes for tsunami; majority changed habitation due to tsunami and
subsequently, majority of them had returned to normal life.
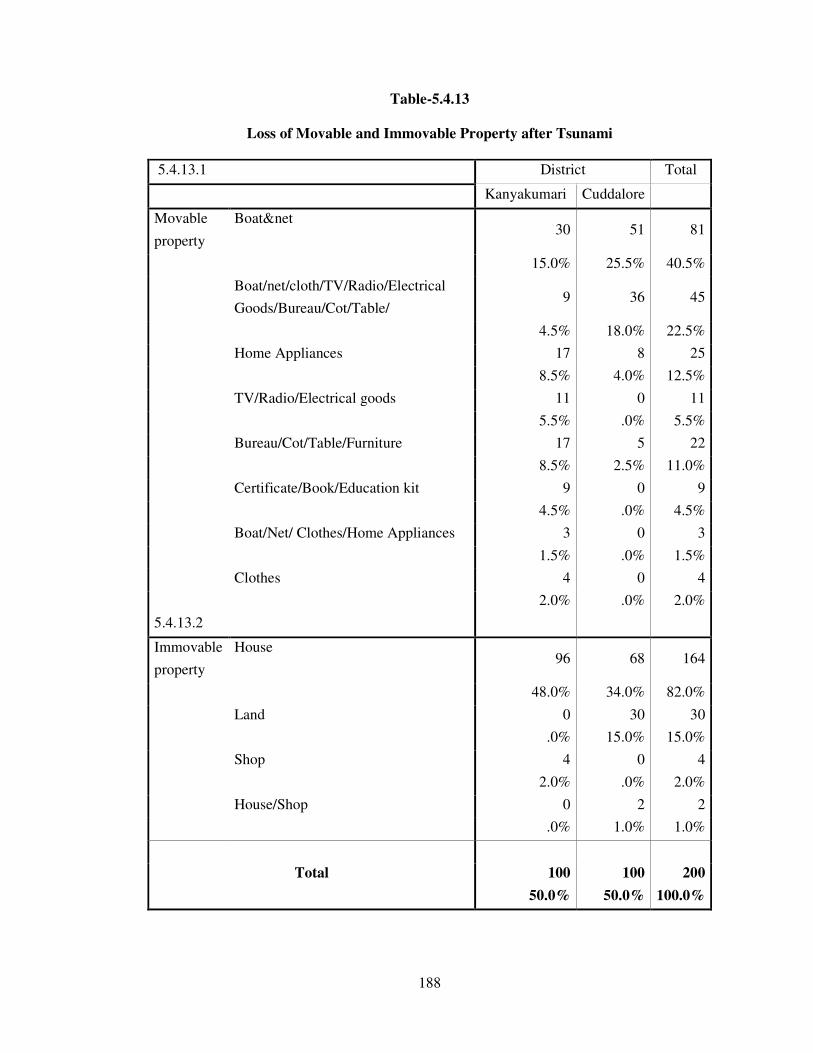
188
Table-5.4.13
Loss of Movable and Immovable Property after Tsunami
5.4.13.1 District Total
Kanyakumari Cuddalore
Movable
property
Boat&net 30 51 81
15.0% 25.5% 40.5%
Boat/net/cloth/TV/Radio/Electrical
Goods/Bureau/Cot/Table/ 9 36 45
4.5% 18.0% 22.5%
Home Appliances 17 8 25
8.5% 4.0% 12.5%
TV/Radio/Electrical goods 11 0 11
5.5% .0% 5.5%
Bureau/Cot/Table/Furniture 17 5 22
8.5% 2.5% 11.0%
Certificate/Book/Education kit 9 0 9
4.5% .0% 4.5%
Boat/Net/ Clothes/Home Appliances 3 0 3
1.5% .0% 1.5%
Clothes 4 0 4
2.0% .0% 2.0%
5.4.13.2
Immovable
property
House 96 68 164
48.0% 34.0% 82.0%
Land 0 30 30
.0% 15.0% 15.0%
Shop 4 0 4
2.0% .0% 2.0%
House/Shop 0 2 2
.0% 1.0% 1.0%
Total 100 100 200
50.0% 50.0% 100.0%

189
Table 5.4.13 indicates the loss of the movable and immovable properties of the
respondents.
According to table 5.4.13.1 nearly (41%) of the respondents reported that the
movable properties are boat and net and nearly (23%) respondents reported that the
boat/net/tv./radio/electronic goods/bureau/bed/tables are movable assets for them and
(13%) home appliances and (11%) of the respondents have no idea of the movable
properties.
5.4.13.2 Indicates that the majority (82%) of respondents reported that house
is the immovable property of the respondents. In district-wise comparison
Kanyakumari district more number (96) of respondents having only house as the
immovable assets than in Cuddalore district (68).
So it is concluded the movable properties are boat and net. The majority of
respondents reported that house is the immovable property of the respondents.
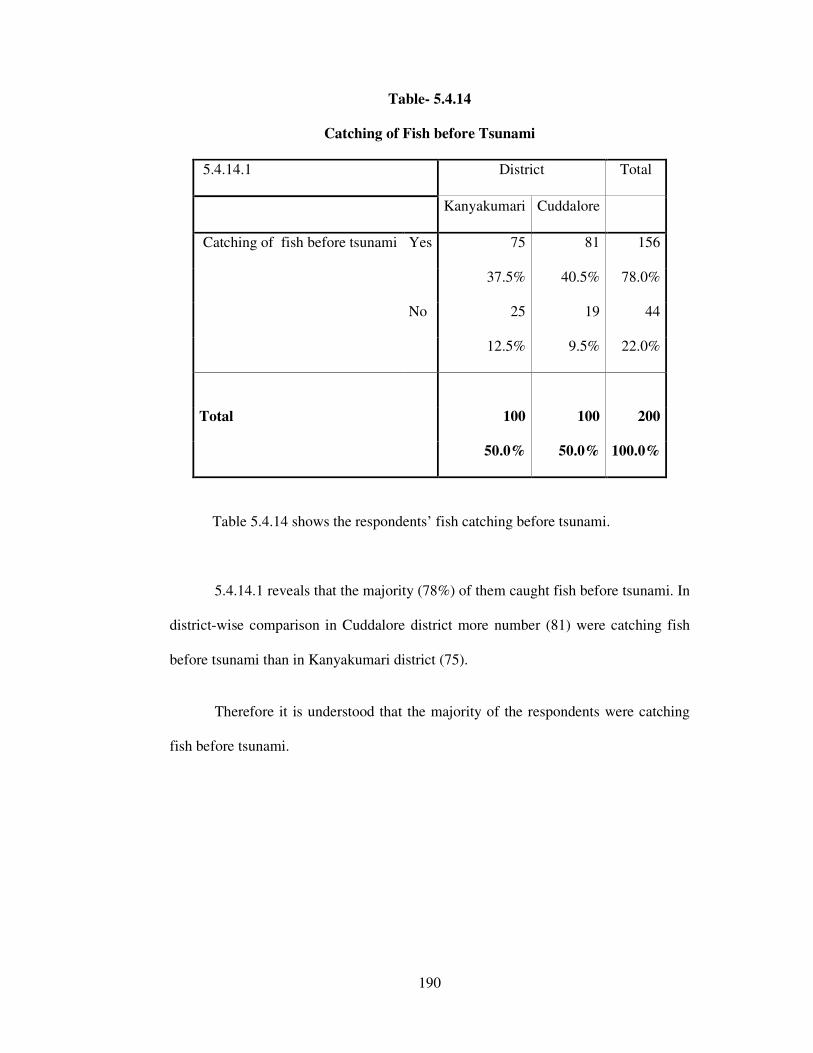
190
Table- 5.4.14
Catching of Fish before Tsunami
5.4.14.1 District Total
Kanyakumari Cuddalore
Catching of fish before tsunami Yes 75 81 156
37.5% 40.5% 78.0%
No 25 19 44
12.5% 9.5% 22.0%
Total 100 100 200
50.0% 50.0% 100.0%
Table 5.4.14 shows the respondents’ fish catching before tsunami.
5.4.14.1 reveals that the majority (78%) of them caught fish before tsunami. In
district-wise comparison in Cuddalore district more number (81) were catching fish
before tsunami than in Kanyakumari district (75).
Therefore it is understood that the majority of the respondents were catching
fish before tsunami.

191
Table-5.4.15
Fear and Experience of Tsunami
5.4.15.1 District Total
Kanyakumari Cuddalore
afraid to go for fishing
after tsunami
Yes 67 56 123
33.5% 28.0% 61.5%
No 33 44 77
16.5% 22.0% 38.5%
5.4.15.2
are you afraid of going to
sea even now
Yes 79 69 148
39.5% 34.5% 74.0%
No 21 31 52
10.5% 15.5% 26.0%
5.4.15.3
What was your experience
during tsunami
Fear for life 80 53 133
40% 26.5% 66.5%
How to save life 20 47 67
10% 23.5% 33.5%
Total 100 100 200
50.0% 50.0% 100.0%

192
Table 5.4.15 reveals the respondent fear and experience about tsunami.
5.4.15.1 indicates that the majority 62% of the respondents were afraid
of the sea after the tsunami. In district wise comparison in Kanyakumari
district more number (67) were afraid of going to the sea after the tsunami
than in Cuddalore district (56).
5.4.15.2 presents that the majority 74% of the respondents are afraid to
go to the sea even now. In district-wise comparison Kanyakumari district more
number (79) were afraid to go to the sea after the tsunami than in Cuddalore
district (69)
5.4.15.3 presents that the majority 66% of them feared for the life due
to the experience of the tsunami. In district wise- comparison in Kanyakumari
district more number 80 feared for life after the tsunami than in Cuddalore
district 53
Therefore it is concluded that the majority of the respondents are afraid
to go into the sea after the tsunami and majority of the respondents are afraid
to go to the sea even now. Majority of them feared for the life due to the
experience of the tsunami.
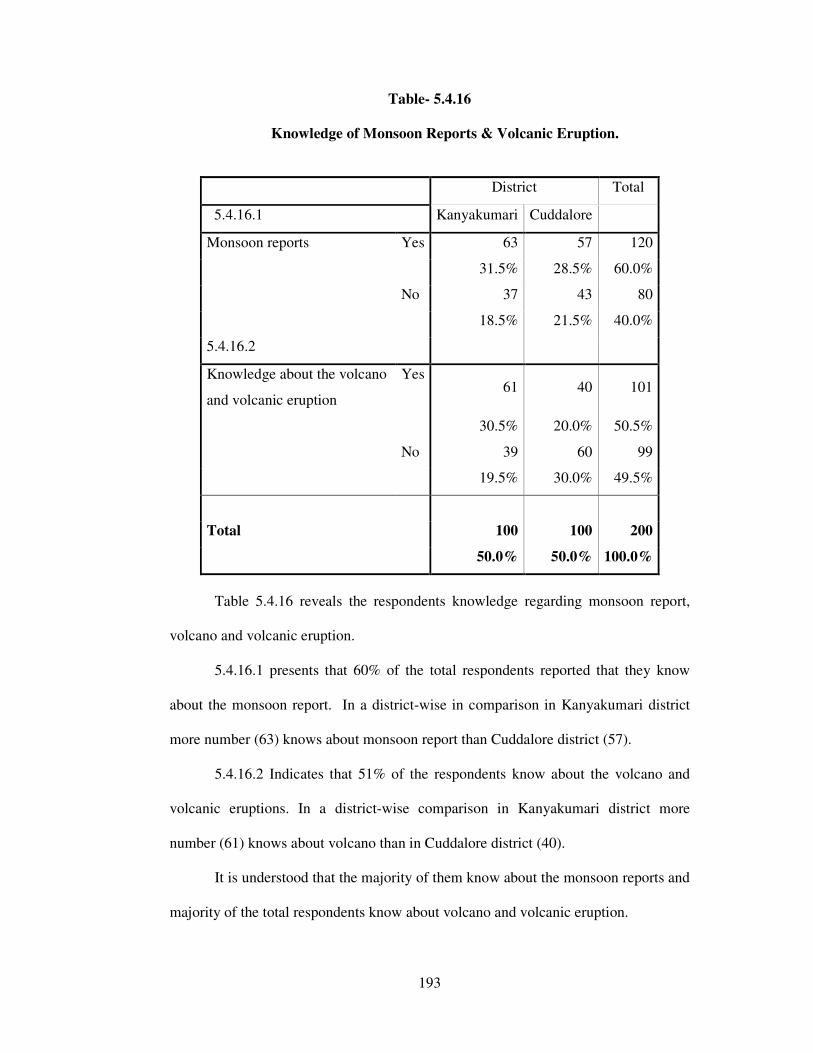
193
Table- 5.4.16
Knowledge of Monsoon Reports & Volcanic Eruption.
District Total
5.4.16.1 Kanyakumari Cuddalore
Monsoon reports Yes 63 57 120
31.5% 28.5% 60.0%
No 37 43 80
18.5% 21.5% 40.0%
5.4.16.2
Knowledge about the volcano
and volcanic eruption
Yes 61 40 101
30.5% 20.0% 50.5%
No 39 60 99
19.5% 30.0% 49.5%
Total 100 100 200
50.0% 50.0% 100.0%
Table 5.4.16 reveals the respondents knowledge regarding monsoon report,
volcano and volcanic eruption.
5.4.16.1 presents that 60% of the total respondents reported that they know
about the monsoon report. In a district-wise in comparison in Kanyakumari district
more number (63) knows about monsoon report than Cuddalore district (57).
5.4.16.2 Indicates that 51% of the respondents know about the volcano and
volcanic eruptions. In a district-wise comparison in Kanyakumari district more
number (61) knows about volcano than in Cuddalore district (40).
It is understood that the majority of them know about the monsoon reports and
majority of the total respondents know about volcano and volcanic eruption.

194
Table-5.4.17
Knowledge on the Occurrence of Tsunami
District Total
5.4.17.1 Kanyakumari Cuddalore
Knowledge on the
occurrence of
tsunami
Yes
64 80 144
32.0% 40.0% 72.0%
No 36 20 56
18.0% 10.0% 28.0%
5.4.17.2
Knowledge about
global warming
Yes 59 75 134
29.5% 37.5% 67.0%
No 41 25 66
20.5% 12.5% 33.0%
5.4.17.3
Normal changes
occurring in the sea
January-Feb 44 52 96
22.0% 26.0% 48.0%
Feb-March 43 40 83
21.5% 20.0% 41.5%
Mar-April 6 2 8
3.0% 1.0% 4.0%
May-June 1 0 1
.5% .0% .5%
June-July 6 6 12
3.0% 3.0% 6.0%
Total 100 100 200
50.0% 50.0% 100.0%
195
Table 5.4.17 Indicates the respondents knowledge regarding the occurrence of
tsunami and global warming.
5.4.17.1 presents that majority 72% of the total respondents know about how
tsunami occurred. In a district-wise comparison 80 respondents of Cuddalore district
know about how the tsunami occurred than those in Kanyakumari district (64).
5.4.17.2 reveals that two-thirds (67%) of the total respondents reported that
they have knowledge about global warming. In district-wise comparison Cuddalore
district reported more number (75) about the same than Kanyakumari district (59).
According to table 5.4.17.3 nearly 48% of the total respondents reported
during January-February changes occur in the sea normally and nearly another 42 of
the total reported the same would be during Feb-March.
Therefore, it is concluded that the majority of the respondents know about how
tsunami occurred; majority of them have knowledge about global warming; and most
of them reported that changes in the sea occur during January-February.
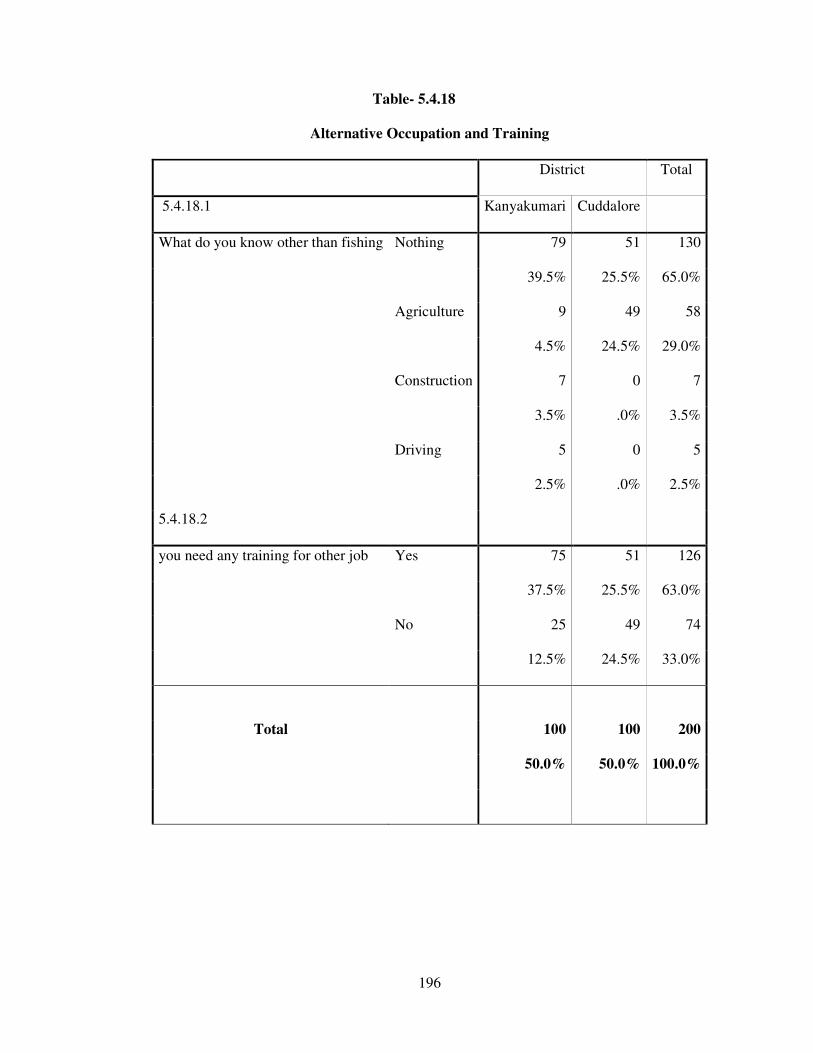
196
Table- 5.4.18
Alternative Occupation and Training
District Total
5.4.18.1 Kanyakumari Cuddalore
What do you know other than fishing Nothing 79 51 130
39.5% 25.5% 65.0%
Agriculture 9 49 58
4.5% 24.5% 29.0%
Construction 7 0 7
3.5% .0% 3.5%
Driving 5 0 5
2.5% .0% 2.5%
5.4.18.2
you need any training for other job Yes 75 51 126
37.5% 25.5% 63.0%
No 25 49 74
12.5% 24.5% 33.0%
Total 100 100 200
50.0% 50.0% 100.0%

197
Table 5.4.18 reveals that the alternative occupations and training availed to the
respondents in the study area.
According to table 5.4.18.1 the majority (65%) of the total respondents know
nothing other than fishing. In district-wise comparison more number (79) of
respondents in Kanyakumari district reported the same than those in Cuddalore
district (51).
5.4.18.2 reveals that the majority 63% of the total respondents are willing to
be trained for other jobs. In district-wise comparison Kanyakumari district more
number (75) required the training for other job than in Cuddalore district (51).
It is concluded that the majority of them reported that nothing is known other
than fishing and majority of them expressed their willingness to be trained for other
jobs.

198
Table- 5.4.19
Communications after Tsunami
District Total
5.4.19.1 Kanyakumari Cuddalore
How did you communicate after
tsunami
Directly 54 64 118
27.0% 32.0% 59.0%
Orally 46 36 82
23.0% 18.0% 41.0%
5.4.19.2
Your land affected due to the
tsunami
Yes 1 25 26
.5% 12.5% 13.0%
No 99 75 174
49.5% 37.5% 87.0%
5.4.19.3
After tsunami what was the
condition of the road
Good 39 50 89
19.5% 25.0% 44.5%
Bad
53 43 96
26.5% 21.5% 48.0%
Normal 8 7 15
4.0% 3.5% 7.5%
61.5%
5.4.19.4
Any environmental changes yes 48 63 111
24.0% 31.5% 55.5%
No 52 37 89
26.0% 18.5% 44.5%
Total 100 100 200
50.0% 50.0%
100.0
%
199
Table 5.4.19 presents communication and environment of the respondents in
the study districts.
5.4.19.1 reveals that the majority (59%) of the total respondents
communicated directly after tsunami. In district-wise comparison 64 out of 100
respondents of the Cuddalore district communicated directly than in Kanyakumari
district (54).
5.4.19.2 presents that a large majority (87%) of the total respondents reported
that no land was affected due to tsunami.
5.4.19.3 Indicates that the majority (62%) of the respondents reported that they
did not know about the systems of disaster. In district-wise comparison more
respondents (68) of Kanyakumari district expressed ignorance than those in
Cuddalore district (55).
5.4.19.4 shows that majority (55.5%) of the total respondents reported that
environmental changes occurred due to tsunami. In district-wise comparison
Cuddalore district reported more (63) about the presence of environmental changes
due to tsunami than Kanyakumari district (48).
It is concluded that the majority of the total respondents communicated
directly after tsunami; majority of them reported that no land was affected due to
tsunami; majority of them stated that they did not know about the systems of disaster;
and majority of them reported that environmental changes occurred due to tsunami.

200
5.5. COMMUNITY PREPAREDNESS AND DISASTER MANAGEMENT
Table - 5.5.1
Any Symptoms before Tsunami
5.5.1.1 District Total
Kanyakumari Cuddalore
was there any symptoms
before tsunami
Yes 79 56 135
39.5% 28.0% 67.5%
No 21 44 65
10.5% 22.0% 32.5%
5.5.1.2
if yes what was that High waves 65 46 111
32.5% 23.0% 55.5%
Wind 22 27 49
11.0% 13.5% 24.5%
Sea aeration 13 1 14
6.5% .5% 7.0%
Nothing 0 26 26
.0% 13.0% 13.0%
5.5.1.3
Who was the first to inform
you about the tsunami
My brother 52 30 82
26.0% 15.0% 41.0%
My father 37 28 65
18.5% 14.0% 32.5%
My mother 5 15 20
2.5% 7.5% 10.0%
My neighbors 6 7 13
3.0% 3.5% 6.5%
No body 0 2 2
.0% 1.0% 1.0%
police 0 18 18
.0% 9.0% 9.0%
Total 100 100 200
50.0% 50.0% 100.0%
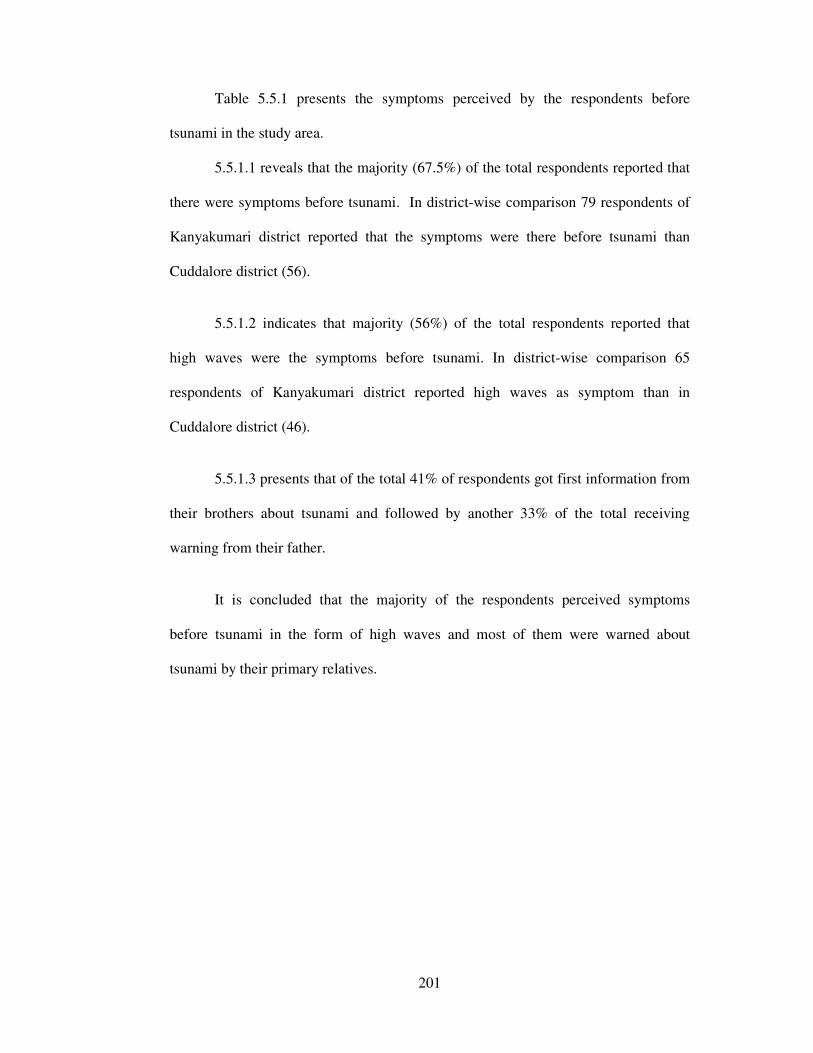
201
Table 5.5.1 presents the symptoms perceived by the respondents before
tsunami in the study area.
5.5.1.1 reveals that the majority (67.5%) of the total respondents reported that
there were symptoms before tsunami. In district-wise comparison 79 respondents of
Kanyakumari district reported that the symptoms were there before tsunami than
Cuddalore district (56).
5.5.1.2 indicates that majority (56%) of the total respondents reported that
high waves were the symptoms before tsunami. In district-wise comparison 65
respondents of Kanyakumari district reported high waves as symptom than in
Cuddalore district (46).
5.5.1.3 presents that of the total 41% of respondents got first information from
their brothers about tsunami and followed by another 33% of the total receiving
warning from their father.
It is concluded that the majority of the respondents perceived symptoms
before tsunami in the form of high waves and most of them were warned about
tsunami by their primary relatives.
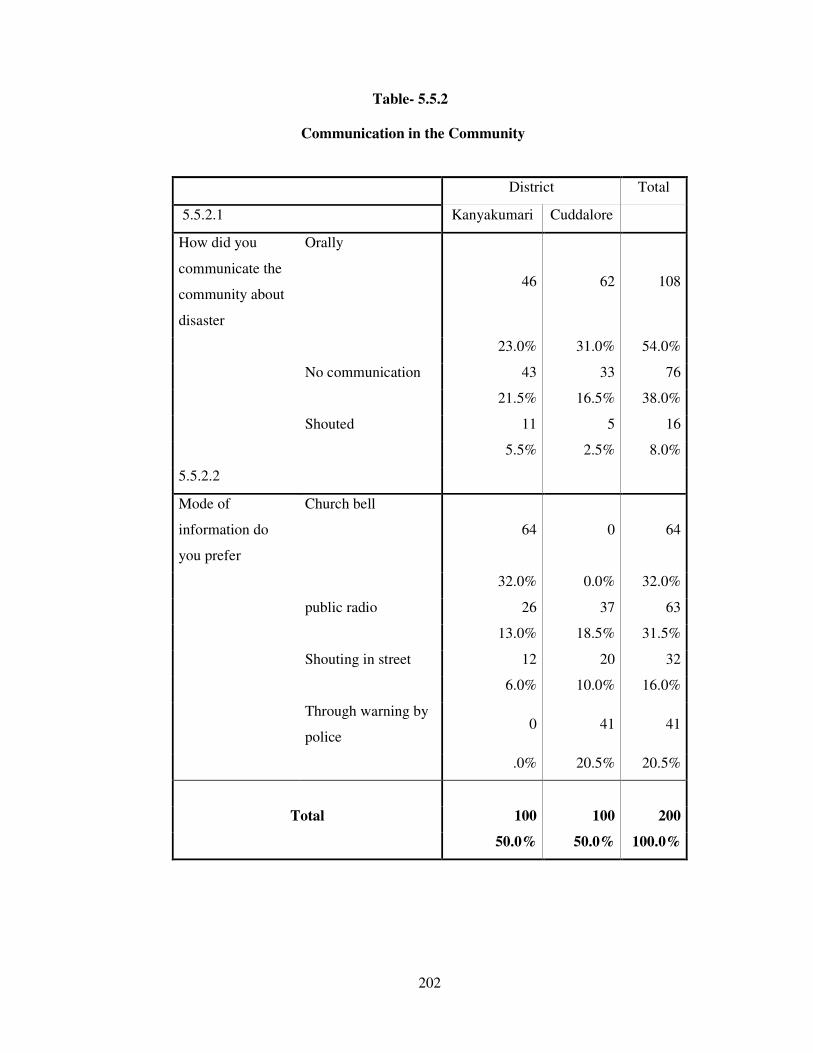
202
Table- 5.5.2
Communication in the Community
District Total
5.5.2.1 Kanyakumari Cuddalore
How did you
communicate the
community about
disaster
Orally
46 62 108
23.0% 31.0% 54.0%
No communication 43 33 76
21.5% 16.5% 38.0%
Shouted 11 5 16
5.5% 2.5% 8.0%
5.5.2.2
Mode of
information do
you prefer
Church bell
64 0 64
32.0% 0.0% 32.0%
public radio 26 37 63
13.0% 18.5% 31.5%
Shouting in street 12 20 32
6.0% 10.0% 16.0%
Through warning by
police 0 41 41
.0% 20.5% 20.5%
Total 100 100 200
50.0% 50.0% 100.0%
203
Table 5.5.2 presents the respondents’ means of communication in the study
districts.
5.5.2.1 presents that more than a half 54% of the total respondents reported
that they communicate orally. In district-wise comparison Cuddalore district more
number (62) communicate orally than Kanyakumari district (46).
5.5.2.2. indicates that about 32% of the total respondents preferred church bell
and public radio, respectively while another 20.5% through police. In district-wise
comparison in Cuddalore district more number (37) preferred public radio as means
for information than in Kanyakumari district (26).
It is understood that the majority of the respondents orally communicate to the
community on the disaster and given preference both to church bell and public radio
as means of communication.
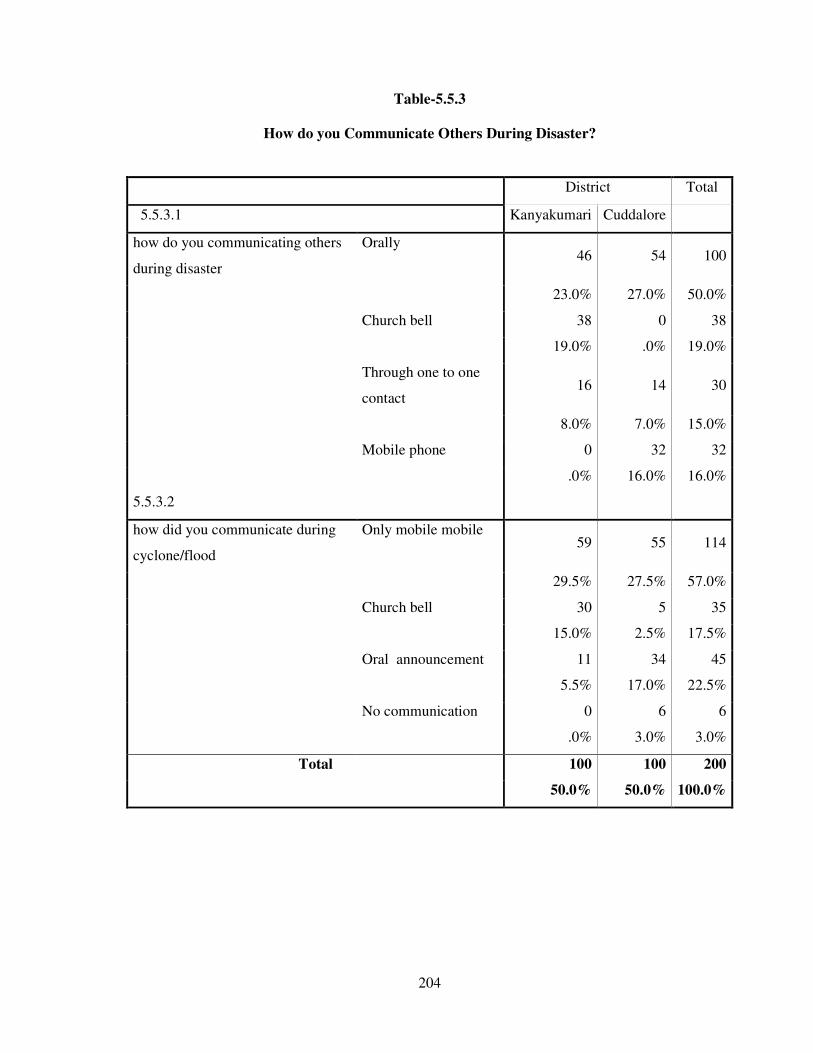
204
Table-5.5.3
How do you Communicate Others During Disaster?
District Total
5.5.3.1 Kanyakumari Cuddalore
how do you communicating others
during disaster
Orally 46 54 100
23.0% 27.0% 50.0%
Church bell 38 0 38
19.0% .0% 19.0%
Through one to one
contact 16 14 30
8.0% 7.0% 15.0%
Mobile phone 0 32 32
.0% 16.0% 16.0%
5.5.3.2
how did you communicate during
cyclone/flood
Only mobile mobile 59 55 114
29.5% 27.5% 57.0%
Church bell 30 5 35
15.0% 2.5% 17.5%
Oral announcement 11 34 45
5.5% 17.0% 22.5%
No communication 0 6 6
.0% 3.0% 3.0%
Total 100 100 200
50.0% 50.0% 100.0%
205
Table 5.5.3 indicates the respondents’ mode of communication during disaster.
5.5.3.1 presents that roughly a half (50%) of the total respondents reported
shouting towards others during disaster. In district-wise comparison Cuddalore
district more number (54) reported shouting towards others during disaster than in
Kanyakumari district (46).
5.5.3.2 reveals that nearly three-fifth (57%) of the total respondents
communicates through the mobile phone during cyclone/flood. In district-wise
comparison, in Kanyakumari district more number (59) reported that they
communicate through mobile phone during the flood/cyclone than in Cuddalore
district (55).
It is understood that the majority of the respondents communicate with others
orally during disaster and majority of them use mobile phone at the time of cyclone
and flood.
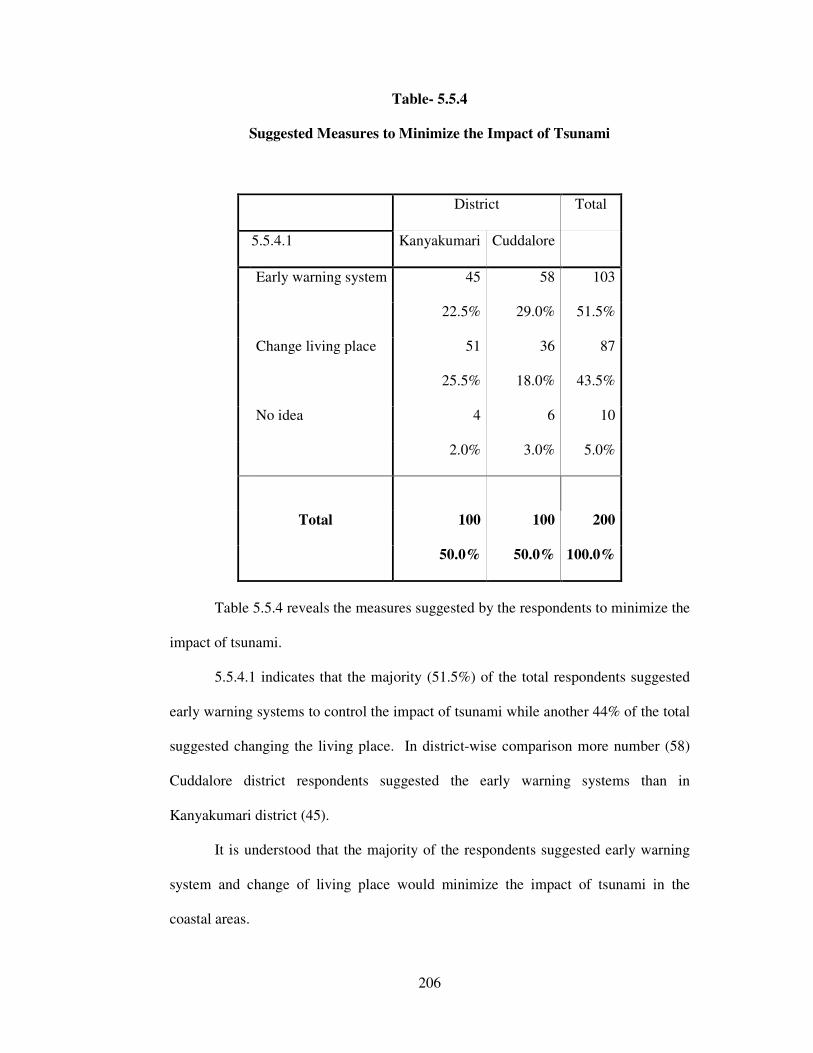
206
Table- 5.5.4
Suggested Measures to Minimize the Impact of Tsunami
District Total
5.5.4.1 Kanyakumari Cuddalore
Early warning system 45 58 103
22.5% 29.0% 51.5%
Change living place 51 36 87
25.5% 18.0% 43.5%
No idea 4 6 10
5.0% 2.0% 3.0%
Total 100 100 200
50.0% 50.0% 100.0%
Table 5.5.4 reveals the measures suggested by the respondents to minimize the
impact of tsunami.
5.5.4.1 indicates that the majority (51.5%) of the total respondents suggested
early warning systems to control the impact of tsunami while another 44% of the total
suggested changing the living place. In district-wise comparison more number (58)
Cuddalore district respondents suggested the early warning systems than in
Kanyakumari district (45).
It is understood that the majority of the respondents suggested early warning
system and change of living place would minimize the impact of tsunami in the
coastal areas.
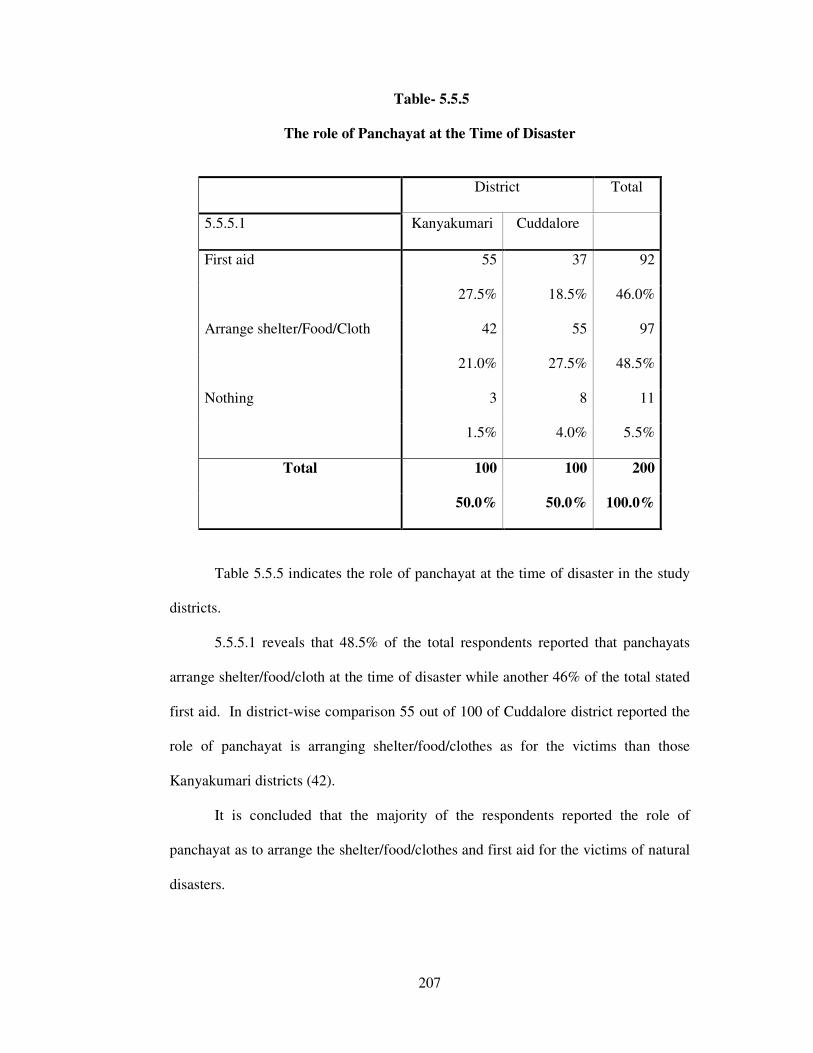
207
Table- 5.5.5
The role of Panchayat at the Time of Disaster
District Total
5.5.5.1 Kanyakumari Cuddalore
First aid 55 37 92
27.5% 18.5% 46.0%
Arrange shelter/Food/Cloth 42 55 97
21.0% 27.5% 48.5%
Nothing 3 8 11
1.5% 4.0% 5.5%
Total 100 100 200
50.0% 50.0% 100.0%
Table 5.5.5 indicates the role of panchayat at the time of disaster in the study
districts.
5.5.5.1 reveals that 48.5% of the total respondents reported that panchayats
arrange shelter/food/cloth at the time of disaster while another 46% of the total stated
first aid. In district-wise comparison 55 out of 100 of Cuddalore district reported the
role of panchayat is arranging shelter/food/clothes as for the victims than those
Kanyakumari districts (42).
It is concluded that the majority of the respondents reported the role of
panchayat as to arrange the shelter/food/clothes and first aid for the victims of natural
disasters.

208
Table-5.5.6
The Role of Panchayat/ GOs/NGOs to Control/Minimize the Disaster
District Total
5.5.6.1 Kanyakumari Cuddalore
Role of
Panchayat
No idea 24 26 50
12.0% 13.0% 25.0%
Weekly arrange village meeting
discussion for preparedness 50
25.0%
49
24.5%
99
49.5%
The GOs/NGOs to arrange EWS from
government 26 25 51
13.0% 12.5% 25.5%
5.5.6.2
Role of
GOs/NGOs
Give safety life 51 52 103
25.5% 26.0% 51.5%
Safe house 26 25 51
13.0% 12.5% 25.5%
Arrange regular occupation facilities 23 12 35
11.5% 6.0% 17.5%
Change the house to other side 0 10 10
.0% 5.0% 5.0%
No idea 0 1 1
.0% .5% .5%
Total 100 100 200
50.0% 50.0% 100.0%
209
Table 5.5.6 presents the respondents’ perception towards the role of panchayat
and GOs / NGOs to minimize the disaster.
5.5.6.1 reveals that nearly 50% of the total respondents reported that the
GO/NGOs give announcement and arrange village meetings and discussions about
preparedness, weekly; and nearly 26% expected GOs/NGOs arrange EWS in the
coastal areas.
5.5.6.2. Indicates that a half (51.5%) of the total respondents reported that
given GO/NGOs should ensure safety to fishermen while another 26% of the total
said that safe shelter would be given by GOs / NGOs.
It is understood that the majority of the respondents expected from the
panchayat to arrange village meetings and to create awareness about disaster to the
people and majority of them expected safety arrangements for life from GOs / NGOs.
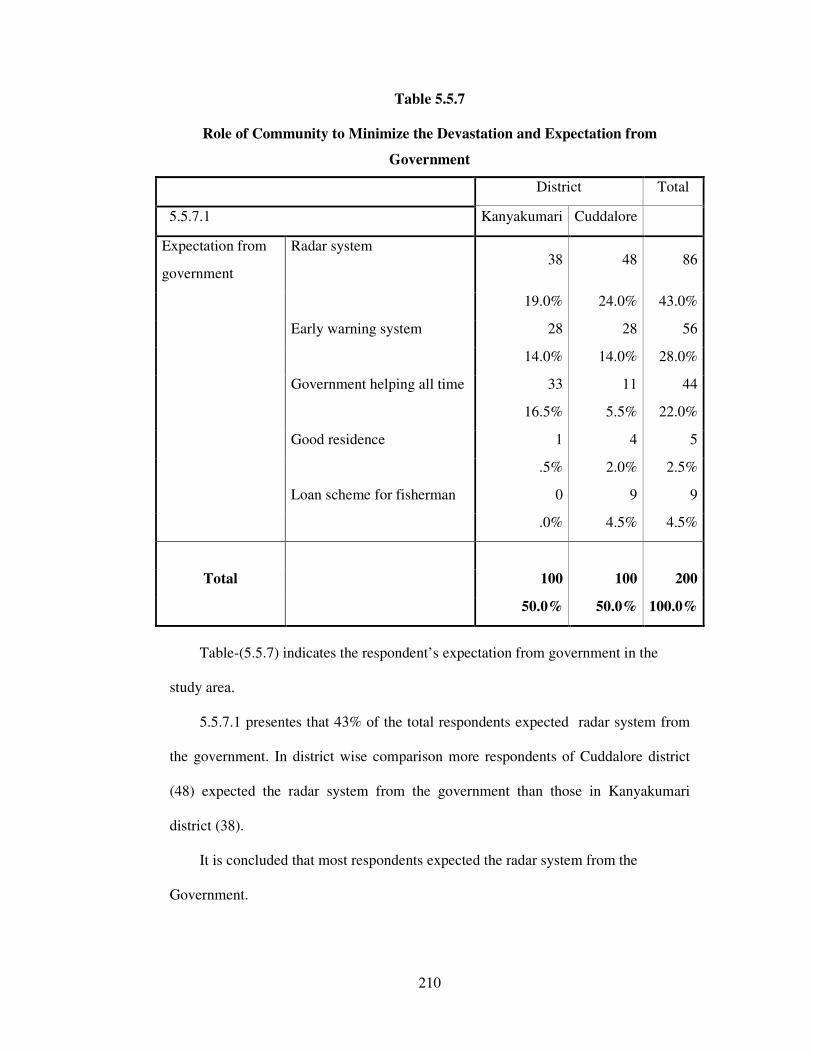
210
Table 5.5.7
Role of Community to Minimize the Devastation and Expectation from
Government
District Total
5.5.7.1 Kanyakumari Cuddalore
Expectation from
government
Radar system 38 48 86
19.0% 24.0% 43.0%
Early warning system 28 28 56
14.0% 14.0% 28.0%
Government helping all time 33 11 44
16.5% 5.5% 22.0%
Good residence 1 4 5
.5% 2.0% 2.5%
Loan scheme for fisherman 0 9 9
.0% 4.5% 4.5%
Total 100 100 200
50.0% 50.0% 100.0%
Table-(5.5.7) indicates the respondent’s expectation from government in the
study area.
5.5.7.1 presentes that 43% of the total respondents expected radar system from
the government. In district wise comparison more respondents of Cuddalore district
(48) expected the radar system from the government than those in Kanyakumari
district (38).
It is concluded that most respondents expected the radar system from the
Government.
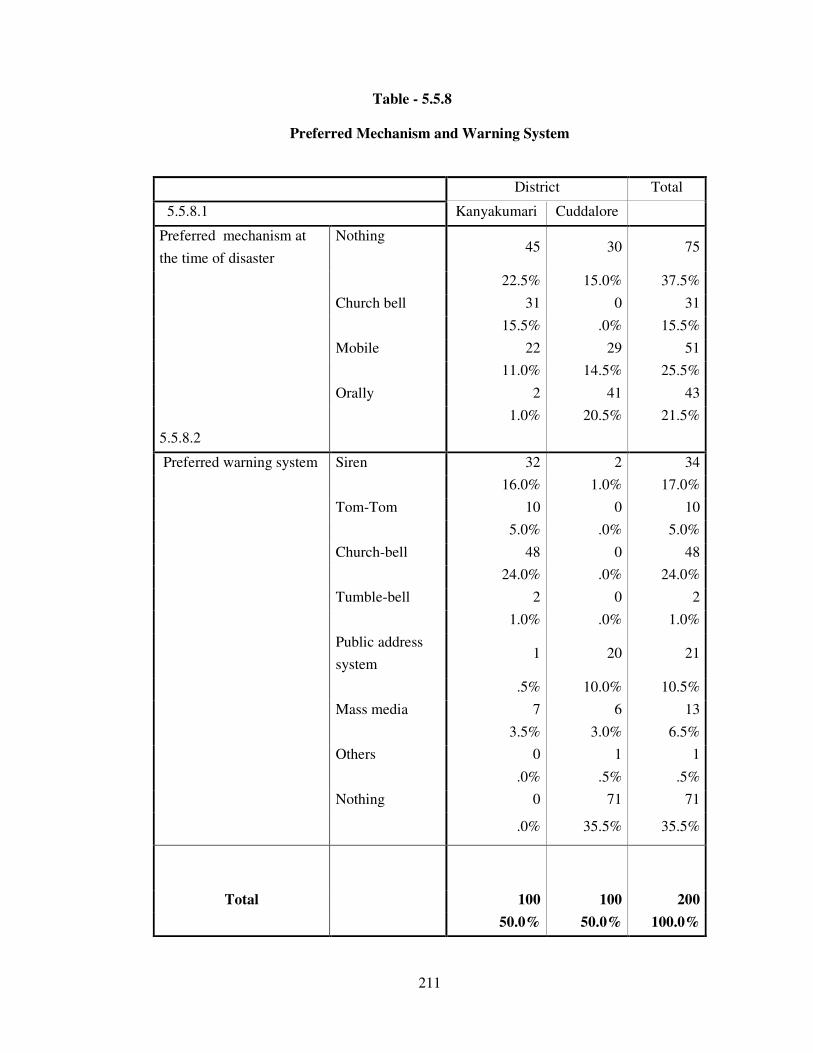
211
Table - 5.5.8
Preferred Mechanism and Warning System
District Total
5.5.8.1 Kanyakumari Cuddalore
Preferred mechanism at
the time of disaster
Nothing 45 30 75
22.5% 15.0% 37.5%
Church bell 31 0 31
15.5% .0% 15.5%
Mobile 22 29 51
11.0% 14.5% 25.5%
Orally 2 41 43
1.0% 20.5% 21.5%
5.5.8.2
Preferred warning system Siren 32 2 34
16.0% 1.0% 17.0%
Tom-Tom 10 0 10
5.0% .0% 5.0%
Church-bell 48 0 48
24.0% .0% 24.0%
Tumble-bell 2 0 2
1.0% .0% 1.0%
Public address
system 1 20 21
.5% 10.0% 10.5%
Mass media 7 6 13
3.5% 3.0% 6.5%
Others 0 1 1
.0% .5% .5%
Nothing 0 71 71
.0% 35.5% 35.5%
Total 100 100 200
50.0% 50.0% 100.0%
212
Table 5.5.8 reveals the respondents preference towards mechanism of warning
system in the study districts.
5.5.8.1 shows that about 38% of the total respondents did not prefer
mechanism for warning at the time of disaster. In district-wise comparison their
proportion found to be more in Kanyakumari district (45) than Cuddalore district.
5.5.8.2 presents that nearly 36% of the respondents reported that no warning
system preferred at the time of disaster however the remaining required warning
systems like church bell (24%), siren (17%), public address system (11%) and the
like.
It is understood that most of the total respondents did not prefer any mechanism
at the time of disaster; however, the remaining reported their preferences for various
warning systems at the time of disaster as stated above.
.
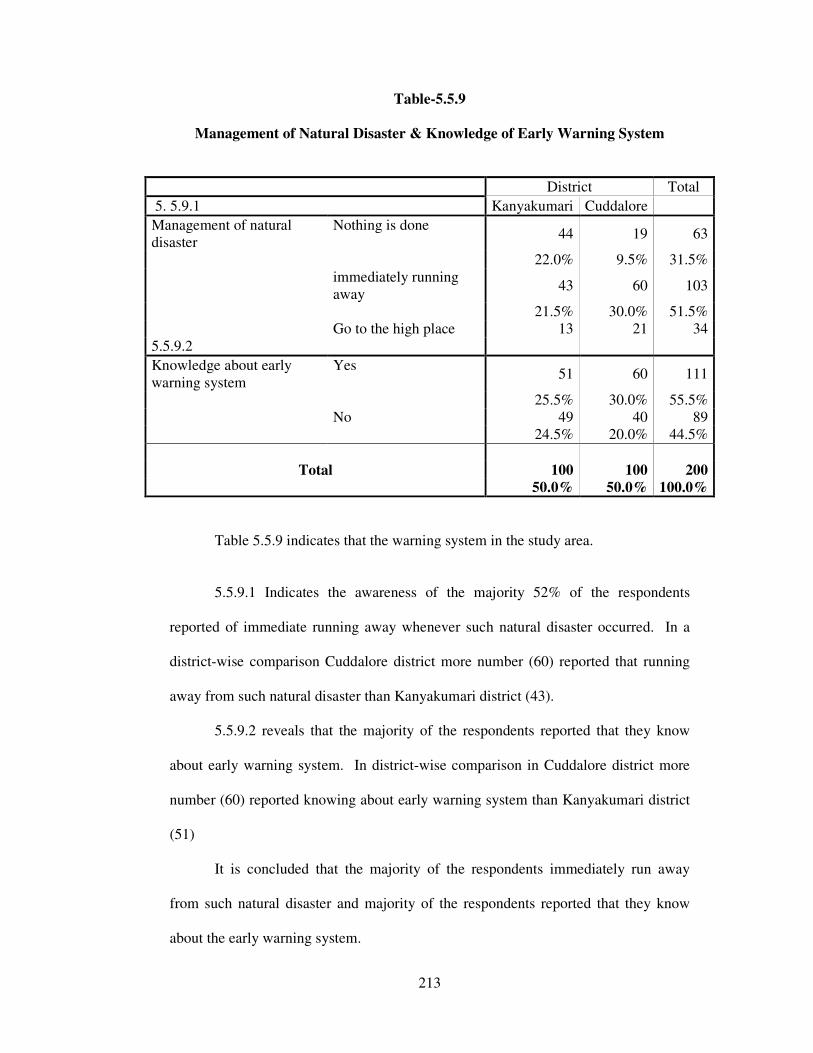
213
Table-5.5.9
Management of Natural Disaster & Knowledge of Early Warning System
District Total
5. 5.9.1 Kanyakumari Cuddalore
Management of natural disaster
Nothing is done 44 19 63
22.0% 9.5% 31.5% immediately running
away 43 60 103
21.5% 30.0% 51.5% Go to the high place 13 21 34 5.5.9.2
Knowledge about early warning system
Yes 51 60 111
25.5% 30.0% 55.5% No 49 40 89 24.5% 20.0% 44.5%
Total 100 100 200
50.0% 50.0% 100.0%
Table 5.5.9 indicates that the warning system in the study area.
5.5.9.1 Indicates the awareness of the majority 52% of the respondents
reported of immediate running away whenever such natural disaster occurred. In a
district-wise comparison Cuddalore district more number (60) reported that running
away from such natural disaster than Kanyakumari district (43).
5.5.9.2 reveals that the majority of the respondents reported that they know
about early warning system. In district-wise comparison in Cuddalore district more
number (60) reported knowing about early warning system than Kanyakumari district
(51)
It is concluded that the majority of the respondents immediately run away
from such natural disaster and majority of the respondents reported that they know
about the early warning system.
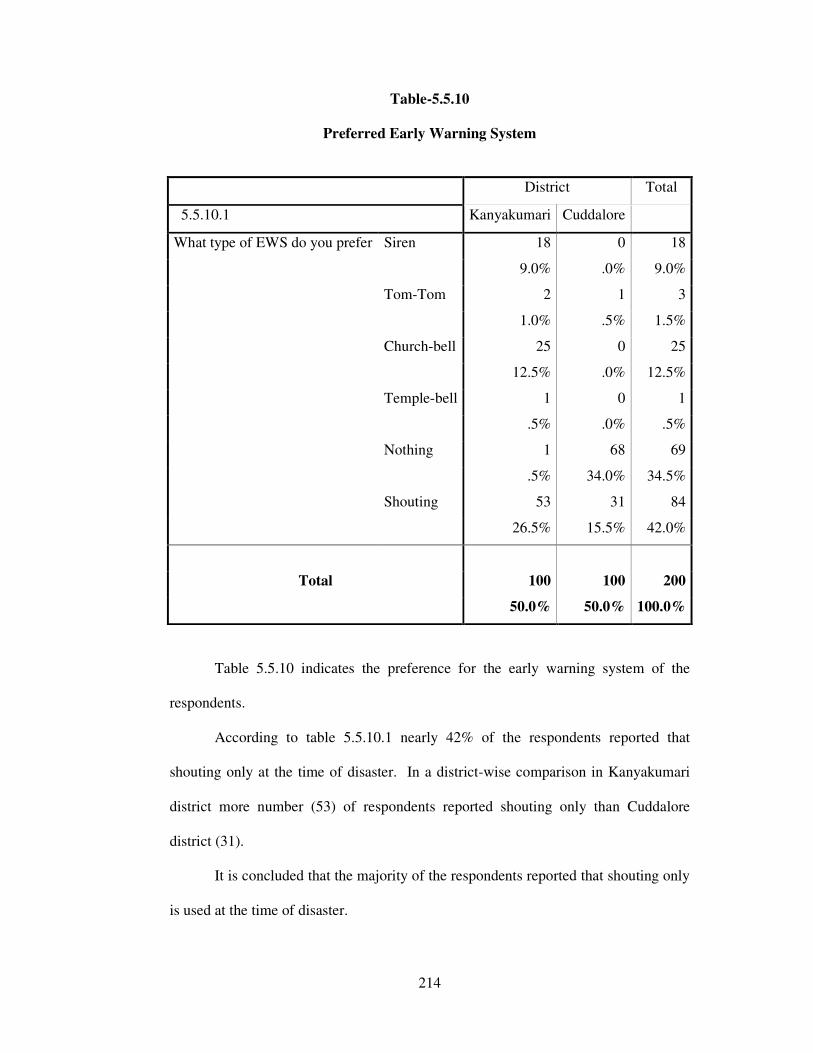
214
Table-5.5.10
Preferred Early Warning System
District Total
5.5.10.1 Kanyakumari Cuddalore
What type of EWS do you prefer Siren 18 0 18
9.0% .0% 9.0%
Tom-Tom 2 1 3
1.0% .5% 1.5%
Church-bell 25 0 25
12.5% .0% 12.5%
Temple-bell 1 0 1
.5% .0% .5%
Nothing 1 68 69
.5% 34.0% 34.5%
Shouting 53 31 84
26.5% 15.5% 42.0%
Total 100 100 200
50.0% 50.0% 100.0%
Table 5.5.10 indicates the preference for the early warning system of the
respondents.
According to table 5.5.10.1 nearly 42% of the respondents reported that
shouting only at the time of disaster. In a district-wise comparison in Kanyakumari
district more number (53) of respondents reported shouting only than Cuddalore
district (31).
It is concluded that the majority of the respondents reported that shouting only
is used at the time of disaster.
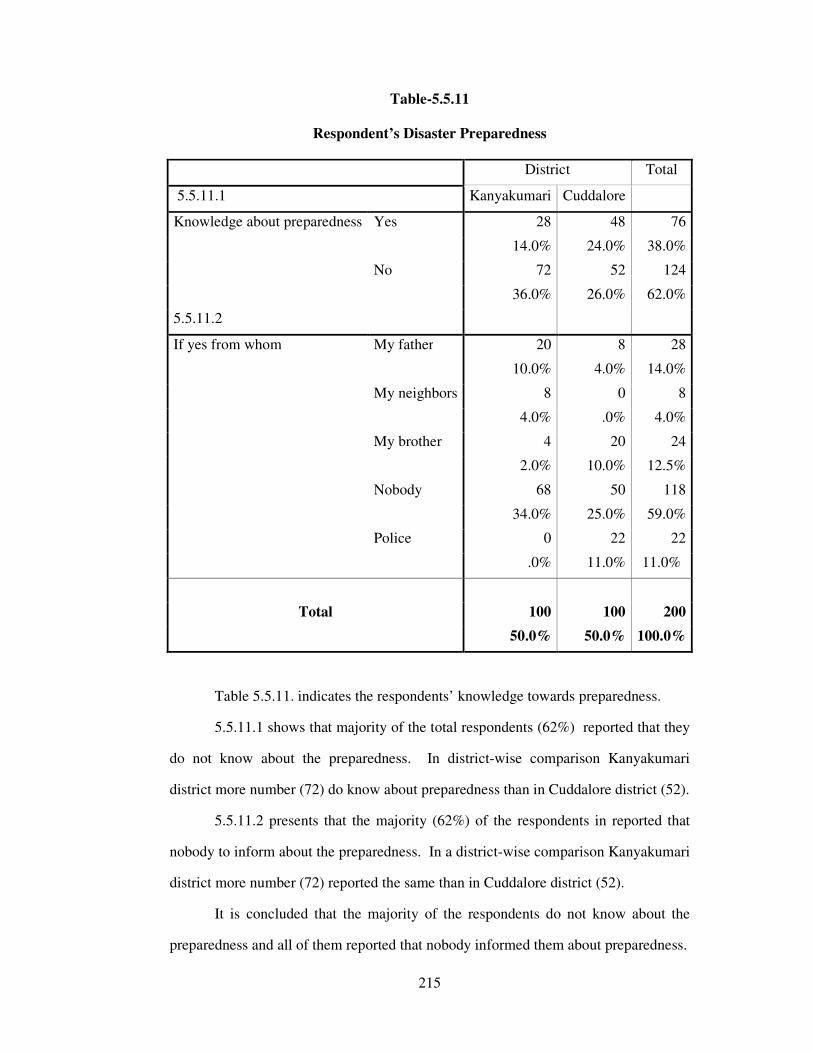
215
Table-5.5.11
Respondent’s Disaster Preparedness
District Total
5.5.11.1 Kanyakumari Cuddalore
Knowledge about preparedness Yes 28 48 76
14.0% 24.0% 38.0%
No 72 52 124
36.0% 26.0% 62.0%
5.5.11.2
If yes from whom My father 20 8 28
10.0% 4.0% 14.0%
My neighbors 8 0 8
4.0% .0% 4.0%
My brother 4 20 24
2.0% 10.0% 12.5%
Nobody 68 50 118
34.0% 25.0% 59.0%
Police 0 22 22
.0% 11.0% 11.0%
Total 100 100 200
50.0% 50.0% 100.0%
Table 5.5.11. indicates the respondents’ knowledge towards preparedness.
5.5.11.1 shows that majority of the total respondents (62%) reported that they
do not know about the preparedness. In district-wise comparison Kanyakumari
district more number (72) do know about preparedness than in Cuddalore district (52).
5.5.11.2 presents that the majority (62%) of the respondents in reported that
nobody to inform about the preparedness. In a district-wise comparison Kanyakumari
district more number (72) reported the same than in Cuddalore district (52).
It is concluded that the majority of the respondents do not know about the
preparedness and all of them reported that nobody informed them about preparedness.
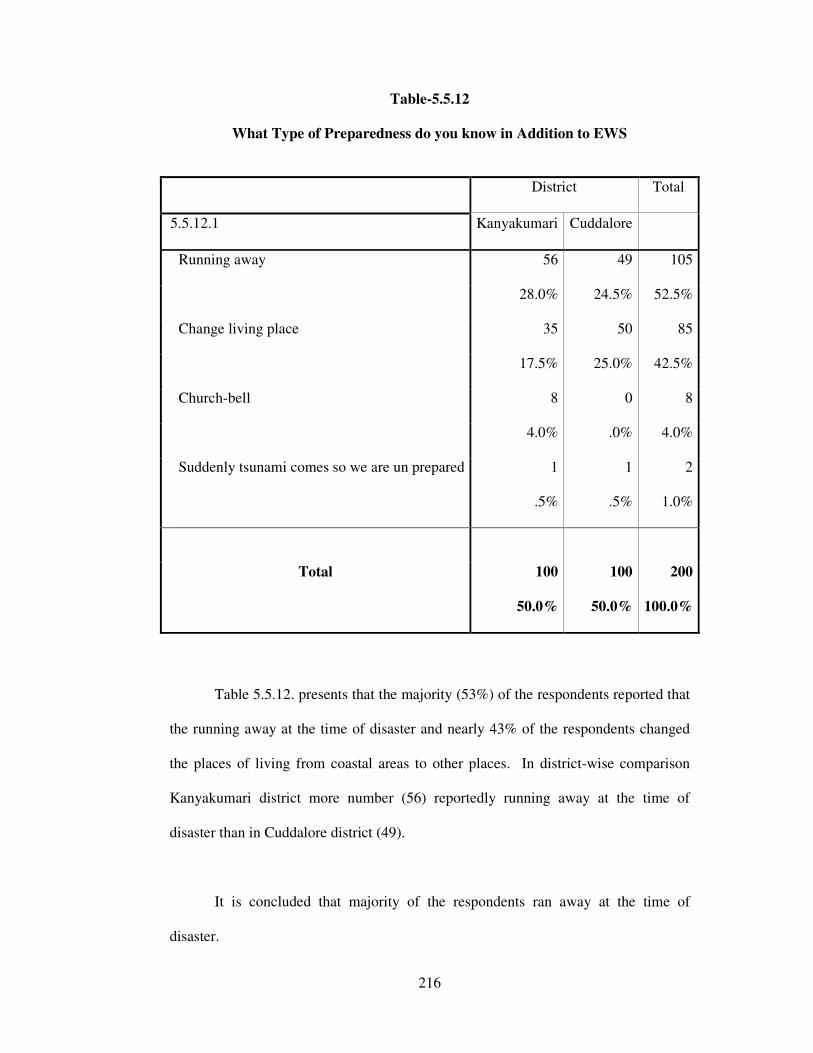
216
Table-5.5.12
What Type of Preparedness do you know in Addition to EWS
District Total
5.5.12.1 Kanyakumari Cuddalore
Running away 56 49 105
28.0% 24.5% 52.5%
Change living place 35 50 85
17.5% 25.0% 42.5%
Church-bell 8 0 8
4.0% .0% 4.0%
Suddenly tsunami comes so we are un prepared 1 1 2
.5% .5% 1.0%
Total 100 100 200
50.0% 50.0% 100.0%
Table 5.5.12. presents that the majority (53%) of the respondents reported that
the running away at the time of disaster and nearly 43% of the respondents changed
the places of living from coastal areas to other places. In district-wise comparison
Kanyakumari district more number (56) reportedly running away at the time of
disaster than in Cuddalore district (49).
It is concluded that majority of the respondents ran away at the time of
disaster.
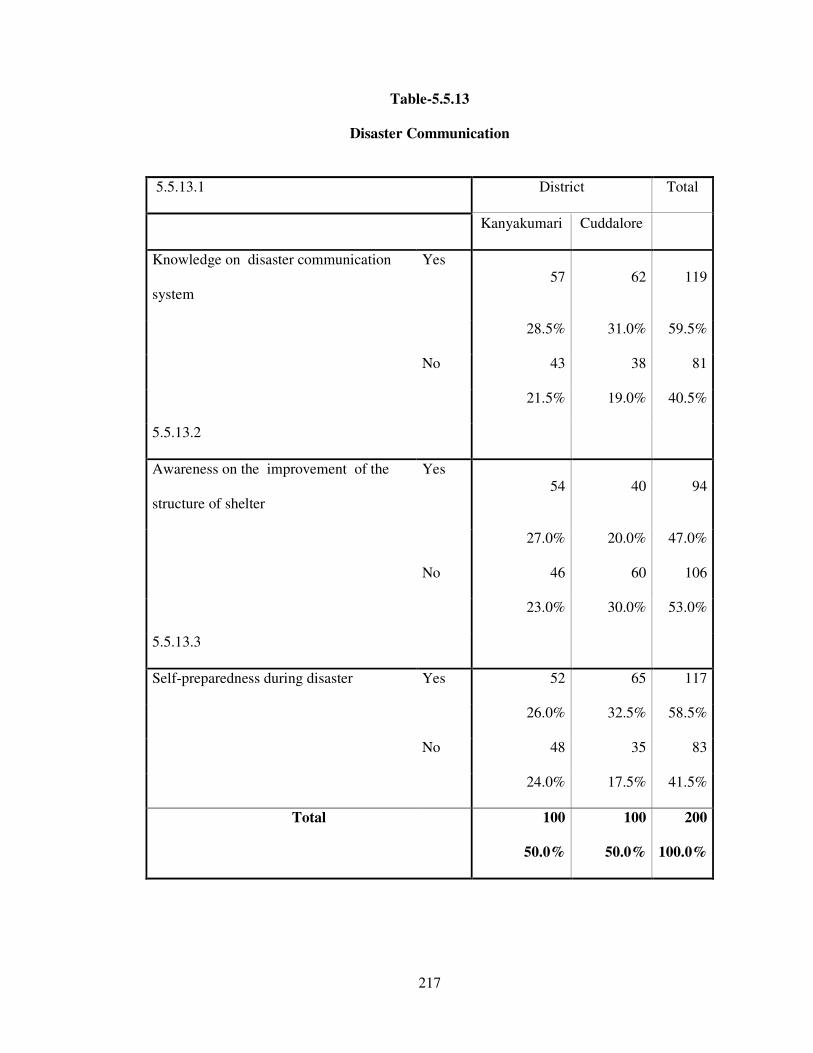
217
Table-5.5.13
Disaster Communication
5.5.13.1 District Total
Kanyakumari Cuddalore
Knowledge on disaster communication
system
Yes 57 62 119
28.5% 31.0% 59.5%
No 43 38 81
21.5% 19.0% 40.5%
5.5.13.2
Awareness on the improvement of the
structure of shelter
Yes 54 40 94
27.0% 20.0% 47.0%
No 46 60 106
23.0% 30.0% 53.0%
5.5.13.3
Self-preparedness during disaster Yes 52 65 117
26.0% 32.5% 58.5%
No 48 35 83
24.0% 17.5% 41.5%
Total 100 100 200
50.0% 50.0% 100.0%
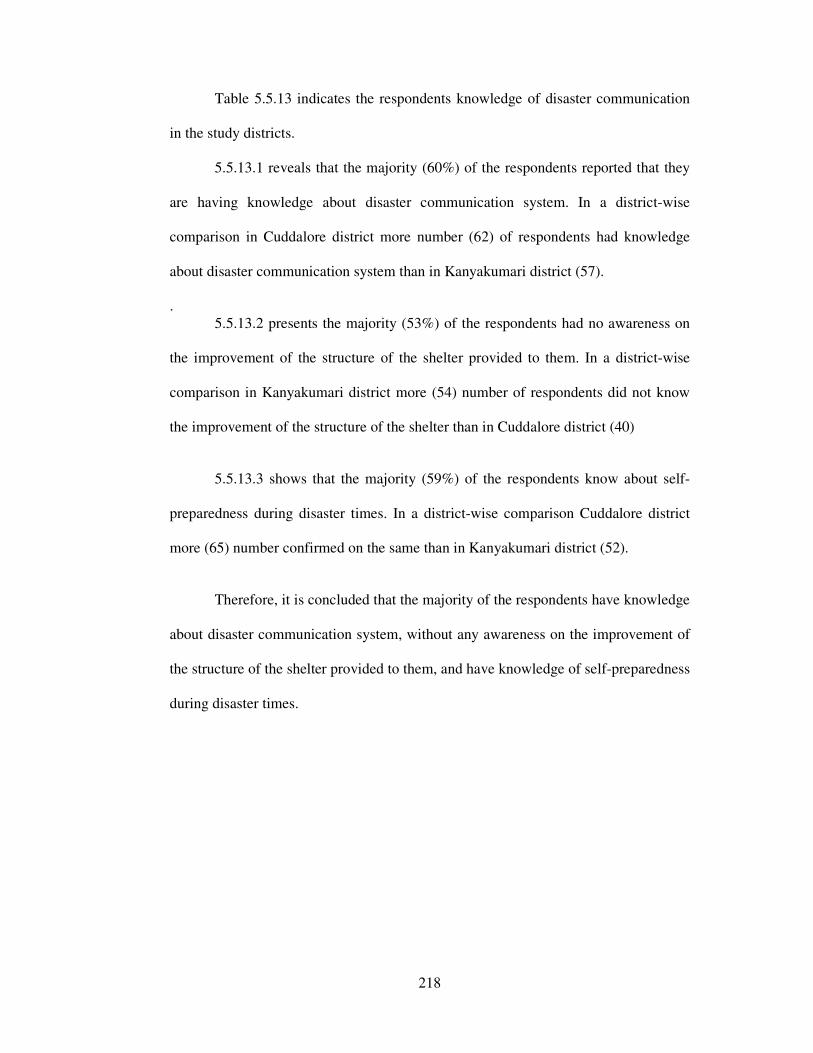
218
Table 5.5.13 indicates the respondents knowledge of disaster communication
in the study districts.
5.5.13.1 reveals that the majority (60%) of the respondents reported that they
are having knowledge about disaster communication system. In a district-wise
comparison in Cuddalore district more number (62) of respondents had knowledge
about disaster communication system than in Kanyakumari district (57).
. 5.5.13.2 presents the majority (53%) of the respondents had no awareness on
the improvement of the structure of the shelter provided to them. In a district-wise
comparison in Kanyakumari district more (54) number of respondents did not know
the improvement of the structure of the shelter than in Cuddalore district (40)
5.5.13.3 shows that the majority (59%) of the respondents know about self-
preparedness during disaster times. In a district-wise comparison Cuddalore district
more (65) number confirmed on the same than in Kanyakumari district (52).
Therefore, it is concluded that the majority of the respondents have knowledge
about disaster communication system, without any awareness on the improvement of
the structure of the shelter provided to them, and have knowledge of self-preparedness
during disaster times.

219
Table-5.5.14
Climatic Change after Tsunami
District Total
5.5.14.1 Kanyakumari Cuddalore
Any climatic change after
tsunami
Yes 68 62 130
34.0% 31.0% 65.0%
No 32 38 70
16.0% 19.0% 35.0%
5.5.14.2
if yes what are the changes High waves 27 20 47
13.5% 10.0% 23.5%
Sudden rain 34 39 73
17.0% 19.5% 36.5%
Over sun
light 3 2 5
1.5% 1.0% 2.5%
Sea water
increasing 4 1 5
2.0% .5% 2.5%
No change 32 38 70
16.0% 19.0% 35.0%
Total 100 100 200
50.0% 50.0% 100.0%
Table 5.5.14 presents the particulars of climatic change after tsunami.
5.5.14.1 reveals that the majority (65%) of respondents reported of climatic
change there after tsunami.
5.5.14.2 indicates more number (36%) of respondents stated that sudden rain
occurs due to change in the climate and 24% of the respondents reported high waves
from sea due to the climatic changes.
It is concluded climatic change occurred and sudden occurrence of rain due to
climatic changes.
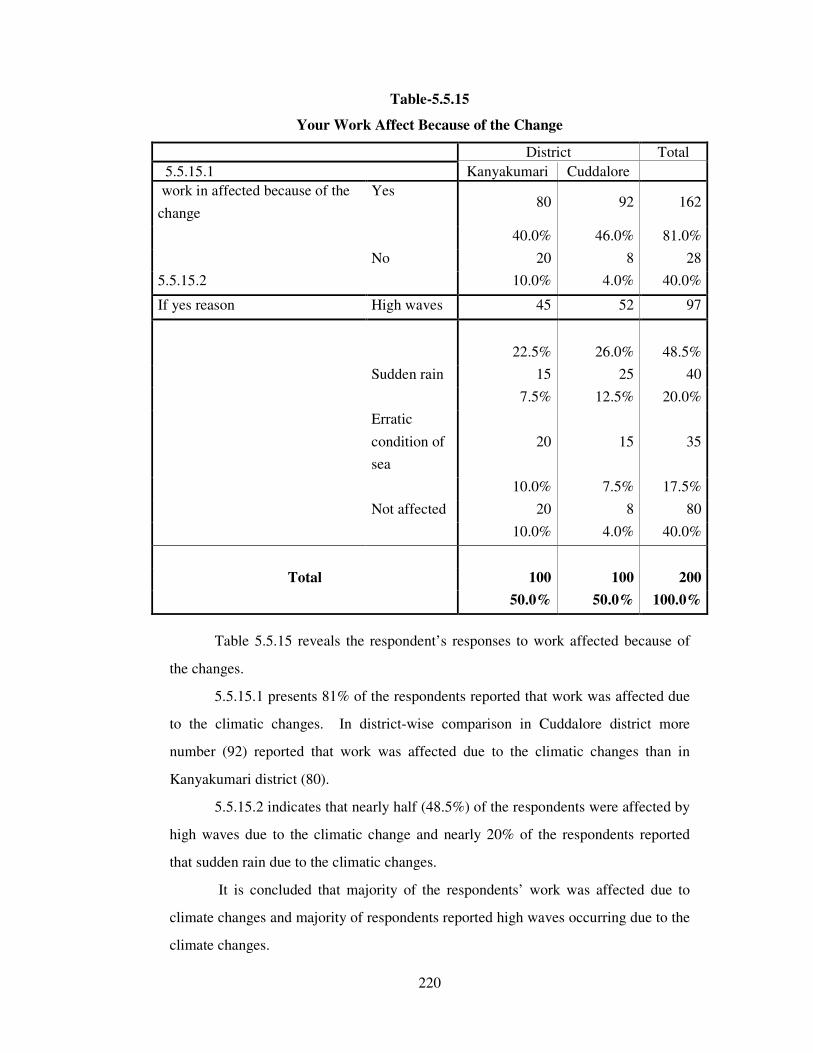
220
Table-5.5.15
Your Work Affect Because of the Change
District Total
5.5.15.1 Kanyakumari Cuddalore
work in affected because of the
change
Yes 80 92 162
40.0% 46.0% 81.0%
No 20 8 28
5.5.15.2 10.0% 4.0% 40.0%
If yes reason High waves 45 52 97
22.5% 26.0% 48.5%
Sudden rain 15 25 40
7.5% 12.5% 20.0%
Erratic
condition of
sea
20 15 35
10.0% 7.5% 17.5%
Not affected 20 8 80
10.0% 4.0% 40.0%
Total 100 100 200
50.0% 50.0% 100.0%
Table 5.5.15 reveals the respondent’s responses to work affected because of
the changes.
5.5.15.1 presents 81% of the respondents reported that work was affected due
to the climatic changes. In district-wise comparison in Cuddalore district more
number (92) reported that work was affected due to the climatic changes than in
Kanyakumari district (80).
5.5.15.2 indicates that nearly half (48.5%) of the respondents were affected by
high waves due to the climatic change and nearly 20% of the respondents reported
that sudden rain due to the climatic changes.
It is concluded that majority of the respondents’ work was affected due to
climate changes and majority of respondents reported high waves occurring due to the
climate changes.
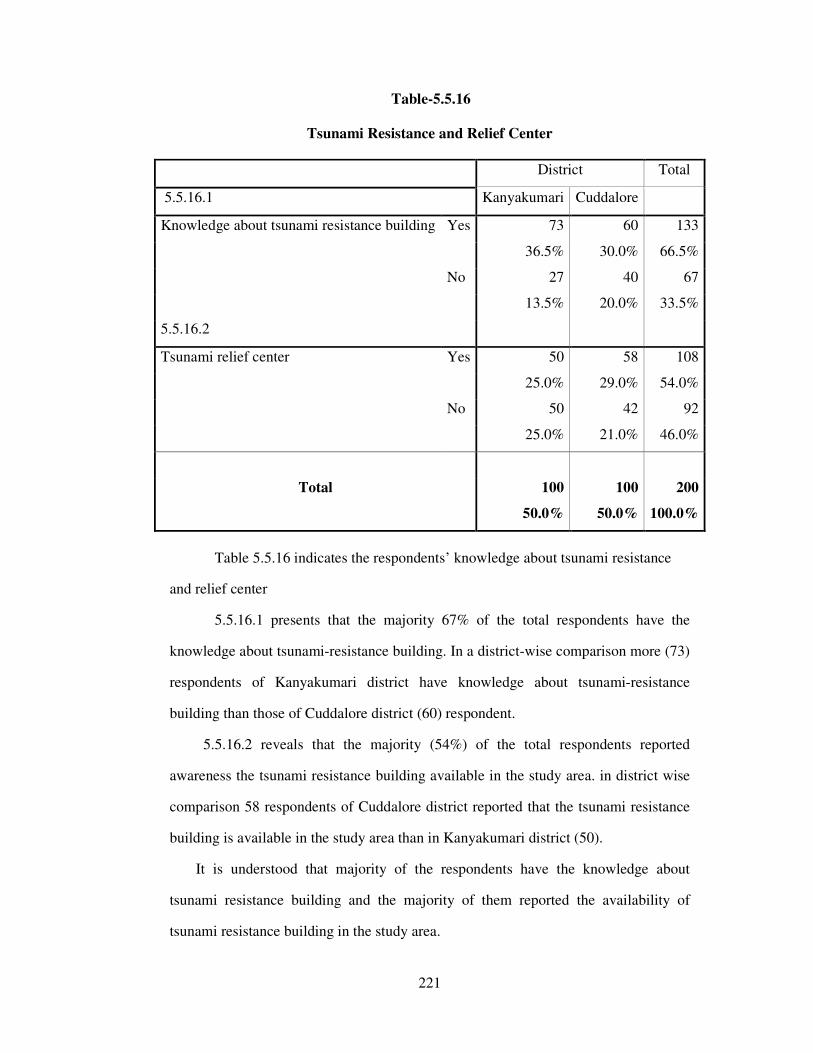
221
Table-5.5.16
Tsunami Resistance and Relief Center
District Total
5.5.16.1 Kanyakumari Cuddalore
Knowledge about tsunami resistance building Yes 73 60 133
36.5% 30.0% 66.5%
No 27 40 67
13.5% 20.0% 33.5%
5.5.16.2
Tsunami relief center Yes 50 58 108
25.0% 29.0% 54.0%
No 50 42 92
25.0% 21.0% 46.0%
Total 100 100 200
50.0% 50.0% 100.0%
Table 5.5.16 indicates the respondents’ knowledge about tsunami resistance
and relief center
5.5.16.1 presents that the majority 67% of the total respondents have the
knowledge about tsunami-resistance building. In a district-wise comparison more (73)
respondents of Kanyakumari district have knowledge about tsunami-resistance
building than those of Cuddalore district (60) respondent.
5.5.16.2 reveals that the majority (54%) of the total respondents reported
awareness the tsunami resistance building available in the study area. in district wise
comparison 58 respondents of Cuddalore district reported that the tsunami resistance
building is available in the study area than in Kanyakumari district (50).
It is understood that majority of the respondents have the knowledge about
tsunami resistance building and the majority of them reported the availability of
tsunami resistance building in the study area.

222
Table-5.5.17
Respondents’ Opinion towards Removing Huts from Costal Area
District Total
5.5.17.1 Kanyakumari Cuddalore
Not to be removed 39 50 89
19.5% 25.0% 44.5%
Make a hut away from the coastal area 50 48 98
25.0% 24.0% 49.0%
Give strong building 10 2 12
5.0% 1.0% 6.0%
no use to fisherman 1 0 1
.5% .0% .5%
Total 100 100 200
50.0% 50.0% 100.0%
Table 5.5.17 reveals the respondents’ opinion towards the removal of huts
from the coastal areas.
5.5.17.1 indicates that about half 49% of the total respondents experienced the
need for a hut away from the coastal area to reduce disaster while 44.5% of the total
reported their unwillingness to remove huts from the coastal area because work would
be affected through the removal of huts since they cannot save the boat and net for
timely venturing in to the sea for fishing.
It is concluded that while about a half of the total respondents of the study
districts demanded to construct huts away from the coastal area to reduce the disaster,
the remaining resisted.
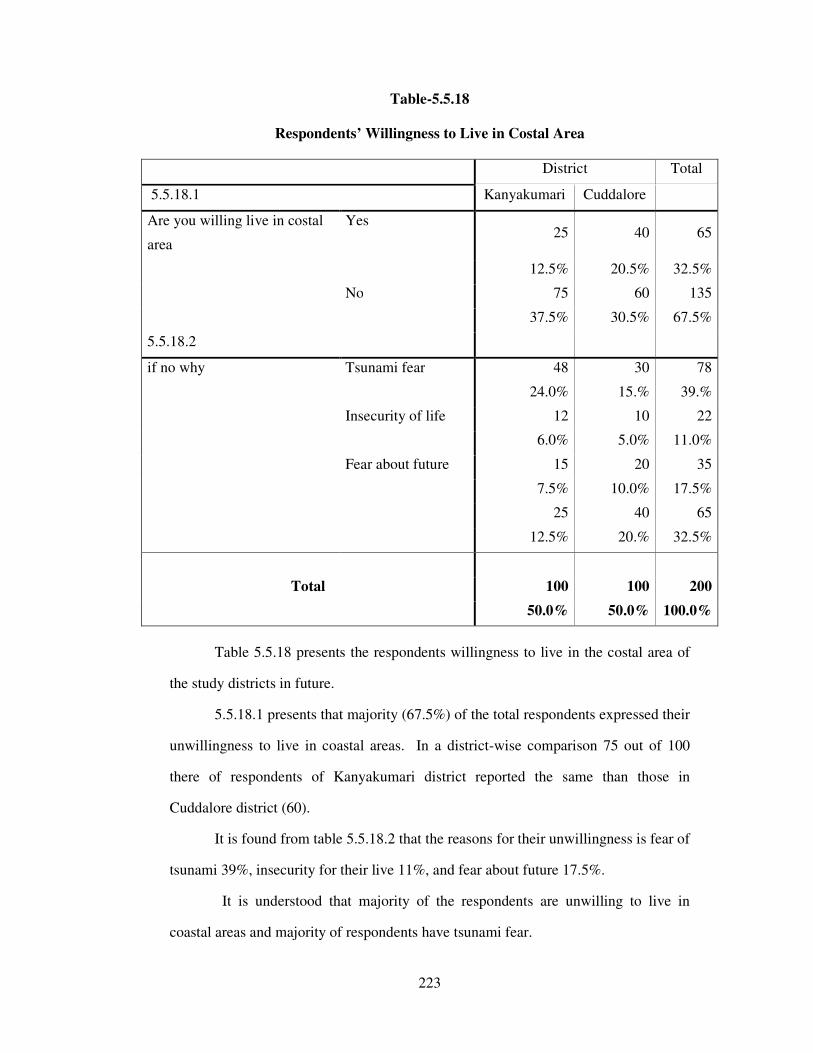
223
Table-5.5.18
Respondents’ Willingness to Live in Costal Area
District Total
5.5.18.1 Kanyakumari Cuddalore
Are you willing live in costal
area
Yes 25 40 65
12.5% 20.5% 32.5%
No 75 60 135
37.5% 30.5% 67.5%
5.5.18.2
if no why Tsunami fear 48 30 78
24.0% 15.% 39.%
Insecurity of life 12 10 22
6.0% 5.0% 11.0%
Fear about future 15 20 35
7.5% 10.0% 17.5%
25 40 65
12.5% 20.% 32.5%
Total 100 100 200
50.0% 50.0% 100.0%
Table 5.5.18 presents the respondents willingness to live in the costal area of
the study districts in future.
5.5.18.1 presents that majority (67.5%) of the total respondents expressed their
unwillingness to live in coastal areas. In a district-wise comparison 75 out of 100
there of respondents of Kanyakumari district reported the same than those in
Cuddalore district (60).
It is found from table 5.5.18.2 that the reasons for their unwillingness is fear of
tsunami 39%, insecurity for their live 11%, and fear about future 17.5%.
It is understood that majority of the respondents are unwilling to live in
coastal areas and majority of respondents have tsunami fear.

224
CHAPTER-VI
SUMMARY OF MAJOR FINDINGS
AND CONCLUSION
1. Significant majorities (71%) of the respondents are males and 64% of them come
under the age group of 32-47.
2. It is found that all the respondents who are engaged in fishing and allied activities
belong to most backward communities.
3. Majority (77%) of the respondents from both districts are illiterates and
significant (91.5%) of the respondents are involved in fishing as primary
occupation. The low educational status of the respondents is associated with the
coastal occupation namely fishing.
4. All the respondents (100%) in the study districts are married and majority (82%)
of the respondents live in the nuclear family.
5. The structures of house of all the respondents’ (100%) are pucca and nearly
(35%) of houses are built by the PMSSS (Pondicherry Multi Purpose Social
Service Society).
6. A significant number (55%) of the respondents do not remarry before tsunami in
Kanyakumari district and majority (65%) of the respondents remarried after
tsunami in Cuddalore district.
7. The dowry practices are widely prevailing among respondent in the study
districts and more number (34%) of respondents reported that the dowry
materials are jewels/vessels/two wheeler/cash etc.
8. Majority (53%) of the respondents are having a monthly income of Rs.8000 and
above.

225
9. Majority belong to (52%) the respondents have reported that the monthly
expenditure is Rs.10001-15000/- per month
10. Majority (50.5%) belong to two different castes in the Cuddalore district and
nearly (49.5%) to only one caste in the Cuddalore district and majority (53%)
status that caste based organizations not available in Kanyakumari district the
majority (54.5%) of respondents says that no idea about role for organization in
Cuddalore.
11. Significant number (100%) of the respondents are Christians and Hindus in the
study districts and through majority (52%) of the respondents are attending other
religious festivals majority of the respondents are not celebrating the other
religious festivals. and there is no discrimination based on religion.
12. Majority (66%) of the respondents reported of no religious problems in the study
area and more respondent reported that religious domination is there in the study
districts because Kanyakumari district has Christian domination and Cuddalore
district has Hindu domination. Majority of the respondents are reported of no
religious conversion in the study area.
13. Majority (80%) of the people celebrates village functions and all the people
celebrate the Christian and Hindu functions in the study districts and the all
respondents celebrate all the functions.
14. Majority (64%) of the respondents are involved in social organization working
in their village.
15. Significant majority (74%) of the respondents say that SHGs work in the study
districts and the majority (67%) of the respondents say that SHG work for
women development and create self employment for them.
226
16. Majority (56%) of the respondents reported that the youth clubs are working in
the village and more number say that youth club do involve in voluntary work
during festival time
17. Majority (56%) of respondents belongs to DMK party and reported that the
caste-class relationship is good.
18. While the respondents of Kanyakumari district take one day for fishing, and two
days are spent on the sea by Cuddalore district respondents.
19. More employment has been availed from March to April to the respondents while
June to September stands as off season for fishing in the study districts.
20. It is noted that more respondent (25.5%) catch the valzh fish because it is
seasonal variety.
21. All the (100%) respondents contribute to exporting fish in both the districts and
majority of them export through contractors.
22. Dipping fishes into salt is a preservative method for the respondents of both the
districts however, two-fifths (41%) of the total respondents are not interested in
dry fish during rainy seasons.
23. It is found that the fishermen of Kanyakumari district have access to marketing
facilities while Cuddalore district are not.
24. Majority (55%) of the women are helping in fish selling and involved are in the
preparation of sea food and majority of the total respondents treat women equally
on par with them.
25. Majority (70%) of respondents of both districts celebrates coastal festivals and
majority (55.5%) of them reported that such festivals are participated by non-
coastal people.

227
26. Majority (67%) of the respondents is aware of the risks in fishing and all of them
are facing risk from big waves, rain, cyclone and even larger fishes.
27. Majority (69.5%) of the respondents reported that they vote in the election time
and majority (77.5%) of the respondent cast their vote for the party to which they
belong.
28. Majority (75%) of the respondents of the study districts are not excluded from
their community, religion and never subjected to exploitation in term of wages
Therefore it is concluded that the respondents are not subjected to exclusion in
the study area.
29. Most (56%) of the respondents of the study districts, especially in the
Kanyakumari district (36.5%) are exploited by moneylenders by charging meter /
compound interest.
30. Majority (56%) of respondents reported that there is no exploitation by
government officers more number (39%) reported that there is delay in the
delivery of relief by government officers.
31. Majority of the respondents opined that improvement in social and economic
conditions would alone prevent exclusion in future.
32. Majority (66%) of the respondents got relief materials not properly and the rest
have no idea about the distribution of relief and rehabilitation measures.
33. Majority (52%) of the respondents reported that there is no corruption during the
distribution. However, the interference of village leaders, and their relatives and
members of political parties and panchayat leaders was prevalent in the study
area.
34. Majority (67%) of the respondents reported that the violence was there at the
time of distribution of relief materials to the people in the study districts.

228
35. Majority (67%) of the respondent/victims are provided with houses in the study
districts.
36. About three-fifths (57.5%) of the total are satisfied about the quality of the house
while the remaining expressed their dissatisfaction and reported various reasons
for the same.
37. More than two-third (68.5%) of the total respondents are satisfied about the
quality of the boat and while the remaining expressed their dissatisfaction for
various reasons.
38. Majority (74%) of the respondents has knowledge about the natural disaster and
it is found that the cyclone is the frequently affecting disaster in the coastal areas
of the study districts.
39. Majority (54.5%) of people passed on the information through one to one oral
communication about disaster and majority (55.5%) of respondents reported that
GOs/NGOs are confined to providing safety shelter for prevention and control
activities in the study area.
40. Majority (51%) of respondents reported that they are more affected by disasters
like flood.
41. Most (55%) of the respondents received warning through media and mobile
phone and small proportion of the total have radio with them for the purpose of
alerts.
42. More number of respondents preferred moving to safer places. About 30% of the
respondents received warnings through radio.
43. Majority (59%) of the respondents perceived that it is dangerous to live in coastal
areas and majority (51.5%) of them face flood and storm after tsunami.

229
44. Majority (39.5%) of the respondents moved to the safer places at the time of
flood and they did nothing to save their huts.
45. All (100%) the respondents suffered from one or the other disease.
46. Majority (61.5%) of the respondents reported that the climate change was
responsible for the disaster and they felt that heavy rain had occurred though they
are staying in pucca shelter.
47. Only a half of the total respondents are informed of tsunami. Majority (55%) of
the respondents reported that earthquake and volcano eruption under the sea were
the causes for tsunami; majority (61.5%) changed habitation due to tsunami and
subsequently, majority (50.5%) of them had returned to normal life.
48. Majority (61.5%) of the respondents were fearful of going into the sea after the
tsunami and majority (74%) of the respondents are afraid of going into the sea
even now.
49. Majority (60%) of them knows about the weather reports and knew about
volcano and volcanic eruption.
50. Majority (72%) of the respondents knew about how tsunami occurred and they
are having knowledge about global warming; and most of them reported that
changes in the sea occur during January-February.
51. Majority (65%) of them reported that no other work except fishing is known to
them and expressed their willingness to undergo training for other jobs.
52. Majority (59%) of the respondents communicate directly after tsunami, they
reported that no land was affected due to tsunami, stated that they don’t know
about the forms of disaster and they felt that environmental changes occurred due
to tsunami.

230
53. Majority (67.5%) of the respondents perceived symptoms of tsunami in the form
of high waves before tsunami and most of them were warned about tsunami by
their primary relatives.
54. Majority (54%) of the respondents orally communicated to the community about
the disaster and used both church bell and public radio as means of
communication.
55. Majority of the respondents communicated to others orally during disaster and
they used mobile phone at the time of cyclone and flood.
56. Majority (51.5%) of the respondents suggested that installation of early warning
system and change of habitat would minimize the impact of tsunami in the
coastal areas.
57. More number (48.5%) of respondents identified the role of panchayat in
arranging the shelter/food/clothes and first aid for the victims of natural disaster.
58. Majority (49.5%) of the respondents expected the panchayat to arrange village
meetings and to create awareness on disaster to the people and majority of them
expected safety arrangements for life from GO/NGOs and they expected the
radar system from the Government.
59. Most (37.5%) of the total respondents did not prefer any mechanism at the time
of disaster; however, the remaining reported their willingness towards various
warning systems at the time of disaster.
60. Majority (51.5%) of the respondents ran away at the time of disaster. They
immediately ran away from such natural disasters, whenever they occurred and
majority of the respondents stated that they know of the early warning system
and reported that shouting only was used at the time of disaster.
231
61. Majority (62%) of the respondents does not know about the preparedness and all
of them reported that nobody instructed them about preparedness.
62. Majority (59.5%) of the respondents are having knowledge about disaster
communication system, without any awareness on the improvement of the
structure of the shelter provided to them, and have self-preparedness during
disaster times.
63. Majority (81%) of the respondents reported that work was affected due to climate
changes and reported that high waves occurred due to the climate changes.
64. Majority (66.5%) of the respondent have the knowledge about tsunami resistance
building and the majority (54%) of them reported the availability of tsunami
resistance building in the study area.
65. About a half of the total respondents of the study districts demanded construction
of huts beyond the coastal area to reduce the disaster, and the remaining resisted.
66. Majority (67.5%) of the respondents are unwilling to live in coastal areas due to
the fear of recurrence of tsunami.
232
CONCLUSION
Disaster is any occurrence that causes damage, ecological destruction, loss of
human life or detonation of health and health service on a scale sufficiently towards
an extraordinary response from outside the affected community area. Disasters are
classified as human made and natural. Various countries experience different types of
disasters – human made and natural – and incur heavy loss of life, property,
environment and other damages to infrastructure. In the absence of community
preparedness in disaster mitigation and management, people and areas vulnerable to
such disasters are subjected to devastation and extinction. Among the various natural
disasters occurred in India the recent tsunami which struck on December 26, 2004 in
the east coast from Chennai to Kanyakumari was a giant killer wave which emanated
under sea from Indonesia. Thousands of people who fell victim to this giant tidal
wave were mostly on the coastal line habitats. Since it was a wonderful and surprising
scene the ignorant and innocent fishermen community fell easy victim of tsunami of
which they never heard and experienced earlier. The community is ignorant of matters
related to disasters, self preparedness to face the challenges of disasters like flood,
tsunami. Oral communication and church bell are the popular mechanisms of
communication on occurrence of disaster. They desire to generate awareness on the
disaster challenges. The establishment of satellite linked village knowledge center in
prevention and control of disaster prone coastal zones would go a long way in
ensuring a fool proof system of community preparedness in disaster management.
Climate change and its influence in coastal livelihood have caused numerous
sufferings to the coastal community. The conclusion of the study is that the
community life in coastal zone is precarious and their plight is full of sufferings and
uncertainties. This necessitates designing of appropriate intervention strategies by
233
GOs, NGOs, CBOs, PRIs and other micro level fora. The installation of early warning
system with satellite link will drastically change the livelihood security and provide
safety to coastal communities to involve in their life earning challenges on sea and
ultimately deliver sustainable development. Community in this regard is to be
enlightened and empowered through dissemination of knowledge to ensure their
participation in prevention, control, and mitigation and rehabilitation activities of
coastal zones prone to natural disasters.
234
CHAPTER-VII
ACTION PLAN
The research on this topic undertaken in two coastal district of Tamil Nadu
with a focus on tsunami exposed certain interesting finding dealing with social
exclusion community preparedness and disaster management. Since, the research takes
the over tone of action research, the implication is the preparation of a complaisance
frame work for action plan covering the foretasted dimensions. The frame work for the
action plan is sketched based upon the major finding of this research and the same was
thoroughly designed with the cross setting and the stakeholders. The Brainstorming
exercises on the action plan were carried out among the stakeholders namely coastal
community NGOs, CBOs, Consumers, Business man, Service providers etc. Inanition
this action plan is also presented to the government officials particularly at the state
and district level for its validation. The action plane based upon this research finding
and the validated framework of the action plan covering the dimension of
mainstreaming social exclusion community preparedness, disaster management is
presented her under.
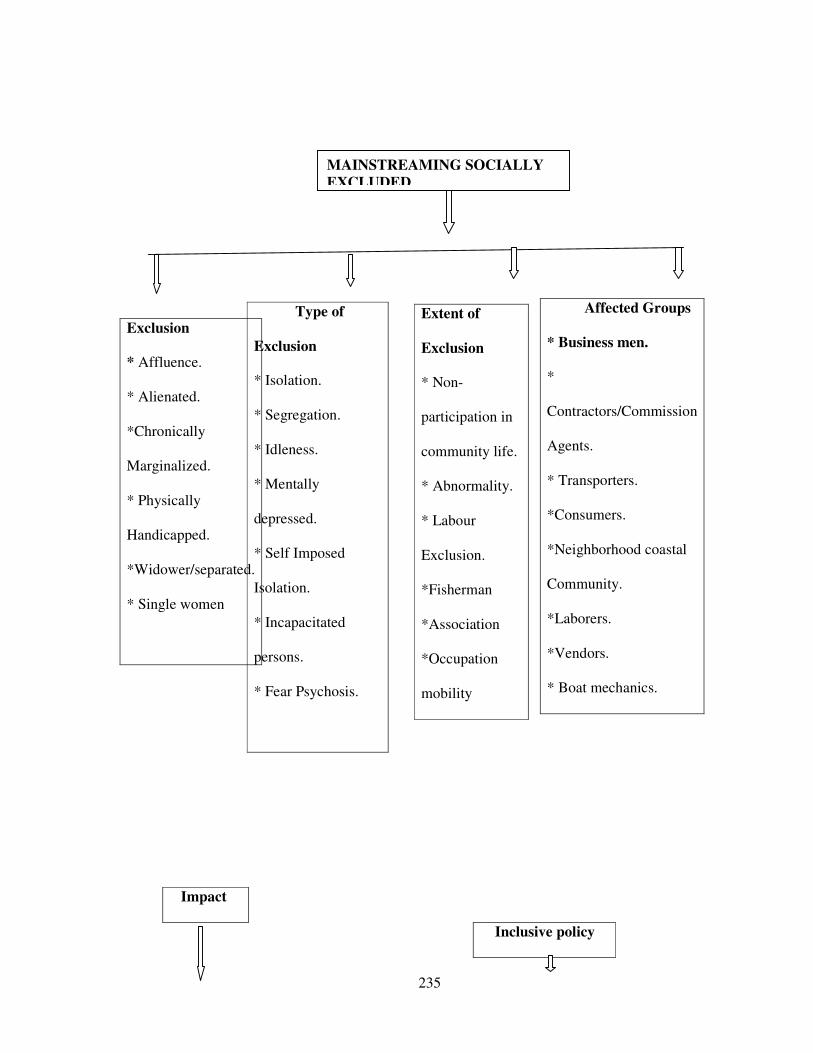
235
Impact
Inclusive policy
Type of
Exclusion
* Isolation.
* Segregation.
* Idleness.
* Mentally
depressed.
* Self Imposed
Isolation.
* Incapacitated
persons.
* Fear Psychosis.
Extent of
Exclusion
* Non-
participation in
community life.
* Abnormality.
* Labour
Exclusion.
*Fisherman
*Association
*Occupation
mobility
Affected Groups
* Business men.
*
Contractors/Commission
Agents.
* Transporters.
*Consumers.
*Neighborhood coastal
Community.
*Laborers.
*Vendors.
* Boat mechanics.
Exclusion
* Affluence.
* Alienated.
*Chronically
Marginalized.
* Physically
Handicapped.
*Widower/separated.
* Single women
MAINSTREAMING SOCIALLY EXCLUDED
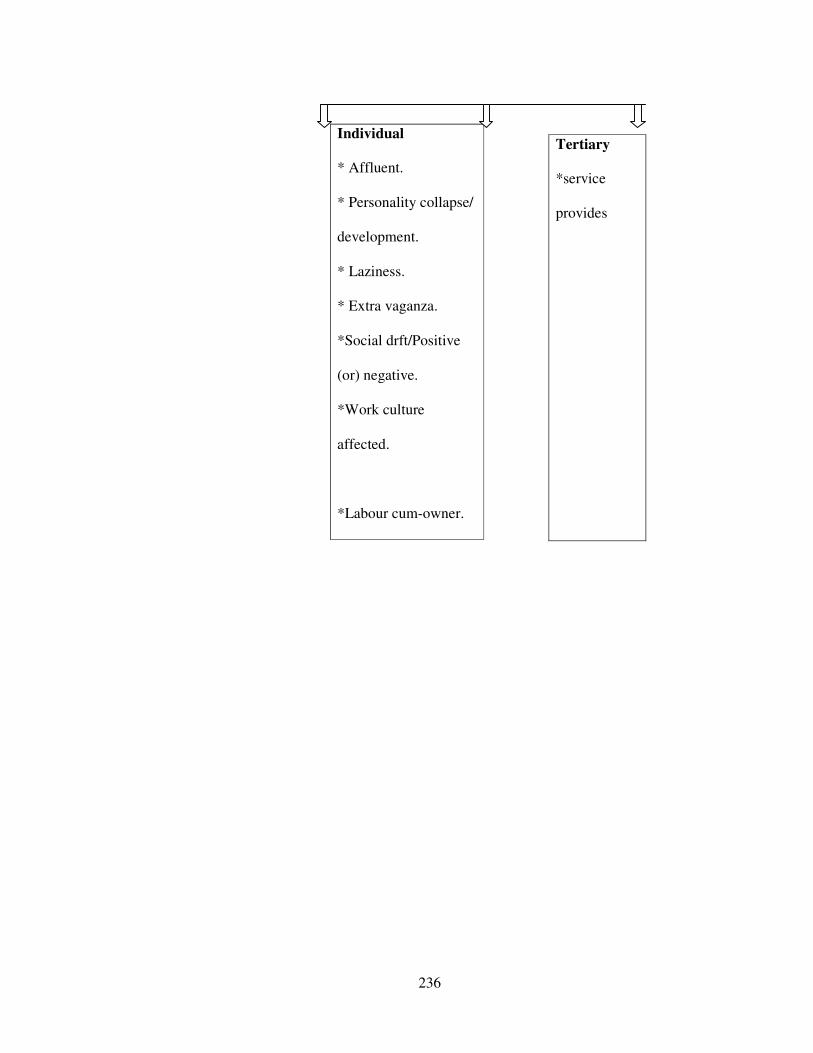
236
Individual
* Affluent.
* Personality collapse/
development.
* Laziness.
* Extra vaganza.
*Social drft/Positive
(or) negative.
*Work culture
affected.
*Labour cum-owner.
Tertiary
*service
provides
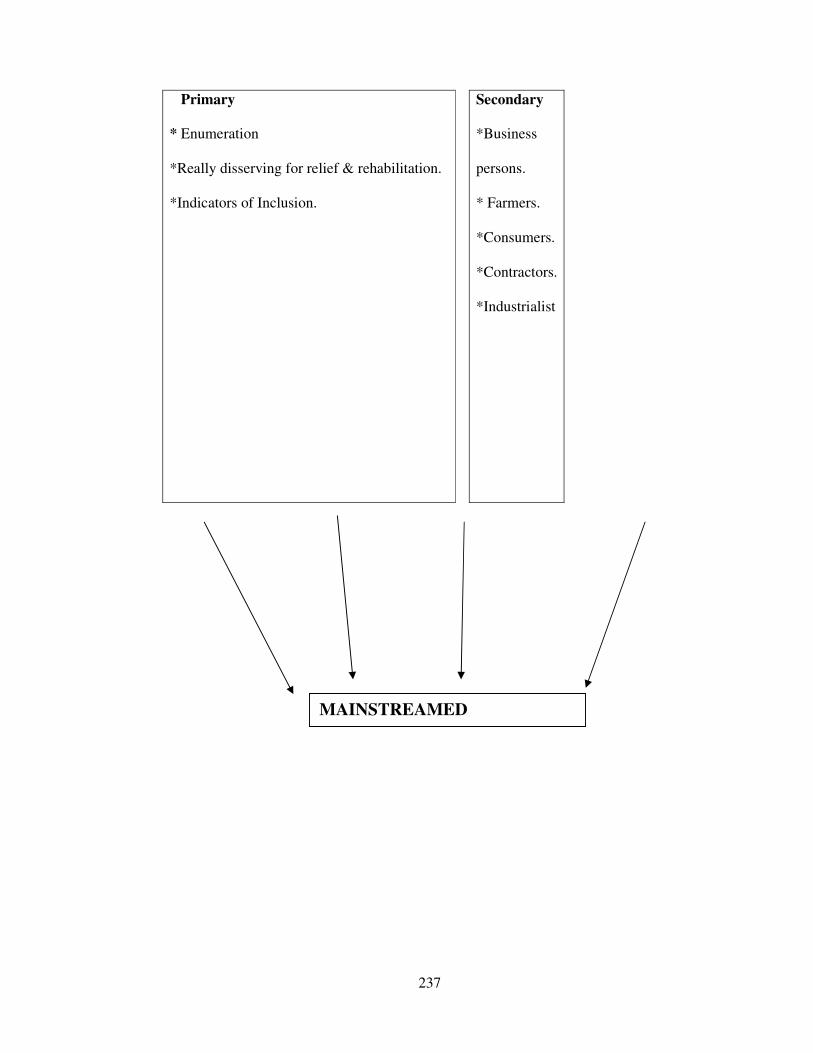
237
Primary
* Enumeration
*Really disserving for relief & rehabilitation.
*Indicators of Inclusion.
Secondary
*Business
persons.
* Farmers.
*Consumers.
*Contractors.
*Industrialist
MAINSTREAMED
COMMUNITY LIFE
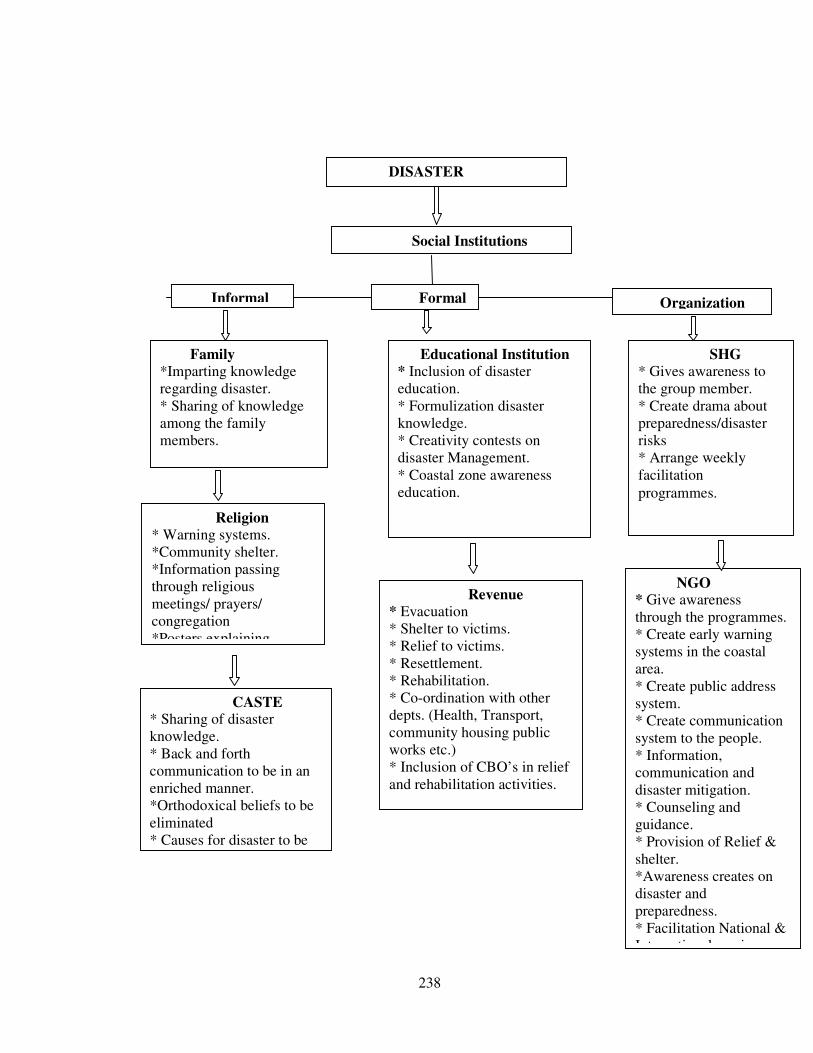
238
Family
*Imparting knowledge regarding disaster. * Sharing of knowledge among the family members.
Educational Institution
* Inclusion of disaster education. * Formulization disaster knowledge. * Creativity contests on disaster Management. * Coastal zone awareness education.
SHG
* Gives awareness to the group member. * Create drama about preparedness/disaster risks * Arrange weekly facilitation
programmes.
Social Institutions
Informal Formal Organization
Religion
* Warning systems. *Community shelter. *Information passing through religious meetings/ prayers/ congregation *Posters explaining
Revenue
* Evacuation * Shelter to victims. * Relief to victims. * Resettlement. * Rehabilitation. * Co-ordination with other depts. (Health, Transport, community housing public works etc.) * Inclusion of CBO’s in relief and rehabilitation activities.
NGO * Give awareness through the programmes. * Create early warning systems in the coastal area. * Create public address system. * Create communication system to the people. * Information, communication and disaster mitigation. * Counseling and guidance. * Provision of Relief & shelter. *Awareness creates on disaster and preparedness. * Facilitation National & International service
CASTE * Sharing of disaster knowledge. * Back and forth communication to be in an enriched manner. *Orthodoxical beliefs to be eliminated * Causes for disaster to be
DISASTER
MANAGEMENT
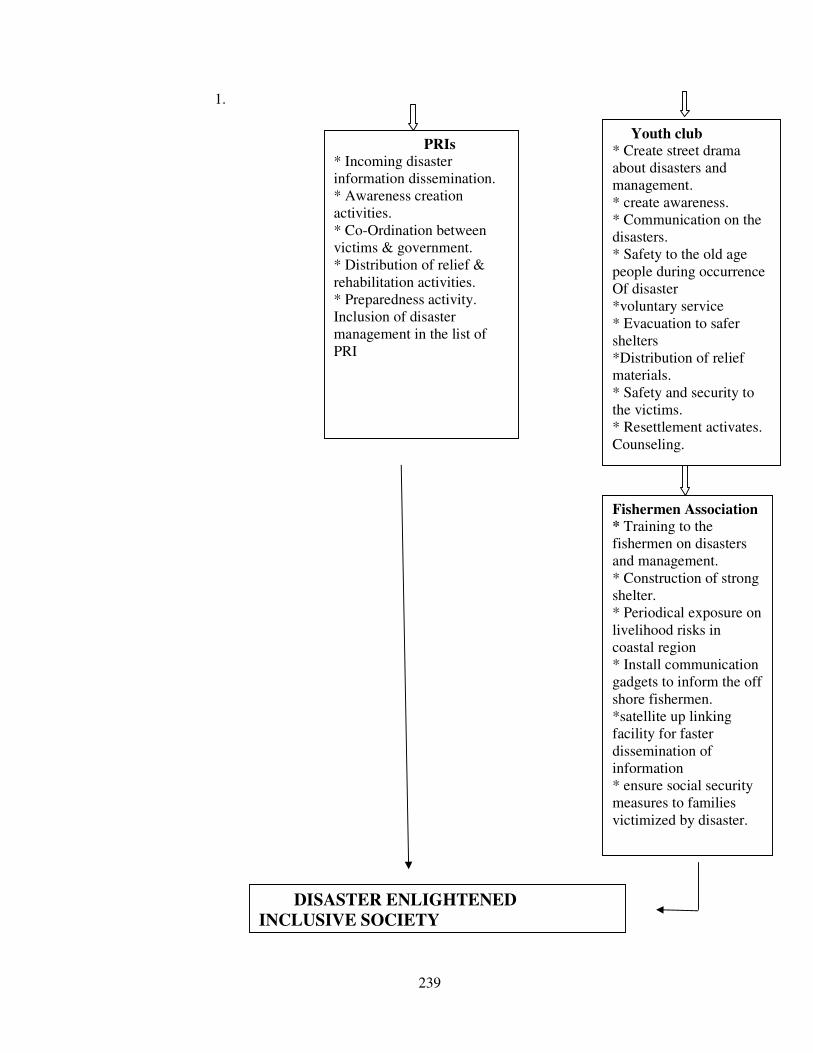
239
1.
Youth club
* Create street drama about disasters and management. * create awareness. * Communication on the disasters. * Safety to the old age people during occurrence Of disaster *voluntary service * Evacuation to safer shelters *Distribution of relief materials. * Safety and security to the victims. * Resettlement activates. Counseling.
Fishermen Association
* Training to the fishermen on disasters and management. * Construction of strong shelter. * Periodical exposure on livelihood risks in coastal region * Install communication gadgets to inform the off shore fishermen. *satellite up linking facility for faster dissemination of information * ensure social security measures to families victimized by disaster.
PRIs
* Incoming disaster information dissemination. * Awareness creation activities. * Co-Ordination between victims & government. * Distribution of relief & rehabilitation activities. * Preparedness activity. Inclusion of disaster management in the list of PRI
DISASTER ENLIGHTENED
INCLUSIVE SOCIETY

240
COMMUNITY
Role of Family in
Disaster
Preparedness
* Imparting & Imbibing knowledge of disaster proneness. * Moving with movable properties. *Safe deposit in bank. * Children and old age persons’ evacuations arrangement. * Information communication through receiver.
Community
Dimension of
Preparedness
* Connectivity between coast and shelter through concrete slaps. * Public address system. * Church/ Temple. Symbolic Indications flag member. * Early warning system Information dissemination through Temple/Church. *Tom Tom *Bell
Caste Association
*dissemination of disasters proneness *safeguards *life saving mechanisms *speedy communication *Evacuation support to GOs/NGOs/CBOs
Religion * Mission/Relief & Rehabilitation *Consoling & guidance. * Mitigation * Reversion to normality. * Congregation sermons’. * Conventions. * Tap funds for relief and rehab. Activities
NGOs * Education. *Awareness * Disaster proneness & preparedness/R and R. *Construction of shelters. * Disaster Asylum. * Guidelines & Counseling * Community radio.
CBOs/SHGs * Capacity building. *Training. *Empowerment. *Supporting EWS. *micro finance and enterprises * Livelihood security *preservation of bio-sphere
Academic
Institution* Design courses on disaster preparedness and management * Shelter. *Guidance & Counseling. * Survey on nature and extent of devastation *Monitoring and evaluation of relief and rehabilitation activities * Disaster mitigation and development
planning.
Government
* EWS * Asylum structure. *Permanent shelter. *Relief Rehabilitation.
Mass Media Visual Media:-
Documentaries I.Disaster proness Ii. Disasters
PRIs * Installation EWS. * Tax for disaster preparedness & mitigation. * Planning disaster preparedness. *Distribution of Relief materials * Arrange Co-Ordination for Rehabilitation * Evacuation
Meteorological
Station
Early Warning System *Periodical weather bulletins.
ACTION PLAN

241
Mainstreaming Socially Excluded: Nature of Exclusion
Though the coastal communities, by and large, are not subjected to exclusion
in the distribution of relief and rehabilitation, there were instances of delayed delivery
of the relief f rehabilitation measures/ materials. At the same time no corruption was
reported in the process of distribution. However there were isolated instance of
violence at the time of delivery of benefits to the victims. It is reported, by and large,
that the coastal community people are satisfied with the nature of house constructed,
boat and net distributed as part of rehabilitation activities.
In spite of the distribution of compensation and other rehabilitation there has
been a feel of marginalization, physical disabilities, individual status of widow,
widower, separated, women headed households, etc… At the same time are certain
instances of affluence as result of over tapping of relief and rehabilitation measures by
certain vested interests.
This needs to be dealt with appropriately through proper enumeration of
victims, nature and extent of loss, designing of welfare programmes taking to account
the felt needs of victims. The NGOs Academic institutions Corporate have got a
greater role to play in this regard. By doing this it is expected that wherever
exclusions were reordered could be avoided and the community subjected to such
types of exclusion are mainstreamed
Types of exclusion
It is observed that the victims of tsunami had been subjected to isolation,
segregation, idleness, depression, fear psychosis etc… To deal with these it is
proposed that the people are brought under the fold of group particularly in the form
at SHGs micro enterprises where in capacity building activities, skill promoting

242
training programme for income generation programme are undertaken in their midst.
Above all individual and group counseling programmes specific to the needs of the
victims are to be planned and undertaken by the NGOs, Academic institutions
Corporate Social workers etc..
Affected Groups:
It is identified that the tsunami struck in the coastal areas had not only affected
the fisherman but also other stakeholders in the vicinity like contractor, commission
agent transporters, Consumers, Laborers, vendors, boat mechanics and other
neighborhood communities. This group of people also deserves appropriate
compensation and relief measures since their livelihood sources got affected in view
of tsunami. While the contractor commission agents, transporters may be provided
loans through nationalized banks, conversion of short to long-term loan period
alternate employment or unemployment dole to labourer vendors and other boat
mechanics. By doings this the affected groups as a result of tsunami, it is expected
that they could be mainstreamed.
Extent of Exclusion:
Owing to the natural disaster in the coastal region the community is severely
affected and normality is disturbed. As a result, there emerges abnormality, alienation.
Idleness among the members of the coastal community. It is proposed that timely
social intervention by GOs, NGOs, Academic institutions, Corporate sectors, Funding
agencies could alleviate their sufferings Community participation in disaster
mitigation would reduce the extent of exclusion.
Impact
Despite the intervention programme of GOs, NGOs, etc. The painful disaster
remains with the community since the loss reported not only voluminous and human
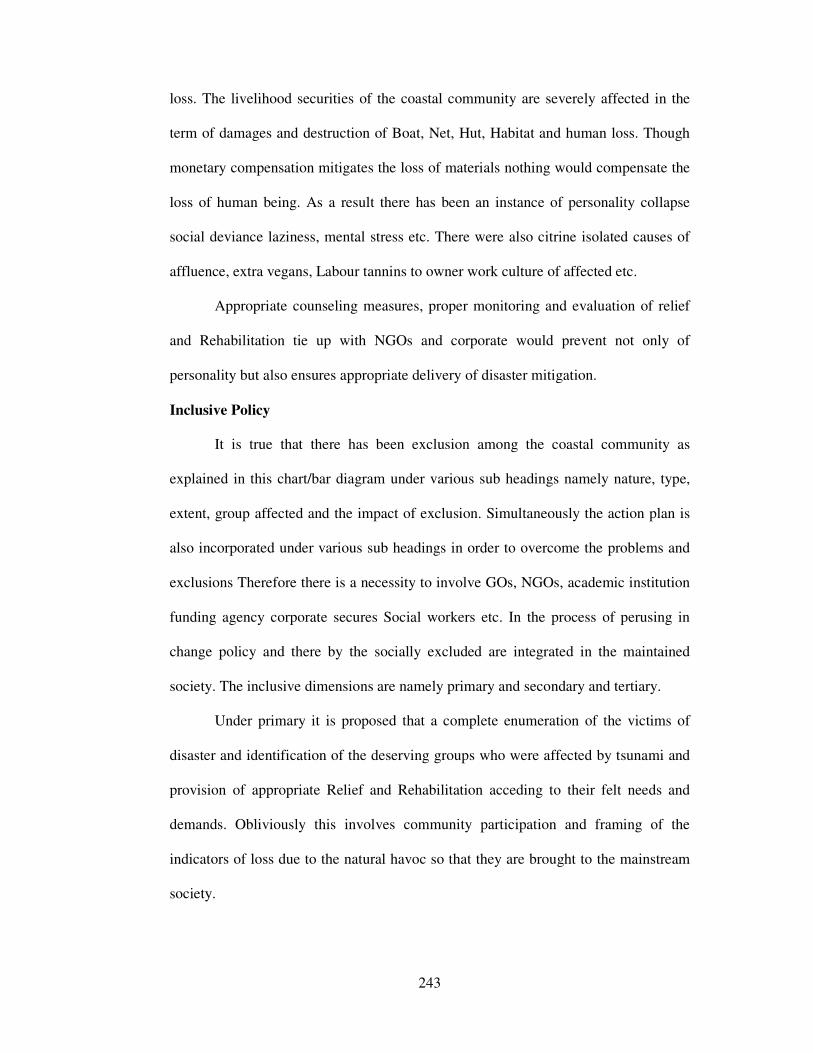
243
loss. The livelihood securities of the coastal community are severely affected in the
term of damages and destruction of Boat, Net, Hut, Habitat and human loss. Though
monetary compensation mitigates the loss of materials nothing would compensate the
loss of human being. As a result there has been an instance of personality collapse
social deviance laziness, mental stress etc. There were also citrine isolated causes of
affluence, extra vegans, Labour tannins to owner work culture of affected etc.
Appropriate counseling measures, proper monitoring and evaluation of relief
and Rehabilitation tie up with NGOs and corporate would prevent not only of
personality but also ensures appropriate delivery of disaster mitigation.
Inclusive Policy
It is true that there has been exclusion among the coastal community as
explained in this chart/bar diagram under various sub headings namely nature, type,
extent, group affected and the impact of exclusion. Simultaneously the action plan is
also incorporated under various sub headings in order to overcome the problems and
exclusions Therefore there is a necessity to involve GOs, NGOs, academic institution
funding agency corporate secures Social workers etc. In the process of perusing in
change policy and there by the socially excluded are integrated in the maintained
society. The inclusive dimensions are namely primary and secondary and tertiary.
Under primary it is proposed that a complete enumeration of the victims of
disaster and identification of the deserving groups who were affected by tsunami and
provision of appropriate Relief and Rehabilitation acceding to their felt needs and
demands. Obliviously this involves community participation and framing of the
indicators of loss due to the natural havoc so that they are brought to the mainstream
society.

244
Under secondary dimension of the sector the severely affected business men,
farmers, contractors, industrialists etc. should also be involved in the framing of
inclusive policy based upon the nature and extent of loss occurred to them.
Appropriate compensation/ concession / Subsidy/ waiver of loan which they
borrowed from banks and provision of fresh loan to resume their regular works.
In the tertiary dimension of the sector the services providers like market
forces, transporters etc. who underwent severe loss of their business need to be
appropriately assisted by providing compensation and provision of fresh loan to them
so as to integrate them in coastal business life.
Community Preparedness
In the community preparedness dimension of the framework for disaster
Management identified as family, Community, Caste, Religion, academic institution,
CBOs/SHGs, NGOs, PRIs, Government Mass media and meteorological station. the
logic behind is community is to be prepared by imparting the necessary information
awareness creation about the risks and dangerous involved in coastal community like
and there by the community is fully prepare to face any eventuality as disasters
proneness is frequent in the coastal region.
Accordingly under this dimension a linkage with various institutions and
agencies who are the stakeholders in protecting life, liberty property of coastal
community is to be ensured. The social intuition of family has got a greater role to
play in imparting, disseminating, ensuring knowledge, information of safety and
security respectively to the members of the family.
To the community level preparedness in the coastal region presupposes
connectivity’s usage of public address system. EWS and other symbolic indications
by hoisting cyclone related flag upon temples churches etc. in addition conventional
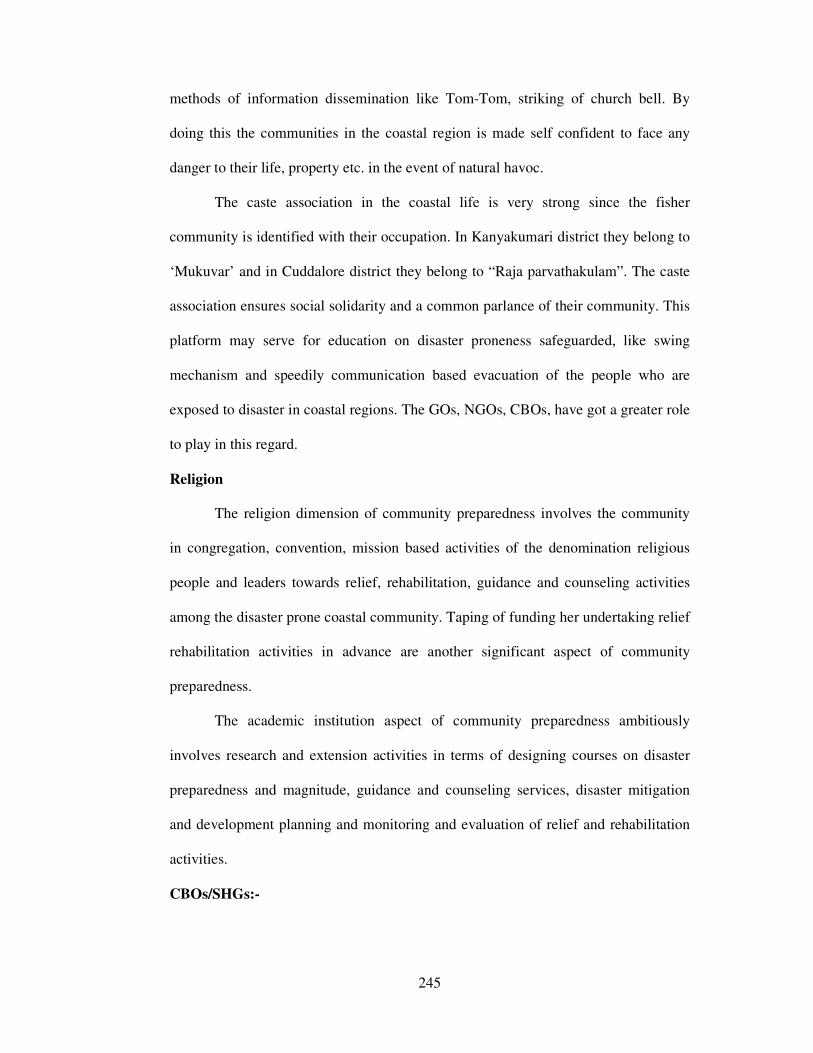
245
methods of information dissemination like Tom-Tom, striking of church bell. By
doing this the communities in the coastal region is made self confident to face any
danger to their life, property etc. in the event of natural havoc.
The caste association in the coastal life is very strong since the fisher
community is identified with their occupation. In Kanyakumari district they belong to
‘Mukuvar’ and in Cuddalore district they belong to “Raja parvathakulam”. The caste
association ensures social solidarity and a common parlance of their community. This
platform may serve for education on disaster proneness safeguarded, like swing
mechanism and speedily communication based evacuation of the people who are
exposed to disaster in coastal regions. The GOs, NGOs, CBOs, have got a greater role
to play in this regard.
Religion
The religion dimension of community preparedness involves the community
in congregation, convention, mission based activities of the denomination religious
people and leaders towards relief, rehabilitation, guidance and counseling activities
among the disaster prone coastal community. Taping of funding her undertaking relief
rehabilitation activities in advance are another significant aspect of community
preparedness.
The academic institution aspect of community preparedness ambitiously
involves research and extension activities in terms of designing courses on disaster
preparedness and magnitude, guidance and counseling services, disaster mitigation
and development planning and monitoring and evaluation of relief and rehabilitation
activities.
CBOs/SHGs:-
246
The community based organizations (CBOs) or Self Help Groups (SHGs)
being micro level community organizations have got an effective role in community
preparedness in terms of disaster mitigation activities and capacity building through
training leading to involvement of the people in the protection, promotion and
sustenance of livelihood security through organisation of micro enterprises as well as
the protection of bio sphere. By involving CBOs/SHGs in disaster mitigation
activities as well as in livelihood security it is believed that the community is fully
prepared to meet the natural disasters and undertake appropriately disaster mitigation
programme.
Non-governmental Organisation (NGOs)
In a welfare state it is the bounden duty and responsibility of the government
to provide all types of prevention and preparedness in respect of disaster prevention,
management and preparedness. However programme alone unable to fulfill the loss of
life property etc since the task is voluminous. Under the circumstance the Non-
Governmental Organisations (NGOs) are inducted to supplement the Governmental
activities. The NGOs provide yeomen services to the affected community as well as
educate them about the risks involved in coastal life. The NGOs are supposed to
concentrate on awareness creation, counseling, preparedness activities as well as
relief, rehabilitation in the event of occurrence of disasters. Reconstruction of
community life through provision of Boat, Net, Hut are the major part of NGO
intervention.
Panchayt Raj Institutions (PRIs)
Being the local governments the Panchayti Raj Institution are locally
responsible to ensure protection, preparedness and mitigation activities as well as
distribution of relief and rehabilitation programme to the victims of natural disasters.
247
Installation of EWS gadgets in the premises of PRI, arrangement of coordination in
mitigation activities and planning preparedness, levy of tax for disaster preparedness,
relief and rehabilitation are the major concerns of the PRIs.
Governments:-
As stated elsewhere in this chapter that the welfare state is committed for
ensuring the social wellbeing of the people in the society. In the event of natural
disasters particularly those occurring in coastal regions the community is faced with
enormous amount of uncertainty and abrupt development. Tsunami is one such
natural disasters on which the community was ignorant about its strike. Naturally the
community falls as an innocent victim of this natural disaster emerging from the
underwater currents due to earthquake. Therefore the government is duty bound to
ensure appropriate preparedness to face such unexpected natural havoc. The
community preparedness from government side includes EWS, construction of
Asylum structure, transport, communication, relief and rehabilitation distribution etc.
This necessitates creation of a department of disaster mitigation at state, district with
taluk and village level administrative arrangement. By doing this the community is
made fully prepared to take any eventuality.
Mass Media:
The mass media has got a larger role to play in disaster prevention, education
preparedness, mitigation activities etc. the Visual. Print and audio visual media have
the social responsibility in this regard.
Satellite assisted receivers shall facilitate quick dissemination of information
towards prevention, evacuation, preparedness and other mitigation activities.
Meteorological Station:

248
The meteorological station, though a government center, has to play the role of
social watch by releasing periodical weather bulletins, educating the coastal
communities about tidal waves, depressions, cyclone, tsunami etc. The meteorological
station should act as EWS. Networking with GOs, NGOs, CBOs, Fishermen
organisation particularly in coastal districts effectively serves the purpose of disaster
management and mitigation. Establishment of meteorological substation in every
coastal district would go a long way in fast dissemination of information about the
possible strike of natural disaster and ensure protection of life, property in the coastal
region.
DISASTER MANAGEMENT:
As stated the coastal region is expose to innumerous uncertainties, risks,
insecurities, as the natural disaster might strike any time abruptly which causes
devastation. Destruction to coastal livelihood securities and properties namely boat,
net, hut and also human loss had taken place. This being reality in the coastal area
there is an urgent need for the system of disaster management as a regular and routine
manner. The GOs, NGOs, CBOs, PRIs and other social institution namely family,
religion, caste as internal social institution; Education intuition, revenue, PRIs as
formal intuitions the CBOs, like SHG, Youth Club. Fishermen association and NGO
are included under community based organisation.
Internal:-
Family:
The social intuition of family as part of disaster management is to impart knowledge
about disaster and sharing among family members which may be integrated in the
process of socialization.
Religion:-

249
The religion dimension of Disaster Management under social institution is to
facilitate information dissemination about livelihood insecurity uncertainties
proneness in coastal life. The religious congregation of community may also be
appropriately used for awareness generation about all the uncertainties. The religious
missions could appropriately use for construction of EWS and community shelters.
Caste:
The caste organisation at the larger level in the coastal region could share the
knowledge on disaster preparedness and management. By doing this the members of
caste are made fully knowledgeable about various types of uncertainties, risks and
other insecurities in coastal life.
250
Formal Education Institution:
The educational institution as part of disaster management can offer disaster
management education in order to generate knowledge on natural disasters, a full-
fledged course on disaster management and mitigation may be included in the
relevant subjects in higher education as well as a lesson on disaster management in
the school curriculum.
Revenue:
The Government’s revenue department is regularly engaged in interaction
dissemination for early evacuation, provisions of relief and rehabilitation as well as
relief for victims of disasters. In addition to the revenue department other
departments, namely health, transport, public works, electricity may also be involved
in disaster mitigation works. In the process the CBOs could also the effectively
engaged in the disaster management and mitigation related activities.
Panchyat Raj Institutions (PRIs):
As local government the PRIs have got the duty to create awareness through
dissemination of information about the possible strike of disaster, evacuation
activities, involvement in distribution of relief and rehabilitation to the victims. In
addition the PRIs could coordinate with other departments of Government and
victims. The disaster management may also be included as one of the subjects in the
list of functions of PRIs.
Orgnisation:
The community based organisation (CBOs) like SHGs, Youth Clubs, and
Fishermen Association with which NGOs could effectively participate in disaster
251
management and mitigation activities effectively leading to creation of disaster
enlightened inclusive society.
SHGs:
Self Help Groups (SHGs) as community based organisation, SHGs in the
coastal areas may be entrusted with the task of creation of awareness, evacuation
monitoring and distribution of relief and rehabilitation materials to the victims and
also facilitate appropriate programmes for the revival of coastal life. The SHGs could
take up disaster management as a matter of discussion in their regular meeting.
Youth Club:
The youth who are young energetic have the capacity to involve in voluntary
service in not only awareness creation but also evacuation distribution relief materials
ensuring safety and security to the coastal communities on occasion of natural
disasters as a strong force. Their voluntary service could be used for emergency
activities.
Fishermen Association:
The professional organisation of the fishermen in the coastal region could act
as a platform for sensitization, training on disaster management expose on livelihood
risks in coastal region. Their safety and security activities are to be informed through
satellite link based in formulation and thereby ensure self-confidence and ensured
ensuring livelihood securities and thereby appropriately protect the individual, family
in the coastal fishermen community.
Non-Governmental Organisations (NGOs)
The NGOs as social services agencies are marked by voluntarism which
invariably engages them in selfless public services towards social wellbeing of the
community. They are, by and large, identified to involve in such services as capacity

252
building income generation activities, counseling and guidance, relief and
rehabilitation, promotion awareness creation sensitization on disaster preparedness
and management, establishment of community based organisation, information
dissemination to the community facilitating development programmes to the
marginalised community towards their inclusive growth.
The NGOs as regards disaster management is concerned are to involve in
prevention, mitigation of disasters and provision of relief and rehabilitation to the
victims. Disaster resistant building structure as part of coastal communication by
adopting ICT gadgets, taping of funds from international development agencies
providing relief and rehabilitation, guidance and counseling etc. are identified to be
the major activities of NGOs serving in the coastal areas. Since NGOs are micro
developmental agencies they should be fully prepared to provide any emergency
services for which adequate funding support from GOs and other international
funding agencies are essential.
The NGOs should be liberally assisted towards mainstreaming the socially
excluded promotion of community preparedness in disaster management etc. by
entrusting the stakes of the NGOs thriving in coastal areas it is expected that the
socially excluded are integrated in the mainstreaming society, community
preparedness to face all challenges, uncertainties and other risks in coastal social life
and disaster management is fully operationalised leading to creation of disaster
enlightened inclusive society in which social exclusion is eliminated, disaster
preparedness is in place and disaster management is systematically evolved for which
infrastructure for communication like EWS, disaster preparedness ,education, fast
dissemination of information to the coastal community about the possible strike of
tsunami: early evacuation , provision of relief and rehabilitation etc are all essential.
253
The creation of a separate Ministry and Department for Disaster Management and
coastal community welfare both at central and state levels would facilitate the needed
budget support and regular developmental activities among the betake holders.
254
BIBLIOGRAPHY
BOOKS
1. Arjan de Haan Social Exclusion: enriching the understanding of Depravity on
pp.1-2
2. Arjan de Haan. Social Exclusion: Enriching the Understanding of
Deprivation (Manila: Asian Development Bank, 2000), pp.1-2.
3. Arunkumar Talwar, Sathish Juneja, Natural Disaster Management,
commonwealth publishers, 4831/24, prahlad street, Ansari road, Dray Ganj,
New Delhi-110002. Pp. 42-43
4. B. Hema Malini and K. Nageswara Rao “Coastal Erosion and Habital Loss
along the Goel, S.L and Ramkumar (ed). Disaster Management. New Delhi:
Deep & Deep Publications, 2001. pp.1232-35
5. B.K . Singhadhyaya, ; Disaster Management; publishers & Distributors, New
Delhi. PP. 111-117, 125-131, 160-174
6. Goel, S.L and Ramkumar (ed). Disaster Management. New Delhi: Deep &
Deep Publications, 2001.
7. P.S Chawla, Natural Hazards and Disaster Management, New Delhi: Pearl
Books 2008; pp.130-133,145-148.
8. P.S. Chawla Natural Hazards and Disaster Mangement, New Delhi pearl
books 2008. pp. 138-143
9. P.S. Chawla, Disaster How to Avoid Harm, Pearl Books New Delhi: (Page no:
81-91), 2008.
10. P.S. Chawla, Emergency and Disaster Management, New Delhi pearl books,
(page no:1-3, 7, 9-10,11-12, 23-29, 34-35, 38-48), 2008
255
11. P.S. Chawla, Emergency and Disaster Management, New Delhi pearl books,
2008 (page no: 34-35, 38-48)
12. P.S.Chawla, Natural Hazards and Disaster Management, Pearl Books, New
Delhi, pp: 130 -133, 138-143
13. S.L Goel, Disaster Management Administration and Management, Deep &
Deep Publications, New Delhi, 2007, pp 124-127
14. S.L Gole. Disaster administration and management. New Delhi: Deep & Deep
Publications, 2007; pp 13-15.
JOURNALS
1. A Fallout of Dam Construction” Current Science, 87 (9 &10), Nov.2004.)
2. According to the prevention/protection and mitigation from risk of tsunami
disaster (2005) report.
3. Avanish Kumar, Social Welfare, 53 (3), June 2006.), pp.27-30
4. B.N. Chattora. “Crime Situation in Tsunami Disaster Areas”, Social Welfare.
52 June 2005
5. Bhrat Dogre. Social Welfare, 51 no.12, March 2005), pp. 23-25
6. Competition affairs, August, 2007,pp;25
7. Competition affairs, August, 2007.pp.33
8. Current Science vol. 89. No. 8. October-25, pp. 1339-47.
9. Current science vol.89 No (8), 2004, October 25,pp;140-45
10. Disaster & Development, 1 (1), Nov.2006: pp. 96-99
11. Disaster impacts on communities and challenges for a critical response – paper
participation on national seminar march .5 -2006)
12. Dr. A.P.J. Abdul Kalam January, 9 2005, “The Week”

256
13. Dr. Prakash B.Behere, Dr. Ravi P. Dhawale Health Action * November -2008.
14. ENVIS-news letter on state government supported by ministry of environment
and forest government of India .jun-2007 vol.4.no.2) pp.2-6
15. Geeta Raj, Social Welfare, 51 (12), March 2005).
16. Ibid, pp.
17. K.S. Krishna, “Coastal Hazard Preparedness”, Current Science, 89 (8), 25, Oct.
2005.), pp. 1339-45
18. K.S. Krishna, Current Sciences, vol, 89 No (8), 25, Oct.2005.)
19. Madhu R. Sekar (2005) Yojana, Feb.2005 Vol.49) pp. 29-32
20. Madhu R. Sekar, Yojana, Feb.2005). pp. 29-32
21. Menon, P.A. Our Weather. 1989, pp.234-244)
22. Nagaraja Front Line, January 30, 2005:126-127), pp. 126-27
23. Prafullakumar’s (2004) Social Welfare, vol.50. no.12, March-2004)
24. Prakash B. Behere and Ravi P. Dhawale. “Managing Mental Health in Disaster
Situations.” Health Action. Nov. 2007: 4-11.
25. Prakash et..al Health Action.November-2007 Pag No.5
26. Pratulla Kumar Das and Niranjana Pardhan. Social Welfare 50 (12), March,
2004.)
27. Profiles of Disaster management.
28. Radha and Velmayil, “Nagapattinam District since Tsunami, 2004” Kissan World.
35 (1), Jan.2008), pp.57-60.
29. Ravindar Banyal, “Natural Calamities and Pseudoscientific Means” Current
Science, 89 (10 & 11), Dec.2005). pp. 1779-83
30. Rehabilitation of Tsunami Victims in Kerala.
257
31. Relief undertaken by central social wafer Board for tsunami victims social
Welfare/Fedruary-2005, pp.43-45
32. Rev.Dr. Sebastin Ousepparapil “Health Action “November-2007. vol.20.no.11.
33. Sanjay K. Srivastava, “Disaster and Development ;Sanjay K. Srivastava, V.S.
Hedge, and N. Jayaraman, “Disaster and Development” Journal of the National
Institute of Disaster Management. 1 (2), May, 2007), pp. 111-15.
34. Sanjaya Bhatia, Environment & People, March 2007, pp. 23-26
35. Santosh Srinivasan, Yojana, Vol.49, 2005.), pp. 65-67
36. Sativa Sinha et.al. India and the World. (New Delhi: NCERT, 2004), pp.24-26
37. Sebastian Ousepparampil, “Disaster Management – Relief to the Tsunami
Affected”, Health Action, 18 (2), 2005.)
38. Sebastian Ousepparampil’s (2007) Health Action- Novembe-2007- Dealing With
Disaster Health-Vol0-20No-11, pp. 3-4
39. Shahin Sultana and K. Shanmugavelayutham, “The Role of the Social Worker in
Rehabilitating Women and Children in the Tsunami Tragedy”, Social Welfare, 51
(12), March 2005). pp. 16-18
40. Shahin sultana et..al.(2004) Social Welfare, vol.51. no.12, March-2004)
41. Subiramanian’s Front Line – 2007 Vol-24 November-24 Page No 104)
42. Sudhir K. Jain, “Effects of M 9 Sumatra Earthquake and Tsunami on 26,
Dec.2004”, Current Science, 88 (3), 10, Feb.2005). pp. 357-60
43. The gain wave in Asia.
44. Tsunami in Andhra Pradesh.
45. Tsunami in disaster-surviving nature’s fury.
46. Tsunami in Tamil Nadu “the damage and the stares response” Social
Welfare/Febrarury-2005

258
47. Vijay K. Agarwal et al. Current Sciences, 88 (3) 10, Feb.2005)
48. World Disasters Report, 2001
News paper
1. The Hindu, December 27, 2004.
2. Budi Waugh The Hindu, December 28, 2004:22
3. The Hindu, December, 29, 2004
4. The Hindu, December 30, 2004.
5. Yenger The Hindu, December 30, 2004
6. Chadha The Hindu, December 30, 2004
7. V.Jayanth The Hindu, April 29, 2005
Websites
1. Http: // www. Cbc News. Com/2005
2. http://www.unisdr.drg/2002
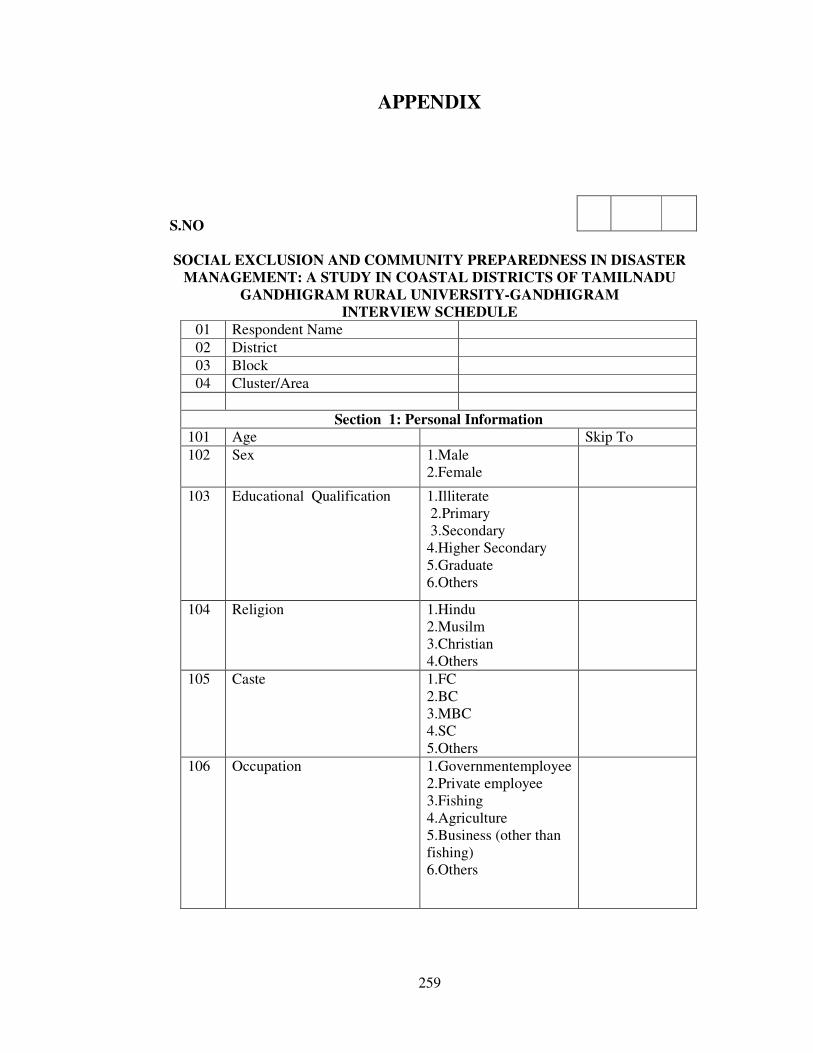
259
APPENDIX
S.NO
SOCIAL EXCLUSION AND COMMUNITY PREPAREDNESS IN DISASTER
MANAGEMENT: A STUDY IN COASTAL DISTRICTS OF TAMILNADU
GANDHIGRAM RURAL UNIVERSITY-GANDHIGRAM
INTERVIEW SCHEDULE
01 Respondent Name
02 District
03 Block
04 Cluster/Area
Section 1: Personal Information
101 Age Skip To
102 Sex 1.Male 2.Female
103 Educational Qualification 1.Illiterate 2.Primary 3.Secondary 4.Higher Secondary 5.Graduate 6.Others
104 Religion 1.Hindu 2.Musilm 3.Christian 4.Others
105 Caste 1.FC 2.BC 3.MBC 4.SC 5.Others
106 Occupation 1.Governmentemployee 2.Private employee 3.Fishing 4.Agriculture 5.Business (other than fishing) 6.Others
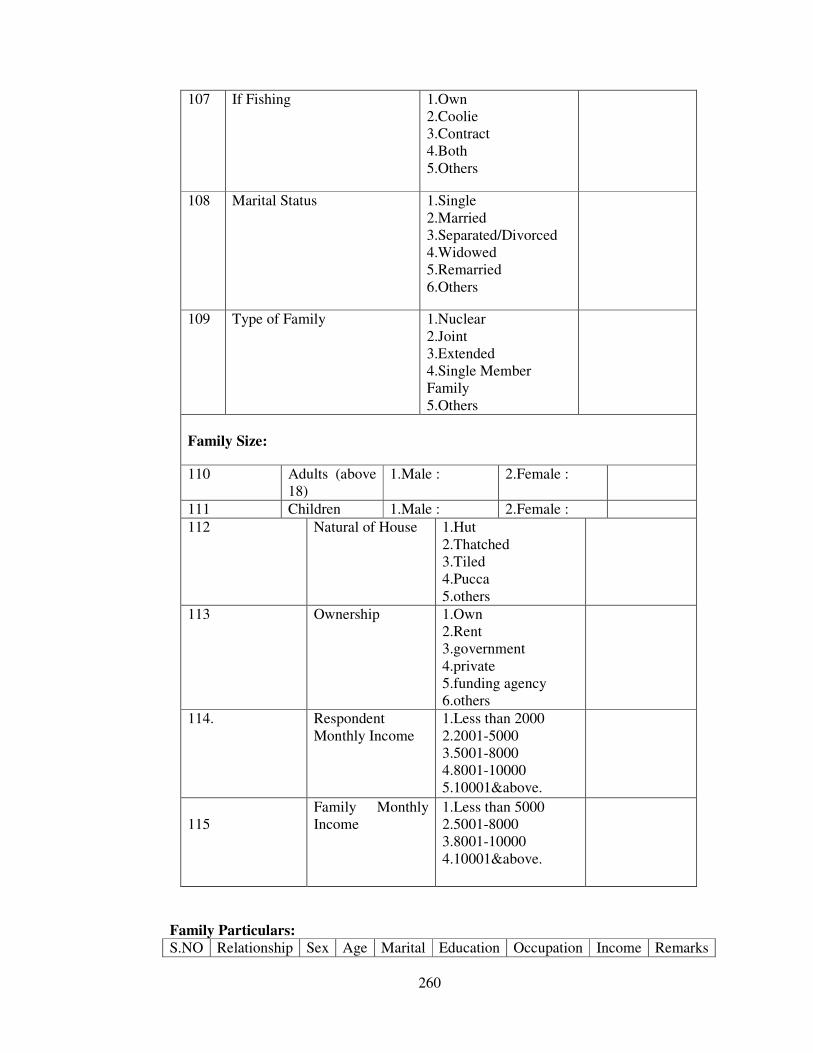
260
107 If Fishing 1.Own 2.Coolie 3.Contract 4.Both 5.Others
108 Marital Status 1.Single 2.Married 3.Separated/Divorced 4.Widowed 5.Remarried 6.Others
109 Type of Family 1.Nuclear 2.Joint 3.Extended 4.Single Member Family 5.Others
Family Size:
110 Adults (above 18)
1.Male : 2.Female :
111 Children 1.Male : 2.Female :
112 Natural of House 1.Hut 2.Thatched 3.Tiled 4.Pucca 5.others
113 Ownership 1.Own 2.Rent 3.government 4.private 5.funding agency 6.others
114. Respondent Monthly Income
1.Less than 2000 2.2001-5000 3.5001-8000 4.8001-10000 5.10001&above.
115
Family Monthly Income
1.Less than 5000 2.5001-8000 3.8001-10000 4.10001&above.
Family Particulars:
S.NO Relationship Sex Age Marital Education Occupation Income Remarks

261
to the Respondent
Status
1
2
3
4
5
6
7
8
Section: II social structure of the coastal area:
a. Socio-Cultural and Political Aspects:
2. Respondents Relationship with Family Members:
S.NO Family members Type of Relationship
Cordial Hostile Indifferent
1. 10. Spouse 11. 12. 13.
14. 2. 15. Son 16. 17. 18.
19. 3. 20. Daughter 21. 22. 23.
24. 4. 25. Mother-in-law 26. 27. 28.
29. 5. 30. Father-in-law 31. 32. 33.
34. 6. 35. Son-in-law 36. 37. 38.
39. 7. 40. Daughter-in-law 41. 42. 43.

262
44. 202. 45. How is the nature of relationship
to your neighbors?
46. 1.Good
47. 2.Moderate
48. 3.Bad
49.
50. 203. 51. How do you maintain inter-caste
relationships?
52. 1.Good
53. 2.Moderate
54. 3.Bad
55.
56. 204. What kind of marriage practices you are adopting?
57. 205. 58. Is there any dowry practices? 59. 1.Yes
60. 2.No
61. If No, Go to
207
62. 206. 63. If Yes, mention goods
64. 207. 65. Do you accept Inter-caste
marriage?
66. 1.Yes
67. 2.No
68. If Yes, go to
209
69. 208. 70. If no, What is the reason?
71. 209. 72. Is there any remarriage among Women and Men? 1.
Yes 2.No.
73. If Yes when.
74. If No, go to
210
75.
1. Before Tsunami : 76. 2.After Tsunami : 77.
78. 210. 79. How many Castes do you have in your village/hamlet?
80. 211. 81. Do you have Caste based
Organization in your
village/hamlet?
82. 1.Yes
83. 2.No
84. If No, go to 213
85. 212. 86. If yes, What is the role of that Organization?
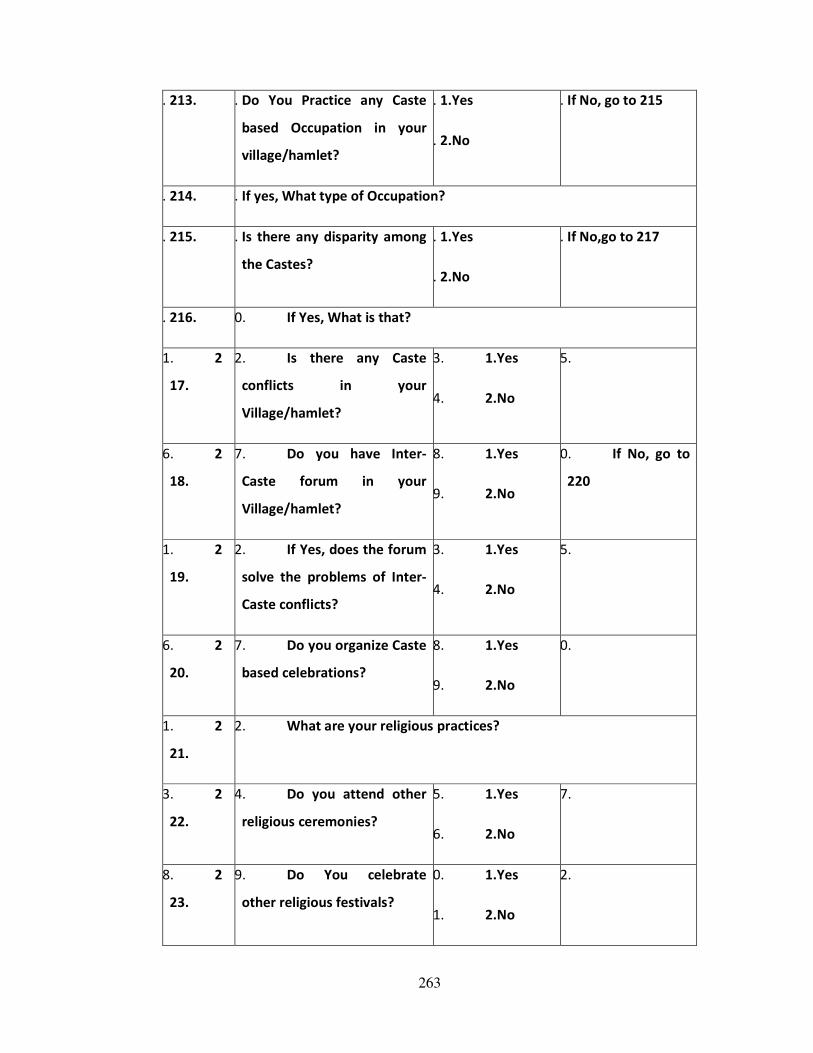
263
87. 213. 88. Do You Practice any Caste
based Occupation in your
village/hamlet?
89. 1.Yes
90. 2.No
91. If No, go to 215
92. 214. 93. If yes, What type of Occupation?
94. 215. 95. Is there any disparity among
the Castes?
96. 1.Yes
97. 2.No
98. If No,go to 217
99. 216. 100. If Yes, What is that?
101. 2
17.
102. Is there any Caste
conflicts in your
Village/hamlet?
103. 1.Yes
104. 2.No
105.
106. 2
18.
107. Do you have Inter-
Caste forum in your
Village/hamlet?
108. 1.Yes
109. 2.No
110. If No, go to
220
111. 2
19.
112. If Yes, does the forum
solve the problems of Inter-
Caste conflicts?
113. 1.Yes
114. 2.No
115.
116. 2
20.
117. Do you organize Caste
based celebrations?
118. 1.Yes
119. 2.No
120.
121. 2
21.
122. What are your religious practices?
123. 2
22.
124. Do you attend other
religious ceremonies?
125. 1.Yes
126. 2.No
127.
128. 2
23.
129. Do You celebrate
other religious festivals?
130. 1.Yes
131. 2.No
132.
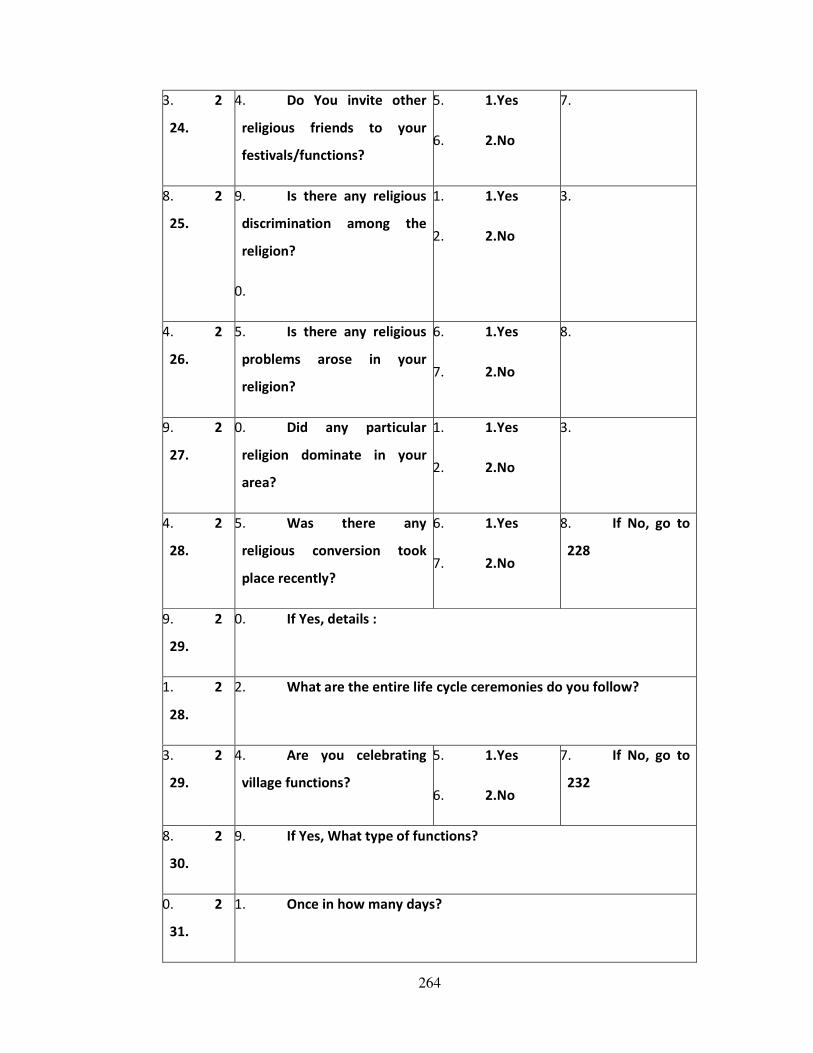
264
133. 2
24.
134. Do You invite other
religious friends to your
festivals/functions?
135. 1.Yes
136. 2.No
137.
138. 2
25.
139. Is there any religious
discrimination among the
religion?
140.
141. 1.Yes
142. 2.No
143.
144. 2
26.
145. Is there any religious
problems arose in your
religion?
146. 1.Yes
147. 2.No
148.
149. 2
27.
150. Did any particular
religion dominate in your
area?
151. 1.Yes
152. 2.No
153.
154. 2
28.
155. Was there any
religious conversion took
place recently?
156. 1.Yes
157. 2.No
158. If No, go to
228
159. 2
29.
160. If Yes, details :
161. 2
28.
162. What are the entire life cycle ceremonies do you follow?
163. 2
29.
164. Are you celebrating
village functions?
165. 1.Yes
166. 2.No
167. If No, go to
232
168. 2
30.
169. If Yes, What type of functions?
170. 2
31.
171. Once in how many days?

265
172.
173. 2
32.
174. Do you have any get-
to-gather activity in your
village/hamlet?
175. 1.Yes
176. 2.No
177.
178. 2
33.
179. Do you arrange any
village meetings regularly?
180. 1.Yes
181. 2.No
182.
183. 2
34.
184. Is there any social
organization working in your
village/hamlet?
185. 1.Yes
186. 2.No
187.
188. 2
35.
189. Do you have Self
Helps Groups in your
village/hamlet?
190. 1.Yes
191. 2.No
192. If No, go to
237
193. 2
36.
194. If Yes, What is that role?
195.
196. 2
37.
197. Do you have Adult
and Non-Formal
198.
199. Education center in
your village/hamlet?
200. 1.Yes
201.
202. 2.No
203.
204. 2
38.
205. What are all the groups working in your village/hamlet?
206.
207. 2
39.
208. Do you have Youth
Club in your village/hamlet?
209. 1.Yes
210. 2.No
211. If No, go to
241
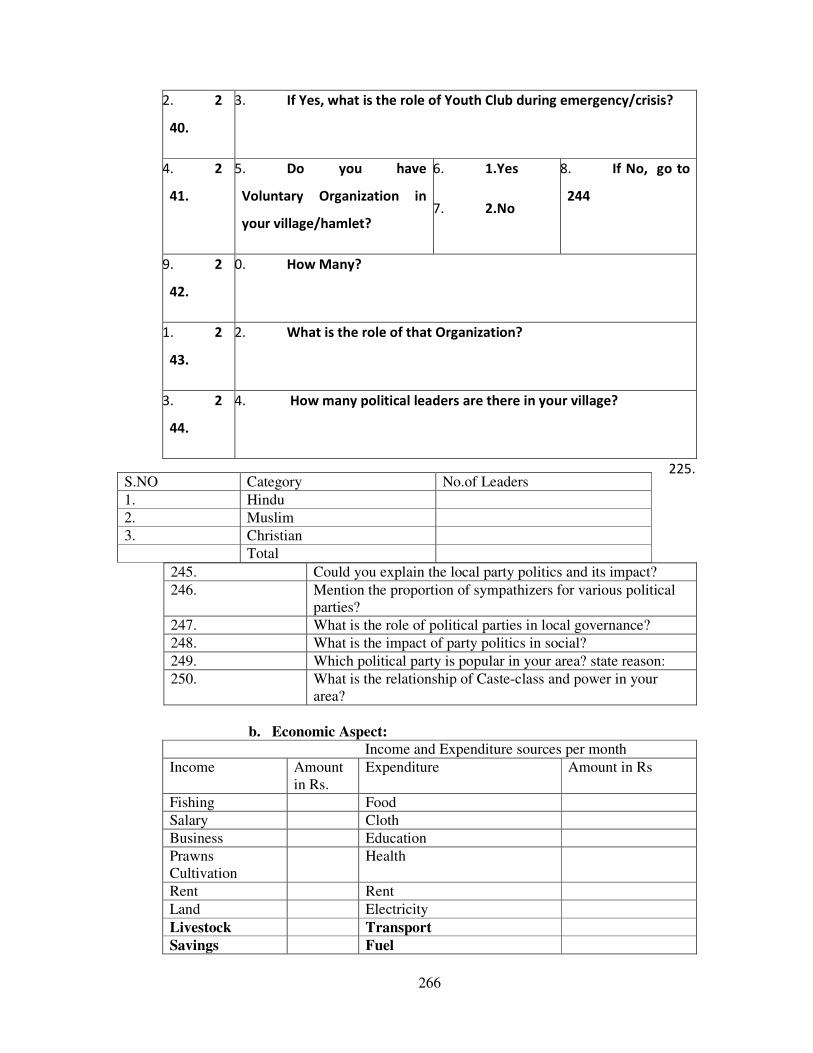
266
212. 2
40.
213. If Yes, what is the role of Youth Club during emergency/crisis?
214. 2
41.
215. Do you have
Voluntary Organization in
your village/hamlet?
216. 1.Yes
217. 2.No
218. If No, go to
244
219. 2
42.
220. How Many?
221. 2
43.
222. What is the role of that Organization?
223. 2
44.
224. How many political leaders are there in your village?
225.
245. Could you explain the local party politics and its impact?
246. Mention the proportion of sympathizers for various political parties?
247. What is the role of political parties in local governance?
248. What is the impact of party politics in social?
249. Which political party is popular in your area? state reason:
250. What is the relationship of Caste-class and power in your area?
b. Economic Aspect:
Income and Expenditure sources per month
Income Amount in Rs.
Expenditure Amount in Rs
Fishing Food
Salary Cloth
Business Education
Prawns Cultivation
Health
Rent Rent
Land Electricity
Livestock Transport
Savings Fuel
S.NO Category No.of Leaders
1. Hindu
2. Muslim
3. Christian
Total
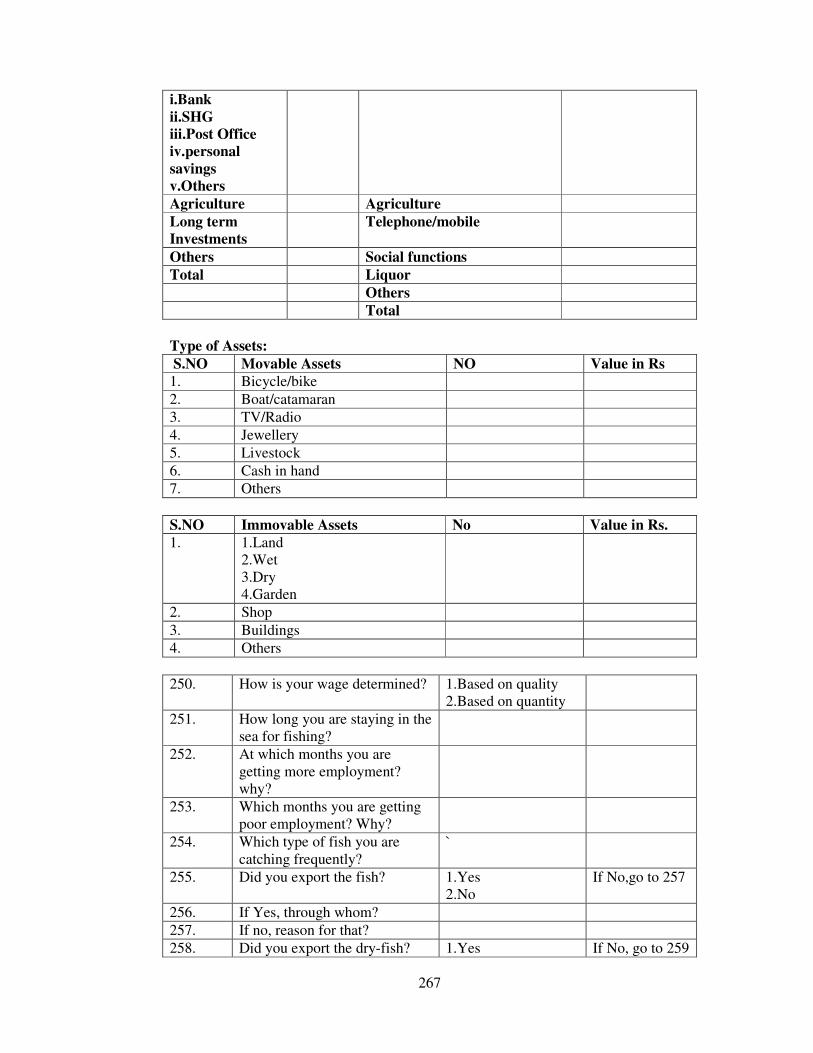
267
i.Bank
ii.SHG
iii.Post Office
iv.personal
savings
v.Others
Agriculture Agriculture
Long term
Investments
Telephone/mobile
Others Social functions
Total Liquor
Others
Total
Type of Assets:
S.NO Movable Assets NO Value in Rs
1. Bicycle/bike
2. Boat/catamaran
3. TV/Radio
4. Jewellery
5. Livestock
6. Cash in hand
7. Others
S.NO Immovable Assets No Value in Rs.
1. 1.Land 2.Wet 3.Dry 4.Garden
2. Shop
3. Buildings
4. Others
250. How is your wage determined? 1.Based on quality 2.Based on quantity
251. How long you are staying in the sea for fishing?
252. At which months you are getting more employment? why?
253. Which months you are getting poor employment? Why?
254. Which type of fish you are catching frequently?
`
255. Did you export the fish? 1.Yes 2.No
If No,go to 257
256. If Yes, through whom?
257. If no, reason for that?
258. Did you export the dry-fish? 1.Yes If No, go to 259
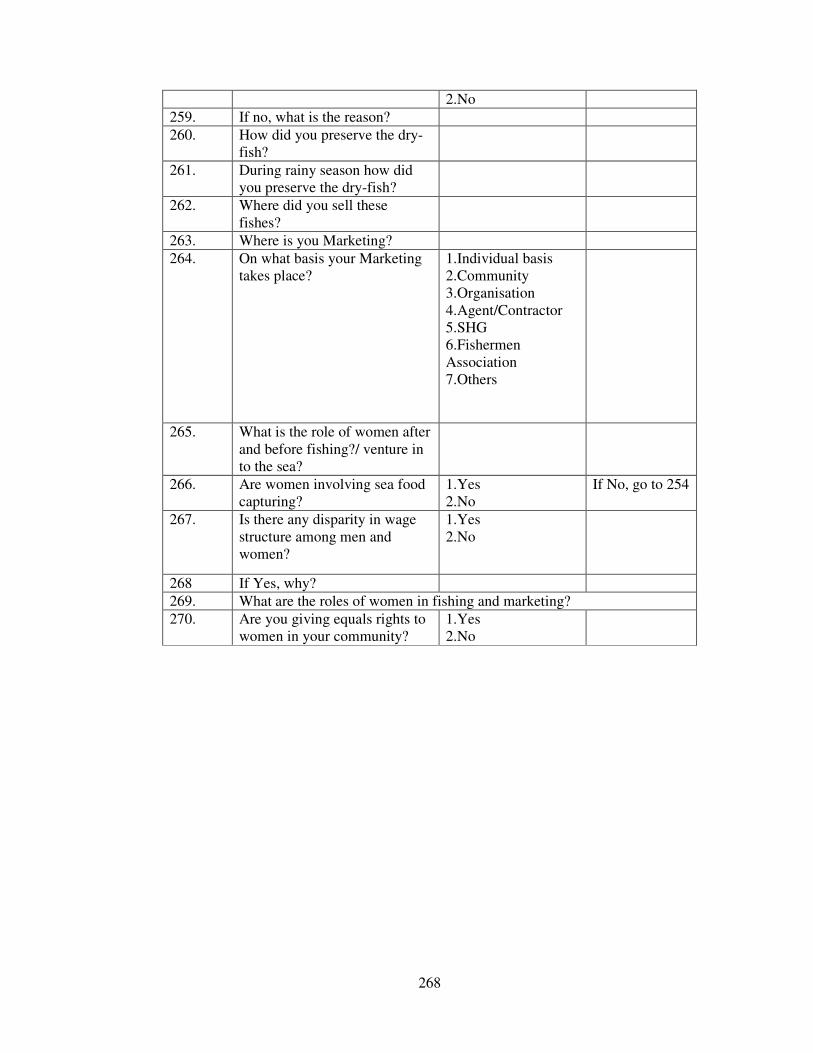
268
2.No
259. If no, what is the reason?
260. How did you preserve the dry-fish?
261. During rainy season how did you preserve the dry-fish?
262. Where did you sell these fishes?
263. Where is you Marketing?
264. On what basis your Marketing takes place?
1.Individual basis 2.Community 3.Organisation 4.Agent/Contractor 5.SHG 6.Fishermen Association 7.Others
265. What is the role of women after and before fishing?/ venture in to the sea?
266. Are women involving sea food capturing?
1.Yes 2.No
If No, go to 254
267. Is there any disparity in wage structure among men and women?
1.Yes 2.No
268 If Yes, why?
269. What are the roles of women in fishing and marketing?
270. Are you giving equals rights to women in your community?
1.Yes 2.No
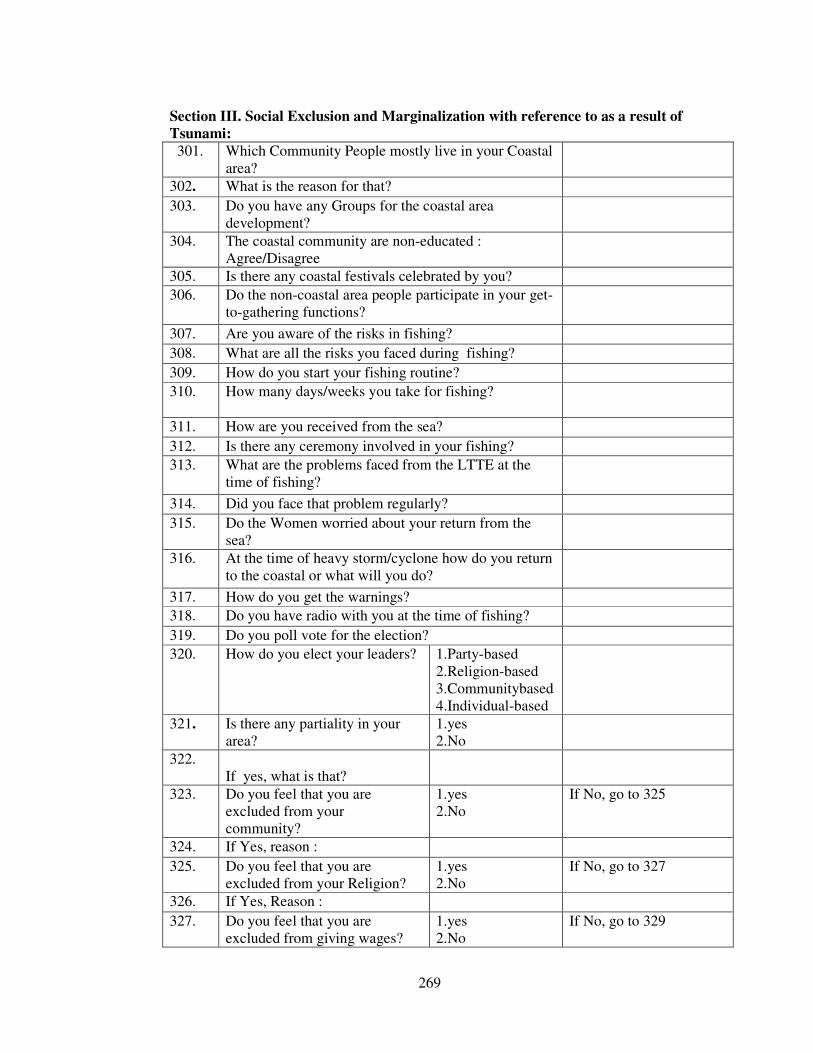
269
Section III. Social Exclusion and Marginalization with reference to as a result of
Tsunami:
301. Which Community People mostly live in your Coastal area?
302. What is the reason for that?
303. Do you have any Groups for the coastal area development?
304. The coastal community are non-educated : Agree/Disagree
305. Is there any coastal festivals celebrated by you?
306. Do the non-coastal area people participate in your get-to-gathering functions?
307. Are you aware of the risks in fishing?
308. What are all the risks you faced during fishing?
309. How do you start your fishing routine?
310. How many days/weeks you take for fishing?
311. How are you received from the sea?
312. Is there any ceremony involved in your fishing?
313. What are the problems faced from the LTTE at the time of fishing?
314. Did you face that problem regularly?
315. Do the Women worried about your return from the sea?
316. At the time of heavy storm/cyclone how do you return to the coastal or what will you do?
317. How do you get the warnings?
318. Do you have radio with you at the time of fishing?
319. Do you poll vote for the election?
320. How do you elect your leaders? 1.Party-based 2.Religion-based 3.Communitybased 4.Individual-based
321. Is there any partiality in your area?
1.yes 2.No
322. If yes, what is that?
323. Do you feel that you are excluded from your community?
1.yes 2.No
If No, go to 325
324. If Yes, reason :
325. Do you feel that you are excluded from your Religion?
1.yes 2.No
If No, go to 327
326. If Yes, Reason :
327.
Do you feel that you are excluded from giving wages?
1.yes 2.No
If No, go to 329
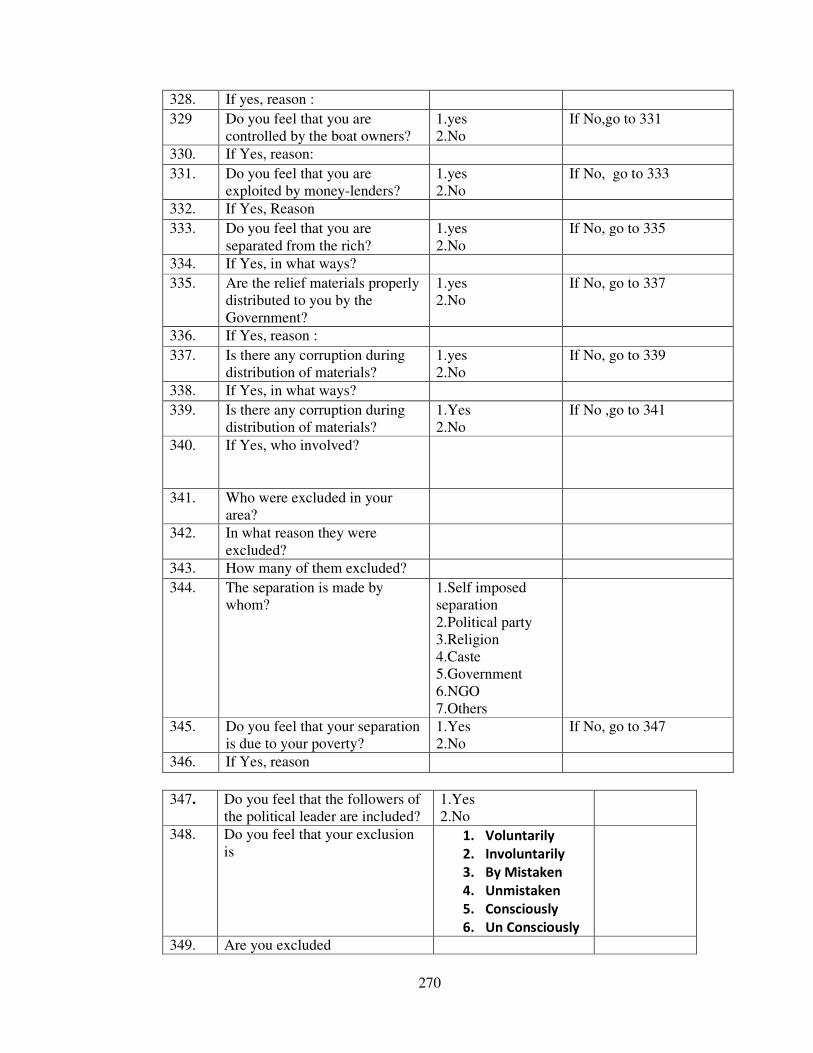
270
328. If yes, reason :
329 Do you feel that you are controlled by the boat owners?
1.yes 2.No
If No,go to 331
330. If Yes, reason:
331. Do you feel that you are exploited by money-lenders?
1.yes 2.No
If No, go to 333
332. If Yes, Reason
333. Do you feel that you are separated from the rich?
1.yes 2.No
If No, go to 335
334. If Yes, in what ways?
335. Are the relief materials properly distributed to you by the Government?
1.yes 2.No
If No, go to 337
336. If Yes, reason :
337. Is there any corruption during distribution of materials?
1.yes 2.No
If No, go to 339
338. If Yes, in what ways?
339. Is there any corruption during distribution of materials?
1.Yes 2.No
If No ,go to 341
340. If Yes, who involved?
341. Who were excluded in your area?
342. In what reason they were excluded?
343. How many of them excluded?
344. The separation is made by whom?
1.Self imposed separation 2.Political party 3.Religion 4.Caste 5.Government 6.NGO 7.Others
345. Do you feel that your separation is due to your poverty?
1.Yes 2.No
If No, go to 347
346. If Yes, reason
347. Do you feel that the followers of the political leader are included?
1.Yes 2.No
348. Do you feel that your exclusion is
1. Voluntarily
2. Involuntarily
3. By Mistaken
4. Unmistaken
5. Consciously
6. Un Consciously
349. Are you excluded
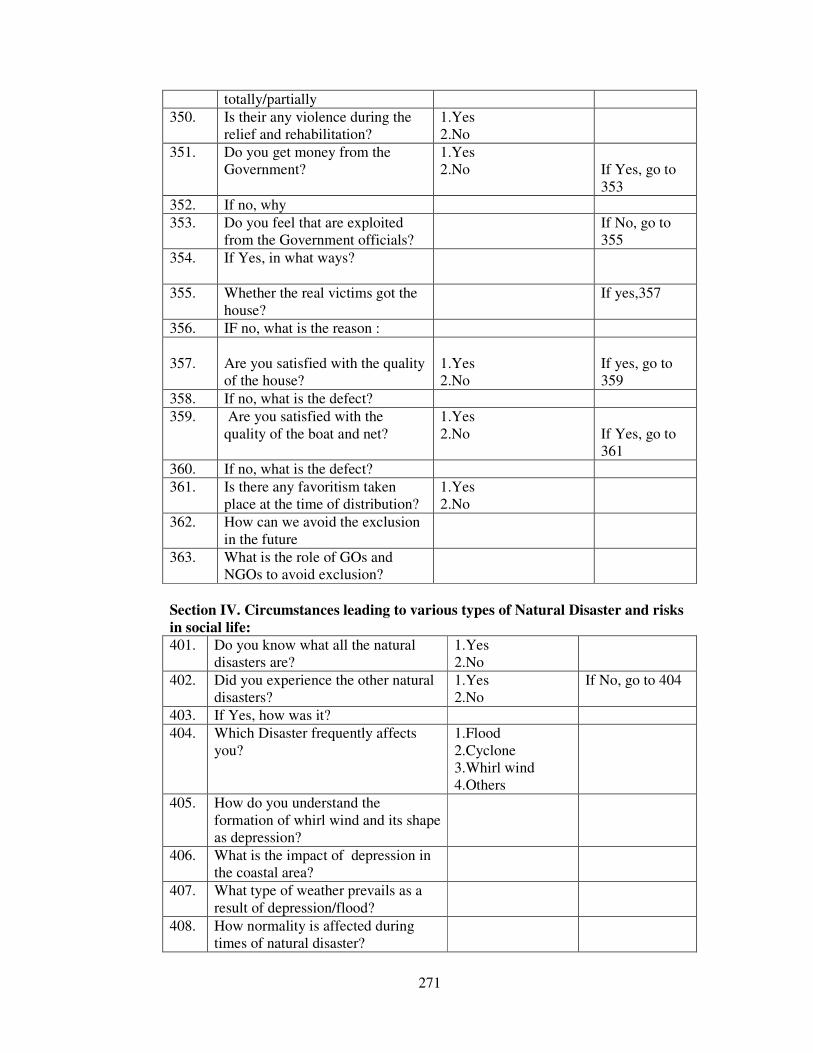
271
totally/partially
350. Is their any violence during the relief and rehabilitation?
1.Yes 2.No
351. Do you get money from the Government?
1.Yes 2.No
If Yes, go to 353
352. If no, why
353. Do you feel that are exploited from the Government officials?
If No, go to 355
354. If Yes, in what ways?
355. Whether the real victims got the house?
If yes,357
356. IF no, what is the reason :
357.
Are you satisfied with the quality of the house?
1.Yes 2.No
If yes, go to 359
358. If no, what is the defect?
359. Are you satisfied with the quality of the boat and net?
1.Yes 2.No
If Yes, go to 361
360. If no, what is the defect?
361. Is there any favoritism taken place at the time of distribution?
1.Yes 2.No
362. How can we avoid the exclusion in the future
363. What is the role of GOs and NGOs to avoid exclusion?
Section IV. Circumstances leading to various types of Natural Disaster and risks
in social life:
401. Do you know what all the natural disasters are?
1.Yes 2.No
402. Did you experience the other natural disasters?
1.Yes 2.No
If No, go to 404
403. If Yes, how was it?
404. Which Disaster frequently affects you?
1.Flood 2.Cyclone 3.Whirl wind 4.Others
405. How do you understand the formation of whirl wind and its shape as depression?
406. What is the impact of depression in the coastal area?
407. What type of weather prevails as a result of depression/flood?
408. How normality is affected during times of natural disaster?
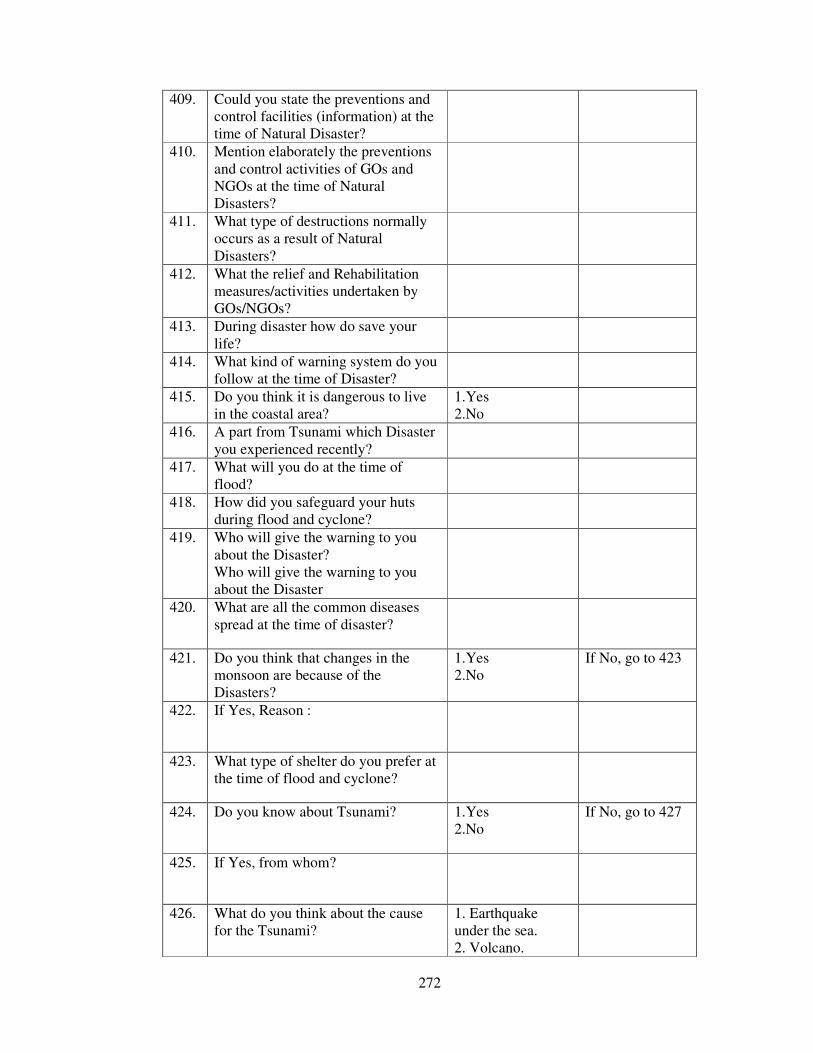
272
409. Could you state the preventions and control facilities (information) at the time of Natural Disaster?
410. Mention elaborately the preventions and control activities of GOs and NGOs at the time of Natural Disasters?
411. What type of destructions normally occurs as a result of Natural Disasters?
412. What the relief and Rehabilitation measures/activities undertaken by GOs/NGOs?
413. During disaster how do save your life?
414. What kind of warning system do you follow at the time of Disaster?
415. Do you think it is dangerous to live in the coastal area?
1.Yes 2.No
416. A part from Tsunami which Disaster you experienced recently?
417. What will you do at the time of flood?
418. How did you safeguard your huts during flood and cyclone?
419. Who will give the warning to you about the Disaster? Who will give the warning to you about the Disaster
420. What are all the common diseases spread at the time of disaster?
421. Do you think that changes in the monsoon are because of the Disasters?
1.Yes 2.No
If No, go to 423
422. If Yes, Reason :
423. What type of shelter do you prefer at the time of flood and cyclone?
424. Do you know about Tsunami? 1.Yes 2.No
If No, go to 427
425. If Yes, from whom?
426. What do you think about the cause for the Tsunami?
1. Earthquake under the sea. 2. Volcano.
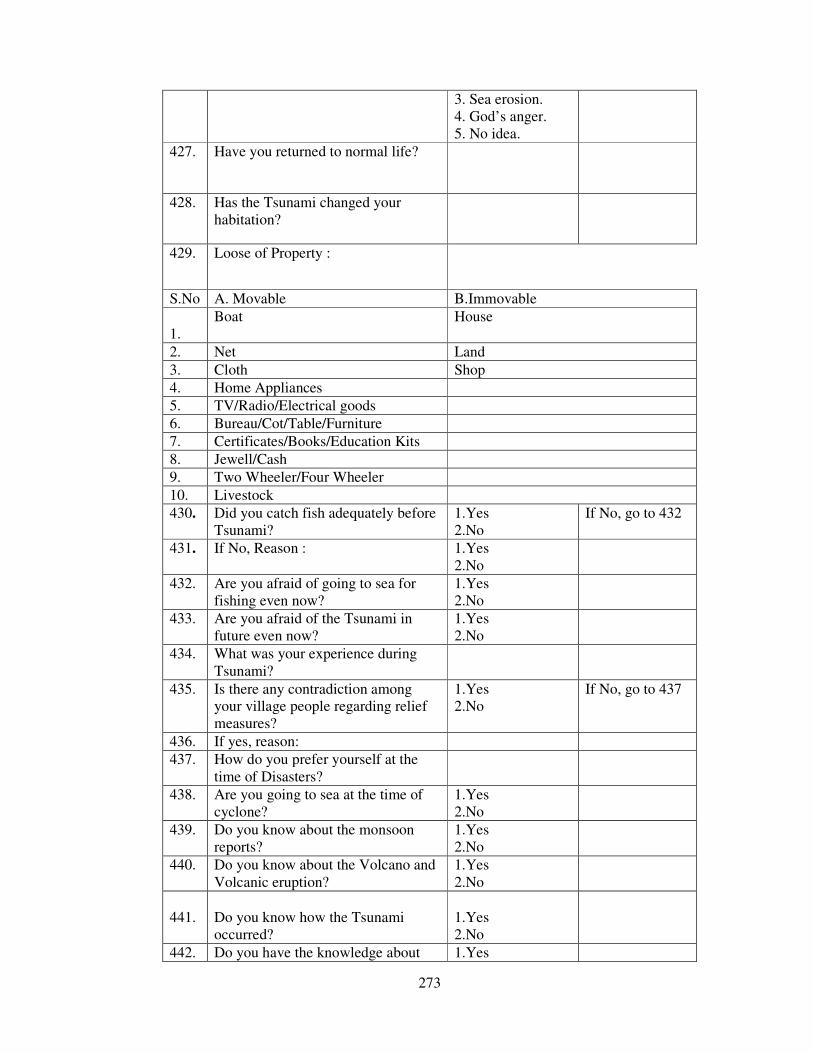
273
3. Sea erosion. 4. God’s anger. 5. No idea.
427. Have you returned to normal life?
428. Has the Tsunami changed your habitation?
429. Loose of Property :
S.No A. Movable B.Immovable
1.
Boat House
2. Net Land
3. Cloth Shop
4. Home Appliances
5. TV/Radio/Electrical goods
6. Bureau/Cot/Table/Furniture
7. Certificates/Books/Education Kits
8. Jewell/Cash
9. Two Wheeler/Four Wheeler
10. Livestock
430. Did you catch fish adequately before Tsunami?
1.Yes 2.No
If No, go to 432
431. If No, Reason : 1.Yes 2.No
432. Are you afraid of going to sea for fishing even now?
1.Yes 2.No
433. Are you afraid of the Tsunami in future even now?
1.Yes 2.No
434. What was your experience during Tsunami?
435. Is there any contradiction among your village people regarding relief measures?
1.Yes 2.No
If No, go to 437
436. If yes, reason:
437. How do you prefer yourself at the time of Disasters?
438. Are you going to sea at the time of cyclone?
1.Yes 2.No
439. Do you know about the monsoon reports?
1.Yes 2.No
440. Do you know about the Volcano and Volcanic eruption?
1.Yes 2.No
441.
Do you know how the Tsunami occurred?
1.Yes 2.No
442. Do you have the knowledge about 1.Yes
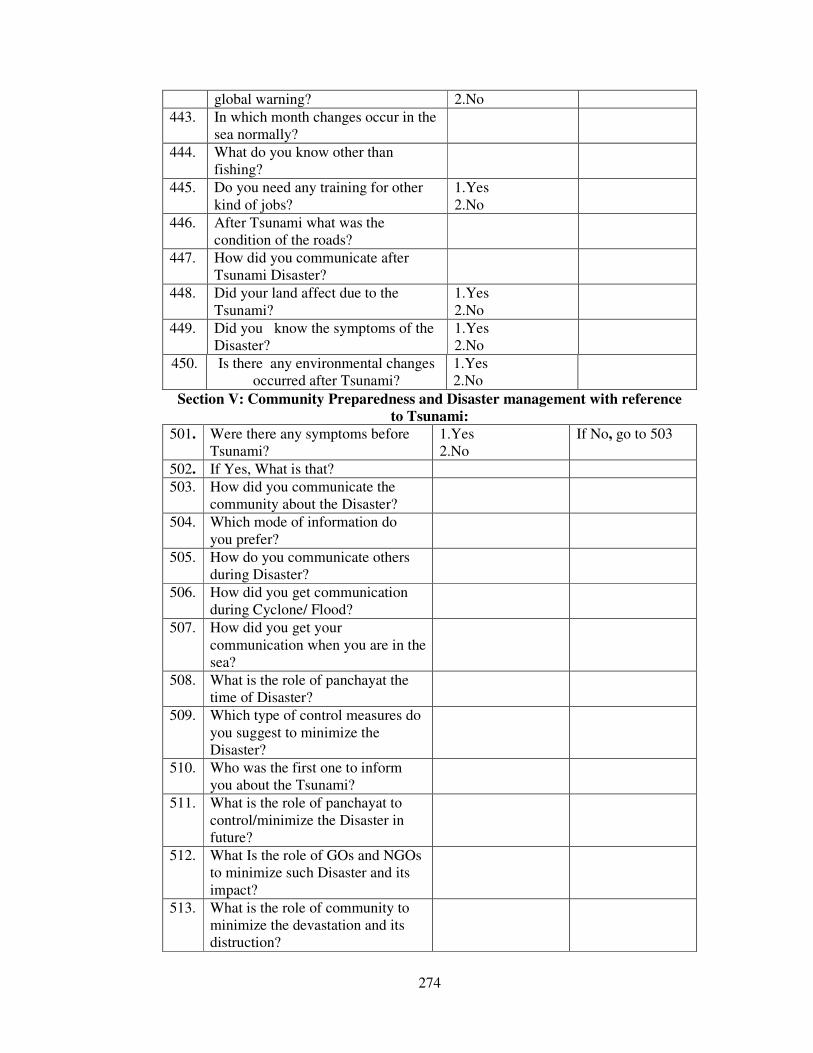
274
global warning? 2.No
443. In which month changes occur in the sea normally?
444. What do you know other than fishing?
445. Do you need any training for other kind of jobs?
1.Yes 2.No
446. After Tsunami what was the condition of the roads?
447. How did you communicate after Tsunami Disaster?
448. Did your land affect due to the Tsunami?
1.Yes 2.No
449. Did you know the symptoms of the Disaster?
1.Yes 2.No
450. Is there any environmental changes occurred after Tsunami?
1.Yes 2.No
Section V: Community Preparedness and Disaster management with reference
to Tsunami:
501. Were there any symptoms before Tsunami?
1.Yes 2.No
If No, go to 503
502. If Yes, What is that?
503. How did you communicate the community about the Disaster?
504. Which mode of information do you prefer?
505. How do you communicate others during Disaster?
506. How did you get communication during Cyclone/ Flood?
507. How did you get your communication when you are in the sea?
508. What is the role of panchayat the time of Disaster?
509. Which type of control measures do you suggest to minimize the Disaster?
510. Who was the first one to inform you about the Tsunami?
511. What is the role of panchayat to control/minimize the Disaster in future?
512. What Is the role of GOs and NGOs to minimize such Disaster and its impact?
513. What is the role of community to minimize the devastation and its distruction?
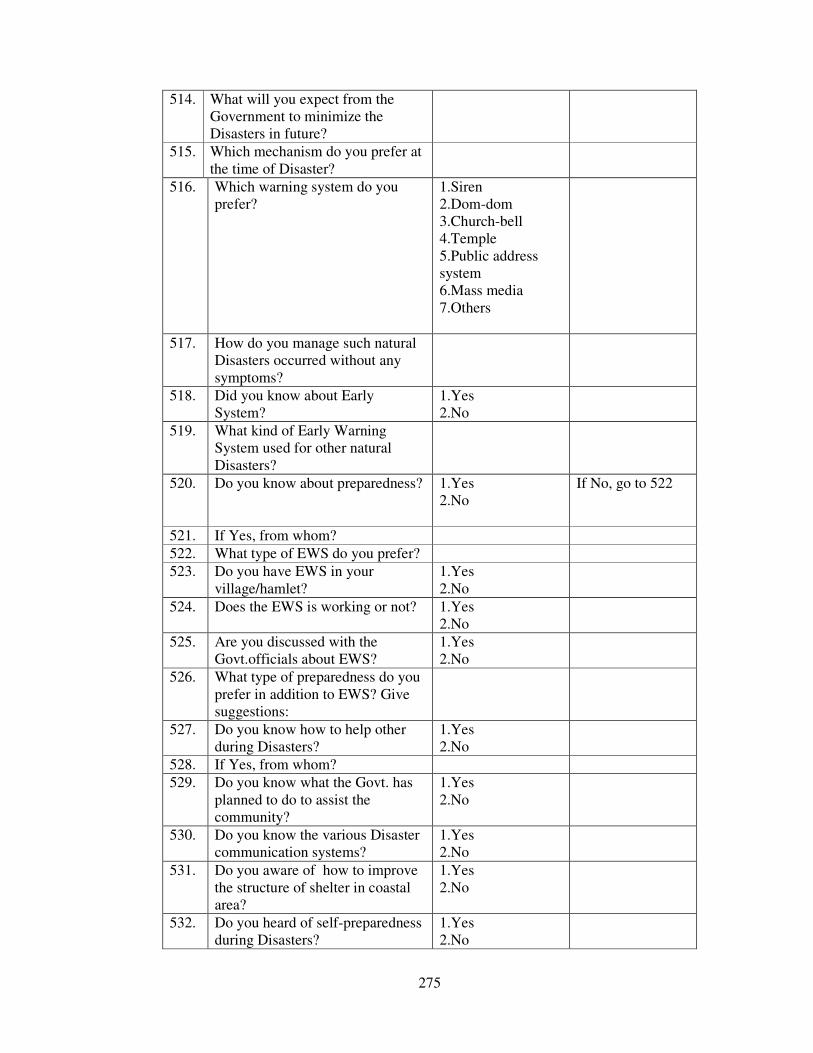
275
514. What will you expect from the Government to minimize the Disasters in future?
515. Which mechanism do you prefer at the time of Disaster?
516. Which warning system do you prefer?
1.Siren 2.Dom-dom 3.Church-bell 4.Temple 5.Public address system 6.Mass media 7.Others
517. How do you manage such natural Disasters occurred without any symptoms?
518. Did you know about Early System?
1.Yes 2.No
519. What kind of Early Warning System used for other natural Disasters?
520. Do you know about preparedness? 1.Yes 2.No
If No, go to 522
521. If Yes, from whom?
522. What type of EWS do you prefer?
523. Do you have EWS in your village/hamlet?
1.Yes 2.No
524. Does the EWS is working or not? 1.Yes 2.No
525. Are you discussed with the Govt.officials about EWS?
1.Yes 2.No
526. What type of preparedness do you prefer in addition to EWS? Give suggestions:
527. Do you know how to help other during Disasters?
1.Yes 2.No
528. If Yes, from whom?
529. Do you know what the Govt. has planned to do to assist the community?
1.Yes 2.No
530. Do you know the various Disaster communication systems?
1.Yes 2.No
531. Do you aware of how to improve the structure of shelter in coastal area?
1.Yes 2.No
532. Do you heard of self-preparedness during Disasters?
1.Yes 2.No
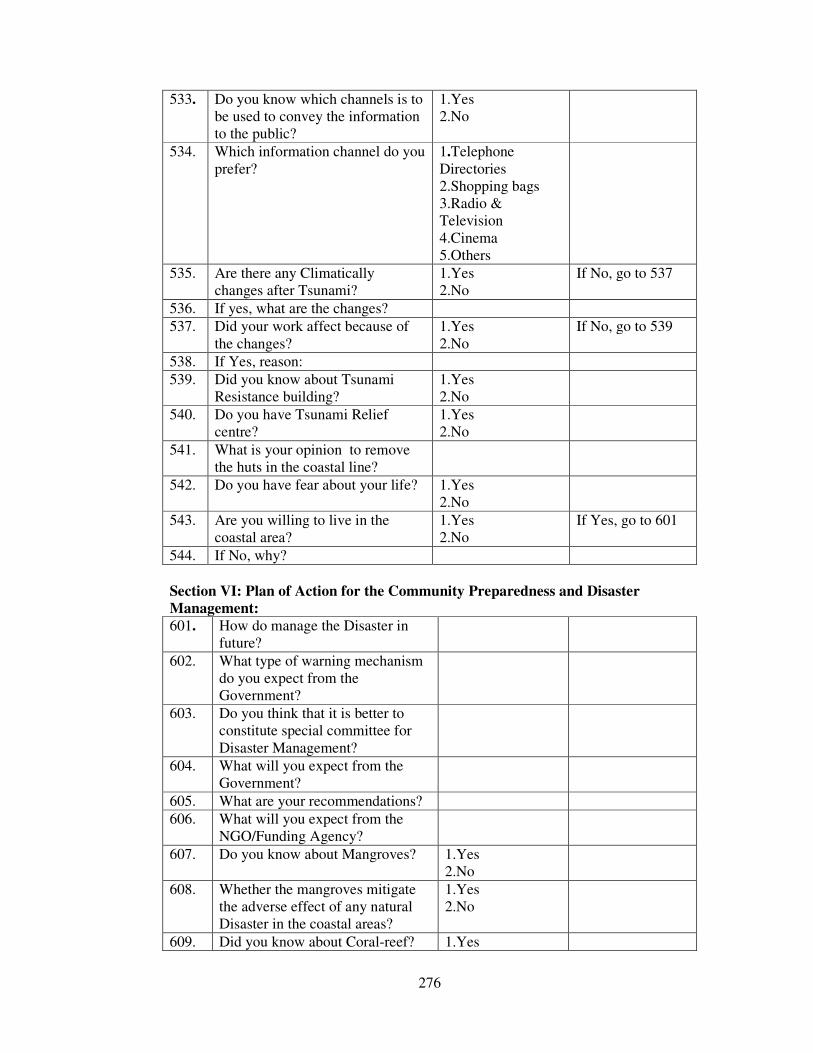
276
533. Do you know which channels is to be used to convey the information to the public?
1.Yes 2.No
534. Which information channel do you prefer?
1.Telephone Directories 2.Shopping bags 3.Radio & Television 4.Cinema 5.Others
535. Are there any Climatically changes after Tsunami?
1.Yes 2.No
If No, go to 537
536. If yes, what are the changes?
537. Did your work affect because of the changes?
1.Yes 2.No
If No, go to 539
538. If Yes, reason:
539. Did you know about Tsunami Resistance building?
1.Yes 2.No
540. Do you have Tsunami Relief centre?
1.Yes 2.No
541. What is your opinion to remove the huts in the coastal line?
542. Do you have fear about your life? 1.Yes 2.No
543. Are you willing to live in the coastal area?
1.Yes 2.No
If Yes, go to 601
544. If No, why?
Section VI: Plan of Action for the Community Preparedness and Disaster
Management:
601. How do manage the Disaster in future?
602. What type of warning mechanism do you expect from the Government?
603. Do you think that it is better to constitute special committee for Disaster Management?
604. What will you expect from the Government?
605. What are your recommendations?
606. What will you expect from the NGO/Funding Agency?
607. Do you know about Mangroves? 1.Yes 2.No
608. Whether the mangroves mitigate the adverse effect of any natural Disaster in the coastal areas?
1.Yes 2.No
609. Did you know about Coral-reef? 1.Yes
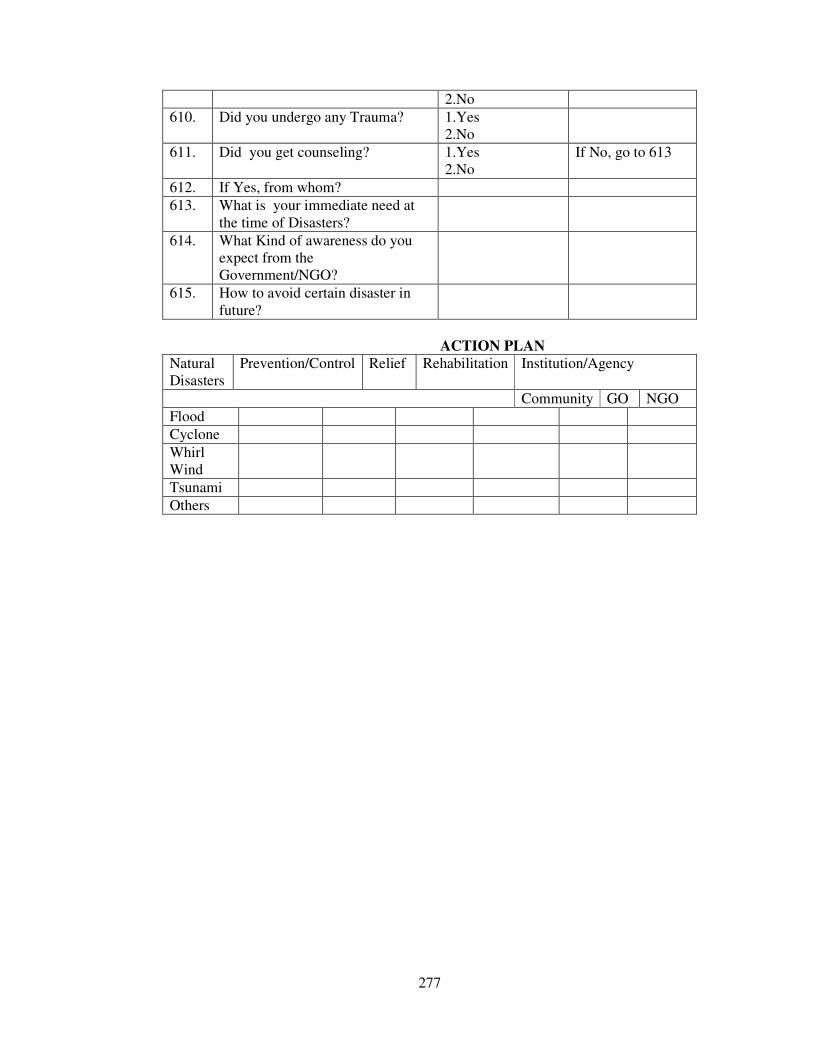
277
2.No
610. Did you undergo any Trauma? 1.Yes 2.No
611. Did you get counseling? 1.Yes 2.No
If No, go to 613
612. If Yes, from whom?
613. What is your immediate need at the time of Disasters?
614. What Kind of awareness do you expect from the Government/NGO?
615. How to avoid certain disaster in future?
ACTION PLAN
Natural Disasters
Prevention/Control Relief Rehabilitation Institution/Agency
Community GO NGO
Flood
Cyclone
Whirl Wind
Tsunami
Others