
Monograph - IIM Bangalore
225
INDIA & JAPAN A Relationship Explored Through Research & Webinars Volume #1 Compiled & Edited By Saideep Rathnam Krishna Sundar D
-
Upload
khangminh22 -
Category
Documents
-
view
1 -
download
0
Transcript of Monograph - IIM Bangalore
INDIA& JAPAN
A RelationshipExplored ThroughResearch & Webinars
Volume #1
Compiled & Edited By
Saideep RathnamKrishna Sundar D
Copyright © MIJSC, 2021
All rights reserved.
No part of this book may be reproduced in anyform on by an electronic or mechanical means,
including information storage and retrievalsystems, without permission in writing from thepublisher, except by a reviewer who may quote
brief passages in a review.
Every effort has been made to trace or contactall copyright holders. The publishers will be
pleased to make good any omissions or rectifyany mistakes brought to their attention at the
earliest opportunity.
Pictures: iStock / Getty Images / FreepikDesign by Prabha & Harsha Koda
Compiled & Edited By
Saideep Rathnam Chief Operating Officer
Mizuho India Japan Study Centre, IIMB
Krishna Sundar DProfessor & Chairperson
Mizuho India Japan Study Centre, IIMBChairperson, Digital innovation Lab, IIMB
INTRODUCTION
0 2
LEADERSHIP , MANAGEMENT & BUSINESS
0 4
A N N E X U R E S
3 3
INDEX
Fore ign D i rec t Inves tments - Prof Rupa Chanda - 05In te r -Governmenta l Agreements - Prof Rupa Chanda -06Bus iness Growth th rough Innovat ion - Mr. Babasaheb Kalyani - 07
Bus iness Group ing - Prof Subhashish Gupta - 09
Manufac tu r ing Compet i t i veness - Mr. Takeyuki Furuhashi - 10
STRATEGY
STRUCTURE
SYSTEM
INNOVATION , TRADITION AND SOCIETY
1 2
Rai lways Tr igger ing Soc io -Economic Trans fo rmat ion - Prof . N . Ravi - 13Humano id Robots Trans fo rming Man-Mach ine In te r face - Mr. Tomotaka Takahashi -14
Craf t Keep ing Trad i t ions A l i ve - Prof Suresh Bhagavatu la - 16
HARD INNOVATION & SOCIETY
SOFT INNOVATION & SOCIETY
PEOPLE , ART , AND CULTURE
1 7
Uniqueness o f Japanese Cu l tu re - Dr. Sandeep Goyal - 18Cul tu ra l S imi la r i t i es - Mr. Anupam Joshi - 20
Leader Vs Manager : Behav io ra l Dynamics - Mr. Jayaram Easwaran - 22
Doing Bus iness Across Cu l tu res - H idehi to Jay Araki - 24
Noh and Kut iya t tam - Prof . A Damodaran - 26
CULTURES
LEADERSHIP STYLES
BUSINESS APPROACHES
DANCE FORMS
SCIENCE , TECHNOLOGY AND SUSTAINABILITY
2 7
Rai lway Fre ight Corr idor - Prof . G Raghuram - 28Space Technology - Ms. Naoko Yamazaki - 29Susta ined L iv ing - Mr . Sa ideep Rathnam - 31
INTRODUCTION
Leadership, Management & Business.Innovation, Tradition & Society.People, Art, & Culture.Science, Technology & Sustainability.
India and Japan may be two relatively small nations on the map ofthe world, but the world has recognized that these two countries,where ancient wisdom and modern advancement coexist, areindeed unique - culturally rich and distinct from the rest of thenations.
This book focusses on bringing insights from researchers,leaders, entrepreneurs, artists, and scientists, integrated in sucha way as to present a refreshing perspective on life and societythat explores the close bond between India and Japan.
Mizuho India Japan Study Centre (MIJSC) funds researchprojects that focus on India and Japan relationships. It also hostsseminars/webinars that bring experts from various fields ofbusiness, technology, and cultural endeavors.
These research papers as well as webinars speak of successes andfailures, of doing business and dealing with competition, ofmaking friends and earning trust across borders, of exploringspace and conserving resources on the planet, of technology thatwill change the world, of historical ties of music, art, people andlanguage.
This book attempts to integrate the learning from researchprojects and the seminar/webinar series into four key chapters -
The details of researchers and speakers are shared in Annexures 1and 2 respectively.
02
0 3

LEADERSHIP,MANAGEMENTAND BUSINESS
In this chapter, five different perspectives fromthree researchers and two practitioners, aregrouped into three distinct elements namely –Strategy, Structure and Systems.
The strategy perspective explores Foreign Direct Investments (Prof. Rupa Chanda), Inter-Governmental Agreements (Prof. Rupa Chanda) and Business Growth through Innovation (Mr. Babasaheb Kalyani).
The Structure element covers the concept of Business Groups (Prof. Subhashish Gupta).
The System element covers the critical element of Manufacturing Competitiveness using the newparadigm of Flow Management (Mr. Takayuki Furuhashi).
STRUCTURESTRUCTURE SYSTEMSSYSTEMSFore ign D i rec t Inves tments -Pro f Rupa ChandaIn te r -Governmenta l Agreements - Pro f Rupa ChandaBus iness Growth th roughInnovat ion - Mr . BabasahebKa lyan i
Bus iness Group ing - Pro f Subhash ish Gupta
Manufac tu r ing Compet i t i veness- Mr . Takeyuk i Furuhash i
0 4
FOREIGN DIRECT INVESTMENTS
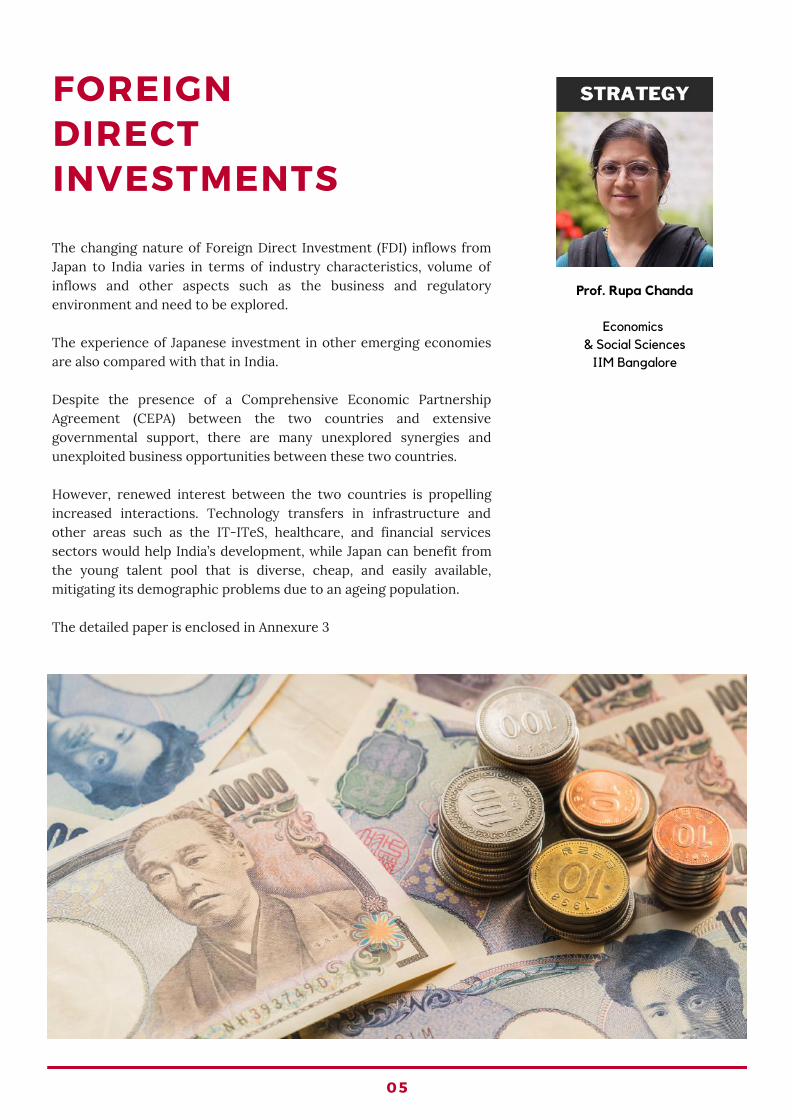
The changing nature of Foreign Direct Investment (FDI) inflows fromJapan to India varies in terms of industry characteristics, volume ofinflows and other aspects such as the business and regulatoryenvironment and need to be explored.
The experience of Japanese investment in other emerging economiesare also compared with that in India.
Despite the presence of a Comprehensive Economic PartnershipAgreement (CEPA) between the two countries and extensivegovernmental support, there are many unexplored synergies andunexploited business opportunities between these two countries.
However, renewed interest between the two countries is propellingincreased interactions. Technology transfers in infrastructure andother areas such as the IT-ITeS, healthcare, and financial servicessectors would help India’s development, while Japan can benefit fromthe young talent pool that is diverse, cheap, and easily available,mitigating its demographic problems due to an ageing population.
The detailed paper is enclosed in Annexure 3
Prof. Rupa Chanda
Economics & Social Sciences
IIM Bangalore
0 5

INTER-GOVERNMENTAL AGREEMENTS
Lauded as one of India’s most exhaustive trade agreements,Comprehensive Economic Partnership Agreement (CEPA) aims toliberalize and enhance trade in goods, services as well as investmentflows between the two countries. However, trends in bilateral tradesuggest that the bilateral potential remains untapped.
This study examines the prospects for expanding trade, investment,and other forms of engagement between India and Japan in the servicesector and the factors that currently constrain this potential. Itspecifically focuses on four service subsectors, namely, educationservices, IT and IT enabled services (ITeS), technology-based start-upsproviding services and engineering services.
The study also assesses the extent to which there is awareness of theCEPA among stakeholders on both sides and the likely efficacy of thisagreement in enabling the realization of expected benefits
The detailed paper is enclosed in Annexure 4.
Prof. Rupa Chanda
Economics & Social Sciences
IIM Bangalore
0 6
BUSINESS GROWTH THROUGH INNOVATION
To explore whether necessity was indeed the mother of invention, oneperspective is to study the effects of challenges posed to the nations,especially USA, by the two World Wars. The iconic book ‘Freedom’sForge’ by Arthur Herman, tells the story of how the ingenuity andenergy of American private sector ensured that the finest militaryforce of the world namely USA was well equipped to win the WW 2.The last pandemic i.e., Spanish flu is another example of howinnovation is triggered by need and how the knowledge impartedserves as a fuel for a revolution.
It is almost impossible to predict the demand for technology, as thetime taken to conceive and create something new may be so high thatthe developed technology may have become obsolete. In a VUCA(Volatile, Uncertain, Complex, Ambiguous) world the speed ofdevelopment of new technology needs to match with challengesthrown up by VUCA. It is therefore felt that constant innovation mustbe attempted across all sectors with a focus on digitization whichsupports all innovation. Understanding AI and reskilling people are theneeds of the hour for individuals, companies and nations. Companiesand countries need to invest in frontier technologies such ashypersonic travel, oceanic monitoring, epidemiology, healthcare,climate change issues, renewable energy, Fintech etc., in order to bebetter prepared for change.
Another focus area for companies and countries is to own intellectualproperty by becoming self-reliant, both at the Company level as wellas at the level of a nation. Many companies such as the Kalyani Grouphave made innovation as the lifestyle of their company and they ownthe IP or the technology that they use. However, owning technologydoes not mean working in isolation. Partnering with researchers,scientists, and institutions such as IITs, IIMs, DRDOs and otherresearch labs across the country are the way forward in nurturingentrepreneurship and frontier technology research. The advantage topartnering with academic institutions is a development of anecosystem of innovation which is accessible to all and is economicallysustainable.
As regards, partnership between nations, India and Japan have enjoyeda special strategic global partnership which is a winning combination,even as we work together with Africa and the Middle East towardsstrengthening our defense systems. India and Indian companies needto go beyond strategic relationships and develop an aspirationalgrowth mindset irrespective of opportunities and policies.
Mr. Babasaheb Kalyani
Chairman & MD Kalyani Group
0 7

As regards the approaches to counter economic stagnation, it is to benoted that the current environment has helped to stimulate the role ofprivate entrepreneurship in various sectors including indigenization ofdefense, smart innovation in agriculture etc., thereby leading Indiainto becoming third largest economy in the world. The key mantra isto focus more on policies for facilitating and nurturing industries whilenot losing sight of making the process inclusive where everybody gainsfrom the nation’s prosperity. We can adopt Japan’s model of self-reliance in our policies and entrepreneurs could take advantage asthey have done in Fintech and E-commerce sectors.
The globalization process has evolved over the years strengthening theeconomies of many nations including our own. The opposite ofglobalization is not isolation and disassociation. In a scenario ofconstant technological disruptions, what you excel at is alwaysexpendable and therefore one has to keep learning and evolving tosurvive.
In conclusion, it could be stated that business growth in anenvironment which is volatile, uncertain, complex, and ambiguous,there are no alternatives to innovations to survive and grow – whetherit is an individual, a company or a nation.
The webinar transcript is enclosed in Annexure 5.
0 8

BUSINESSGROUPING
The business groups in India and Japan could be analyzed by looking atthe evolution of the Asian business systems, their institutionalcharacteristics and the type of Asian business systems. For example,on the job training is more prevalent in Japan, Korea and Taiwan andAsian business groups are usually controlled by a family or is statecontrolled, with Japan being an exception.
The main types of Asian business systems are classified as postsocialist, advanced city economies (e.g. Singapore), advancedNortheast Asian (e.g. Taiwan) and the remaining. We further discussthe effect of multinational enterprises on Asian business systems,which has been significant and the same could be the experience withJapanese multinationals in India.
We then go on to discuss business groups in general, which is aprominent feature of Asian business systems. First, we distinguishbetween business groups and other structures such as conglomeratesin terms of their internal structures and management. This is followedby a discussion on the difference between business groups betweendeveloped and developing economies. Another critical issue is thefactors behind the creation of business groups, such as imperfectmarkets. It may be surmised that as an economy develops, the reasonfor the existence of business groups disappears. After that we look atthe features of Japanese and Indian business groups.
Finally, we discuss three papers on location choices of Japanese firms,management of alliances and strategies of Japanese firms, respectively.
The detailed paper is enclosed in Annexure 6.
Prof. Subhashish GuptaEconomics
& Social SciencesIIM Bangalore
0 9
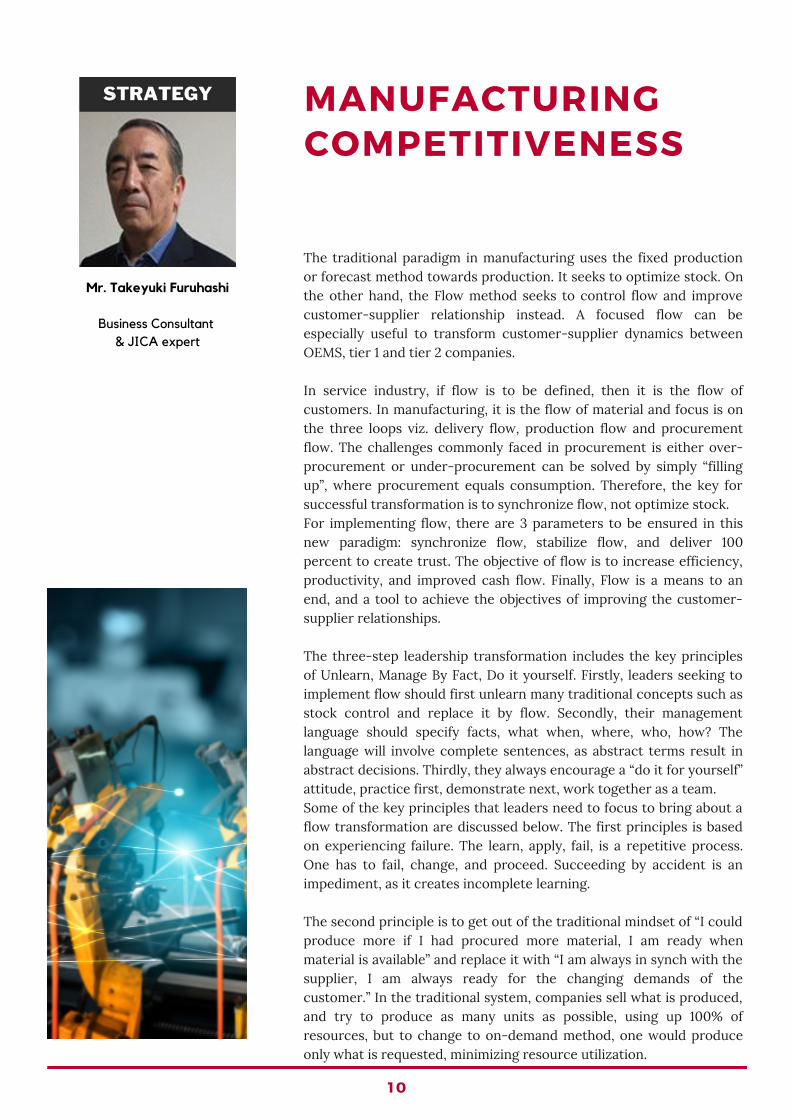
The traditional paradigm in manufacturing uses the fixed productionor forecast method towards production. It seeks to optimize stock. Onthe other hand, the Flow method seeks to control flow and improvecustomer-supplier relationship instead. A focused flow can beespecially useful to transform customer-supplier dynamics betweenOEMS, tier 1 and tier 2 companies.
In service industry, if flow is to be defined, then it is the flow ofcustomers. In manufacturing, it is the flow of material and focus is onthe three loops viz. delivery flow, production flow and procurementflow. The challenges commonly faced in procurement is either over-procurement or under-procurement can be solved by simply “fillingup”, where procurement equals consumption. Therefore, the key forsuccessful transformation is to synchronize flow, not optimize stock. For implementing flow, there are 3 parameters to be ensured in thisnew paradigm: synchronize flow, stabilize flow, and deliver 100percent to create trust. The objective of flow is to increase efficiency,productivity, and improved cash flow. Finally, Flow is a means to anend, and a tool to achieve the objectives of improving the customer-supplier relationships.
The three-step leadership transformation includes the key principlesof Unlearn, Manage By Fact, Do it yourself. Firstly, leaders seeking toimplement flow should first unlearn many traditional concepts such asstock control and replace it by flow. Secondly, their managementlanguage should specify facts, what when, where, who, how? Thelanguage will involve complete sentences, as abstract terms result inabstract decisions. Thirdly, they always encourage a “do it for yourself”attitude, practice first, demonstrate next, work together as a team. Some of the key principles that leaders need to focus to bring about aflow transformation are discussed below. The first principles is basedon experiencing failure. The learn, apply, fail, is a repetitive process.One has to fail, change, and proceed. Succeeding by accident is animpediment, as it creates incomplete learning.
The second principle is to get out of the traditional mindset of “I couldproduce more if I had procured more material, I am ready whenmaterial is available” and replace it with “I am always in synch with thesupplier, I am always ready for the changing demands of thecustomer.” In the traditional system, companies sell what is produced,and try to produce as many units as possible, using up 100% ofresources, but to change to on-demand method, one would produceonly what is requested, minimizing resource utilization.
1 0
MANUFACTURINGCOMPETITIVENESS
Mr. Takeyuki Furuhashi
Business Consultant & JICA expert
However, in the new paradigm, the plant needs to understand the endcustomer’s behaviour, and the leader is required to educate allinvolved on the end customer. In order to achieve this, the leader mustjump into the customer’s market. In on demand production, stock isproduced exactly as per requests, production is in synch with demand,and buffer stock is not necessary as stock never gets wasted. It alsoensures quick delivery. Therefore, to be intuitive, don’t look at shortterm reports, look at synchronization levels. Don’t let the constraintsof a financial view block synchronization.
The third principle is that in the supply chain, leaders need to buildpartnership with the suppliers to create a win-win arrangement. Thismeans that objective of the exercise to improve suppliers should notbe cost reduction but should be efficiency improvement.Implementation of flow principles would directly impact the cashflowsof companies, which is critical for small businesses, even more so thanfor the bigger companies.
The fourth principle is that the fundamentals of flow are applicable toall industries, irrespective of whether they are mass manufacturingtype, project type or even if they are service-type of industry. Thepriorities are based on sequential flow even as various functions havevaried time requirements. Every customer’s requirement is different.Every process has different cycle times. But average flow rate can bemeasured for each process, and a buffer time of nearly double theprocess time can be assigned. Soon there will be many lists ofprocesses, and any process can be planned. There is a stereotype thatflow is meant for automotive manufacturing alone. But when visualizedthis way, project type assignments are the same as flow process.
The fifth principle is that in improving flow, technology should beleveraged. Technology aids in the quick transfer of information, and IThelps to smoothen flow. This is especially useful when operatinginternationally or across long distances. A customer places a deliveryquest in the system, which takes information every day, therefore, theinformation transfer time reduces to zero.
In conclusion, it can be stated that application of flow principlesrequires the leaders to unlearn the old paradigms before learning thenew ones, synchronize production with both customers and suppliers,build partnership with suppliers based on mutual respect, recognizethat these principles are universally applicable to even service type ofindustry and leverage technology to ensure information flowsmoother, thereby ensuring 100% performance.
The webinar transcript is enclosed in Annexure 7.
1 1

1 2
INNOVATION,TRADITION & SOCIETY.
Three different perspectives from tworesearchers and one practitioner, are groupedinto three two elements namely - HardInnovation and Soft Innovation.
The 'Hard' innovation perspective discusses Railways triggering a Socio-Economic Transformation(Prof. N. Ravi). It also looks at Humanoid Robots transforming Man-Machine Interface (Mr. TomotakaTakahashi).
The 'Soft' innovation discussion looks at Crafts that keep traditions alive and its importance in asociety.
SOFT INNOVATIONSOFT INNOVATIONRai lways Tr igger ing Soc io -EconomicTrans fo rmat ion - Pro f . N . Rav iHumano id Robots Trans fo rming Man-Mach ineIn te r face - Mr . Tomotaka Takahash i
Cra f t Keep ing Trad i t ions A l i ve - Pro f SureshBhagavatu la

RAILWAYS TRIGGERING SOCIO-ECONOMICTRANSFORMATION
Indian Railways is a little over a century and a half old. Its developmentover the decades has been gradual. It has been and continues to be thelifeline for the socioeconomic growth of India, by connecting humansettlements across the country and simultaneously transportingvarious resources to centers of production and markets. Nationalizedin 1951, Indian Railways is among the largest rail networks in Asia andthe world’s second largest network operated under a singlemanagement. Its growth over the past 7 decades is focused upon.Indian Railways has always aimed to provide safety during travel. Therate of its development as a service organization has been modest,with two forces, one originating from political considerations balancedby another based on engineering competence.
High-speed rail travel emerged in Indian Railways in 1969, when thefirst high-speed limited-stop train service was introduced betweenNew Delhi and Kolkata. The origins of highspeed travel on IndianRailways will be traced and attempt to show how it has indeed helpedpassengers reach their destinations in less time. Any direct correlationbetween high-speed train travel and the growth of the economy, theeffect on the environment and society, while significant over the longterm, would be difficult to estimate empirically.
It would also be shown, in terms of policy flow and implications, howIndian railways has been unwavering in providing sustenance foreconomic growth. One common theme in these decades has been theinexorable drive to acquire and develop technology to ensure faster,inexpensive, and safer travel for all users. The increase in speed oftravel has been steady, progressive, and not an attempt at creatingrecords. Over the years, high-speed trains have enabled better qualityof life for professionals in India, especially in the age of globalization.However, the effect of this has been generally restricted to mediumdistance and suburban travel. In this scenario, the steps that have tobe taken by the provider and the user for making future high-speedrail travel profitable, productive, comfortable, and dependable wouldbe detailed.
The detailed paper is enclosed in Annexure 8.
1 3
Prof. N RaviCentre for
Public PolicyIIM Bangalore

The process of conception, design and application of robots isdiscussed in some detail. The Humanoid Robot Astronaut “Kirobo”(designed by Mr. Tomotaka Takahashi) was sent to the internationalspace station. Another battery promotor robot “Evolta” did a full length24-hour marathon course with AAA batteries which it achievedwithout changing batteries and has become a part of the GuinnessWorld Record challenge and was shown climbing a 1000-meter-highcliff for a TV commercial. The project of building a robot kit whereconsumers could build their own robots with the help of a guide waspublished in an Italian magazine for over 70 issues taking a whole yearto finally complete building the robot. In these series of popularizingrobots to the general public, the demonstration of a communicationrobot which talked, danced, did task like taking photographs,projecting them, making phone calls – all on voice command was trulyimpressive. Over 50 robot schools across Japan and Asia are helping inthe creation of various gadgets including highly technical gadgets likeself-maneuvering boats which can be used even in rough seas.
The application of humanoid robots needs to be understood beforethey are put to wider usage. A humanoid communication robots arenot meant for doing physical chores because it is impractical to chargea humanoid robot with something that could be accomplished by asingle task device such as a vacuum cleaner. A communication roboton the other hand is designed to be an interface between the humanbeing and all other devices. They function by learning the users’ needsand communicating tasks to the other devices accordingly. They alsoundertake a wide range of actions based on the users’ preferencesturning into an animate and adaptable companion. A comparisonbetween smart phones and robots explains how the appearance ofbeing alive made the robot interface more preferable to people andtherefore would be the next big area for innovation of software andhardware. The future venture called “Jiminy Cricket” is a concept of acrossover between a robot and a smart phone.
Another interesting dynamics in modern society is that unlike theearlier societies where necessity drove invention, innovation woulddrive the need in the society of the future. Social media is one suchexample which though not a necessity has several useful applicationssince its inception.
1 4
HUMANOID ROBOTSTRANSFORMINGMAN-MACHINEINTERFACE
Mr. Tomotaka TakahashiRoboticist& founder
ROBO-GARAGE

Another dilemma with regard to technological innovation is the battlebetween creation and analysis. The future society would focus oncreation and then exploring to see how this could be improved ratherthan an over-focus on analysis. This approach encourages people toadopt a fun-seeking and curiosity-induced approach to designing andcreating new technological innovations as against the old path ofdesign perfection followed by prototyping.
Robots in education is another way to help to teach children, acting asa companion in learning, encouraging competition amongst learnersand adding elements of fun. It can therefore be concluded that there isno right or wrong approach in innovation. It is something that onemust go ahead and try by themselves and perfect in small measures. The webinar transcript is enclosed in Annexure 9.
1 5

CRAFT: KEEPINGTRADITIONS ALIVE
Conventionally, cultural economics focuses more on the arts thancrafts. However, while art is acknowledged as a driver of innovation,crafts play an integral role in keeping traditions alive. While machineryand automation can provide convenience and better margins,handicrafts and their impact are often overlooked.
Handicrafts connect us to the past, where hand-operated tools madeeverything. While we no longer need handcrafted products in themodern technological world, there is something about theseimperfectly made products that make them aesthetically valuable toniche segments of the population. Making the products by handrequires skills and training that takes long years, and most of theseskills are learnt under the guidance of master craftspeople than in aformal educational institution. Japan has been one of the nations thatplaced handmade objects high in value and therefore developed policyframeworks to ensure that Japanese handicrafts find a market and canremain economically viable for their producers.
The objective of this study is to run through some of these uniquepolicies that have helped handicrafts thrive and stay relevant even intoday’s day and age. The study is divided into three parts. The first partcovers the history of the craft policies. The second part explores thehandloom sector in Kyoto with a specific focus on the Nishijin area. Inthe final part, the interactions with entrepreneurs, weavers and storeowners have been explored.
The detailed paper is enclosed in Annexure 10.
1 6
Prof SureshBhagavatula
ProfessorEntrepreneurship
IIM Bangalore
1 7
PEOPLE, ART, & CULTURE
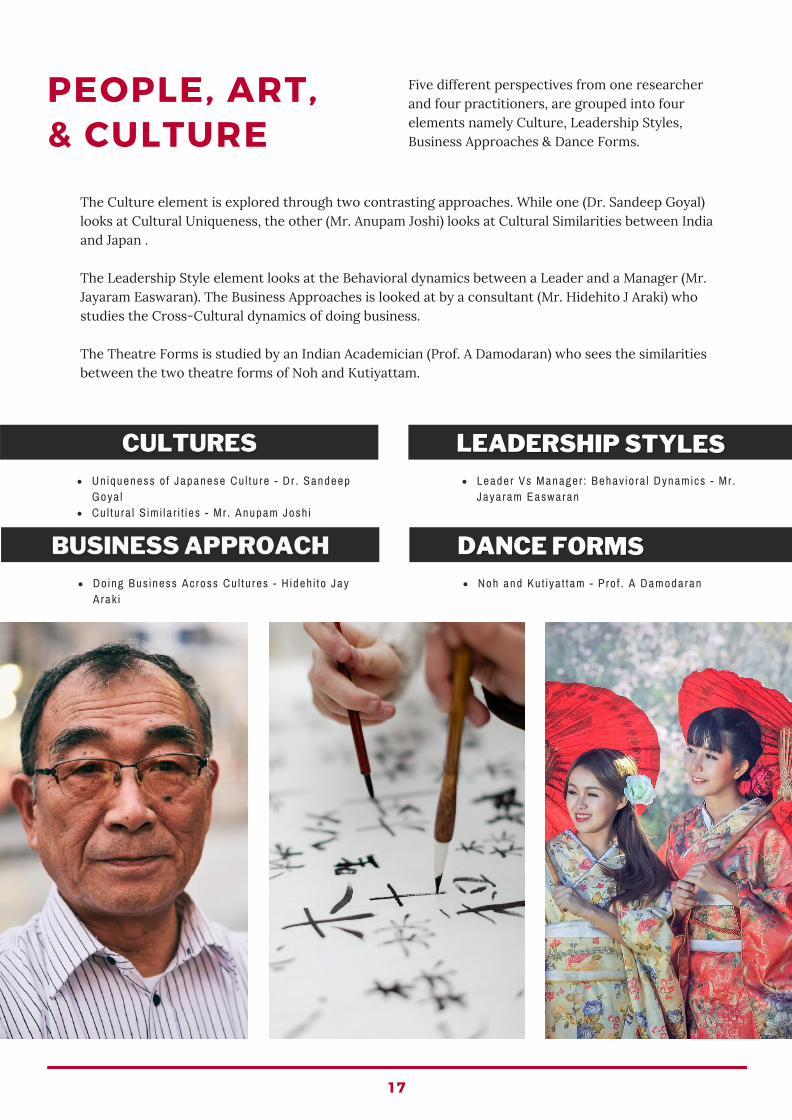
Five different perspectives from one researcherand four practitioners, are grouped into fourelements namely Culture, Leadership Styles,Business Approaches & Dance Forms.
The Culture element is explored through two contrasting approaches. While one (Dr. Sandeep Goyal)looks at Cultural Uniqueness, the other (Mr. Anupam Joshi) looks at Cultural Similarities between Indiaand Japan .
The Leadership Style element looks at the Behavioral dynamics between a Leader and a Manager (Mr.Jayaram Easwaran). The Business Approaches is looked at by a consultant (Mr. Hidehito J Araki) whostudies the Cross-Cultural dynamics of doing business.
The Theatre Forms is studied by an Indian Academician (Prof. A Damodaran) who sees the similaritiesbetween the two theatre forms of Noh and Kutiyattam.
LEADERSHIP STYLESLEADERSHIP STYLESUniqueness o f Japanese Cu l tu re - Dr . SandeepGoya lCu l tu ra l S imi la r i t i es - Mr . Anupam Josh i
Leader Vs Manager : Behav io ra l Dynamics - Mr .Jayaram Easwaran
DANCE FORMSDANCE FORMSDoing Bus iness Across Cu l tu res - H ideh i to JayArak i
Noh and Kut iya t tam - Pro f . A Damodaran

Some of the most unique aspects about ‘Japan that surprises the world’is the focus on perfection, pride in one’s work and personal ethics.Another unique aspect of Japanese society is the overt focus ontechnological innovations, which sometimes borders on obsessiveness.The wearable air conditioner is one such example of masterpiece ofinnovation which focuses on touching common people’s lives.
In the 1990’s of Japan, a unique cultural fad was born “Tamagotchi”, adigital pet, with features that simulate taking care of a real pet, whichbegan to trend very fast and symbolically indicating the importance ofthe man-machine interfaces in Japanese society. At the root of theseinnovations lies simplicity. The evolutionary marvel of the Japanesetoilets which integrates customers conveniences with simplicity ofproduct design, demonstrates the Japanese culture of manufacturinggoods that are crafted to suit consumers’ every need. The focus onenhancing the beauty of everyday objects like manhole covers bydecorating and showcasing them highlights the integration of cultureand innovation that has made Japan a cultural superpower in the eyesof the world.
The technological revolution of developing and building fast trainssymbolized by Shinkansen highlights the focus on efficiency (e.g. nodelays), customer convenience (e.g. rotating seats) and customerdelight (e.g. video games) that make them quite unique. Anotherunique aspect of Japanese society is its focus on the sense of disciplineand commitment that has become an intrinsic part of the psyche ofthe people, as exemplified by the unique bus drivers’ strike, schoolchildren cleaning the school premises and spectators cleaning thewhole stadium after a football world cup match. This seems topercolate into everyday aspects of life. Making available umbrellas forpublic use, installing reading glasses in front of public notices etc.,indicate the focus on discipline, efficiency and focus on details. Thefascinating concepts such as capsule hotels and napping rooms aresome more examples of Japanese innovativeness.
Another unique aspect of Japanese society is the coexistence oftradition and technology. The Hakone black eggs, a delicacy availablein the volcanic regions of Japan, are marketed as food that supposedlyextends a person’s life.
1 8
UNIQUENESS OFJAPANESE CULTURE
Dr. Sandeep GoyalChairman
India Advisory Board of Snap Inc.

The concepts of branded fruits and square watermelon are otherexamples of the marrying tradition to needs of the modernmarketplace. The narrative of Daruma Dolls is used as commemorationof sorts for new beginnings and congratulations for a job well done.However, the impact of strict norms within Japanese society enforcingthe traditions can sometimes lead to a high-pressure environmentwhich can cause people to become social recluses. Also, the Japaneseare trained from their childhood in the one-thing-after-anotherapproach which may affect their ability to multitask or think out-of-the-box.
In conclusion, it could indeed be said that Japan does indeed surprisethe World with its ability to innovate, adapt and grow through a focuson discipline, customer focus and efficiency.
The webinar transcript is enclosed in Annexure 11.
1 9
Though the cultures of India and Japan are unique by themselves, adeeper study seems to indicate that there are cultural similarities thatare astonishing, probably due to the shared identities of the twosocieties. In order to understand this, it is imperative that one mustlearn the languages of the two countries to fully grasp thedevelopmental history and the cultural nuances.
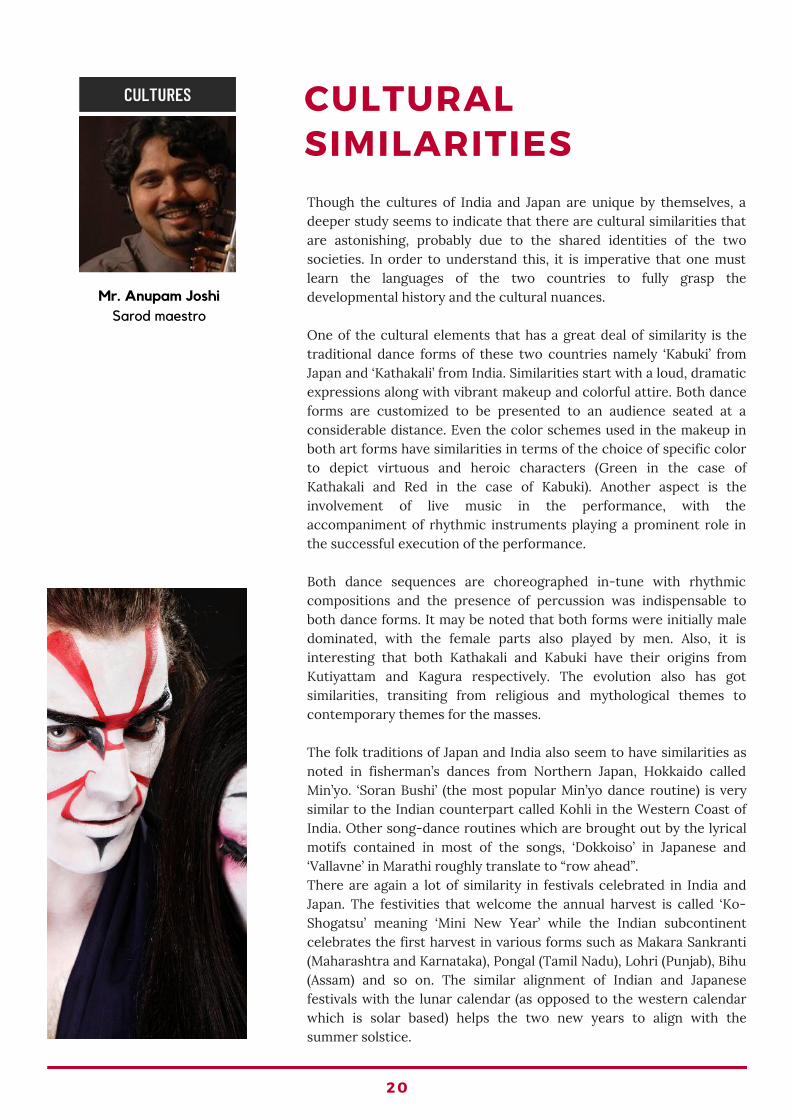
One of the cultural elements that has a great deal of similarity is thetraditional dance forms of these two countries namely ‘Kabuki’ fromJapan and ‘Kathakali’ from India. Similarities start with a loud, dramaticexpressions along with vibrant makeup and colorful attire. Both danceforms are customized to be presented to an audience seated at aconsiderable distance. Even the color schemes used in the makeup inboth art forms have similarities in terms of the choice of specific colorto depict virtuous and heroic characters (Green in the case ofKathakali and Red in the case of Kabuki). Another aspect is theinvolvement of live music in the performance, with theaccompaniment of rhythmic instruments playing a prominent role inthe successful execution of the performance.
Both dance sequences are choreographed in-tune with rhythmiccompositions and the presence of percussion was indispensable toboth dance forms. It may be noted that both forms were initially maledominated, with the female parts also played by men. Also, it isinteresting that both Kathakali and Kabuki have their origins fromKutiyattam and Kagura respectively. The evolution also has gotsimilarities, transiting from religious and mythological themes tocontemporary themes for the masses.
The folk traditions of Japan and India also seem to have similarities asnoted in fisherman’s dances from Northern Japan, Hokkaido calledMin’yo. ‘Soran Bushi’ (the most popular Min’yo dance routine) is verysimilar to the Indian counterpart called Kohli in the Western Coast ofIndia. Other song-dance routines which are brought out by the lyricalmotifs contained in most of the songs, ‘Dokkoiso’ in Japanese and‘Vallavne’ in Marathi roughly translate to “row ahead”.There are again a lot of similarity in festivals celebrated in India andJapan. The festivities that welcome the annual harvest is called ‘Ko-Shogatsu’ meaning ‘Mini New Year’ while the Indian subcontinentcelebrates the first harvest in various forms such as Makara Sankranti(Maharashtra and Karnataka), Pongal (Tamil Nadu), Lohri (Punjab), Bihu(Assam) and so on. The similar alignment of Indian and Japanesefestivals with the lunar calendar (as opposed to the western calendarwhich is solar based) helps the two new years to align with thesummer solstice.
2 0
CULTURALSIMILARITIES
Mr. Anupam JoshiSarod maestro

The cultural similarities in terms of festive attires that are tuned tosymbolic representations of bountiful harvest such as clothes andaccessories made with rice husk. The common tradition of preparingand sharing the produce of the harvest with friends and family is alsocuriously similar. In Maharashtra, a festive hamper of sugarcane,assorted sweets etc., is made in every household similar to theJapanese homes where Koshogatsu gift assortment and a special ricesweet dish called Mochi is shared with near and dear ones. It isinteresting that though in modern Japan and modern India people livein urban areas, the customs of harvest festivals are still widelypracticed.
Another astonishing similarity is with ‘Obon Matsuri’ of Japan and‘Pitrupaksh’ in India which are customs to pay homage to the deceasedspirits of the ancestors. It is interesting to note that both Obon andPitrupaksh fall on the same day of the year and they are practiced afterthe seventh lunar cycle of every year. Some of the other rites for thedead such as ‘Osho Shiki’ (in Japan) and ‘Vhaiswana’ (western India) arealso very similar.
Other similarities of comparing the origin, form and attributes ofdeities worshipped in India and Japan have also great similarities.Ganesha is placed in Fukuoka Tower and similar displays of Brahma,Saraswathi and other gods are seen in various parts of Japan. DeitiesShiva and Daikoten are both known as beings of completeness indestruction, adhering to similar notions that destruction and creationare both continuous processes of nature.
The similarities in the language are also quite astonishing when onestudies the idioms, phrases and expressions. Many phrases expressingsimilar sentiments are noted such as ‘Ittekimasu’ (I shall be back) aresimilar to ‘Jaake Aata Hoon’ (Hindi) or ‘Yeto’ (Marathi) (I shall leave andreturn). Other expressions like ‘Mimi Ga Karui’ and ‘Halka Kaanancha’(Marathi) both mean ‘Light Years’ to describe people as gullible.There are many more similarities in traditional art forms, but unlike inIndia, the Japanese classical art forms did not emerge as a distinctgenre, though traditional songs and dances are still part of theJapanese cultural practices even today.
In conclusion, we see that the cultural similarities between these twoancient cultures are truly astonishing, ranging from music/dance,gods/festivals, social practices, and even the language!
The webinar transcript is enclosed in Annexure 12.
2 1
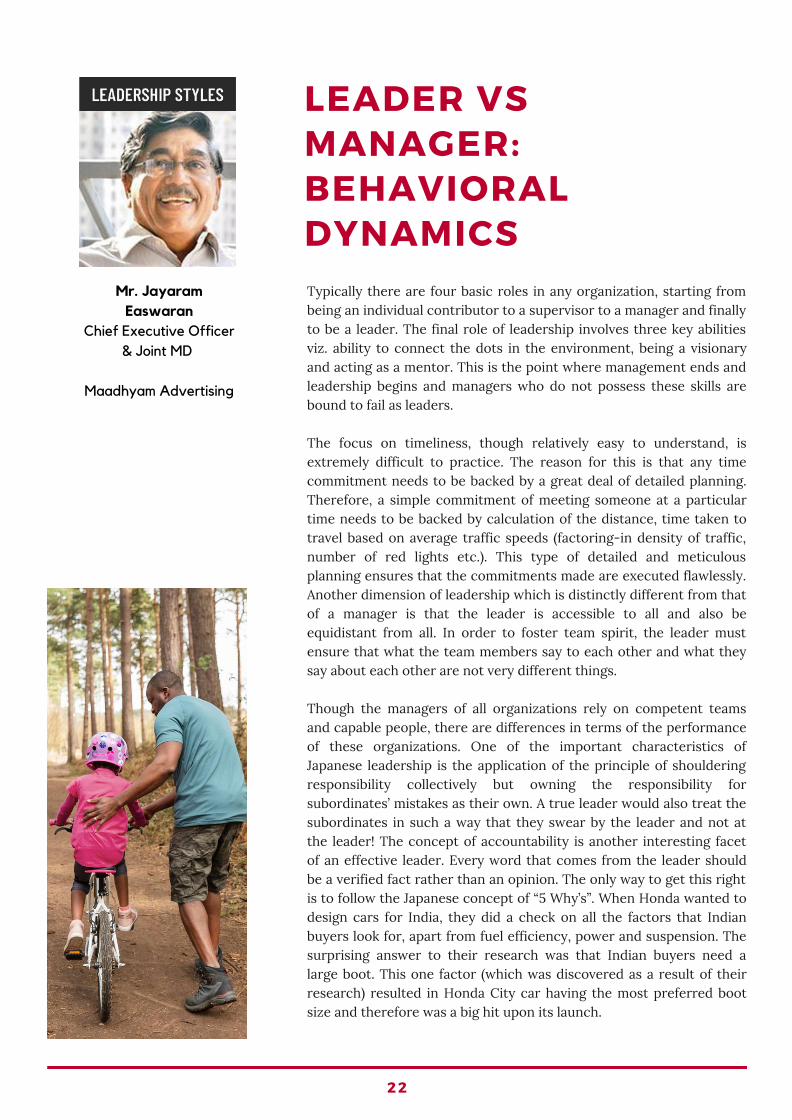
Typically there are four basic roles in any organization, starting frombeing an individual contributor to a supervisor to a manager and finallyto be a leader. The final role of leadership involves three key abilitiesviz. ability to connect the dots in the environment, being a visionaryand acting as a mentor. This is the point where management ends andleadership begins and managers who do not possess these skills arebound to fail as leaders.
The focus on timeliness, though relatively easy to understand, isextremely difficult to practice. The reason for this is that any timecommitment needs to be backed by a great deal of detailed planning.Therefore, a simple commitment of meeting someone at a particulartime needs to be backed by calculation of the distance, time taken totravel based on average traffic speeds (factoring-in density of traffic,number of red lights etc.). This type of detailed and meticulousplanning ensures that the commitments made are executed flawlessly.Another dimension of leadership which is distinctly different from thatof a manager is that the leader is accessible to all and also beequidistant from all. In order to foster team spirit, the leader mustensure that what the team members say to each other and what theysay about each other are not very different things.
Though the managers of all organizations rely on competent teamsand capable people, there are differences in terms of the performanceof these organizations. One of the important characteristics ofJapanese leadership is the application of the principle of shoulderingresponsibility collectively but owning the responsibility forsubordinates’ mistakes as their own. A true leader would also treat thesubordinates in such a way that they swear by the leader and not atthe leader! The concept of accountability is another interesting facetof an effective leader. Every word that comes from the leader shouldbe a verified fact rather than an opinion. The only way to get this rightis to follow the Japanese concept of “5 Why’s”. When Honda wanted todesign cars for India, they did a check on all the factors that Indianbuyers look for, apart from fuel efficiency, power and suspension. Thesurprising answer to their research was that Indian buyers need alarge boot. This one factor (which was discovered as a result of theirresearch) resulted in Honda City car having the most preferred bootsize and therefore was a big hit upon its launch.
2 2
LEADER VSMANAGER:BEHAVIORALDYNAMICS
Mr. JayaramEaswaran
Chief Executive Officer& Joint MD
Maadhyam Advertising

Another aspect of transformational leader is the ‘first time right policy’across business cultures. The focus on facts not opinions requires thatdecisions must emanate from the lower levels of the hierarchy who arein touch with the facts.
Another important lesson about true power for a leader is to recognizethe sign of power after stripping it off the trapping of success andfocusing on the ability to influence one’s environment. A true leader isone who understands that the usual perceptions of power such assigning authority, designation, size of one’s team, ability to hire/fireand even the size of one’s cabin are just the trappings of success. Atrue leader therefore understands that trust is power and a leader’scontribution is not always recognized and rewarded.
However, a true leader recognizes that like a proud football coachbringing the best of the team watching his prodigies being applauded,the thrill of watching someone grow etc., are truly worthwhile andirreplaceable.A good leader understands that one never interacts with an individualor a set of individuals, but always with the company as a collectivewhole. The leader recognizes that the only way to gain others’ trust isto become worthy of their trust.
It is therefore seen that the behavioral dynamics of effective leaders,whether Indian or Japanese, are similar, with a focus on shoulderingaccountability (while delegating responsibility), being accessible (whilekeeping distance), and focusing on facts (while questioning opinions).
The webinar transcript is enclosed in Annexure 13.
2 3
Growth-oriented companies always look for new markets to capture.Even when these new markets are within the same country, there aremany challenges. However, when these new markets are acrossnations, the challenges faced by the companies are huge, particularlywhen companies are dealing with countries such as India and Japanwhich are quite unique in their own specific ways. Though thegovernments of both India and Japan have been encouraging tradeacross these two countries through special strategic globalpartnerships and trade/investment alliances, the gap in expectationand reality on the trade front is quite big, leading to a great deal ofhesitancy by the corporates. Apart from the culture gap, language gapand perception gap, one of the key failure factors is a lack of long-termfocus by the companies.
The most critical is the culture gap. India and Japan share manycommonalities including both being well-established democracies. Thecultures of both these nations are also rich in shared aims withemphasis on traditional beliefs and customs, respect for family andelders etc. However, the differences are also striking. The inability ofbusinesses to assimilate the differences in cultural nuances is apossible failure factor. It is critical to recognize that cultural influencesgreatly affect the growth of a business. India’s cultural diversity is aunique strength (and a weakness in certain circumstances), whereasthe Japanese culture, with its homogeneity, is something to be adaptedto. Unless the companies make a conscious effort for culturalalignment, harnessing the beliefs, customs, and preferences of theirnew market, it would be impossible to penetrate the market.
Secondly, the language gap is an obvious but tricky failure factor.Though India is a multilingual nation, it has adopted English as acommon business language nationwide, which makes it attractive forwestern manufacturers. However, for Japanese businesses, it remainsa challenge that needs to be addressed in a focused manner. Similarly,Indian businesses which want to focus on the Japanese market couldlook at bridging this language gap by hiring local talent as appropriate.
2 4
DOING BUSINESSACROSS CULTURES
Mr. Hidehito J ArakiSenior management
consultant
The third major hurdle is the perception gap, which is mainly due tothe lack of adequate flow of information between India and Japan. Thelongstanding preconceptions about the Indians by the Japanese andvice versa would start to play a major role, thereby creatingcommunication barriers. Interactions between the two nations ingeneral and people-to-people exchange in particular, are still on a lowkey, thereby preventing aggressive business expansions across thesetwo countries. In this context, student, academia, Government, andindustry level exchanges are crucial. Currently, the number of Indianstudents going to Japan for higher education is often as low as 2000per year, even though the tuition fees are very low compared to thewestern countries. If the perception gaps are addressed, many Indianstudents would go to Japan, learn about technological advances, buildrapport with the local people - thereby enriching themselves and thenations.
The fourth hurdle is the lack of a long-term focus. For Japanesebusinesses to succeed in India and vice versa, companies must come-in for the long haul to be able to understand local practices, customerexpectations, and cultivate the market effectively. Companies that donot have this focus would ultimately fail.
Apart from addressing the failure factors as above, there are manycompanies who have found the right approach to success intransnational business. If businesses focus on the uniqueness of theproduct/service which is being offered which addresses a particularmarket need, the acceptance of the product and therefore the growthof the company is assured. The examples of Honda Motorcycle &Scooter and Unicharm are two examples of Japanese businesses whichhave made their mark on the Indian market through their uniqueofferings. Similarly, Infosys has made a mark in Japan by offering aunique product/service (ERP) in the late nineties which helped themto establish their business in Japan.
Transnational businesses would also succeed if the synergies betweenthe two nations are clearly understood and exploited. Japan is home tothousands of companies with great technological advancements andestablished quality culture. However, Japan seems to be poor inmarketing these across the globe and especially to India. However,India has strong skills in building customer interfaces through itsmarketing, branding, and sales strategies. If the strengths of Japan andIndia are synergized, many Indian and Japanese companies, especiallySMEs, have great potential for success.
The different demographics of the two countries, with India’s youngpopulation and Japan’s ageing population, could also be adequatelyleveraged, especially in the field of technical manpower. Japan has adeficit of technically qualified young people which could be addressedthrough suitable training/other interventions by India.
2 5
India and Japan couldbecome a great winningcombination in defence,trade service industry andeven in manufacturing. The size of therelationship between thetwo countries can grow asbig as the aspirations ofits people, as there is stilla lot of space for it togrow.
In conclusion, one can saythat the factors thatnegatively affecttransnational businessesneed to be addressedthrough a focus on imagebuilding and gaining oftrust. Understanding thelanguage and culturalnuances of the targetcountry are as importantas the long-term focus. The different strengthsof the two countriescould be synergizedleading to much greateroverall output. Forexample, Japan’s obviousstrength in manufacturinghigh level of qualitycontrol could besynergized with India’sprowess in the field ofsales and marketing,thereby creating a win-win combination. Thoughmaking transnationalbusinesses to succeedtakes time it is extremelyrewarding and enrichingas one would be learningand applying the bestpractices of bothcultures.
The webinar transcript isenclosed in Annexure 14.
2 6
NOH ANDKUTIYATTAM
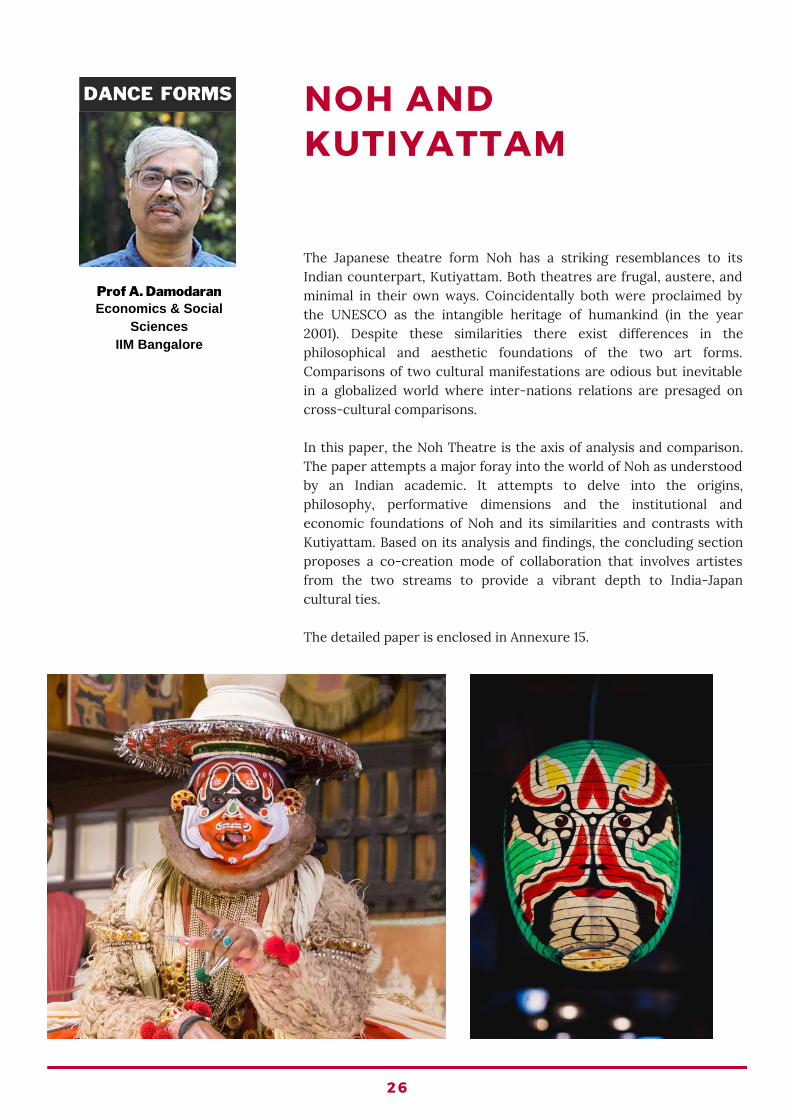
The Japanese theatre form Noh has a striking resemblances to itsIndian counterpart, Kutiyattam. Both theatres are frugal, austere, andminimal in their own ways. Coincidentally both were proclaimed bythe UNESCO as the intangible heritage of humankind (in the year2001). Despite these similarities there exist differences in thephilosophical and aesthetic foundations of the two art forms.Comparisons of two cultural manifestations are odious but inevitablein a globalized world where inter-nations relations are presaged oncross-cultural comparisons.
In this paper, the Noh Theatre is the axis of analysis and comparison.The paper attempts a major foray into the world of Noh as understoodby an Indian academic. It attempts to delve into the origins,philosophy, performative dimensions and the institutional andeconomic foundations of Noh and its similarities and contrasts withKutiyattam. Based on its analysis and findings, the concluding sectionproposes a co-creation mode of collaboration that involves artistesfrom the two streams to provide a vibrant depth to India-Japancultural ties.
The detailed paper is enclosed in Annexure 15.
Prof A. DamodaranEconomics & Social
SciencesIIM Bangalore

2 7
SCIENCE,TECHNOLOGY &SUSTAINABILITY
Two different perspectives from one researcher and one practitioner are studied with respect to theirimpact on sustainability.
The Railway Freight Corridor’s impact on sustainability is discussed by an academician (Prof GRaghuram).
The Space Science and its impact on sustainability is discussed by an Astronaut (Ms. Naoko Yamazaki).
TECHNOLOGYTECHNOLOGY SUSTAINABILITYSUSTAINABILITYRai lway Fre igh t Cor r idor - Pro f .G Raghuram
Space Techno logy - Ms. NaokoYamazak i
Sus ta ined L iv ing
RAILWAY FREIGHT CORRIDIR
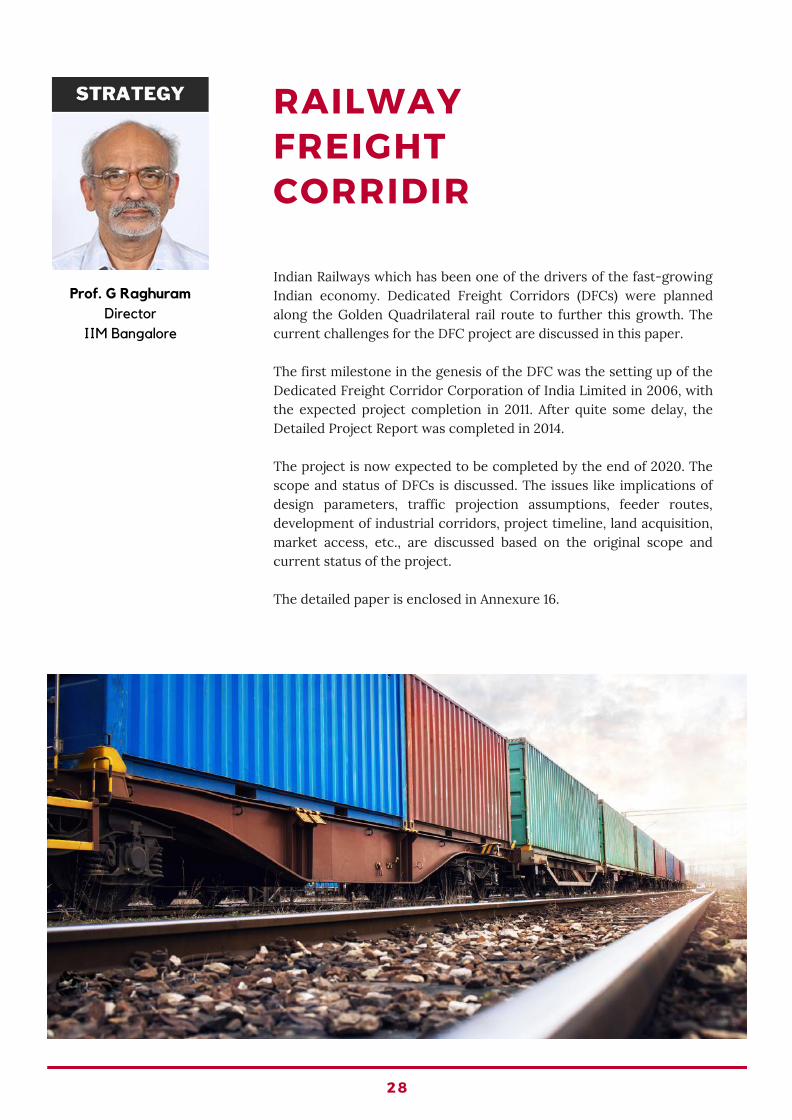
Indian Railways which has been one of the drivers of the fast-growingIndian economy. Dedicated Freight Corridors (DFCs) were plannedalong the Golden Quadrilateral rail route to further this growth. Thecurrent challenges for the DFC project are discussed in this paper.
The first milestone in the genesis of the DFC was the setting up of theDedicated Freight Corridor Corporation of India Limited in 2006, withthe expected project completion in 2011. After quite some delay, theDetailed Project Report was completed in 2014.
The project is now expected to be completed by the end of 2020. Thescope and status of DFCs is discussed. The issues like implications ofdesign parameters, traffic projection assumptions, feeder routes,development of industrial corridors, project timeline, land acquisition,market access, etc., are discussed based on the original scope andcurrent status of the project.
The detailed paper is enclosed in Annexure 16.
2 8
Prof. G RaghuramDirector
IIM Bangalore

SPACE TECHNOLOGY
Learning from space science and technology is a very challenging butrewarding exercise. Apart from science and technology, space travelfocuses on team building, leadership, and situational awareness. Thehuman beings’ perspective also changes substantially when one is inspace, because in space there is no concept of up or down and eachperson has his/her own axis. For being effective space traveler, onehas to understand not only one’s own axis, but also that of the others’axes too, which is a concept worth bringing back to Earth.
Another key element of life in space is the need for being hyper-organized, with not even a minute to spare, with very short breaks formeals that are also staggered. One of the recent interestingdiscoveries has been that life span of microbes in space gets extendedwhich means that one has to be extra cautious about biocontaminationin space. Another aspect of space life is the effect of alteredenvironment on muscles and bone density with muscles decreasing by1% per day and bone density decreasing by 1.5% every month. This hasmany implications for people on Earth as well. Though the impact ofnon-usage of muscles on Earth is not as dramatic as in space, thedecay is present even on Earth and unless it is compensated for bymandatory workout, it would add up to debilitating disorders.
The International Space Station (ISS) project is symbolic of the unitedefforts of countries and many more such projects are in the pipelinewith collaboration between USA, Canada, Japan, India, and Europeanagencies with a potential for more nations to get onboard.
While expanding the frontiers there is a need to develop sustainabletechnology in space. Currently, water (including urine and sweat) andthe atmosphere inside the spaceship are recycled, but the levels areonly at around 60%. While energy is solar generated, we have toconsider alternatives for longer journeys. Though currently food iscompletely relayed from the ground, it might not be long beforeexperiments to grow food in space would yield results. The concept of3D printers is being considered with regards to food generation too.The discovery of water on the polar regions of Mars and other moonsand presence of priceless worth of metals on asteroids haveencouraged several probes and space mining.
Space exploration is expensive both in terms of money as well asresources and therefore the question which needs to be answered iswhether it is worth spending the resources on this type of study.
2 9
Ms. Naoko YamazakiJapanese astronaut
at JAXA

To answer this question, one must look at the prospect of discoveringresources and habitats for the future through a study of the universeand fueling innovation and gathering inputs to preserve our planet.The mining of asteroids for rare metals and to inhabiting life on otherplanets may sound impractical at the moment, but the technologicalpossibilities are improving each day, impacting on possible solutions toenvironmental and societal problems on Earth. The changingatmospheres of one’s inhabitable plans forces a serious rethink ondeveloping sustainable attitudes both on Earth and in space.
The technological solutions to accommodate human mistakes andprepare for high-risk situations using AI has many implications forlong-term space travel as well as long-term habitation on Earth. Thechallenges of space travel includes the serious concerns of biologicalcontamination in space. Though there are several guidelines aboutreleasing life in space and bringing back extraterrestrial samples toEarth, the implications of any slipup in following these rules are stillnot fully understood.
Our planet is breathtaking, but the atmosphere is fragile as a mere 3%of available water is shared amongst 7.7 billion people. In a way wecould consider our planet as a spaceship Earth. In conclusion, the sunis resplendent during the days, but in the night the influence ofmankind can be seen from space reminding us that we can accomplishmuch more to conserve sustain and explore.
The webinar transcript is enclosed in Annexure 17.
3 0
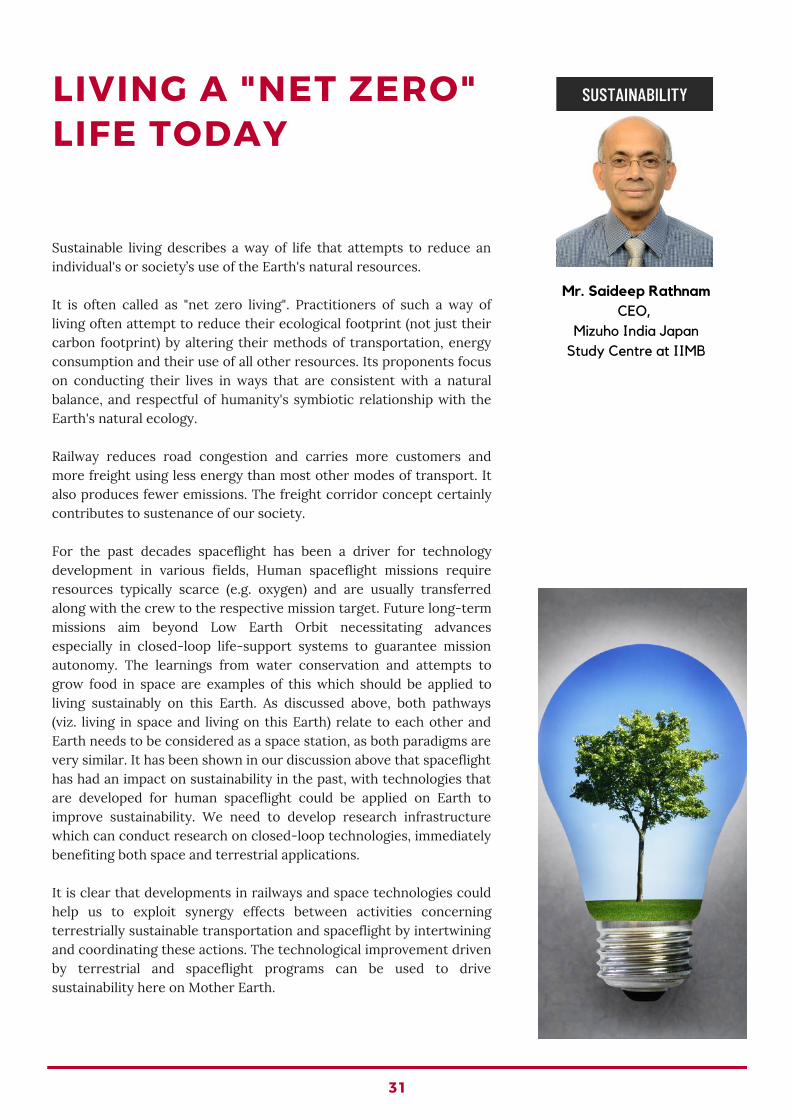
LIVING A "NET ZERO"LIFE TODAY
Sustainable living describes a way of life that attempts to reduce anindividual's or society’s use of the Earth's natural resources.
It is often called as "net zero living". Practitioners of such a way ofliving often attempt to reduce their ecological footprint (not just theircarbon footprint) by altering their methods of transportation, energyconsumption and their use of all other resources. Its proponents focuson conducting their lives in ways that are consistent with a naturalbalance, and respectful of humanity's symbiotic relationship with theEarth's natural ecology.
Railway reduces road congestion and carries more customers andmore freight using less energy than most other modes of transport. Italso produces fewer emissions. The freight corridor concept certainlycontributes to sustenance of our society.
For the past decades spaceflight has been a driver for technologydevelopment in various fields, Human spaceflight missions requireresources typically scarce (e.g. oxygen) and are usually transferredalong with the crew to the respective mission target. Future long-termmissions aim beyond Low Earth Orbit necessitating advancesespecially in closed-loop life-support systems to guarantee missionautonomy. The learnings from water conservation and attempts togrow food in space are examples of this which should be applied toliving sustainably on this Earth. As discussed above, both pathways(viz. living in space and living on this Earth) relate to each other andEarth needs to be considered as a space station, as both paradigms arevery similar. It has been shown in our discussion above that spaceflighthas had an impact on sustainability in the past, with technologies thatare developed for human spaceflight could be applied on Earth toimprove sustainability. We need to develop research infrastructurewhich can conduct research on closed-loop technologies, immediatelybenefiting both space and terrestrial applications.
It is clear that developments in railways and space technologies couldhelp us to exploit synergy effects between activities concerningterrestrially sustainable transportation and spaceflight by intertwiningand coordinating these actions. The technological improvement drivenby terrestrial and spaceflight programs can be used to drivesustainability here on Mother Earth.
3 1
Mr. Saideep RathnamCEO,
Mizuho India JapanStudy Centre at IIMB

ANNEXURES
ReasearchersSpeakersFore ign Direct Investments - Prof Rupa ChandaInter -Governmenta l Agreements - Prof Rupa ChandaBusiness Growth through Innovat ion - Mr . Babasaheb KalyaniBusiness Grouping - Prof Subhashish Gupta Manufactur ing Compet i t iveness - Mr . Takeyuki FuruhashiRai lways Tr igger ing Socio-Economic Transformat ion - Prof . N . RaviHumanoid Robots Transforming Man-Machine In ter face - Mr . Tomotaka TakahashiCraf t Keeping Tradi t ions Al ive - Prof Suresh Bhagavatu laUniqueness of Japanese Cul ture - Dr . Sandeep GoyalCul tura l S imi lar i t ies - Mr . Anupam JoshiLeader Vs Manager: Behaviora l Dynamics - Mr . Jayaram EaswaranDoing Business Across Cul tures - H idehi to Jay ArakiNoh and Kut iyat tam - Prof . A DamodaranRai lway Fre ight Corr idor - Prof . G RaghuramSpace Technology - Ms. Naoko Yamazaki


ANNEXURE #1
Researchers
Featured in this publication
Prof. Rupa Chanda
Rupa Chanda has been a Professor of Economics at IIM Bangalore since 1997. Prior to joining IIMB, she was an
economist at the International Monetary Fund in Washington, DC. She briefly served as the Head, UNESCAP
Sub-regional Office for South and South-West Asia in New Delhi, while on leave from IIMB.
Prof. Subhashish Gupta
Professor Gupta’s interests are in Industrial Organization, Regulation, Antitrust, Economics of Organizations, and
Telecommunications. He has taught Managerial Economics, Game Theory, Industrial Organization, Regulation and
Advanced Microeconomics. He was previously chair of the ESS Area and Admissions Chair for IIMB.
Prof. A. Damodaran
Professor Damodaran did his doctoral studies in Economics. He has also held Visiting Faculty positions at the
University of Bonn, Germany, Institute of Developing Economies, Japan, University of Wageningen, Netherlands, and
the Graduate School of Management, St Petersburg State University in Russia. He was part of India’s delegation
to CBD to negotiate Biodiversity Financing issues in COP 11.
Prof. Suresh Bhagavatula
Prof. Suresh Bhagavatula is a Professor of Entrepreneurship at IIM Bangalore who has done his Masters and doctoral
studies abroad. He is interested and done extensive research in the field of Entrepreneurship in the context of urban
and rural India and also in Social Capital within teams and organizations.
Prof. N. Ravi
N Ravi, PGP '82 joined the Centre for Public Policy (CPP) at IIM Bangalore as Senior Fellow in November 2010. A
seasoned bureaucrat, he retired from the Indian Foreign Service (IFS) in December 2009 after working for nearly 37
years in different positions in India and abroad. He was also in charge of Economic Relations of India with all
countries of the world which included ASEM, ASEAN, ARF, BIMSTEC, EAS, GCC and SAARC. His postings abroad have
been in Belgrade, Tokyo, Bhutan, Moscow, Munich and an ambassadorial stint in Vietnam.
Prof. G. Raghuram
Prof. G. Raghuram has a PhD from Northwestern University, USA, a Postgraduate Diploma in Management (PGDM)
from IIM Ahmedabad and a BTech degree from IIT Madras. He was Professor and Chairperson of the Public Systems
Group and Dean Faculty of IIM Ahmedabad. He was Vice-Chancellor of the Indian Maritime University and the Indian
Railways Chair Professor. He has served on various government policy making and advisory committees for the
Ministry of Civil Aviation, Ministry of Consumer Affairs and Public Distribution, Ministry of Railways, Ministry of Road
Transport and Highways, Ministry of Shipping, Cabinet Secretariat, Comptroller and Auditor General, the Planning
Commission and various State Governments.
35

ANNEXURE #2
Researchers
Featured in this publication
Dr. Sandeep Goyal
Dr. Goyal is a self-confessed Nihonophile. Over the years, he handled multiple Japanese brands – such as Toyota,
Honda, Suzuki, Hino, Mitsubishi, Nissan, Sony and many more. A former Group CEO of Zee Telefilms and current
Chairman of the India Advisory Board of Snapchat, Dr. Goyal is an MBA and a PhD from FMS-Delhi, besides being an
alumnus of Harvard Business School’s prestigious OPM program. Dr. Goyal has published 6 books; two of which are
well acclaimed books on Japan: Konjo – The Fighting Spirit and Japan Made Easy. Both books are Harper Collins
publications.
Mr. Tomotaka Takahashi
Tomotaka Takahashi is one of Japan’s leading new-generation robot scientists, known for creating humanoid
communication robots. Takahashi San is the founder and CEO of Robo Garage, Founder of Marine-X, and a Research
Associate Professor of The University of Tokyo and Visiting Professor of Osaka Electro-Communication University. His
journey has involved researching, creating, designing, inventing, and manufacturing humanoid robot prototypes from
scratch. His inventions include Robot Astronaut, ‘Kirobo’ and the Grand Canyon scaler, ‘Evolta’ which also hold 4
Guinness World Records.
Mr. Anupam Joshi
Shri. Anupam Joshi a musical genius who serves the society by the means of his musical instrument "The Sarod".
Joshi San was very proud when the Hollywood Documentary “Among the Believers” in which he played Sarod won an
award at the Hollywood film festival. Joshi San now gives performances in India and across the world including many
of the prestigious music festivals like Sawai Gandharv Mahotsav Kundgol. Joshi San is also a trained Japanese
language consultant who spent over a decade and half to learn the intricacies of Japanese culture and experimented
with a fusion of Indian and Japanese language and art forms.
Ms. Naoko Yamazaki
Naoko Yamazaki is a former Japanese Aerospace Exploration Agency (JAXA) astronaut, space engineer, and mission
specialist who served on-board NASA’s Space Shuttle Discovery STS-131 and the International Space Station (ISS).
Naoko Yamazaki San is the second Japanese woman to fly to space for assembly and is the co-founder of Space Port
Japan, an organization with a focus on exploring commercial space travel in Asia. She is also a member of Space
Policy Committee of the Cabinet Office, Japan, and advisor to the Young Astronaut Club, and the chairperson of
“Sorajo” (Women in Space), a step to promote women in STEM fields.
Mr. Babasaheb Neelkanth Kalyani
Babasaheb Neelkanth Kalyani is the Chairman & Managing Director of Bharat Forge Limited (BFL), Kalyani Group, a
leading engineering conglomerate with flagship of USD 3 billion. As the Founding President of the Society of Indian
Defence Manufacturers and as the Chairman, CII – National Committee for Defence, Mr. Kalyani has been
championing and increasing the participation of private industry in India’s Defence Manufacturing in devising a
favorable policy framework to encourage private sector investments. Mr Baba Kalyani has been conferred with many
highest civilian awards including Padma Bhushan by the Hon. President of India and the Order of the Rising Sun, Gold,
and Silver Star by the Government of Japan.
Mr. Jayaram Easwaran
Mr. Jayaram Easwaran is an alumnus of IIM Bangalore, Independent Director at Jindal Stainless Ltd., and Director at
Casa Blanka India Consulting Pvt. Ltd. He has over three decades of experience in leadership positions in global
36
corporations. Key amongst these was his role as the Head of Corporate Marketing at the Eicher Group: Mitsubishi
Trucks, Royal Enfield Motorcycles, and Tractors. A key aspect here was to manage the interface with Mitsubishi
Corporation and Mitsubishi Motors Corporation, Japan. He is a management consultant and mentor and writes a
regular column in Business World. His book is published by Harper Collins.
Mr. Hidehito Jay Araki
Mr. Hidehito Jay Araki is currently working as the Director at Japan Business, Udyen Jain & Associates and Sekusui
Chemicals Pvt. He has over three decades of experience in leadership positions. Key amongst these are Mitsubishi
Corporation, Mitsubishi Motors, Isuzu, Toyota, VW, Audi, Yamaha, Suzuki, Nikon, Canon, Casio, Pigeon, Pfizer, Veritus,
etc. He is also a management consultant. He is the official coordinator for JETRO's SME Overseas Expansion Platform
and a columnist on Mainichi Asia Business Report. He is also working with Japanese embassy in India to promote
"SAKE" and "Green Tea" in India.
Mr. Furuhashi Takeyuki
Mr. Furuhashi joined Chu-San-Ren (Central Japan Industries Association) in 1972 and started his journey as a
management consultant. Later from the beginning of 1980s, he started consultation services of transforming
production & supply system by “focusing flow,” applying so called Toyota Model of Production System (TPS). He
brings a wealth of knowledge derived from his vast consulting experience in mixed industries from automotive
industry to general & project type of industries. Furuhashi San involved in organizing various training programmes
for ASEAN, EU, South Africa, etc. Since 2007 he joined Visionary Leaders for Manufacturing (VLFM) Programme in
India as a faculty member and has been conducting Visionary SME Course.
37

ANNEXURE #3
Prof. Rupa Chanda
The Trends in FDI Inflows from Japan to India
Table of Contents
Abstract
1. Introduction
1.1 Statement of the Research Problem
1.2 Research Methodology
1.3 Scope and Objectives of the Study
2. Review of Literature
3. FDI from Japan to India
3.1 Japan’s FDI inflows to India
3.2 Sector wise distribution of FDI Flows
3.2.1 Automobile Industry
3.2.2 Drugs and Pharmaceuticals
3.2.3 Service Sector
3.2.4 Metallurgical Industries
3.2.5 Telecommunications
3.2.6 Tourism
4. Institutional Initiatives
4.1 Japan International Cooperation Agency (JICA)
4.2 Ahmedabad – Mumbai bullet train project
4.3 Industrial Townships
4.4 Smart Cities
4.5 Japan Plus
5. A study of Japan’s investment experience in India vis-à-vis the world
5.1 Japan’s investment experience in India
5.1.1 Business and regulatory environment
5.1.2 Institutional Aspects
5.2 A study of Japan’s investment experience in other new emerging markets
6. Conclusion
References
List of Tables
List of Figures
38

Abstract
This report on Foreign Direct Investment (FDI) provides insights into the characteristics of FDI inflows from Japan to
India. It outlines the changing nature of the inflows in terms of industry characteristics, volume of inflows and other
aspects such as the business and regulatory environment, based on secondary sources of information. It compares
the experience of Japanese investment in other emerging economies with that in India. The report explains that
despite having a Comprehensive Economic Partnership Agreement (CEPA) between the two countries and
government support, there exist unexplored synergies and business opportunities. However, renewed interest
between the two countries is propelling their interaction. Technology transfers in infrastructure and other areas such
as the IT-ITeS, healthcare, and financial services sectors will help India’s development, while Japan can benefit from
the young talent pool that is diverse, cheap and easily available, mitigating its demographic problems due to an
ageing population.
Keywords: FDI, emerging economies, India-Japan relations, institutional regulations, ODI.
1. Introduction
Japan and India have had a long history of bilateral ties. Cultural and religious exchanges began with the spread of
Buddhism from India to Japan, followed by intermittent exchanges till the signing of ‘Treaty of Peace between Japan
and India’ in 1952. This treaty established more formal diplomatic relations between the two following India’s
independence. This was accentuated by two policies; Japan’s ‘Free and Open India and Pacific Strategy’, and India’s
‘Look East’, and presently, ‘Act East’ policy. Trade between the two nations began with India supplying iron ore to aid
Japan’s reconstruction after the Second World War, and Japan began to provide aid in the form of Official
Development Assistance (ODA), from 1958. At present, Japan is India’s highest ODA donor. Despite cordial diplomatic
relations and numerous facilitation mechanisms, there is much unrealized scope to increase bilateral trade and
investment flows. Over the years, Japan’s trade with China has increased, while trade with India has remained
stagnant despite China and India having similar growth trajectories in the 20th century. However, with the advent of
India’s liberalization policy and robust economic growth, Japanese companies and both governments have shown
renewed interest in expanding bilateral relations.
1.1. Statement of the Research Problem
Despite abundant trade and investment opportunities between the two nations, bilateral trade and investment
between the two remains low. This study is a preliminary exploration of the existing pattern of Foreign Direct
Investment (FDI) inflows from Japan to India and discusses the problems and prospects of the same. The study
analyses the main hindrances to the growth of FDI from Japan and suggests relevant areas for further study.
1.2. Research Methodology
This study uses secondary data sources from online databases, government surveys and reports, publications and
books to carry out qualitative and descriptive analysis for the stated research problem. Data for this study is obtained
from journal articles, books, speeches by academic and industry experts; government websites like DIPP, MoSPI,
JETRO reports, JBIC reports, and data repositories such as IndiaStat, OECD and the WorldBank.
1.3 Scope and Objectives of the Study
The report studies the pattern of sector wise FDI inflows from Japan to India for the time period post 2000. It
identifies the trends and hindrances to FDI inflows from Japan to India by comparing Japan’s investment experiences
in other countries with that of India. In conclusion, the study aims to provide solutions to facilitate further Japanese
investment in the Indian market and suggest other areas that need to be studied if bilateral investment relations are
to be strengthened. In addition to analyzing the facilitators ad constraints to FDI flows from Japan to India, it also
analyses the implications of the CEPA for investment ties between the two countries.
2. Review of Literature
There are numerous theoretical underpinnings to explain the complex phenomenon of FDI in the world. According to
IMF (1993), FDI is defined as international investment made by one economy’s resident entity, in the business
operations of an entity resident in a different economy with the intention of establishing a lasting interest. According
39

to WTO (1996), FDI occurs when an investor based in the home country acquires an asset in another country (host
country), with an intention of managing the said asset. The Benchmark Definition of FDI, the OECD (2008), defined
FDI as the net inflows of investment undertaken to acquire a lasting management interest (10% or more of the voting
stock) in a firm conducting business in any other economy but the investor’s home country.
Most FDI theories rely on two aspects to explain FDI between different countries. A macroeconomic perspective is
offered that draws upon the fields of international economics and international business, specifically, locational
advantage and international trade and often employ the gravity model to explain FDI movement across the globe.
The other perspective that several theories offer rests on firm-specific elements. Market entry strategies,
firm-specific advantages and other microeconomic perspectives are offered that relate to the field of industrial
economics.
One of the most renowned FDI theories is the eclectic paradigm, (Dunning, 1980, 1993) that looks at FDI movement
in terms of ownership advantages, locational advantages and internalization of the firms in the host country. Well
known empirical studies on the OLI triad have found that market size, openness, labor costs and productivity,
economic growth, infrastructure, tax regime, political risk are some of the main determinants of FDI in both
developing and developed countries.
Japan’s direction of FDI has undergone a radical shift in the past decade. Much like other foreign investors, the focus
has shifted from investing only in developed countries to the newly emerging economies due to benefits in terms of
increasing market size, low labor costs and other locational advantages. This often results in a bandwagon effect
(Knickerbocker, 1973) as rival investors rush to invest in the same regions. Thus, concentration of FDI often occurs in
popular regions with a concurrent deceleration of investments into other formerly popular regions (Sethi et al, 2003).
Japan’s engagement with India through FDI is important for our country. Japan is the fourth largest foreign investor in
India and is also looking to increase bilateral engagements between the two through economic and strategic
partnerships. As observed by numerous scholars, the political, legal and economic framework of a country is
important for shaping bilateral trade and investment engagement. According to North (1990, 1995), people form
institutions due to imperfect insight and information asymmetry. He defines institutions as ‘humanly devised
constraints that shape human interaction’. Since time immemorial, institutions have been necessary to lower
uncertainty in exchange, lower transaction costs, thus increasing efficiency. Hence, in this study, in addition to
assessing FDI inflows from Japan to India, we also study the numerous institutional arrangements framed by both
governments to facilitate India-Japan bilateral trade and investment relations. The ‘new institutional theory’ (North,
1990, Scott, 1987) posits that by establishing and administering the rules to guide private players, the host country
institutions play an important role in moderating and regulating the behavior of investing entities. Thus, the
overarching interests of the government are important to keep in mind while studying FDI inflows from Japan to
India.
The ‘new institutional theory’ approach has been previously used to explain the internationalization of Japan’s ODI
which has adapted to the changing macroeconomic conditions in the host country (Buckley & Horn, 2009). According
to Cross & Horn (2009), Japan’s ODI has also aligned corporate behavior to the institutional constraints present in the
host countries.
Japan’s business community has now understood the potential of India’s market, especially its rising middle class. In
the past, research by Japanese firms on India led to deferral of market entry, which is not the case anymore. More
and more firms are looking to enter, not only because of the potential of India’s economy, but also due to the visible
success of several South Korean firms (Masanori, 2012). This study also assesses Japan’s strategies in adjusting to the
Indian business climate.
Furthermore, it is important to look at India-Japan cooperation from a more strategic perspective. So far, India’s
engagement with other South East Asian nations has been below its potential. Despite India’s ‘Look East’ and ‘Act
East’ policy, India’s involvement with ASEAN, Japan, China and South Korea has been much less compared to that
with other nations in this area (Das, 2014). The CEPA between India and Japan is expected to bolster India’s
involvement in this region. Apart from the obvious advantages that would accrue to India from greater integration
with Japan, for the latter, there are clearly geo-strategic and political considerations. China’s growing dominance in
Asia is of common concern to both India and Japan. Thus, the establishment of a robust sustainable strategic
partnership can counter this growing Chinese influence through greater economic and defense cooperation. India’s
latent potential as an economic and security powerhouse coupled with Japan’s established Asian presence provides a
strong basis to their burgeoning strategic and economic relationship. Prime Minister Abe’s critical efforts in the past
40
few years have led to the bilateral relationship being institutionalized in special ways that will make it durable, if not
as dynamic, when Abe leaves office (Lynch & Przystup, 2017).
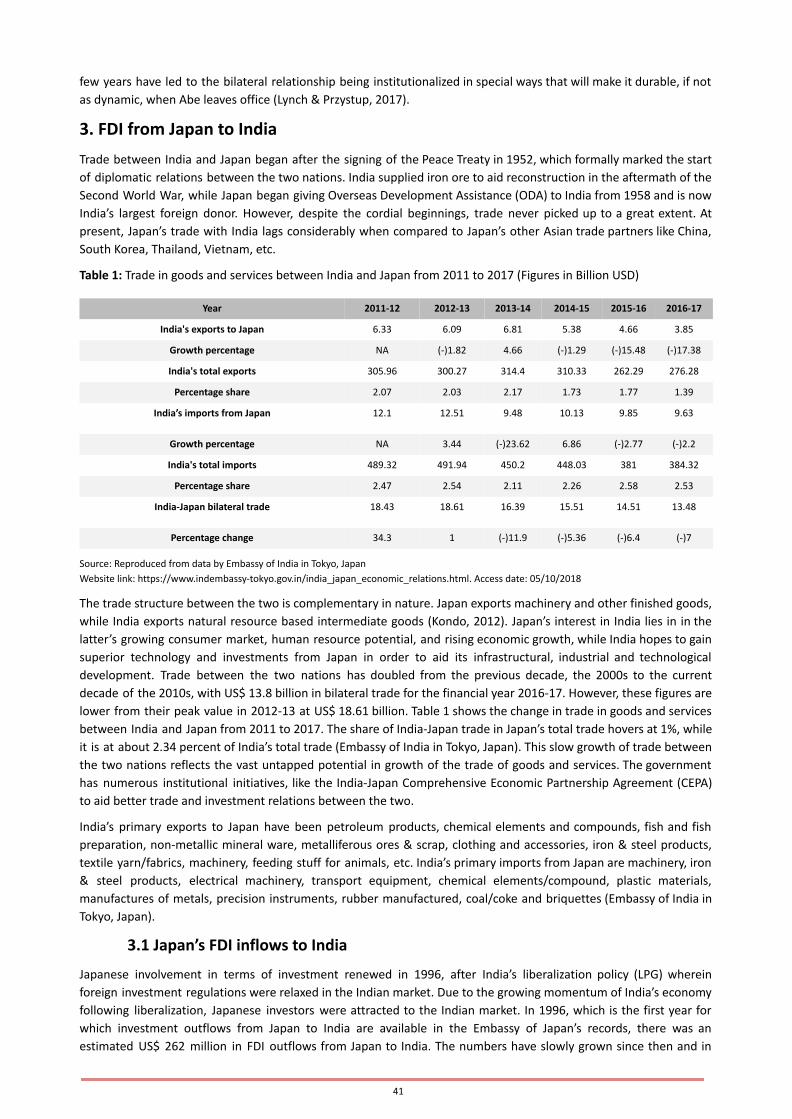
3. FDI from Japan to India
Trade between India and Japan began after the signing of the Peace Treaty in 1952, which formally marked the start
of diplomatic relations between the two nations. India supplied iron ore to aid reconstruction in the aftermath of the
Second World War, while Japan began giving Overseas Development Assistance (ODA) to India from 1958 and is now
India’s largest foreign donor. However, despite the cordial beginnings, trade never picked up to a great extent. At
present, Japan’s trade with India lags considerably when compared to Japan’s other Asian trade partners like China,
South Korea, Thailand, Vietnam, etc.
Table 1: Trade in goods and services between India and Japan from 2011 to 2017 (Figures in Billion USD)
Year 2011-12 2012-13 2013-14 2014-15 2015-16 2016-17
India's exports to Japan 6.33 6.09 6.81 5.38 4.66 3.85
Growth percentage NA (-)1.82 4.66 (-)1.29 (-)15.48 (-)17.38
India's total exports 305.96 300.27 314.4 310.33 262.29 276.28
Percentage share 2.07 2.03 2.17 1.73 1.77 1.39
India’s imports from Japan 12.1 12.51 9.48 10.13 9.85 9.63
Growth percentage NA 3.44 (-)23.62 6.86 (-)2.77 (-)2.2
India's total imports 489.32 491.94 450.2 448.03 381 384.32
Percentage share 2.47 2.54 2.11 2.26 2.58 2.53
India-Japan bilateral trade 18.43 18.61 16.39 15.51 14.51 13.48
Percentage change 34.3 1 (-)11.9 (-)5.36 (-)6.4 (-)7
Source: Reproduced from data by Embassy of India in Tokyo, Japan
Website link: https://www.indembassy-tokyo.gov.in/india_japan_economic_relations.html. Access date: 05/10/2018
The trade structure between the two is complementary in nature. Japan exports machinery and other finished goods,
while India exports natural resource based intermediate goods (Kondo, 2012). Japan’s interest in India lies in in the
latter’s growing consumer market, human resource potential, and rising economic growth, while India hopes to gain
superior technology and investments from Japan in order to aid its infrastructural, industrial and technological
development. Trade between the two nations has doubled from the previous decade, the 2000s to the current
decade of the 2010s, with US$ 13.8 billion in bilateral trade for the financial year 2016-17. However, these figures are
lower from their peak value in 2012-13 at US$ 18.61 billion. Table 1 shows the change in trade in goods and services
between India and Japan from 2011 to 2017. The share of India-Japan trade in Japan’s total trade hovers at 1%, while
it is at about 2.34 percent of India’s total trade (Embassy of India in Tokyo, Japan). This slow growth of trade between
the two nations reflects the vast untapped potential in growth of the trade of goods and services. The government
has numerous institutional initiatives, like the India-Japan Comprehensive Economic Partnership Agreement (CEPA)
to aid better trade and investment relations between the two.
India’s primary exports to Japan have been petroleum products, chemical elements and compounds, fish and fish
preparation, non-metallic mineral ware, metalliferous ores & scrap, clothing and accessories, iron & steel products,
textile yarn/fabrics, machinery, feeding stuff for animals, etc. India’s primary imports from Japan are machinery, iron
& steel products, electrical machinery, transport equipment, chemical elements/compound, plastic materials,
manufactures of metals, precision instruments, rubber manufactured, coal/coke and briquettes (Embassy of India in
Tokyo, Japan).
3.1 Japan’s FDI inflows to India
Japanese involvement in terms of investment renewed in 1996, after India’s liberalization policy (LPG) wherein
foreign investment regulations were relaxed in the Indian market. Due to the growing momentum of India’s economy
following liberalization, Japanese investors were attracted to the Indian market. In 1996, which is the first year for
which investment outflows from Japan to India are available in the Embassy of Japan’s records, there was an
estimated US$ 262 million in FDI outflows from Japan to India. The numbers have slowly grown since then and in
41
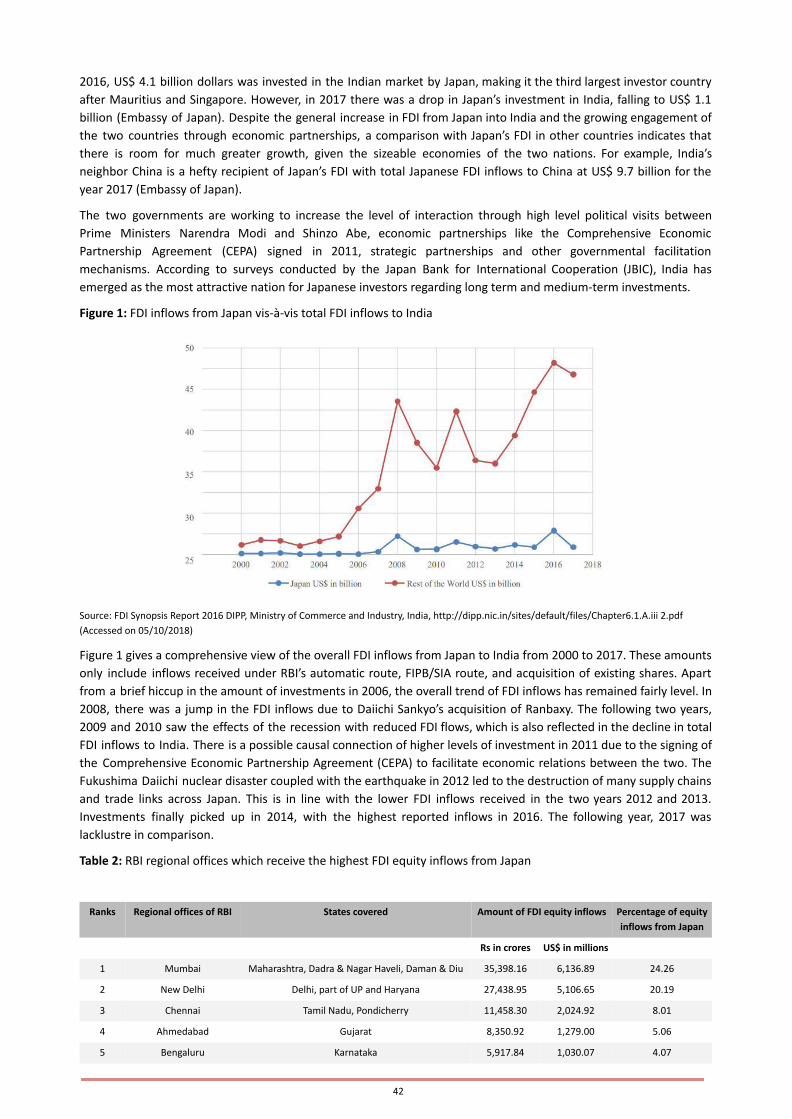
2016, US$ 4.1 billion dollars was invested in the Indian market by Japan, making it the third largest investor country
after Mauritius and Singapore. However, in 2017 there was a drop in Japan’s investment in India, falling to US$ 1.1
billion (Embassy of Japan). Despite the general increase in FDI from Japan into India and the growing engagement of
the two countries through economic partnerships, a comparison with Japan’s FDI in other countries indicates that
there is room for much greater growth, given the sizeable economies of the two nations. For example, India’s
neighbor China is a hefty recipient of Japan’s FDI with total Japanese FDI inflows to China at US$ 9.7 billion for the
year 2017 (Embassy of Japan).
The two governments are working to increase the level of interaction through high level political visits between
Prime Ministers Narendra Modi and Shinzo Abe, economic partnerships like the Comprehensive Economic
Partnership Agreement (CEPA) signed in 2011, strategic partnerships and other governmental facilitation
mechanisms. According to surveys conducted by the Japan Bank for International Cooperation (JBIC), India has
emerged as the most attractive nation for Japanese investors regarding long term and medium-term investments.
Figure 1: FDI inflows from Japan vis-à-vis total FDI inflows to India
Source: FDI Synopsis Report 2016 DIPP, Ministry of Commerce and Industry, India, http://dipp.nic.in/sites/default/files/Chapter6.1.A.iii 2.pdf
(Accessed on 05/10/2018)
Figure 1 gives a comprehensive view of the overall FDI inflows from Japan to India from 2000 to 2017. These amounts
only include inflows received under RBI’s automatic route, FIPB/SIA route, and acquisition of existing shares. Apart
from a brief hiccup in the amount of investments in 2006, the overall trend of FDI inflows has remained fairly level. In
2008, there was a jump in the FDI inflows due to Daiichi Sankyo’s acquisition of Ranbaxy. The following two years,
2009 and 2010 saw the effects of the recession with reduced FDI flows, which is also reflected in the decline in total
FDI inflows to India. There is a possible causal connection of higher levels of investment in 2011 due to the signing of
the Comprehensive Economic Partnership Agreement (CEPA) to facilitate economic relations between the two. The
Fukushima Daiichi nuclear disaster coupled with the earthquake in 2012 led to the destruction of many supply chains
and trade links across Japan. This is in line with the lower FDI inflows received in the two years 2012 and 2013.
Investments finally picked up in 2014, with the highest reported inflows in 2016. The following year, 2017 was
lacklustre in comparison.
Table 2: RBI regional offices which receive the highest FDI equity inflows from Japan
Ranks Regional offices of RBI States covered Amount of FDI equity inflows Percentage of equity
inflows from Japan
Rs in crores US$ in millions
1 Mumbai Maharashtra, Dadra & Nagar Haveli, Daman & Diu 35,398.16 6,136.89 24.26
2 New Delhi Delhi, part of UP and Haryana 27,438.95 5,106.65 20.19
3 Chennai Tamil Nadu, Pondicherry 11,458.30 2,024.92 8.01
4 Ahmedabad Gujarat 8,350.92 1,279.00 5.06
5 Bengaluru Karnataka 5,917.84 1,030.07 4.07
42
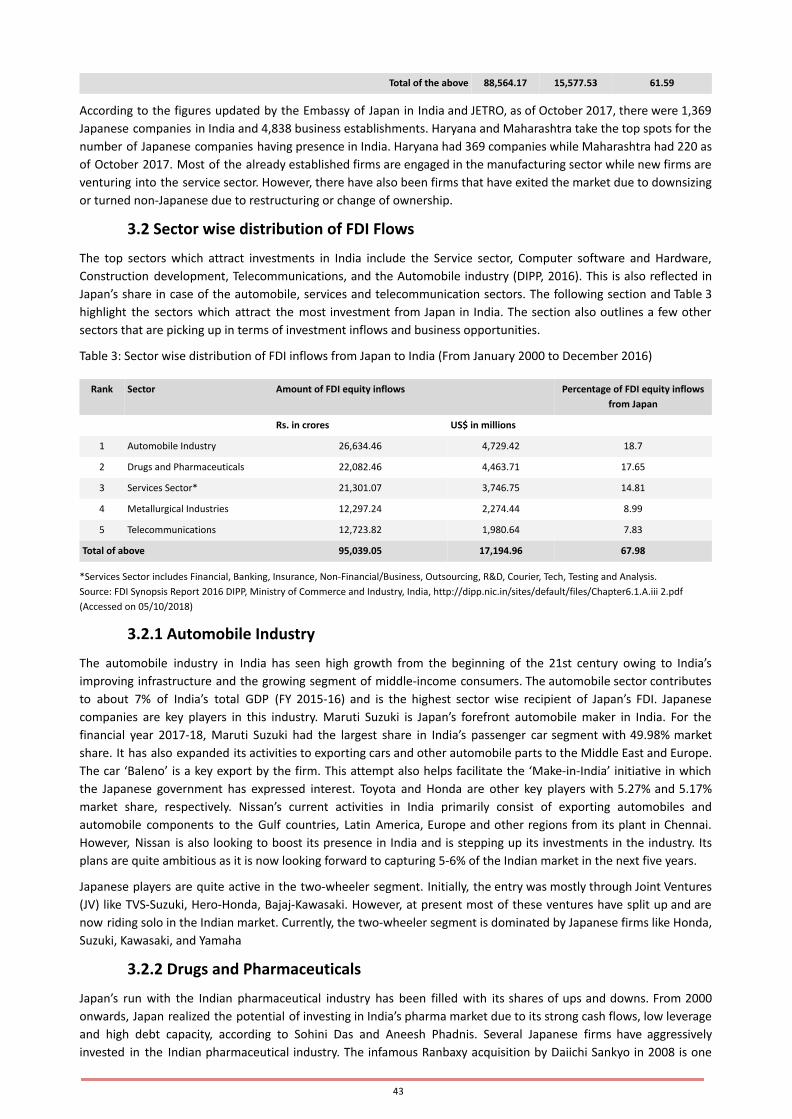
Total of the above 88,564.17 15,577.53 61.59
According to the figures updated by the Embassy of Japan in India and JETRO, as of October 2017, there were 1,369
Japanese companies in India and 4,838 business establishments. Haryana and Maharashtra take the top spots for the
number of Japanese companies having presence in India. Haryana had 369 companies while Maharashtra had 220 as
of October 2017. Most of the already established firms are engaged in the manufacturing sector while new firms are
venturing into the service sector. However, there have also been firms that have exited the market due to downsizing
or turned non-Japanese due to restructuring or change of ownership.
3.2 Sector wise distribution of FDI Flows
The top sectors which attract investments in India include the Service sector, Computer software and Hardware,
Construction development, Telecommunications, and the Automobile industry (DIPP, 2016). This is also reflected in
Japan’s share in case of the automobile, services and telecommunication sectors. The following section and Table 3
highlight the sectors which attract the most investment from Japan in India. The section also outlines a few other
sectors that are picking up in terms of investment inflows and business opportunities.
Table 3: Sector wise distribution of FDI inflows from Japan to India (From January 2000 to December 2016)
Rank Sector Amount of FDI equity inflows Percentage of FDI equity inflows
from Japan
Rs. in crores US$ in millions
1 Automobile Industry 26,634.46 4,729.42 18.7
2 Drugs and Pharmaceuticals 22,082.46 4,463.71 17.65
3 Services Sector* 21,301.07 3,746.75 14.81
4 Metallurgical Industries 12,297.24 2,274.44 8.99
5 Telecommunications 12,723.82 1,980.64 7.83
Total of above 95,039.05 17,194.96 67.98
*Services Sector includes Financial, Banking, Insurance, Non-Financial/Business, Outsourcing, R&D, Courier, Tech, Testing and Analysis.
Source: FDI Synopsis Report 2016 DIPP, Ministry of Commerce and Industry, India, http://dipp.nic.in/sites/default/files/Chapter6.1.A.iii 2.pdf
(Accessed on 05/10/2018)
3.2.1 Automobile Industry
The automobile industry in India has seen high growth from the beginning of the 21st century owing to India’s
improving infrastructure and the growing segment of middle-income consumers. The automobile sector contributes
to about 7% of India’s total GDP (FY 2015-16) and is the highest sector wise recipient of Japan’s FDI. Japanese
companies are key players in this industry. Maruti Suzuki is Japan’s forefront automobile maker in India. For the
financial year 2017-18, Maruti Suzuki had the largest share in India’s passenger car segment with 49.98% market
share. It has also expanded its activities to exporting cars and other automobile parts to the Middle East and Europe.
The car ‘Baleno’ is a key export by the firm. This attempt also helps facilitate the ‘Make-in-India’ initiative in which
the Japanese government has expressed interest. Toyota and Honda are other key players with 5.27% and 5.17%
market share, respectively. Nissan’s current activities in India primarily consist of exporting automobiles and
automobile components to the Gulf countries, Latin America, Europe and other regions from its plant in Chennai.
However, Nissan is also looking to boost its presence in India and is stepping up its investments in the industry. Its
plans are quite ambitious as it is now looking forward to capturing 5-6% of the Indian market in the next five years.
Japanese players are quite active in the two-wheeler segment. Initially, the entry was mostly through Joint Ventures
(JV) like TVS-Suzuki, Hero-Honda, Bajaj-Kawasaki. However, at present most of these ventures have split up and are
now riding solo in the Indian market. Currently, the two-wheeler segment is dominated by Japanese firms like Honda,
Suzuki, Kawasaki, and Yamaha
3.2.2 Drugs and Pharmaceuticals
Japan’s run with the Indian pharmaceutical industry has been filled with its shares of ups and downs. From 2000
onwards, Japan realized the potential of investing in India’s pharma market due to its strong cash flows, low leverage
and high debt capacity, according to Sohini Das and Aneesh Phadnis. Several Japanese firms have aggressively
invested in the Indian pharmaceutical industry. The infamous Ranbaxy acquisition by Daiichi Sankyo in 2008 is one
43
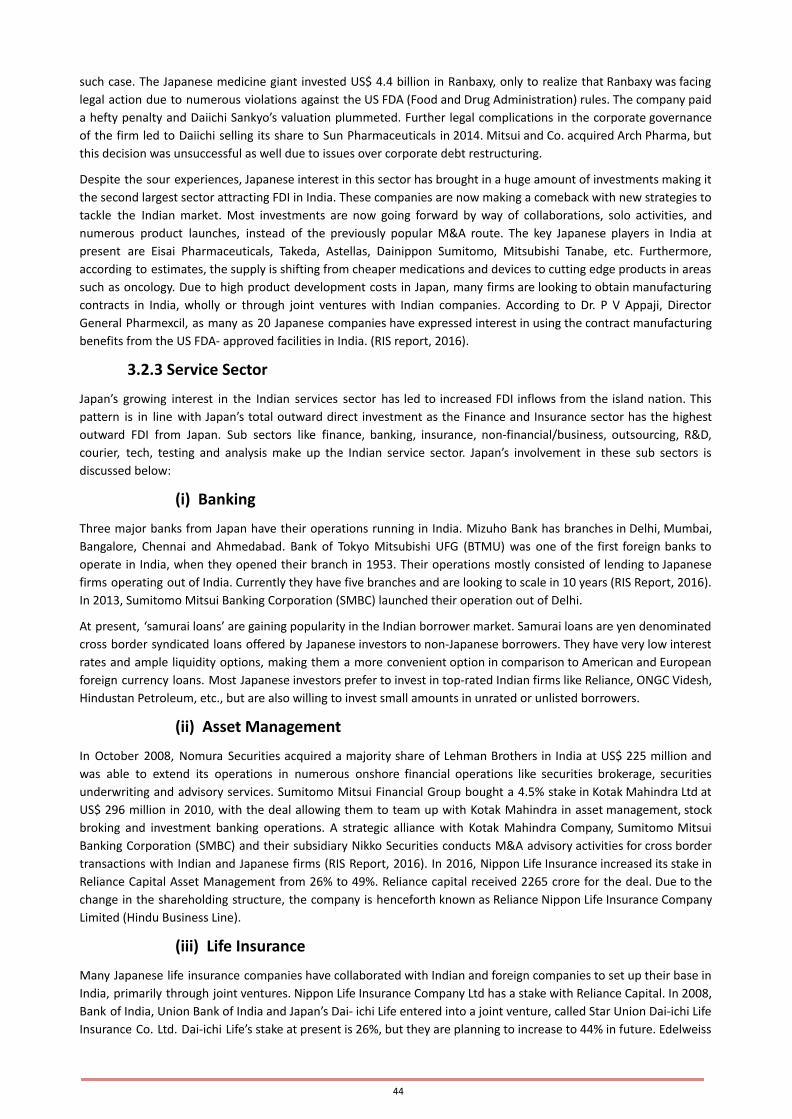
such case. The Japanese medicine giant invested US$ 4.4 billion in Ranbaxy, only to realize that Ranbaxy was facing
legal action due to numerous violations against the US FDA (Food and Drug Administration) rules. The company paid
a hefty penalty and Daiichi Sankyo’s valuation plummeted. Further legal complications in the corporate governance
of the firm led to Daiichi selling its share to Sun Pharmaceuticals in 2014. Mitsui and Co. acquired Arch Pharma, but
this decision was unsuccessful as well due to issues over corporate debt restructuring.
Despite the sour experiences, Japanese interest in this sector has brought in a huge amount of investments making it
the second largest sector attracting FDI in India. These companies are now making a comeback with new strategies to
tackle the Indian market. Most investments are now going forward by way of collaborations, solo activities, and
numerous product launches, instead of the previously popular M&A route. The key Japanese players in India at
present are Eisai Pharmaceuticals, Takeda, Astellas, Dainippon Sumitomo, Mitsubishi Tanabe, etc. Furthermore,
according to estimates, the supply is shifting from cheaper medications and devices to cutting edge products in areas
such as oncology. Due to high product development costs in Japan, many firms are looking to obtain manufacturing
contracts in India, wholly or through joint ventures with Indian companies. According to Dr. P V Appaji, Director
General Pharmexcil, as many as 20 Japanese companies have expressed interest in using the contract manufacturing
benefits from the US FDA- approved facilities in India. (RIS report, 2016).
3.2.3 Service Sector
Japan’s growing interest in the Indian services sector has led to increased FDI inflows from the island nation. This
pattern is in line with Japan’s total outward direct investment as the Finance and Insurance sector has the highest
outward FDI from Japan. Sub sectors like finance, banking, insurance, non-financial/business, outsourcing, R&D,
courier, tech, testing and analysis make up the Indian service sector. Japan’s involvement in these sub sectors is
discussed below:
(i) Banking
Three major banks from Japan have their operations running in India. Mizuho Bank has branches in Delhi, Mumbai,
Bangalore, Chennai and Ahmedabad. Bank of Tokyo Mitsubishi UFG (BTMU) was one of the first foreign banks to
operate in India, when they opened their branch in 1953. Their operations mostly consisted of lending to Japanese
firms operating out of India. Currently they have five branches and are looking to scale in 10 years (RIS Report, 2016).
In 2013, Sumitomo Mitsui Banking Corporation (SMBC) launched their operation out of Delhi.
At present, ‘samurai loans’ are gaining popularity in the Indian borrower market. Samurai loans are yen denominated
cross border syndicated loans offered by Japanese investors to non-Japanese borrowers. They have very low interest
rates and ample liquidity options, making them a more convenient option in comparison to American and European
foreign currency loans. Most Japanese investors prefer to invest in top-rated Indian firms like Reliance, ONGC Videsh,
Hindustan Petroleum, etc., but are also willing to invest small amounts in unrated or unlisted borrowers.
(ii) Asset Management
In October 2008, Nomura Securities acquired a majority share of Lehman Brothers in India at US$ 225 million and
was able to extend its operations in numerous onshore financial operations like securities brokerage, securities
underwriting and advisory services. Sumitomo Mitsui Financial Group bought a 4.5% stake in Kotak Mahindra Ltd at
US$ 296 million in 2010, with the deal allowing them to team up with Kotak Mahindra in asset management, stock
broking and investment banking operations. A strategic alliance with Kotak Mahindra Company, Sumitomo Mitsui
Banking Corporation (SMBC) and their subsidiary Nikko Securities conducts M&A advisory activities for cross border
transactions with Indian and Japanese firms (RIS Report, 2016). In 2016, Nippon Life Insurance increased its stake in
Reliance Capital Asset Management from 26% to 49%. Reliance capital received 2265 crore for the deal. Due to the
change in the shareholding structure, the company is henceforth known as Reliance Nippon Life Insurance Company
Limited (Hindu Business Line).
(iii) Life Insurance
Many Japanese life insurance companies have collaborated with Indian and foreign companies to set up their base in
India, primarily through joint ventures. Nippon Life Insurance Company Ltd has a stake with Reliance Capital. In 2008,
Bank of India, Union Bank of India and Japan’s Dai- ichi Life entered into a joint venture, called Star Union Dai-ichi Life
Insurance Co. Ltd. Dai-ichi Life’s stake at present is 26%, but they are planning to increase to 44% in future. Edelweiss
44

Tokio is another joint venture between Edelweiss Financial Services and Tokio Marine Holdings Inc, incorporated in
2011. Tokio Holdings is looking to increase their stake to 44%.
(iv) Healthcare Services
Notwithstanding Japan’s unfavorable experience with the Indian drugs and pharmaceutical sector, interest in the
healthcare services sector is rising. Sakra hospital in Bengaluru is India’s first 100% FDI hospital. The majority
shareholders are Secom Medical Systems and Toyota Tsusho Corporation. Furthermore, interest in healthcare
start-ups is on the rise. Spiral Ventures and India Japan Partnership Fund LLP are investing in local health related
start-ups and exploring investment opportunities in the healthcare sector. Japanese firm M3 entered a JV with Indian
HealthCare at Home to provide internet-based health services. Panasonic Corporation started offering new solutions
to aid rural healthcare in India. Growing demand to provide affordable healthcare services to the population,
improvement in internet connectivity, lack of adequate government spending in the healthcare sector are some of
the factors attracting start-ups to venture into the healthcare market in India. Japanese firms are now targeting this
niche market, both directly and by funding local start-ups that cater to this field.
3.2.4 Metallurgical Industries
Key Japanese players in India’s metallurgical industry are Kobe Steel, Nippon Steel & Sumitomo Metals and JFE Steel.
Some players entered the market as joint ventures, Nippon Steels & Sumitomo Metals entered into a joint venture
with Tata Steel in 2013 to produce automotive cold rolled steel at an investment of 2,300 crore (RIS Report, 2016).
JFE purchased 14.9% stake in Jindal Steel Works, an investment of 4,800 crore in 2010. Other high-profile
investments include Kobe Steel’s joint venture with Steel Authority of India (SAIL) at 1,500 crores in the Durgapur
Steel Plant.
3.2.5 Telecommunications
Japan’s biggest investment in India’s telecommunication industry happened through TATA and NTT DoCoMo’s joint
venture when DoCoMo entered the market in 2009. However, due to a margin denting price war, uncertainty
regarding telecom policies, and controversies over license allotment, DoCoMo’s entry in the Indian market did not
have the expected success. After several investments, and a dispute with TATA Sons, DoCoMo exit the Indian market
in October 2017. However, the unified brand name of TATA DoCoMo is still in use for Tata Teleservices Limited. In
contrast, telecom giant SoftBank from Japan is planning to invest US$10 billion by 2022. However, their reach is
primarily in the sector of financial services, rather than telecommunications.
3.2.6 Tourism
Apart from strategic and business exchange, the two nations are also focusing on cultural exchange. The tourism
sector, and especially business and religious tourism is a segment that is attracting investments. The Japan National
Tourism Office opened in Delhi in 2017 and as of January 2019, the third ‘India -Japan Tourism Council and Summit’
has been organized. It is a bilateral dialogue which discusses potential areas to work on in tourism. The India Japan
Friendship Forum is another initiative to invigorate the tourism sector, alongside other areas like knowledge, culture
and art. According to the previous Minister of Tourism Dr Mahesh Sharma, the Buddhist circuit along the lines of
Bihar, the North East states, and Nepal are some of the preferred destinations for Japanese tourists. Medical and
Ayurveda related tourism is also popular. In terms of investment, the telecom giant Softbank has invested in Oyo
rooms. However, most Japanese companies that are in the hospitality business primarily cater to providing
accommodation to Japanese expatriates and business people.
4. Institutional Initiatives
Apart from private investments, the Japanese government has several projects lined up in collaboration with the
Indian Government. The two nations are in the process of building up a strategic partnership, which extends to
cooperation in different spheres like infrastructural development, defense and even nuclear energy. At present,
Indo-US-Japan relations are at an all- time high in terms of strategic partnerships, and both nations have had military
drills as a demonstration of their growing cooperation. This chapter provides an overview of the government
investments and Japanese projects in India. It provides a look into the major investments, JICA’s part in India’s
development, the Shinkansen project and facilitation mechanisms like Japan Plus, to name a few.
4.1 Japan International Cooperation Agency (JICA)
45
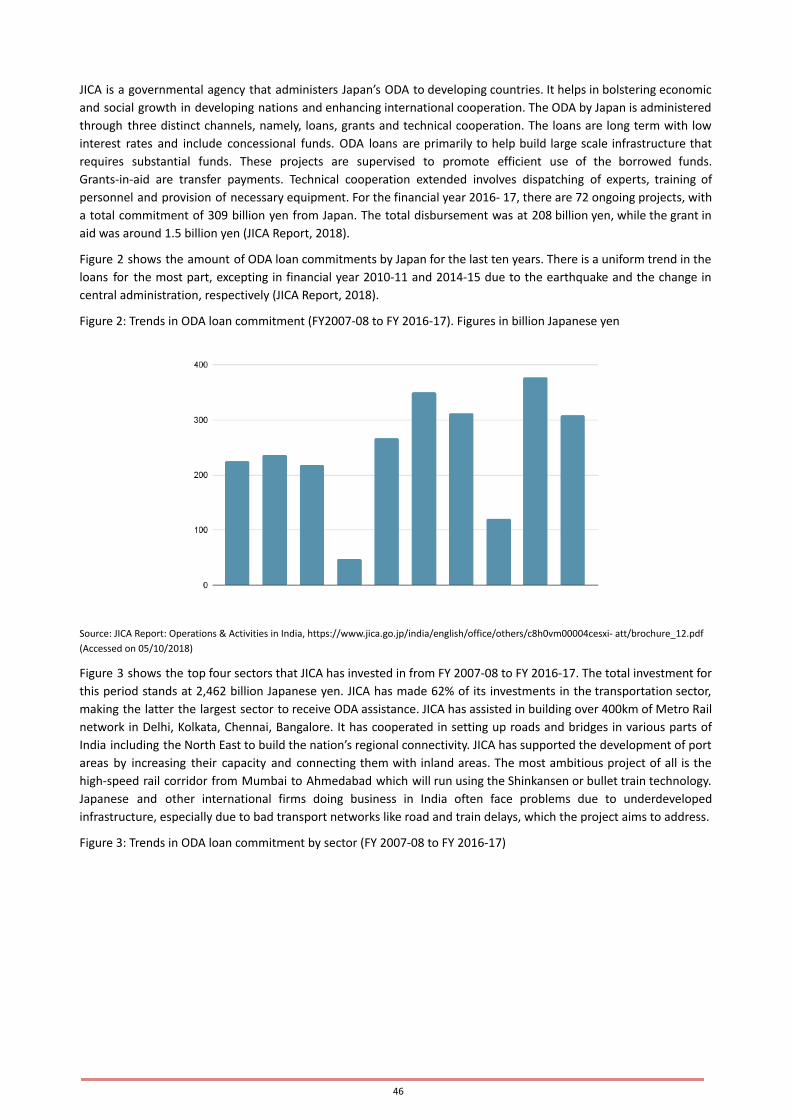
JICA is a governmental agency that administers Japan’s ODA to developing countries. It helps in bolstering economic
and social growth in developing nations and enhancing international cooperation. The ODA by Japan is administered
through three distinct channels, namely, loans, grants and technical cooperation. The loans are long term with low
interest rates and include concessional funds. ODA loans are primarily to help build large scale infrastructure that
requires substantial funds. These projects are supervised to promote efficient use of the borrowed funds.
Grants-in-aid are transfer payments. Technical cooperation extended involves dispatching of experts, training of
personnel and provision of necessary equipment. For the financial year 2016- 17, there are 72 ongoing projects, with
a total commitment of 309 billion yen from Japan. The total disbursement was at 208 billion yen, while the grant in
aid was around 1.5 billion yen (JICA Report, 2018).
Figure 2 shows the amount of ODA loan commitments by Japan for the last ten years. There is a uniform trend in the
loans for the most part, excepting in financial year 2010-11 and 2014-15 due to the earthquake and the change in
central administration, respectively (JICA Report, 2018).
Figure 2: Trends in ODA loan commitment (FY2007-08 to FY 2016-17). Figures in billion Japanese yen
Source: JICA Report: Operations & Activities in India, https://www.jica.go.jp/india/english/office/others/c8h0vm00004cesxi- att/brochure_12.pdf
(Accessed on 05/10/2018)
Figure 3 shows the top four sectors that JICA has invested in from FY 2007-08 to FY 2016-17. The total investment for
this period stands at 2,462 billion Japanese yen. JICA has made 62% of its investments in the transportation sector,
making the latter the largest sector to receive ODA assistance. JICA has assisted in building over 400km of Metro Rail
network in Delhi, Kolkata, Chennai, Bangalore. It has cooperated in setting up roads and bridges in various parts of
India including the North East to build the nation’s regional connectivity. JICA has supported the development of port
areas by increasing their capacity and connecting them with inland areas. The most ambitious project of all is the
high-speed rail corridor from Mumbai to Ahmedabad which will run using the Shinkansen or bullet train technology.
Japanese and other international firms doing business in India often face problems due to underdeveloped
infrastructure, especially due to bad transport networks like road and train delays, which the project aims to address.
Figure 3: Trends in ODA loan commitment by sector (FY 2007-08 to FY 2016-17)
46

Source: JICA Report: Operations & Activities in India, https://www.jica.go.jp/india/english/office/others/c8h0vm00004cesxi- att/brochure_12.pdf
(Accessed on 05/10/2018)
4.2 Ahmedabad – Mumbai bullet train project
One of the most ambitious projects by the heads of both nations is the high-speed network from Mumbai to
Ahmedabad using the shinkansen technology from Japan. The project was agreed upon in the December 2015
summit by Japan’s Prime Minister Shinzo Abe and his Indian counterpart Narendra Modi. Japan is financing 81% of
the project with a soft loan of 13.8 billion yen, with a 0.1 interest rate. The construction began in August 2018, while
the target date for completion is set for the year 2023, but Indian officials say they will attempt to inaugurate the
train on 15thAugust 2022 to celebrate the 75th Independence Day. Japan will aid in technology transfer for the
project but the components for the train are to be locally sourced to support the government’s ‘Make in India’
initiative. Japanese officials claim that the higher initial costs will be offset by the low repair costs and extended
lifespan of the trains. India expects a boom in employment and the benefits of economies of scale from this project,
apart from the obvious upgradation in India’s infrastructure.
4.3 Industrial Townships
According to the Department of Industrial Policy and Promotion (DIPP), Japan Industrial Townships are envisaged to
be integrated industrial parks with readymade operational platforms, world class infrastructure, plug in play factories
and investment incentives for Japanese firms. The Action Agenda for India-Japan Investment and Trade Promotion
and Asia-Pacific Economic Integration signed by Japan and India in 2015 agreed to 12 potential sites for Japanese
Industrial Townships. The potential state governments have suggested incentives like exemption of CST, electricity
duties, stamp duty, amongst others. The townships in Mandal, Neemrana, Ghilot and Supa Parner are funded by
JETRO, while two townships in Tamil Nadu are private projects. One such hub in Chennai is a collaborative project
between JGC Corporation and Mizuho Bank and the Sojitz Motherson Park in Tamil Nadu is a collaboration between
Sojitz Corporation and Motherson Group. It has been agreed by both nations that the investment incentives will not
be lower than in SEZs and National Investment and Manufacturing Zones (NIMZ). Various fields in the manufacturing
sector like textiles, automobile, food processing and engineering are attracting investments in these townships. Firms
specializing in the development of soft skills are also setting up bases in such townships (RIS Report, 2016).
4.4 Smart Cities
A ‘Partner City Affiliation’ MoU was signed by the two heads of Government in 2014 to help build cities like Varanasi
as a ‘smart city’ in cooperation with Kyoto. JICA has also taken up projects to build 3 cities as ‘smart cities’: Ponneri in
Tamil Nadu, Krishnapatnam in Andhra Pradesh and Tumkur in Karnataka in the Chennai-Bangalore Industrial Corridor
(RIS Report, 2016). JICA has signed an agreement with the Indian Government to provide loan assistance to the tune
of 8.08 billion yen (500 crores approximately) for the installation of intelligent transport systems.
4.5 Japan Plus
Prime Minister Narendra Modi and his Japanese counterpart Shinzo Abe signed the Investment Promotion
Partnership in Tokyo in September 2014. Under this partnership, Japan agreed to 3.5 trillion yen in the next 5 years.
47

Thus, the Japan Plus facilitation mechanism was especially created to manage and fast track investment proposals
from Japan to their end goal. Japan Plus is to be headed by 4 representatives from the Government of India and 3
from the Government of Japan: one nomination from METI, one from JETRO and one nomination from Aichi
Prefecture. The team helps handle investment promotion for SMEs from Japan through research, outreach,
promotion, facilitation and aftercare. The team also provides updated information on investment opportunities to
Japanese firms across different sectors, especially in the industrial corridor projects.
5. A study of Japan’s investment experience in India vis-à-vis the world
As of 2018, Japan is the fourth largest economy in the world, and the second largest in Asia, with several important
trade and investment links. In terms of trade, as of 2016, Japan has Economic Partnership Agreements (EPA) with 14
nations, including Singapore, Chile, Australia, Switzerland, Philippines, Vietnam, Thailand, ASEAN amongst others.
Furthermore, in 2017, Japan and EU reached agreement on an EPA that will remove 95% of tariffs that the two have,
although there are many details left to be negotiated. Parallelly, a strategic agreement between the two is also being
negotiated, as reported by the EU press release. Japan has ongoing negotiations for the Regional Comprehensive
Economic Partnership (RCEP) with 6 countries: Australia, ASEAN countries, China, India, South Korea and New
Zealand. For the year 2017, Japan’s exports were at US$ 698.2 billion (Trade Map, International Trade Centre). For the
same year, Japan’s top export destinations were USA, China, and South Korea.
In terms of investment, Japan’s foray into outward FDI was influenced by the steep rise in the value of the yen against
the dollar, triggered by the Plaza Accord of 1985. The latter resulted in a rapid transfer of production lines by
Japanese firms to East Asian nations in the late 1980s (Bank of Japan Report, 2007) These trends positively impacted
the establishment of an industrial base in the region that energized trade in raw materials, parts, intermediate and
finished goods with partners both inside and outside the regions, including local companies from the host region.
This further propelled more direct investment from Japan into the countries in this region, which contributed to
Japan’s high growth. This is illustrated by the balance of payments statistics given in Table 4. In the early 1980s, the
annual average was US$ 1.8 billion, which tripled to US$ 5.1 billion in the latter half of the decade and then increased
to US$ 6-7 billion in the 1990s and US$ 9 billion in the 2000s (Bank of Japan Report, 2007).
Table 4: FDI to East Asian countries from 1981 to 2005
1981-1985 1986-1990 1991-1995 1996-2000 2000-2005
Hong Kong NA NA NA 33.8 23.4
Singapore 1.4 3.3 6.4 12.7 11.3
Korea 0.1 0.8 1 5.8 4.4
NIE-s3 1.5 4.1 7.4 52.3 39.1
Thailand 0.3 1.2 1.9 4.6 2.4
Malaysia 1.1 1.1 4.5 4 2.7
Indonesia 0.2 0.6 2.3 0.8 -0.6
The Philippines 0.1 0.5 1 1.6 0.9
ASEAN 4 1.7 3.4 9.8 11.1 5.4
China 1 2.9 22.5 41.1 54.9
Total 3.9 10.4 39.7 104.4 93.4
Figures in billion dollars (annual average)
Note: China covers 1982-85 for the period marked 1981-85; Hong Kong covers 1998-99 for the period marked 1996-2000; Except for Hong Kong,
Thailand and China, the period marked 2000-05 covers 2001-04
Source: External Aspects of East Asian Economies and Finance, Bank of Japan, 2007
https://www.boj.or.jp/en/research/brp/ron_2007/data/ron0701a.pdf (Accessed on 05/10/2018)
At present, Japan is one of the highest investors in the world, with cumulative FDI outflows across all countries of
US$ 1.58 trillion between 2000 to 2017, as reported by JETRO. The most common investment destinations for
Japanese firms are the USA, Europe and Asian countries, which are also the world’s largest FDI recipients. These
three regions have received more than 80% of Japan’s FDI since 1996. However, the USA’s share has reduced from
50% of Japan’s FDI in 2000 to about 30% in 2017. As of 2012, Europe and Asia’s share has increased from 38% to
48
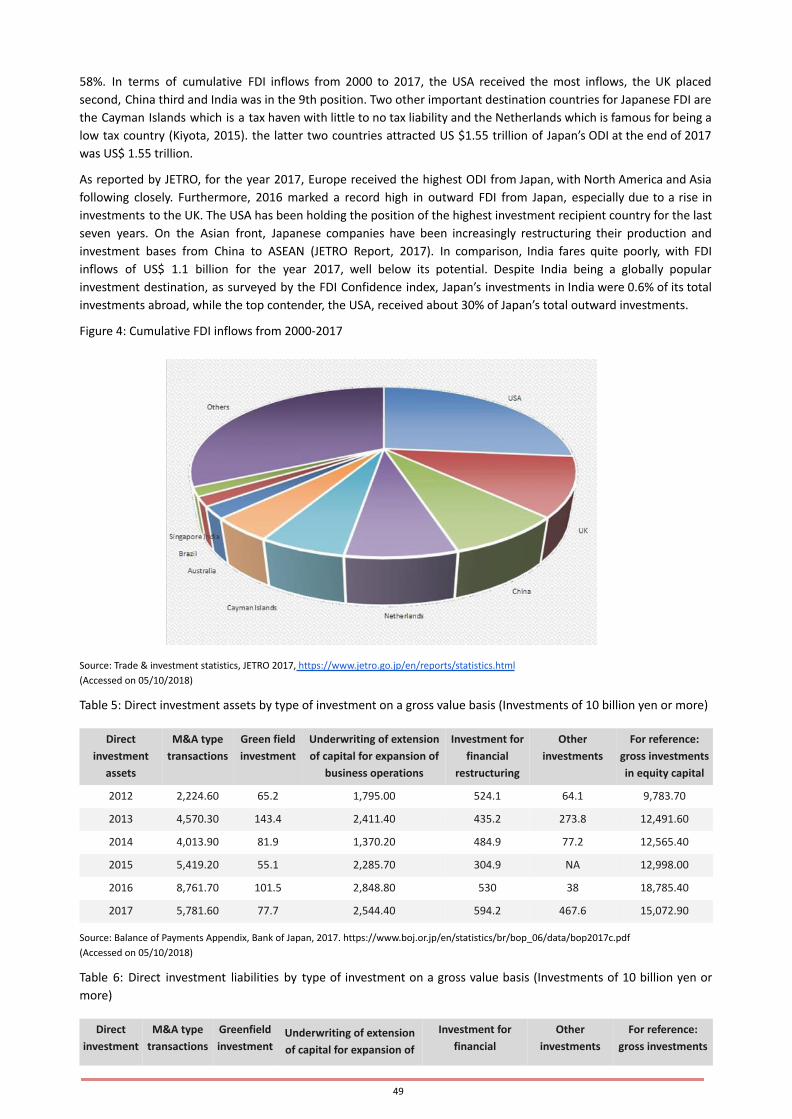
58%. In terms of cumulative FDI inflows from 2000 to 2017, the USA received the most inflows, the UK placed
second, China third and India was in the 9th position. Two other important destination countries for Japanese FDI are
the Cayman Islands which is a tax haven with little to no tax liability and the Netherlands which is famous for being a
low tax country (Kiyota, 2015). the latter two countries attracted US $1.55 trillion of Japan’s ODI at the end of 2017
was US$ 1.55 trillion.
As reported by JETRO, for the year 2017, Europe received the highest ODI from Japan, with North America and Asia
following closely. Furthermore, 2016 marked a record high in outward FDI from Japan, especially due to a rise in
investments to the UK. The USA has been holding the position of the highest investment recipient country for the last
seven years. On the Asian front, Japanese companies have been increasingly restructuring their production and
investment bases from China to ASEAN (JETRO Report, 2017). In comparison, India fares quite poorly, with FDI
inflows of US$ 1.1 billion for the year 2017, well below its potential. Despite India being a globally popular
investment destination, as surveyed by the FDI Confidence index, Japan’s investments in India were 0.6% of its total
investments abroad, while the top contender, the USA, received about 30% of Japan’s total outward investments.
Figure 4: Cumulative FDI inflows from 2000-2017
Source: Trade & investment statistics, JETRO 2017, https://www.jetro.go.jp/en/reports/statistics.html
(Accessed on 05/10/2018)
Table 5: Direct investment assets by type of investment on a gross value basis (Investments of 10 billion yen or more)
Direct
investment
assets
M&A type
transactions
Green field
investment
Underwriting of extension
of capital for expansion of
business operations
Investment for
financial
restructuring
Other
investments
For reference:
gross investments
in equity capital
2012 2,224.60 65.2 1,795.00 524.1 64.1 9,783.70
2013 4,570.30 143.4 2,411.40 435.2 273.8 12,491.60
2014 4,013.90 81.9 1,370.20 484.9 77.2 12,565.40
2015 5,419.20 55.1 2,285.70 304.9 NA 12,998.00
2016 8,761.70 101.5 2,848.80 530 38 18,785.40
2017 5,781.60 77.7 2,544.40 594.2 467.6 15,072.90
Source: Balance of Payments Appendix, Bank of Japan, 2017. https://www.boj.or.jp/en/statistics/br/bop_06/data/bop2017c.pdf
(Accessed on 05/10/2018)
Table 6: Direct investment liabilities by type of investment on a gross value basis (Investments of 10 billion yen or
more)
Direct
investment
M&A type
transactions
Greenfield
investmentUnderwriting of extension
of capital for expansion of
Investment for
financial
Other
investments
For reference:
gross investments
49

liabilities business operations restructuring in equity capital
2012 277.3 NA 187.7 270.5 35.5 1,973.70
2013 165.8 NA 63.8 276.6 68.2 1,496.40
2014 656.9 NA 351.1 345.3 29.5 4,202.80
2015 577.1 NA 177.2 183.4 NA 2,028.80
2016 403.8 NA 513.1 83.3 22.3 2,122.70
2017 644.1 NA 361.5 32.2 21.7 2,294.20
Source: Balance of Payments Appendix, Bank of Japan, 2017. https://www.boj.or.jp/en/statistics/br/bop_06/data/bop2017c.pdf (Accessed on
05/10/2018)
Development in direct investment assets show that mergers & acquisitions make up the largest share of FDI outflows
through large scale acquisitions of foreign firms by Japanese firms. Underwriting of the extension of capital for the
expansion of overseas business operations also continues to account for a relatively large share, while greenfield
investments by Japanese firms in host countries continue to be less, as reported by the Bank of Japan, as seen in
Table 5. When compared to assets, the direct investment liabilities continue to be low, as seen in Table 6. M&As and
underwriting of extension of capital for the expansion of business operations account for the larger share, as
reported by Bank of Japan.
As of the end of 2017, globally, Japan’s total share of ODI in the manufacturing sector amounted to 7,01,469 hundred
million yen, while the non-manufacturing total was 9,85,990 hundred million yen. The top five sectors that received
direct investment from Japan for the year 2017 were finance and insurance services, wholesale and retail, transport
and equipment, chemicals and pharmaceuticals and communications. Table 7 illustrates the numbers, as reported by
the Bank of Japan.
Table 7: Top 5 industries to receive ODI in 2017
Top 5 sectors receiving ODI in 2017 FDI in 100 million yen Percentage
Finance and Insurance 3,47,505 20.60%
Wholesale and Retail 2,32,274 13.76%
Transport and Equipment 1,41,902 8.40%
Chemicals and Pharmaceuticals 1,31,470 7.80%
Communications 1,14,402 6.78%
Others 7,19,905 42.66%
Total 16,87,458 100.00%
Source: Balance of Payments data, Bank of Japan, 2017, https://www.boj.or.jp/en/statistics/br/bop_06/index.htm/#p0103 (Accessed on
05/10/2018)
5.1 Japan’s investment experience in India
As discussed earlier, bilateral relations between India and Japan have been boosted by governmental measures such
as the bilateral CEPA that was signed in 2011, multiple facilitation mechanisms to aid Japanese firms in India and
media attention. According to surveys by JETRO, Japanese firms view India as one of the most profitable investment
locations in the medium and long-term. This section qualitatively analyses Japan’s investment experiences in India by
looking into overall investment figures, ease of doing business, infrastructure, policy and institutional issues that help
or hamper Japanese firms in India. The chapter shall also draw comparisons between other investment locations
preferred by Japan such as the USA, UK, Netherlands, China and regional trade blocs such as the EU and ASEAN.
5.1.1 Business and regulatory environment
According to the 2017 Report on Investment Climate by the Bureau of Economic and Business Affairs, US Department
of State, India continues to send out mixed signals regarding FDI inflows. The government actively seeks investments
through economic reforms but is lax in following up on implementation of the same. Non-performing assets continue
50
to hold back banks’ profits and limit their lending. However, stable, relatively low inflation and strong management
from India’s central bank, the Reserve Bank of India, have mitigated the negative impact on credit. Employment,
while difficult to measure given the large informal economy, appears to lag growth, while a demographic boom
means India must generate over ten million new jobs every year. In contrast, Japan has a demographic problem due
to the high median age in the country and a negative population rate of -0.1% as of 2016.
According to the Ease of Doing Business Report in 2018, India ranks 100th among the 190 countries that were
assessed. Despite the low rank, this is a massive jump for India in comparison with last year’s report when India was
placed 130th. Japan’s leading FDI destinations rank much higher globally with the US at 6th position, the UK at 7th,
the Netherlands at 32nd, Singapore at 2nd and China at 78th. The report assesses the country based on certain
parameters. Among these parameters, India ranks high in terms of getting credit and protecting minority investors.
Dealing with construction permits, registering property and enforcing contracts are some of the worst ranked
parameters for India according to this report. Furthermore, according to the 2014 Enterprise Survey, corruption and
electricity were the biggest obstacles for firms doing business in India.
With respect to the business environment, Japanese firms surveyed by JBIC (2014) on overseas business operations
cite lack of infrastructure to be the worst hurdle that they face in India. Local agents often promise adequate
infrastructure to the firms which is later not implemented as the hard infrastructure in India has several quality
issues. Japanese firms have had trouble with infrastructural issues such as roadways, uninterrupted electricity,
problems with water pipelines, etc. However, the Japanese government has been very involved with improving
India’s large-scale infrastructure through ODA assistance administered by JICA. The top three sectors receiving ODA
are transport, water & sanitation and energy. The massive boom in the telecommunications industry has led to an
improvement in internet and phone connectivity that the firms require. Furthermore, many firms that operate in
locations like Haryana and Maharashtra have not faced problems with infrastructure as these regions are suitably
developed to support the endeavors of these companies (ICRIER Report, 2009). The list of Japanese business
establishments in India provided by JETRO shows a concentration of Japanese firms in Haryana and Maharashtra with
Tamil Nadu, Gujarat and Karnataka rising in the ranks. All five states are ranked among the ten best states in terms of
infrastructure (National Institute of Public Finance and Policy Report, 2016). Severe competition by other firms, both
Indian and foreign, ranks as the second most common problem according to the report. Japan has been keen on
replicating the South Korean strategy of localization of production and low-priced, market specific goods to counter
the intense competition that they face (Masanori, 2012). Furthermore, as a strategy Japan has expressed interest in
the Make-in-India initiative to manufacture products in India and export to other nations. The automobile giant
Suzuki is a market leader in exporting such finished automobiles to other countries, including Chile, Indonesia and
developed markets in the EU. Japanese and other foreign firms also face problems with business regulations in India
due to lack of transparency and a complex tax system.
Other problems faced by firms in entering the Indian market include the long and arduous process of land acquisition
and associated approvals, poor governance, and corruption. Apart from entry, big corporations which are looking to
expand their operations often encounter the same hassles once again. A common strategy is to use the help of their
experienced partners, the joint venture firms, to take care of such administrative procedures. Toyota Kirloskar
Motors, which had done an extensive survey before entering the market purchased large tracts of land for expansion
and was able to avoid this problem. Other strategies used to counter this problem are through the help of
consultants and other local agents (ICRIER Report, 2009).
The Innovation Index quantifies the level of creativity and innovation that a nation is capable of in its present state
through certain indicators like institutions, quality of human capital, infrastructure, market sophistication, business
sophistication, knowledge and technology and creative outputs. India ranks at 57 out of the 126 countries surveyed
while the USA ranks 2nd, the UK 8th, Netherlands 4th and China 17th. Level of infrastructure and institutions are
some of India’s major weaknesses, while technological development, creative output and market sophistication are
parameters on which it is strongest, as reported by the Global Innovations Index 2018. In comparison to most
countries that receive a high amount of ODI from Japan, India’s rank in innovations is much lower. The Indian
government has launched an innovation program to improve the quality of Indian start-ups and attract more
investors. Digital India is another pet project of the government to enhance India’s innovating capabilities. SoftBank
which heavily invests in some of India’s major start-ups has decided to invest over 2 billion US dollars in the Indian
market by the year 2020.
The existing perception that the Japanese have of human resource capabilities in India is not very favorable. The level
of human resource capabilities in India has often daunted new firms, especially the SMEs with lower resources that
51
are trying to break into the Indian market. Several Japanese firms believe that despite having an intelligent
workforce, Indian workers lack skills in practical application, are low on operational efficiency and take more time to
train. Toyota Kirloskar Motors (TKM) considered human resources to be the biggest obstacle they had to face in
market entry. Other firms that were surveyed conveyed that the labor problems are intrinsic to their industries. In
the automobile industry, TKM faced trouble with the labor union in 2001 and 2002 with strikes and a 53-day lock-out
(ICRIER Report, 2009). One of the worst labor problems took place in Manesar, Haryana with Maruti Suzuki. The
workforce demanded the establishment of a new union, a pay hike and more vacation time. There were also
problems concerning the abusive behavior of supervisors. The turmoil finally culminated in the murder of a senior
executive, extensive property damage and many injuries. However, Honda has had a much better experience with its
labor union. After initial suspicion, the company trusted the workforce to form a union, which has had cordial
relationships with the management through regular communication. Despite the trouble faced by the automobile
industry, other sectors have not faced such problems and do not consider labor practices to be much of an issue. This
is reflected in the experiences of the manufacturing, pharma and IT industries.
The state of skilled labor in India is looked upon with favor and several Japanese firms are keen on recruiting people
to work in Japan. Japanese IT service companies face a shortage in terms of both the number and quality of IT
engineers and are thus eyeing the budding IT professionals in India. However, training cost due to the language
barrier is a concern. The Japanese government and private firms are also keen to mitigate the demographic problem
facing the country given its ageing population. This is an area where India with its large, skilled workforce can
complement the needs of the Japanese economy.
Since Japan is looking to boost its economy with newer businesses, it is quite interested in the ‘start-up’ culture in
India. The aspect of creativity and innovation is appreciated. However, the bigger firms are critical of the ‘jugaad’
element of Indian businesses. This goes completely against the traditional Japanese management practices which
have thrived on extensive planning, scrutinization of every detail and strict discipline. The work culture between the
two is quite different, but both sides are now making attempts to meet each other halfway. The Japanese are aware
that communication between the management and the employees will result in smoother functioning of their firms.
5.1.2 Institutional Aspects
Apart from the CEPA which is in place to facilitate Japanese investment into India, India’s FDI policy plays a major
role. Furthermore, in January 2018, India’s FDI policy was further amended by the Indian Cabinet to liberalize and
simplify the process of ushering in FDI inflows. These reforms target the retail sector, aviation, pharmaceuticals,
construction development, power exchange and FDI in investment. Japan’s investment into the Indian
pharmaceutical and construction development sector falls in the top 5 sectors in India that Japan invests in, and thus
may positively impact firms operating in these sectors. Despite Japan’s less than favorable experience with the Indian
pharmaceutical sector, this reform will amend the definition of ‘medical devices’ in the FDI policy and permit a wide
range of such devices into the market which can attract 100% FDI via the automatic route. Furthermore, a major
share of Japan’s outward FDI goes to the retail sector. This reform, which allows 100% FDI in single brand retail into
the market without government approval may induce more Japanese retail players to venture into the Indian market
in future, especially since Japan’s fashion retailer UNIQLO is set to launch their first store in New Delhi in 2019.
According to the Enterprise Survey Report of 2014, 20% of the firms assessed, cited corruption as the main hurdle to
business. The Corruption Perception Index 2017 ranks India at 81 out of the 180 countries assessed. Japan’s top three
ODI receivers are ranked at 16th, 8th, 9th respectively. Despite China’s low rank at the 77th position, it is the fourth
highest ODI receiver from Japan. However, foreign firms have an incentive to invest in China owing to its better
infrastructure, business climate, conducive FDI policies, and availability of capital to name a few. However, in his book
‘Selling China’, Huang Yasheng points out the corruption in China’s governance is discriminatory and supports certain
foreign firms, hampering the competitiveness of private domestic firms.
Despite the release of the National IPR Policy and the establishment of India’s first intellectual property (IP) crime
unit in Telangana in 2016, India’s IP regime continues to fall short of global best practices and standards. Several
“Notorious Markets” across the country continue to operate, while many smaller stores sell or deal with pirated
content across the country. India made some progress in fulfilling its mandate to become more market-oriented and
competitive in 2016, but Prime Minister Modi’s courtship of multinationals to invest and “Make in India” has not yet
addressed longstanding hesitations over India’s lack of effective IPR enforcement (Investment Climate Statement,
2017). The Intellectual Property Index tabulated by the US Chamber of Commerce Global Innovation Policy Center,
which analyses the intellectual property climate of 50 countries, India ranks 44th. US is ranked first and has the most
52

robust IP climate and North America and Europe rank very high on this list due to their developed and mature
economies. Most emerging economies still struggle with the issue of ethics in business.
5.2 A study of Japan’s investment experience in other new emerging markets
Japan’s investment in South East Asia has been on the rise since 2011 with 50% of its investments in Asia going to
ASEAN-6 (DBS Report, 2016). Despite high costs arising from the lack of infrastructure, market openness and growth
are attracting Japanese investors to this region. As explained in the above sections, Japan’s foray into outward FDI
picked up in the early 1980s, and from 2011, its FDI has been targeted at emerging markets in Asia, and to some
extent Central and South American nations like Mexico and Brazil. Cayman Islands is one of the top recipients due to
tax exemption policies. South Africa is the only African nation to attract FDI from Japan, though at nominal levels.
According to the JBIC survey in 2015, 56% of Japanese investors were looking to invest in ASEAN countries, especially
in Vietnam, Indonesia and Thailand. In contrast, the survey reported a 48% fall in the number of investors looking to
expand to China. In 2011, Japan’s investment in China stood at US$12.6 billion, which reduced to US$ 8.6 billion in
2015. In contrast, Japan’s FDI inflows to ASEAN rose from US$ 15.7 billion in 2011 to US$ 20.2 billion in 2015 (JETRO,
2016). Initially, Japan’s rise in FDI to the South East Asian region could be attributed to diversification strategies and a
tendency to reduce investments in China, owing to economic considerations such as high labor costs and increasing
domestic capacity in China. Other geopolitical considerations include the deterioration of bilateral relations between
Japan and China in 2012 due to the Senkaku Islands dispute. However, the sustained rise in FDI to the South East
Asian region could plausibly reflect broader economic considerations due to the growing market in this region (DBS
Report, 2016). According to the JBIC surveys, Japanese investors face problems in South East Asia mainly due to rising
labor costs, problems in hiring efficient management level staff, unclear legal systems, political instability and
underdeveloped infrastructure. When juxtaposed with the investment experiences of the Japanese in India, we see
that underdeveloped infrastructure, implementation problems arising from non-transparent and inefficient
regulatory mechanisms are some of the common issues. In contrast, efficient skilled labor and low labor costs in
several sectors make India a favorable investment destination.
Amongst the ASEAN countries, Japan has been a long-time investor in Vietnam. It is the second largest FDI investor in
the country, after South Korea, with 3,835 projects as of July 2018, representing a total investment of US$ 39 billion,
(Ministry of Planning and Investment, Vietnam). Japan is Vietnam’s highest ODA provider and is also the fourth
largest trading partner of Vietnam. The investments were stable at US$ 500 million from 1995 to 1998. The period
from 1999 to 2003 saw a reduction in the amount of inflows, after which there was a marked improvement with a
peak in investments in 2008. The amount of investments lowered in 2009, following the global financial crisis. The
numbers have recovered since then. (Hanh et al, 2017). Majority of Japan’s investments have focused on the sectors
of manufacturing, infrastructure and energy projects. However, over the last five years, investments have grown in
consumer goods sectors, including retail and hospitality services.
Vietnam and Japan launched a Joint Initiative in 2003 to improve the business environment in Vietnam. The aim was
to increase Vietnam’s competitiveness and attracting other FDI investors, as Vietnam’s economy is highly influenced
by FDI inflows. The ‘action plan’ for the Joint Initiative is being conducted in phases by the two governments and
even the private sector, and the 7th phase of this plan began in late July 2018. Evaluation studies conducted by JICA
on the Joint Initiative has seen positive reviews in fields of customs and intellectual property.
The Vietnam Japan EPA was signed in 2008 and came into force in April 2009. It is expected to liberalize and facilitate
trade between the two countries through reduction and exemption of tariffs according to prior commitments
between the two nations. Apart from the VJEPA, the ASEAN Japan Comprehensive Economic Partnership (AJCEP) has
boosted trade between the two through further reduction and exemption of tariff lines with 3426 tariff lines with
zero percent rate effective from April 2018, in several industrial goods such as machinery, equipment, iron, steel
copper, metals, etc. According to a survey by JBIC in 2015, Japanese investors have faced problems in Vietnam owing
to rising labor costs, unclear execution of legal systems, intense competition from other companies and
underdeveloped infrastructure. These problems are common across other emerging markets that Japan invests in,
including India.
Japan is Thailand’s largest investor, with cumulative inflows from Japan to Thailand for the period 1985 to 2016
standing at US$ 85 billion, which is more than double the cumulative inflows from Thailand’s second largest investor,
USA. Furthermore, cumulative investments for the aforementioned period indicate that 43 percent of Thailand’s total
investments come from Japan. Thus, Thailand’s FDI climate is considerably influenced by Japan. The JBIC Survey in
2015 reveals that, much like Vietnam, rising labor costs and intense competition from other companies are the two
53
most cited problems faced by investors. Apart from this, social and political instabilities are an issue as Thailand often
faces natural disasters like floods and political coups. In addition to the AJCEP, Thailand and Japan have signed the
TJEPA, the Japan Thailand Economic Partnership Agreement in 2007. The TJEPA registered little immediate change in
investments and there was a drop in investment in 2009, which can be attributed to the Global Financial Crisis. A
political economy approach by Hartley (2017) postulates that global economic events such as the Asian Financial
Crisis in 1998 and the global recession in 2008-09 have affected Thailand’s FDI climate negatively, while positive
changes have been brought about by domestic economic reforms such as Thailand’s Board of Investment’s (BoI)
economic plan. However, after a peaking of inflows from Thailand to Japan in 2012 and 2013, there has been a rapid
drop in investments from 2014 that lasted till 2017.
Japan’s large immigrant community in Brazil, the ‘Nikkei jin’, continues to be a massive influencer in Japan’s and
Brazil’s bilateral relations, improving dialogue and cooperation due to the human assets in the country. Japan’s
cumulative outflows in the period 2000 to 2017 shows higher outflows to Brazil in comparison to India. Direct
investment for the year 2016 was at US$ 1.4 billion.
Japan is the 6th largest FDI investor in Brazil, in terms of FDI stocks and the two nations are now looking at further
cooperation in the fields of science, technology and energy. Initially, Japan’s investments in Brazil were restricted to
obtaining natural resources. However, by 2015 Japan was investing 40% in the manufacturing sector, 35% in the
service sector and 22% in the primary sector (Embassy of Japan). Brazil’s business environment is plagued by
problems such as its opaque bureaucracy, a complex tax regime, credit risks in the market, underdeveloped
infrastructure, etc.
There are commonalities in the problems that the Japanese investors face in investing in other emerging markets in
Asia as well as in Brazil. Institutional issues regarding implementation of regulatory mechanisms, lack of transparency
in the legal system; and underdeveloped infrastructure are the most commonly cited problems. Intense competition
from other companies, both local and other foreign investors are also cited by the Japanese investors doing business
in these regions. Firms from South Korea, China and Singapore are the most common foreign investors that the
Japanese regard as competition in the widely popular South East Asian region.
6. Conclusion
According to the United Nations Conference on Trade and Development’s (UNCTAD) 2018 World Investment Report,
India is one of the top 10 host economies that attract FDI. The year 2016 saw a record high in FDI inflows at US$ 44.5
billion (UNCTAD). The subsequent year, 2017 recorded a decline and the FDI stood at US$ 39 billion, reflecting the
global downward trend. India’s specialized service sector, English speaking competitive workforce, large potential
market size and growth; have contributed to India’s attractiveness as an FDI destination. As of 2017, Japan is the 5th
largest FDI investor in the India and accounts for 4% of India’s FDI inflows. The top sectors that Japan invests in India
as mentioned in Section 3 are reflective of the top sectors that attract FDI in India. Notwithstanding Japan’s
importance as a source of investment, the secondary data analyzed suggests that Japan’s investment experience has
a lot of unrealized potential in the case of India. Despite constraints posed by infrastructure and regulations, both
nations would clearly benefit from building stronger relations. Technology transfer in infrastructure and other
industries would help India’s development, while Japan could benefit from India’s young talent pool that is diverse,
cheap and easily available.
Japan has been aggressively attempting to stimulate its economy since April 2013, after the onset of ‘Abenomics’.
Quantitative and qualitative easing by increasing the money supply, negative interest rates and export promotion are
some of the major facets of ‘Abenomics’ to bring out Japan from its two-decade long stagnancy. At this juncture,
Japanese firms have more incentive to accelerate overseas business, which is where India can prove to be a
promising candidate. The JBIC Survey on overseas business operations 2014, identified the potential growth of the
labor market, labor costs, size of the local market, India’s potential as a production base for exports as the most
attractive aspects of the Indian market, which are of interest to Japanese corporations.
Improvement in business regulations is needed to propel Japanese FDI into India, as the cumbersome business
environment in India is one of the main reasons cited by Japanese firms as hurting their profitability in India.
Japan’s established presence lies in providing superior quality products with high prices that cater to cross national
consumer segments (Enatsu, 1997; Nonaka & Katsumi, 2007; Horn, 2015). However, this strategy has better chances
of success in advanced economies, and not emerging ones which are overflowing with spurious products, cheap
alternatives and lower consumption capacity. Japanese firms thus engage in strategic planning that will suit the
54
needs of the Indian consumers. However, they also have been dealing with risks of political and economic uncertainty
(Khanna et al, 2005) including geographical complexity and a very diverse socio-cultural environment (Itou, 2006;
Oku, 2008). The Japanese are now adopting some of their strategies of localized production and actively targeting the
needs of the Indian middle-class consumer. From primarily investing in the manufacturing sector, several firms have
diversified their interests into more niche markets such as healthcare, start-ups, etc. Furthermore, Japan’s interest in
India’s service sector is on the rise. This reflects the sector wise distribution of Japan’s total outward FDI as well.
According to the assessment by Research and Information System (RIS), the CEPA has been effective in introducing
better security measures for investments while introducing a liberalized framework for trade of goods and services.
Notwithstanding criticism about the tariff reduction process, there has been a stable and continual rise in the
number of Japanese in India after the introduction of the CEPA, indicating a positive impact of the same.
This paper has explored some of the factors influencing Japanese investments in India. Many areas, such as the role
of culture or organizational set up, quality, however, remain unexplored. The discussion clearly indicates that despite
numerous governmental measures to facilitate Japanese firms in India, which are well advertised in the Indian media
and in government press releases, the level of bilateral trade and investment does not reflect its full potential.
Exhaustive primary research on sectoral trends and problems faced by individual firms may provide a more insightful
understanding of the prospects for the said challenges facing Japanese businesses in India and the steps required to
strengthen bilateral trade and business relations between the two countries.
References● Abe, I. (2015). JETRO's Role in Accelerating Japanese FDI. JETRO. Bank of Japan. (2017). Balance of Payments Report. Bank of Japan.
● Buckley, P. J., Cross, A. R., & Horn, S. A. (2012). Japanese Foreign Direct Investment in India: An Institutional Theory Approach. Business History,
657–688.
● Choudhury, S. R. (2009). Japan’s Foreign Direct Investment Experience in India: Lessons Learnt from Firm Level Surveys. Indian Council for
Research on International Economic Relations (ICRIER).
● Das, R. U. (2014, January). India-Japan Comprehensive Economic Partnership Agreement (CEPA): Some Implications for East Asian Economic
Regionalism and RCEP. Research and Information System for Developing Countries (RIS).
● DBS Group Research. (2016). Japan: Rising Direct Investment in South East Asia. Development Bank of Singapore.
● Department of Industrial Promotion & Policy. (2016). FDI Synopsis on Country Japan.
● Government of India.
● Diep, T., & Hawkins, P. (2015). Foreign Investors in Vietnam: An Increasingly Attractive Market.
● Asian Management Insights, 76-84.
● Fujita, M. (2000). Foreign Direct Investment, Trade & Vietnam's Interdependence in the APEC Region. Institute of Developing Economies, JETRO.
● Global Business Division, MUFG. (2017). Japanese Investments in India - Prospects and Challenges. MUFG.
● Government officials of India and Japan. (2006). Report of the India-Japan Joint Study Group.
● Government of India, Government of Japan.
● Hanh, N. P., Hung, D. V., Hoat, N. T., & Trang, D. T. (2017). Improving Quality of Foreign Direct Investment Attraction in Vietnam. International
Journal of Quality Innovation.
● Hisai, T. (2015). Enhancing Foreign Direct Investment in India: focusing on the financial sector.
● ICRIER-PRI Joint Workshop.
● Horn, S. A. (2015). Subsidiary Capacity Building in Emerging Markets: How Japanese MNE's Sequence Market Entry & Development Strategies in
India. Wiley Periodicals, Inc.
● III, T. F., & Przystup, J. J. (2017, March). India-Japan Strategic Cooperation and Implications for US Strategy in the Indo-Asia-Pacific Region.
Institute for National Strategic Studies Strategic Perspectives, no. 24.
● Japan International Cooperation Agency (JICA). (2018). Operations and Activities in India. JICA.
● Jerurkar, A., & Sanbe, H. (2017). Doing Business in India-A perspective from Japan. India Unleashed.
● JETRO. (2013). Challenges for India-Japan Investment Promotion and Proposals to both Governments. JETRO.
● JETRO. (2017). 2017 JETRO Survey on Business Conditions of Japanese Companies in Asia and Oceania. JETRO.
● Kiyota, K. (2015, September). Trends and characteristics of Inward and Outward Direct Investment in Japan. White Paper on International
Economy and Trade. Japan Spotlight.
● Lotorre, M. C., & Hosoe, N. (2016). The Role of Japanese FDI in China. Journal of Policy Modelling, 226-241.
● Makoni, P. L. (2015). An Extensive Exploration of Theories of Foreign Direct Investment. Risk governance & control: financial markets &
institutions.
● Masanori, K. (2012). Japan-India Economic Relationship: Trends and prospects. Research Institute of Economy, Trade and Industry (Japan).
● Mathew, D., & Bera, S. (2012). India-Japan Trade and Investment Relations and Their Future Prospects.
● Medvedev, D. (2012). Beyond Trade: The Impact of Preferential Trade Agreements on FDI Inflows. World Development, pp. 49-61.
● Nataraj, G. (2010). India-Japan Investment Relations: Trends and Prospects. Indian Council for Research on International Economic Relations
(ICRIER).
● Nielson, B. B., Asmussen, C. G., & Weatherall, C. D. (2016). The Location Choice of Foreign Direct Investments: Empirical Evidence and
Methodological Challenges. Journal of World Business, 62-82.
● Okamura, T. (2011). India-Japan Economic Partnership: The Way Forward. New Delhi: Federation of Indian Chambers of Commerce and Industry
(FICCI).
55
● Seshadri, V. (2016). India-Japan CEPA: An Appraisal. Research and Information System for Developing Countries (RIS).
● Sethi, D., Guisinger, S. E., Phelan, S. E., & Berg, D. M. (2003). Analysis, Trends in Foreign Direct Investment Flows: A Theoretical and Empirical
Analysis. Journal of International Business Studies, 315-326.
● The Economist Intelligence Unit. (2015). India: A New Dawn for Japanese Companies?
● Economist Intelligence Unit Limited.
● WorldBank. (2005). Ease of Doing Business in 2005. IMF; WorldBank; Oxford Univeristy Press.
List of Tables● Table 1: Trade in goods and services between India and Japan from 2011 to 2017
● Table 2: RBI regional offices which receive the highest FDI equity inflows from Japan
● Table 3: Sector wise distribution of FDI inflows from Japan to India
● Table 4: FDI to East Asian countries from 1981 to 2005
● Table 5: Direct investment assets by type of investment on a gross value basis
● Table 6: Direct investment liabilities by type of investment on a gross value basis
● Table 7: Top 5 industries to receive ODI in 2017
List of Figures● Figure 1: FDI inflows from Japan vis-à-vis total FDI inflows to India
● Figure 2: Trends in ODA loan commitment (FY2007-08 to FY 2016-17)
● Figure 3: Trends in ODA loan commitment by sector (FY 2007-08 to FY 2016-17)
● Figure 4: Cumulative FDI inflows from 2000-2017
56

ANNEXURE #4
Prof. Rupa Chanda1
India – Japan Relations in Services & the
India – Japan Comprehensive Economic Partnership Agreement
Table of Contents
Abstract
Acknowledgements
Summary
1. Introduction to the Study
1.1 Background and Motivation
1.2 India and FTAs
1.3 India Japan CEPA
1.4 Scope and Outline
2. Service Trade in India and Japan & Bilateral Engagement
2.1 Services Trade in India and Japan
2.1.1 India’s services trade flows
2.1.2 Japan’s services trade flows
2.1.3 India’s services trade flows
2.2 Services FDI in India and Japan
2.2.1 Services FDI in India
2.2.2 Services FDI in Japan
2.3 Bilateral FDI Trends – India and Japan
2.4 Summarizing the key insights
3. Selected Services & India – Japan Engagement
3.1 Education Services
3.1.1 India
3.1.2 Japan
3.1.3 Bilateral Prospects
3.2 IT – Enabled Services Sector
3.2.1 India
3.2.2 Japan
3.2.3 Bilateral Prospects
3.3 Technology Start – Ups in Services
3.3.1 India
3.3.2 Japan
3.3.3 Bilateral Prospects
3.4 Engineering Services
3.5 Taking stock of prospects under the CEPA
4. Survey Findings and Discussion
4.1 Survey Methodology and Approach
4.2 Results & Discussion
4.2.1 Education Services
4.2.2 IT – ITeS Sector
1 Rupa Chanda is RBI Chair Professor in Economics at IIM Bangalore. Kalpana Tokas is Assistant Professor at IMI, New Delhi and a former doctoralstudent in the Economics and Social Sciences Area at IIM Bangalore. This study was funded by a seed grant from the India Japan Study Centre atIIM Bangalore. It builds upon Kalpana Tokas’ doctoral work on India-Japan services trade in IT-IT enabled services.
57
4.3 Technology Start – Ups
4.4 Engineering Services
4.5 Summarizing the Findings
5. Concluding Thoughts
5.1 Addressing the unfinished agenda and improving commitments
5.2 Exploring synergies, collaborative opportunities, and new export segments
5.3 Summing up
References
List of Tables
List of Figures
List of Boxes
Appendices
Appendix A - India – Japan Comprehensive Economic Partnership Agreement (CEPA)
Appendix B - Selected Announcements/Agreements signed between India and Japan
Appendix C - Survey Questionnaires
58

Abstract
India and Japan signed a Comprehensive Economic Partnership Agreement (CEPA) in February 2011. Lauded as one
of India’s most exhaustive trade agreements, it aims to liberalize and enhance trade in goods, services as well as
investment flows between the two countries. However, trends in bilateral trade suggest that the bilateral potential
remains untapped. This study examines the prospects for expanding trade, investment, and other forms of
engagement between India and Japan in the service sector and the factors that currently constrain this potential. It
specifically focuses on four service subsectors, namely, education services, IT and IT enabled services (ITeS),
technology-based start-ups providing services and engineering services. The study also assesses the extent to which
there is awareness of the CEPA among stakeholders on both sides and the likely efficacy of this agreement in enabling
the realization of expected benefits.
Keywords: Services, CEPA, trade, FDI, commitments, bilateral
JEL classification: F13, F16
Acknowledgements
This study has been funded by the India Japan Study Centre at the Indian Institute of Management Bangalore. We are
grateful to the Centre for enabling us to undertake this research and for extending all necessary support to complete
this study.
We are very grateful to the survey agency, BRIEF, for carrying out the primary survey and completing all the
interviews on time. We thank Afaq Hussain and Sameer Ahmad for coordinating the interviews and providing us with
the collated responses.
We also thank all the survey respondents from companies, government agencies, and industry associations who
provided their valuable time to share their insights.
I am also thankful to the two reviewers for their useful comments and suggestions which helped in improving this
report and addressing many finer points.
Finally, thanks are due to Saunok Chakraborty and Sudeshna Ghosh for their prompt research assistance in the final
stages of this report.
Summary
India and Japan signed a Comprehensive Economic Partnership Agreement (CEPA) in February 2011. The agreement
came into force in August 2011. Lauded as one of India’s most exhaustive trade agreements, it aims to liberalize and
enhance trade in goods, services as well as investment flows between the two countries. However, trends in bilateral
trade suggest that the bilateral potential remains untapped. This study examines the prospects for expanding trade,
investment and other forms of engagement between India and Japan in the service sector and the factors that
currently constrain this potential. It specifically focuses on four service subsectors, namely, education services, IT and
IT enabled services (ITeS), technology-based startups providing services and engineering services. The study also
assesses the extent to which there is awareness of the CEPA among stakeholders on both sides and the likely efficacy
of this agreement in enabling the realization of expected benefits.
Following the introduction, Section 2 provides an overview of services trade for India and Japan and discusses their
bilateral trade and investment relations in services in recent years, based on secondary sources. Section 3 outlines
the key features of the four services in both countries and the status of existing bilateral initiatives in these services.
The discussion clearly indicates the strengths and complementarities between the two countries in the service sector
and highlights the scope for expanding and diversifying trade and investment relations as well as non-commercial
engagement between the two countries.
Section 4 presents the findings of the interviews for each of the 4 sectors. The discussion outlines the opportunities
for bilateral engagement in these services, the key challenges, and the perspectives of respondents on the CEPA and
future directions for this agreement to advance mutual interests in the selected services. The survey findings indicate
that the main factors that make Japan an attractive partner market are its technological expertise, the opportunity it
provides as a new untapped market for firms looking for diversification (in Asia-Pacific) and recent incentives by the
Japanese government to internationalize by attracting businesses to Japan as well as by investing overseas.
Opportunities in the Indian market are mainly due to the quality and cost effectiveness of its workforce and to a
lesser extent government policies and incentives. The main constraints highlighted by the survey relate to differences
in language and culture and organizational practices, followed by high investment costs in Japan and infrastructural
59
challenges as well as regulatory issues concerning investment and labour in India. Overall, the discussions indicate
that for the CEPA to be more useful to both countries, the linguistic and cultural gap and the lack of understanding
and awareness of each other’s markets need to be bridged.
Section 5 concludes by highlighting some specific steps that could be taken in future negotiations to make the
agreement much more meaningful to both sides. These include addressing the unfinished built-in agenda under the
agreement; exploring synergies and collaborative opportunities as well as targeting new segments and niches; and
reviewing the functioning and efficacy of those aspects which have been addressed under the CEPA. Specific action
points are also outlined to address issues such as data limitations in bilateral services trade, cultural and linguistic
barriers, data security, as well as longer-term strategic interests through partnerships in other regions such as Africa
and collaboration in sectors such as health. A key takeaway from this study is that without enhanced connectivity and
understanding at the level of people and organizations, the macro level benefits of the CEPA in terms of trade,
investment, and technology flows, will be difficult to realize.
1. Introduction to the Study
1.1 Background and Motivation
In the past two decades, most economies in the world have entered into various kinds of regional and bilateral
agreements. These include free trade agreements (FTAs), preferential trade agreements (PTAs), economic
cooperation and economic partnership agreements (ECAs and EPAs), among others. These are between countries
with similar as well as vastly different levels of development, and both within and across regions. Increasingly, an
important feature of these agreements is that they go beyond goods to cover the services sector as well as other
issues such as investment, government procurement, labour and environment, among others.
The inclusion of services in trade agreements stems from their growing tradability. Services trade expanded at an
average annual growth rate of 5.4 percent between 2005 and 2017, compared to 4.6 percent for goods trade.
Services exports were valued at US$ 5.8 trillion in 2018, or 25 per cent of global exports, with developing countries
accounting for a growing share (Trade and Development Report, UNCTAD, 2019) . The rise in services trade is due to2
a variety of factors, including advances in information and communication technology, increased mobility between
countries, declining transport costs, liberalization of Foreign Direct Investment (FDI) in services and the growing use
of services as an input to manufacturing all through the value chain. An important distinguishing feature of services3
trade is that it is subject to a wide range of border measures such as FDIs, visa, and data localization and transfer
regulations related restrictions as well as behind-the-border measures in the form of standards, licensing restrictions,
economic needs tests, authorization requirements, and other domestic regulations. Moreover, services can be traded
through various modes of supply. These as well as other characteristics of services, such as their intangibility,4
non-durability, and the provider-consumer proximity burden in many services, make it far more complex to address
services liberalization compared to goods in trade agreements.
1.2 India and FTAs
India has, over the past two decades, significantly expanded its trade and investment relations with a growing
number of countries by initiating free trade, preferential trade, and economic cooperation agreements. Within Asia,
India has signed bilateral FTAs with Sri Lanka (1998, in force 2001), Afghanistan (2003), Thailand (2004), Singapore
(2005), Bhutan (2006), Nepal (2009), Korea (2009, in force 2010), Malaysia (2011) and Japan (2011). It has also signed
the South Asian Free Trade Agreement (SAFTA) (2004, in force 2006) and a bilateral FTA with the Association of
Southeast Asian Nations (ASEAN) in 2010. Outside Asia, India has entered into free trade agreements with Chile
(2006, in force 2007) and MERCOSUR (2004, in force 2009). Negotiations are in process, at various stages with many5
5 This information is based on India’s notification of its various free trade agreements to the WTO.
4 Services can be traded through 4 modes of supply. These are: mode 1 (cross-border supply) when a service crosses borders (BPO, transport);
mode 2 (consumption abroad) when a consumer consumes the service in another country (medical tourism, foreign students); mode 3
(commercial presence) when a juridical entity is set up to provide a service in another country (banking, telecom); and mode 4 (movement of
natural persons) when a service supplier goes to another country temporarily to deliver a service (IT, healthcare).
3 According to the World Trade Report, 2019, 59 per cent of world trade in services can be attributed to Mode 3, i.e., commercial presence, which
signifies the importance of FDI for services trade. In 2018, the value of net cross-border M&As globally was the highest in the services sector,
valued at USD 469 bn. Similarly, the value of FDI greenfield projects announced was the highest in services, at USD 463 billion (World Investment
Report, UNCTAD, 2019).
2 https://unctad.org/en/PublicationsLibrary/tdr2019_en.pdf
60
partners, including the EU , Australia, New Zealand, Indonesia, among others. An important trend in India’s approach6
to FTAs is to negotiate comprehensive agreements that include goods, services and investment. This is mainly
motivated by the fact that India is more competitive in services and expects to be able to better leverage any market
access gains in services under such agreements, thereby also compensating for losses it experiences in goods trade.
India’s interests in services pertain to the movement of its professionals to partner countries in sectors and through
cross border delivery of outsourced services.
After more than a decade of India’s entry into such comprehensive agreements, the evidence appears to be mixed.
The market access gains in services have largely not been realized. India’s recent withdrawal from the Regional
Comprehensive Economic Partnership (RCEP) agreement in part reflects this view among Indian policy makers, that
market access commitments in services from partner countries may not be forthcoming as expected under such
comprehensive arrangements, while India may have to increasingly concede market access in goods, resulting in
growing trade deficits with its partners. There is thus an emerging view that India needs to review its FTAs, take stock
of the gains and losses, and accordingly decide on the future course of FTA negotiations as well as its existing
agreements.
Needless to say, a cost-benefit analysis of FTAs, however, should not be limited to a simplistic assessment of their
impact on trade balances as there are potential gains in the form of technology transfer, value added linkages,
trade-related investment flows, and improved access to a greater variety of intermediate goods and services, which
cannot be captured through trade balances. Furthermore, India’s experience shows that utilization of FTAs might be
quite low and attributing the effects on trade flows to an agreement, may not always be justified. It is thus important
to review each bilateral or regional agreement against its potential, i.e., in terms of the sectoral opportunities and
challenges that exist between the partners in individual sectors and to widen this analysis beyond trade flows to
consider all forms of engagement, both commercial and non-commercial. It is also important to assess the degree of
awareness and utilization of an agreement among industry stakeholders. Such a deep-dive analysis can provide a
more holistic understanding of the prospects for expanding bilateral or regional relations in services and the specific
constraints that would need to be addressed in each sector with respect to each partner country.
1.3 India Japan CEPA
One such FTA signed by India is the India-Japan Comprehensive Economic Partnership Agreement (CEPA). This
agreement was signed in February 2011 and came into force in August 2011. Lauded as one of India’s most
exhaustive trade agreement, it aims to liberalize and enhance trade in goods, services as well as investment flows
between the two countries. This agreement drew upon the recommendations of a 2006 Joint Study Group (JSG)
Report which highlighted the existence of immense untapped economic opportunities between the two countries,
that could be realized through a CEPA.7
One of the main observations of the JSG report was the presence of complementarities between India and Japan., in
particular, the demographic complementarity between the two countries, given India’s young, quality and
cost-effective labor force and Japan’s ageing population and rising wages. The report noted that Japan needs to8
outsource services in multiple sectors while India has a skill-intensive labour force that could provide cost-effective
and high-quality services. India’s expertise in areas such as IT and biotechnology were seen as complementing
Japan’s edge in R&D, technology and manufacturing of products while India’s growing middle-class with rising
incomes had the potential to serve as a huge market for Japanese investments. Overall, the JSG, which laid the basis
for the eventual CEPA between the two countries, noted that expanding bilateral relations in services would be more
important than in the goods sector as this would enhance the connect between people. It suggested a “GATS-plus”
engagement through the CEPA, which could aid the growth of the services sector in both countries and
recommended facilitating the movement of skilled professionals from India to Japan to provide the requisite services.
8 Japan’s population reached its peak in 2007 and has been on a declining trend since, with 28 percent of the population above 65. It is estimatedto decline by 13 per cent by 2045(See https://www.nytimes.com/2019/12/24/world/asia/japan-birthrate-shrink.html). With a low female labourforce participation rate and a large aged population, Japan’s dependency ratio is very high. In contrast, India entered the period of demographicdividend in 2018 with the working age population accounting for 66.4 percent of its population (Seehttps://data.oecd.org/pop/working-age-population.htm).
7 Apart from the CEPA which is under review, there are other forums through which India and Japan are engaged in services discussions. Theseinclude the Indo-Pacific alliance, the G20, the trilateral forum consisting of India-Japan-Australia and various bilateral MoUs and jointly fundedinitiatives.
6 Discussions for an India-EU Broad-Based Trade and Investment Agreement are currently on hold and have to be relaunched.
61
The JSG report also highlighted the presence of barriers such as the lack of recognition of qualifications and9
experience of professionals and visa restrictions as a challenge to expanding bilateral relations in services.
Evidence following implementation of the India-Japan CEPA indicates hardly any expansion in bilateral relations in
goods or services. India’s exports of goods to Japan have declined from US$ 4.8bn in 2010-11 to US 4.5 $ bn in 2018
while its services exports to Japan increased only marginally from US $4 bn to $4.8 bn between 2010 and 2015 (the10
latter being the latest year for which bilateral services data is publicly available) . In sectors such as IT and11
information services and other business services, where India is considered to be competitive, its exports to Japan
have hardly increased, rising from US $2.1 bn to $3 bn for IT services and from $423mn to $585 mn for other
business services between 2010 and 2015 . There is no dynamism evident in either exports or imports of services12
between the two countries. If one considers the relative importance of the two countries in each other’s trade flows,
then one finds a stagnant or declining trend. In 2006, Japan ranked 10th among India’s export markets and import
sources. In 2019 it ranked 19th and 14th, respectively . As an export market for services, Japan’s share has declined13
from 2.9% to 2.5% and its importance as a source of imports for services has fallen from 4% to 3.5% over 2006 to
2015. Similarly, India’s significance for Japan as a source of services imports has risen only marginally from 1.9% to
2.1% and from 1.6% to 1.8% as a market for services exports from Japan, during this period.
The trends in bilateral trade thus indicate that the bilateral potential that had been highlighted in the JSG remains
untapped. This point is well captured in a recent statement by the current Commerce Minister in December 2019,
that “despite commitments in CEPA from Japan, market access for India’s goods and services remain elusive.”14
Against this backdrop, it is important to examine in-depth the prospects and the challenges that exist for India-Japan
relations.
1.4 Scope and Outline
This study specifically focuses on the potential that exists for expanding trade, investment and other forms of
engagement between India and Japan in the service sector and the factors that currently constrain this potential. As
services are very heterogeneous in nature, we focus on four service subsectors, namely, education services, IT and IT
enabled services (ITeS), technology-based startups providing services and engineering services. The choice of these15
four services is motivated by discussions with industry and government officials and an examination of the secondary
evidence on bilateral initiatives, bilateral data and a stock taking of the sectors and activities in which companies are
present in each other’s markets. Though there exist some studies which have analyzed bilateral merchandise trade
between India and Japan, there is a paucity of studies exploring trade in key services and the implications of CEPA for
the same. This study aims to address this gap by both identifying bilateral opportunities in these services and also
constraints impeding these opportunities. Further, it assesses the extent to which there is awareness of the CEPA
among industry stakeholders on both sides and the likely efficacy of this agreement in enabling the realization of
expected benefits.
The discussion is based on a mix of primary and secondary evidence. It primarily draws upon interviews with Indian
and Japanese companies present in each other’s markets, as well as government officials, industry experts and
industry association representatives. These primary insights are supplemented by data from secondary sources to
validate the findings.
The report is structured as follows. Section 2 provides an overview of services trade for India and Japan and discusses
their bilateral trade and investment relations in services in recent years, based on secondary sources. It highlights the
strengths and complementarities between the two countries in the service sector. Section 3 outlines the key features
of the four services under focus in this study in both countries and the status of existing bilateral initiatives in these
services. Section 4 presents the findings of the interviews for each of the 4 sectors. The discussion outlines the
15 We consider tech start-ups in services, including in IT-IT enabled services but distinguish these from IT and IT-enabled services firms. Forengineering services, although the GATS framework mostly covers engineers in infrastructure services, in this discussion, we take a broaddefinition of engineering services. We consider the provision of engineering services across different verticals (infrastructure, IT products.Construction, and manufacturing) and do not make a distinction between engineers as part of the manufacturing versus the services workforce.
14 See, https://economictimes.indiatimes.com/news/economy/foreign-trade/india-japan-trade-ministers-discuss-review-of-cepa-ahead-of-pms-meet/articleshow/72458688.cms?utm_source=contentofinterest&utm_medium=text&utm_campaign=cppst
13 India Trade Portal, Ministry of Commerce and Industry, GOI
12 See https://stats.oecd.org/Index.aspx?datasetcode=TIVA_2018_C1 (Accessed April 22, 2020)
11 Bilateral services trade data is available for a longer time period (2000-2015) from the OECD’s Trade-in-Value-Added (TiVA) database. This is themost detailed bilateral services trade database available at this time, the only limitation being that this data is available only till 2015.
10 https://wits.worldbank.org/CountryProfile/en/Country/IND/StartYear/1988/EndYear/2018/TradeFlow/Export/Indicator/XPRT-TRD-VL/Partner/JPN/Product/Total
9 GATS refers to the General Agreement on Trade in Services under the WTO. A GATS plus approach refers to inclusion of elements andcommitments that go beyond what exists under the GATS.
62
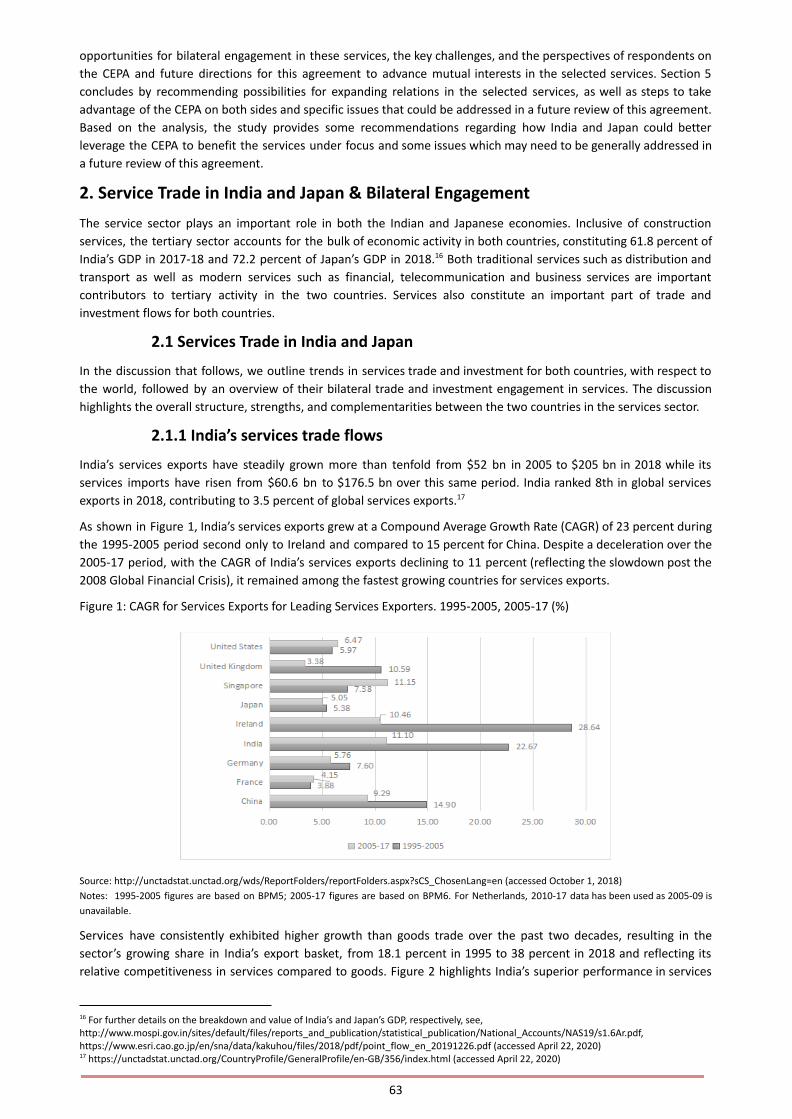
opportunities for bilateral engagement in these services, the key challenges, and the perspectives of respondents on
the CEPA and future directions for this agreement to advance mutual interests in the selected services. Section 5
concludes by recommending possibilities for expanding relations in the selected services, as well as steps to take
advantage of the CEPA on both sides and specific issues that could be addressed in a future review of this agreement.
Based on the analysis, the study provides some recommendations regarding how India and Japan could better
leverage the CEPA to benefit the services under focus and some issues which may need to be generally addressed in
a future review of this agreement.
2. Service Trade in India and Japan & Bilateral Engagement
The service sector plays an important role in both the Indian and Japanese economies. Inclusive of construction
services, the tertiary sector accounts for the bulk of economic activity in both countries, constituting 61.8 percent of
India’s GDP in 2017-18 and 72.2 percent of Japan’s GDP in 2018. Both traditional services such as distribution and16
transport as well as modern services such as financial, telecommunication and business services are important
contributors to tertiary activity in the two countries. Services also constitute an important part of trade and
investment flows for both countries.
2.1 Services Trade in India and Japan
In the discussion that follows, we outline trends in services trade and investment for both countries, with respect to
the world, followed by an overview of their bilateral trade and investment engagement in services. The discussion
highlights the overall structure, strengths, and complementarities between the two countries in the services sector.
2.1.1 India’s services trade flows
India’s services exports have steadily grown more than tenfold from $52 bn in 2005 to $205 bn in 2018 while its
services imports have risen from $60.6 bn to $176.5 bn over this same period. India ranked 8th in global services
exports in 2018, contributing to 3.5 percent of global services exports.17
As shown in Figure 1, India’s services exports grew at a Compound Average Growth Rate (CAGR) of 23 percent during
the 1995-2005 period second only to Ireland and compared to 15 percent for China. Despite a deceleration over the
2005-17 period, with the CAGR of India’s services exports declining to 11 percent (reflecting the slowdown post the
2008 Global Financial Crisis), it remained among the fastest growing countries for services exports.
Figure 1: CAGR for Services Exports for Leading Services Exporters. 1995-2005, 2005-17 (%)
Source: http://unctadstat.unctad.org/wds/ReportFolders/reportFolders.aspx?sCS_ChosenLang=en (accessed October 1, 2018)
Notes: 1995-2005 figures are based on BPM5; 2005-17 figures are based on BPM6. For Netherlands, 2010-17 data has been used as 2005-09 is
unavailable.
Services have consistently exhibited higher growth than goods trade over the past two decades, resulting in the
sector’s growing share in India’s export basket, from 18.1 percent in 1995 to 38 percent in 2018 and reflecting its
relative competitiveness in services compared to goods. Figure 2 highlights India’s superior performance in services
17 https://unctadstat.unctad.org/CountryProfile/GeneralProfile/en-GB/356/index.html (accessed April 22, 2020)
16 For further details on the breakdown and value of India’s and Japan’s GDP, respectively, see,http://www.mospi.gov.in/sites/default/files/reports_and_publication/statistical_publication/National_Accounts/NAS19/s1.6Ar.pdf,https://www.esri.cao.go.jp/en/sna/data/kakuhou/files/2018/pdf/point_flow_en_20191226.pdf (accessed April 22, 2020)
63
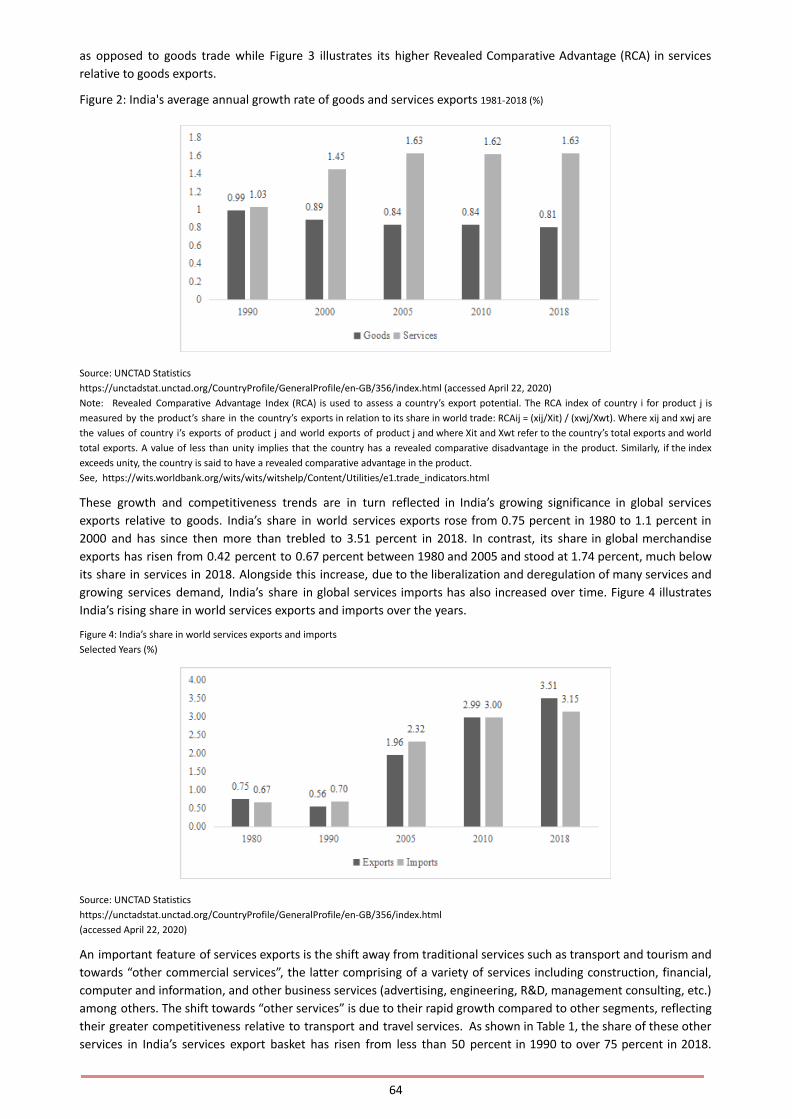
as opposed to goods trade while Figure 3 illustrates its higher Revealed Comparative Advantage (RCA) in services
relative to goods exports.
Figure 2: India's average annual growth rate of goods and services exports 1981-2018 (%)
Source: UNCTAD Statistics
https://unctadstat.unctad.org/CountryProfile/GeneralProfile/en-GB/356/index.html (accessed April 22, 2020)
Note: Revealed Comparative Advantage Index (RCA) is used to assess a country’s export potential. The RCA index of country i for product j is
measured by the product’s share in the country’s exports in relation to its share in world trade: RCAij = (xij/Xit) / (xwj/Xwt). Where xij and xwj are
the values of country i’s exports of product j and world exports of product j and where Xit and Xwt refer to the country’s total exports and world
total exports. A value of less than unity implies that the country has a revealed comparative disadvantage in the product. Similarly, if the index
exceeds unity, the country is said to have a revealed comparative advantage in the product.
See, https://wits.worldbank.org/wits/wits/witshelp/Content/Utilities/e1.trade_indicators.html
These growth and competitiveness trends are in turn reflected in India’s growing significance in global services
exports relative to goods. India’s share in world services exports rose from 0.75 percent in 1980 to 1.1 percent in
2000 and has since then more than trebled to 3.51 percent in 2018. In contrast, its share in global merchandise
exports has risen from 0.42 percent to 0.67 percent between 1980 and 2005 and stood at 1.74 percent, much below
its share in services in 2018. Alongside this increase, due to the liberalization and deregulation of many services and
growing services demand, India’s share in global services imports has also increased over time. Figure 4 illustrates
India’s rising share in world services exports and imports over the years.
Figure 4: India’s share in world services exports and imports
Selected Years (%)
Source: UNCTAD Statistics
https://unctadstat.unctad.org/CountryProfile/GeneralProfile/en-GB/356/index.html
(accessed April 22, 2020)
An important feature of services exports is the shift away from traditional services such as transport and tourism and
towards “other commercial services”, the latter comprising of a variety of services including construction, financial,
computer and information, and other business services (advertising, engineering, R&D, management consulting, etc.)
among others. The shift towards “other services” is due to their rapid growth compared to other segments, reflecting
their greater competitiveness relative to transport and travel services. As shown in Table 1, the share of these other
services in India’s services export basket has risen from less than 50 percent in 1990 to over 75 percent in 2018.
64
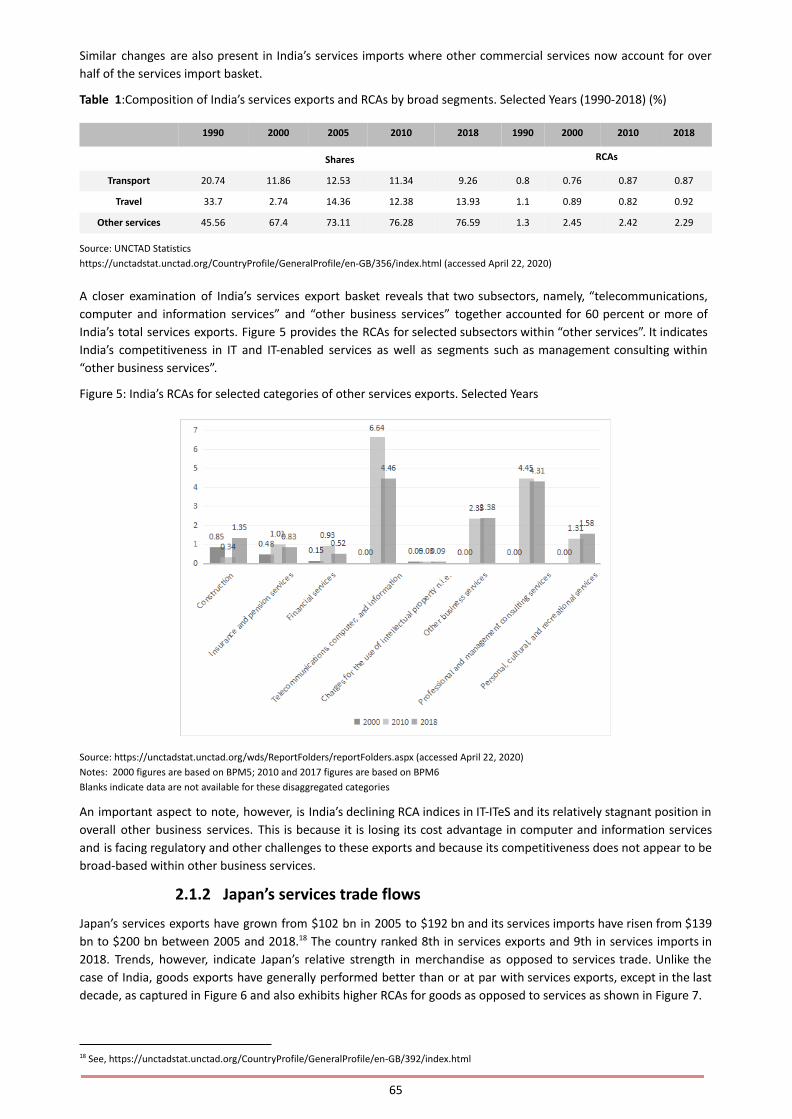
Similar changes are also present in India’s services imports where other commercial services now account for over
half of the services import basket.
Table 1:Composition of India’s services exports and RCAs by broad segments. Selected Years (1990-2018) (%)
1990 2000 2005 2010 2018 1990 2000 2010 2018
Shares RCAs
Transport 20.74 11.86 12.53 11.34 9.26 0.8 0.76 0.87 0.87
Travel 33.7 2.74 14.36 12.38 13.93 1.1 0.89 0.82 0.92
Other services 45.56 67.4 73.11 76.28 76.59 1.3 2.45 2.42 2.29
Source: UNCTAD Statistics
https://unctadstat.unctad.org/CountryProfile/GeneralProfile/en-GB/356/index.html (accessed April 22, 2020)
A closer examination of India’s services export basket reveals that two subsectors, namely, “telecommunications,
computer and information services” and “other business services” together accounted for 60 percent or more of
India’s total services exports. Figure 5 provides the RCAs for selected subsectors within “other services”. It indicates
India’s competitiveness in IT and IT-enabled services as well as segments such as management consulting within
“other business services”.
Figure 5: India’s RCAs for selected categories of other services exports. Selected Years
Source: https://unctadstat.unctad.org/wds/ReportFolders/reportFolders.aspx (accessed April 22, 2020)
Notes: 2000 figures are based on BPM5; 2010 and 2017 figures are based on BPM6
Blanks indicate data are not available for these disaggregated categories
An important aspect to note, however, is India’s declining RCA indices in IT-ITeS and its relatively stagnant position in
overall other business services. This is because it is losing its cost advantage in computer and information services
and is facing regulatory and other challenges to these exports and because its competitiveness does not appear to be
broad-based within other business services.
2.1.2 Japan’s services trade flows
Japan’s services exports have grown from $102 bn in 2005 to $192 bn and its services imports have risen from $139
bn to $200 bn between 2005 and 2018. The country ranked 8th in services exports and 9th in services imports in18
2018. Trends, however, indicate Japan’s relative strength in merchandise as opposed to services trade. Unlike the
case of India, goods exports have generally performed better than or at par with services exports, except in the last
decade, as captured in Figure 6 and also exhibits higher RCAs for goods as opposed to services as shown in Figure 7.
18 See, https://unctadstat.unctad.org/CountryProfile/GeneralProfile/en-GB/392/index.html
65

Figure 6: Japan’s average annual growth rate of goods and services exports
Source: https://unctadstat.unctad.org/CountryProfile/GeneralProfile/en-GB/392/index.html (accessed April 22, 2020)
Figure 7: Japan’s RCAs in goods and services exports Selected Years (1980-2018)
Source: https://unctadstat.unctad.org/CountryProfile/GeneralProfile/en-GB/392/index.html (accessed April 22, 2020)
Given its relative competitiveness in goods exports, Japan accounts for a higher share of global goods exports as
opposed to services, although there is a general declining trend in case of both sectors over the past three decades.
The same decline is also seen in case of Japan’s significance as an importer of services globally and is quite marked in
the post 2000 period. Figures 8 and 9 illustrate these trends in Japan’s goods versus services trade flows and in its
role in global services trade.
Figure 8: Japan’s share in world exports of goods and services Selected Years (1980-2018) (%)
Source: https://unctadstat.unctad.org/CountryProfile/GeneralProfile/en-GB/392/index.html (accessed April 22, 2020)
66

Figure 9: Japan’s share in world services exports and imports Selected Years (1980-2018) (%)
Source: https://unctadstat.unctad.org/CountryProfile/GeneralProfile/en-GB/392/index.html (accessed April 22, 2020)
A feature worth noting, which stands in contrast to the case of India, is that Japan has consistently had a higher
global presence in services imports as opposed to exports. Overall, the picture that emerges is that of a country
which is more competitive in goods compared to services but whose significance in the world market has fallen
across sectors, reflecting its economic stagnation in the past two decades.
In terms of the composition of Japan’s services exports, one finds a major shift from segments like transport services
towards travel and other services as seen in Table 2. The RCAs indicate that Japan is relatively more competitive in
the “other services” segment. A closer examination reveals the subsectors which are important within this segment.
These include construction, financial, charges for use of intellectual property, other business services, which
constituted 5 percent of more of total services exports. Table 3 presents the structure of Japan’s other services
exports followed by Figure 10 which shows Japan’s competitiveness in certain segments such as Intellectual Property
(taken here as a proxy for competence in technical and R&D services) and construction services.
Table 2: Composition of Japan’s services exports and RCAs by broad segments Selected Years (1990-2018) (%)
1990 2000 2005 2010 2018 1990 2000 2010 2018
Shares RCAs
Transport 42.89 36.98 35.08 31.42 15.07 1.05 0.22 0.35
Travel 8.67 4.87 12.19 9.82 21.42 0.18 0.2 0.33
Other
services
48.44 58.15 52.42 58.32 62.58 - 0.87 0.97 1.33
Source: https://unctadstat.unctad.org/CountryProfile/GeneralProfile/en-GB/392/index.html (accessed April 22, 2020)
Note: * RCA could not be calculated for 1990 due to non-availability of required data for this subsector.
Table 3: Composition of Japan’s other services exports, Selected Years (2005-18) (%)
Sectors 2005 2010 2018
Construction 7.08 7.91 4.8
Insurance and pension services 0.85 0.95 1.26
Financial services 4.97 2.68 5.98
Charges for the use of intellectual property n.i.e. 17.27 19.85 23.73
Telecommunications, computer, and information services 1.49 1.32 2.38
Telecommunications services 0.39 0.55 0.66
Other business services 18.39 23.57 21.65
Research and development (R&D) 3.43 3.04 3.6
Personal, cultural, and recreational services 0.09 0.11 0.33
Source: https://unctadstat.unctad.org/CountryProfile/GeneralProfile/en-GB/392/index.html (accessed April 22, 2020)
67

Figure 10: Japan’s RCAs in select categories of other services Selected Years (2000-18)
https://unctadstat.unctad.org/CountryProfile/GeneralProfile/en-GB/392/index.html (accessed April 22, 2020)
The composition and pattern of competitiveness in Japan’s exports complements the services import basket for India
in segments such as financial and insurance services and IP related charges. The same holds in the case of Japan’s
import basket and trends, which complement India’s areas of export strength, such as telecommunications,
computer and information services. There also appears to be scope for two-way flows in segments such as other
business services, which feature importantly in both countries’ exports (22 percent for Japan and 32 percent for
India) as well as imports (22 percent for both). Thus, an overview of the trends in services trade in both countries
indicates several areas of complementary interests and strengths in the services basket. Also, given the variety of
services where such potential exists, all modes of delivery, i.e., cross border, movement of providers, commercial
presence, and of consumers would appear to be relevant for expanding service sector relations between the two
countries.
2.1.3 India’s services trade flows
We next examine the extent to which these complementarities are borne out in their bilateral trade flows in services.
Bilateral up to date services trade data is not readily available from multilateral sources. One source notes that Japan
exported 1.3 percent of its services exports to India in 2017, which ranked 17th among its service export markets.
This was meagre compared with China, which ranked second and accounted for 12 percent of Japan’s services
exports. According to this data, in 2017, India exported US$ 4.8 bn worth of services to Japan, or 2.7 percent of its19
total services exports that year. Its services imports from Japan were valued at US$ 4 bn in 2015, or 3.5 per cent of its
total services imports. It thus registered a slight trade surplus with Japan in services. Table 4 provides the trends in
India’s services exports to and imports from Japan over the 2005-15 period. The figures for bilateral services flows
indicate that there has been very little increase in both India’s services exports to and imports from Japan and the
absolute values overall as well as in individual subsectors remain very low. India had a slight trade surplus in services
with Japan in 2015.
Table 4: India’s Trade in Services with Japan (in USD billions)
2005 2006 2007 2008 2009 2010 2011 2012 2013 2014 2015
India’s exports to Japan 1.84 2.66 3.04 4.02 3.04 4.03 4.09 4.19 4.13 5.01 4.81
19 http://www.worldstopexports.com/japans-exported-services/
68
India’s imports from Japan 1.6 2.09 2.37 2.93 3.04 3.62 4.66 4.62 3.83 3.84 4.02
Source: https://stats.oecd.org/Index.aspx?datasetcode=TIVA_2018_C1 ( Accessed 7 April 2020)
Table 5 provides the sub-sectoral breakdown for services trade between India and Japan. Among the subsectors, IT
and information services accounted for 63 percent of India’s services exports to Japan. At a meagre US $3 bn, merely
4 percent of India’s total IT and information services exports to the world went to Japan as compared to 46 percent in
case of the US. This was followed by other business services exports to Japan, which were valued at $586 million.
India’s services imports from Japan are dominated by finance and insurance services and transport services, valued at
around $1 bn, followed by other business services.
Table 5: India’s Trade with Japan in selected service sectors 2015 (USD Millions)
Sector Services Exports Services Imports Normalized Bilateral RCA (BRCA)20
Total services 4815.8 4033.5
Transport 280.8 986.6 -0.47
IT and information 3052.5 51.7 0.17
Finance and insurance 288.5 1021 -0.23
Other business 585.7 582.6 0.03
Arts, entertainment, recreation and other 6.2 11.7 -0.77
Telecommunications 12.9 4.8 -0.71
Education 3.4 0.3 -0.58
Source : https://stats.oecd.org/Index.aspx?datasetcode=TIVA_2018_C1 ( Accessed : 10 April 2020)
Thus, the bilateral relationship in services is dominated by a few service subsectors. The positive bilateral trade
balance (US $0.8bn) in services is mainly due to IT and information services (US $3 bn) which offsets the deficits in
finance and insurance services (US$ 0.7bn) and transport services ($0.7 bn). The bilateral RCA measures indicate
India’s relative advantage in IT and other business services vis-à-vis Japan.
It is important to note that bilateral data on services trade has its limitations and there are discrepancies across data
sources. While the OECD TiVA data shows India as having services exports of $4.8 bn to Japan in 2015 and a trade
surplus in services, which is similar to the level of services exports ($4.7bn) reported by the Indian Commerce
Ministry, the export figure given by Extended Balance of Payments Services classification 2010 (EBOPS 2010) is much
lower at $1.6bn. These differences are most likely due to differences in the classification of services and coverage of21
the four modes of services trade across the different datasets. An attempt was made to validate the figures based on
JETRO statistics. However, this could not be done as Japan’s services imports from India were not available publicly
(goods imports from India were estimated at $4.8b in 2015, comparable to that for services imports according to
TiVA). The analysis in this report is based on the TiVA data given its comparability with the data available from the
Indian Commerce Ministry. However, it must be seen in light of these data limitations and discrepancies across data
sources.
Table 6 presents the significance of the two countries in each other’s services exports and imports across different
services based on the OECD TiVA statistics. Two subsectors stand out in this relationship. India accounted for 14
percent of Japan’s IT and information services imports, although Japan is not as important an export market for India,
at less than 4 percent of total IT services exports. In the case of finance and insurance services, both countries are
important for each other. Japan accounted for almost 5 percent of India’s finance and insurance services imports
while India accounted for 6.7 percent of its exports in this sector. India is also an important market for Japan’s
construction services exports, accounting for 5.7 percent.
Table 6: Significance in each other’s exports and imports of services 2015 (%)
21 See, https://www.livemint.com/Politics/S7iA23p9KRrKMiWiy7YbqI/Indias-exports-to-Japan-halve-to-385-billion-in-four-year.html andhttps://stats.oecd.org/Index.aspx?DataSetCode=TISP_EBOPS2010.
20 Bilateral RCA is a measure of competitiveness which is calculated as the ratio of the share of sectoral exports of service to a partner country inthe country’s overall services exports to the partner nation to the share of that country’s sectoral service exports to the world in its overall servicesexports to world. Normalized BRCA = (BRCA-1)/(BRCA+1). BRCA value greater than zero indicates advantage and BRCA value less than zeroindicates a disadvantage.
69
Indicator Total services
(incl.
construction)
IT and other
information
services
Total business
sector services
Other
business
sector services
Financial and
insurance
activities
Transportatio
n and storage
Constructi
on
Exports
Japan's significance in India's services
exports to the world
2.74 3.89 2.77 2.93 3.2 1 -
India's significance in Japan's services
exports to the world
1.76 1.45 1.76 1.24 6.68 1.53 5.72
Imports
Japan's significance in India's services
imports from the world
3.48 1.05 3.53 2.95 4.94 3.62 3.48
India's significance in Japan's services
imports from the world
2.09 14.04 2.12 1.04 1.34 0.59 0
Source: https://stats.oecd.org/index.aspx?queryid=75537# (accessed April 23, 2020)
Overall, the bilateral trade structure in services indicates the complementary strengths of the two countries, as also
highlighted earlier. India’s exports to Japan are concentrated in two services, IT and information services and other
business services, two skilled labor-intensive services, where it also has a revealed bilateral comparative advantage.
Its imports from Japan are relatively more diversified and in subsectors which reflect Japan’s comparative advantage
in technology, infrastructure and knowledge-intensive services. However, the trends indicate asymmetries in the
relationship, and scope to expand trade flows between the two countries in areas such as IT and information
services. The one subsector where trade flows are symmetric is other business services. As this is a subsector that
comprises of a wide variety of services, the trends suggest potential for two-way trade flows and complementarities
within this segment. The pattern of bilateral services trade flows also indicates likely linkages between services trade
and investment flows between the two countries given the significance of subsectors such as finance and insurance,
construction, and transport services where FDI based delivery is important. We next examine the significance of the
services sector in India-Japan FDI relations.
2.2 Services FDI in India and Japan
Both India and Japan are important globally as destinations and/or sources of FDI. According to the UNCTAD World
Investment Report 2019 , Japan’s total inward stock of FDI and its total outward stock of FDI stood at $231 bn and22
$1.7 trillion, or 4.3 percent and 33.5 percent of its GDP, respectively, in 2019. Its inward and outward FDI flows
amounted to $9.8 bn and $143 bn or 0.8 percent and 11.9 percent of GDP, respectively in 2019. India’s inward and23
outward FDI stock were valued at $386 bn and $166 bn, or 14.2 percent and 6.1 percent, respectively of GDP in 2019.
In terms of FDI flows, inward and outward FDI flows for India were valued at $42 bn and $11 bn, or 5.3 percent and
1.4 percent of GDP, respectively in 2019.24
The overall FDI trends for the two countries make evident the complementarity in the case of investments, with India
being a key destination for FDI and Japan being a key country of origin for FDI. While India ranked 9th among all
countries as a recipient of FDI, Japan ranked 2nd among all countries as a source of FDI in 2018 . The service sector25
is an important sector in these flows, as discussed next.
2.2.1 Services FDI in India
The services sector, comprising of Financial (banking and insurance) as well as Non-Financial (business, outsourcing,
R&D, courier, technical testing and analysis, and misc. services) is the main destination sector for FDI flows to India.
The average share of services in India’s inward FDI has risen over time, from 10.5 percent for the 1990-94 period to
28.3 percent during the 1995-99 period and further to 75 percent of total FDI inflows at $28 billion in 2017-18.
Cumulative FDI inflows into services for the January 2000-March 2018 period stood at $222.9 billion or roughly 60
percent of total cumulative FDI inflows over this entire period. Service sector FDI has grown more rapidly than
manufacturing FDI, with a CAGR of 28.4 percent between 2013/14 and 2017/18 compared to a mere 2.1 percent
CAGR for manufacturing FDI over this same period. Given the importance of FDI in not only bridging the26
savings–investment gap but also its potential contribution through technological spillovers, upgrading of regulatory
26 See, DIPP (2018) and RBI Handbook of Statistics (various years).
25 https://unctad.org/sections/dite_dir/docs/wir2019/wir19_fs_in_en.pdf
24 https://unctad.org/sections/dite_dir/docs/wir2019/wir19_fs_in_en.pdf
23 https://unctad.org/sections/dite_dir/docs/wir2019/wir19_fs_jp_en.pdf
22 https://unctad.org/en/Pages/DIAE/World%20Investment%20Report/World_Investment_Report.aspx
70
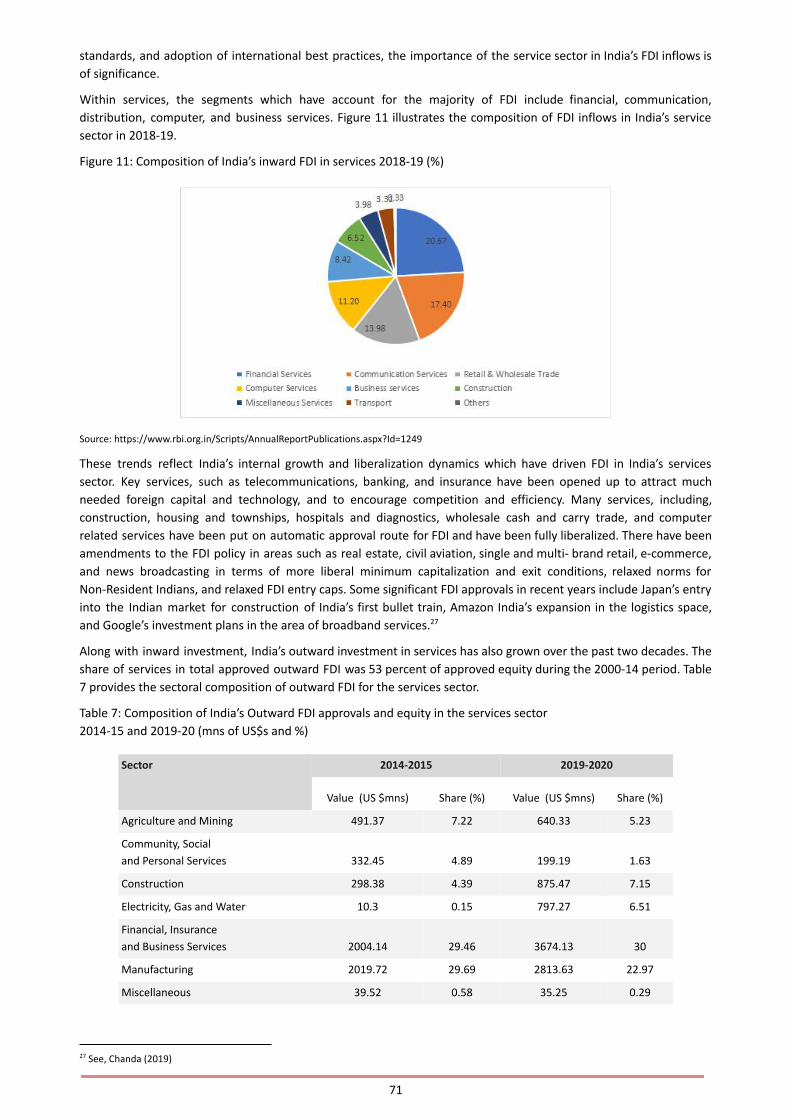
standards, and adoption of international best practices, the importance of the service sector in India’s FDI inflows is
of significance.
Within services, the segments which have account for the majority of FDI include financial, communication,
distribution, computer, and business services. Figure 11 illustrates the composition of FDI inflows in India’s service
sector in 2018-19.
Figure 11: Composition of India’s inward FDI in services 2018-19 (%)
Source: https://www.rbi.org.in/Scripts/AnnualReportPublications.aspx?Id=1249
These trends reflect India’s internal growth and liberalization dynamics which have driven FDI in India’s services
sector. Key services, such as telecommunications, banking, and insurance have been opened up to attract much
needed foreign capital and technology, and to encourage competition and efficiency. Many services, including,
construction, housing and townships, hospitals and diagnostics, wholesale cash and carry trade, and computer
related services have been put on automatic approval route for FDI and have been fully liberalized. There have been
amendments to the FDI policy in areas such as real estate, civil aviation, single and multi- brand retail, e-commerce,
and news broadcasting in terms of more liberal minimum capitalization and exit conditions, relaxed norms for
Non-Resident Indians, and relaxed FDI entry caps. Some significant FDI approvals in recent years include Japan’s entry
into the Indian market for construction of India’s first bullet train, Amazon India’s expansion in the logistics space,
and Google’s investment plans in the area of broadband services.27
Along with inward investment, India’s outward investment in services has also grown over the past two decades. The
share of services in total approved outward FDI was 53 percent of approved equity during the 2000-14 period. Table
7 provides the sectoral composition of outward FDI for the services sector.
Table 7: Composition of India’s Outward FDI approvals and equity in the services sector
2014-15 and 2019-20 (mns of US$s and %)
Sector 2014-2015 2019-2020
Value (US $mns) Share (%) Value (US $mns) Share (%)
Agriculture and Mining 491.37 7.22 640.33 5.23
Community, Social
and Personal Services 332.45 4.89 199.19 1.63
Construction 298.38 4.39 875.47 7.15
Electricity, Gas and Water 10.3 0.15 797.27 6.51
Financial, Insurance
and Business Services 2004.14 29.46 3674.13 30
Manufacturing 2019.72 29.69 2813.63 22.97
Miscellaneous 39.52 0.58 35.25 0.29
27 See, Chanda (2019)
71
Transport, Storage and
Communication Services 785.31 11.54 890.85 7.27
Wholesale, Retail Trade,
Restaurants and Hotels 821.75 12.08 2322.61 18.96
Total 6802.94 100 12248.73 100
Source: https://www.indiastat.com/table/industries-data/18/sector-wise-foreign-direct-investment-fdi-equity-inflows/449572/1115496/data.aspx
Within services, outward FDI from India is dominated by financial and business services, including IT-IT enabled
services, even surpassing India’s outward FDI in manufacturing in 2019-20. This is followed by trade and distribution
services. DIPP data shows that during the 2000-14 period, the IT-ITeS segment accounted for the bulk of outward FDI
approvals. In segments such as IT, restaurants and hotels, and construction, Indian firms have increasingly emerged
as exporters of capital. In IT services, overseas investments have taken the form of greenfield ventures, including the
setting up of R&D centres for work on new technologies like blockchain application and artificial intelligence, and
acquisitions of overseas firms in areas like cloud services, and analytics.
Overall, India’s services FDI overseas has been facilitated by the government’s relaxation of guidelines for
investments abroad.28
2.2.2 Services FDI in Japan
As highlighted earlier, Japan does not feature among the leading destination markets for global FDI. Investments in
Japan are towards a mix of manufacturing and non-manufacturing industries, including electric machinery (41.8
percent), finance and insurance (24.9 percent), transport equipment production (15.6 percent), chemicals and
pharmaceuticals (8.5 percent), and real estate (4.7 percent). Thus, unlike in the case of India, services do not29
dominate inward FDI in Japan, accounting for less than 40 percent. Within inward services FDI, finance and insurance
activities dominate followed by several other services such as information and communication, transport,
distribution and construction services, as illustrated in Figure 12.
Figure 16: Composition of Japan’s inward services FDI 2017 (%)
Source: OECD Statistics
Note: This data is based on FDI position
Japan is more important globally as an outward investor. Services constitute the bulk of Japan’s outward FDI, at over
60 percent in 2018. Table 8 provides the composition of Japan’s outward FDI by industry, in 2018. It highlights the
significance of certain services, especially communication services.
Table 15: Japanese outward FDI by industry - 2018 (US$ bns)
Industry Value
Communications 38.96
Finance and insurance 24.94
Chemicals and pharmaceuticals 14.31
29 Based on JETRO statistics, https://www.jetro.go.jp/en/reports/statistics/
28 See, India Brand Equity Foundation (2018)
72
Wholesale and retail 14.04
Transportation equipment 12.73
Electric machinery 8.14
Mining 7.81
General machinery 6.21
Real estate 4.6
Iron, non-ferrous and metals 3.68
Construction 2.46
Transportation 2.1
Glass and ceramics 1.77
Textile 1.77
Rubber and leather 1.58
Precision machinery 1.19
Lumber and pulp 1.07
Petroleum 0.49
Food 0.34
Fishery and marine products 0.05
Farming and forestry 0.02
Services 12.93
Source: https://www.statista.com/statistics/742748/japan-outward-fdi-by-industry/, based on Bank of Japan, JETRO, Ministry of Finance, Japan
(release date December 2019)
Table 9 shows the breakdown of Japan’s outward services FDI for the 2014-18 period. Finance and insurance services
dominate, followed by distribution and information and communication services.
Table 9: Composition of Japan’s outward FDI in services - 2014-18 (%)
Service sector Share (%)
Construction 1.08
Wholesale and retail trade; repair of motor vehicles and motorcycles 29.38
Transportation and storage 2.69
Information and communication 13.64
Financial and insurance activities 41.61
Real estate activities 3.86
Source: OECD
Thus, the trends in FDI suggest that Japan and India strongly complement each other in terms of the direction of
overall FDI flows but also specifically in the services sector. Services constitute the main recipient sector for India’s
inward FDI while they constitute the main destination sector for Japan’s outward FDI. We next examine the bilateral
FDI flows between India and Japan and the role of the service sector.
2.3 Bilateral FDI Trends – India and Japan
The bilateral relationship in FDI between Japan and India has grown over the years. In 2019-20, Japan featured
among the top 5 source countries for India’s FDI inflows (the leading source countries being Singapore, followed by
Mauritius and the Netherlands). For the April 2000 to March 2019 period, Japan ranked as the third most important
source country for FDI inflows to India, with a cumulative FDI inflow of US$ 30 billion over this period.30
FDI from Japan to India is largely concentrated in manufacturing. According to a JBIC report[ Japan Bank for
International Cooperation (JBIC), 2019, Survey Report on Overseas Business Operations by Japanese Manufacturing
30 DIPP, FDI Synopsis for Japan.
73

Companies] on the overseas business operations of Japanese manufacturing companies, India was ranked as the
top-most country for potential mid-term (3 years) and long-term (10 years) business expansion. In four major
industries- automotive, electrical equipment and electronics, chemicals and general machinery, India was ranked as
the destination market with the most potential. Reflecting this potential, there has been a significant rise in the
number of Japanese companies in India over recent years. A survey carried out by JETRO and Embassy of Japan in
India found that the number of Japanese companies registered in India as of October 2018 was 1441 while the total
number of Japanese business establishments was 5102, with a 5 per cent growth over the number in 2017 .31
Although the main sectors in India which have attracted Japanese FDI are the automobile and pharmaceuticals
sectors, in recent years, according to DIPP source, there is a shift towards services. In 2019-20, the service sector,
comprising of Financial, Banking, Insurance, Non-Financial /Business, Outsourcing, R&D, Courier, Tech. Testing and
Analysis, accounted for 15 per cent of FDI inflows from Japan to India. Table 10 highlights the sector-wise distribution
of Japan’s FDI in India.
Table 10: Sector wise distribution of FDI inflows from Japan to India - (Jan 2000 to Dec 2016)
Rank Sector Amount of FDI equity inflows Percentage of FDI equity
inflows from JapanRs. in crores US$ in millions
1 Automobile Industry 26,634.46 4,729.42 18.7
2 Drugs and Pharmaceuticals 22,082.46 4,463.71 17.65
3 Services Sector* 21,301.07 3,746.75 14.81
4 Metallurgical Industries 12,297.24 2,274.44 8.99
5 Telecommunications 12,723.82 1,980.64 7.83
Total of above 95,039.05 17,194.96 67.98
Source: FDI Synopsis Report 2016 DIPP, Ministry of Commerce and Industry, India, http://dipp.nic.in/sites/default/files/Chapter6.1.A.iii 2.pdf
(Accessed on 05/10/2018) Note: *Services Sector includes Financial, Banking, Insurance, Non-Financial/Business, Outsourcing, R&D, Courier, Tech,
Testing and Analysis
Japan’s growing interest in India’s services sector is in line with the pattern of its overall outward FDI flows in which
Finance and Insurance services dominate. For instance, three major Japanese banks (Mizuho, Bank of Tokyo
Mitsubishi UFG and Sumitomo Mitsui Banking Corporation) have their operations in India. Their operations include
lending to Japanese firms operating in India as well as providing yen denominated cross border syndicated loans to
non-Japanese borrowers. There are also Japanese asset management companies (Nomura Securities, Sumitomo
Mitsui, Nikko Securities) which provide securities brokering, underwriting and advisory services and have bought
stakes in Indian financial sector companies. Several Japanese life insurance companies (Nippon, Dai-ichi) have
entered into joint ventures with Indian and foreign companies and are operating in India. Other services where
Japanese presence is growing in the Indian market include healthcare and telecommunications. India’s first 100
percent FDI hospital (Sakra in Bangalore) has majority shareholding by Toyota Tsusho Corporation. Japanese
companies (Spiral Ventures and India Japan Partnership Fund LLP) are also investing in local healthcare start-ups in
India. In the telecommunications sector, NTTDoCoMo had earlier formed a joint venture with TATA though it had to
exit later, and SoftBank is planning an investment of US $10bn by 2022. There is also investment interest in the
hospitality segment, though to a limited extent at present.32
The trends discussed above indicate the growing interest among Japanese firms to invest in India, including in its
services sector. However, it is important to note the asymmetric nature of the India-Japan FDI relationship. Although
Japan is an important source of FDI for India, accounting for 7 percent of its inward FDI in 2018, as a destination
market for Japanese FDI, India only accounted for 2 percent of Japan’s total outward FDI in 2018. It ranked among the
top 20 recipients in 2018 but was far behind the leading recipients of Japanese FDI which were the US, China and
Europe. Similarly, in terms of India’s outward FDI, although Japan was among India’s top 10 outward FDI33
destinations in 2018, with Indian companies investing US $0.4 bn between April-November 2019 in Japan, and the
number of Indian companies in Japan standing at above 100 in 2018, it accounts for a relatively small share of India’s
33 https://unctad.org/sections/dite_dir/docs/wir2019/wir19_fs_jp_en.pdf
32 See, Roy and Chanda (May 2019) for a detailed discussion of Japan’s FDI in India.
31 [ https://www.in.emb-japan.go.jp/PDF/2018_co_list_en_pr.pdf]
74
OFDI. EXIM bank data on India’s outward FDI indicate that the main destinations for India’s outward services FDI are34
the UAE, Singapore and Mauritius and to a more limited extent the US and the UK. Japan does not feature among the
leading recipient markets.35
2.4 Summarizing the key insights
The discussion on bilateral trends in services trade and FDI indicate the many complementarities between the two
countries, in terms of the direction of flows, the sectors, and the modes of interest, notwithstanding the highlighted
data limitations in terms of obtaining services trade statistics. These complementarities arise from their resource
endowments, demography, technology and market needs. The trends also indicate the scope for expanding and
diversifying trade and investment relations as well as non-commercial engagement between the two countries.
Surveys of Japanese companies highlight their growing interest in the Indian market, but the evidence suggests that
this interest has not yet translated into India becoming one of the leading recipients of Japanese FDI. On the other
hand, India’s services exports remain largely concentrated in the Western developed country markets while the
Asia-Pacific region, including Japan, continues to account for only a small part of these exports and growth remains
below potential. This is notwithstanding the recognized potential for exporting to this region and the need to
diversify export markets for India’s IT and other business services. It is thus important to examine this potential by
delving into specific services and also to understand the factors that are constraining the realization of these
prospects.
3. Selected Services & India – Japan Engagement
In this section we provide an overview of four selected services from a country as well as bilateral perspective. These
services include education services, IT-ITeS, technology start-ups with focus on healthcare, and construction and
engineering services. The choice of these sectors is in part motivated by the preceding overview of the pattern of36
trade and investment flows for the two countries in that these services feature importantly in either their current
international or bilateral flows. The choice of sectors is also motivated by discussions with experts which highlighted
areas where currently bilateral engagement may be limited but there are prospects for increasing collaboration and
commercial relations. The discussion also outlines bilateral initiatives already undertaken between India and Japan.
The objective is to provide the context so as to better understand the opportunities and challenges for expanding
India’s relations with Japan in the selected services and also in related areas. It is important to note at the outset that
much of the background information on these different services for the two countries as well as information on their
bilateral relations in these services is sourced from a mix of industry reports, newspaper articles, working papers,
summary documents provided by consulting firms, JETRO and JBIC surveys, and other documents, as there is a
dearth of rigorous academic literature on the same.
3.1 Education Services
This is a sector which currently does not feature in the trade and investment statistics as a major area for
engagement. However, a review of existing initiatives and discussions with private sector and government sources
suggest that this sector holds a lot of promise.
3.1.1 India
India’s education sector was estimated at US $91.7 bn in 2018-19 and was projected to grow to US $101.1 bn by
2019-20[ https://www.ibef.org/industry/education-sector-india.aspx]. The higher education segment has
experienced high growth in recent years. In 2017-2018, nearly 36.64 million students were enrolled in higher
education in India (although these enrolment rates are not at par with those of its peers such as China (43 per cent)
and Brazil (51 per cent)). With the world’s largest population in the age bracket of 5 to 24 years and with the
population in the tertiary age group of 18-22 expected to rise to 126 mn by 2026 , India is obviously an attractive37
destination for trade and investment in education services.
Between 2000 and 2019, cumulative FDI in India’s education services sector was estimated at US$ 2.47 bn[ Report on
Education and Training Industry in India, IBEF, 2020 https://www.ibef.org/industry/education-sector-india.aspx].
Although FDI presence in this sector is relatively low at present, mainly due to regulatory issues, FDI in this sector is
37 https://www.dfat.gov.au/geo/india/ies/chapter-3.html
36 The initial plan was to cover 5 services, the 5th being Finance and insurance services. However, due to the very limited nature of the response byfinancial services firms which were approached during the survey, this sector has been excluded from the scope of this study.
35 See, Chaudhry et. al (2018); Export-Import Bank of India (2014); DIPP (2018); RBI Handbook of Statistics.
34 DIPP, FDI Fact Sheet
75

expected to grow due to factors such as India’s changing demography, mismatch in demand for and supply of
education, the entry of private players, rising demand for a skilled labour force, and growth in online education
platforms with Central and State government initiatives such as e-learning and mobile-learning. India ranks as the
second largest market for e-learning, next only to the US[ Report on Education and Training Industry in India, IBEF,
2018].
3.1.2 Japan
The outlook for Japan’s higher education sector stands in stark contrast to that of India. With its ageing population,
there has been a significant decline in the number of students in the 18-24 age bracket, forcing the universities to run
at less than full capacity. In order to bridge this gap, since 2008, the Ministry of Education, Culture, Sports, Science
and Technology (MEXT) in Japan has been focusing on the globalization of Japan’s higher education sector. One of the
targets is to attract 300,000 foreign students by 2020 . Other strategies to internationalize the Japanese education38
sector include providing financial assistance, a support system in the university campuses (through both online and
offline modes), and job opportunities to foreign students. In a similar vein, MEXT has come up with a ‘Top Global
Universities’ project to fund some Japanese universities to internationalize their academic systems. The approaches
include introduction of programs conducted in English, establishing overseas offices to attract foreign students,
among other initiatives. MEXT had also targeted to send 120,000 higher education students and 60, 000 high school
students abroad for exposure by 2020 . As per JASSO (Japan Students Service Organization), in 2017, the number39 40
of international students in the higher education sector was 188, 364. However, 50 per cent of these students were
Chinese. The country’s low economic growth and linguistic barriers have posed challenges to attracting foreign
students from a wider range of countries.
Another area of internationalization is language training. Japan offers a large market for English Language Training
(ELT) as English has come to be viewed as a much-needed skill in higher education and for employment
opportunities. Due to currency depreciation and low economic growth, Japanese students have been approaching
countries which can offer cost-effective short-term ELT courses, rather than going to the US or the UK. Likewise,
Japan has opportunities for exporting Japanese language training to other countries or tying up with universities for
provision of such language courses given the growing demand for learning foreign languages around the world.
3.1.3 Bilateral Prospects
Given the context on both sides, there are several areas and modes for engagement between India and Japan in
education services. These include possibilities for student exchange between the two countries, Indian students
pursuing higher education in Japan, FDI from Japan in Indian higher educational institutions and start-ups (edu-tech
firms), ELT provision by Indian teachers and institutions, internships for Indian students with Japanese companies in
India and in Japan, and scientific research and other collaborations between Indian and Japanese educational
institutions.
Several of these opportunities, especially those of a collaborative nature, are reflected in ongoing initiatives between
the two countries. One such initiative is the Project for “Future Researchers at the Indian Institute of Technology,
Hyderabad to Enhance Network Development with Scholarship of Japan” (FRIENDHIP) Programme which
commenced in 2012 for a period of 8 years and has now been extended to 2024. This programme is funded by Japan
International Cooperation Agency (JICA) and aims to bolster collaboration between IIT Hyderabad (IITH), 11 leading
Japanese universities such as Kyoto University, University of Tokyo among others and Japanese companies, by
providing scholarships, academic exchange (students as well as faculty) and industrial exposure. This programme also
promotes faculty exchange between the partner institutes by facilitating and promoting special lectures, short-term
research visits, workshops and symposiums for IITH faculty and Japanese researchers. This programme also provides
opportunities for IITH students to intern at Japanese companies located in India as well as recruitment-based
interactions. Industrial collaboration with IITH and these companies is also supported through R&D collaboration,
joint workshops and special lectures by industry experts. Further, JICA funds the Collaboration Kick Starter Program
(CKP) in order to promote industry and academic collaboration between IITH and Japanese academia and industry.
This program promotes the students’ interactions with Japanese academia and industry. The JICA-FRIENDSHIP
Programme has helped to send around 74 students from IITH for higher studies to Japanese universities. The
40 https://www.jasso.go.jp/en/about/statistics/intl_student/data2017.html
39 https://www.mext.go.jp/en/policy/education/lawandplan/title01/detail01/sdetail01/1373805.htm
38 See https://www.japantimes.co.jp/news/2018/10/22/national/government-aims-300000-international-students/#.XqspJ2gzbIU
76
program has also held academic fairs to promote higher education in Japan by encouraging interactions between
prospective and current students in Japanese universities .41
Another initiative reflects the scope for bilateral engagement in language training. In 2017, a Memorandum of
Cooperation was signed between the two countries in order to promote the expansion of Japanese language training
in India to enable cooperation in a variety of sectors. This Memorandum aims to establish a Japanese Language
Teacher’s Training Center in India to train 1000 Japanese language teachers as well as providing Japanese language
certificate courses in 100 higher education institutes in India by 2022. This Training Centre was established at the
Jawaharlal Nehru University (JNU), New Delhi in July 2018 and completed its first 3-month long programme in
October 2018. More generally, the two countries have agreed to work together to promote Japanese language42
studies in India, with a target of 30,000 learners at different levels over the next 5 years. The measures include
introducing Japanese as an optional foreign language in the secondary school curriculum, establishing Centres of
Japanese Studies at Indian universities and institutions where Japanese is being taught, and Japanese language
teaching cells in 7 Indian Institutes of Technology.
There is also the India-Japan Education Programme (IJEP), which is a collaboration between academia, industry and
Government agencies in India and Japan in five sub programmes, namely railways, infrastructure, innovation,
technology management and information science. This programme aims to foster extensive collaboration between
Indian schools - the IITs and IIM Bangalore and Faculty of Engineering at the University of Tokyo, to train future global
professionals as well as to internationalize higher education, without compromising on quality. This program provides
opportunities for scholarships, remote lectures, short-term programmes, summer internships, collaborative research
as well as joint teaching for students and faculty from the two countries.
Recently, Maruti Suzuki India, IIT Guwahati, Association for Overseas Technical Cooperation and Sustainable
Partnerships (AOTS), Japan and Suzuki Motor Corporation have entered into a collaboration to promote training in
technical education between the two countries. The collaboration will involve an automobile engineering course
where technical training will be provided through Maruti Suzuki India and Suzuki Motor Corporation, Japan. Further,
a Japanese language course will be conducted by AOTS for the students of IITG. The collaboration also provides
students with an opportunity for internships at Maruti Suzuki.43
The Japan-India engagement in education is also growing in other areas such as Industry 4.0 technologies, online
education, and skilling and vocational training. For instance, Japan is trying to enter into partnerships with Indian
educational institutions in emerging areas such as AI, machine learning, and block chains. Very few Indian universities
and engineering institutes have such courses at present or the requisite research infrastructure and faculty and this is
an untapped area. Japan is looking to enter the online education market in India, especially in language training.
Another important partnership initiative is in the area of vocational education and skilling. In 2017, the Technical
Intern Training Program (TITP) for Japan was launched as per a Memorandum of Cooperation signed between the
Indian Ministry of Skill Development and Entrepreneurship (MSDE) and the Japanese Ministries of Justice, Foreign
Affairs, Health, Labour and Welfare. The National Skills Development Corporation (NSDC) has been designated as44
the Monitoring agency to oversee the execution of TITP in India. Under this initiative, NSDC identifies institutes which
train people and makes them ready to work in Japan. The process involves IQ tests and training in language skills, an
interview, followed by placement in factories or as care workers/nurses and other skilled/semi-skilled jobs. Thus far,
an awareness workshop has been conducted by JITCO and the Japanese Embassy, several interns have been trained
by CII in consortium with Nihon Technology and placed in Japan. Several interns have been trained by Navis Nihongo
as care workers and sent to Japan. The uptake thus far has been poor with only a total of 24 sending organizations
being empanelled and 44 interns placed in Japan since 2017. One of the main reasons is cost (around Rs. 250,000)45
which is borne by the person. Loans are also not available. In contrast, in countries like China which have placed
thousands of workers in Japan under such skilling partnership programs, the government has borne the training cost.46
46 http://www.msde.gov.in/reports-documents/Skill-Engagements/International-Collaborations
45 See, http://www.msde.gov.in/reports-documents/Skill-Engagements/International-Collaborations ,https://nsdcindia.org/sites/all/themes/ibees/images/titp/TITP-RFP-Phase-III-29-11-19.pdf
44 TITP first commenced in 1993 in Japan. It aims to promote international cooperation by transferring professional skills to young and middle-agedyouths of developing countries.
43 https://www.marutisuzuki.com/corporate/media/press-releases/2020/iit-guwahati-aots-japan-suzuki-motor-corporation-and-maruti-suzuki-india-limited-sign-memorandum)
42 See https://pib.gov.in/newsite/PrintRelease.aspx?relid=184461
41 See http://friendship.iith.ac.in/
77

There are several other collaborations which have been initiated between the two countries. These span education
services, as well as other areas such as IT, engineering and R&D services, some of the other sectors under focus in
this study.
Box 1: Existing Bilateral Education and R&D Initiatives between India and Japan
● MoC between the National Institute of Polar Research (NIPR) of Japan and the National Centre for Polar and Ocean Research of
India on Polar Research (NCPOR) (October 2018).
● Agreement for Cooperation between Institute of Innovative Research, Tokyo Institute of Technology, Japan and Council of
Scientific & Industrial Research (CSIR), India was signed (October 2018)
● A Memorandum of Understanding on Further Cooperation toward Indo-Japan Global Startup between Nagasaki University and
IIITDM was signed in October 2018.
● MoU between Council of Scientific & Industrial Research (CSIR), India and Hiroshima University for research partnerships was
signed in October 2018.
● MoU between CSIR, India and Research Centre for Advanced Science and Technology (RCAST), University of Tokyo for R&D
cooperation in areas such as Mechatronics including Robotics, Surface Engineering, Energy Storage (especially solar to chemical),
and Optoelectronics was signed in October 2018.
● Hokkaido University signed four Academic Exchange Agreements and Memorandums of Understanding on Student Exchange
respectively with Indian Institute of Technology Bombay (January 2018), Indian Institute of Technology Madras (March 2018),
Indian Institute of Technology Hyderabad (April 2018), and Indian Institute of Technology Kanpur (October 2018).
● Memorandum of Understanding Between Shizuoka University, Japan and National Institute of Pharmaceutical Education and
Research (NIPER), S. A. S. Nagar was signed in October 2018.
● Nagasaki University signed three Letters of Intent (LoIs) with All India Institute of Medical Sciences (AIIMS), Indian Institute of
Science (IISc), and Indian Institute of Technology Delhi (IIT Delhi) respectively for education and academic research cooperation in
July 2018.
● Department of Mechanical Engineering, Department of Nuclear System Safety Engineering, Nagaoka University of Technology
signed two Agreements of Academic and Research Collaboration respectively with Department of Mechanical Engineering, Indian
Institute of Technology, Tirupati (January 2018) and School of Engineering Discipline of Metallurgy Engineering and Material
Science, Indian Institute of Technology Indore (July 2018)
● Memorandum of Agreement on Academic and Educational Exchange between Indian Institute of Technology Delhi, India and
Hiroshima University Japan (May 2018).
● Memorandum of Agreement for Student Exchange between Indian Institute of Management Ahmedabad (IIMA) and Hiroshima
University, Japan (April 2018).
● Memorandum on Student Exchange between Hiroshima University, Japan and CSIR-Central Mechanical Engineering Research
Institute (CSIR-CMERI) (January 2018).
● Memorandum to Academic and Educational Exchange Agreement between Hiroshima University, Japan and Indian Institute of
Engineering Science and Technology, Shibpur, India (January 2018).
● Agreement on Academic and Educational Exchange and Memorandum to Academic and Educational Exchange Agreement
between Hiroshima University, Japan and Indian Institute of Technology Bombay, India (IIT BOMBAY)(January 2018)
● Agreement on Academic and Educational Exchange and Memorandum to Academic and Educational Exchange Agreement
between Hiroshima University, Japan and Birla Institute of Technology and Science, Pilani, India (BITS-P) (December 2017).
● Annexure to Memorandum of Understanding between the Council of Scientific and Industrial Research through the CSIR-Central
Electronics Engineering Research Institute (CSIR-CEERI), Pilani, India and Hiroshima University, Japan Concerning International
Collaboration on Research, Academic and Educational Exchange (December 2017).
● A Memorandum for an Internship Program between OMRON Corporation, the Graduate School of Information Science and
Engineering of Ritsumeikan University, and the Indian Institute of Technology Hyderabad was signed in November 2017.
● India-Japan Joint Laboratories in the area of ICT ("Internet of Things, Artificial Intelligence and Big Data Analytics”) "Architecting
Intelligent Dependable Cyber Physical System Targeting IoT and Mobile Big Data Analysis" between The University of Tokyo and IIT
Bombay; "Data Science-based Farming Support System for Sustainable Crop Production under Climatic Change" between The
University of Tokyo and IIT Hyderabad; and "Security in the Internet of Things Space" between Kyushu University and IIT Delhi.
● Initiation of DST-JSPS Fellowship Programme for young researchers
Source: Ministry of External Affairs
As is evident from the long list of collaborations there is a lot of interest between the two countries to undertake
joint research and exchange faculty and students in the fields of science and technology. Interestingly, there is not
much evidence of engagement in areas outside science and engineering in areas such as history, language, religious,
cultural and heritage studies where there is likely to be commonality of interest. At present, engagement through
movement of students and teachers between the two countries is relatively limited. There is, however, growing
presence of Japanese language institutes as well as kumon franchises and centres in India.
3.2 IT – Enabled Services Sector
78
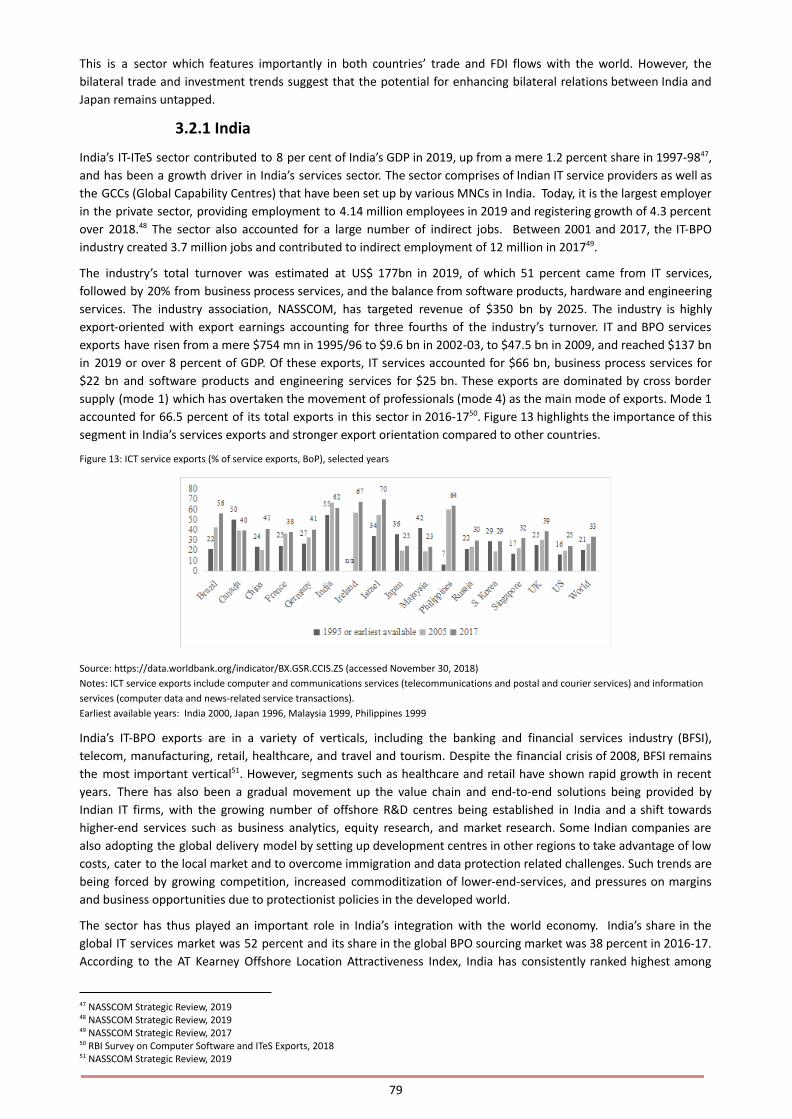
This is a sector which features importantly in both countries’ trade and FDI flows with the world. However, the
bilateral trade and investment trends suggest that the potential for enhancing bilateral relations between India and
Japan remains untapped.
3.2.1 India
India’s IT-ITeS sector contributed to 8 per cent of India’s GDP in 2019, up from a mere 1.2 percent share in 1997-98 ,47
and has been a growth driver in India’s services sector. The sector comprises of Indian IT service providers as well as
the GCCs (Global Capability Centres) that have been set up by various MNCs in India. Today, it is the largest employer
in the private sector, providing employment to 4.14 million employees in 2019 and registering growth of 4.3 percent
over 2018. The sector also accounted for a large number of indirect jobs. Between 2001 and 2017, the IT-BPO48
industry created 3.7 million jobs and contributed to indirect employment of 12 million in 2017 .49
The industry’s total turnover was estimated at US$ 177bn in 2019, of which 51 percent came from IT services,
followed by 20% from business process services, and the balance from software products, hardware and engineering
services. The industry association, NASSCOM, has targeted revenue of $350 bn by 2025. The industry is highly
export-oriented with export earnings accounting for three fourths of the industry’s turnover. IT and BPO services
exports have risen from a mere $754 mn in 1995/96 to $9.6 bn in 2002-03, to $47.5 bn in 2009, and reached $137 bn
in 2019 or over 8 percent of GDP. Of these exports, IT services accounted for $66 bn, business process services for
$22 bn and software products and engineering services for $25 bn. These exports are dominated by cross border
supply (mode 1) which has overtaken the movement of professionals (mode 4) as the main mode of exports. Mode 1
accounted for 66.5 percent of its total exports in this sector in 2016-17 . Figure 13 highlights the importance of this50
segment in India’s services exports and stronger export orientation compared to other countries.
Figure 13: ICT service exports (% of service exports, BoP), selected years
Source: https://data.worldbank.org/indicator/BX.GSR.CCIS.ZS (accessed November 30, 2018)
Notes: ICT service exports include computer and communications services (telecommunications and postal and courier services) and information
services (computer data and news-related service transactions).
Earliest available years: India 2000, Japan 1996, Malaysia 1999, Philippines 1999
India’s IT-BPO exports are in a variety of verticals, including the banking and financial services industry (BFSI),
telecom, manufacturing, retail, healthcare, and travel and tourism. Despite the financial crisis of 2008, BFSI remains
the most important vertical . However, segments such as healthcare and retail have shown rapid growth in recent51
years. There has also been a gradual movement up the value chain and end-to-end solutions being provided by
Indian IT firms, with the growing number of offshore R&D centres being established in India and a shift towards
higher-end services such as business analytics, equity research, and market research. Some Indian companies are
also adopting the global delivery model by setting up development centres in other regions to take advantage of low
costs, cater to the local market and to overcome immigration and data protection related challenges. Such trends are
being forced by growing competition, increased commoditization of lower-end-services, and pressures on margins
and business opportunities due to protectionist policies in the developed world.
The sector has thus played an important role in India’s integration with the world economy. India’s share in the
global IT services market was 52 percent and its share in the global BPO sourcing market was 38 percent in 2016-17.
According to the AT Kearney Offshore Location Attractiveness Index, India has consistently ranked highest among
51 NASSCOM Strategic Review, 2019
50 RBI Survey on Computer Software and ITeS Exports, 2018
49 NASSCOM Strategic Review, 2017
48 NASSCOM Strategic Review, 2019
47 NASSCOM Strategic Review, 2019
79

offshoring destinations, due to the combination of its skill availability, favourable business environment, and low cost.
The 2019 Index places India as the leading offshoring destination, ahead of China, which is placed second, though the
gap is narrowing. Today, India accounts for 55 percent of the offshore IT-BPO market (A.T. Kearney, 2017). Twenty four
percent of the 271 new global delivery centres that were set up worldwide by US based firms in 2017 were in India .52
In 2018, India hosted almost 1140 global in-house captive centres and accounted for 75% of global digital talent.
Indian firms have presence in over 80 different countries (A.T. Kearney, 2019). The sector accounts for the highest
share of FDI inflows in the form of mergers, acquisitions, GCCs, JVs and alliances. India is expected to remain an
important part of the global outsourcing market in future, notwithstanding emerging competition from other
developing countries and regions and challenges posed by automation.
Recent policies have enabled the growth of the domestic IT-ITeS sector. In 2018, domestic turnover of this sector
stood at US$ 41 bn, registering a year-on-year growth of 7.9 per cent. This growth has been attributed to multiple
schemes by the government such as Digital India, Start Up India, JAM (Jan Dhan-Aadhar-Mobil) etc. which are
incentivizing and facilitating the use of technology. Further, the adoption of digital technologies by Indian firms in
order to remain competitive is also facilitating the growth of India’s IT services sector. In addition to these domestic
initiatives, the liberal trade and investment framework in the IT-ITeS sector has contributed to the growth of this
sector.
3.2.2 Japan
The share of IT-ITeS services in the Japanese economy was around 8.2 per cent in 1995 and has remained more or
less constant as this sector contributed 9 per cent to the Japanese GDP in 2017. Japan has the third largest IT services
market in the world valued at USD 192 billion . The IT industry in Japan resembles a pyramid structure where five53
companies (Fujitsu, Hitachi, NTT, NEC and IBM) in the highest tier fall in the range of more than USD 5 billion as
revenue. The highest tier has only one non-local firm[ Gartner] .These firms combinedly account for nearly 45 per
cent of the market share in Japan. Further, only two non-Japanese companies feature in the top 20 IT service
companies in Japan, by revenue. The second tier IT firms consists of firms having revenue in the range of more that
USD 1 billion and there are a couple of dozen local and non-local companies in this cohort. The bottom tier firms
have revenues less than USD 1 billion and are primarily engaged in low value-added work. One of the services that is
much in demand in the Japanese IT market is embedded software. With rapid advances in technology and the
amalgamation of software and hardware through AI, IoT etc., this segment has become even more significant.
Various manufactured products such as electronics, automobiles etc. utilize this software. Japan’s IT services exports
rose from USD 1.3 billion in 2005 to USD 3.5 billion in 2015 .54
3.2.3 Bilateral Prospects
At present, the bilateral engagement between India and Japan in the IT-BPO sector is limited. India’s main destination
markets are concentrated in the US and Canada accounting for 60.3 per cent of the total exports, followed by Europe
which comprised of 20 per cent. Although Asia's share doubled to 10.4 per cent in 2016-17 from 2008-09, it is still
low[ RBI Survey on Computer Software and ITeS Exports, 2018]. Factors such as cultural and linguistic barriers and
organizational issues have been highlighted as the main constraints to expanding relations in this sector.
There are, however, a growing number of partnership initiatives between the two countries which suggest the
mutual interest and scope to increase engagement in this sector. One such arrangement is the India-Japan Digital
Partnership which aims to explore the complementarities between the two countries in the current digital era by
syncing together Japan’s “Society 5.0” and initiatives such as Digital India, Start-up India and Smart cities in India. It
targets cooperation in new ICT initiatives as well as digital technologies. Under this arrangement, internship
programs, training courses and job fairs have been introduced to reap mutual benefits from India’s talented
workforce in the IT sector. In 2018, the Ministry of Electronics and Information Technology, India (MeitY) and Ministry
of Economy, Trade and Industry (METI), Japan came together to sign Joint Minutes for Cooperation between the two
nations in the ICT sector. NASSCOM and the government of Hiroshima Prefecture, Japan have signed a MoU to
co-invest in an India- Japan IT Corridor in Hiroshima to leverage the synergies between the two countries. They aim
to incentivize Indian tech companies to come to Japan and to enter into partnerships with Japanese firms, leading to
co-creation of innovative products and solutions leveraging the expertise of Indian software firms and Japanese
manufacturing firms.
54 OECD TiVA
53 See https://atradius.ca/reports/market-monitor-ict-japan-2019.html
52 NASSCOM Strategic Review, 2018
80

At the industry level, there are several examples of partnerships between Indian and Japanese companies. All of
these partnerships aim to leverage and combine the expertise of Indian IT companies with the competencies and
local knowledge of Japanese companies. For example, TCS Japan and IT Frontier Corporation, Mitsubishi’s 100
percent IT subsidiary entered into a tie-up in 2014. The partnership has gone from a 51:49 to 66:34 in 2019. The aim
was to complement ITF’s long-standing relationships with Japanese companies, talented workforce and
competencies in various industries like retail, trading and distribution with TCS’ domain knowledge and technology
expertise, thus increasing TCS’ presence and growth in the Japanese market and also providing global capabilities to
Japanese companies. TCS also has a Japan dedicated centre in Pune and receives interns from Japan. This facility
caters to the specific business needs of Japanese companies with enhanced language support services. TCA Japan
Hikari Academy has been established as a part of the centre with dedicated faculty to provide extensive language
training, cultural seminars for staff, and a customized curriculum for Japanese language studies, in collaboration with
universities in the Pune area.55
Another noteworthy partnership is that of Infosys, which entered into a joint venture in 2018 with Hitachi, Panasonic
Corporation and Pasona Inc. to form a new venture called HIPUS Co. Ltd. ] The new entity will provide Japanese56
companies with business process transformation using digital procurement platforms. Infosys’s global expertise in
consulting, analytics, digital technologies such as AI and Robotic Process Automation, and procurement processes
would be combined with Hitachi and Panasonic’s local expertise and knowledge of procurement processes and
Pasona’s talent and BPM networks in Japan.
Similarly, Tech Mahindra has entered into a collaboration with Mitsui Knowledge Industry (a wholly owned subsidiary
of Mitsui & Co.) in Japan and in other locations. The aim is to develop next generation digital enterprise solutions in57
the Japanese market. For this purpose, they plan to train a 600-member engineering pool in the two countries to
address the skill shortage in SAP. Both sides will leverage their competencies, technologies and best practices and will
set up dedicated infrastructure to enable Japanese companies to migrate to next generation enterprise solutions
such as AI, Blockchain, Cybersecurity, 5G, and Internet of Things. 58
The Japanese government has also taken steps to ease the movement of Indian professionals. In order to attract
talent, Japan has introduced a “green card” system that provides highly skilled Indians such as IT professionals to
obtain permanent resident status in Japan within 24-48 months of their residence in Japan. It has also reduced the
number of documents needed by Indian professionals to obtain a visa. Another important step is the Totalisation or
Social Security Agreement between India and Japan, which was implemented in October 2016. Under this
agreement, Indian workers on short-term projects in Japan are exempted from making social security contributions
for up to 5 years, thus avoiding double contributions. The agreement also allows professionals to seek social security
benefits against contributions made in the other country in case they relocate. This also aggregates the periods of
contribution made by the professionals in the two countries to be eligible for retirement benefits. An earlier
arrangement was made between the Information Technology Promoting Agency (IPA), Japan and National Institute of
Electronics and Information Technology (NIELIT) under MEITY, GOI in 2012 to implement mutual acceptance and
equivalence of the IT Engineers’ examinations and course of both the bodies. The objective was to facilitate the
mobility of skilled IT personnel across the two countries through mutual recognition of qualifications and training.59
3.3 Technology Start – Ups in Services
Both India and Japan have a strong technology start-up ecosystem. The Indian technology start-up sector is the 3rd
largest in the world , with significant growth over the past decade. Japan, which has been a leader of disruptive and60
innovative technologies, has had a relatively limited start-up community for a variety of reasons. However, the sector
is growing in recent years and VC funding in tech start-ups is on the rise, particularly in the areas of financial
technology, health technology and Artificial Intelligence. The synergies between the two are strong in this segment as
evident from the following discussion.
60 Indian Tech-Start Up Ecosystem, 2019 Edition, NASSCOM
59 http://nielit.gov.in/sites/default/files/INT_MoU_Japan.pdf
58 See, https://www.techmahindra.com/en-in/tech_mahindra_and_mki_collaborate_to_develop_next_gen_digital_enterprise_solutions_for_japanese_market/ and https://www.business-standard.com/article/pti-stories/tech-mahindra-partners-mitsui-knowlegde-to-develop-digital-solutions-for-japanese-market-119052801326_1.html
57 See, https://www.mki.co.jp/english/
56 See, https://www.newindianexpress.com/business/2019/apr/02/infosys-forms-joint-venture-with-hitachi-pasona-and-panasonic-1958981, https://www.hipus.com
55 See, https://www.thehindu.com/business/Industry/tcs-mitsubishi-sign-agreement-to-merge-it-units/article5933211.ece;https://www.tcs.com/tcs-inaugurates-japan-centric-delivery-center,https://www.infosys.com/newsroom/press-releases/2019/completes-jv-digital-procurement-platforms.html;
81
3.3.1 India
In 2019, India added around 1300 start-ups to its economy, ranking third after the US and China. According to
NASSCOM, the number of active start-ups in India are around 39,000 and the total number of unicorns is 24. As of
2019, India was home to nearly 8,900-9,300 tech-based start-ups, of which 50 per were concentrated in the
e-commerce and B2B segments. Of the tech-based start-ups in India, nearly 1600 are working in the domain of
deep-tech, with a CAGR of 40 percent over the 2014-19 period in the number of such start-ups in India.[ Indian
Tech-Start Up Ecosystem, 2019 Edition, NASSCOM]
Tech start-ups have been attracting a growing amount of funding in recent years. The cumulative amount of funding
in tech start-ups was an estimated US $51bn between 2008-2018. In 2019 alone, tech-based start-ups in India raised
a funding of nearly USD 14.5 bn, registering a 55 percent growth over 2018 . Initiatives such as the Prime Minister’s61
flagship program ‘Start-Up India’ launched in 2016 and Digital India, launched in 2015 have contributed to this
growth. The Start-up India initiative aimed at bolstering the start-up ecosystem in India through financial assistance,
tax exemptions, industry-academia partnership and incubation (housed by universities and educational institutions).
The Digital India initiative focused on improving internet penetration and digital infrastructure in rural areas and on
providing government services online, thus further widening the business opportunities available to Indian start-ups.
3.3.2 Japan
Japan was the 6th largest market for VC investments in technology-based start-ups in 2017. However, unlike other
countries, it is the rich corporations such as Toyota and Sony which are the main players in Japan’s start-up space
compared to the VCs. These corporations in turn invest in the VC funds to look for start-ups in upcoming domains.
Post the adoption of Shinzo Abe’s growth policies in 2013, there has been an increase in VC investment in Japan,
rising from US$ 0.8 bn in 2013 to US$ 2.5 bn in 2017 . Compared to the number of unicorns in the U.S., which is62
nearly 200 , and several dozen in India and the UK, the number is quite small in Japan. But investment in deep-tech63
start-ups such as autonomous driving, robotics etc. is one the rise. Japanese universities have been playing a key role
as incubation centres for advanced technologies and many of the deep-tech start-ups originate in the universities,
and typically collaborate with the large Japanese corporations Such collaboration is mutually beneficial as the
corporations are able to leverage innovations beyond their mainstream businesses while the start-ups are able to
leverage the knowledge and expertise of the corporations for commercializing their products and services. Another
important development is the introduction of start-up visas for specific regions to promote the creation of high
technology zones. These include municipalities such as Hokkaido, Osaka City, and several Prefectures (Kyoto, Gifu,
Ibaraki, Aichi, Mie, Oita, Fukuoka, and Kobe City).64
3.3.3 Bilateral Prospects
The opportunities for Japan and India to engage in the technology start-up space is reflected in several initiatives and
trends. Prime among these is the setting up of a Japan India Start-up Hub in 2018. This is an online platform that was
conceptualized and established in Bangalore to bring the two countries’ start-up ecosystems (start-ups, investors,
innovators and entrepreneurs) closer together, leverage their potential, and to promote joint innovation for mutual
benefit. It is a joint effort of the Ministry of Commerce and Industry, GoI and the Ministry of Economy, Trade and
Industry (METI) of Japan. The Start-up Hub facilitates market entry and information exchange by supporting
collaborations between startups and investors from the two countries and by connecting Indian start-ups suited for
the Japanese market with potential Japanese investors for a mutually beneficial collaboration. JETRO and NASSCOM
have been facilitating the interface between Indian start-ups and Japanese investors. Start-up pitch sessions were
organized in Bangalore and Japan in 2019, where Indian start-ups presented their ideas to the Japanese VCs for
funding.
According to a report, 50 active Japanese start-up investors in India have funded nearly 105 Indian start-ups across
more than 136 deals and Japanese VC investment of US $10bn has been made in Indian start-ups. In 2019, Japan
64 See, https://www.meti.go.jp/english/policy/economy/startup_nbp/startup_visa.html#:~:text=What%20is%20the%20%E2%80%9CStartup%20Visa,category%20of%20%E2%80%9Cbusiness%20manager%E2%80%9D.&text=When%20you%20take%20advantage%20of,before%20the%20requirements%20are%20met
63 [ Hurun Global Unicorn List, 2019]
62 https://tech.eu/features/24647/the-rise-of-deep-tech-startups-in-japan-and-why-european-companies-should-take-note/
61 Tracxn Report, 2019
82

based Softbank made large sized investments in Indian tech-based start-ups such as PayTM, Ola Electric etc . There65
is much interest among Japanese investors in India’s unicorns, a segment where India ranks third in the world .66
Another collaborative initiative between the Confederation of Indian Industries (CII) and the Advanced
Telecommunications Research Institute International (ATR) (funded by the Japanese Ministry of Education, Culture,
Sports, Science and Technology) is a program to improve the start-up ecosystem in India. ATR and SeekersBase Japan
along with NASSCOM, plan to raise USD 100 million to invest in 20 promising nascent-stage start-ups in India. One of
the success stories includes Niramai Health Analytix, a health tech start-up that was established in 2016 in India. This
start-up has developed software for screening breast cancer using machine intelligence, that is radiation free and
non-invasive. It has secured US$ 6 mn in funding from Japanese VC firms Dream Incubator and Beenext, to aid its
expansion in the Japanese market .67
In 2019, India and Japan decided to launch a US$ 187 mn fund of funds called The Indo-Japan Emerging Technology &
Innovation Fund . This fund aims to strengthen Indo-Japan partnership in the digital space through investments in68
Indian technology start-ups in the domains of fintech, healthcare, AI, IoT, education, and automation, among others.
This fund aims to work on technologies which leverage each other’s advantages, namely bringing together India’s
expertise in software with Japan’s expertise in hardware in emerging technologies like AI and IoT, thus benefiting
both nations.
Box 2: Sagri Co. Ltd.- Startup in Microfinance for farmers69
Sagri Co., Ltd. is the first Japanese start-up to enter the Indian market with the support of the Japan India Startup Hub.
It set up its subsidiary, Sagri Bengaluru Pvt. Ltd. in Bengaluru in September 2019. The company provides technological
solutions to Japanese farmers. Till date, the company has helped around 200 Indian farmers access microfinance
through its innovative model.
Interview excerpts
a)Services offered by the company to Indian farmers
The company has so far raised more than Rs. 2 crores from Japan for its India operation. It helps Indian farmers by
improving their access to microfinance. It lends directly from its books. In future, it plans to partner with other financial
institutions to lend through its online platform for reaching out to as many farmers as possible. It will lend through its
"SAgri Finance Platform" and is also open to others to use the platform to lend to farmers.
Sagri, the parent organization of Sagri Bengaluru Pvt Ltd, also provides pre-harvest and post-harvest technology
solutions to farmers in Japan. Currently, it is checking whether these solutions will work in Indian agriculture conditions
as the agro-climatic pattern in India is completely different from that in Japan.
b) How it helps farmers access microfinance
So far, Sagri Bengaluru Pvt Ltd has disbursed loans to 200 farmers across Jaipur, Manipur and Karnataka. In order to
reach these farmers, it has tied up with agri-value chain companies such as Freshokartz in Jaipur, Freshiesfresh in
Manipur and EasyKrishi in Bengaluru to enhance micro credit delivery to farmers. These companies connect farmers and
consumers (including enterprises like food processing companies) as they have collection centres, expertise in the
agricultural supply chain and a ground level understanding of the farmers. Sagri has also tied up with farmer producer
organization NAFPO in Delhi to reach out to farmers. Farmers repay its loans through these partner organizations.
The company is trying to solve two main problems faced by farmers-credit creation and repayment of loans. To deal with
these problems, it is trying to leverage the working methodologies of microfinance and its Farmer Credit Scoring
techniques powered by technologies such as satellite imagery, soil sampling and testing, along with additional data on
weather, climate, etc. and the credit history of the farmers and their families.
c)Future business growth plans in India
The company plans to expand beyond the three states of Karnataka, Manipur, Rajasthan where it is currently based to
launch operations all over India. It is looking for partners that are working closely with farmers at the ground level, with
other startups and farmer groups.
69 See, https://sagri.co/sagri-finance/
68 https://www.indembassy-tokyo.gov.in/pdf/Newsletter_June_2019_Issue_6_English_July08.pdf
67 https://yourstory.com/2019/02/ai-healthcare-startup-niramai-funding
66 Hurun Global Unicorn List, 2019
65 Japanese Investors in India Report 2019, Datalabs by Inc42
83
Source: MVRDC, World Trade Centre Mumbai Newsletter, May 5, 2020
Note: Extracted from an interview given by the Chief Strategy Officer, Sagri Bengaluru Pvt. Ltd. to MVRDC, World Trade Centre, Mumbai
3.4 Engineering Services
The global market for engineering services in 2019 was valued at US$ 316 billion. It is expected to grow at a CAGR of
29 per cent from 2020-2027[ Global Engineering Services Outsourcing Market Size Report 2020, Grand View
Research]. The Asia-Pacific region features importantly in this market as several countries in this region are hubs for
automotive, electronic, and construction engineering and technologies. This is a sector where India and Japan have
complementary strengths and potential for engagement through trade, investment, and R&D collaborations.
The engineering services sector is growing rapidly in India. The two main segments in the Indian market are
automotive, hi-tech services such as telecom, consumer electronics and industrial controls, with aerospace and
defence also becoming more important in recent years. India’s presence in this sector is based on an outsourcing
delivery model, mainly catering to developed markets in the West. India is yet to tap the newer geographies in the
Asia Pacific, including Japan.
India’s strengths in this sector are cost, capacity and capability due to its large pool of low-cost and technically skilled
labour force in STEM fields, its competitive IT services sector, and supporting policies and other initiatives. For
instance, the ‘Make in India’ program which focuses on making India a global manufacturing and R&D hub provides
opportunities for the Indian engineering services sector. India’s expertise in the IT services sector along with
widespread internet penetration have allowed it to adopt upcoming technologies such as AI, robotics, and virtual
reality, at a rapid pace. This has enabled the engineering services sector to climb up the value chain and move
towards more complex services. The sector has also benefited from increased FDI in the infrastructure, automotive
and auto components sectors in India.
One of the most promising areas of complementarity between India and Japan is in the automotive engineering
services market. Globally, the sector is expected to grow to US$ 384.6 billion in 2027 from US$ 153.1 billion in 2019,
registering a CAGR of 12.2 percent . Japan is the largest player in the global automotive engineering services market.70
India, on the other hand, provides a competitive market to which such services can be outsourced on a large scale.
Japanese firms are interested in outsourcing engineering services to Indian vendors to help them in customizing the
products they offer as well as in innovating new products to suit the needs of the Indian market. There has been an
increase in M&As in India’s engineering services sector with Japanese firms acquiring Indian counterparts. For
instance, the Solize Group headquartered in Japan acquired the CSM group in India, which primarily provides
engineering services to the automotive and aerospace sectors. Another important area of synergy is infrastructure
related engineering services such as in transport and logistics. There is considerable investment by Japan in such
projects (metro rail projects, Mumbai-Ahmedabad bullet train, the Delhi-Mumbai Industrial Corridor). Given the huge
infrastructure funding needs in India and the big push by the Japanese government for overseas investments and to
create new markets, there is much scope for mutual benefit.
3.5 Taking stock of prospects under the CEPA
The preceding overview of four selected services in India and Japan highlights the many sources of complementarity.
Three basic complementarities emerge. The first relates to India’s need for investments and technology and Japan’s
ability to provide financial and intellectual capital. The second relates to Japan’s need for talented manpower in many
services and India’s ability to meet that requirement. The third is the synergy between Japan’s hardware expertise
and India’s software expertise, and the possibilities to leverage India’s IT services strengths to exploit emerging
opportunities in a variety of other IT-based services and manufacturing processes.
We next examine the extent to which the existing commitments taken by India and Japan under the Comprehensive
Economic Partnership Agreement (IJ CEPA) address these areas and modes of mutual interest and complementarity.[
See Appendix A for a summary of the IJ-CEPA.] Table 11 summarizes the sectoral coverage of the commitments made
by India and selected partner countries, under India’s bilateral agreements and how this compares with those made
under the GATS, while Table 12 presents the coverage of subsectors within scheduled services.71
71 Under the GATS, countries have flexibility to table service sectors (of the 12 broad services covered by the GATS) they wish to table fornegotiations. This is called scheduling a sector. Once a sector is scheduled, they also have the flexibility to commit or not in subsectors andactivities (160+ total across the 12 services) that are covered by a sector. Thus, the coverage of services and sub-sectoral coverage within ascheduled sector is left to the discretion of member countries. The same approach has been followed in India’s bilaterals with Singapore, Japanand Korea.
70 Automotive Engineering Services Market Report, 2019, Markets and Markets
84

An examination of the sectoral coverage of commitments shows that both India and its partners have either bound
the status quo or have taken GATS plus commitments in terms of the number of services sectors and subsectors
scheduled. Some schedules go beyond the offers made in the Doha round request-offer process.
Table 11: Sectoral coverage of commitments by India and selected partners under various FTAs
SERVICE SECTOR/ AGREEMENTGATS INDIA-KOREA INDIA-JAPAN INDIA-SINGAPORE
India Korea Japan Singapore India Korea India Japan India Singapore
Business Services √ √ √ √ √ √ √ √ √ √
Communication Services √ √ √ √ √ √ √ √ √ √
Construction and Related Engineering
Services √ √ √ √ √ √ √ √ √
Distribution Services √ √ √ √ √ √ √ √
Educational Services √ √ √ √ √ √
Environmental Services √ √ √ √ √ √ √
Financial Services √ √ √ √ √ √ √ √ √ √
Health Related and Social Services √ √ √ √ √ √ √
Tourism and Travel Related Services √ √ √ √ √ √ √ √ √ √
Recreational Cultural and Sporting Services √ √ √ √ √ √ √ √
Transport Services √ √ √ √ √ √ √ √ √
Other Services Not Included Elsewhere √
Source: Authors’ construction based on schedules of services commitments under selected FTAs and Chanda (2014)
India committed only six sectors under the GATS, but it committed eight sectors in the India-Singapore CECA and
eleven sectors each in the India-Japan and the India-Korea agreements. While partner countries such as Singapore,
Korea and Japan have committed six, eight and eleven sectors respectively under the GATS, they have committed
twelve, ten and eleven sectors, respectively in their FTAs with India. Thus, both sides have increased the sectoral
scope of their services commitments.
Table 12 highlights that within the scheduled services, the number of subsectors/activities committed has also
increased for both India and Japan. This is particularly so in business and communication services and to a lesser
extent in transport services in case of Japan, and in business, transport and construction and engineering services
and to a lesser extent in financial services in case of India. Japan, has however, committed fewer subsectors in
financial services in its CEPA with India, compared to that under the GATS.
Table 12: No. of Sectors Committed within each Sector
SERVICE SECTOR/ AGREEMENT
GATS INDIA-KOREA INDIA-JAPAN INDIA-SINGAPORE
India Korea Japan Singapore India Korea India Japan India Singapore
Business Services 8 34 36 21 33 50 32 61 39 55
Communication Services 11 12 11 7 16 19 15 21 9 12
Construction and Related Engineering Services 1 7 5 1 1 1 5 6 5 8
Distribution Services 4 4 2 4 4 8 2 11
Educational Services 4 1 2 1 5 0 4
Environmental Services 4 7 2 4 2 7 0 3
Financial Services 10 15 9 17 17 12 14 2 12 17
Health Related and Social Services 1 1 1 0 1 1 1 7
Tourism and Travel Related Services 2 3 4 4 3 3 3 3 2 7
Recreational Cultural and Sporting Services 4 1 2 2 2 4 3 8
85

Transport Services 15 17 3 11 21 11 23 9 31
Other Services Not Included Elsewhere 0 0 0 0 0 3
Total 33 94 102 54 89 118 90 141 82 166
Source: Authors’ construction based on schedules of services commitments under selected FTAs and Chanda (2014)
With respect to the four services under focus in this study, the CEPA commitments show increased coverage of these
sectors. Both countries have not only scheduled these services but have significantly expanded the number of
activities committed within them.
Beyond the scope of commitments, it is also important to examine the content of these commitments so as to get a
better understanding of how much liberalization has actually been committed under the agreement by the two
countries and how areas of sensitivity have been safeguarded. Table 13 provides the actual commitments made by72
India and Japan in selected services, for market access and for national treatment, in each of the four modes of
supply. It also captures the gist of the limitations that have been inscribed where partial commitments have been
made.
Table 13: Commitments in India-Japan CEPA in selected sectors
Education: Higher Education (Japan has committed all education subsectors, where Primary & Secondary Education
are committed limitedly)
Mode India’s Commitments: Limitations on Japan’s Commitments: Limitations on
MA NT MA NT
M1 P: Service providers would be s.t. regulations as applicable to domestic providers in the
country of origin.
N N N
M2 N N N N
M3 P: Fees to be charged can be fixed by an appropriate authority & that such fees do not
lead to charging capitation fees/profiteering & s. t. further to such regulations, already in
place/ to be prescribed by the appropriate regulatory authority.
N N N
M4 U# U# N N
Computer & Related
Mode India’s Commitments: Limitations on Japan’s Commitments: Limitations on
MA NT MA NT
M1 N N N N
M2 N N N N
M3 N N N N
M4 U# U# N N
Construction & Related Engineering
Mode India’s Commitments: Limitations on Japan’s Commitments: Limitations on
MA NT MA NT
M1 N N Only Other (UN CPC 511, 515, 518) committed
with No restrictions & mining more restricted
Only Other (UN CPC 511, 515, 518) committed
with No restrictions & mining more restricted
72 As per the commitment modalities, in the sectors and subsectors that are scheduled, countries make commitments on market access andnational treatment for each of the four modes of supply (8 commitments per activity/subsector). There are three kinds of commitments they canchoose to make-none, partial and unbound. None refers to commitments with no limitations when full market access has been permitted. Partialcommitments are when limitations have been included and only partial market access has been provided subject to conditions. Unbound refers tothe case of no commitments. Thus, countries have the discretion to commit in any of these forms within the sectors they have scheduled forcommitments.
86

M2 N N
M3 N N
M4 U# U#
Health Related: Hospital
Mode India’s Commitments: Limitations on Japan’s Commitments: Limitations on
MA NT MA NT
M1 P: Only for provision of services on provider-to-provider basis such that the
transaction is between two established medical institutions, covering the areas of
second opinion to help in diagnosis of cases or in the field of research.
N U except there is no
limitation on
participation of
foreign capital
U except there is no
limitation on
participation of
foreign capital
M2 N N N N
M3 P: Only through incorporation with a foreign equity ceiling of 74% & s. t. latest
technology for treatment will be brought in. Publicly funded services may be
available only to Indian citizens or may be supplied at differential prices to persons
other than Indian citizens.
N N N
M4 U# But None for charitable purposes. U# N N
Financial: Insurance & Insurance Related
Mode India’s Commitments: Limitations on Japan’s Commitments: Limitations on
MA NT MA NT
M1 U for Life, P for other subsectors, N for auxiliary
services
U, N only for auxiliary P N
M2 U except reinsurance, intermediation U, N only for auxiliary P N
M3 P: establishment would be through
incorporation with foreign equity not exceeding
26%, 51% for auxiliary services
N for Life, U for others, P for Non-Life:
establishment would be through Incorporation
with foreign equity not exceeding
N N
M4 U# U# N N
Financial: Banking & Other
Mode India’s Commitments: Limitations on Japan’s Commitments: Limitations on
MA NT MA NT
M1 U U P: Commercial presence
is required for
discretionary investment
management services.
N
M2 U U N N
M3 P, U for money broking, N for Provision
& transfer of financial information,
financial data processing & related
software by suppliers of other financial
services
P, N for asset management; consulting;
Provision & transfer of financial
information, financial data processing
& related software by suppliers of
other financial services
N P: Deposit insurance
system does not cover
deposits taken by
branches of foreign
banks.
M4 U# U# U U
Source: Based on commitment schedules under the India-Japan CECA
Notations: P: partial, N: None, U: Unbound, U*: unbound due to technical constraints,
U#: Unbound except as indicated in the horizontal section
Notes: Subsectors include all subsectors committed. Where partial commitments are very detailed, they have not been mentioned
As is evident from Table 13, Japan has made more liberal commitments than India in general. Across modes, mode 4
remains unbound for both countries indicating that there is no liberalization with regard to movement of service
87
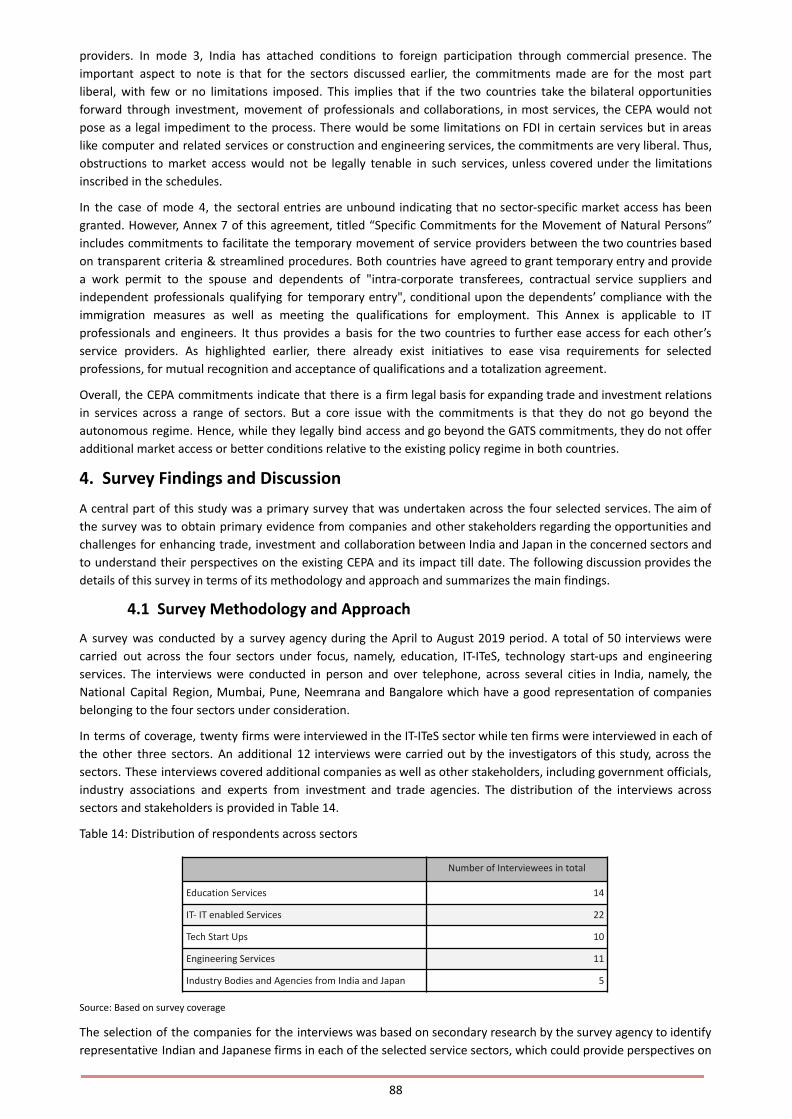
providers. In mode 3, India has attached conditions to foreign participation through commercial presence. The
important aspect to note is that for the sectors discussed earlier, the commitments made are for the most part
liberal, with few or no limitations imposed. This implies that if the two countries take the bilateral opportunities
forward through investment, movement of professionals and collaborations, in most services, the CEPA would not
pose as a legal impediment to the process. There would be some limitations on FDI in certain services but in areas
like computer and related services or construction and engineering services, the commitments are very liberal. Thus,
obstructions to market access would not be legally tenable in such services, unless covered under the limitations
inscribed in the schedules.
In the case of mode 4, the sectoral entries are unbound indicating that no sector-specific market access has been
granted. However, Annex 7 of this agreement, titled “Specific Commitments for the Movement of Natural Persons”
includes commitments to facilitate the temporary movement of service providers between the two countries based
on transparent criteria & streamlined procedures. Both countries have agreed to grant temporary entry and provide
a work permit to the spouse and dependents of "intra-corporate transferees, contractual service suppliers and
independent professionals qualifying for temporary entry", conditional upon the dependents’ compliance with the
immigration measures as well as meeting the qualifications for employment. This Annex is applicable to IT
professionals and engineers. It thus provides a basis for the two countries to further ease access for each other’s
service providers. As highlighted earlier, there already exist initiatives to ease visa requirements for selected
professions, for mutual recognition and acceptance of qualifications and a totalization agreement.
Overall, the CEPA commitments indicate that there is a firm legal basis for expanding trade and investment relations
in services across a range of sectors. But a core issue with the commitments is that they do not go beyond the
autonomous regime. Hence, while they legally bind access and go beyond the GATS commitments, they do not offer
additional market access or better conditions relative to the existing policy regime in both countries.
4. Survey Findings and Discussion
A central part of this study was a primary survey that was undertaken across the four selected services. The aim of
the survey was to obtain primary evidence from companies and other stakeholders regarding the opportunities and
challenges for enhancing trade, investment and collaboration between India and Japan in the concerned sectors and
to understand their perspectives on the existing CEPA and its impact till date. The following discussion provides the
details of this survey in terms of its methodology and approach and summarizes the main findings.
4.1 Survey Methodology and Approach
A survey was conducted by a survey agency during the April to August 2019 period. A total of 50 interviews were
carried out across the four sectors under focus, namely, education, IT-ITeS, technology start-ups and engineering
services. The interviews were conducted in person and over telephone, across several cities in India, namely, the
National Capital Region, Mumbai, Pune, Neemrana and Bangalore which have a good representation of companies
belonging to the four sectors under consideration.
In terms of coverage, twenty firms were interviewed in the IT-ITeS sector while ten firms were interviewed in each of
the other three sectors. An additional 12 interviews were carried out by the investigators of this study, across the
sectors. These interviews covered additional companies as well as other stakeholders, including government officials,
industry associations and experts from investment and trade agencies. The distribution of the interviews across
sectors and stakeholders is provided in Table 14.
Table 14: Distribution of respondents across sectors
Number of Interviewees in total
Education Services 14
IT- IT enabled Services 22
Tech Start Ups 10
Engineering Services 11
Industry Bodies and Agencies from India and Japan 5
Source: Based on survey coverage
The selection of the companies for the interviews was based on secondary research by the survey agency to identify
representative Indian and Japanese firms in each of the selected service sectors, which could provide perspectives on
88

the prospects and challenges in bilateral engagement and operating in each other’s market. Senior persons were
interviewed in each of the companies so as to get this strategic perspective.
The interviews were based on semi-structured questionnaires, which had some common questions across sectors
and some which were customized to meet the specificities of each sector. (Appendix A provides the questionnaires
that were used for the survey). There were four parts to the questionnaire. The first part sought to get an overview
of the company’s operations and its engagement with India/Japan. The second part covered sector-specific
opportunities and barriers. The third part attempted to assess the extent of awareness of the CEPA, its utilization as
well as relevance for companies on both sides. The final part of the survey sought suggestions from the interviewees
regarding specific issues that need to be addressed in future discussions and a review of the CEPA.
4.2 Results & Discussion
We present here the key findings on the current status, opportunities, barriers, and the role of the CEPA going
forward for each of the chosen services sectors. This is followed by a summary of the cross-cutting issues in terms of
the common opportunities and challenges as well as the top few issues and policy suggestions that emerge from the
survey.
4.2.1 Education Services 73
Most interviewees were from private establishments, with only one respondent being affiliated to an Indian Central
University. The survey sample for education services consisted of eight Indian educational institutions and two
Japanese establishments. All of the establishments covered in the sample offered degree certificate courses with only
one also offering Undergraduate and Post-Graduate degrees. A Japanese language course was the most common
course offered by all the establishments in our sample.
a) Key Opportunities
According to respondents, there are several factors that make Japan attractive as a partner for India in higher
education services. The most significant factor noted by respondents was the high quality (and rankings) of Japan’s
educational institutions, followed by other factors such as incentives in the form of scholarships provided by the
Japanese government to overseas students. However, factors such as Japan’s global recognition as a R&D hub or its
commonalities with India in the areas of cultural, religious (Buddhist) and heritage studies were not considered
significant factors.
Respondents from Indian educational institutions had a very positive perception about the quality of Japanese
education. They viewed the Japanese education system as historically and culturally rich and as being fundamentally
different from that of other countries as it aims to inculcate a sense of responsibility, values and ethics, thus enabling
holistic development. The Indian institutions interviewed also noted that Japanese educational institutions are very
up to date in their use of technology and in pedagogical innovations, with curricula that include exchange
programmes to provide students with international exposure. The Japanese curriculum was also seen to be
innovative and practical, with sufficient focus on co-curricular activities, making the students independent and
well-rounded. Some respondents also noted that for Indian students, education in Japan might be an economical
option as compared to other developed economies. As Japan’s education system is a balanced mix of traditional as
well as modern teaching techniques, they are seen as having a unique edge in the education sector.
One of the higher education institutes in India which offers programmes in Japanese language studies, highlighted
that the Japanese Government has taken more initiatives than the Indian government to strengthen bilateral ties in
education services. For instance, the School invites Japanese visiting faculty for lectures, which are well-appreciated
by the students. These exchanges are often facilitated by organizations that are funded by the Japanese Ministry of
Foreign Affairs as a means to strengthen cultural ties between the two countries. Further, over time, Japanese
government has increased the number of fellowships offered to students to attract talented youth since the country
is facing a student shortage due to its declining youth population.
Another feature that makes bilateral engagement attractive with Japan is due to the growing demand for learning the
Japanese language. As Japan is perceived to be a market leader in many segments, including electronics, computer
73 Trade in education services occurs through four modes of the General Agreement of Trade in Services (GATS). These include cross border supplyof education services through online programs or courses offered by foreign universities that are taken up by students in other countries,consumption abroad wherein foreign students come to study in the universities of another country and native students go abroad to study,commercial presence which involves offshore campuses of foreign universities being set up in a country and mode 4 or movement of naturalpersons which represents the exchange of faculty across nations.
89

hardware, semiconductors, automotive, and has set up businesses in India, there is demand for learning the
Japanese language to avail of the employment opportunities these companies offer. An understanding of Japanese
language and culture is seen as enabling the candidates to understand the Japanese business etiquette and ethics
better and to avoid cultural faux pas when engaging with them. Furthermore, some respondents noted that with the
demographic shift in Japan towards an ageing population, Japanese companies are increasingly looking for talented
employees, creating opportunities for international students who are well versed in the Japanese language. This has
led to increased demand for learning the Japanese language in India. With growing business relations between the
two countries, an acquaintance with one another’s education system and standards is seen as a welcome step. Also,
with the growing population of Japanese expatriates in India given the rise in business transactions, there is also a
need to offer education services to their dependents at the school level.
Respondents from Japanese establishments covered by the survey indicated that the most significant opportunities
offered by India in education services sector included the availability of quality faculty and the growing private sector
in the Indian education sector. Proficiency of the students and faculty in the English language and rankings of some
Indian institutes were considered relatively less significant factors. Respondents did not find Indian government
initiatives such as scholarships or India’s competence in emerging domains such as Internet of Things (IoT) and
Artificial Intelligence (AI) etc. as being important factors. It was also highlighted that some students also come to
study English language in India due to the lower costs compared to studying in the US or UK. Some Japanese students
also study Hindi in India and take Hindi as a major when studying in Japan due to their interest in the Indian culture,
though this number is very limited at present.
b) Key Barriers
Several barriers were highlighted during the survey by Indian and Japanese respondents. The three barriers that were
rated as most significant by Indian educational establishments included linguistic and cultural barriers, lack of
awareness among students (lack of people to people connect) and lack of updated course content in the two
countries.
Several respondents talked at length about the cultural and linguistic barriers that constrain bilateral engagement in
education services. According to the Indian respondents, the history of Japan as a closed and conservative nation
puts it at a disadvantage relative to major global players in the education sector. Problems of language and
communication are a major deterrent between India and Japan in this sector. This is reflected in the very small
number of students moving between Japan and India (though this is increasing slowly). Japanese students who visit
India on student exchange have difficulties in communicating with administrative staff in the universities as well as
with people outside the university campus due to linguistic barriers. Indian students refrain from going to Japan for
higher studies as not many Universities in Japan offer programmes with English as the medium of instruction.
Therefore, knowing Japanese becomes a pre-requisite for taking up higher studies in Japan, making it a less attractive
destination for Indian students seeking higher education overseas This was highlighted as the single most important
barrier for foreign students in choosing Japan for higher studies. Further, as some respondents pointed out, the
success stories of Indian students gone to US in the past, motivate more Indian students to choose the US for higher
studies, but such stories are lacking in the case of Japan. Most of the overseas students therefore turn to Japan only
for pursuing Japanese studies. Japanese universities are addressing this shortcoming by starting summer courses and
degree programmes in other disciplines in English at the undergraduate and postgraduate levels. This would not only
help attract more foreign, including Indian students to Japanese universities in future, but could also benefit
Japanese students in terms of communicating with their peers and preparing them for employment opportunities in
other countries.
Some other factors that were cited as barriers included delays in regulatory approvals, problems with land
acquisition, and dependency on local partners in case of setting up commercial presence in Japan, though these were
seen to be moderately significant barriers, much less important than the cultural and linguistic differences. Other
factors that were considered to be relatively less significant included immigration barriers, wide variability in the
quality of the curriculum in Indian universities and non-recognition of degrees across countries. Restrictions on
online delivery of education services or electronic sharing of online material were not considered important barriers.
The misalignment of programmes between the two countries was also pointed out. For instance, the post-graduate
programmes in Japan require four years of undergraduate studies for eligibility while many of the undergraduate
courses in India, primarily in language studies and in non-engineering programmes, are of three years in duration,
posing difficulties for Indian students in pursuing further studies in Japan.
90
On the part of Japanese establishments, the most significant trade barrier that was cited was the lack of
infrastructural facilities in India, i.e., lack of international standards in Hostels, the Mess, Classrooms, and the lack of
disability-friendly campuses, Some Japanese respondents also noted the restrictions in India with respect to
acquisition of land as constraining Japanese universities from setting up their offices or campuses in India. Another
factor cited was lack of awareness among Japanese students about the prospects for higher studies India. While
some Japanese students coming to India pursue engineering degrees especially IT, they are only aware of the high
quality of institutions like the IITs but are not aware of other universities in India. Japanese educational institutions
also noted problems that arise due to the lack of people-to-people connect and the non-recognition of degrees,
which in turn limits student mobility between the two countries. Some Japanese respondents also cited the lack of
marketing efforts by Japan in the higher education sector and restrictions on marketing and promotion in the Indian
market, both of which have caused a general lack of awareness about Japanese higher education institutions among
Indian students.
c) Way Forward and Role of CEPA
The majority of respondents (80 percent) were aware of the CEPA between India and Japan. The respondents agreed
that such an agreement can help both countries understand each other’s education sectors better. There was a
general perception that such agreements can play a pivotal role in allowing the free movement of faculty across the
two countries and in enabling private universities to make in-roads into each other’s market. The CEPA is viewed as
an opportunity to learn about the Japanese education system which is considered among the best in the world.
Respondents were largely optimistic about leveraging the CEPA to facilitate exchange of ideas, pedagogical
techniques and methods of learning between the two countries to promote bilateral trade in education services.
Several suggestions were made in the context of the CEPA and also more generally to realize these opportunities.
The primary suggestion made by all respondents was to increase the visibility of Indian universities and educational
institutions in Japan as it was felt that currently awareness about India is very limited in the Japanese market.
Similarly, awareness of educational opportunities in Japan is limited among Indian students. As a result, the number
of Indian students in Japanese universities is quite low in comparison with China and even Indonesia and Bangladesh.
As Indian students are more exposed and oriented towards the English-speaking Western nations, a greater
awareness campaign is needed by the Japanese institutions to attract Indian students. It was also mentioned that
media can also play an important role in raising awareness and that the role of media needs to be carefully examined
as at times it may also create negative stereotypes about the two countries.
There were suggestions regarding teaching the Japanese language in India’s mainstream curriculum, especially in the
lower grades. Very few schools in India offer Japanese language as a subject. The latter is often listed as a fourth
language and hence is not opted for by students. Knowledge of Japanese, it was felt, would help improve ties
between the two countries and also make the Indian youth more global in their orientation. It was felt that the CEPA
should be leveraged to increase language training programs in Japanese as this would facilitate employment for
Indian professionals across a variety of sectors in Japan. For instance, special training programmes in Japanese could
be introduced for Indian healthcare workers, which would facilitate their movement to Japan for providing care to
the elderly. Similarly, given the fact that large conglomerates in Japan – the ‘keiretsus’ , are conservative in nature74
and mostly use Japanese language as a medium of communication to carry out their business, being well-versed in
Japanese language could help Indian businesses in penetrating the Japanese market.75
In this regard, some participants mentioned that progress is being made to impart language training in Japanese. For
instance, a few schools in India are promoting cultural interaction with Japanese schools as a part of their curriculum.
Some IT firms in India are already associating with the Japanese Embassy in India to train their employees in
Japanese. Certain Japanese foundations have been supporting Japanese language centres in Indian universities in
creating awareness about the language as well as promoting people to people connect.
As the high cost of education in Japan compared to that in India, as well as visa issues are seen as impeding bilateral
trade in education services, respondents suggested that the CEPA could focus more on such issues to remove these
barriers for mutual benefit. For instance, it was noted that technology-oriented programs in which Japan specializes
75 [ Respondents noted that China fares better than India as it has more linguistic and cultural affinity with Japan. Ithas the third largest number of Japanese-language educational establishments, after Korea and Indonesia, with 2115such institutions compared to only 184 in India. China has the largest number of Japanese learners in the world at953,283 persons compared to India which ranks 12th with only 24,011 learners (Japan Foundation, 2015).]
74 [ Keiretsu is a form of business organization unique to Japan, where a number of organisations are linked togetherin a network by having stakes in one another and have a close business relationship.]
91
and excels and has a curriculum that is at par with that of global universities can be very expensive for Indian
students. Without some scholarships being extended by the two governments, it is difficult for Indian students to
pursue these programs in Japan. It was specifically suggested that future reviews of the CEPA should address the
introduction of country specific scholarships by the governments to facilitate bilateral student exchange. It is to be
noted, however, that the cost of education in Japan is less than that in other major destination markets for Indian
students, such as the US and the UK. This has often been cited as a reason for Indian students to explore Japan as a76
destination country for further studies. Moreover, loans are not available for foreign students.77 78
In addition to addressing the cost of education, it was also suggested that the governments in both countries should
take efforts to encourage and incentivize Indian youth to attain education in Japan by offering recruitment to
competent students and leverage the linkages of Japanese universities with industry to motivate Indian students to
take up higher studies, internships and future employment in Japan. It was also suggested that government
assistance is needed to improve the infrastructure and capacity of institutes and universities to facilitate student
exchange programmes between the two countries. Such exchange programmes would in turn benefit universities on
both sides by contributing to their educational and scientific accomplishments.
Respondents also highlighted the need for the government to organize workshops and seminars to educate the
institutes as well as prospective students about the CEPA and its provisions for the education sector. They also
suggested the role the two governments could play in promoting exchange of reputed faculty between the countries
on a regular basis, though respondents also mentioned that due to the shortage of faculty at Indian universities, it is
often difficult to engage in faculty exchange. In addition to exchange programmes, it was also suggested that the two
governments could provide internships to each other’s students so as to allow them to explore the business
environment and system. Further, Japanese scholars are deterred by the low salaries in India and thus have low
motivation to visit India to teach.
Another set of suggestions concerned the need to align the curricula for standard degrees in the two countries. A
lack of such synchronization creates difficulties for students in understanding the requirements for the degrees they
wish to pursue and deters pursuit of further studies in each other’s market. The discussions also revealed the need
to address non-transparency in the admission processes of the institutes for foreign students. It was further noted
that Indian students face an issue with recognition of their language proficiency certification, even after clearing the
JLPT (Japanese Language Proficiency Test) exam when they seek admissions for higher studies in Japanese
universities.
Respondents also highlighted the many opportunities in the education services sector which can be exploited by
India and Japan for mutual gain. For instance, it was mentioned that India and Japan have synergies to introduce
technology into pedagogical tools so as to improve the learning process and outcomes through means such as:
e-learning, interactive learning, etc. Further, given the respective strengths of both countries, technology could also
be included as part of the curriculum, especially in higher degree courses. It was also felt that collaborations on the
research front can help the countries cut down the costs, target common issues and share each other’s expertise in
different domains. Universities from the two countries can collaborate in offering dual degree programmes or
developing common curriculum keeping in mind the needs of the industry to prevent skill mismatch, so as to provide
the students with employment opportunities in both countries.
Overall, respondents had several forward-looking suggestions about ways to enhance relations in education services.
The two main suggestions pertained to raising awareness and lowering the cost of education. The general view is that
both governments should be more pro-active if the existing opportunities are to be exploited. There is, however, also
some skepticism about the implementation and monitoring of the commitments made under the CEPA.
4.2.2 IT – ITeS Sector
The survey covered 20 firms in the IT-ITeS sector. Among these, three firms were headquartered in Japan but had a
commercial presence in India while the remainder were Indian firms and MNCs (based in India) with a presence in
the Japanese market or plans to enter the market. The broad industry verticals in which these firms have presence
included IT, healthcare, banking, telecom, insurance, legal services, accounting services and auditing. Their
operations included IT services, IT consulting, automation solutions, web designing, data processing, digital
78 It is also difficult for international students with non-resident status to secure loans to pursue studies in Japan.http://hanko-seal.com/archives/4847#:~:text=There%20are%20dozens%20of%20consumer,students%20with%20permanent%20resident%20status.&text=No%20bank%20accepts%20applications%20from%20foreign%20students
77 [ But Japan remains less attractive for Indian students due to linguistic and cultural reasons. ]
76 [ https://read.oecd-ilibrary.org/education/education-at-a-glance-2017_eag-2017-en#page221]
92
marketing, business technology solutions, integrated product engineering solutions, and IT solutions for hardware
etc. among others. All three modes (modes 1, 3, 4) of trade were found to be equally significant among the firms
surveyed.
a) Key Opportunities
The survey highlighted the very positive outlook across all respondents regarding the bilateral opportunities in this
sector. Sixty five percent of the non-Japanese firms ranked Japan among the top 10 markets in terms of business
opportunities. In their view, the most significant opportunity offered by the Japanese market is the technological
complementarity between the two countries in terms of India’s expertise in software skills and Japan’s expertise in
hardware, technology and R&D. Other factors that are conducive to bilateral engagement include Japan’s global
reputation in terms of R&D capabilities; the demographic complementarity between India and Japan and the need
for India to diversify its exports to other markets such as in the Asia-Pacific region. One of the respondents from an
Indian IT firm highlighted that because of the unique nature of the Japanese market, that company has created a
niche for itself by focusing on services that cater only to Japan, with 90 per cent of its revenues coming from Japan.
Factors such as size of the Japanese IT sector and incentives given by the Japanese government were, however, were
not perceived to be that significant.
According to Japanese firms, one of the main attractions of the Indian market is the hardware-software synergy
between the two countries. They noted that Japanese manufacturing firms are increasingly realizing the importance
of integrating updated software services in manufacturing to be globally competitive. Hence, there is growing
interest in collaborating more actively with India so as to be at par with their global competitors as far as the
integration of frontier IT solutions is concerned.
Across all Japanese and MNC respondents, the Indian market was perceived to be very attractive due to the high
quality and reliability of services provided by Indian IT professionals and firms. The other significant opportunities
include incentives offered by the Indian Government, India’s expanding market and the relative maturity of its
domestic IT market compared to that in Japan, and the efficiency, productivity and capability of India’s IT workforce.
Japanese firms noted that India’s large domestic market, its globally reputed IT-ITeS market and its cost-effective and
talented workforce makes it an attractive business destination for Japan. In particular, respondents highlighted
factors such as mandatory trainings in workplace code of conduct which enhances the efficiency of Indian IT
professionals as well as the latter’s in-depth domain knowledge of technical languages such as PHP, Java etc. which
enables them to prioritize work, understand the client’s needs and provide quick and hassle-free delivery of services
to international clients. The respondents also noted the innovative and value-for-money services which set apart
Indian IT professionals from those of other countries, the high standard of the services provided by Indian IT firms,
and the fact that Indian IT firms are up to date with new technologies such as AI, IoT and Machine learning and
provide their employees with multiple platforms to upgrade their skills.
Overall, it was evident that Japanese clients have a very good opinion of Indian IT firms and professionals. In their
view, Indian IT firms are capable of providing high-end technical support for their clients. They perceive Indian IT
professionals to be reliable and dedicated to their work with excellent communication skills and ability to provide
services remotely. As pointed out by one respondent, the latter skills are of utmost importance in a sector where
Mode 1 (or cross border supply) is usually the most common mode of trade.
b) Key Barriers
Bilateral engagement in IT-ITeS is, however, subject to several challenges. Non-Japanese respondents identified three
significant barriers. These include linguistic differences, growing competition from China and other South East Asian
nations and the unique Japanese industrial organization system of ‘Keiretsu’ which makes it difficult to enter the
Japanese market. Other factors such as Data Protection and IPR issues, investment barriers in Japan, and differences
in organizational culture and ways of doing business between the two countries were perceived to be moderately
significant barriers. Labor Regulations in terms of Mutual Recognition, Accreditation and licensing issues, labour
market and economic needs test related requirements, labour laws and Immigration issues were not perceived as
significant barriers to bilateral trade in this sector.
Indian firms and MNCs highlighted language as the most significant barrier when working with Japanese clients and
in entering the Japanese market.[ Language was seen to be a particularly important barrier in the case of IT-ITeS as
this sector requires repeated communication between service providers and certain technicalities may get lost in
translation which could adversely affect service delivery.
93
] It was noted that the few US based firms that have been successful in Japan have overcome this challenge by hiring
more Japanese professionals. Moreover, Indian professionals who live and work in Japan, face challenges relating to
language and culture. Organizational culture was also cited as a challenge. The CEO of a leading IT firm in India which
withdrew from the Japanese market a few years back noted that the slow and hierarchic nature of the
decision-making process in Japanese firms relative to that in other countries, makes it more difficult to do business
with Japanese compared to Western clients. While collaboration and strategic tie-ups with local partners were seen
as a good way to penetrate the Japanese market (as the examples of tie-ups by Indian IT majors cited earlier
highlight), respondents noted the challenges in integrating with Japanese companies. Some Indian IT firms which are
interested in entering the Japanese market also cited the difficulty and high cost associated with getting a
commercial space in Japan and thus in accessing the Japanese market through mode 3, or commercial presence. In
their view, future CEPA discussions could consider providing some rebates which could help Indian firms to enter the
Japanese market.
Beyond these issues, other factors such as labour laws and taxation did not emerge as major barriers according to
Indian and MNC respondents, their main contention being that such issues only arise after the firm secures business
in Japan, which in itself is the more difficult step. Cross border mobility of professionals, though not cited as a major
hurdle, is nevertheless a challenge for some companies. An e-learning app developer firm from India with a large
client base in Japan expressed the need to have easier visa norms to facilitate cross-border movement of service
providers between the two countries as frequent movement of professionals to the client’s location is required in this
sector. More generally, Japan’s economic stagnation was seen as adversely affecting the opportunities for expanding
business operations in Japan.
Although Indian IT firms were by and large perceived to be very technically competent, one large Indian IT firm cited
the challenge of slow adoption of new technologies such as cloud computing, artificial intelligence, IoT, blockchain
etc. by Indian IT firms. This potentially poses a constraint to collaboration with Japanese firms as the latter are more
technically updated. Hence, according to this respondent, the Indian IT industry needs to upgrade itself more quickly
to leverage collaboration possibilities with Japanese firms. This requires Indian IT firms to adopt and train their
professionals in new skills such as big data, robotics, etc. and moving into jobs that go beyond replication of
processes and towards implementation of new solutions, so as to sustain their competitive edge in future.
The Japanese firms that were surveyed highlighted language barriers to be the most significant barrier to trade with
India in the IT-ITeS sector. In addition, they also cited several other challenges to operating in India, including the poor
execution of laws and regulations in India, the organizational systems and ways of doing business in India which are
very different from those practiced in Japan, immigration related challenges, infrastructural constraints (especially,
erratic power supply, insufficient bandwidth, and poor network connectivity), and lack of data protection norms in
India. For instance, some firms noted that the lack of data protection and privacy laws in India is causing India to lose
business from many developed countries which have enforced these standards. As India’s data security regime is
evolving and India has not signed the Osaka Track, data sharing is an area of concern for Japanese companies. Piracy
and copyright violations were also cited as concerns.
The Japanese respondents were, however, appreciative of recent ease of doing business related initiatives
undertaken by the Indian government (e.g., GST and the Insolvency and Bankruptcy Code) as steps in the right
direction, though they noted the generally poor implementation of rules and regulations in India and the gap
between policy and practice. Japanese respondents also cited India’s over-dependence on the Western markets in
the IT industry and the need to diversify the sector’s geographic orientation. Apart from language, organizational
culture, infrastructure and data protection related challenges, other factors such as FDI regulations, labour laws and
the availability of skilled labour were not perceived by Japanese respondents to be major barriers to doing business
in India.
c) Way Forward and Role of CEPA
Eighty percent of the firms surveyed were aware of the India-Japan CEPA. In their view, the agreement can facilitate
investment from Japan into the Indian IT sector, enable Indian firms to do business with Japanese firms which are
global leaders in technology, and help Indian firms to provide value added services and customized solutions to small,
medium and large-scale firms in Japan. There is a strong view that the CEPA can be used to leverage the
complementary hardware and software skills of Japan and India, respectively, particularly given the use of advanced
software with hardware. Better implementation of the CEPA in the IT-ITeS sector is seen as benefiting both sides
through lower costs, enabling technological innovation and ease of doing business.
94
Respondents highlighted several barriers and issues which could be addressed in the CEPA discussions and future
review of the agreement. One such issue relates to easing restrictions on the cross-border movement of
professionals between the two countries through more liberal commitments in mode 4. This, according to the
respondents, would enable firms on both sides to better utilize technically qualified personnel. There was a mixed
view about how much the CEPA has eased the norms for obtaining Japanese visas for Indians. All firms stressed the
need to introduce more business-friendly visa rules that can help in the movement of professionals across countries,
through the agreement.
Another general point raised by all respondents was the need to raise awareness of the CEPA and to improve its
effectiveness. Some suggestions made in this regard included the need to organize events to make the stakeholders
aware of the opportunities offered by the other country, better information on investments opportunities and the
way to navigate each other’s markets, and the establishment of special windows to facilitate bilateral investment.
Indian IT companies pointed out that they face tough competition in Japan in the healthcare and retail IT services
segments and that an India-specific desk in Japan would make it easier for them to enter the Japanese market.
Respondents also suggested that the CEPA discussions be used to address barriers relating to language and culture so
as to provide more employment opportunities to Indian and Japanese professionals in each other’s markets.
Overall, the prevailing view was that the CEPA has much to offer but it has not been utilized well by either
government. In future reviews, the agreement should be revised keeping in mind the needs of the service sector,
including the specific concerns of the IT industry. It was felt that these agreements have generally focused more on
goods and the service sector’s interests are not given adequate attention. Hence, it was suggested that a dedicated
team should delve into the opportunities and interests of the various services, including the IT sector and incorporate
these issues into future discussions. If this is done, then according to the respondents, the CEPA can play an
important role in the growth of this industry in both countries.
4.3 Technology Start – Ups
All the firms that were interviewed in this sector, were set up post 2000. Eighty percent of them were aware of the
India-Japan CEPA. The verticals in which they are operating include, mobile app development, web development, IT
solutions, IT service and translation, e-commerce, mobile marketing and mobile analytics. The most common mode
for trade for the respondents was Mode 4, followed by Mode 1 and Mode 3. For around 60 per cent of these firms,
their operations in the Japanese market began only in the past five years. However, 70 per cent of these firms listed
Japan among the top 3 markets for their business.
a) Key Opportunities
The discussions indicated that the size of the Japanese IT services market is what makes the Japanese market
attractive to Indian start-ups. All respondents agreed that the demographic complementarity between India and
Japan, the need for Indian providers to diversify into new Asia-Pacific markets, the currently low levels of penetration
of digitalization in most sectors in Japan, and the availability of special incentives that are being offered by the
Japanese government to support innovation for revitalizing Japan’s economy are conducive to bilateral engagement
in this segment. Other factors that were cited, though perceived to be relatively less significant, included
technological complementarity (hardware and software) and the possibilities for knowledge transfer given Japan’s
global reputation in R&D.
According to the respondents, as India is at a relatively nascent stage in the online business segment, it offers
immense potential for tech start-ups. India provides a labour force which is innovative, talented and cost-effective.
With high growth and rising incomes in India, firms highlighted the many unexploited opportunities in the
e-commerce space. They mentioned that the availability of skilled IT professionals in India not only enables good IT
services delivery but also good after sales service for tech start-ups. Indian IT professionals are seen to have a good
understanding of problems and a problem- solving oriented approach. Several respondents also highlighted the
diversity of the Indian market as another positive attribute in that it provides start-ups with an opportunity to pitch
their product or service to different customer segments and offers investors opportunities to invest in a range of
areas, including consumer goods, pharmaceuticals, infrastructure, energy, agriculture, etc. Given Japan’s ageing
population and thus a declining domestic market, India with its young population and growing consumer market
coupled with good IT skills and a growing start-up ecosystem, offers good opportunities to start-up investors from
Japan. Respondents mentioned the important role JETRO has been playing in bringing together Indian start-ups and
Japanese investors. Firms also highlighted opportunities in new areas such as block chain technology. One of the
95

respondents revealed that they have recently signed a contract with a Japanese start-up to set up a block chain R&D
center in Pune, India to hire and train block-chain developers in this innovative technology.
b) Key Barriers
Several challenges were highlighted by the survey. The most significant among these were linguistic barriers,
followed by high investment costs (due to the exorbitant cost of real estate in Japan, requirements pertaining to local
presence, and need for a local partner) and a stringent regulatory environment for start-ups. Eighty percent of the
respondents considered the Japanese work culture in terms of its aversion to risk taking and the tendency to strive
for perfection as a moderately significant barrier. As an example, one of the interviewees mentioned that often a
beta version of a software is not released in Japan as it is considered a less than perfect product.
Another set of challenges that emerged from the survey related to knowhow and skills. It was mentioned that strict
regulations as well inertia on the part of incumbents in Japan to adopt new technologies in sectors such as
healthcare, adversely affect tech start-up opportunities for Indian companies in Japan. (It was, however, noted that
there is a gradual push towards adopting health-tech start-ups given the rising demand for healthcare due to Japan’s
demographic structure, which will open up future possibilities for Indian tech start-ups in healthcare). Several Indian
tech start-ups cited their lack of business knowledge regarding customer relationships and marketing strategies and
the need for support in these areas if they are to enter the Japanese market. Some of the firms surveyed also
mentioned the difficulties in finding skilled labour due to a wide mismatch between the curriculum in India and the
skill sets needed for technology start-up jobs, particularly in sectors where technology keeps changing at a fast pace.
Some respondents also mentioned the lack of people-to-people communication between the two countries as
causing a gap between solution providers and their clients. They pointed out the need for Indian start-ups to bridge
this gap and to develop an in-depth understanding of the customers and their needs in markets such as Japan, which
are culturally distinct. A similar perception exists regarding the Indian market which according to the respondents,
also requires a good understanding of customer needs given its diversity in terms of culture, language, ethnicity and
religion. Another key issue highlighted about the Indian start-up market was the price sensitivity of Indian customers
who are unwilling to pay much for a product or service.
Indian start up founders mentioned the difficulties in finding suitable investors and raising funds in the Japanese
market. Despite positive reviews received for a product, Japanese investors take a long time to invest in a new idea or
technology. Therefore, in their view, government support is needed to set up a platform which updates the tech
start-ups about the various schemes offered in various sectors.
Firms were also asked about the significance of other factors which pose a challenge to enhancing relations in the
technology start-up space. Factors such as lack of transparency and long timelines for visa issuance, difficulties in
getting visas for dependents, the absence of a data protection law in India, and labour and recognition related issues
(such as Accreditation and licensing requirements, local employment conditions, and labour market test) also
emerged as barriers, though they were not considered to be significant.
c) Way Forward and Role of CEPA
Views regarding the effectiveness and significance of the CEPA in facilitating bilateral relations in the technology
start-up segment, were mixed. According to some respondents, while the agreement could help the manufacturing
sector by helping firms to update their technology in collaboration with Japan, e-commerce firms in services would
not stand to benefit from the CEPA in its current form. There were also concerns about the efficacy of its
implementation as other trade agreements are not seen as helping Indian firms to gain much in partner county
markets. However, some other respondents were optimistic about the CEPA. They considered the agreement as a
gateway to the Japanese market. In their view, the CEPA can facilitate FDI from Japan to India, thus helping Indian
tech startups expand their global footprints and enabling them to expand their product offerings and reach out to a
wider range of consumers. Further, the CEPA is seen as helping the two countries exploit their business synergies,
enhancing employment opportunities and enabling the transfer of innovative ideas and technologies to India.
Respondents did not, however, provide any specific suggestions on policy initiatives or measures needed under the
CEPA to promote bilateral opportunities in the technology startups segment. Most suggestions were general in
nature and largely echoed those made in the case of IT-IT enabled services given the strong overlap in the nature of
both these segments.
96

4.4 Engineering Services79
The survey of firms in engineering services mostly covered Japanese MNCs located in India. These firms were
involved in verticals like – automotive equipment, electrical equipment, industrial tools, power grids, power
generation, robotics and motion, surface treatment, air conditioning and petrochemical refining. Their operations
comprised of repairing automotive parts, air bags, seat belts etc.; surface coating; sales, R&D and warehousing for
air-conditioners; manufacturing and sales of industrial and commercial motors. All the respondent firms ranked India
among the top 10 markets for overseas business. Respondents highlighted that they are engaged in engineering
services trade with India through commercial presence (Mode 3), movement of skilled professionals (Mode 4) and
cross border supply (Mode 1) due to advancements in ICT. Most respondents were aware of the existence of the
India-Japan CEPA. Nearly 90 percent of the surveyed Japanese engineering firms ranked India as one of the top 3
markets by the volume of overseas business.
a) Key Opportunities
The discussions indicated that the single largest factor that makes India an attractive market for Japanese firms is its
growing market. Coupled with this growth is the rising demand for solutions which requires a combination of
engineering and IT services. India’s IT skilled labour force provides the much-needed complement to Japan’s prowess
in the engineering sector. All the Japanese engineering services firms interviewed listed this complementarity as the
most significant opportunity presented by India. Nearly 90 per cent of these firms agreed that the availability of
low-cost, young, efficient and skilled professionals in India, is one of the most significant features of the Indian
market. Respondents highlighted that while Japan specializes in automotive and electronics manufacturing, it does
not have much exposure to the latest IT technology, and given that the future will be digital, Indian IT engineers can
help them bridge this gap.
Most of the companies indicated that the quality of labor in architectural and engineering services in India is
world-class. They noted that India offers a unique mix of a talented workforce coupled with low costs, which puts it
at an advantage relative to other countries. In addition, the adoption of practices such as Quality Management and
Industrial Management by the Indian workforce, enhances in efficiency in engineering services. One respondent
mentioned that India’s talent pool is well versed in distinguishing between quality and quantity, enabling smooth and
efficient flow of the desired products.
Seventy five percent of the Japanese firms also attributed the attractiveness of the Indian market to the Indian
government’s thrust on infrastructure, its liberal FDI policies in this sector, and the incentives being provided by the
Japanese government for overseas investments. For instance, infrastructure projects such as the Delhi-Mumbai
Industrial Corridor, the Mumbai-Ahmedabad high speed rail, etc. were cited as providing opportunities for Japanese
investment in Indian infrastructure projects. Respondents also highlighted the spinoffs from such investments in
terms of the opportunities created for Indian firms to engage in related areas such as IT-ITeS and professional
services. Some respondents also noted that Japanese engineering services firms can benefit from the demand for
services from reputed companies such as Maruti Suzuki, Honda, Munjal Dowa, Tricolite which are already present in
the Indian market. Such backward linkages with existing Japanese companies in the manufacturing sector, provide
bilateral opportunities to both Indian and Japanese engineering services firms.
The non-Japanese companies based in India which are interested in engaging with the Japanese market cited India’s
skilled labour force and lack of same in Japan as one of the main drivers of bilateral engagement. This demographic
complementarity as well as incentives by the Japanese Government to invest overseas and to diversify to new
markets were considered to be moderately significant factors in enabling bilateral relations in engineering services.
b) Key Barriers
Within the engineering services the Japanese companies ranked cultural barriers and differences in the ways of doing
business and language as highly significant barriers to bilateral relations in this sector. Immigration Policies such as
long timelines, cumbersome processes and procedural requirements, difficulties in getting visas for dependents and
multiple entry, lack of transparency in visa issuance; infrastructural issues in terms of erratic power supply,
insufficient bandwidth, and poor network connectivity; and lack of domain expertise in potential employees were
79 Japan-India trade in engineering services is present in corridor projects – Delhi Mumbai industrial corridor, SMART cities – primarily in theinfrastructure sectors.
97
seen as moderately significant barriers by a majority of Japanese companies. Regulatory and institutional constraints
in India were viewed as moderately significant barriers by these respondents. There was a lack of consensus
regarding investment conditions (such as Local Content Requirements in government contracts or requirements
pertaining to Commercial presence or dependence on local partners -JVs etc.). The latter were rated by some
respondents as moderately significant and by others as highly significant barriers to trade. Dependence on a local
partner was seen as important for addressing cultural and linguistic barriers. Views were similarly mixed in case of
barriers such as complexity of labor regulations (MRA, Accreditation and licensing requirements, local employment,
rigid labor laws) and lack of transparency in competitive bids for projects (public procurement).
One of the issues highlighted by a respondent who has worked with a Japanese firm was about attrition rates in
India, in addition to problems with finding the right skill sets. The respondent noted that while Japanese companies
are known for investing in their employees, the high attrition rate in India makes it difficult for them to incur training
costs. Nevertheless, as Japanese employers recognize the quality of engineers from IITs, they regularly recruit
students from these institutions, but attrition imposes high costs on them. Firms also mentioned challenges which
arise due to uncertainties with government regulations, approvals and permits which often derail their planned
milestones in India. One of the firms, also pointed out that infrastructural issues relating to electricity, road and
transportation pose a challenge for Japanese firms looking to expand their business in India. Hence, in order to
create a better ecosystem and attract investments from Japan to India, both physical and IT infrastructure have to be
raised to global standards.
According to the non-Japanese companies in the sample, their main constraints to doing business in Japan relate to
investment barriers (such as high cost of real estate in Japan, local content requirement norms in Japan or
requirements pertaining to commercial presence or dependency on local partners -JVs, etc.) and inadequate
availability of cost-effective and skilled labour. Other relatively less significant factors include language barriers and
lack of transparency in competitive bids for projects (public procurement) and complexity of labour regulations.
Issues pertaining to immigration were however, not considered very significant barriers. For engineering services
(based in India) venturing into the Japanese market, access to credit was also cited as a key challenge.
c) Way Forward and Role of CEPA
All respondents were appreciative of the CEPA and perceived it to be of significance for improving bilateral relations
in services. It was mentioned that the CEPA provides for lower tariffs on machinery imports from Japan, which in turn
enables innovations in production techniques, a significant reduction in production costs, and opportunities for
collaboration in engineering services. The interviewees noted that the CEPA can help India’s engineering
professionals to collaborate with Japanese companies and to technologically upgrade themselves, which would be
beneficial to both countries. A cost-effective, skilled work force in the automotive industry can help lower production
costs, to the benefit of both Indian and Japanese firms. The provisions for reduced tariffs and liberal market access
for FDI under the CEPA, allows companies to set up easily in India and use the Indian work force efficiently. The CEPA
is believed to have aided India in developing stronger trade relations Japan and using this to create a congenial
business environment in India for MNCs from Japan. By promoting the operations of Japanese firms in India, the
CEPA is seen as enhancing employment opportunities in India and Japan for Indian engineers.
It was, however, pointed out that the level of awareness about CEPA and its provisions is currently very limited in
industry on both sides. There is also a lack of information and awareness among companies and other major
stakeholders about each other’s markets. Therefore, there need to be more efforts on the part of both the
governments to reach out to industry through orientation sessions, training and seminars, to disseminate
information about the CEPA and opportunities created by this agreement. Further, as many of these firms are
involved in automotive-related engineering services, respondents also suggested the need to lower tariffs on auto
parts to confer a price advantage to both the countries.
From a forward-looking perspective, many respondents highlighted the importance of diversifying the nature of
engagement to include more SMEs. As most of the big Japanese companies have already made inroads in India, it
was felt that the CEPA should be leveraged to motivate Japanese SMEs to explore the Indian market. Given rising
incomes in India and the shrinking economy in Japan with its ageing population, Japanese SMEs would have an
incentive to invest in India. Such investments are currently constrained by a lack of awareness amongst them about
the Indian market, its tax system, laws and regulations, and how to do business in India. Future discussions on CEPA
could address provisions specifically targeting SME engagement and investments by Japanese SMEs in India. This
would require the industry bodies and relevant government ministries to engage with SMEs through seminars and
workshops about the CEPA and for the governments to provide them with incentives to invest in India. Several Indian
98
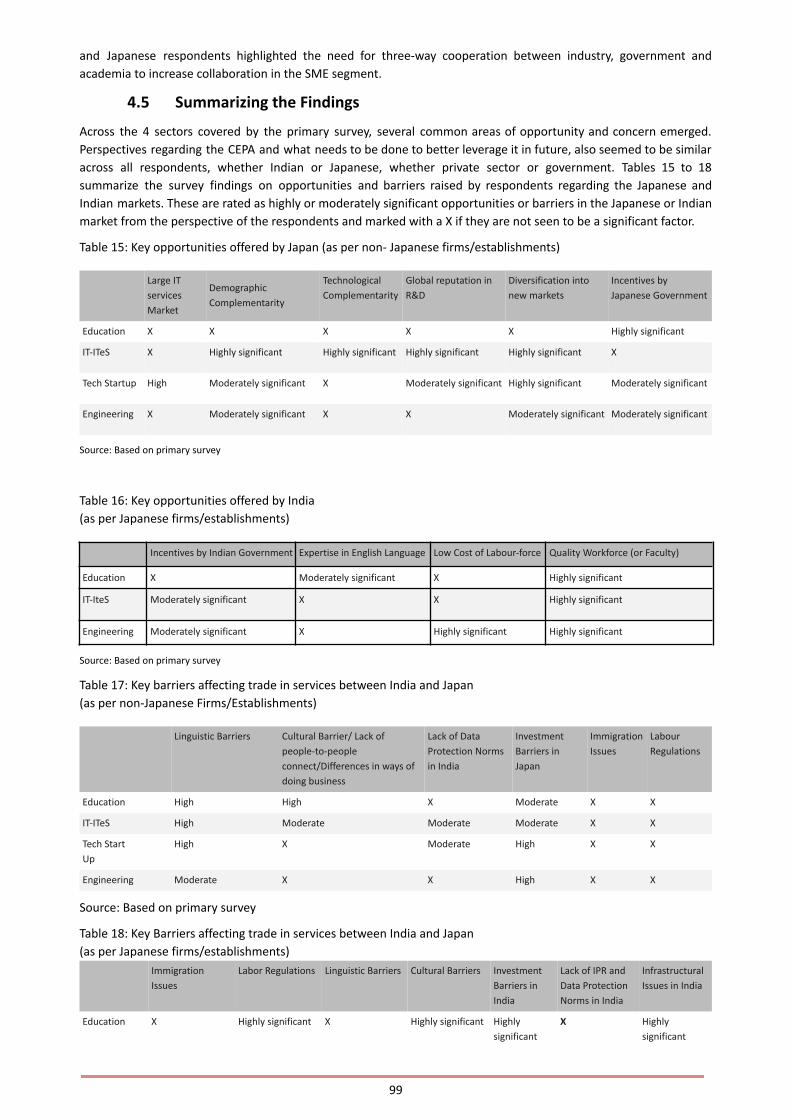
and Japanese respondents highlighted the need for three-way cooperation between industry, government and
academia to increase collaboration in the SME segment.
4.5 Summarizing the Findings
Across the 4 sectors covered by the primary survey, several common areas of opportunity and concern emerged.
Perspectives regarding the CEPA and what needs to be done to better leverage it in future, also seemed to be similar
across all respondents, whether Indian or Japanese, whether private sector or government. Tables 15 to 18
summarize the survey findings on opportunities and barriers raised by respondents regarding the Japanese and
Indian markets. These are rated as highly or moderately significant opportunities or barriers in the Japanese or Indian
market from the perspective of the respondents and marked with a X if they are not seen to be a significant factor.
Table 15: Key opportunities offered by Japan (as per non- Japanese firms/establishments)
Large IT
services
Market
Demographic
Complementarity
Technological
Complementarity
Global reputation in
R&D
Diversification into
new markets
Incentives by
Japanese Government
Education X X X X X Highly significant
IT-ITeS X Highly significant Highly significant Highly significant Highly significant X
Tech Startup High Moderately significant X Moderately significant Highly significant Moderately significant
Engineering X Moderately significant X X Moderately significant Moderately significant
Source: Based on primary survey
Table 16: Key opportunities offered by India
(as per Japanese firms/establishments)
Incentives by Indian Government Expertise in English Language Low Cost of Labour-force Quality Workforce (or Faculty)
Education X Moderately significant X Highly significant
IT-IteS Moderately significant X X Highly significant
Engineering Moderately significant X Highly significant Highly significant
Source: Based on primary survey
Table 17: Key barriers affecting trade in services between India and Japan
(as per non-Japanese Firms/Establishments)
Linguistic Barriers Cultural Barrier/ Lack of
people-to-people
connect/Differences in ways of
doing business
Lack of Data
Protection Norms
in India
Investment
Barriers in
Japan
Immigration
Issues
Labour
Regulations
Education High High X Moderate X X
IT-ITeS High Moderate Moderate Moderate X X
Tech Start
Up
High X Moderate High X X
Engineering Moderate X X High X X
Source: Based on primary survey
Table 18: Key Barriers affecting trade in services between India and Japan
(as per Japanese firms/establishments)
Immigration
Issues
Labor Regulations Linguistic Barriers Cultural Barriers Investment
Barriers in
India
Lack of IPR and
Data Protection
Norms in India
Infrastructural
Issues in India
Education X Highly significant X Highly significant Highly
significant
X Highly
significant
99
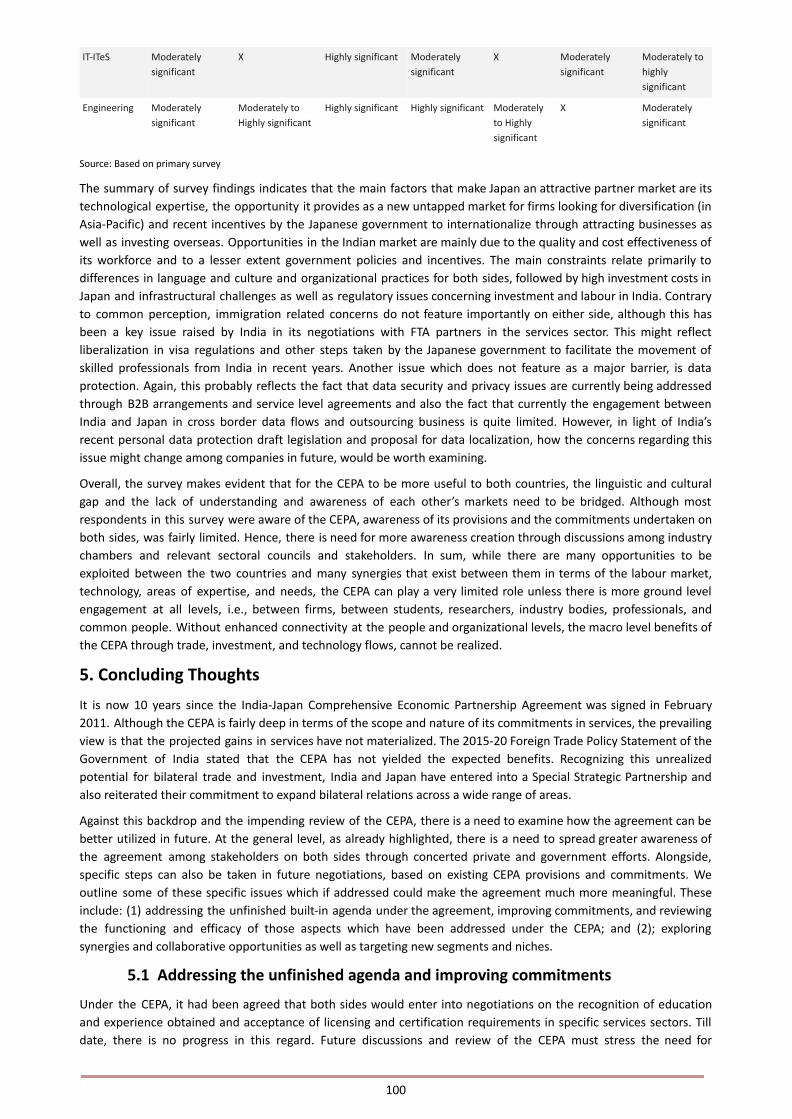
IT-ITeS Moderately
significant
X Highly significant Moderately
significant
X Moderately
significant
Moderately to
highly
significant
Engineering Moderately
significant
Moderately to
Highly significant
Highly significant Highly significant Moderately
to Highly
significant
X Moderately
significant
Source: Based on primary survey
The summary of survey findings indicates that the main factors that make Japan an attractive partner market are its
technological expertise, the opportunity it provides as a new untapped market for firms looking for diversification (in
Asia-Pacific) and recent incentives by the Japanese government to internationalize through attracting businesses as
well as investing overseas. Opportunities in the Indian market are mainly due to the quality and cost effectiveness of
its workforce and to a lesser extent government policies and incentives. The main constraints relate primarily to
differences in language and culture and organizational practices for both sides, followed by high investment costs in
Japan and infrastructural challenges as well as regulatory issues concerning investment and labour in India. Contrary
to common perception, immigration related concerns do not feature importantly on either side, although this has
been a key issue raised by India in its negotiations with FTA partners in the services sector. This might reflect
liberalization in visa regulations and other steps taken by the Japanese government to facilitate the movement of
skilled professionals from India in recent years. Another issue which does not feature as a major barrier, is data
protection. Again, this probably reflects the fact that data security and privacy issues are currently being addressed
through B2B arrangements and service level agreements and also the fact that currently the engagement between
India and Japan in cross border data flows and outsourcing business is quite limited. However, in light of India’s
recent personal data protection draft legislation and proposal for data localization, how the concerns regarding this
issue might change among companies in future, would be worth examining.
Overall, the survey makes evident that for the CEPA to be more useful to both countries, the linguistic and cultural
gap and the lack of understanding and awareness of each other’s markets need to be bridged. Although most
respondents in this survey were aware of the CEPA, awareness of its provisions and the commitments undertaken on
both sides, was fairly limited. Hence, there is need for more awareness creation through discussions among industry
chambers and relevant sectoral councils and stakeholders. In sum, while there are many opportunities to be
exploited between the two countries and many synergies that exist between them in terms of the labour market,
technology, areas of expertise, and needs, the CEPA can play a very limited role unless there is more ground level
engagement at all levels, i.e., between firms, between students, researchers, industry bodies, professionals, and
common people. Without enhanced connectivity at the people and organizational levels, the macro level benefits of
the CEPA through trade, investment, and technology flows, cannot be realized.
5. Concluding Thoughts
It is now 10 years since the India-Japan Comprehensive Economic Partnership Agreement was signed in February
2011. Although the CEPA is fairly deep in terms of the scope and nature of its commitments in services, the prevailing
view is that the projected gains in services have not materialized. The 2015-20 Foreign Trade Policy Statement of the
Government of India stated that the CEPA has not yielded the expected benefits. Recognizing this unrealized
potential for bilateral trade and investment, India and Japan have entered into a Special Strategic Partnership and
also reiterated their commitment to expand bilateral relations across a wide range of areas.
Against this backdrop and the impending review of the CEPA, there is a need to examine how the agreement can be
better utilized in future. At the general level, as already highlighted, there is a need to spread greater awareness of
the agreement among stakeholders on both sides through concerted private and government efforts. Alongside,
specific steps can also be taken in future negotiations, based on existing CEPA provisions and commitments. We
outline some of these specific issues which if addressed could make the agreement much more meaningful. These
include: (1) addressing the unfinished built-in agenda under the agreement, improving commitments, and reviewing
the functioning and efficacy of those aspects which have been addressed under the CEPA; and (2); exploring
synergies and collaborative opportunities as well as targeting new segments and niches.
5.1 Addressing the unfinished agenda and improving commitments
Under the CEPA, it had been agreed that both sides would enter into negotiations on the recognition of education
and experience obtained and acceptance of licensing and certification requirements in specific services sectors. Till
date, there is no progress in this regard. Future discussions and review of the CEPA must stress the need for
100

respective professional bodies to negotiate and conclude such arrangements for mutual recognition of qualifications
or experience, even if only in a limited way within specific services where there is mutual interest.
There is also an understanding under the CEPA to negotiate the acceptance of Indian qualified nurses and care
workers and to conclude an arrangement within two years after entry into force of agreement. Given the
demographic complementarity between the two countries, mobility of nurses and caregivers should be pursued in
mutual interest. However, not much progress has been made on this issue. The experience of other countries such
as Vietnam, Philippines and Indonesia which have such an arrangement with Japan suggests that even if India were
to conclude this arrangement with Japan, very few nurses are likely to move given the high costs involved. This is
because under the current arrangements, selected candidates are required to go to Japan and take tests in language
proficiency and nursing. To enable more health workers to avail of the opportunities, alternative approaches should
be tried, such as setting up training facilities in India and administering the tests and selection process in India, to
reduce the cost and uncertainty involved. Such steps can be taken under the Cooperation provisions of the CEPA and
would help in building human resource capacity in the health sector.
The CEPA has an in-built agenda to try and reduce requirements to establish or maintain some form of commercial
presence in order to enter the partner’s market or to provide services through mode 1. Provisions in the CEPA call for
both sides to show more flexibility in reducing commercial presence requirements attached to modes 1 and 4. In this
regard, a review of the agreement could focus on removing such limitations and liberalizing commitments in mode 4.
As is evident from the survey findings, visa related procedural requirements and delays are not seen as a major
impediment to doing business. Given the existing provisions in Annex 7 on Movement of Natural Persons address the
movement of certain categories of service providers such as business visitors and intracorporate transferees), future
discussions could aim at improving the quality of the sector-specific commitments in mode 4 to target the
aforementioned categories as well as specific types of skilled professionals that are of mutual interest in the
concerned sector (IT programmers, data analysts, web designers, etc.) and persons occupied in critical shortage areas
(nursing, caregiving, occupational trades). The chapter on cooperation can be used to address issues of recognition,
credentialing, equivalence, training, etc. which would be needed to facilitate such movement. Likewise,
commitments in mode 3 can be improved in future discussions to address investment barriers which are perceived as
being moderately or highly significant in the 4 selected sectors. This could involve a review of the inscribed
limitations, a comparison of the commitments with the existing autonomous investment regime and trying to bridge
the gap between autonomous policies and the commitments, at a minimum.
Another specific issue that could be pursued is that of reciprocal access to each other’s government procurement
market in a selected manner, starting possibly with the IT services sector. Although India is not a signatory to the
Government Procurement Agreement, the Indian government could consider seeking access to Japan’s government
market in the IT and IT-enabled services sector based on Article 114 on Non-Discrimination of the India-Japan CEPA.
The latter Article states that adequate opportunity would be given to a party (India), if the latter so requests, to enter
into negotiation on any advantageous treatment concerning measures on government procurement, including access
to the partner’s (Japan’s) government procurement market with a view to extending such advantageous treatment to
the party on a reciprocal basis. Under the CPTPP Japan has extended GPA access to other countries like Malaysia and
Vietnam who are not members of the GPA. The same could be considered under the CEPA, in a limited manner,
starting with the IT-ITeS sector. This could greatly benefit Indian IT and BPO companies by providing them access not
only to Japan’s government procurement market but also to Japanese companies due to the associated recognition
and acceptance once they can secure a government contract in Japan.80
5.2 Exploring synergies, collaborative opportunities, and new export segments
There are several ongoing initiatives where there is scope for collaboration between the two countries. The
cooperation provisions under CEPA could be utilized to further such collaborative ventures. For example, under the
“Make in India” initiative, the two countries could enter into strategic collaboration in areas like IoT and robotics,
which would synergize Japan’s expertise in advanced technologies with India’s attempts to upgrade its manufacturing
sector. This could be facilitated through the establishment of research centres or consortia.
Likewise, synergies can be explored in the start-up segment, through funding initiatives and tie-ups between
companies and funding partners in the two countries. India’s Smart Cities initiative can benefit from Japanese
80 It is to be noted that respondents were sceptical about the public procurement provision in the CEPA for securing access to Japan’s governmentprocurement market. They noted that Japanese government tends to support Japanese firms and it may be more pragmatic to enter intolong-term strategic collaboration with Japanese firms to avail of government incentives. Further, one respondent noted that the process of biddingfor government projects often requires proficiency in Japanese, which impedes access to government contracts.
101

expertise in urban planning and management. Existing working groups and forums, such as the India-Japan Working
Group on IT, the India-Japan IT Forum in Japan, and the NASSCOM-Japan Council in India can be leveraged for
promoting cooperation through training programmes, internships, outsourcing of work by Japanese clients, and the
branding of Indian IT companies in Japan. In the education sector, introduction of scholarships, study programmes,
and faculty and student exchange schemes with government support on both sides, can enhance the
people-to-people connect which is currently very limited. In particular, language and cultural training programmes
and courses can help reduce the divide between the two countries. More cooperation in the education sector can
have spinoffs in many other sectors.
The discussions also indicated the possibilities for diversifying the kinds of Japanese companies doing business in
India. In particular, one segment which could be targeted is SMEs. The share of SMEs among all Japanese companies
present in other Asian countries is higher than in the case of India. Increasing their presence in India would require
promoting awareness among Japanese SMEs and providing them with a dedicated source of information on doing
business in India and facilitating their operations in India.
Future CEPA discussions could also consider synergies between the goods and services provisions and commitments
under the agreement given growing servicification opportunities in manufacturing. For instance, synergies between
India’s capabilities in IT and other professional services and Japan’s capabilities in automotive, electronics, and
engineering goods and linkages between the services and goods chapters of the agreement could be addressed in
future CEPA discussions. Similarly, the synergies between the investment and services provisions and commitments
under the agreement also need to be addressed as there are many potential linkages between investment flows in
both goods and services and services trade prospects.
There are also certain export opportunities that India could explore in the Japanese market. These include traditional
health practitioners, yoga trainers, English teachers. Issues of certification, recognition, and visa facilitation would
need to be addressed. The chapter on cooperation and the provisions of Chapter 7 on Movement of Natural Persons
would provide the basis for these discussions.
5.3 Selected Areas for Action
There are many areas where steps can be taken to push the bilateral agenda forward. Some of these action points
can be pursued under the CEPA while others may need to be taken up in avenues outside the agreement in various
consultative forums by both governments, industry associations, companies, and academic institutions. Some
selected areas for action are provided in this section.
Address data gaps in services trade and investment
Bilateral trade data is not available readily from official sources which makes it difficult to have evidence-based policy
making. A mechanism should be in place to systematically collect, discuss and publish bilateral data in English and
Japanese. The cooperation chapter in the CEPA and the provisions for regulatory cooperation in the services chapter,
can be a starting point.
Create financing schemes
Scholarships, loans, and other financing mechanisms should be created to facilitate the movement of students from
India to Japan. Both the cooperation chapter in the CEPA and existing agreements on academic exchange and
cooperation provide a basis for such steps.
Overcome linguistic and cultural barriers and promote awareness
Enhancing people-to-people connect through language training and cultural exposure is critical to promoting bilateral
relations. For this purpose, priority has to be given to establishing more language training centres in universities and
dedicated Japanese language training facilities in Indian companies. To incentivize enrolment in such
programs/courses, internships or exchange visits can be introduced to provide more exposure to Indian students and
teachers learning Japanese. The cooperation chapter in the CEPA as well as the existing bilateral agreements and
MoUs provide the basis for bridging linguistic and cultural barriers. Industry associations such as NASSCOM could
promote the setting up of such language training institutes and dedicated centres to overcome linguistic and cultural
barriers that currently affect Indian IT services exports to Japan. Cultural and general awareness workshops could be
organized by industry bodies, particularly in the IT-ITeS sector to help companies understand each other’s values,
ways of doing business, and competencies and to disseminate information about companies which have successfully
navigated each other’s market.
102

Address data protection related concerns
Given the evolving nature of India’s data protection regulations, this issue will have to be addressed through more
discussions between NASSCOM, Japanese companies and Indian IT companies. The approach should be to devise a
B2B instrument which certifies the data secure status of the Indian service provider based on a set of criteria that is
mutually agreed upon.
Explore post-Covid opportunities
Apart from the selected action areas above to address immediate challenges, there is also a need to take a strategic
medium to long term view of bilateral relations, especially post-Covid. Both countries have already entered into “The
India-Japan Special Strategic and Global Partnership” which aims to develop new technologies and solutions for a
post-Covid world. This includes de-coupling Japanese firms from China and relocating their supply chains to other81
countries. This creates an opportunity for India to position itself as an investment destination for Japanese
companies, with associated implications for bilateral engagement in services such as financial, IT, business support
and distribution services.
Explore geo-strategic opportunities
Another area for forging a longer-term strategic partnership post-Covid is healthcare related research and
development for pharmaceuticals, medical devices and technologies, and new technologies for healthcare delivery
and management. From a longer-term geostrategic perspective, there are opportunities for collaboration between
the two countries in third countries, especially in Africa, to counter China’s Belt Road Initiative. The complementary
expertise of Japan and India in manufacturing and services, respectively, can be leveraged for development purposes
in these other regions, particularly in the areas of infrastructure and connectivity where services such as ICT,
engineering, and construction would play an important role.82
5.4 Summing up
This report has highlighted the many opportunities that can be exploited between India and Japan and the many
complementarities that exist between the two countries in terms of the labour market, technology, areas of
expertise, and market needs. Both the secondary and the primary evidence have highlighted these opportunity areas
across a range of services. However, it is also evident that the CEPA and the services commitments and provision
under this agreement have thus far played only a limited role in enabling these opportunities. This is because a
ground level engagement and understanding between firms, between students, researchers, industry bodies,
professionals, and common people is still lacking. Basic issues of language, culture, organizational practices, and
mindset remain obstacles to expanding bilateral relations.
A key takeaway from this study is that without enhanced connectivity and understanding at the level of people and
organizations, the macro level benefits of the CEPA in terms of trade, investment, and technology flows, will be
difficult to realize. The macroeconomic outcomes of trade agreements ultimately rest on micro level factors. Hence,
private sector and government on both sides have to invest more in building trust and in creating greater awareness
of each other’s competencies and complementarities.
References
● Chanda, R. and S. Ghosh (2019a), “India’s Integration in Services with Asian FTA Partners”, in D. Mukherjee (ed.) Economic Integration in Asia:
Key Prospects and Challenges with the RCEP, Routledge, pp. 117-43
● ---- (2019b), “Trends, Opportunities and Challenges in India’s Service Sector”, in U. Kapila (ed.), Indian Economy-II: Macroeconomic Policies,
Sectoral Developments and Performance, Academic Foundation, pp. 497-536
● ----, Impact Analysis of India’s Free Trade Agreement. Research Project for the Department of Economic Affairs, Ministry of Finance,
Government of India. New Delhi, 2014
● Chaudhry, Divya, Priyanka Tomar and Pallavi Joshi (2018), “Deconstructing Indian Overseas Foreign Direct Investments: Historical &
Contemporary Trends”, Oxfam Discussion Paper
● Department of Industrial Policy and Promotion (2018), Ministry of Commerce and Industry, Fact Sheet on Foreign Direct Investment (FDI), New
Delhi: Government of India, 2018
● ----(2017), Ministry of Commerce and Industry. Consolidated FDI Policy. New Delhi: Government of India
● --- (2016), Ministry of Commerce and Industry, India, FDI Synopsis Report, New Delhi: Government of India
82 https://www.jetro.go.jp/newsletter/ind/2020/africa.pdf and https://www.livemint.com/Politics/gfSbaVJjfHuoUKPTMxrU8L/IndiaJapan-partnership-to-play-key-role-in-AsiaAfrica-corr.html
81 [ https://indiaincgroup.com/the-pandemic-may-open-new-doors-for-india-japan-ties-india-global-business/]
103
● Export-Import Bank of India (2014), “Outward Direct Investment from India: Trends, Objectives and Policy Perspectives”, Occasional Paper No.
165
● Government of Japan (2019), Annual Report on National Accounts for 2018 Summary,
http://nielit.gov.in/sites/default/files/INT_MoU_Japan.pdf)ps://atradius.ca/reports/market-monitor-ict-japan-2019.html
● Hurun Global Unicorn List (2019)
● India Brand Equity Foundation (2018), “Indian Investment Abroad - Overseas Direct Investment by Indian Companies”,
https://www.ibef.org/economy/indian-investments-abroad (accessed November 14, 2018)
● IBEF (2018), Report on Education and Training Industry in India
● IBEF (2020), Report on Education and Training Industry in India,
● https://www.ibef.org/industry/education-sector-india.aspx
● NASSCOM (2019), “Indian Tech-Start Up Ecosystem”
● Japan Bank for International Cooperation (JBIC) (2019), Survey Report on Overseas Business Operations by Japanese Manufacturing Companies
● Japan’s Outward FDI, 2018, https://www.statista.com/statistics/742748/japan-outward-fdi-by-industry
● Japanese Investors in India Report 2019, Datalabs by Inc42
● JETRO statistics, https://www.jetro.go.jp/en/reports/statistics/
● JETRO, Ministry of Finance, Japan (release date December 2019)
● Ministry of Commerce, Government of India, India-Japan CEPA, https://commerce.gov.in/PageContent.aspx?Id=137
● MOSPI, Govt of India,
http://www.mospi.gov.in/sites/default/files/reports_and_publication/statistical_publication/National_Accounts/NAS19/s1.6Ar.pdf
● OECD Statistics, https://stats.oecd.org/Index.aspx?datasetcode=TIVA_2018_C1 (Accessed 7 April 2020)
● RBI (various years). Handbook of Statistics on Indian Economy. Mumbai: Reserve Bank of India (RBI)
RBI Annual Report (various years).
● https://www.rbi.org.in/Scripts/AnnualReportPublications.aspx?Id=1249
● RBI (2018), RBI Survey on Computer Software and ITeS Exports
● --- (2017) Survey on Computer Software & Information Technology Enabled Services Exports: 2016-17. Mumbai: Reserve Bank of India.
● Reserve Bank of India (various years) Handbook of Statistics on Indian Economy. Mumbai: Reserve Bank of India.
● Roy, M. and R. Chanda, “Trends in FDI Flows from Japan to India”, Working Paper No.1, India Japan Study Centre, IIM Bangalore, May 2019
● https://www.iimb.ac.in/sites/default/files/inline-files/ijsc-fdi-report-2019.pdf
● Seshadri VS (2016) India-Japan CEPA: An appraisal. New Delhi: ASEAN-India Centre at Research and Information System for Developing
Countries.
● Tracxn Report, 2019, https://tracxn.com/
UNCTAD Statistics
● https://unctadstat.unctad.org/CountryProfile/GeneralProfile/en-GB/392/index.html (accessed April 22, 2020)
● https://unctadstat.unctad.org/CountryProfile/GeneralProfile/en-GB/356/index.html (accessed April 22, 2020)
● http://unctadstat.unctad.org/wds/ReportFolders/reportFolders.aspx?sCS_ChosenLang=en (accessed October 1, 2018)
● UNCTAD, World Investment Report, 2019
● https://unctad.org/en/Pages/DIAE/World%20Investment%20Report/World_Investment_Report.aspx
● ----, World Investment Report, 2019, India Fact Sheet
● https://unctad.org/sections/dite_dir/docs/wir2019/wir19_fs_in_en.pdf
● ----, World Investment Report, 2019, Japan Fact Sheet
● https://unctad.org/sections/dite_dir/docs/wir2019/wir19_fs_jp_en.pdf
● ----, World Trade and Development Report, 2019
● World Bank, World Integrated Trade Solutions
● https://wits.worldbank.org/wits/wits/witshelp/Content/Utilities/e1.trade_indicators.html
● https://wits.worldbank.org/CountryProfile/en/Country/IND/StartYear/1988/EndYear/2018/TradeFlow/Export/Indicator/XPRT-TRD-VL/Partner/J
PN/Product/Total
● WTO, World Trade Report, Geneva, 2019
Miscellaneous data links
● http://www.worldstopexports.com/japans-exported-services/
● https://data.oecd.org/pop/working-age-population.html.
● https://data.worldbank.org/indicator/BX.GSR.CCIS.ZS (accessed November 30, 2018)
● https://www.esri.cao.go.jp/en/sna/data/kakuhou/files/2018/pdf/point_flow_en_20191226.pdf
● https://www.rbi.org.in/Scripts/BS_ViewBulleeting.aspx?=Id=17425 (accessed May 4, 2019)
● https://read.oecd-ilibrary.org/education/education-at-a-glance-2017_eag-2017-en#page221
Miscellaneous article links
● http://friendship.iith.ac.in/
● https://economictimes.indiatimes.com/news/economy/foreign-trade/india-japan-trade-ministers-discuss-review-of-cepa-ahead-of-pms-meet/
articleshow/72458688.cms?utm_source=contentofinterest&utm_medium=text&utm_campaign=cppst
● https://pib.gov.in/newsite/PrintRelease.aspx?relid=184461
● https://sagri.co/sagri-finance/
● https://tech.eu/features/24647/the-rise-of-deep-tech-startups-in-japan-and-why-european-companies-should-take-note/
● https://www.dfat.gov.au/geo/india/ies/chapter-3.html
● https://www.ibef.org/industry/education-sector-india.aspx
104
● https://www.in.emb-japan.go.jp/PDF/2018_co_list_en_pr.pdf
● https://www.indembassy-tokyo.gov.in/pdf/Newsletter_June_2019_Issue_6_English_July08.pdf
● https://www.japantimes.co.jp/news/2018/10/22/national/government-aims-300000-international-students/#.XqspJ2gzbIU
● https://www.marutisuzuki.com/corporate/media/press-releases/2020/iit-guwahati-aots-japan-suzuki-motor-corporation-and-maruti-suzuki-in
dia-limited-sign-memorandum)
● https://www.mext.go.jp/en/policy/education/lawandplan/title01/detail01/sdetail01/1373805.html
● https://www.nytimes.com/2019/12/24/world/asia/japan-birthrate-shrink.html)
● https://yourstory.com/2019/02/ai-healthcare-startup-niramai-funding
● https://www.newindianexpress.com/business/2019/apr/02/infosys-forms-joint-venture-with-hitachi-pasona-and-panasonic-1958981
● https://www.hipus.com
● https://www.mki.co.jp/english/
● https://www.techmahindra.com/en-in/tech_mahindra_and_mki_collaborate_to_develop_next_gen_digital_enterprise_solutions_for_japanese
_market/
● ttps://www.business-standard.com/article/pti-stories/tech-mahindra-partners-mitsui-knowlegde-to-develop-digital-solutions-for-japanese-mar
ket-119052801326_1.html
● https://www.meti.go.jp/english/policy/economy/startup_nbp/startup_visa.html#:~:text=What%20is%20the%20%E2%80%9CStartup%20Visa,c
ategory%20of%20%E2%80%9Cbusiness%20manager%E2%80%9D.&text=When%20you%20take%20advantage%20of,before%20the%20require
ments%20are%20met
● http://hanko-seal.com/archives/4847#:~:text=There%20are%20dozens%20of%20consumer,students%20with%20permanent%20resident%20st
atus.&text=No%20bank%20accepts%20applications%20from%20foreign%20students
● https://indiaincgroup.com/the-pandemic-may-open-new-doors-for-india-japan-ties-india-global-business/
● https://www.jetro.go.jp/newsletter/ind/2020/africa.pdf and
● https://www.livemint.com/Politics/gfSbaVJjfHuoUKPTMxrU8L/IndiaJapan-partnership-to-play-key-role-in-AsiaAfrica-corr.html
● https://mea.gov.in/bilateral-documents.htm?dtl/30542/List_of_AnnouncementsAgreements_signed_between_India_and_Japan_during_visit_
of_Prime_Minister_to_Japan
List of Tables● Table 1: Composition of India’s services exports and RCAs by broad segments
● Table 2: Composition of Japan’s services exports and RCAs by broad segments
● Table 3: Composition of Japan’s other services exports,
● Table 4: India’s Trade in Services with Japan
● Table 5: India’s Trade with Japan in selected service sectors
● Table 6: Significance in each other’s exports and imports of services
● Table 7: Composition of India’s Outward FDI approvals and equity in the services sector
● Table 8: Japanese outward FDI by industry
● Table 9: Composition of Japan’s outward FDI in services
● Table 10: Sector wise distribution of FDI inflows from Japan to India
● Table 11: Sectoral coverage of commitments by India and selected partners under various FTAs
● Table 12: No. of Sectors Committed within each Sector
● Table 13: Commitments in India-Japan CEPA in selected sectors
● Table 14: Distribution of respondents across sectors
● Table 15: Key opportunities offered by Japan
● Table 16: Key opportunities offered by India
● Table 17: Key barriers affecting trade in services between India and Japan
● Table 18: Key Barriers affecting trade in services between India and Japan
List of Figures● Figure 1: CAGR for Services Exports for Leading Services Exporters
● Figure 2: India's average annual growth rate of goods and services exports
● Figure 3: India’s RCAs in goods versus services
● Figure 4: India’s share in world services exports and imports
● Figure 5: India’s RCAs for selected categories of other services exports
● Figure 6: Japan’s average annual growth rate of goods and services exports
● Figure 7: Japan’s RCAs in goods and services exports
● Figure 8: Japan’s share in world exports of goods and services
● Figure 9: Japan’s share in world services exports and imports
● Figure 10: Japan’s RCAs in select categories of other services
● Figure 11: Composition of India’s inward FDI in services
● Figure 12: Composition of Japan’s inward services FDI
● Figure 13: ICT service exports
List of Boxes● Box 1: Existing Bilateral Education and R&D Initiatives between India and Japan
● Box 2: Sagri Co. Ltd.- Startup in Microfinance for farmers
105

Appendices
Appendix A
India – Japan Comprehensive Economic Partnership Agreement (CEPA)
In October 2010, a Joint Declaration was signed on the conclusion of the India-Japan CEPA negotiations. The
agreement was signed in February 2011 and came into effect in August 2011.
The CEPA aimed to establish a framework that is conducive to doing business between the two countries. To facilitate
trade in services, the agreement specified that both countries will abide by the 'National Treatment’ (treat the
service providers of the other country no less favorably than their own) and 'Most Favored Nation' Clauses (any
agreement signed by either of the countries would not be any more favorable than this agreement signed by them).
The agreement includes a chapter on Movement of Natural Persons, with commitments to facilitate the temporary
movement of service providers between the two countries based on transparent criteria & streamlined procedures.
Under the CEPA, both countries have agreed to grant temporary entry and provide a work permit to the spouse and
dependents of "intra-corporate transferees, contractual service suppliers and independent professionals qualifying
for temporary entry", conditional upon the dependents’ compliance with the immigration measures as well as
meeting the qualifications for employment. The CEPA also calls for the formation of a sub-committee on ‘trade in
services’ which would review the implementation of the services chapter and exchange information on domestic
laws and regulations. The countries have agreed that there will be no restrictions on international transfers and
payments for current transactions in services where they have made specific commitments.
As part of the in-built agenda, the CEPA has provisions requiring both countries to enter into negotiations regarding
the recognition of education, experience, licensing and certification requirements in specific services sectors, with a
view to concluding mutual recognition agreements within three years after the entry into force of the Agreement.
The CEPA also suggests instituting administrative or judicial tribunals or procedures for the review and remedies in
case of grievances by services suppliers. In the case of investment, the agreement requires each country to treat the
investors from the other country with all fairness and equity, along with providing them full protection and security in
their territory. It also forbids both countries from imposing performance requirements on investors from the other
country.
Appendix B
Selected Announcements/Agreements signed between India and Japan
(other than Academic/Scientific Exchange and Cooperation)
Name of the MOU/Agreement/Treaty Description
Digital and New Technologies
1MoC between Ministry of Electronics and Information Technology
and Ministry of Economy, Trade & Industry on Japan-India Digital
Partnership
To tap into the synergies and complementarities between Japan’s
"Society 5.0” and India’s flagship programmes like "Digital India”, "Smart
City” and "Start-up India” in areas of next generation technologies such
as Artificial Intelligence (AI), and IoT (Internet of Things), etc.
2 Statement of Intent between NITI Aayog and Ministry of Economy,
Trade & Industry (METI), Japan on Artificial Intelligence (AI)
To encourage and develop cooperation on Artificial Intelligence
technologies
Healthcare and Wellness
3 MoC between Ministry of Health and Family Welfare of Republic
of India and the Office of Healthcare Policy, Cabinet Secretariat,
Government of Japan and the Ministry of Health, Labour and
Welfare of Japan in the field of Healthcare and Wellness
To establish a mechanism to identify potential areas for collaboration
between India and Japan in common domains of primary healthcare,
prevention of non-communicable diseases, maternal and child health
services, sanitation, hygiene, nutrition and elderly care
4 MoC between The Ministry of AYUSH of Republic of India and the
Kanagawa Prefectural Government of Japan in the field of
Healthcare and Wellness
To promote and deepen mutual understanding and interaction between
India’s Traditional Medicine Systems like "Ayurveda & Yoga” and Japan’s
ME-BYO.
106

Economic
5 MoU between Export Credit Guarantee Corporation of India and
NEXI, Japan
For stimulating trade and investment between India and Japan and
strengthening cooperation in projects in third countries.
Postal
6 MOC in Postal Field between the Ministry of Communications,
Government of India and the Ministry of Internal Affairs and
Communications, Government of Japan.
To strengthen cooperation in postal field including through setting up of
Postal Services Dialogue between Ministry of Communications and
Ministry of Internal Affairs and Communications
Source: https://mea.gov.in/bilateral-documents.htm?dtl/30542/List_of_AnnouncementsAgreements_signed_between_India_and_
Japan_during_visit_of_Prime_Minister_to_Japan
Appendix C - Survey Questionnaires
● Education Services
● IT-ITeS
● Technology Start-Ups
● Engineering Services
Questionnaire: Education Services
SECTION I
1.Name and Address of the Institute/ University:
2.Year of Establishment:
3.Type of the University/ Institute: (Central/ State/ Deemed/ Private):
4.Degrees Offered: (Certificate Course, UG, PG, Integrated Master’s Degree, MPhil and PhD). Which of these degrees
attract majority of the exchange students (if any)?
5.Which of the following Courses are offered by the Institute/University: (Language, Engineering, Medical,
Management, Social Sciences, Physical Sciences, Arts and Literature)? Which of these courses attract majority of the
exchange students (if any)?
**If the institute/university is Indian, kindly proceed to Section II for further questions.
If the institute/university is Japanese, kindly proceed to Section III for further questions.
SECTION II
1. What is the mode of presence in the Japanese Market?
Mode Tick √ the relevant
option/options
University/Institute has a virtual education programme offered to students in Japan. 1
University/Institute students going to Japan for education/ Japanese students coming to India for education. 2
The University/ Institute has a campus in Japan. 3
Exchange of Indian and Japanese Professors and researchers for short periods. 4
2. What are some of the key barriers that affect export and import of education services between India and Japan?
Please rank them as ‘Not Significant’, ‘Moderately Significant’ and ‘Very Significant’. Please Indicate 'Not Applicable'
(N.A.) wherever the options seem non-relevant.
107

Barriers Not
Significant
Moderately
Significant
Very
Significant
Immigration Policies (Long timelines, Cumbersome processes and procedural requirements,
dependents/ spouses, multiple entry, and lack of transparency in visa issuance)
Non-recognition of degrees across countries/ Equivalence of degrees across countries
Language Barriers and Cultural Barriers
Lack of courses taught in English in Japan
Restrictions on electronically sharing educational material
Investment Barriers (Regulatory barriers or land acquisition issues or dependency on local partners)
Mismatch in Quality of curriculum, R&D, technology and laboratory facilities etc.
Lack of updated course content
Lack of awareness/ Lack of people to people connect
Others (Please Specify)
3.What are some of the opportunities offered by the Japanese Market in the education services sector? Please rank
them as ‘Not Significant’, ‘Moderately Significant’ and ‘Very Significant’. Please Indicate 'Not Applicable' (N.A.)
wherever the options seem non-relevant.
Not
Significant
Moderately
Significant
Very
Significant
Growth of private sector in education sector
Government incentives like scholarships
Quality and rankings of certain Japanese Universities/Institutes
Quality Faculty
Expertise in certain contemporary domains such as AI, IoT etc.
Global recognition in R&D and technology
Common historical traditions such as Buddhism and commitment to the ideals of democracy, tolerance,
pluralism and open society
Lower costs of education than Western counterparts
Others (Please Specify):
4.What is the perception of Indian Universities/ Institutes about the quality of Japanese educational Institutes?
SECTION III
1.What is the mode of presence in the Indian Market?
Mode Tick √ the relevant
option/options
University/Institute has a virtual education programme offered to students in India 1
University/Institute students going to India for education/ Indian students coming to Japan for education. 2
The University/ Institute has a campus in India. 3
Exchange of Indian and Japanese Professors and researchers for short periods. 4
2.What are some of the key barriers that affect export and import of education services between India and Japan?
Please rank them as ‘Not Significant’, ‘Moderately Significant’ and ‘Very Significant’. Please Indicate 'Not Applicable'
(N.A.) wherever the options seem non-relevant.
Barriers Not
Significant
Moderately
Significant
Very
Significant
108

Immigration Policies (Long timelines, Cumbersome processes and procedural requirements, dependents/
spouses, multiple entry, and lack of transparency in visa issuance)
Non-recognition of degrees across countries/ Equivalence of degrees across countries
Language Barriers and Cultural Barriers
Lack of courses taught in English in Japan
Restrictions on electronically sharing educational material
Investment Barriers (Regulatory barriers or land acquisition issues or dependency on local partners)
Mismatch in Quality of curriculum, R&D, technology and laboratory facilities etc.
Lack of updated course content
Infrastructural Facilities in India (International standards in Hostel, Mess, Classrooms, Disability-friendly
campus)
Lack of awareness / Lack of people-to-people interaction
Others (Please Specify)
3.What are some of the opportunities offered by the Indian Market in the education services sector? Please rank
them as ‘Not Significant’, ‘Moderately Significant’ and ‘Very Significant’. Please Indicate 'Not Applicable' (N.A.)
wherever the options seem non-relevant.
Not
Significant
Moderately
Significant
Very
Significant
Growth of private sector in education sector
Government incentives like scholarships
Quality and rankings of certain Indian Universities/Institutes
Quality Faculty
Expertise in certain contemporary domains such as AI, IoT etc.
Expertise in certain contemporary domains such as IT.
Proficiency in English
Common historical traditions such as Buddhism and commitment to the ideals of democracy, tolerance,
pluralism and open society
Others (Please Specify):
4.What is the perception of Indian Universities/ Institutes about the quality of Japanese educational Institutes?
SECTION IV
1.Are you aware of the existence of a CEPA (Comprehensive Economic Partnership Agreement) between India &
Japan?
2.Do you think such a bilateral agreement is important from the University’s/ Institute’s perspective of engaging with
India/Japan? Why or Why not?
3.Please list top three issues that you would like to be addressed by the CEPA to improve the relations between the
two countries in the educational services sector?
Questionnaire: IT and IT enabled Services
SECTION I
1.Company’s Name & Address:
109

2.Year of establishment:
3.Which are the industry verticals in which the company has presence?
**If the company is Indian, kindly proceed to Section II for further questions.
If the company is Japanese, kindly proceed to Section III for further questions.
SECTION II
1.What is the mode of presence of the firm in the Japanese Market?
Mode Tick √ the relevant
option/options
Off-shoring to/from Japan 1
Serving clients in Japan through Commercial Presence 3
Movement of intra-corporate transferees (Managers, Executives, Specialists), contractual service suppliers &
independent professionals across India and Japan
4
2.Year in which the company began operations in Japan through any of the above modes.
3.List the top 3 markets (countries) of the firm (by value of business done with overseas markets)
4.What rank does Japan hold as a client market? (by business done with overseas markets in this sector). (Top 10,
10-20, Above 20).
5.What are some of the key barriers that affect export and import of services with Japan? Please rank them as ‘Not
Significant’, ‘Moderately Significant’ and ‘Very Significant’. Please Indicate 'Not Applicable' (N.A.) wherever the
options seem non-relevant.
Not
Significant
Moderately
Significant
Very
Significant
Immigration Policies (Long timelines, Cumbersome processes and procedural requirements, dependents/
spouses, multiple entry visa, transparency in visa issuance)
Labor Regulations (Mutual Recognition Agreements, Accreditation and licensing requirements, local
employment, rigid labour laws)
Language Barriers
Cultural Barriers (Differences in ways of doing business)
Data Protection and IPR issues
Investment Barriers (High Cost of Real estate in Japan, Local Content Requirement norms in Japan or
requirements pertaining to Commercial presence or dependency on local partners -JVs etc.)
Competition from China and other South East Asian countries
Industrial Organization in Japan (Keiretsus)
Others (Please Specify):
6. What are some of the opportunities offered by the Japanese Market in the IT-ITeS sector? What makes Japan an
attractive market for Indian firms? Please rank them as ‘Not Significant’, ‘Moderately Significant’ and ‘Very
Significant’. Please Indicate 'Not Applicable' (N.A.) wherever the options seem non-relevant.
Not
Significant
Moderately
Significant
Very
Significant
2nd largest IT services market globally
Demographic Complementarity (ageing population in Japan v/s the growing working population in
India)
Technological Complementarity (due to Japanese expertise in hi-tech manufacturing & Indian
expertise in software skills)
110
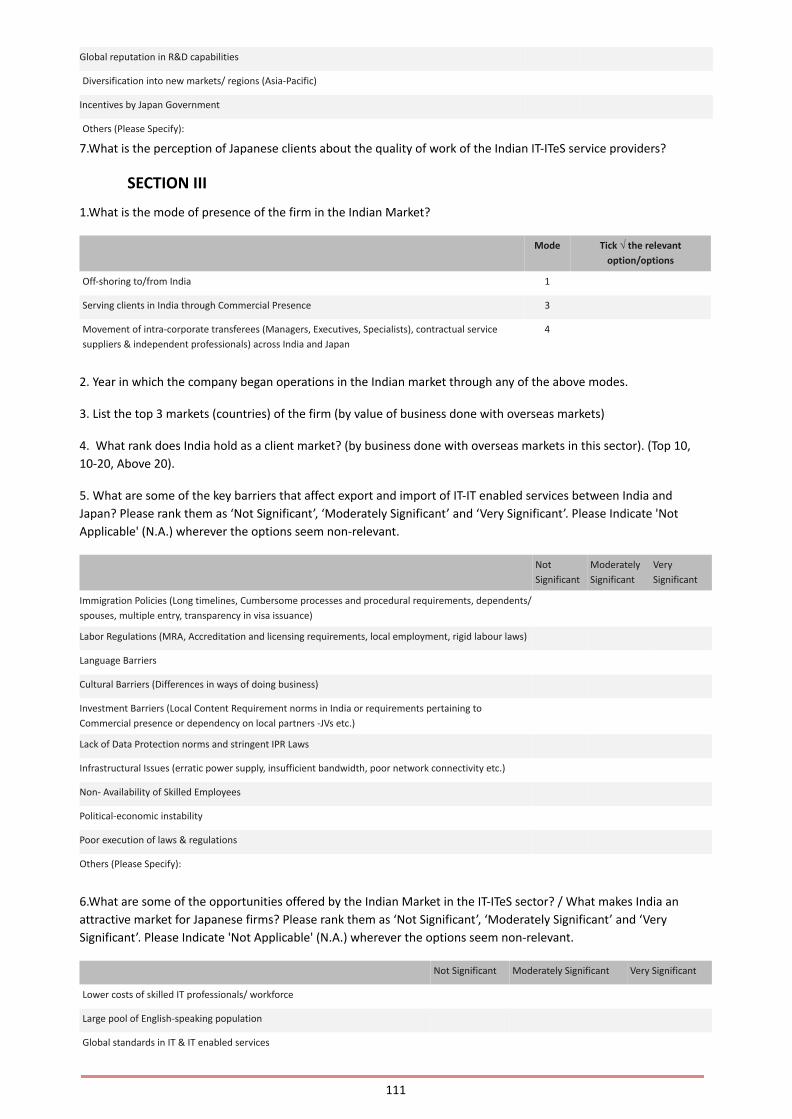
Global reputation in R&D capabilities
Diversification into new markets/ regions (Asia-Pacific)
Incentives by Japan Government
Others (Please Specify):
7.What is the perception of Japanese clients about the quality of work of the Indian IT-ITeS service providers?
SECTION III
1.What is the mode of presence of the firm in the Indian Market?
Mode Tick √ the relevant
option/options
Off-shoring to/from India 1
Serving clients in India through Commercial Presence 3
Movement of intra-corporate transferees (Managers, Executives, Specialists), contractual service
suppliers & independent professionals) across India and Japan
4
2. Year in which the company began operations in the Indian market through any of the above modes.
3. List the top 3 markets (countries) of the firm (by value of business done with overseas markets)
4. What rank does India hold as a client market? (by business done with overseas markets in this sector). (Top 10,
10-20, Above 20).
5. What are some of the key barriers that affect export and import of IT-IT enabled services between India and
Japan? Please rank them as ‘Not Significant’, ‘Moderately Significant’ and ‘Very Significant’. Please Indicate 'Not
Applicable' (N.A.) wherever the options seem non-relevant.
Not
Significant
Moderately
Significant
Very
Significant
Immigration Policies (Long timelines, Cumbersome processes and procedural requirements, dependents/
spouses, multiple entry, transparency in visa issuance)
Labor Regulations (MRA, Accreditation and licensing requirements, local employment, rigid labour laws)
Language Barriers
Cultural Barriers (Differences in ways of doing business)
Investment Barriers (Local Content Requirement norms in India or requirements pertaining to
Commercial presence or dependency on local partners -JVs etc.)
Lack of Data Protection norms and stringent IPR Laws
Infrastructural Issues (erratic power supply, insufficient bandwidth, poor network connectivity etc.)
Non- Availability of Skilled Employees
Political-economic instability
Poor execution of laws & regulations
Others (Please Specify):
6.What are some of the opportunities offered by the Indian Market in the IT-ITeS sector? / What makes India an
attractive market for Japanese firms? Please rank them as ‘Not Significant’, ‘Moderately Significant’ and ‘Very
Significant’. Please Indicate 'Not Applicable' (N.A.) wherever the options seem non-relevant.
Not Significant Moderately Significant Very Significant
Lower costs of skilled IT professionals/ workforce
Large pool of English-speaking population
Global standards in IT & IT enabled services
111

High economic growth/ Maturity of local market
Higher efficiency, productivity & capability of workforce
High Quality & reliability of services
Government Incentives by Indian Government
Others (Please Specify):
7.What is the perception of Japanese clients about the quality of work of Indian IT-ITeS firms?
SECTION IV
1.Are you aware of the existence of a CEPA (Comprehensive Economic Partnership Agreement) between India &
Japan?
2.Do you think such a bilateral agreement is important from your company’s perspective for doing business with
India/Japan (through offshoring/ outsourcing or through commercial presence)? Why or Why not?
3.Please list top three issues that you would like to be addressed by the CEPA to improve business between the two
countries in the IT-ITeS sector?
Questionnaire: Technology Start – Ups
SECTION I
1.Company’s Name and Address:
2.Year of Establishment:
3.Which are the industry verticals in which the company has presence?
**If the company is Indian, kindly proceed to Section II for further questions.
If the company is Japanese, kindly proceed to Section III for further questions.
SECTION II
1.What is the mode of presence of the firm in the Japanese Market?
Mode Tick √ the relevant
option/options
Off-shoring to/from Japan 1
Serving clients in Japan through Commercial Presence 3
Movement of intra-corporate transferees (Managers, Executives, Specialists), contractual service suppliers &
independent professionals across India and Japan
4
2.Year in which the company began operations in Japan through any of the above modes.
3.List the top 3 markets (countries) of the firm (by value of business done with overseas markets).
4.What rank does Japan hold as a market? (by business done with overseas markets in this sector) (Top 10, 10-20,
Above 20).
5.What are some of the key barriers that affect export and import of tech-based services between India and Japan?
Please rank them as ‘Not Significant’, ‘Moderately Significant’ and ‘Very Significant’. Please Indicate 'Not Applicable'
(N.A.) wherever the options seem non-relevant.
Barriers Not
Significant
Moderately
Significant
Very
Significan
112
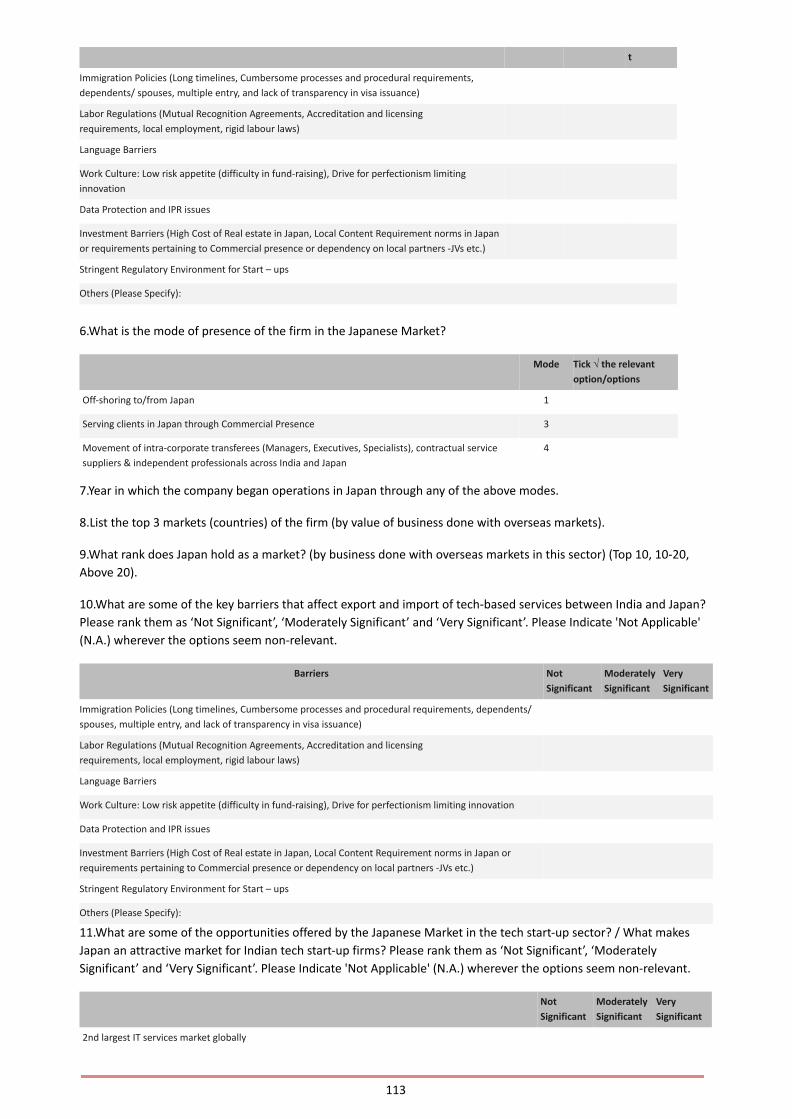
t
Immigration Policies (Long timelines, Cumbersome processes and procedural requirements,
dependents/ spouses, multiple entry, and lack of transparency in visa issuance)
Labor Regulations (Mutual Recognition Agreements, Accreditation and licensing
requirements, local employment, rigid labour laws)
Language Barriers
Work Culture: Low risk appetite (difficulty in fund-raising), Drive for perfectionism limiting
innovation
Data Protection and IPR issues
Investment Barriers (High Cost of Real estate in Japan, Local Content Requirement norms in Japan
or requirements pertaining to Commercial presence or dependency on local partners -JVs etc.)
Stringent Regulatory Environment for Start – ups
Others (Please Specify):
6.What is the mode of presence of the firm in the Japanese Market?
Mode Tick √ the relevant
option/options
Off-shoring to/from Japan 1
Serving clients in Japan through Commercial Presence 3
Movement of intra-corporate transferees (Managers, Executives, Specialists), contractual service
suppliers & independent professionals across India and Japan
4
7.Year in which the company began operations in Japan through any of the above modes.
8.List the top 3 markets (countries) of the firm (by value of business done with overseas markets).
9.What rank does Japan hold as a market? (by business done with overseas markets in this sector) (Top 10, 10-20,
Above 20).
10.What are some of the key barriers that affect export and import of tech-based services between India and Japan?
Please rank them as ‘Not Significant’, ‘Moderately Significant’ and ‘Very Significant’. Please Indicate 'Not Applicable'
(N.A.) wherever the options seem non-relevant.
Barriers Not
Significant
Moderately
Significant
Very
Significant
Immigration Policies (Long timelines, Cumbersome processes and procedural requirements, dependents/
spouses, multiple entry, and lack of transparency in visa issuance)
Labor Regulations (Mutual Recognition Agreements, Accreditation and licensing
requirements, local employment, rigid labour laws)
Language Barriers
Work Culture: Low risk appetite (difficulty in fund-raising), Drive for perfectionism limiting innovation
Data Protection and IPR issues
Investment Barriers (High Cost of Real estate in Japan, Local Content Requirement norms in Japan or
requirements pertaining to Commercial presence or dependency on local partners -JVs etc.)
Stringent Regulatory Environment for Start – ups
Others (Please Specify):
11.What are some of the opportunities offered by the Japanese Market in the tech start-up sector? / What makes
Japan an attractive market for Indian tech start-up firms? Please rank them as ‘Not Significant’, ‘Moderately
Significant’ and ‘Very Significant’. Please Indicate 'Not Applicable' (N.A.) wherever the options seem non-relevant.
Not
Significant
Moderately
Significant
Very
Significant
2nd largest IT services market globally
113
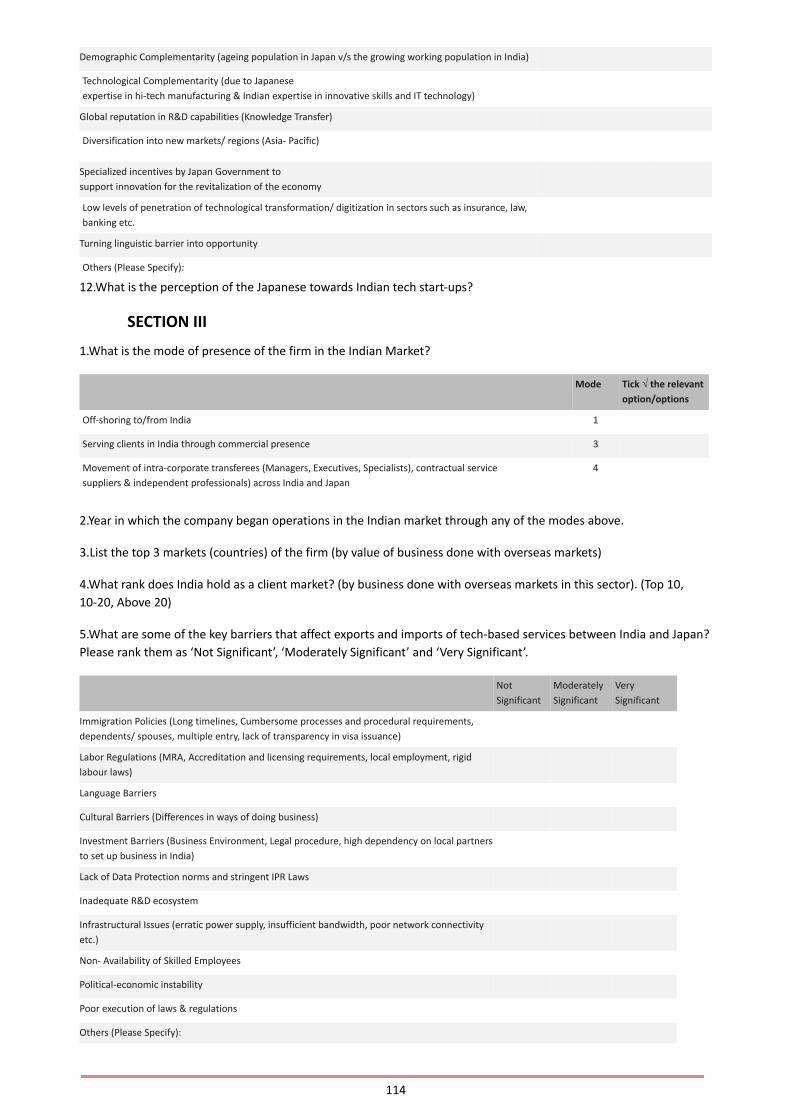
Demographic Complementarity (ageing population in Japan v/s the growing working population in India)
Technological Complementarity (due to Japanese
expertise in hi-tech manufacturing & Indian expertise in innovative skills and IT technology)
Global reputation in R&D capabilities (Knowledge Transfer)
Diversification into new markets/ regions (Asia- Pacific)
Specialized incentives by Japan Government to
support innovation for the revitalization of the economy
Low levels of penetration of technological transformation/ digitization in sectors such as insurance, law,
banking etc.
Turning linguistic barrier into opportunity
Others (Please Specify):
12.What is the perception of the Japanese towards Indian tech start-ups?
SECTION III
1.What is the mode of presence of the firm in the Indian Market?
Mode Tick √ the relevant
option/options
Off-shoring to/from India 1
Serving clients in India through commercial presence 3
Movement of intra-corporate transferees (Managers, Executives, Specialists), contractual service
suppliers & independent professionals) across India and Japan
4
2.Year in which the company began operations in the Indian market through any of the modes above.
3.List the top 3 markets (countries) of the firm (by value of business done with overseas markets)
4.What rank does India hold as a client market? (by business done with overseas markets in this sector). (Top 10,
10-20, Above 20)
5.What are some of the key barriers that affect exports and imports of tech-based services between India and Japan?
Please rank them as ‘Not Significant’, ‘Moderately Significant’ and ‘Very Significant’.
Not
Significant
Moderately
Significant
Very
Significant
Immigration Policies (Long timelines, Cumbersome processes and procedural requirements,
dependents/ spouses, multiple entry, lack of transparency in visa issuance)
Labor Regulations (MRA, Accreditation and licensing requirements, local employment, rigid
labour laws)
Language Barriers
Cultural Barriers (Differences in ways of doing business)
Investment Barriers (Business Environment, Legal procedure, high dependency on local partners
to set up business in India)
Lack of Data Protection norms and stringent IPR Laws
Inadequate R&D ecosystem
Infrastructural Issues (erratic power supply, insufficient bandwidth, poor network connectivity
etc.)
Non- Availability of Skilled Employees
Political-economic instability
Poor execution of laws & regulations
Others (Please Specify):
114
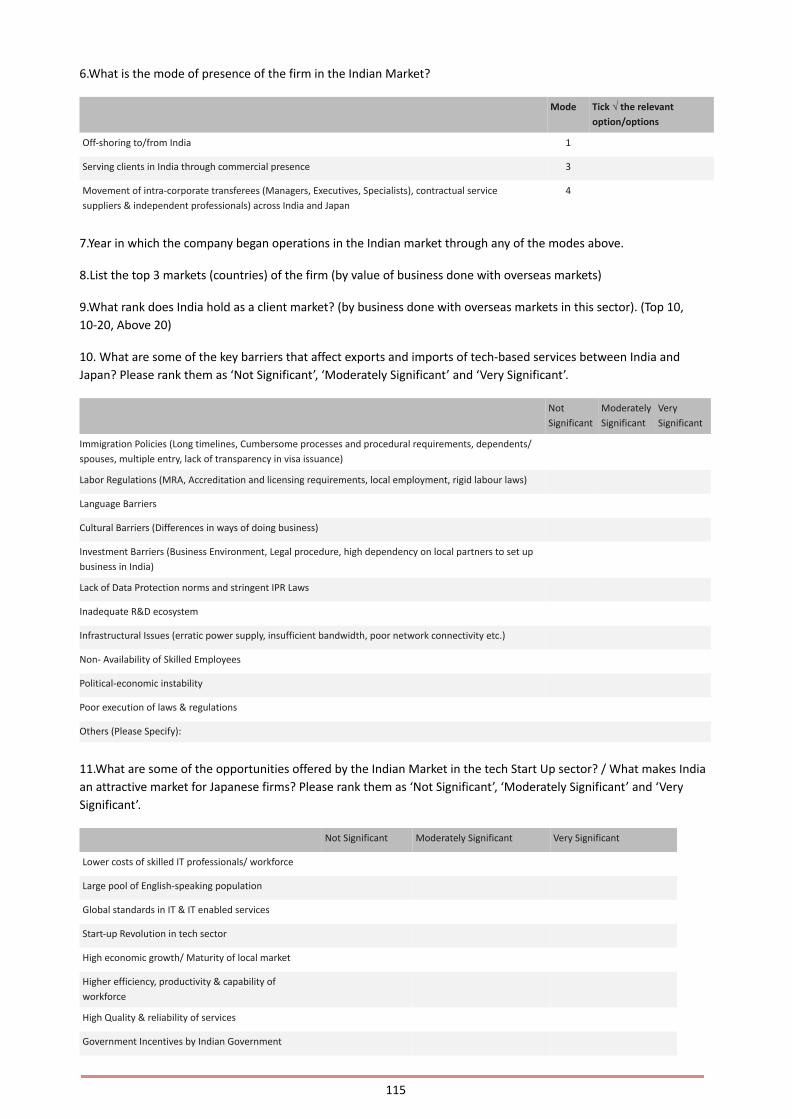
6.What is the mode of presence of the firm in the Indian Market?
Mode Tick √ the relevant
option/options
Off-shoring to/from India 1
Serving clients in India through commercial presence 3
Movement of intra-corporate transferees (Managers, Executives, Specialists), contractual service
suppliers & independent professionals) across India and Japan
4
7.Year in which the company began operations in the Indian market through any of the modes above.
8.List the top 3 markets (countries) of the firm (by value of business done with overseas markets)
9.What rank does India hold as a client market? (by business done with overseas markets in this sector). (Top 10,
10-20, Above 20)
10. What are some of the key barriers that affect exports and imports of tech-based services between India and
Japan? Please rank them as ‘Not Significant’, ‘Moderately Significant’ and ‘Very Significant’.
Not
Significant
Moderately
Significant
Very
Significant
Immigration Policies (Long timelines, Cumbersome processes and procedural requirements, dependents/
spouses, multiple entry, lack of transparency in visa issuance)
Labor Regulations (MRA, Accreditation and licensing requirements, local employment, rigid labour laws)
Language Barriers
Cultural Barriers (Differences in ways of doing business)
Investment Barriers (Business Environment, Legal procedure, high dependency on local partners to set up
business in India)
Lack of Data Protection norms and stringent IPR Laws
Inadequate R&D ecosystem
Infrastructural Issues (erratic power supply, insufficient bandwidth, poor network connectivity etc.)
Non- Availability of Skilled Employees
Political-economic instability
Poor execution of laws & regulations
Others (Please Specify):
11.What are some of the opportunities offered by the Indian Market in the tech Start Up sector? / What makes India
an attractive market for Japanese firms? Please rank them as ‘Not Significant’, ‘Moderately Significant’ and ‘Very
Significant’.
Not Significant Moderately Significant Very Significant
Lower costs of skilled IT professionals/ workforce
Large pool of English-speaking population
Global standards in IT & IT enabled services
Start-up Revolution in tech sector
High economic growth/ Maturity of local market
Higher efficiency, productivity & capability of
workforce
High Quality & reliability of services
Government Incentives by Indian Government
115

Others (Please Specify):
12.What is the perception of Japanese Startups about India and the Indian IT-ITeS services providers?
SECTION IV
1.Are you aware of the existence of a CEPA (Comprehensive Economic Partnership Agreement) between India &
Japan?
2.Do you think such a bilateral agreement is important from your company’s perspective for doing business with
India/Japan (through offshoring/ outsourcing or through commercial presence)? Why or Why not?
3.Please list top three issues that you would like to be addressed by CEPA to improve the business relations between
the two countries in this sector?
Questionnaire: Engineering Sector
SECTION I
1.Company’s Name and Address:
2.Year of Establishment:
3.Which are the industry verticals in which the company has presence?
**If the company is Indian, kindly proceed to Section II for further questions.
If the company is Japanese, kindly proceed to Section III for further questions.
SECTION II
1.What is the mode of presence of the firm in the Japanese Market?
Mode Tick √ the relevant
option/options
Off-shoring to/ from Japan 1
Serving firms through commercial presence in Japan 3
Movement of business visitors, intra-corporate transferees (Managers, Executives, Specialists), contractual service
suppliers & independent professionals to across India- Japan for provision of services.
4
2.Year in which the company began operations with Japan through either of the modes.
3.List the top 3 markets (countries) of the firm (by business done with overseas markets).
4.What rank does Japan hold as a market? (by business done with overseas markets in this sector). (Top 10, 10-20,
Above 20).
5. What are some of the key barriers that affect export and import of engineering services between India and Japan?
Please rank them as ‘Not Significant’, ‘Moderately Significant’ and ‘Very Significant’. Please Indicate 'Not Applicable'
(N.A.) wherever the options seem non-relevant.
Not
Significant
Moderately
Significant
Very
Significant
Immigration Policies (Long timelines, Cumbersome processes and procedural requirements, dependents/
spouses, multiple entry, transparency in visa issuance)
Labor Regulations (MRA, Accreditation and licensing requirements, local employment, rigid labour laws)
Language Barriers
116

Cultural Barriers (Ways of doing business)
Investment Barriers (High Cost of Real estate in Japan, Local Content Requirement norms in Japan or
requirements pertaining to Commercial presence or dependency on local partners -JVs etc.)
Lack of Transparency in Competitive Bids for projects (Public Procurement)
Unavailability of Skilled Professionals/ High Cost of Skilled professionals
Others (Please specify):
6.What are some of the opportunities offered by Japanese market in the engineering services sector? What makes
Japan an attractive market for Indian firms? Please rank them as ‘Not Significant’, ‘Moderately Significant’ and ‘Very
Significant’. Please Indicate 'Not Applicable' (N.A.) wherever the options seem non-relevant.
Not
Significan
t
Moderately
Significant
Very
Significan
t
Demographic Complementarity (ageing population in Japan v/s the growing working population in India)
Global reputation in R&D capabilities
Diversification into new markets/ regions (Asia-Pacific)
Incentives by Japan Government
Lower cost of skilled professionals in India relative to Japan (Cost advantage)
Others (Please Specify):
7. What is the perception of the Japanese about the quality of work of Indian engineering service providers?
SECTION III
1.What is the mode of presence of the firm in the Indian Market?
Mode Tick √ the relevant
option/options
Off-shoring to/ from India 1
Serving firms through commercial presence in India 3
Movement of business visitors, intra-corporate transferees (Managers, Executives, Specialists),
contractual service suppliers & independent professionals to across India- Japan for provision of services.
4
2. Year in which the company began operations with India through either of the modes.
3. List the top 3 markets (countries) of the firm (by business done with overseas markets)
4. What rank does India hold as a market? (by business done with overseas markets in this sector). (Top 10, 10-20,
Above 20)
5. What are the types of operations which the Indian clients generally seek to be carried out by the firm?
Or
What are the types of operations which the firm outsources/ offshores to Indian firms?
6. What are some of the key barriers that affect export and import of engineering services between India and Japan?
Please rank them as ‘Not Significant’, ‘Moderately Significant’ and ‘Very Significant’. Please Indicate 'Not Applicable'
(N.A.) wherever the options seem non-relevant.
Not
Significant
Moderately
Significant
Very
Significant
Immigration Policies (Long timelines, Cumbersome processes and procedural requirements,
dependents/ spouses, multiple entry, transparency in visa issuance)
117

Labor Regulations (MRA, Accreditation and licensing requirements, local employment, rigid labour
laws)
Language Barriers
Cultural Barriers (Differences in ways of doing business)
Investment Barriers (Local Content Requirement norms in India or requirements pertaining to
Commercial presence or dependency on local partners -JVs etc.)
Infrastructural Issues (erratic power supply, insufficient bandwidth, poor network connectivity etc.)
Regulatory and Institutional Constraints
Technology adaptation and R&D short comings
Lack of Transparency in Competitive Bids for projects (Public Procurement)
Lack of Domain experience in potential employees
Any Other. Please Elaborate.
7.What are some of the opportunities offered by Indian Market in the engineering services sector? What makes India
an attractive market for Japanese firms? Please rank them as ‘Not Significant’, ‘Moderately Significant’ and ‘Very
Significant’. Please Indicate 'Not Applicable' (N.A.) wherever the options seem non-relevant.
Not
Significant
Moderately
Significant
Very
Significant
High economic growth/ Maturity of local market
Government Incentives
Large number of infrastructural development projects (Scope)
Exploring new geographies
Availability of low-cost, young, efficient and skilled professionals
Rising demand of an overall solution that is a combination of engineering and IT (And India’s
established IT sector is a complementarity)
Any Other. Please Elaborate.
8.What is the perception of the Japanese about Indian clients and/or the quality of work of Indian engineering
service providers?
SECTION IV
1.Are you aware of the existence of a CEPA (Comprehensive Economic Partnership Agreement) between India &
Japan?
2.Do you think such a bilateral agreement is important from your company’s perspective for doing business with
India/Japan? Why or Why not?
3.Please list the top three issues that you would like to be addressed by the CEPA to improve business between the
two countries in the engineering services sector?
118

ANNEXURE #5
Babasaheb Kalyani
Technological Innovation and Sustainable EconomicDevelopment: What can India and Japan learn from each �her?
This is a conversation between the forge master, M.D, Bharat Forge, Mr. Babasaheb Kalyani, and the COO of Mizuho
India Japan Study Centre, Mr. Saideep Rathnam.
Mr. Kalyani is one of very few Indians to be bestowed with the Order of the Rising Sun, Gold and Silver Star by the
Government of Japan, and the Padma Bhushan by the Government of India. His entrepreneurial drive clubbed with
the penchant for equipping best-in-class technology has placed Bharat Forge as a category leader in the global
automotive and industrial landscape. Mr. Kalyani is a model for economically sustainable growth built on a strong
connection with one’s roots while exploring new avenues through international collaborations, and as a permanent
member of the Prime Minister’s Science Technology & Innovation Council, Government of India, he has championed
the cause of increasing the participation of private industry in India’s Defense Manufacturing.
Saideep Rathnam: We commence the much-anticipated interaction, titled “Technological Innovation and
Sustainable Economic Development: What can India and Japan learn from each other?” Considering Mr. Kalyani’s
zeal in breaching technological frontiers, and his long association with Japan, we would like to hear his thoughts
on three major themes, “Technological Innovation”, “Developing India Japan relationships”, and “Economically
Sustainable Development”. The first question I pose is: As necessity is the mother of invention, does crisis triggers
innovation?
Babasaheb Kalyani: Over the past decades, there have been many instances where the world was gripped in crisis,
and nations, backed by passionate individuals have risen magnificently to the occasion, like described in the book
Freedom’s Forge, the story of how the ingenuity and energy of the American private sector equipped the finest
military force of the world. At President Roosevelt’s call, nationalistic individuals such as Henry Kaiser, came together
and just within 4 and a half years, 340 fighter planes and 140 aircrafts were manufactured.
The last pandemic, the Spanish Flu, and the World war are examples of how innovation is triggered by need and how
the knowledge imparted serves as fuel for revolution. Another example is the current pandemic, where India saw a
severe lockdown, and economic distress. We were short on medical and pharma supplies at the beginning of the
pandemic, but turning crisis into opportunity, we began manufacturing ventilators, vaccines, and within 12 months,
we are the largest exporters of ventilator equipment. When in crisis, a good leadership drives India into mission
mode, and when in mission mode, there is little that we cannot accomplish. The world is in the midst of an electronic
industrial revolution, where technology strives to make lives better, smarter, and efficient. With the advent of AI,
India is at the center, catching up fast with the startup ecosystem, aided by good governance, framework, and most
importantly, individual participation.
SR: It was indeed an insightful reply, I believe the key aspects of turning crisis to advantage, according to your
observations are, leadership, the mission mode, and individual involvement. Continuing with the theme of
technological innovation, what, in your opinion are the areas that innovation should focus on? Would it be
agriculture, healthcare, or defense, and why?
BK: To answer the first question, we live in a VUCA (Volatile, Uncertainty, Complexity, Ambiguity) environment, an
age where the speed of development of new technology has never been greater. In the time it takes to conceive and
create something, it may already become obsolete. Therefore, one cannot predict the demand for technology, there
has to be constant innovation across sectors. The foremost need is digitalization, which supports all innovation.
Understanding AI and reskilling is the need of the hour, this holds true for individuals, companies, and nations.
To give an example, the world and India had to became digital within months to operate during the pandemic.
E-markets have bloomed in India, further influencing virtual spaces and logistics, one change leads to another. Across
sectors like agriculture and healthcare AI is a big influencer. Consulting, diagnosis, and treatment are becoming
available online, enhancing the reach of healthcare. With AI based knowledge, the automotive sector has seen the
119

dawn of the E.V era, in the past module of IC engines, millions of people were in components manufacturing, but E.V
tech, with no such components, is causing big disruptions. One has to be on the top to survive.
To answer the question about focus area, investing in frontier tech such as hyper sonic travel, oceanic monitoring,
epidemiology, healthcare, climate change issues, renewable tech, fintech sector, etc. might be the best bet to be
prepared for change. Another area of focus could be to own intellectual property, by becoming self-reliant as
individuals and nations.
SR: The key takeaway, therefore, is to focus on frontier tech, which would have significant impact across sectors.
Speaking of the need for constant innovation, there is no better example than Bharat Forge, which is known for
integrating innovation in their DNA. What would be your methods and advice to make innovation a part of
organizational DNA?
BK: Innovating is our lifestyle. In the spirit of ‘atma nirbharta’, (self-reliance) we own the IP for the technology we
use. The key to building one’s own IP is collaboration, taking advantage of the intellectual wealth in academia.
Owning technology does not mean working in isolation. Partnering with researchers, scientists, and institutions such
as DRDO, laboratories across the country, institutes involved in social, economic, and technological research such as
the IIM’s and IIT’s is the tool to stay ahead. IIT Madras, Pawai, and even IIM Bangalore are involved in nurturing
entrepreneurship and frontier technology research. Another advantage to partnering with academic institutes is the
development of an ecosystem of innovation, which is accessible to all, and economically sustainable.
SR: Indeed, building fruitful partnerships with academic institutions is mutually beneficial. IIM Bangalore’s NSR
Cell for incubation is a key contributor to Bangalore’s start-up ecosystem. Considering the involvement of academic
institutions and policy makers in frontier technology, how can they facilitate collaborations between nations, such
as India and Japan?
BK: India and Japan have enjoyed a special strategic global partnership, which is a winning combination, even as we
work together with Africa and the Middle East toward strengthening our defense. From my experience in the India
Japan Business Forum, I believe that we need to go beyond strategic relations and develop an aspirational growth
mindset, irrespective of opportunities and policies.
SR: Focusing on aspirational growth seems to be the next milestone for India and Japan. Given your role as a key
stimulator for trade relations between India and Japan, during your long association with Japan, are there any
personal learnings you would like to share with our audience?
BK: This story is around the time I first started working with Japan in the mid 70’s. I used to stay at the Imperial hotel,
in a room with a view of the street outside, and what used to surprise me most was the pace of the people walking
on the street, it told me a lot about their dynamic and relentless approach to work. Their system places great
importance on individual involvement, which is something the rest of us should learn from. I also notice that we have
a lot of cultural commonalities. It would benefit us to also build a cultural relationship with Japan, built on mutual
trust.
SR: Your views remind me of my interactions with Chiba san, an expert and India Japan relation stimulator in the
manufacturing sector, who spoke of a ‘noble mindset’, which implies that results are only a by-product of
individual work and effort. Relying on your experiences of working with Japan, could you give your thoughts on
how to mitigate the effects of stagnation, low interest rates and aging population, some issues which the Japanese
economy is dealing with? Are there any policy lessons for India?
BK: Although I am no economist, I would like to say that amidst the current environment of private entrepreneurship,
indigenizing defense, smart innovation in agriculture, etc. in India, we are looking up to our goal of becoming the 3rd
largest economy. We need to focus more on policies for facilitating and nurturing, while not losing sight of making
the process inclusive, where everybody gains from the nations prosperity. We can adopt Japan’s model of
self-reliance in our policies, leadership will show the road map, it is up to the entrepreneurs to take advantage, as
they have in Fintech and E-commerce.
SR: In the environment of private growth, can we indoctrinate ‘Sabka sath, sabka vikas’ (Grow together) or will it
effect in the rich become richer and the poor become poorer?
BK: Focus on creating wealth could come first, distributing wealth will follow, in any system there is risk and reward
involved. While some may gain more, some may loose too.
SR: Another aspect we would like your views on is, the debate of Indigenization vs. Globalization. While the former
has been a major contributor to economic growth, many countries are adopting self-reliance in recent times,
120

urging industry leaders to stay committed to indigenous production. Looking at such approaches, in a way, is
indigenization retrograde? Would it be a better policy to do what one does best? For instance, if someone is good
at making umbrellas, should they continue making umbrellas and fulfill their other needs through globalization for
improved efficiency?
BK: The concept of globalization has evolved over the years. Globalization is using resources worldwide to improve
our own countries national standing, putting citizens first. However, that does not imply isolating and disassociating.
In a scene of constant tech disruptions, what you excel at is always expendable, therefore, one has to keep learning
and evolving to survive. For instance, the advent of streaming services like Netflix has changed buying products for
entertainment to buying services. At present, countries other than India make services, India has to evolve to make
compatible products, and further develop know how on creating services.
SR: Therefore, one has to discard their old lens of viewing globalization and keep oneself at the cutting edge of
technology. I would like to pose our last question to you, of sustainable economic development and policies. Firstly,
what is your take on the present initiatives of the government to promote private players across sectors, including
defense, will these policy changes be successful? Secondly, will these policies take effect in a way that it will
influence all stakeholders?
BK: I believe that the policies are a great initiative by the government. All private and public stakeholders are
invested, there is room for newcomers and small-scale entrepreneurs as well. Answering your second question, in my
experience, the pandemic has upset all our lives and livelihood, the economy is bound to contract under these
circumstances and the pain is mutually borne. However, as time passes, we might see growth in all sectors. We have
examples of villages we have developed as part of our CSR initiatives, the trends changed gradually through effort,
we witnessed reverse migration as job opportunities, water, healthcare and schooling improved. Therefore,
perseverance and aspiration will help us reach our goals. Thank you for having me, Jai Hind!
121

ANNEXURE #6
Prof. Subhashish Gupta
Business Groups in India and Japan
Table of ContentsAbstract
Acknowledgements
1. Introduction
2. Asian Business Systems
2.1 Institutional Characteristics:
2.2 Types of Asian Business Systems:
2.3 The effect of MNEs on Asian Business Systems
3. Business Groups
3.1 Business Groups and Alternative Structures
3.2 Business Groups in Late and Early Industrializing Nations
3.3 Factors Leading to the Creation of Business Groups
3.3.1 Diversified Business Groups
3.3.2 Pyramidal Business Groups
3.4 The Evolution of Business Groups
4. Japanese Business Groups
4.1 Origins of the Keiretsu
4.2 Impact of Keiretsu
4.3 Keiretsu: The End?
5. Business Groups in India
5.1 Regulation and Deregulation (1947-2006)
5.2 Indian Business Groups: Some Distinctive Features
5.3 Dealing with the Business Environment
5.4 How have they fared?
6. Japanese firms in India
6.1 Location of Japanese Firms in India
6.2 Alliance Management between Japanese MNEs and Indian firms
6.2.1 Case profiles
6.3 Japanese company strategies
7. Conclusion
References
List of Tables
122
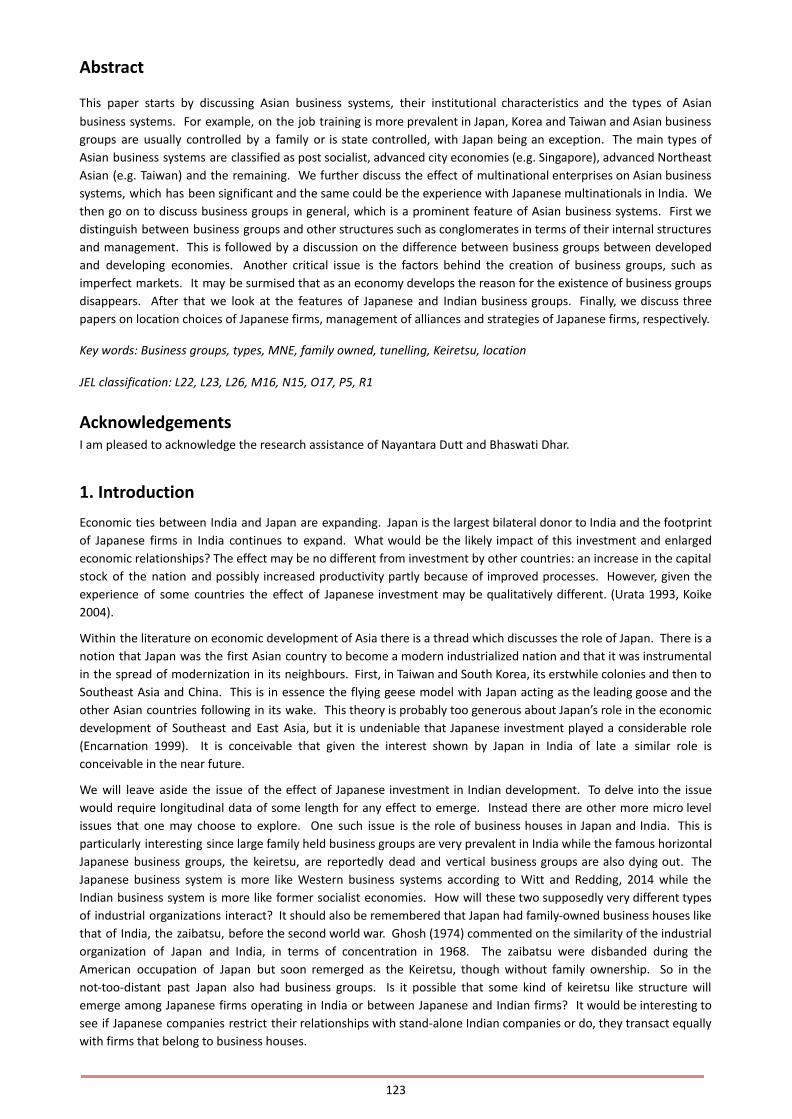
Abstract
This paper starts by discussing Asian business systems, their institutional characteristics and the types of Asian
business systems. For example, on the job training is more prevalent in Japan, Korea and Taiwan and Asian business
groups are usually controlled by a family or is state controlled, with Japan being an exception. The main types of
Asian business systems are classified as post socialist, advanced city economies (e.g. Singapore), advanced Northeast
Asian (e.g. Taiwan) and the remaining. We further discuss the effect of multinational enterprises on Asian business
systems, which has been significant and the same could be the experience with Japanese multinationals in India. We
then go on to discuss business groups in general, which is a prominent feature of Asian business systems. First we
distinguish between business groups and other structures such as conglomerates in terms of their internal structures
and management. This is followed by a discussion on the difference between business groups between developed
and developing economies. Another critical issue is the factors behind the creation of business groups, such as
imperfect markets. It may be surmised that as an economy develops the reason for the existence of business groups
disappears. After that we look at the features of Japanese and Indian business groups. Finally, we discuss three
papers on location choices of Japanese firms, management of alliances and strategies of Japanese firms, respectively.
Key words: Business groups, types, MNE, family owned, tunelling, Keiretsu, location
JEL classification: L22, L23, L26, M16, N15, O17, P5, R1
AcknowledgementsI am pleased to acknowledge the research assistance of Nayantara Dutt and Bhaswati Dhar.
1. Introduction
Economic ties between India and Japan are expanding. Japan is the largest bilateral donor to India and the footprint
of Japanese firms in India continues to expand. What would be the likely impact of this investment and enlarged
economic relationships? The effect may be no different from investment by other countries: an increase in the capital
stock of the nation and possibly increased productivity partly because of improved processes. However, given the
experience of some countries the effect of Japanese investment may be qualitatively different. (Urata 1993, Koike
2004).
Within the literature on economic development of Asia there is a thread which discusses the role of Japan. There is a
notion that Japan was the first Asian country to become a modern industrialized nation and that it was instrumental
in the spread of modernization in its neighbours. First, in Taiwan and South Korea, its erstwhile colonies and then to
Southeast Asia and China. This is in essence the flying geese model with Japan acting as the leading goose and the
other Asian countries following in its wake. This theory is probably too generous about Japan’s role in the economic
development of Southeast and East Asia, but it is undeniable that Japanese investment played a considerable role
(Encarnation 1999). It is conceivable that given the interest shown by Japan in India of late a similar role is
conceivable in the near future.
We will leave aside the issue of the effect of Japanese investment in Indian development. To delve into the issue
would require longitudinal data of some length for any effect to emerge. Instead there are other more micro level
issues that one may choose to explore. One such issue is the role of business houses in Japan and India. This is
particularly interesting since large family held business groups are very prevalent in India while the famous horizontal
Japanese business groups, the keiretsu, are reportedly dead and vertical business groups are also dying out. The
Japanese business system is more like Western business systems according to Witt and Redding, 2014 while the
Indian business system is more like former socialist economies. How will these two supposedly very different types
of industrial organizations interact? It should also be remembered that Japan had family-owned business houses like
that of India, the zaibatsu, before the second world war. Ghosh (1974) commented on the similarity of the industrial
organization of Japan and India, in terms of concentration in 1968. The zaibatsu were disbanded during the
American occupation of Japan but soon remerged as the Keiretsu, though without family ownership. So in the
not-too-distant past Japan also had business groups. Is it possible that some kind of keiretsu like structure will
emerge among Japanese firms operating in India or between Japanese and Indian firms? It would be interesting to
see if Japanese companies restrict their relationships with stand-alone Indian companies or do, they transact equally
with firms that belong to business houses.
123
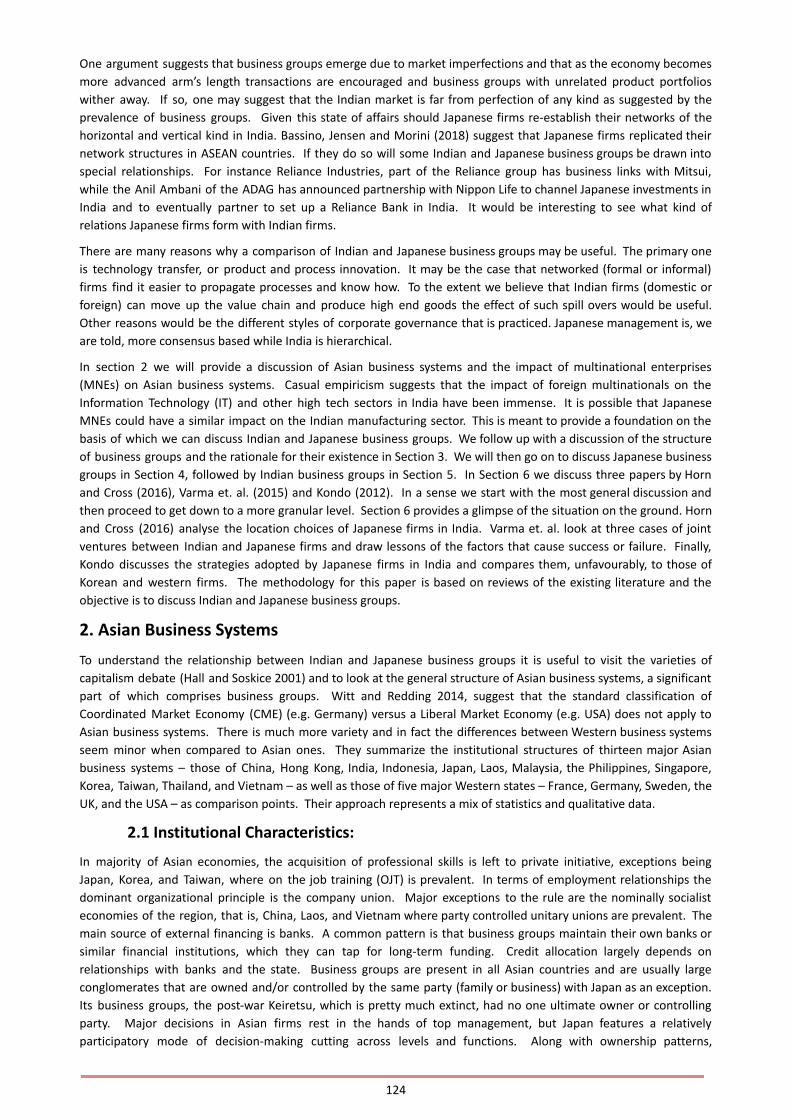
One argument suggests that business groups emerge due to market imperfections and that as the economy becomes
more advanced arm’s length transactions are encouraged and business groups with unrelated product portfolios
wither away. If so, one may suggest that the Indian market is far from perfection of any kind as suggested by the
prevalence of business groups. Given this state of affairs should Japanese firms re-establish their networks of the
horizontal and vertical kind in India. Bassino, Jensen and Morini (2018) suggest that Japanese firms replicated their
network structures in ASEAN countries. If they do so will some Indian and Japanese business groups be drawn into
special relationships. For instance Reliance Industries, part of the Reliance group has business links with Mitsui,
while the Anil Ambani of the ADAG has announced partnership with Nippon Life to channel Japanese investments in
India and to eventually partner to set up a Reliance Bank in India. It would be interesting to see what kind of
relations Japanese firms form with Indian firms.
There are many reasons why a comparison of Indian and Japanese business groups may be useful. The primary one
is technology transfer, or product and process innovation. It may be the case that networked (formal or informal)
firms find it easier to propagate processes and know how. To the extent we believe that Indian firms (domestic or
foreign) can move up the value chain and produce high end goods the effect of such spill overs would be useful.
Other reasons would be the different styles of corporate governance that is practiced. Japanese management is, we
are told, more consensus based while India is hierarchical.
In section 2 we will provide a discussion of Asian business systems and the impact of multinational enterprises
(MNEs) on Asian business systems. Casual empiricism suggests that the impact of foreign multinationals on the
Information Technology (IT) and other high tech sectors in India have been immense. It is possible that Japanese
MNEs could have a similar impact on the Indian manufacturing sector. This is meant to provide a foundation on the
basis of which we can discuss Indian and Japanese business groups. We follow up with a discussion of the structure
of business groups and the rationale for their existence in Section 3. We will then go on to discuss Japanese business
groups in Section 4, followed by Indian business groups in Section 5. In Section 6 we discuss three papers by Horn
and Cross (2016), Varma et. al. (2015) and Kondo (2012). In a sense we start with the most general discussion and
then proceed to get down to a more granular level. Section 6 provides a glimpse of the situation on the ground. Horn
and Cross (2016) analyse the location choices of Japanese firms in India. Varma et. al. look at three cases of joint
ventures between Indian and Japanese firms and draw lessons of the factors that cause success or failure. Finally,
Kondo discusses the strategies adopted by Japanese firms in India and compares them, unfavourably, to those of
Korean and western firms. The methodology for this paper is based on reviews of the existing literature and the
objective is to discuss Indian and Japanese business groups.
2. Asian Business Systems
To understand the relationship between Indian and Japanese business groups it is useful to visit the varieties of
capitalism debate (Hall and Soskice 2001) and to look at the general structure of Asian business systems, a significant
part of which comprises business groups. Witt and Redding 2014, suggest that the standard classification of
Coordinated Market Economy (CME) (e.g. Germany) versus a Liberal Market Economy (e.g. USA) does not apply to
Asian business systems. There is much more variety and in fact the differences between Western business systems
seem minor when compared to Asian ones. They summarize the institutional structures of thirteen major Asian
business systems – those of China, Hong Kong, India, Indonesia, Japan, Laos, Malaysia, the Philippines, Singapore,
Korea, Taiwan, Thailand, and Vietnam – as well as those of five major Western states – France, Germany, Sweden, the
UK, and the USA – as comparison points. Their approach represents a mix of statistics and qualitative data.
2.1 Institutional Characteristics:
In majority of Asian economies, the acquisition of professional skills is left to private initiative, exceptions being
Japan, Korea, and Taiwan, where on the job training (OJT) is prevalent. In terms of employment relationships the
dominant organizational principle is the company union. Major exceptions to the rule are the nominally socialist
economies of the region, that is, China, Laos, and Vietnam where party controlled unitary unions are prevalent. The
main source of external financing is banks. A common pattern is that business groups maintain their own banks or
similar financial institutions, which they can tap for long-term funding. Credit allocation largely depends on
relationships with banks and the state. Business groups are present in all Asian countries and are usually large
conglomerates that are owned and/or controlled by the same party (family or business) with Japan as an exception.
Its business groups, the post-war Keiretsu, which is pretty much extinct, had no one ultimate owner or controlling
party. Major decisions in Asian firms rest in the hands of top management, but Japan features a relatively
participatory mode of decision-making cutting across levels and functions. Along with ownership patterns,
124

management control of firms usually also rests with families or the state. Decision-making in most Asian states is
statist. The exception is Japan, which involves the participation of various sectors of society.
2.2 Types of Asian Business Systems:
To identify the different types of Asian business systems present in the sample Witt and Reading (2014) use cluster
analysis.
The main Asian clusters are
1. The (post) socialist countries of China, Vietnam, Laos, and India.
2. The advanced city economies of Hong Kong and Singapore.
3. The remaining South East Asian nations.
4. The advanced North-East Asian economies of Korea and Taiwan.
The Western economies as well as Japan cluster separately from the Asian economies. Japan falls into the
coordinated branch, between Germany and France. Further, Chinese private business broadly clusters with the
poorer South East Asian economies. Indian private business is on the same branch as Chinese private business and
the poorer South East Asian nations but splits off earlier into a branch of its own. This structural similarity of Chinese
and Indian business stem from the similarity of their business systems: the inefficiency of the state institutions on
which the economy depends, the vibrancy of the private sector, the dominance of bank financing, the power of
personally dominated large firms with crony-capitalist connections being a few of them.
Their research suggests that the total number of known types of capitalism in Asia and the West is at least six and
possibly as many as nine: four in Asia (post-socialist, advanced city-state, emerging South East Asian, advanced
North-East Asian), plus some two to five in the West (including Japan). It would be useful to incorporate social capital
(interpersonal or relational trust, and institutionalized or system trust), and cultural elements for business-systems
analysis. The reliance on informality, so common in India, (reliance on informal institutions such as unwritten norms,
conventions, or codes of behaviour) in a business system and its interplay with formal institutions should also be
investigated. Another interesting feature of Asian business systems is multiplexity, which is the presence of multiple
business systems within one economy. India, again is a prominent example. The presence of multiplexity raises
important questions. One is what preconditions allow the coexistence of multiple business systems in the same
institutional space. A second question relates to the concept of institutional convergence. If business systems
converge, which one do they converge to. Multiple business systems within the same nation complicates the
dynamics of convergence among different business systems.
It also raises questions about the compatibility and ability of Indian and Japanese business systems to work together.
Japanese firms will not only have to deal with one type of business system, different from its own business system,
but two. Further, the impact of Japanese firms may be to introduce yet another type of business system into India.
So it would be useful to consider the effect of Multinational Enterprises (MNE) on Asian Business Systems.
2.3 The effect of MNEs on Asian Business Systems
Giroud (2014) provides a comprehensive account of the impact of MNE activities in Asian Business systems. As he
notes the literature on international business has recognized for a long time the interaction between MNEs and the
institutional structure of countries. MNEs have had to adapt to local conditions and institutions and in turn they
have left their imprint on these. This is a continuous process. Adaptations made by MNEs is response to the
institutional context is termed as micro-politics while the effect that MNEs have on the host country’s institutional
context is called macro-politics, which is the focus of Giroud’s work.
It has been long recognized that a firm’s activities, its strategies and its structure, and to some extent its competitive
advantage, derives from the institutional arrangements in the home country. By this we broadly mean the structure
of the employment system, the financial system, relationships within firms and the political system that binds it
together. Firms from USA are more likely to rely on short-term, contract-based relationships with workers and
suppliers while Japanese firms may prefer more long-term relationships based on cooperation and trust and not so
much on formally defined contracts. Thus USA based firms may find it easier to work with the more dynamic parts of
the private sector in India since it is to some extent it mirrors USA institutions. Japanese firms, on the other hand,
may find it easier to work with the larger business groups in India since it has a history of business groups and has a
system of coordinated capitalism.
The strategies that MNEs use can be characterized as efficiency seeking, market seeking and resource seeking. These
will have different effects on the institutional changes in the host country. For example efficiency seeking firms will
125

try and goad the government and municipalities to become more efficient in terms of ease of doing business and the
provision of infrastructure. Market seeking firms will push for open trade and better access. They will push for
access to areas of the market that are currently closed and may also support privatization and deregulation policies.
Finally, those trying to get access to raw materials or human resources will push for better access to those resources.
MNEs differ between themselves as to what strategies they pursue and MNEs from different countries can have
different effects.
At the firm level the main channels through which MNEs change the institutional structures of the host country is
through knowledge transfers, spill overs and linkages. The extent of knowledge transfer depends on the strategies of
firms and the ability of local firms to absorb such transfers. USA based multinationals typically rely on local hires for
managerial expertise while Japanese firms rely more on expatriates. Consequently, the possibility of knowledge
transfer of processes is likely to be less in the case of Japanese firms. Of course it is possible that formal processes at
the level of governments, as in the case of Japanese investments in high-speed rail in India, may accelerate
knowledge transfer. The other possibility is to subcontract parts of production to local firms. Indeed, the
participation and development of global value chains or production networks in Asia has led to significant improving
in the technology levels in firms in Asia. The process has largely been led by multinationals from Western economies
and Japan.
Spill overs also lead to knowledge transfers but indirectly. Economists term these beneficial externalities. MNEs,
which once operated mainly in manufacturing, are now engaging in more R&D and their activities are getting more
technologically sophisticated. This has resulted in higher productivity among local firms. Such effects may be
transmitted either horizontally, through enhanced competition, or vertically, through substituting capital for labour.
Spill overs are generally positive or small. However, there is also a negative side to MNE investment. They can drive
away local firms or leave them restricted to unattractive markets. Linkages between MNEs and local businesses
enhance knowledge transfer through spill overs, so it is important to build networks to increase linkages. Networks
can be formal and structured or informal, such guanxi networks in Taiwan. In such situations both sided have to
adapt to build functioning networks.
3. Business Groups
The advent of the business group as an economic institution can be traced back to the early decades of the twentieth
century, when large enterprises started gaining prominence, especially in the emerging economies. There were two
types of large enterprises operating-state-owned enterprises with a focus on specific types of industries; and
business groups with wide, unrelated (or related) product portfolios having pyramidal structures usually owned by
families. While state owned enterprises were on the decline by the 1980s, business groups remained central to large
enterprises and have become an important subject of study due to the three features i.e., unrelated products,
pyramidal structure and family-owned businesses. All of these are to some extent looked down upon. The pyramidal
structure of ownership allows promoters with relatively small shareholdings to divert economic benefits from
ordinary shareholders to themselves. These are typically family-owned businesses and economic power thus tends
to become concentrated in the hands of a few elite families with its attendant social and political consequences. On
the other hand, unrelated product diversification does not have the benefit of knowledge sharing and low cost of
production which comes from producing related product categories and suffers from the conglomerate discount
problem where the market value of the group is lower than the sum of individual units.
Business groups are organized under a collaboration mechanism between independent companies to enhance their
collective welfare. This is different from the market mechanism under which companies usually operate when they
coordinate through price signals in competitive settings. The literature on business groups recognizes two types of
business groups: there are network type business groups which function under the alliance principle, and there are
hierarchy type business groups which function under the authority principle. In network type business groups
functioning under the alliance principle, no individual firm holds controlling interests over other firms due to which
most scholars consider them as business networks rather than business groups. In hierarchy type business groups,
there is a holding company at the top of the hierarchy which controls legally independent operating units via
different economic mechanisms like equity ties, interlocking directorates and so on. Often these types of business
groups are family owned.
Hierarchy type business groups incorporate two different perspectives and business arrangements, and hence are
sub-divided into two categories – diversified business groups and pyramidal business groups. From the perspective
of the development economics and strategy literature, diversified business groups consist of product portfolios that
exhibit unrelated diversification and are legally independent firms operating in different industries under common
126

control in the form of equity or family ties. Their organizational structure differs from the usual multi-divisional
enterprise with related product portfolios which is the sort of large enterprise commonly found in mature industrial
economies. On the other hand, from the perspective of the finance and governance literature, there are business
groups that are arranged as pyramidal structures which consist of affiliated listed firms under a common shareholder
having the largest controlling interest. In such arrangements, one group firm is a controlled subsidiary of another.
This kind of arrangement may allow the tunnelling of profits at the cost of minority shareholder interests through the
separation of controlling rights from cash-flow rights. While both the perspectives are different, developmental and
strategic literature also looks at the intersection of diversified business groups having a pyramidal structure of
ownership which may be under family control. This is one of the dominant types of business groups that exist today,
and hence will be explored in further detail. The two approaches also recognize that the existence of business
groups is a reaction to market imperfections that ultimately results in the sub-optimal allocation of resources.
3.1 Business Groups and Alternative Structures
The alternative to business groups isn’t necessarily stand-alone firms. Groups of firms or businesses that share some
relation to each other are common. Individual lines of businesses or products are often legally separate entities.
Sometimes, different kinds of activity are housed within the same entity, only to be separated or sold at some
appropriate time. Examples could be GE, Johnson and Johnson and the Mitsubishi group.
For diversified business groups with unrelated products, alternative models would be mainly multidivisional
enterprises, conglomerate enterprises and holding company organizations. For pyramidal business groups, the
alternative is horizontal business groups where the shares of listed companies are directly held by controlling owners
and not through a subsidiary. Diversified business groups may have ownership structures that are pyramidal or
horizontal. We briefly describe the main alternatives to diversified business groups below. Diversified business
groups and comparable structures fall under multi-unit enterprises which consist of a headquarters unit and
operating units where division of labor occurs according to administrative control and actual production of goods and
services (Chandler, 1977). Allocation of resources and monitoring the performance of legally independent operating
units under subsidiaries and affiliates is carried out by the headquarters unit of business groups.
Multidivisional enterprises – Large enterprises in mature economies exhibit this type of structure which has related
product categories. Operating units are internal divisions or rather they are quasi-autonomous, self-contained
divisions (Chandler, 1962). Internal divisions can also be legally independent subsidiaries but are administered within
the enterprise i.e., they are under the strategic control of the headquarters’ unit which helps in capturing and
utilizing positive spill over effects in terms of knowledge and other benefits for common product categories.
Conglomerate enterprises – Another significant type of multi-unit enterprise that resembles business groups are
conglomerate enterprises in which product profiles are not as closely related thus leading to limited spill over effects
(Williamson, 1985). As a result, their internal control mechanism is less extensive. They may contain either internal
divisions or fully owned subsidiaries in multiple product categories which may be related or unrelated. Originally the
term ‘conglomerate’ refers to a company that diversified quickly through mergers and acquisitions in unrelated
products. To separate conglomerates from diversified groups, there are four aspects that need to be kept in mind:
ownership of head unit, top management, public trading status of operating unit and the administrative apparatus.
While diversified groups are mostly controlled by families, conglomerates are not confined to families but can be
publicly held corporations. Salaried professionals in top management carry out the critical decision-making for
conglomerates, but for diversified groups the main decision-making body is almost always the family. Conglomerates
own operating units as fully owned subsidiaries, while shares are listed and publicly traded for the operating units of
diversified business groups which allows for the possible tunnelling of profit. While conglomerates may retain
administrative control by the head unit only in terms of budget (financing and investment), diversified groups retain
administrative control by the head unit in terms of both strategic and some financial control.
Holding company organizations – According to Williamson (1975), holding companies have loose divisions in which
there is limited and unsystematic control between the headquarters unit and the operational units. They have a
narrow range of related products. They are similar to business groups in terms of being in a position of control by
virtue of its ownership of securities in other companies. The rationale may be to pyramid the voting control in order
to milk the operating companies as seen in the pyramidal structure of business groups.
Thus, the main difference between business groups and other forms of organization is in the degree of control and
the amount of diversification. Business groups have relatively tight control often with members of the family heading
subsidiaries and are more diversified. Multidivisional enterprises exhibit the most control and the least amount of
diversification. At the other extreme are holding companies that exhibit the least control but are more diversified.
127

All the alternatives to business groups rely on professional managers rather than on members of the family for
executive decisions.
3.2 Business Groups in Late and Early Industrializing Nations
In the twentieth century, as economies were going through a structural transformation into modern industrial
economies, business groups played a significant role. Most of the main economic players in emerging economies are
business groups that are family owned as well as government owned. Of the family-controlled groups, most are
diversified businesses while in the government-controlled groups, most are in petroleum related businesses or
financial services. Business groups in emerging economies usually consist of legally independent companies and, the
majority of them have two or more listed subsidiaries with a headquarters unit organized as a holding company.
From as early as the nineteenth century, family-owned business groups with diversified product portfolios and
pyramidal ownership operated in the form of mercantile businesses such as the British overseas merchants, or in
other business activities related to trading, manufacturing, distribution and financial services, e.g., the sixteenth
century Fugger family of Augsburg with subsidiaries throughout Europe. Thus, the international trading concerns
which formed the embryonic stage of modern industrialization and internationalization paved the way for large
enterprises to make their way into the modern global economy. These overseas trading companies came about as a
result of inter-country market imperfections which prompted them to explore overseas markets. However, if
inter-regional and inter-economy market imperfections relating to product, labor and capital markets are the reasons
for diversification, we would have seen more diversification for today’s multinationals across countries. Evidence
suggests that multinational corporations usually stick to their home country’s products when expanding in emerging
markets.
Historically, diversified business groups existed within continental Europe and matured industrial economies and
were not just confined to those engaged in international trade. They were mostly family-owned groups, but
mega-banks also functioned as apex organizations that controlled operating companies across diverse businesses.
Some of these bank-led groups were hierarchy type groups while others were involved only in financing relationships
while keeping themselves away from strategic/budgetary decisions. However, even if business groups were
operating historically in mature economies, collectively they remained secondary players to various small and
medium enterprises, or large enterprises with technologically related diversification.
The evolution of business groups in early and late industrializing economies shows some dissimilarity. In the early
industrialized economies, the development of the large enterprise sector experienced two waves. Initially, in the first
phase, business groups exhibited a diversified product portfolio. As the economy matured, during the second phase
large enterprises having related product portfolios came into existence. By contrast, in economies like Japan that
experienced late industrialization, business groups that started in the early phases of industrial development
collectively remained leading business organizations up to the twenty first century. The puzzle as to why diversified
business groups failed to sustain their dominance in mature economies such as that of North America and Europe,
even in the presence of market imperfections, remains to be explained.
One of the reasons could be the contrasting nature of internal capabilities possessed by business groups during the
early industrialization and the late industrialization phases. As diversified business groups in early industrializing
nations faced tough competition from large enterprises with technologically related and multidivisional models,
which became the mainstay of the economy, they retreated. Most such groups could not establish product specific
competitive assets or those which could transcend products/industries. Business groups in mature economies could
manage to survive only after strategic reorientation and re-concentration of their portfolios into product specific
competitive capabilities and specialized businesses. On the other hand, business groups in today’s emerging markets
have established themselves well in dealing with the competitive pressures of the twenty-first century business
environment. It is the kind of ownership that is responsible for accumulating competitive assets related to intangible
resources like administrative, financial or product-specific capabilities.
By the late nineteenth century pyramidal business groups were also functioning in countries like the United States,
Canada, and Europe. The evolution of such groups mostly depended on individual economies and specific
institutional conditions. For example, in Germany the pyramidal structure became popular after the second World
War due to dual class shares being banned. In the US, pyramidal structures were prominent before the New Deal
regulations were brought in during the 1930s. In other words, it is not just the degree of market imperfections in
relation to the level of economic development but also institutional forces that are independent of market forces
that influence the formation of pyramidal business structures.
128
Moreover, the formation of pyramidal structures in the US may not always have been motivated with the intent of
tunnelling profits, and the pyramid form gained prominence only after 1888 when laws were passed allowing
corporations to hold securities in other corporations. Also, by the late nineteenth century, the US market was
already a mature market. Therefore, pyramidal ownership structure in the US was not a substitute for market
imperfections at the institution level as such but probably, the conduct of some businessmen to create monopolistic
entities to distort competitive pricing.
3.3 Factors Leading to the Creation of Business Groups
3.3.1 Diversified Business Groups
a) Exogenous Factors
There are mainly two demand driven factors which facilitate the formation of business groups into diversified
product categories. The first is that of unfulfilled demand due to the lack of functioning markets possibly due to
underdevelopment. An example could be the lack of high-end products in rural markets. The size of the market may
be too small and risky for an individual firm to enter and serve. A business group with a diversified portfolio may be
able to pool risks better to serve the market. The second arises from government policy. Often developing countries,
such as India, have tried to pursue import substitution as a developmental strategy. It was felt that import of
consumer goods led to wastage of precious foreign exchange which could be better utilized for the import of capital
goods. Consequently, imports of foreign consumer goods were either banned or had to pay very high tariffs. As a
result, there was a sudden demand for domestic consumer goods, which were often met by domestic producers who
had no expertise in these sectors. This was sometimes accompanied by incentives, a supply side push, from the
government to produce certain goods which were deemed to be useful to the economy, such as fertilizers. It is no
surprise that manufacturers produced these goods regardless of their focus.
● Imperfect markets
One important strand of literature emphasizes market failure and imperfections as the cause behind the emergence
of business groups. It is felt that institutions and regulatory mechanisms are weak in developing economies, which
result in high transaction costs. Business groups are seen as a means to reduce these.
Product markets may not function well in spite of their being sufficient demand if there is an absence of suppliers
who can be trusted to provide good quality products. Inadequacy of information along with weak contract
enforcement may prompt business groups to diversify into different unrelated categories, creating an umbrella
brand. Diversified groups can also act as a substitute for imperfect capital markets by creating channels for internal
capital transfer within the group to invest in new businesses, when investors are unwilling to invest in markets with
poor protective measures. This may help mitigate risk if the business group has a well-established reputation.
Business groups are also a response to labour market imperfections that arise due to a lack of qualified employees in
emerging economies. Business groups can establish their own training facilities, or rotate personnel to create their
own internal labour market which make them more efficient compared to the external market.
● Role of the government
The second critical factor that facilitates the formation of business groups is government aid. In this argument, the
government supports particular industries and promotes industrialization. The government provides them with the
necessary funds, charges lower interest, provides subsidies and protects the domestic market. Once the government
moves on to more advanced industries, businesses collaborating with the government may upgrade their capabilities
and diversify (Studwell 2014). However, government favours may lead to irregularities in the market relating to crony
capitalism and rent seeking.
b) Endogenous Factors
Endogenous factors look at the internal competitiveness and capabilities of diversified groups. Normally, firms with
access to new technology (whether developed internally or sourced from outside) should be able to purchase or
develop these abilities and introduce new products in the market. However, in many developing markets, access to
new technology is unavailable. Business groups with access to foreign firms or with the government, may be better
able to develop these technologies. It is easier for business groups to enter into joint ventures or other technology
transfer contracts.
129

This paves the way for profit opportunities for business groups in emerging markets through project management
and start-up capabilities. Business groups, therefore, diversify into different categories which may be related or
unrelated. As new plants start functioning, the accumulated project management capabilities act as competitive
assets which prompt business groups to explore new industries. As the market matures, businesses would tend to
specialize in core domains and technologically related areas. However, on the whole they remain diversified due to
what some have termed as ‘trans-product’ capabilities resulting in shareable knowledge across product related
categories giving them a sustainable advantage even in competitive markets.
3.3.2 Pyramidal Business Groups
Pyramidal business groups exist because of the controlling interest that comes with limited capital investment via
pyramiding that allows for the tunnelling of profits. Separating the cash flow rights from control rights comes at the
cost of minority shareholders. However, in developing economies, where investor protection and contract
enforcement are weak, minority shareholders may not be directly affected if general shareholders accept the
probability of profit diversion and share prices are discounted. Another reason for the development of pyramidal
business groups was because profitable groups could subsidize unprofitable or nascent units for the group’s collective
prosperity. Even when markets mature, pyramidal structures endure because of invisible assets like group reputation
or political connections. Also, there may be certain advantages relating to taxes and subsidies when state-owned
enterprises are privatized. Hence, pyramidal group structures may remain even if there are societal costs such as
transfer of profits from minority shareholders, the underdevelopment of capital markets and the concentration of
economic power in the hands of a few wealthy families.
3.4 The Evolution of Business Groups
One might conclude that business groups should eventually die out as they have done in the mature economies in
America (Canada and USA) and in Europe. To be sure there are some old-style business groups that still function but
usually their numbers are small and their role in the economy is not significant. Japan could also be cited as an
example where business groups have withered away. However, they are still going strong in countries such as Korea
and Thailand. One may say that given sufficient time and market style reforms that business groups must eventually
disappear. That may be so, but how long will that take and to what extend should markets be liberalized ? Most
economies, some more than others, suffer from some amount of market imperfections and should therefore remain
a happy hunting ground for business groups.
Also, non-market forces such as politics and legal institutions have played their part in determining the laws and
regulation of capital markets. As long as these factors are present, pyramidal business groups will exist within the
institutional framework of the relevant economies, even if there are long run shifts towards a competitive market
structure. Pyramidal ownership structures may also survive because controlling shareholders may have other
incentives than tunnelling profits such as control of economic wealth that is larger than the actual holdings, they
have in order to leverage the economic gains from favourable business transactions. They might also want to hold on
to non-economic benefits like political power and social prestige which comes from adopting a pyramidal structure.
Maintaining a pyramidal structure can also lower market risks by controlling shareholders, for innovative new
products, by holding operating units legally independent and isolating the risk.
Business groups especially those that are family owned with a diversified portfolio have been searching for an
effective organization model as they deal with market developments. On the one hand they are faced with
increasing domestic and foreign competition and on the other they are entering complex industries such as
information technology and financial services. Their problems are compounded by the amount and complexity of
information that the executives at the headquarters and the members of the family have to deal with. According to
Chandler, this “overload in the decision making at the top” was the reason behind the advent of the multidivisional
structure of modern corporations.
The reason behind their entry into complex industries is that these are industries that afford the most opportunities
for growth and profits. It is usually difficult to generate high profits from mature industries with many competitors.
However, this poses strains on the capacity of the higher management. One possibility would be to relinquish control
to professional managers. A second problem relates to retention of capabilities that make the business group
profitable in the first place. The entry into new businesses reduces the shared knowledge and coordination that is
necessary. One solution is to arrange related products into strategic business units so that these can share
information and coordination. The owners then can act more like portfolio managers, choosing which businesses to
130
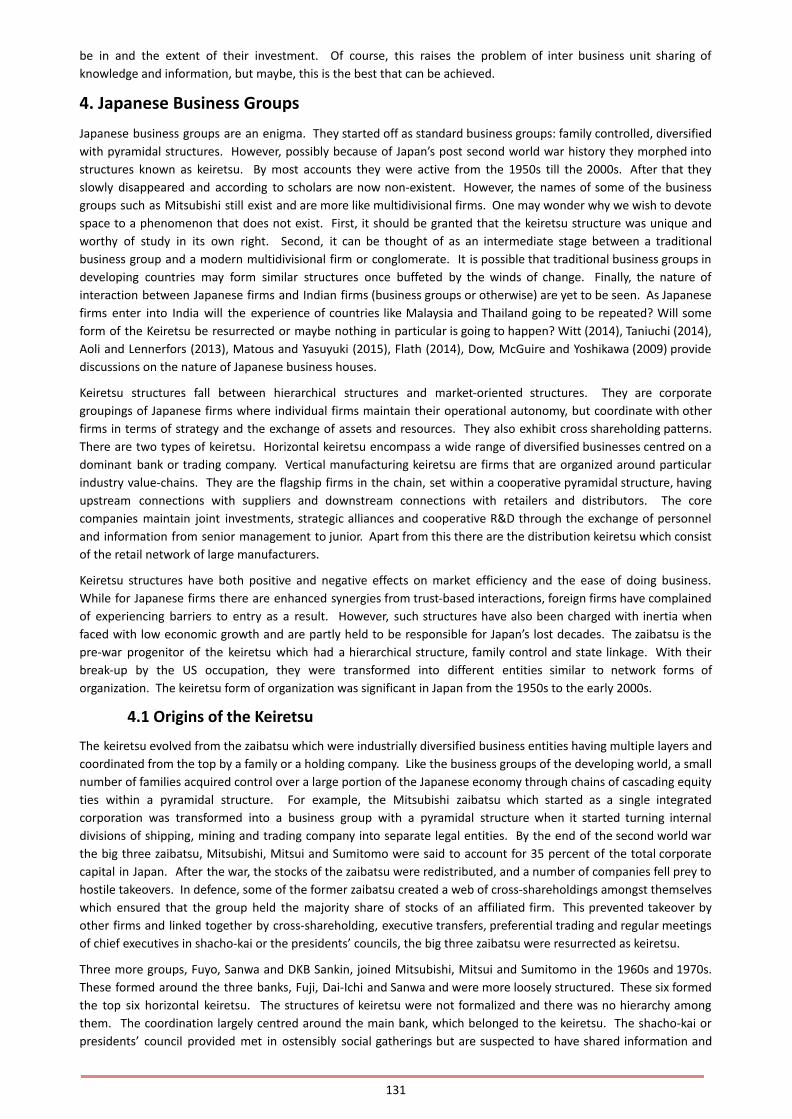
be in and the extent of their investment. Of course, this raises the problem of inter business unit sharing of
knowledge and information, but maybe, this is the best that can be achieved.
4. Japanese Business Groups
Japanese business groups are an enigma. They started off as standard business groups: family controlled, diversified
with pyramidal structures. However, possibly because of Japan’s post second world war history they morphed into
structures known as keiretsu. By most accounts they were active from the 1950s till the 2000s. After that they
slowly disappeared and according to scholars are now non-existent. However, the names of some of the business
groups such as Mitsubishi still exist and are more like multidivisional firms. One may wonder why we wish to devote
space to a phenomenon that does not exist. First, it should be granted that the keiretsu structure was unique and
worthy of study in its own right. Second, it can be thought of as an intermediate stage between a traditional
business group and a modern multidivisional firm or conglomerate. It is possible that traditional business groups in
developing countries may form similar structures once buffeted by the winds of change. Finally, the nature of
interaction between Japanese firms and Indian firms (business groups or otherwise) are yet to be seen. As Japanese
firms enter into India will the experience of countries like Malaysia and Thailand going to be repeated? Will some
form of the Keiretsu be resurrected or maybe nothing in particular is going to happen? Witt (2014), Taniuchi (2014),
Aoli and Lennerfors (2013), Matous and Yasuyuki (2015), Flath (2014), Dow, McGuire and Yoshikawa (2009) provide
discussions on the nature of Japanese business houses.
Keiretsu structures fall between hierarchical structures and market-oriented structures. They are corporate
groupings of Japanese firms where individual firms maintain their operational autonomy, but coordinate with other
firms in terms of strategy and the exchange of assets and resources. They also exhibit cross shareholding patterns.
There are two types of keiretsu. Horizontal keiretsu encompass a wide range of diversified businesses centred on a
dominant bank or trading company. Vertical manufacturing keiretsu are firms that are organized around particular
industry value-chains. They are the flagship firms in the chain, set within a cooperative pyramidal structure, having
upstream connections with suppliers and downstream connections with retailers and distributors. The core
companies maintain joint investments, strategic alliances and cooperative R&D through the exchange of personnel
and information from senior management to junior. Apart from this there are the distribution keiretsu which consist
of the retail network of large manufacturers.
Keiretsu structures have both positive and negative effects on market efficiency and the ease of doing business.
While for Japanese firms there are enhanced synergies from trust-based interactions, foreign firms have complained
of experiencing barriers to entry as a result. However, such structures have also been charged with inertia when
faced with low economic growth and are partly held to be responsible for Japan’s lost decades. The zaibatsu is the
pre-war progenitor of the keiretsu which had a hierarchical structure, family control and state linkage. With their
break-up by the US occupation, they were transformed into different entities similar to network forms of
organization. The keiretsu form of organization was significant in Japan from the 1950s to the early 2000s.
4.1 Origins of the Keiretsu
The keiretsu evolved from the zaibatsu which were industrially diversified business entities having multiple layers and
coordinated from the top by a family or a holding company. Like the business groups of the developing world, a small
number of families acquired control over a large portion of the Japanese economy through chains of cascading equity
ties within a pyramidal structure. For example, the Mitsubishi zaibatsu which started as a single integrated
corporation was transformed into a business group with a pyramidal structure when it started turning internal
divisions of shipping, mining and trading company into separate legal entities. By the end of the second world war
the big three zaibatsu, Mitsubishi, Mitsui and Sumitomo were said to account for 35 percent of the total corporate
capital in Japan. After the war, the stocks of the zaibatsu were redistributed, and a number of companies fell prey to
hostile takeovers. In defence, some of the former zaibatsu created a web of cross-shareholdings amongst themselves
which ensured that the group held the majority share of stocks of an affiliated firm. This prevented takeover by
other firms and linked together by cross-shareholding, executive transfers, preferential trading and regular meetings
of chief executives in shacho-kai or the presidents’ councils, the big three zaibatsu were resurrected as keiretsu.
Three more groups, Fuyo, Sanwa and DKB Sankin, joined Mitsubishi, Mitsui and Sumitomo in the 1960s and 1970s.
These formed around the three banks, Fuji, Dai-Ichi and Sanwa and were more loosely structured. These six formed
the top six horizontal keiretsu. The structures of keiretsu were not formalized and there was no hierarchy among
them. The coordination largely centred around the main bank, which belonged to the keiretsu. The shacho-kai or
presidents’ council provided met in ostensibly social gatherings but are suspected to have shared information and
131

provided mutual assistance. In fact, it is difficult to determine which firms belonged to which keiretsu and some
seemed to belong to more than one. However, a reasonably reliable indicator was membership in the council. Thus,
keiretsu can be thought of as loose alliances of reasonably independent firms. New firms could also be drawn into
their orbit through trading or lending relations. So, the structures also changed with time and were more fluid than
is usually suggested.
The second major form of the keiretsu was the vertical form. It comprised of manufacturing groups: suppliers and
subcontractors organized across a vertical division of labour around a large industrial firm. There is no counterpart to
the shacho-kai in a vertical keiretsu but there is a loose association of suppliers maintained by manufacturers which
are co-operative in nature. However due to the vertical structure, personnel from the vertical keiretsu have greater
cohesion which enables better co-ordination between suppliers and consumers. They also have improved personnel
flows through exchange of engineers and other trained executives, and the transfer of executives from higher to
lower-tier firms which prevents their redundancy and ensures the adherence to lifetime employment norms.
Because of the support displayed between upstream and downstream firms in a vertical keiretsu there is risk sharing
with each party supporting the other and absorbing some of the cost and risk.
It may be assumed that horizontal and vertical keiretsu are distinct business structures. However, that is not the case
and horizontal keiretsu may have vertical keiretsu within them. Furthermore, the vertical keiretsu may have firms
that belong to the orbit of several horizontal keiretsu. For example, the Toyota group is a vertical keiretsu aligned
with the Mitsui horizontal keiretsu. However, Daihatsu, which belongs to the Toyota vertical keiretsu belonged to the
Sanwa horizontal keiretsu.
Identifying which firms belong to which keiretsu, under the circumstances, is a difficult task, not that it has stopped
scholars from trying. However, to some extent all such attempts are arbitrary. One way to identify firms within a
group is to use a network clustering algorithm using data on trade, lending, equity and direct transfer ties. This was
done by Lincoln and Gerlach (2004) by taking many of the largest financials and trading companies in the Japanese
economy during the period 1978-1998. The keiretsu can be observed as blocks or clusters of firms that occupy
structurally equivalent positions in the network. However, every three years from 1978 to 1998, distinct keiretsu
clusters are seen. Earlier clusters show more clearly and in each succeeding period the empirically derived groups
were fuzzier. By the 1990s, large-firm networks don’t show up that clearly and point to the demise of the keiretsu.
However, that does not necessarily indicate that ties between clusters do not exist. It may be that the clusters have
changed shape and may now be geographical or industry based. It may be worthwhile to use the existent data and
analyse them according to the advances made in network economics.
Apart from their evolution from the pre-war zaibatsu, there were a range of forces that drew the firms into tighter
relationships. Equally, there were forces which tended to push them apart. Banking relations, equity ties and sharing
of personnel drew them together. Sometimes geographical proximity or the use of bailouts had the same effect. On
the other hand, many keiretsu also expanded by setting up divisions with new products that were separate
companies under the support and control of a parent firm. This was different from the kind of autonomy that their
counterparts in mature economies enjoyed. Due to the strong culture and tight organization of Japanese enterprises,
the keiretsu satellite created a substitute quasi-intrapreneurial business environment.
Keiretsu like business groups in emerging economies pursued strategies of unrelated diversification. There were
however differences between horizontal and vertical keiretsu. Horizontal keiretsu usually contained at least one firm
from the major industrial sectors. In the vertical keiretsu, upstream suppliers or downstream distributors to a large
manufacturer often diversified and expanded into other arenas. For e.g. Toyota started off as an assembler of sedans
but expanded its product line to include trucks, minicars through its keiretsu partnerships with Hino and Daihatsu,
respectively.
4.2 Impact of Keiretsu
The keiretsu structure can be evaluated in terms of their overall impact on the development of the post war Japan
economy. This can be done through the lens of development economics or through other sub disciplines in
economics. Quite often scholars from other areas such as strategy and finance have also waded in.
The received view is that the keiretsu structure helped to overcome market imperfections and institutional
deficiencies. First, it helped firms get access to funds for the purpose of investment when Japanese capital markets
were not serving the purpose. Secondly, given the deficiencies of the Japanese distribution systems the keiretsu
system allowed firms to bypass these provided coordination and economies of scale. Third, the system allowed firms
to set up upstream and downstream firms for the inputs and distribution, at a time where supply chains were
132

virtually non-existent. Finally, it also allowed entrepreneurs within the firms to innovate and come out with new
products, which went on to become successful firms on their own. This was an important role at a time when
venture capital was largely absent.
There is a considerable amount of disagreement about the microeconomic effects of Keiretsu, ranging from
significant to no effect. The arrangements for information sharing and cooperation would raise the suspicion of
antitrust economists, who could sniff cartelization as well as abuse of dominance. If that was the case the financial
performance of Keiretsu companies would be better than non-keiretsu firms: but that was not the case. The Keiretsu
structures could also be viewed as economizing on transaction and agency costs, but that also should be reflected in
superior performance. According to some, all that Keiretsu system does is risk sharing and resource shifting among
affiliated firms. For example, in the 1970s, Sumitomo Bank rescued the Mazda Motors though bank loans, arranging
for lower input prices, sending managers and other actions. There is a fair amount of evidence that affiliates in
distress have received significant help from their Keiretsu partners which led to the restoration of their fortunes. Yet
when it comes to the economic viability of the groups, this could happen at the expense of their high performing
counterparts. Thus, the Keiretsu system could be viewed as a set of transfer payments from the better performing
firms to the poorer performing ones. This might have helped stave of bankruptcies and maintain the system of
lifetime employment and no layoffs, but it didn’t provide good returns to the investor.
For the vertical keiretsu, the close and collaborative buyer-supplier relationships prevalent in vertical structures lead
to efficiency and innovation as documented by numerous studies. More than the horizontal keiretsu, the vertical
version seems to perform an economically important function. The high degree of trust, information sharing,
efficient governance due to relationship specific investments along with relatively customized processes make
businesses more likely to choose keiretsu suppliers than independent suppliers when the complexity and specificity
of the parts sourced is high. Similar to the horizontal keiretsu, vertical keiretsu have also been able to share and pool
risk. For example, a study finds that suppliers to Japanese auto assemblers are more protected from the risk of
demand fluctuations, which the car companies have to deal with.
4.3 Keiretsu: The End?
By the 1980s the breakdown of the keiretsu structure was evident. An examination of specific ties like equity ties
document the unravelling of the keiretsu. Major banks and insurance companies sold off their cross shareholding
and replaced them with foreign institutional shareholders. During the 1990s, keiretsu risk sharing activity declined
further and Japanese firms like the Japanese electronics businesses began aligning themselves less with keiretsu
firms and started forming strategic alliances with other domestic firms instead, especially in areas such as research
and development. The keiretsu structure gave way to holding companies and conglomerates. The result can be seen
in Table 4.1. The old and venerable Mitsubishi, Mitsui and Sumitomo are still there but the extent of intra group links
is unclear. Some of the old keiretsus have like Fuyo and Daiichi Kangyo have dissolved following restructuring. The
number of banks has reduced and are no longer, ostensibly, tied to the keiretsus. This has resulted in the emergence
of MUFJ, Mizuho, Nomura and SMBC. Companies like Toyota and Matsushita, which were part of vertical keiretsus,
still remain. A slew of new firms such as Rakuten, Uniqlo and Softbank have emerged. So the business landscape of
Japan now exhibits considerable variety. The following are the main reasons for the decline: banking consolidation,
change in accounting rules, corporate governance reform, technological change and lack of cultural and political
legitimacy.
They are discussed below:
1. Banking consolidation: A wave of Japanese bank consolidations during the end of the 1990s brought lasting
changes to the financial services landscape. This in turn altered the structure of Japanese banking and their
linkage with the horizontal groups. These mergers were large in scale and reduced the number of banks that
were supporting the keiretsu. Apart from banks, industrial mergers also took place beyond the keiretsu
association. A parallel consolidation of non-keiretsu industrial partners led to the formation of alliances
related to distribution and maintenance.
2. Change in accounting rules: To increase the transparency of Japanese firms, financial reports were required to
include the results of all affiliates however small the stake in the affiliate. The tunnelling of profits ascribed to
business groups was possible under old accounting rules which allowed companies to hide assets and
liabilities of associated firms. The new accounting rules prohibited keiretsu practices like transferring
personnel to affiliates or bailouts. A major rule that led to the unravelling of the keiretsu structure was the
reporting of assets at market value rather than book value. Many banks were discovered to be worse off and
insufficiently capitalized to support their lending activities. Thus, banks had to offload their cross-held shares.
133
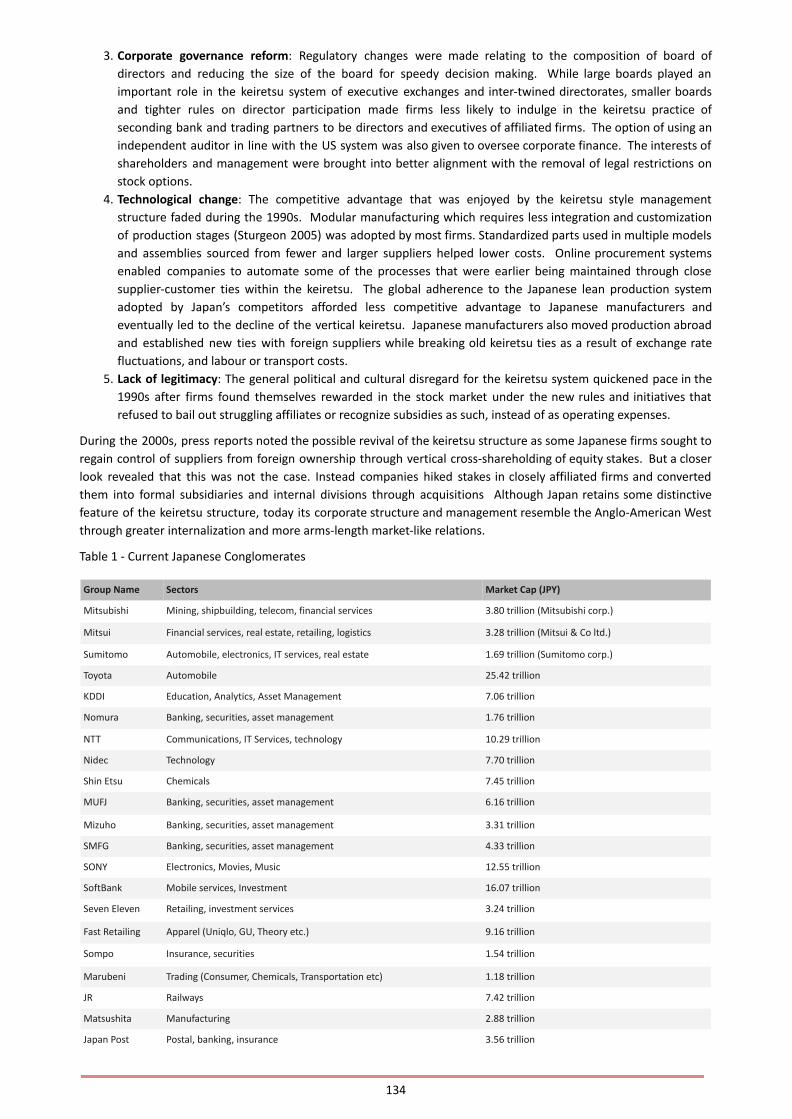
3. Corporate governance reform: Regulatory changes were made relating to the composition of board of
directors and reducing the size of the board for speedy decision making. While large boards played an
important role in the keiretsu system of executive exchanges and inter-twined directorates, smaller boards
and tighter rules on director participation made firms less likely to indulge in the keiretsu practice of
seconding bank and trading partners to be directors and executives of affiliated firms. The option of using an
independent auditor in line with the US system was also given to oversee corporate finance. The interests of
shareholders and management were brought into better alignment with the removal of legal restrictions on
stock options.
4. Technological change: The competitive advantage that was enjoyed by the keiretsu style management
structure faded during the 1990s. Modular manufacturing which requires less integration and customization
of production stages (Sturgeon 2005) was adopted by most firms. Standardized parts used in multiple models
and assemblies sourced from fewer and larger suppliers helped lower costs. Online procurement systems
enabled companies to automate some of the processes that were earlier being maintained through close
supplier-customer ties within the keiretsu. The global adherence to the Japanese lean production system
adopted by Japan’s competitors afforded less competitive advantage to Japanese manufacturers and
eventually led to the decline of the vertical keiretsu. Japanese manufacturers also moved production abroad
and established new ties with foreign suppliers while breaking old keiretsu ties as a result of exchange rate
fluctuations, and labour or transport costs.
5. Lack of legitimacy: The general political and cultural disregard for the keiretsu system quickened pace in the
1990s after firms found themselves rewarded in the stock market under the new rules and initiatives that
refused to bail out struggling affiliates or recognize subsidies as such, instead of as operating expenses.
During the 2000s, press reports noted the possible revival of the keiretsu structure as some Japanese firms sought to
regain control of suppliers from foreign ownership through vertical cross-shareholding of equity stakes. But a closer
look revealed that this was not the case. Instead companies hiked stakes in closely affiliated firms and converted
them into formal subsidiaries and internal divisions through acquisitions Although Japan retains some distinctive
feature of the keiretsu structure, today its corporate structure and management resemble the Anglo-American West
through greater internalization and more arms-length market-like relations.
Table 1 - Current Japanese Conglomerates
Group Name Sectors Market Cap (JPY)
Mitsubishi Mining, shipbuilding, telecom, financial services 3.80 trillion (Mitsubishi corp.)
Mitsui Financial services, real estate, retailing, logistics 3.28 trillion (Mitsui & Co ltd.)
Sumitomo Automobile, electronics, IT services, real estate 1.69 trillion (Sumitomo corp.)
Toyota Automobile 25.42 trillion
KDDI Education, Analytics, Asset Management 7.06 trillion
Nomura Banking, securities, asset management 1.76 trillion
NTT Communications, IT Services, technology 10.29 trillion
Nidec Technology 7.70 trillion
Shin Etsu Chemicals 7.45 trillion
MUFJ Banking, securities, asset management 6.16 trillion
Mizuho Banking, securities, asset management 3.31 trillion
SMFG Banking, securities, asset management 4.33 trillion
SONY Electronics, Movies, Music 12.55 trillion
SoftBank Mobile services, Investment 16.07 trillion
Seven Eleven Retailing, investment services 3.24 trillion
Fast Retailing Apparel (Uniqlo, GU, Theory etc.) 9.16 trillion
Sompo Insurance, securities 1.54 trillion
Marubeni Trading (Consumer, Chemicals, Transportation etc) 1.18 trillion
JR Railways 7.42 trillion
Matsushita Manufacturing 2.88 trillion
Japan Post Postal, banking, insurance 3.56 trillion
134
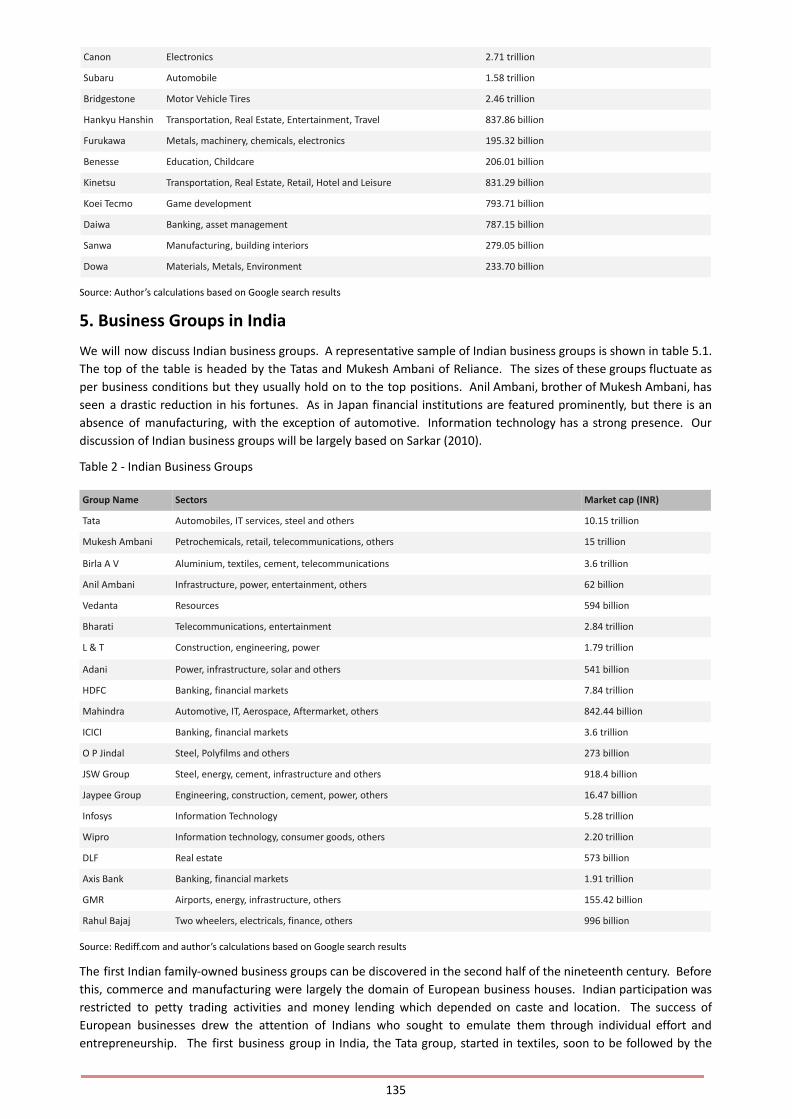
Canon Electronics 2.71 trillion
Subaru Automobile 1.58 trillion
Bridgestone Motor Vehicle Tires 2.46 trillion
Hankyu Hanshin Transportation, Real Estate, Entertainment, Travel 837.86 billion
Furukawa Metals, machinery, chemicals, electronics 195.32 billion
Benesse Education, Childcare 206.01 billion
Kinetsu Transportation, Real Estate, Retail, Hotel and Leisure 831.29 billion
Koei Tecmo Game development 793.71 billion
Daiwa Banking, asset management 787.15 billion
Sanwa Manufacturing, building interiors 279.05 billion
Dowa Materials, Metals, Environment 233.70 billion
Source: Author’s calculations based on Google search results
5. Business Groups in India
We will now discuss Indian business groups. A representative sample of Indian business groups is shown in table 5.1.
The top of the table is headed by the Tatas and Mukesh Ambani of Reliance. The sizes of these groups fluctuate as
per business conditions but they usually hold on to the top positions. Anil Ambani, brother of Mukesh Ambani, has
seen a drastic reduction in his fortunes. As in Japan financial institutions are featured prominently, but there is an
absence of manufacturing, with the exception of automotive. Information technology has a strong presence. Our
discussion of Indian business groups will be largely based on Sarkar (2010).
Table 2 - Indian Business Groups
Group Name Sectors Market cap (INR)
Tata Automobiles, IT services, steel and others 10.15 trillion
Mukesh Ambani Petrochemicals, retail, telecommunications, others 15 trillion
Birla A V Aluminium, textiles, cement, telecommunications 3.6 trillion
Anil Ambani Infrastructure, power, entertainment, others 62 billion
Vedanta Resources 594 billion
Bharati Telecommunications, entertainment 2.84 trillion
L & T Construction, engineering, power 1.79 trillion
Adani Power, infrastructure, solar and others 541 billion
HDFC Banking, financial markets 7.84 trillion
Mahindra Automotive, IT, Aerospace, Aftermarket, others 842.44 billion
ICICI Banking, financial markets 3.6 trillion
O P Jindal Steel, Polyfilms and others 273 billion
JSW Group Steel, energy, cement, infrastructure and others 918.4 billion
Jaypee Group Engineering, construction, cement, power, others 16.47 billion
Infosys Information Technology 5.28 trillion
Wipro Information technology, consumer goods, others 2.20 trillion
DLF Real estate 573 billion
Axis Bank Banking, financial markets 1.91 trillion
GMR Airports, energy, infrastructure, others 155.42 billion
Rahul Bajaj Two wheelers, electricals, finance, others 996 billion
Source: Rediff.com and author’s calculations based on Google search results
The first Indian family-owned business groups can be discovered in the second half of the nineteenth century. Before
this, commerce and manufacturing were largely the domain of European business houses. Indian participation was
restricted to petty trading activities and money lending which depended on caste and location. The success of
European businesses drew the attention of Indians who sought to emulate them through individual effort and
entrepreneurship. The first business group in India, the Tata group, started in textiles, soon to be followed by the
135

Khataus, Birlas and Mafatlals. The original formation of Indian business groups owed much to entrepreneurial
enthusiasm, the example of successful European business activities and the formation of a large single market
through British rule.
The evolution of group structure was aided by the role that family finance played in promoting new ventures for
Indian entrepreneurs. An underdeveloped stock market and banking system, under the control of the British, who
were loath to help Indians were the reason behind this development. Consequently, these enterprises became joint
stock companies with shares owned by family members and friends and acquaintances. The profits from the original
companies were reinvested into other new concerns, partly because the size of the market was small and there were
many opportunities in a developing economy. Thus, group of companies formed that were associated with a
particular family and there were a number of such business groups. Some of these groups developed a pyramidical
structure.
Each group also had a managing agency, as a proprietorship or partnership comprising family members that was
entrusted with managerial responsibilities. Not only did this help with vertical and horizontal integration which
generated scale economies, but it also helped address the problems of a deficient managerial market in the early
years of industrialization. Further, all this could be achieved without market-based transactions, which would have
been the norm if the members of the business groups had been independent companies.
These family-based business groups benefitted from the extremely strong ties of trust and reciprocity that exist
within the Indian joint family structure and also within certain communities. This characteristic conforms to the
sociological perspective on the formation of business groups which accentuate the network effect. They were also
diversified structures that were legally independent under common family administered control and as such were
full-fledged economic entities which pursued economic goals. Such groups were also seen as an institutional
response to weak institutions and missing markets and helped develop both the firm and the market. Thus, they
adhered to all the standard criteria associated with business groups in many of these key aspects. During this period,
the revenues generated, and experience gained helped in the sustenance of internal capital as well as the
development of the labour market, which in turn enabled groups to overcome market imperfections and generate
further growth for the economy. Indian family groups proliferated and their share in capital employed went from 13
percent to 34 percent in the 1918-39 period with three of the top four groups being owned by Indians. As such, the
business groups, though much maligned in later years and probably even now, were instrumental in the development
process of India.
5.1 Regulation and Deregulation (1947-2006)
The institutional environment in the case of business groups for the years 1947 to 2006 can be broken up into 3
distinct periods: the time taken from their inception in the late nineteenth century to 1947, the post-independence
period up to 1991 when the environment was extensively regulated and subsequently the period of liberalization and
globalization that was ushered in for the Indian economy post 1991. The economic development of India under
colonial rule has been extensively discussed. On the one hand industry benefitted from being a part of the globalized
British empire and planted roots in foreign countries, but overall the policies of the British were not geared towards
the economic development of India and India performed dismally in terms of traditional measures of economy as
increase in GDP per capita.
After independence in 1947 the state adopted a protectionist attitude and contrived to control the “commanding
heights of the economy.” The regulated industry policy entrusted a dominant role to the public sector and a residual
role to the private sector. The policy of import substitution along with industrial/import licensing, infant industry
protection and regulations to curb the concentration of economic power ensured that domestic industrial capabilities
could not be effectively built up under protected markets. The private sector tried to cope as best it could under very
challenging circumstances. Restrictions on expansion in core businesses led to an increase in the portfolio of
businesses for business group. Expand where you can get a license was the motto. The protectionist and import
substitution policies of the government spawned the growth of many firms. The eviction of Coca Cola saw Indian
substitutes emerge such as Thums Up and Campa Cola. The retreat of IBM let to the emergence of personal
computer manufacturers such as HCL and Wipro.
With mounting evidence on the ineffectiveness of the licensing regime to achieve economic growth or to offer social
justice (as the ostensible reason for regulation), attempts were first made to liberalize the economy during the 1980s,
which failed. The Indian economy which had begun to slow down faced a foreign-exchange crisis in 1991 which led
to structural reforms in its industrial and trade policy regime. The abolition of licensing and removal of curbs placed
on large businesses eventually made business houses able to expand, invest and diversify post 1991. Reducing trade
136
barriers, deregulating the banking sector, allowing free pricing of primary issues and transparency in the stock
market, permitting foreign institutional investors to provide low-cost finance were other measures that were
initiated.
5.2 Indian Business Groups: Some Distinctive Features
Business groups in India are characterized by family ownership, diversified portfolios and pyramidal structures as per
the standard definition of business groups. Ownership is through equity as well as through administrative control.
Perhaps the standout feature of Indian business groups is the importance of family, ethnicity or community.
There were 2922 firms affiliated with 560 business groups as identified from the Prowess database in 2006. Group
affiliates together account for almost 70 percent of asset share in 2006. The concentration of business groups
though meant that only a few large groups (around 4) would account for most of the share of business assets. This
persisted in spite of the development of the market. There was some turnover of rankings prior to 2000 among the
top twenty with 11 new entrants and 9 previous ones. However, ranks have not changed much since then and there
not much change in the distribution, so that by 2006, six of the groups belonged to the pre-independence period (the
oldest being Tata), nine belonged to the regulated period of the 1950-70s, and the remaining belonged to the post
liberalization period.
Family ownership has been through holding company structures, either in the form of a single holding company like
the Tata group or multiple ones like the Anil Dhirubhai Ambani group. Sometimes there is no holding company but a
flagship company at the helm around which has subsidiaries, private companies and trusts where family members
have stakes. These are often organized as pyramids but also have intra group shareholdings, making the structure
very complicated. While the owner or promoter of the group has absolute control, it can also exert informal control
over affiliates lower in the pyramid with only minor equity stakes. In the period 2001-06, the direct stake of
promoters was 41 percent whereas indirect ownership amounted to 5.35 percent. However, direct ownership by
family members was relatively low. The family influence was indirect, either through closely held group holding
companies (Tata Steel and Reliance Communications) or through other privately-owned companies (Reliance
Industries and Hindalco Industries) owned by promoters. Tunnelling of earnings has been a consistent concern with
Indian business groups. The extent of tunnelling is difficult to detect given the complex structures of these groups.
In fact, it is difficult to even appropriately value these groups given incomplete knowledge of earnings and
shareholdings.
Two features of group affiliates are promoters as directors, and multiple directorships. The percentage of companies
in which the promoter serves as director or managing director is higher for group affiliates than non-affiliated
companies while the percentage of directors with three or more directorships continues to remain high (56 percent
against 6 percent in the US). Business groups have more insider directors with multiple directorships compared to
ones which do not belong to business groups. This is also true for independent directors with multiple directorships.
Managerial integration is also achieved via an inner circle among group affiliates from which most inside directors as
well as independent directors emerge (often from a single group). This is in contrast to the inside or independent
directors of non-affiliates where a larger share of directors from both categories are concentrated in non-affiliates
themselves rather than affiliated group companies.
5.3 Dealing with the Business Environment
The first notable feature of Indian business groups is diversification. Though family-based business groups are by
nature diversified, the scale of diversification in India is very high. However, this was driven more by environmental
factors than deliberate strategy. During the colonial period lack of competitors and a large market coupled with
business opportunities saw business groups expand into many unrelated areas. Even though, business groups
differed in size and their portfolios they had similar strategies for expansion.
During the license regime raj business groups continued their march towards diversification, only their reasons were
different. They were now faced with a government policy that looked at them with suspicion and stymied their
efforts on expanding their businesses. Business groups developed considerable ingenuity in expanding regardless of
such impediments. The primary weapon in the hands of the government were industrial licenses, that were required
for any sort of production among licensed goods. Access to credit and foreign exchange and imports were also
rationed. Once a particular firm within a business group reached its licensed production limit it had to diversify into
other industries. They could not pick and choose but had to produce what they could get licenses for, though they
could get licenses through their ability to work the system.
137

Economic liberalization and the subsequent deregulation and development of the external and internal markets
raised questions about the relevance of unrelated diversification. Some felt that there would be a wave of mergers
and acquisitions as business groups rationalized their businesses based on a coherent strategy. It should be
mentioned that Indian markets, both external and internal are far from perfect, and if one were to search for market
imperfection to justify the existence of business groups, many such examples can be found. Nevertheless, the
process of liberalization and deregulation saw many firms streamline their businesses.
The strategic responses of Indian business groups during the post reform period varied. While some groups focused
on core competencies, some diversified either extensively or in select product categories. For the period 1991 to
2006, the core industries of Indian groups (with the exception of one group) remained the same. While some chose
to expand their core businesses (e.g. Reliance), others also pursued different lines of activity relative to their core
industry (e.g. Tata).
Unrelated diversification has also been observed along vertical lines. Firms may be tempted to avoid transaction
costs through vertical integration which in turn can also lead to diversification. For example, Reliance started in the
1960s with textiles and moved to in-house production of rayon because of the market failed to provide adequate
quantity and quality. As a result, the company moved forward through vertical integration into retail and backward
into petrochemicals and gas, and subsequently leveraged this experience to foray into unrelated industries like
cement and telecommunications.
The post-reform period also witnessed the growing internationalization of group companies through outward direct
foreign investment (ODFI). Even during the license raj regime Indian business groups ventured abroad given the
problems they faced at home, even though the regulatory regime was far from conducive to such expansion. Initially
they concentrated on manufacturing in developing economies: an environment that they were much more familiar
with Later they changed their focus to services and developed economies. The post liberalization period not only
brought about market expansion through ODFI but also improved their global competitiveness and by creating value
chains through backward and forward linkages to become competitive globally. Most of the global acquisitions were
done through group affiliated companies. The forward linkages were focused on developing marketing and sales
capabilities in developed economies to be served by low-cost domestic operations.
5.4 How have they fared?
As far as performance is concerned, there is no significant difference in the performance of affiliated group
companies compared to stand-alone firms. Groups did not outperform stand-alone firms and their profits moved in
tandem. However, group affiliated companies were larger in terms of sales and assets, more leveraged and older,
when compared to non-affiliated companies. Business group affiliated companies have expended into information
technology services, where Indian companies have demonstrated superior performance. They have also moved into
financial services, telecommunications and retail. In these new markets they have not demonstrated better
performances than stand-alone firms.
The experiences of business groups can be summed up by the old adage: the more things change the more they
remain the same. Business groups have had to face challenging environments as they evolved in different
institutional regimes. They have changed strategies, diversified and expanded along the way. There has been some
turmoil, with changes in the fortunes of some. However, they have more than managed to hold their own. The
disappearance of the business group in India is quite some distance away.
6 Japanese firms in India
According to the Japanese embassy the total number of Japanese companies registered in India stood at 1,454 at the
end of October 2018 and the total number of Japanese business establishments stood at 5,022. The largest number
of Japanese establishments are in Maharashtra (815), followed by Tamil Nadu (600) and Karnataka (534). Prominent
Japanese involvement in India include Suzuki, Toyota, Uniqlo, Mitsubishi, Mitsui, Honda, Mizuho, Hitachi, Sony and
Panasonic. Indian firms in Japan include Infosys, TCS, HCL technologies, OYO, SBI, Quick Heal and Sun Pharma.
The literature on the behaviour of Japanese firms in India is relatively sparse. Broad studies on economic relations
and trade have been carried out by Sato (2012), Buckley, Cross and Horn (2012) and Taneja, Joshi, Bimal and Singh
(2020). Similarly, Roy and Chanda (2020) look at trends in FDI inflows from Japan and Chanda and Tokas (2020)
consider the effects of trade agreements. Some authors have compared and contrasted the behaviour of Japanese
firms in India and China. A notable example is Anand and Delios (1996). For our purposes the more interesting
papers are Horn and Cross (2016) which looks at Japanese production networks, Varma, Awasthy, Narain and Nayaar
138

(2015) and Masanori (2012), who investigates Japanese company strategies in India. We will provide a brief
discussion of Horn and Cross (2016) first.
Table shows the institutional characteristics of India and Japan, according to Witt and Redding (2014).
Table 3 - Institutional Characteristics of India and Japan
Category Measure India Japan
Education and Skills Adult Literacy 0.61 0.99
Education Attainment Index (2010) 0.45 0.883
Employment Tenure short (private), long (state- owned) long
Skills Acquisition private, some corporate OJT
Employment Relations Union Density 6.9% (2008) 18.5% (2010)
Organization Principle industry company
State Intervention in Wage
Bargaining
low-medium low
Coordination 2 3
Belligerence: Days Lost to Strikes,
Average 2000– 2008
2,52,30,911 11,693
Financial System Main Source of External Capital banks banks
Allocation Criterion relationships, state market, relationships
Term long long
Interfirm Relations Presence of Business Groups business houses keiretsu
Noteworthy Other Networks caste or religion-based networks,
industrial clusters (IT)
intra-industry loops with strong
associations, R&D consortia,
supplier and distribution networks
Internal Structure Decision- making Structure top-down participatory
Extent of Delegation low medium-high
Main Basis of Promotion and Pay
Raises
relationships, seniority seniority
Ownership and Governance Main Ownership Form, Large Firms family, state public
Main Controlling Owner family, state firms
Investor Protection Index (out of
10) (2012)
6 7
Social Capital Interpersonal Trust high high
Institutionalized Trust: Rule of Law − 0.06 1.31
State Type predatory with developmental trend residual developmental, welfare
elements
Decision- making top-down, variation at state level participatory through associations
and committees
Voice and Accountability 0.42 1.05
Government Effectiveness −0.01 1.4
Regulatory Quality −0.39 0.98
Source: Witt and Redding (2014)
6.1 Location of Japanese Firms in India
Their study tries to answer the following research questions:
1. “How do subnational location characteristics influence the geographic dispersion of Japanese operations in
India (as measured by investment project numbers)?
2. Can firm-level and industry-level variations in dispersion be detected?
3. To what extent is agglomerative behaviour – one of the key facets of Japanese corporate behaviour - observed?
139
4. Can trends in the subnational distribution of investment project numbers be detected over time?”
Based on previous studies of FDI location determinants, the authors choose five components to study. They are
1. Market size and growth.
2. Human capital.
3. Infrastructure.
4. Agglomeration.
5. 5.Manufacturing density.
Using these factors the authors suggest nine propositions:
Proposition 1: Japanese firms preferentially establish larger numbers of operations in more economically advanced
regions of India.
Proposition 2: Japanese firms preferentially establish larger numbers of operations in regions of India with higher
economic growth rates.
Propositions 1 and 2 relate to market size and growth respectively. It seems fairly obvious that firms will aim to serve
areas that have a bigger market. It also stands to reason that firms would look at market potential rather than
immediate returns when choosing their locations.
The next two propositions relate location decisions with human capital. Again it seems fairly straightforward to
suggest that firms would like cheap but skilled labour. This might be a paradoxical desire for businesses but that
would be the ideal situation. Since the degree of skills cannot be easily assessed one needs to use proxies as
indicators. Two readily suggest themselves: education levels and labour costs. One may surmise that cheap labour
equates to unskilled labour which in turn indicates lower productivity. One may as well pay more to get better
quality labour.
Proposition 3: Japanese firms establish larger numbers of operations in regions of India with higher labour costs.
Proposition 4: Japanese firms preferentially establish larger numbers of operations in regions of India with higher
education attainment levels.
It is obvious that better infrastructure is an attraction which gives us proposition 5. Government incentives in terms
of special economic zones (SEZ) and the better-quality infrastructure that is usually provided there gives proposition
6.
Proposition 5: Japanese firms preferentially establish larger numbers of operations in regions of India with superior
infrastructure.
Proposition 6: Japanese firms preferentially establish larger numbers of operations in regions of India with greater
numbers of SEZs.
Propositions 7, 8 and 9 concern agglomeration effects and manufacturing density. Japanese firms are reputed to
follow in the footsteps of their countrymen. If a few Japanese firms establish business in some part of the country,
then others will follow. This bandwagon effect is quite rational, particularly for businesses. Japanese firms are well
known for meticulous preparation and consensual decision making. Consequently, taking a decision on location can
be a painful and arduous process. A Japanese firm that follows knows that preceding firms have gone through the
same analysis and can then feel confident about their choice. Higher levels of manufacturing activity can provide us
another indicator of agglomeration effect. The effect of manufacturing density is captured in proposition 9.
Proposition 7: Japanese firms preferentially establish larger numbers of operations in regions of India with higher
numbers of prior Japanese-owned investment cases.
Proposition 8: Japanese firms preferentially establish larger numbers of operations in regions of India with higher
levels of manufacturing activity.
Proposition 9: Japanese firms are more likely to preferentially establish larger numbers of operations in regions of
India with higher levels of manufacturing density than are other foreign firms.
The analysis is carried out using data for two periods: 1995/98 and 2004/2008. The authors find that JMNEs exhibit a
tendency to locate in regions of India characterized by high GDP levels. This finding holds irrespective of industry
affiliation. However GDP per capita has only a small effect on investment numbers and regional growth figures also
don’t seem to drive investment.
140
The relationship between wage structures and investment seems weak. After controlling for regional labour
productivity in India, the effects of wages on Japanese investment numbers diminishes. In both time periods
Japanese corporate behaviour in India is driven more by labour productivity than wage considerations. Indicators for
quality of human capital at the state-level show that higher the availability of educated personnel, more likely that
instances of Japanese FDI will be observed.
The effect of Indian infrastructure on Japanese location decisions is equivocal. The period 1995/1998 exhibits a
positive relationship with investment, with the effects for road infrastructure being small and more pronounced for
railway networks. The latter period (2004/2008) only shows a positive effect for railways. Most surveys on drivers of
location in India as a whole or regionally flag poor infrastructure as a major impediment. The analysis by Horn and
Cross suggests otherwise. It is possible that Japanese investment is directed at market development rather than using
India as an export platform. In both periods, the existence of EPZs (1995/1998) and SEZ numbers (2004/2008) are
positively correlated to Japanese investment numbers.
In both time periods, there is a strong effect of prior Japanese investment projects as a location determinant. In
comparison to other independent variables this country-of-origin effect is by far the strongest. The GIS data analysis
confirms an intensification of agglomerative tendency among JMNEs in India over the two periods under
investigation.
Japanese investment is strongly and positively related to levels of manufacturing activity at regional levels. This is
true when levels of manufacturing activity is measured by the number of workers in manufacturing regionally. When
measured proportionally to total number of workers or total population the effects are less pronounced. The
location effects are more pronounced for Japanese firms than for other nations. With respect to industry effects,
significant differences in investment strategies are exhibited for the electronics, chemical and IT sectors. The IT
sector seems to exhibit more pronounced agglomeration effects than others, but that would probably be true of
Indian firms as well.
6.2 Alliance Management between Japanese MNEs and Indian firms
Varma, Awasthy, Narain and Nayyar (2015) attempt to understand alliance management capabilities through the
different phases of the alliance life cycle in the context of three Indo-Japanese joint ventures (JV) with diverse
alliance outcomes. This study, that uses the case method is pertinent to our paper in that it highlights the
connections and relationships that drive changes in business systems. To maintain anonymity the names of the firms
have been omitted in the paper.
There are typically three different stages in the life cycle of an alliance:
1. The formation phase where the firm evaluates its decision to form an alliance and selects an appropriate
partner.
2. The design phase where the firm sets ups an appropriate governance structure and design for the alliance.
Alliance success depends on appropriate choices about the structure and contractual terms of that alliance.
3. The post-formation management phase where the firm has to manage the alliance after it is up and running.
6.2.1 Case profiles:
JV1 was established in 1987. The partners were a Japanese firm with expertise in industrial automation and a leading
Indian firms with a long history in refrigeration. There a third partner, a government of Karnataka state enterprise.
The Japanese were interested in entering India for strategic reasons and the Indian firm wanted access to Japanese
technology. Since this was at the time of the license raj the only way of getting a license was to involve a
state-owned enterprise, which exited after a period. It should be noted that the Japanese had a long association
with the Indian firm before it struck up the alliance. The alliance worked successfully for 16 years before it finally
ended amicably. The Indian firm achieved its goal of technology transfer and training and the Japanese firm set up its
own operations.
JV2 involved the auto components sector. This involved a JV with an existing Indo-Japanese joint venture. The Indian
partner supplied auto parts components to the older joint venture. The Indian firm primarily sought technology
transfer which required detailed information including specification of machine tools, auxiliary equipment and
technical support for a period of seven years. Initially, the Japanese firm was reluctant to take an active role in the
venture, partly because of its experience with a previous JV. However, the Indian firm persisted and brought about
changes in its processes and engaged in a long and painstaking interaction with the Japanese firm, eventually
wearing down its resistance. Eventually, the Japanese firm was convinced about the Indian firm’s commitment and
141
had a fruitful association which was still continuing at the time the paper was written. The Indian firm went from
strength to strength collecting many awards and signing joint ventures with other firms.
JV3 had all the markers of success as it was a joint venture between a leading Japanese telecommunications operator
and a one of the leading business houses of India. Instead it was a failure. The Indian firms wanted access to
Japanese technology and investment and the Japanese firm wanted access to a growing Indian market. The
immediate cause for the collapse of the deal was the inability to get a license for Delhi circle, a very lucrative market.
After that the venture lost three licenses after they were cancelled by the Indian courts. Besides this there were
differences between the working styles and the strategic intents of the two entities. A compounding factor was the
hyper competitive state of the Indian telecommunications market at this stage.
There are a number of possible conclusions one can draw from these cases, though one must be aware of the perils
of generalisations on such a small sample. It would also do well to remember that two of the cases date back to a
different policy regime while the third is of relatively recent provenance. First, the policy regime left very little choice
about the mode of entry of the Japanese MNEs into India at that time. All the Indian partners were interested in
technology transfer, and the Japanese wanted to enter a promising market. In all instances mutual trust was
instrumental in the establishment of the alliance and both formal and informal methods were necessary for the
alliance to work.
In the case of JV1 and JV2 factors which helped in forming a good working relationship included
1. Clear roles.
2. Mutual trust.
3. Consensus and consultation in decision-making.
4. Mutual understanding of differences in culture.
5. An appreciation of the Japanese style of management and finally.
6. Communication. Trust and cultural compatibility in a business environment emerge as a key factor that drive
the success of an alliance.
6.3 Japanese company strategies
The final paper that we will discuss is Kondo 2012, which looks at strategies adopted by Japanese firms for their
operations in India. The author compares favourably the relatively higher levels of success of Korean firms and
attributes it to their strategies. The paper does not use data sets or follow any particular methodology and it is
largely based on newspaper articles. Nonetheless it provides us with insights that could be investigated with data
and is useful.
The main strategies that the paper discusses are
1. Large scale investment at the time of entry.
2. Working through joint ventures.
3. Central decision-making.
4. Adapting to the Indian market.
5. Large scale advertisement campaigns.
6. Corporate culture and fostering understanding.
7. Human resource relations
8. Chambers of commerce.
Kondo 2012 suggests that firms which enter the market on the back of large investments, like the Korean firms of
Samsung and LG are more likely to be successful. Small, tentative entry with an intent to understand the complex
Indian market soon falter. He also notes that several Japanese firms that entered the Indian market in a big way also
came to rue their decision, but he nevertheless persists in his prescription. He notes that the preferred route of
entry for Japanese firms have been through joint ventures which require a lot of managing. In particular he notes
that a lot of Indian firms are family businesses and are not always transparent and do not follow the logic of markets
or sound management. The commitment of the top management to the Indian market is also very important. He
notes that the success of Maruti-Suzuki depended a lot on the leadership of Osamu Suzuki.
Kondo suggests that adapting to the market has been a notable failure of Japanese firms. In contrast Korean firms did
extensive market research to find out which features were suitable for the Indian market. However, some Japanese
companies such as Panasonic and Daikin have been more proactive. Large advertisement campaigns are also needed
for the success of products as the example of Toyota Innova shows. Of particular importance is the corporate culture
142

of the Japanese firm. He notes that often there is very little faith in the management capabilities of Indian managers
among Japanese firms. The relationship between the management of the subsidiary and the parent Japanese firm is
often frosty and plagued by mutual incomprehension. Expatriate Japanese managers typically find it difficult to fit in
culturally and have problems with food. The Korean firms on the other hand have again gone to great lengths to
assuage these problems. Training Indian staff has also proved to be a major challenge. Typically Japanese firms rely
on workers with very high skill levels and a sound understanding of Japanese production processes. Getting Indian
workers to these levels requires a lot of investment. There is need for training on the Japanese side as well since
finding Japanese workers who are conversant with India is a challenge. Japanese firms are loath to delegate
authority to Indian managers. This results in slower decision-making. On the other hand it is also cheaper to hire
Indian managers and the money saved could come in handy, particularly in nascent stages. This is in contrast to
western firms who have far more confidence in the abilities of Indian managers. In terms of labour relations he notes
that non-Japanese companies suffer fewer strikes and there needs to be improvement. Finally, Japanese Chambers
of Commerce and JETRO need to be more proactive and emulate the Indo-German chambers of Commerce. It
should be noted that Kondo’s paper is quite old and much may have changed over time. Now there is a Indo
Japanese Chamber of Commerce and Industry and JETRO is more proactive.
7. Conclusion
We have provided a discussion of business groups in general and Japanese and Indian business groups in particular.
This was motivated by the relatively recent Japanese commercial interest in India. More and more Indian and
Japanese businesses are interacting and sooner or later Japanese firms will have to interact with Indian business
houses. The question is what shape this interaction will take. One of the reasons for the existence of business
houses is imperfect markets and that is a feature of Indian markets. Japanese industrial structures were marked, in
the past, by the presence of the zaibatsu and the keiretsu. It is possible that those structures may be replicated
when Japanese businesses interact with Indian ones.
The current literature is limited and is based mostly on case studies. It is important to get more extensive data
through which we can explore the interaction in quantifiable terms. The obvious next step is to find some answers
through surveys of Japanese and Indian businesses that interact with each other.
References
● Anand, J., and Delios A., 1996, Competing Globally: How Japanese MNCs Have Matched Goals and Strategies in India and China, The Columbia
Journal of World Business
● Aoki K, and Lennenfors T. T., (2013), The New Improved Keiretsu, Harvard Business Review.
● Bassino, J, Jensen, P and Morini, M., (2018), The Evolution of Japanese Business Networks in ASEAN Countries Since the 1960s, Complex
Networks and their Applications, (Cherifi et al., eds). Springer International Publishing.
● Chandler, A. D., Jr. (1962). Strategy and Structure: Chapters in The History of The American Industrial Enterprise. Cambridge, Ma: MIT Press.
● Chandler, A. D., Jr. (1977). The Visible Hand: The Managerial Revolution in American Business. Cambridge, Ma: Belknap Press.
● Chandler, A. D., Jr. (1990a). Scale and Scope: The Dynamics of Industrial Capitalism Cambridge, Ma: Belknap Press.
● Colpan, A.M and Hikino, T (2010). “Foundations of Business Groups: Towards an Integrated Framework,” The Oxford Handbook of Business
Groups, OUP
● Dow, S, McGuire, J, Yoshikawa, T., (2011), Disaggregating the Group Effect: Vertical and Horizontal Keiretsu in changing economic times, Asia
Pacific Journal of Management 28.
● Giroud, Axele, MNEs in Asian Business Systems in The Oxford Handbook of Asian Business Systems, OUP 2018.
● Horn, S. and Cross, A., (2016), Japanese Production Networks in India: Spatial Distribution, Agglomeration and Industry Effects, Asia Pacific
Business Review, 22:4, 612-640.
● Japanese Multinationals in Asia, Dennis J. Encarnation (ed.), Oxford University Press, 1999.
● Koike, R., (2004), Japan’s Foreign Direct Investment and Structural Changes in Japan and East Asia Trade, IMES, Bank of Japan
● Kondo, Masanori (2012), Strategies for Japanese Companies in India, RIETI Discussion Paper Series 12-E-064.
● Lincoln, J. R., and Shimotani, M., (2010), Business Networks in Post-war Japan: Whither the Keiretsu? The Oxford Handbook of Business Groups,
OUP
● Matous, P and Yasuyuki, T, (2015), “Dissolve the Keiretsu or Die”: A longitudinal study of disintermediation in the Japanese automobile
manufacturing supply networks. RIETI discussion paper 15E039.
● Sarkar, J., (2010), Business Groups in India, The Oxford Handbook of Business Groups, OUP
● Urata, S., (1993), Japanese Foreign Direct Investment and its Effect on Foreign Trade in Asia, NBER.
● The Japanese Economy by David Flath, OUP 2014.
● The Japanese Economy by Mitsuro Taniuchi, gale Asia 2014.
● Williamson, O. E. (1971). “The Vertical Integration of Production: Market Failure Considerations,” American Economic Review, 61: 112–23.
● Williamson, O. E. (1985). The Economic Institutions of Capitalism. New York: Free Press.
● Witt, Michael A. and Redding, G., (2014) Asian Business Systems: Implications and Perspectives for Comparitive Business Systems and Varieties
of Capitalism Research in The Oxford Handbook of Asian Business Systems, OUP 2018
143

● Witt, Michael A., (2014), Japan: Coordinated Capitalism Between Institutional Change and Structural Inertia in The Oxford Handbook of Asian
Business Systems, OUP 2018
● Varma, S., Awasthy, R., Narain, K. and Nayyar, R., (2015), Cultural Determinants of alliance management capability-an analysis of Japanese
MNCs in India, Asia Pacific Business Review, 21:3, 424-448.
List of Tables● Table 1 - Current Japanese Conglomerates
● Table 2 - Indian Business Groups
● Table 3 - Institutional Characteristics of India and Japan
144

ANNEXURE #7
Mr. Furuhashi Takeyuki
Transform self before transforming the company,
Leadership Secrets for Improving ManufacturingCompetitivenessFuruhashi san started his journey as a management consultant when he joined Chu-San-Ren (Central Japan Industries
Association) in 1972. Later from the beginning of 1980s, he started consultation services of transforming production
& supply system by “focusing flow,” applying the Toyota Model of Production System (TPS). He brings a wealth of
knowledge derived from his vast consulting experience in mixed industries from automotive industry to general &
project type of industries. From 1990s, he became involved in organizing various training programmes for ASEAN, EU,
South Africa, etc. Since 2007 he joined Visionary Leaders for Manufacturing (VLFM) Programme in India as a faculty
member and has been conducting Visionary SME Courses.
OVERVIEW OF FLOW TRANSFORMATION
Typical challenges with production and supply
Supplier: I have produced 100 units
Customer: I need 80 units
Supplier: I have produced 80 units
Customer: I need 120 units…
It is difficult to create the perfect production schedule, with changing requirements of the customer. The traditional
paradigm has to be reworked.
Traditional Paradigm v/s Flow
The traditional paradigm uses the fixed production or forecast method towards production. It seeks to optimize
stock. The Flow method seeks to control flow and improve customer supplier relationship instead. A focused flow can
be especially useful to transform customer supplier dynamics in tier 1, 2 companies and OEM’s.
If flow is to be defined, in service, it is the flow of customer. In manufacturing, it is the flow of material. In delivery, it
is the flow of production and procurement. The challenges commonly faced in over procurement or under
procurement can be solved by simply “Filling up”, where procurement equals consumption. When the production is
exactly equal to the customer requirement. OEMs adapt this by assigning one person at the customer’s end and
getting stock quantity requirement conveyed every day.
Therefore, the key for successful transformation is to synchronize flow, not optimize stock.
Implementing Flow
There are 3 parameters to be ensured in this new paradigm: synchronize flow, stabilize flow, and deliver 100 percent
to create trust.
The objective of flow is to increase efficiency, productivity, and improved cash flow. Finally, Flow is a means to an
end, and a tool to achieve objectives.
Three Step Leadership Transformation
1. Unlearn
2. Management By Fact
3. Do it yourself
145

Firstly, leaders seeking to implement flow will first unlearn stock control and replace it by flow. Secondly, their
management language will specify facts, what when, where, how? The language will involve complete sentences, no
abstract terms result in no abstract decisions. They also convert decision to action plan immediately.
Thirdly, they always encourage a “do it for yourself” attitude, practice first, demonstrate next, work together as a
team.
Secret for success is experiencing failure
The learn, apply, fail, is a repetitive process. One has to fail, change, and proceed. Succeeding by accident is an
impediment, it creates incomplete learning. VSME too, as a model encourages trial and error and counts on the
leaders failing.
Q: In any transformation, the leaders role is crucial. In flow transformation, what do leaders do right for sustained
change? (In addition to learning from failure)
A: Let us first understand what to replace. The old paradigm is planned production, the new paradigm is on demand
production. To realize on demand production, we need new tools, which is flow transformation.
Markets are evolving. For instance, in the 90’s, only 20,000 automobiles were manufactured in India. In 2009, it was
around 2.3 million. Now it is over 4 million.
In a controlled market, customers wait, but now there is a large variety of products, uncertain fluctuating demand is
the norm.
The Customer is a Tiger
The modern Customer is like a Tiger, one has to catch it when it appears. But tigers are unpredictable, one cannot
forecast and make a plan. In the old model, a monthly, weekly, daily schedule is created, but there is always a gap
between supply and demand.
The mindset is, “I could produce more if I had procured more material, I am ready when material is available”
In the new model, if the tiger suddenly appears, the supplier makes a quick response, schedules everything on the
go, creating a culture of “I am always in synch with the supplier, I am always ready for the tiger.” Speed is achieved
through the new tool.
In the management system of planned production, suppliers sell what is produced, and try to produce as many units
as possible, using up 100% of resources, but to change to on demand method, one would produce only what is
requested, minimizing resource utilization.
The Plant head only knows the inside of the plant, the stock is controlled by sales. If the new paradigm is introduced,
the Plant head needs to understand the end customer’s behaviour, the leader is required to educate all involved on
the end customer.
Accounts tend to show that all sales generally happen at the month end. But reality is far from this, customers come
anytime. Only data is compiled at the end of the month.
Therefore, how do leaders stabilize the assembly line? They jump into the customers market.
Q: In VSME, or VLCI, it is explained that Inventory should be based on consumption. But from a financial viewpoint,
if inventory fluctuates, profit or loss also fluctuates. In such a case, implementing flow may be counter intuitive.
How can leaders work around this?
A: One has to understand that the principle in the old method is optimizing stock through planned production, which
may seem like an efficient practice if taken account at the month end. But overall, the stock forecast is not equal to
demand, therefore creating the need for a buffer stock, resource wastage, and errors.
In on demand production, stock is produced exactly as per requests, production is in synch with demand, and buffer
stock is not necessary, stock never gets wasted. It also ensures quick delivery.
Another factor is, for stock optimization, formulas are impractical, as they assume too many variables as constants.
A Product meter is a tool used in Flow transformation. On one end is sales and delivery, on another is production,
balanced in between is stock. To analyze if delivery and production are synchronized, product meter is used. If in
146
synch, stock is reduced, if not synced, stock is increased. If balanced, it indicates that stock is at a reasonable level.
The traditional method does not take into account synchronization.
Therefore, to be intuitive, don’t look at short term reports, look at synchronization levels. Don’t let the constraints of
a financial view block synchronization.
Shortages normally happen for individual items, total money value may not be affected, and may never reflect at the
end of the month. Operations and Finance need to go hand in hand. The product meter is effective in visualizing,
evaluating stock, and re-strategizing.
Q: What is the role of customer companies in implementing flow in supplier companies?
A: In Flow control, both customers and suppliers benefit. For the customer there is no shortage of stock, and there is
improved productivity. For the supplier, delivery performance becomes 100%, there is increase in efficiency, and no
wastage. Customers can implement similar program with suppliers, but objective of the exercise should not be cost
reduction, it should be efficiency improvement.
Q: Do Small companies with thin management strengths face constraint in applying flow principles?
A: The reverse of that is true, since owners can implement decisions faster, with a direct impact. Medium or large
companies’ operation head may not care about cash flow, synchronizing will be a bigger challenge. Delivery is the
only cash in-flow, production is cash out-flow, if production is more, cash outflow would be greater than in-flow. In
large companies, financial compliance is only at the end of the month, employees can forget stock increase, as not it
is not a direct concern for them. However, for small businesses, cash flow is critical if the product meter works,
owners benefit immediately.
Q: Do the same principles of Flow apply to project-based companies?
A: To answer this, let us look at the hospital system. At the hospital, the patient comes, picks a token number, goes
through many processes, gets diagnosed, and leaves.
A Project type industry operates similarly. Sequentially, various functions with varied time requirements , such as
machine assembly, testing, installation etc. take place.
If like the patients, each process is numbered, and followed in order, flow is successful.
Every customer’s requirement is different. Every process has different cycle times. But average flow rate can be
measured for each process, and a buffer time of nearly double the process time can be assigned. Soon there will be
many lists of processes, and any process can be planned. There is a stereotype that flow is meant for automotive
manufacturing alone. But when visualized this way, project type assignments are the same as flow process.
Q: What is the role of technology for improving flow?
A: Technology aids in the quick transfer of information, IT is already developed to accommodate flow. This is
especially useful when operating internationally. A customer places a delivery quest in the system, which takes
information every day, therefore, the information transfer time reduces to zero.
Q: In the pandemic, when supply chains are disrupted, what advice would you give companies?
A: We cannot control the outcome of the pandemic. But we can control the outcome of our processes. One must
develop a system for plan of action for various setbacks, what if a particular supplier can’t supply?
For example, if there are floods, what action will the company take to ensure flow? They can decide out of 3
pre-planned options,
1. Delete the product which use these materials from the line,
2. Reduce the number of products,
3. Stop the line altogether even if one part is delayed, uniformly.
One can use insight to decide the best course.
In conclusion, having an established protocol is the best way to ensure 100% performance.
147
ANNEXURE #8
Mr. Neelakantan Ravi
Speed and Socioeconomic Development:Influence of Indian Railways
Table of Contents
Abstract
Introduction To Indian Railways
Growth Of Railways Through Five-year Plans
High-speed Rail: Basics And Background
Indian Railways Enters The 21st Century
Spillover Effects For India’s Conditions
Areas Likely To Be Influenced By HSR
Spillover Effects
A Lesson From The Recent Past
Competition From Cyberspace?
References
Abstract
Indian Railways is a little over a century and a half old. Its development over the decades has been gradual. It has
been and continues to be the “lifeline for the socioeconomic growth of India,” by connecting human settlements
across the country and simultaneously transporting various resources to centers of production and markets.
Nationalized in 1951, Indian Railways is among the largest rail networks in Asia and the world’s second largest
network operated under a single management. We will feature its growth over the past 7 decades. Indian Railways
has always aimed to provide safety during travel. The rate of its development as a service organization has been
modest, with two forces, one originating from political considerations balanced by another based on engineering
competence. High-speed rail travel emerged in Indian Railways in 1969, when the first high-speed limited-stop train
service was introduced between New Delhi and Kolkata. We will trace the origins of high- speed travel on Indian
Railways and attempt to show how it has indeed helped passengers reach their destinations in less time. Any direct
correlation between high-speed train travel and the growth of the economy, the effect on the environment and
society, while significant over the long term, would be difficult to estimate empirically.
We will show, in terms of policy flow and implications, how Indian railways has been unwavering in providing
sustenance for economic growth. One common theme in these decades has been the inexorable drive to acquire and
develop technology to ensure faster, inexpensive, and safer travel for all users. The increase in speed of travel has
been steady, progressive, and not an attempt at creating records. Over the years, high-speed trains have enabled
better quality of life for professionals in India, especially in the age of globalization. However, the effect of this has
been generally restricted to medium distance and suburban travel. In this scenario, we will detail the steps that have
to be taken by the provider and the user for making future high-speed rail travel profitable, productive, comfortable,
and dependable.
Keywords: high-speed rail, Indian Railways, socioeconomic development, train, travel
JEL Classification: O2, O53, R480
148

Introduction To Indian Railways
Indian Railways, over the last 160 years, has brought about deep and irreversible change across India, hauling it along
towards modernity, one step at a time. It has been a journey that has kept abreast of the available technologies in rail
transport, while incorporating these into the Indian railway system based on affordability, its domestic capacity to
indigenize these technologies and thereby enhance performance. A crucial contribution of Indian Railways has been
connecting and networking communities and markets. However, the basic approach of considering the Indian
railways as their “socioeconomic lifeline” has seldom changed. Whether in terms of travel comfort or speed or safety,
the all-round growth of the railways in India has been guided by a steady hand, across decades, keeping in mind the
requirements of feisty travelers and freight tonnage while fostering safety.
“Given the strategic role played by railways in the transportation space, rail transportation has been one of the three
areas reserved for the public sector in successive industrial policies of the country (the others being atomic energy
and defense)” (National Transport Development Policy Committee 2013).
Indian Railways (IR) is managed directly by the Ministry of Railways, Government of India, which owns and operates
most of India’s rail transport. IR had a total route network of 67,368 km in 2016–17; it operates more than 22,300
trains daily (13,098 passenger plus 9202 freight trains). IR has 278,000 wagons, 69,322 coaches, and 11,461
locomotives. Over 23 million passengers travel by train daily in India. The passenger traffic stood at 8.3 billion in FY18
and is expected to increase to 15.18 billion by FY20. In FY51 the passenger traffic was 1.3 billion. Around 1.2 billion
tonnes of freight was transported via trains in FY18 and 2.2 billion tonnes is expected in FY20. In FY51 the freight
carried was 73.2 million tonnes. This includes a huge variety of goods such as mineral ores, iron, steel, fertilizers,
petrochemicals, and agricultural produce (India Brand Equity 2018).
Growth Of Railways Through Five-year Plans
India’s economy was actively driven by five-year plans (FYPs) for the 5 decades after independence in 1947. The
objectives and targets of IR were always reflected in the plan document, usually in a separate chapter dealing with
railways. The concerned chapters of the plan periods were examined and checked for any reference to high-speed
rail travel. However, no FYP document until the 11th five-year plan mentioned high-speed train travel with any
degree of emphasis. Table 1 gives some details of objectives and developments under the various plans. The first
five-year plan was launched in 1951 and the 10th in 2002.
Table 1: Major Objectives Designated for Railways Development Under Each Five-year Plan in India
Time Period Name of Plan Major Objectives Miscellaneous Developments
1951–1956 First Five-Year Plan Track Renewals
1956–1961 Second Five-Year Plan Continue track renewals, install better signaling
technology, and enhance line capacity
Examine and permit higher speeds on main trunk
routes such as Mathura‒Baroda, Wardha‒Bezwada,
and Delhi‒Kalka
1961–1966 Third Five-Year Plan Complete track renewal programs along with
rail and sleeper renewals
1966–1969 Annual Plans No specific mention
1969–1974 Fourth Five-Year Plan Run higher-speed trains on long- distance
routes where overcrowding is high
On 3 March 1969, the first Rajdhani Express, a
high-speed nonstop service, started between Delhi
and Howrah (i.e., Kolkata).
On 17 May 1972, the second Rajdhani Express,
another high- speed nonstop service, started between
Delhi and Bombay
1974–1978 Fifth Five-Year Plan Electrification of tracks, acquisition of more
powerful locomotives, and efficient freight
movement
On 7 August 1976, the Tamil Nadu Express, a superfast
train, started service between Delhi and Madras (i.e.,
Chennai)
1978–1980 Annual Plans No specific mention
1980–1985 Sixth Five-Year Plan Assessment of quality and quantum of railway
assets; their efficiency/performance
Overall evaluation was that all assets were being
utilized optimally
149

1985–1990 Seventh Five-Year Plan Electrification of high-density routes;
upgradation of such networks for speedier
trains by seeking more funding for new
projects
Indian Railway Finance Corporation (IRFC) set up in
1987 as the financing arm, borrowed from the market
for projects, owing to reduced budgetary support.
Introduction of the high-speed Shatabdi Express
between Delhi and Agra in November 1988
1991–1992 Annual Plans No specific mention
1992–1997 Eighth Five-Year Plan Enhance reliability and quality of service
through modernization programs, energy
conservation, ensuring greater safety, pursue
financial viability
1997–2002 Ninth Five-Year Plan Initiate measures to regain railways’ role as the
principal transport mode for passengers and
especially freight
2002–2007 Tenth Five-Year Plan Focus on increasing capacity on the Golden
Quadrilateral; tackle problems arising out of
old technologies; measures to tackle
prevalence of slow train speeds
2007–2012 Eleventh Five-Year Plan Building of dedicated freight corridors on the
Delhi–Mumbai and Delhi–Kolkata routes
Introduce high-speed trains (with max. speeds of 150
km/h) between more city pairs, like Delhi–Agra
Source: Planning Commission of India (2018).
Table 2 below gives details of the original and present state of India’s first three superfast trains, providing a clue to
the way in which the engineering objective of safe high-speed travel gets compromised by sociopolitical compulsions.
This is revealed by the initial and present number of halts and the speed. We thus find that the seventies were the
first years when relatively high-speed trains were introduced between the four major cities in India.
Table 2: Comparison of India’s First Three Long-distance Superfast Trains
Train Number 12302 12952 12622
Train Name New Delhi Howrah Rajdhani
Express
New Delhi Bombay Rajdhani
Express
New Delhi Madras Tamil Nadu
Express
Date of Introduction 3 March 1969 17 May 1972 8 August 1976
Original Time Taken, Distance and Speed 17 hours
1,450 km
85 kmph
19 hours
1,385 km
72 kmph
29.5 hours 2,188 km 75 kmph
Time Taken and Speed Today 17 hours
85 kmph
16 hours
90 kmph
33 hours
66 kmph
Original Halts NONE: [Only 4 technical halts] 1 Passenger Halt and 1 Technical
Halt
5 Passenger Halts
Passenger Halts Today 7 6 10
Source: Compiled from the Indian Railway Catering and Tourism Corporation, www.irctc.co.in; the India Rail Info Website, www.indiarailinfo.com;
the Indian Railways Fan Club Website, www.irfca.co.in; and Information on Superfast Rail Services in India http://www.nationalrailplan.in (accessed
8 October 2018).
On the 200 km Delhi‒Agra route, a high-speed train (the Shatabdi Express) with a maximum speed of 150 km per
hour was introduced in November 1988; it was proposed that similar trains be introduced between selected city
pairs. Currently, there are about 25 pairs of such trains running in various regions across India connecting important
cities connected with business, tourism, and pilgrimage.
It was in the 12th FYP (2012‒17) document (Planning Commission of India 2012) that “Developing High-Speed Rail
Corridors and Upgradation of Speeds” was dwelt upon in some detail. For instance, the Ministry of Railways had
selected the following six corridors for conducting pre-feasibility studies for the development of high-speed rail
corridors:
1. Delhi–Chandigarh–Amritsar (450 km)
2. Pune–Mumbai–Ahmedabad (650 km)
3. Hyderabad–Dornakal–Vijayawada–Chennai (664 km)
4. Chennai–Bangalore–Coimbatore–Ernakulam–Thiruvananthapuram (849 km)
5. Howrah–Haldia (135 km)
150
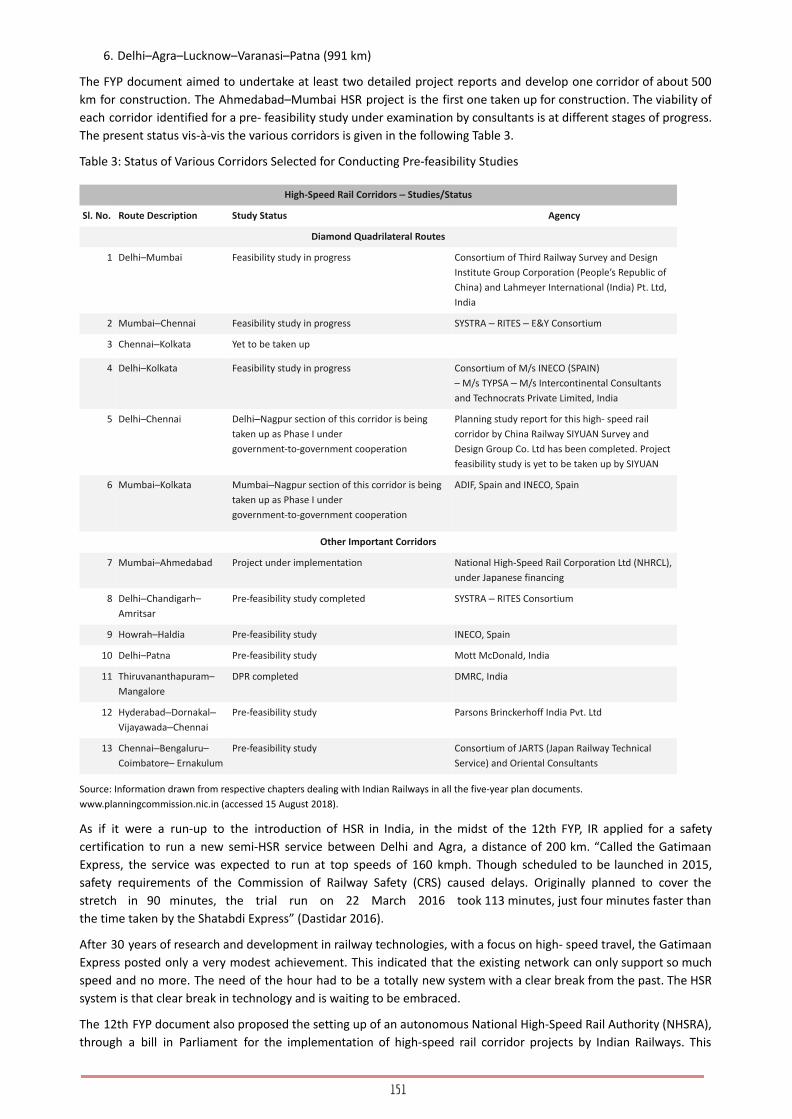
6. Delhi–Agra–Lucknow–Varanasi–Patna (991 km)
The FYP document aimed to undertake at least two detailed project reports and develop one corridor of about 500
km for construction. The Ahmedabad–Mumbai HSR project is the first one taken up for construction. The viability of
each corridor identified for a pre- feasibility study under examination by consultants is at different stages of progress.
The present status vis-à-vis the various corridors is given in the following Table 3.
Table 3: Status of Various Corridors Selected for Conducting Pre-feasibility Studies
High-Speed Rail Corridors ‒ Studies/Status
Sl. No. Route Description Study Status Agency
Diamond Quadrilateral Routes
1 Delhi–Mumbai Feasibility study in progress Consortium of Third Railway Survey and Design
Institute Group Corporation (People’s Republic of
China) and Lahmeyer International (India) Pt. Ltd,
India
2 Mumbai‒Chennai Feasibility study in progress SYSTRA ‒ RITES ‒ E&Y Consortium
3 Chennai‒Kolkata Yet to be taken up
4 Delhi–Kolkata Feasibility study in progress Consortium of M/s INECO (SPAIN)
– M/s TYPSA ‒ M/s Intercontinental Consultants
and Technocrats Private Limited, India
5 Delhi–Chennai Delhi‒Nagpur section of this corridor is being
taken up as Phase I under
government-to-government cooperation
Planning study report for this high- speed rail
corridor by China Railway SIYUAN Survey and
Design Group Co. Ltd has been completed. Project
feasibility study is yet to be taken up by SIYUAN
6 Mumbai–Kolkata Mumbai‒Nagpur section of this corridor is being
taken up as Phase I under
government-to-government cooperation
ADIF, Spain and INECO, Spain
Other Important Corridors
7 Mumbai–Ahmedabad Project under implementation National High-Speed Rail Corporation Ltd (NHRCL),
under Japanese financing
8 Delhi‒Chandigarh–
Amritsar
Pre-feasibility study completed SYSTRA ‒ RITES Consortium
9 Howrah–Haldia Pre-feasibility study INECO, Spain
10 Delhi–Patna Pre-feasibility study Mott McDonald, India
11 Thiruvananthapuram–
Mangalore
DPR completed DMRC, India
12 Hyderabad‒Dornakal‒Vijayawada‒Chennai
Pre-feasibility study Parsons Brinckerhoff India Pvt. Ltd
13 Chennai‒Bengaluru–
Coimbatore– Ernakulum
Pre-feasibility study Consortium of JARTS (Japan Railway Technical
Service) and Oriental Consultants
Source: Information drawn from respective chapters dealing with Indian Railways in all the five-year plan documents.
www.planningcommission.nic.in (accessed 15 August 2018).
As if it were a run-up to the introduction of HSR in India, in the midst of the 12th FYP, IR applied for a safety
certification to run a new semi-HSR service between Delhi and Agra, a distance of 200 km. “Called the Gatimaan
Express, the service was expected to run at top speeds of 160 kmph. Though scheduled to be launched in 2015,
safety requirements of the Commission of Railway Safety (CRS) caused delays. Originally planned to cover the
stretch in 90 minutes, the trial run on 22 March 2016 took 113 minutes, just four minutes faster than
the time taken by the Shatabdi Express” (Dastidar 2016).
After 30 years of research and development in railway technologies, with a focus on high- speed travel, the Gatimaan
Express posted only a very modest achievement. This indicated that the existing network can only support so much
speed and no more. The need of the hour had to be a totally new system with a clear break from the past. The HSR
system is that clear break in technology and is waiting to be embraced.
The 12th FYP document also proposed the setting up of an autonomous National High-Speed Rail Authority (NHSRA),
through a bill in Parliament for the implementation of high-speed rail corridor projects by Indian Railways. This
151
authority was to be entrusted with the work of planning, standard setting, and implementing and monitoring these
projects. However, the actual establishment of the HSRA was slightly altered in procedure. The High-Speed Rail
Corporation of India Limited was incorporated as a subsidiary of Rail Vikas Nigam Limited (RVNL) on 25 July 2012 and
was launched on 29 October 2013 in New Delhi.11
It was in the midst of these circumstances that in February 2010, nearly 2 decades after the start of the economic
liberalization process in India, the Government of India set up the National Transport Development Policy Committee
as a high-level committee. The final report, submitted in 2013, was titled India Transport Report: Moving India to
2032 and had many recommendations for Indian Railways (National Transport Development Policy Committee 2013).
Among them were the following:
For long-term sustainability, railways have to be run as a business on sound commercial principles. However, the
several social/national responsibilities of IR prevent it from operating on a purely commercial basis. While IR has to
fulfill both roles, it is essential that the commercial and social roles are kept distinct and separate.
The lack of clarity between its public-service obligations and commercial objectives affects several other operational
practices/systems of IR, such as investment planning, project execution, costing and tariff practices, the accounting
system, etc., making it even more difficult to reconcile these roles. This, and the need to implement India’s first HSR
project, resulted in the establishment of the NHSRA/HRSCIL.
In order to meet the ambitious goals set for 2032, the major issues confronting the network were classified under the
following broad headings:
● Capacity constraints;
● Lack of clarity on social and commercial objectives;
● Safety;
● Inadequate research and development;
● Optimization of land use;
● Energy conservation; and
● Organizational and human resource issues.
High-speed Rail: Basics And Background
According to the International Union of Railways (UIC), the definition of HSR states that it is a grounded, guided, and
low-grip transport system; it could be considered to be a railway subsystem. The most important change comes from
the speed. As travel times had to be reduced for commercial purposes, speed emerged as the main factor. HSR meant
a jump in commercial speed and this is why the UIC considers a commercial speed of 250 km/h to be the principal
criterion for the definition of HSR (UIC 2018).
Indian Railways Enters The 21st Century
Keeping the above definition in mind, it would be useful to examine the evolution of the Indian approach. From
time-to-time various white papers and other important documents have been released by Indian Railways, listing
contemporary objectives. For the purposes of this paper, those released over the last decade are considered.
One of the principal documents was titled: Indian Railways Vision 2020 was presented to the Indian Parliament on 20
December 2009 (Ministry of Railways 2009). It focused on four strategic national goals, namely:
● Inclusive development, both geographically and socially;
● Strengthening national integration;
● Large-scale generation of productive employment;
● Environmental sustainability.
The document touched upon all aspects of India’s development of its railways. These covered, among others, the
areas of high-speed travel, capacity augmentation, passenger services, safety, freight movement, technology
upgradation including enhanced telecommunications, investment goals, public-private partnership etc. It was also
emphasized that Indian Railways would remain under government control for the foreseeable future.
Some specific points in the vision document include:
1 The RVNL is a special-purpose vehicle created to undertake project development and mobilization of financial resources, and implement projectspertaining to strengthening the Golden Quadrilateral and port connectivity. The Company was incorporated in New Delhi as a public limitedcompany on 24 January 2003 as “Rail Vikas Nigam Limited.” It is an organization associated with Indian Railways among whose tasks is to buildengineering works required by Indian Railways.
152
For enhancing capacity, doubling or quadrupling of selected lines and complete segregation of passenger and freight
lines on high-density routes. With this, more than 30,000 km of route would be of double/multiple lines of which
more than 6,000 km would be a quadrupled line with segregation of lines. This would include the main routes
from Delhi to the three other major metropolises, viz., Kolkata, Mumbai, and Chennai, with the building of dedicated
freight corridors.
The speed of freight trains on Indian Railways, which had stagnated at around 25 km/h, would be raised to a
maximum of 60 to 70 km/h. Passenger services that are slow by international standards would see an increase in
their maximum permissible speed of 130 km/h (for Rajdhani/Shatabdi trains) and 110 km/h (for other mail/express
trains) to between 160 and 200 km/h, respectively. As regards high-speed rail travel, the vision document aimed to
raise the speed of regular passenger trains to between 160 and 200 km/h on the segregated routes.
However, the Vision 2020 document (Ministry of Railways 2009) also laid down the objective to implement “at least 4
high-speed rail projects to provide bullet train services running at between 250 and 300 km/h.” Specifically, six
corridors were listed, namely:
● (i) Delhi‒Chandigarh‒Amritsar
● (ii) Pune‒Mumbai‒Ahmedabad
● (iii) Hyderabad‒Dornakal‒Vijayawada‒Chennai
● (iv) Howrah‒Haldia
● (v) Chennai‒Bangalore‒Coimbatore‒Ernakulam
● (vi) Delhi‒Agra‒Lucknow‒Varanasi‒Patna
The white paper observed that these could be built as elevated corridors in keeping with the pattern of habitation
and the constraint of land in India. The railways will use the public–private partnership (PPP) mode for investment
and execution and draw on frontier technologies incorporating the highest standards of safety and service quality.
Part of the vision document deals with the suburban segment. It needs to be mentioned here that even though HSR
networks connect the city centers, the importance of suburban rail in the system framework cannot be overlooked.
These would provide further efficient connection to specific destinations within the urban/suburban areas.
The vision document refers to “partnership with state authorities for development of suburban rail systems.” In the
same context, it also clarifies an aim for railways to integrate the metro rail and suburban rail systems under a single
management in partnership with the respective state/city authorities. This would be one area for deeper study in the
realm of public policy.
As soon as a new government came to power in the middle of 2014, a new white paper on Indian Railways subtitled
“Lifeline of the nation” was released in February 2015 (Indian Railways 2015). The thrust was to convert Indian
Railways into being “… the backbone of India's economic development,” as the Prime Minister put it at the time of
the release of the document.
In the words of the then Railway Minister, “the objective of this paper is to show the challenges that the organization
is facing today. It also shows that Indian Railways is perched on a precipice but is capable of flying off and attaining
great heights. The organization, especially its staff, has inherent strength and I am confident that a clear direction,
targeted investments, and well-defined priorities can make the organization grow by leaps and bounds.”
There is a clear reference to the High-Speed Trains project under the FDI chapter and the Ahmedabad–Mumbai HSR
is also referred to under the projects identified for domestic/foreign direct investments in railways. The document is
more focused on the overall development of the railways sector with special emphasis on the finances required and
on the pattern of public-private partnership required to meet the objectives of the contents of the white paper.
In the following year, on 8 December 2016, the incumbent Minister of Railways launched the website: National Rail
Plan, 2030 (NRP 2030) . The objective is to “develop the National Rail Plan (NRP 2030) in consultation with all the2
stakeholders including state governments, public representatives, and other relevant central ministries” and thereby
provide the long-term perspective. NRP 2030 will endeavor to harmonize and integrate the rail
network with other modes of transport and create synergy for achieving a seamless multimodal transportation
network across the country. A visit to the website reveals that under the heading “Existing and Planned Rail Network”
there is a detailed reference both to the high-speed rail corridors and dedicated freight corridors.
2 This unique website, accessible at http://www.nationalrailplan.in, has been developed for all stakeholders to give their inputs for a purposefulstudy to enable long-term growth of Indian Railways in a comprehensive manner.
153
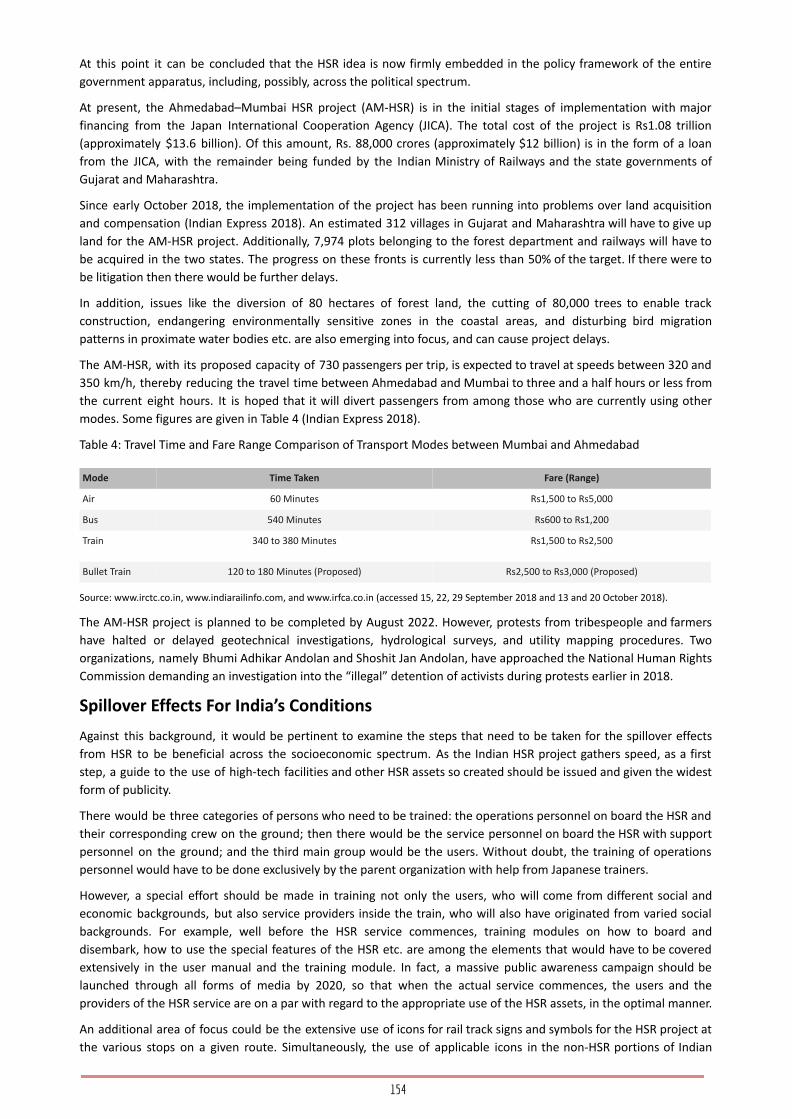
At this point it can be concluded that the HSR idea is now firmly embedded in the policy framework of the entire
government apparatus, including, possibly, across the political spectrum.
At present, the Ahmedabad–Mumbai HSR project (AM-HSR) is in the initial stages of implementation with major
financing from the Japan International Cooperation Agency (JICA). The total cost of the project is Rs1.08 trillion
(approximately $13.6 billion). Of this amount, Rs. 88,000 crores (approximately $12 billion) is in the form of a loan
from the JICA, with the remainder being funded by the Indian Ministry of Railways and the state governments of
Gujarat and Maharashtra.
Since early October 2018, the implementation of the project has been running into problems over land acquisition
and compensation (Indian Express 2018). An estimated 312 villages in Gujarat and Maharashtra will have to give up
land for the AM-HSR project. Additionally, 7,974 plots belonging to the forest department and railways will have to
be acquired in the two states. The progress on these fronts is currently less than 50% of the target. If there were to
be litigation then there would be further delays.
In addition, issues like the diversion of 80 hectares of forest land, the cutting of 80,000 trees to enable track
construction, endangering environmentally sensitive zones in the coastal areas, and disturbing bird migration
patterns in proximate water bodies etc. are also emerging into focus, and can cause project delays.
The AM-HSR, with its proposed capacity of 730 passengers per trip, is expected to travel at speeds between 320 and
350 km/h, thereby reducing the travel time between Ahmedabad and Mumbai to three and a half hours or less from
the current eight hours. It is hoped that it will divert passengers from among those who are currently using other
modes. Some figures are given in Table 4 (Indian Express 2018).
Table 4: Travel Time and Fare Range Comparison of Transport Modes between Mumbai and Ahmedabad
Mode Time Taken Fare (Range)
Air 60 Minutes Rs1,500 to Rs5,000
Bus 540 Minutes Rs600 to Rs1,200
Train 340 to 380 Minutes Rs1,500 to Rs2,500
Bullet Train 120 to 180 Minutes (Proposed) Rs2,500 to Rs3,000 (Proposed)
Source: www.irctc.co.in, www.indiarailinfo.com, and www.irfca.co.in (accessed 15, 22, 29 September 2018 and 13 and 20 October 2018).
The AM-HSR project is planned to be completed by August 2022. However, protests from tribespeople and farmers
have halted or delayed geotechnical investigations, hydrological surveys, and utility mapping procedures. Two
organizations, namely Bhumi Adhikar Andolan and Shoshit Jan Andolan, have approached the National Human Rights
Commission demanding an investigation into the “illegal” detention of activists during protests earlier in 2018.
Spillover Effects For India’s Conditions
Against this background, it would be pertinent to examine the steps that need to be taken for the spillover effects
from HSR to be beneficial across the socioeconomic spectrum. As the Indian HSR project gathers speed, as a first
step, a guide to the use of high-tech facilities and other HSR assets so created should be issued and given the widest
form of publicity.
There would be three categories of persons who need to be trained: the operations personnel on board the HSR and
their corresponding crew on the ground; then there would be the service personnel on board the HSR with support
personnel on the ground; and the third main group would be the users. Without doubt, the training of operations
personnel would have to be done exclusively by the parent organization with help from Japanese trainers.
However, a special effort should be made in training not only the users, who will come from different social and
economic backgrounds, but also service providers inside the train, who will also have originated from varied social
backgrounds. For example, well before the HSR service commences, training modules on how to board and
disembark, how to use the special features of the HSR etc. are among the elements that would have to be covered
extensively in the user manual and the training module. In fact, a massive public awareness campaign should be
launched through all forms of media by 2020, so that when the actual service commences, the users and the
providers of the HSR service are on a par with regard to the appropriate use of the HSR assets, in the optimal manner.
An additional area of focus could be the extensive use of icons for rail track signs and symbols for the HSR project at
the various stops on a given route. Simultaneously, the use of applicable icons in the non-HSR portions of Indian
154

Railways can also be promoted. Most of the symbols used currently by IR owe their origins to days prior to the
computerization of activities in India’s railway operations. A separate module for both categories should be designed
to ensure consistency and ease of recognition.
Japan Railways is well known for the high standard of its service personnel, especially the cleaning staff, who
complete their task in a bullet train in around seven minutes or so during a turnaround. To achieve comparable levels
of productivity for Indian personnel, appropriate guidance and, where needed, special training modules would have
to be designed. Further, the technology that goes with the provision of the service or maintenance would have to be
specially designed to suit Indian climatic as well as community conditions.
For instance, Japanese engineering-based activities are supported solidly by the practice of preventive maintenance.
It has to be ensured that when such activities for the HSR in India are designed, the cost of operation should remain
within limits. In this context, it is also necessary to focus on aspects like redundancy, which Japanese technology is
famous for, especially for high-value assets. Admittedly, redundancy in engineering systems enhances reliability but
this should not increase the costs of implementation of the Indian HSR to uncontrollable levels.
It needs to be remembered that levels of compliance between Japanese and Indian personnel (both user and
service) vary significantly. If the HSR assets created at enormous cost are to last for a long time, then it is necessary
that appropriate care is given to these assets right from the beginning. This should therefore include specially trained
people who are appointed for that task.
One of the important tasks for public policy specialists would be to look at various alternatives that correctly balance
(a) the overall costs of construction, (b) the maintenance cost of the assets thus created, and (c) the overarching
need to make HSR services available at an affordable cost to the user over the long term.
Indians, like people from other countries, love to travel during holidays, especially by train. Undoubtedly, this would
ensure higher occupancy rates. Even though travel habits have changed over the years, certain aspects of behavior
that arise from Indians traveling in groups differ widely from the Japanese practice and routine. This may require a
modified design for the movement of both passengers and their baggage inside the HSR carriages. From seat design
to racks for baggage, a new approach may be called for. Yet again, there would be a challenge to design a system that
caters to the distinctive demands of the service provider and the user in the Indian context. A thorough examination
of all facets followed by an extensive exchange of views on this would be an absolute necessity if the high-value HSR
is to ensure exceptional levels of service at high speeds!
Currently, of the following six corridors under consideration, four are in peninsular India. A crucial question arises.
Should one wait for the Ahmedabad‒Mumbai HSR project to be completed before taking up the other projects in the
list? In the context of proposed high-speed corridors, the table below lists the current time taken to cover the
existing distance by train and the time that is likely to be taken if HSR is introduced between the concerned
destinations.
Table 5: Comparison of the Current Journey Time to the Assumed Values for HSR Corridors in India (IRCTC 2018)
Route Present Distance Current Time by the Fastest
Train
Proposed HSR
Distance
Likely Journey Time
(Assumed Values)
Ahmedabad‒Mumbai 491 km 430 mins 534 km 120 to 180 mins
Bangalore‒Chennai 362 km 300 mins 340 km 90 to 120 mins
Chennai‒Hyderabad 715 km 760 mins 664 km 150 to 220 mins
Chennai‒Bangalore‒Ernakulam Not Applicable Not Applicable 649 km 150 to 220 mins
Delhi‒Jaipur‒Ajmer‒Jodhpur 553 km 610 mins 591 km 130 to 190 mins
Delhi‒Patna 983 km 700 mins 991 km 220 to 330 mins
Source: Data downloaded from Raghuram and Udaykumar (2016).
It needs to be noted here that the first AM-HSR is being constructed in an area that has very high levels of economic
development going back well over a century. However, are there other routes? The next most talked-about route is
the Bangalore–Chennai corridor (BC-cord) as part of the proposed Chennai–Ernakulam/Trivandrum HSR corridor.
A desk study was done to compare the present capacity available on the BC-cord through all modes so that a suitable
conclusion can be arrived at with regard to capacity and pricing for a possible HSR on the BC-cord. A calculation of
the number of seats available in air-conditioned comfort across modes was compiled and comparative data derived
155

from a hypothetical journey from Bangalore to Chennai by various modes, for a hypothetical journey on 17 October
2018, appears in Table 6 below.
Table 6: Travel Time and Fare Range Comparison of Transport Modes from Bangalore to Chennai
Mode Time Taken Fare (Range)
Air (4,400 Seats daily) 60 minutes Rs2,500 ‒ 10,700
Bus (3,400 Seats daily) 360 minutes Rs650 ‒1,800
Train (2,400 Seats daily) 300 to 360 minutes Rs550 ‒ 1,500
Bullet Train (??? Seats daily) 90 minutes (nonstop) ???
Source: http://www.nationalrailplan.in (accessed 8 October 2018).
Areas Likely To Be Influenced By HSR
The introduction of HSR in India is certain to stimulate active interest, both commercial and technological, in the area
of transportation in general and in railways in particular. India is among the latest entrants in the HSR segment.
Countries like Japan, Germany, France, Spain, and the People’s Republic of China (PRC) have already established the
norm for their respective systems.
The 2013 report of the National Transport Development Policy Committee (NTDPC), dealing with the railway sector,
states the following regarding HSR projects: A review of the most important projects carried out today around the
globe highlights that the potential demand for services must be particularly high in order to make investment in them
socially profitable and that these projects must target the corridors linking densely populated metropolitan areas,
suffering from severe road congestion, and having deficient air links.
A closer examination of the statement reveals the crucial phrase “socially profitable.” This is one of the most
important parameters whenever any high-cost infrastructure project is considered in India. The viability has to meet
not only the private cost-benefit analysis but also the social cost-benefit analysis norms prevalent at any given point
in time. If the latter yardstick were used for assessing the proposed HSR project in India, there would be many
weaknesses that may well negate the idea.
The present decision of the governments of Japan and India to go ahead with the construction of the HSR would
appear to be driven by the futuristic vision of the respective leaders. They look at the project as bringing the two
countries closer together economically, commercially, and technologically for the foreseeable future.
What effect the HSR will have on Indian Railways is difficult to predict. However, in a large and highly populated
country like India, the effects are likely to emerge over a period of time. One thing, however, is certain ‒ that the
introduction of the new technology of high-speed transport is certain to have a decisive effect on the existing system.
Transportation at higher speeds and economic productivity are directly linked. If a given task can be completed in less
time, productivity goes up automatically. In Japan, as people shifted from ordinary trains to the Shinkansen,
productivity levels increased and the economy benefited. Since the corridors identified in Table 5 are mostly
business, commerce, and industry oriented, the possibility that a similar productivity increase can be observed in the
Indian context too, by the middle of this century, is high. This could also form the basis for a deeper, analytical study
in the realm of public policy.
Spillover Effects
HSR, apart from providing a reliable, fast, and timely service, helps in two other ways. It has the capacity to divert
and absorb traffic from the air mode and the automobile (bus and cars) mode and also have an effect on reducing
the carbon footprint over a period of time. The other is the demonstration effect that the HSR can have on other
transportation modes in India. HSR may well replicate the effect that the automobile sector and the highways sector
have had on road transportation in India in the 21st century.
According to the European Energy Agency, the following are the CO2 emissions per passenger kilometer for various
modes of transport (Table 7):
Table 7: Carbon Dioxide Emissions per Passenger Kilometer for Various Modes as per European Energy Agency
Transport Mode Passenger Average Emissions (g-CO2/km*pax)
Train 156 14
156

Small car 4 42
Big car 4 55
Bus 12.7 68
Motorbike 1.2 72
Small car 1.5 104
Big car 1.5 158
Plane 88 285
Ship – 245
Source: Figures obtained from www.eea.europa.eu/transport on 23 October 2018.
A UIC study on HSR in France and the PRC (UIC 2016) concluded that the carbon footprint of HSR can be up to 14
times less carbon-intensive than car travel and up to 15 times less than aviation travel, even when measured over the
full life cycles of planning, construction, and operation of the different transport modes. This is even more important
where there are predictions of changes to the technology of all transport modes, such as cars, and even airplanes,
powered by electricity.
In the case of India, the potential for renewable sources for electricity production, especially wind and solar energy,
can really help in this regard. Further, in a country like India, where there is always a perennial shortage in the supply
of railway accommodation, any new high-speed alternative will always be fully subscribed. Given Indians’ innate urge
to travel for business and pleasure, a modal shift is bound to occur, thereby reducing the carbon footprint even
further. Since an average high-speed train is expected to carry about 700 to 800 passengers, the carbon footprint will
certainly grow smaller in the long run.
An average high-speed train emits no direct CO2. Emission depends on the mode of electricity generation used to run
the train. Keeping the above in mind, a calculation was made of the possible levels of emissions of CO2 in the BC-cord
based on actual seats available. The results are based on the desk study conducted on the number of seats available
in each mode for the BC-cord and depending on the load factor for a given mode, the amount of emissions is
compared.
Table 8: Carbon Dioxide Emission Estimations for Bangalore‒Chennai Corridor
Transport
Mode
Total No. of
Seats A/C
Capacity Utilization
Approx.
Passengers
Traveling
Distance Emissions
(gCO2/km*pax)
Total Emissions Total Emissions
(In Tonnes)
Air 4,400 70% 3,080 350 285 307,230,000 307 Tonnes
Bus 3,400 90% 3,060 350 68 72,828,000 72.9 Tonnes
Rail 2,800 80% 2,240 350 14 10,976,000 10.9 Tonnes
HSR 5,600 90% 5,040 350 6a 10,584,000 5.3 Tonnes
a* UIC Carbon Footprint of Railway Infrastructure: Comparing existing methodologies for typical corridor recommendation to harmonized
approach. UIC. https://uic.org/IMG/pdf/carbon_footprint_of_railway_infrastructure.pdf.
A Lesson From The Recent Past
To a large extent, the paradigm shifts in road transport in India arose as a result of the construction of the Golden
Quadrilateral highway project. It came into prominence after a decisive leap in technology achieved through foreign
investment in the manufacture of cars and commercial vehicles. The innumerable number of models of cars and
buses available in India, particularly over the last decade, has made road travel very comfortable. There is no denying
the fact that it was the government that built the roads on which these vehicles travel. However, the choice available
to the user from a private car to the most comfortable air-conditioned bus has changed the culture of road travel in
the country. Today, the three models of cars and three major models of trucks that defined the Indian motoring
landscape in the 20th century have disappeared.
Owing to the better quality of roads, constructed around the turn of the century, and the availability of luxury buses,
long-distance travel has blossomed in India in a big way over the last decade and a half. In this case, however, it was
the private bus operators who took the lead in acquiring modern buses and providing very comfortable services
connecting major cities in various regions of India. This, in turn, compelled the various state-run road transport
corporations to buy the same luxury buses, just to be able to compete. Long- and medium-distance travel (up to 600
km) has now resulted in a Pareto equilibrium in bus road travel in many parts of the country.
157
It is very likely that the HSR will compel Indian Railways, possibly through the demonstration effect, to change its
method of functioning and operations to help give greater comfort to passengers, enhance timely departures and
arrivals, and thereby post higher revenues along with greater efficiency. Two activities are already underway: the
construction of dedicated freight corridors and the expansion of carrying capacity by doubling or quadrupling the
number of railway lines on high-density routes. This will reduce congestion and also help the non-HSR sector to
improve its average speeds, thereby enabling a reduction in travel time across long distances.
Depending on the capacity of a given HSR, there would certainly be a shift away from the road to HSR, thereby
freeing up both the road and a part of the existing railway system. This would, in turn, reduce congestion across the
board. This freeing up of space will not only help the achievement of higher speeds for passenger trains on normal
tracks but also help freight trains move faster.
Competition From Cyberspace?
From another angle, let us take just two corridors: one between Chennai and Bangalore and the second between
Chennai and Hyderabad. Travel by HSR in the
|two sectors mentioned above is possible in about 90 minutes and 180 minutes, respectively. All the peninsular
cities/city pairs in the table above are heavily commerce and business oriented. Thus, the customer base for an HSR
service is significantly large. Their ability to pay more for a better and faster service is also a favorable factor. The
assistance that such a facility will render to the business community will be immense – especially to those who need
to physically travel to the termini or to the intermediate stops. Further, a trip in the above pairs can be
completed by businesspersons in the space of one working day. Such time savings will certainly lead to greater
efficiencies.
At the same time, just as the mobile phone revolution has comprehensively connected India by speech as well as
images, the appeal and pull of high-speed travel will be such that it will have to compete with the modern technology
of instant voice/image communication embellished by other facilities offered by high-speed Internet. An average
businessperson, taking care of a small/medium-sized enterprise, would normally tend to save time and costs. Thus,
unless travel by HSR becomes an inevitability or is a source of pleasure, that segment of the market may use it more
for the latter than the former. Therefore, HSR will face competition from the facilities offered by high-speed
connectivity by cyberspace both at the individual and at the industrial level, unless trips are taken purely for
pleasure. Simultaneously, however, varying with the distances involved, HSR may encourage that segment of the
population that can afford to travel short distances to try and take an HSR alternative just for the sake of it.
Here, it would be appropriate to quote from an article from the Free Press Journal dated 1 June 2018 about the
oldest high-speed journey train, called the Deccan Queen, which has run between Pune and Mumbai for nearly 90
years.
On 1 June 1930 (88 years ago), the Indian passenger train Deccan Queen Express started its service between Mumbai
and Pune. It was started as a weekend train during the British rule and was a medium for rich people from Bombay
(now Mumbai) to attend horse racing at Pune racecourse. The train started its initial services on weekends but was
soon converted to a daily service running from Bombay Victoria Terminus (now Chhatrapati Shivaji Maharaj Terminus
(CSMT)) to Pune Junction.
Deccan Queen is one of the longest-running train services of Indian Railways to never run on steam power. It has
been running using electric locomotives from the start and also used a diesel locomotive in case of original
locomotive failure. It was the first train to have a “ladies only” coach and among the first to feature a diner. It was
also one of India’s first vestibule trains.
Currently, Deccan Queen is the fastest train service linking CSMT in Mumbai and Pune station. It has an average
operating speed of 58 km/hr and a top speed of 105 km/hr. The train leaves Pune Junction every day at 7:15 a.m. and
reaches CSMT at 10:25 a.m. The train departs from CSMT every day at 5:10 p.m. and reaches Pune Junction at 8:25
p.m. There are hundreds of Pune residents who take this train to Mumbai on a daily basis for work and return the
same day. This is also what the HSR service hopes to achieve in India, but in the 21st century. There are bound to be
lessons from this train’s operations for the HSR planners in catering to the commuters who would travel for work
daily for a few hundred kilometers and return home the same day.
It would be useful to do a detailed study on a public policy canvas about those routes that could face competition
from cyberspace, as technology increases the speed of data transmission almost by the day. In the same context of
advances in technology, studies could be undertaken by the NITI Aayog (successor to the Planning Commission) on
158
identifying sources of funding and how to create new assets in the HSR universe. This should include studies
by Indian Railways on the introduction of new technologies and how these can be indigenized over a
period of time. They should also conduct studies on how traffic patterns can be improved and economy of operations
can be made more cost optimal. The Ministry of Finance, which has now included the railway budget within its own
ambit, should enable public policy studies on pricing of services and sources for funding, especially for asset
maintenance and renewal.
No discussion on HSR today can be complete without a mention of the achievements that the PRC has posted in this
sector. The PRC today has the world’s longest HSR network. Long-distance travel of more than 2,000 km is now
operational there. This includes the journey between Beijing and Hong Kong, China, which began its commercial
operations on 23 September 2018. It takes about 9 hours to cover the distance of 2,300 km between the two cities.
The line is the world's longest high-speed rail route and cuts travel time by more than half.
A similar route in India could link the capital Delhi with major southern cities like Chennai, Bangalore, Hyderabad, and
Trivandrum during the course of a day or through comfortable overnight journeys. Even if it is in the realm of
imagination, India needs to think ahead in terms of how the reliability and speed of the trains in our country can
better serve the socioeconomic objectives of India in general, and her railways in particular. There is a need to dream
big and dream right!
References
● Dastidar, A., 2016. India’s ‘fastest train’ beats first Shatabdi by all of two minutes.
https://indianexpress.com/article/india/india-news-india/indias-fastest-train- shatabdi-express-gatimaan-express/ (accessed 25 October 2018).
● High Speed Rail. 2018. https://uic.org/highspeed (accessed 8 October 2018).
● India Brand Equity Foundation. 2018. India Brand Equity Sectoral Report on Indian Railways. www.ibef.org.
● Indian Express Centre. Can't delegate land acquisition power to state government for bullet train project: Farmers.
http://www.newindianexpress.com/nation/
● 2018/oct/16/centre-cant-delegate-land-acquisition-power-to-state-government- for-bullet-train-project-farmers-1885919.html.
● Indian Railways. 2015. Lifeline of the Nation. White Paper released by India’s Railway Minister in February 2015. Accessed from the web on 19
September 2018.
● Indian Railways. Five-Year Plans of India. www.planningcommission.nic.in (accessed 15 August 2018).
● IRCTC Indian Railways Catering and Tourism Company. https://www.irctc.co.in, www.irctc.co.in, www.indiarailinfo.com, and www.irfca.co.in
(accessed 8 October 2018).
● National Rail Plan 2030 (NRP 2030) released on December 8, 2016 and accessed through website http://www.nationalrailplan.in.
● New Delhi Government of India, Ministry of Railways. 2009. Indian Railways: Vision 2020.
https://www.prsindia.org/uploads/media//Railways%20Vision%20Document%202020.pdf (accessed 19 September 2018).
● New Delhi Planning Commission of India. 2013. National Transport Development Policy Committee Report, Part 1.
● Planning Commission of India 12th Five-Year Plan. New Delhi Planning Commission of India 2012.
● Raghuram, G. and Udayakumar, Prashanth D. 2016. "Dedicated High Speed Rail Network in India: Issues in Development," IIMA Working Papers
WP2016-03- 58, Indian Institute of Management Ahmedabad, Research and Publication Department.
● UIC Carbon Footprint of Railway Infrastructure : Comparing existing methodologies for typical corridor recommendation to harmonized
approach. UIC. https://uic.org/ IMG/pdf/carbon_footprint_of_railway_infrastructure.pdf.
159
ANNEXURE #9
Mr. Tom�aka Takhashi
The Creation of a new Rob�-Era
The session began with Mr. Saideep Rathnam, Chief Operating Officer, India Japan Study Centre @ IIMB, welcoming
the participants to the webinar, and introducing them to IJSC, and its role to strengthen India and Japan bonds by
promoting academic, industrial, and societal linkages. He spoke about the webinar series, which aims to bring-in
experts from both countries to talk of societal, technological, business, and other facets of life highlighting both the
Indian and the Japanese perspectives.
Takahashi San was introduced as an eminent scientist, researcher, and entrepreneur. The audience were acquainted
with Takahashi San’s specialty of Humanoid Communication Robots, and his visionary approach towards the
emerging field of robotics. His evolving robots were introduced as having the ability to move, talk, have a personality
of their own, climb mountains, and even travel into space, while having the appearance of being alive.
Takahashi San began by expressing his passion for research, entrepreneurship, creating, and designing. He spoke
about how the pandemic has created chaos in the lives of people, but also suggested that it is an opportunity for
researchers and entrepreneurs to come up with new questions, and solutions.
The audience were taken through the process of the conception, designing, and application of his creations.
Takahashi San revealed that he does most of it by hand, and on his own, rarely resorting to automation. He then
introduced the audience to some of his Robots.
The first was the Humanoid Robot Astronaut, “Kirobo”, who was sent to the international space station. The Second
was a battery promoter robot, “Evolta” which did a full-length 24-hour marathon course with double A Batteries,
which it achieved without changing batteries. “Evolta” was also part of the Guinness World Record Challenge and
was shown climbing a 1000m high cliff for a TV Commercial.
He next spoke about an interesting initiative with De Agostini, an Italian manufacturer. The project was of a robot-kit,
where consumers could build their own robot, with the help of a guide published in a magazine over 70 issues, taking
a whole year to finally complete building the robot!
He went on to demonstrate his most popular communication robot which talked, danced, did tasks like take
photographs and project them, and made phone calls, all on voice command. He also spoke about his initiative of
over 50 robot schools across Japan and Asia and his new project of creating self-maneuvering boats.
He then took us through his journey as a robot-creator, which began from being inspired by the manga Astro Boy to
founding his own Company Robo-Garage, 20 years ago. He also displayed the Gundam (anime robot character) model
which he had designed as a student, and his creation that won “Robocup” the International Robot Football event,
where completely autonomous robots with 360-degree cameras compete for the Trophy.
He next discussed why he insists on working with his own hands, choosing his material and personalizing design. He
explained how he carved the molds by himself, as opposed to using a 3D Printer, and how he uses a blend of
materials which he figures out by experimentation. He pointed out that while these aspects could be outsourced,
doing it personally gave rise to new questions and solutions derived through the process. He expressed that this
principle could be applicable to all fields.
He mentioned how he sometimes tended to get carried away focusing on tiny parts and the creative aspects, and
that it is necessary to maintain a balance between the finer and broader view, such as the purpose of a creation, and
it’s applicability in society.
The next point in focus was the actual application of Humanoid Robots. He explained why humanoid communication
robots are not meant for physical chores. He spoke about how people generally assumed they could have a
human-like robot do daily chores for them, and a robot company’s experiment with creating a robot to do household
chores. He contended that it is not practical to charge a humanoid robot with something that could be accomplished
by a single-task device, such as a vacuum cleaner, and that they had their limitations in perception and strength.
160

Then, the audience were introduced to the functions of Communication Robots, using his own robot, “Robohon” as
an example. He demonstrated their ability to act as an interface between the human and all other devices. They
function by learning the user’s needs and communicating tasks to the other devices accordingly. They also undertake
a wide range of actions based on the user’s preferences, turning into an animate, adaptable companion.
He made a comparison between smartphones and robots, explaining how the appearance of being alive made the
robot interface more preferable to people, and why it would be the next big area for innovation of software and
hardware. He discussed his future venture, which is to create a “Jiminy Cricket”, a pocket robot.
He next spoke about an important dynamic of society. Earlier, necessity drove invention, but now innovation drives
need. He gave the example of how social media, which was not a necessity, but has several useful applications since
its inception.
Takahashi San went on to talk about how people need to focus on doing things unique to humans, which is creating,
rather than dwelling excessively on analysis. He expressed his belief that doing things gives rise to new questions,
which could then be explored by going back to studying.
In conclusion, he encouraged people to adopt a fun-seeking and curiosity induced approach to being designers,
creators, and technology consumers, and to pick a unique path in life, vis-a vis always going for the tried and tested.
Mr. Saideep Rathnam thanked Takahashi San for such an insightful presentation and summarized his key takeaways in
three points. Firstly, he appreciated the insight gained by learning about how Takahashi San works with his hands
while creating Technology. Secondly, he commented on how the audience was enlightened on the limitations and
applicability of Humanoid Robots, and the life-like aspect of Communication robots. He mentioned his personal
preference of talking to an animate being rather than a flat screen. Thirdly, he thanked Takahashi San for sharing his
approach to research and life, and for his advice to the audience on finding a balance between studying and creating.
The Q&A Session began with a question enquiring on the efficiency of designing and creating Robots by hand.
Takahashi San responded by giving instances where it is simpler to naturally draw and design parts by hand as a
compared to feeding the shape / structure he has envisioned in a computer, or wait for a 3D printer’s output, while
the same process could be repeated several times by hand in the same time-period. He also mentioned that it is
quicker to make changes to the design as it is unfolding.
The second question was about the difference between Robotics and Artificial Intelligence and addressing people’s
fear of Artificial Intelligence getting the better of Humans. Takahashi San responded by saying that Artificial
Intelligence is largely tasked with understanding user preferences and acting as an interface, which does not make it
any closer to mimicking human capacity, or human thoughts, but only to act as an intermediate between humans
and other technology.
Other questions on the limitation of Humanoid Robots were answered by discussing the primary functions of
Communication Robots, which would not include major physical tasks. Employing Humanoid robots in a purely
physical capacity would not be a viable option in any sector.
The next question addressed by Takahashi San was about the applicability of robots as an educator. His take on the
topic was that the medium of education depends on the preference of the student, while some may pen and paper,
some might opt for a digital teacher.
He spoke of a different use of Robots in education, as a companion in learning, encouraging competition amongst
learners and as an added element of fun.
The session concluded with Takahashi San expressing that there can be no right or wrong in innovation, it is
something one must simply go ahead and try for themselves.
161
ANNEXURE #10
Prof. Suresh Bhagavatula
Insights into Understanding Japanese Cra�s & Related Policies
Table of Contents
Abstract
1 Introduction
1.1 Statement of the Research Problem
1.2 Research Methodology
1.3 Scope and Objectiv
Acknowledgements
PART 1
1. Introduction
1.1 Context Setting
1.2 History of the Crafts
2. Ministerial and Non-Ministerial Agencies responsible for Craft Policy
3. Craft Policies
3.1 Living National Treasure
3.2 DENSAN Certification
3.3 Designation of Traditional Crafts
4. Cultural Fairs and Exhibitions
5. Craftwork Education
6. Funding and Subsidies
7. Cool Japan – Creating Overseas Demand
8. Conclusion
PART 2
1 Kyoto Handloom History
2 History of Nishijin (15th Century
3 Family Tradition and Innovation
4 Return to High Market Goods
5 Conclusion
PART 3
List of Pictures
162

Acknowledgements
I thank Vishruti Shrivastava for helping me in transcribing and conducting preliminary research on the Japanese
handloom industry. I would also like to thank Prof. Krishna Sundar for the continuous support both in Bangalore and
in Japan. And finally would like to acknowledge the financial and logistical support provided by the India Japan Study
Centre @ IIM Bangalore.
Part 1
1. Introduction
1.1 Context Setting
Conventionally, cultural economics focuses more on the arts than crafts. However, while art is acknowledged as a
driver of innovation, crafts play an integral role in keeping traditions alive. While machinery and automation can
provide convenience and better margins, handicrafts and their impact are often overlooked. Handicrafts connect us
to the past, where hand-operated tools made everything. While we no longer need handcrafted products in the
modern technological world, there is something about these imperfectly made products that make them
aesthetically valuable to niche segments of the population. Making the products by hand required skills and training
that took long years, and most of these skills are learnt under the guidance of master craftspeople than in a formal
educational institution. Japan has been one of the nations that placed handmade objects high in value and therefore
developed policy frameworks to ensure that Japanese handicrafts find a market and can remain economically viable
for their producers. The objective of this study is to run through some of these unique policies that have helped
handicrafts thrive and stay relevant even in today’s day and age.
The study is divided into three parts. In the first part, I will be discussing the history of the craft policies. In the
second part, I will be discussing the handloom sector in Kyoto with a specific focus on the Nishijin area. In the final
part, I will be highlighting the interactions with entrepreneurs, weavers and store owners, which I had in Kyoto and
Tokyo.
1.2 History of the Crafts
Until the country opened up via the Meiji restoration, art and craft was one identity. It was only after 1868 that
western influences forced Japan to distinguish between art and craft. Consequently, crafts were separated into
artistic crafts and industrial crafts. Crafts were an important export product in the early periods of the Meiji era and1
were promoted extensively in international circles. Initially, they were admired by larger audiences at the Vienna
World’s Fair in 1873, but by 1878 these handicrafts were heavily criticized for being more industrial product than fine
art. The influence of western culture meant crafts bifurcated into artistic crafts on the one end and economic crafts2
on the other. Artistic crafts being aesthetic in appeal contrast, economic crafts had a functional purpose. It is worth
noting that later on, the mingei movement by Yanagi Soetsu was centred around the beauty of the economic craft.
While their primary objective was functionality, the beauty of these items lay in how they were created from an
unselfish purpose by an artisan not working for their ego since these products did not go out with nametags. Daily
use did make them more beautiful. The mingei movement was crucial in establishing an early predecessor to a3
policy framework for handicrafts by documenting, promoting and preserving folk crafts. A frequent rationalization4
against giving out subsidies for artisans is that the economic expenditure on culture does not give back enough
returns. However, research conducted by Hiroyuki Yamada, Masuyo Arai and Hideho Yasuda found that in the Tokyo
area, investment in art and culture had a more significant impact than construction or infrastructure.5
One of the first cultural policies regarding craftworks was established in 1897 - The Cultural Preservation Law for
Temples and Shrines, seeking to protect paintings and crafts found in religious places as tangible cultural heritages.
Internationally exhibiting Japanese handicrafts did not stop even after early criticism at the global stage since the
5 The Information Bulletin of the National Economic Associations in Japan, pg 23, 2014, available athttps://www.ibi-japan.co.jp/gakkairengo/htdocs/nenpou/pdf/no_34.pdf
4 See Reedy, p131
3 Cite Kikuchi, Reedy
2 Mori 2009
1 Cite
163
handicrafts evolved to include western sensibilities, perennial exhibitions like Bunten were held to large audiences
starting as early as 1907. To further create a solid foundation for ensuring craftworks survive through time, schools
specializing in craft traditions were also established, such as the Kanazawa College of Arts and the Tokyo High School
of Arts. In 1950, the Comprehensive Law for Cultural Heritage Preservation was established - this was probably the
first time the concept of intangible cultural heritage had been recognized, notably, even before UNESCO had done so.
Intangible heritage may be defined as the skills of traditional performing arts and traditional crafts. By 1974, a more
concrete policy dedicated to promoting craftworks was established as the Law for the Promotion of Traditional Craft
Industries and entrusted to the Ministry of Economy, Trade and Industry (METI). As this law evolved through the
years, the national government began to take on a more holistic approach towards creating a market for handicraft
goods by establishing sound measures for passing down traditional know-how within the Japanese citizenry and
branding strategies (Cool Japan) for appreciation across the globe.
2. Ministerial and Non-Ministerial Agencies responsible for Craft Policy
It must be understood that there is a mix of cultural and economic policymaking in the handling of the handicraft
industry. Both these lines of policy fall under different agencies within the government’s cabinet – the Agency for
Cultural Affairs (ACA) deals with cultural policy while the Ministry of Economy, Trade and Industry deals with
economic policy. The ACA treats important craftwork as a tangible cultural heritage policy while the techniques of6
making various craftworks are classified as intangible cultural heritage. While ‘Living National Treasure’ is not an
official term, those individuals whose skills are classified as Intangible Cultural Heritage are referred to as Living
National Treasures. They are responsible for carrying forward the traditions of the past to the future.7
The METI, on the other hand, deals exclusively with economic policy ensuring that there is a sizable market for all
handicrafts and making it readily available to large audiences. The Law for the Promotion of Traditional Craft8
Industries lays out a framework for a bottom-up approach whereby Production Areas or Manufacturers of
handicrafts in conjunction with each other and retailers layout Promotion Plans and Revitalization Plans , subject to9
which funding is given once recognized by the METI. The METI works with DENSAN (the Association for the
Promotion of Traditional Craft Industries), who help in promoting designated traditional craft industries.
3. Craft Policies
3.1 Living National Treasure
Article 2(II) of the Cultural Properties Act includes crafts as intangible cultural properties, and Article 71 of the
Cultural Properties Act states that the Minister of Education, Culture, Sports, Science and Technology may designate
important intangible cultural properties as important intangible cultural properties.
While there is no direct mention of the term “Living National Treasure” in the Cultural Properties Act, it is an informal
term that applies to the keepers of intangible cultural properties. While individuals or groups may get the status of
National Treasure or Important Intangible Cultural Property, the phrase Living National Treasure is usually reserved
for the individuals who have been certified.[ Article 71, Cultural Properties Act]
The holders of this title are granted 2 million yen for training and spreading knowledge on the skills required for the
designated craft. The government also gives subsidies and tax incentives in furtherance of the same. As the award10
comes with financial support to ensure the continuation of the tradition and complete documentation of the craft
and exhibitions to publicize it , it works as a definitive incentive for craftspersons to achieve this status. Moreover,11
those handicrafts made by living national treasures are high-value goods in the market because of their exclusivity
and endorsement by the national government.
3.2 DENSAN Certification
11 Making Traditional Pottery Sustainable Today: Three Case Studies in Akita Prefecture, Japan, Cara L. Reedy and Chandra L. Reedy, pg 131,available at http://www.archaeopress.com/Public/download.asp?id={B13FD0AF-E302-43DA-88EC-60971AB2FD43}
10 Miwako Sato, Japanese Artists: The Way it Was and Still is, Departures,https://www.departures.com/art-culture/art-design/japanese-artisans-and-living-national-treasures; See K Goto, pg 119
9 Article 71, Cultural Properties Act
8 Cite METI website
7 Cite
6 Cite Goto
164
The Association for the promotion of traditional craft industries (DENSAN) , along with METI, local governments and12
regional craft unions, certifies traditional craftspersons. Certification requires at least twelve years of work13
experience in a district specializing in a specific craft industry and the passing of an examination. DENSAN also plays
a central role in the promotion of designated traditional craft industries by providing vital services such as Human
Resources, demand development, trade exhibitions, research and information and the operation of Aoyama Square -
a shop in Tokyo where one can purchase traditional craft products from various areas throughout Japan.14
3.3 Designation of Traditional Crafts
To be considered a traditional craft, the following conditions need to be met[ Article 2 of the ‘Act’ 15
1. The craftwork ought to be used in daily life.
2. The primary production process should be performed by hand.
3. The tradition should be more than 100 years old.
4. The primary materials used to make the product must be more than a hundred years old.
5. The crafts industry should be concentrated in a specific regional district [the production area should be more
than ten firms or greater than 30 employees .16
A bottom-up approach is followed wherein manufacturers of traditional crafts can submit a joint promotion plan
through the prefectural governor. The promotion plan must relate to the following :17
1. Securing and fostering successors and training employees.
2. Generational Transfer or improvement of craftsmanship, techniques and quality.
3. Securing or research of raw materials.
4. Development of demand.
5. Improving the work environment.
6. Joint purchase/selling and other endeavours pertaining to joint business.
7. Quality labelling and provision of adequate information to consumers.
8. Employee welfare.
While the promotion plan is prima facie to be funded on the cooperative’s finances, there are numerous subsidies
and advantages that the Association and the govt bestow :18
1. Subsidy for successor training projects.
2. Assistance in collecting materials on traditional craft techniques and making recording films and documents.
3. To secure stable raw materials used for the production of traditional crafts, they will conduct a fact-finding
survey, conduct a field survey to see if it is available in Japan and overseas, and research to develop
alternative raw materials.
4. Assistance for developing new products using traditional techniques, developing new demand, and holding
exhibitions to grasp trends.
5. Assistance for design development of traditional crafts, evaluation meetings for new designs, and study
groups on the results of the evaluation meetings.
Thus, officially designated traditional crafts are eligible for labelling their products as “designated as traditional
crafts” and also financial assistance as under the act. The local cooperative business association in the production
area has to develop promotion plans/revitalization plans and submit them to METI via the prefectural government to
receive such assistance. Labelling allows the products to have a certain status and recognition as the government
endorses it. The designation as traditional crafts is also the first step to coming within the fold of the government’s
policies. These are also the crafts that DENSAN helps reach a global market.
18 Subsidy for expenses in implementing the promotion plan, DENSAN website, available at https://kyokai.kougeihin.jp/law/
17 Article 6 of the ‘Act’
16 What are Traditional Crafts?, DENSAN website, https://kyokai.kougeihin.jp/traditional-crafts/
15 The Law for the Promotion of Traditional Craft Industries], The decision is made by the Minister of Economy, Trade and Industry on counsel ofthe Industrial Structure Council; Defining Japan’s Traditional Crafts, Tsunagu Japan, available athttps://www.tsunagujapan.com/traditional-japanese-crafts-defined/
14 Yasushi Ueki and Yuki Kamiesu, Opportunities and Challenges of Developing Contemporary Relationships between Traditional Crafts andIndustries in Japan..., Research Report IDE-JETRO, pg 68,69, 2019,https://www.ide.go.jp/library/English/Publish/Download/Ec/pdf/201903_02_ch05.pdf
13 See K Goto, Crafts Policies in Japan, pg 121
12 [“The Traditional Craft Industry Promotion Association is a national, local public organization, production center association and organization asa core organization for promoting the traditional craft industry based on the Act on Promotion of the Traditional Craft Industry”, DENSAN website]
165

4. Cultural Fairs and Exhibitions
In the post-war period, one of the crucial developments in the realm of crafts was the setting up of the Japan Craft
Association (Nihon Kogei Kai) and the opening of the Japan Traditional Crafts Exhibition in 1955 - around this time is
when the government also began awarding the titles of Living National Treasure and Important Intangible Cultural
Property. National efforts to support traditional crafts included the establishment in the 1950s of an annual Japan
Fine Arts Exhibition (Nitten) and the first Japan Traditional Handicrafts Exhibition held in 1954 at the Cultural
Properties Protection Committee (now Agency for Cultural Affairs). Since then, various exhibitions have been held
within the country to highlight the various craftworks and present them to the larger populace. In the 1950s, the
Japan Fine Arts Exhibition (Nitten) was held as well as the first Japan Traditional Handicrafts Exhibition. One of the
most popular exhibitions to showcase traditional crafts is the annually held Japan Traditional Crafts Week, held
despite the coronavirus pandemic. Moreover, the Japan Craft Design Association regularly exhibits work by19
members at the annual “New Craft Exhibition” at Matsuya Department Store in Tokyo. Craft Centre Japan also hosts
permanent exhibits at the Maruzen Bookshop in Tokyo.20
Crafts Exhibitions are vital in exposing the product to different segments of the population. A common problem
faced by craftspersons is their inability to cater to larger audiences outside their local region or the availability of
cheaper imports in these regions. Showcasing these crafts and giving them visibility is possibly among the primary
steps to creating demand and ensuring the market is sustainable.
5. Craftwork Education
Art education was introduced in primary and secondary schools in Japan at the end of the nineteenth century,
emphasizing manual drawing.[ Christian Morgner, Governance and Policy Development of creative and cultural
industries in Japan from: Routledge Handbook of Cultural and Creative Industries in Asia, pg 44, 18 Dec 2018.] In the
late 19th century, the Japanese government established both the Department of Industrial Craft at Imperial
University and the Imperial Technical Craft Scheme to protect some of Japan’s unique craft traditions.[ See Reedy] In
1921, the Tokyo High School of Crafts was established to develop education in crafts - this later became part of the
Chiba National University. The Kanazawa College of Arts was one of the earliest to rely on supplying crafts persons
for the region back in 1946. Another famous institute that still finds relevance is The Kyoto Institute of Technology,
established in 1948 to teach crafts.21
The transmission of skills has seen a considerable drop among crafts persons with fewer young people taking to the
same. However, as mentioned by Reedy, there are some pockets of spaces where crafts persons are learning these
skills from universities even if not directly taught as per the conventional ‘apprenticeship’ method. An active system
of higher education in craftworks, set up early, has helped sustain the transmission of certain traditional craft
techniques and methods.
6. Funding and Subsidies
Officially designated Traditional craft products can be eligible for financial assistance implemented under the act. To
receive financial aid from the METI and other public entities to promote a selected traditional craft product, the local
cooperative business association in the production area, which consists of traditional craft producers, needs to
develop three-to five-year plans for industrial promotion and vitalization and submit them to the METI through the
local prefectural government. Such a bottom-up approach ensures that artisans are involved in the process. Their22
concerns are mirrored by the government who then alleviates the same by choosing to fund or subsidize what the
artisan wants instead of the standard method of allocating funds towards specific industries.
Article 19 of the Act also says that the national and local government must ensure appropriate tax measures for the23
smooth implementation of the accredited promotion plan. This implies that local governments must give tax breaks
to support the production areas where crafts are being manufactured.
23 Act on the Promotion of Traditional Craft Industries
22 SeeYasushi Ueki and Yuki Kamiesu, pg 68
21 See K Goto, Crafts Policies in Japan, pg 120
20 An Economic Essay on Traditional Handicraft Industries by taking Mingei and Traditional Crafts as a Base of Reappraisal, Tadashi Sanaka, pg 42
19 Coronavirus cannot hold back these traditional craft events,https://www.japantimes.co.jp/life/2020/09/20/style/japanese-traditional-craft-events/
166
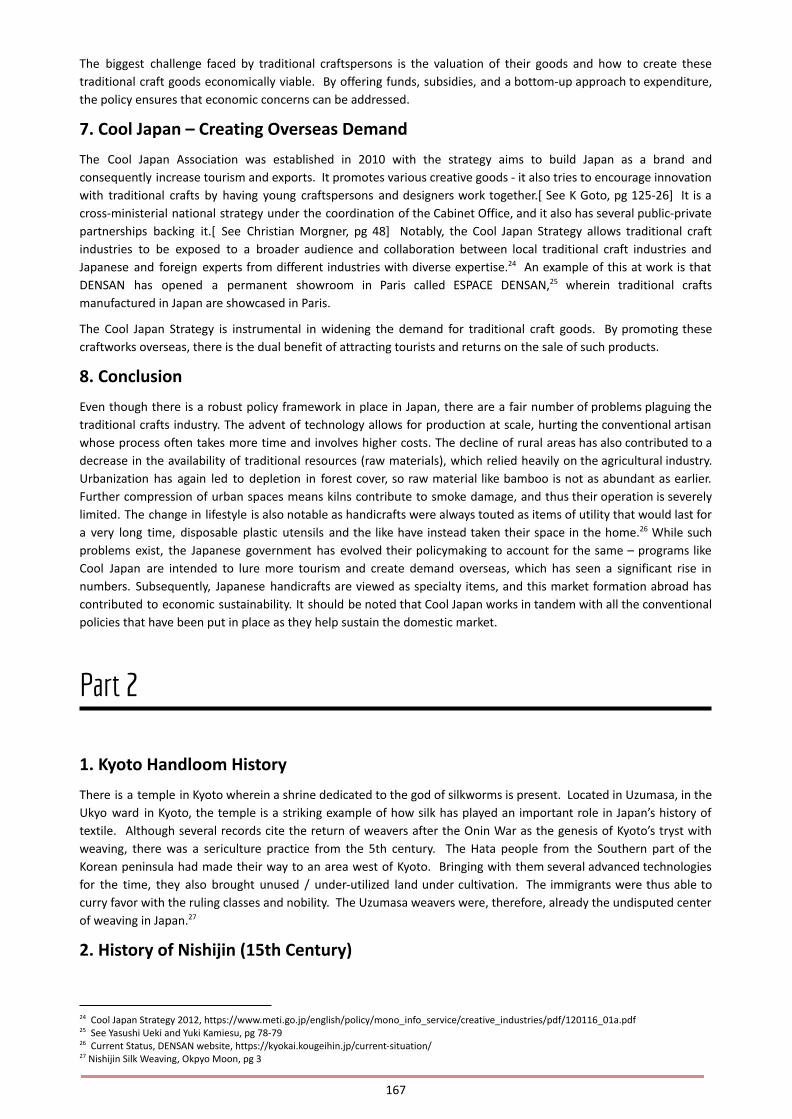
The biggest challenge faced by traditional craftspersons is the valuation of their goods and how to create these
traditional craft goods economically viable. By offering funds, subsidies, and a bottom-up approach to expenditure,
the policy ensures that economic concerns can be addressed.
7. Cool Japan – Creating Overseas Demand
The Cool Japan Association was established in 2010 with the strategy aims to build Japan as a brand and
consequently increase tourism and exports. It promotes various creative goods - it also tries to encourage innovation
with traditional crafts by having young craftspersons and designers work together.[ See K Goto, pg 125-26] It is a
cross-ministerial national strategy under the coordination of the Cabinet Office, and it also has several public-private
partnerships backing it.[ See Christian Morgner, pg 48] Notably, the Cool Japan Strategy allows traditional craft
industries to be exposed to a broader audience and collaboration between local traditional craft industries and
Japanese and foreign experts from different industries with diverse expertise. An example of this at work is that24
DENSAN has opened a permanent showroom in Paris called ESPACE DENSAN, wherein traditional crafts25
manufactured in Japan are showcased in Paris.
The Cool Japan Strategy is instrumental in widening the demand for traditional craft goods. By promoting these
craftworks overseas, there is the dual benefit of attracting tourists and returns on the sale of such products.
8. Conclusion
Even though there is a robust policy framework in place in Japan, there are a fair number of problems plaguing the
traditional crafts industry. The advent of technology allows for production at scale, hurting the conventional artisan
whose process often takes more time and involves higher costs. The decline of rural areas has also contributed to a
decrease in the availability of traditional resources (raw materials), which relied heavily on the agricultural industry.
Urbanization has again led to depletion in forest cover, so raw material like bamboo is not as abundant as earlier.
Further compression of urban spaces means kilns contribute to smoke damage, and thus their operation is severely
limited. The change in lifestyle is also notable as handicrafts were always touted as items of utility that would last for
a very long time, disposable plastic utensils and the like have instead taken their space in the home. While such26
problems exist, the Japanese government has evolved their policymaking to account for the same – programs like
Cool Japan are intended to lure more tourism and create demand overseas, which has seen a significant rise in
numbers. Subsequently, Japanese handicrafts are viewed as specialty items, and this market formation abroad has
contributed to economic sustainability. It should be noted that Cool Japan works in tandem with all the conventional
policies that have been put in place as they help sustain the domestic market.
Part 2
1. Kyoto Handloom History
There is a temple in Kyoto wherein a shrine dedicated to the god of silkworms is present. Located in Uzumasa, in the
Ukyo ward in Kyoto, the temple is a striking example of how silk has played an important role in Japan’s history of
textile. Although several records cite the return of weavers after the Onin War as the genesis of Kyoto’s tryst with
weaving, there was a sericulture practice from the 5th century. The Hata people from the Southern part of the
Korean peninsula had made their way to an area west of Kyoto. Bringing with them several advanced technologies
for the time, they also brought unused / under-utilized land under cultivation. The immigrants were thus able to
curry favor with the ruling classes and nobility. The Uzumasa weavers were, therefore, already the undisputed center
of weaving in Japan.27
2. History of Nishijin (15th Century)
27 Nishijin Silk Weaving, Okpyo Moon, pg 3
26 Current Status, DENSAN website, https://kyokai.kougeihin.jp/current-situation/
25 See Yasushi Ueki and Yuki Kamiesu, pg 78-79
24 Cool Japan Strategy 2012, https://www.meti.go.jp/english/policy/mono_info_service/creative_industries/pdf/120116_01a.pdf
167

The Onin wars lasted a decade (1467-1477), and they ravaged large swathes of Kyoto, war-torn and seeking refuge, a
group of weavers took to reside in Sakai, a merchant city near Osaka. After the war, they returned to a former
military camp outside the western walls of the city and lived there, setting up a community of weavers. The era of
Nishijin had thus laid the foundation in Kyoto, and the name is a derivative of “Western Camp”. This community of
weavers had clientele from the upper echelons of Japanese society, from the emperor to the feudal lords. What28
followed was the Edo Period (1603-1868), a relatively peaceful and prosperous time in Japanese history. Nishijin
textiles flourished because of various factors - they had a ready market of affluent nobility who could afford
high-quality textiles and held a monopoly on silk thread imported from China. Such was the fancy that even though29
the Shogunate had barred samurai warriors from wearing ostentatious garments, samurais (now more bureaucrats
than warriors) continued to adorn various kinds of glamorous Nishijin textiles. The urban middle class had an30
expendable income and would partake in the arts freely. Consequently, the Edo period saw a flourishing culture of
literature and various forms of entertainment such as Kabuki theatre. It is them who also became ready adopters of
high-quality silk garments.31
Towards the end of the Edo period, however, multiple events offset this early success as a series of crop failures
resulted in a decrease in demand for high-quality textile. Moreover, the Shogunate supported a variety of weaving
districts all across Japan, and Nishijin suffered from this competition. However, in response, Nishijin had set up a32
series of guilds to ensure quality control and ensure product improvement. Further, the Meiji emperor had shifted
the capital from Kyoto to Tokyo, which also served as a big blow to the industry. The western dress also became
prominent around this time, serving as a double punch since the demand for these clothes increased over traditional
attire. This crisis period served as an essential turning point for Nishijin textiles as the then Kyoto prefectural33
governor took steps to revitalize the industry by upping the ante on innovation. In 1872, he sent three textile experts
from Kyoto to Lyon in France to understand and acquire the jacquard loom, power looms and other dyes. The Hall of
weaving was also established in Kyoto in 1887, which acted as a centre for disseminating new technology. Nishijin34
also had the advantage of being surrounded by culturally relevant businesses and sites such as tea ceremony houses,
classical theatres, painter’s studios, shrines and temples. This patronage of high-quality textile continues to date. It35
should be noted that superior technique was also built through centuries of passing down weaving traditions among
families in the Nishijin community. Thus the quality of textiles was undoubtedly superior to comparable weaving
communities in the rest of the country.
3. Family Tradition and Innovation
Familial tradition plays an essential role in Nishijin textile history, and the formation of infrastructure within which
the industry resides is a result of the same. The current village structure is reminiscent of ancient cities wherein
horizontal blocks were concentrated and joined by narrow roads. Notably, such construction proved conducive to
tightly knit exclusive weaving communities that did not favour the ready acceptance of outsiders.[ A study on the
Regional Innovation in an Industrial Cluster: Focusing on a Traditional Textile Industry of Nishijin Area. Tai Hun Lee
and Soon Goo Hong, IJUNESST Vol 9 No. 4, pg 10 (2016)] Narrow streets also ensured that large scale transportation
would not feature in this area. Together these factors resulted in Nishijin not translating to the modern
manufacturing industry but more of a household production system during the Meiji period, which oversaw the
Industrial Revolution.[ See Tai Hun Lee and Hareven] The distribution system in Nishijin also had a crucial role to play
in this regard as unlike in other parts of the country where family-based weaving communities resided, in Kyoto,
there existed a unique system of intermediary merchants and wholesalers who had nationwide information about
the market and would assure sales of the product. Although such hierarchies provide fertile ground for exploitation36
by the wholesalers, they also absorb economic shocks so that the manufacturer is not exposed directly to the market
fluctuations.37
The industry saw several ups and downs through the Meiji Period, but its biggest blow was dealt later on during the
Second World War as production of Nishijin was halted almost entirely since it was considered a luxury good, only a
37 Ibid Moon, pg 123
36 See Heritization as a double-edged sword: the dilemma of Nishijin silk weaving in Kyoto, Japan, Okpyo Moon, pg 123 in Fashionable Traditions:Asian Handmade Textiles in Motion, Ayami Nakatani (2020)
35 See Taniguchi, 1993, pg 14, from Moon
34 See Morris-Suzuki 1994, from Hareven
33 Hareven pg 28, Moon pg 4
32 See Naramoto 1969, pp 223-224, from Moon
31 See Reischauer 1989, from Hareven
30 Hareven, pg 28
29 Supra Moon, pg 4-5
28 Hareven, pg 26
168
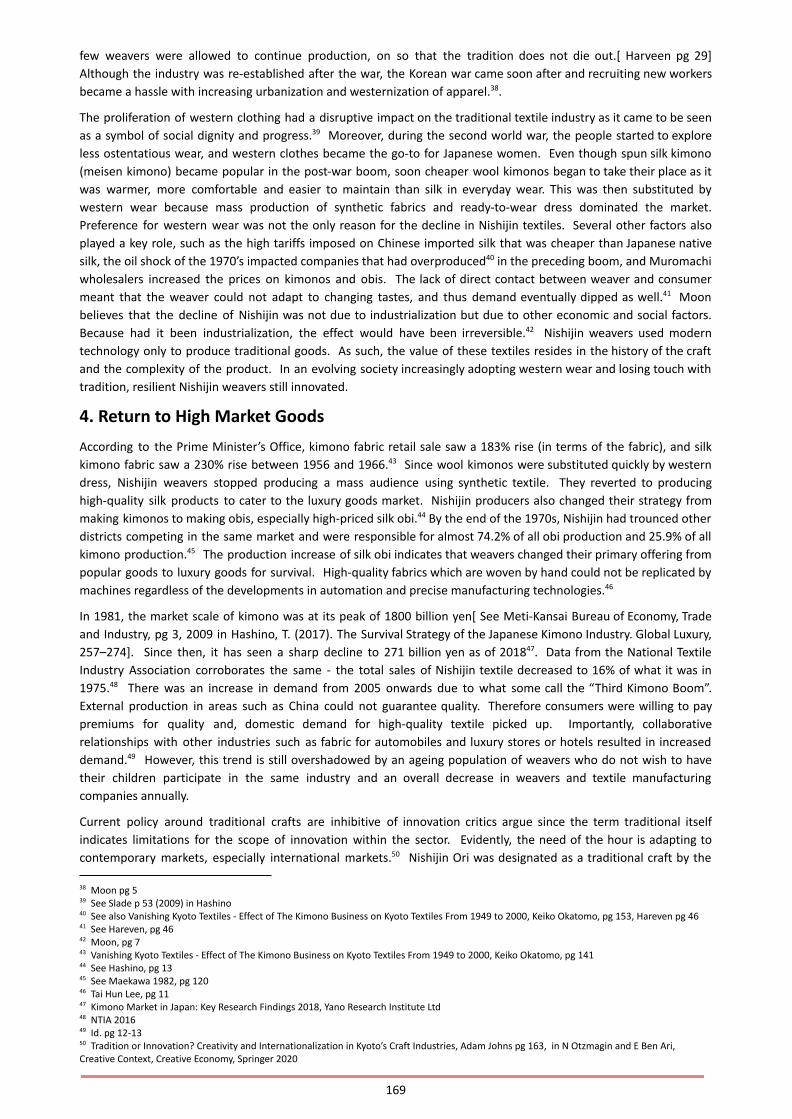
few weavers were allowed to continue production, on so that the tradition does not die out.[ Harveen pg 29]
Although the industry was re-established after the war, the Korean war came soon after and recruiting new workers
became a hassle with increasing urbanization and westernization of apparel. .38
The proliferation of western clothing had a disruptive impact on the traditional textile industry as it came to be seen
as a symbol of social dignity and progress. Moreover, during the second world war, the people started to explore39
less ostentatious wear, and western clothes became the go-to for Japanese women. Even though spun silk kimono
(meisen kimono) became popular in the post-war boom, soon cheaper wool kimonos began to take their place as it
was warmer, more comfortable and easier to maintain than silk in everyday wear. This was then substituted by
western wear because mass production of synthetic fabrics and ready-to-wear dress dominated the market.
Preference for western wear was not the only reason for the decline in Nishijin textiles. Several other factors also
played a key role, such as the high tariffs imposed on Chinese imported silk that was cheaper than Japanese native
silk, the oil shock of the 1970’s impacted companies that had overproduced in the preceding boom, and Muromachi40
wholesalers increased the prices on kimonos and obis. The lack of direct contact between weaver and consumer
meant that the weaver could not adapt to changing tastes, and thus demand eventually dipped as well. Moon41
believes that the decline of Nishijin was not due to industrialization but due to other economic and social factors.
Because had it been industrialization, the effect would have been irreversible. Nishijin weavers used modern42
technology only to produce traditional goods. As such, the value of these textiles resides in the history of the craft
and the complexity of the product. In an evolving society increasingly adopting western wear and losing touch with
tradition, resilient Nishijin weavers still innovated.
4. Return to High Market Goods
According to the Prime Minister’s Office, kimono fabric retail sale saw a 183% rise (in terms of the fabric), and silk
kimono fabric saw a 230% rise between 1956 and 1966. Since wool kimonos were substituted quickly by western43
dress, Nishijin weavers stopped producing a mass audience using synthetic textile. They reverted to producing
high-quality silk products to cater to the luxury goods market. Nishijin producers also changed their strategy from
making kimonos to making obis, especially high-priced silk obi. By the end of the 1970s, Nishijin had trounced other44
districts competing in the same market and were responsible for almost 74.2% of all obi production and 25.9% of all
kimono production. The production increase of silk obi indicates that weavers changed their primary offering from45
popular goods to luxury goods for survival. High-quality fabrics which are woven by hand could not be replicated by
machines regardless of the developments in automation and precise manufacturing technologies.46
In 1981, the market scale of kimono was at its peak of 1800 billion yen[ See Meti-Kansai Bureau of Economy, Trade
and Industry, pg 3, 2009 in Hashino, T. (2017). The Survival Strategy of the Japanese Kimono Industry. Global Luxury,
257–274]. Since then, it has seen a sharp decline to 271 billion yen as of 2018 . Data from the National Textile47
Industry Association corroborates the same - the total sales of Nishijin textile decreased to 16% of what it was in
1975. There was an increase in demand from 2005 onwards due to what some call the “Third Kimono Boom”.48
External production in areas such as China could not guarantee quality. Therefore consumers were willing to pay
premiums for quality and, domestic demand for high-quality textile picked up. Importantly, collaborative
relationships with other industries such as fabric for automobiles and luxury stores or hotels resulted in increased
demand. However, this trend is still overshadowed by an ageing population of weavers who do not wish to have49
their children participate in the same industry and an overall decrease in weavers and textile manufacturing
companies annually.
Current policy around traditional crafts are inhibitive of innovation critics argue since the term traditional itself
indicates limitations for the scope of innovation within the sector. Evidently, the need of the hour is adapting to
contemporary markets, especially international markets. Nishijin Ori was designated as a traditional craft by the50
50 Tradition or Innovation? Creativity and Internationalization in Kyoto’s Craft Industries, Adam Johns pg 163, in N Otzmagin and E Ben Ari,Creative Context, Creative Economy, Springer 2020
49 Id. pg 12-13
48 NTIA 2016
47 Kimono Market in Japan: Key Research Findings 2018, Yano Research Institute Ltd
46 Tai Hun Lee, pg 11
45 See Maekawa 1982, pg 120
44 See Hashino, pg 13
43 Vanishing Kyoto Textiles - Effect of The Kimono Business on Kyoto Textiles From 1949 to 2000, Keiko Okatomo, pg 141
42 Moon, pg 7
41 See Hareven, pg 46
40 See also Vanishing Kyoto Textiles - Effect of The Kimono Business on Kyoto Textiles From 1949 to 2000, Keiko Okatomo, pg 153, Hareven pg 46
39 See Slade p 53 (2009) in Hashino
38 Moon pg 5
169
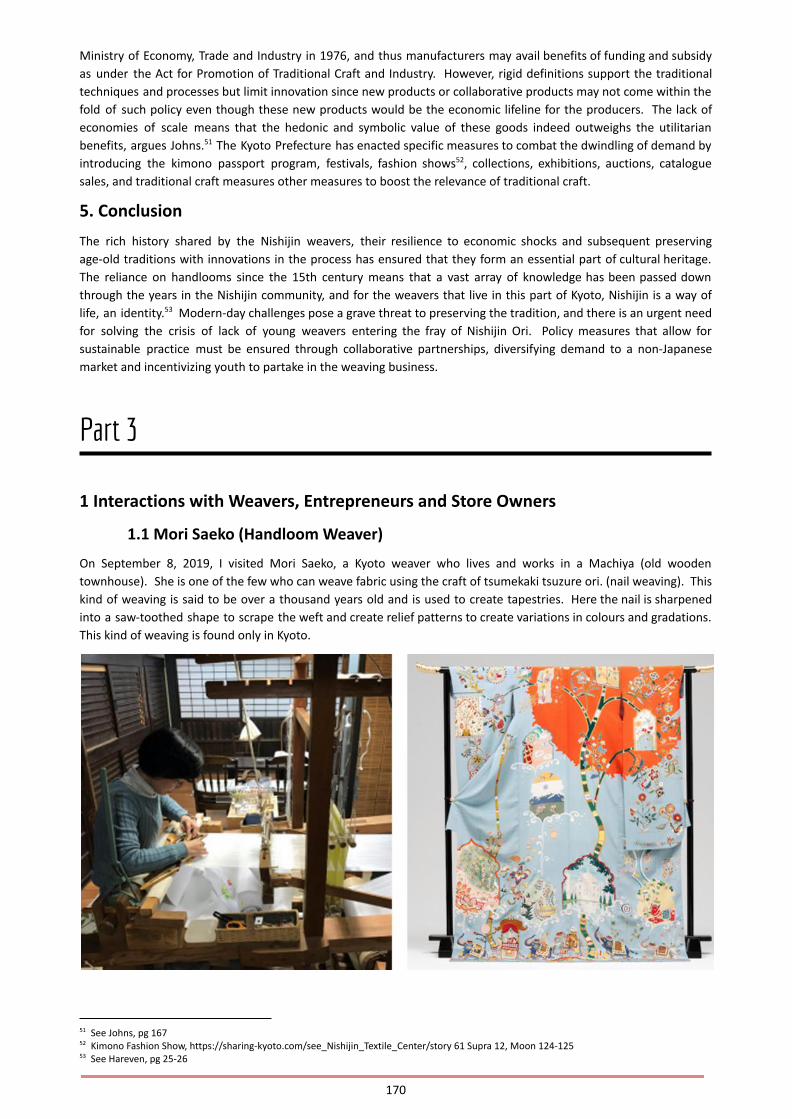
Ministry of Economy, Trade and Industry in 1976, and thus manufacturers may avail benefits of funding and subsidy
as under the Act for Promotion of Traditional Craft and Industry. However, rigid definitions support the traditional
techniques and processes but limit innovation since new products or collaborative products may not come within the
fold of such policy even though these new products would be the economic lifeline for the producers. The lack of
economies of scale means that the hedonic and symbolic value of these goods indeed outweighs the utilitarian
benefits, argues Johns. The Kyoto Prefecture has enacted specific measures to combat the dwindling of demand by51
introducing the kimono passport program, festivals, fashion shows , collections, exhibitions, auctions, catalogue52
sales, and traditional craft measures other measures to boost the relevance of traditional craft.
5. Conclusion
The rich history shared by the Nishijin weavers, their resilience to economic shocks and subsequent preserving
age-old traditions with innovations in the process has ensured that they form an essential part of cultural heritage.
The reliance on handlooms since the 15th century means that a vast array of knowledge has been passed down
through the years in the Nishijin community, and for the weavers that live in this part of Kyoto, Nishijin is a way of
life, an identity. Modern-day challenges pose a grave threat to preserving the tradition, and there is an urgent need53
for solving the crisis of lack of young weavers entering the fray of Nishijin Ori. Policy measures that allow for
sustainable practice must be ensured through collaborative partnerships, diversifying demand to a non-Japanese
market and incentivizing youth to partake in the weaving business.
Part 3
1 Interactions with Weavers, Entrepreneurs and Store Owners
1.1 Mori Saeko (Handloom Weaver)
On September 8, 2019, I visited Mori Saeko, a Kyoto weaver who lives and works in a Machiya (old wooden
townhouse). She is one of the few who can weave fabric using the craft of tsumekaki tsuzure ori. (nail weaving). This
kind of weaving is said to be over a thousand years old and is used to create tapestries. Here the nail is sharpened
into a saw-toothed shape to scrape the weft and create relief patterns to create variations in colours and gradations.
This kind of weaving is found only in Kyoto.
53 See Hareven, pg 25-26
52 Kimono Fashion Show, https://sharing-kyoto.com/see_Nishijin_Textile_Center/story 61 Supra 12, Moon 124-125
51 See Johns, pg 167
170
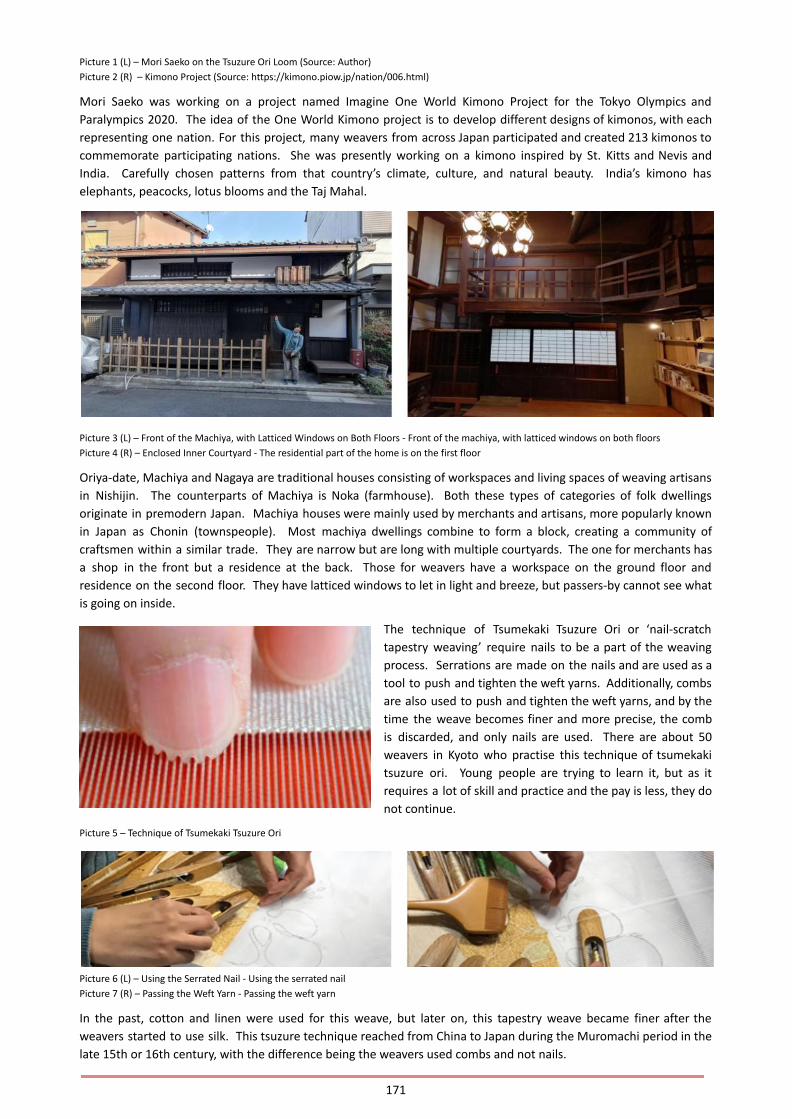
Picture 1 (L) – Mori Saeko on the Tsuzure Ori Loom (Source: Author)
Picture 2 (R) – Kimono Project (Source: https://kimono.piow.jp/nation/006.html)
Mori Saeko was working on a project named Imagine One World Kimono Project for the Tokyo Olympics and
Paralympics 2020. The idea of the One World Kimono project is to develop different designs of kimonos, with each
representing one nation. For this project, many weavers from across Japan participated and created 213 kimonos to
commemorate participating nations. She was presently working on a kimono inspired by St. Kitts and Nevis and
India. Carefully chosen patterns from that country’s climate, culture, and natural beauty. India’s kimono has
elephants, peacocks, lotus blooms and the Taj Mahal.
Picture 3 (L) – Front of the Machiya, with Latticed Windows on Both Floors - Front of the machiya, with latticed windows on both floors
Picture 4 (R) – Enclosed Inner Courtyard - The residential part of the home is on the first floor
Oriya-date, Machiya and Nagaya are traditional houses consisting of workspaces and living spaces of weaving artisans
in Nishijin. The counterparts of Machiya is Noka (farmhouse). Both these types of categories of folk dwellings
originate in premodern Japan. Machiya houses were mainly used by merchants and artisans, more popularly known
in Japan as Chonin (townspeople). Most machiya dwellings combine to form a block, creating a community of
craftsmen within a similar trade. They are narrow but are long with multiple courtyards. The one for merchants has
a shop in the front but a residence at the back. Those for weavers have a workspace on the ground floor and
residence on the second floor. They have latticed windows to let in light and breeze, but passers-by cannot see what
is going on inside.
The technique of Tsumekaki Tsuzure Ori or ‘nail-scratch
tapestry weaving’ require nails to be a part of the weaving
process. Serrations are made on the nails and are used as a
tool to push and tighten the weft yarns. Additionally, combs
are also used to push and tighten the weft yarns, and by the
time the weave becomes finer and more precise, the comb
is discarded, and only nails are used. There are about 50
weavers in Kyoto who practise this technique of tsumekaki
tsuzure ori. Young people are trying to learn it, but as it
requires a lot of skill and practice and the pay is less, they do
not continue.
Picture 5 – Technique of Tsumekaki Tsuzure Ori
Picture 6 (L) – Using the Serrated Nail - Using the serrated nail
Picture 7 (R) – Passing the Weft Yarn - Passing the weft yarn
In the past, cotton and linen were used for this weave, but later on, this tapestry weave became finer after the
weavers started to use silk. This tsuzure technique reached from China to Japan during the Muromachi period in the
late 15th or 16th century, with the difference being the weavers used combs and not nails.
171
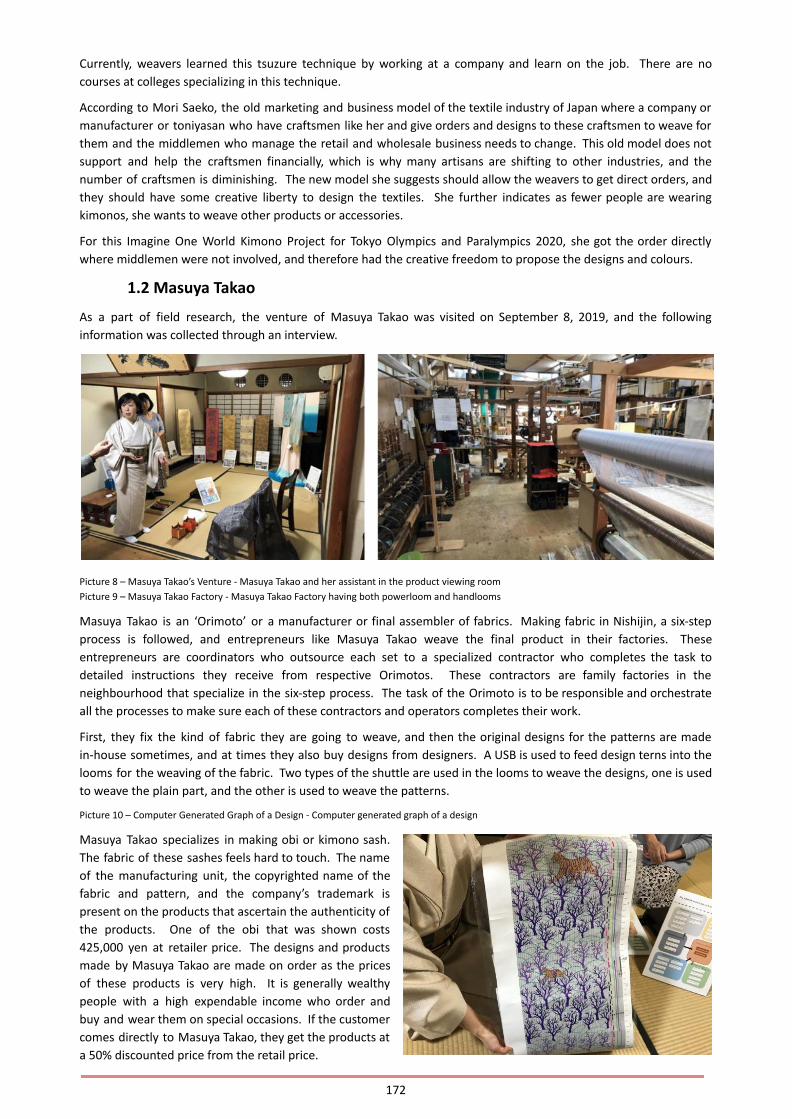
Currently, weavers learned this tsuzure technique by working at a company and learn on the job. There are no
courses at colleges specializing in this technique.
According to Mori Saeko, the old marketing and business model of the textile industry of Japan where a company or
manufacturer or toniyasan who have craftsmen like her and give orders and designs to these craftsmen to weave for
them and the middlemen who manage the retail and wholesale business needs to change. This old model does not
support and help the craftsmen financially, which is why many artisans are shifting to other industries, and the
number of craftsmen is diminishing. The new model she suggests should allow the weavers to get direct orders, and
they should have some creative liberty to design the textiles. She further indicates as fewer people are wearing
kimonos, she wants to weave other products or accessories.
For this Imagine One World Kimono Project for Tokyo Olympics and Paralympics 2020, she got the order directly
where middlemen were not involved, and therefore had the creative freedom to propose the designs and colours.
1.2 Masuya Takao
As a part of field research, the venture of Masuya Takao was visited on September 8, 2019, and the following
information was collected through an interview.
Picture 8 – Masuya Takao’s Venture - Masuya Takao and her assistant in the product viewing room
Picture 9 – Masuya Takao Factory - Masuya Takao Factory having both powerloom and handlooms
Masuya Takao is an ‘Orimoto’ or a manufacturer or final assembler of fabrics. Making fabric in Nishijin, a six-step
process is followed, and entrepreneurs like Masuya Takao weave the final product in their factories. These
entrepreneurs are coordinators who outsource each set to a specialized contractor who completes the task to
detailed instructions they receive from respective Orimotos. These contractors are family factories in the
neighbourhood that specialize in the six-step process. The task of the Orimoto is to be responsible and orchestrate
all the processes to make sure each of these contractors and operators completes their work.
First, they fix the kind of fabric they are going to weave, and then the original designs for the patterns are made
in-house sometimes, and at times they also buy designs from designers. A USB is used to feed design terns into the
looms for the weaving of the fabric. Two types of the shuttle are used in the looms to weave the designs, one is used
to weave the plain part, and the other is used to weave the patterns.
Picture 10 – Computer Generated Graph of a Design - Computer generated graph of a design
Masuya Takao specializes in making obi or kimono sash.
The fabric of these sashes feels hard to touch. The name
of the manufacturing unit, the copyrighted name of the
fabric and pattern, and the company’s trademark is
present on the products that ascertain the authenticity of
the products. One of the obi that was shown costs
425,000 yen at retailer price. The designs and products
made by Masuya Takao are made on order as the prices
of these products is very high. It is generally wealthy
people with a high expendable income who order and
buy and wear them on special occasions. If the customer
comes directly to Masuya Takao, they get the products at
a 50% discounted price from the retail price.
172
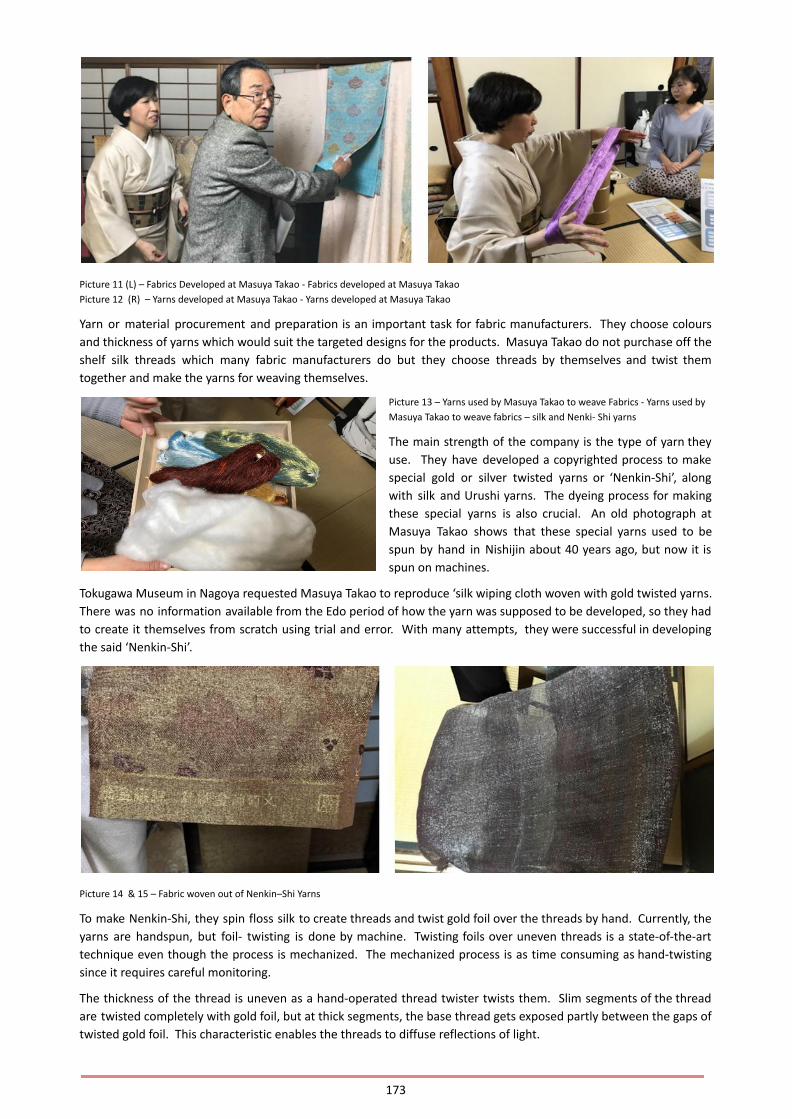
Picture 11 (L) – Fabrics Developed at Masuya Takao - Fabrics developed at Masuya Takao
Picture 12 (R) – Yarns developed at Masuya Takao - Yarns developed at Masuya Takao
Yarn or material procurement and preparation is an important task for fabric manufacturers. They choose colours
and thickness of yarns which would suit the targeted designs for the products. Masuya Takao do not purchase off the
shelf silk threads which many fabric manufacturers do but they choose threads by themselves and twist them
together and make the yarns for weaving themselves.
Picture 13 – Yarns used by Masuya Takao to weave Fabrics - Yarns used by
Masuya Takao to weave fabrics – silk and Nenki- Shi yarns
The main strength of the company is the type of yarn they
use. They have developed a copyrighted process to make
special gold or silver twisted yarns or ‘Nenkin-Shi’, along
with silk and Urushi yarns. The dyeing process for making
these special yarns is also crucial. An old photograph at
Masuya Takao shows that these special yarns used to be
spun by hand in Nishijin about 40 years ago, but now it is
spun on machines.
Tokugawa Museum in Nagoya requested Masuya Takao to reproduce ‘silk wiping cloth woven with gold twisted yarns.
There was no information available from the Edo period of how the yarn was supposed to be developed, so they had
to create it themselves from scratch using trial and error. With many attempts, they were successful in developing
the said ‘Nenkin-Shi’.
Picture 14 & 15 – Fabric woven out of Nenkin–Shi Yarns
To make Nenkin-Shi, they spin floss silk to create threads and twist gold foil over the threads by hand. Currently, the
yarns are handspun, but foil- twisting is done by machine. Twisting foils over uneven threads is a state-of-the-art
technique even though the process is mechanized. The mechanized process is as time consuming as hand-twisting
since it requires careful monitoring.
The thickness of the thread is uneven as a hand-operated thread twister twists them. Slim segments of the thread
are twisted completely with gold foil, but at thick segments, the base thread gets exposed partly between the gaps of
twisted gold foil. This characteristic enables the threads to diffuse reflections of light.
173
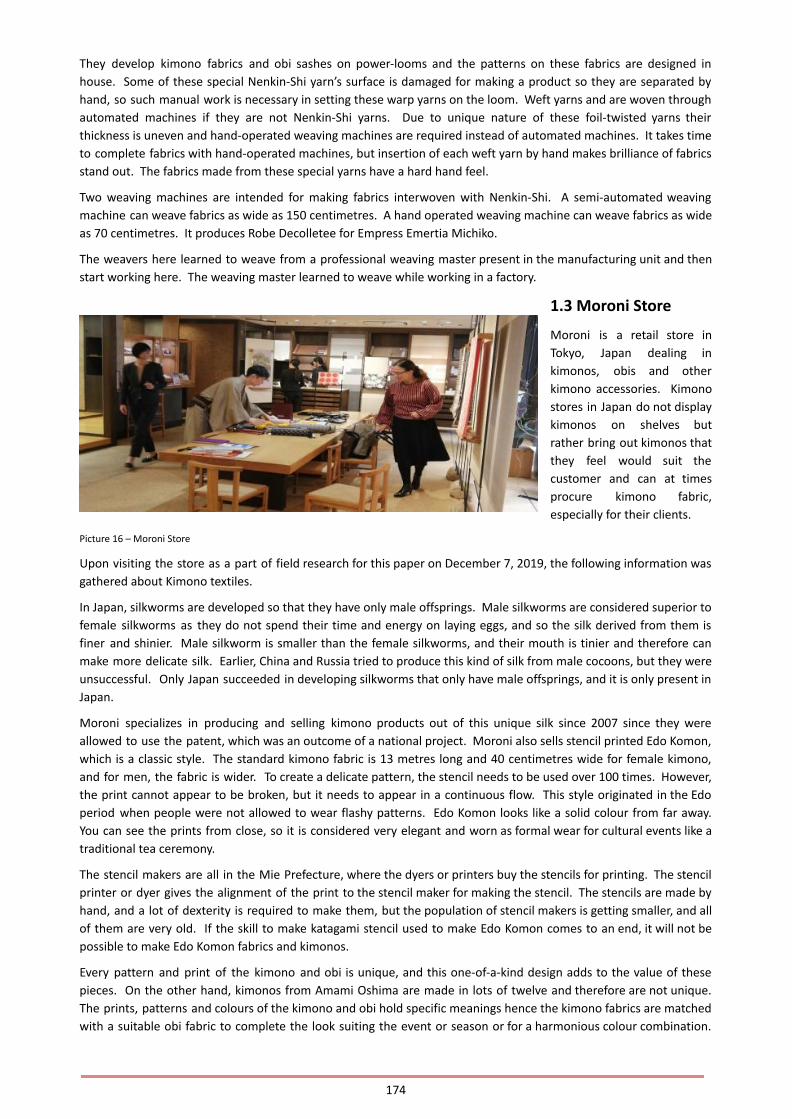
They develop kimono fabrics and obi sashes on power-looms and the patterns on these fabrics are designed in
house. Some of these special Nenkin-Shi yarn’s surface is damaged for making a product so they are separated by
hand, so such manual work is necessary in setting these warp yarns on the loom. Weft yarns and are woven through
automated machines if they are not Nenkin-Shi yarns. Due to unique nature of these foil-twisted yarns their
thickness is uneven and hand-operated weaving machines are required instead of automated machines. It takes time
to complete fabrics with hand-operated machines, but insertion of each weft yarn by hand makes brilliance of fabrics
stand out. The fabrics made from these special yarns have a hard hand feel.
Two weaving machines are intended for making fabrics interwoven with Nenkin-Shi. A semi-automated weaving
machine can weave fabrics as wide as 150 centimetres. A hand operated weaving machine can weave fabrics as wide
as 70 centimetres. It produces Robe Decolletee for Empress Emertia Michiko.
The weavers here learned to weave from a professional weaving master present in the manufacturing unit and then
start working here. The weaving master learned to weave while working in a factory.
1.3 Moroni Store
Moroni is a retail store in
Tokyo, Japan dealing in
kimonos, obis and other
kimono accessories. Kimono
stores in Japan do not display
kimonos on shelves but
rather bring out kimonos that
they feel would suit the
customer and can at times
procure kimono fabric,
especially for their clients.
Picture 16 – Moroni Store
Upon visiting the store as a part of field research for this paper on December 7, 2019, the following information was
gathered about Kimono textiles.
In Japan, silkworms are developed so that they have only male offsprings. Male silkworms are considered superior to
female silkworms as they do not spend their time and energy on laying eggs, and so the silk derived from them is
finer and shinier. Male silkworm is smaller than the female silkworms, and their mouth is tinier and therefore can
make more delicate silk. Earlier, China and Russia tried to produce this kind of silk from male cocoons, but they were
unsuccessful. Only Japan succeeded in developing silkworms that only have male offsprings, and it is only present in
Japan.
Moroni specializes in producing and selling kimono products out of this unique silk since 2007 since they were
allowed to use the patent, which was an outcome of a national project. Moroni also sells stencil printed Edo Komon,
which is a classic style. The standard kimono fabric is 13 metres long and 40 centimetres wide for female kimono,
and for men, the fabric is wider. To create a delicate pattern, the stencil needs to be used over 100 times. However,
the print cannot appear to be broken, but it needs to appear in a continuous flow. This style originated in the Edo
period when people were not allowed to wear flashy patterns. Edo Komon looks like a solid colour from far away.
You can see the prints from close, so it is considered very elegant and worn as formal wear for cultural events like a
traditional tea ceremony.
The stencil makers are all in the Mie Prefecture, where the dyers or printers buy the stencils for printing. The stencil
printer or dyer gives the alignment of the print to the stencil maker for making the stencil. The stencils are made by
hand, and a lot of dexterity is required to make them, but the population of stencil makers is getting smaller, and all
of them are very old. If the skill to make katagami stencil used to make Edo Komon comes to an end, it will not be
possible to make Edo Komon fabrics and kimonos.
Every pattern and print of the kimono and obi is unique, and this one-of-a-kind design adds to the value of these
pieces. On the other hand, kimonos from Amami Oshima are made in lots of twelve and therefore are not unique.
The prints, patterns and colours of the kimono and obi hold specific meanings hence the kimono fabrics are matched
with a suitable obi fabric to complete the look suiting the event or season or for a harmonious colour combination.
174
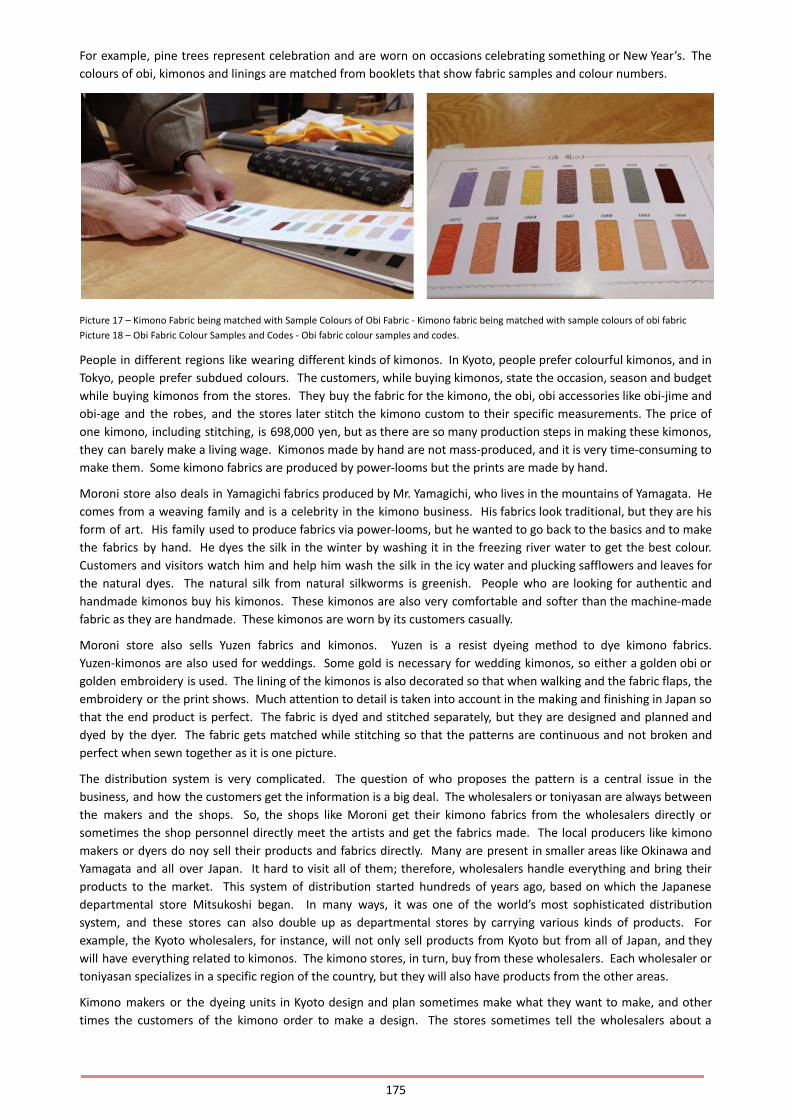
For example, pine trees represent celebration and are worn on occasions celebrating something or New Year’s. The
colours of obi, kimonos and linings are matched from booklets that show fabric samples and colour numbers.
Picture 17 – Kimono Fabric being matched with Sample Colours of Obi Fabric - Kimono fabric being matched with sample colours of obi fabric
Picture 18 – Obi Fabric Colour Samples and Codes - Obi fabric colour samples and codes.
People in different regions like wearing different kinds of kimonos. In Kyoto, people prefer colourful kimonos, and in
Tokyo, people prefer subdued colours. The customers, while buying kimonos, state the occasion, season and budget
while buying kimonos from the stores. They buy the fabric for the kimono, the obi, obi accessories like obi-jime and
obi-age and the robes, and the stores later stitch the kimono custom to their specific measurements. The price of
one kimono, including stitching, is 698,000 yen, but as there are so many production steps in making these kimonos,
they can barely make a living wage. Kimonos made by hand are not mass-produced, and it is very time-consuming to
make them. Some kimono fabrics are produced by power-looms but the prints are made by hand.
Moroni store also deals in Yamagichi fabrics produced by Mr. Yamagichi, who lives in the mountains of Yamagata. He
comes from a weaving family and is a celebrity in the kimono business. His fabrics look traditional, but they are his
form of art. His family used to produce fabrics via power-looms, but he wanted to go back to the basics and to make
the fabrics by hand. He dyes the silk in the winter by washing it in the freezing river water to get the best colour.
Customers and visitors watch him and help him wash the silk in the icy water and plucking safflowers and leaves for
the natural dyes. The natural silk from natural silkworms is greenish. People who are looking for authentic and
handmade kimonos buy his kimonos. These kimonos are also very comfortable and softer than the machine-made
fabric as they are handmade. These kimonos are worn by its customers casually.
Moroni store also sells Yuzen fabrics and kimonos. Yuzen is a resist dyeing method to dye kimono fabrics.
Yuzen-kimonos are also used for weddings. Some gold is necessary for wedding kimonos, so either a golden obi or
golden embroidery is used. The lining of the kimonos is also decorated so that when walking and the fabric flaps, the
embroidery or the print shows. Much attention to detail is taken into account in the making and finishing in Japan so
that the end product is perfect. The fabric is dyed and stitched separately, but they are designed and planned and
dyed by the dyer. The fabric gets matched while stitching so that the patterns are continuous and not broken and
perfect when sewn together as it is one picture.
The distribution system is very complicated. The question of who proposes the pattern is a central issue in the
business, and how the customers get the information is a big deal. The wholesalers or toniyasan are always between
the makers and the shops. So, the shops like Moroni get their kimono fabrics from the wholesalers directly or
sometimes the shop personnel directly meet the artists and get the fabrics made. The local producers like kimono
makers or dyers do noy sell their products and fabrics directly. Many are present in smaller areas like Okinawa and
Yamagata and all over Japan. It hard to visit all of them; therefore, wholesalers handle everything and bring their
products to the market. This system of distribution started hundreds of years ago, based on which the Japanese
departmental store Mitsukoshi began. In many ways, it was one of the world’s most sophisticated distribution
system, and these stores can also double up as departmental stores by carrying various kinds of products. For
example, the Kyoto wholesalers, for instance, will not only sell products from Kyoto but from all of Japan, and they
will have everything related to kimonos. The kimono stores, in turn, buy from these wholesalers. Each wholesaler or
toniyasan specializes in a specific region of the country, but they will also have products from the other areas.
Kimono makers or the dyeing units in Kyoto design and plan sometimes make what they want to make, and other
times the customers of the kimono order to make a design. The stores sometimes tell the wholesalers about a
175
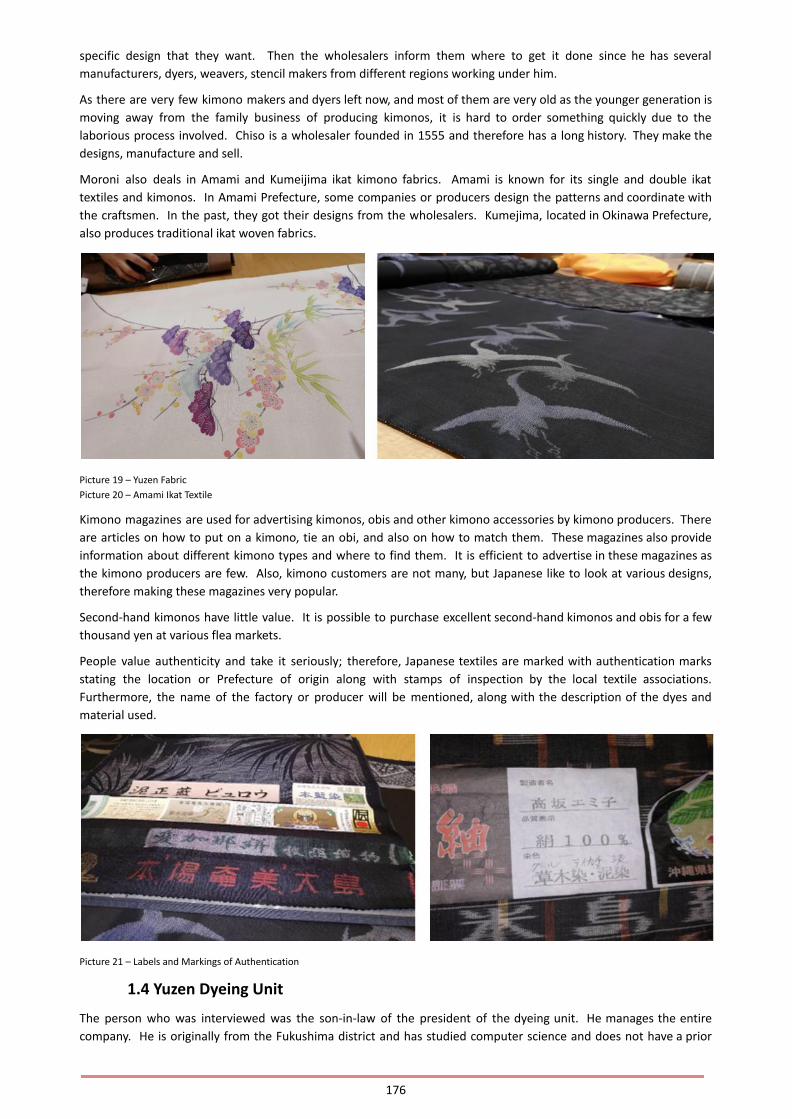
specific design that they want. Then the wholesalers inform them where to get it done since he has several
manufacturers, dyers, weavers, stencil makers from different regions working under him.
As there are very few kimono makers and dyers left now, and most of them are very old as the younger generation is
moving away from the family business of producing kimonos, it is hard to order something quickly due to the
laborious process involved. Chiso is a wholesaler founded in 1555 and therefore has a long history. They make the
designs, manufacture and sell.
Moroni also deals in Amami and Kumeijima ikat kimono fabrics. Amami is known for its single and double ikat
textiles and kimonos. In Amami Prefecture, some companies or producers design the patterns and coordinate with
the craftsmen. In the past, they got their designs from the wholesalers. Kumejima, located in Okinawa Prefecture,
also produces traditional ikat woven fabrics.
Picture 19 – Yuzen Fabric
Picture 20 – Amami Ikat Textile
Kimono magazines are used for advertising kimonos, obis and other kimono accessories by kimono producers. There
are articles on how to put on a kimono, tie an obi, and also on how to match them. These magazines also provide
information about different kimono types and where to find them. It is efficient to advertise in these magazines as
the kimono producers are few. Also, kimono customers are not many, but Japanese like to look at various designs,
therefore making these magazines very popular.
Second-hand kimonos have little value. It is possible to purchase excellent second-hand kimonos and obis for a few
thousand yen at various flea markets.
People value authenticity and take it seriously; therefore, Japanese textiles are marked with authentication marks
stating the location or Prefecture of origin along with stamps of inspection by the local textile associations.
Furthermore, the name of the factory or producer will be mentioned, along with the description of the dyes and
material used.
Picture 21 – Labels and Markings of Authentication
1.4 Yuzen Dyeing Unit
The person who was interviewed was the son-in-law of the president of the dyeing unit. He manages the entire
company. He is originally from the Fukushima district and has studied computer science and does not have a prior
176
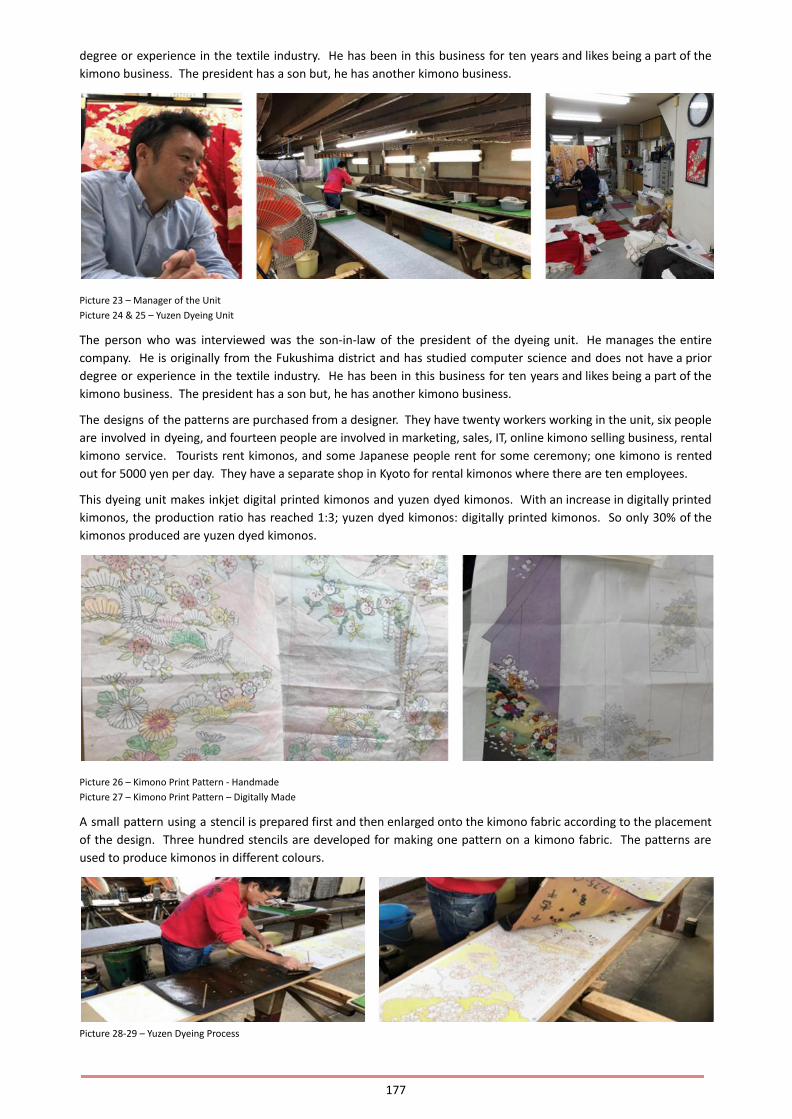
degree or experience in the textile industry. He has been in this business for ten years and likes being a part of the
kimono business. The president has a son but, he has another kimono business.
Picture 23 – Manager of the Unit
Picture 24 & 25 – Yuzen Dyeing Unit
The person who was interviewed was the son-in-law of the president of the dyeing unit. He manages the entire
company. He is originally from the Fukushima district and has studied computer science and does not have a prior
degree or experience in the textile industry. He has been in this business for ten years and likes being a part of the
kimono business. The president has a son but, he has another kimono business.
The designs of the patterns are purchased from a designer. They have twenty workers working in the unit, six people
are involved in dyeing, and fourteen people are involved in marketing, sales, IT, online kimono selling business, rental
kimono service. Tourists rent kimonos, and some Japanese people rent for some ceremony; one kimono is rented
out for 5000 yen per day. They have a separate shop in Kyoto for rental kimonos where there are ten employees.
This dyeing unit makes inkjet digital printed kimonos and yuzen dyed kimonos. With an increase in digitally printed
kimonos, the production ratio has reached 1:3; yuzen dyed kimonos: digitally printed kimonos. So only 30% of the
kimonos produced are yuzen dyed kimonos.
Picture 26 – Kimono Print Pattern - Handmade
Picture 27 – Kimono Print Pattern – Digitally Made
A small pattern using a stencil is prepared first and then enlarged onto the kimono fabric according to the placement
of the design. Three hundred stencils are developed for making one pattern on a kimono fabric. The patterns are
used to produce kimonos in different colours.
Picture 28-29 – Yuzen Dyeing Process
177

Picture 30 – Yuzen Dyed Kimono Fabric
Then the agent made of rice is prepared for dyeing. The stencil is put on the fabric, the part of the pattern where the
colour needs to be placed precisely with the pattern marked on the cloth and the dye is then put on the stencil to
dye the fabric. A 14-metre fabric is printed with this process which can be used to make a long sleeve, furisode
kimono and a 10-metre fabric is printed for a short sleeve, kosode kimono.
They have two kinds of stencils which are handmade. They have about fifty thousand stencils in the unit and the
warehouse.
Picture 31-32-33 - Stencils used for Dyeing
The dyed colour on the fabric and the dye looks different in colour; the dye looks darker. The dyes are marked with
colour numbers. A rice agent is added with the active dye while dyeing the fabric. This agent is used for the
uniformity of the colour all over the printed fabric so that no area is dyed darker or lighter.
178

Picture 34 – Dyes, Picture 35 – Difference between Dye and the Colour of the Dye on the Fabric
Picture 36 – Dyed Fabric Swatches - Difference between the dye and the colour of the dye on the fabric
The patterns like sakura and colours like the
colour red represent good fortune or are
auspicious in Japanese culture and are used
on furisode kimonos for young ladies for
some traditional or special occasion or
wedding ceremonies or coming of age
ceremony which is when they turn twenty
years of age. The bride wears a kimono
called uchikake, which is embroidered, for
her wedding ceremony. The length of the
kimono is 15-16 metres, the extra length
touches the ground, and it is draped in a
special way. The lining of this kimono is
white.
The kimonos manufactured here are
exported to China and America. The
kimonos exported to America are for Americans. These kimonos are cheaper, and the fabric is cotton or polyester
and not silk.
Picture 37 – Furisode Kimono; Picture 38 – Embroidered Kimono Fabric; Picture 39 – Embroidered Kimono Fabric
They get business on commission from toniyasans, so they are paid for pattern development and dyeing. They
present a catalogue of patterns to toniyasans to select and place an order on commission. They print 3000 meters on
average for a commission received by a toniyasan for one year, where five patterns are used with five to ten
colourways.
Conclusions
There are many similarities between the handloom industry in Japan and India. Most of the weaving done in these
two countries is for traditional wear for women - sari and kimono. Although there are products such as dhoti and
kimono for Indian and Japanese men, these traditional fabrics are worn infrequent and only for occasions. Japanese
women may wear a kimono more often than men but still much less than earlier. Much of this change happened
after WW 2. Indian women, on the other hand, continue to wear saris both for daily and events such as festivals,
weddings and other formal occasions. Furthermore, many Indian managers and CEOs wear sari for work as well. In
Japan and India, powerloom production has eroded the handloom markets since the production costs are much
lower.
The price of saris ranges from few hundreds of rupees to few thousands of rupees. Sometimes the wedding sarees
could cost a few lakhs of rupees. On the other hand, it would cost anywhere between 2,50,000 yen to 700,000 yen.
During conversations with the Japanese, it was not surprising to hear that many youngsters do not own a kimono,
and for occasions when they need to wear one, they borrow from their family. However, all of them wished that they
would have a kimono of their own one day. The fabric that is woven in Japan is entirely different from the fabric that
179

is woven in India. Indian sarees are mostly made out of cotton or silk. Sarees are soft and comfortable and are very
appropriate for the warm climate that India has.
On the other hand, the Japanese fabric is extremely thick. More often than not, the yarn is interlaced with metal
thread, making the fabric very stiff. Given that Japan can get very cold, kimonos made out of such fabric will keep the
person warm. In summer, since it gets hot, kimonos need to be airy and comfortable. The material is used for
summer kimonos is completely different. There are multiple styles of kimono across Japan.
Weaving techniques that are available in both these countries is quite immense. While some formal training
institutes in both these countries are learning how to weave, most weavers learn by doing. Like in India, Japan has
weaving techniques that are localized to regions. Japan, much more than India, has extensive documentation for all
the different types of weaves.
The structure of the handloom market is quite similar. Customers purchasing these traditional fabrics do so by
visiting stores located in urban areas. The products to the stores are supplied by intermediaries who ho outsource
the production to weavers scattered across the country. In many cases, these market intermediaries provide the raw
material as well as the designs as well.
While sari and kimono are both worn by women, there are many differences in these two pieces of the garment. A
sari is draped while kimono is stitched and has multiple parts to it. A kimono is made from one piece of fabric of 38
feet in length and 14-inch wide for women; for men, 41 feet long and 17-inch-wide fabric is required. The front side
of the kimono has different components from the rear side of a kimono. Kimonos can be extremely casual or
extremely formal and can be identified by patterns, decoration, fabric and colour for women. For men, the formality
of a kimono is determined by fabric choice and coordination elements.
During the fieldwork, it would be noticed that the issues Japanese handloom industries face are similar to those in
India. The producers of the garments do not have access to market information because the product goes to the
customers through multiple sets of intermediaries. Because the wages they receive for making these products are a
fraction of the cost final consumers pay. Also, there are very few youngsters who are choosing to be in these crafts.
This issue is more severe in Japan, where the average age of the craftsperson is much higher and the market for
these products our shrinking rapidly. From our field research, we found out that the Japanese government is taking
up multiple activities at the national and local levels to increase the awareness of these products both for internal
and external consumers. So the level of training and intensity of assistance is quite commendable in Japan, but the
cost of the products is relatively high to be attractive to casual consumers.
In all, handloom in both countries will not survive if new markets or consumers are not created. In India, sari stores
are using social media to develop new markets among youngsters. Social media-heavy initiatives like the 100-sari
pact[ http://100sareepact.com/ ] are making many women wear a sari to work. Japan will have to create unique
occasions for youngsters to wear kimonos.
References● Cite
● Mori 2009
● Cite Kikuchi, Reedy
● See Reedy, p131
● The Information Bulletin of the National Economic Associations in Japan, pg 23, 2014, available at
https://www.ibi-japan.co.jp/gakkairengo/htdocs/nenpou/pdf/no_34.pdf
● Cite Goto
● Cite
● Cite METI website
● Article 71, Cultural Properties Act
● Article 71, Cultural Properties Act
● Miwako Sato, Japanese Artists: The Way it Was and Still is, Departures,
https://www.departures.com/art-culture/art-design/japanese-artisans-and-living-national-treasures; See K Goto, pg 119
● Making Traditional Pottery Sustainable Today: Three Case Studies in Akita Prefecture, Japan, Cara L. Reedy and Chandra L. Reedy, pg 131,
available at http://www.archaeopress.com/Public/download.asp?id={B13FD0AF-E302-43DA-88EC-60971AB2FD43}
● “The Traditional Craft Industry Promotion Association is a national, local public organization, production center association and organization as
a core organization for promoting the traditional craft industry based on the Act on Promotion of the Traditional Craft Industry”, DENSAN
website
● See K Goto, Crafts Policies in Japan, pg 121
● Yasushi Ueki and Yuki Kamiesu, Opportunities and Challenges of Developing Contemporary Relationships between Traditional Crafts and
Industries in Japan..., Research Report IDE-JETRO, pg 68,69, 2019,
https://www.ide.go.jp/library/English/Publish/Download/Ec/pdf/201903_02_ch05.pdf
180
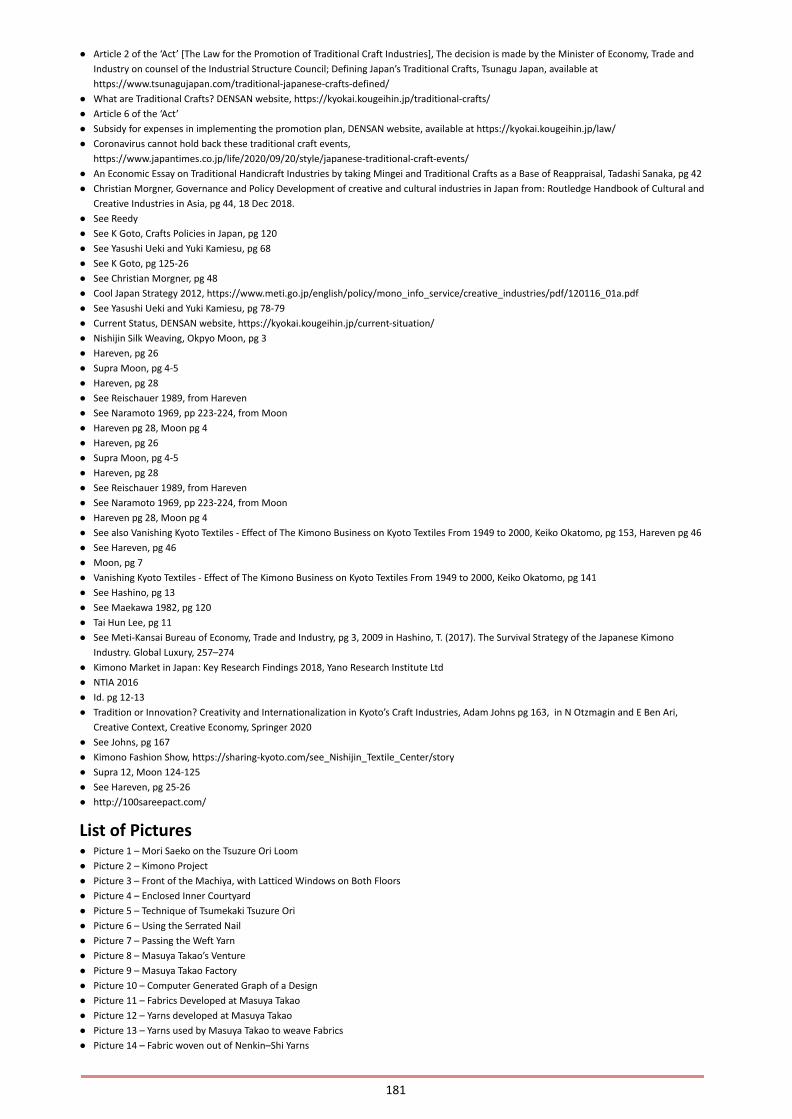
● Article 2 of the ‘Act’ [The Law for the Promotion of Traditional Craft Industries], The decision is made by the Minister of Economy, Trade and
Industry on counsel of the Industrial Structure Council; Defining Japan’s Traditional Crafts, Tsunagu Japan, available at
https://www.tsunagujapan.com/traditional-japanese-crafts-defined/
● What are Traditional Crafts? DENSAN website, https://kyokai.kougeihin.jp/traditional-crafts/
● Article 6 of the ‘Act’
● Subsidy for expenses in implementing the promotion plan, DENSAN website, available at https://kyokai.kougeihin.jp/law/
● Coronavirus cannot hold back these traditional craft events,
https://www.japantimes.co.jp/life/2020/09/20/style/japanese-traditional-craft-events/
● An Economic Essay on Traditional Handicraft Industries by taking Mingei and Traditional Crafts as a Base of Reappraisal, Tadashi Sanaka, pg 42
● Christian Morgner, Governance and Policy Development of creative and cultural industries in Japan from: Routledge Handbook of Cultural and
Creative Industries in Asia, pg 44, 18 Dec 2018.
● See Reedy
● See K Goto, Crafts Policies in Japan, pg 120
● See Yasushi Ueki and Yuki Kamiesu, pg 68
● See K Goto, pg 125-26
● See Christian Morgner, pg 48
● Cool Japan Strategy 2012, https://www.meti.go.jp/english/policy/mono_info_service/creative_industries/pdf/120116_01a.pdf
● See Yasushi Ueki and Yuki Kamiesu, pg 78-79
● Current Status, DENSAN website, https://kyokai.kougeihin.jp/current-situation/
● Nishijin Silk Weaving, Okpyo Moon, pg 3
● Hareven, pg 26
● Supra Moon, pg 4-5
● Hareven, pg 28
● See Reischauer 1989, from Hareven
● See Naramoto 1969, pp 223-224, from Moon
● Hareven pg 28, Moon pg 4
● Hareven, pg 26
● Supra Moon, pg 4-5
● Hareven, pg 28
● See Reischauer 1989, from Hareven
● See Naramoto 1969, pp 223-224, from Moon
● Hareven pg 28, Moon pg 4
● See also Vanishing Kyoto Textiles - Effect of The Kimono Business on Kyoto Textiles From 1949 to 2000, Keiko Okatomo, pg 153, Hareven pg 46
● See Hareven, pg 46
● Moon, pg 7
● Vanishing Kyoto Textiles - Effect of The Kimono Business on Kyoto Textiles From 1949 to 2000, Keiko Okatomo, pg 141
● See Hashino, pg 13
● See Maekawa 1982, pg 120
● Tai Hun Lee, pg 11
● See Meti-Kansai Bureau of Economy, Trade and Industry, pg 3, 2009 in Hashino, T. (2017). The Survival Strategy of the Japanese Kimono
Industry. Global Luxury, 257–274
● Kimono Market in Japan: Key Research Findings 2018, Yano Research Institute Ltd
● NTIA 2016
● Id. pg 12-13
● Tradition or Innovation? Creativity and Internationalization in Kyoto’s Craft Industries, Adam Johns pg 163, in N Otzmagin and E Ben Ari,
Creative Context, Creative Economy, Springer 2020
● See Johns, pg 167
● Kimono Fashion Show, https://sharing-kyoto.com/see_Nishijin_Textile_Center/story
● Supra 12, Moon 124-125
● See Hareven, pg 25-26
● http://100sareepact.com/
List of Pictures● Picture 1 – Mori Saeko on the Tsuzure Ori Loom
● Picture 2 – Kimono Project
● Picture 3 – Front of the Machiya, with Latticed Windows on Both Floors
● Picture 4 – Enclosed Inner Courtyard
● Picture 5 – Technique of Tsumekaki Tsuzure Ori
● Picture 6 – Using the Serrated Nail
● Picture 7 – Passing the Weft Yarn
● Picture 8 – Masuya Takao’s Venture
● Picture 9 – Masuya Takao Factory
● Picture 10 – Computer Generated Graph of a Design
● Picture 11 – Fabrics Developed at Masuya Takao
● Picture 12 – Yarns developed at Masuya Takao
● Picture 13 – Yarns used by Masuya Takao to weave Fabrics
● Picture 14 – Fabric woven out of Nenkin–Shi Yarns
181
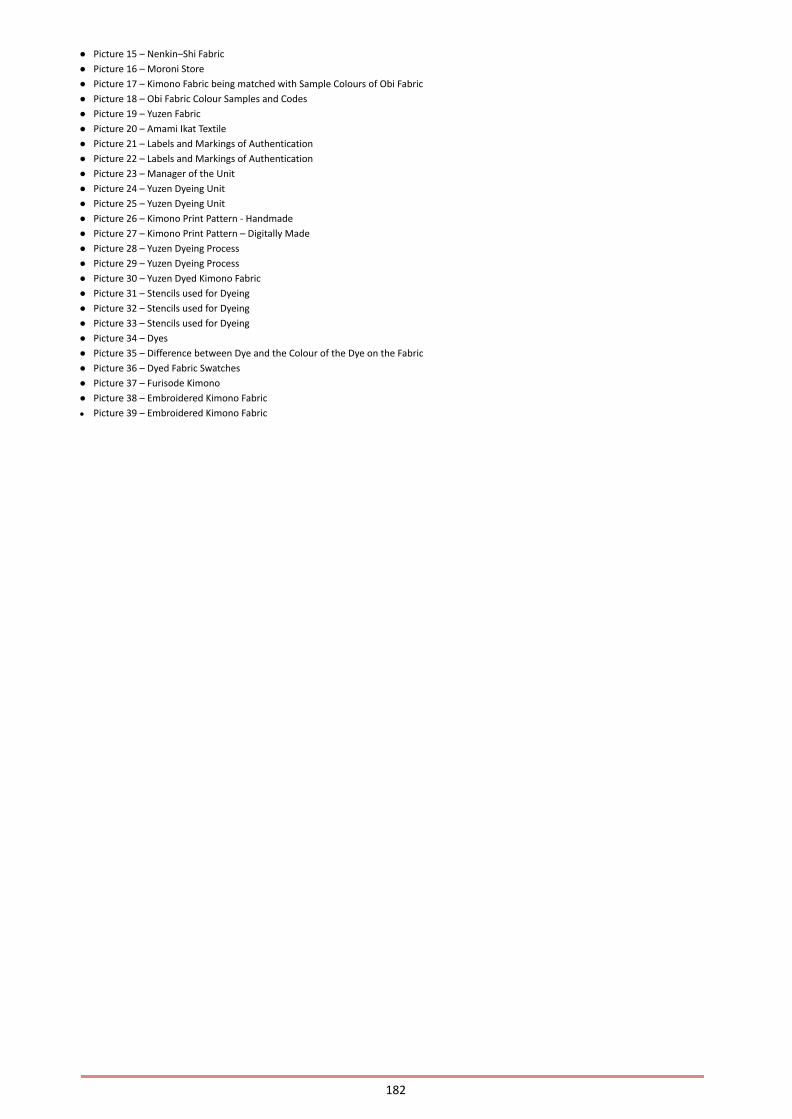
● Picture 15 – Nenkin–Shi Fabric
● Picture 16 – Moroni Store
● Picture 17 – Kimono Fabric being matched with Sample Colours of Obi Fabric
● Picture 18 – Obi Fabric Colour Samples and Codes
● Picture 19 – Yuzen Fabric
● Picture 20 – Amami Ikat Textile
● Picture 21 – Labels and Markings of Authentication
● Picture 22 – Labels and Markings of Authentication
● Picture 23 – Manager of the Unit
● Picture 24 – Yuzen Dyeing Unit
● Picture 25 – Yuzen Dyeing Unit
● Picture 26 – Kimono Print Pattern - Handmade
● Picture 27 – Kimono Print Pattern – Digitally Made
● Picture 28 – Yuzen Dyeing Process
● Picture 29 – Yuzen Dyeing Process
● Picture 30 – Yuzen Dyed Kimono Fabric
● Picture 31 – Stencils used for Dyeing
● Picture 32 – Stencils used for Dyeing
● Picture 33 – Stencils used for Dyeing
● Picture 34 – Dyes
● Picture 35 – Difference between Dye and the Colour of the Dye on the Fabric
● Picture 36 – Dyed Fabric Swatches
● Picture 37 – Furisode Kimono
● Picture 38 – Embroidered Kimono Fabric
● Picture 39 – Embroidered Kimono Fabric
182
ANNEXURE #11
Dr. Sandeep Goyal
Sekai ga Odoroku Nippon! - the Japan that surprises the world
The session began with Mr. Saideep Rathnam, Chief Operating Officer, India Japan Study Centre @ IIMB, welcoming
the participants to the webinar, and introduced them to IJSC, and its role to strengthen India and Japan bonds by
promoting academic, industrial, and societal linkages. He spoke about the webinar series, which aims to bring-in
experts from both countries to talk of societal, technological, business and other facets of life highlighting both the
Indian and the Japanese perspectives.
Dr. Sandeep Goyal was introduced as a business leader, a writer, a blogger and above all, a Japanophile, a guy who
loves Japan. His visits to Japan, over 100 times during his life, and his close contacts with Japanese companies, both
in India and in Japan has led him to develop insights about the Japanese mindset. He has captured these insights in
two of his books on Japan viz. Konjo – The Fighting Spirit, and Japan Made Easy.
Dr. Sandeep Goyal gave an overview of this presentation, titled “Sekai ga Odoroku Nippon!”, “the Japan that surprises
the world.” He introduced how Japan is unique in many aspects.
He started with a narration about his tryst with the “Akai Fuji San”, “the Red Fuji San” and painter Hayakawa San,
through his mentor Oshima San. He highlighted the concept of perfectionism, pride in one’s work, and “Kojen no
Rinri”, personal ethics of the Japanese people and how that makes them what they are.
His second narrative was about some technological innovations in Japan, like the wearable Air-Conditioner, which are
master-pieces of innovation, and products that touch the common people’s lives.
He then spoke about a unique cultural fad in the 90’s of Japan, called a Tamagotchi, a digital pet, with features that
simulate taking care of a real pet. He spoke about how trends catch on fast in Japan, and how many of these are out
of the box.
He went on to demonstrate, with pictures, how Japanese goods are perfectly crafted to suit the consumers’ every
need. Simplicity lies at the root of these innovations. He showed us the evolutionary marvel that the Japanese Toilets
have become, with conveniences that are a product of efforts to provide consumer satisfaction. He also
demonstrated this also by talking about vending machines and public lockers, available throughout Japan.
Next, he spoke about the technological revolution, Shinkansen, the bullet trains of Japan. He highlighted the
efficiency and the amenities offered, ranging from rotating seats, in-house video games, to footbaths.
He gave an insight into the legendary Japanese sense of discipline, which is an intrinsic part of their psyche. He
demonstrated this with incidents about unique bus driver strikes, Japanese school culture and the incident where the
Japanese spectators cleaned the whole stadium after themselves during the football world cup.
He went on to discuss how this discipline and commitment seeps into everyday aspects, from efficiency in mundane
aspects, like using umbrellas to installing reading glasses before public notices for the public’s convenience. The
discipline was also translated into efficiency, which he demonstrated with the Japanese way of taking into account
every second and minute aspect of a service, like the instance when hotel staff apologized for a one-minute internet
outage in the early hours of the day. Some other fascinating concepts such as capsule hotels and napping rooms,
were highlighted as examples of ingenious Japanese inventions.
He next explored the traditional and cultural aspects of Japan that co-exist with the technology and innovation. He
spoke of Hakone black eggs, a delicacy available in the volcanic regions of Japan, believed to extend a person’s life, to
the invention of branded fruits and square watermelons.
The audience were then taken through the tradition that Japanese people integrate in the corporate culture, with a
narrative of Daruma Dolls being used as a commemoration of sorts for new beginnings and congratulations for a job
well done. The audience were also enlightened about the Japanese way of detailing, and proactively enhancing
natural beauty, be it through decorating manhole-covers, or evolving a form of nature-art and showcasing them. He
spoke about how the integration of culture and innovation has made Japan a cultural superpower in the eyes of a
world, and how it makes Japan impossible to ignore.
183
Mr. Rathnam thanked and congratulated Dr. Goyal on giving the audience such an original insight into Japan in a
short 45-minute presentation and made his observations on the takeaway of the lecture. Some comments from the
audience were also discussed. Questions from the audience were then addressed. A question about societal pressure
was discussed at length, observations on how the strict norms can sometimes lead to a high-pressure environment
were made. The issue of hikikomori, social recluses of Japan was also brought up. In reply to another question, Dr.
Goyal highlighted the Japanese sense of belonging to their country, their civic sense, and the personal involvement in
every aspect of life. Incidents where Dr. Goyal was personally acquainted to the Japanese sense of dedication were
discussed. The aspect of punctuality was especially highlighted as an intrinsic Japanese trait. The next question was
aimed at exploring the differences in the Indian and Japanese way of thinking and doing. Dr Goyal hypothesized that
many Indians were disconcerted with the methodical way of dealing, maybe because Indians tend to operate on
multiple things simultaneously, whereas the Japanese are trained in the one-thing-after-the-other approach. In reply
to another question about Japanese handling of the ongoing pandemic Dr. Sandeep Goyal gave an insight into the
cluster method adopted by the Japanese. He also spoke about their many years of experience with pulmonary
afflictions and pandemics, considering that Japan is an aging society.
The discussion ended with a note of appreciation for the IJSC initiative by Dr. Goyal, and him wishing good luck to the
future endeavors of the Centre.
184

ANNEXURE #12
Mr. Anupam Joshi
Identifying our shared Identities: Astonishing culturalsimilarities between India and Japan
The session was hosted by Chief Operating Officer @ IJSC, Mr. Saideep Rathnam who welcomed the participants and
speaker, Mr. Anupam Joshi. Joshi San was introduced as a musical genius, who developed a thirst for music at the
tender age of seven, and serves the society through his medium, the Sarod. Besides being a musician, Joshi San is a
Japanese language expert and keen linguist, who continues to foster an interest to learn new languages.
Joshi San began with the observation that learning a language is an incomplete exercise, without the study of the two
other elements that contribute to its development, culture, and history. Therefore, on his language learning journey,
he picked up aspects of Japanese culture and couldn’t help noticing how astonishingly similar it was to India. He
proposed to present a collation of cultural similarities that stood out the most to him.
The first comparison of the session was between the Traditional Dance Drama forms, Kabuki and Kathakali, from
Japan and India, respectively. The audience were first taken through a visual representation where Joshi San pointed
out the similarities in the loud, dramatic expressions, vibrant make-up, and colourful attire. It was explained that
both were customized to be presented to an audience seated at a considerable distance. This was followed by the
analyzation of the colour scheme used in the make-up, with both art forms assigning a specific colour to depict
virtuous, heroic characters, Green in the case of Kathakali, and Red in the case of Kabuki.
The second aspect to be compared was the involvement of live music in the performance, with the rhythmic
instruments playing a prominent role in the successful execution of the performance. It was shared that the dance
sequences were choregraphed in tune with the rhythmic compositions, and the presence of percussion was
indispensable to both Kabuki and Kathakali. Joshi San also talked about how both forms were initially male
dominated, with the female parts also played by men, and the contemporary changes in Kathakali, with the
introduction of female artists, and the adoption of various new themes in the traditional medium, such as social
causes, and even Shakespearean Plays.
Next, he delved in the origins of Kathakali and Kabuki, being Kuttiyattam and Kagura, respectively. He explained that
if one traced the evolution of Kathakali and Kabuki from their predecessors, the transition from religious and
mythological themes for set audiences, to contemporary themes for the masses were vastly similar.
The second cultural aspect to be compared in the talk was the folk traditions of Japan and India. The audience were
introduced to the Fisherman’s Dances from Northern Japan, Hokkaido, called Min’yo (Folk Songs). The most popular
Min’yo dance routine is called Soran Bushi, commonly followed by the Obon Dance. The Indian counterpart is called
Kohli and is a part of the culture of the Western Coasts.
Joshi San went on to explore the common sentiment of encouragement and expressions between the two
song-dance routines which are brought out by the lyrical motifs contained in most of the songs, Dokkoiso in
Japanese, and Vallavne in Marathi, which roughly translates to ‘Row Ahead’!
The third subject of the talk was the similarities in thought and concept of the various festivals celebrated in India
and Japan. Joshi San started with describing the festivities that welcome the annual harvest. The Japanese celebrate
the first harvest of the year as Ko Shogatsu, meaning “mini–New Year”, while the Indian Subcontinent celebrates the
first harvest in various forms, Makar Sankranti in Maharashtra and Karnataka, Pongal in Tamil Nadu, Lohri in Punjab,
Bihu in Assam, and so on. Joshi San spoke about the similar alignment of Indian and Japanese festivals with the lunar
calendar, as opposed to the western calendar, and how both our New-Years align with the Summer Solstice.
Further, the audience were taken through a visual representation of the festivities, where he pointed out the festive
attires which involved using symbolic representations of the bountiful harvest, such as clothes and accessories made
with rice husk. Next, he described the common tradition of preparing and sharing with friends and family the
produce of the harvest. He noted that in Maharashtra, for instance, a festive hamper of sugarcane, assorted sweets
etc. is made in every household, and similarly in Japanese homes, a Koshogatsu gift assortment, and a special rice
185
sweet dish, called mochi is shared with near and dear ones. He also spoke about mochi being prepared at public
events, on the occasion of Koshogatsu. He added that both in modern Japan and India, although most people live in
urban areas, and are no longer farmers, the customs of harvest festivals are still widely practiced.
The next practice he went on to compare was the Obon matsuri of Japan, and Pitrupaksh in India, which are customs
to pay homage to the deceased spirits of ancestors. He noted that Obon and Pitrupaksh fell on the same day in the
present year, and they are practiced after the seventh lunar cycle of every year. Some other practices in Japan,
associated with the passing rites for the dead, one of them being the Oshoshiki, which is a day appointed for near
and dear ones to gather and pay homage to the deceased, are comparable to the Bhaiswana practice in Western
India, with the only difference being the use of Sake (rice wine) in Japanese rites.
The next subject taken up by Joshi San was the comparable origin, form, and attributes of deities worshipped in India
and Japan. India’s beloved Ganesha, is also placed in Fukuoka Tower. Lord Bramha, and his Japanese equivalent have
similar features such as the lotus pedestal, and numerous arms and heads. Goddess Saraswati has a counterpart in
Japan’s Benzaiten, with the attire and musical instruments possessed by the Goddess, indicating a link to China as
well. There are also similarities in minute physical attributes such as posture and position of instruments and both
Goddesses are known to be the deities for knowledge, learning and the Arts.
With the next deities, Shiva and Daikoten, it was explained that both were known as the beings of completeness and
destruction, adhering to the similar notion that destruction and creation is a continuous process. It was also shared
with the audience that the Japanese regard Daikoten as the reigning deity of Chefs. The cosmic architect of Indian
origin, Vishwakarma is similar to the Japanese God of creation, construction activities, and business. Similarly, Indra,
the king of Gods and the bearer of thunder finds his counterpart in Taishaku ten, God of rains and the ruler of the
heavens.
The last aspect of the talk was about linguistic similarities, found in idioms, phrases, and expressions.
The first term introduced was money, which is equivalent to laksm in India, signifying gold and the characters used to
write Okane (金)(money) which also indicates gold. We saw phrases expressing similar sentiments, such as the words
said before leaving home, Ittekimasu, which literally translates to “I shall be back” similar to expressions such as
“Jaake ata Hun”(Hindi) or “Yeto” (Marathi) (I shall leave and return) used in Indian languages.
The next set of idioms were based on body parts. “Atama ni Kuru”, has its counterpart in “Dokya ni Gele” (Marathi),
meant to express annoyance. “Koa o Dasu” is “Muh dikake aata hun”,(Hindi) which conveys the sentiment of being
somewhere for appearances sake. “Te o nuku” is “Haath kheench lena” which expresses beating a quick retreat
(before things get difficult). “Te ga mijikai” is “Haath tang hona” which means not being fully equipped.
India and Japan also share similar words for an afternoon nap/Siesta, Vamakukshi (Sanskrit) and “Hiru Ne.” “Hana ga
Takai” translates to “Nak Chada” (Hindi) which is used to refer to an inflated ego. The presentation was concluded
with the idiom “Mimi ga karui” translating to “Halka Kaanancha” (Marathi) meaning ‘light ears” which is an
expression used to refer to people as gullible.
Mr. Rathnam commended Joshi San on the insightful session and went on to address a few questions from the
audience. The first question was whether there were similarities in the origin of Kathakali and Kabuki . Joshi San
explained that while the Dance Dramas addressed similar social/ cultural subjects and have a similar evolution, their
origins are not the same. He also addressed a marked difference between the two, Kabuki actors deliver dialogues
with complex techniques while Kathakali relies on rhythm and music to deliver the story.
The next question was on whether the musical instruments in India and Japan shared similar journeys, to which Joshi
San replied that most Japanese classical instruments such as the Koto and Biwa were of Chinese origin and remained
as background for other performances, while Indian instruments have been taking the centre stage from the 17th
century itself. He mentioned that there is a tradition of solo performances for the Koto, however, pre composed
pieces are performed, as opposed to the improvisation prevalent in Indian instrumental performances. The following
question was based on the variety of Japanese percussion instruments, to which Joshi San gave a brief explanation
on Taiko Drums, and traditional rhythmic patterns, similar to Indian folk practices, but different from Classical
Percussion instruments.
Mr. Rathnam enquired about the suffix Ten used for Japanese deities, in reply to which Joshi San spoke about various
Japanese suffixes from San, to Sama and Tenno, which is equivalent to heavenly beings.
186
The following question was whether cultures of deity worship still prevailed in Japan. Joshi San explained that most
current Japanese did not identify with any particular religion and did not perform elaborate rituals, comparable to
the extensive ones in India.
The next question was about the comparative journey of the traditional art forms, which was followed by a
discussion about the initial hindrances to Japanese art during the Warring States Era and the cultural peak of the Edo
Era. However, Joshi San noted that Japanese classical art forms did not emerge as a distinct genre, but traditional
songs and dances are still part of the Japanese practices today.
In reply to a question about religious ideology, Joshi san went on to describe the Nirgun philosophy in India,
popularized by the Dohas (Couplets) (similar to Japanese Haikus) of Indian poet and saint, Kabir Das, comparable to
the nature worshipping aspect of Shintoism.
The next question on underlying themes of classical art forms was followed with an extensive discussion on art forms
portraying religious themes. Joshi san explained that forms of the dance drama, Kagura, narrates events from
religious texts, but the later art forms did not focus on religious narratives, unlike the predominantly religious themes
in the Indian art forms. He also spoke in detail about the Raaga schemes of Indian classical music, which are slightly
comparable to pentatonic scales prevalent in Japanese tones. He spoke of Hindustaani Raags, such as Bhoop, and
Bhairavi which are found in musical scales in China and the Middle East. However, he concluded, the concept of a
complete Raaga system remains unique to the Indian Subcontinent.
Mr. Rathnam thanked Joshi San for the enlightening answers, and the session was concluded with a talk about Indian
and Japanese cuisine, references to pickled and fermented food such as miso and plums, and a light-hearted
exchange about small underground Japanese restaurants and one last common idiomatic expression carrying the
notion that if one sneezes, they are being bad mouthed by someone, somewhere.
187
ANNEXURE #13
Mr. Jayaram Easwaran
“Leadership Begins where Management Ends”-Some Lessons from Transformational Leaders of India and Japan
This is a conversation between the illustrious management consultant, mentor, and author, Jayaram Easwaran and
the COO of Mizuho India Japan Study Centre, Mr. Saideep Rathnam.
Mr. Easwaran has over three decades of experience in various leadership positions in global corporations, including
his key role as Head of Corporate Marketing at the Eicher Group, managing the interface with Mitsubishi Corporation
and Mitsubishi Motor Corporation, Japan. He is an independent director at Jindal Stainless Ltd., and director at Casa
Blanka India Consulting Pvt. Ltd. His critically acclaimed best-seller, “Inside the C-Suite” is endorsed by Mr. Anand
Mahindra, one can also read his insightful lessons on Business World, where he is a regular Columnist.
Beginning
Mr. Rathnam commences the session by introducing the speaker to the audience, while fondly recollecting his
interactions with him from his days at IIM Bangalore, both speaker and host happen to be alumni of the institute and
ex-classmates.
Mr. Easwaran’s opening comments put a smile on the audiences’ faces (we presume, since this is not a live session,
although we smiled) by likening his challenge of speaking to this diverse audience of students, managers,
entrepreneurs, and leaders, to the marketing campaign of Florence Toothpaste, claiming to perform every possible
function of dental care and falling flat, joking that he hopes to survive to the end.
He kicks-off the discussion quoting Alvin Toffler, “The illiterate of the 21st Century will not be those who cannot read
and write, but those who cannot learn, unlearn, and re-learn.”
“Leadership begins where Management ends”
Mr. Jayaram takes to the topic by explaining that as known to most listeners, in every organization, there are only
four basic roles. The first role is that of an individual contributor at the entry-level. The second role is that of a
supervisor, who is an individual contributor as well, but responsible for the contribution of others, and seeing to it
that they are aligned with the organization’s goals. The third role is distinct as a managerial one, not only responsible
for completion of goals, supervision, but also interacting across interfaces, aligning priorities of parallel departments,
and collaboration. The final role is that of leadership, which involves connecting the dots in the environment, being a
visionary, and a mentor, this is where Management ends and Leadership begins. Managers who do not possess these
skills are bound to fail as leaders.
A Timely Lesson
Mr. Rathnam, referring to Mr. Easwaran’s comment that in Japan, timeliness is not merely a coincidence, asks him to
elaborate on what is the lesson that can be learnt there.
In answer, Mr. Easwaran recounts his experience in Japan with Yunoki san from Mitsubishi Corporation, who used to
meet up at exactly 5 min before the decided time, without fail, for every single day they spent the evening together.
When Yunoki san was visiting India a month later, Mr. Easwaran made an appointment with him at 9:00 AM. When
he reached the designated meeting place at 9:20 AM, Yunoki san was nowhere to be seen. Upon calling on him in his
room, he was invited for a cup of tea. They spoke for a while, and he learnt that Yunoki san had waited exactly from
8:40 to 9:15 before returning. Mr. Easwaran cited terrible traffic as a reason for being late, but Mr. Yunoki proceeded
to make a detailed calculation of the distance, time taken to travel, traffic frequency, and number of red lights from
his office to the hotel. He declared that if he had left office at 8:09 minutes, he would never be late. This interaction
left a deep impact on Mr. Easwaran, and he says, this goes to show that the Japanese meet their commitments
because they never fail to plan meticulously and execute flawlessly.
188
A Lesson in Team Spirit
Mr. Rathnam observes that in Japan, to be a team player seems like an ingrained quality, individually and societally.
He asks Mr. Easwaran to talk about examples of great team building he has come across in India and Japan.
Mr. Easwaran says that the first rule to be a great team is to have a leader who is accessible to all, and equidistant
from all. To demonstrate, he shares the words of one of the Indian leaders he admires, who used to insist that his
team is working “together”, only when what they say to each other and what they say about each other are not very
different things.
A Trusty Lesson
Mr. Rathnam cites, “Trust takes years to build, seconds to break, and forever to repair”. Would Mr. Easwaran talk
about distinctive trust-building practices across cultures? Mr. Easwaran says that all large organizations rely on
competent teams and capable people. He talks about the Japanese principle of shouldering responsibility collectively,
drawing from the experiences of his colleague Araki Hidehito san, who took responsibility for his subordinate’s
mistake, (distributing brochures with a dated logo for an important exhibition), and could do that because his own
senior has stepped in for him in the same fashion.
Further, he stresses that loyalty is earned, and recounts his own incident at Eicher, where they lost the dealership
award for the first time in 26 years, but his boss let him deal with his mistake in dignity and showed him the learnings
he could take away. He leaves an important message for the leaders in the audience, the way you treat your
subordinates will decide whether they swear at you or swear by you.
A Factual Lesson, from the Bottoms up
Mr. Rathnam alludes to another important practice in Japan, of valuing hard facts construed from verified data, in
keeping with Edwards Deming’s philosophy, which seemed to be best adapted in Japan, and made into a fine art.
Mr. Jayaram observes that as a nation, in Japan there is always a need to be accountable - individually, and
collectively. Therefore, every word that comes from them is verified. Back home, there is a tendency to give opinions,
if there are no facts. He jokes that the number of “why’s” in the Japanese way of dogged fact verification could be
exasperating. He shares an interesting instance that demonstrates it through his conversation with a senior leader at
Honda Motor Cars, India. When Honda wanted to design cars for India, they did a check on all the factors that Indian
buyers look for apart from fuel efficiency such as power, suspension and surprisingly, a large boot. The research then
went into great lengths of personal surveys to answer the question, “Why does India need a big boot in a car?” The
result of this double-fact checking was that Honda City had the most preferred boot size and was a big hit upon its
launch.
Mr. Easwaran also talks about important insights gained from transformational leaders who adapted the “first-time
right policy” across business cultures. He mentions in particular, the brilliant execution by Mr. Charles Frump, CEO of
Volvo in India, who also worked in Japan and Scandinavia. He had the practice of telling his team that they need not
have the answers all the time, as he does not himself, but it is important to work together, and make out information
to be facts, not opinions. Furthering the discussion, examples of the bottom to the top practice in Japan emerged,
where Mr. Easwaran spoke of the time when he operated the Japanese way, fact checking from the root, and getting
outstanding results in his endeavor of introducing Mitsubishi in a Himalayan car rally.
A Powerful Lesson
Talking about what true power is, and how to acquire it, Mr. Easwaran says that signs of power is not the trappings of
success, but the ability to influence one’s environment. He speaks about exercises he conducted among corporates to
understand what is perceived as power, and got responses such as authority, designation, signing authority, size of
one’s team, ability to hire and fire, and even the size of one’s cabin. But a truly exceptional observation was from a
Materials director at Maruti, who was initially dejected at the limit of his signing authority, but to whom it occured at
a later date that his superior’s reliance on his competence, the trust he generated, was his true power, which he had
already achieved. Therefore, Mr. Easwaran reminds the audience that trust is power.
A Lesson in Writing
On being goaded by Mr. Rathnam to share the secrets of writing a bestseller, Mr. Easwaran has valuable snippets for
wanna-be writers viz. write the best opening lines, create a story with a protagonist, a conflict, and an antagonist. He
189

elaborates on the types of conflicts viz. internal, amongst other people, versus animals, versus nature, and more
recently, versus AI. He also advises that a scene must either tell the audience something more about the characters
or must take the story forward, and that any other scene has to be shown the door. He demonstrates with a poignant
Ernest Hemmingway short story, “Baby shoes for sale, never worn.”
A Lesson in Answers
Taking a question from the audience on how Japan appreciates its people’s success as an individual, Mr. Easwaran
points out that the very perception of success in Japan is synchronization and teamwork, as opposed to individual
ability.
To another question about how the leader’s contribution is rewarded, he responds that the joy of giving is as
rewarding as recognition, or even more, like a proud football coach bringing the best of the team, watching his
prodigies being applauded, the thrill of watching someone grow is worthwhile, and irreplaceable.
He signs off with an observation on working with the Japanese Companies, sharing that one never interacts with an
individual, or a set of individuals, but always with the company as a collective whole. He says from his experiences,
that the Japanese are never fair-weather friends, the only way to gain their trust is to become worthy of their trust.
190
ANNEXURE #14
Mr. Hidehito Jay Araki
“Unlocking the secrets of Transnational Business Success”-
Exclusive Insights on the Corporate Landscape in India and Japan
Araki san is a transnational business consultant, with an extensive knowledge of the business landscape in India and
Japan, lending his expertise for over 35 Indian and Japanese companies in his career spanning 3 decades. He is
Japanese by nationality, but part Indian at heart, having spent almost half of his professional life in India. He has been
a consultant for organizations such as Mitsubishi Motors, Toshiba, Hitachi, Sony and many more, in India, Japan,
China and also the middle east. He has worked with the Government of India and Japan for training, skill building,
immersion, and business expansion programs.
India and Japan, Similarly Unique
What makes India and Japan so different, yet similar and above all, complementary to each other’s growth?
Araki san points out, India is 9 times as big as Japan. India’s population is roughly 10 times of Japan’s. India is a young
country, with the average population age at 27 years. India’s GDP is placed 6th in the world and catching up fast.
India has the most diverse and complex ethnic, linguistic, and religious make-up.
Japan is a small country, 78% of forest, with scarce land availability and densely populated cities. Japan is an aging
nation with the average population at 47 years. It is placed among the top ranked nations and known for
homogeneity. But beyond these obvious differences, our cultural identities are shared to a surprising extent, from
philosophical and religious commonalities to linguistic roots.
This shared history has made it in the daily lives of Indian and Japanese people manifesting as a strong family value
system, reverence for elders, emphasis on societal harmony, and many other social habits. Further, the business
landscape in India and Japan are similarly unique, and therefore require a great deal of expertise to maneuver.
Why India?
Araki San talks about why Japan must invest in India, a fast-growing country with remarkable opportunities, and a
market size nearly equal to Japan. He speaks about the merits of the recent digitalization drive, which happens to be
more successful than Japan, and the booming e- commerce domain for B to C Companies. The boost to
manufacturing in recent years too only adds to the receptiveness of the Indian market.
Giving a few examples, he points out that there is not much room for penetration of electronics, home appliances,
and SNS platforms in Japan, but India has a constantly evolving consumer base, with internet users amounting to
nearly half the population. He talks about how Facebook and WhatsApp have made a mark in India and alludes to the
already established presence of Korean and Chinese players in the market.
Another advantage of investing in India, he says, is the favorable conditions for accessing labor, land, and utilities,
with governments incentivizing overseas investments. Japanese companies that are in need of human resources can
find a blue ocean in India, with a few strategies to adapt to the Indian Market.
Further, he opines that Japanese SME’s would benefit more by partnering with their counterparts in India, resulting
in a win-win outcome for both.
Why Japan?
Japan, as a highly quality conscious nation, offers an irrefutable standard of technology and operational efficiency.
The ingrained values of taking pride in one’s work, respecting and adhering to time, and attention to detail are what
makes Japanese quality a global standard, incorporating which will provide any partner a highly desirable
transformation.
191
Another aspect about Japanese operation is the bottom to top approach in organizations of all sizes, which promotes
consistency of the quality of work, by counting the contribution of people at all levels. Japan, with its unique
population dynamics and technical requirements has risen as a nation of opportunity for skilled individuals with
vocational degrees, which provides a platform for technicians from India to upskill and earn more at the same time.
He cited that Vietnam sent nearly 2 lakh skilled people annually to Japan.
Strategies to succeed in India
Talking about the Challenges to overcome in India for Japanese businesses, Araki San discusses how India is far
removed from other Asian countries in terms of language and cultural diversity, and it doesn’t help that most
Japanese people may have a biased perception of Indians. Another aspect that might be challenging, he says is the
availability of Japanese food, which is scarce in India, compared to countries such as China or Korea, offering
culturally similar environments.
He also talks about how India is more westernized in its approach, and how people may not treat Japanese
companies distinctively from other Asian companies. Araki San also explains that most companies fail in the stage of
thinking through marketing strategies and hiring executives the Indian way.
Citing the strategies of successful Japanese companies in India, he says the most important aspect is partnering with
an Indian company and using their network and resources as a launching platform. Suzuki, which partnered with
Maruti, has more than half of its global sales in India, and the biggest market share. Honda motorcycles, which
started with Hero and set up a network system, now along with Hero takes more than 60% of the two-wheeler
market in India, a win-win situation for both.
Successfully established Japanese industrial townships in Rajasthan, Nimrana, Gurgaon, and Shree City in Andhra
Pradesh, focus on Blue Ocean Strategy and Technological Innovation. Brands like Unicharm had a unique product
offering of pants style diapers, which capitalized on product innovation. New entrants to the market such as Muji,
Uniqlo, and COCO Ichiban also seem to have relied on the same strategy.
Speaking about soft skills the Japanese can rely on in India, he gives a concise “Itsusu no A” (5 A’s),
1. Aseranai (Never hurry),
2. Awatenai (Never panic),
3. Atenishinai (Never depend on),
4. Akiramenai (Never give up), and
5. Anadoranai (Never underestimate)
Strategies to succeed in Japan
Araki san says that the main concern for Indian companies in Japan would be establishing an image and gaining trust.
The first step could be getting acquainted with the language and culture. The other crucial stage would be to ramp up
technical training and immersion programs of Indians in Japan and Japanese in India and promote India in Japan
more aggressively through collaborative platforms.
Talking about Indian companies established in Japan, such as Infosys or TCS, he says the best way to create a
presence would be to offer unique solutions to unaddressed problems in the industry. The second aspect to capitalize
on is advanced and innovative technology. Competitive pricing might also make Indian solutions more preferred.
An important feature of doing business in Japan would be to prepare for long term commitment, says Araki San.
Rather than expecting quick progress, spending 10 years to understand the people and market would be more
rewarding in the long term, an ideal situation that also allows the ingraining of Japanese ethical practices such as a
strict attention to detail and adherence to time, which one needs to incorporate to operate in Japan.
Collaborative Strategies
Araki San concludes that India and Japan are highly compatible due to the very different strengths they have come to
showcase. While India is known for software innovation and technical expertise, Japan is known for a high-level
quality control in manufacturing. While Indians are known for sales and marketing prowess, the Japanese are known
for niche technological advancements.
Learning to work with each other’s operating styles and combining strengths can make India and Japan
commendable partners to work together in the international market.
192
ANNEXURE #15
Prof. A. Damodaran
‘Where N�hing is Everything’ – A Comparison of Japan’s NohTheatre with its Indian Counterpart
Table of Contents
Abstract
Acknowledgements
1. Introduction
1.1 Origins, Evolution and the Principal Features of Noh
1.2 Performance Aspects of Noh Performance and the Noh Repertory
1.3 The Noh Performance Stage
2. Techniques of Performance
3. Genres and Schools of Noh
4. The Socio-Logic of Noh Education
5. The Well Springs of Creative Capital in Noh
6. The Philosophy of Noh
6.1 Symbolism
6.2 Minimalism
7. The Temporal Dimension of Noh
8. Deconstructing ‘Yugen’
9. Comparing Apples to Oranges: Towards a Comparative Analysis of Noh and Kutiyattam
10. Co-creation as the new Frontier: Factoring a new dimension to India -Japan Cultural Cooperation
References
List of Figures
List of Tables
193
Abstract
The Japanese theatre form Noh has striking resemblances with its Indian counterpart, Kutiyattam. Both theatres are
frugal, austere and minimal in their own ways. Coincidentally both were proclaimed by the UNESCO as the intangible
heritage of humankind in the year 2001. Despite these similarities there exist differences in the philosophical and
aesthetic foundations of the two art forms. Comparisons of two cultural manifestations are odious but inevitable in a
globalized world where inter-nations relations are presaged on cross cultural comparisons. In this paper, the Noh
Theatre is the axis of analysis and comparison. The paper attempts a major foray into the world of Noh as
understood by an Indian academic. It attempts to delve into the origins, philosophy, performative dimensions and
the institutional and economic foundations of Noh and its similarities and contrasts with Kutiyattam. Based on its
analysis and findings, the concluding section proposes a co-creation mode of collaboration that involves artistes from
the two streams to provide a vibrant depth to India-Japan cultural ties.
Keywords: nothingness, repertoire, essence, minimalism, symbolism, creative capital, India- Japan Cultural
Cooperation.
Acknowledgements
I am thankful to the India Japan Study Centre at IIM Bangalore for the financial support extended to me for
conducting this study in Japan during 2019. My work on the Noh Theatre undertaken here would not have been
possible but for the encouragement and support I received from Prof. Reiko Yamanaka, Director; Professor, Noh
Theatre Research Institute at the Hosei University, Tokyo, considered to be one of the most renowned scholars in the
field of Noh.
I was exposed to Noh by Prof Hajime Sato in 2003 who ran an amateur training class in Noh at Chiba when I was a
Visiting Scholar at the Institute of Developing Economies at Chiba. I am thankful to him for his encouragement all
these years. Finally, my special word of appreciation for Mr. Daisuke Minakata for navigating me through Kyoto
despite his official commitments.
1. Introduction
1.1 Origins, Evolution and the Principal Features of Noh
The origins of Noh go back to two ancient art forms of Japan, viz Sarugaku (a folk art that is traced to China) and
Dengaku (or rice field music) that forms part of Japan’s peasant art forms (Mikiko Ishii. 1994) . The acting dimension1
of Noh owes its roots to Sarugaku while the Noh traditions of music and dancing came from Dengaku (Ishii,1994).
The 14th century founding fathers of Noh, were Kanami AKA Kan’ami / Kanze Kiyotsugu and his son Zeami Kanze AKA
Zeami Motokiyo. Both were playwright-artistes. The father son duo started off as Sarugaku artistes in a theatre
group that the former had set up in Obata. After a while both of them moved to Yamato where Kanami set up his
second theatre group, named Yūzaki. It is here that their constant experimentations yielded the new art form ‘Noh’ .2
The Yuzaki was to later morph into the first school of Noh, viz the Kanze school, which was once again founded by
Kanami. The Kanze school developed an impressive repertoire of Noh plays largely aided, in its earlier years, by the
patronage received from the Shogun Ashikaga Yoshimitsu (Anonymous (ud2) ibid). Over years, other schools of Noh
came into the scene, viz Komparu, Hosho, Kongo and Kita. The Kita which was the last of the five illustrious Noh
schools, came into being in early 17th century.
Today the repertory of Noh comprises of nearly 240 plays, a large number of which has been created by Zeami (O’
Neill 1953, p8).
Noh is variously described as ‘dance drama’ and ‘musical drama’ since it combines song, dance and drama. The
relative contribution of the three elements in a Noh play is not easy to determine. In this sense, as is the case with
India’s Kutiyattam, Noh can be best described as a theatre form.
As a theatre form, Noh differs from Western drama theatre in the sense that it is not based on a ‘play with a story’ .3
Rather Noh focuses on presenting the mood of a moment and representing it in an aesthetic way by blending words,
3 O’Neill.1953
2 Anonymous (ud2) https:// www .britannica.com/biography/Kanami, accessed on Sep 4, 2020.
1 Anonymous(ud1). The term ‘Noh’ is derived from the Sino- Japanese word ‘No’ which means ‘skill’ or ‘talent’. https://www.definitions.net/definition/NOH, accessed on Sep 5, 2020.
194

music and dance. The story is narrated by a single actor / character. This obviates the need to have multiple
characters on stage as is typical of Western drama (O’Neill.1953) .4
The minimalist streak of a Noh performance arises from the absence of standard dramatic effects. The emphasis is
on rendering an ‘incident’ through restrained, physical movements and at a very slow pace . Noh acting is stylised5
and is based on seemingly simplistic expressions (Sekine 1985, p 43). However these manifestations in movements
and acting conceal rich emotions and profound moods. Subtle tilts in the masks worn by the main characters was
enough to convey change in moods. An upward tilt of the mask (teru) indicates joy and mirthfulness while a
downward tilt is associated with despair and grief (kumoru) (Udaka,2015, p 187) .6
Conventional Noh performances commenced with a ceremonial dance called ‘Okina’. Traditionally, five plays were
performed in a sequence on a given day. These five categories of plays are referred to as shin, nan, nyo, kyo and ki
(god, man, woman, madness and demon respectively). Shin or wakinoh-mono plays are celebratory in content. Nan
or shura mono play centres on armed conflicts and typically involves the story of a deceased warrior who descends
into Shura-do, which is the asura realm of Buddhism, Nyo or Kazura – mono is about graceful dancing. The Kyo plays
(included in the fourth category of plays) are called Kurui-mono. These plays are about tormented souls. The ‘Ki’ play
concludes a full day of Noh program on a celebratory note (Udaka ,2010 p147-48). The final act is most vivacious one
in Noh, as characters break into brisk movements on stage, which is way different from the slow, gliding moving that
is characteristic of main body of Noh plays.7
These days only two plays are performed in a given day (Udaka ,2010 p147-48).
What Zeami is to Noh is what Bharata is to India’s Sanskrit Theatre. Traditional Kutiyattam plays of India also
commence with ritualistic oblations before the lamp. This is consistent with the precept laid down by Bharata in his
work Natyasastra that highlighted the importance of conducting rituals prior to a performance in order to purify the
body and controlling the senses of the performer (Vatsyayan. 1993, p47).
Between each Noh play, it is common to have a comedy or farce piece performed, referred to as Kyogen (or mad
words). In some ways Kyogen resembles ‘Cakyar Koothu’ associated with Kutiyattam. Both are satirical in nature.
‘Cakyar Koothu’ which is an adjunct art form of Kutiyattam is however enacted as an independent performance on
days / times when Kutiyattam is not performed.
1.2 Performance Aspects of Noh Performance and the Noh Repertory
The main characters of a Noh performance (without which a Noh performance is incomplete) are the Shite (the main
actor) and the Waki (who is the next most important actor after the Shite). The Waki sets the stage for the Shite to
enact and perform. Indeed some plays like Minobu comprise of only the Shite and Waki (O’ Neill 1953, p7) .8
The supporting actors associated with the Shite, are referred to as Tsure. In addition, there are other minor actors
(referred to as Tomo) and child characters (referred to as Ko-kata) (O’ Neill 1953, p6). The Noh stage is enriched by
music. The musicians present on stage include those who play flute, a small drum (or kotsuzumi) which is held on
the right shoulder and struck with the hand, a slightly larger drum (o-tszumi) held on the left hip and struck with the
hand and a big drum (taiko) (for some plays) which is set up on a low stand and played with drumsticks .9
Despite its focus on the departed souls, Noh plays remains rooted in the present tense. To quote Takahashi et al
(2010, p17), ’At the door of the Noh theatre we invite you to experience a stirring account with elemental life’.
In terms of the nature of characters focused upon, Noh plays can be classified into Mugen Noh and Genzai Noh. The
former comprises of plays where the main character of the Shite is not a flesh and blood living being but the spirit of
people who died long ago. Genzai Noh plays, on the other hand, focus on real life characters. According to
Yamanaka (2015,43-44), Genzai Noh plays tend to be like Western theatre, since they deal with incidents and their
resolution, while Mugen Noh is the quintessential Noh play since it stresses on dreams and illusions and controlled
but intense emotions.
9 O’ Neill (1953, p8) and Anonymous 2020, a.
8 The Shite wears a mask, while the Waki does not (O’ Neill 1953, p7)
7 Noh movements are of three types viz, realistic, symbolic and abstract. The Noh actor rarely moves quickly when charged with emotion as is thecase with Western Plays. Movement is slow but majestic. Actors strive to glide across the stage instead of walk.
6 The impact that Noh masks had on Yeats’ concept of drama has been tremendous. See Yeats 1961 and Youngmin Kim.2019 for a detaileddiscussion on the influence of Noh theatre on Yeats’ plays.
5 As Sekine(1985, p44) observes, Noh plays were more pronouncedly slow during the Edo period. The canonisation of Noh also took place largelyduring the Edo period. This assumed the forms of metred performance yardsticks and universalised depictions of emotions.
4 This is a characteristic that is true of India’s Kutiyattam Theatre as well.
195
Noh plays are also classified into five (Kami,Shura,Kazura, Zatsu and Kiri) depending on the characters played, their
gender, the typology of characters presented and the dominant moods of these characters. Kami is a play where the
Shite assumes the role of God, Shura Noh is where the Shite assumes the role of the ghost of a warrior, while in
Kazura type of plays, the Shite dons the role of women. Zatsu presents plays that are characterised by moods and
temperamental traits of the characters presented, which range from madness to vengefulness. Kiri plays are
characterised by the presence of demons and supernatural powers .10
The principal source of the Noh mystique is the metaphorical value of the masks (omote) worn by the main
characters. The process of mask making is called utsu (Udaka ,2015, p 188). Noh masks are made of seasoned
cypress wood. The wood is seasoned by immersing them in water for long periods of time. This is followed by special
chiselling, painting and colouring. As Udaka (2015, p 185) states, there are 60 basic models of Noh masks which get
extended in number to over 200, if subtle variations and the class of special masks are included. Older actors
(hitamen) do not wear masks. The masks used in professional Noh performance by the leading schools go back to
the period between the 14th and 17th centuries (Udaka op, cit). Masks used in Noh can be categorized into six viz,
onna for female characters, otoko for male characters, jo for elderly characters, okina for aged dieties, kishin for
demons and gods and onryo for wandering spirits of the living or dead . It is the masks that transform an actor into11
the character that he assumes on stage (Udaka (2015, p 186). The masks are by design smaller than the human face
that it seeks to cover. An actor wearing the mask is under great pressure to ensure that his performance meets the
highest standard (Udaka,2015, p186).
Finally, comes the music associated with a Noh performance. The words of a chant are called kotoba and the music is
fushi. The typology of chanting is referred to as Utai. Some lines are performed to the accompaniment of drums and
flute, while certain others are not .12
The dynamics of repertory management by performing arts theatres rest on the dual approaches of repertory
deepening and repertory widening (Damodaran,2013). By repertory deepening is meant reworking and the
enrichment of classical plays included in the conventional repertoire in order to impart new stylistic features by way
of variations. By ‘repertory widening’ is meant the tendency to introduce plays with exotic genres from other
theatres. Re-adaptations of classical Noh plays to include modern drama features also involves repertoire widening.
Over the years the Noh theatre too has undergone the processes of repertory widening and deepening.
Examples of repertory widening undertaken by Noh artistes / schools include the works of Kita Minoru (a famous
artiste belonging to the Kita School / lineage). His works carried new content, while adhering to the traditional
canons of Noh production (Anonymous. ud3). Minoru’s modern Noh plays works which were not part of the classical
repertoire include Yumedono and Kenny – o. These works were created by him in cooperation with the famous
Japanese poet Zenmaro Toki.
Examples of repertoire widening carried out by non-traditional Noh artistes, include modern Shakespearian plays
enacted in the Noh format by the Ryutopia Noh Theatre Shakespeare Series’ under the stewardship of Yoshihiro
Kurita, an artiste who moved from Kabuki to contemporary Theatre . Another outstanding case of repertoire13
widening carried out by non Noh artistes involves the readapted choreographic work, ‘Lady Aoi’ of 1954, essayed by
the famous novelist Yukio Mishima, which incorporates elements from Western Opera with the ‘damask drum’ being
the only element drawn from classical Noh performance . A more contemporary figure who has experimented new14
Noh (Kyogen) scripts is Mansai Nomura, the charismatic Kyogen artiste who has tried innovative methods to draw
new audience to Noh plays (Birmingham, 2008). Mansai has appeared in Shakespeare's Macbeth performance which
tried to combine Noh and Kyogen strands in the work. However the problem with new or re-adapted Noh plays is
that they run the risk of not being acceptable to the audience (Masayuki ONUKI 2019, Personal communication, 30th
August).
The instances of repertoire deepening are more complex in the case of Noh as it involves mapping the changes that
have occurred in performance styles of plays over a period of time. This is something that can be done only by
traditional performers associated with the five Noh schools. Since the strength of the canons is strong amongst these
14 Analysing Mishima’s ‘The Lady Aoi’, Neblett (2011, p136-137) mentions how Mishima while carefully navigating the major literary andperformative traditions of classical Nōh imparts Rokujō Lady’s demonic “living ghost,” with a modern touch by innovatively repositioning hersupernatural aspects based on Freudian psychology. As Neblett says, in this manner Mishima seeks to reinterpret the classical aesthetic of yūgenassociated with Noh.
13 https://performingarts.jp/E/art_ interview/0503/art_interview0503e.pdf, accessed on 6th August 2020.
12 http://ryokoaoki. net/study_ e/ about.html, accessed on 4th August 2020.
11 Udaka op, cit.
10 See https://www.the-noh.com/en/ world/ forms.html accessed on 25 Aug 2020.
196

families, changes and innovations on existing works are hard to come by. Despite this both the utai as well as
performative aspects of Noh have evolved in interesting ways .15
1.3 The Noh Performance Stage
The Noh performance space is built with cypress wood. It is ‘L’ shaped, open on three sides, with a backboard
carrying a painted image of a pine tree. This main performance space or Hombutai comprises of three rectangles.
The outer rectangle is the ‘performance space proper’. The smaller rectangle on the posterior has as its backdrop a
painted image of a pine tree. It is here that drummers and other musicians (hayashikata) sit. The third rectangle is a
smaller one to the right where the chorus (Jiutai) sits. The stairs in front of the stage is called ‘Kizahashi’. The main
performance space (the outer rectangle) is supported by four pillars or Hashira, each of which is allotted to different
classes of characters. The rear pillar on the left of the stage is earmarked for the Shite (Shite hashira), while the rear
pillar on the right is earmarked as the musicians’ pillar (fue hashira). The anterior pillar to the right is earmarked for
the Waki (waki hashira) while the anterior left pillar to the left is earmarked as the sighting pillar (metsuke hashira) to
help masked characters adjust their masks. To the left of the main performance area is a passage or walkway called
hashigakari that leads to a doorway from which the characters emerge and exit, which is covered by a curtain (or
Agemaku). Three pine trees are placed in front of the hashigakari. The audience sit facing the stairs as well as the
hashigakari . The pine tree and the painted bamboos on the sides of the stage signify grandeur. ( Cavaye et al16
2004).
2. Techniques of Performance
The basic technique by which an actor fulfils his commitment to the role in hand and imparts life to a character, is by
moving slowly and smoothly with occasional stamping on the floor to project his annoyance or anger. The only
exception to this rule of staid movements is when violent, negative characters are to be portrayed, where loud and
rhythmic stamping of the floor is involved (Cavaye et al 2004).
The essential movement in Noh is that of gliding like movement referred to as ‘Hakobi’ whereby the heels are not
lifted from the floor. The Centre of gravity for hakobi is provided by the basic posture that a Noh actor has to adopt
viz, Kamae, whereby the axis of gravity of the actor is the lower part of the body, which is enabled by the slightly bent
knees. The upper part of the body has the arms slightly bent with elbows pushed out. The right hand holds the fan
and wafts it in a circular fashion. The fan is opened and closed as necessitated by the scrip .17
The changes in moods are conveyed through shiori that symbolises crying, Sashi in which the hand holding the fan is
brought back closer to the body and then swung in an arc like fashion to point to a distance to point to a mountain or
a sea afar .18
Kata is the detailed choreographed pattern of movement in Noh, which adds to the emotional touch of Noh plays.
Kata can mean different things at different stages of a given play .19
In addition to regular performances, the Noh performance list includes smaller, elemental, but aesthetically rich
versions of performance viz, Shimai and Maibayashi. These versions are extracted from the main plays and
performed by the Shite. However these smaller versions look like rundown versions of regular plays. For on one
thing, the Shite does not wear his regular costumes in Shimai plays. Similarly instead of his regular fan (chukei), the
Shite of Shimai plays, uses the less officious shizume fan .20
3. Genres and Schools of Noh
Following Yamanaka and Pellachia (ud), we can distinguish Noh schools in terms of the types of plays performed by
them as well as in terms of their differing performance styles. The schools of Kongo and Kita do not focus on Waki
based plays. Similarly the Komparu, Kongo and Kita schools do not perform Kyogen. The hayashi musicians are also
affliated to various schools depending on the instruments handled by them. Thus there are three schools of fue (also
20 https://www.the-noh.com/en/world / danceform.html, accessed on 24th Aug 2020.
19 https://www.the-noh.com/en/world / danceform.html, accessed on 24th Aug 2020.
18 https://www.the-noh.com/en/world / danceform.html, accessed on 24th Aug 2020.
17 See Anonymous (2020a) and Lamarque (1989) for the symbolic nature of the movements essayed by a Shite with his fan. Thus the single sweepof a fan with the left hand indicates shooting an arrow, if repeated twice it denotes fluttering wings or the wind.
16 See Ichida Hiromi. (2017, p 88-94) and O’Neill(1953, p 12).
15 This aspect of repertoire deepening in Noh is suggested in the following narrative on the Komapru School of Noh ,’’ The basic methods of theschool which were established by Bishao Gon no Kami and his son Gon no Kami Konparu, underwent dramatic deepening at the time of Gon noKami's grandson, Zenchike Konparu (https://japanese-wiki-corpus.github.io/culture /The%20 Konparu%20school.html, accessed on Sep20,2020.). In the case of Kutiyattam, repertoire deepening is reflected in the changes brought about in the stage manuals for different plays from timeto time (Margi Madhu (personal communication, September 22, 2020).
197

nōkan, the transverse flute), four schools of kotsuzumi (the small hand drum), four schools of ōtsuzumi (the large
hand drum) and two schools of taiko (the stick drum) (Yamanaka and Pellachia (ud)).
Each school of Noh includes learners who are not relations of the head of the school. These schools also enrol
amateur students some of whom eventually turn into semi or full professionals (Yamanaka and Pellachia.ud). As
Pellachia (2017) notes, nonfamily, nonprofessional individuals perform Noh as amateur members of university clubs
of Noh etc. They affiliate themselves to different schools of Noh with a few of them turn into professional artistes.
Indeed as Pellachia (2017) notes, there are female actors in the amateur streams although in the traditional scheme
of things, female members are overlooked when it comes to hereditary transmission of professional titles.
In Noh, the fans held by the characters are not just instruments that aid acting but also serve as totems for the school
the performance is associated with. In fact each Noh School distinguishes itself from the other by the distinctive
design of the fan used by them.
Noh schools are not educational institutions or academies or conservatories although they have a band of teachers
who teach pupils in highly formalised environments. According to Yamanaka and Pellachia (ud), the traditional
schools of Noh, being closely held and driven by patriarchs, assume the character of ‘Ryugis’’. A Ryugi is a Japanese
term used to refer to a ‘flow’ of a tradition shared by a group of practitioners. Ryugis are headed by iemoto (lit.
‘origin of the house’). The iemoto lineage, from which each Ryūgi takes its name, is the highest ranking within the
stylistic school. They partake of a hierarchical social order (Yamanaka and Pellachia (ud)).
As Yamanaka and Pellachia (ud) further state, Noh performers do not undertake extensive group rehearsals prior to a
performance. They rehearse separately and have at best one rehearsal before the actual performance. According to
the authors, the fixity of the canons of acting, music, choreography and staging conventions obviate the need for
extensive.
It is possible for different schools to come together to enact complementary roles.Thus the authors mention how the
Kanze-ryū Shite could perform with Fukuō waki or Hōshō waki, with kō-ryū or okura-ryū ko-tsuzumi, etc. However
two Shites from different Ryūgis very rarely perform together in the same play due to differences in parameters of
acting, music and performance.
Each school is known for its unique competencies when it comes to performances. The Kita Noh school prides itself
in the distinct character and quality of its utai. Likewise the Kanzai, Kongo Komparu and Hosho schools have their
distinctive styles of dance, music, costumes and choreographic works.
4. The Socio-Logic of Noh Education
There are a few tenets of Noh that define the socio-logic of education and training in Noh. The first tenet is that the
learning process in Noh is based on the principle of imitation (‘maneru’) which in turn, is based on observation and
repetition of what the teacher demonstrates (Pellachia 2017). In terms of this approach, there is little potential for
the pupil (and more so for an amateur pupil) to be creative or original (Pellachia 2017). The teacher will display a
higher level of enthusiasm than the learner to induce students to be converted to cause of rigorous learning.
Another manifestation of this facet is that the teacher projects himself as super-energetic by taking up himself,
physically demanding movements and actions despite his age, to instil energy and a sense of commitment amongst
his pupils to learn the craft of Noh (Oshima Teruhisa.2016).
Being traditionally family / kinship-based organizations, Noh schools followed the path of exclusive training and
pedagogy that is exclusive and secretive. Pound and Fenollosa (1959, p31) mention the story of how an outsider,
young actor had to struggle to learn the acting secrets of a difficult play Sekidera Komachi since the instruction on
the same was only provided by an iemoto to his elder son . Movement of artistes or artiste families across different21
schools of Noh has also been a rarity .22
The advent of amateur performers since post World War 2 and their dual role as performers and financiers
sharpened the distinction between amateurs and professionals in the world of Noh (Pellachia .2017). There were
1250 Noh professionals in Japan during 2016 (Sato 2017, p12). As Pellachia (2017) brings out the amateurs were an
22 In the Edo period, there have been instances of actors changing camps at the beckoning of their patron or domain lords. There have also beenequal number of instances where artistes on their volition, crossed over from one school to the other. See for such instances (‘Question 135 Is itpossible for Noh actors to change to different schools? https://www.the-noh.com/en/trivia/135.html, accessed on 5th Aug 2020.
21 A contrasting case in point from Kutiyattam is the account about venerable Kochu Kutta Chakyar , who was the Kutiyattom Guru at theperforming arts school ‘Margi’ in Trivandrum from 1970s to 1990s, who had amongst his pupils, his two sons Sajeevan and Madhu and hisnephew Raman apart from others . However the Guru lived with all his pupils in a common facility attached to the school instead of stayingseparately with his sons and nephew. It is noteworthy that many of his pupils, including his sons and nephew turned out to be successfulprofessional artistes.
198
unqualified blessing to the school and its master, due to their unswerving compliance to the former’s authority as
well as their role in financially sustaining his master and his school through financial contributions which included
purchase of tickets for performances conducted by the master and his core disciples.
However, Noh Amateurs did not have any right to improvise on Noh plays as the rights over repertoire (which
included removing or including a new work as well as recognizing performers and professionals) rested with the
iemoto (Sato.2017, p12) . Efforts to create new types of Noh plays that went beyond classical repertoire was rare23
and was taken up only by celebrity literary figures like Ýukio Mishima. Nevertheless, in recent times the desperation
to attract new audiences has impelled Noh performances to go far beyond conventional canons. These moves
parallel efforts to introduce female actors in Noh performances (Salz.2019).
5. The Well Springs of Creative Capital in Noh
Being canonical in nature, Noh is tightly metred when it comes to performances. Indeed Zeami’s basic works like
Fushi – Kaden, Shikado and Sando lay down tall and tough standards of performance (Sekine.1985, p14-17) . On the24
face of it, this rigid canonical structure associated with Noh, leaves very little scope for individual artistes to
experiment or be innovative. Yet in practice, Noh provides scope for an actor to improvise and innovate.
The creative moment of a Noh play arises from its emotional content which is expressed in a restrained manner by
the actors. As Wells (1965, p175-192) puts it, Noh is more lyrical ‘than dramatic. It is about spiritual conflict and
psychical unrest, issues which lie at the core of Zen Buddhism. Similarly Zeami was of the view that the aesthete of
the audience was a major factor that guided the performance of a Noh Actor (Samsom,1975). Thus Zeami
emphasized on the centrality of the performance moment and not on the grip of the play on the actor (Megumi Sata.
1989).
For Zeami, a Noh actor experienced a mysterious sense of beauty (or Yugen) each time he repeated his role in given
drama. This artiste’s Yugen is also discerned by the audience who derive immense pleasure and joy from a Noh
performance. In many ways Zeami’s stress on the audience, resonates with the canons of Bharata’s Natya Sastra
where the role of audience in savouring Rasa is highlighted. The creative capital of Noh therefore lies not in its
canonised texts and manuals but in the performance moment, which in essence, conveys the creative twists and
turns that is brought out at the spur of the moment by the actor.
An identical ‘moment of creation is suggested for Western Classical Ballet in Damodaran (2013). However the big
difference between the creative moment in Western Ballet (a dance form) and Noh is the more intimate touch that a
Noh artiste keeps with his audience as compared to the Western / Russian Classical Ballet. This is facilitated in the
Noh Theatre by the smallness of the stage, the relative proximity of the audience with the stage and the ability to
feel the pulse of the audience due to the stillness and slow-moving enactment process. The corollary of this feature
is that Noh and Kutiyattam, unlike Russian Ballet do not require large, ornate performance infrastructure on account
of their minimalist character.
As with Noh, in Kutiyattam, despite the dominance of ‘Natya Dharmi’ (the laid down canons of performance), actors
go by ‘Loka Dharmi’ (or the practice of assessing the state of mind of the audience) and bring suitable variations to
their performance to suit the moods of the audience.
Given that plays and performance manuals are written by artistes in Noh (as in the case of Kutiyattam), the scope for
incorporating innovations in acting is immense .25
However as mentioned earlier, the privilege of innovating on Noh plays always rests with professional actors.
6. The Philosophy of Noh
25 The concept of Manodharma in Natyasastra , in some ways, is the fountain of innovation and creative capital inKutiyattam.
24 Indeed some Noh plays call for special skills on the part of the actors. An interesting phenomenon which gives grist to this statement is thewell-known discourses on Noh theatre that emphasizes on the special skills required of an actor to successfully enact difficult plays like Do-ji,which calls for extraordinary physical and mental strength on the part of the actors. See Oshima Masanobu (2016).
23 The attraction of amateurs to the Noh Theatre was fuelled by the State’s policy of promoting heritage and traditions among the youngergeneration of Japanese citizens in post-World War 2 Japan (Pellachia 2017). This policy initiative was also impelled by the emergence of Noh as asymbol of social superiority and a valuable slice of Japanese heritage (Pound and Fenollosa.1959, p8). However, the gap between the professionalsand amateurs is less pronounced for Kutiyattam as amateurs practising this art form are open to receive even ‘play production grants’ by parastatal bodies like the Sangeet Natak Academies of the Central government and the State Governments ( Source Margi Madhu, personalcommunication, Sep 15, 2020).
199
The broad premise of the Noh theatre is the ideal of wholesomeness and the unity of opposition between, ‘the
worldly and the non-worldly’, ‘the sacred and the profane’ and ‘the good and bad’ etc (Wells 1965). However
wholesomeness requires the expurgation of partial truths or partial facets. This entails, as per Noh philosophy, of
first attaining a state of ‘Nothingness’ and ‘naturalism’ before moving to capture the spirit of wholesomeness. The
concept of nothingness and naturalism in Noh can be traced to the philosophical foundations of Zen Buddhism which
is typically expressed in Japanese language through the metaphor of ‘empty space’. Japanese language treasures
‘ma’ or ‘empty space’ and seeks to find hidden meaning in them (Davies and Ikeno (2002, p38). The concomitants of
the concept of empty space are the deep reflection, intense gaze, symbolism, minimalism and circularity of time.
These virtues lead to the realisation of ‘yugen’, the supreme aesthetic feeling that a Noh actor realizes while
performing.
Indeed, the idea of ‘Nothingness’ is the philosophical principle of Zen Buddhism as well .26
The idea of nothingness is empowering and has a powerful positive connotation (Sekine, p95). ‘Nothingness’ is not
just about renouncing the idea of self. It is also about being one with the universe. It is in this sense that Zeami
explains why it is important for a Noh actor to seek unity with the universe and achieve spiritual enlightenment
(Sekine op. cit, p95) . The idea of nothingness in Noh is associated with a Noh actor shedding his own personality in27
favour of the role that he assumes in a play. The mask that a Shite dons to cover his face, is what enables the artiste
wearing the mask to transform himself into that of the assumed character. ‘Nothingness’, in turn can be associated
with the ideals of asymmetry, sublime austerity (introspective eyes), freedom from attachment and tranquility
(Shinchi Hisamatsu (1982. p62).
The second philosophical principle of Noh is the idea of ‘naturalism’. The roots of Noh stories are drawn from nature
as well as from festival songs, rituals and dance (Udaka (2010, p177). The best manifestation of naturalism in
Japanese ethos is the respect that it confers on resources that other civilizations consider as valueless .28
The other closely related point about Noh is that it emphasizes the primacy and purity of human energy (the artiste’s
body and voice) in comparison to the artificiality of electricity and human created sources of energy (Sato.2017,
p12).In this way Noh is associated with the credo of sustainability.
A concomitant of the concepts of nothingness and naturalism is the principle of intense gaze and reflection on the
part of the actor or artiste. As Pound and Fenollosa (1959, p32) state, the more you look at a Noh mask, the more
you see it charged with life and the more you feel like getting to be one with the mask. The gaze into nothingness in
a calm manner leads the actor to cast away his body and mind and enter the realm of a liberated state that portrays
distance from everyday life and transition to a world of metaphors and symbolism. These were the added qualities
that attracted the famous Irish poet / playwright W. B. Yeats to the Noh Theatre (Jeff Janisheshki.2014) .29
6.1 Symbolism
The Noh mask is the symbol of serenity, transformation and ‘other-worldliness’. The pine tree which forms the
backdrop of the rectangular performance space and the bamboo plants planted in front of the walkway (hashigakari)
through which characters enter and exit, symbolise radiant green and positive spirits or kadomatsu (Ichida
Hiromi.2017, p92). These aspects strengthen the naturalistic dimension of Noh (Ezra Pound and Ernest Fenollosa
.1959, p36). Likewise, as mentioned earlier, the fans used by the main characters and the costumes also convey the
identity of the character and the theatre. Similarly, the bridge that links the mirror room to the stage represent the
29 Hisamatsu (1982, p100-101) refers to the Shite in Matsukaze undergoing the metamorphosis of the kind described from his own self to that ofthe character of the play.
28 Davies and Ikeno (2002,p71) mention how the approach to beauty in Japanese culture pays equal attention to all the different states in whichan object may exist. Thus in Japanese culture flowers in full bloom hold the same significance as their withered versions. While conventionallyother cultures are used to thinking the former to be beautiful and ipso facto valuable and the latter valueless, in terms of the Japanese ethos thewithered flowers are deemed to be of value for the pathos they generate. In a deeper sense this credo of assigning value to the valueless conveysnaturalism and ipso facto the attachment to the notion of diversity.
27 It is noteworthy that Henry W Wells (1965, p175-192) considers the Noh experience to be about spiritual conflict and psychical ferment, issueswhich form the core concerns of Zen Buddhism. Wells (1965) however describes the Sanskrit theatre forms (like Kutiyattam for instance) as‘theatres of poise’.
26 As Suzuki (1970, p 419) says, Noh plays like Yama -Uba (the old woman of the mountains) was put in by a Buddhist priest to propagate theteaching of Zen. Indeed ‘nothingness’ in Zen Buddhism is not a hopeless void. The importance that Zen accords to nothingness can be gleanedfrom the following tale involving a Zen master of the Meiji era, the Rinzai Master Nan-In. The master once received a University Professor whocame to inquire about Zen. The master welcomed the Professor by serving him tea. He poured his visitor’s cup full and still kept pouring. TheProfessor watched the overflow until he could not stop. “It is overfull. No more will go in”, he said. “Like this cup, said Nan-In ‘’ you are full of yourown opinions and speculations. How can I show you Zen unless you empty your cup. See Bryan McDaniel, Richard. 2013, p 292.
200
transition between the material world and the spiritual realm (Mikiko Ishii .1994). Udaka (2010, p181-183) describes
how Noh plays have their allegorical tones and change men into trees and sometimes into Gods.
6.2 Minimalism
The austere nature of Noh is reflected in its minimalist approach to acting which is best expressed in the stately but
slow movements of the characters (Udaka,2010, p177 and Lamarque 1989). Even in Noh plays that are lyrical, the
process of build up towards music and dance is gradual (Udaka 2010, p175) . This is achieved through bodily30
restraint. As Zeami avers, when you feel ten in your heart, express seven in your movements”. Likewise the actor
should restrain a gesture (extending or withdrawing the hand) "to a lesser extent than his own emotions suggest"
(Roland Barthes.2005). Likewise gentle tilts to the mask indicates fundamental change in emotions on the part of the
characters (Udaka, p178).
The Noh stage has no dazzling curtains unlike the stages of dance forms like Western Classical Ballet. The sets are
bare and simple. The music is by way of chants and does not bear the opulence associated with the orchestra of a
Ballet or an opera.
The other reason why Noh is minimal is that a Noh play, unlike an opera or a ballet does not require the presence of
too many characters/ actors. The Shite of a Noh play by enacting multiple roles obviates the need for a Noh
performance to have a corps of artistes as is the case with Ballets and Operas or classical western drama .31
Thus in the Mugen play ‘Atsumori’, where the main character is the slain warrior Atsumori, the widened scope for
acting comes from the Shite performing first as a mirthful youth and later on as the mature Atsumori who is killed in
battle. The Waki of the play also is required to perform more than one role, first as a repentant warrior and later as
the monk Rensei who is in desperate search of the Atsumori’s ghost to atone for his sin of killing him. Both the Shite
and the Waki in Atsumori have ample scope for venting their emotions in a quintessential Noh manner. The finale of
the play occurs when the Rensei whom the ghost of Atsumori wanted to destroy, is embraced by him as his friend.
The practice of the main actor / character assuming or enacting different roles is an accepted performance mode in
Kutiyattam as well.
7. The Temporal Dimension of Noh
The circularity of time underlying Noh aesthetics is best expressed in the paradigm that what goes out comes back.
The Japanese concept of four seasons accords with this approach to time. The characters in Mugen Noh plays
alternate between departed souls and their ‘in life’ versions.
The second dimension of a Noh’s circularity is the enormous temporal dimension covered by a Noh play within a
narrow stage (space). In certain plays the change in time is conveyed through small changes in spatial movements
across place .32
8. Deconstructing ‘Yugen’
When compared to the concepts of monomane (mimicry) and Hana (a flower) that defined the aesthetics of Noh
theatre, Yugen was a relatively new concept which received in depth consideration at the hands of Zeami
(Tsubaki,1971). The concept of creation from a state of nothingness casts the yugen in a distinct mould. Yugen is the
mysterious beauty that guides an artiste from the state of abnegation of self and ‘nothingness’ to a state of
enrichment that is centrally stimulated by the audience before him . Lamarque (1989) says, that Zeami saw an33
intimate connection between the defining qualities of a character and the inner mental state of the actor portraying
the character. The enlightened pool of Noh audience that are passionate or addicted to Noh (Rasikas in Sanskrit
parlance or ‘connoisseurs’ in French and English) vary in their mental makeup depending upon their expectations
from a performance. These expectations vary from day to day. The same play performed on different days creates
33 Tsubaki (1971) explains how the idea of yugen was to evolve in the hands of Zeami from that of mysterious beauty to a state of sabi (the serenesimplicity of the aged). The impact of sabi on the Noh aesthete is not assessed in this paper as it needs a detailed and separate consideration andmore profound scholarship.
32 As Heita (2004) says, in terms of traditional Japanese thinking, a change in place (and character) brings in a temporal dimension. Thus it isconventional for Japanese history to be divided into time periods that are associated with places. Thus the seat of authority during Heian and Edoperiods was Kyoto which was different for other periods.
31 The minimalist rigour of the classical Noh theatre of the Edo period got weakened in the post-World War 2 period when efforts were made toattract commoners as spectators by introducing the shimai where the Noh drama which was until then sombre and stately, transitions to its moremirthful dance phase (Bowers, Fabion.1960).
30 As Udaka says, the most lyrical of Noh plays do not necessarily connote the musical. The lyrical element imparts the greatest concentration ofexpression and the evocation of emotion.
201
differing expectations amongst its spectators. The skill of a Noh artiste lies in his ability to sense the changing moods
of the spectators. Another source of inspiration for a Noh actors was the enlightened approach of patrons in the pre
Meiji era (the Tokugawa shoguns) and their cultural sensitivity which inspired an actor to realise the ‘hana’ (or
flower) and the yugen effects every time he performed (Sekine,1985, p52-53).
The spur of the moment creations also explains the infinite capacity of a Noh performer and a Noh play to generate
creative capital. The artiste is not trammelled by the grip of the drama’s plot or the rigidities of the stage manuals in
realising his creative potential. In some ways, the idea of yugen resonates with the aesthetic concept of Rasa in
India’s aesthetics which highlights the role of the audience or the spectator in kindling creativity of the artiste as per
her / his manodharma (state of mind driven or self-generated creativity) that is set to Lokadharmi (the audience’s
aesthete).
As discussed, earlier Noh is minimalistic and deeply symbolic. This explains why the yugen in Noh is realized without
recourse to the fantastic and spectacular. According to Ikegami (2005, p109-111), this has been due to actors
attached to Japanese performing arts wrenching themselves free from madness (kurue) and marginality, two traits
characteristic of the medieval period in Japanese history. This also explains why Noh actors transform themselves in
the direction of restraint and control when it comes to performances. What accounts for minimalism in acting has
been ‘the aesthetics of suggestion combined with the principle of monomane (the imitation of essence) which pares
down gesture and movement in favor of high symbolism by way of the realisation of yugen (Lamarque (1989) .34
9. Comparing Apples to Oranges: Towards a Comparative Analysis of Noh and
Kutiyattam
Franz Boas (1940) was a well-known critic of the comparative method in cultural anthropology that sought to relate
one ‘whole culture’ from the other. Boas’ refrain was that such an approach tended to gloss over the evolutionary
particularities of compared cultures. Thus two art forms like Noh and Kutiyattam that have distinct origins, milieu
and aesthetic properties cannot be compared as ‘distinct whole systems’ even when they have a few striking
similarities. Yet, if one were to eschew comparisons altogether, the discipline of anthropology would lose its sheen.
As Borofsky (2019) says, comparison free anthropology can at best create a flood of specialized studies that are of
uncertain significance . When an outsider seeks to understand an exotic culture, the predominant tendency is to35
relate traits of her / his culture that are morphologically similar to the observed exotic culture. In these days of
globalisation where cultural exchanges assume complex cross cutting forms, an anthropological approach that shies
away from the ‘comparisons of the incomparable’ would stand in the way of human beings belonging to one part of
the world making sense of themselves vis-a-viz myriad communities or expressions found in other parts of the globe.
In this paper, we thus resort to the methodology of comparing apples with oranges by giving an account of the
phenological and ontological distinctions between Noh and Kutiyattam. In some ways, this approach accords well
with the neo Boasian traditions in cultural anthropology pioneered by Margaret Mead and Ruth Benedict that sought
to compare specific traits of two cultural phenomena without comparing them holistically.
The minimalist streak of Noh and Kutiyattam is manifested in the profound simplicity of Noh performances. Unlike a
classical Western Ballet Theatre where the performance venue is linear and large with extensive stage props
(including opulent curtains and backdrops), the Noh theatre is considerably light in terms of its décor. Also, as
observed earlier, the movement of the characters is limited in the range covered. As Yamanaka (2015, p57-58)
observes, the kata (or movement patterns) of a Noh character is wavy and slow. The trajectory of movement follows
a hexagonal shape that moves onwards and reverses (see Yamanaka, 2015, p 53 and p56). The recursiveness of
movement is suggested in Kutiyattam too, given the small size of the performance space. Thus both art forms are
different from that of Western Ballet that requires long, horizontally linear movements across the stage (which in
turn calls for a larger and longer performance space). The L shaped performance space of the Noh theatre is spartan
so is the Koothambalam, which is the performance space for Kutiyattom. The Koothambalam is a roofed, square
platform that is supported by four pillars (See Nair.1976 & Lal, p174).
Similarly both Noh and Kutiyattam are theatre forms that go back to antiquity. While the former traces its roots to
the folk traditions and evolved in its present form during the 14 to 15th century, the latter emerged from the Great
Sanskrit traditions of India and trace its formalized origin between the 10th and 12th centuries (Moser 2011, cited in
35 https://hraf.yale.edu/the-return-of-the-comparative-method-in-anthropology/, accessed on Sep 21. 2020.
34 Lamarque (1989) explains the essence of minimalism and symbolism as expressed through restrained actions suchas single sweep of a fan with the left hand to symbolise shooting of an arrow. Likewise, by a slight lowering of maskthe actor conveys grief.
202

Damodaran and Chavis, 2017). As mentioned earlier, Noh practitioners were drawn from groups of families that
occupied a high position in social hierarchy. Even today despite becoming more inclusive, Noh continues to be
controlled in its performance traditions by these families. In the case of Kutiyattam too, the traditional families
practicing the art form were situated high in the social order. However in the wake of social reforms that swept
Kerala in the 1950s, the art form became more socially inclusive with members of non-traditional castes also making
their entry as performers (Lowthorp 2013a; Moser 2013).
Both theatre forms were proclaimed by UNESCO as Intangible heritage of Humankind in 2001 and both were
inscribed in the UNESCO representative list of Intangible Cultural Heritage of Humanity in 2008 .36
As mentioned earlier, the philosophy of Noh has centered on the Zen philosophy of ‘nothingness’ associated with
minimalism and profound symbolism. Kutiyattam is also based on the idea of minimalism and deep symbolism with
the exception that it is based on the idea of illumination from a previous state of darkness-illumination which leads
to the unfolding of Rasa ( particularly Srngara) from a state of Sthayi bhava (state of feeling / mood) (Venu,2013, p
6-7). The dimension of illumination in Kutiyattam is suggested by the focus of an actor’s performance on the lighted
lamp placed at the centre of the performance stage, that is ritualistically lit, prior to the launch of actual performance
(Venu,2013, p5) .37
Noh differs from Kutiyattam in that it has conventionally speaking, not accepted the presence of female actors even
when women characters are to be depicted. In Kutiyattam, the role of female characters is played by female artistes
(Nangiars) and there are dedicated solo performances by female actors, referred to as Nangiarkoothu (Venu,2013,
p2). In reality, the aesthetic foundations of Kutiyattam eulogise the role of mother Goddess and conceptualise the
female character of Kutiyattam as Goddess and this is reflected in the distinct costumes worn by female characters
(Venu,2013, p 4-5).
The two striking performative similarities between Noh and Kutiyattam lies in the chanting nature of their music and
the manner in which a single actor / character presents the story involving multiple characters (O’Neill.1953). There
are a couple of other features that are similar between Noh and Kutiyattam. One is their ritualistic roots and the
other is the presence of comic adjunct performances. Both Noh and Kutiyattam have, as has been noted earlier, a
strong ritualistic element associated with them. Kutiyattam plays, as has been noted, commence with ritualistic
oblations before the lamp. Indeed portions of Mattavilasam and the Anguliyankam plays in Kutiyattam are densely
ritualistic when performed in temples (Venu,2013, p 2). Likewise, as has been noted earlier, there are strong
resemblances between Kyogen and Cakyar Koothu in terms of their satirical and comedic orientation.
The significant dissimilarity between the two theatres, is the divide between amateurs and professionals when it
comes to rights to perform and innovate in the case of Noh as compared to Kutiyattam.
Both theatres have as noted in the preceding discussions on repertoire management indulged in both repertoire
‘deepening’ and ‘widening’. Repertoire deepening in Kutiyattam has involved excavations of old choreographic
pieces and their deepening by way of greater elaboration.In the case of Noh it has involved reworking of old
choreographies. The point of divergence between the two theatre forms is that in the case of Noh repertoire
deepening could have also been driven by the desire on the part of different schools to establish their stylistic
distinctiveness, while in the case of Kutiyattam, there are no proclaimed differences between existing performing
schools or theatres as far as stylistic differences are concerned (Damodaran and Chavis, 2017). When it comes to
the conversion of modern novels and plays from their respective languages into the theatre format, Noh takes a lead
over Kutiyattam as modern Noh plays have been created by modern literary figures of Japan. Kutiyattam, by contrast
are still occupied with converting old Sanskrit plays which were not choreographed into the Kutiyattam acting format.
This included like Kalidasa’s Abhijnana Sakuntalam and Vikramaorvasiyam. Very few Indian contemporary literary
works have been added to the Kutiyattam repertoire.
The financing models of Noh and Kutiyattom performance organisations differ in major ways. As far as Noh is
concerned during the Edo period the art form was patronized and economically supported (or funded) by the
Shoguns (Fig 1).
Figure 1 – Noh Funding Under Edo Period
37 A lamp has pride in place in Sanatan Vaidik Hindu Dharma(http://themodernvedic.com/science-vedas/light-lamp-deepam-science/#:~:text=A%20lamp %20has %20its% 20own,of% 20Durga %2C%20Lakshmi%20and%20Saraswathi, accessed on Sep 20,2020.
36 Damodaran and Chavis, 2017 and https://ich.unesco.org/en/RL/nogaku-theatre-00012, accessed on Sep 21, 2020.
203

However as noted earlier, in the post-World War II period, faced with the decline in direct or indirect financial
support from patrons, Noh performance organizations shifted to the ingenious alternative of admitting ‘well to do’
and ‘keen’ amateurs as students in return for their monetary contributions. These amateurs also doubled up as
spectators of performances by the performance organizations (Peellachia,2017). Fig 2 illustrates the changed of
funding.
Figure 2 – Amateur Driven Model of Noh Funding
In the case of Kutiyattam, the traditional support for the theatre form came from temples and local patrons
(Damodaran and Chavis,2017). However, during the 1950s as these sources of financial support drained up,
Kutiyattam performing organisations got into serious difficulties. Commencing with the 1970s the Provincial and
Federal Governments stepped in to fund five Kutiyattam Schools of Excellence though their the Central and State
Sangeet Natak Academies. Fig 3 illustrates the model of State driven funding of Kutiyattam Schools in India.
Figure 3 – The Model of State Driven Funding for Kutiyattom
(The five Schools are Mani Madhava Chakyar Smaraka Gurukulam, Ammanur Chachu Chakyar Gurukulam, Margi,
Pothiyil Gurukulam and Nepathya).
This process of Central and State Government funding gained renewed vigour after the proclamation of the theatre
as intangible heritage of humankind by the UNESCO in 2001 (Damodaran and Chavis,2017).
The revenue models of the two theatre forms vary radically. While the Noh schools have a box office approach to
revenue collection based on a hybrid of third order and second order price discrimination models, the Kutiyattam
204
performance organizations do not practice of charging for their performances on account of State regulations
requiring them to treat public performances as public goods .38
Both theatre forms were recognised by the UNESCO as the intangible heritage of humankind in 2001. However, as
Lowthorp (2015, 157) states, Kutiyattam underwent ‘mediatization’, ‘institutionalization’ and ‘liberalization’, in the
period following UNESCO recognition of the art form. By comparison Noh did not undergo major changes in the post
UNESCO recognition phase.
Table A provides a matrix that summarizes the points of convergences and divergence between Noh and Kutiyattam
in terms of their broad morphological and phenological features.
Table A: Systemic Comparison between Noh and Kutiyattam
Parameters NOH KUTIYATTAM
Origin Folk (Little Traditions) Sanskritic ( Great Traditions)
Philosophy Creation and Enrichment from a state of
Nothingness
Illumination from Darkness
Performative Systems Subtle Motions and Controlled Expressions
(through use of Masks)
Pronounced Motions and Acting
Present Social Context Exclusive Affinal and Lineage based Performance
Organizations
Traditionally performed by designated upper castes
Repertoire Management Both Repertoire Deepening and Widening Both Repertoire Deepening and Widening
Stylistic Identity of Performing Schools Strong Weak
Financing Source Amateur Learners who double up as Spectators
as well
State Funded
Revenue Model Ticket / Box Office Sales Free Public Good
10. Co-creation as the new Frontier: Factoring a new dimension to India -Japan
Cultural Cooperation
The modern history of India Japan relations goes back to the year 1903 when the India-Japan Association was formed
. After India’s independence, both countries entered into an agreement for cultural co-operation on 29 October39
1956. This agreement came into effect on 24 May 1957 (ibid).
More recently a yearlong ‘Festival of India in Japan’ was held from October 2014 to September 2015. This year-long
festival has fostered closer ties between the two countries. The ‘Act East’ policy of the Government of India initiated
in 2014, which is focused on South East and East Asian Countries, envisages close cultural cooperation of these
countries with India. Japan is a key country of focus in India’s ‘Act East Policy’ (Anonymous 2020 b).
The Embassy of India in Tokyo and the Consulate General of India in Japan, organized the celebrations connected to
the 3rd International Day of Yoga on 18 June 2017 (ibid). The Yoga Organisation of Japan and the Quality Council of
India launched a scheme of Voluntary Certification of Yoga and conducted the first QCI examination outside India in
Japan at the Vivekananda Cultural Centre on 23 April 2016 (ibid). These steps have without doubt, opened up the
cultural heritage of both countries to their respective citizens and created conditions for both Japanese and Indian
citizens to pick up skills in critical areas like yoga and dance forms.
Another interesting facet of India-Japan cultural cooperation has been the Jenesys (or “Japan-East Asia Network of
Exchange for Students and Youths”) and its programme of selecting Indian youth (along with youth from the
Asia-Pacific region) to be Young Cultural Ambassadors to Japan (Anonymous.2018). Although cultural exchanges are
envisaged under this programme, the same does not extend to fine or performing arts. Similarly Japan’s cultural
assistance programmes undertaken in India include cultural exchanges programmes. Thus in India’s North Eastern
States like Manipur, with a history of ties with Japan programs have been taken up to promote tourism involving40
Japanese citizens. Japanese tourists in Manipur pay visits to the tombs of Japanese soldiers who were cremated in
Manipur during Japan’s brief military occupation of Imphal during World War 2. In addition Japan has provided
assistance to natural heritage projects in Manipur which includes projects taken up for improving the sustainability of
40 Japanese soldiers, who during World War 2 were stationed In Imphal, to fight the British and allied troops had a history of close interactionswith the local population.
39 Anonymous (2017) accessed on Sep 20, 2020.
38 However the onset of virtual performances in the COVID 19 era have altered the situation as the different Kutiyattam schools have taken toticketing their virtual streaming performances taken up through the social media platforms afforded by Facebook and Instagram.
205
the Lok Tak Lake (Anonymous, 2016). Likewise, Japan has promised investment to help the rebuilding of the Nalanda
University in Bihar. In addition, Japan Government has come forward to assist infrastructure development in the
Nalanda District (Vibhanshu Shekhar. 2007).
The discussions in the preceding sections of this paper underscore the close affinity that potentially exists between
Noh and Kutiyattam. Noh performers from Japan have visited India on sporadic missions and have interacted with
Kutiyattam artistes. However these exchanges have not been as part of India-Japan Cultural Exchange Programs. One
method by which India- Japan cultural co-operation can be taken to an advanced level, is by exploring possibilities for
Noh and Kutiyattam artistes to come together to co-create new works involving the two art/ theatre forms. However
for co-creation to be a reality, it is essential that artistes from both streams grasp the aesthetic essence of the art
forms that they seek to learn about, through a process of active, two-way interactions. In this scheme of things Noh
artistes would attempt to grasp the philosophical essence of Kutiyattam from their Kutiyattam counterparts, in the
same manner that Kutiyattam artistes will attempt to grasp the philosophical essence of Noh from the former.
The concept of Mono has been a key principle guiding Japan’s cultural interchange with the outside world and can be
a critical tool in promoting understanding of the philosophical essence of arts forms. As Yamaguchi (1991, p 61)
explains, the Japanese term mono (by which is meant the ‘roots an object’), lies at the base of the Japanese
‘technique’ of exhibiting the invisible mono of its cultural objects through a material mono which is artistically
fabricated. Put in a different way, the Japanese believe that their ‘Gods’ do not want to see things as they truly exist.
In terms of the Japanese ethos, Gods would prefer to get astonished by fabricated things that look like the original .41
However to create a product that resembles its original, it is essential that the artist who fabricates a material mono
understands the essence of the original. In many ways Yamaguchi’s point, though related to the idea of Baudrillard’s
simulacrum, resonates with the remarks of the celebrated Japanese novelist Junichiro Tanizaki (1977) on essence. As
Tanizaki says, “I would push back into the shadows the things that come forward too clearly, I would strip away the
useless decoration…Perhaps we may be allowed at least one mansion where we can turn off the electric lights and
see what it is like without them”. In many ways Tanizaki’s approach accords with the idea of kuden, or acquiring the
feel of a phenomena by grasping the inner spirit (Pound and Fellonsa.1959, p 30).The penchant of getting
astonished by artistically fabricated mono has a close resemblance to the Husserlian phenomenological quest that
privileges the essence of a phenomenon in preference to its outward manifestations (Husserl 1983, p7-8).
What are the implications of the phenomenological quest of essence (or the material mono) on the proposed idea of
co-creation involving Noh and Kutiyattam artistes? The simple answer to this question is that a quest for deriving the
essence of a phenomenon will help artistes on both sides to decipher the essence of aesthetics implicit in Noh and
Kutiyattam. A practical consequence of the approach is that it will foster a deeper level of engagement and involved
discussions amongst the practitioners and scholars of Noh and Kutiyattam that centre on the key aesthetic concepts
of Yugen, Bhava and Rasa. Thus these interactions will help scholars and artistes from both sides to arrive at the
invariant core of both art forms and create conditions for co – created plays involving both Noh and Kutiyattam
artistes. Co-created plays could involve adaptation of Kutiyattam plays to the format of Noh and vice versa. While it
may be true that a large number of Srngara Rasa based plays of Kutiyattam may not fit into the metre of Noh plays, it
is quite likely that Kutiyattam plays that highlight Santa bhava may fit into the Noh format. Likewise the Mugen plays
of Noh with its focus on other worldly beings may go well with the focus of Kutiyattam plays on super natural
characters. However as Baumer and Brandon (1993.p73) observe, by ensuring that the play that is being adapted to
an exotic art form captures the essence of the art form to which it is transposed, it is possible to ensure its
acceptability amongst its new audiences. This is where cultural exchange programmes involving India and Japan can
play a positive role.
References
● Anonymous. 2020, a. Movement Patterns, Introducing the World of Noh, https://www.the-noh.com/en/world/danceform.html, accessed on
Aug 4, 2020.
● Anonymous. 2020, b.’ Japan-India Relations (Basic Data)’, January 30 https:// www.mofa .go.jp/region/asia-paci/india/data.html, accessed on
Sep 5, 2020.
● Anonymous. 2018. ‘80 Young Cultural Ambassadors to Japan on JENESYS Program’, https://india.afs. org/ 2018/
12/07/80-young-cultural-ambassadors-to-japan/#:~: text= Representing %20India%20 in%20Japan% 20 for,by%20AFS%20
Intercultural%20Programs%20India, accessed on Sep 20, 2020.
● Anonymous. 2017. ‘India - Japan Relations’, http://www.mea. gov.in/Portal/ Foreign Relation /Japan_ Aug_2017.pdf, accessed on Sep 5, 2020.
● Anonymous. 2016. ‘Japan Willing to fund State’s Development’, The People’s Chronicle, (http://thepeopleschronicle.in/daily/english/1161,
accessed on Sep 1, 2020.
41 A case in point is the ikebana (or the Japanese technique of flower arrangement which seeks to bring out inner qualities of flowers that evokeemotions amongst its beholders (Yamaguchi,1991, p 61).
206

● Anonymous (ud1) ‘Definitions for Noh’, https://www. definitions.net/definition/NOH, accessed on Sep 5, 2020.
● Anonymous (ud 2) ‘Noh Theatre – Japanese Drama’, https:// www. britannica. com /art/Noh-theatre,
● Anonymous. (ud3) ‘Kita School’, https://japanese-wiki-corpus.github.io /culture /Kita% 20school.html, accessed July 7, 2020.
● Anonymous (ud 4). ‘History of the Oshima Noh Theatre’. https://noh-oshima.com/noh /history /history.html, accessed on August 24, 2020.
● Barthes, Roland .2018. ‘The Neutral that Roland Barthes’, http://www.sholette
seminars.com/wp-content/uploads/2018/01/The-Neutral-R.-Barthes.pdf, accessed on Sep 4, 2020.
● Baumer, Rachel Van D. and Brandon, James. R, 1993. ‘Performance Today’ In Baumer, Rachel Van D. and Brandon, James. R. (Eds) 1993. Sanskrit
Drama in Performance, Motilal Banarasidass Publishers, Delhi, p 67-73.
● Birmingham, Lucy. 2008. Actor Nomura brings Noh to new audiences, https://www.japantimes.
co.jp/culture/2008/06/12/stage/actor-nomura-brings-noh-to-new-audiences/#.X0CtUciJiUk, Jun 12.
● Boas, Franz. 1940. [1896]. The Limitations of the Comparative Method of Anthropology. In Race Language, and Culture. Pp. 270-280. New York:
Macmillan.
● Bowers, Fabion.1960. Theatre in the East A Survey of Asian Dramas, Grove Press Inc, New York.
● Bryan McDaniel, Richard.2013. Zen Masters of Japan, Tuttle Publishing, Tokyo.
● Cavaye, Ronald, Griffith, Paul and Senda, Akihiko.2004. A Guide to the Japanese Stage: From Traditional to Cutting Edge, Kodansha
International, Tokyo.
● Damodaran, A.2013. ’The Locus of Creativity in Classical Performing Arts: Economics and Intellectual Property in Theatre Management’,
November 25, Working Paper No. 432, Indian Institute of Management Bangalore, India.
● Damodaran, A N & Chavis, Larry.2017.’Nurturing UNESCO’s ‘aged’ infants in India: lessons in heritage policy’, International Journal of Cultural
Policy, Vol 25(4), p407-422.
● Davies, Roger,. J and Ikeno , Osamu (eds) .2002. The Japanese Mind,Tuttle Publishing, Tokyo.
● Fenollosa, Ernest.1953. "Fenollosa on the Noh," in The Translations of Ezra Pound (Ed). (trans Hugh Kenner (.), Faber and Faber, London:, pp.
269-270.
● Gopalakrishnan, Sudha. 2011. Kutiyattam: The Heritage Theatre of India. New Delhi: Niyogi Books. New Delhi.
● Goswamy, B. N.1991. ‘Another Past, Another Context. Exhibiting Indian Art Abroad’, In Ivan Karp and Steven D Lavine (eds). 1991. Exhibiting
Cultures, Smithsonian Institution, USA, pp68-78.
● Heita, Kawakatsu.2004.‘Japanese Civilization- Historical periodization: A Fresh Look at Japan’s Economic Theory’, Japan Spotlight. Jan/Feb, pp
36-39.
● Hisamatsu , Shinchi .1982. Zen and the Fine Arts , (Trans Gishin Tokiwa), Kodansha International Ltd, USA.
● Husserl.E. 1983. Ideas pertaining to a pure phenomenology and to a phenomenological philosophy. (F. Kersten, Trans.), Martinus Nijhoff
Publishers, Kluwer Academic Publishers Group, The Hague.
https://books.google.co.in/books?id=xapti6-4nGYC&printsec=frontcover&source=gbs_ge_ summary_ r&cad=0#v=onepage&q&f=false).
● Ichida, Hiromi (2017) An Illustrated Guide to Japanese Traditional Clothing and Performing Arts, Tokyo.
● Ikegami, Eiko.2005. Bonds of Civility Aesthetic Networks and the Political Origins of Japanese Culture, Cambridge University Press, Cambridge.
● Ishii, Mikiko. 1994. ‘The Noh Theater: Mirror, Mask, and Madness’, Comparative Drama, Early and Traditional Drama, Comparative Drama, Early
and Traditional Drama, Vol.28, No.1, Spring, pp. 43-66.
● Jeff Janisheshki .2014. ‘Empire of stillness: the six essential aspects of Japanese Noh, The Conversation’,
https://theconversation.com/empire-of-stillness-the-six-essential-aspects-of-japanese-noh-27517.
● Karp, Ivan and Lavine, Steven. D. (eds).1991. Exhibiting Cultures, Smithsonian Institution, USA.
● Komparu, Kunio 1983 The Noh theatre; Principles and Perspectives, trans Jane Corddry and Stephen Commee. Weatherhill., NY.
● Lal, Ananda (Ed).2009. Theatres of India. Oxford University Press, Delhi.
● Lamarque, Peter .1989. ‘Expression and the Mask: The Dissolution of Personality in Noh’,
● The Journal of Aesthetics and Art Criticism 47:2 Spring.
● Lowthorp, L. 2015. “Voices on the Ground: Kutiyattam, UNESCO, and the Heritage of Humanity.” Journal of Folklore Research 52 (2–3):
157–180. doi:10.2979/jfolkrese.52.2-3.157.
● Lowthorp, L. 2013a. “Scenarios of Endangered Culture, Shifting Cosmopolitanisms: Kutiyattam and UNESCO Intangible Cultural Heritage in
Kerala, India.” PhD. diss., University of Pennsylvania.
● Marasinghe, E.W. 1988. The Sanskrit Theatre and Stagecraft, Sri Satguru Publications. Delhi.
● Masanobu, Oshima.2016. ‘A Single Time in the Life’, No 3, Cover story, 2016/04/15.
● Moser, H. 2013. “Kuṭiyaṭṭam on the Move: From Temple Theatres to Festival Stages.” In South Asian Festivals on the Move, edited by U. Hüsken
and A. Michaels, 245–274. Wiesbaden: Harrassowitz Verlag.
● Motokiyo, Zeami.1984., On the Art of the No Drama:the Major Treatises of Zeami, (trans. J. Thomas Rimer and Yamazaki Masakazu), Princeton
University Press, USA.
● Nair, D Appukuttan. 1976 , ’Kuthamabalangal (Kutthambalas)’, Margi Annual Souvenir 1976, pp XI-XIV.
● Neblett, Robert.2011. "Dramaturgical Crossroads and Aesthetic Transformations: Modern and Contemporary Adaptations of Classical Japanese
Nō Drama" (2011). All Theses and Dissertations (ETD).258, https://openscholarship. wustl.edu/cgi/ viewcontent.cgi? article=1257&context=etd.
● O’Neill, P. G. 1953. A Guide to No: Hinoki Shoten, Tokyo.
● Pellecchia, Diego.2017. ‘Noh Creativity? The Role of Amateurs in Japanese Noh Theatre’, Contemporary Theatre Review, 27:1, 34-45.
● Salz, Jonah .2019. ‘Noh Theatre's Desperate Measures: Creativity in Crisis’, Fall 2018, Kyoto,
https://www.academia.edu/38802477/Noh_Theatres_Desperate_Measures_Creativity_in_Crisis_Fall_2018_Kyoto_%E8%83%BD%E3%81%AE%
E5%8D%B1%E6%A9%9F%E3%81%A8%E6%94%BF%E7%AD%96%E5%8A%9B_2018_%E5%B9%B4_%E7%A7%8B_%E4%BA%AC%E9%83%BD,
accessed on Sep 22, 2020.
● Sansom, G. B .1975. Japan : A Short Cultural History, Revised Edition, Tuttle Publishing, Tokyo, Singapore.
● Sata, Megumi (1989): ‘Aristotle’s Poetics and Zeami’s teaching on Style and the Flower’, Asian Theatre Journal (Spring 1989) pp 47-56.
● Sato, Hajime .2017. ‘Creative Content in The Traditional Theatre Arts-The Case of Noh’ In Damodaran A (ed). 2017.Creativity in Films and
Performing Arts: Musings and Critique, CS/IPRC/2/17, IIM Bangalore, p10-14.
● Sekine, Masaru 1985. Ze-Ami and His Theories of Noh Drama, Colin Smythe, Great Britain.
207

● Shekhar, Vibhanshu. 2007.’Revival of Nalanda University Key Players and their Soft Power Diplomacy’,No 48, Institute of Peace and Conflict
Studies, New Delhi, November,
file:///D:/Users/Damodaran%20A/AppData/Local/Microsoft/Windows/Temporary%20Internet%20Files/Content.Outlook/PODQKVRX/IPCS-Spe
cial-Report-48.pdf, accessed on 21 Sep 2020.
● Suzuki, Diasetz, T. 1970. Zen and Japanese Culture, Bollingen Paperback Series, Princeton, USA.
● Takahasi, Matsuo, Morita, Toshiro and Takaoka, Kazuya. 2010. Noh, PIE BOOKS, Tokyo
● https://kanze.net/en/publics/index/36/.
● Tanen, Ted M G .1991. ‘Festivals and Diplomacy’ In Ivan Karp and Steven D Lavine (eds). 1991. Exhibiting Cultures, Smithsonian Institution, USA,
pp 366-372.
● Tanizaki, Jun'ichirō 1977. In Praise of Shadows. New Haven, Conn: Leete's Island Books, New Haven, USA.
● Tsubaki, Andrew. T. 1971. ‘Zeami and the Transition of the Concept of Yūgen: A Note on Japanese Aesthetics’,The Journal of Aesthetics and Art
Criticism, Vol 30(1), Autumn, pp. 55-67.
● Teruhisa, Oshima .2015. ‘Succeeding to the Next Generation’, Cover Story, No 31., https://noh-oshima.com/noh/history/history.html.
● Udaka, Michishige .2010. The Secrets of Noh Masks, Kodansha International, Tokyo.
● Vatsyayan, Kapila. ‘Dance or Movement Techniques of Sanskrit Theatre’ In Baumer, Rachel Van D. and Brandon, James.R.(Eds).1993. Sanskrit
Drama in Performance, Motilal Banarasidass Publishers, Delhi, pp 45-66.
● Venu G.2013. Ramayana Samkshepam, Natana Kairali, Kerala.
● Watson, Michael and Yamanaka, Reiko (Eds).2015. Expressions of the Invisible; A Comparative Study of Noh and other Theatrical Traditions, The
Nogami Memorial Noh Research Institute at Hosei University, Japan.
● Wells, Henry.W..1965. The Classical Drama of the Orient, Asia Publishing House, Delhi.
● Yamaguchi, Masao .1991. ‘The Poetics of Exhibition in Japanese Culture’ In Ivan Karp and Steven D Lavine (eds).1991. Exhibiting Cultures,
Smithsonian Institution, USA, pp57-67.
● Yamanaka, Reiko and Pellachia. Diego (Undated) ‘Performers’. https:// jparc. online/ nogaku/ performance/ performers/., accessed on October
29,2020.
● Yeats, W.B.,1961 "Certain Noble Plays of Japan," in Essays and Introductions, Macmillan, London, p. 221.
● Youngmin Kim.2019. Yeats’s Noh and World Drama: foreign form in tandem with local materials Published online: 17 December 2018 ©
Akadémiai Kiadó, Budapest, Hungary 2018, Neohelicon (2019) 46:81–96 https://doi.org/10.1007/s11059-018-0470-9 1 3., accessed on Sep
9.2020.
List of Figures
● Figure 1 – Noh Funding Under Edo Period
● Figure 2 – Amateur Driven Model of Noh Funding
● Figure 3 – The Model of State Driven Funding for Kutiyattom
List of Tables
● Table A: Systemic Comparison between Noh and Kutiyattam
208
ANNEXURE #16
Mr. G Raghuram
Dedicated Freight Corridor: Current Challenges
Abstract
Indian Railways has been one of the drivers of the fast-growing Indian economy. Dedicated Freight Corridors (DFCs)
were planned along the Golden Quadrilateral rail route to further this growth. In this paper, we examine the current
challenges for the DFC project. The first milestone in the genesis of the DFC was the setting up of the Dedicated
Freight Corridor Corporation of India Ltd. in 2006, with the expected project completion in 2011. After quite some
delay, the Detailed Project Report was completed in 2014. The project is now expected to be completed by the end of
2020. We examine the scope and status of DFCs. We bring out issues like implications of design parameters, traffic
projection assumptions, feeder routes, development of industrial corridors, project timeline, land acquisition, market
access, etc. based on the original scope and current status of the project.
Keywords: Freight; logistics; railways; land acquisition; dedicated freight corridors
1. Introduction
Independence Day in 2018 made a mark in the history of Indian Railways freight movement. The day saw
inauguration of the first stretch of the 3360 kilometer (km) long Dedicated Freight Corridor (DFC). The inaugural
freight train was flagged off from Ateli in Haryana to Phulera in Rajasthan . This, now operational, 190 km stretch is a1
part of the 1504 km long Western Dedicated Freight Corridor (WDFC), that shall run from Dadri in Uttar Pradesh to
Jawaharlal Nehru Port Trust (JNPT), near Mumbai . The Eastern Dedicated Freight Corridor (EDFC), 1856 km long, will2
begin from Ludhiana in Punjab and go till Dankuni, near Kolkata . This paper reviews the status of DFC and the3
challenges for the way forward.
2.Genesis of DFC
Indian Railway network, 67,368 km long, carried 1109.6 million-ton (mt) freight in 2016-17 . The share of Indian4
Railways in carrying freight traffic of the country dropped from 83% in 1950-51 to 31% in 2016-17 . The 10,122 km5
long Golden Quadrilateral, connecting the four metropolitan cities of Delhi, Mumbai, Chennai and Kolkata, along with
its two diagonals (Delhi-Chennai and Mumbai-Kolkata) constitutes 16% of the Indian Railway (IR) network. It carried
52% of the passenger traffic and 58% of the freight traffic. Kolkata- Delhi and Mumbai-Delhi routes were highly
saturated with line capacity utilization varying between 115% to 150% . The Indian economy, growing rapidly, had6
put a great pressure on the existing rail infrastructure.
Indian economy is highly dependent on a few core sectors, namely, coal mining, power, steel, fertilizer, cement
production and petroleum. These, in turn, have a greater dependence on railways. Keeping in line the importance of
railways in supporting these core sectors, a target of 1850 mt freight traffic was envisaged in the Indian Railways
2020 vision document .7
Elasticity of rail demand in India is expected to be 1.2 times the GDP growth. However, in the past it has been limited,
between 0.8 to 1, due to capacity constraints. This need for capacity led to the conception of DFC on the western and
eastern high-density corridors. The project was announced in the Railway Budget for 2005-06. Ministry of Railway
(MoR) appointed Rail India Technical and Economic Services Ltd. (RITES) in July 2005 to conduct a ‘Feasibility study’
and a ‘Preliminary Engineering Cum Traffic Survey (PETS)’ for both the corridors. Government of Japan was requested
to provide technical cooperation in feasibility assessment of the project .8
8 CAG, 2015
7 Saxena, 2012
6 DFCCIL, Background
5 WRI India, 2017
4 Indian Railways, 2017
3 DFCCIL, Eastern Corridor
2 DFCCIL, Western Corridor
1 Bhargava, 2018
209

MoR approached the Cabinet Committee on Economic Affairs (CCEA) for approval based on the RITES Feasibility
Report with an estimated cost of Rs 21,140 crore (cr). CCEA gave ‘In Principle Approval’ for execution of the project in
February 2006 .9
A Special Purpose Vehicle (SPV), “Dedicated Freight Corridor Corporation of India Limited (DFCCIL), to undertake
planning and development, mobilization of financial resources and construction, maintenance and operation of the
dedicated freight corridors was incorporated as a company under the Companies Act 1956, on 30th October 2006†.”
The DFCCIL was set up as a public sector company under the MoR.
After submission of the PETS Report, MoR approached CCEA in February 2007 with an updated cost estimate of Rs
28,181 cr. In November 2007, CCEA gave in-principle approval and directed MoR to undertake preliminary works10
and formulate comprehensive cost estimates and financing plans .11
In consultation with Ministry of Finance (MoF), MoR prepared a financing plan based on the Feasibility Report by
Japan International Cooperation Agency (JICA) and approached CCEA again in 2008 with a cost estimate of Rs 43,293
cr. However, CCEA approved the project at the earlier estimated cost of Rs 28,181 cr .12
During 2010 and 2011, loan agreements with JICA (first tranche) for JPY 90 billion (b) (Rs 5100 cr) for WDFC Phase-I
(Rewari-Vadodara) and World Bank for USD 975 million (m) (Rs 5850 cr) for EDFC Adaptable Program Loan (APL)-1
(Khurja-Bhaupur) were signed respectively. The first contracts were awarded for EDFC APL-1 in January 2013 and for
WDFC Phase-I in June 2013. A loan agreement with JICA (first tranche) for JPY 136 b (Rs 7750 cr) was signed for
WDFC Phase-II (Vadodara-JNPT and Dadri-Rewari) in March 2013. Loan agreements for USD 1100 m for EDFC APL-2
(Bhaupur-Mughalsarai) and USD 650 m for EDFC APL-3 (Ludhiana-Khurja and Dadri-Khurja) were signed in December
2014 and June 2015 respectively . The JICA funding for WDFC was stepped up to Rs 38,722 cr . The total loan from13 14
JICA and the World Bank would provide for Rs 52,347 cr . Phase wise cost estimates are given in Table 1.15
Table 1. Phase wise cost estimates.
DFC Section Kilometres Original Loan Amount Final Loan Amount FinancierCost of the
Project
WDFC
Phase-I Rewari-Vadodara 947 JPY 90 bJPY 550 b
(Rs 38,722 cr)JICA Rs 51,101 crPhase-II Vadodara-JNPT 430
JPY 136 bPhase-II Dadri-Rewari 127
Total WDFC 1504
EDFC
APL-1 Khurja-Bhaupur 343 USD 975 m
USD 2.725 b
(Rs 13,625 cr)World Bank Rs 26,679 cr
APL-2 Bhaupur- Mughalsarai 402 USD 1100 m
APL-3 Ludhiana-Khurja 401USD 650 m
APL-3 Dadri-Khurja 46
Railway Funded Mughalsarai-Sonnagar 126 MoR Rs 3679 cr
Total 1318
PPP Sonnagar- Dankuni 538 Rs 12,218 cr
Total EDFC 1856
Grand Total Rs 52,347Rs 81,459 cr
(excluding PPP)
15 CCEA, 2015
14 DFCCIL, Project Status
13 DFCCIL, Background
12 CAG, 2015
11 CAG, 2015
10 DFCCIL, Background
9 CAG, 2015
210

DFCCIL, Project Funding, Ministry of Railways, 2018 and DFCCIL, Project Phasing
The Mughalsarai-Sonnagar section was to be funded fully by MoR. The 538 km Sonnagar-Dankuni section, added
later, was to be awarded on a Public-Private Partnership (PPP) basis .16
In the meantime, a Concession Agreement (CA) was signed between DFCCIL and MoR in February 2014. The CCEA
approved the revised cost estimates of Rs 81,459 cr in June 2015 . The Debt-Equity ratio for the project was17
originally envisaged at 2:1 but was later made 3:1 .18 19
3. Scope of DFC
The DFCs were launched to:
● “Reduce unit cost of transportation by speeding up freight train operations & higher productivity
● Increase rail share in freight market by providing customized logistic services
● Segregate freight infrastructure for focused approach on both passenger and freight business of Railways
● Create additional rail infrastructure to cater high levels of transport demand
● Introduce of high-end technology & IT packing of Freight Services
● Introduce time tabled freight services & guaranteed transit time‡ ”20
WDFC shall begin from Dadri in Uttar Pradesh and terminate in JNPT in Maharashtra, passing through Haryana,
Rajasthan and Gujarat on the way . The WDFC would have feeder routes serving the large Gujarat ports of Mundra,21
Kandla, Pipavav, Dahej and Hazira. EDFC shall run from Ludhiana in Punjab to Dankuni in West Bengal, passing
through Haryana, Uttar Pradesh, Bihar and Jharkhand . A route from Dadri would join the EDFC at Khurja. The EDFC22
would have feeder routes to different coal mines and thermal power plants.
Out of the 3360 km of the two DFCs, 2959 km would be double track, but for the 401 km Ludhiana-Khurja section .23
The entire DFC would be run on electric traction. Of the 1504 km of WDFC, 1077 km would be adjacent to the IR
network and 427 km as detours . The additional land acquisition requirement for WDFC, primarily driven by the24
detours, would be 6000 hectares (ha) . Of the non-PPP 1318 km of EDFC, 1111 km would be adjacent to the IR25
network and 207 km as detours . The additional land acquisition requirement for EDFC, primarily driven by the26
detours, would be 4601 ha. The PPP portion would require 1118 ha .27
In addition, future DFCs were announced in the Budget of 2016. These included Kolkata-Mumbai (2328 km),
Delhi-Chennai (2327 km), Kharagpur-Vijayawada (1114 km) and Chennai-Goa (892 km) . A map of the consolidated28
DFC is given in Fig. 1.
28 DFCCIL, Corporate Plan
27 DFCCIL, Project Status
26 DFCCIL, Eastern Corridor
25 DFCCIL, Project Status
24 DFCCIL, Western Corridor
23 DFCCIL, Corporate Plan
22 DFCCIL, Eastern Corridor
21 DFCCIL, Western Corridor
20 Objectives are taken as is from DFCCIL. Objectives
19 DFCCIL, Project Status
18 CAG, 2015
17 CAG, 2015
16 DFCCIL, Project Status
211
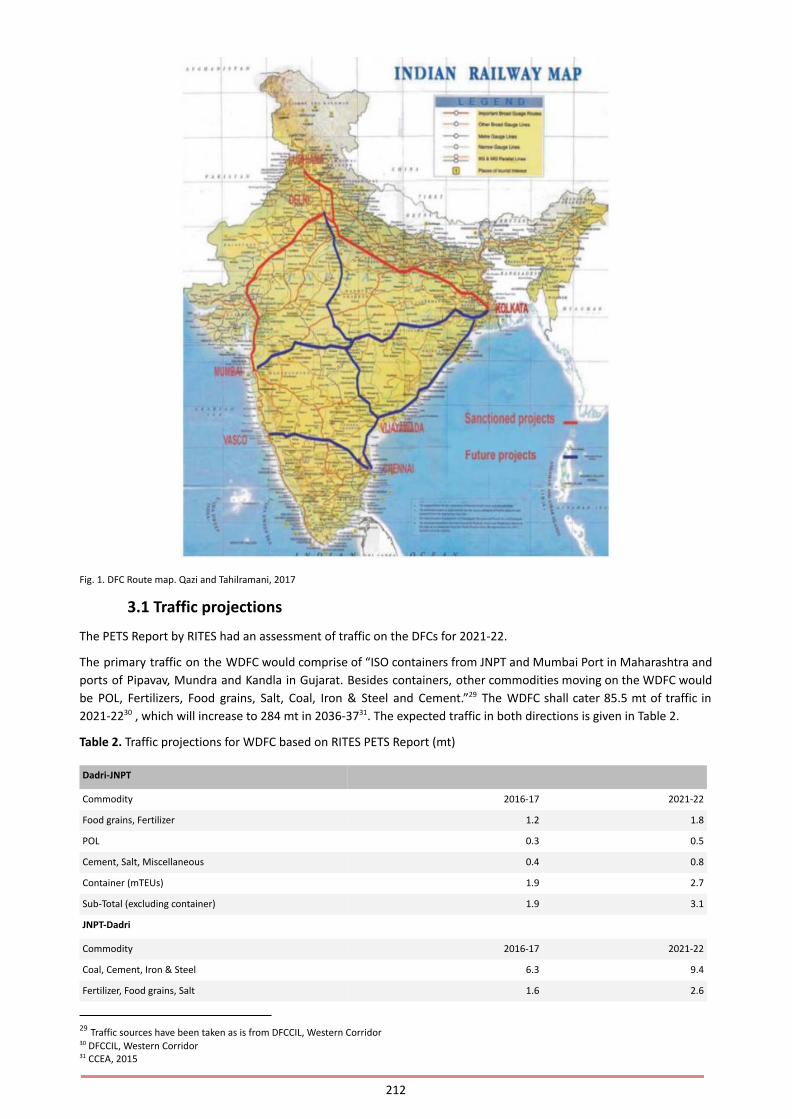
Fig. 1. DFC Route map. Qazi and Tahilramani, 2017
3.1 Traffic projections
The PETS Report by RITES had an assessment of traffic on the DFCs for 2021-22.
The primary traffic on the WDFC would comprise of “ISO containers from JNPT and Mumbai Port in Maharashtra and
ports of Pipavav, Mundra and Kandla in Gujarat. Besides containers, other commodities moving on the WDFC would
be POL, Fertilizers, Food grains, Salt, Coal, Iron & Steel and Cement.” The WDFC shall cater 85.5 mt of traffic in29
2021-22 , which will increase to 284 mt in 2036-37 . The expected traffic in both directions is given in Table 2.30 31
Table 2. Traffic projections for WDFC based on RITES PETS Report (mt)
Dadri-JNPT
Commodity 2016-17 2021-22
Food grains, Fertilizer 1.2 1.8
POL 0.3 0.5
Cement, Salt, Miscellaneous 0.4 0.8
Container (mTEUs) 1.9 2.7
Sub-Total (excluding container) 1.9 3.1
JNPT-Dadri
Commodity 2016-17 2021-22
Coal, Cement, Iron & Steel 6.3 9.4
Fertilizer, Food grains, Salt 1.6 2.6
31 CCEA, 2015
30 DFCCIL, Western Corridor
29 Traffic sources have been taken as is from DFCCIL, Western Corridor
212
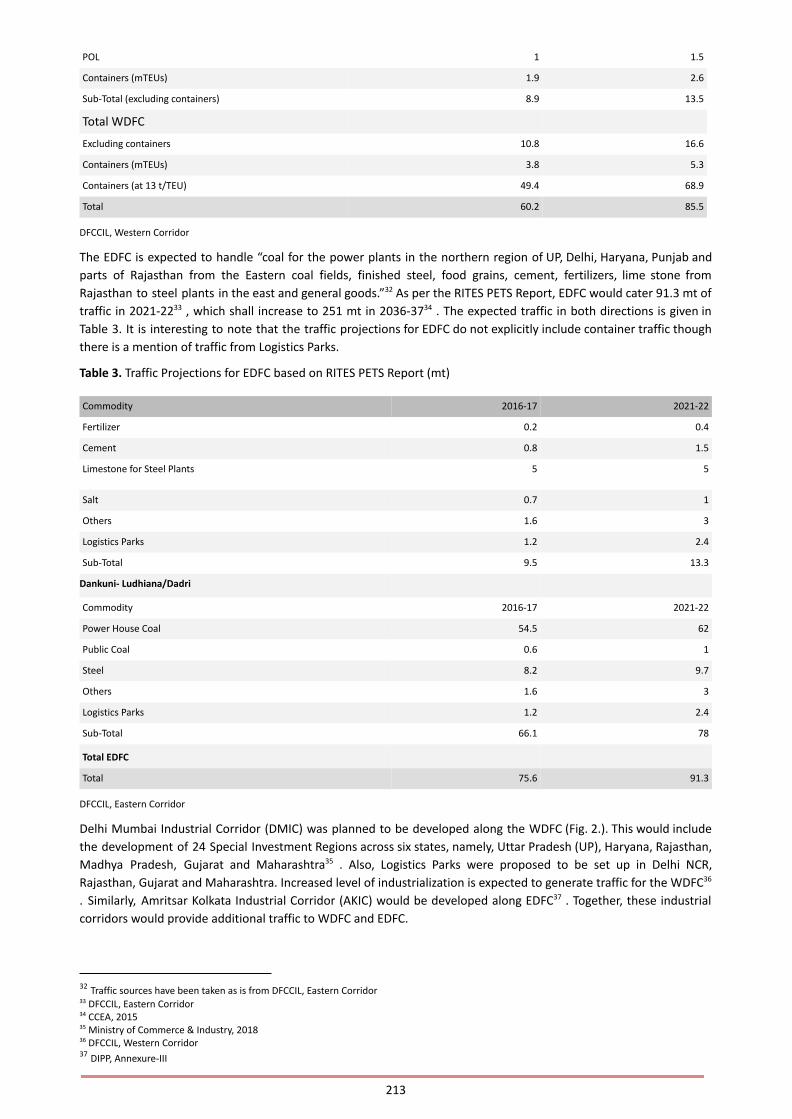
POL 1 1.5
Containers (mTEUs) 1.9 2.6
Sub-Total (excluding containers) 8.9 13.5
Total WDFC
Excluding containers 10.8 16.6
Containers (mTEUs) 3.8 5.3
Containers (at 13 t/TEU) 49.4 68.9
Total 60.2 85.5
DFCCIL, Western Corridor
The EDFC is expected to handle “coal for the power plants in the northern region of UP, Delhi, Haryana, Punjab and
parts of Rajasthan from the Eastern coal fields, finished steel, food grains, cement, fertilizers, lime stone from
Rajasthan to steel plants in the east and general goods.” As per the RITES PETS Report, EDFC would cater 91.3 mt of32
traffic in 2021-22 , which shall increase to 251 mt in 2036-37 . The expected traffic in both directions is given in33 34
Table 3. It is interesting to note that the traffic projections for EDFC do not explicitly include container traffic though
there is a mention of traffic from Logistics Parks.
Table 3. Traffic Projections for EDFC based on RITES PETS Report (mt)
Commodity 2016-17 2021-22
Fertilizer 0.2 0.4
Cement 0.8 1.5
Limestone for Steel Plants 5 5
Salt 0.7 1
Others 1.6 3
Logistics Parks 1.2 2.4
Sub-Total 9.5 13.3
Dankuni- Ludhiana/Dadri
Commodity 2016-17 2021-22
Power House Coal 54.5 62
Public Coal 0.6 1
Steel 8.2 9.7
Others 1.6 3
Logistics Parks 1.2 2.4
Sub-Total 66.1 78
Total EDFC
Total 75.6 91.3
DFCCIL, Eastern Corridor
Delhi Mumbai Industrial Corridor (DMIC) was planned to be developed along the WDFC (Fig. 2.). This would include
the development of 24 Special Investment Regions across six states, namely, Uttar Pradesh (UP), Haryana, Rajasthan,
Madhya Pradesh, Gujarat and Maharashtra . Also, Logistics Parks were proposed to be set up in Delhi NCR,35
Rajasthan, Gujarat and Maharashtra. Increased level of industrialization is expected to generate traffic for the WDFC36
. Similarly, Amritsar Kolkata Industrial Corridor (AKIC) would be developed along EDFC . Together, these industrial37
corridors would provide additional traffic to WDFC and EDFC.
37 DIPP, Annexure-III
36 DFCCIL, Western Corridor
35 Ministry of Commerce & Industry, 2018
34 CCEA, 2015
33 DFCCIL, Eastern Corridor
32 Traffic sources have been taken as is from DFCCIL, Eastern Corridor
213

The traffic projections envisage a modal shift from roads to DFCs. This is expected to reduce the CO2 emission by 457
mt in a period of 30 years .38
Fig. 2. DMIC along WDFC
DIPP, Delhi Mumbai Industrial Corridor
3.1Design Features
In terms of technical design features, DFCs would have significant improvements over the existing railway standards
to help withstand heavier loads and achieve higher speeds. Fig. 3. provides a comparison of the existing design
features and standards on Indian Railways and those proposed for DFCs.
The axle loading which is currently at 22.9 tons universally and 25 tons for a few routes will become 32.5 tons on the
DFCs. However, initially, the axle loading on the DFCs would be 25 tons, since the early rolling stock would only
permit that. Maximum speeds which are currently at 75 kilometer per hour (kmph) would go up to 100 kmph.
38 CCEA, 2015
214
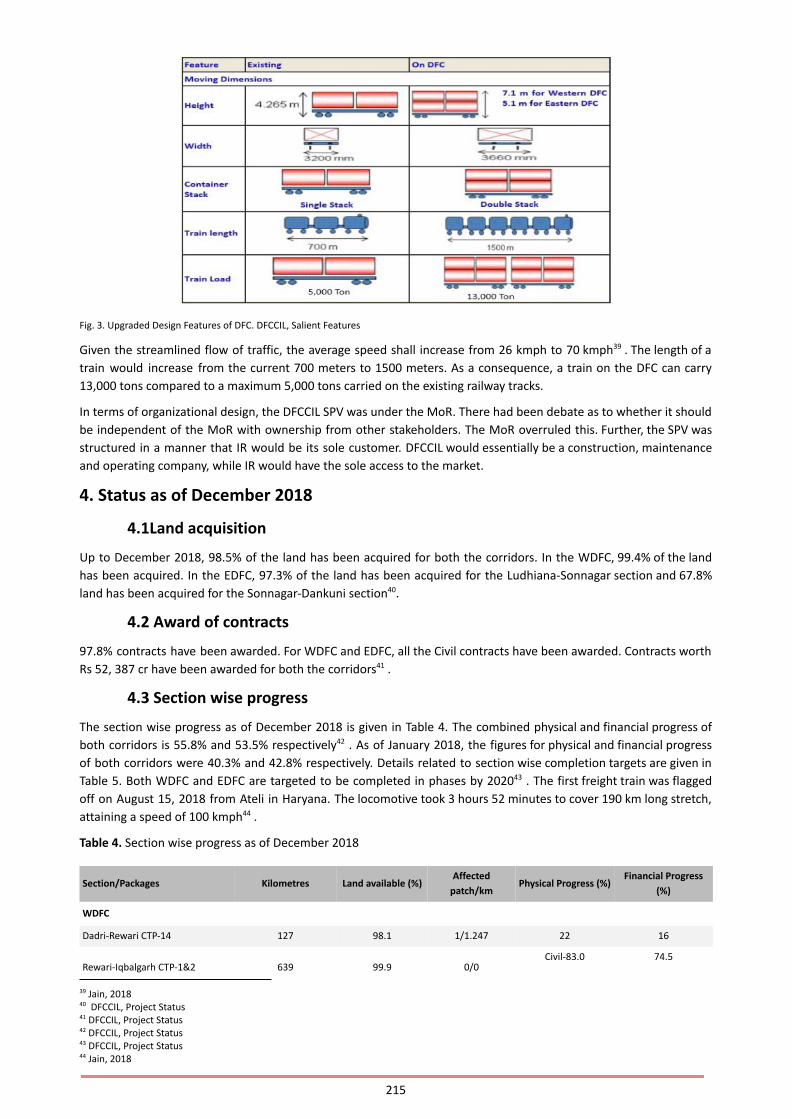
Fig. 3. Upgraded Design Features of DFC. DFCCIL, Salient Features
Given the streamlined flow of traffic, the average speed shall increase from 26 kmph to 70 kmph . The length of a39
train would increase from the current 700 meters to 1500 meters. As a consequence, a train on the DFC can carry
13,000 tons compared to a maximum 5,000 tons carried on the existing railway tracks.
In terms of organizational design, the DFCCIL SPV was under the MoR. There had been debate as to whether it should
be independent of the MoR with ownership from other stakeholders. The MoR overruled this. Further, the SPV was
structured in a manner that IR would be its sole customer. DFCCIL would essentially be a construction, maintenance
and operating company, while IR would have the sole access to the market.
4. Status as of December 2018
4.1Land acquisition
Up to December 2018, 98.5% of the land has been acquired for both the corridors. In the WDFC, 99.4% of the land
has been acquired. In the EDFC, 97.3% of the land has been acquired for the Ludhiana-Sonnagar section and 67.8%
land has been acquired for the Sonnagar-Dankuni section .40
4.2 Award of contracts
97.8% contracts have been awarded. For WDFC and EDFC, all the Civil contracts have been awarded. Contracts worth
Rs 52, 387 cr have been awarded for both the corridors .41
4.3 Section wise progress
The section wise progress as of December 2018 is given in Table 4. The combined physical and financial progress of
both corridors is 55.8% and 53.5% respectively . As of January 2018, the figures for physical and financial progress42
of both corridors were 40.3% and 42.8% respectively. Details related to section wise completion targets are given in
Table 5. Both WDFC and EDFC are targeted to be completed in phases by 2020 . The first freight train was flagged43
off on August 15, 2018 from Ateli in Haryana. The locomotive took 3 hours 52 minutes to cover 190 km long stretch,
attaining a speed of 100 kmph .44
Table 4. Section wise progress as of December 2018
Section/Packages Kilometres Land available (%)Affected
patch/kmPhysical Progress (%)
Financial Progress
(%)
WDFC
Dadri-Rewari CTP-14 127 98.1 1/1.247 22 16
Rewari-Iqbalgarh CTP-1&2 639 99.9 0/0Civil-83.0 74.5
44 Jain, 2018
43 DFCCIL, Project Status
42 DFCCIL, Project Status
41 DFCCIL, Project Status
40 DFCCIL, Project Status
39 Jain, 2018
215
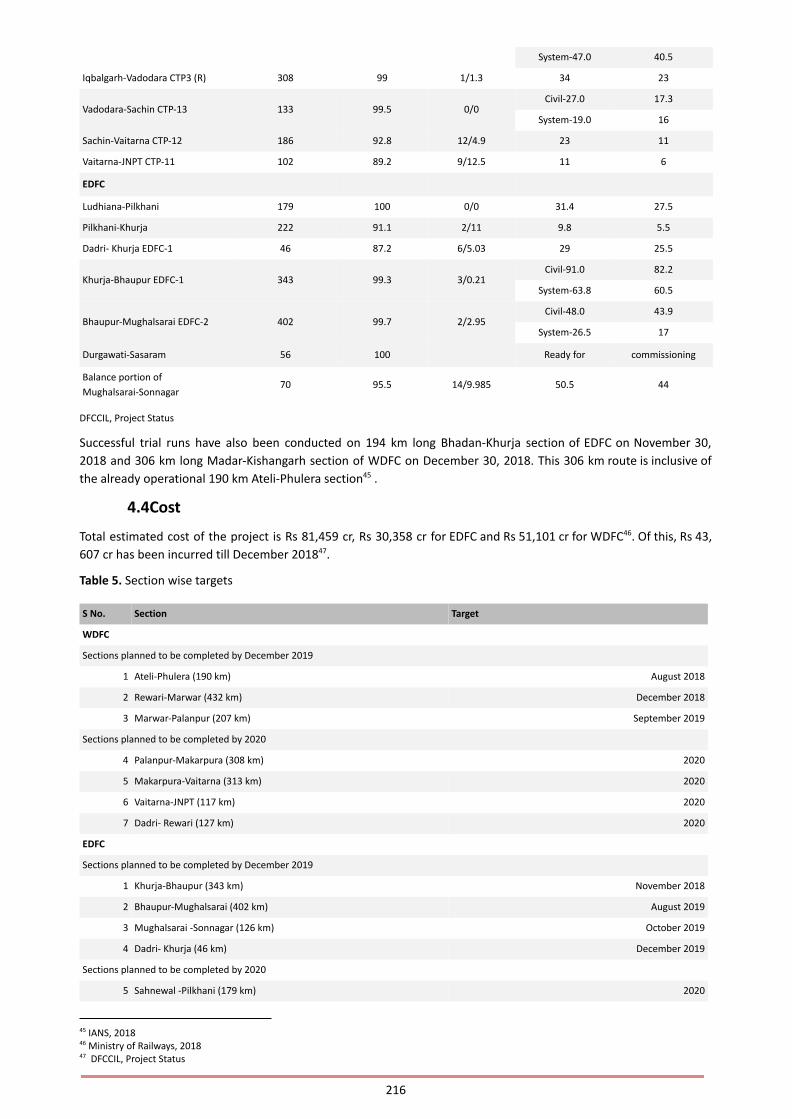
System-47.0 40.5
Iqbalgarh-Vadodara CTP3 (R) 308 99 1/1.3 34 23
Vadodara-Sachin CTP-13 133 99.5 0/0Civil-27.0 17.3
System-19.0 16
Sachin-Vaitarna CTP-12 186 92.8 12/4.9 23 11
Vaitarna-JNPT CTP-11 102 89.2 9/12.5 11 6
EDFC
Ludhiana-Pilkhani 179 100 0/0 31.4 27.5
Pilkhani-Khurja 222 91.1 2/11 9.8 5.5
Dadri- Khurja EDFC-1 46 87.2 6/5.03 29 25.5
Khurja-Bhaupur EDFC-1 343 99.3 3/0.21Civil-91.0 82.2
System-63.8 60.5
Bhaupur-Mughalsarai EDFC-2 402 99.7 2/2.95Civil-48.0 43.9
System-26.5 17
Durgawati-Sasaram 56 100 Ready for commissioning
Balance portion of
Mughalsarai-Sonnagar70 95.5 14/9.985 50.5 44
DFCCIL, Project Status
Successful trial runs have also been conducted on 194 km long Bhadan-Khurja section of EDFC on November 30,
2018 and 306 km long Madar-Kishangarh section of WDFC on December 30, 2018. This 306 km route is inclusive of
the already operational 190 km Ateli-Phulera section .45
4.4Cost
Total estimated cost of the project is Rs 81,459 cr, Rs 30,358 cr for EDFC and Rs 51,101 cr for WDFC . Of this, Rs 43,46
607 cr has been incurred till December 2018 .47
Table 5. Section wise targets
S No. Section Target
WDFC
Sections planned to be completed by December 2019
1 Ateli-Phulera (190 km) August 2018
2 Rewari-Marwar (432 km) December 2018
3 Marwar-Palanpur (207 km) September 2019
Sections planned to be completed by 2020
4 Palanpur-Makarpura (308 km) 2020
5 Makarpura-Vaitarna (313 km) 2020
6 Vaitarna-JNPT (117 km) 2020
7 Dadri- Rewari (127 km) 2020
EDFC
Sections planned to be completed by December 2019
1 Khurja-Bhaupur (343 km) November 2018
2 Bhaupur-Mughalsarai (402 km) August 2019
3 Mughalsarai -Sonnagar (126 km) October 2019
4 Dadri- Khurja (46 km) December 2019
Sections planned to be completed by 2020
5 Sahnewal -Pilkhani (179 km) 2020
47 DFCCIL, Project Status
46 Ministry of Railways, 2018
45 IANS, 2018
216

6 Pilkhani- Khurja (222 km) 2020
DFCCIL, Project Phasing
5. Issues
We examine the challenges of the DFC in two broad categories, with respect to scope and status.
5.1Scope
5.1.1Diesel vs electric traction
WDFC was initially proposed to use a diesel traction system, later it was converted to an electrified traction system
after the JICA study concluded that it was more economical in the long term. However, this increased the cost as
electrified traction system required a larger initial investment .48
5.1.2 Double stack vs single stack
The project has adopted different technical standards for WDFC and EDFC. WDFC would have moving dimensions
made for double stacked containers (7.1 meters). Moving dimensions for EDFC are being made for single stack
container operations (5.1 meters) . This makes seamless movement of double stack trains from WDFC to EDFC49
impossible. Commenting on this, state “This appears to be a very short-sighted policy, since it would be extremely50
difficult to anticipate future traffic flows beyond even ten years. One can also argue that the current hinterland
container flows were more significant from the western sea board, reaching even into UP and Bihar, but it is not a
desirable situation. This was due to bottlenecks in Haldia and Kolkata ports, which would increasingly get released
with new large port projects being conceptualized near the mouth of the river Hooghly. Container traffic from the
eastern seaboard is bound to grow and serve the Northern Indian hinterland. This matter needs to be examined so
that we do not bind ourselves for the future…
… Also, if moving dimension for EDFC permitted double stack container movement, it would have provided two
important flexibilities:
● double stack container trains from the western sea board could have moved seamlessly from the WDFC into
the EDFC, if the destinations are beyond Dadri (being the current terminus of the WDFC and junction with the
EDFC).
● there would have been greater throughput should any low-density bulk cargo move.”
5.1.3 Renewable resources vs coal
With an inclination towards using renewable resources in future, viability of the EDFC could be a concern since the
majority of the traffic was expected to be coal for power plants in northern India from the coal fields in the east.
5.1.4 Double line vs twin single lines on feeder routes
The feeder route from Mundra Port to Palanpur, passing via Gandhidham, is part of the doubling works of the
existing railway line. Though there would be a double line route, only one of them is up to the DFC standard. Hence,
this route cannot be operated as a streamlined double line, but only as two single lines. This may be true on many of
the other feeder routes.
5.1.5 Industrial corridors
The progress for both Logistics Parks and DMIC has been very slow. DMIC was approved in 2007 by the Union
Cabinet. Eleven years after the approval, the DMIC is progressing at a slow pace. AKIC, was to be developed along the
alignment of EDFC, in a band of 150-200 km. It was approved by GoI in 2014 , however, even after four years, the51
progress has been only up to preparing the ‘Perspective Plan’ .52
5.1.6 Ownership of SPV: Timeline
52 DIPP, Annexure-III
51 PTI, 2014
50 Agrawalla and Raghuram, 2013
49 Agrawalla and Raghuram, 2013
48 JICA, 2007
217

Committee on Infrastructure had constituted a Task Force in May 2005. The Task Force was of the view that the SPV
should have a joint ownership between MoR and the “users of bulk freight services like port operators, shipping
companies, commodity-based companies in the oil, coal, iron ore, steel and power sectors, largely in the public
sector.††” It would have ensured an adequate equity base, which could be used to leverage market borrowings to
raise capital for investment in the DFCs. Department of Economics Affairs (DEA) and Planning Commission shared the
same view. However, MoR argued that it was important to put DFCs in place by 2010-11 to maintain an 8 to 8.5 %
growth rate of GDP. It also argued that other PSUs should avoid entering into business activities that were outside
their core competence. In August 2006, formation of DFCCIL was approved by Cabinet (incorporated in October
2006) under the administrative control of MoR. The purpose of formation of SPV under MoR’s control could not
achieve the timelines envisaged . Given the current expected completion by the end of 2020, the project is at least53
9 years delayed.
5.1.7 Ownership of SPV: Land acquisition
†† Users of freight services have been taken as is from54
stated that “It is interesting that the task force did not consider the option of a non-IR owned entity, presumably55
based on the premise that synergy on various dimensions (such as access to the existing network and land
acquisition, construction and operations expertise and market development) could be leveraged only through IR.”
Given the difficulties of land acquisition in India, the fact that 1077 km out of 1504 km of WDFC and 1111 km out of
1318 km of the non-PPP EDFC are adjacent to the existing IR network has been a positive for DFCCIL.
5.1.8 Market access
IR being the sole customer of DFCCIL, all other freight customers/qualified operators would be routed though IR. IR
would be paying DFCCIL Track Access Charges (TAC) starting from 2020-21, whether it utilizes the path or not.
Consequently, there is no revenue risk for DFCCIL, which could have a bearing on their service levels .56
5.1.9 Cost
Initially the Debt-Equity Ratio for the project was envisaged to be 2:1. However, now it is 3:1. When cost estimates
were revised to 81,459 cr, the liability of IR towards equity increased to 27,153 cr from Rs 9,393 cr .57
5.1.10 Funding and cost of procurement
Commenting on the funding of the WDFC, state, “The conditions of JICA loan for WDFC (constituting 80% of WDFC58
costs) required that 30% of the JICA funding be used for import of equipment and goods from Japan and that all
contracts for WDFC must have a Japanese firm as the lead partner. Assuming equipment cost is 40% of the project
cost, over 60% of the equipment and goods may have to be sourced from Japan which would significantly narrow the
scope of competition. Further, the restriction that only a Japanese firm can be a lead partner in works contracts also
reduced competition in procurement of works. The obvious consequence is that procurement may not be at the least
possible cost.”
5.2Status
5.2.1Project target
The project, which was conceptualized and given a final go ahead with the setting up of DFCCIL in 2006, was
expected to be completed by 2011. The final location survey/Detailed Project Report (DPR) and freezing of alignment
was done in 2014, eight years after getting the ‘In Principle Approval’ . The target completion was first shifted to59
2016-17, then again to 2017-18 and now to 2020.60
5.2.2Planning and execution
60 PTI, 2018
59 CAG, 2015
58 Agarwalla and Raghuram, 2013
57 CAG, 2015
56 Kumar, 2018
55 Agarwalla and Raghuram, 2013
54 Agarwalla and Raghuram, 2013
53 CAG, 2015
218

Planning has been an issue since the conception of the project.
MoR approached CCEA with an estimated cost of Rs 21,140 cr based solely on the Feasibility Report by RITES. They
approached CCEA in November 2007 with revised figures of Rs 28,181 cr based on PETS Report by RITES. They again
approached CCEA in February 2008 with a cost estimate of Rs 43,293 cr based on Feasibilty Report by JICA. It took
MoR another six years (February 2008 to March 2014) to finalize the DPR and cost estimates. Based on the DPR, the
project cost was put at Rs 81,459 cr excluding the PPP portion. Approaching CCEA without credible estimates and a
sound financing plan was a premature move. Further, MoR approached CCEA with cost estimates based on JICA
Feasibility Report without firming up a financing plan for EDFC or a CA between MoR and SPV. The latter was finalized
in 2014 .61
MoR did not give due weightage to the timeline for completion of the project. This is evident from the fact that in all
Cabinet Notes, MoR mentioned the completion period to be five years, without specifying the ‘zero’ date for
commencement of the same .62
5.2.3 Land acquisition
As of December 2018, DFCCIL has acquired 98.5% of the required land. Though only 1.5% remains (presumably due
to difficulties in land acquisition), these have higher number of affected patches per kilometer. It can pose a problem
in construction of the DFC and can further delay the timeline for completion of the project. The details of affected
patch per kilometer is given in Table 4. For instance, In the Sachin-Vaitarna section in WDFC, there are twelve
affected land patches in 4.9 km. Similarly, in Dadri-Khurja EDFC-1 section, there are six affected land patches in 5.03
km. The number of affected land patches per kilometer is higher in EDFC.
5.2.4 Traffic projection
For the year 2021-22, the PETS Report by RITES projected a traffic of 85.5 mt for WDFC and 91.3 mt for EDFC. For the
year 2021-22, the DFCCIL Corporate Plan projected a traffic of 167.1 mt for WDFC and 219.6 mt for EDFC for WDFC is
167.1 mt for 2021-22. Traffic projections based on DFCCIL Corporate Plan 2017-22 are given in Table 6 and Table 7.
The figures are more optimistic in the Corporate Plan for all the commodities. The maximum increase in the
projection has been for the coal movement. The traffic projected for coal in the RITES PETS Report for EDFC was 62.9
mt, while it has increased to 119.5 mt in the Corporate Plan. The RITES Report did not consider the container traffic
for EDFC. However, as per the Corporate Plan, there would be container traffic of 8.5 mt.
Table 6: Traffic projections for WDFC based on DFCCIL Corporate Plan 2017-22 (mt)
Commodity 2018 2019 2020 2021 2022
Container 45.6 49.8 54.3 59.2 64.6
Coal 21.5 22.4 23.3 24.2 25.2
Food grains 8.1 8.4 8.6 8.8 9.1
Fertilizer 11.5 11.9 12.4 12.9 13.4
Cement 6.3 6.8 7.3 7.9 8.5
Steel 1.6 1.7 1.9 2 2.2
POL 6.7 6.9 7 7.2 7.3
MISC 6.6 6.8 7 7.2 7.4
Total 108 114.6 121.8 129.4 137.7
Modal shift from Road 12.7 13.3 14 14.7 15.4
DMIC Traffic 4.6 6.1 8 10.6 14
Grand Total 125.3 134.1 143.8 154.8 167.1
CAGR (%) 11.2 11.4 11.7 12 7.5
Table 7: Traffic projections for EDFC based on DFCCIL Corporate Plan 2017-22 (mt)
Commodity 2018 2019 2020 2021 2022
62 CAG, 2015
61 CAG, 2015
219

Container 6.2 6.7 7.2 7.8 8.5
Coal 102.2 106.2 110.5 114.9 119.5
Food grains 13.8 14.2 14.6 15 15.4
Fertilizer 5.2 5.4 5.6 5.9 6.1
Cement 9.3 10 10.8 11.7 12.6
Steel 11.8 12.7 13.7 14.8 15.9
POL 4.1 4.1 4.2 4.3 4.4
MISC 21.3 21.9 22.6 23.3 24
Total 173.8 181.3 189.3 197.6 206.3
Modal shift from
Road
10.9 11.4 12 12.6 13.2
AKIC Traffic 0 0 0 0 0
Grand Total 184.6 192.8 201.3 210.2 219.6
CAGR (%) 6.5 6.3 6.2 6.1 4.4
DFCCIL, Corporate Plan
Conclusion
DFCs present a significant opportunity for freight logistics in India. What is important is to see how the increasingly63
optimistic traffic projections will be realized. That depends upon the industrial and trade growth in India, and the
development of industrial corridors and the feeder network. In order to leverage the full efficiency of the DFC, we will
also need rolling stock that can take advantage of the increased axle loading capability. On the EDFC, the dependence
on coal traffic would be a concern since there could be disruptive changes on the sources of energy in the long run.
Further, the prospect of increasing container traffic could be affected adversely since the EDFC would permit single
stacking only. Another important concern would be the sole intermediary role played by the Indian Railways, which
has to bring in the end users. Indian Railways has not always been known for its customer centricity.
Overall, the DFCs have the potential to be a game changer for the Indian economy.
References
● Agarwalla, SK., Raghuram, G., 2013. Structuring the Dedicated Freight Corridor Project - A Critique. In: in Selected Proceedings of the 13th
World Conference on Transport Research (WCTR), Rio de Janeiro, Brazil.
● Bhargava, Yuthika., 2018. Ateli enters history on a freight train. The Hindu. Available at: https://www.thehindu.com/news/national/ateli-enters-
history-on-a-freight-train/article24861766.ece
● CAG, 2015. CHAPTER 3 - Dedicated Freight Corridor Projects. Report No. 48 of 2015-Union Railways. Available at:
https://saiindia.gov.in/sites/default/files/audit_report_files/Union_Performance_Railways_Status_Work_Report_48_2015.pdf
● CCEA, 2015. Approval of Revised Cost Estimate (RCE) of Eastern and Western Dedicated Freight Corridor Project. Press Information Bureau.
● Available at: http://pib.nic.in/newsite/PrintRelease.aspx?relid=122746
● DFCCIL, Background. Dedicated Freight Corridor Corporation of India Ltd. Available at: http://dfccil.gov.in/dfccil_app/Background, accessed on
accessed on October 21, 2018
● DFCCIL, Corporate Plan. Dedicated Freight Corridor Corporation of India Ltd. Available at: http://dfccil.gov.in/upload/CP_17_22 accessed on
October 21, 2018. Jan_18.pdf
● DFCCIL, Eastern Corridor. Dedicated Freight Corridor Corporation of India Ltd. Available at: http://dfccil.gov.in/dfccil_app/Eastern_Corridor
accessed on October 21, 2018
● DFCCIL, Home. Dedicated Freight Corridor Corporation of India Ltd. Available at: http://dfccil.gov.in/dfccil_app/Home, accessed on Oct 21, 2018
● DFCCIL, Objectives. Dedicated Freight Corridor Corporation of India Ltd. Available at: http://dfccil.gov.in/dfccil_app/Objectives accessed on
October 21, 2018
● DFCCIL, Project Funding. Dedicated Freight Corridor Corporation of India Ltd. Available at: http://dfccil.gov.in/dfccil_app/Project_Funding,
accessed on October 21, 2018
● DFCCIL, Project Phasing. Dedicated Freight Corridor Corporation of India Ltd. Available at: http://dfccil.gov.in/dfccil_app/Project_Phasing
accessed on October 21, 2018
● DFCCIL, Project Status. Dedicated Freight Corridor Corporation of India Ltd. Available at: http://dfccil.gov.in/dfccil_app/Project_Status accessed
● on April 21, 2019
● DFCCIL, Salient Features. Dedicated Freight Corridor Corporation of India Ltd. Available at: http://dfccil.gov.in/dfccil_app/Salient_features
accessed on October 21, 2018
● DFCCIL, Western Corridor. Dedicated Freight Corridor Corporation of India Ltd. Available at: http://dfccil.gov.in/dfccil_app/Western_Corridor
● accessed on October 21, 2018
63 † Definition of DFCCIL is taken as is from DFCCIL, Home
220

● DIPP, Annexure-III. Other Industrial Corridor Projects. Department of Industrial Policy and Promotion. Available at:
http://dipp.nic.in/sites/default/files/ic-annex3.pdf accessed on October 21, 2018
● DIPP, Delhi Mumbai Industrial Corridor (DMIC). Department of Industrial Policy and Promotion. Available at: http://dipp.nic.in/japan-plus/delhi-
mumbai-industrial-corridor-dmic accessed on October 21, 2018
● IANS., 2018. Railways completes 306 km of western dedicated freight corridor. The Economics Times. Available at:
https://economictimes.indiatimes.com/industry/transportation/railways/railways-completes-306-km-of-western-dedicated-freight-
corridor/articleshow/67313648.cms?from=mdr
● Indian Railways, 2017. Indian Railways Yearbook 2016-17. Available at:
http://www.indianrailways.gov.in/railwayboard/uploads/directorate/stat_econ/IRSP_2016-17/Facts_Figure/Year%20Book_2018_Eng.pdf
● Jain, Smriti., 2018. Why the locomotive trial at 100 kmph on western DFC is a significant step for Indian Railways. Financial Express. Available at:
https://www.financialexpress.com/infrastructure/railways/why-the-locomotive-trial-at-100-kmph-on-western-dfc-is-a-significant-step-for-
indian-railways/1116200/
● JICA, 2007. The Feasibility Study on the Development of Dedicated Multimodal High Axle Load Freight Corridor with Computerized Control for
Delhi-Mumbai and Delhi-Howrah in India Draft Final Report. JICA. Available at:
https://www.jica.go.jp/english/our_work/social_environmental/archive/pro_asia/pdf/india04_05.pdf
● Kumar, Saurabh., 2018. Track access charges: Indian Railways set to pay around Rs 10k crore for dedicated freight corridors starting 2020-21.
Financial Express. Available at: https://www.financialexpress.com/infrastructure/railways/track-access-charges-indian-railways-set-to-pay-
around-rs-10k-crore-for-dedicated-freight-corridors-starting-2020-21/1283267/
● Ministry of Commerce & Industry, 2018. Dedicated Freight Corridors in Railways. Press Information Bureau. Available at:
http://pib.nic.in/newsite/PrintRelease.aspx?relid=153692
● Ministry of Railways, 2018. Dedicated Freight Corridors in Railways. Press Information Bureau. Available at:
http://pib.nic.in/newsite/PrintRelease.aspx?relid=181043
● PTI., 2014. Cabinet approves Amritsar-Kolkata Industrial Corridor project. The Economics Times. Available
at: https://economictimes.indiatimes.com/news/economy/infrastructure/cabinet-approves-amritsar-kolkata-industrial-corridor-
project/articleshow/29123462.cms
● PTI., 2018. Missing several deadlines, Railways' freight corridor project sets new target. The Economics Times. Available at:
https://economictimes.indiatimes.com/industry/transportation/railways/missing-several-deadlines-railways-freight-corridor-project-sets-new-
target/articleshow/64026809.cms
● Qazi, PA., Tahilramani, Rita., 2017. Indian Railways: Re-birth of Colossus. Edelweiss Research.
Available at: https://www.edelresearch.com/showreportpdf-35319/RAILWAYS_-_SECTOR_REPORT-JAN-17-EDEL
● Saxena AK., 2012. Building Corridors - Fuelling Growth - DFC Carrying India to New Height. Press Information Bureau. Available at:
http://pib.nic.in/newsite/mbErel.aspx?relid=86222
● WRI India, 2017. Freight Transport: Modal Choice & GHG Emissions. Indian Railways. Available
at: http://www.indianrailways.gov.in/railwayboard/uploads/directorate/traffic_comm/Rates-
Letters/2017/5_%20Chirag_Freight%20Transport%20Modal%20Choice%20%26%20GHG%20Emissions%20v1_0%20CG.PDF
221

ANNEXURE #17
Ms. Naoko Yamazaki
Space 4DGs; What can Space Science and Technology teach usabout sustainability?
Space traveler, author, policy-driver, and mentor, whose passion for space and commitment towards sustainability
makes her a key figure in science and society, Naoko Yamazaki began her space odyssey as a little girl with stars in her
eyes and 2 decades later, she is an inspiring leader and a model of perseverance. Since retiring from JAXA, she has
dedicated herself to further causes with a focus on sustainability, space education and research, and exploring
commercial space travel.
Yamazaki San enters the session with the fabulous earth-view from the ISS Cupola as her background, one of her
favorite views from space, she reveals. She puts a smile on the Indian audiences’ faces by congratulating the success
of Mission Mangal and excitedly telling us how much she enjoyed the Indian movie of the same name. She also
expresses her anticipation for the upcoming joint lunar exploration of India and Japan.
Taking us through her journey, she starts from her childhood in Hokkaido, Northern Japan, reminiscing about the
clear skies which inspired her love for the stars and outer space. She was convinced of her chances of going to space
when she witnessed Japanese astronauts in space in 1981 and decided to study aerospace engineering. She applied
to be an astronaut twice, once as a graduate, and later as an engineer in JAXA, which was followed by training which
spanned a period of 11 years and covered several countries and survival exercises including freezing temperatures
and underwater locations. Ironically, her batch was nicknamed “The Peacocks”, birds with a beautiful but flightless
plumage, as part of an interesting tradition where training batches were named after flightless birds such as penguins
to wish them luck that the reverse would come true.
She talks about the training's focus on team building, leadership, and situational awareness and shares a few exciting
moments such as micro gravity simulation, and the mission poster, similar in fashion to the movie Armageddon. The
actual mission was to deliver an Italian logistics module called Leonardo to the ISS and Yamazaki San operated the
robotic arm to carry out the process. The inside of the discovery space shuttle used in the mission was designed in
the 1980’s and looked intensely complicated, but Yamazaki San points out that a sleek and modern “Dragon” shuttle
designed by Space X is already in use now. Talking about resupply and delivery missions, Yamazaki San explains that
the ISS was constructed over 13 years, requiring many parts to be assembled, along with periodic repairs and
maintenance.
Inside the space station, Yamazaki San plants her feet on the floor and Noguchi San hangs from the ceiling, but in
space, there is no up or down, each person has their own axis, and has to understand the other’s axis too, a
refreshing concept worth bringing back to Earth.
Life in space is all about hyper organization and little glamour, the numerous articles in the craft are barcoded and
constantly checked on, the passengers do not have a minute to spare, and there are micro spaces for meals that are
had mostly at separate times. However, the fellow travelers still dined together, played some music, and conducted
fun microgravity experiments during their time off. An interesting discovery made during some experiments was the
lengthened life span of microbes in space, also reminding us of the need to be cautious of bio-contamination in
space. Another aspect of space life is the effect of the altered environment on muscles and bone density, the former
decreasing by 1% by the day and the latter decreasing by 1.5% every month, making a 2-hour workout mandatory.
Back on Earth, Yamazaki San recalls feeling the weight of gravity, and the freshness of the breeze, and the longing she
had felt for space was overwhelmed with admiration for the Earth.
Strong partnerships on Earth will extend human frontiers in Space. Talking about the history of space collaboration,
Yamazaki San comments on the united efforts of countries like Russia and the U.S even during times of conflict, and
the ISS project which will continue until 2024. She also speaks about the Artemis project, an initiative for a lunar
gateway, a human outpost to the moon and eventually to Mars, for which NASA has collaborated with Canada, Japan,
and several European agencies, with a potential for more nations to get on board.
222
While on the subject of expanding frontiers, she explains that there is a need to develop sustainable technology in
space and talks about how the ISS is a testing ground. Presently, water (including urine and sweat) and atmosphere
are recycled, but the levels are only at 60%. While energy is solar generated, we would have to consider alternatives
for long journeys. Food is completely relayed from the ground at present, though it might not be long before the
experiments with space grown food yield results. 3D printers are in use and could be considered for food generation
too. On ground efforts include space 4DGs, a UN study collaboration for which Japan cooperates by deploying small
satellites for observations. Alternatively, the discovery of water on the polar regions of Mars and other moons, and
billions of dollars’ worth of metal on asteroids have encouraged several probes and space mining.
If survival means conservation in space, the Earth is no different. Our planet is breath-taking, but the atmosphere is
fragile, a mere 3% of available water is shared amongst 7.7 Billion people. Yamazaki San stresses that we consider our
planet as a space-ship Earth.
She concludes that to go farther, go together. The sun is resplendent, but during night on earth, the influence of
mankind can be seen from space, reminding us together we can accomplish much more, to conserve, sustain, and
explore.
Yamazaki San proceeds to answer the piling questions from the audience on space exploration, innovation, research,
education, and policy.
Offering her views on the longstanding debate of whether space exploration is really worth the steep expenses and
resources for mankind, she suggests that the possibilities presented by space exploration are boundless, the prospect
of discovering resources and habitats for the future, studying the universe, fueling innovation, and gathering inputs
to preserve our planet. Extending the thought to mining asteroids for rare metals and plans to inhabit life sustaining
planets, she expresses that exploring possibilities would pave the way for finding solutions to environmental and
societal problems on earth. However, she agrees that we must proceed with wisdom, keeping in mind that needs are
endless, and all resources are limited. She suggests that we could learn about changing atmospheres from other once
inhabitable planets and develop a sustainable attitude both on Earth and in space.
Welcoming questions on opportunities for innovation in space technology, she speaks about the increasing demand
for heat resistant ceramics, and reusable space equipment, citing Tesla’s completely reusable starship, and constant
experimentation with alloys in the Japanese startup ecosystem. Moving on to innovation in Artificial Intelligence, she
says the present spacecraft monitoring and controlling systems work with a 50/50 mechanism between manual and
automation mode. However, constant attempts are being made to accommodate mistakes and prepare for high-risk
situations, where AI may play a significant role. She also suggests that as projects involving long-term space travel
increase, the dependence on AI would grow.
Addressing questions about her involvement in commercial space travel and collaboration, Yamazaki San elaborates
on the goals of Space Port Japan, of building an Asia wide space network, launching satellites for independent
studies, and gathering data about the water bearing south pole of the moon, to execute manned missions to the
moon. She speaks about how international collaboration will empower countries in their exploration and promote
equal opportunity in space.
Delving into the details of the challenges of space travel, she answers concerns of biological contamination in space
and explains that there are several guidelines about releasing life in space and bringing back extra-terrestrial samples
to earth, with an emphasis on rules for potentially life supporting planets such as Mars. Answering questions on the
effects of space travel on the human body, she explains that while adjusting to micro gravity is easy, readjusting
muscles and bones to gravity is challenging, and longer the stay in space, longer the recovery time, although
experiments to create artificial gravity are in progress. She also reveals that astronauts undergo some permanent
changes to vision, and the cause is yet to be discovered. There has been an increase in space debris and possibility of
collisions over the years, but monitoring systems are in place which can help maneuver space shuttles, and new ways
to deal with emergencies are always being thought of.
Yamazaki San shares her ways to cope with the psychological challenges in space such as isolation and boredom, she
sticks to a well-formed routine, communicates with crew, friends, and family, and indulges in tea breaks as needed.
She reminds us that carrying gratitude for the support on ground is a big motivator.
Today, engineers, doctors, and journalists have been to space but looking ahead, opportunities may arise for lawyers
or anthropologists and even space tourists. Yamazaki San hopes that soon a day will come where an artist can create
a masterpiece, inspired by the wonders of space.
223


![[Product Monograph Template - Standard]](https://static.fdokumen.com/doc/165x107/6335db358502b620dc09022b/product-monograph-template-standard.jpg)