Functional MRI BOLD response to Tower of London performance of first-episode schizophrenia patients...
11
Functional MRI BOLD response to Tower of London performance of first-episode schizophrenia patients using cortical pattern matching Paul E. Rasser, a,b,c Patrick Johnston, a,b Jim Lagopoulos, a,c Philip B. Ward, a,c, * Ulrich Schall, a,b Renate Thienel, a,d Stefan Bender, a,d Arthur W. Toga, e and Paul M. Thompson a,e a Neuroscience Institute of Schizophrenia and Allied Disorders (NISAD), Australia b Centre for Mental Health Studies, University of Newcastle and Hunter Medical Research Institute (HMRI), Australia c School of Psychiatry, University of New South Wales, Australia d Clinic for Psychiatry and Psychotherapy, University of Duisburg-Essen, Germany e Laboratory of Neuro Imaging, Department of Neurology, UCLA School of Medicine, Los Angeles, CA 90024, USA Received 8 December 2003; revised 10 November 2004; accepted 29 November 2004 Available online 15 April 2005 Due to its three-dimensional folding pattern, the human neocortex poses a challenge for accurate co-registration of grouped functional brain imaging data. The present study addressed this problem by employing three-dimensional continuum-mechanical image-warping techniques to derive average anatomical representations for co- registration of functional magnetic resonance brain imaging data obtained from 10 male first-episode schizophrenia patients and 10 age- matched male healthy volunteers while they performed a version of the Tower of London task. This novel technique produced an equivalent representation of blood oxygenation level dependent (BOLD) response across hemispheres, cortical regions, and groups, respectively, when compared to intensity average co-registration, using a deformable Brodmann area atlas as anatomical reference. Somewhat closer association of Brodmann area boundaries with primary visual and auditory areas was evident using the gyral pattern average model. Statistically-thresholded BOLD cluster data confirmed predominantly bilateral prefrontal and parietal, right frontal and dorsolateral prefrontal, and left occipital activation in healthy subjects, while patients’ hemispheric dominance pattern was diminished or reversed, particularly decreasing cortical BOLD response with increasing task difficulty in the right superior temporal gyrus. Reduced regional gray matter thickness correlated with reduced left-hemispheric prefrontal/ frontal and bilateral parietal BOLD activation in patients. This is the first study demonstrating that reduction of regional gray matter in first-episode schizophrenia patients is associated with impaired brain function when performing the Tower of London task, and supports previous findings of impaired executive attention and working memory in schizophrenia. D 2005 Published by Elsevier Inc. Keywords: Structural magnetic resonance imaging; Functional magnetic resonance imaging; Cortex; Deformable Brodmann area atlas; Three- dimensional continuum-mechanical image-warping; Cortical pattern matching; First-episode schizophrenia; Tower of London; Planning; Executive attention; Working memory Introduction Functional brain imaging techniques, such as functional magnetic resonance imaging (fMRI) and positron emission tomography (PET), provide detailed spatial information about brain activation. This information is increasingly used to generate maps of normal brain function as a reference for abnormal brain function in various neuropsychiatric conditions. While co-registration of changes in blood oxygenation levels or blood flow rates onto structural MRI scans of individual brains can be achieved with high levels of accuracy, grouping these data for quantitative comparisons (e.g., between diagnostic groups) poses a major methodological challenge due to the inter-individual variability of regional brain morphology (Brett et al., 2002). Some cortical areas, however, such as the primary motor, visual, and auditory cortex, are defined by their relationship to distinct anatomical landmarks such as central and calcarine sulci and Heschl’s gyrus which are relatively invariant in position and configuration across individuals (Rademacher et al., 1993), while other areas, such as the prefrontal cortex, are highly variable across subjects thus making it difficult to choose mean- ingful anatomical labels (Rajkowska and Goldman-Rakic, 1995). For these regions of the neocortex, there is also little agreement on 1053-8119/$ - see front matter D 2005 Published by Elsevier Inc. doi:10.1016/j.neuroimage.2004.11.054 * Corresponding author. Schizophrenia Research Unit, Don Everett Building, Liverpool Hospital, Locked Bag 7103, Liverpool BC 1871, Australia. Fax: +61 2 9828 6181. E-mail address: [email protected] (P.B. Ward). Available online on ScienceDirect (www.sciencedirect.com). www.elsevier.com/locate/ynimg NeuroImage 26 (2005) 941 – 951
Transcript of Functional MRI BOLD response to Tower of London performance of first-episode schizophrenia patients...

www.elsevier.com/locate/ynimg
NeuroImage 26 (2005) 941 – 951
Functional MRI BOLD response to Tower of London performance of
first-episode schizophrenia patients using cortical pattern matching
Paul E. Rasser,a,b,c Patrick Johnston,a,b Jim Lagopoulos,a,c Philip B. Ward,a,c,* Ulrich Schall,a,b
Renate Thienel,a,d Stefan Bender,a,d Arthur W. Toga,e and Paul M. Thompsona,e
aNeuroscience Institute of Schizophrenia and Allied Disorders (NISAD), AustraliabCentre for Mental Health Studies, University of Newcastle and Hunter Medical Research Institute (HMRI), AustraliacSchool of Psychiatry, University of New South Wales, AustraliadClinic for Psychiatry and Psychotherapy, University of Duisburg-Essen, GermanyeLaboratory of Neuro Imaging, Department of Neurology, UCLA School of Medicine, Los Angeles, CA 90024, USA
Received 8 December 2003; revised 10 November 2004; accepted 29 November 2004
Available online 15 April 2005
Due to its three-dimensional folding pattern, the human neocortex
poses a challenge for accurate co-registration of grouped functional
brain imaging data. The present study addressed this problem by
employing three-dimensional continuum-mechanical image-warping
techniques to derive average anatomical representations for co-
registration of functional magnetic resonance brain imaging data
obtained from 10 male first-episode schizophrenia patients and 10 age-
matched male healthy volunteers while they performed a version of the
Tower of London task. This novel technique produced an equivalent
representation of blood oxygenation level dependent (BOLD) response
across hemispheres, cortical regions, and groups, respectively, when
compared to intensity average co-registration, using a deformable
Brodmann area atlas as anatomical reference. Somewhat closer
association of Brodmann area boundaries with primary visual and
auditory areas was evident using the gyral pattern average model.
Statistically-thresholded BOLD cluster data confirmed predominantly
bilateral prefrontal and parietal, right frontal and dorsolateral
prefrontal, and left occipital activation in healthy subjects, while
patients’ hemispheric dominance pattern was diminished or reversed,
particularly decreasing cortical BOLD response with increasing task
difficulty in the right superior temporal gyrus. Reduced regional gray
matter thickness correlated with reduced left-hemispheric prefrontal/
frontal and bilateral parietal BOLD activation in patients. This is the
first study demonstrating that reduction of regional gray matter in
first-episode schizophrenia patients is associated with impaired brain
function when performing the Tower of London task, and supports
1053-8119/$ - see front matter D 2005 Published by Elsevier Inc.
doi:10.1016/j.neuroimage.2004.11.054
* Corresponding author. Schizophrenia Research Unit, Don Everett
Building, Liverpool Hospital, Locked Bag 7103, Liverpool BC 1871,
Australia. Fax: +61 2 9828 6181.
E-mail address: [email protected] (P.B. Ward).
Available online on ScienceDirect (www.sciencedirect.com).
previous findings of impaired executive attention and working memory
in schizophrenia.
D 2005 Published by Elsevier Inc.
Keywords: Structural magnetic resonance imaging; Functional magnetic
resonance imaging; Cortex; Deformable Brodmann area atlas; Three-
dimensional continuum-mechanical image-warping; Cortical pattern
matching; First-episode schizophrenia; Tower of London; Planning;
Executive attention; Working memory
Introduction
Functional brain imaging techniques, such as functional
magnetic resonance imaging (fMRI) and positron emission
tomography (PET), provide detailed spatial information about brain
activation. This information is increasingly used to generate maps
of normal brain function as a reference for abnormal brain function
in various neuropsychiatric conditions. While co-registration of
changes in blood oxygenation levels or blood flow rates onto
structural MRI scans of individual brains can be achieved with high
levels of accuracy, grouping these data for quantitative comparisons
(e.g., between diagnostic groups) poses a major methodological
challenge due to the inter-individual variability of regional brain
morphology (Brett et al., 2002). Some cortical areas, however, such
as the primary motor, visual, and auditory cortex, are defined by
their relationship to distinct anatomical landmarks such as central
and calcarine sulci and Heschl’s gyrus which are relatively invariant
in position and configuration across individuals (Rademacher et al.,
1993), while other areas, such as the prefrontal cortex, are highly
variable across subjects thus making it difficult to choose mean-
ingful anatomical labels (Rajkowska and Goldman-Rakic, 1995).
For these regions of the neocortex, there is also little agreement on

P.E. Rasser et al. / NeuroImage 26 (2005) 941–951942
cytoarchitectonic boundaries and their relationship to sulcal and
functional anatomy (Amunts et al., 2000).
At present, most analytical approaches are based on template or
normalization techniques, which provide an approximation of
spatial information for grouped data with reference to a coordinate
system (e.g., the brain atlas of Talairach and Tournoux, 1988).
However, small changes of cortical stereotactic coordinates can, in
fact, represent a relatively large change in distance within the
cortical surface given the three-dimensional folding pattern of
cortex morphology (e.g., Fischl et al., 1999; Van Essen et al.,
2000). The same limitations apply when registering stereotactic
coordinates onto cytoarchitectonically-defined regions such as the
Brodmann areas (Brodmann, 1909). The interpretation of such data
can be further distorted by subtle brain pathology that is not
sufficiently corrected by the spatial normalization procedures,
potentially adding a systematic co-registration error to group
comparisons of brain activation.
The present study addresses some of these limitations by
employing three-dimensional continuum-mechanical image-
warping techniques to derive well-resolved average representa-
tions of anatomy for the co-registration of functional brain
imaging data. A key element of this strategy is the application
of cortical pattern matching methodologies that permit aggregation
of imaging data sets in the same anatomical reference locations
across subjects, explicitly modeling and adjusting for individual
differences in the cortical folding pattern as well as in overall brain
size (Thompson et al., 1997, 2000, 2003). Many traditional spatial
mapping techniques normalize data using only linear or global
(e.g., Woods et al., 1993) or piece-wise linear transformation into
stereotactic space, using the anterior and posterior commissures,
and a small number of points on the cortical surface defined with
reference to the AC–PC line, as fixed points (Talairach and
Tournoux, 1988). Such a global transformation is highly insensi-
tive to individual differences in cortical patterning.
By contrast, the cortical pattern matching method differs from
traditional spatial normalization techniques by explicitly model-
ing major cortical landmarks, and through deforming the
individual’s cortical surface, creates the best fit to an average
cortical pattern model. When comparing measures of gray matter
(Thompson et al., 2003) and functional activation across subjects,
statistical power is increased by explicitly adjusting for cortical
patterning differences across individuals. Recent research shows
that patients with schizophrenia show greater individual differ-
ences in the locations of major cortical surface than healthy
controls (Narr et al., 2001). Thus, this method may be particularly
relevant in avoiding systematic biases when comparing gray
matter or functional measures in patients with neuropsychiatric
conditions to healthy control subjects.
Cortical pattern matching has been applied in the current study
to compare the spatial properties of brain activation of first-episode
schizophrenia patients with that of matched healthy control
subjects when performing the Tower of London (TOL) task. It
was hypothesized that the gyral pattern-averaged model of the
cortex will improve spatial co-registration of brain activation
particularly in those regions of the cortex, which have a close
association of cytoarchitecture and function (i.e., primary sensory
projection areas).
The TOL is an adaptation of the Tower of Hanoi and consists
of moving colored balls within a limited number of moves in
order to achieve a given goal configuration. Previous studies
reported poor TOL performance in patients with frontal brain
lesions (e.g., Owen et al., 1990; Pantelis et al., 1997; Shallice,
1982) or frontal lobe dementia (Carlin et al., 2000), Parkinson’s
disease (e.g., Lewis et al., 2003; Morris et al., 1988; Owen et al.,
1992; Robbins et al., 1994), depression (e.g., Purcell et al., 1997),
and schizophrenia (e.g., Morris et al., 1995; Pantelis et al., 1997;
Schall et al., 1998).
Early activation studies using single-photon emission compu-
terized tomography (SPECT) reported that TOL performance is
associated with increased activation of the frontal cortex in healthy
subjects (Morris et al., 1993). Longer planning times and fewer
moves to complete a problem were associated with significantly
higher regional cerebral blood flow (rCBF) in the left prefrontal
cortex whereas execution time was negatively correlated with both
left and right prefrontal rCBF. Subsequent studies (Baker et al.,
1996; Owen et al., 1996) reported additional task-related increase of
rCBF in pre-motor areas, the visual cortex, thalamus, and caudate
nucleus.
Dagher et al. (1999) compared rCBF dependent on task
complexity as defined by the number of moves required to solve
a TOL problem (i.e., correlational analysis) with rCBF contrasts of
Fon_ versus Foff _ task performance (i.e., categorical analysis).
Activated brain areas in which increases of rCBF did not correlate
with task complexity were regions belonging to the dorsal stream
of visual input processing (i.e., visual cortical and posterior parietal
cortical areas) and regions involved in the execution and
sequencing of arm movements (e.g., cerebellum, primary motor
cortex, and supplementary motor area). Brain regions where levels
of rCBF correlated with task complexity included the dorsolateral
prefrontal cortex, the lateral pre-motor cortex, the rostral anterior
cingulate cortex, and the dorsal caudate nucleus.
A similar regression model–with number of moves required to
solve a problem as the independent variable and blood oxygenation
level-dependent (BOLD) signal changes as the dependent variable–
served as the functional MR measure in the present study (e.g.,
Schall et al., 2003; Van den Heuvel et al., 2003). So far, however,
only a limited number of reports have been published with TOL as
an activation task in schizophrenia. For instance, Andreasen et al.
(1992) reported decreased rCBF (when using [133Xe]) in the left
mesiofrontal cortex and cingulate in drug-naıve and neuroleptic
withdrawn schizophrenia patients that was associated with the
severity of frontal brain dysfunction as expressed by negative
symptoms.
While neuropsychological data suggest impaired TOL perform-
ance already at an early stage of the disorder (Thienel et al., 2000),
corresponding functional brain imaging studies are lacking. Such
data are of particular interest since subtle structural decline of gray
matter in those cortical areas–which are also subserving TOL
processing–have been reported at very early stages of the disease
(Pantelis et al., 2003). In early onset cases, the chronologically
earliest deficits were found in parietal brain regions concerned with
visuo-spatial and associative thinking, where adult deficits are
known to be mediated by environmental (non-genetic) factors
(Cannon et al., 2002). Over 5 years, these deficits progressed
anteriorly into temporal lobes, engulfing sensorimotor cortices,
executive and cognitive function associated dorsolateral prefrontal
cortices, and into the frontal eye fields. Faster loss rates of gray
matter in the frontal cortex were strongly correlated with the
severity of negative symptoms. Statistical maps on the cortical
surface further revealed regionally specific linkages between gray
matter losses and several IQ sub-tests on information processing,
comprehension, and vocabulary. These findings suggest an overall

P.E. Rasser et al. / NeuroImage 26 (2005) 941–951 943
deterioration of global functioning and cognitive decline, consis-
tent with progressive structural deterioration. These emerging
dynamic patterns were controlled for medication and IQ effects,
replicated in independent groups of males and females, and charted
in individuals and groups (Thompson et al., 2001).
The present study directly assesses function–structure relation-
ships by mapping task difficulty-dependent BOLD changes as a
function of cortical gray matter thickness. We hypothesized that the
extent of BOLD response–and, by extension, the performance on
the task– is partially dependent on the integrity of regions of gray
matter that are subserving TOL problem solving performance (i.e.,
prefrontal, frontal, and parietal cortex).
Materials and methods
The current study was conducted as part of the Brain Atlasing
Initiative of the Neuroscience Institute of Schizophrenia and
Allied Disorders (NISAD). Ethics approval was granted by the
human research ethics committees of the contributing institutions:
the University of Newcastle Human Research Ethics Committee,
the Hunter Area Health Research Ethics Committee, the Univer-
sity of New South Wales Ethics Research Committee, the South
Western Sydney Area Health Service Human Research Ethics
Committee, and the University of Duisburg-Essen Research Ethics
Committee.
Subjects and task
Schizophrenia was diagnosed according to DSM-IV criteria
with less than 2 years duration of illness and tested in remission on
maintenance antipsychotic medication (i.e., olanzapine, risperi-
done, or quetiapine). Healthy control subjects were matched for
age. All participants were right-handed males in order to avoid
gender by hemispheric dominance confounds. They were trained
on the TOL task prior to scanning in order to achieve a minimum
of 80% correct responses to ensure an equivalent level of task
performance of all participants. All subjects were also screened and
examined for general MR exclusion criteria (e.g., ferromagnetic
body objects, etc.) including a history of anxiety disorder and in
particular claustrophobia. They were also psychiatrically assessed
immediately prior to scanning to exclude individuals who were
experiencing an acute psychosis or were meeting any other of our
exclusion criteria (e.g., illicit substance use) that may have
emerged since recruitment for our study. Despite this strict
screening protocol, two patients and one control subject felt
discomfort while in the scanner and the session was aborted.
Another scan of one patient was excluded from analysis due to
movement artifacts. Data of 10 first-episode schizophrenia patients
with a mean age of 19.8 years (range 17–23 years) and 10 healthy
control subjects with a mean age of 20.1 years (range 18–21 years)
constitute the sample of the current study.
While lying in the MR scanner, each subject was presented
with TOL images using mirrors in the head coil to view a back-
projected video display. The upper half of the image contained a
goal configuration of three different colored balls on three pegs.
The subject was asked to determine the minimum number of
moves required to reach this goal configuration, given the
distribution of balls in the lower half of the image. Problems
involving 1 to 7 moves (Factive_) were presented along with a
baseline condition in which the upper and lower halves of the
image were identical (Fzero move_). After viewing the images for
30 s, the subject was asked to verbalize the required number of
moves. fMRI data were obtained for 21 problems, presented in 3
consecutive sequences consisting of 7 problems. Each sequence
commenced and ended with a Fzero move_ problem and
alternated between Fzero move_ and Factive_ problems (see Schall
et al., 2003 for further details and methodological cross
validations).
Structural and functional MRI acquisition
Structural and functional MR data were acquired using either a
Magnetom Vision 1.5-T MRI scanner (John Hunter Hospital,
Newcastle), a 1.5-T GE Signa LX scanner (St George MRI,
Kogarah), or a Siemens Sonata, 1.5-T MRI scanner (University
Clinic, Essen). Patients and control subjects were pair-wise age
matched at each site. For each subject, high-resolution structuralMR
data were collected with approximate dimensions of 164 � 256 �256 with each voxel being approximately 1.0 � 1.0 � 1.0 mm3
using a 3D MPRAGE protocol with TR = 9.7 ms, TE = 4 ms, and
flip angle = 12-. Subsequently, T2-weighted sequences were
collected during each of the 7 TOL problems using a 64 by 64
matrix to acquire 16 axial slices (TR = 0.6 s; TE = 70 ms; flip
angle = 90-; 6.25 � 6.25 � 8 mm in-plane resolution; each voxel
being 6.25 � 6.25 � 8 mm3) resulting in 70 volumes per run
(covering total brain volume). Each subject performed 3 sequen-
ces, leading to a total of 210 functional volumes per subject.
Processing of MR data
Each subject’s structural MR data were aligned with the
ICBM53 template (Collins et al., 1994) in order to reduce
individual proportional differences across subjects followed by
an intensity correction to reduce scanner inhomogeneity due to
radio frequency bias (Sled et al., 1998). A tissue classification (i.e.,
white matter, gray matter, CSF, and space surrounding the head)
for each subject was performed using a nearest neighbor Gaussian
distribution model that results in a discrete 4-parameter model of
the structure (Thompson et al., 2001).
Cortical surface modeling
To compare the BOLD activation data using two different
structural methods (i.e., affine registration and cortical pattern
matching), an intensity average (IA) model and a gyral pattern
average (GPA) model of cerebral cortex were developed. For the
IA model of cerebral cortex, the aligned individual MR images
were mean normalized and then intensity averaged for all subjects.
A three-dimensional model of the cerebral cortex was then
extracted (Thompson et al., 1997). For the GPA model, using the
masked MR data of the cerebrum, three-dimensional surface
models of the cerebral cortex were extracted for each subject.
Seventeen sulci were identified on each hemisphere and traced
onto each subject’s cortical surface model. Six control lines (three-
dimensional curves) mapping the midline hemispheric boundaries
at the interhemispheric margin were also identified and traced onto
the cortical surface model, giving 23 lines for each hemisphere for
each subject (Sowell et al., 2003; Thompson et al., 1997). Each of
the sulci and control lines identified for all subjects were then
geometrically averaged and used as the target for the alignment of
each individual set of sulci and control lines (Thompson et al.,
P.E. Rasser et al. / NeuroImage 26 (2005) 941–951944
2000). By computing the deformation that elastically transforms
one cortex into alignment with the geometrically averaged target,
the relationship between the voxels of each individual subject data
set (structural or functional) and the vertices on the average (GPA)
model is maintained (Thompson et al., 2000, 2003).
Deformable Brodmann area atlas
To localize the functional activation for both the IA and GPA
models, the Brodmann areas were used. From the right brain
hemisphere of the Montreal Neurological Institute intensity-
averaged single-subject MRI atlas (MNI colin27; http://
www.mrc-cbu.cam.ac.uk/Imaging/mnispace.html), an sMRI was
generated with two identical hemispheres (FcolinRR_). This
enabled the mapping of the Brodmann areas described on one
hemisphere to be reflected onto the other. (The classical Brodmann
maps are plotted on only one hemisphere as they are thought to
have a consistent relation to the gyral anatomy of each hemi-
sphere.) From the colinRR sMRI, a three-dimensional model of the
cerebral cortex was extracted (Thompson et al., 1997) and the
Brodmann areas, as described by the Caret package (http://
brainmap.wustl.edu/caret), represented onto its surface. As the
colinRR cerebral cortex model and the IA model were in the
same space, the Brodmann areas were applied to the surface of
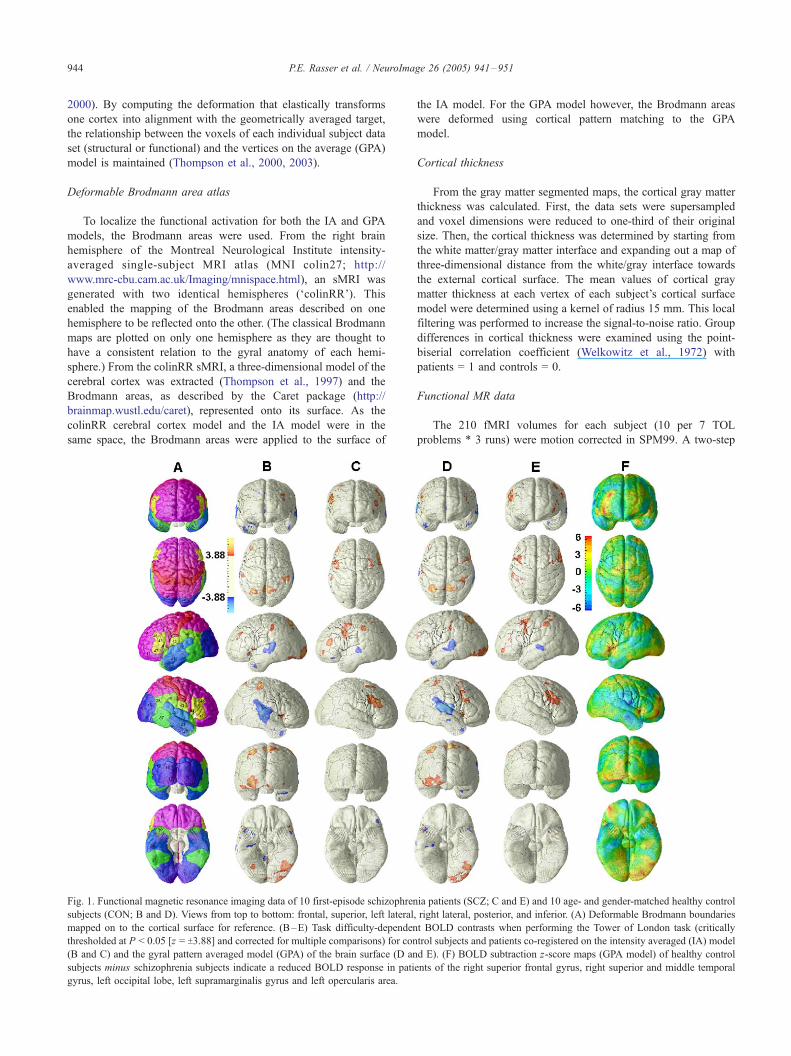
Fig. 1. Functional magnetic resonance imaging data of 10 first-episode schizophren
subjects (CON; B and D). Views from top to bottom: frontal, superior, left lateral,
mapped on to the cortical surface for reference. (B–E) Task difficulty-dependen
thresholded at P < 0.05 [z = T3.88] and corrected for multiple comparisons) for con
(B and C) and the gyral pattern averaged model (GPA) of the brain surface (D an
subjects minus schizophrenia subjects indicate a reduced BOLD response in pati
gyrus, left occipital lobe, left supramarginalis gyrus and left opercularis area.
the IA model. For the GPA model however, the Brodmann areas
were deformed using cortical pattern matching to the GPA
model.
Cortical thickness
From the gray matter segmented maps, the cortical gray matter
thickness was calculated. First, the data sets were supersampled
and voxel dimensions were reduced to one-third of their original
size. Then, the cortical thickness was determined by starting from
the white matter/gray matter interface and expanding out a map of
three-dimensional distance from the white/gray interface towards
the external cortical surface. The mean values of cortical gray
matter thickness at each vertex of each subject’s cortical surface
model were determined using a kernel of radius 15 mm. This local
filtering was performed to increase the signal-to-noise ratio. Group
differences in cortical thickness were examined using the point-
biserial correlation coefficient (Welkowitz et al., 1972) with
patients = 1 and controls = 0.
Functional MR data
The 210 fMRI volumes for each subject (10 per 7 TOL
problems * 3 runs) were motion corrected in SPM99. A two-step
ia patients (SCZ; C and E) and 10 age- and gender-matched healthy control
right lateral, posterior, and inferior. (A) Deformable Brodmann boundaries
t BOLD contrasts when performing the Tower of London task (critically
trol subjects and patients co-registered on the intensity averaged (IA) model
d E). (F) BOLD subtraction z-score maps (GPA model) of healthy control
ents of the right superior frontal gyrus, right superior and middle temporal

Table 1
Clusters (N > 20 units critically thresholded at P < 0.05 and corrected for multiple comparisons) of significant positive BOLD response dependent on task
difficulty (number of moves) when performing the Tower of London task
Anatomical region Brodmann areas [% of cluster] Unit count of cluster Maximum z of cluster Mean z of cluster
CON SCZ CON SCZ CON SCZ CON SCZ
Left superior frontal gyrus 10 [100%] 6 [100%] 39 46 4.18 4.69 4.04 4.19
10 [100%] 31 4.49 4.13
Right superior frontal gyrus 6 [100%] 6 [97%]; 8 [3%] 87 73 5.12 5.12 4.42 4.25
6 [100%] 6 [71%]; 4 [29%] 49 68 4.86 4.63 4.33 4.05
Left middle frontal gyrus Ø 6 [58%]; 9 [17%];
44 [16%]; 8 [16%];
4 [2%]
Ø 827 Ø 5.11 Ø 4.29
Right middle frontal gyrus 44 [33%]; 6 [31%];
9 [24%]; 46 [12%]
6 [30%]; 44 [22%];
9 [15%]; 4 [15%];
46 [13%]; 45 [5%]
519 1236 5.55 5.52 4.50 4.37
Left inferior frontal gyrus Ø 11 [81%]; 10 [19%] Ø 37 Ø 4.77 Ø 4.21
Left opercularis region 2 [41%]; 40 [30%];
43 [21%]; 1 [9%]
ND [100%] 81 53 4.48 4.36 4.12 4.07
Right opercularis region 38 [44%]; ND [25%];
44 [20%]; 22 [10%];
6 [1%]
ND [100%] 211 89 5.78 4.5 4.68 4.06
Left superior parietal lobule 7 [65%]; 5 [35%] 7 [57%]; 40 [37%];
5 [5%]
292 115 6.59 4.90 5.02 4.26
5 [51%]; 7 [49%] 89 5.69 4.56
Right superior parietal lobule 5 [75%]; 7 [24%] Ø 291 Ø 7.28 Ø 5.24 Ø
Left inferior occipital lobe 19 [47%]; 18 [27%];
37 [14%]; 17 [12%]
Ø 322 Ø 5.51 Ø 4.33 Ø
SCZ: first-episode schizophrenia patients; CON: age- and gender-matched healthy control subjects; ND: non-defined area by warped Brodmann atlas; Ø: <
statistical threshold; [%]: percent of cluster of significant BOLD activation falling into the boundaries of the respective Brodmann area.
P.E. Rasser et al. / NeuroImage 26 (2005) 941–951 945
intensity normalization procedure was adopted. Within each
sequence, images were intensity normalized to give a mean volume
intensity of 1000. A mean image for each sequence was generated,
and subtracted from every individual volume within its associated
acquisition sequence. This resulted in (for each sequence) a mean
baseline signal of zero at every voxel, with individual volume
acquisitions representing variation around that mean. Volumes
across all sequences were then concatenated to produce a single
series. Images were subsequently co-registered into MNI space
(Collins et al., 1994) using the SPM EPI template image as the target
volume. Data were then spatially smoothed using a Gaussian filter
Table 2
Clusters (N > 20 units critically thresholded at P < 0.05 and corrected for multip
difficulty (number of moves) when performing the Tower of London task
Anatomical region Brodmann areas [% of cluste
CON SCZ
Left superior frontal gyrus 9 [79%]; ND [21%]
10 [73%]; ND [27%] 10 [7
9 [26
Right superior frontal gyrus 9 [79%]; ND [21%] Ø
10 [56]; ND [44%]
Left superior and middle temporal gyrus 22 [68%]; 21 [28%];
37 [4%]
22 [6
21 [3
Right superior temporal and supramarginal gyrus 22 [58%]; 43 [22%];
40 [15%]; 21 [3%];
37 [3%]
Ø
Right middle temporal gyrus 21 [100%] Ø
Right inferior temporal gyrus 20 [100%] Ø
SCZ: first-episode schizophrenia patients; CON: age- and gender-matched health
statistical threshold; [%]: percent of cluster of significant BOLD activation falling
with a FWHM of 15 � 15 � 9 mm3 and submitted to a parametric
general linear model analysis (SPM99; Friston et al., 1995).
The hemodynamic response related to intensity changes was
predicted by a regression model at each time step as being a linear
function of the number of moves required to solve the problem
associated with each volume acquisition. This value was assumed
to remain constant across each block of 10 volume acquisitions. To
avoid overweighting the Fzero move_ baseline condition, for each
run only the block of 10 scans associated with the third Fzeromove_ problem was included in the analysis following the PET-
validated procedure by Schall et al. (2003). Consequently, for each
le comparisons) of significant negative BOLD response dependent on task
r] Unit count of cluster Maximum z of cluster Mean z of cluster
CON SCZ CON SCZ CON SCZ
177 �4.28 �4.01
4%];
%]
78 62 �4.56 �4.32 �4.16 �4.05
279 Ø �4.56 Ø �4.16 Ø
57 �4.39 �4.09
5%];
5%]
300 117 �5.00 �4.61 �4.34 �4.21
937 Ø �6.82 Ø �5.04 Ø
21 Ø �4.53 Ø �4.20 Ø
26 Ø �4.47 Ø �4.12 Ø
y control subjects; ND: non-defined area by warped Brodmann atlas; Ø: <
into the boundaries of the respective Brodmann area.

Fig. 2. Group comparison of total number of cortical surface units and
standard deviation (critically thresholded at P < 0.05 and corrected for
multiple comparisons) for left (L) and right (R) hemispheres, respectively.
Data suggest more extended cortical areas with positive BOLD contrasts
(left) in first-episode schizophrenia patients (SCZ) with increasing task
difficulty (i.e., number of moves) when performing the Tower of London
task and compared to healthy control subjects (CON) while cortical surface
areas with negative BOLD (right) are reduced in patients (see Table 3 for
detailed statistics).
Fig. 3. BOLD unit counts by Brodmann areas (critically thresholded at P < 0.05 an
pattern averaged (GPA) model of the brain surface, for left and right hemisphere
subjects, respectively. (Fisher’s test of variance homogeneity between groups: F(
P.E. Rasser et al. / NeuroImage 26 (2005) 941–951946
run and subject, 40 volumes were submitted to the regression
analysis, including the 30 volumes associated with the Factive_condition blocks and 10 volumes associated with the third Fzeromove_ block. The resulting z-scores for each subject were then
registered to their corresponding aligned structural MR space. For
both the IA and GPA models, the z scores were group averaged,
�N corrected and thresholded at P < 0.05.
The total number of above-threshold cortical surface vertices
(i.e., indicating significant activation with increasing task difficulty
in the gray matter) was computed in each of 6 cortical regions
defined by Brodmann areas: prefrontal (BA 9; 10; 11), dorsolateral
prefrontal (BA 44; 45; 46), and frontal cortex (BA 4; 6; 8); parietal
(BA 1; 2; 3; 4; 5; 7; 19; 39; 40), temporal (BA 20; 21; 22; 37; 38),
and occipital lobe (BA 17; 18). These six measures were entered
into a repeated measurement ANOVA analysis with Greenhouse–
Geisser-adjusted degrees of freedom for the averaged statistical
model: Region by Hemisphere by Methodology (IA versus GPA)
by Group (first-episode schizophrenia patients versus healthy
control subjects).
As a measure of the dependence of function on structure,
Pearson statistical maps of the correlation between cortical gray
matter thickness and BOLD response were calculated for the GPA
model across the combined data set (i.e., patients and control
d corrected for multiple comparisons) for intensity averaged (IA) and gyral
s, and for first-episode schizophrenia patients and matched healthy control
9,9) = 1.3, not significant; see Table 3 for more detailed statistics.)

P.E. Rasser et al. / NeuroImage 26 (2005) 941–951 947
subjects) as well as separately for both groups, and thresholded at
P < 0.05.
Results
Functional activation maps of healthy subjects corresponded
with previous findings (reviewed by Schall et al., 2003) and
confirmed an increasing BOLD response with TOL task difficulty
(i.e., number of moves) in the left and right superior frontal gyrus
(BA 10 and 6), the right middle frontal gyrus (BA 6/9/44/46), the
left and right opercularis region (BA 1/2/40/43), the left and right
superior parietal lobule (BA 5 and 7), and the left inferior occipital
lobe (BA 17/18/19/37; Figs. 1B and D; Table 1) while a decreasing
BOLD response with increasing task difficulty was confirmed for
the left and right superior frontal gyrus (BA 9 and 10), the right
superior temporal and supramarginal gyrus (BA 21/22/37/40/43) as
well as the right superior, middle and inferior temporal gyrus (BA
21/22/37; Figs. 1B and D; Table 2).
While performing the TOL task in the scanner, performance of
patients and control subjects did not significantly differ at group
level (CON: 88.7% SD 9.8 versus SCZ: 83.2% SD 14.1 correct
responses). However, patients’ pattern of BOLD response clusters
differed significantly from that of the control group (Figs. 1B–D).
For instance, only patients exhibited an increase of BOLD response
in the left middle and inferior frontal gyrus while their activation of
the right superior parietal lobule and left inferior occipital lobe did
not surpass the critical threshold of P < 0.05 (corrected for multiple
Table 3
BOLD unit counts by cortical region dependent on task difficulty (number of mov
0.05 and corrected for multiple comparisons
Anatomical region Brodmann areas CON
Left Righ
Prefrontal cortex 9; 10; 11 335 42
121.6 5
Dorsolateral prefrontal cortex 44; 45; 46 49 175
59.4 14
Frontal cortex 4; 6; 8 31 18
14.2 17
Parietal lobe 1; 2; 3; 4; 5; 7; 19; 39; 40 574 62
26.9 6
Temporal lobe 20; 21; 22; 37; 38 396 84
33.9 8
Occipital lobe 17; 18 131
12.7
Total 1503 243
181.7 14
Method (IA versus GPA model)
Greenhouse–Geisser adjusted repeated measurement ANOVA statistics: Brodmann
hemisphere; means (bold); standard deviation (italic); NS: not significant.
comparisons; Table 1). However, the most significant difference
between groups was found for decreasing cortical BOLD response
with increasing task difficulty (Fig. 2). Patients’ overall negative
BOLD response was markedly diminished in both hemispheres and
reduced to two small left-hemispheric clusters above the critical
statistical threshold in the superior frontal gyrus (BA 10) and the
temporal lobe (BA 21 and 22; Table 2).
Subtraction z-score maps of healthy control subjects minus
first-episode schizophrenia subjects for unthresholded data further
indicated reduced task difficulty-dependent BOLD response in
patients in the right prefrontal cortex, the right superior and middle
temporal gyrus, the left occipital lobe, the left supramarginal gyrus
and the left opercularis area (Fig. 1F). The detailed statistical group
analysis of thresholded data by cortical region (Fig. 3 and Table 3)
confirms smaller activation clusters in patients across all cortical
regions and in particular for the prefrontal cortex (BA 9–11), the
parietal (BA 1–5; 7; 19; 39; 40), temporal (BA 20–22; 37; 38) and
occipital (BA 17; 18) lobes. However, in contrast to the
unthresholded subtraction maps, significantly larger clusters of
activation were found in the frontal (BA 4; 6; 8) and the
dorsolateral prefrontal cortex (BA 44–46) in patients as compared
to the control group when analyzing thresholded cluster data.
Statistical analysis of thresholded cluster data further confirms a
predominantly right-hemispheric activation pattern in healthy
control subjects (Table 3), particularly for the prefrontal and
frontal cortex as well as for the temporal lobe while more extensive
clusters of left-hemispheric activation was confirmed for the
occipital lobe. On the other hand, patients’ hemispheric dominance
es) when performing the Tower of London task critically thresholded at P <
SCZ ANOVA statistics F value P value
t Left Right
5 299 112 Group 8.0 0.047
8.0 35.4 103.9 Hemisphere 0.6 NS
Group by hemisphere 5.1 NS
150 577 Group 15.2 0.018
0.7 21.2 97.6 Hemisphere 18.4 0.013
Group by hemisphere 5.4 NS
4 704 677 Group 55.6 0.002
6.1 139.3 129.7 Hemisphere 0.9 NS
Group by hemisphere 1.7 NS
3 131 11 Group 355.5 <0.001
5.8 36.8 9.1 Hemisphere 2.1 NS
Group by hemisphere 10.2 0.033
9 123 13 Group 290.2 <0.001
6.3 14.9 14.1 Hemisphere 25.6 0.007
Group by hemisphere 76.3 0.001
9 5 0 Group 237.1 <0.001
2.1 1.1 0.9 Hemisphere 181.3 <0.001
Group by hemisphere 179.2 <0.001
1 1408 1369 Group 33.5 0.004
8.5 154.1 34.5 Hemisphere 19.7 0.011
Group by hemisphere 23.3 0.008
Method <0.1 NS
Method by area 0.2 NS
Method by group <0.1 NS
Method by hemisphere 0.2 NS
areas by group by hemisphere and Brodmann areas by method by group by

P.E. Rasser et al. / NeuroImage 26 (2005) 941–951948
pattern was significantly diminished or reversed in the temporal,
parietal, and occipital lobes.
The statistical analysis also indicates no significant difference
of activation at cluster level by group, region, or hemisphere when
comparing co-registration of BOLD activation onto the GPA model
versus co-registration onto the IA model of the cerebral cortex
(Fig. 3 and Table 3).
Fig. 4. Combined structural and functional magnetic resonance imaging data o
subjects (CON). Views from top to bottom: frontal, superior, left lateral, right later
GPA model of the brain surface. (A) Unthresholded correlation maps of cortica
matter while negative values indicate reduced gray matter in patients, particularly
and hippocampus. (B) Combined group BOLD response (z-score maps thresholde
the Tower of London task showing increasing activation in the prefrontal and pa
and middle temporal gyrus. (C) Correlation maps of cortical gray matter thickness
BOLD response with decreased cortical gray matter thickness in the left prefronta
across groups.
The assessment of cortical gray matter thickness by group
(GPA model) suggests predominantly right-hemispheric reduc-
tion of gray matter in patients in the prefrontal, frontal, and
parietal cortex as well as the anterior temporal lobe and the
hippocampus, thus confirming previous findings based on gray
matter density measures (e.g., Cannon et al., 2002; Fig. 4A).
Correlation analysis (co-varying gray matter thickness with
f first-episode schizophrenia patients (SCZ) and matched healthy control
al, posterior, and inferior. Brodmann areas are warped into the probabilistic
l gray matter thickness by group. Positive values indicate increased gray
in the right anterior temporal lobe, prefrontal, frontal and parietal cortex,
d at P < 0.05 [z = T3.88]) as a function of task difficulty when performing
rietal cortex and a negative BOLD response predominantly in the superior
by BOLD response (thresholded at P < 0.05 [r = T0.44]) suggest reduced
l, right orbitofrontal, right superior temporal, and bilateral parietal cortices

Fig. 5. Correlation maps of cortical gray matter thickness by BOLD
response of left and right hemispheres (thresholded at P < 0.05 [r = T0.63])indicate a reduction of BOLD response with decreasing gray matter thick-
ness in first-episode schizophrenia patients. By contrast, matched healthy
control subjects predominantly show an inverse relationship suggesting
proportionally less activation of gray matter with increasing task difficulty.
P.E. Rasser et al. / NeuroImage 26 (2005) 941–951 949
unthresholded BOLD response across groups) suggests reduced
BOLD activation as a function of reduced cortical gray matter
thickness predominantly in the left prefrontal, right orbitofrontal,
right superior temporal, as well as left and right parietal cortex
(Figs. 4B and C). This relationship was particularly expressed in
first-episode patients (Fig. 5), thus predominantly affecting left
prefrontal, left dorsolateral prefrontal and left frontal as well as
bilateral parietal BOLD activation. In healthy subjects however,
this relationship was partially reversed, particularly in the
prefrontal and frontal cortex.
Discussion
The current study pursued three objectives. First, to compare
BOLD responses co-registered on an intensity-averaged model
(IA) with BOLD responses deformed onto the gyral pattern-
averaged (GPA) model of the cortical surface; second, to compare
the cortical BOLD response pattern of first-episode male
schizophrenia patients with age-matched male healthy control
subjects; and third, to analyze differences of cortical gray matter
thickness between the two groups and its association with BOLD
response.
In respect of the first objective, both models produced an
equivalent representation of BOLD response across hemispheres,
cortical regions, and groups, respectively, when using Brodmann
areas as anatomical reference for the cortical surface. However, it is
important to emphasize that the functional data were obtained at a
relatively low resolution. This, together with the small sample size
and the complexity of the TOL task, may have contributed to a lack
of power to demonstrate significant differences between the two
methods.
Some differences between the two methods were observed in
certain areas of the cortex. For instance, in relation to the right-
hemisphere negative BOLD response in healthy subjects, the
cluster appears more circumscribed and limited to BA 22 in the
GPA model as compared to the IA model (Figs. 1B and D). A
similar effect is apparent for the left-occipital BOLD increase in
healthy subjects. These brain regions are closely associated with
elementary auditory and visual processing, supporting the notion
that the cytoarchitectonically derived Brodmann boundaries
provide a more appropriate reference system for primary sensory
regions of the cortex. Brodmann area boundaries are less useful in
defining association areas, notably the prefrontal, frontal, and
parietal cortex, due to lack of reference to the functional properties
of the underlying brain tissue (e.g., Owen, 2000). On the other
hand, Brodmann areas provide a broadly accepted reference
system, which allows standardized reporting of cortical functional
brain imaging data (Brett et al., 2002). This includes a precise
definition of location and description of relative cluster size (e.g.,
Tables 1 and 2), thus assisting cross-study comparisons, partic-
ularly when employing deformable Brodmann area anatomical
referencing.
On the second objective, our functional data largely confirm
previous fMRI and PET findings in healthy subjects where a
parametric functional neuroimaging with the TOL task has been
employed (e.g., Dagher et al., 1999; Schall et al., 2003; Van den
Heuvel et al., 2003); that is a regression analysis as a function of
task difficulty (i.e., number of moves). The GPA BOLD activation
group subtraction map (i.e., healthy control subjects minus first-
episode schizophrenia patients; Fig. 1F) suggests reduced right-
prefrontal BOLD response (i.e., superior frontal gyrus) in patients.
Newman et al. (2003) reported that the left and right prefrontal
cortices were equally involved during the solution of moderate and
difficult TOL problems while only right prefrontal activation was
highly correlated with individual differences in working memory
(as measured independently by the reading span task). However,
when comparing thresholded cluster data, significantly larger
clusters of activation in the dorsolateral prefrontal and frontal
cortex were identified; that is a larger area of cortical activation in
patients as compared to healthy control subjects at the same level
of performance (Fig. 1F and Table 1).
At cluster lever, the most striking group differences were found
for the negative BOLD response (Fig. 2), particularly in the
temporal lobes (Table 2). Dagher et al. (1999) also reported a
negative correlation of rCBF with increasing TOL task complexity
for the right superior and inferior temporal gyrus in their PET
study. These findings may indicate a progressive down-regulation
of auditory information processing with increasing workload, thus
inhibiting interfering (and potentially disturbing) sensory auditory
information processing that is not directly related to performing the
TOL task. This proposed mechanism of appropriately regulating
cortical activation dependent on task requirements appears to be
impaired in first-episode schizophrenia patients, suggestive of
impaired executive attention, which is thought to be the underlying
neural mechanism to orchestrate complex cognitive processes
(Posner and Rothbart, 1998).
Since all patients of our study were on maintenance anti-
psychotic drug treatment at the time of testing, some of the here
reported group differences might reflect medication effects.
Particularly anti-dopaminergic drug action interferes with informa-
tion processing within the frontostriatal network, thus possibly
affecting working memory performance (Ellis and Nathan, 2001).
However, our patients were maintained on a group of antipsychotic
drugs that is less likely to induce a strong anti-dopaminergic effect
(i.e., parkinsonian side effects) and instead have been found to
improve TOL performance in the course of maintenance treatment
(Bender et al., 2002; Schall et al., 1998).
On the third objective, our data derived from the GPA model
suggest a reduction of gray matter thickness in the temporal lobe,
the prefrontal, frontal, and parietal cortex, and the hippocampus in

P.E. Rasser et al. / NeuroImage 26 (2005) 941–951950
first-episode schizophrenia patients (Fig. 4A). These results
support previous studies that have identified impaired gray matter
integrity in corresponding cortical areas (e.g., Pantelis et al., 2003;
Thompson et al., 2001; Wright et al., 1995).
To assess its functional relevance, a correlation map relating
local gray matter thickness to BOLD response was calculated.
Across groups, BOLD response was positively correlated with
gray matter thickness in the left prefrontal, right orbitofrontal,
right superior temporal, and bilateral parietal cortex, thus indicat-
ing a reduction of BOLD response with decreasing cortical gray
matter (Fig. 4C). This relationship was confirmed for the
prefrontal, dorsolateral prefrontal, frontal, and parietal cortex in
the first-episode schizophrenia sample whereas an inverse relation-
ship was found predominantly for the dorsolateral prefrontal and
frontal cortex in the control sample (Fig. 5). Notably, these are
those brain regions of increased activation in patients as compared
to healthy control subjects at cluster level (Table 3). First-episode
schizophrenia patients may therefore recruit these frontal areas
more extensively in order to perform at the same level as healthy
subjects in terms of calculating the correct number of moves. In
the context of behavioral data, schizophrenia patients are more
likely to spend more time on successfully mastering the TOL task
(e.g., Morris et al., 1995; Pantelis et al., 1997; Schall et al.,
1998), which was not accommodated by the fixed interval
procedure of the current study. It may also be possible that
healthy subjects do not recruit progressively larger frontal areas
above a certain level of task difficulty (i.e., in a non-linear
fashion), thus partially resulting in a cluster of negative correlation
when BOLD response is expressed as a function of cortical gray
matter thickness.
In summary, our novel approach of assessing structure–
function relationships using cortical pattern matching offers a
new direction for research since it provides the opportunity to
integrate within-subject data derived from structural and functional
MRI data of the cortex. We demonstrated the feasibility of
mapping functional BOLD data onto the GPA model of the cortex.
However, further studies are required in order to establish its utility,
for instance, by collecting BOLD data at higher spatial resolution
(e.g., in the present study, the effective BOLD voxel size after
spatial smoothing was larger than gray matter thickness). Addi-
tionally, the cognitive task used in our study was complex, which
may have masked any potential advantage of the GPA over the IA
model. Hence, future assessments of the anatomical accuracy of
BOLD co-registration using gyral pattern averaging should be
conducted at higher spatial resolution and focus on simpler tasks
with well-established functional neuroanatomy (e.g., finger tap or
visual checkerboard). In respect to our patient data, the current
results suggest impaired integrity of cortical gray matter in high
functioning (i.e., as assessed by task performance) first-episode
schizophrenia patients with relatively mild psychotic symptoms.
This gray matter reduction appears to be associated with impaired
functional activation as assessed by task difficulty-dependent
BOLD responses during task performance. Our data also show a
marked reduction of patients’ negative BOLD response in areas
subserving sensory auditory information processing when perform-
ing a demanding visual planning/working memory task. This may
indicate impaired down-regulation of neural activity in those brain
regions that are less likely to be directly involved in TOL
performance or may be a source of distraction. Within this context,
our findings support the notion of impaired executive attention
processes in schizophrenia.
Acknowledgments
We are grateful for the skilled radiographic assistance of Steve
Hudson, Gary O’Connor, Jo Donovan, and Mary Dwyer. The
Neuroscience Institute of Schizophrenia and Allied Disorders
(NISAD) and the Hunter Medical Research Institute (HMRI) are
supported by infrastructure funding from NSW Health. R.T. and
S.B were supported by the IFORES Program, Faculty of Medicine,
the University of Duisburg-Essen. Algorithm development was
supported in part by National Institute for Biomedical Imaging and
Bioengineering and the National Center for Research Resources
(R21 EB01561 and R21 RR019771, to P.T.).
References
Amunts, K., Malikovic, A., Mohlberg, H., Schormann, T., Zilles, K., 2000.
Brodmann’s areas 17 and 18 brought into stereotaxic space—Where and
how variable? NeuroImage 11, 66–84.
Andreasen, N.C., Rezai, K., Alliger, R., Swayze, V.W., Flaum, M.,
Kirchner, P., Cohen, G., O’Leary, D.S., 1992. Hypofrontality in
neuroleptic-naive patients and in patients with chronic schizophre-
nia. Assessment with xenon 133 single-photon emission computed
tomography and the Tower of London. Arch. Gen. Psychiatry 49,
943–958.
Baker, S.C., Rogers, R.D., Owen, A.M., Frith, C.D., Dolan, R.J.,
Frackowiak, R.S., Robbins, T.W., 1996. Neural systems engaged by
planning: a PET study of the Tower of London task. Neuropsychologia
34, 515–526.
Bender, S., Dittmann-Balcar, A., Schall, U., Klimke, A., Riedel, M.,
Vorbach, U., Kuhn, K.U., Lambert, M., Dittmann, R.W., Naber, D.,
2002. Effects of olanzapine versus clozapine on executive functions in
schizophrenia. Schizophr. Res. 53 (Suppl.), 194.
Brett, M., Johnsrude, I.S., Owen, A.M., 2002. The problem of functional
localization in the human brain. Nat. Rev., Neurosci. 3, 243–249.
Brodmann, K., 1909. Vergleichende Lokalisationslehre der Grosshimrinde
in ihren Prinzipien dargestellt auf Grund des Zellenbaues. Barth,
Leipzig.
Cannon, T.D., Thompson, P.M., van Erp, T., Toga, A.W., Poutanen, V.-P.,
Huttunen, M., Lonnqvist, J., Standertskjold-Nordenstam, C.-G., Narr,
K.L., Khaledy, M., Zoumalan, C.I., Dail, R., Kaprio, J., 2002. Cortex
mapping reveals regionally specific patterns of genetic and disease-
specific gray-matter deficits in twins discordant for schizophrenia. Proc.
Nat. Acad. Sci. U. S. A. 99, 3228–3233.
Carlin, D., Bonerba, J., Phipps, M., Alexander, G., Shapiro, M., Grafman,
J., 2000. Planning impairments in frontal lobe dementia and frontal lobe
lesion patients. Neuropsychologia 38, 655–665.
Collins, D.L., Neelin, P., Peters, T.M., Evans, A.C., 1994. Automatic 3D
intersubject registration of MR volumetric data in standardized
Talairach space. J. Comput. Assist. Tomogr. 18 (2), 192–205.
Dagher, A., Owen, A.M., Boecker, H., Brooks, D.J., 1999. Mapping the
network for planning: a correlational PET activation study with the
Tower of London task. Brain 122, 1973–1987.
Ellis, K.A., Nathan, P.J., 2001. The pharmacology of human working
memory. Int. J. Neuropsychopharmacol. 4, 299–313.
Fischl, B., Sereno, M.I., Tootell, R.B., Dale, A.M., 1999. High-resolution
intersubject averaging and a coordinate system for the cortical surface.
Hum. Brain Mapp. 8, 272–284.
Friston, K.J., Ashburner, J., Frith, C.D., Poline, J.B., Heather, J.D.,
Frackowiak, R.S.J., 1995. Spatial registration and normalization of
images. Hum. Brain Mapp. 3, 165–189.
Lewis, S.J., Cools, R., Robbins, T.W., Dove, A., Barker, R.A., Owen,
A.M., 2003. Using executive heterogeneity to explore the nature of
working memory deficits in Parkinson’s disease. Neuropsychologia
41, 645–654.

P.E. Rasser et al. / NeuroImage 26 (2005) 941–951 951
Newman, S.D., Carpenter, P.A., Varma, S., Just, M.A., 2003. Frontal and
parietal participation in problem solving in the Tower of London: fMRI
and computational modeling of planning and high-level perception.
Neuropsychologia 41, 1668–1682.
Morris, R.G., Downes, J.J., Sahakian, B.J., Evenden, J.L., Heald, A.,
Robbins, T.W., 1988. Planning and spatial working memory in
Parkinson’s disease. J. Neurol., Neurosurg. Psychiatry 51, 757–766.
Morris, R.G., Ahmed, S., Syed, G.M., Toone, B.K., 1993. Neural correlates
of planning ability: frontal lobe activation during the Tower of London
test. Neuropsychologia 31, 1367–1378.
Morris, R.G., Rushe, T., Woodruffe, P.W., Murray, R.M., 1995. Problem
solving in schizophrenia: a specific deficit in planning ability.
Schizophr. Res. 14, 235–246.
Owen, A.M., 2000. The role of the lateral frontal cortex in mnemonic
processing: the contribution of functional neuroimaging. Exp. Brain
Res. 133, 33–43.
Owen, A.M., Downes, J.J., Sahakian, B.J., Polkey, C.E., Robbins, T.W.,
1990. Planning and spatial working memory following frontal lobe
lesions in man. Neuropsychologia 28, 1021–1034.
Owen, A.M., James, M., Leigh, P.N., Summers, B.A., Marsden, C.D.,
Quinn, N.P., Lange, K.W., Robbins, T.W., 1992. Fronto-striatal
cognitive deficits at different stages of Parkinson’s disease. Brain 115,
1727–1751.
Owen, A.M., Doyon, J., Petrides, M., Evans, A.C., 1996. Planning and
spatial working memory: a positron emission tomography study in
humans. Eur. J. Neurosci. 8, 353–364.
Pantelis, C., Barnes, T.R., Nelson, H.E., Tanner, S., Weatherley, L., Owen,
A.M., Robbins, T.W., 1997. Frontal– striatal cognitive deficits in
patients with chronic schizophrenia. Brain 120, 1823–1843.
Pantelis, C., Velakoulis, D., McGorry, P.D., Wood, S.J., Suckling, J.,
Phillips, L.J., Yung, A.R., Bullmore, E.T., Brewer, W., Soulsby, B.,
Desmond, P., McGuire, P.K., 2003. Neuroanatomical abnormalities
before and after onset of psychosis: a cross-sectional and longitudinal
MRI comparison. Lancet 361, 281–288.
Posner, M.I., Rothbart, M.K., 1998. Attention, self-regulation and con-
sciousness. Philos. Trans. R. Soc. Lond., B Biol. Sci. 353, 1915–1927.
Purcell, R., Maruff, P., Kyrios, M., Pantelis, C., 1997. Neuropsychological
function in young patients with unipolar major depression. Psychol.
Med. 27, 1277–1285.
Rademacher, J., Caviness Jr, V.S., Steinmetz, H., Galaburda, A.M., 1993.
Topographical variation of the human primary cortices: implications
for neuroimaging, brain mapping, and neurobiology. Cereb. Cortex 3,
313–329.
Rajkowska, G., Goldman-Rakic, P.S., 1995. Cytoarchitectonic definition of
prefrontal areas in the normal human cortex: II. Variability in locations
of areas 9 and 46 and relationship to the Talairach Coordinate System.
Cereb. Cortex 5, 323–337.
Robbins, T.W., James, M., Owen, A.M., Lange, K.W., Lees, A.J., Leigh,
P.N., Marsden, C.D., Quinn, N.P., Summers, B.A., 1994. Cognitive
deficits in progressive supranuclear palsy, Parkinson’s disease, and
multiple system atrophy in tests sensitive to frontal lobe dysfunction.
J. Neurol., Neurosurg. Psychiatry 57, 79–88.
Schall, U., Catts, S.V., Chaturvedi, S., Liebert, B., Redenbach, J.,
Karayanidis, F., Ward, P.B., 1998. The effect of clozapine therapy
on frontal lobe dysfunction in schizophrenia: neuropsychology
and event-related potential measures. Int. J. Neuropsychopharmacol.
1, 19–29.
Schall, U., Johnston, P., Lagopoulos, J., Juptner, M., Jentzen, W., Thienel,
R., Dittmann-Balcar, A., Bender, S., Ward, P.B., 2003. Functional brain
maps of Tower of London performance: a PET and fMRI study.
NeuroImage 20, 1154–1161.
Shallice, T., 1982. Specific impairments of planning. Philos. Trans. R. Soc.
Lond., B Biol. Sci. 298, 199–209.
Sled, J.G., Zijdenbos, A.P., Evans, A.C., 1998. A non-parametric method
for automatic correction of intensity non-uniformity in MRI data. IEEE
Trans. Med. Imag. 17, 89–97.
Sowell, E.R., Peterson, B.S., Thompson, P.M., Welcome, S.E., Henkenius,
A.L., Toga, A.W., 2003. Mapping cortical change across the human life
span. Nat. Neurosci. 6, 309–315.
Talairach, J., Tournoux, P., 1988. Co-Planar Stereotaxic Atlas of the Human
Brain. Thieme, New York.
Thienel, R., Butorac, M., Schall, U., Bender, S., Wolstein, J., Dittmann-
Balcar, A., Oades, R.D., 2000. Tower of London performance in first to
third episode patients with schizophrenia: a follow up study on
executive function. Schizophr. Res. 41 (Suppl.), 294.
Thompson, P.M., MacDonald, D., Mega, M.S., Holmes, C.J., Evans, A.C.,
Toga, A.W., 1997. Detection and mapping of abnormal brain structure
with a probabilistic atlas of cortical surfaces. J. Comput. Assist. Tomogr.
21, 567–581.
Thompson, P.M., Woods, R.P., Mega, M.S., Toga, A.W., 2000. Mathema-
tical/computational challenges in creating deformable and probabilistic
atlases of the human brain. Hum. Brain Mapp. 9, 81–92.
Thompson, P.M., Vidal, C., Giedd, J.N., Gochman, P., Blumenthal, J.,
Nicolson, R., Toga, A.W., Rapoport, J.L., 2001. Mapping adolescent
brain change reveals dynamic wave of accelerated gray matter loss in
very early-onset schizophrenia. Proc. Natl. Acad. Sci. U. S. A. 98,
11650–11655.
Thompson, P.M., Hayashi, K.M., de Zubicaray, G., Janke, A.L., Rose, S.E.,
Semple, J., Hong, M.S., Herman, D., Gravano, D., Dittmer, S.,
Doddrell, D.M., Toga, A.W., 2003. Dynamics of gray matter loss in
Alzheimer’s disease. J. Neurosci. 23, 994–1005.
Van den Heuvel, O.A., Groenewegen, H.J., Barkhof, F., Lazeron, R.H., van
Dyck, R., Veltman, D.J., 2003. Frontostriatal system in planning
complexity: a parametric functional magnetic resonance version of
Tower of London task. NeuroImage 18, 367–374.
Van Essen, D.C., Drury, H.A., Joshi, S., Miller, M.I., 2000. Functional and
structural mapping of human cerebral cortex: solutions are in the
surfaces. Adv. Neurol. 84, 23–34.
Welkowitz, J., Ewen, R.B., Cohen, J., 1972. Introductory Statistics for the
Behavioral Science. Academic Press.
Woods, R.P., Mazziotta, J.C., Cherry, S.R., 1993. MRI-PET registration
with automated algorithm. J. Comput. Assist. Tomogr. 17, 536–546.
Wright, I.C., McGuire, P.K., Poline, J.B., Travere, J.M., Murray, R.M.,
Frith, C.D., Frackowiak, R.S., Friston, K.J., 1995. A voxel-based
method for the statistical analysis of gray and white matter density
applied to schizophrenia. NeuroImage 2, 244–252.