
Professional Development Program CAREER EPISODE REPORT (CER) EXAMPLE REGISTRY
Upload
khangminh22Category
view
0download
0
Episode 3
D5.3.6-02 - Report on the Prototyping of a dense TMA Version : 1.01
Page 1 of 133
Issued by the Episode 3 consortium for the Episode 3 project co-funded by the European Commission and Episode 3 consortium.
EPISODE 3 Single European Sky Implementation support through Validation
Document information
Programme Sixth framework programme Priority 1.4 Aeronautics and Space
Project title Episode 3
Project N° 037106
Project Coordinator EUROCONTROL Experimental Centre
Deliverable Name Report on the Prototyping of a dense TMA
Deliverable ID D5.3.6-02
Version 1.01
Owner
Bruno FAVENNEC
Antonio NUZZO
EUROCONTROL
ENAV
Contributing partners
No contributing partner.

Episode 3
D5.3.6-02 - Report on the Prototyping of a dense TMA Version : 1.01
Page 2 of 133
Issued by the Episode 3 consortium for the Episode 3 project co-funded by the European Commission and Episode 3 consortium.
- This page is intentionally blank -

Episode 3
D5.3.6-02 - Report on the Prototyping of a dense TMA Version : 1.01
Page 3 of 133
Issued by the Episode 3 consortium for the Episode 3 project co-funded by the European Commission and Episode 3 consortium.
DOCUMENT CONTROL
Approval
Role Organisation Name
Document owner EUROCONTROL, ENAV Bruno FAVENNEC, Antonio NUZZO
Technical approver NATS Richard POWELL
Quality approver EUROCONTROL Frédérique SENECHAL
Project coordinator EUROCONTROL Philippe LEPLAE
Version history
Version Date Status Author(s) Justification - Could be a
reference to a review form or a comment sheet
1.00 29/07/2009 Approved Bruno FAVENNEC
Laurence ROGNIN
Stefano TIBERIA
Antonio NUZZO
Giorgio MATRELLA
Patrizia CRISCUOLO
Approval of the document by the Episode 3 Consortium.
1.01 27/10/2009 Approved Bruno FAVENNEC Format change section 6.1.1 and document title modification

Episode 3
D5.3.6-02 - Report on the Prototyping of a dense TMA Version : 1.01
Page 4 of 133
Issued by the Episode 3 consortium for the Episode 3 project co-funded by the European Commission and Episode 3 consortium.
TABLE OF CONTENTS
EXECUTIVE SUMMARY......................................................................................................... 10
1 INTRODUCTION ............................................................................................................. 12 1.1 PURPOSE OF THE DOCUMENT ..................................................................................... 12 1.2 INTENDED AUDIENCE.................................................................................................. 12 1.3 EXPERIMENT BACKGROUND AND CONTEXT.................................................................. 13 1.4 DOCUMENT STRUCTURE............................................................................................. 13 1.5 GLOSSARY OF TERMS ................................................................................................ 15
2 EXERCISE SCOPE AND JUSTIFICATION................... ................................................. 17 2.1 CONTEXT................................................................................................................... 17 2.2 OVERVIEW OF THE ATM CONCEPT BEING ADDRESSED ................................................. 17
2.2.1 Precision Area Navigation (P-RNAV) .............................................................. 21 2.2.2 Point Merge Procedure.................................................................................... 21 2.2.3 Continuous Descent Approach (CDA) and Advanced Continuous Descent Approach (A-CDA)........................................................................................................... 23 2.2.4 Advanced Arrival Manager (AMAN) ................................................................ 24 2.2.5 Controlled Time of Arrival (CTA)...................................................................... 25 2.2.6 ASPA Sequencing & Merging.......................................................................... 26
2.3 STAKEHOLDERS AND THEIR EXPECTATIONS ................................................................. 26 3 VALIDATION METHODOLOGY ............................. ........................................................ 29
3.1 PROTOTYPING APPROACH .......................................................................................... 29 3.2 LINKS WITH EXPERT GROUPS, DODS AND MODELLING ACTIVITIES ................................. 29
4 TASK 1 ............................................. ............................................................................... 30 4.1 EXPERIMENT AND STRATEGY PLANNING ....................................................................... 30
4.1.1 Main objectives ................................................................................................ 30 4.1.2 Stepped Approach ........................................................................................... 30 4.1.3 Prototyping sessions’ objectives...................................................................... 31 4.1.4 Methods and techniques.................................................................................. 36 4.1.5 Scenario Specifications ................................................................................... 39 4.1.6 Experimental variables and design.................................................................. 46
4.2 CONDUCT .................................................................................................................. 48 4.2.1 Schedule .......................................................................................................... 48 4.2.2 Working methods and roles ............................................................................. 50 4.2.3 Participants ...................................................................................................... 51
4.3 RESULTS ................................................................................................................... 52 4.3.1 Introduction ...................................................................................................... 52 4.3.2 Objective 1: Familiarise controllers with P-RNAV, A-CDA and CTA............... 52 4.3.3 Objective 2: Assess feasibility and operability of P-RNAV, A-CDA and CTA . 54 4.3.4 Main conclusions of the Task 1 (P-RNAV, A-CDA and CTA assessment) ..... 79
5 TASK 2 ............................................. ............................................................................... 81 5.1 EXPERIMENT AND STRATEGY PLANNING ......................................................... 81
5.1.1 Main Objectives ............................................................................................... 81 5.1.2 Approach.......................................................................................................... 81 5.1.3 Prototyping Session’s Objectives .................................................................... 82 5.1.4 Methods and Technique .................................................................................. 84 5.1.5 Scenario Specifications ................................................................................... 85 5.1.6 Experimental Variables and Design ................................................................ 89
5.2 CONDUCT............................................................................................................... 90 5.2.1 Schedule .......................................................................................................... 90 5.2.2 Training session............................................................................................... 90 5.2.3 Measured session............................................................................................ 90

Episode 3
D5.3.6-02 - Report on the Prototyping of a dense TMA Version : 1.01
Page 5 of 133
Issued by the Episode 3 consortium for the Episode 3 project co-funded by the European Commission and Episode 3 consortium.
5.2.4 Working Methods and Roles............................................................................ 91 5.2.5 Participants ...................................................................................................... 95
5.3 RESULTS ................................................................................................................ 96 5.3.1 Introduction ...................................................................................................... 96 5.3.2 Objective 1: Assess Feasibility and Operability of P-RNAV, A-CDA and ASPA S&M 97 5.3.3 Objective 2: Assess Safety of P-RNAV, A-CDA and ASPA S&M ................. 108 5.3.4 Main conclusions of the Task 2 (P-RNAV/A-CDA and ASPA S&M assessment) 113
6 GENERAL CONCLUSIONS AND RECOMMENDATIONS............ .............................. 115 6.1 TMA CONCEPTS ...................................................................................................... 115
6.1.1 Conclusions ................................................................................................... 115 6.1.2 Recommendations related to concept maturation and assessment.............. 116
6.2 RECOMMENDATIONS TO DEVELOPMENT OF THE DODS............................................... 117 6.3 PROTOTYPING APPROACH ........................................................................................ 117
6.3.1 Advantages.................................................................................................... 117 6.3.2 Limitations...................................................................................................... 118 6.3.3 Recommendations......................................................................................... 118
7 REFERENCES AND APPLICABLE DOCUMENTS................ ..................................... 120
8 ANNEXES ..................................................................................................................... 121 8.1 PROTOTYPING SESSIONS OVERVIEW ......................................................................... 122 8.2 EXECUTED SCHEDULES ............................................................................................ 129

Episode 3
D5.3.6-02 - Report on the Prototyping of a dense TMA Version : 1.01
Page 6 of 133
Issued by the Episode 3 consortium for the Episode 3 project co-funded by the European Commission and Episode 3 consortium.
LIST OF TABLES
Table 1. Link between WP5.3.6 and the SESAR OI steps (IP2/SL2). ...................... 19
Table 2. KPA and KPI investigated during the four prototyping sessions................. 20
Table 3. Stakeholder expectations. ......................................................................... 27
Table 4. Primary (X) and secondary (x) focus of the three prototyping sessions...... 32
Table 5. Hypotheses per experiment objectives. ..................................................... 33
Table 6. List of Episode 3 TMA metrics, with associated performance areas and corresponding sessions.................................................................................... 38
Table 7. Measured sectors. ..................................................................................... 41
Table 8. Hybrid feed sectors.................................................................................... 41
Table 9. Separation standards (sessions 1, 2 and 3)............................................... 42
Table 10. Meteorological settings. ........................................................................... 42
Table 11. Illustration of entry conditions. ................................................................. 44
Table 12. Number of clusters per condition in session 2.......................................... 44
Table 13. Summary of independent variables usage during prototyping sessions. .. 47
Table 14. Controllers' tasks and associated phraseology. ....................................... 50
Table 15. Description of participants per session. ................................................... 51
Table 16. Benefits of P-RNAV, A-CDA and CTA-RTA. ............................................ 65
Table 17. Limitations of P-RNAV, A-CDA and CTA-RTA. ........................................ 66
Table 18. Review of initial operability-related hypotheses........................................ 67
Table 19. Review of initial efficiency-related hypotheses. ........................................ 72
Table 20. Review of initial predictability-related hypotheses. ................................... 74
Table 21. Review of initial safety-related hypotheses. ............................................. 77
Table 22. Review of initial capacity-related hypotheses........................................... 79
Table 23. Review of initial environment-related hypotheses. ................................... 79
Table 24. Episode 3 4th Prototyping Session high level objectives........................... 82
Table 25. Episode 3 TMA prototyping session 2 Low level objectives and related hypothesis........................................................................................................ 82
Table 26: Validation Scenarios................................................................................ 85
Table 27. Measured Sectors ................................................................................... 86
Table 28. Characteristics of Measured sectors........................................................ 86
Table 29: Feed sector ............................................................................................. 87
Table 30: Characteristics of Feed sector ................................................................. 87
Table 31: Simulated Traffic Samples....................................................................... 88
Table 32: Training Traffic Sample............................................................................ 88
Episode 3
D5.3.6-02 - Report on the Prototyping of a dense TMA Version : 1.01
Page 7 of 133
Issued by the Episode 3 consortium for the Episode 3 project co-funded by the European Commission and Episode 3 consortium.
Table 33. Controllers’ tasks and associated phraseology. ....................................... 91
Table 34. Controllers’ tasks and associated phraseology. ....................................... 95
Table 35. Participants.............................................................................................. 96
Table 36: Review of initial operability related hypothesis......................................... 98
Table 37: Review of initial safety related hypothesis..............................................109
Table 38. Overview of the contents and focus of each prototyping session. ...........122
Table 39. List of Episode 3 TMA metrics with associated performance areas and corresponding sessions...................................................................................128
Table 40. Schedule of the first prototyping session (Task 1)...................................129
Table 41. Schedule of the second prototyping session (Task 1). ............................130
Table 42. Schedule of the third prototyping session (Task 1). ................................131
Table 43. Exercise name de-code for sessions 1 to 3 (Task 1). .............................131
Table 44. Schedule of the 4th Prototyping Session (Task 2). ..................................132
LIST OF FIGURES
Figure 1. Diagram showing the outline scenario and scope of the three prototyping sessions (Task 1). ............................................................................................ 18
Figure 2. Point merge system - example with two parallel and curved sequencing legs. ................................................................................................................. 22
Figure 3. Airspace used for Episode 3 TMA prototyping session 1. ......................... 40
Figure 4. Airspace used for Episode 3 TMA prototyping sessions 2 and 3. ............. 40
Figure 5. Controllers’ rating on quality of training over the three prototyping sessions......................................................................................................................... 53
Figure 6. Controllers’ rating on realism of simulation over the three prototyping sessions........................................................................................................... 55
Figure 7. Suitability of traffic .................................................................................... 56
Figure 8. Estimated workload per session and per position. .................................... 57
Figure 9. Estimated workload, session 1. ................................................................ 57
Figure 10. Estimated workload, session 2. .............................................................. 58
Figure 11. Estimated workload, session 3. .............................................................. 59
Figure 12. Repartition of ATC instructions and clearances in Arrival sector............. 60
Figure 13. Repartition of ATC instructions and clearances in AP............................. 61
Figure 14. Repartition of ATC instructions and clearances in FI. ............................. 62
Figure 15. Geographical distributions of instructions. .............................................. 63
Figure 16. Benefits of P-RNAV/PMS, A-CDA and CTA. .......................................... 65
Figure 17. Perceived limitations of P-RNAV/PMS, A-CDA and CTA........................ 66
Episode 3
D5.3.6-02 - Report on the Prototyping of a dense TMA Version : 1.01
Page 8 of 133
Issued by the Episode 3 consortium for the Episode 3 project co-funded by the European Commission and Episode 3 consortium.
Figure 18. Percentage of aircraft and of flight time on lateral navigation mode. ....... 68
Figure 19. Inter-aircraft spacing at FAF (crosswind condition). ................................ 69
Figure 20. Trajectories illustrating working practices. .............................................. 70
Figure 21. Mean flown distance from IAFs. ............................................................. 71
Figure 22. Example of aircraft vertical profiles, for North and South flows. .............. 71
Figure 23. Example of descent smoothing along the sequencing leg. ..................... 72
Figure 24. Controllers' subjective feedback on predictability.................................... 73
Figure 25. Perceived impact of P-RNAV, A-CDA and CTA on safety level. ............. 75
Figure 26. Perceived impact of P-RNAV, A-CDA and CTA on situation awareness. 76
Figure 27. Throughput at FAF ................................................................................. 78
Figure 28. Episode 3 4th Prototyping Session Airspace. .......................................... 85
Figure 29: 4th Prototyping Session Assessment Approach ...................................... 96
Figure 30: ORGA – Sectors AE, OtS, AW - Working Methods Analysis................... 98
Figure 31: ORGA – Sectors AE, OtS, AW - Working Methods Analysis................... 99
Figure 32: ORGA – Sectors TE, FU, TW - Working Methods Analysis .................... 99
Figure 33: ORGA – Sectors TE, FU, TW - Working Methods Analysis ...................100
Figure 34: ORGB – Sectors AE, OtS, AW - Working Methods Analysis..................100
Figure 35: ORGB – Sectors AE, OtS, AW - Working Methods Analysis..................101
Figure 36: ORGB – Sectors TE, FU, TW - Working Methods Analysis ...................102
Figure 37: ORGB – Sectors TE, FU, TW - Working Methods Analysis ...................103
Figure 38: ORGB – Sectors TE, FU, TW - Working Methods Analysis ...................103
Figure 39: ORGA – Sectors AE, OtS, AW - Workload Analysis ..............................104
Figure 40: ORGA – Sectors AE, OtS, AW - Workload Analysis ..............................105
Figure 41: ORGA – Sectors TE, FU, TW - Workload Analysis ................................105
Figure 42: ORGA – Sectors TE, FU, TW - Workload Analysis ................................106
Figure 43: ORGB – Sectors AE, OtS, AW - Workload Analysis ..............................106
Figure 44: ORGB – Sectors AE, OtS, AW - Workload Analysis ..............................107
Figure 45: ORGB – Sectors TE, FU, TW - Workload Analysis ................................107
Figure 46: ORGB – Sectors TE, FU, TW - Workload Analysis ................................108
Figure 47: ORGA – Sectors AE, OtS, AW – Situation Awareness Analysis ............109
Figure 48: ORGA – Sectors AE, OtS, AW – Situation Awareness Analysis ............110
Figure 49: ORGA – Sectors TE, FU, TW – Situation Awareness Analysis..............110
Figure 50: ORGA – Sectors TE, FU, TW – Situation Awareness Analysis..............111
Figure 51: ORGB – Sectors AE, OtS, AW – Situation Awareness Analysis ............111

Episode 3
D5.3.6-02 - Report on the Prototyping of a dense TMA Version : 1.01
Page 9 of 133
Issued by the Episode 3 consortium for the Episode 3 project co-funded by the European Commission and Episode 3 consortium.
Figure 52: ORGB – Sectors AE, OtS, AW – Situation Awareness Analysis ............112
Figure 53: ORGB – Sectors TE, FU, TW – Situation Awareness Analysis..............112
Figure 54: ORGB – Sectors TE, FU, TW – Situation Awareness Analysis..............113
Episode 3
D5.3.6-02 - Report on the Prototyping of a dense TMA Version : 1.01
Page 10 of 133
Issued by the Episode 3 consortium for the Episode 3 project co-funded by the European Commission and Episode 3 consortium.
EXECUTIVE SUMMARY
This document is the consolidated validation exercise report for the four prototyping sessions of the Episode 3 WP5.3.6 Prototyping of a dense Terminal Manoeuvring Area (TMA). It covers the step 4 of the European Operational Concept Validation Methodology (E-OCVM). It reports the work carried out to assess the operability, from the controller perspective, of the SESAR-Implementation Package 2 (IP2) foreseen improvements of the route structures in a dense TMA, combined with the optimisation of descent procedures i.e. advanced continuous descent approach (A-CDA), controlled time of arrival (CTA) constraints, and with ASPA S&M (ASAS Spacing Sequencing & Merging) application.
The methodology consisted of a series of prototyping sessions, whose scope was gradually increased, as maturity progressed. Four prototyping sessions of one week each were carried out in a SESAR Intermediate Timeframe TMA Environment. The content and focus of the sessions were defined by the EP3 WP5 Expert Group. The sessions started by refining possible options (e.g. airspace, routes, and scenario), then assessed the operability and acceptability of Precision Area Navigation (P-RNAV), A-CDA, 4D and ASAS S&M.
The first session aimed at refining roles, procedures, and working methods of the controllers, and assessing the operability and acceptability of A-CDA in a P-RNAV route structure. The second session aimed at assessing the impact of respecting time constraints (Controlled Time of Arrival – CTA) on the operability and acceptability of A-CDA in an improved new P-RNAV route structure. The third session aimed at confirming the acceptability and operational feasibility of A-CDA down to the Final Approach Fix (FAF) in the improved P-RNAV environment and assessing the impact of mixed aircraft RTA equipage on this acceptability and operational feasibility. The fourth session aimed to evaluate, in a different environment like the high density Rome TMA, the use of ASPA S&M application combined with the use of P-RNAV and A-CDA.
The first three sessions (WP5.3.6 Task 1, lead by EUROCONTROL) took place between November 2008 and January 2009 at the EUROCONTROL Experimental Centre (EEC) and involved a total of seventeen controllers from DFS, ENAV, LFV, LVNL and NATS. For these sessions the airspace was derived/adapted from Dublin TMA. The fourth session (WP5.3.6 Task 2, lead by ENAV) was conducted in SICTA premises in February 2009; the airspace was derived from Rome TMA. All the traffic flows were based on SESAR forecasts.
Results from the Task 1 showed that the P-RNAV/Advanced CDA concept tested is operationally viable. With P-RNAV and A-CDA, the overall feedback was positive, controllers found it easy to work with the procedures, provided a suitable and safe design (e.g. no head to head converging flows). P-RNAV and A-CDA enable a large reduction in radiotelephony (R/T) communications, leaving free cognitive resource. Teamwork and coordination, especially between approach and final are essential for efficiency and throughput. The CTA concept has potential for optimal delivery at metering point e.g. the Initial Approach Fix (IAF), increase in regularity, punctuality, predictability, and reduction in stack usage. However the subjective feedback suggested that CTA reduces flexibility and controllers’ situation awareness and lacks robustness against external factors (e.g. meteorological conditions). Initial trends on performance showed that even under high traffic load, the concept provided benefits, in enabling to keep aircraft on lateral navigation (2D), carry out Advanced Continuous Descent Approaches (3D) and achieve consistent inter-aircraft spacing on final (4D). Open issues include the variability of working methods (and their impact on performance) and the CTA/RTA maturity.
Results from Task 2 showed that the P-RNAV concept applied through the Point Merge System (PMS) technique and the A-CDA concept tested are operationally viable. In terms of acceptability and feasibility, P-RNAV concept, introduced through the PMS technique, was considered by the participants a very good technique allowing the elimination of vectoring and

Episode 3
D5.3.6-02 - Report on the Prototyping of a dense TMA Version : 1.01
Page 11 of 133
Issued by the Episode 3 consortium for the Episode 3 project co-funded by the European Commission and Episode 3 consortium.
facilitating the activity of controllers that can concentrate on the monitoring of the PMS application in terms of speed and flight levels.
Controllers found easy to manage the traffic using P-RNAV and A-CDA together. The new route structure and associated new working methods allow the controllers to manage high traffic loads with an acceptable workload thanks to a reduction of tasks associated with this new operational environment. P-RNAV and A-CDA allow controllers to have a better situation awareness of the traffic evolution due to a standardised working methods based on an arrival structured route layout. Accordingly, in nominal situation, controllers perceived an increased safety level.
The combined use of ASPA S&M, P-RNAV and A-CDA allow controllers to focus more on the sequence leg management. Controllers, having delegated spacing tasks to the cockpit, are able to better monitor the traffic evolution on the arrival streams. The availability of ASPA S&M infringement tool was appreciated by controllers enabling them to have a timely warning in case of infringement. Controllers generally accepted the new working methods foreseeing a partial delegation of their tasks to the cockpit.

Episode 3
D5.3.6-02 - Report on the Prototyping of a dense TMA Version : 1.01
Page 12 of 133
Issued by the Episode 3 consortium for the Episode 3 project co-funded by the European Commission and Episode 3 consortium.
1 INTRODUCTION
1.1 PURPOSE OF THE DOCUMENT
According to step 4 of the E-OCVM, an exercise report should be produced to provide evidence of the qualities and shortcomings together with any issues and recommendations. The document reports on the validation exercise WP 5.3.6 Prototyping session of a dense TMA, carried out within WP 5: Airport and TMA.
This document provides the consolidated validation exercise report for:
• The series of three prototyping sessions carried out by EUROCONTROL in the frame of Episode 3 WP 5.3.6 Task 1 Prototyping session of a dense TMA; as well as
• The fourth prototyping session carried out by ENAV in the frame of Episode 3 WP5.3.6 Task 2 Prototyping session of a dense TMA.
The document will contribute to the elaboration of the Integrated Reports of Work Package 5.
The Task 1 sessions were carried out between November 2008 and January 2009 at the EUROCONTROL Experimental Centre (EEC) to evaluate the potential for new functionality and techniques needed to accommodate predicted traffic levels in ECAC TMAs, in the intermediate timeframe (SESAR IP2). The Task 2 session took place from 23rd to 27th February 2009, at SICTA premises.
Complementing the validation exercise plan [1], the present validation report covers step 4 of the European Operational Concept Validation Methodology (E-OCVM) [2]. It includes all information necessary to understand the conduct and outcomes of the Episode 3 WP5.3.6 prototyping sessions of a dense TMA, in line with the Episode 3 WP 5 validation strategy [3].
1.2 INTENDED AUDIENCE
This document is intended for use by the exercise leaders involved in EP3 WP5 and in EP3 WP2.3 Validation Process Management. Moreover, it forms the basis for further elaboration of the detailed WP5 validation and exercise reporting (E-OCVM steps 4 and 5).
The intended audience includes:
• EP3 WP 2 System Consistency leader;
• EP3 WP 2 Reporting and Dissemination;
• EP3 WP 5 EP3 WP5 TMA and Airport:
o EP3 WP 5 Leader;
o EP3 WP 5.2 TMA and Airport Validation Strategy, Support, and Operational Concept Refinement;
o EP3 WP5.3.1 TMA Expert Group Leader;
o EP3 WP5.3.4 Multi Airport TMA Fast Time Exercise Leader;
o EP3 WP5.3.5 TMA Trajectory and Separation Management Fast Time Exercise Leader;
o EP3 WP 5.4 TMA and Airport Results Analysis and Report.

Episode 3
D5.3.6-02 - Report on the Prototyping of a dense TMA Version : 1.01
Page 13 of 133
Issued by the Episode 3 consortium for the Episode 3 project co-funded by the European Commission and Episode 3 consortium.
1.3 EXPERIMENT BACKGROUND AND CONTEXT
The EUROCONTROL Study Report “Challenges to Growth” [4] suggests that, under the most optimistic of circumstances, existing airport capacity in Europe is capable of absorbing a maximum of twice the traffic demand of 2003. Other studies ([5], [6]) suggest a traffic growth rate of between 4% & 5% per annum through to 2025 can be expected. At these rates, a total capacity barrier would be reached around 2017. Noting that this includes capacity filling at regional airports as well as current major hub airports, it is reasonable to assume that the practical capacity barrier will be reached well before the theoretical barrier, typically between 2013 and 2015. Consequently, in order to meet the SESAR challenge and break through this barrier, sufficient capacity in the basic ATM infrastructure of the air transport network (including airports) must be created, together with a concept of operations which makes it function as a true, single network. In addition, there must be the political will to commit to achieving it - all with a planning horizon based upon the above.
Episode 3 is tasked with beginning the validation of the operational concept expressed by SESAR Task 2.2 and consolidated in SESAR D3 [7].
The validation process as applied in Episode 3 is based on the E-OCVM [2], which describes an approach to ATM Concept validation. However, to date the E-OCVM has not been applied to validation of a concept on the scale and complexity of SESAR. Such a system level validation assessment must be constructed from data derived from a wide range of different validation activities, integrating many different levels of system description, different operational segments and contexts and different planning horizons. The data are collected through a variety of methods and tools and vary in quality and reliability.
The process of performing systematic validation and the integration of results must be actively planned and managed from the beginning of the whole validation activity. This validation management is coordinated by EP3/WP 2.3, which is responsible for ensuring the effective application of the E-OCVM and the consolidation of the Episode 3 Validation Strategy.
Following the Episode 3 resumption on 1st August 2008, and acknowledging that a large part of the SESAR ConOps [8] is at a relatively early stage in the Concept Validation Lifecycle (late V1, early V2) there has been a shift in focus, with emphasis now increased in three main areas:
• Clarification of the concept; recognising that the concept is large and that Episode 3 does not have the resources to address all areas and OIs;
• Expanding the repertoire of cost-effective validation techniques (e.g. gaming variants) suited to these early stages of concept validation;
• Consolidating our learning on the application of the E-OCVM to SESAR-scale ConOps.
It should be noted that the human in the loop prototyping sessions focused on operability aspects. Nevertheless, as validation exercises should produce evidence (preferably measured) about the ability (of some aspects) of the concept to deliver on (some aspects of) the performance targets, a secondary focus was on initial trends as regards performance aspects.
In addition, these sessions contribute to subsequent validation activities in enabling concept clarification, requirements development or elaboration activities.
1.4 DOCUMENT STRUCTURE
The document is structured as follows:
• Section 2 introduces the scope and justification of the validation exercises (composed of the series of four prototyping sessions);

Episode 3
D5.3.6-02 - Report on the Prototyping of a dense TMA Version : 1.01
Page 14 of 133
Issued by the Episode 3 consortium for the Episode 3 project co-funded by the European Commission and Episode 3 consortium.
• Section 3 describes the validation methodology used to progressively validate the concept;
• Sections 4 and 5 respectively cover the description of Tasks 1 and 2, with a similar sub-structure, summarising the experimental plan (objectives, methods, settings and design), the experiment conduct and results according to the objectives;
• Section 6 concludes and provides recommendations;
• In addition, an overview of the prototyping sessions and sessions’ schedules are provided in annexes.
Episode 3
D5.3.6-02 - Report on the Prototyping of a dense TMA Version : 1.01
Page 15 of 133
Issued by the Episode 3 consortium for the Episode 3 project co-funded by the European Commission and Episode 3 consortium.
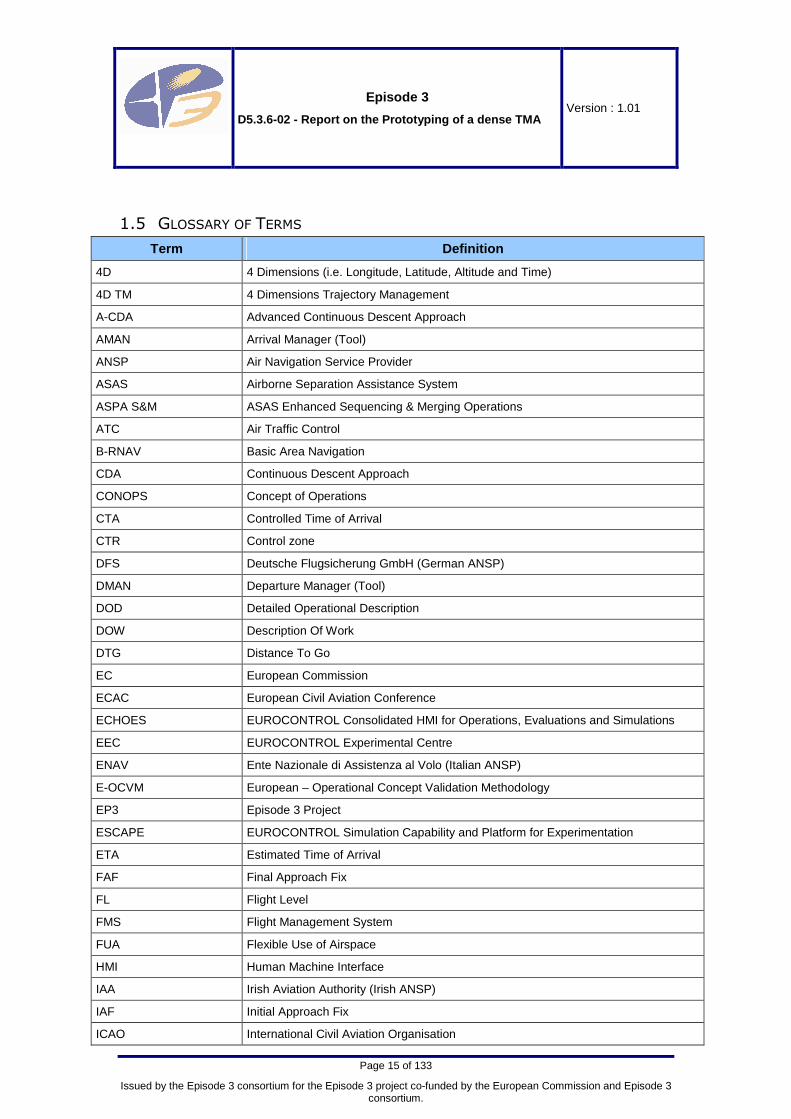
1.5 GLOSSARY OF TERMS
Term Definition
4D 4 Dimensions (i.e. Longitude, Latitude, Altitude and Time)
4D TM 4 Dimensions Trajectory Management
A-CDA Advanced Continuous Descent Approach
AMAN Arrival Manager (Tool)
ANSP Air Navigation Service Provider
ASAS Airborne Separation Assistance System
ASPA S&M ASAS Enhanced Sequencing & Merging Operations
ATC Air Traffic Control
B-RNAV Basic Area Navigation
CDA Continuous Descent Approach
CONOPS Concept of Operations
CTA Controlled Time of Arrival
CTR Control zone
DFS Deutsche Flugsicherung GmbH (German ANSP)
DMAN Departure Manager (Tool)
DOD Detailed Operational Description
DOW Description Of Work
DTG Distance To Go
EC European Commission
ECAC European Civil Aviation Conference
ECHOES EUROCONTROL Consolidated HMI for Operations, Evaluations and Simulations
EEC EUROCONTROL Experimental Centre
ENAV Ente Nazionale di Assistenza al Volo (Italian ANSP)
E-OCVM European – Operational Concept Validation Methodology
EP3 Episode 3 Project
ESCAPE EUROCONTROL Simulation Capability and Platform for Experimentation
ETA Estimated Time of Arrival
FAF Final Approach Fix
FL Flight Level
FMS Flight Management System
FUA Flexible Use of Airspace
HMI Human Machine Interface
IAA Irish Aviation Authority (Irish ANSP)
IAF Initial Approach Fix
ICAO International Civil Aviation Organisation

Episode 3
D5.3.6-02 - Report on the Prototyping of a dense TMA Version : 1.01
Page 16 of 133
Issued by the Episode 3 consortium for the Episode 3 project co-funded by the European Commission and Episode 3 consortium.
Term Definition
IP Implementation Package (SESAR)
KPA Key Performance Area
KPI Key Performance Indicator
LFV Luftfartsverket (Swedish ANSP)
LVNL Luchtverkeersleiding Nederland (Dutch ANSP)
MTV Mid-Term Concept Validation
NATS National Air Traffic Services
NM Nautical Miles
NOP Network Operations Plan
OI Operational Improvement
OLDI Standard On Line Data Interchange
OSED Operational Services and Environment Definition
PBN Performance Based Navigation
PMS Point Merge System
P-RNAV Precision Area Navigation
PTC Precision Trajectory Clearances
PWP Pilot Working Position
RBT Reference Business Trajectory
RNAV Area Navigation
R/T Radio Telephony
RTA Required Time of Arrival
SESAR Single European Sky ATM Research in Air Transportation
SID Standard Instrument Departure (Route)
SMAN Surface Manager (Tool)
STAR Standard Terminal Arrival Route
STCA Short Term Conflict Alert
SYSCO System Supported Co-ordination
TMA Terminal Manoeuvring Area
TOD Top of Descent
TSA Temporary Segregated Area
TTA Target Time of Arrival
UTA Upper (Traffic) Control Area
WP Work Package

Episode 3
D5.3.6-02 - Report on the Prototyping of a dense TMA Version : 1.01
Page 17 of 133
Issued by the Episode 3 consortium for the Episode 3 project co-funded by the European Commission and Episode 3 consortium.
2 EXERCISE SCOPE AND JUSTIFICATION
2.1 CONTEXT
Terminal airspace is the important link between En Route flight operations and airports. Year after year, terminal airspace operations are becoming increasingly busy and more complex. Overall demand continues to rise and with increasing airline operations from secondary airports adding to the complexity, some TMA operations are being stretched to the limit. As stated in SESAR D1 [9] this ever rising demand is pushing for better performance from the ATM system.
For airline operators, improved predictability, lower fuel costs and minimum investment in new equipment are all high priorities. Equally, for ATC and ground operations, minimum investment with maximum returns in terms of efficiency, capacity and workload are required. Environmentally, emissions and noise are increasingly important areas that need to be addressed in the overall context of ATM. In today’s economic climate and environmental situation, these drivers have assumed even greater importance than before.
In today’s operations, there is a demand from airspace users to have greater predictability of routing within the terminal airspace flight segment, more efficient operating procedures in terminal airspace and exploitation of existing navigation capabilities to their maximum extent to achieve greater efficiency. If addressed together, through the introduction and implementation of P-RNAV routings and Continuous Descent Approaches (CDA), it is anticipated that significant benefits are achievable.
During this type of operation, the aircraft can optimise its descent profile and routing within the terminal airspace without the controller having to intervene with radar vectoring. In addition, aircraft can be operated more efficiently and economically because of improved predictability of flight profiles. Moreover, significant benefits from reduced fuel burn and reduced environmental impact may be gained. Additional benefits from the use of enhanced ATC system support, such as an Advanced Arrival Manager (AMAN), include a reduction in fuel burn due to decreased holding times.
However, in areas of medium to high-density operations, these fixed procedures cannot always be used due to the necessity for controllers to intervene with radar vectoring to deliver aircraft to the runway to achieve maximum throughput, whilst still ensuring safe separation is maintained. This removes the predictability of the routing within the terminal airspace and may reduce the ability to carry out a CDA. Structured merging techniques could potentially remove the need to resort to radar vectoring, thereby ensuring that aircraft can remain in FMS lateral navigation mode.
2.2 OVERVIEW OF THE ATM CONCEPT BEING ADDRESSED
As described in the EP3 DoW [10], the main focus of the series of prototyping sessions in WP5.3.6 Task 1 was on the following aspects in dense TMA:
• Lateral (2D): Innovative TMA route structures (Performance Based Navigation) with multiple merge points, and associated procedures supported by 2D Precision Trajectory Clearances and limited closed-loop tactical interventions;
• Vertical (3D): Adherence to vertical windows (“cone-shaped” envelope of trajectories), while optimising the vertical profiles by enabling advanced CDAs during arrival flow integration;
• Longitudinal (4D/time): Inbound aircraft adhering to a RBT, including time constraints (CTA) issued by an arrival manager (AMAN).
Episode 3
D5.3.6-02 - Report on the Prototyping of a dense TMA Version : 1.01
Page 18 of 133
Issued by the Episode 3 consortium for the Episode 3 project co-funded by the European Commission and Episode 3 consortium.
Notes:
• Creation, management and actual revision of the NOP, of RBTs, as well as actual issuance of PTC instructions were out of the scope of the present task;
• So were airport turnaround management processes (e.g. SMAN, DMAN);
• While focus was on arrivals, compatibility with continuous climb departures was also considered.
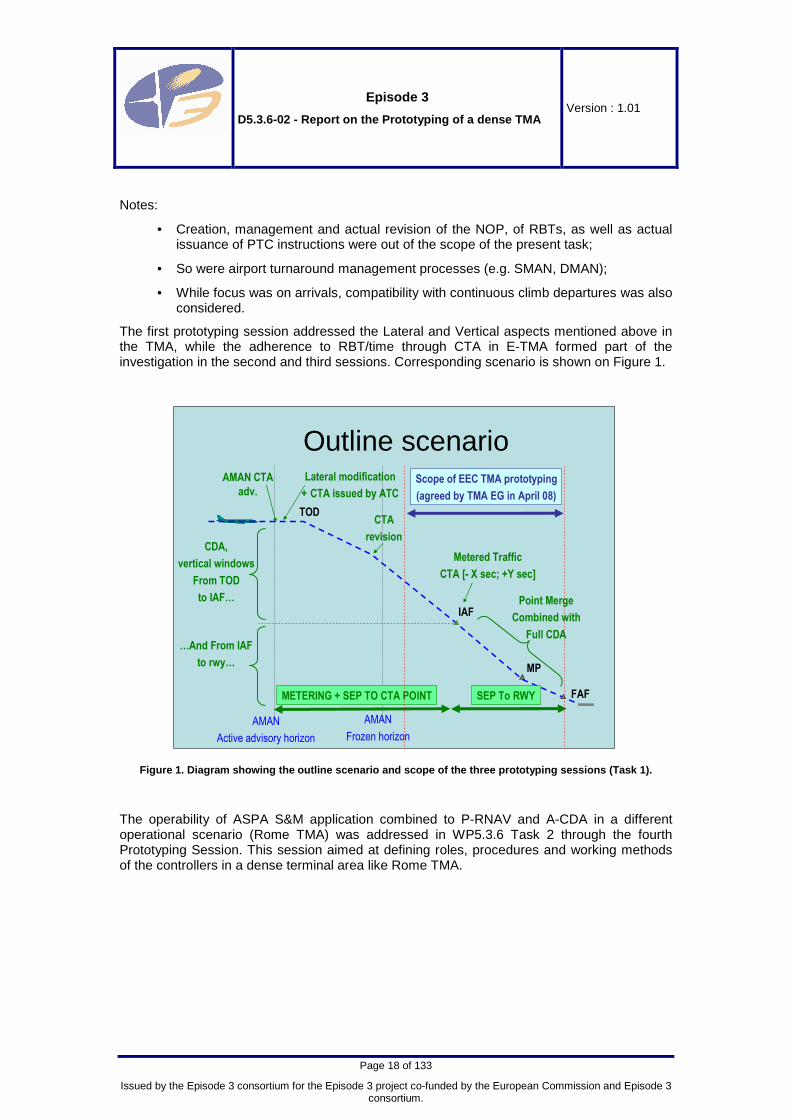
The first prototyping session addressed the Lateral and Vertical aspects mentioned above in the TMA, while the adherence to RBT/time through CTA in E-TMA formed part of the investigation in the second and third sessions. Corresponding scenario is shown on Figure 1.
Outline scenario
TOD
IAF
FAF
Metered Traffic
CTA [- X sec; +Y sec]
AMAN
Active advisory horizon
Lateral modification
+ CTA issued by ATC
AMAN CTA
adv.
CTA
revision
AMAN
Frozen horizon
Scope of EEC TMA prototyping
(agreed by TMA EG in April 08)
METERING + SEP TO CTA POINT SEP To RWY
MP
Point Merge
Combined with
Full CDA
CDA,
vertical windows
From TOD
to IAF…
…And From IAF
to rwy…
Figure 1. Diagram showing the outline scenario and scope of the three prototyping sessions (Task 1).
The operability of ASPA S&M application combined to P-RNAV and A-CDA in a different operational scenario (Rome TMA) was addressed in WP5.3.6 Task 2 through the fourth Prototyping Session. This session aimed at defining roles, procedures and working methods of the controllers in a dense terminal area like Rome TMA.
Episode 3
D5.3.6-02 - Report on the Prototyping of a dense TMA Version : 1.01
Page 19 of 133
Issued by the Episode 3 consortium for the Episode 3 project co-funded by the European Commission and Episode 3 consortium.
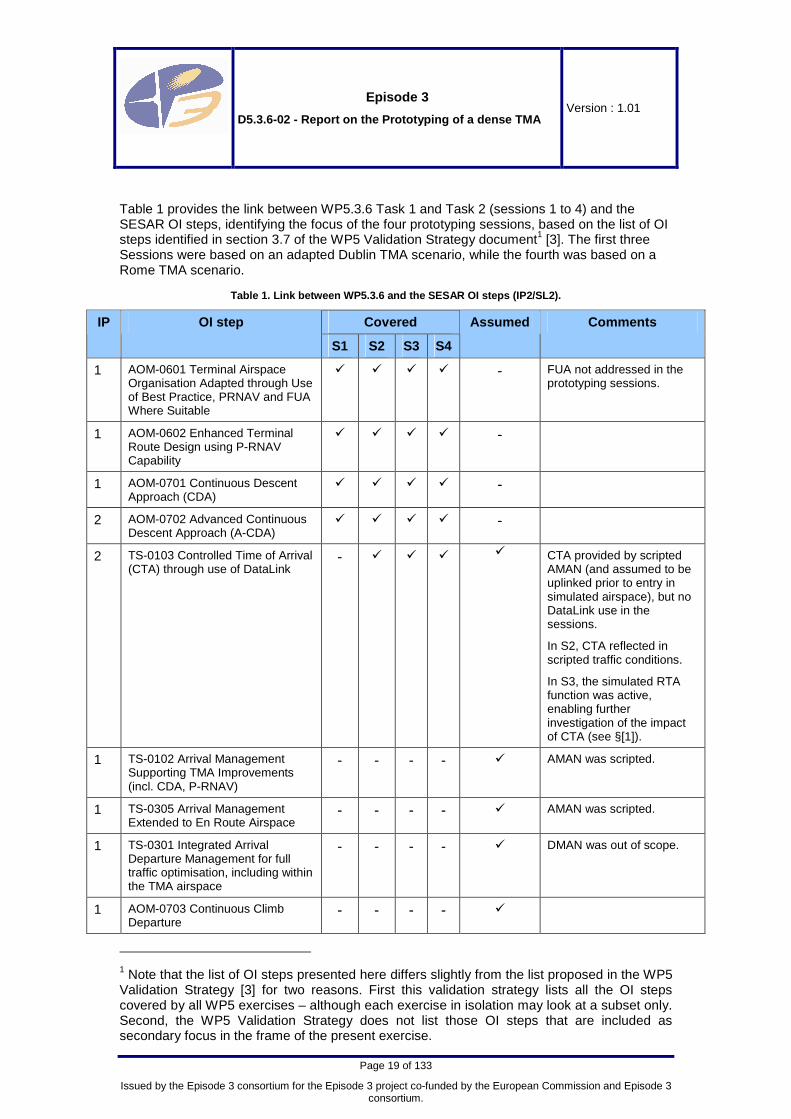
Table 1 provides the link between WP5.3.6 Task 1 and Task 2 (sessions 1 to 4) and the SESAR OI steps, identifying the focus of the four prototyping sessions, based on the list of OI steps identified in section 3.7 of the WP5 Validation Strategy document1 [3]. The first three Sessions were based on an adapted Dublin TMA scenario, while the fourth was based on a Rome TMA scenario.
Table 1. Link between WP5.3.6 and the SESAR OI step s (IP2/SL2).
Covered IP OI step
S1 S2 S3 S4
Assumed Comments
1 AOM-0601 Terminal Airspace Organisation Adapted through Use of Best Practice, PRNAV and FUA Where Suitable
� � � � - FUA not addressed in the prototyping sessions.
1 AOM-0602 Enhanced Terminal Route Design using P-RNAV Capability
� � � � -
1 AOM-0701 Continuous Descent Approach (CDA)
� � � � -
2 AOM-0702 Advanced Continuous Descent Approach (A-CDA)
� � � � -
2 TS-0103 Controlled Time of Arrival (CTA) through use of DataLink
- � � � � CTA provided by scripted AMAN (and assumed to be uplinked prior to entry in simulated airspace), but no DataLink use in the sessions.
In S2, CTA reflected in scripted traffic conditions.
In S3, the simulated RTA function was active, enabling further investigation of the impact of CTA (see §[1]).
1 TS-0102 Arrival Management Supporting TMA Improvements (incl. CDA, P-RNAV)
- - - - � AMAN was scripted.
1 TS-0305 Arrival Management Extended to En Route Airspace
- - - - � AMAN was scripted.
1 TS-0301 Integrated Arrival Departure Management for full traffic optimisation, including within the TMA airspace
- - - - � DMAN was out of scope.
1 AOM-0703 Continuous Climb Departure
- - - - �
1 Note that the list of OI steps presented here differs slightly from the list proposed in the WP5 Validation Strategy [3] for two reasons. First this validation strategy lists all the OI steps covered by all WP5 exercises – although each exercise in isolation may look at a subset only. Second, the WP5 Validation Strategy does not list those OI steps that are included as secondary focus in the frame of the present exercise.

Episode 3
D5.3.6-02 - Report on the Prototyping of a dense TMA Version : 1.01
Page 20 of 133
Issued by the Episode 3 consortium for the Episode 3 project co-funded by the European Commission and Episode 3 consortium.
Covered IP OI step
S1 S2 S3 S4
Assumed Comments
2 AOM-0705 Advanced Continuous Climb Departure
- - - - �
2 TS-0306 Optimised Departure Management in the Queue Management Process
- - - - � TTA mechanism for short flights not addressed.
2 CM-0601 Precision Trajectory Clearances (PTC)-2D Based On Pre-defined 2D Routes
- - - - �
2 TS-105 ASPA S&M Sequencing and Merging
- - - - � In S4, ASAS applications were tested. ASAS chains were established in the feeder sectors, not in the measured ones
The present series of prototyping sessions aimed mostly at concept clarification. Whereas the main focus of the prototyping sessions was on operability, initial trends on KPAs such as safety, efficiency, predictability, environmental sustainability and capacity were observed (Table 2). Note that the main focus of the fourth prototyping session was on operability, with initial trends on safety (situation awareness) looked for.
Table 2. KPA and KPI investigated during the four p rototyping sessions.
Focus KPA KPI
Main Operability Subjective feedback on suitability of the new working method, perceived benefits (reduced controller workload, standardised procedures, increased controller situation awareness, improved efficiency) and limitations.
Objective measure of changes in working practices (instructions repartition, geographical distribution of manoeuvre instructions, controller workload level).
Safety Controller situational awareness.
Number of short-term conflict alerts and of losses of separation.
Environmental Sustainability
Vertical trajectories.
3D containment of trajectory dispersion.
Fuel consumption.
Capacity Controller workload (subjective feedback, assessment and number of instructions issued).
Efficiency Vertical trajectories.
3D containment of trajectory dispersion.
Fuel consumption.
Secondary (trends)
Predictability Lateral/vertical flight paths.

Episode 3
D5.3.6-02 - Report on the Prototyping of a dense TMA Version : 1.01
Page 21 of 133
Issued by the Episode 3 consortium for the Episode 3 project co-funded by the European Commission and Episode 3 consortium.
2.2.1 Precision Area Navigation (P-RNAV)
IP1 AOM-0602 Enhanced Terminal Route Design using P -RNAV Capability
Area navigation (RNAV) is a method of navigation that permits aircraft operation on any desired flight path without the necessity to fly point-to-point between ground-based navigational aids (ICAO manual [11]). Aircraft RNAV equipment automatically determines aircraft desired flight path by a series of waypoints held in a database.
A further development of the concept of area navigation within the European region, Precision Area Navigation (P-RNAV) is being implemented in terminal airspace as an interim step to obtain increased operating capacity together with environmental benefits arising from route flexibility. In comparison to the Basic-RNAV (B-RNAV) procedures with cross-track accuracy of ±5NM, suitable for En Route operations, the Precision-RNAV (P-RNAV) procedures provide an enhanced track keeping accuracy of ±1NM, which makes them suitable for use in terminal airspace.
By enabling all aircraft to fly accurate and predictable flight paths in the terminal area, operators are provided with the opportunity to employ flight management systems to the best advantage, as well as allowing the enhancement of the efficiency of Terminal Airspace usage. In conjunction with other flight techniques such as Continuous Descent Approach (CDA) and ATC system support tools (e.g. Advanced Arrival Managers), P-RNAV is expected to form a cornerstone of ATM initiatives aimed at maximising the efficiency of Terminal Airspace and thereby providing economic, operational, capacity and environmental benefits to the aviation community.
2.2.2 Point Merge Procedure
IP1 AOM-0601 Terminal Airspace Organisation Adapted through Use of Best Practice, P-RNAV and FUA Where suitable
Point Merge [12] is a P-RNAV application that has been developed by EUROCONTROL as an innovative technique aiming at improving and standardising terminal airspace operations.
A Point Merge procedure associates a dedicated route structure with a systemised operating method to integrate arrival flows with extensive use of RNAV while keeping aircraft on FMS lateral navigation mode. It thus enables an efficient use of FMS advanced functions and consequent optimisation of vertical profiles, making it possible to apply Continuous Descent Approaches (CDAs) even under high traffic load. Open-loop radar vectoring is not used, except for recovering from unexpected situations.
The dedicated RNAV route structure relies on the following key elements: merge point and sequencing legs.
Integration of arrival flows is performed by merging inbound flows to a single common point (merge point) using “Direct-to” instructions. After this merge point, aircraft are established on a fixed common route until the exit of the point merge system.
Before the merge point, a sequencing leg of a pre-defined length is dedicated to path stretching/shortening for each inbound flow (Figure 2). While along a sequencing leg, aircraft can be instructed to fly direct to the merge point at any appropriate time (i.e. be kept for a certain amount of time on the leg for path stretching, or inversely sent early direct to the merge point for path shortening).

Episode 3
D5.3.6-02 - Report on the Prototyping of a dense TMA Version : 1.01
Page 22 of 133
Issued by the Episode 3 consortium for the Episode 3 project co-funded by the European Commission and Episode 3 consortium.
Figure 2. Point merge system - example with two par allel and curved sequencing legs.
The geometry of the point merge system (based on equidistance of any point of the sequencing legs to the merge point) ensures that the controller can easily and intuitively determine the appropriate moment to issue the Direct-to instructions for each aircraft, based on its spacing with the preceding aircraft in the sequence, and without requiring the support of any new ground tool.
Finally, although Point Merge mainly deals with 2D improvements for arrivals, it is expected to form a sound foundation on top of which further improvements can be envisaged in line with SESAR concepts. Among these are:
• Continuous Descent Approaches (towards improved 3D profiles);
• Towards trajectory-based operations in the context of SESAR: introduction of 4D trajectory management (including adherence to an agreed or constrained time of arrival);
• And at a later stage, improvement of spacing accuracy with adapted ground tools use of pre-defined RNAV routes (ultimately allocation thereof) with advanced ground support/decision tools, and/or ASAS – sequencing and merging.
The first two elements above are fully consistent with the objective of the WP5.3.6/Task 1 prototyping sessions. Note that the third element is addressed in WP5.3.6/Task 2.
Notes:
1. Flexible Use of Airspace (FUA) is outside the scope of WP5.3.6.
2. Point Merge is not the overall objective of EP3 WP5.3.6. It is an integral part of the airspace design used in these prototyping sessions, and it is being seen as one short term implementation solution, but its inclusion here is primarily intended to provide a sound basis on which further operational improvements (OIs) in the SESAR Master Plan might be achieved. The focus of the Episode 3 WP5.3.6 prototyping sessions is to build on the work previously carried out, in order to assess the operability of innovative (Precision) RNAV route

Episode 3
D5.3.6-02 - Report on the Prototyping of a dense TMA Version : 1.01
Page 23 of 133
Issued by the Episode 3 consortium for the Episode 3 project co-funded by the European Commission and Episode 3 consortium.
structures in the TMA together with the provision of Continuous Descent Arrival procedures from the En Route system down to the final approach segment (WP5.3.6 Task 1 and Task 2). In addition, the link to 4D/time constraints (CTA) is being introduced during the Task 1 sessions, while ASAS sequencing and merging is introduced in session 4 (Task 2).
Therefore, the added value of WP5.3.6 prototyping exercise lies in the introduction of further functionality in an iterative manner across the sessions.
2.2.3 Continuous Descent Approach (CDA) and Advanced Continuous Descent Approach (A-CDA)
IP2 AOM-0701 Continuous Descent Approach (CDA)
IP2 AOM-0702 Advanced Continuous Descent Approach ( A-CDA)
The CDA concept aims at environmental or flight-efficiency benefits (reduction in noise and gaseous emissions and in fuel consumption). At present several non-harmonised applications of CDA are in operation in Europe. To address this issue, EUROCONTROL has produced a CDA Implementation Guidance Information brochure [13] with the aim of providing “guidance for the local implementation of a simple and effective CDA technique that does not adversely affect capacity in high-density air traffic situations”.
ICAO working arrangements are in the process of assessing CDA on a global scale and may also produce CDA guidance. At present, and in the absence of an internationally agreed definition of Continuous Descent Approach, EUROCONTROL proposes the following: “Continuous Descent Approach is an aircraft operating technique in which an arriving aircraft descends from an optimal position with minimum thrust and avoids level flight to the extent permitted by the safe operation of the aircraft and compliance with published procedures and ATC instructions.” (from [13]2).
As local conditions require, CDA may comprise any of the following:
• STAR-based CDA: Standard Terminal Arrival Routes (STARs) (including transitions) which may be designed with vertical profiles. The routes may be tailored to avoid noise-sensitive areas as well as including the vertical profile (ICAO PANS-OPS [14]) and the provision of Distance To Go (DTG) information;
• Radar-based CDA: the provision of “distance from touchdown” (hereinafter referred to in this document as “distance to go” (DTG)) information by Air Traffic Control during vectoring;
• A combination of these two: STARs being used in low traffic density, and DTG estimates being issued by ATC as and when radar intervention is required e.g. during busy periods.
CDA can be optimized within energy, speed and safety constraints by avoiding, as far as possible, unnecessary flap, air brake and engine thrust and avoiding early lowering of landing gear. Aircraft energy and speed management are therefore critical factors in successful CDA implementation. CDAs provide a first level of benefits in the frame of a trade-off between flight efficiency on the one hand and capacity on the other hand; STAR-based CDAs being generally possible only in low traffic density.
The use of Point Merge in TMA provides benefits in terms of both:
2 EUROCONTROL - Continuous Descent Approach, Implementation Guidance Information, May 2008, Introduction, page 9.
Episode 3
D5.3.6-02 - Report on the Prototyping of a dense TMA Version : 1.01
Page 24 of 133
Issued by the Episode 3 consortium for the Episode 3 project co-funded by the European Commission and Episode 3 consortium.
• Predictability and capacity on the one hand (flights follow a P-RNAV procedure, with sufficient built-in flexibility in path stretching/shortening so as to enable high density operations);
• Flight efficiency and environmental impact on the other hand (as the procedure enables Continuous Descent Approaches – at least from the sequencing legs).
According to the SESAR definition of OI Step AOM-0702, the term “Advanced Continuous Descent Approach” (A-CDA) refers to the harmonised implementation of CDA in high traffic density, relying on further developments of RNAV procedures, complemented by appropriate ground support tools as needed. A-CDA is expected to bring an improved benefit compared to CDA, as it enables increased flight efficiency even under high traffic load.
In this context, the Episode 3 WP5.3.6 TMA prototyping sessions study a form of A-CDA, as they involve continuous descents in high traffic density.
Note: A-CDAs in the Episode 3 WP5.3.6 TMA prototyping sessions are also considered from delivery into the TMA, i.e. from the TOD for short flights - down to the Final Approach Fix (FAF).
2.2.4 Advanced Arrival Manager (AMAN)
IP1 TS-0102 Arrival Management Supporting TMA Impro vements (incl. CDA, P-RNAV)
AMAN is a sequence planning and support tool for arriving traffic. System trajectories for airborne and non-airborne aircraft are assessed to accurately determine runway demand ahead of expected use. AMAN uses data from the surveillance system (through the trajectory prediction function) and is supported by the flight data processing system. The AMAN operational horizon defines the time based area for which the Arrival Manager is responsible.
A major objective of AMAN is to advise controllers in upstream ACC sectors to adjust approaching flights in a manner ensuring a smooth flow of traffic entering the TMA in order to use the airport’s capacity in the most efficient way.
The AMAN functionality:
• Proposes the initial arrival sequence, based on the first-come, first-served rule, for the stream of inbound traffic considered, and subsequently optimises it to take into account different factors;
• Generates advisories for the controllers in order to meet and maintain the optimised arrival sequence;
• Presents advisories to controllers through the timeline HMI;
• Adapts the display of the proposed inbound traffic sequence to the actual traffic evolution taking into account the controller decisions deemed necessary to optimise the sequence.
It comprises three areas of different functionality:
• Eligibility Horizon: This range includes all flights which are relevant for consideration by the AMAN function. These inbound flights are inserted into a natural sequence (AMAN) based on the first-come, first-served rule. The natural sequence (AMAN) serves the controller as a kind of sector load forecast for the inbound traffic;
• Active Advisory Horizon: For flights within this area, an optimised arrival sequence will be generated with sufficient stability for time advisories to be provided to the controller. Sequence order, as well as time to lose or gain or holding advisories are given within the active advisory horizon but outside the common path horizon;

Episode 3
D5.3.6-02 - Report on the Prototyping of a dense TMA Version : 1.01
Page 25 of 133
Issued by the Episode 3 consortium for the Episode 3 project co-funded by the European Commission and Episode 3 consortium.
• Common Path Horizon: The common path horizon should be kept as small as possible (e.g. final approach). At this stage, the sequence is established and the objective is to ensure that the required spacing between consecutive arrivals is maintained. Advisories are no longer needed.
Within the context of the Episode 3 TMA prototyping sessions, AMAN operation was simulated through providing traffic samples with scripted metered arrival traffic flows (as detailed at the end of §2.2.5).
2.2.5 Controlled Time of Arrival (CTA)
IP2 TS-0103 Controlled Time of Arrival (CTA) throug h use of DataLink
The Controlled Time of Arrival (CTA) is a time constraint over the runway threshold, or Final Approach Fix (FAF), or an upstream point (possibly the IAF) to assist in queue management.
The SESAR ConOps [8]3 states that:
“A CTA (which includes wake vortex optimisation) will be calculated after the flight is airborne and published to the relevant controllers, arrival airport systems, user systems and the pilot:
• For a short flight the CTA should be very close to the pre-take-off TTA (Target Time of Arrival) and is calculated as soon as the flight is airborne. Any ground delay implemented to meet the TTA is taken into account when the CTA is calculated;
• For longer flights the CTA must be available well before planned Top-Of-Descent (TOD) and will be calculated when the flight passes the AMAN sequencing horizon.
All partners in the system now work towards achieving the CTA. When initially issued the CTA represents the current optimised sequence that can still be changed if circumstances dictate. The CTA will be ‘frozen’ at a certain time horizon in order to ensure sequence stability.”
A CTA is allocated when entering the AMAN horizon, before TOD, and books a place in the Arrival queue. Between AMAN advisory horizon and AMAN Frozen horizon, the CTA can still be updated. However, once in the Frozen horizon (and later in TMA), the CTA should no longer be updated. SESAR describes a larger AMAN horizon than exists currently (of the order of 40min or 200 NM). In the second and third Episode 3 TMA prototyping sessions, the CTA is described with a time window granularity of +/- 30 sec calculated at the IAFs4.
Within the context of the second and third Episode 3 TMA prototyping session, the CTA concept was simulated through:
• Providing traffic with entry conditions reflecting CTA achievement in En Route. These entry conditions (flight ‘navigation start’ time in the simulation) were scripted in the traffic samples.
• The employment of suitably equipped aircraft (RTA FMS functionality). The simulated RTA FMS function is expected to fly the aircraft so as to meet the CTA constraint at the IAF within a defined tolerance window (+/- 30 sec). The allocated CTA is part of the aircraft entry conditions, and it is not updated during the course of the flight towards the IAF.
The third session also tested scenarios in which mixed RTA equipage conditions exist. The non RTA capable aircraft were also allocated a CTA over the IAF. However for these aircraft
3 DLT-0612-222-01-00 - SESAR Concept of Operations, version 2, October 2007, §F.4.2.2, Queue Management Process, page 109. 4 The +/- 30s time window granularity is an example value, taken from the interim G-DOD, §11.2.17 [19].

Episode 3
D5.3.6-02 - Report on the Prototyping of a dense TMA Version : 1.01
Page 26 of 133
Issued by the Episode 3 consortium for the Episode 3 project co-funded by the European Commission and Episode 3 consortium.
the achievement of such time constraints was subject to controllers’ actions. As a result it is expected that the CTAs will then be met within a wider tolerance window (greater than +/- 30 sec). Note that for these sessions, a printed arrival list was used to inform the controllers of the aircraft CTAs.
2.2.6 ASPA Sequencing & Merging
IP2 TS-0105 ASPA S&M Sequencing and Merging
In ASAS Airborne Spacing applications the role of separator is retained by ATC, whilst the task to achieve a prescribed spacing (expressed in time or distance), with regard to another designated target aircraft, is temporarily delegated to aircrew under specific circumstances. The aircrew is supported in this task by automation capabilities (including Air-Air Surveillance and specific ASAS applications).
The controller shall designate the target aircraft and specify the scope of the manoeuvre allowing the flight crew to conduct it in the most efficient way possible.
The controller shall assure that no other aircraft interfere with the ASAS manoeuvre and the flight crew shall assure that spacing is achieved with the target aircraft as stipulated by ATC.
ASAS Spacing is expected to bring benefits (such as e.g. reduction in R/T load, in ATC workload, and increased spacing accuracy) in particular for arrival sequencing and merging operations in terminal airspace.
Within the context of the Episode 3 4th TMA prototyping session, the impact of already settled ASPA – S&M chains (settled by the Feeder Sector) in a PMS Environment was evaluated. ASAS operations were simulated through the provision of ASAS pre-linked aircraft chains established by the upstream sectors acting as feeder of the simulated scenario. The ASAS chains will be interrupted before entering the Sequencing legs.
2.3 STAKEHOLDERS AND THEIR EXPECTATIONS
At present, capacity at airports, i.e. their infrastructure and consequentially TMAs, is primarily the limiting factor of overall system capacity, with contribution of the En Route sector to delays at historically low levels. The most important stakeholders are the airspace users and their requirements as expressed in SESAR D2 [15]. However, airspace users are not directly involved in Episode 3. Their needs were taken into account through the use of the relevant SESAR documentation. In the present validation activity, the focus is put on improvements of route structure (P-RNAV), introduction of advanced descent procedure (advanced continuous descent approach) and respect of time constraints (controlled time of arrival). Involved stakeholders are the European Commission, SESAR Joint Undertaking and the project partners, divided in the ANSP and research community group. From an Episode 3 internal stakeholder point of view, active controllers from ANSP were involved in the preparation and execution of the TMA prototyping sessions. This secured a realistic operational feedback and evaluation of the results. The management of the stakeholders expects the following evidence in order to have sufficient confidence in the validation results (see Table 3). Note that in the context of the prototyping sessions, only a sub-part of the following expectations and concerns can be addressed (i.e. essentially those of involved stakeholders).

Episode 3
D5.3.6-02 - Report on the Prototyping of a dense TMA Version : 1.01
Page 27 of 133
Issued by the Episode 3 consortium for the Episode 3 project co-funded by the European Commission and Episode 3 consortium.
Table 3. Stakeholder expectations.
Stakeholder Involvement Expectations Concerns
Controllers A core team of controllers participates in the preparation of the prototyping sessions (airspace, traffic definition and testing, platform acceptance).
TMA controllers participate in the prototyping sessions, providing feedback to assess the operability, acceptability and initial benefits and limitations of the concept.
Reduced workload due to less complex and less demanding tasks.
Reduced communication load.
Improved situation awareness.
Controllers are direct users of the new procedures.
As their acceptance is essential for the concept implementation, their concerns must be addressed.
Typically, the use of new procedures might reduce flexibility and reduce controllers' opportunity to use vectors. They will be concerned by the loss of their vectoring skills, their ability to handle unexpected events and a possible reduced job satisfaction.
Pilots Even though they are not involved in the prototyping sessions, pilots are represented in the expert group when scoping the prototyping sessions.
Improved situation awareness.
Better anticipation of actions.
Reduced communication load.
Pilots' main concern is the operational acceptability of the P-RNAV/CDA procedure.
ANSP Represented by the controllers involved in the preparation and conduct of the prototyping sessions.
Structured and standardised working method (facilitate qualification & training).
Better quality of service (maintain current runway throughput but during longer periods and with high accuracy).
Increase safety level.
The introduction of the new concept will require the redesign of airspace and procedures. It will also induce a cost in terms of staffing and qualifications (initial and recurrent training).
Airlines Not involved in the prototyping sessions.
Improved predictability (punctuality).
Improved flight efficiency.
Because of the costs of equipment (mostly for capability to comply with CTA -i.e. RTA functionality), the airlines need to be convinced of the benefits provided by the concept.
Industry Airframe/Avionics manufacturers involved in the TMA Expert Group.
Provision of stable (validated) requirements for pilots support tools.
Usable and used support tools.
The estimation of the costs of developing support tools (mainly the airborne RTA function) and the availability of stable requirement are required by the industry to provide on-time and appropriate tools.
General public (community)
Not involved in the prototyping sessions.
Improved predictability (punctuality).
Minimised environmental impact.
Improved safety.
The improved predictability and consequently punctuality of aircraft could be well appreciated by the public. However, the redesign of airspace will certainly induce a change of aircraft paths as well as a concentration of nuisance over a unique point (as opposed to today's diffuse nuisance) that could lead to general public rejection.

Episode 3
D5.3.6-02 - Report on the Prototyping of a dense TMA Version : 1.01
Page 28 of 133
Issued by the Episode 3 consortium for the Episode 3 project co-funded by the European Commission and Episode 3 consortium.
Stakeholder Involvement Expectations Concerns
Regulatory authorities (incl. EC)
Not involved in the prototyping sessions.
Standardised procedures and safe operations.
Regulatory authorities responsible for the approval of standardised procedures. They will also need evidence of safety benefits (or at least the absence of safety degradation).

Episode 3
D5.3.6-02 - Report on the Prototyping of a dense TMA Version : 1.01
Page 29 of 133
Issued by the Episode 3 consortium for the Episode 3 project co-funded by the European Commission and Episode 3 consortium.
3 VALIDATION METHODOLOGY
3.1 PROTOTYPING APPROACH
In order to make progress in the concept clarification as part of the Episode 3 project, it was decided to investigate the feasibility and operability of P-RNAV, A-CDA and CTA (and ASPA-S&M as far as session 4 was concerned), following a prototyping approach.
Prototyping sessions were considered the most appropriate technique to assess the feasibility and acceptability of the improved TMA organisation and procedures, within the new Episode 3 timescales, and at this level of concept maturity. Prototyping sessions address the concepts clarification objectives in an efficient manner. They are an intermediate type of validation technique between expert groups, gaming exercises, and full scale fast-time and real-time simulations.
Furthermore, they are a compromise between sufficient realism and a flexible/iterative approach in close co-operation with WP5 TMA Expert Group. The iterative approach enables specific aspects of the concept to be assessed separately (possibly in a simplified environment), and then gradually integrated when sufficient maturity is reached.
In line with the principle of iterative approach and as initial validation steps, the WP5.3.6 series of prototyping sessions focused on the intermediate timeframe (Implementation Package 2, see Table 1). It is anticipated that, beyond Episode 3, further validation activities addressing the same topics such as a full-scale real-time simulation will have to be conducted.
3.2 LINKS WITH EXPERT GROUPS, DODS AND MODELLING ACTIVITIES
The prototyping activity is part of a larger validation strategy [3]. The four prototyping sessions were carried out in the SESAR TMA Environment, in close co-operation with the TMA Expert Group (WP5.3.1), taking advantage of the iterative nature of the sessions.
After each prototyping session, an Expert Group meeting was convened by WP5.3.1 to agree on the scope and content of the next session, based on a presentation of initial feedback on the one just conducted. Some scoping and direction for the sessions (in particular the first one) had already been addressed in the TMA Expert Group that took place on April 1st-2nd 2008, before the project suspension [16].
In this sub-Work Package the support of Operational staff was essential for the validity and successful delivery of meaningful results. The same group of operational experts was involved from the preparation of the experiment onwards while the experimental subjects were current operational controllers experienced in busy airspace.
The links with Fast Time activities (WP5.3.4 and WP5.3.5) was managed by the TMA Expert Group which co-ordination role sits between WP5.2 and WP5.3.x (EP3 WP5 PMP [17]).
Finally, regarding the DODs (Detailed Operational Descriptions), WP5.2.2 provided Operational Scenarios according to the exercise needs. The corresponding scenario supporting WP5.3.6 Task 1 is “Flying CDA merging”, in the context of route structures deployed in a dense TMA (EP3 OS-35 [18]).
In accordance with the Episode 3 DoW [10], and in the frame of E-OCVM step 5 [2], the Episode 3 WP5 Expert Group and the WP5.2 activities are expected to use the output of the prototyping sessions, where deemed appropriate, as inputs to the Scenario and Use Case development/update in the G-DOD [19] and E5 Arrival-Departures DOD document (§4.1.4.2, Implement Arrival Queue) [20].

Episode 3
D5.3.6-02 - Report on the Prototyping of a dense TMA Version : 1.01
Page 30 of 133
Issued by the Episode 3 consortium for the Episode 3 project co-funded by the European Commission and Episode 3 consortium.
4 TASK 1
4.1 EXPERIMENT AND STRATEGY PLANNING
4.1.1 Main objectives
The improvement of TMA route structures (e.g. using P-RNAV SIDS and STARS and a Point Merge System), combined with the optimisation of descent procedures (e.g. with Continuous Descent Approach) and the use of time constraints (e.g. Controlled Time of Arrival) is expected to provide benefits in terms of efficiency (optimised flight profile), predictability (adherence to pre-defined trajectory), environmental sustainability and capacity (optimised airspace usage and reduced controller workload), while preserving the same level of safety. The suitability of the new working methods and perceived benefits (reduced controller workload, standardised procedures, increased controller situation awareness, improved efficiency) are expected to result in operational acceptance.
In this context, the main aim of WP5.3.6 is to provide evidence on the operability from the ground standpoint of the various techniques and procedures envisaged in TMA (i.e. P-RNAV, CDA, CTA and ASPA S&M). The series of prototyping sessions also aim, as secondary focus, at assessing the impact and perceived benefits of aircraft adhering to a RBT with CTA while achieving a CDA. The prototyping sessions are envisaged as complementary steps towards the assessment of new ATM techniques in managing traffic in a dense TMA.
4.1.2 Stepped Approach
The step-wise approach introduced to address the operational feasibility of the P-RNAV, A-CDA, CTA was guided by the following motivations:
• Progressive introduction to and implementation of the concepts: first P-RNAV and A-CDA, then CTA;
• Progressive increase of complexity, with an initial focus on P-RNAV and A-CDA, before investigating the impact of varying aircraft RTA equipage on acceptability and feasibility of handling arrivals in TMA;
• Progressive extension of scope: feasibility, acceptability including compatibility with other controller tasks before performance assessment.
The experiment was conducted over three separate but successive sessions with each session designed to introduce new elements (e.g. airspace improvements, varied entry conditions). At the end of the first and second sessions the results and comments from the controllers resulted in changes for the next session.
The approach also involved iterative interactions with WP5.3.1 (TMA Expert Group). Outputs from each session, combined with outputs from the Expert Group serve as inputs to scope the following session.
A brief summary of each prototyping session is as follows:
• Session 1:
o The airspace was based on a modified/adapted Dublin TMA, with a Point Merge system composed of two sequencing legs (with a partial overlap) and a merge point; North and South arrival flows were balanced and ideally metered.
o Advanced Continuous Descent Approaches (A-CDA) were enabled to the extent possible, including the sequencing legs (before aircraft reached the

Episode 3
D5.3.6-02 - Report on the Prototyping of a dense TMA Version : 1.01
Page 31 of 133
Issued by the Episode 3 consortium for the Episode 3 project co-funded by the European Commission and Episode 3 consortium.
‘overlapping’ area of the legs); traffic was scripted to replicate upstream compliance with Arrival Manager information; four wind conditions were tested.
o The aim was to get an initial feedback from the controllers on the acceptability and operational feasibility of A-CDA from TOD to FAF in P-RNAV environment with emphasis on the period between the sequence legs and the FAF.
• Session 2:
o As Session 1 but with the Point Merge system modified (dissociated legs, two merge points and a common point further down – see §4.1.5.1 below) to avoid head to head convergence to the merge point and aircraft being delivered to the appropriate TMA metering points in accordance with Controlled Time of Arrival (CTA) instructions.
o The time constraints were scripted in the traffic to reflect the respect of CTA in upstream sectors. Various arrival cluster sizes and three wind conditions were tested.
o The aim was to assess the impact of cluster size and of aircraft respecting the time constraints at the IAF (CTA scripted in the traffic presentation) on the acceptability and operational feasibility of A-CDA down to FAF in the improved P-RNAV environment.
• Session 3:
o As Session 2 but with various proportions of aircraft being RTA equipped and meeting CTA constraint at the IAF through simulated aircraft RTA function, driving automatic speed adjustments.
o Mixed level of RTA equipage and focus on the two most demanding/challenging wind conditions tested.
o The aim was to further assess the impact of mixed RTA equipage and of aircraft respecting the time constraints on the IAF (CTA) on the acceptability and operational feasibility of A-CDA down to FAF in the P-RNAV environment.
4.1.3 Prototyping sessions’ objectives
The assessment of P-RNAV, A-CDA and CTA feasibility and acceptability was broken into two sub-objectives:
• Objective 1: Familiarise controllers with the TMA concepts;
• Objective 2: Assess operability and acceptability of the TMA concepts.
Table 4 summarises the coverage of these objectives during each of the three prototyping sessions. Detailed objectives of each of the three sessions can be found in the consolidated experimental plan [1].
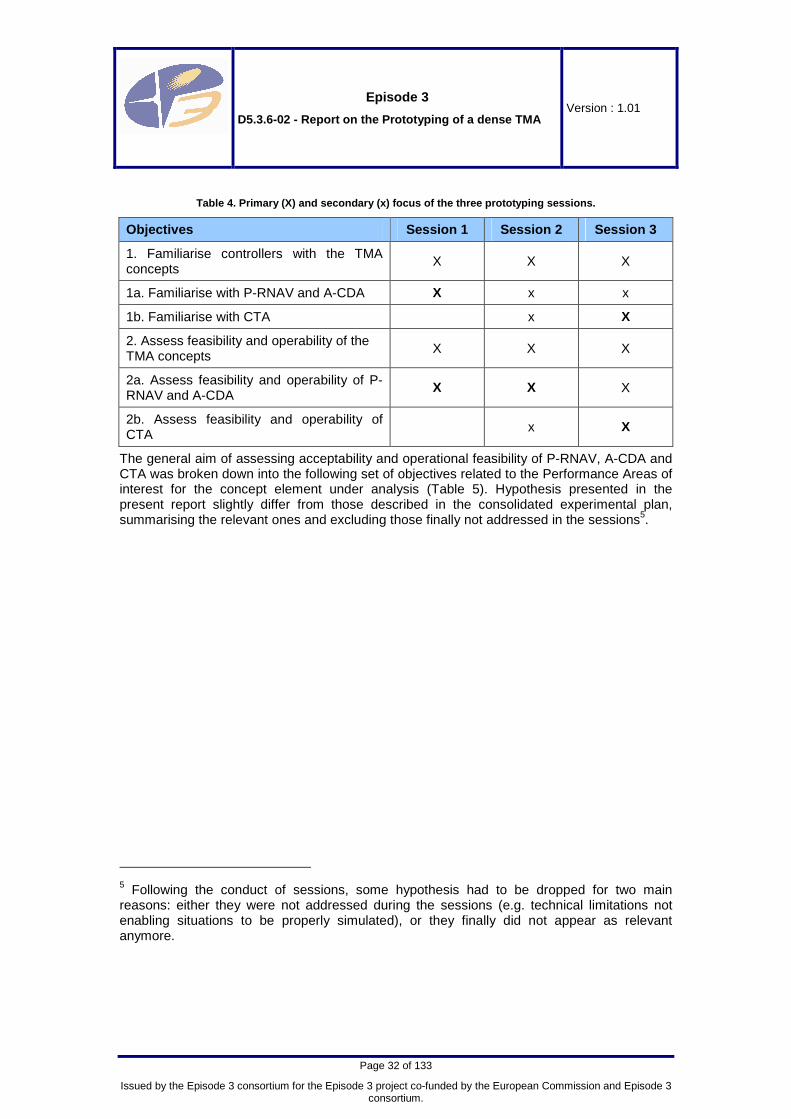
Episode 3
D5.3.6-02 - Report on the Prototyping of a dense TMA Version : 1.01
Page 32 of 133
Issued by the Episode 3 consortium for the Episode 3 project co-funded by the European Commission and Episode 3 consortium.
Table 4. Primary (X) and secondary (x) focus of the three prototyping sessions.
Objectives Session 1 Session 2 Session 3
1. Familiarise controllers with the TMA concepts
X X X
1a. Familiarise with P-RNAV and A-CDA X x x
1b. Familiarise with CTA x X
2. Assess feasibility and operability of the TMA concepts
X X X
2a. Assess feasibility and operability of P-RNAV and A-CDA
X X X
2b. Assess feasibility and operability of CTA
x X
The general aim of assessing acceptability and operational feasibility of P-RNAV, A-CDA and CTA was broken down into the following set of objectives related to the Performance Areas of interest for the concept element under analysis (Table 5). Hypothesis presented in the present report slightly differ from those described in the consolidated experimental plan, summarising the relevant ones and excluding those finally not addressed in the sessions5.
5 Following the conduct of sessions, some hypothesis had to be dropped for two main reasons: either they were not addressed during the sessions (e.g. technical limitations not enabling situations to be properly simulated), or they finally did not appear as relevant anymore.
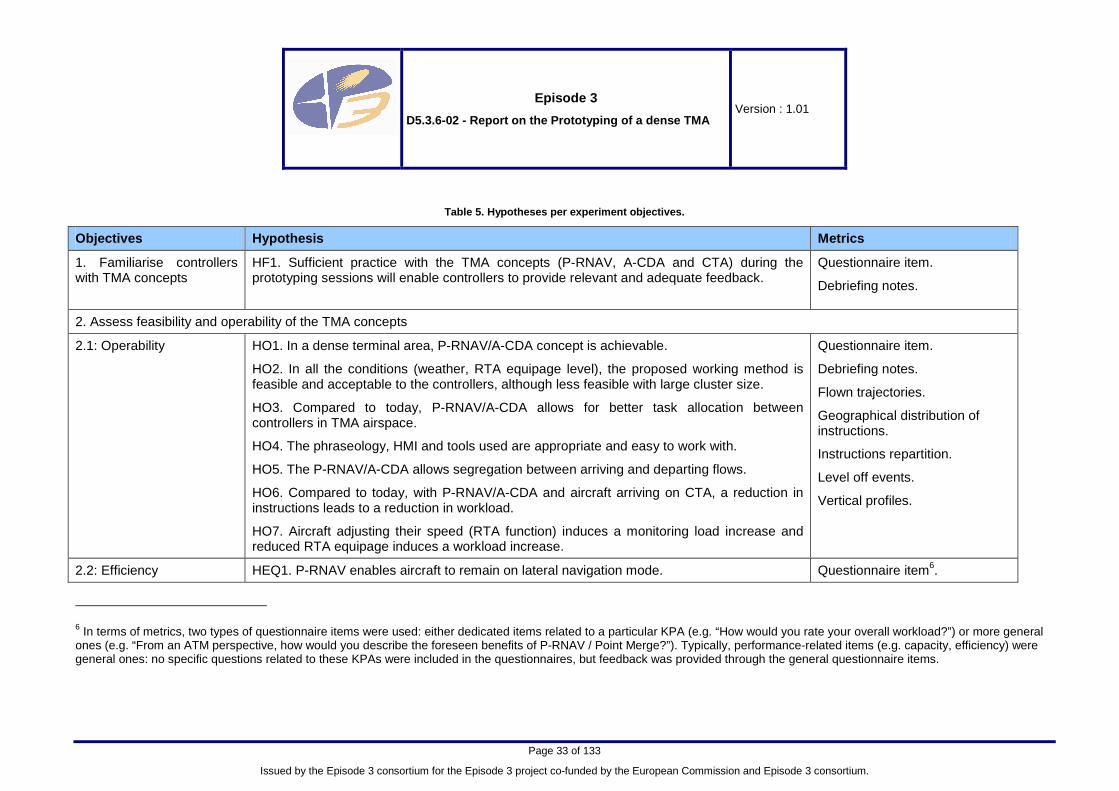
Episode 3
D5.3.6-02 - Report on the Prototyping of a dense TM A Version : 1.01
Page 33 of 133
Issued by the Episode 3 consortium for the Episode 3 project co-funded by the European Commission and Episode 3 consortium.
Table 5. Hypotheses per experiment objectives.
Objectives Hypothesis Metrics
1. Familiarise controllers with TMA concepts
HF1. Sufficient practice with the TMA concepts (P-RNAV, A-CDA and CTA) during the prototyping sessions will enable controllers to provide relevant and adequate feedback.
Questionnaire item.
Debriefing notes.
2. Assess feasibility and operability of the TMA concepts
2.1: Operability HO1. In a dense terminal area, P-RNAV/A-CDA concept is achievable.
HO2. In all the conditions (weather, RTA equipage level), the proposed working method is feasible and acceptable to the controllers, although less feasible with large cluster size.
HO3. Compared to today, P-RNAV/A-CDA allows for better task allocation between controllers in TMA airspace.
HO4. The phraseology, HMI and tools used are appropriate and easy to work with.
HO5. The P-RNAV/A-CDA allows segregation between arriving and departing flows.
HO6. Compared to today, with P-RNAV/A-CDA and aircraft arriving on CTA, a reduction in instructions leads to a reduction in workload.
HO7. Aircraft adjusting their speed (RTA function) induces a monitoring load increase and reduced RTA equipage induces a workload increase.
Questionnaire item.
Debriefing notes.
Flown trajectories.
Geographical distribution of instructions.
Instructions repartition.
Level off events.
Vertical profiles.
2.2: Efficiency HEQ1. P-RNAV enables aircraft to remain on lateral navigation mode. Questionnaire item6.
6 In terms of metrics, two types of questionnaire items were used: either dedicated items related to a particular KPA (e.g. “How would you rate your overall workload?”) or more general ones (e.g. “From an ATM perspective, how would you describe the foreseen benefits of P-RNAV / Point Merge?”). Typically, performance-related items (e.g. capacity, efficiency) were general ones: no specific questions related to these KPAs were included in the questionnaires, but feedback was provided through the general questionnaire items.

Episode 3
D5.3.6-02 - Report on the Prototyping of a dense TM A Version : 1.01
Page 34 of 133
Issued by the Episode 3 consortium for the Episode 3 project co-funded by the European Commission and Episode 3 consortium.
Objectives Hypothesis Metrics
HEQ2. P-RNAV/A-CDA allows for a regular spacing at the runway.
HEQ3. Reduced RTA equipage degrades the level of metering at the IAFs which induces an increase in sequencing legs usage.
HEQ4. P-RNAV/A-CDA allows for equal management of arrival flows in all the conditions.
HEF1. A-CDA and CTA in a P-RNAV environment enables homogeneous vertical profiles.
HEF2. With A-CDA and CTA in a P-RNAV environment the distance flown in terminal area is close to the planned trajectory.
HEF3. Reduced RTA equipage increases the distance flown and the fuel consumption.
Debriefing notes.
Flown trajectories.
Inter-aircraft spacing.
Level off events.
Time spent in open loop vectors.
Track miles.
Vertical and speed profiles.
2.3: Predictability HP1. The use of P-RNAV and CTA contains the track dispersion.
HP2. The use of P-RNAV and CTA allows for limited use of open-loop instructions (e.g. headings).
Questionnaire item.
Debriefing notes.
Flown trajectories.
Time spent on open loop vectors.
2.4: Safety HS1. Compared to today, P-RNAV enables earlier anticipation by controllers and contributes to maintaining a clear picture of the traffic.
HS2. Compared to today, A-CDA and CTA degrade the situation awareness, in preventing controllers from knowing when exactly aircraft will initiate their descent and when/how exactly they will adjust the speed.
HS3. Compared to today, whatever the RTA equipage level, P-RNAV/A-CDA increases controllers’ perceived level of safety.
HS4. There is no safety hazard because of segregation of arriving and departing flows.
Questionnaire item.
Debriefing notes.
Geographical distribution of instructions.
Number and severity of losses of separation.

Episode 3
D5.3.6-02 - Report on the Prototyping of a dense TM A Version : 1.01
Page 35 of 133
Issued by the Episode 3 consortium for the Episode 3 project co-funded by the European Commission and Episode 3 consortium.
Objectives Hypothesis Metrics
2.5: Capacity HC1. With P-RNAV/A-CDA and with aircraft arriving within CTA tolerance window, the expected throughput is achieved (for non RTA capable aircraft the tolerance window may be wider than +/- 30 sec).
Questionnaire item.
Debriefing notes.
Throughput at FAF.
2.6. Environment HEN1. Compared to today, P-RNAV/A-CDA reduces gaseous emissions because of efficient vertical profiles, reduction of level off, reduction of open-loop manoeuvres and stacks.
Questionnaire item.
Debriefing notes.
Level off events.
Time spent on open-loop vectors.
Vertical and speed profiles.

Episode 3
D5.3.6-02 - Report on the Prototyping of a dense TMA Version : 1.01
Page 36 of 133
Issued by the Episode 3 consortium for the Episode 3 project co-funded by the European Commission and Episode 3 consortium.
4.1.4 Methods and techniques
4.1.4.1 Measurements
4.1.4.1.1 Subjective measurements
The subjective measurements tools mainly consisted of questionnaires and debriefing conducted with the participants. In addition, in so far as possible, spontaneous controllers’ comments were recorded (i.e. noted down) by the observers.
Note that samples of the questionnaires used are provided in the WP5.3.6 Experimental Plan [1].
4.1.4.1.1.1 Questionnaires 4.1.4.1.1.1.1 Entry questionnaire
A brief questionnaire was filled at the beginning of the simulation to collect participants’ experiences and level of familiarity with the features and concept tested.
4.1.4.1.1.1.2 Post run questionnaire
The post run questionnaire included questions on the concept (e.g. P-RNAV, A-CDA, CTA), with a specific focus on workload, situation awareness, feasibility and acceptability (of the concept and the induced new working method). The participants were tasked to complete it at the end of each run to assess impact of the condition on their performance and feedback.
4.1.4.1.1.1.3 Final questionnaire
At the end of each prototyping session, a specific questionnaire was distributed to capture the global acceptability of the organisation, the working methods and procedures as well as collect suggestions for improvements and for open issues to investigate in following prototyping sessions.
4.1.4.1.1.2 Debriefings
At the end of each run, a short debriefing (15 minutes) was conducted to collect feedback concerning the run.
Daily debriefings took place at the end of each day to collate participants’ feedback over the three daily runs and discuss specific topics of interest.
In addition a final debriefing was conducted at the end of the session to collect feedback regarding the acceptability of the concept, improvements required and issues to investigate during the following prototyping session.
4.1.4.1.1.3 Observations
Some elements of the experiment cannot be recorded from the simulation platform nor from the feedback of the controllers. Therefore, it is necessary to collect observations. Several means were used during the experiment to do so:
• SME observation: Subject Matter Experts (SMEs) observed some positions focusing on important points of the session;
• Human factors observation: Human factor experts followed the prototyping sessions and noted relevant events to be discussed later, during either collective or individual debriefing sessions.
4.1.4.1.2 Objective measurements
4.1.4.1.2.1 General requirements
Several aspects were assessed by objective data, collected by means of system recordings throughout the duration of the runs. The recorded data included controller and pilot inputs, communications (R/T and telephone) and aircraft navigation data.

Episode 3
D5.3.6-02 - Report on the Prototyping of a dense TMA Version : 1.01
Page 37 of 133
Issued by the Episode 3 consortium for the Episode 3 project co-funded by the European Commission and Episode 3 consortium.
The MUDPIE (Multiple User Data Processing Interactive Environment) analysis tool was used both to retrieve the recorded data (AIR, TELECOM and CWP) from the simulation platform and to deliver them in a format suitable for data analysis and exploration.
Data were collected during all the duration of the run (approximately 1h) and comprised also the traffic build-up period. However, the analysis period started when the first aircraft of the traffic sample reached the FAF and lasted 45 minutes.
The metrics used associated to KPA and performance indicators extracted from the Episode 3 Performance Framework [21] are summarised in Table 6. Detailed description of the metrics is available in the WP 5.3.6 prototyping sessions consolidated experimental plan [1].

Episode 3
D5.3.6-02 - Report on the Prototyping of a dense TM A Version : 1.01
Page 38 of 133
Issued by the Episode 3 consortium for the Episode 3 project co-funded by the European Commission and Episode 3 consortium.
Table 6. List of Episode 3 TMA metrics, with associ ated performance areas and corresponding sessions.
Performance Areas Metrics
Capacity Efficiency Environment Operability Safety Predictability Session Performance framework
Flown trajectories X X X All -
Geographical distribution of manoeuvre instructions
X X X All -
Instructions repartition X X X All CAP.LOCAL.TMA.PI8, SAF.LOCAL.TMA.PI3, SAF.LOCAL.TMA.PI4
Inter aircraft spacing X X X All -
Level off events X X All -
Number and severity of losses of separation X All SAF.LOCAL.TMA.PI2
Throughput at the FAF X All
CAP.LOCAL.TMA.PI1, CAP.LOCAL.TMA.PI5, CAP.LOCAL.TMA.PI6, CAP.LOCAL.TMA.PI7.
Time spent on open loop vector X X X 3 -
Track miles X All -
Vertical and speed profiles X X All -

Episode 3
D5.3.6-02 - Report on the Prototyping of a dense TMA Version : 1.01
Page 39 of 133
Issued by the Episode 3 consortium for the Episode 3 project co-funded by the European Commission and Episode 3 consortium.
4.1.5 Scenario Specifications
This section is related to step 2.5 of the E-OCVM. It reports more specifically the simulation environment (area, sectorisation…), traffic and working positions.
4.1.5.1 Airspace
The prototyping sessions considered the execution phase in a dense terminal environment with Performance Based Navigation (PBN) route structures and with a single airport. Normal operation scenario constituted the main target of the prototyping sessions. Normal operation scenarios aimed at experiencing the different concepts under normal operational conditions. They enabled the clarification and the evaluation of the concepts and the associated working methods.
In order to provide sufficient realism, the validation scenario was based on and included all of the airspace of Dublin CTA at and below FL 245; Dublin CTR; portions of Shannon UTA FL 245 – FL 660 and the Shannon CTA at and below FL 245 (Figure 3). The airspace also included delegated ATS from LATCC, MACC and ScATCC to Dublin ATCC.
The operations were based on future parallel runways RWY 10R/L at Dublin, with RWY10L dedicated to departures only and RWY10R to arrivals only.
All STARs used in the prototyping sessions were P-RNAV STARs. The arrival streams were fed into a Point Merge system, with two sequencing legs for delivery to the landing runway via the Merge Point. Feedback collected during the first prototyping session highlighted concerns due to the potential head-on convergence of the North and South flows towards the merge point. The design of the point merge system was modified accordingly for the second and third sessions (Figure 4).
All SIDs used in the prototyping sessions were P-RNAV SIDs. The departures were not controlled, but scripted, as the focus was not on measuring effects on Departure Controllers. They were organised to fly in accordance with efficient climb profiles and de-conflicted from arrival streams by the placement of altitude constraints at appropriately positioned RNAV waypoints.
The reference route structure before the TMA Entry/Exit Points was ARN Version 5 effective from end 2006.
No Temporary Segregated Areas (TSA) including prohibited areas, military restricted areas, military exercise, training areas and danger areas were simulated.

Episode 3
D5.3.6-02 - Report on the Prototyping of a dense TMA Version : 1.01
Page 40 of 133
Issued by the Episode 3 consortium for the Episode 3 project co-funded by the European Commission and Episode 3 consortium.
Figure 3. Airspace used for Episode 3 TMA prototypi ng session 1.
Figure 4. Airspace used for Episode 3 TMA prototypi ng sessions 2 and 3.

Episode 3
D5.3.6-02 - Report on the Prototyping of a dense TMA Version : 1.01
Page 41 of 133
Issued by the Episode 3 consortium for the Episode 3 project co-funded by the European Commission and Episode 3 consortium.
4.1.5.2 Measured and feed sectors
The simulated airspace comprised four TMA measured sectors, one tower feed sector and two En Route feed sectors.
All measured sectors were single person operations manned by an Executive controller. Each measured sector was associated with a single Controller Working Position (CWP). The following measured sectors were simulated (Table 7).
Table 7. Measured sectors.
Name Code FIR/CTA Category Lateral Limits
Vertical Limits
Number of CWP
Arrival North AN Dublin
CTA Civil
En Route 1
(EC)
Arrival South
AS Dublin CTA
Civil En Route
1 (EC)
Approach AP Dublin CTA
Civil Approach
1 (EC)
Final FI Dublin CTA
Civil Approach
As notified
As notified
1 (EC)
The feed sectors represent the FIR/UIR, state and regional airports that interface with the measured sectors. In order to feed traffic into the simulated measured sectors, parts of London FIR/UIR was included in the simulation area. The feed sectors were developed to assure continuity of control to and from the measured sectors. All feed sectors are hybrid positions. Controller or pseudo pilot support was not required for the feed sectors. The following hybrid feed sectors were simulated (Table 8).
Table 8. Hybrid feed sectors.
Name Code FIR/CTA Category Lateral limits
Vertical limits
Number of CWP
Feed North FN
ScATCC
MACC Shannon FIR/UIR
Civil En Route
1 (EC)
Feed South FS
Shannon FIR/UIR LATCC
Civil En Route
1 (EC)
Tower TR Dublin Control Zone
Civil Aerodrome
As notified As notified
1 (EC)
4.1.5.3 Separation standards
Horizontal and vertical separations are applied as follows (Table 9).

Episode 3
D5.3.6-02 - Report on the Prototyping of a dense TMA Version : 1.01
Page 42 of 133
Issued by the Episode 3 consortium for the Episode 3 project co-funded by the European Commission and Episode 3 consortium.
Table 9. Separation standards (sessions 1, 2 and 3) .
Horizontal separation Vertical separation
Application Separation Application Separation
Measured sectors 3 NM Measured sectors 1000 ft
4.1.5.4 Meteorological characteristics
The algorithm for wind changes with altitude applies a continuous change of wind up to 4 times the surface wind and a 30˚ increase of wind origin below 35000 ft. A constant wind with factor 4 and 30° increase of wind origin is applied above 35000ft.
In the first session, four different meteorological environments were designed to reflect prevailing wind conditions for the active runway (headwind, tailwind, northerly and southerly crosswind components). In the second session, the least demanding condition (tailwind) was dropped. In the third session, only the most demanding wind conditions for the active runway (northerly and southerly crosswind components) was kept. The meteorological environments are as follows (Table 10).
Table 10. Meteorological settings.
Environmental Setting
Values Session 1 Session 2 Session 3
South 190˚ magnetic / 15 knots X X X
North 010˚ magnetic / 15 knots X X X
East 100˚ magnetic / 20 knots X X
Surface Wind Velocity
West 280˚ magnetic / 05 knots X
Wind direction (with altitude)
All Veering 30˚ up to 35000ft (then linear) X X X
Temperature All 12˚ Celsius X X X
Wind speed (with altitude)
All Increasing by factor 4 up to 35000ft (then linear) X X X
Atmospheric Pressure (QNH)
All 1013 X X X
4.1.5.5 Traffic
4.1.5.5.1 Characteristic
4.1.5.5.1.1 Simulated traffic samples
As there was no reference/baseline runs in the simulation, only 'future' traffic samples were required, in order to expose participating controllers to the considered new concept elements, mature the latter, and obtain initial assessment of their acceptability and feasibility.
Having these objectives in mind, and considering the level of maturity of future concepts studied here, it was not intended to define a traffic that would accurately correspond to a specific date as per the SESAR roadmap. Therefore, even though a 2020 traffic growth scenario is considered here (see below), it is to be seen as a step in the generation of traffic. The traffic samples used in the third prototyping session were actually adapted to fit the purpose of an initial assessment of SESAR concepts for the intermediate timeframe (IP2 Service level 2). From this perspective, the main adjustments on traffic aimed at obtaining defined arrival/departures rates, and a certain level of inbound traffic metering at the TMA

Episode 3
D5.3.6-02 - Report on the Prototyping of a dense TMA Version : 1.01
Page 43 of 133
Issued by the Episode 3 consortium for the Episode 3 project co-funded by the European Commission and Episode 3 consortium.
entry points. More details on the metering are provided in §4.1.5.5.1.2 focusing on entry conditions.
The samples were based on data taken, as a starting point, from the CFMU records from 2006 for the three days selected for simulation by Episode 3:
• Tuesday 18th July 2006;
• Friday 21st July 2006;
• Sunday 23rd July 2006.
The raw flight-plan data was processed to exclude all flights planned but which did not operate on the day in question. Where regulation was applied to a particular flight, the regulated flight plan was chosen in preference to the filed flight plan. These traffic samples were produced by STATFOR based on the STATFOR 06 scenario and projected 2020 traffic assuming high growth. No routes were provided with the traffic samples, as the assumption was made that all aircraft would fly direct from airport of departure to airport of arrival.
Aerodrome of Departure (ADEP) and Aerodrome of Destination (ADES) data for Dublin (EIDW) was extrapolated from each of the traffic samples for use in the prototyping session. The extrapolated traffic samples were analysed to determine the one hour peak periods which would be most suitable for the session. The analysis took into account:
• The number of flights in each one hour period;
• The arrival / departure rates for each one hour period.
The above information was used to construct traffic samples as realistic as possible and best reflecting traffic expectations. Final adjustment and definition of the traffic samples were carried out to represent an AMAN delivered metered traffic flow.
In session 1, the three samples varied in terms of level of traffic, expressed in terms of hourly movements at EIDW with parallel runways RWY 10R/L in use.
The three traffic levels were as follows:
• TL60 = 30 arrivals Rwy10R; 30 departures Rwy10L;
• TL70 = 35 arrivals Rwy10R; 35 departures Rwy10L;
• TL80 = 40 arrivals Rwy10R; 40 departures Rwy10L.
In sessions 2 and 3, the traffic level expressed in terms of hourly movements at EIDW with parallel runways RWY 10R/L in use was 80, with 40 arrivals on Runway10R and 40 departures on Runway10L.
4.1.5.5.1.2 Entry conditions
To represent the operation of an advanced AMAN and the application of CTA in En Route, the traffic was metered. This allowed smoothing the flow of arriving aircraft entering the simulated area towards the IAFs. The metering requirement was based on the planned use of the PMS sequencing legs, i.e. with appropriate metering, in nominal conditions the flights were not expected to fly more than a certain defined portion of these legs before being issued a Direct-to instruction to the merge point. CTA times were scripted in the traffic, and during session 3, a simulated RTA FMS function was activated in the simulator. Last of all, the traffic was automatically transferred from the hybrid feed sectors to the arrival measured sectors

Episode 3
D5.3.6-02 - Report on the Prototyping of a dense TMA Version : 1.01
Page 44 of 133
Issued by the Episode 3 consortium for the Episode 3 project co-funded by the European Commission and Episode 3 consortium.
(namely AN and AS) beyond the TOD point and consequently already in descending status (CDA) except for some short flights7.
The size of cluster of aircraft also influenced the entry conditions. As illustrated in Table 11, a cluster was defined based on predicted spacing between successive aircraft at merge point (time constraint back calculated at IAF). The definition is compliant with the +/- 30s tolerance window allocated to the CTAs at IAFs. It could happen that the clusters were propagated to a single IAF, causing separation issues prior to sequencing legs entry. Otherwise, clusters raising separation issues at runway were expected to be handled by means of PMS (sequencing legs engagement). North and South arrival flows were balanced, with 20 aircraft on each flow.
Table 11. Illustration of entry conditions.
Number of aircraft in the cluster Illustration
Entry condition 1
1
90s 90s 90s
4 cluster size 1
Entry condition 2 2
30s 90s 120s
1 cluster size 2 and 2 cluster size 1
Entry condition 3
3
60s 60s 120s
1 cluster size 3 and 1 cluster size 1
In session 1, cluster size 1 was simulated, the metering was ideal and achieved through scripted navstart times8. In session 2, cluster size 1, 2 and 3 were mixed (Table 12), using navstart times to simulate these clusters. In session 3, only cluster size 1 was simulated, but aircraft RTA capability were mixed, with +/- 30 sec accuracy.
Table 12. Number of clusters per condition in sessi on 2.
Condition (cluster size)
1 2 3
Number of size 1 clusters 40 16 16
Number of size 2 clusters / 12 /
Number of size 3 clusters / / 8
7 Traffic from EGGP would not commence descent until under the control of the AN sector, traffic from EINN and EICK transferred in accordance with the LoA, i.e. descending to or level at FL170. 8 This means that the aircraft creation time was defined in order to ensure clusters of aircraft at IAF.

Episode 3
D5.3.6-02 - Report on the Prototyping of a dense TMA Version : 1.01
Page 45 of 133
Issued by the Episode 3 consortium for the Episode 3 project co-funded by the European Commission and Episode 3 consortium.
4.1.5.5.2 Aircraft capabilities
In all the sessions, all the traffic was assumed being P-RNAV capable aircraft.
In session 2, all the traffic was also assumed being RTA capable aircraft and in session 3, three mixed RTA equipage conditions were simulated: all arriving aircraft RTA capable, 80% of the arriving traffic RTA capable and 66% of the arriving traffic RTA capable.
4.1.5.6 Working position
4.1.5.6.1 Controller working position
In all three sessions, each controller working position was equipped with:
• A BARCOTM monitor, with a multi-window working environment;
• A three-button mouse;
• A digital voice communication system (Audio-LAN) with a headset, a loudspeaker, a footswitch and a panel-mounted push-to-talk facility.
4.1.5.6.2 Controller tools and HMI
The HMI used for the RTS was an advanced stripless HMI (ECHOES), including the following main functions:
• Interactive radar labels and aircraft data lists, with colour coding of aircraft planning states;
• Standard On-Line Data Interchange (OLDI) of flight progress data, with SYSCO extensions specifically providing the support for aircraft transfer of communication (i.e. there is no co-ordination of flight parameters);
• Safety Nets: Short Term Conflict Alert (STCA).
Note that in none of the three WP5.3.6 Task 1 sessions the HMI featured any presentation of CTA and deviation thereof (i.e. position with respect to the CTA tolerance window) in meeting the time constraints at the IAFs. However, the label of the non RTA capable aircraft was enriched with a graphical symbol (e.g. a small yellow square), to make the controllers clearly aware of the different aircraft equipage.
4.1.5.6.3 Pilot working positions
The simulated environment provided pilot working positions enabling “pseudo-pilots” to handle several aircraft at the same time.
Among the available instructions, the pilots had the possibility to execute CDA for each aircraft, typically instructing a slope CDA, to reach a given waypoint at a given altitude. More in detail, while an aircraft was flying with lateral navigation engaged the pilot was able to input a point of the route, and a target altitude/level to be reached at the designated point (consequently, the distance to go (DTG) to the specified point is known).
The airborne system calculated the descent profile, including the TOD, according to:
• The target altitude/level at the prescribed point;
• The need to minimise levelling off segments;
• The altitude/level restrictions (windows) defined as constraints on intermediate points in the procedure;
• The need to keep speed margins (possibility to increase or decrease speed upon ATC instruction during the descent - within the available speed range);
• A prescribed 2° constant slope, provided as an off -line parameter (with a possibility to activate/de-activate this condition offline).

Episode 3
D5.3.6-02 - Report on the Prototyping of a dense TMA Version : 1.01
Page 46 of 133
Issued by the Episode 3 consortium for the Episode 3 project co-funded by the European Commission and Episode 3 consortium.
The airborne system managed the descent according to these computations until:
• The designated point is reached; or
• The pilot manually inputs a vertical rate or stops descent following ATC instruction; or
• The descent can not be managed according to the constraints anymore while remaining in the safe aircraft flight envelope; or
• The pilot disengages the lateral navigation (e.g. an open-loop heading instruction is received), and accurate DTG can not be maintained anymore by the airborne system.
The airborne system continuously calculated the descent profile, assessed feasibility and adjusted rate if needed, in order to consider any perturbations, in particular wind variations. Finally, the airborne system should modify/update the descent profile to take into account any lateral modifications resulting from ATC instructions (e.g. Direct To, a route change or a speed instruction).
Moreover, in session 3 the pilot working positions enabled to fly these aircraft that were considered RTA capable according to a simulated RTA FMS functionality.
4.1.6 Experimental variables and design
This section describes the experimental design based on the different control variables (independent variables) of the experiment.
4.1.6.1 Experimental variables
The experiment design of the prototyping sessions was built around the following variables.
The traffic load with three levels:
• TL60 (60 movements, 30 arrivals and 30 departures per hour);
• TL70 (70 movements, 35 arrivals and 35 departures per hour);
• TL80 (80 movements, 40 arrivals and 40 departures per hour).
This variable had two objectives. First, it aimed to enable a progressive familiarisation with the environment and the concept, with a traffic load initially low then finally higher. The second objective was to assess the impact of the traffic load on the feasibility and acceptability of P-RNAV and A-CDA. As controllers quickly adapted to the TL60 and TL70 traffic levels, these were dropped at a very early stage in PS1 and removed from PS2 and PS3 (see Table 13).
The meteorological conditions with four levels in s ession 1, 3 in session 2 and 2 in session 3:
• Headwind (E);
• Tailwind (W);
• Northerly crosswind (N);
• Southerly crosswind (S).
This variable was used to assess the impact of meteorological conditions on P-RNAV and A-CDA feasibility and operability, with crosswind conditions expected to induce more difficulties than the other two conditions. The effect of northerly and southerly crosswind is considered as equivalent, expected to have opposite effects on North and South flows. Whilst in approach phase, tailwind (W) is assumed to be less challenging than headwind (E). Note that in session 3, this variable was used to induce variability in the simulated scenarios, as the two crosswind conditions were considered as equivalent.

Episode 3
D5.3.6-02 - Report on the Prototyping of a dense TMA Version : 1.01
Page 47 of 133
Issued by the Episode 3 consortium for the Episode 3 project co-funded by the European Commission and Episode 3 consortium.
Cluster size at IAF, with three levels:
• 1: Only single aircraft;
• 2: Clusters of two aircraft, plus some single aircraft;
• 3: Clusters of three aircraft, plus some single aircraft.
This variable was used to assess the impact of the cluster size on the feasibility and acceptability of A-CDA and P-RNAV. It was expected that handling larger clusters reduced the use and benefits of P-RNAV, A-CDA and RBT adherence.
Mixed RTA equipage conditions, with three levels:
• 100: All arriving aircraft are RTA capable, also denoted “Full level of equipage”;
• 80: Four-fifths (80%) of the arriving traffic are RTA capable, also denoted High level of equipage;
• 66: Two-thirds (66%) of the arriving traffic are RTA capable, also denoted Medium level of equipage.
This variable was used to assess the impact of RTA equipage level on the feasibility and acceptability of working method and CTA adherence.
Traffic patterns with two levels:
• A: morning traffic sample;
• P: afternoon traffic sample.
This variable was used to minimise the learning effect and prevent the controllers from getting too familiar with the traffic scenarios. Indeed, the traffic patterns were similar in terms of load and complexity. The two samples presented the same characteristics (same load level, same aircraft capabilities). Their difference mainly lay in aircraft identification and a slightly different structure of the traffic.
Table 13 summarises in which session variables were used with corresponding number of runs.
Table 13. Summary of independent variables usage du ring prototyping sessions.
Variable Modalities Session 1 Session 2 Session 3
60 2 0 0
70 1 0 0
Traffic load
80 7 10 9
North 4 3 6
South 2 3 3
East 3 4 0
Meteorological conditions
West 1 0 0
1 10 4 9
2 0 3 0
Cluster size
3 0 3 0
RTA equipage 66% 0 0 3

Episode 3
D5.3.6-02 - Report on the Prototyping of a dense TMA Version : 1.01
Page 48 of 133
Issued by the Episode 3 consortium for the Episode 3 project co-funded by the European Commission and Episode 3 consortium.
Variable Modalities Session 1 Session 2 Session 3
80% 0 0 3
100% 10 10 3
A 3 6 3 Traffic patterns
P 7 4 6
4.1.6.2 Control variables
Other variables were induced by the simulation characteristics:
• Controller position: even though the operability and acceptability of the P-RNAV and CDA is assessed from the perspective of all positions (Arrival, Approach, Final), no comparison is planned between them.
4.2 CONDUCT
4.2.1 Schedule
The three sessions took place on the following weeks:
• Session 1 Week of 10th - 14th November 2008;
• Session 2 Week of 8th - 12th December 2008;
• Session 3 Week of 19th - 23rd January 2009.
All sessions took place over five days and consisted of one day of training followed by three days of measured exercises. The last day of the simulation session was used for final debriefing and questionnaire.
4.2.1.1 Training session
The objectives of the training were to:
• Provide the controllers with a sufficient knowledge of the ATM concepts assessed during the simulation;
• Familiarise the controllers with the airspace settings and with the operational procedures and working methods applied during the simulation;
• Provide the controllers with a sufficient knowledge and practice of the platform functions and HMI.
During the training period, the controllers were first given several presentations concerning the simulation objectives, content and organisation, the operational concept, the working procedures and the HMI.
They then participated in hands-on training exercises. During these runs, the controllers had the opportunity to rotate between the different measured sectors. The first aim was to get the participants familiar with the airspace, the HMI and the traffic. Once familiarity was gained, an additional training run was used to enable controllers to practice the new route structure and the continuous descent approach. TL60 traffic (a reduced version of the sample used in the measured session) was initially used to prevent the participants from being overloaded by the new features (e.g. procedures, airspace, tools, HMI). The training exercises were based on traffic samples containing the same characteristics as the ones used for the measured exercises.

Episode 3
D5.3.6-02 - Report on the Prototyping of a dense TMA Version : 1.01
Page 49 of 133
Issued by the Episode 3 consortium for the Episode 3 project co-funded by the European Commission and Episode 3 consortium.
4.2.1.2 Measured session
The measured part of each session consisted of performing ten measured runs (nine in the third session). Each run lasted approximately 1 hour 15 minutes, enabling 45 minutes of recordings, and was followed by a post-exercise questionnaire and a collective debriefing. In addition, observers present in the operations room captured spontaneous controller comments on the topics of interest and problems that occurred.
At the end of the simulation period, the participants completed a post-simulation questionnaire. Moreover, a global debriefing was held to obtain further information on their perceived benefits/limits of the concept, the conduct of the experiment and their recommendations and/or requirements on what could be tested next.
During a measured run, as there were four working positions and eight participants, the four spare participants acted as observers in each position. (Note: In PS3, a spare controller was allocated to the Sequence Manager (Co-ordinator) non measured position to ensure consistency between the printed scripted sequence lists and the AMAN display sequence lists).
The seating plan (see details in [1]) was prepared to allow, as far as possible, each controller:
• To control at least once on each position;
• To test at least once each of the condition (e.g. the weather conditions; traffic level, cluster level and RTA equipage).
4.2.1.3 Deviation from the planned schedule
Detailed weekly schedules of the three sessions are presented in annexes (tables in §8.2).
4.2.1.3.1 Deviation from session high level objective
The clarification objective of the three sessions defined at the Episode 3 resumption guided the definition of the session contents. The high level objectives (assess feasibility of P-RNAV and A-CDA, assess impact of aircraft arriving on CTA) were not modified.
However, the assessment of the airspace design which was initially envisaged for the first session only, had to be extended to the second session, due to improvements of the route towards final approach fix required to mitigate safety concerns as well as to provide the opportunity for execution of CDA from TOD to FAF.
4.2.1.3.2 Deviation from weekly and daily schedule
During the session 2, the first two measured runs had to be discarded from the analysis set, the first one because of a technical problem (no speed constraint implemented) and the second one because the controllers considered the working methods as not stable and were still defining them. During the session 3, the two first runs were also discarded from the analysis set, because they were used to finalise the operating method (essentially adjust/decide on speed constraints). Changes made after requirements collected during the first run finally caused more difficulties during the second run and it was agreed to stick to the method from the first run.

Episode 3
D5.3.6-02 - Report on the Prototyping of a dense TMA Version : 1.01
Page 50 of 133
Issued by the Episode 3 consortium for the Episode 3 project co-funded by the European Commission and Episode 3 consortium.
4.2.2 Working methods and roles
Even though one of the objectives of the sessions was to assess and refine working methods, an initial definition of roles and working methods was proposed:
4.2.2.1 Controller – Pilot task repartition
The controllers were responsible for ensuring safe separation between aircraft, while timely sequencing them. The concept assumed no change with regards responsibility for separation and sequence management.
With the introduction of A-CDA, the pilots were responsible for selecting the descent profile enabling a selected waypoint to be reached at a given level. With the RTA function, the pilots were also responsible for ensuring (through automatic speed adjustments) that the selected waypoint (the IAF here) was reached at the agreed time (the CTA).
4.2.2.2 Controllers task repartition
For the three measured positions (Arrival, Approach and Final), the P-RNAV/CDA procedure implied specific tasks. Those are reported in Table 14. More details on the tasks and associated phraseology are described in the consolidated experimental plan [1].
Table 14. Controllers' tasks and associated phraseo logy.
ARRIVAL CONTROLLER NORTH (AN) or SOUTH (AS)
Tasks 1. Assume and identify aircraft transferred from upstream sectors (Feed North or Feed South).
2. Issue appropriate P-RNAV arrival clearance and CDA
3a. For sessions 1 and 2: Before transfer to Approach, instruct aircraft to reduce speed and transfer aircraft no later than 15NM before the IAF. Use speed control also to ensure appropriate longitudinal spacing is maintained. If at all possible, do not deviate the aircraft from the P-RNAV procedure track.
3b. For session 3, with RTA-compliant aircraft: Monitor aircraft progress towards the IAF – if possible, allow aircraft to carry out the P-RNAV procedure without issuing any further ATC instructions (i.e. speed, level or track adjustments which will change its profile or timing). Transfer aircraft to APP between 10NM and 15NM from the IAF.
3c. For session 3, with non-RTA-compliant aircraft (indicated on aircraft label with yellow square): Although these aircraft will still be able to comply with the leg entry speed constraint (220kts IAS), positive ATC control may be necessary to optimise the sequence. Ensure that assigned IAS is inserted on the label of non-RTA–compliant aircraft for the information and use of the APP controller. Transfer aircraft to APP between 10NM and 15NM before the IAF.

Episode 3
D5.3.6-02 - Report on the Prototyping of a dense TMA Version : 1.01
Page 51 of 133
Issued by the Episode 3 consortium for the Episode 3 project co-funded by the European Commission and Episode 3 consortium.
APPROACH CONTROLLER (AP)
Tasks 1a. Assume aircraft transferred from Arrival North or South.
1b. In session 3, note assigned IAS on non-RTA-compliant aircraft.
2. Issue speed instructions as necessary (note: sequencing leg entry condition of 220kts IAS is embedded in the procedure) to achieve and maintain required longitudinal spacing between aircraft under Approach control. If at all possible, do not deviate the aircraft from the P-RNAV procedure track.
3. Assess relative positions of aircraft approaching or on the sequencing legs to determine when to issue explicit ‘Direct To’ clearances to RISAP in session 1, to either NUTTA or SORRO depending on STAR in use in sessions 2 and 3.
4. Once an aircraft’s turn is observed (ensuring clear of possible conflicting traffic), issue further descent clearance to 3000ft QNH and transfer aircraft to Final Director (FI).
FINAL DIRECTOR (FI)
Tasks 1. Assume aircraft and monitor initiated descent.
2. Use speed control to optimise final sequence for required spacing. If at all possible, do not use radar vectors.
3. Transfer aircraft to Tower once established on the localiser. Note: there is no need to instruct the aircraft to intercept the localiser unless aircraft has been deviated from the P-RNAV procedure.
4.2.3 Participants
Up to eight controllers per session were committed by five ANSPs involved in Episode 3 WP 5: DFS, ENAV, LFV, LVNL and NATS. In addition, even though they were not Episode 3 partners, the IAA provided two staff controllers to ensure operational support and expertise during the preparation and conduct of the prototyping sessions.
The continuity of controllers along sessions, as well as their age and experience repartition is reported in Table 15.
Table 15. Description of participants per session.
ANSP Controller Id Session 1 Session 2 Session 3
DFS 1 X X X
2 X X X
3 X - X
ENAV
4 - X -
6 X - -
7 X - -
8 X
9 X
10 X
LFV
11 X
LVNL 12 X X X

Episode 3
D5.3.6-02 - Report on the Prototyping of a dense TMA Version : 1.01
Page 52 of 133
Issued by the Episode 3 consortium for the Episode 3 project co-funded by the European Commission and Episode 3 consortium.
ANSP Controller Id Session 1 Session 2 Session 3
13 X X -
14 X - -
15 - X -
16 - - X
NATS
17 - - X
Average experience in years (min; max)
19 (5; 35)
18 (2; 35)
17 (6; 35)
Note: “X” means present, “-” means not present.
4.3 RESULTS
4.3.1 Introduction
The prototyping sessions were mainly aimed at concept clarification in an iterative manner. Each session lasted a very short time (1 week) and involved a limited number of participants (on average eight per session). As a result, even though the data collected were analysed with statistical tools, outcomes are considered as trends rather than strong statistical evidence. For this reason, statistical significance tests were not conducted.
In addition, again due to the limited time available for the sessions, it was decided to focus on the tested situation (i.e. intermediate timeframe up to SESAR IP2 – capability level 2), without conducting reference runs. In the present section, the comparison with “today” is based on controllers’ feedback provided during debriefing and in questionnaires.
4.3.2 Objective 1: Familiarise controllers with P-RNAV, A-CDA
and CTA
The main hypothesis was that “the duration of the training and the material provided will enable controllers to become familiar enough with the concept”.
The training was aimed at familiarising the controllers with the ATM concepts (P-RNAV, A-CDA and CTA) and the simulated environment (airspace, traffic and HMI). Brief presentations were made to the controllers on the concept elements, simulation objectives, HMI and support tools, followed by practical hands-on exercises on the platform. The training exercises were based on traffic samples presenting the same characteristics as the ones used for the measured exercises.
In the post-session questionnaires, the controllers were asked if they considered the training sufficient in order to allow them to familiarise themselves with the HMI, P-RNAV operating procedures, PMS working methods, A-CDA and CTA concepts.
Most of the controllers rated the quality of training high (and some even very high) over the three prototyping sessions (Figure 5). Overall, they felt that the duration of the training and the material provided enabled them to become familiar with PMS/PRNAV procedures, A-CDA and CTA/RTA. There were some medium to low ratings (two medium in session 1, one low in session 2 and one medium and one low in session 3). For sessions 2 and 3 the three medium to low ratings were associated with controller’s comment that one major constraint was the lack of continuity of controllers between sessions. They considered having the same controllers for all of the sessions as an important element in terms of familiarisation, as it avoids the risks of participants with heterogeneous levels of familiarisation with the HMI and the different concepts and reduces the biases due to learning effects. Actually, this confirmed the importance of continuity of participation that was stressed by the EEC prior to the

Episode 3
D5.3.6-02 - Report on the Prototyping of a dense TMA Version : 1.01
Page 53 of 133
Issued by the Episode 3 consortium for the Episode 3 project co-funded by the European Commission and Episode 3 consortium.
sessions and re-emphasised to the ANSPs concerned following each session, but was not always possible (see §4.2.3 above).
As highlighted earlier in the document, the prototyping approach is efficient to clarify low maturity concepts in enabling a gradual investigation of scenarios and assumptions. However, without the continuity of participants, the benefits of iterative progressive extension of scope within a short period of time are reduced. Typically, in the case of WP5.3.6 Task 1, the newcomers who did not attend all sessions could not accumulate as much practice and experience as the other participants.
Quality of training
0
1
2
3
4
5
6
Very low Low Medium High Very high
Num
ber
of a
nsw
ers
S1
S2
S3
Figure 5. Controllers’ rating on quality of training over the three prototyping sessions
Hypothesis Status Comments
HF1. Sufficient practice with the TMA concepts (P-RNAV, A-CDA and CTA) during the prototyping sessions will enable controllers to provide relevant and adequate feedback.
Confirmed.
Episode 3
D5.3.6-02 - Report on the Prototyping of a dense TMA Version : 1.01
Page 54 of 133
Issued by the Episode 3 consortium for the Episode 3 project co-funded by the European Commission and Episode 3 consortium.
4.3.3 Objective 2: Assess feasibility and operability of P-RNAV, A-CDA and CTA
4.3.3.1 Introduction
When applicable, each indicator is considered with regards to P-RNAV, A-CDA and CTA and globally.
The results from the first session were not integrated in the analysis for two reasons. First, the controllers were still getting familiar with the concept, the environment and the HMI during this first session and second, the initial PMS design had to be improved. Indeed, adjustments of the airspace between sessions 1 and 2 were made possible by the prototyping approach and enabled feasibility and operability to be assessed from session 2 on. In the remaining part of this section, unless mentioned, results are based on analysing outcomes from sessions 2 and 3.
Note: Given some constraints and limitations of the prototyping sessions (e.g. low maturity of the concepts, limited time for training, limited time for preparation between two consecutive sessions), some controllers’ comments needed contextual explanations. In these cases, for clarity purpose these clarifications are provided as footnotes.
4.3.3.2 Operability
In addition to the SESAR performance areas, an important element to check is that the changes envisioned by the novel concept can safely be operated by Air Traffic Controllers.
The E-OCVM methodology [2] defines Operability that way: “OPERABILITY: [the changes envisioned by the novel concept are] usable by and suitable for those who operate the system, e.g. controllers and pilots. Satisfaction of usability and suitability issues lead to operational acceptability.” This is not a SESAR KPA but it is nevertheless important for the success of Episode 3 concept validation. This exercise aimed to provide an initial assessment of operability and acceptability aspects of the SESAR concept in dense terminal airspace, from a controller perspective, relying on subjective/objective measurements.
Operability is addressed in terms of feasibility, working practices and acceptability. In other words, it consists in assessing if the new concepts can be used (feasibility), how they can be used (working methods) and if they would be used (acceptability).
4.3.3.2.1 Feasibility
4.3.3.2.1.1 Suitability of traffic and airspace
After sessions 1 and 2, the participants were generally satisfied about the realism of the simulation, however, for session 3 about half of the controllers (five out of eight) rated the realism as being low. According to the participants, this low rating was mainly due to the fact that they found that the traffic was not always flying at a realistic speed9.
Moreover some observed that in future real situations, even with CTA/RTA, the aircraft might still arrive bunched due to control interventions in upstream En Route sectors. The controllers found partly unrealistic the idea that CTA could induce a perfectly metered traffic delivered from En Route.10
9 The limitation was due to the fact that the speeds were linked to the simulated RTA functionality in the platform in session 3. Timing constraints between sessions did not permit an in-depth analysis and improvement of this functionality. 10 Feasibility of CTA achievement by En Route was studied in parallel in EP3 WP4.3.4 (Validation Report [22]).

Episode 3
D5.3.6-02 - Report on the Prototyping of a dense TMA Version : 1.01
Page 55 of 133
Issued by the Episode 3 consortium for the Episode 3 project co-funded by the European Commission and Episode 3 consortium.
Realism of simulation
0
1
2
3
4
5
6
Very low Low Medium High Very high
Num
ber
of a
nsw
ers
S1
S2
S3
Figure 6. Controllers’ rating on realism of simulat ion over the three prototyping sessions
In addition, the participants were asked whether the traffic scenarios and the airspace design were suitable to evaluate the operability of the explored concepts.
As far as the traffic scenarios are concerned, a common feedback over the three sessions was about traffic levels and mix (Figure 7). In order to test the resilience essentially of the Point Merge method on P-RNAV structure, controllers would have liked busier traffic levels and a more heterogeneous mix (mixed weight categories). All the simulated flights were operated by jet aircraft, while turboprops, for instance, were missing11. According to the participants, the addition of slower (and lower in cruising speed) aircraft would have been needed to better explore the operational concepts12.
Traffic presentation in session 2, while still metered, was characterised by clusters at the IAFs, which implied some active control for separation purposes. That was deemed by the participants as suitable to evaluate the operability of P-RNAV and A-CDA, as opposed to what was reported in session 1, whose traffic scenarios were based on a perfect traffic delivery. Some of the participants then regretted not to experience situations of traffic bunching in session 313.
11 The SESAR compliant traffic samples used in the exercise assumed a quite homogeneous traffic mix in terms of aircraft categories. 12 Traffic samples were actually based on a maximum delivery to/from a set of runways in a specific time period, best achieved by the traffic mix used. Further mixing would only have led to less traffic in the sample in order to be able to adhere to the RTA/CTA principles. 13 In the SESAR concept, a better/more regular traffic presentation is expected at the TMA boundary, resulting from better planning and En Route actions. Along these lines, as already mentioned above, the feasibility of CTA achievement by En Route was studied in parallel in EP3 WP4.3.4 (Validation Report [22]). Nevertheless, the level of ‘de-bunching’ that could be achieved at a given timeframe may still be subject to further assessment, including at the ATM network level.

Episode 3
D5.3.6-02 - Report on the Prototyping of a dense TMA Version : 1.01
Page 56 of 133
Issued by the Episode 3 consortium for the Episode 3 project co-funded by the European Commission and Episode 3 consortium.
Suitability of Traffic scenarios
0
1
2
3
4
5
6
Very low Low Medium High Very high
Num
ber
of a
nsw
ers
S1
S2
S3
Suitability of Traffic scenarios
0
1
2
3
4
5
6
Very low Low Medium High Very high
Num
ber
of a
nsw
ers
S1
S2
S3
Figure 7. Suitability of traffic
With regard to the airspace design the main concern the participants had was about the initial design of Point Merge system in session 1. As already explained in §4.1.5.1, the design applied in session 1 caused head-on convergence of the North and South flows towards the merge point (RISAP). The avoidance of potential hazardous situations resulted in working practices different from those which had been hypothesised, although the longitudinal spacing inbuilt into the sequencing function of the Point Merge system made actual head-on conflicts non-existent when controllers followed their procedures. The design was modified accordingly for the two subsequent sessions and eventually was found suitable to comply safely with the working method proposed.
In sessions 2 and 3, CTA constraints were applied at the IAFs, which were also the first points on each sequencing legs. This CTA points location was judged to be quite close to the runway, well inside the TMA14. This configuration was not deemed as completely appropriate also because of the STAR design. The presence of merge points where arriving traffic met prior to the IAFs had potential for separation issues, which CTA allocation alone could not solve.
4.3.3.2.1.2 Perceived workload
Feedback per session
The controllers were asked to rate their workload according to a pre-defined scale at the end of each run15. Globally, at each position, the workload was between low and medium during all three sessions. The comparison between sessions showed that as expected, in session 2, varying the cluster size increased slightly the arrival controller workload, whereas the introduction of RTA in session 3 reduced the workload of both arrival and approach controllers.
14 See § 4.3.3.2.2.3. 15 This rating at the end of each run was an absolute one, i.e. not involving comparison between conditions, nor with a baseline.

Episode 3
D5.3.6-02 - Report on the Prototyping of a dense TMA Version : 1.01
Page 57 of 133
Issued by the Episode 3 consortium for the Episode 3 project co-funded by the European Commission and Episode 3 consortium.
Estimated overall workload (post run)
AR AP FI
S1S2S3
Low
Very high
Very Low
Medium
High
Figure 8. Estimated workload per session and per po sition.
In session 1, with P-RNAV and A-CDA, controllers’ workload was similar in approach and final sector, and a bit lower in arrival sectors (Figure 9). In arrival, the small number of aircraft handled, combined with their ideal entry conditions explain the very low level of workload perceived. In approach and final, the low level of workload is due to the use of Point Merge system.
Estimated Overall Workload – S 1
AR AP FI
Low
Veryhigh
VeryLow
Medium
High
Figure 9. Estimated workload, session 1.
In session 2, the introduction of various clusters of aircraft increased controllers’ workload at the arrival positions (Figure 8). Compared to the medium cluster (size 2), the largest one (size 3) was more demanding in approach but less demanding in arrival (Figure 10). As expected, handling larger clusters of aircraft in arrival North and South during session 2 was more demanding (than handling smaller ones).

Episode 3
D5.3.6-02 - Report on the Prototyping of a dense TMA Version : 1.01
Page 58 of 133
Issued by the Episode 3 consortium for the Episode 3 project co-funded by the European Commission and Episode 3 consortium.
Estimated Overall Workload – S2
AR AP FI
Cluster Level 1 Cluster Level 2 Cluster Level 3
Low
Veryhigh
VeryLow
Medium
High
Figure 10. Estimated workload, session 2.
In session 3, controllers’ workload ratings showed that the level of RTA equipage had an influence on the Approach and Final controllers’ workload, but not on the Arrival controller workload (Figure 11). Reducing the level of RTA equipage increased the Approach controller’s workload, but reduced the Final controller’s workload.
However, a deeper analysis of the measured runs showed that the “level of RTA equipage” did actually correspond to an unexpected condition, due to inter-individual differences in working methods applied at approach and final positions. Three different methods were observed:
• The standard method, with the use of the sequencing legs to ensure proper spacing before sending aircraft to final, where final refinement of spacing were achieved through speed adjustments - observed in the 80% RTA equipage condition;
• The aircraft not transferred in an efficient manner from approach to final (not enough spacing between successive aircraft) – observed in the 100% RTA equipage condition;
• The final controllers using a tactical point (TACTY) to refine spacing - observed in the 66% RTA equipage condition.
It is noticeable that this link between RTA equipage and working method was purely incidental (inter-individual differences).
Differences between the workload perceived in the various conditions were thus obviously related to the relevance and limitations of these diverse working methods. When the standard method was used (observed in RTA 80%) or when a tactical point (TACTY) was used in FI to refine spacing (observed in RTA 66%), the workload was low in AR and in AP but slightly higher in FI, where tactical interventions were needed to obtain the final spacing. When aircraft were not transferred in an efficient manner from approach to final (observed in RTA 100%), the additional actions required in final to create and maintain spacing significantly increased the final controller workload (Figure 11).
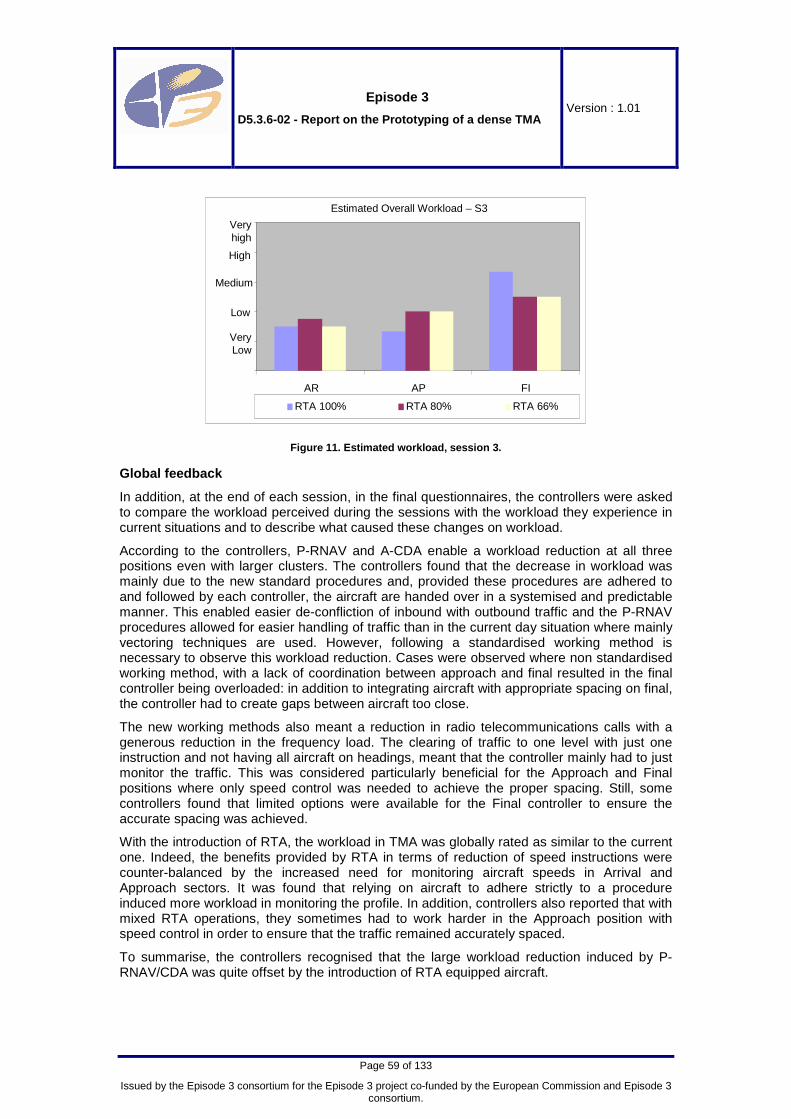
Episode 3
D5.3.6-02 - Report on the Prototyping of a dense TMA Version : 1.01
Page 59 of 133
Issued by the Episode 3 consortium for the Episode 3 project co-funded by the European Commission and Episode 3 consortium.
Estimated Overall Workload – S3
AR AP FI
RTA 100% RTA 80% RTA 66%
Low
Veryhigh
VeryLow
High
Medium
Figure 11. Estimated workload, session 3.
Global feedback
In addition, at the end of each session, in the final questionnaires, the controllers were asked to compare the workload perceived during the sessions with the workload they experience in current situations and to describe what caused these changes on workload.
According to the controllers, P-RNAV and A-CDA enable a workload reduction at all three positions even with larger clusters. The controllers found that the decrease in workload was mainly due to the new standard procedures and, provided these procedures are adhered to and followed by each controller, the aircraft are handed over in a systemised and predictable manner. This enabled easier de-confliction of inbound with outbound traffic and the P-RNAV procedures allowed for easier handling of traffic than in the current day situation where mainly vectoring techniques are used. However, following a standardised working method is necessary to observe this workload reduction. Cases were observed where non standardised working method, with a lack of coordination between approach and final resulted in the final controller being overloaded: in addition to integrating aircraft with appropriate spacing on final, the controller had to create gaps between aircraft too close.
The new working methods also meant a reduction in radio telecommunications calls with a generous reduction in the frequency load. The clearing of traffic to one level with just one instruction and not having all aircraft on headings, meant that the controller mainly had to just monitor the traffic. This was considered particularly beneficial for the Approach and Final positions where only speed control was needed to achieve the proper spacing. Still, some controllers found that limited options were available for the Final controller to ensure the accurate spacing was achieved.
With the introduction of RTA, the workload in TMA was globally rated as similar to the current one. Indeed, the benefits provided by RTA in terms of reduction of speed instructions were counter-balanced by the increased need for monitoring aircraft speeds in Arrival and Approach sectors. It was found that relying on aircraft to adhere strictly to a procedure induced more workload in monitoring the profile. In addition, controllers also reported that with mixed RTA operations, they sometimes had to work harder in the Approach position with speed control in order to ensure that the traffic remained accurately spaced.
To summarise, the controllers recognised that the large workload reduction induced by P-RNAV/CDA was quite offset by the introduction of RTA equipped aircraft.

Episode 3
D5.3.6-02 - Report on the Prototyping of a dense TMA Version : 1.01
Page 60 of 133
Issued by the Episode 3 consortium for the Episode 3 project co-funded by the European Commission and Episode 3 consortium.
4.3.3.2.2 Working practices
4.3.3.2.2.1 Controller activity
As described in §4.2.2.2, the measured positions (Arrival, Approach and Final) were defined along with specific tasks to suit P-RNAV, A-CDA procedures and the respect of CTA (only session 3). The repartition of instructions and clearances per type were looked at in each sector. This metric provided an indicator of how closely the controllers applied the proposed working method and highlights practices that were induced by the different conditions.
Arrival position
In both sessions 2 and 3, the Arrival controller issued appropriate P-RNAV arrival clearance and CDA.
In session 2, the controllers used speed control to assure the appropriate longitudinal spacing at the IAFs. When the traffic was meant to present cluster at the IAFs, further speed instructions were given to provide also the separation between the aircraft. In general, the controllers did not make the aircraft deviate from the P-RNAV procedure track but in few circumstances (not depending on the level of clusters). Track adjustments would change the profile and thus no longer assure the respect of the defined vertical windows (for arrivals/departures segregation).
In session 3, the amount of ATC instructions was significantly reduced with respect to session 2. Rarely the controllers deviated from the P-RNAV procedure. The RTA capable aircraft were automatically adjusting their speed to meet the constraints over the IAFs. Adhering to the proposed method led the controllers to intervene with speed control as little as possible and only to prevent separation issues. As a result, with RTA 100% condition, the speed orders issued by the arrival controllers decreased by 87% against the mean number averaged over session 2. The number of speed instructions fairly increased along with the percentage of non RTA capable aircraft, for which the achievement of time constraints was subject to the controllers’ actions. Still the whole amount of speed instructions in RTA 80% and RTA 66% conditions was always lower than the mean number in session 2 (the reduction led down to 50% in case of RTA 66%).
16
3
16
10
15
1
12
0,3 0,3 1
CDA Direct Heading Level Speed
Num
ber
of in
stru
ctio
ns
RTA 100% RTA 80% RTA 66%
S3
Mean Number of InstructionsArr Position
17
31
1916
2 1
26
17
2 2
27
0,30
10
20
30
40
CDA Direct Heading Level Speed
Num
ber
of in
stru
ctio
ns
CL1 CL2 CL3
S2
16
3
16
10
15
1
12
0,3 0,3 1
CDA Direct Heading Level Speed
Num
ber
of in
stru
ctio
ns
RTA 100% RTA 80% RTA 66%
S3
Mean Number of InstructionsArr Position
17
31
1916
2 1
26
17
2 2
27
0,30
10
20
30
40
CDA Direct Heading Level Speed
Num
ber
of in
stru
ctio
ns
CL1 CL2 CL3
S2
Figure 12. Repartition of ATC instructions and clea rances in Arrival sector.
Approach position
The Approach controller (AP) assumed the traffic transferred from the arrival controllers and assessed the relative positions of aircraft approaching or on the sequencing legs to determine when to issue the Direct To clearances to either NUTTA or SORRO depending on STAR in use. Once the aircraft initiated its turn to the merge point, the AP issued a further descent clearance before transferring the aircraft to the final controller (FI). Working method and practices applied by the controllers were independent from the conditions simulated over the sessions. The analysis of the situations showed that the differences in instructions given (e.g.

Episode 3
D5.3.6-02 - Report on the Prototyping of a dense TM A Version : 1.01
Page 61 of 133
Issued by the Episode 3 consortium for the Episode 3 project co-funded by the European Commission and Episode 3 consortium.
speed control in session 2) were actually due to different controllers’ working practices and not related to the conditions. Speed control was generally used differently between Northbound and Southbound traffic to counterbalance the action of the wind (crosswind). The use of open-loop instructions was very limited in session 2 and totally absent in session 3.
Guidelines were actually provided to controllers in terms of speed control, spacing between aircraft, use of ground-speed etc. But as controller practices vary from region to region, it was left to the controllers to operate in accordance with their local experience. One of the lessons learned from the sessions is that the same procedures should be applied by all controllers in order to facilitate teamwork and cooperation between sectors.
29 3033
29 29
3431 30
36
CDA Direct Heading Level Speed
S3
31 31
2 1
48
29 29
1 1
2630 29
39
0
10
20
30
40
50
60
CDA Direct Heading Level Speed
Num
ber
of in
stru
ctio
ns
S2
Mean Number of InstructionsAP Position
RTA 100% RTA 80% RTA 66%CL1 CL2 CL3
29 3033
29 29
3431 30
36
CDA Direct Heading Level Speed
S3
31 31
2 1
48
29 29
1 1
2630 29
39
0
10
20
30
40
50
60
CDA Direct Heading Level Speed
Num
ber
of in
stru
ctio
ns
S2
Mean Number of InstructionsAP Position
RTA 100% RTA 80% RTA 66%CL1 CL2 CL3
Figure 13. Repartition of ATC instructions and clea rances in AP.
Final position
The Final controller (FI) assumed the traffic from the AP and refined the inter aircraft spacing before delivering the traffic to the tower. The proposed working method consisted in the controllers using speed control to optimise the final sequence and achieve the required spacing (4 NM), and if at all possible not using radar vectors, leaving aircraft to fly on their lateral navigation mode.
The controllers made indeed a large use of speed instructions. Nevertheless, the analysis of the results shows that the speed related figures are characterised by a large dispersion (illustrating differences in controllers’ working practices) and also that the controllers did not exclusively give speed instructions to optimise the final sequence.
Differences in the working practices were much affected by the teamwork between the AP and FI positions. Situations where the approach controller did not transfer traffic to the final with appropriate spacing occurred. In those circumstances, acting only with speed instructions was not sufficient to regain an appropriate spacing. So typically FI had to use either heading instructions or Direct to TACTY to re-establish an appropriate spacing. Lack of coordination between the positions even worsened these situations both in terms of workload (§4.3.3.2.1.2) and use of open loop instructions (§4.3.3.3.1.1).
Summarising, two different working practices were observed:
• Refining the final spacing using only speed instructions (as suggested by the proposed working method), or;
• Refining the final spacing deviating the aircraft from the defined route (either with Direct to TACTY or with open loop instructions) in addition to speed instructions.
Anyway, in some exercises (e.g. RTA 80% in session 3) the controllers were observed to adhere closely to the proposed working method. That resulted in:
• Extensive usage of navigation mode (§4.3.3.3.1.1);

Episode 3
D5.3.6-02 - Report on the Prototyping of a dense TM A Version : 1.01
Page 62 of 133
Issued by the Episode 3 consortium for the Episode 3 project co-funded by the European Commission and Episode 3 consortium.
• Fairly more track miles flown on average by the aircraft, as they were kept longer on the sequencing legs (§4.3.3.3.2.2);
• More consistent delivery to the tower in terms of spacing (§4.3.3.3.1.3).
135
92
2
102
26
2 2
91
112
CDA Direct Heading Level Speed
S3
208
65
14
1
104
22
1 3
66
0
25
50
75
100
125
150
CDA Direct Heading Level Speed
Num
ber
of in
stru
ctio
ns
S2
Mean Number of InstructionsFI Position
RTA 100% RTA 80% RTA 66%CL1 CL2 CL3
135
92
2
102
26
2 2
91
112
CDA Direct Heading Level Speed
S3
208
65
14
1
104
22
1 3
66
0
25
50
75
100
125
150
CDA Direct Heading Level Speed
Num
ber
of in
stru
ctio
ns
S2
Mean Number of InstructionsFI Position
RTA 100% RTA 80% RTA 66%CL1 CL2 CL3
Figure 14. Repartition of ATC instructions and clea rances in FI.
4.3.3.2.2.2 Task allocation
The arrival controllers issued P-RNAV arrival clearances and CDA as soon as the aircraft were in contact and identified. Afterwards the aircraft were monitored and if necessary instructed with speed adjustments so as to deliver traffic to the AP with appropriate spacing. Generally the arrival controllers transferred the traffic to the AP approximately 15 NM before the IAFs.
The analysis of the geographical distribution of instructions proved the AP started applying speed control before the aircraft passed the IAFs. In session 3, the AP position acted on the traffic regardless the CTA constraint. In other words, after receiving traffic from the arrival controllers, AP did not reckon with the CTA and instead focused on pre-sequencing traffic (assigning appropriate speeds before the sequencing legs). The controllers varied the speed of both RTA capable and non capable aircraft before the IAFs indistinctly (no prioritisation was recorded).
As said the proposed working method for FI relied almost exclusively on speed control for the optimisation of the final spacing, unless the controllers felt the necessity of deviating from the P-RNAV procedure (§4.3.3.2.2.1). The speed adjustments issued by the FI usually accompanied the aircraft all along the path from the assumption (a few miles after the sequencing legs) to the localiser.

Episode 3
D5.3.6-02 - Report on the Prototyping of a dense TM A Version : 1.01
Page 63 of 133
Issued by the Episode 3 consortium for the Episode 3 project co-funded by the European Commission and Episode 3 consortium.
Distribution of Instructions (RTA 80%)
0
5
10
15
20
25
30
35
0 5 10 15 20 25 30 35 40 45 50
Distance to TACTY (NM)
Num
ber
of In
stru
ctio
ns
Speed
DirectCDA
0
5
10
15
20
25
30
35
25 30 35 40 45 50
Num
ber
of In
stru
ctio
ns
FI
AP
Distribution of Instructions (RTA 80%)
0
5
10
15
20
25
30
35
0 5 10 15 20 25 30 35 40 45 50
Distance to TACTY (NM)
Num
ber
of In
stru
ctio
ns
Speed
DirectCDA
0
5
10
15
20
25
30
35
25 30 35 40 45 50
Num
ber
of In
stru
ctio
ns
0
5
10
15
20
25
30
35
25 30 35 40 45 50
Num
ber
of In
stru
ctio
ns
FI
AP
Figure 15. Geographical distributions of instructio ns.
4.3.3.2.2.3 Subjective feedback on working method
The participants generally agreed the proposed working method and tasks sharing among the positions were quite appropriate.
They emphasised how greatly the behaviour of an upstream position could have an impact on the achievement of a downstream position’s goal, typically in the case of approach and final positions. The proposed working method consisted in the final controller mostly relying on speed control to deliver traffic to the runway with the required spacing. That was felt achievable provided the approach controller would hand the traffic over with appropriate conditions. Indeed, a strict collaboration between the two positions might guarantee an adequate traffic delivery and a more effective and efficient tasks sharing. However, as a participant reported, the FI controller was only able to work the sequence given by the AP controller and for that reason he/she lost some flexibility. Meaning the final was not always able to recover from certain situations created upstream, unless deviating from the proposed working method (e.g. open-loop instructions).
Finally a concern was raised in session 3 with regard to the CTA/RTA implementation (see 4.1.5.5.1.2), and the way it had an impact on the tasks repartition between the arrival and the approach positions. The allocation of the CTA was simulated at the IAFs, i.e. at the extreme limit of arrival positions’ area of responsibility. In practice, the release of traffic from arrivals to the approach position occurred well before the IAFs (approximately 15 NM). As soon as the approach controller had the flight in contact, he/she intervened with speed control. As reported by a participant, from a certain point on the traffic had to be managed regardless the RTA capability, as the priority became homogeneous performances (taking also into account the prevailing wind conditions). That practice had then the effect to partly cancel the benefit of the RTA function which otherwise would have achieved the CTA at the IAF.
Therefore, some participants agreed with the project team suggestion, for consideration in concept assessment beyond the Episode 3 timeframe, to allocate the CTAs further out, far
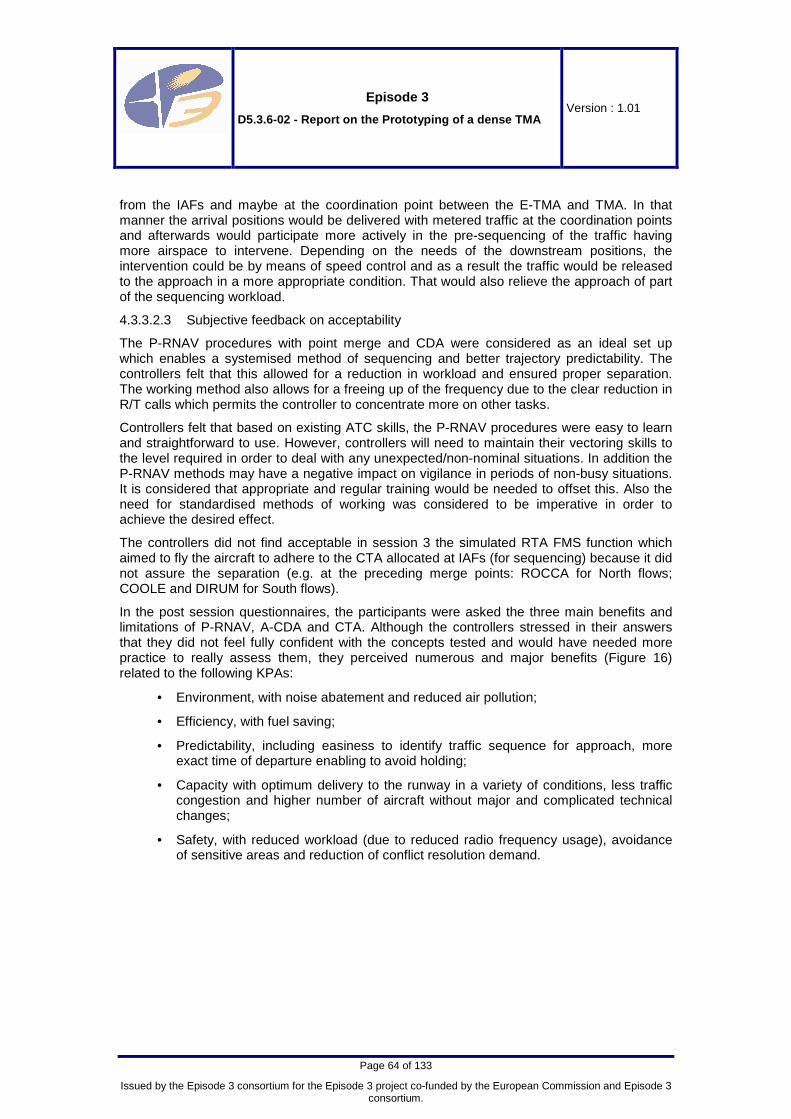
Episode 3
D5.3.6-02 - Report on the Prototyping of a dense TM A Version : 1.01
Page 64 of 133
Issued by the Episode 3 consortium for the Episode 3 project co-funded by the European Commission and Episode 3 consortium.
from the IAFs and maybe at the coordination point between the E-TMA and TMA. In that manner the arrival positions would be delivered with metered traffic at the coordination points and afterwards would participate more actively in the pre-sequencing of the traffic having more airspace to intervene. Depending on the needs of the downstream positions, the intervention could be by means of speed control and as a result the traffic would be released to the approach in a more appropriate condition. That would also relieve the approach of part of the sequencing workload.
4.3.3.2.3 Subjective feedback on acceptability
The P-RNAV procedures with point merge and CDA were considered as an ideal set up which enables a systemised method of sequencing and better trajectory predictability. The controllers felt that this allowed for a reduction in workload and ensured proper separation. The working method also allows for a freeing up of the frequency due to the clear reduction in R/T calls which permits the controller to concentrate more on other tasks.
Controllers felt that based on existing ATC skills, the P-RNAV procedures were easy to learn and straightforward to use. However, controllers will need to maintain their vectoring skills to the level required in order to deal with any unexpected/non-nominal situations. In addition the P-RNAV methods may have a negative impact on vigilance in periods of non-busy situations. It is considered that appropriate and regular training would be needed to offset this. Also the need for standardised methods of working was considered to be imperative in order to achieve the desired effect.
The controllers did not find acceptable in session 3 the simulated RTA FMS function which aimed to fly the aircraft to adhere to the CTA allocated at IAFs (for sequencing) because it did not assure the separation (e.g. at the preceding merge points: ROCCA for North flows; COOLE and DIRUM for South flows).
In the post session questionnaires, the participants were asked the three main benefits and limitations of P-RNAV, A-CDA and CTA. Although the controllers stressed in their answers that they did not feel fully confident with the concepts tested and would have needed more practice to really assess them, they perceived numerous and major benefits (Figure 16) related to the following KPAs:
• Environment, with noise abatement and reduced air pollution;
• Efficiency, with fuel saving;
• Predictability, including easiness to identify traffic sequence for approach, more exact time of departure enabling to avoid holding;
• Capacity with optimum delivery to the runway in a variety of conditions, less traffic congestion and higher number of aircraft without major and complicated technical changes;
• Safety, with reduced workload (due to reduced radio frequency usage), avoidance of sensitive areas and reduction of conflict resolution demand.

Episode 3
D5.3.6-02 - Report on the Prototyping of a dense TM A Version : 1.01
Page 65 of 133
Issued by the Episode 3 consortium for the Episode 3 project co-funded by the European Commission and Episode 3 consortium.
Benefits of P-RNAV/PMS, A-CDA and CTA.
0
1
2
3
4
5
6
None Few Some Numerous Minor Major
Num
ber
ofan
swer
s
S1
S2
S3
Figure 16. Benefits of P-RNAV/PMS, A-CDA and CTA.
To go a step further, the controllers were asked to specify which benefits could be provided by P-RNAV/PMS, A-CDA and CTA-RTA (Table 16).
Table 16. Benefits of P-RNAV, A-CDA and CTA-RTA.
P-RNAV / PMS A-CDA CTA-RTA
Improved flight efficiency and predictability with standardised and more efficient flight profiles, more exact lateral navigation.
Reduced communication load (less instructions and reduced frequency load) for controllers and pilots, and reduced complexity with spacing task felt easier.
Improved safety with regards to precision.
Increased capacity with optimised traffic patterns and exploitation of available airspace.
Reduced training requirement for the controllers, because of procedure intuitiveness.
Reduced workload for controllers and pilots (despite the monitoring load increase).
Improved flight efficiency with costs cut (fuel saving).
Increased situation awareness on the crew side.
Positive impact on environment with noise abatement.
Increased predictability for pilots.
Optimised distribution of the traffic in a time window and reduction in opening holding stacks.
Improved predictability and efficiency, with “automated” metering of flows, regularity of flights, “well spaced aircraft” arriving into sector “beautifully”, “streamed”.
According to the controllers, the limitations, minor for some, major for other (Figure 17) were related to the following KPA:
• Operability, with the reduced flexibility to control aircraft in an expedited manner (limited use of speed control), the need for an agreed and standardised team working method, the absence of direct routing to fill gaps, the loss of vectoring skills and the associated difficulty in unusual/unexpected circumstances, the controller boredom;

Episode 3
D5.3.6-02 - Report on the Prototyping of a dense TM A Version : 1.01
Page 66 of 133
Issued by the Episode 3 consortium for the Episode 3 project co-funded by the European Commission and Episode 3 consortium.
• Applicability, with the usability of the system in small and complex TMA (co-located airfields, multiple airports, military areas, crossing and VRF traffic) and with unusual scenarios (slower aircraft, weather influence, traffic volume);
• Capacity, with a (lack of) accuracy to deliver aircraft to tower, a loss of airspace for overflights, a not flexible use of airspace, finally not resolving the current problems of demand exceeding capacity;
• Safety, with risks of multiple aircraft in TMA (e.g. if sudden runway blockage) combined to the controller’s deskilling, departing traffic with low cruising level interfering with arrivals;
• Efficiency (including cost effectiveness), with a possible mileage increase, the airlines willingness to pay for EQ & certification, and the cost of procedure development, airspace change to support design/concept (see applicability issues) and training plans to confirm skills not routinely practiced.
0
1
2
3
4
5
6
Num
ber
ofan
swer
s
S1
S2
S3
None Few Some Numerous Minor Major
Limitations of P-RNAV/PMS, A-CDA and CTA.
Figure 17. Perceived limitations of P-RNAV/PMS, A-C DA and CTA.
To go a step further, the controllers were asked to specify which limitations could be due to P-RNAV/PMS, A-CDA and CTA (Table 17).
Table 17. Limitations of P-RNAV, A-CDA and CTA-RTA.
P-RNAV / PMS A-CDA CTA-RTA
Capacity and efficiency: need for large airspace, need room for manoeuvre to tighten traffic or create gaps, possible increase in mileage.
Teamwork: need for standardised method and efficient work upstream.
Safety: Deskilling and need for vectors in unexpected situations.
Applicability: with mixed of H/M/S/L traffic, with mixed level of equipage.
Safety: increased monitoring load, controllers no longer in control, must rely on aircraft to adhere strictly to the procedure, issue of responsibility for separation, conflicts with overflights (crossing routes + continuous climb/descent), TCAS warning
Applicability: need for large airspace, lack of compatibility with speed control
Safety: controller put out of the loop induces increased monitoring load, issue of delegating flight management to flight crew, RTA not suitable to ensure separation.
Operability: Compatibility between CTA and other controller tools (e.g. speed, heading), feasibility in degraded weather conditions (e.g. turbulences, headwind).

Episode 3
D5.3.6-02 - Report on the Prototyping of a dense TM A Version : 1.01
Page 67 of 133
Issued by the Episode 3 consortium for the Episode 3 project co-funded by the European Commission and Episode 3 consortium.
Table 18. Review of initial operability-related hyp otheses.
Hypothesis Status Comments
HO1. In a dense terminal area, P-RNAV/A-CDA concept is achievable.
Confirmed.
HO2. In all the conditions (weather, RTA equipage level), the proposed working method is feasible and acceptable to the controllers, although less feasible with large cluster size.
Not confirmed.
Different working methods were used, leading to different level of acceptability.
HO3. Compared to today, P-RNAV/A-CDA allows for better task allocation between controllers in TMA airspace.
Confirmed. If following the proposed working method.
HO4. The phraseology, HMI and tools used are appropriate and easy to work with.
Confirmed. None of these items were mentioned as problematic in any of the debriefing.
HO5. The P-RNAV/A-CDA allows segregation between arriving and departing flows.
Confirmed.
HO6. Compared to today, with P-RNAV/A-CDA and aircraft arriving on CTA, a reduction in instructions leads to a reduction in workload.
Confirmed.
HO7. Aircraft adjusting their speed (RTA function) induces a monitoring load increase and reduced RTA equipage induces a workload increase.
Partly confirmed.
Impact of conditions was lower than inter-individual differences.
4.3.3.3 Efficiency
This KPA addresses the actually flown 4D trajectories of aircraft in relationship to their Shared Business Trajectory. It usually includes both temporal and fuel efficiency. It is here addressed from both service providers and customers’ perspectives in terms of quality of service and flight efficiency, through the optimisation of vertical trajectories as well as 3D containment of trajectory dispersion, expected to result in an increase in fuel efficiency.
4.3.3.3.1 Quality of service
4.3.3.3.1.1 Lateral deviation
The use of open loop vectors was the main indicator considered to analyse the aircraft adherence to its 2D trajectory. The percentage of aircraft receiving open loop vectors (i.e. heading instructions) and the duration of these instructions reflect a quasi perfect adherence to the trajectory. More than 99.9% of the aircraft remained on lateral navigation mode and globally the aircraft remained more than 99% of the total flight time on this mode (Figure 18).
In session 2, aircraft on open loop vectors were essentially in the arrival sectors. The heading instructions were used to ensure the appropriate spacing at the IAF and counter-balance the reduced spacing due to the cluster size. In session 3, heading instructions were essentially issued in the final sector to create spacing at the FAF between aircraft sent too closely by the approach sector.
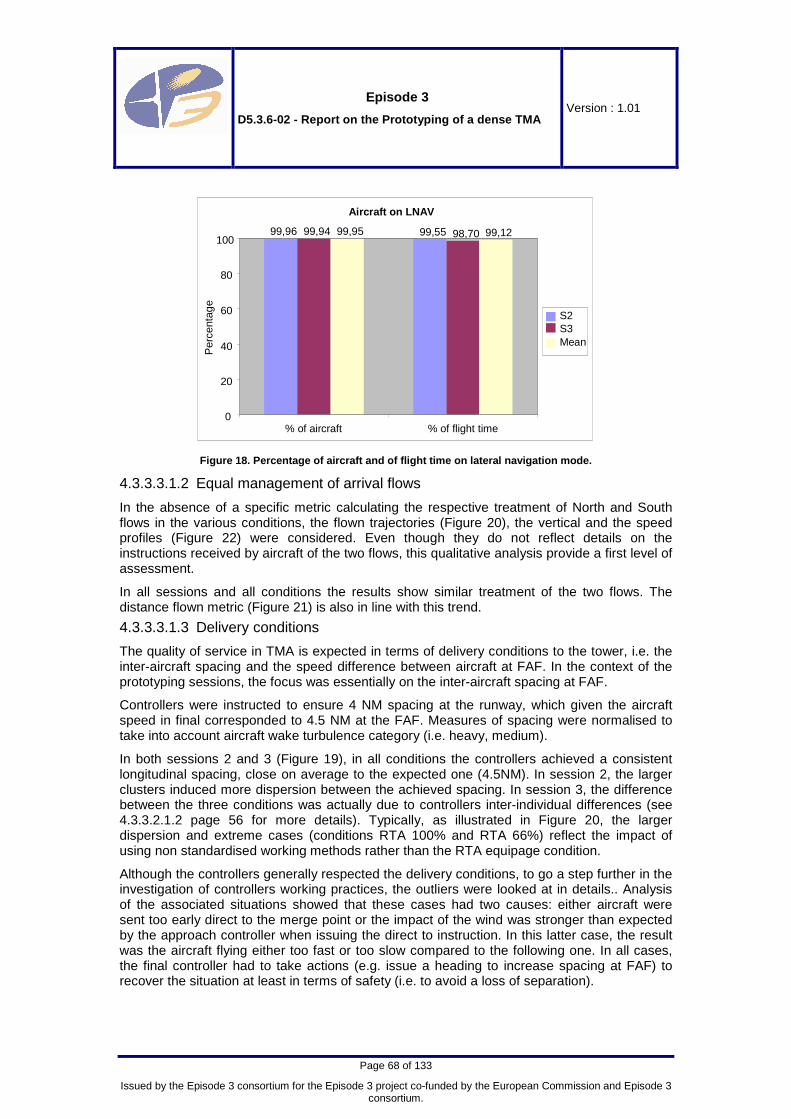
Episode 3
D5.3.6-02 - Report on the Prototyping of a dense TM A Version : 1.01
Page 68 of 133
Issued by the Episode 3 consortium for the Episode 3 project co-funded by the European Commission and Episode 3 consortium.
Aircraft on LNAV
99,96 99,5599,94 98,7099,95 99,12
0
20
40
60
80
100
% of aircraft % of flight time
Per
cent
age
S2S3Mean
Figure 18. Percentage of aircraft and of flight tim e on lateral navigation mode.
4.3.3.3.1.2 Equal management of arrival flows
In the absence of a specific metric calculating the respective treatment of North and South flows in the various conditions, the flown trajectories (Figure 20), the vertical and the speed profiles (Figure 22) were considered. Even though they do not reflect details on the instructions received by aircraft of the two flows, this qualitative analysis provide a first level of assessment.
In all sessions and all conditions the results show similar treatment of the two flows. The distance flown metric (Figure 21) is also in line with this trend.
4.3.3.3.1.3 Delivery conditions
The quality of service in TMA is expected in terms of delivery conditions to the tower, i.e. the inter-aircraft spacing and the speed difference between aircraft at FAF. In the context of the prototyping sessions, the focus was essentially on the inter-aircraft spacing at FAF.
Controllers were instructed to ensure 4 NM spacing at the runway, which given the aircraft speed in final corresponded to 4.5 NM at the FAF. Measures of spacing were normalised to take into account aircraft wake turbulence category (i.e. heavy, medium).
In both sessions 2 and 3 (Figure 19), in all conditions the controllers achieved a consistent longitudinal spacing, close on average to the expected one (4.5NM). In session 2, the larger clusters induced more dispersion between the achieved spacing. In session 3, the difference between the three conditions was actually due to controllers inter-individual differences (see 4.3.3.2.1.2 page 56 for more details). Typically, as illustrated in Figure 20, the larger dispersion and extreme cases (conditions RTA 100% and RTA 66%) reflect the impact of using non standardised working methods rather than the RTA equipage condition.
Although the controllers generally respected the delivery conditions, to go a step further in the investigation of controllers working practices, the outliers were looked at in details.. Analysis of the associated situations showed that these cases had two causes: either aircraft were sent too early direct to the merge point or the impact of the wind was stronger than expected by the approach controller when issuing the direct to instruction. In this latter case, the result was the aircraft flying either too fast or too slow compared to the following one. In all cases, the final controller had to take actions (e.g. issue a heading to increase spacing at FAF) to recover the situation at least in terms of safety (i.e. to avoid a loss of separation).

Episode 3
D5.3.6-02 - Report on the Prototyping of a dense TM A Version : 1.01
Page 69 of 133
Issued by the Episode 3 consortium for the Episode 3 project co-funded by the European Commission and Episode 3 consortium.
Inter aircraft spacing at FAF (Crosswind)
0
1
2
3
4
5
6
7
8
9
10
C1 C2 C3 All
Spa
cing
(nm
)
RTA 100% RTA 80% RTA 66% All
Session 2 Session 3
Mean
Max95%
Min5%
Mean +SD
Mean -SD
Figure 19. Inter-aircraft spacing at FAF (crosswind condition).
4.3.3.3.2 Flight efficiency
4.3.3.3.2.1 Trajectory flown
For each run of all sessions the aircraft trajectories were looked at. In the absence of advanced metrics such as “distance flown on the legs” or “trajectory containment”, these trajectories provide a support for a subjective analysis. Typically these trajectories illustrate:
• The usage of the legs;
• The containment of trajectories;
• The working methods used (and more specifically the frequency and location of occurrence of heading instructions).
In terms of legs usage, the approach controllers seldom used more than half of the legs. When following a standardised method they usually used a third of the legs, while non standardised methods led to a reduced usage, with a transfer of aircraft as soon as they entered the legs.
Depending on the working method used by the controllers, the trajectories containment in the final part of the sector (between the merge point and the final approach fix) differed. When the controllers used only the merge point to integrate the final sequence and put aircraft back on the standard trajectory, the aircraft trajectories were more contained and superimposed (Figure 20, left). When the controllers combined the use of the merge point, with the use of the TACTY point to refine the final spacing, the trajectories were spread in a larger zone (Figure 20, middle).

Episode 3
D5.3.6-02 - Report on the Prototyping of a dense TM A Version : 1.01
Page 70 of 133
Issued by the Episode 3 consortium for the Episode 3 project co-funded by the European Commission and Episode 3 consortium.
Non standardised working method
More tactical interventions, closed loop
Non standardised working method
More tactical interventions, open loop
Standardised working method
Figure 20. Trajectories illustrating working practi ces.
As described previously, two main working methods were identified and reflected in the trajectories flown. The first one corresponded to the standard method (Figure 20, left), which consists in:
• The arrival sectors ensuring a proper spacing at the IAF;
• The approach sector ensuring flow integration at the FAF in using the sequencing leg to acquire a proper spacing before sending aircraft direct to the merge point;
• The final sector leaving aircraft to fly on their lateral navigation mode and refining the final spacing with speed adjustments.
A second method observed in the final sector consisted in using both speed adjustments and vectors (to TACTY point) to refine the final spacing (Figure 20, middle). In addition to the negative impact on the number of instructions issued, this working method had also an impact on the approach sector work, in inducing earlier transfer of aircraft direct to the merge point. Although it reduced the approach controller workload, it modified the task allocation between sectors and increased the final controller’s workload.
A third practice was observed, actually reflecting a lack of coordination between approach and final controllers (Figure 20, right). In this case the approach controllers kept sending aircraft to the final sector without considering the load and current spacing achieved in final. As a result, the closeness between two successive aircraft handled in final with vectoring resulted not only in vectors for the given aircraft, but also for the four successive aircraft. More coordination between final and approach could have resulted in the approach controller retaining aircraft on the sequencing legs until the situation is solved.
4.3.3.3.2.2 Track miles
To assess the benefits of CTA and the subsequent usage of the sequencing legs, the distance flown by aircraft between the IAF and the runway was calculated. During sessions 2 and 3, the average distance flown is around 45NM (Figure 21). The similar distance is flown by aircraft from North and South flows.
In the session 3, the measured distance flown is slightly shorter in the 66% RTA condition (Figure 20, middle). It happens that TACTY was used most of the time in this condition which resulted in a shortening of most trajectories. However, this resulted in increased workload (more instructions issued) and less consistent spacing at FAF.

Episode 3
D5.3.6-02 - Report on the Prototyping of a dense TM A Version : 1.01
Page 71 of 133
Issued by the Episode 3 consortium for the Episode 3 project co-funded by the European Commission and Episode 3 consortium.
0
10
20
30
40
50
60
70
Mea
nF
low
nD
ista
nce
(NM
)
Mean flown distance from IAFs
0
10
20
30
40
50
60
70
Mea
nF
low
nD
ista
nce
(NM
)
RTA 100% RTA 80% RTA 66%
S3
Cluster 1 Cluster 2 Cluster 3
S2Longest
Shortest
Figure 21. Mean flown distance from IAFs.
4.3.3.3.2.3 Vertical profiles
The vertical profile of each aircraft was analysed. In addition to the full display of all aircraft profile per run, an average distribution was calculated per run and per condition. In all conditions and for both North and South flows, the vertical profiles were quite homogeneous. Aircraft started to descend at the start of the runs, and kept a regular descent down to the runway (see examples on Figure 22). In some cases, a smoothing of the descent curve was observed along the sequencing legs (Figure 23). Globally, the results show that aircraft from both North and South flows could achieve A-CDA from the IAF to the runway in all conditions.
Mean Vertical Profile for Arrivals -
Run : 090122A-
RTA 66% - Crosswind (S) - North flow
Alt
itud
e in
fee
t (*
100)
0
20
40
60
80
100
120
140
160
180
200
Distance To FAF (NM)0 5 10 15 20 25 30 35 40 45 50 55 60
Mean Vertical Profile for Arrivals -
Run : 090122A-
RTA 66% - Crosswind (S) - South flow
Alt
itud
e in
fee
t (*
100)
0
20
40
60
80
100
120
140
160
180
200
Distance To FAF (NM)0 5 10 15 20 25 30 35 40 45 50 55 60
Figure 22. Example of aircraft vertical profiles, f or North and South flows.

Episode 3
D5.3.6-02 - Report on the Prototyping of a dense TM A Version : 1.01
Page 72 of 133
Issued by the Episode 3 consortium for the Episode 3 project co-funded by the European Commission and Episode 3 consortium.
Mean Vertical Profile for Arrivals -
Run : 090121B-
RTA 80% - Crosswind (N) - South flow
Alt
itud
e in
feet
(*10
0)
0
20
40
60
80
100
120
140
160
180
200
Distance To FAF (NM)0 5 10 15 20 25 30 35 40 45 50 55 60
Figure 23. Example of descent smoothing along the s equencing leg.
4.3.3.3.3 Subjective feedback
In the post session questionnaire, the controllers’ feedback regarding the impact of P-RNAV, A-CDA and CTA on efficiency was globally positive. According to them, the use of P-RNAV and PMS enables more exact lateral navigation, which induces more standardised and efficient flight profiles. The use of A-CDA enables environmental benefits in terms of noise abatement and pollution reduction, as well as potential fuel savings. Last of all, the use of CTA enables an optimised distribution of the traffic in a time window, which should reduce the need for opening holding stacks and an optimum delivery to the runway in a variety of conditions.
4.3.3.3.4 Summary
Efficiency was addressed through the analysis of time spent on open loop vector (use of navigation mode), inter-aircraft spacing at the FAF (delivery conditions to tower) and vertical profiles (continuous descent achievement). In all conditions, 99% of the aircraft were during 99% of their flight time on lateral navigation mode. Both North and South flows were treated equally. On average, in all conditions, the delivery conditions to the tower were homogeneous, with aircraft transferred on average with 4.5 NM spacing at the FAF. In addition, in all conditions, aircraft could achieve continuous descent from the IAF down to the runway, with homogeneous descent profiles.
Table 19. Review of initial efficiency-related hypo theses.
Hypothesis Status Comments
HEQ1. P-RNAV enables aircraft to remain on lateral navigation mode.
Confirmed.
HEQ2. P-RNAV/A-CDA allows for a regular spacing at the runway.
Confirmed.
HEQ3. Reduced RTA equipage degrades the level of metering at the IAFs which induces an increase in sequencing legs usage.
Not confirmed.
Not possible to assess the impact of RTA equipage, due to inter-individual differences and non standardised working methods.
HEQ4. P-RNAV/A-CDA allows for equal management of arrival flows in all the conditions.
Confirmed.
HEF1. A-CDA and CTA in a P-RNAV environment enables homogeneous vertical profiles.
Confirmed.

Episode 3
D5.3.6-02 - Report on the Prototyping of a dense TM A Version : 1.01
Page 73 of 133
Issued by the Episode 3 consortium for the Episode 3 project co-funded by the European Commission and Episode 3 consortium.
Hypothesis Status Comments
HEF2. With A-CDA and CTA in a P-RNAV environment the distance flown in terminal area is close to the planned trajectory.
Not confirmed.
Absence of a reference corresponding to the planned trajectory.
HEF3. Reduced RTA equipage increases the distance flown and the fuel consumption.
Not confirmed.
Differences between conditions actually due to differences in working methods.
4.3.3.4 Predictability
This KPA addresses the ability of the ATM System to ensure a reliable and consistent level of 4D trajectory performance. In other words: across many flights, the ability to control the variability of the deviation between the actually flown 4D trajectories of aircraft in relationship to the Reference Business Trajectory.
The focus area of the present prototyping sessions (on-time operation) covers the impact of variability of the flight operation, of adherence to the RBTs (CTA) and of the use of A-CDA on the predictability of TMA traffic (more predictable lateral/vertical flight paths).
The indicators considered were similar to the efficiency-related ones. Typically, the following indicators provided information on the impact of 4D Trajectory Management on predictability:
• The time spent on open-loop vector indicates how well the aircraft adhered to its agreed and expected trajectory; the more the aircraft adhered to its trajectory, the more this trajectory can be considered as predictable;
• The respect of delivery conditions (inter-aircraft spacing at runway) also suggests predictability of arrivals aircraft.
In the post session questionnaire, the controllers expressed their feeling regarding the impact of P-RNAV, A-CDA and CTA on trajectory predictability. Globally the controllers felt a benefit in terms of trajectory predictability (Figure 24), due to a reduced usage of open loop instructions and a more structured traffic delivery to arrival sectors. However, especially with A-CDA and CTA, the reduced predictability (and awareness) of aircraft speed led some controllers to feel no longer in control of the situations.
Enables increase of trajectory predictability
0
1
2
3
4
5
6
Stronglydisagree
Disagree Neutral Agree Stronglyagree
Num
ber
ofan
swer
s
S1
S2
S3
Figure 24. Controllers' subjective feedback on pred ictability.
This feeling was confirmed with objective results. As shown in §4.3.3.3.1.1, the controllers managed to facilitate the adherence to the trajectory with few interventions to the 2D profile.

Episode 3
D5.3.6-02 - Report on the Prototyping of a dense TM A Version : 1.01
Page 74 of 133
Issued by the Episode 3 consortium for the Episode 3 project co-funded by the European Commission and Episode 3 consortium.
As a result, more than 99% of aircraft remained on lateral navigation mode. The analysis of trajectories (Figure 20) also showed that when using standardised procedures, the controllers managed to contain these trajectories within a limited area. These two aspects contribute to the system predictability in terms of predicted trajectories, from both controllers and pilots’ perspectives.
As shown in §4.3.3.3.1.3 (Figure 19), the use of P-RNAV and PMS enabled a homogeneous spacing at the runway. This contributes to the system predictability in terms of delivery conditions from the final to the tower.
The negative effect of weather conditions on the predictability was observed, specifically in the approach sector. Difficulties to anticipate correctly aircraft positions and behaviour in the approach sector sometimes led to tactical interventions of the final controller to create the correct spacing at the runway.
Table 20. Review of initial predictability-related hypotheses.
Hypothesis Status Comments
HP1. The use of P-RNAV and CTA contains the track dispersion.
Confirmed.
HP2. The use of P-RNAV and CTA allows for limited use of open-loop instructions (e.g. headings).
Confirmed.
4.3.3.5 Safety
This KPA addresses the risk, the prevention and the occurrence and mitigation of air traffic accidents. The Focus Area is ‘ATM-related Safety Outcome’, covering the occurrence and prevention of accidents involving aircraft with a MTOW > 2.25 tonnes, operating under IFR, with a direct and/or indirect ATM contribution. This includes, for example, collisions on the ground and in the air. This exercise does not directly address the focus area, but rather deals with safety impacts through reduced workload and increased situational awareness, due to the deployment of new route structures and structured standardized working methods.
4.3.3.5.1 Subjective feedback
The controllers’ feedback regarding the impact of the new procedures on safety was diverse. Whereas the feedback was more positive in session 2, the controllers globally thought that with P-RNAV, A-CDA and CTA the safety was either similar or lower than today (Figure 25).
The controllers stressed positive impacts on safety. First, Point Merge and P-RNAV enable predictable trajectories and ensure improved situation awareness, directly contributing to safety. Second, CTA enables more regular traffic which allows less likely congestion and interferences. In addition, with the same amount of traffic, the workload reduction provides controllers with more time for monitoring and for being prompter to react when facing unexpected situations.
On the other hand, a first concern raised in session 1 (subsequently solved by design in sessions 2 and 3) was related to clearing all aircraft at the same level on the same point with a head to head convergence, which was not felt safe by controllers. A second main concern was related to uncertainties introduced by CDA and CTA. Controllers felt no longer in control, they felt they could only guess (aircraft descent, speed, pilots’ adherence to instruction) and considered that descending all aircraft to the same level without knowing their speed was even worse. Regarding CTA, the controllers insisted on the fact that the proposed RTA accuracy (+/-30 seconds) could not ensure a proper separation.

Episode 3
D5.3.6-02 - Report on the Prototyping of a dense TM A Version : 1.01
Page 75 of 133
Issued by the Episode 3 consortium for the Episode 3 project co-funded by the European Commission and Episode 3 consortium.
P-RNAV, A-CDA and CTA increase safety level
0
1
2
3
4
5
6
Stronglydisagree
Disagree Neutral Agree Stronglyagree
Num
ber
ofan
swer
s
S1
S2
S3
P-RNAV, A-CDA and CTA increase safety level
0
1
2
3
4
5
6
Stronglydisagree
Disagree Neutral Agree Stronglyagree
Num
ber
ofan
swer
s
S1
S2
S3
Figure 25. Perceived impact of P-RNAV, A-CDA and CT A on safety level.
4.3.3.5.2 Workload
As described in §4.3.3.2.1.2, P-RNAV and A-CDA enable a better predictability of trajectories and a decreased communication load, provides the controllers with more availability to monitor the situations. As a result, they felt the improved situation awareness as beneficial to safety. However, uncertainties introduced with CTA/RTA (essentially aircraft speed changes) and convergence of aircraft towards a same point at the same level (session 1) resulted in an increased monitoring load, which caused them concerns in terms of safety.
Globally, the safety benefits due to reduced communication load with P-RNAV and A-CDA are counter-balanced by the safety concerns due to uncertainty and feeling of loss of control with aircraft flying on RTA.
4.3.3.5.3 Situation awareness
The impact on controllers’ perceived situational awareness was assessed from subjective feedback obtained from the post-exercise and post-session questionnaires.
With P-RNAV and CDA (sessions 1 and 2), the controllers rated their situation awareness either similar or improved compared to today. When adding CTA (session 3), they perceived their situation awareness as similar or quite degraded compared to today (Figure 26).
The controllers attributed the positive impact of P-RNAV/A-CDA methods on their situational awareness to the standardisation of routes and trajectories. This was particularly the case for the approach and final positions, where the new systemised procedures allowed for a more ordered flow of traffic and enabled an increase in the predictability of the traffic. They reported that this increase in predictability gave them a better overview and contributed to a clear mental picture of the traffic. It also allowed them to anticipate the evolution of the traffic in a short time. They also found that the reduction in R/T with the new working methods freed up time which allowed them to focus more on the radar screen and to plan ahead.
In the post-exercise questionnaires, the approach controllers reported that at times they were sometimes surprised by events which they did not expect. The reasons given for this were mainly due to the behaviour of the aircraft not following the P-RNAV track due to non-compliance with the instructions given or aircraft turning late. Some controllers also reported
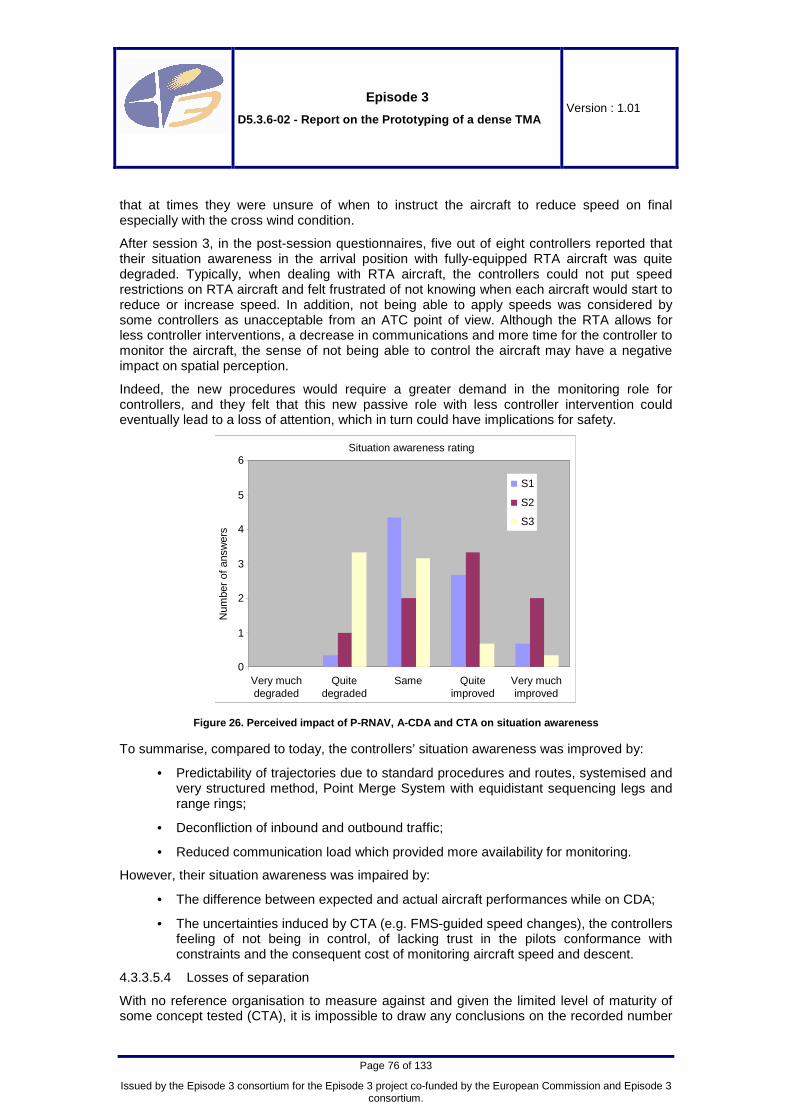
Episode 3
D5.3.6-02 - Report on the Prototyping of a dense TM A Version : 1.01
Page 76 of 133
Issued by the Episode 3 consortium for the Episode 3 project co-funded by the European Commission and Episode 3 consortium.
that at times they were unsure of when to instruct the aircraft to reduce speed on final especially with the cross wind condition.
After session 3, in the post-session questionnaires, five out of eight controllers reported that their situation awareness in the arrival position with fully-equipped RTA aircraft was quite degraded. Typically, when dealing with RTA aircraft, the controllers could not put speed restrictions on RTA aircraft and felt frustrated of not knowing when each aircraft would start to reduce or increase speed. In addition, not being able to apply speeds was considered by some controllers as unacceptable from an ATC point of view. Although the RTA allows for less controller interventions, a decrease in communications and more time for the controller to monitor the aircraft, the sense of not being able to control the aircraft may have a negative impact on spatial perception.
Indeed, the new procedures would require a greater demand in the monitoring role for controllers, and they felt that this new passive role with less controller intervention could eventually lead to a loss of attention, which in turn could have implications for safety.
Situation awareness rating
0
1
2
3
4
5
6
Very muchdegraded
Quitedegraded
Same Quiteimproved
Very muchimproved
Num
ber
ofan
swer
s
S1
S2
S3
Figure 26. Perceived impact of P-RNAV, A-CDA and CT A on situation awareness
To summarise, compared to today, the controllers’ situation awareness was improved by:
• Predictability of trajectories due to standard procedures and routes, systemised and very structured method, Point Merge System with equidistant sequencing legs and range rings;
• Deconfliction of inbound and outbound traffic;
• Reduced communication load which provided more availability for monitoring.
However, their situation awareness was impaired by:
• The difference between expected and actual aircraft performances while on CDA;
• The uncertainties induced by CTA (e.g. FMS-guided speed changes), the controllers feeling of not being in control, of lacking trust in the pilots conformance with constraints and the consequent cost of monitoring aircraft speed and descent.
4.3.3.5.4 Losses of separation
With no reference organisation to measure against and given the limited level of maturity of some concept tested (CTA), it is impossible to draw any conclusions on the recorded number

Episode 3
D5.3.6-02 - Report on the Prototyping of a dense TM A Version : 1.01
Page 77 of 133
Issued by the Episode 3 consortium for the Episode 3 project co-funded by the European Commission and Episode 3 consortium.
of losses of separation. The following figures are presented to give indication of the type and geographical location of the losses of separation.
Only minor losses of separation were observed, with longitudinal separation slightly below 3 NM (usually between 2.6 and 2.8NM) and vertical separation slightly below 1000ft (800ft).
In session 2, eight minor cases of losses of separation were observed. One case occurred in arrival South sector, due to two aircraft converging at the same predicted time at the IAF. The seven other cases occurred in final sector when the controller integrated converging flows on final, but were actually a consequence of the approach controller sending successive aircraft direct to the merge point either too close, or with correct spacing but with the second aircraft much faster than the preceding one.
In session 3, two minor losses of separation were observed in final, but actually resulted from aircraft transferred from approach with not enough spacing. Recovering from the minor loss of separation required the second aircraft to be vectored and resulted in losing spacing for the successive aircraft also sent from approach without margins. The lack of coordination between approach and final (essentially the approach controller not taking into account difficulties encountered in final with aircraft losing separation) worsened the situation for the final controller.
Again, although no conclusion can be drawn from the losses of separation in such a context (limited training, heterogeneous controller experience with the tested concepts, limited number of run), their analysis highlights possible sources of risks to be carefully considered for further development of the concepts, typically the need for standardised working methods and efficient teamwork.
4.3.3.5.5 Summary
P-RNAV and Point Merge seem to increase safety level with an improved predictability of trajectories, a reduced workload and better situation awareness. However, A-CDA and CTA degrades the controller situation awareness in introducing uncertainties in the system, mainly in terms of aircraft behaviour (speed changes).
Table 21. Review of initial safety-related hypothes es.
Hypothesis Status Comments
HS1. Compared to today, P-RNAV enables earlier anticipation by controllers and contributes to maintaining a clear picture of the traffic.
Confirmed.
HS2. Compared to today, A-CDA and CTA degrade the situation awareness, in preventing controllers from knowing when exactly aircraft will initiate their descent and when exactly they will adjust the speed.
Confirmed
HS3. Compared to today, whatever the RTA equipage level, P-RNAV/A-CDA increases controllers’ perceived level of safety.
Confirmed Positive impact of P-RNAV and A-CDA on safety confirmed; impact of RTA still to be confirmed.
HS4. There is no safety hazard because of segregation of arriving and departing flows.
Confirmed
4.3.3.6 Capacity
This KPA addresses the ability of the ATM System to cope with air traffic demand (in number and distribution through time and space). In the present prototyping sessions, the focus area

Episode 3
D5.3.6-02 - Report on the Prototyping of a dense TM A Version : 1.01
Page 78 of 133
Issued by the Episode 3 consortium for the Episode 3 project co-funded by the European Commission and Episode 3 consortium.
is Airspace Capacity. The series of exercises aimed to provide initial trends on the reduction in controller task load achieved by a reduced requirement for controller tactical intervention – due to new organisation of TMA operations relying on Performance Based Navigation (PBN) concepts. This reduced workload might provide a potential for capacity increase, but it has to be proven that freed cognitive resources are used for capacity. Achieved throughput is also considered as an indicator of Capacity.
4.3.3.6.1 Subjective feedback
Even though the capacity was not explicitly assessed with a dedicated questionnaire item it was mentioned by the controllers when addressing the questionnaire items on benefits and limitations of the tested concepts.
On the one hand, the controllers’ perception was that mainly because of the P-RNAV structure and the Point Merge working method the radio communications decreased significantly. That along with a better predictability of the trajectories could provide controllers with more availability, relieve them of part of their workload and consequently lead to an increase of their capacity.
The airspace capacity, on the other hand, was for the participants still dictated by objective constraints (e.g. runway occupancy time). Although the sessions provided optimised traffic patterns for the arrivals (enhancement of the quality of service), the introduction of different constraints (e.g. CTA, vertical window) was felt rather detrimental to a significant increase of airspace capacity.
4.3.3.6.2 Throughput
The traffic samples used in session 2 and 3 were constructed to reflect 80 movements per hour at EIDW (40 arrivals on Runway 10R and 40 departures on Runway10L). The analysis proved the controllers were capable to accommodate that demand of traffic over the sessions (Figure 27, left). With focus on the arrivals, the number of aircraft passing the FAF in one hour period was calculated throughout the exercises. No significant differences were found within the sessions, the throughput was consistent and not affected by the different conditions (Figure 27, right).
Throughput at FAFSession 3
0
5
10
15
20
25
30
35
40
45
Throughput at FAF
0
5
10
15
20
25
30
35
40
45
A/C
Num
ber
per
hour
0
5
10
15
20
25
30
35
40
45Session 2 vs Session 3Session 2 vs Session 3
0
5
10
15
20
25
30
35
40
45
S2 S3 RTA 100% RTA 80% RTA 66%
Figure 27. Throughput at FAF

Episode 3
D5.3.6-02 - Report on the Prototyping of a dense TM A Version : 1.01
Page 79 of 133
Issued by the Episode 3 consortium for the Episode 3 project co-funded by the European Commission and Episode 3 consortium.
Table 22. Review of initial capacity-related hypoth eses.
Hypothesis Status Comments
HC1. With P-RNAV/A-CDA and with aircraft arriving within CTA tolerance window, the expected throughput is achieved (for non RTA capable aircraft the tolerance window may be wider than +/- 30 sec).
Confirmed.
4.3.3.7 Environmental sustainability
Aviation has a diverse impact on the environment, but not all aspects can be influenced by the ATM System. This KPA addresses the role of ATM in the management and control of environmental impacts. The aims are to reduce adverse environmental impacts (average per flight); to ensure that air traffic related environmental considerations are respected; and, that as far as possible new environmentally driven non-optimal operations and constraints are avoided or optimised as far as possible. In the present sessions, the focus areas are noise and atmospheric impacts, with the series of exercises assessing the optimisation of vertical trajectories as well as 3D containment of trajectory dispersion, expected to result in a decrease of the environmental impact.
4.3.3.7.1 Subjective feedback
Neither the questionnaires nor the debriefing addressed explicitly the impact of the tested concept on environmental sustainability. However, as described in the section on acceptability, most of the controllers clearly mentioned that P-RNAV, A-CDA and CTA would provide a benefit in terms of environmental sustainability, with both noise abatement and reduced air pollution.
4.3.3.7.2 Flown trajectories
As illustrated in a previous section (§4.3.3.3.2.1), the use of P-RNAV and PMS enabled trajectories to be contained. However, the working method used influenced the containment of the trajectories, especially in final, with the use of a tactical point (TACTY) to refine spacing extending the space occupied by trajectories. The analysis of vertical profiles (§4.3.3.3.2.3) showed that the aircraft trajectories were vertically contained, with quite limited standard deviations and that it was possible to perform advanced CDA.
In the context of the prototyping sessions, the noise impact was not measured.
Table 23. Review of initial environment-related hyp otheses.
Hypothesis Status Comments
HEN1. Compared to today, P-RNAV/A-CDA reduces gaseous emissions because of efficient vertical profiles, reduction of level offs, reduction of open-loop manoeuvres and stacks.
(Indirectly) Confirmed
Assessed through analysis of vertical profiles, and subjective data on noise and gaseous emissions.
4.3.4 Main conclusions of the Task 1 (P-RNAV, A-CDA and CTA assessment)
4.3.4.1 Operability
The P-RNAV/Advanced CDA concept tested is operationally viable. With P-RNAV and A-CDA, the overall feedback was positive, controllers found it easy to work with the procedures, provided a suitable and safe design (e.g. no head to head converging flows). P-RNAV and A-

Episode 3
D5.3.6-02 - Report on the Prototyping of a dense TM A Version : 1.01
Page 80 of 133
Issued by the Episode 3 consortium for the Episode 3 project co-funded by the European Commission and Episode 3 consortium.
CDA enable a large reduction in R/T, leaving free cognitive resource. Traffic clustering and crosswind conditions induced controller actions and increased workload, still at an acceptable level. Teamwork and coordination, especially between approach and final are essential for efficiency and throughput.
The CTA concept has potential for optimal delivery at metering point (e.g. IAF), increase in regularity, punctuality, predictability, reduction in stack usage. However it was judged by controllers that the CTA/RTA concept needs further maturation. In terms of safety, as CTA/RTA does not ensure the separation and the +/- 30sec tolerance window is obviously not accurate enough to allow for separation minima in TMA. In addition, RTA reduces flexibility (ATC speed control / level / heading for separation issues may not be compliant with the RTA) and controllers’ situation awareness (controllers feeling not in control) and lacks robustness against external factors (e.g. meteorological conditions). In terms of design, the location of the CTA point could be allocated at metering points further out than the IAF (also merging points), enabling controllers to use “standard” speed control between that point and the IAF to ensure separation. Additional concerns were raised regarding the compatibility between the tested concept elements (P-RNAV, A-CDA and CTA). Regarding CTA/A-CDA joint usage, the controllers questioned the interdependency between RTA and A-CDA, typically in terms of priority between the two and the possible separation issues involved.
Regarding CTA/P-RNAV joint usage, the proposed strategy for speed management was to adhere to CTA through RTA in so far as possible. In this case, the FMS speed management involved earlier speed reduction. In theory, this was aimed at ensuring ideal metering before entering the Point Merge System (i.e. with the benefit of very limited usage of the sequencing legs). However, due to a known limitation in the prototyping sessions (scripted CTA, with no dynamic behaviour), adhering to CTA did not always guarantee an optimal metering, nor a minimum usage of the sequencing legs. As a consequence, the controllers could not observe the benefits in terms of track miles of systematic compliance with the CTA/RTA.
4.3.4.2 Performance
Initial trends on KPA were measured along the prototyping sessions. Even under high traffic load, the concept provided benefits, in enabling to
• Keep aircraft on lateral navigation, with more than 99,8% of aircraft spending more than 98,7% of their flight time (2D);
• Carry out Advanced Continuous Descent Approaches (3D);
• Achieve consistent inter-aircraft spacing on final (4D).
However, the variability in working methods (e.g. due to maturity, training, subjects continuity issues) had an impact on these KPAs. Typically, when following the proposed standardised working method, the controllers could achieve the correct spacing and trajectories containment. Deviation from the standardised working method, usually due to a lack of coordination between Approach and Final induced more tactical interventions, with either closed loop (e.g. direct TACTY) or open loop (e.g. heading) instructions.

Episode 3
D5.3.6-02 - Report on the Prototyping of a dense TM A Version : 1.01
Page 81 of 133
Issued by the Episode 3 consortium for the Episode 3 project co-funded by the European Commission and Episode 3 consortium.
5 TASK 2
5.1 EXPERIMENT AND STRATEGY PLANNING
5.1.1 Main Objectives
The main objective of the EP3 WP5.3.6 4th Prototyping Session is to assess the interoperability among:
• New TMA route structure in a high density route structure environment (e.g. Point Merge System);
• Continuous Descent Approach; and
• ASPA S&M (ASAS Spacing Sequencing and Merging).
The operational implementation of the above new concepts is expected to provide benefits in terms of:
• Reduced controllers workload;
• Increased controllers acceptability;
• Increased controller situation awareness; and
• Increased level of safety.
The assessment is achieved in a representative TMA environment, allowing to answer research questions at a generic execution phase level.
5.1.2 Approach
The validation scenarios are based on Roma TMA airspace feeding Fiumicino and Ciampino Airports. In this framework a new PMS route structure has been designed and according to A-CDA and ASPA S&M guidelines, new operational working methods have been proposed to the ATCOs involved in the prototyping session.
Concepts clarification and associated working methods are main targets of the prototyping session. Exercises are structured to have controllers’ feedback and identify potential benefits deriving from the implementation of the proposed concepts.
It is noted that no baseline or reference situation is simulated and measured. Two motivations guided this choice:
• Episode 3 validation objectives are oriented towards concept clarification rather than performance assessment (see section Table 25);
• The limited duration (1 week including training) of prototyping session offers a limited number of runs during which concept elements can be investigated.
As a consequence, the session does not enable an objective comparison with current operational environment -i.e. based on objective performance metrics. However, subjective data, essentially recorded via questionnaires/briefings, are collected to assess perceived benefits and limitations of the simulated environment compared to the current ones.
A brief summary of the fourth prototyping session is given as the following:
• Session 4:

Episode 3
D5.3.6-02 - Report on the Prototyping of a dense TM A Version : 1.01
Page 82 of 133
Issued by the Episode 3 consortium for the Episode 3 project co-funded by the European Commission and Episode 3 consortium.
o The session was divided into two organisations, ORGA and ORGB, the first one to test P-RNAV/A-CDA concepts and the second one to test ASPA S&M concept in addition to P-RNAV/A-CDA.
o The airspace was based on the current configuration of Rome TMA in terms of sectorisation, with a Point Merge system for the arrivals to LIRF composed of two sequencing legs each having a merge point.
o Advanced Continuous Descent Approaches (A-CDA) were enabled to the extent possible taking into account the airspace configuration feeding two parallel runways each one using two opposite sequence legs. As a result steady entry sequence flight levels were needed until the aircraft was cleared to the Point Merge.
o ASPA S&M application was considered to facilitate the arrival traffic spacing when applied in the upstream sectors.
5.1.3 Prototyping Session’s Objectives
The main focus of the fourth prototyping session is the assessment of operability (usability, suitability) and perceived benefits and limitations of A-CDA, P-RNAV and ASPA S&M Spacing.
The general aim of assessing operability is broken down into the following set of objectives related to SESAR Key Performance Areas of interest for the concept element (Table 24). A secondary focus will be on safety, in terms of situation awareness.
Table 24. Episode 3 4 th Prototyping Session high level objectives.
KPA High level objectives
Acceptability, feasibility Operability
Workload
Safety Situation awareness
Perceived Level of Safety
The high level objectives of Table 24 are further split into the Low Level Objectives (LLO) and the associated hypotheses listed in Table 25. The following LLOs are considered to be the most important ones:
• Assess the feasibility of the integrated P-RNAV/A-CDA and ASPA S&M operational procedures in Rome TMA;
• Assess the controller’s acceptance of the integrated procedure proposed for P-RNAV/A-CDA and ASPA S&M, including their perceived benefits and limitations.
Table 25. Episode 3 TMA prototyping session 2 Low l evel objectives and related hypothesis.
High level objectives (HO) Low level objectives (LO) Hypothesis (H)
LO1.1. Define the P-RNAV/A-CDA and ASPA S&M working method.
HO1. Acceptability, feasibility
LO1.2.a Assess the feasibility and controllers’ acceptance of the defined P-RNAV/A-CDA and ASPA
H1.2.1. The defined P-RNAV/A-CDA and ASPA S&M working method is feasible and acceptable to the controller.

Episode 3
D5.3.6-02 - Report on the Prototyping of a dense TM A Version : 1.01
Page 83 of 133
Issued by the Episode 3 consortium for the Episode 3 project co-funded by the European Commission and Episode 3 consortium.
High level objectives (HO) Low level objectives (LO) Hypothesis (H)
S&M working method.
LO1.2.b Assess the interoperability between PMS and ASPA S&M concepts.
LO1.3. Assess the suitability in the context of a dense terminal area of the P-RNAV/A-CDA and ASPA S&M concepts.
H1.3.1. In a dense terminal area, P-RNAV/A-CDA and ASPA S&M concepts are achievable.
LO1.4. Define the phraseology which supports the defined P-RNAV/A-CDA and ASPA S&M working method.
LO1.5. Assess the usability and suitability of the defined phraseology.
H1.4.1. The defined phraseology is appropriate and easy to understand.
HO2. Workload LO2.1. Assess the effect of the working method on the controllers’ workload.
H2.1.1. Compared to today, with P-RNAV/A-CDA and ASPA S&M, a reduction in instructions leads to a reduction in workload.
LO3.1. Assess the effect of the P-RNAV/A-CDA and ASPA S&M working method on controllers’ perceived situation awareness.
H3.1.1. Compared to today, P-RNAV/A-CDA and ASPA S&M enable earlier anticipation by controllers
H3.1.2. P-RNAV contributes to maintaining a clear picture of the traffic.
H3.1.3. Compared to today, CDA degrades the situation awareness, e.g. in preventing controllers from knowing when exactly aircraft will initiate their descent.
LO3.2. Assess the effect of the P-RNAV/A-CDA and ASPA S&M on controllers’ perceived level of safety.
H3.2.1. Compared to today, P-RNAV/A-CDA and ASPA S&M increase controllers’ perceived level of safety.
LO3.3. Assess the effect of the conditions on controllers’ perceived level of safety.
H3.3.1.There is no impact of the conditions on the controllers’ perceived level of safety.
HO3. Safety
LO3.4. Assess the effect of the conditions on possible occurrence and severity of events detrimental to safety.
H3.4.1. Some conditions have a more negative impact on safety than other.

Episode 3
D5.3.6-02 - Report on the Prototyping of a dense TM A Version : 1.01
Page 84 of 133
Issued by the Episode 3 consortium for the Episode 3 project co-funded by the European Commission and Episode 3 consortium.
5.1.4 Methods and Technique
5.1.4.1 Measurements
The 4th Prototyping Session is a unique session of 5 working days (1 day training and 4 days simulation exercises and debriefing) where a qualitative, subjective validation assessment has been carried out.
The qualitative assessment has been justified by the following risks:
• 1 day training does not provide sufficient time to familiarise with the HMI and the new proposed working methods;
• 4 exercise days does not give valuable statistical results.
The qualitative validation assessment of LOs listed in Table 25 has been carried out applying the human data collection methods described in the next paragraphs.
5.1.4.2 Subjective Measurements
Prototyping session offered a limited number of measured runs along which concept elements could be investigated, so that concept clarification was the main focus rather than performance assessment. Concept clarification was carried out through the analysis of subjective data, collected through questionnaires/briefings (see WP5.3.6 Experimental Plan [1]).
5.1.4.2.1 Questionnaires
5.1.4.2.1.1 Entry questionnaire
The aim of the Entry questionnaire is to capture information about the experience of the participants, their willingness to participate, and their level of knowledge of the main operational concepts that will be evaluated during the prototyping sessions.
5.1.4.2.1.2 Post Exercise questionnaire (PEQ)
The Post Exercise Questionnaire was a rating-scale type to obtain, at the end of each run, the controller’s feedback on the application of Point Merge System technique, A-CDA and ASPA S&M concepts.
The aim of the Post-exercise questionnaire is to collect immediate feedback on the run, with a specific focus on:
• Operability/acceptability;
• Workload;
• Safety aspects;
• Situation Awareness;
• Benefits and limitations.
For both ORGA and ORGB, four runs were executed, each run with an increasing amount of traffic, and with a PEQ filled in by the Controllers involved in the runs.
5.1.4.2.1.3 Briefings/Debriefings/Interview
Daily briefing: At the beginning of each day, the controllers were briefed about the objectives and the general organisation of the day.
Debriefings were conducted at the end of each run to enable participants to discuss their feeling regarding the feasibility and the acceptability of the tested concept, and evoke more specifically what they experienced during the run (e.g. confirm appropriateness of procedures, discuss usability of the phraseology, describe problems or difficulties encountered).

Episode 3
D5.3.6-02 - Report on the Prototyping of a dense TM A Version : 1.01
Page 85 of 133
Issued by the Episode 3 consortium for the Episode 3 project co-funded by the European Commission and Episode 3 consortium.
In addition a final debriefing took place at the end of the prototyping session to collate participants’ final feedback regarding the acceptability of the concept, improvements required and issues to further investigate.
Structured One to One interviews: during the prototyping session, these kinds of interview were conducted with each of the participants at least once. The objective was to get a more specific and precise feedback about the operability of the operational concepts and their working methods.
5.1.4.2.1.4 Observations
Observations were performed during the runs by:
• Human factors observation: Human factor experts took note of relevant events to be discussed later, either during collective or individual debriefing sessions;
• Screen captures: On request, the supervision is capable of taking screen captures of any working positions.
5.1.5 Scenario Specifications
5.1.5.1 Airspace
The validation scenarios, which are shown in Table 26, are based on the airspace of Rome TMA (Figure 28).
Table 26: Validation Scenarios
Figure 28. Episode 3 4 th Prototyping Session Airspace.
Validation Scenario ID Validation Scenario Objective
ORGA Point Merge System and A-CDA
Evaluate the use of PMS and A – CDA in Rome TMA
ORGB ORGA + ASPA S&M Spacing Evaluate the interoperability of PMS and ASPA S&M Spacing in Rome TMA

Episode 3
D5.3.6-02 - Report on the Prototyping of a dense TM A Version : 1.01
Page 86 of 133
Issued by the Episode 3 consortium for the Episode 3 project co-funded by the European Commission and Episode 3 consortium.
The Operations were based on independent arrival parallel runways RWY 16R/L at Rome Fiumicino Airport and Rome Ciampino RWY15 arrivals.
All STARs used in the 4th prototyping session are P-RNAV STARs. The arrival streams are fed into a Point Merge system, with two sequencing legs for RWYs 16L/R.
The 4th Prototyping Session considered arrivals only.
No Temporary Segregated Areas (TSA) including prohibited areas, military restricted areas, military exercise and training areas and danger areas were simulated. Consequently during the fourth prototyping session no military activity was simulated.
5.1.5.2 Measured and feed sectors
The simulated airspace comprised 4 TMA measured sectors and 1 Feed sector.
All measured sectors are single man operations managed by an Executive controller. Each measured sector is associated with a single Controller Working Position (CWP). The following measured sectors are simulated (Table 27).
Table 27. Measured Sectors
Rome TMA
Sector Name Sector Code Number of CWP
Approach West
TW
1
(EXC)
Approach Est TE 1
(EXC)
Arrival West AW
1
(EXC)
Arrival Est AE
1
(EXC)
The TE and TW sectors receive the sequence of aircraft prepared from the FU sector and monitor and eventually refine the sequences.
The AE and AW sectors are responsible of landing to LIRF and to LIRA; with regard to arrivals to LIRF, they monitor the good application of PMS in terms of flight levels and speed.
The following table (Table 28) shows the main characteristics of each of these sectors:
Table 28. Characteristics of Measured sectors
Sector Name Vertical Limits Radar Separation
TW FL GND to FL245 Horizontal 3NM; Vertical 1000ft
TE FL GND to FL195 Horizontal 3NM; Vertical 1000ft
AW FL GND to 6000ft Horizontal 3NM; Vertical 1000ft
AE FL GND to 6000ft Horizontal 3NM; Vertical 1000ft
Only one feed sector interfacing with the measured sectors has been considered, due to prototyping session objectives and limited effort, only four sectors were modelled; this has been a limiting factor in the fourth prototyping, because the FU controller, assuming an AMAN scripted traffic, was entirely responsible for building the sequence of aircrafts to be transferred to TE and TW sectors, leaving these last sectors to monitor and eventually refine the sequence.

Episode 3
D5.3.6-02 - Report on the Prototyping of a dense TM A Version : 1.01
Page 87 of 133
Issued by the Episode 3 consortium for the Episode 3 project co-funded by the European Commission and Episode 3 consortium.
Due to platform limitation, it was not possible to implement and test ASPA S&M functionalities at full extend. For this reason ASAS chains were maintained till aircraft joined the sequence legs, once on the leg, the proposed working methods envisaged the cancellation of ASAS chains.
The feed sector has been developed to assure continuity of control to and from the measured sectors. Controller or pseudo pilot support is not required for the feed sector.
The following feed sector was simulated (Table 29):
Table 29: Feed sector
Feed Sector
Sector Name Sector Code Number of CWP
Approach Coordinator FU Not Measured
The following table (Table 30) shows the main characteristics of this sector:
Table 30: Characteristics of Feed sector
Sector Name Vertical Limits Radar Separation
FU FL GND to UNL Horizontal 3NM; Vertical 1000ft
5.1.5.3 Separation standards
See column “Radar Separation” in Table 28 and Table 30.
5.1.5.4 Meteorological characteristics
In the 4th Prototyping Session standard meteorological conditions (i.e. no wind) are set up.
5.1.5.5 Traffic
5.1.5.5.1 Characteristic
5.1.5.5.1.1 Simulated traffic samples
In the 4th Prototyping Session there is no reference/baseline runs in the simulation, so only “future” traffic samples are required in order to expose participating controllers to the considered new concept elements and obtain initial assessment of their acceptability and feasibility.
2006 Rome TMA traffic samples are actually adapted to 2020 levels to fit the purpose of an initial assessment of SESAR concepts. The main adjustment on traffic aimed at obtaining defined arrival rates, and a certain level of inbound traffic metering at the TMA entry points.
These traffic samples have been produced by STATFOR based on the STATFOR 06 scenario and projected 2020 traffic assuming high growth.
Aerodrome of Destination (ADES) data for Rome Fiumicino (LIRF) have been extrapolated from each of the traffic samples for use in the prototyping session. The extrapolated traffic samples have been analysed to determine the one hour peak periods in each which would be most suitable for the session. The analysis has taken into account:
• The number of flights in each 1 hour period;
• The arrival rates for each 1 hour period.
The above information has been used to construct traffic samples as realistic as possible and best reflected traffic expectations.

Episode 3
D5.3.6-02 - Report on the Prototyping of a dense TM A Version : 1.01
Page 88 of 133
Issued by the Episode 3 consortium for the Episode 3 project co-funded by the European Commission and Episode 3 consortium.
In Table 31 are listed the traffic samples prepared for the 4th Prototyping Session with the indication of the number of movements achieved at Fiumicino airport.
Table 31: Simulated Traffic Samples
5.1.5.5.1.2 Training Sample
The training samples developed to cater for initial training (equipment familiarisation, area familiarisation and system debugging) are the following:
Table 32: Training Traffic Sample
5.1.5.5.2 Aircraft capabilities
For the fourth prototyping session:
• All the traffic is assumed being P-RNAV and ASPA S&M capable aircraft.
This simplified assumption, not compliant to the SESAR assumptions about aircraft equipage (at 2020 not all the traffic will be level 2 equipped), has been done due to the limited duration

Episode 3
D5.3.6-02 - Report on the Prototyping of a dense TM A Version : 1.01
Page 89 of 133
Issued by the Episode 3 consortium for the Episode 3 project co-funded by the European Commission and Episode 3 consortium.
of the 4th Prototyping Session, that has run a limited number of exercises, allowing only concept clarification through simplified scenarios.
5.1.5.6 Working position
5.1.5.6.1 Controller Working Position
Each controller working position has been equipped with:
• A BARCOTM monitor, with a multi-window working environment;
• A three-button mouse;
• A digital voice communication system (Audio-LAN) with a headset, a loudspeaker, a footswitch and a panel-mounted push-to-talk facility;
5.1.5.6.2 Controller tools and HMI
The HMI used for the RTS is an advanced stripless HMI, including the following main functions:
• Interactive radar labels and aircraft data lists, with colour coding of aircraft planning states;
• Graphical representation of ASPA S/M delegation on HMI by means of a link between target and delegated aircraft;
• Standard On-Line Data Interchange (OLDI) of flight progress data, with SYSCO extensions specifically providing the support for aircraft transfer of communication i.e. there will be no co-ordination of flight parameters;
• Safety Nets: Short Term Conflict Alert (STCA).
5.1.5.6.3 Pilot working positions
Four PseudoPilots from ENAV Academy participate to the fourth prototyping session.
The simulated environment provides pilot working positions enabling pseudo-pilots to simulate the normal navigation behaviour of involved flights in the simulated airspace.
5.1.6 Experimental Variables and Design
5.1.6.1 Experimental variables
The limitation of 4th Prototyping Session to only 1 week (including training) has made the design of the experiment built around only a main independent variable represented by traffic sample and in particular by the flight distribution on the two runways of Rome Fiumicino Airport (LIRF), Rwy16L and RWY 16R:
• V1: ADES LIRF 16L/16R, with four levels:
o 1 : ADES LIRF 16L, 42 ; ADES LIRF 16R, 19;
o 2 : ADES LIRF 16L, 39 ; ADES LIRF 16R, 21;
o 3 : ADES LIRF 16L, 46 ; ADES LIRF 16R, 22;
o 4 : ADES LIRF 16L, 41 ; ADES LIRF 16R, 20.
This variable has been used to assess the impact of the flight distribution on the two runway of Rome Fiumicino Airport on the PMS+A-CDA and ASPA S&M operability and safety.

Episode 3
D5.3.6-02 - Report on the Prototyping of a dense TM A Version : 1.01
Page 90 of 133
Issued by the Episode 3 consortium for the Episode 3 project co-funded by the European Commission and Episode 3 consortium.
5.1.6.2 Control variables
The limitation of 4th Prototyping Session to only 1 week (including training) made to not consider other variables that the simulation characteristics could have induced.
5.2 CONDUCT
5.2.1 Schedule
The fourth prototyping session has been conducted over five days from the 23rd to the 27th of February 2009 and consisted of one day of training followed by four days of measured exercises (see Table 44).The last slot of the simulation session has been used for spare run, final debriefings and questionnaire
5.2.2 Training session
The objective of the training has been to:
• Provide the controllers with a sufficient knowledge of the ATM concepts assessed during the simulation;
• Familiarise the controllers with the airspace settings and with the operational procedures and working methods applied during the simulation;
• Provide the controllers with a sufficient knowledge and practice of the platform functions and HMI.
During the training period several presentations have been given to the controllers dealing with simulation objectives, content and organisation, operational concept, working procedures and HMI.
The ATCOs participate to series of hands-on exercises. During these exercises, the controllers have the opportunity to rotate over the different measured sectors. First hands-on sessions aimed at getting familiar with the airspace, HMI and traffic. Once familiarity has been gained, additional training runs have been used to enable controllers to practice the new route structure and the continuous descent approach. An adapted traffic sample has been used for the training sessions, see section 5.3.1.2.
5.2.3 Measured session
The measured session consisted of performing eight measured runs. Each run lasted approximately 1 hour 15 minutes, enabling to collect 45 minutes of recordings, and were followed by a post-exercise questionnaire and a collective debriefing. In addition, observers present in the operations room captured spontaneous controller comments on the topics of interest, and problems that can have occurred.
At the end of the simulation period, the participants were asked to complete a post-simulation questionnaire. Moreover, a global debriefing was held to obtain further information on their perceived benefits/limits of the concept, the conduct of the experiment and their recommendations and/or requirements on what could be further tested.
During a measured runs one ATCO was not involved directly in the simulation tasks and he was free to observe any of the positions. Controllers' impressions were discussed during debriefings with people actively involved in the exercise session.

Episode 3
D5.3.6-02 - Report on the Prototyping of a dense TM A Version : 1.01
Page 91 of 133
Issued by the Episode 3 consortium for the Episode 3 project co-funded by the European Commission and Episode 3 consortium.
5.2.4 Working Methods and Roles
5.2.4.1 Controller – Pilot task repartition
The airborne system calculated the descent profile, including the TOD, according to:
• The target altitude/level at the prescribed point;
• The need to minimise levelling off segments;
• The altitude/level restrictions (windows) defined as constraints on intermediate points in the procedure;
• The need to keep speed margins, i.e. the possibility to increase or decrease speed upon ATC instruction during the descent – within the available speed range;
• A prescribed 2° constant slope, provided as an off -line parameter, with a possibility to activate/de-activate this condition offline.
The airborne system managed the descent according to these computations until:
• The designated point has been reached; or
• The pilot manually input a vertical rate or stops descent following ATC instruction; or
• The descent could not be managed according to the constraints anymore while remaining in the safe aircraft flight envelope; or
• The pilot disengaged the lateral navigation (e.g. an open-loop heading instruction is received), and accurate DTG could not be maintained anymore by the airborne system.
The airborne system continuously calculated the descent profile, assessed feasibility and adjusted rate if needed. Finally the airborne system modified/updates the decent profile to take into account any lateral modifications resulting from ATC instructions (e.g. Direct-to, route change or speed instruction).
5.2.4.2 Controllers task repartition
5.2.4.2.1 Roles and Tasks ORGA
For the four measured positions (Approach and Arrival), the P-RNAV/CDA procedure implies specific tasks and phraseology. Those are described in the present section.
Table 33. Controllers’ tasks and associated phraseo logy.
FU COORDINATOR
General Tasks
• Defines the overall approach strategy, determines the approach sequences to the relevant airports and RWYs and provides the TN/UPSTREAM ATCOs with the appropriate instructions or suggestions.
• In order to balance the inbound traffic along all STARs, he coordinates for delay actions and defines the pre-approach sequences to the related IAF.
• In addition, he decides the inbound traffic runways balance by proposing alternative routes, taking into account 3Nm or 90sec landing rate for 16L, and 8 Nm or 180sec landing rate for 16R which may be reduced to 3Nm or 90sec when Tower conditions are suitable. Minimum wake turbulence separation should always be taken into account when deciding the landing rates.

Episode 3
D5.3.6-02 - Report on the Prototyping of a dense TM A Version : 1.01
Page 92 of 133
Issued by the Episode 3 consortium for the Episode 3 project co-funded by the European Commission and Episode 3 consortium.
PMS Tasks • Balance east and west flows of traffic in respect of the defined constraints (e.g. landing rate, WTC, slot insertion,…), and handle potential unexpected situations.
• Provide TN E/W with instructions or suggestions concerning the management of the traffic in the sequencing leg.
• Inform the ARR COORDINATOR (Observer Over the Shoulder), TNW and ARW of the traffic flying the west triangle expected to land on the RWY 16L. For this traffic an appropriate coordination with ARR COORDINATOR may also be required.
• In case of single RWY operations at LIRF (RWY 16L), coordinate with ARR COORDINATOR the final approach sequence and spacing when needed to better merge the arrival flows coming from both PMS triangles (EAST and WEST).
• Handle potential unexpected situations and contingencies.
ARR COORDINATOR (Observer Over the Shoulder)
General Tasks
• The ARR COORDINATOR provides the TN COORDINATOR information related to the Roma CTR aerodromes such as runway in use, meteorological conditions, instrument procedures and landing rates.
• In particular he defines and coordinates with ARR E the approach sequence for Ciampino Airport (LIRA).
• Coordinates all traffic departing from Roma CTR and will coordinate with ARR E/W when inbound traffic affects ARR sectors.
• Finally he coordinates with TN COORDINATOR any change in the planned sequence and any unusual occurrence.
PMS Tasks • Coordinate with ARR E/W any action referring to aircraft leaving east/west point merge.
• Coordinate all the inbound warning and release with LIRA TWR.
• In the case of a single RWY operation in LIRF (RWY 16L), inform TN COORDINATOR about the traffic position in the east sequence landing on 16L.
• When there is traffic landing in LIRA, determine and coordinate with the TN COORDINATOR the best strategy to keep the arrival flow to LIRA apart from the envelope of paths which are LIRF dedicated.
• Coordinate any potential runway change which may occur after the merge points with LIRF TWR giving sudden warning to TN COORDINATOR. When an unpredicted runway change is applied by the ARR COORDINATOR, the TN COORDINATOR is likely to be informed.
TW CONTROLLER
General Tasks
• The TNW build up the 16R approach sequence according to the overall approach strategy provided by TN COO, and in the case of traffic landing 16L he will ensure that the TN COO coordinates with TN/E and NE if necessary. Provides vertical separation between aircraft in simultaneous approaches until they are at least 10 NM from the threshold and within the NOZ, and established on the respective ILS localiser course.

Episode 3
D5.3.6-02 - Report on the Prototyping of a dense TM A Version : 1.01
Page 93 of 133
Issued by the Episode 3 consortium for the Episode 3 project co-funded by the European Commission and Episode 3 consortium.
PMS Tasks • TNW Controller issues the “Turn left/right direct to merge point (FRANK)” and “descent“ instruction to the proper aircraft using the range ring arcs to assess the appropriate WTC spacing from the preceding aircraft using the specified phraseology:
Phraseology • Call Sign…turn left/right direct to Frank
PMS Tasks • When the turn is appreciated the traffic is cleared to descend to FL90 and sent in contact with ARW sector.
Phraseology • Call Sign..descend to FL90, contact..AW
PMS Tasks • A different defined spacing will be applied according to the landing rate requested.
• Traffic destination LIRA flying ALAXI/VELIM3F will be cleared not below FL130 initially, then he will provide further descent to FL 100 as appropriate.
• Traffic flying ELKAP3F will be sent in contact with ARE when passing abeam TAQ or when appropriate.
TE CONTROLLER
General Tasks
• The TNE build up 16L approach sequence according to the overall approach strategy provided by FU and in the case of traffic landing 16R will ensure that the FU coordinates with TN/W. Provides vertical separation between aircraft in simultaneous approaches until they are at least 10 NM from the threshold and within the NOZ, and established on the respective ILS localiser course.
• Determine and optimise LIRA approach sequence according to the instruction provided by the ARR COO.
PMS Tasks
• TNE Controller issues the “Turn left/right direct to merge point (STAIR)” and “descent” instruction to the proper aircraft using the range ring arcs to assess the appropriate WTC spacing from the preceding aircraft using the specified phraseology:
Phraseology • Call Sign…turn left/right direct to STAIR
PMS Tasks • When the turn is appreciated the traffic is cleared to descend to FL90 due to the radar minima and sent in contact with ARE.
Phraseology • Call Sign…descend to FL90 contact…AE
PMS Tasks
• A different defined spacing will be applied according to the landing rate requested. Traffic destination LIRA is prearranged by FU, pre-sequenced by TNE and sent in contact with ARE.
AW CONTROLLER
General Tasks
• The ARRW will optimise 16R sequence. Provides vertical separation between aircraft in simultaneous approaches until they are at least 10 NM from the threshold and within the NOZ, and established on the respective ILS localiser course.
• Monitors other aircraft on 16R approach to ensure containment within 16R NOZ and avoidance of the NTZ; provides appropriate instructions if aircraft stray from the 16R ILS localiser course and procedures to follow in the event of a missed approach.
PMS Tasks • The ARW will optimise 16R sequence by using the point merge technique and speed adjustment as appropriate.
• Upon receiving the traffic in contact leaving the sequencing legs, he monitors

Episode 3
D5.3.6-02 - Report on the Prototyping of a dense TM A Version : 1.01
Page 94 of 133
Issued by the Episode 3 consortium for the Episode 3 project co-funded by the European Commission and Episode 3 consortium.
the descent and adjusts the speed as appropriate.
• He will also provide vertical separation between aircraft in independent parallel approaches until they are within the NOZ and established on the respective ILS localiser course.
• When the traffic landing 16L is managed by ARW:
o Vertical separation will be applied between the two traffic concerned;
o Frequency change provided ASAP after the point merge and/or when safely appropriate.
Phraseology • (CALLSIGN)…DIRECT TO FRANK…TO 5000FT
• APPROACHING FRANK “Call Sign…CLEARED ILS 16R REPORT ESTABLISHED”
AE CONTROLLER
General Tasks
• The ARE will optimise 16L sequence. Provides vertical separation between aircraft in simultaneous approaches until they are at least 10 NM from the threshold and within the NOZ, and established on the respective ILS localiser course.
• Monitors other aircraft on 16L approach to ensure containment within 16L NOZ and avoidance of the NTZ; provides appropriate instructions if aircraft stray from the 16L ILS localiser course and procedures to follow in the event of a missed approach.
• Instructs aircraft to carry out a missed approach procedures in case of NTZ incursion.
• He also coordinates with ARR COO any change in the planned sequence and any unusual occurrence.
PMS Tasks • The ARE will optimise 16L sequence by using the point merge technique as appropriate.
• Upon receiving the traffic in contact leaving the sequencing legs, he provides further descent and speed adjustment as appropriate.
• He will also provide vertical separation between aircraft in independent parallel approaches until they are within the NOZ and established on the respective ILS localiser course.
Phraseology
• (CALLSIGN)….DIRECT TO STAIR…DESCEND TO 4000FT
• APPROACHING STAIR ”Call Sign…CLEARED ILS 16L REPORT ESTABLISHED”
PMS Tasks • In addition, he’s responsible to build the sequence for LIRA using STAR’s and radar technique as appropriate according to the requested landing rate.
5.2.4.2.2 Roles and Tasks ORGB
For the four measured positions (Approach and Arrival), the P-RNAV/CDA and ASPA S&M procedures implies specific tasks and phraseology. Those are described in the present section.
The ASAS instructions can be applied from the En Route phase down to the initial or final approach fix, however it should ideally be applied before descent commences. Before implementing an ASAS instruction it is important that the controller is selective in his choice of aircraft in that:

Episode 3
D5.3.6-02 - Report on the Prototyping of a dense TM A Version : 1.01
Page 95 of 133
Issued by the Episode 3 consortium for the Episode 3 project co-funded by the European Commission and Episode 3 consortium.
• Both aircraft are flying at compatible Mach No./indicated airspeed (+/- M·03 or +/- 20Kts);
• Both aircraft are flying at compatible flight level. (Within 4000 feet of each other).
In the 4th Prototyping Session the ASAS chains are interrupted before entering the sequencing legs.
Table 34. Controllers’ tasks and associated phraseo logy.
FU COORDINATOR
General Tasks
• Minimum ASAS Spacing to be applied is 90secs however a different value may be implemented.
• An ASAS Spacing chain may be initialised and implemented in the Feeder sector and then changed by an approach sector, or initialised in the Feeder sector and then implemented by the approach sector.
• TN-COO is in charge to verify, validate or initialise the incoming ASPA set chain of aircraft.
ARR COORDINATOR (Observer Over the Shoulder)
Detailed ASAS Tasks
• The ARR COO will take into consideration any ASAS sequence already established upstream.
• The ARR COO is expected to work in close cooperation with the TN-COO.
TE CONTROLLER
Detailed ASAS Tasks
• He verifies the incoming ASPA chain application.
TW CONTROLLER
Detailed ASAS Tasks
• He verifies the incoming ASPA chain application.
AE CONTROLLER
Detailed ASAS Tasks
• He verifies the incoming ASPA chain application.
AW CONTROLLER
Detailed ASAS Tasks
• He verifies the incoming ASPA chain application.
5.2.5 Participants
Seven controllers, from several ANSPs involved in Episode 3 WP5, participated to the fourth prototyping session (Table 35).

Episode 3
D5.3.6-02 - Report on the Prototyping of a dense TM A Version : 1.01
Page 96 of 133
Issued by the Episode 3 consortium for the Episode 3 project co-funded by the European Commission and Episode 3 consortium.
Table 35. Participants
Air Navigation Service Provider
Personnel participating
ENAV (Italy) 4
LFV (Sweden) 2
NATS (UK) 1
5.3 RESULTS
5.3.1 Introduction
Figure 29 shows the approach applied in the 4th Prototyping Session to obtain results.
Prototyping Session with limited duration
(1 week, including training)
Limited N° Runs
No Performance Assessment
Concept Clarification through
Subjective Data Analysis through
Qualitative Data Collection
Figure 29: 4 th Prototyping Session Assessment Approach
The subjective data analysis has been carried out through the analysis of the questionnaires filled in by the Controllers.
As already explained in Paragraph 5.1.4.2, the questionnaires submitted to the Controllers are rating scale type questionnaires. For each questionnaire and for the majority of the questions the Controller can select a value ranging from “Very Low” to “Very High” and for some questions he can select a “Yes” or “No” answer.
For each question and for each scale value, the number of controllers crossing that value is counted.
This analysis has been carried out for each of the four runs carried out for each ORG.
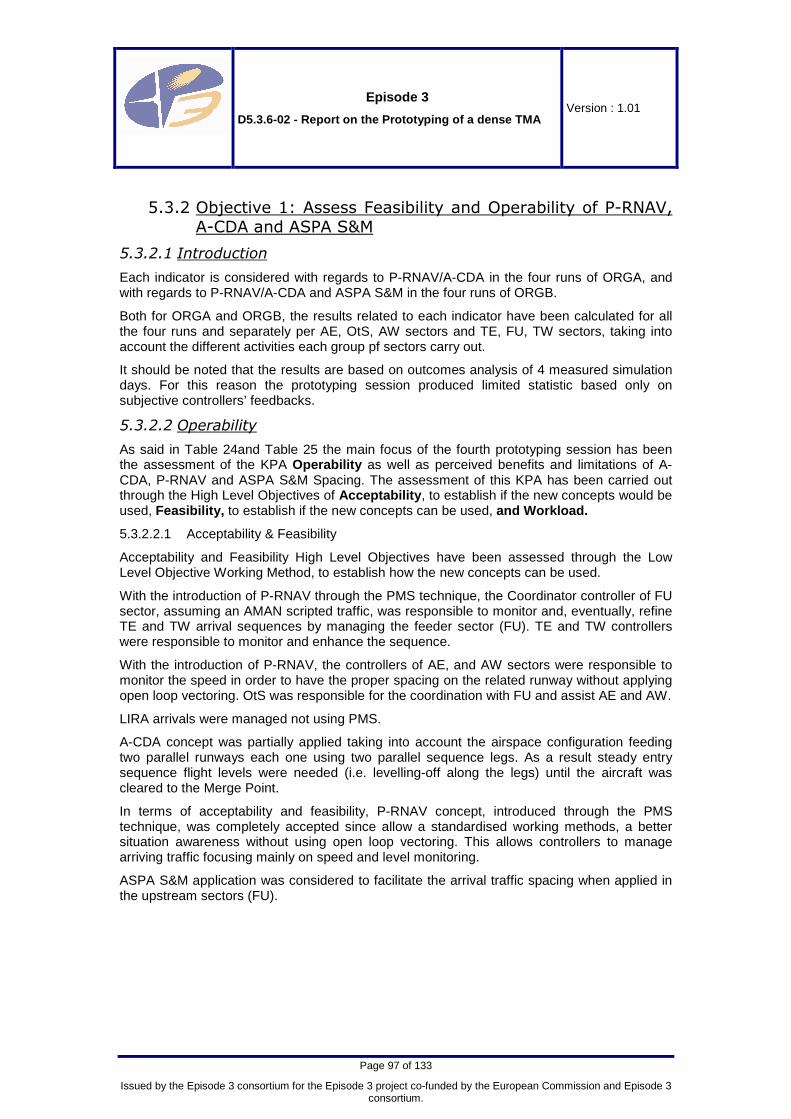
Episode 3
D5.3.6-02 - Report on the Prototyping of a dense TM A Version : 1.01
Page 97 of 133
Issued by the Episode 3 consortium for the Episode 3 project co-funded by the European Commission and Episode 3 consortium.
5.3.2 Objective 1: Assess Feasibility and Operability of P-RNAV, A-CDA and ASPA S&M
5.3.2.1 Introduction
Each indicator is considered with regards to P-RNAV/A-CDA in the four runs of ORGA, and with regards to P-RNAV/A-CDA and ASPA S&M in the four runs of ORGB.
Both for ORGA and ORGB, the results related to each indicator have been calculated for all the four runs and separately per AE, OtS, AW sectors and TE, FU, TW sectors, taking into account the different activities each group pf sectors carry out.
It should be noted that the results are based on outcomes analysis of 4 measured simulation days. For this reason the prototyping session produced limited statistic based only on subjective controllers’ feedbacks.
5.3.2.2 Operability
As said in Table 24and Table 25 the main focus of the fourth prototyping session has been the assessment of the KPA Operability as well as perceived benefits and limitations of A-CDA, P-RNAV and ASPA S&M Spacing. The assessment of this KPA has been carried out through the High Level Objectives of Acceptability , to establish if the new concepts would be used, Feasibility, to establish if the new concepts can be used, and Workload.
5.3.2.2.1 Acceptability & Feasibility
Acceptability and Feasibility High Level Objectives have been assessed through the Low Level Objective Working Method, to establish how the new concepts can be used.
With the introduction of P-RNAV through the PMS technique, the Coordinator controller of FU sector, assuming an AMAN scripted traffic, was responsible to monitor and, eventually, refine TE and TW arrival sequences by managing the feeder sector (FU). TE and TW controllers were responsible to monitor and enhance the sequence.
With the introduction of P-RNAV, the controllers of AE, and AW sectors were responsible to monitor the speed in order to have the proper spacing on the related runway without applying open loop vectoring. OtS was responsible for the coordination with FU and assist AE and AW.
LIRA arrivals were managed not using PMS.
A-CDA concept was partially applied taking into account the airspace configuration feeding two parallel runways each one using two parallel sequence legs. As a result steady entry sequence flight levels were needed (i.e. levelling-off along the legs) until the aircraft was cleared to the Merge Point.
In terms of acceptability and feasibility, P-RNAV concept, introduced through the PMS technique, was completely accepted since allow a standardised working methods, a better situation awareness without using open loop vectoring. This allows controllers to manage arriving traffic focusing mainly on speed and level monitoring.
ASPA S&M application was considered to facilitate the arrival traffic spacing when applied in the upstream sectors (FU).

Episode 3
D5.3.6-02 - Report on the Prototyping of a dense TM A Version : 1.01
Page 98 of 133
Issued by the Episode 3 consortium for the Episode 3 project co-funded by the European Commission and Episode 3 consortium.
Hypothesis Status Comments
H1.2.1. The defined P-RNAV/A-CDA and ASPA S&M working method is feasible and acceptable to the controller.
Confirmed.
H1.3.1. In a dense terminal area, P-RNAV/A-CDA and ASPA S&M concepts are achievable.
Confirmed.
H1.4.1. The defined phraseology is appropriate and easy to understand.
Confirmed.
H2.1.1. Compared to today, with P-RNAV/A-CDA and ASPA S&M, a reduction in instructions leads to a reduction in workload.
Confirmed.
Table 36: Review of initial operability related hyp othesis
In the following paragraphs detailed results per Low Level Objectives are reported.
5.3.2.2.1.1 Working Methods – ORGA All Runs - Sectors AE, OtS, AW
The proposed P-RNAV/A-CDA working methods were evaluated and feedbacks of AE, OtS and AW sectors were recorded at the end of end of each run.
ORGA All Run AE, OtS, AWPEQ - Section Working Methods
0
5
10
15
20
25
Very L
o wLow
Med
ium High
Very
High
N° o
f Ans
wer
s
Q9 How would you ratethe compatibility of the P-RNAV/A-CDA with yourusual tasks (sequencebuilding, separationmanagement)?
Q11 Were the provided P-RNAV/A-CDA workingmethods appropriate?
Figure 30: ORGA – Sectors AE, OtS, AW - Working Met hods Analysis
Participants considered the proposed working methods being appropriate for sequence building and separation management (Figure 30). Being the arrival traffic pre-sequenced by TMA sectors (FU, TE and TW), the Approach sectors (AE and AW) tasks were facilitated due to the already established arrival traffic sequences.
The majority of participants considered Easy/Very Easy the application of new working methods (Figure 31).

Episode 3
D5.3.6-02 - Report on the Prototyping of a dense TM A Version : 1.01
Page 99 of 133
Issued by the Episode 3 consortium for the Episode 3 project co-funded by the European Commission and Episode 3 consortium.
AE monitoring task was considered to be more demanding due to the different management of PMS landing traffic in LIRF and “standard” landing traffic in LIRA.
ORGA All Run AE, OtS, AWPEQ Section Working Methods
0
5
10
15
20
25
Very E
asy
Easy
Med
ium
Difficu
lt
Very D
if ficu
lt
N° o
f Ans
wer
s
Q13 As an Arrival orApproach Controller, howwas it for you tosequence the trafficduring the last run?
Q14 As an ApproachController or FinalDirector, how was it foryou to monitor the a/cspacing during the lastrun?
Figure 31: ORGA – Sectors AE, OtS, AW - Working Met hods Analysis
5.3.2.2.1.2 Working Methods – ORGA All Runs - Sectors TE, FU, TW
The proposed P-RNAV/A-CDA working methods were evaluated for TE, FU, TW sectors and controllers feedbacks were recorded at the end of end of each run.
ORGA All Run TE, FU, TWPEQ - Section Working Methods
0
5
10
15
20
25
Very L
ow Low
Medium Hig
h
Very H
igh
N° o
f Ans
wer
s
Q9 How would you ratethe compatibility of the P-RNAV/A-CDA with yourusual tasks (sequencebuilding, separationmanagement)?
Q11 Were the provided P-RNAV/A-CDA workingmethods appropriate?
Figure 32: ORGA – Sectors TE, FU, TW - Working Meth ods Analysis
The majority of participants considered High/Very High both the compatibility of new working methods with the current ones as well as their appropriateness from the point of view of sequence building and separation management (Figure 32).

Episode 3
D5.3.6-02 - Report on the Prototyping of a dense TM A Version : 1.01
Page 100 of 133
Issued by the Episode 3 consortium for the Episode 3 project co-funded by the European Commission and Episode 3 consortium.
As for sectors AE, OtS, AW, also for TE, FU, TW controllers were asked to provide feedback on monitoring and spacing tasks.
ORGA All Run TE, FU, TWPEQ Section Working Methods
0
5
10
15
20
25
Very E
asy
Easy
Med
ium
Difficu
lt
Very D
if ficu
lt
N° o
f Ans
wer
s
Q13 As an Arrival orApproach Controller, howwas it for you tosequence the trafficduring the last run?
Q14 As an ApproachController or FinalDirector, how was it foryou to monitor the a/cspacing during the lastrun?
Figure 33: ORGA – Sectors TE, FU, TW - Working Meth ods Analysis
The participants considered from Very Easy to Medium to perform monitoring and sequencing tasks (Figure 33). Only TE Controller in the second run experimented difficulties due to traffic descending too slow towards the merge point, due to limited pilots training. This was solved in the other runs.
5.3.2.2.1.3 Working Methods – ORGB All Runs - Sectors AE, OtS, AW
ORGB assessed the compatibility of ASPA S&M together with P-RNAV and A-CDA addressed in ORGA. Results for AE, OtS and AW sectors are shown.
ORGB All Run - Sector AE, OtS, AW PEQ - Section Working Methods
0
5
10
15
20
25
Very Low Low Medium High Very High
N° o
f A
nsw
ers
Q9 How would you rate thecompatibility of the P-RNAV/A-CDA with your usual tasks(sequence building, separationmanagement)?Q11 How would you rate thecompatibility of the ASPA S&Mwith your usual tasks (sequencebuilding, separationmanagement)?
Q13 Were the provided P-RNAV/A-CDA working methodsappropriate?
Q15 Were the provided ASPAS&M working methodsappropriate?
Figure 34: ORGB – Sectors AE, OtS, AW - Working Met hods Analysis

Episode 3
D5.3.6-02 - Report on the Prototyping of a dense TM A Version : 1.01
Page 101 of 133
Issued by the Episode 3 consortium for the Episode 3 project co-funded by the European Commission and Episode 3 consortium.
The majority of participants rated High compatibility and appropriateness of ASPA S&M and P-RNAV/A-CDA and ASPA S&M with sequence building and separation management (Figure 34).
Some participants rated Medium the compatibility and appropriateness due to the following:
• Regard to P-RNAV/A-CDA:
o A-CDA concept was partially applied taking into account the airspace configuration feeding two parallel runways each one using two parallel sequence legs;
o As a result steady entry sequence flight levels were needed (with level off along the legs) until the aircraft was cleared to the Merge Point.
• Regard to ASPA S&M:
o Due to the lack of managed En Route upstream sectors inbound traffic was pre-sequenced and ASAS linked only by FU controller increasing his workload and providing a suboptimal sequence to approach controller that had to refine it;
o Due to platform limitation, ASPA S&M was not implemented at full functionality so ASAS chain had to be cancelled once on the sequence leg. The Controllers realised that the possibility to maintain ASAS chain on the sequence leg should provide less workload.
It has to be noted that in AW sector ASPA S&M chains were largely maintained till the runway due to the lower runway capacity and limited use of PMS application (aircraft were sent to the Merge Point before to join the sequence leg).
The majority of participants rated Very Easy/Easy sequencing and spacing monitoring of the traffic (Figure 35).
ORGB All Run - Sector AE, OtS, AW PEQ Section Working Methods
0
5
10
15
20
25
VeryEasy
Easy Medium Difficult VeryDifficult
N° o
f Ans
wer
s
Q17 As an Arrival or ApproachController, how was it for youto sequence the traffic duringthe last run?
Q19 As an ApproachController or Final Director,how was it for you to monitorthe a/c spacing during the lastrun?
Figure 35: ORGB – Sectors AE, OtS, AW - Working Met hods Analysis

Episode 3
D5.3.6-02 - Report on the Prototyping of a dense TM A Version : 1.01
Page 102 of 133
Issued by the Episode 3 consortium for the Episode 3 project co-funded by the European Commission and Episode 3 consortium.
5.3.2.2.1.4 Working Methods – ORGB All Runs - Sectors TE, FU, TW
Compatibility of P-RNAV/A-CDA and ASPA S&M working methods with Rome TMA operational environment was evaluated for Sectors TE, FU, TW.
ORGB All Run - Sector TE, FU, TWPEQ - Section Working Methods
0
5
10
15
20
25
Very Low Low Medium High Very High
N° o
f A
nsw
ers
Q9 How would you rate thecompatibility of the P-RNAV/A-CDA with your usual tasks(sequence building, separationmanagement)?Q11 How would you rate thecompatibility of the ASPA S&Mwith your usual tasks (sequencebuilding, separationmanagement)?
Q13 Were the provided P-RNAV/A-CDA working methodsappropriate?
Q15 Were the provided ASPAS&M working methodsappropriate?
Figure 36: ORGB – Sectors TE, FU, TW - Working Meth ods Analysis
The majority of participants rated High the compatibility and appropriateness of the P-RNAV/A-CDA and ASPA S&M working methods.
Some observations have been done:
• Due to the lack of managed En Route upstream sectors inbound traffic was pre-sequenced and ASAS linked only by FU controller increasing his workload and providing a suboptimal sequence to approach controller that had to refine it.

Episode 3
D5.3.6-02 - Report on the Prototyping of a dense TM A Version : 1.01
Page 103 of 133
Issued by the Episode 3 consortium for the Episode 3 project co-funded by the European Commission and Episode 3 consortium.
The participants considered the sequencing and spacing monitoring tasks from Very Easy to Medium (Figure 37).
ORGB All Run - Sector TE, FU, TWPEQ Section Working Methods
0
5
10
15
20
25
VeryEasy
Easy Medium Difficult VeryDifficult
N° o
f Ans
wer
s
Q17 As an Arrival or ApproachController, how was it for youto sequence the traffic duringthe last run?
Q19 As an ApproachController or Final Director,how was it for you to monitorthe a/c spacing during the lastrun?
Figure 37: ORGB – Sectors TE, FU, TW - Working Meth ods Analysis
The participants didn’t encounter any difficulties in identifying when to issue the direct to instruction, as shown in Figure 38.
ORGB All Run - Sector TE, FU, TWPEQ Section Working Methods
0
5
10
15
20
25
Never
Somet
imes
Often
Very O
ften
Alway
s
N° o
f Ans
wer
s
Q18 As an ApproachController, did you have anydifficulties in identifying whento issue the direct toinstruction during the lastrun?
Figure 38: ORGB – Sectors TE, FU, TW - Working Meth ods Analysis

Episode 3
D5.3.6-02 - Report on the Prototyping of a dense TM A Version : 1.01
Page 104 of 133
Issued by the Episode 3 consortium for the Episode 3 project co-funded by the European Commission and Episode 3 consortium.
5.3.2.2.2 Workload
P-RNAV, A-CDA and ASPA S&M were considered a valuable technique since the implementation of these new operational concept elements reduces open loop vectoring and controller workload.
In the following paragraphs detailed results per this Low Level Objective are reported.
5.3.2.2.2.1 Workload – ORGA All Runs - Sectors AE, OtS, AW
AE, OtS, and AW controllers feedback on workload felt in a wide range of values going from Very Low to High, with the majority estimating it as Medium (Figure 39).
ORGA All Run AE, OtS, AWPEQ - Section Workload
0
5
10
15
20
25
Very L
owLo
w
Med
ium
High
Very
High
N° o
f Ans
wer
s
Q1 What is yourestimated overallworkload during the lastrun?
Q3 What was the impactof the traffic load on yourworkload during the lastrun?
Q4 What was the impactof R/T on your workloadduring the last run?
Figure 39: ORGA – Sectors AE, OtS, AW - Workload An alysis
The justification for the High overall workload was mainly due to the coexistence of the arrival traffic to LIRA, managed with traditional working methods.
AE reported high value of workload due to higher volumes of traffic associated with the higher capacity of relative RWY. Nevertheless, the proposed concept allowed an easy management of the traffic.
OtS Controller noticed that he was not enough familiar with the procedures, and this comment can easily be understood taking into account that the fourth session has been characterised by one day training.

Episode 3
D5.3.6-02 - Report on the Prototyping of a dense TM A Version : 1.01
Page 105 of 133
Issued by the Episode 3 consortium for the Episode 3 project co-funded by the European Commission and Episode 3 consortium.
The assigned AE, Ots, and AW tasks were considered feasible and acceptable (Figure 40).
ORGA All Run AE, OtS, AWPEQ - Section Workload
0
5
10
15
20
25
Yes No
N° A
nsw
ers
Q5 Overall, were thetasks you had to carryout during the last runfeasible?
Q6 Overall, did the tasksyou had to carry outduring the last run remainat an acceptable level?
Figure 40: ORGA – Sectors AE, OtS, AW - Workload An alysis
5.3.2.2.2.2 Workload – ORGA All Runs - Sectors TE, FU, TW
TE, FU, TW controller’s evaluated overall workload from a range to Very Low to High.
The impact of the traffic load on workload was considered from Very Low to Very High. The higher score was determined by TE managing a high volume of traffic associated with a high capacity RWY. Nevertheless the use of PRNAV concept allowed a better traffic awareness.
The impact of R/T on the workload was considered mainly medium (Figure 41).
ORGA All Run TE, FU, TWPEQ - Section Workload
0
5
10
15
20
25
Very L
owLo
w
Med
ium
High
Very
High
N° o
f Ans
wer
s
Q1 What is yourestimated overallworkload during the lastrun?
Q3 What was the impactof the traffic load on yourworkload during the lastrun?
Q4 What was the impactof R/T on your workloadduring the last run?
Figure 41: ORGA – Sectors TE, FU, TW - Workload Ana lysis

Episode 3
D5.3.6-02 - Report on the Prototyping of a dense TM A Version : 1.01
Page 106 of 133
Issued by the Episode 3 consortium for the Episode 3 project co-funded by the European Commission and Episode 3 consortium.
The feasibility and acceptability of overall tasks were rated positively. The negative feedback was recorded from TE controller due to the higher volume of traffic to be managed (Figure 42).
ORGA All Run TE, FU, TWPEQ - Section Workload
0
5
10
15
20
25
Yes No
N° A
nsw
ers
Q5 Overall, were thetasks you had to carryout during the last runfeasible?
Q6 Overall, did the tasksyou had to carry outduring the last run remainat an acceptable level?
Figure 42: ORGA – Sectors TE, FU, TW - Workload Ana lysis
5.3.2.2.2.3 Workload – ORGB All Runs - Sectors AE, OtS, AW
The overall workload deriving from the application of new working methods with P-RNAV, A-CDA and ASPA S&M was rated Low/Medium from the majority of controllers (Figure 43).
AE controller rated high in the third run, due to the management of arrivals to LIRA. Always AE controllers declared that PMS allowed the management of all the traffic with a limited number of R/T.
AW controller in the first run highlighted that, due the low traffic load, ASAS spacing was maintained till the RWY, with a limited use of PMS sequence legs.
ORGB All Run - Sector AE, OtS, AW PEQ - Section Workload
0
5
10
15
20
25
Very Low Low Medium High Very High
N° o
f A
nsw
ers
Q1 What is your estimatedoverall workload during the lastrun?
Q3 What was the impact of thetraffic load on your workloadduring the last run?
Q4 What was the impact of R/Ton your workload during thelast run?
Figure 43: ORGB – Sectors AE, OtS, AW - Workload An alysis
Figure 44 shows that all the controllers rated feasible and acceptable the tasks to carry out.
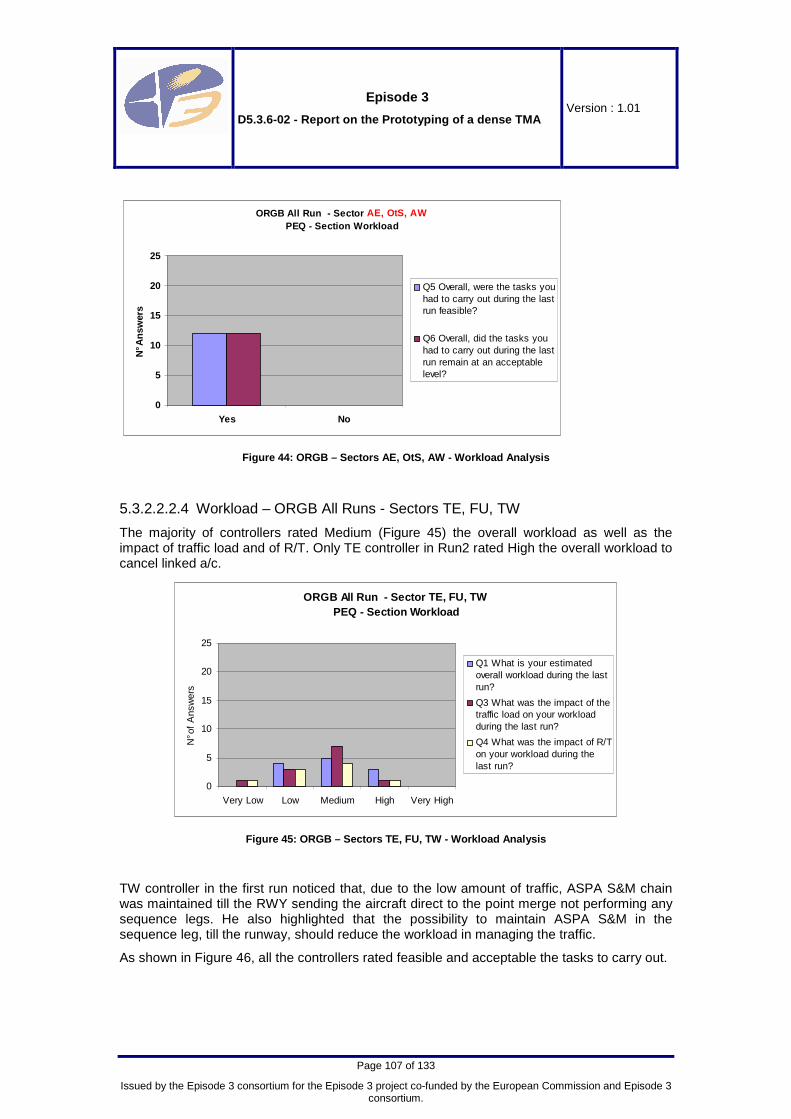
Episode 3
D5.3.6-02 - Report on the Prototyping of a dense TM A Version : 1.01
Page 107 of 133
Issued by the Episode 3 consortium for the Episode 3 project co-funded by the European Commission and Episode 3 consortium.
ORGB All Run - Sector AE, OtS, AW PEQ - Section Workload
0
5
10
15
20
25
Yes No
N° A
nsw
ers
Q5 Overall, were the tasks youhad to carry out during the lastrun feasible?
Q6 Overall, did the tasks youhad to carry out during the lastrun remain at an acceptablelevel?
Figure 44: ORGB – Sectors AE, OtS, AW - Workload An alysis
5.3.2.2.2.4 Workload – ORGB All Runs - Sectors TE, FU, TW
The majority of controllers rated Medium (Figure 45) the overall workload as well as the impact of traffic load and of R/T. Only TE controller in Run2 rated High the overall workload to cancel linked a/c.
ORGB All Run - Sector TE, FU, TWPEQ - Section Workload
0
5
10
15
20
25
Very Low Low Medium High Very High
N° o
f A
nsw
ers
Q1 What is your estimatedoverall workload during the lastrun?
Q3 What was the impact of thetraffic load on your workloadduring the last run?
Q4 What was the impact of R/Ton your workload during thelast run?
Figure 45: ORGB – Sectors TE, FU, TW - Workload Ana lysis
TW controller in the first run noticed that, due to the low amount of traffic, ASPA S&M chain was maintained till the RWY sending the aircraft direct to the point merge not performing any sequence legs. He also highlighted that the possibility to maintain ASPA S&M in the sequence leg, till the runway, should reduce the workload in managing the traffic.
As shown in Figure 46, all the controllers rated feasible and acceptable the tasks to carry out.

Episode 3
D5.3.6-02 - Report on the Prototyping of a dense TM A Version : 1.01
Page 108 of 133
Issued by the Episode 3 consortium for the Episode 3 project co-funded by the European Commission and Episode 3 consortium.
ORGB All Run - Sector TE, FU, TWPEQ - Section Workload
0
5
10
15
20
25
Yes No
N° A
nsw
ers
Q5 Overall, were the tasks youhad to carry out during the lastrun feasible?
Q6 Overall, did the tasks youhad to carry out during the lastrun remain at an acceptablelevel?
Figure 46: ORGB – Sectors TE, FU, TW - Workload Ana lysis
5.3.3 Objective 2: Assess Safety of P-RNAV, A-CDA and ASPA S&M
5.3.3.1 Safety
Safety KPA has been assessed through the High/Low Level Objective Situation Awareness.
The controllers were asked questions to assess the safety impacts through increased situational awareness, due to the introduction of new concepts and new working methods.
Hypothesis Status Comments
H3.1.1. Compared to today, P-RNAV/A-CDA and ASPA S&M enable earlier anticipation by controllers
H3.1.2. P-RNAV contributes to maintaining a clear picture of the traffic.
H3.1.3. Compared to today, CDA degrades the situation awareness, e.g. in preventing controllers from knowing when exactly aircraft will initiate their descent.
H3.1.1 & H3.1.2 Confirmed.
H3.1.3: Situation Awareness for P-RNAV/A-CDA and ASPA S&M was evaluated good/very good
H3.2.1. Compared to today, P-RNAV/A-CDA and ASPA S&M increase controllers’ perceived level of safety.
Confirmed.
H3.3.1.There is no impact of the conditions on the controllers’ perceived level of safety.
Confirmed.

Episode 3
D5.3.6-02 - Report on the Prototyping of a dense TM A Version : 1.01
Page 109 of 133
Issued by the Episode 3 consortium for the Episode 3 project co-funded by the European Commission and Episode 3 consortium.
Hypothesis Status Comments
H3.4.1. Some conditions have a more negative impact on safety than other.
Not Confirmed. Safety was looked at from the situation awareness perspective only, as an indirect indicator.
Arrivals to LIRA, traditionally managed (with vectors), raised more situation awareness issues that Arrivals to LIRF, managed with Point Merge.
Table 37: Review of initial safety related hypothe sis
5.3.3.1.1 Situation Awareness
5.3.3.1.1.1 Situation Awareness – ORGA All Runs - Sectors AE, OtS, AW
AE, OtS and AW controllers gave positive feedback (Figure 47) on the estimated situational awareness, with the majority of them expressing Good/Very Good judgement.
ORGA All Run AE, OtS, AWPEQ - Section Situation Awareness
0
5
10
15
20
25
Very
LowLo
w
Mediu
mGood
Very G
ood
N° o
f Ans
wer
s Q7 What is yourestimated overallsituation awareness(clear picture of thesituation) during the lastrun?
Figure 47: ORGA – Sectors AE, OtS, AW – Situation A wareness Analysis
AE, OtS and AW controllers did not experiment unexpected events during the runs (Figure 48). “Sometimes” answers were due the management of LIRA arrivals.

Episode 3
D5.3.6-02 - Report on the Prototyping of a dense TM A Version : 1.01
Page 110 of 133
Issued by the Episode 3 consortium for the Episode 3 project co-funded by the European Commission and Episode 3 consortium.
ORGA All Run AE, OtS, AWPEQ - Section Situation Awareness
0
5
10
15
20
25
Never
Somet
imes
Often
Very O
ft en
Alway
s
N° o
f Ans
wer
s
Q8 Were you surprisedby any events that youdid not expect during thelast run?
Figure 48: ORGA – Sectors AE, OtS, AW – Situation A wareness Analysis
5.3.3.1.1.2 Situation Awareness – ORGA All Runs - Sectors TE, FU, TW
TE, FU and TW controllers gave positive feedback (Figure 49) on the estimated situational awareness, with the majority of them expressing Good/Very Good judgement.
ORGA All Run TE, FU, TWPEQ - Section Situation Awareness
0
5
10
15
20
25
Very
LowLo
w
Mediu
mGood
Very G
ood
N° o
f Ans
wer
s Q7 What is yourestimated overallsituation awareness(clear picture of thesituation) during the lastrun?
Figure 49: ORGA – Sectors TE, FU, TW – Situation Aw areness Analysis
The Medium value was expressed by the TW controller in the first two runs due to some difficulty occurred in managing the arrival to LIRA; this problem is the same at the basis of the rates expressed in Figure 50.

Episode 3
D5.3.6-02 - Report on the Prototyping of a dense TM A Version : 1.01
Page 111 of 133
Issued by the Episode 3 consortium for the Episode 3 project co-funded by the European Commission and Episode 3 consortium.
ORGA All Run TE, FU, TWPEQ - Section Situation Awareness
0
5
10
15
20
25
Never
Somet
imes
Often
Very O
ft en
Alway
s
N° o
f Ans
wer
s
Q8 Were you surprisedby any events that youdid not expect during thelast run?
Figure 50: ORGA – Sectors TE, FU, TW – Situation Aw areness Analysis
5.3.3.1.1.3 Situation Awareness – ORGB All Runs - Sectors AE, OtS, AW
The introduction of ASPA S&M combined with P-RNAV/A-CDA recorded very positive feedback on the estimated situational awareness, with the majority of them expressing Good/Very Good judgement (Figure 51).
ORGB All Run - Sector AE, OtS, AW PEQ - Section Situation Awareness
0
5
10
15
20
25
Very Low Low Medium Good Very Good
N° o
f A
nsw
ers
Q7 What is your estimatedoverall situation awareness(clear picture of the situation)during the last run?
Figure 51: ORGB – Sectors AE, OtS, AW – Situation A wareness Analysis
The majority of controllers were never surprised by any unexpected events (Figure 52). Only AE controller in Run 3 declared to be sometimes surprised by unexpected events dealing with traffic landing in LIRA. In addition AE controllers declared in the other runs having time to watch TE arrival flow delivering being able to plan the management of unexpected events.

Episode 3
D5.3.6-02 - Report on the Prototyping of a dense TM A Version : 1.01
Page 112 of 133
Issued by the Episode 3 consortium for the Episode 3 project co-funded by the European Commission and Episode 3 consortium.
ORGB All Run - Sector AE, OtS, AW PEQ - Section Situation Awareness
0
5
10
15
20
25
Never
Sometim
esOfte
n
Very O
ften
Alway
s
N° o
f Ans
wer
s
Q8 Were you surprised by anyevents that you did not expectduring the last run?
Figure 52: ORGB – Sectors AE, OtS, AW – Situation A wareness Analysis
5.3.3.1.1.4 Situation Awareness – ORGB All Runs - Sectors TE, FU, TW
The introduction of ASPA S&M combined with P-RNAV/A-CDA recorded very positive feedback on the estimated situational awareness, with the majority of them expressing Good/Very Good judgement (Figure 53).
ORGB All Run - Sector TE, FU, TWPEQ - Section Situation Awareness
0
5
10
15
20
25
Very Low Low Medium Good Very Good
N° o
f A
nsw
ers
Q7 What is your estimatedoverall situation awareness(clear picture of the situation)during the last run?
Figure 53: ORGB – Sectors TE, FU, TW – Situation Aw areness Analysis
The majority of controllers did not experiment unexpected events during the runs (Figure 54). “Sometimes” answers were related to the traffic landing in LIRA airport.

Episode 3
D5.3.6-02 - Report on the Prototyping of a dense TM A Version : 1.01
Page 113 of 133
Issued by the Episode 3 consortium for the Episode 3 project co-funded by the European Commission and Episode 3 consortium.
ORGB All Run - Sector TE, FU, TWPEQ - Section Situation Awareness
0
5
10
15
20
25
Never
Sometim
esOfte
n
Very O
ften
Alway
s
N° o
f Ans
wer
s
Q8 Were you surprised by anyevents that you did not expectduring the last run?
Figure 54: ORGB – Sectors TE, FU, TW – Situation Aw areness Analysis
5.3.4 Main conclusions of the Task 2 (P-RNAV/A-CDA and ASPA S&M assessment)
The P-RNAV concept applied through the PMS technique and the A-CDA concept tested are operationally viable.
In terms of acceptability and feasibility, P-RNAV concept, introduced through the PMS technique, was considered by the participants a very good technique allowing the elimination of vectoring and facilitating the activity of controllers that can concentrate on the monitoring of the PMS application in terms of speed and flight levels.
In the simulated environment A-CDA concept application did not had a negative impact on the traffic management as the traffic flows were sequenced by a scripted AMAN. The controllers suggested to further investigate this aspect in a realistic environment considering all the possible different descend profiles of inbound traffic.
A-CDA concept was partially applied taking into account the airspace configuration feeding two parallel runways each one using two parallel sequence legs. As a result steady entry sequence flight levels were needed (i.e. level-off along the legs) until the aircraft was cleared to the Merge Point.
Controllers found easy to manage the traffic using P-RNAV and A-CDA together. The new route structure and associated new working methods allow the ATCOs to manage high traffic loads with an acceptable workload thanks to a reduction of tasks associated with this new operational environment. P-RNAV and A-CDA allow ATCOs to have a better situation awareness of the traffic evolution due to a standardised working methods based on an arrival structured route layout. Accordingly, in nominal situation, controllers perceived an increased safety level.
ASAS S&M chains were established in the feeder sector by the TN coordinator having this ATCO a complete picture of all the inbound traffic to provide the best ASAS chains suitable for the management of the arrival sequences by approach sectors.
The controllers asked for the possibility to explore new working methods and procedures able to manage the ASAS chains on sequence legs, this should have a positive impact on their workload.

Episode 3
D5.3.6-02 - Report on the Prototyping of a dense TM A Version : 1.01
Page 114 of 133
Issued by the Episode 3 consortium for the Episode 3 project co-funded by the European Commission and Episode 3 consortium.
The combined use of ASPA S&M, P-RNAV and A-CDA allow ATCO to focus more on the sequence leg management. ATCO, having delegated spacing tasks to the cockpit, is able to better monitor the traffic evolution on the arrival streams. The availability of ASPA S&M infringement tool was appreciated by ATCOs enabling them to have a timely warning in case of infringement. ATCOs generally accepted the new working methods foreseeing a partial delegation of their tasks to the cockpit.
It was recognised that one day of training was not enough to ensure the needed familiarity with the new procedures from controller side.

Episode 3
D5.3.6-02 - Report on the Prototyping of a dense TM A Version : 1.01
Page 115 of 133
Issued by the Episode 3 consortium for the Episode 3 project co-funded by the European Commission and Episode 3 consortium.
6 GENERAL CONCLUSIONS AND RECOMMENDATIONS
6.1 TMA CONCEPTS
6.1.1 Conclusions
In the framework of Episode 3 WP5.3.6, a series of four prototyping sessions were conducted between November 2008 and February 2009. The main aim of the simulations was to clarify the SESAR-IP2 foreseen improvements of the route structures in a dense TMA, combined with the optimisation of descent procedures (A-CDA), controlled time of arrival (CTA) constraints, and with ASPA S&M (ASAS Spacing Sequencing & Merging) application. The focus was upon operability with initial trends on SESAR KPAs (e.g. efficiency, predictability, capacity and safety). The iterative approach allowed the scope of the prototyping sessions to be successively adjusted. This was communicated and agreed through WP5.3.1 TMA Expert Group meetings scheduled in-between the prototyping sessions.
The first session aimed at refining the controllers’ roles, working methods and ATC procedures, and assessed the operability and acceptability of A- CDA in a P-RNAV route structure. The second session assessed the impact of variability in traffic presentation at the TMA boundary (through different levels of clustering of arrival traffic) on the operability and acceptability of A-CDA in an improved new P-RNAV route structure. The third session confirmed the acceptability and operational feasibility of A- CDA down to the FAF in the improved P-RNAV environment and assessed the impact of mixed aircraft RTA equipage on this acceptability and operational feasibility. Eventually, the fourth session (Task 2) evaluated, in a different environment like the high density Rome TMA, the use of ASPA S&M application combined with the use of Point Merge System (PMS) and A-CDA.
Results from the Task 1 (sessions 1 to 3, led by EUROCONTROL) showed that the P-RNAV/Advanced CDA concept tested is operationally viable. With P-RNAV and A-CDA, the overall feedback was positive, controllers found it easy to work with the procedures, provided a suitable and safe routes design. P-RNAV and A-CDA enable a large reduction in R/T, leaving free cognitive resource. Teamwork and coordination, especially between approach and final were deemed essential for efficiency and throughput. The controllers found that the CTA concept has potential for optimal delivery at metering point (i.e. the IAF in the considered design for the Task 1 sessions), increase in regularity, punctuality, predictability, reduction in stack usage, but might reduce flexibility and controllers’ situation awareness and lack robustness against external factors (e.g. meteorological conditions). Open issues include the variability of working methods (and their impact on performance) and the CTA/RTA maturity. Despite these issues, initial trends on performance showed that even under high traffic load, the concept provided benefits, allowing aircraft to remain on lateral navigation (2D), carry out Advanced Continuous Descent Approaches (3D) and achieve consistent inter-aircraft spacing on final (4D).
Results from the Task 2 (session 4, ENAV/SICTA) showed that P-RNAV/A-CDA and ASPA S&M concepts in a today environment (same sectorisation and coexistence of traditional handled flows) are operationally viable. Controllers found P-RNAV/A-CDA a valuable technique allowing a reduction of workload through the avoiding of vectoring, leaving more time to monitoring. In the simulated environment, A-CDA concept application did not have a negative impact on the traffic management as the traffic flows were sequenced by a scripted AMAN. The controllers suggested to further investigate this aspect in a realistic environment considering all the possible different descend profiles of inbound traffic.
The controllers found it easy to manage the traffic using P-RNAV and A-CDA together. The new route structure and associated new working methods allow the controllers to manage

Episode 3
D5.3.6-02 - Report on the Prototyping of a dense TM A Version : 1.01
Page 116 of 133
Issued by the Episode 3 consortium for the Episode 3 project co-funded by the European Commission and Episode 3 consortium.
high traffic loads with an acceptable workload thanks to a reduction of tasks associated with this new operational environment. P-RNAV and A-CDA allow the controllers to have a better situation awareness of the traffic evolution due to a standardised working methods based on an arrival structured route layout. Accordingly, in the nominal situation, controllers perceived an increased safety level.
The combined use of ASPA S&M, P-RNAV and CDA allow ATCO to focus more on the sequence leg management. A controller having delegated spacing tasks to the cockpit can improve monitoring of the arrival stream traffic evolution. The availability of ASPA S&M infringement tool was appreciated by controllers enabling them to have a timely warning in case of infringement. The controllers generally accepted the new working methods foreseeing a partial delegation of their tasks to the cockpit.
6.1.2 Recommendations related to concept maturation and assessment
Important Note: As the prototyping sessions were of a short duration and involved a limited number of participants the results should be regarded as trends rather than results backed by statistical evidence. This needs to be taken into account in the following recommendations.
Further maturation of the concept should be carried out through human-in-the-loop experiments after the Episode 3 timeframe in order to address open issues identified above, including the following aspects:
• The scope of these prototyping sessions was too restricted to enable a full evaluation of the effect of RTA in a terminal area to be made. Nevertheless, initial indications are that use of RTA to comply with a CTA could be useful to provide a suitably-measured flow into the airspace around an airport. However, the exact positioning of the RTA/CTA points would be location-, airspace- and complexity-specific and would, in any event, need to be placed at a sufficient distance from final approach to allow controllers to provide the necessary safe separation as well as to construct an efficient sequence and optimal landing spacing. Instead of the IAF, which was also a merging point, a point further out such as a TMA entry point could for instance be considered as CTA point. Then between that point and the IAF, subject to a sufficient level of strategic de-confliction and to inbound traffic delivery conditions, “standard” speed control could be used to ensure separation.
• As a contributing factor to the above issue, the reduction in the controller’s situation awareness regarding the aircraft’s speed schedule when flying an RTA to adhere to a CTA should also be addressed. To increase the situational awareness of controllers, information on aircraft intent should be available to the ground system, in particular speed. Note that the same recommendation came out from the EP3 En Route prototyping sessions (WP4.3.4 En Route Validation Report [22]).
• Along similar lines regarding speed adjustments, the interdependency between RTA and A-CDA, i.e. their relative priority and the interaction with separation assurance should be clarified.
• The concept introduces time constraints dynamically issued by an arrival manager (AMAN) for metering purposes. As a known limitation in session 3, these constraints (CTAs) were actually scripted and the displayed arrival sequence, presented on the AMAN timeline, was static. Consequently it was not possible – nor intended – to explore dynamic aspects of the sequence optimisation in the session. After sufficient maturation is achieved in TMA airspace through further small scale human in the loop experiments, a larger scale Real Time simulation should be conducted, involving more sectors, enabling dynamic aspects of the arrival sequence management through e.g. an AMAN to be assessed.

Episode 3
D5.3.6-02 - Report on the Prototyping of a dense TM A Version : 1.01
Page 117 of 133
Issued by the Episode 3 consortium for the Episode 3 project co-funded by the European Commission and Episode 3 consortium.
• Compatibility with departures (which were scripted in Task 1 sessions) could be confirmed in the frame of a Real Time simulation, also providing a more realistic environment.
• The 4th prototyping session (in Task 2) limited to just one week, including training, to test the introduction of new concepts as PMS, CDA and ASPA S&M has allowed only subjective feedbacks: Despite this the new concept viability has been proven.
• Simulation reduced duration and platform limitations reduced the full potential of the concept (Task 2) being investigated.
• The limited effort permitted simulating only four sectors, it was not possible to manage properly the upstream traffic with an additional workload on the simulated sectors (Task 2).
6.2 RECOMMENDATIONS TO DEVELOPMENT OF THE DODS
The implications of these exercises on the development of the Episode 3 DODs will be assessed by the Episode 3 Work Package 5 TMA Expert Group.
Note: this may also involve interactions with the WP5-level consolidation (WP5.4 and WP5.2), feeding Project-level consolidation (WP2).
6.3 PROTOTYPING APPROACH
The introduction of the prototyping approach in Episode 3 aimed to provide an efficient support for the clarification of some concept elements.
Although such an approach was previously used for local projects, its application in the context of a large project such as Episode 3 was a premiere. The WP5.3.6 benefited both from the experience of its team in implementing a prototyping approach and from backup information collected during previous experiments. This last item enabled the preparation of the prototyping sessions to rely on existing material, e.g. airspace, tools, working methods definition, concept preliminary acceptance. Building up on previous work enabled the concept to be de-risked and refined.
In addition, the objectives of each session were validated prior every occurrence by the Expert Group, on the basis of feedback of the previous session (see §3.1).
6.3.1 Advantages
In the context of concept clarification, the prototyping approach showed more advantages than traditional real-time simulation:
• Reduced cost: small scale and simplified environment, to focus on specific issues;
• Iterative process, enabling first to gradually increase realism and complexity, once initial basis has been acquired (e.g. getting familiar with P-RNAV and A-CDA before investigating the impact of CTA) and second to consider outcomes from one session to refine objectives of the following one (e.g. routes redesign, working method refinement);
• Flexibility: small scale experiments allow quick implementation of unexpected changes, thus enabling:
o Participants to provide feedback and test their feedback subsequently to assess potential benefits;
o Modification of a specific research question to be introduced between sessions;
Episode 3
D5.3.6-02 - Report on the Prototyping of a dense TM A Version : 1.01
Page 118 of 133
Issued by the Episode 3 consortium for the Episode 3 project co-funded by the European Commission and Episode 3 consortium.
o Methodological framework: given the limited duration of each session and the limited time between them, the overall approach needs to be structured so that the concept clarification is guided and maintained within reasonable and achievable objectives.
6.3.2 Limitations
Despite the benefits listed above, the use of prototyping sessions showed some limitations, both general, and specific to concept clarification, that should be considered as lessons learned from the prototyping approach.
The main limitation is related to the temporal constraints of prototyping sessions. The nature of prototyping sessions implies a limited duration over time (3-6 months), as well as of the session itself (4-5 days). Moreover, constraints arising from the overall project schedule, combined with the well known limited availability of operational controllers during the aeronautical summer, resulted in small time intervals between consecutive sessions (3-4 weeks). This had the following consequences:
• Limited time to introduce the concept and train the controllers (1 day max per session);
• Limited time during the sessions to address the concept with many conditions;
• Limited how representative results are, which must be considered as trends and qualitative feedback enabling the concept clarification rather than strong performance measures;
• Limitation in the flexibility brought by the prototyping approach, e.g. to introduce significant changes between two close/consecutive sessions;
• Limited time between sessions to conduct acceptance tests on the platform.
A second limitation is related to the assumptions made to prepare the prototyping sessions. Whereas some assumptions are necessary at the concept clarification stage, these must be realistic enough to be accepted by the participants. Typically, in the context of CTA, the technical feasibility and reliability of RTA function was questioned. Even though the controllers can understand the notion of assumptions, it is necessary to provide them quite early with some initial feedback on this feasibility.
A third limitation is related to controllers’ participation. It was noticeable that the controllers who had participated previously in this set of prototyping sessions only had to assimilate the concept of RTA, whereas the newcomers had to accommodate the whole concepts of Point Merge, P-RNAV, CDA, CTA/RTA.
6.3.3 Recommendations
To address the above limitations, a first set of recommendations would relate to the temporal constraint of the prototyping sessions:
• To cope with the limited time available for training, continuity of participants is essential as it enables participants to be trained only on new items and avoid using valuable evaluation time on re-training; note that this continuity also enables the participants to mature the concept between sessions, possibly consider it while back in their own premises and provide even more grounded feedback session after session.
• Sufficient time between sessions to enable analysis and refinement of remaining objectives, technical development of new functions, conduct of acceptance test and preparation of briefing and experimental material. In addition, this would have

Episode 3
D5.3.6-02 - Report on the Prototyping of a dense TM A Version : 1.01
Page 119 of 133
Issued by the Episode 3 consortium for the Episode 3 project co-funded by the European Commission and Episode 3 consortium.
enabled more opportunities for interaction with WP5.3.1 TMA Expert Group participants.
In the perspective of further concept maturation through human-in-the-loop experiments, a second set of recommendations concerns:
• The selection of participants: to clarify an emerging concept, participants need to be sufficiently open-minded, to envisage changes in their current working practices, roles and tasks. Although this represents a difficult constraint, the participants should accept not to apply their usual rules and strategies and in the contrary imagine how to deal with new issues (e.g. changes in pilots’ involvement, introduction of new tools, removal of controller tools).
• The interactions between En Route and TMA: further concept maturation/assessment activity e.g. in the frame of the SESAR JU, will most probably involve issues concerning different airspaces, and/or more detailed aspects related to their interfaces (e.g. En Route delivery to TMA). In this context, it will be of utmost importance to continue ensuring appropriate co-ordination at the level of operational concept descriptions, and at that of operational experts involved in different validation exercises and/or different projects.

Episode 3
D5.3.6-02 - Report on the Prototyping of a dense TM A Version : 1.01
Page 120 of 133
Issued by the Episode 3 consortium for the Episode 3 project co-funded by the European Commission and Episode 3 consortium.
7 REFERENCES AND APPLICABLE DOCUMENTS
[1]. Episode 3 E3-WP 5-D5.3.6-01-PLN – WP5.3.6 Prototyping Consolidated Experimental Plan, v1.00, April 2009
[2]. E-OCVM European Operational Concept Validation Methodology E-OCVM – Approved version 2.0, March 2007
[3]. Episode 3 E3-WP5-D5.2.1-01 - WP5 Validation Strategy – Version 1.0.1, April 2009 (www.episode3.aero)
[4]. EUROCONTROL Study Report “Challenges to Growth”, EUROCONTROL. Version 1.0, December 2004
[5]. Episode 3 EP3 WP2 RMC2.5 Validation Themes, EEC, v0.1, July 2007
[6]. SESAR SESAR Performance Assessment Task Report Capacity and Quality of Service, Version 00.04, June 2007
[7]. SESAR DLM-0612-001-02-00 - SESAR D3: The ATM Target Concept, September 2007
[8]. SESAR DLT-0612-222-00 - SESAR Concept of Operations. Version 2, October 2007
[9]. SESAR DLM-0602-001-03-00 - SESAR D1 The Current Situation
[10]. Episode 3 Contract Annex I Description Of Work (DOW) Version 3.0, 10th July 2008
[11]. ICAO ICAO Doc 9573, Manual of Area Navigation (RNAV) Operations, First Edition
[12]. PMS Point Merge Integration of Arrival Flows Enabling Extensive RNAV Application and CDA – Operational Services and Environment Definition, EUROCONTROL, v1.0. April 2008
[13]. EUROCONTROL CDA Brochure, Continuous Descent Approach, Implementation Guidance Information, May 2008
[14]. ICAO ICAO PANS-OPS Doc 8168, Volume II
[15]. SESAR DLM-0607-001-01-00 - SESAR D2: Air Transport Framework, The Performance Target
[16]. Episode 3 E3-WP5-TMAEGERC-MIN-V02. Minutes of TMA Expert Group Meeting (1-2 April 2008, ERC)
[17]. Episode 3 E3-WP5 Project Management Plan, v1.0
[18]. Episode 3 E3-WP5 High Density TMA Arrival - Flying CDA Merging (OS-35), v0.1
[19]. Episode 3 E3-D2.2-030-REP-V1.00. General Purpose (G) Interim Detailed Operational Description (DOD) v1.00
[20]. Episode 3 E3-D2.2-037-REP-V1.00 E5 Detailed Operational Description Arrival and Departure - High and Medium/Low Density Operations v1.00
[21]. Episode 3 E3-WP 2-D2.4.1-04-TEC - Performance Framework. Version 3.03
[22]. Episode 3 E3-WP4 – D4.3.4-02 Consolidated Validation Report on Prototyping on Queue, Trajectory and Separation Management, v0.04

Episode 3
D5.3.6-02 - Report on the Prototyping of a dense TM A Version : 1.01
Page 121 of 133
Issued by the Episode 3 consortium for the Episode 3 project co-funded by the European Commission and Episode 3 consortium.
8 ANNEXES

Episode 3
D5.3.6-02 - Report on the Prototyping of a dense TMA Version : 1.01
Page 122 of 133
Issued by the Episode 3 consortium for the Episode 3 project co-funded by the European Commission and Episode 3 consortium.
8.1 PROTOTYPING SESSIONS OVERVIEW
As stated earlier in the document, the focus and contents of the sessions was gradually refined on the basis of outcomes from previous session. This section provides an overview of the key aspects of the four prototyping sessions. First, the present section proposes an overview of contents and focus of each session (Table 38) in order to help readers to understand the specificity and added value of each session. Similarly, the various metrics considered and their respective KPA are associated to sessions in which they were used (Table 39).
Table 38. Overview of the contents and focus of eac h prototyping session.
Session 1 Session 2 Session 3 Session 4
Validation objectives
Session objectives
• Assess the acceptability and operational feasibility of A-CDA from TOD to FAF in P-RNAV route structure (e.g. tasks, roles, working method).
• Further assess the acceptability and operational feasibility of A-CDA from TOD to FAF in an improved P-RNAV route structure with aircraft being delivered to the appropriate TMA metering points in accordance with Controlled Time of Arrival (CTA) instructions.
• Assess the impact of cluster size on the acceptability and feasibility of adhering to an RBT, while performing an A-CDA down to FAF in P-
• To confirm the acceptability and operational feasibility of A-CDA down to FAF in the improved P-RNAV route structure.
• To assess the impact of aircraft flying to meet time constraints on the IAF (CTA) on the acceptability and operational feasibility.
• To assess the impact of mixed RTA equipage conditions on the feasibility and acceptability of the proposed working method.
• Assess the acceptability and feasibility of P-RNAV/A-CDA and ASPA S&M in terms of working methods, phraseology and flight distribution
• Assess the effect of the working methods on the controller’s workload
• Assess the effect of the P-RNAV/A-CDA and ASPA S&M working methods on controller’s perceived situation awareness

Episode 3
D5.3.6-02 - Report on the Prototyping of a dense TMA Version : 1.01
Page 123 of 133
Issued by the Episode 3 consortium for the Episode 3 project co-funded by the European Commission and Episode 3 consortium.
Session 1 Session 2 Session 3 Session 4
RNAV environment.
Hypothesis • A-CDA in P-RNAV route structure will be feasible and acceptable.
• In approach phase, headwind (East wind) is assumed to be less challenging than tailwind (West wind).
• A-CDA in the improved P-RNAV route structure will be feasible and more acceptable.
• Handling larger clusters of aircraft reduces the use and benefits of P-RNAV, A-CDA and RBT adherence.
• A-CDA in the improved P-RNAV route structure will be feasible and more acceptable.
• Although still feasible with reduced level of RTA equipage, the benefits of A-CDA in PRNAV route structure will be reduced.
• P-RNAV/A-CDA and ASPA S&M working methods is feasible and acceptable to the controller.
• In a dense TMA, P-RNAV/A-CDA and ASPA S&M concepts are achievable
• The defined phraseology is appropriate and easy to understand
• P-RNAV/A-CDA and ASPA S&M leads to a reduction in workload, enable earlier anticipation by controllers, contribute to maintaining a clear picture of traffic, increase controller’s perceived level of safety
Simulation settings
Airspace • Dense terminal environment with Performance Based Navigation (PBN) route
• Same as session 1, with improved route structure (no more head-on
• Same as session 2. • Dense terminal environment with PMS system route structure and

Episode 3
D5.3.6-02 - Report on the Prototyping of a dense TMA Version : 1.01
Page 124 of 133
Issued by the Episode 3 consortium for the Episode 3 project co-funded by the European Commission and Episode 3 consortium.
Session 1 Session 2 Session 3 Session 4
structures and with a single airport.
• Based on Dublin CTA, with future parallel runways RWY 10R/L.
• 4 Measured sectors: AN, AS, AP and FI.
convergence). with two airport, with one airport
• Based on Rome TMA, with two parallel runways 16L/R
• 4 Measured sectors: AE, AW, TE, TW.
Traffic • Traffic scripted to replicate upstream compliance with Arrival Manager information.
• The time constraints are scripted in the traffic to reflect the respect of CTA in upstream sectors.
• Traffic clustered at IAF.
• CTA achieved through aircraft RTA functions.
• Traffic scripted to replicate upstream compliance with Arrival Manager information.
Controllers and tools
• 8 controllers from 5 ANSPs: 1 DFS, 2 ENAV, 2 LFV, 1 LVNL and 2 NATS.
• Tools and HMI:
o ECHOES HMI: Interactive radar labels and aircraft data lists;
o OLDI of flight progress data, with SYSCO
• 8 controllers from 5 ANSPs: 1 DFS, 2 ENAV, 2 LFV, 1 LVNL and 2 NATS.
• Tools and HMI: Same as during session 1.
• 8 controllers from 5 ANSPs: 1 DFS, 2 ENAV, 2 LFV, 1 LVNL and 2 NATS, including 4 newcomers.
• Tools and HMI: Same as during session 2 plus:
o RTA non capable aircraft highlighting on Controller radar screen;
o RTA FMS function
• 7 controllers from 3 ANSPs: 4 ENAV, 2 LFV, 1 NATS.
• 4 Pseudo Pilots from ENAV Academy
• Advanced stripless HMI, with interactive radar labels and aircraft data lists,

Episode 3
D5.3.6-02 - Report on the Prototyping of a dense TMA Version : 1.01
Page 125 of 133
Issued by the Episode 3 consortium for the Episode 3 project co-funded by the European Commission and Episode 3 consortium.
Session 1 Session 2 Session 3 Session 4
extensions;
o STCA for short term conflict alert;
o CDA slope function on the Pilot Working Position.
emulated on the Pilot Working Position.
• graphical representation of ASPA S/M delegation
• OLDI of flight progress data
• SYSCO extensions
o STCA
Experimental design
Experimental variables and conditions
Two variables:
• Wind conditions: East, West, North and South.
• Traffic level: 60 (30 arrivals and 30 departures), 70 (35 arrivals and 35 departures) and 80 (40 arrivals and 40 departures).
Those variables are used to assess the impact of respectively wind conditions and traffic level on the feasibility and operability of P-RNAV and A-CDA.
Two variables:
• Wind conditions: East, North and South.
• Cluster size:
o 1: aircraft with appropriate spacing at IAF;
o 2: groups of 2 successive aircraft with predicted spacing at IAF smaller than required, and possibly a loss of separation in the absence of controller intervention;
Two variables:
• Wind conditions: North and South.
• Level of RTA equipage: Full (100%), High (80%) and Medium (66%).
The wind condition is mainly used to induce variability in the simulated scenarios, as both conditions are comparable.
The level of RTA equipage variable is used to assess the impact of RTA equipage level
Two variables:
• Traffic level:
o 1 : ADES LIRF 16L, 42 ; ADES LIRF 16R, 19;
o 2 : ADES LIRF 16L, 39 ; ADES LIRF 16R, 21;
o 3 : ADES LIRF 16L, 46 ; ADES LIRF 16R, 22;
o 4 : ADES LIRF 16L, 41 ; ADES LIRF 16R, 20.
• Scenarios: ORGA and ORGB
Those variables are used to

Episode 3
D5.3.6-02 - Report on the Prototyping of a dense TMA Version : 1.01
Page 126 of 133
Issued by the Episode 3 consortium for the Episode 3 project co-funded by the European Commission and Episode 3 consortium.
Session 1 Session 2 Session 3 Session 4
It is assumed that crosswind conditions (North and South) are more difficult to handle than other wind conditions and that higher traffic load is more difficult to handle than lower one.
o 3: groups of 3 successive aircraft with predicted spacing at IAF smaller than required, and possibly a loss of separation in the absence of controller intervention.
The wind condition variable is used to assess the impact of meteorological conditions on P-RNAV and A-CDA feasibility and operability, with crosswind conditions expected to be more difficult to handle.
The cluster size variable is used to assess the impact of the cluster size on the feasibility and acceptability of A-CDA and P-RNAV. As described in 4.1.6.1, it is expected that handling larger clusters reduces the use and benefits of P-RNAV, A-CDA
on the feasibility and acceptability of working method and CTA adherence.
assess the impact of traffic level on the feasibility and operability of P-RNAV and A-CDA.

Episode 3
D5.3.6-02 - Report on the Prototyping of a dense TMA Version : 1.01
Page 127 of 133
Issued by the Episode 3 consortium for the Episode 3 project co-funded by the European Commission and Episode 3 consortium.
Session 1 Session 2 Session 3 Session 4
and RBT adherence.
Schedule • 10/11/08 – 14/11/08.
• 8 training runs (45 min).
• 10 measured runs (75 min).
• 08/12/08 – 12/12/08.
• 2 training runs (2 x 45 min hands-on session).
• 10 measured runs (75 min).
• 19/01/09 – 23/01/09.
• 4 training runs (45 min).
• 9 measured runs (75 min).
• 23/02/09 – 27/02/09
• 4 training runs (75 min).
• 8 measured runs (75 min).
Measurements
See Table 39.

Episode 3
D5.3.6-02 - Report on the Prototyping of a dense TMA Version : 1.01
Page 128 of 133
Issued by the Episode 3 consortium for the Episode 3 project co-funded by the European Commission and Episode 3 consortium.
Table 39. List of Episode 3 TMA metrics with associ ated performance areas and corresponding sessions.
KPA
Metric
Capacity Efficiency Environment Operability Safety Predictability Session
Flown trajectories X X X All
Geographical distribution of manoeuvre instructions X X X All
Instructions repartition X X X All
Inter aircraft spacing X X X All
Level off events X X All
Number and severity of losses of separation X All
Throughput at the FAF X All
Time spent on open loop vector X X X 3
Track miles through measured airspace X All
Vertical and speed profiles X X All

Episode 3
D5.3.6-02 - Report on the Prototyping of a dense TM A Version : 1.01
Page 129 of 133
Issued by the Episode 3 consortium for the Episode 3 project co-funded by the European Commission and Episode 3 consortium.
8.2 EXECUTED SCHEDULES
Table 40. Schedule of the first prototyping session (Task 1).
Monday Tuesday Wednesday Thursday Friday
Welcome
Coffee break
Coffee break
Debrief
Run 10
EP3T1M80S
Q & Debrief(+coffee break)
Final Q & Final Debrief
Run 7
EP3T1M80E
Q & Debrief(+coffee break)
Run 8
EP3T1M80N
Lunch Lunch Lunch
Q & Debrief(+coffee break)
Run 3
EP3T1M70E
Q & Debrief
Run 9
EP3T1M80W
Q & Debrief
Run 6
EP3T1M70S
Q & Debrief
Lunch
Run 1
EP3T1M60E
Run 4
EP3T1M70N
Q & Debrief(+coffee break)
Run 5
EP3T1M70W
Q & Debrief(+coffee break)
Q & Debrief(+coffee break)
Run 2
EP3T1M60N
Hands on session 7CDA & P-RNAV
EP3T1T60E
Hands on session 5CDA & P-RNAV
EP3T1T60EHands on session 6
CDA & P-RNAVEP3T1T60E
Hands on session 8CDA & P-RNAV
EP3T1T60E
Q & Debrief(+coffee break)
Presentation onobjectives and concept
airspace, HMI, tools
Hands on session 1 & 2Airspace, HMI and tools
familiarisationEP3T1T60E
Hands on session 3 & 4Airspace, HMI and tools
familiarisationEP3T1T60E

Episode 3
D5.3.6-02 - Report on the Prototyping of a dense TM A Version : 1.01
Page 130 of 133
Issued by the Episode 3 consortium for the Episode 3 project co-funded by the European Commission and Episode 3 consortium.
Table 41. Schedule of the second prototyping sessio n (Task 1).
Monday8th Dec
Tuesday9th Dec
Wednesday10th Dec
Thursday11th Dec
Friday12th Dec
Q & Debrief Q & Debrief Q & Debrief Q & DebriefCoffee break Coffee break Coffee break Coffee break Coffee break
Debrief Q & Debrief Q & Debrief Q & Debrief
Q & Debrief Q & Debrief Q & Debrief Q & DebriefCoffee break Coffee break Coffee break Coffee break
End of day Debrief
Run 3
T2M80SP1
End of day Debrief
Run 10
T2M80SA3
Spare runRun 8
T2M80NA3
Run 9
T2M80SP3
Run 6
T2M80NP2Final Q & Final Debrief
Run 2
T2M80NA1
Run 5
T2M80SA2
End of day Debrief End of day Debrief
Run 1
T2M80EP1
Lunch
Welcome
Objectives, concept,airspace, HMI and tools
Hands on sessionAirspace, HMI, toolsCDA / P-RNAV / CTA
Lunch Lunch Lunch
Run 7
T2M80EA3
Run 4
T2M80EA2

Episode 3
D5.3.6-02 - Report on the Prototyping of a dense TM A Version : 1.01
Page 131 of 133
Issued by the Episode 3 consortium for the Episode 3 project co-funded by the European Commission and Episode 3 consortium.
Table 42. Schedule of the third prototyping session (Task 1).
Monday19th Jan
Tuesday20th Jan
Wednesday21st Jan
Thursday22nd Jan
Friday23rd Jan
Coffee break Coffee break Coffee break Coffee break Coffee break
Debrief
DebriefCoffee break
DebriefCoffee break Q Q
Coffee break Coffee break
Q
Lunch
Run 9
T3M80SP66
Spare runRun 7
T3M80NP66
Run 8
T3M80NA66
Q & Debrief
Final Q & Final Debrief
Q & Debrief Q & Debrief
Q & Debrief Q & Debrief
Run 3
T3M80SP100
Run 5
T3M80NA80
Run 2
T3M80NA100
Run 4
T3M80NP80
Q & Debrief Q & Debrief
End of day DebriefEnd of day Debrief
Lunch Lunch
Run 6
T3M80SP80
Hands on session 1Airspace, HMI, tools
CDA / P-RNAV / CTA / RTA
Hands on session 2Airspace, HMI, tools
CDA / P-RNAV / CTA / RTA
Lunch
Welcome
Objectives, concept,airspace, HMI and tools
End of day Debrief
Run 1
T3M80NP100
Hands on session 3CDA / P-RNAV / CTAMixed RTA equipage
Hands on session 4CDA / P-RNAV / CTAMixed RTA equipage
End of day Debrief
The Table 43 explains the naming convention adopted for the third prototyping session exercises.
Table 43. Exercise name de-code for sessions 1 to 3 (Task 1).
Character Acronym
Description
EP3T (S1)
T (S2 and S3)
EP3_TMA
1/2/3 Prototyping Session number
T or M Training / Measured
60/70/80 Represents the number of hourly movements achieved at Dublin airport.
60 = 30 arrivals Rwy10R; 30 departures Rwy10L
70 = 35 arrivals Rwy10R; 35 departures Rwy10L
80 = 40 arrivals Rwy10R; 40 departures Rwy10L
N/S/E/W Represents the wind direction component applied to the exercise to reflect headwind (E for East), tailwind (W for West) and crosswind variances (N and S for North and South) for Runway 10R operations.
P/A Represents the period of day, with afternoon (P for PM) and morning (A for AM).
1/2/3 (S2) Represents the size of clusters at IAF (i.e. number of aircraft arriving in clusters), from 1 to 3.
100/80/66 (S3) Represents the RTA equipage conditions.
66 = two-thirds (66%) of the arriving traffic are RTA capable.

Episode 3
D5.3.6-02 - Report on the Prototyping of a dense TM A Version : 1.01
Page 132 of 133
Issued by the Episode 3 consortium for the Episode 3 project co-funded by the European Commission and Episode 3 consortium.
Table 44. Schedule of the 4 th Prototyping Session (Task 2).

Episode 3
D5.3.6-02 - Report on the Prototyping of a dense TM A Version : 1.01
Page 133 of 133
Issued by the Episode 3 consortium for the Episode 3 project co-funded by the European Commission and Episode 3 consortium.
END OF DOCUMENT
Copyright © 2022 FDOKUMEN