MAXIMUM POWER POINT EVALUATION OF PHOTOVOLTAIC MODULES UNDER SHADING EFFECT
14
European Scientific Journal March 2014 edition vol.10, No.9 ISSN: 1857 – 7881 (Print) e - ISSN 1857- 7431 281 MAXIMUM POWER POINT EVALUATION OF PHOTOVOLTAIC MODULES UNDER SHADING EFFECT Younis Khalaf Osama Ibraheem Mustafa Adil Salih Mohammed Mohammed Qasim Khaled Waleed University of Anbar, Renewable Energy Research Center, Iraq Abstract In this paper, the effect of shading on solar Photovoltaic (PV) modules is evaluated by using a simulation model, which is able to simulate both the I-V and P-V characteristics curves for PV panels with different sizes. Three percentages of shading states (25%, 50%, 75%) and without shading were used as efficiency limitations. The results are extracted and simulated using the Matlab software. One-diode equivalent circuit is applied in order to investigate electrical characteristics of a typical Kyocera 54W and Solara 130W solar modules. The results show that the performance of both models is widely decreased and the models can’t charge the batteries if the shading near 75% or more for single panel. The systems with small sizes panels have better performance than these with large panels; the drop voltage due to shading was increased with a bigger size. Keywords: Shading, PV, MPP, Solara, Kyocera Introduction Shade is a significant design factor affecting the performance of many, if not most, of today’s photovoltaic systems (David, 2012). Measuring the extent of shade on a solar array can be challenging due to the fact that shadows move as the sun position moves throughout the day and year. This is further complicated by changes in the source of shade itself, for example, a tree can sway in the wind or lose its leaves during the winter, changing the type of shade and casts on a solar array. Compounding the complexities in shade analysis is the fact that even a small area of shade can have a
Transcript of MAXIMUM POWER POINT EVALUATION OF PHOTOVOLTAIC MODULES UNDER SHADING EFFECT
European Scientific Journal March 2014 edition vol.10, No.9 ISSN: 1857 – 7881 (Print) e - ISSN 1857- 7431
281
MAXIMUM POWER POINT EVALUATION OF PHOTOVOLTAIC MODULES UNDER SHADING
EFFECT
Younis Khalaf Osama Ibraheem
Mustafa Adil Salih Mohammed Mohammed Qasim
Khaled Waleed University of Anbar, Renewable Energy Research Center, Iraq
Abstract In this paper, the effect of shading on solar Photovoltaic (PV)
modules is evaluated by using a simulation model, which is able to simulate both the I-V and P-V characteristics curves for PV panels with different sizes. Three percentages of shading states (25%, 50%, 75%) and without shading were used as efficiency limitations. The results are extracted and simulated using the Matlab software. One-diode equivalent circuit is applied in order to investigate electrical characteristics of a typical Kyocera 54W and Solara 130W solar modules. The results show that the performance of both models is widely decreased and the models can’t charge the batteries if the shading near 75% or more for single panel. The systems with small sizes panels have better performance than these with large panels; the drop voltage due to shading was increased with a bigger size.
Keywords: Shading, PV, MPP, Solara, Kyocera Introduction
Shade is a significant design factor affecting the performance of many, if not most, of today’s photovoltaic systems (David, 2012). Measuring the extent of shade on a solar array can be challenging due to the fact that shadows move as the sun position moves throughout the day and year. This is further complicated by changes in the source of shade itself, for example, a tree can sway in the wind or lose its leaves during the winter, changing the type of shade and casts on a solar array. Compounding the complexities in shade analysis is the fact that even a small area of shade can have a
European Scientific Journal March 2014 edition vol.10, No.9 ISSN: 1857 – 7881 (Print) e - ISSN 1857- 7431
282
significant impact on the total output of the PV system. In particular, solar power electronics, such as inverters, micro inverters or power optimizers, have a range of responses to shade, depending on their ability to adapt to complex power curves. Up to this point, scientific tests of shade impact have been performed using a variety of products and procedures, resulting in an equal variety of claims about the effects of shade and the best products and processes to deal with it. Therefore, there is a need for standardized procedures for evaluating the effect of shade and for standardized modeling methods to predict lifetime impact.
Shading of photovoltaic systems can cause high loss in performance (Volker, 1995). For the calculation of the performance loss the irradiance on each cell of the solar generator must be known. Then, the I-V-curve of a photovoltaic generator can be calculated using numerical methods. The irradiance on a tilted solar generator can be obtained from measurements of the global irradiance on the horizontal plane, geographical data and the calculated position of the sun. Objects, which possibly cause irradiance losses, are placed in the surroundings of the solar generator. The reduced diffuse irradiance on the solar generator can be obtained by surface integrals. The addition of the reduced direct and diffuse irradiance and a ground reflection component leads to the reduced irradiance on the solar cells. PV modules are very sensitive to shading unlike a solar thermal panel which can tolerate some shading, many brands of PV modules cannot even be shaded by the branch of a leafless tree. Shading obstructions can be defined as soft or hard sources. If a tree branch, roof vent, chimney or other item is shading from a distance, the shadow is diffused or dispersed. These soft sources significantly reduce the amount of light reaching the cells of a module. Hard sources are defined as those that stop light from reaching the cells, such as a blanket, tree branch, bird dropping, or the like, sitting directly on top of the glass. If even one full cell is hard shaded the voltage of that module will drop to half of its unshaded value in order to protect itself. If enough cells are hard shaded, the module will not convert any energy and a tiny drain of energy on the entire system. Partial-shading even one cell of a 36-cell module will reduce its power output. Because all cells are connected in a series string, the weakest cell will bring the others down to its reduced power level. Therefore, whether half of one cell is shaded, or half row of cells is shaded, the power decrease will be the same and proportional to the percentage of area shaded, When a full cell is shaded, it can act as a consumer of energy produced by the remainder of the cells, and trigger the module to protect itself. The module will route the power around that series string. If even one full cell in a series string is shaded, it will likely cause the module to reduce its power level to half of its full available value. If a row of
European Scientific Journal March 2014 edition vol.10, No.9 ISSN: 1857 – 7881 (Print) e - ISSN 1857- 7431
283
cells at the bottom of a module is fully shaded, the power output may drop to zero.
Shading of PV installations has an irregular impact on power production (Deline, 2009). The shading can represent a reduction in power over 30 times its physical size. In order to accurately predict the power lost due to shaded conditions, it is necessary to identify the bypass diode placement in the PV modules, where it regulates the impact of shading on a particular module or group of cells. With an accurate description of the PV module layout, a single site survey can provide an estimate of shade conditions at one position, and geometric transforms can translate that shade description to any point in the PV array. This process can provide the basis for an accurate simulation of power reduction in a partially shaded PV system.
The existing Photovoltaic modules in Renewable Energy Research Centre (University of Anbar-Iraq) consist of 36 cells. These modules (Kyocera and Solara) are often used for experimental researches. In this experiment PV modules were placed in a dark in order to study their behavior without illumination. Our results contain both experimental with some mathematical calculation used to determine the effect of some the junction parameters through an equivalent circuit model of PV. 2. The Photovoltaic Cell Modeling:
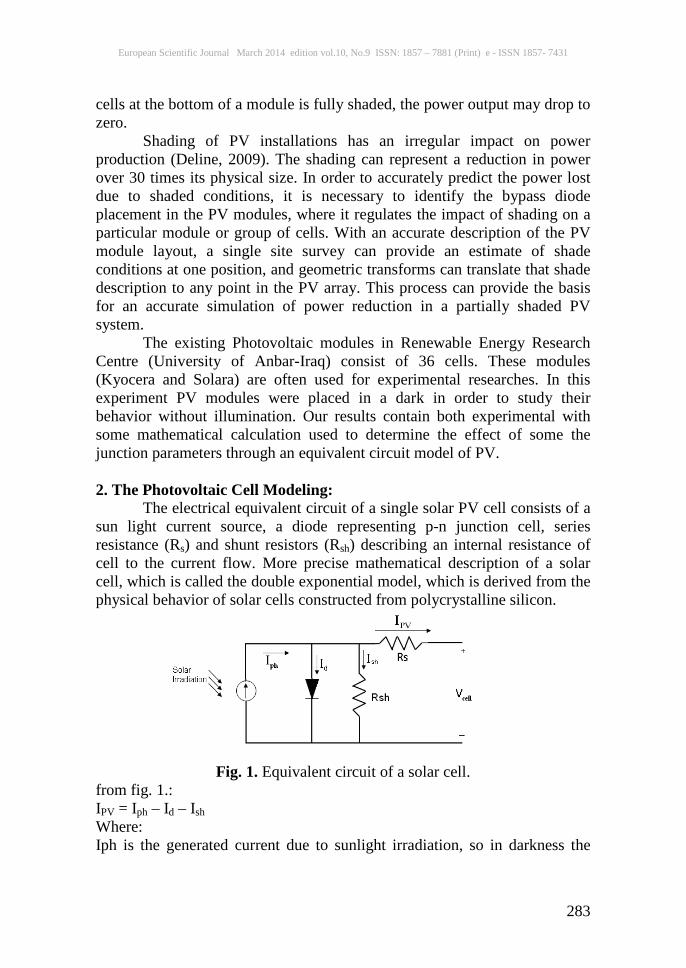
The electrical equivalent circuit of a single solar PV cell consists of a sun light current source, a diode representing p-n junction cell, series resistance (Rs) and shunt resistors (Rsh) describing an internal resistance of cell to the current flow. More precise mathematical description of a solar cell, which is called the double exponential model, which is derived from the physical behavior of solar cells constructed from polycrystalline silicon.
Fig. 1. Equivalent circuit of a solar cell.
from fig. 1.: IPV = Iph – Id – Ish Where: Iph is the generated current due to sunlight irradiation, so in darkness the
European Scientific Journal March 2014 edition vol.10, No.9 ISSN: 1857 – 7881 (Print) e - ISSN 1857- 7431
284
solar cell is not an active device; it works as a diode. Id is a diode current Ish is a current flow to shunt resistor and IPV is output current of a PV module.
It considers the calculation of both series along with the junction ideality factor (A) and the components of the diode diffusion experimentally collected I-V and P-V curves were introduced into specially designed software that performs numerical evaluation. The existing PV models provide a variety of analytical results from the simulation. The PV panels have some parameters as listed below (Mohammed, 2011) Va= Working voltage G= Number of suns; irradiance (1 sun= 1000 W/m2) K= Boltzman constant = 1.38×10⁻²³
Q= Electron Charge = 1.6×10⁻¹⁹
A= Diode quality coefficient:=2 for Crystalline Silicon, <2 for Amorphous Silicon Vg= Diode Voltage =1.12eV for Crystalline Silicon, <1.75 for Amorphous Silicon Ns= Number of cells connected in series = 36 T1= Standard working temperature = 250C Voc_T1= Open circuit voltage per cell to T1 1sc_T1= Current of short circuit per cell to T1 T2= Working temperature at T2 Voc_T2= Open circuit voltage per cell to T2 Isc_T2= Current of short circuit per cell to T2 Tak= Real working temperature The derivative equations for PV panel are: K= (Isc_T2 – Isc_T1)/( T2 - T1) (1) IL_T1 = Isc_T1 * G (2) IL= IL_ T1 + Ko*( Tak- T1) (3) Io_ T1= Isc_ T1/(exp(q*Voc_ T1)/(A*k*Ta-1) (4) Io= Io_T1*( Tak/Tac)(3/A) *exp(-q*Vg/(A*k)*((1/ Tak)-(1/Tac)) (5) Xv= Io_ T1*q/(n*k*Tac)*exp(q*Voc_T1/(A*k*Tac)) (6) dV/dI_Voc=-1.15/Ns/2 (7) Rs=dV\dI_Voc-(1/Xv)= Xv (8) Vt_Ta= A*k*Tak/q (9) Ish= Vc- Ipv*Rs/ Rsh (10)
The Newton Raphson method will be used for extracting the exact value of current at each assigned parameter for I-V and P-V curves as given in (11) Ia=Ia-( IL-Ia- Io*(exp((Vc+Ia*Rs)/Vt_Ta)-1))/(-1-(Io*(exp((Vc+Ia*Rs)/( Vt_Ia)))-Is (11)
European Scientific Journal March 2014 edition vol.10, No.9 ISSN: 1857 – 7881 (Print) e - ISSN 1857- 7431
285
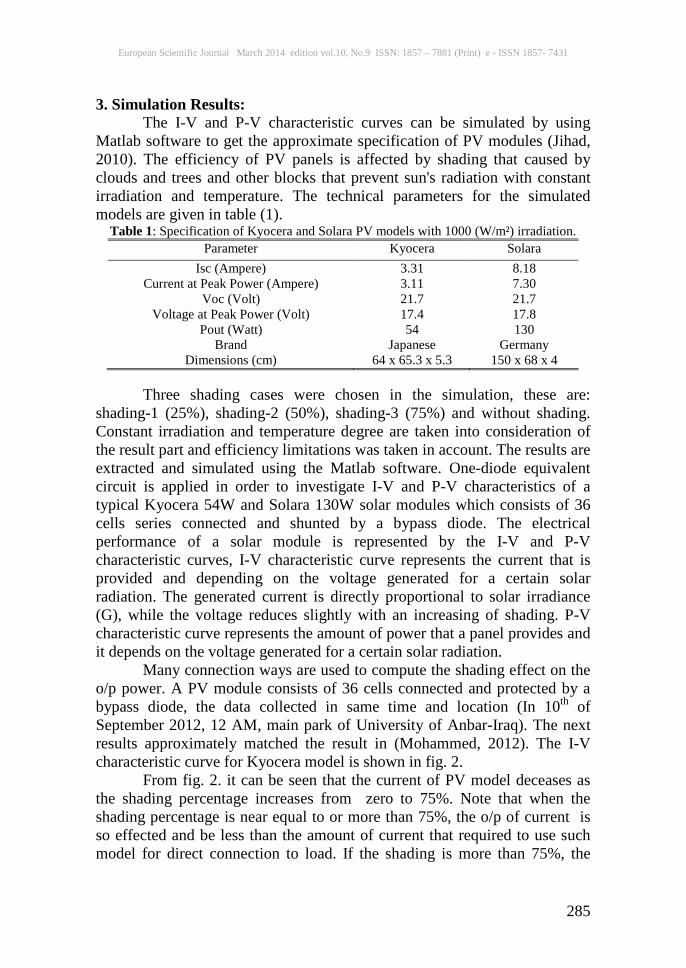
3. Simulation Results: The I-V and P-V characteristic curves can be simulated by using
Matlab software to get the approximate specification of PV modules (Jihad, 2010). The efficiency of PV panels is affected by shading that caused by clouds and trees and other blocks that prevent sun's radiation with constant irradiation and temperature. The technical parameters for the simulated models are given in table (1).
Table 1: Specification of Kyocera and Solara PV models with 1000 (W/m²) irradiation. Parameter Kyocera Solara
Isc (Ampere) Current at Peak Power (Ampere)
Voc (Volt) Voltage at Peak Power (Volt)
Pout (Watt) Brand
Dimensions (cm)
3.31 3.11 21.7 17.4 54
Japanese 64 x 65.3 x 5.3
8.18 7.30 21.7 17.8 130
Germany 150 x 68 x 4
Three shading cases were chosen in the simulation, these are:
shading-1 (25%), shading-2 (50%), shading-3 (75%) and without shading. Constant irradiation and temperature degree are taken into consideration of the result part and efficiency limitations was taken in account. The results are extracted and simulated using the Matlab software. One-diode equivalent circuit is applied in order to investigate I-V and P-V characteristics of a typical Kyocera 54W and Solara 130W solar modules which consists of 36 cells series connected and shunted by a bypass diode. The electrical performance of a solar module is represented by the I-V and P-V characteristic curves, I-V characteristic curve represents the current that is provided and depending on the voltage generated for a certain solar radiation. The generated current is directly proportional to solar irradiance (G), while the voltage reduces slightly with an increasing of shading. P-V characteristic curve represents the amount of power that a panel provides and it depends on the voltage generated for a certain solar radiation.
Many connection ways are used to compute the shading effect on the o/p power. A PV module consists of 36 cells connected and protected by a bypass diode, the data collected in same time and location (In 10th of September 2012, 12 AM, main park of University of Anbar-Iraq). The next results approximately matched the result in (Mohammed, 2012). The I-V characteristic curve for Kyocera model is shown in fig. 2.
From fig. 2. it can be seen that the current of PV model deceases as the shading percentage increases from zero to 75%. Note that when the shading percentage is near equal to or more than 75%, the o/p of current is so effected and be less than the amount of current that required to use such model for direct connection to load. If the shading is more than 75%, the
European Scientific Journal March 2014 edition vol.10, No.9 ISSN: 1857 – 7881 (Print) e - ISSN 1857- 7431
286
charging current is not enough for charging batteries of 12 V even the shading used is soft shading instead of hard shading.
0 2 4 6 8 10 12 14 16 18 20 220
0.5
1
1.5
2
2.5
3
3.5
4
V(volt)
I(am
p)
no shading25% Shading75% Shading75% Shading
Fig. 2. I-V characteristic with shade effect of one Kyocera PV panels (54 W)
0 2 4 6 8 10 12 14 16 18 20 220
10
20
30
40
50
60
V(volt)
P(W
att)
no shading25% Shading75% Shading75% Shading
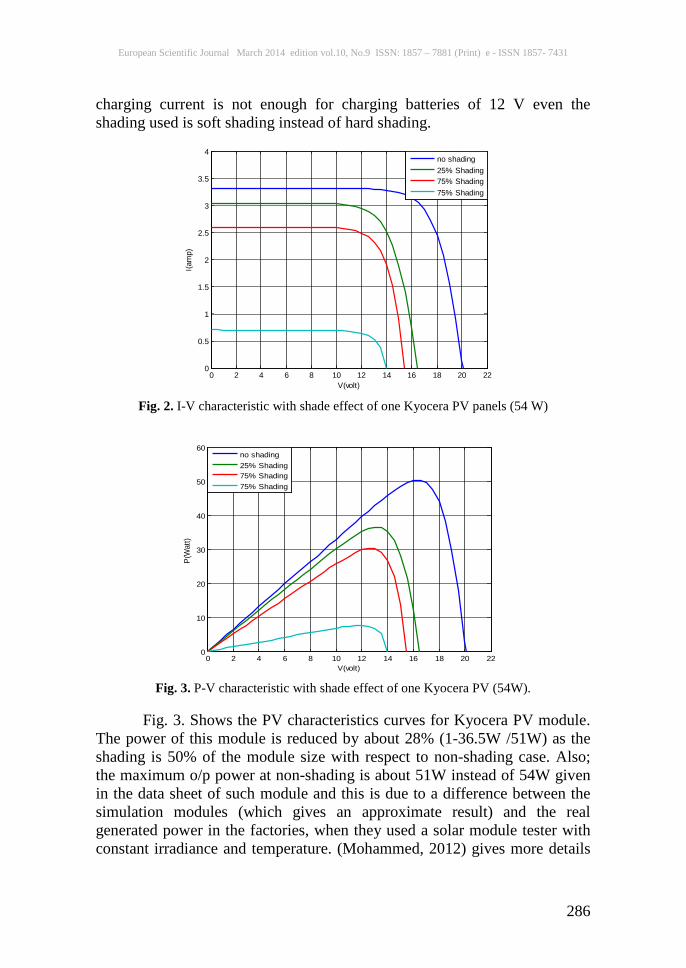
Fig. 3. P-V characteristic with shade effect of one Kyocera PV (54W).
Fig. 3. Shows the PV characteristics curves for Kyocera PV module. The power of this module is reduced by about 28% (1-36.5W /51W) as the shading is 50% of the module size with respect to non-shading case. Also; the maximum o/p power at non-shading is about 51W instead of 54W given in the data sheet of such module and this is due to a difference between the simulation modules (which gives an approximate result) and the real generated power in the factories, when they used a solar module tester with constant irradiance and temperature. (Mohammed, 2012) gives more details
European Scientific Journal March 2014 edition vol.10, No.9 ISSN: 1857 – 7881 (Print) e - ISSN 1857- 7431
287
of the extracted results for models by using the existing solar module tester in renewable energy research center – university of Anbar – Iraq.
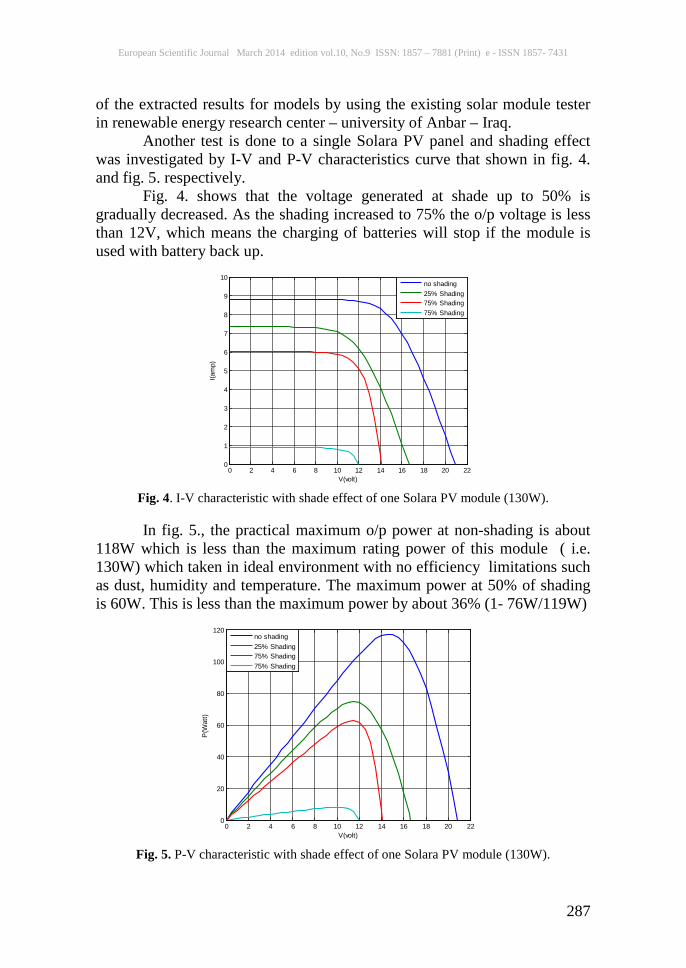
Another test is done to a single Solara PV panel and shading effect was investigated by I-V and P-V characteristics curve that shown in fig. 4. and fig. 5. respectively.
Fig. 4. shows that the voltage generated at shade up to 50% is gradually decreased. As the shading increased to 75% the o/p voltage is less than 12V, which means the charging of batteries will stop if the module is used with battery back up.
0 2 4 6 8 10 12 14 16 18 20 220
1
2
3
4
5
6
7
8
9
10
V(volt)
I(am
p)
no shading25% Shading75% Shading75% Shading
Fig. 4. I-V characteristic with shade effect of one Solara PV module (130W). In fig. 5., the practical maximum o/p power at non-shading is about
118W which is less than the maximum rating power of this module ( i.e. 130W) which taken in ideal environment with no efficiency limitations such as dust, humidity and temperature. The maximum power at 50% of shading is 60W. This is less than the maximum power by about 36% (1- 76W/119W)
0 2 4 6 8 10 12 14 16 18 20 220
20
40
60
80
100
120
V(volt)
P(W
att)
no shading25% Shading75% Shading75% Shading
Fig. 5. P-V characteristic with shade effect of one Solara PV module (130W).
European Scientific Journal March 2014 edition vol.10, No.9 ISSN: 1857 – 7881 (Print) e - ISSN 1857- 7431
288
From figures above it is clear that Kyocera PV panel is less affected by shading when the same percentage of shading was applied. The PV modules are connected in parallel or serial ways to made the voltage generated is close to (or greater than) the level of voltage of the batteries, and the current generated is sufficient to feed the equipment and to charge the batteries.
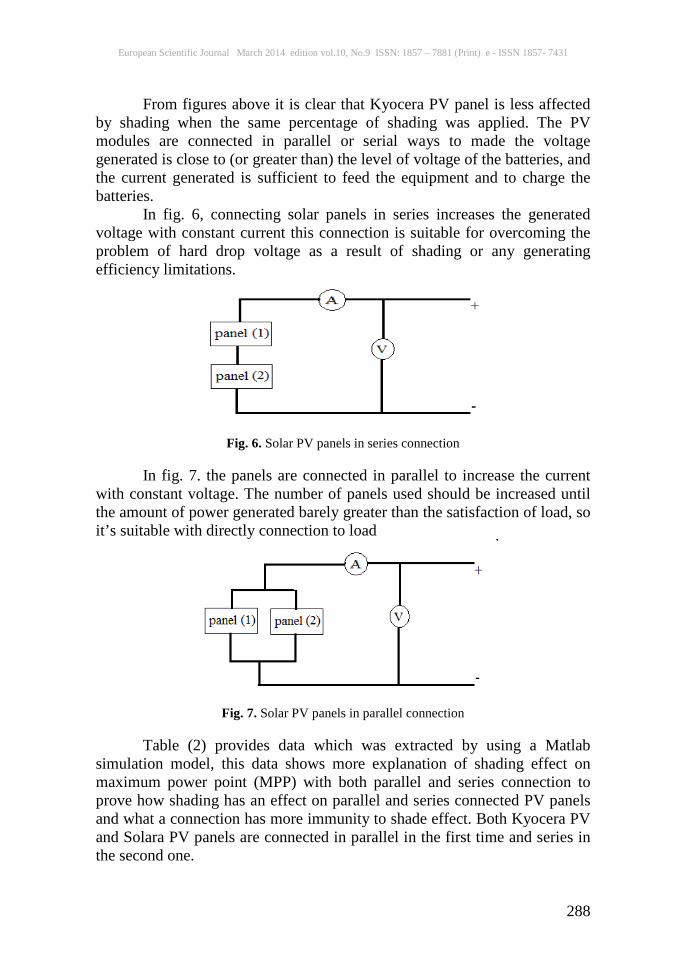
In fig. 6, connecting solar panels in series increases the generated voltage with constant current this connection is suitable for overcoming the problem of hard drop voltage as a result of shading or any generating efficiency limitations.
Fig. 6. Solar PV panels in series connection
In fig. 7. the panels are connected in parallel to increase the current
with constant voltage. The number of panels used should be increased until the amount of power generated barely greater than the satisfaction of load, so it’s suitable with directly connection to load
Fig. 7. Solar PV panels in parallel connection
Table (2) provides data which was extracted by using a Matlab
simulation model, this data shows more explanation of shading effect on maximum power point (MPP) with both parallel and series connection to prove how shading has an effect on parallel and series connected PV panels and what a connection has more immunity to shade effect. Both Kyocera PV and Solara PV panels are connected in parallel in the first time and series in the second one.
European Scientific Journal March 2014 edition vol.10, No.9 ISSN: 1857 – 7881 (Print) e - ISSN 1857- 7431
289
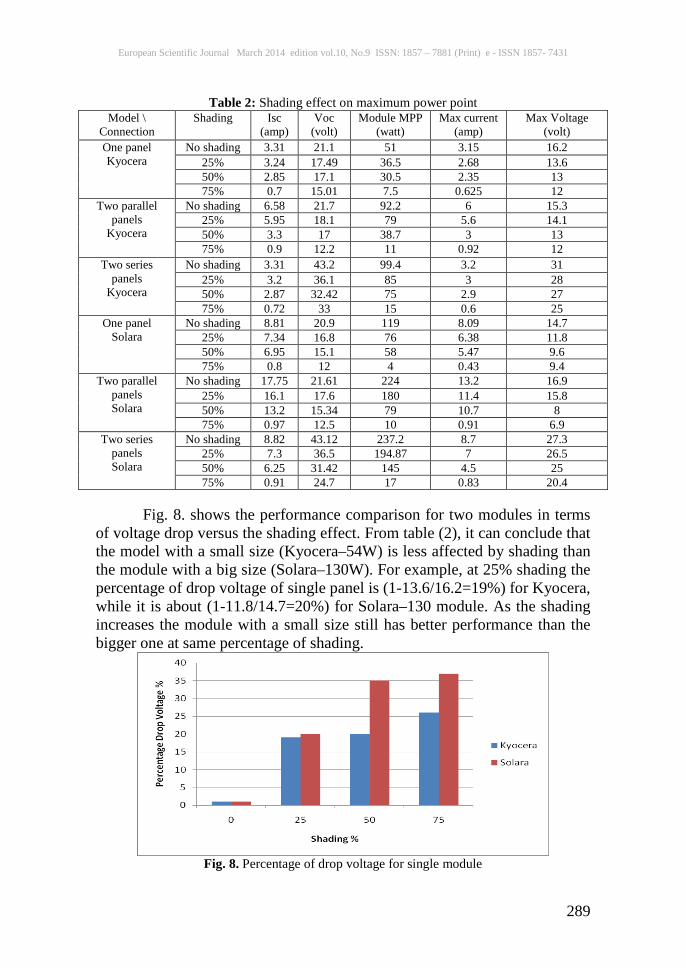
Table 2: Shading effect on maximum power point Model \
Connection Shading Isc
(amp) Voc
(volt) Module MPP
(watt) Max current
(amp) Max Voltage
(volt) One panel Kyocera
No shading 3.31 21.1 51 3.15 16.2 25% 3.24 17.49 36.5 2.68 13.6 50% 2.85 17.1 30.5 2.35 13 75% 0.7 15.01 7.5 0.625 12
Two parallel panels
Kyocera
No shading 6.58 21.7 92.2 6 15.3 25% 5.95 18.1 79 5.6 14.1 50% 3.3 17 38.7 3 13 75% 0.9 12.2 11 0.92 12
Two series panels
Kyocera
No shading 3.31 43.2 99.4 3.2 31 25% 3.2 36.1 85 3 28 50% 2.87 32.42 75 2.9 27 75% 0.72 33 15 0.6 25
One panel Solara
No shading 8.81 20.9 119 8.09 14.7 25% 7.34 16.8 76 6.38 11.8 50% 6.95 15.1 58 5.47 9.6 75% 0.8 12 4 0.43 9.4
Two parallel panels Solara
No shading 17.75 21.61 224 13.2 16.9 25% 16.1 17.6 180 11.4 15.8 50% 13.2 15.34 79 10.7 8 75% 0.97 12.5 10 0.91 6.9
Two series panels Solara
No shading 8.82 43.12 237.2 8.7 27.3 25% 7.3 36.5 194.87 7 26.5 50% 6.25 31.42 145 4.5 25 75% 0.91 24.7 17 0.83 20.4
Fig. 8. shows the performance comparison for two modules in terms
of voltage drop versus the shading effect. From table (2), it can conclude that the model with a small size (Kyocera–54W) is less affected by shading than the module with a big size (Solara–130W). For example, at 25% shading the percentage of drop voltage of single panel is (1-13.6/16.2=19%) for Kyocera, while it is about (1-11.8/14.7=20%) for Solara–130 module. As the shading increases the module with a small size still has better performance than the bigger one at same percentage of shading.
Fig. 8. Percentage of drop voltage for single module
European Scientific Journal March 2014 edition vol.10, No.9 ISSN: 1857 – 7881 (Print) e - ISSN 1857- 7431
290
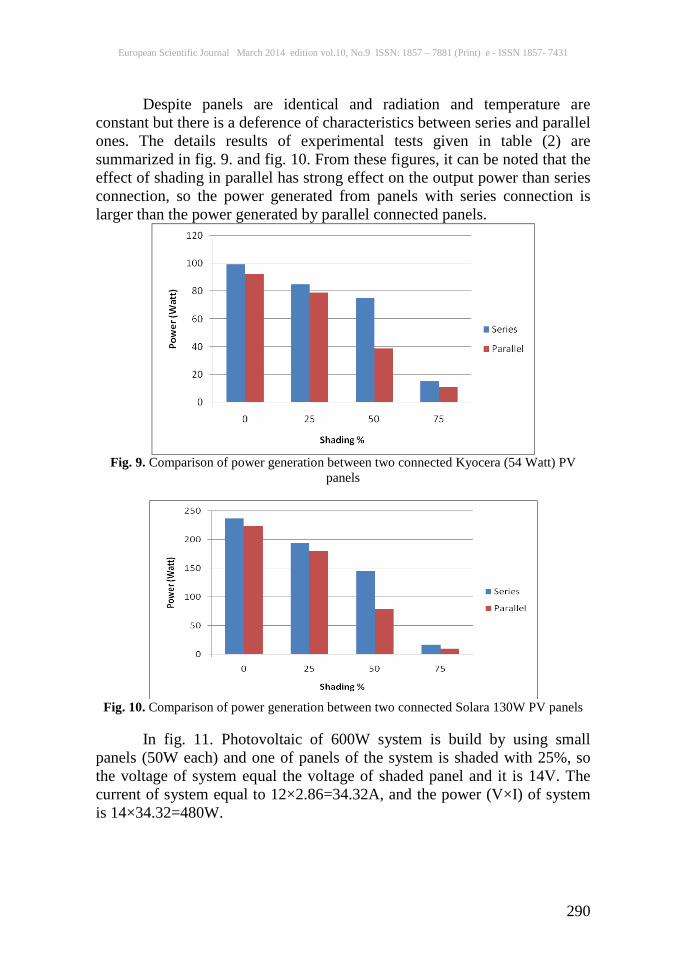
Despite panels are identical and radiation and temperature are constant but there is a deference of characteristics between series and parallel ones. The details results of experimental tests given in table (2) are summarized in fig. 9. and fig. 10. From these figures, it can be noted that the effect of shading in parallel has strong effect on the output power than series connection, so the power generated from panels with series connection is larger than the power generated by parallel connected panels.
Fig. 9. Comparison of power generation between two connected Kyocera (54 Watt) PV
panels
Fig. 10. Comparison of power generation between two connected Solara 130W PV panels
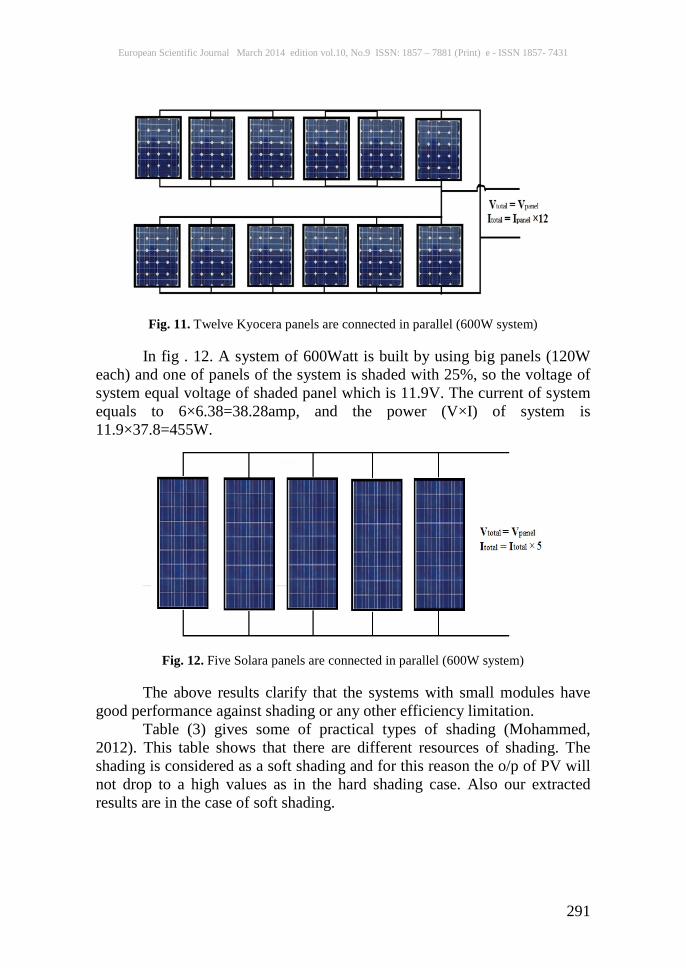
In fig. 11. Photovoltaic of 600W system is build by using small
panels (50W each) and one of panels of the system is shaded with 25%, so the voltage of system equal the voltage of shaded panel and it is 14V. The current of system equal to 12×2.86=34.32A, and the power (V×I) of system is 14×34.32=480W.
European Scientific Journal March 2014 edition vol.10, No.9 ISSN: 1857 – 7881 (Print) e - ISSN 1857- 7431
291
Fig. 11. Twelve Kyocera panels are connected in parallel (600W system)
In fig . 12. A system of 600Watt is built by using big panels (120W
each) and one of panels of the system is shaded with 25%, so the voltage of system equal voltage of shaded panel which is 11.9V. The current of system equals to 6×6.38=38.28amp, and the power (V×I) of system is 11.9×37.8=455W.
Fig. 12. Five Solara panels are connected in parallel (600W system)
The above results clarify that the systems with small modules have
good performance against shading or any other efficiency limitation. Table (3) gives some of practical types of shading (Mohammed,
2012). This table shows that there are different resources of shading. The shading is considered as a soft shading and for this reason the o/p of PV will not drop to a high values as in the hard shading case. Also our extracted results are in the case of soft shading.
European Scientific Journal March 2014 edition vol.10, No.9 ISSN: 1857 – 7881 (Print) e - ISSN 1857- 7431
292
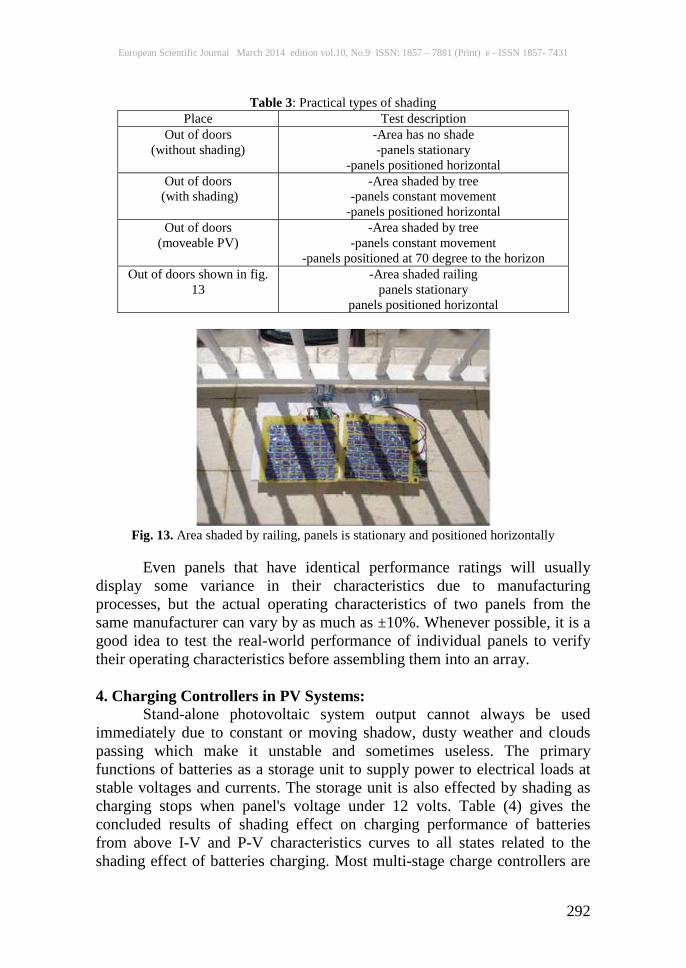
Table 3: Practical types of shading Place Test description
Out of doors (without shading)
-Area has no shade -panels stationary
-panels positioned horizontal Out of doors
(with shading) -Area shaded by tree
-panels constant movement -panels positioned horizontal
Out of doors (moveable PV)
-Area shaded by tree -panels constant movement
-panels positioned at 70 degree to the horizon Out of doors shown in fig.
13 -Area shaded railing
panels stationary panels positioned horizontal
Fig. 13. Area shaded by railing, panels is stationary and positioned horizontally
Even panels that have identical performance ratings will usually
display some variance in their characteristics due to manufacturing processes, but the actual operating characteristics of two panels from the same manufacturer can vary by as much as ±10%. Whenever possible, it is a good idea to test the real-world performance of individual panels to verify their operating characteristics before assembling them into an array. 4. Charging Controllers in PV Systems:
Stand-alone photovoltaic system output cannot always be used immediately due to constant or moving shadow, dusty weather and clouds passing which make it unstable and sometimes useless. The primary functions of batteries as a storage unit to supply power to electrical loads at stable voltages and currents. The storage unit is also effected by shading as charging stops when panel's voltage under 12 volts. Table (4) gives the concluded results of shading effect on charging performance of batteries from above I-V and P-V characteristics curves to all states related to the shading effect of batteries charging. Most multi-stage charge controllers are
European Scientific Journal March 2014 edition vol.10, No.9 ISSN: 1857 – 7881 (Print) e - ISSN 1857- 7431
293
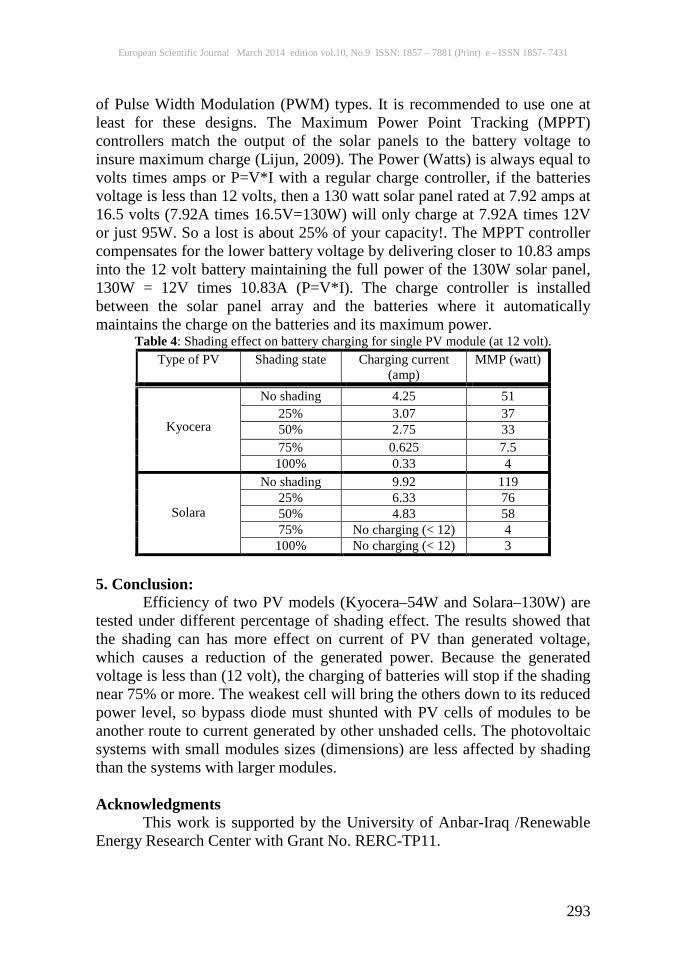
of Pulse Width Modulation (PWM) types. It is recommended to use one at least for these designs. The Maximum Power Point Tracking (MPPT) controllers match the output of the solar panels to the battery voltage to insure maximum charge (Lijun, 2009). The Power (Watts) is always equal to volts times amps or P=V*I with a regular charge controller, if the batteries voltage is less than 12 volts, then a 130 watt solar panel rated at 7.92 amps at 16.5 volts (7.92A times 16.5V=130W) will only charge at 7.92A times 12V or just 95W. So a lost is about 25% of your capacity!. The MPPT controller compensates for the lower battery voltage by delivering closer to 10.83 amps into the 12 volt battery maintaining the full power of the 130W solar panel, 130W = 12V times 10.83A (P=V*I). The charge controller is installed between the solar panel array and the batteries where it automatically maintains the charge on the batteries and its maximum power.
Table 4: Shading effect on battery charging for single PV module (at 12 volt). Type of PV Shading state Charging current
(amp) MMP (watt)
Kyocera
No shading 4.25 51 25% 3.07 37 50% 2.75 33 75% 0.625 7.5 100% 0.33 4
Solara
No shading 9.92 119 25% 6.33 76 50% 4.83 58 75% No charging (< 12) 4 100% No charging (< 12) 3
5. Conclusion:
Efficiency of two PV models (Kyocera–54W and Solara–130W) are tested under different percentage of shading effect. The results showed that the shading can has more effect on current of PV than generated voltage, which causes a reduction of the generated power. Because the generated voltage is less than (12 volt), the charging of batteries will stop if the shading near 75% or more. The weakest cell will bring the others down to its reduced power level, so bypass diode must shunted with PV cells of modules to be another route to current generated by other unshaded cells. The photovoltaic systems with small modules sizes (dimensions) are less affected by shading than the systems with larger modules. Acknowledgments
This work is supported by the University of Anbar-Iraq /Renewable Energy Research Center with Grant No. RERC-TP11.
European Scientific Journal March 2014 edition vol.10, No.9 ISSN: 1857 – 7881 (Print) e - ISSN 1857- 7431
294
References: David Briggs, Enphase Energy, “Shade Impact: How Solar Systems Handle Sub-optimal Conditions” May, (2012), URL: http://enphase.com/wp-uploads/enphase.com/2012/05/Enphase-Study-Shade-Impact.pdf, visited at 12th of Jan (2012) Deline C., "Partially shaded operation of a grid-tied PV system", 34th IEEE photovoltaic specialists’ conference, Philadelphia, June 7–12, (2009). Jihad Sidawia, Nadine Abboud, Georges Jelian, Roland Habchi, Mario Eltahchi and Chafic Salame, “Photovoltaic solar modules electrical properties evolution under extreme stress”, lst Franco-Syrian Conference on Renewable Energies, Damask, 24-28 October (2010). Lijun Gao, Roger A. Dougal, Sheng Yi Liu and Albena P. Iotova. “Parallel-Connected Solar PV System to Address Partial and Rapidly Fluctuating Shadow Conditions”, IEEE Transactions on Industrial Electronics, pp. 1548 – 1556, Volume. 56, No. 5, May (2009). Mohammed Q. Taha, Qusay H. Eesse and Salih Mohammed Salih, “Mathematical Modeling of different Photovoltaic Modules”, Journal of telecommunications, Volume 11, Issue 2, pp. 59-64, December, (2011). Mohammed Qasim Taha, Salih Mohammed Salih, “Performance Analysis of Photovoltaic Modules under Shading Effect”, Technology and Innovation, Vol. 1(9), pp. 228-235, December (2012) Salih Mohammed Salih, Firas Fadhil Salih, Mustafa Lateef Hasan and Mustafa Yaseen Bedaiawi, “Performance Evaluation of Photovoltaic Models Based on a Solar Model Tester”, IJITCS Vol. 4, No. 7, pp. 1-10, July (2012) Volker Quaschning, Rolf Hanitsch, “Shade Calculations in Photovoltaic Systems” ISES Solar World Conference - Harare / Zimbabwe - September 11-15, (1995)